Diversity of bacteria associated with the coral Pocillopora damicornis from the Great Barrier Reef
13
Environmental Microbiology (2005) 7(8), 1162–1174 doi:10.1111/j.1462-2920.2005.00793.x © 2005 Society for Applied Microbiology and Blackwell Publishing Ltd Blackwell Science, LtdOxford, UKEMIEnvironmental Microbiology 1462-2912Society for Applied Microbiology and Blackwell Publishing Ltd, 20057 811621174Original ArticleBacteria associated with coralsD. G. Bourne and C. B. Munn Received 10 December, 2004; accepted 10 December, 2004. *For correspondence. E-mail [email protected]; Tel. (+61) 7 4753 4139; Fax (+61) 7 4772 5852. Diversity of bacteria associated with the coral Pocillopora damicornis from the Great Barrier Reef David G. Bourne 1 * and Colin B. Munn 2 1 Australian Institute of Marine Science, Townsville, Australia. 2 School of Biological Sciences, University of Plymouth, Plymouth, UK. Summary The microbial community associated with the reef building coral Pocillopora damicornis located on the Great Barrier Reef was investigated using culture- independent molecular microbial techniques. The microbial communities of three separate coral colo- nies were assessed using clone library construction alongside restriction fragment length polymorphism and phylogenetic analysis. Diversity was also inves- tigated spatially across six replicate samples within each single coral colony using 16S rDNA and rpoB- DGGE analysis. Clone libraries demonstrated that the majority of retrieved sequences from coral tissue slurry libraries affiliated with g g-Proteobacteria. This contrasted with clone libraries of seawater and coral mucus, which were dominated by a-Proteobacteria. A number of retrieved clone sequences were conserved between coral colonies; a result consistent with pre- vious studies suggesting a specific microbe–coral association. rpoB-DGGE patterns of replicate tissue slurry samples underestimated microbial diversity, but demonstrated that fingerprints were identical within the same coral. These fingerprints were also conserved across coral colonies. The 16S rDNA- DGGE patterns of replicate tissue slurry samples were more complex, although non-metric multidimen- sional scaling (nMDS) analysis showed groupings of these banding patterns indicating that some bacterial diversity was uniform within a coral colony. Sequence data retrieved from DGGE analysis support clone library data in that the majority of affiliations were within the g g-Proteobacteria. Many sequences retrieved also affiliated closely with sequences derived from previous studies of microbial diversity of healthy corals in the Caribbean. Clones showing high 16S rDNA sequence identity to both Vibrio shiloi and Vibrio coralliilyticus were retrieved, suggesting that these may be opportunist pathogens. Compari- sons of retrieved microbial diversity between two different sampling methods, a syringe extracted coral mucus sample and an airbrushed coral tissue slurry sample were also investigated. Non-metric multidi- mensional scaling of clone library data highlighted that clone diversity retrieved from a coral mucus library more closely reflected the diversity of sur- rounding seawater than a corresponding coral tissue clone library. Introduction Bacteria are known to be abundant and active around corals. This dynamic microbiota can exist within a number of coral niches, including the coral surface mucus layer (Ducklow and Mitchell, 1979; Paul et al., 1986; Ritchie and Smith, 1995; 2004), on the coral tissue surface (Frias- Lopez et al., 2002), within coral tissue itself (Williams et al., 1987; Shashar et al., 1994; Kushmaro et al., 1996; Banin et al., 2000) and in the surrounding reef waters (Sorokin, 1973; Gast et al., 1998; Frias-Lopez et al., 2002). These associations between bacteria and corals are suspected to play an important, although at present relatively unknown role in coral health. The bacterial communities associated with corals are largely coral species specific, with microbial profiles reflecting phylogenetic relationships among coral species (Ritchie and Smith, 2004). Rohwer and colleagues (2002), identified 430 novel bacterial ribotypes associated with three coral species. Many of these bacteria appear to have symbiotic relationships with the animal, and it has been suggested that corals may in fact harbour specific microbial communities for beneficial effect (Rohwer and Kelley, 2004). Understanding microbial communities associated with corals and how they change through time is the key to understanding the health of reef corals. Shifts in the bac- terial community composition may affect coral health and susceptibility to disease. Pantos and colleagues (2003) demonstrated that the bacterial community of the whole coral colony is affected even when just a small part of the colony shows signs of disease. This result demonstrates that shifts in the normal microbiota, observed before signs
-
Upload
independent -
Category
Documents
-
view
2 -
download
0
Transcript of Diversity of bacteria associated with the coral Pocillopora damicornis from the Great Barrier Reef

Environmental Microbiology (2005)
7
(8), 1162–1174 doi:10.1111/j.1462-2920.2005.00793.x
© 2005 Society for Applied Microbiology and Blackwell Publishing Ltd
Blackwell Science, LtdOxford, UKEMIEnvironmental Microbiology 1462-2912Society for Applied Microbiology and Blackwell Publishing Ltd, 20057
811621174
Original Article
Bacteria associated with coralsD. G. Bourne and C. B. Munn
Received 10 December, 2004; accepted 10 December, 2004. *Forcorrespondence. E-mail [email protected]; Tel. (+61) 7 47534139; Fax (+61) 7 4772 5852.
Diversity of bacteria associated with the coral
Pocillopora damicornis
from the Great Barrier Reef
David G. Bourne
1
* and Colin B. Munn
2
1
Australian Institute of Marine Science, Townsville, Australia.
2
School of Biological Sciences, University of Plymouth, Plymouth, UK.
Summary
The microbial community associated with the reefbuilding coral
Pocillopora damicornis
located on theGreat Barrier Reef was investigated using culture-independent molecular microbial techniques. Themicrobial communities of three separate coral colo-nies were assessed using clone library constructionalongside restriction fragment length polymorphismand phylogenetic analysis. Diversity was also inves-tigated spatially across six replicate samples withineach single coral colony using 16S rDNA and
rpoB
-DGGE analysis. Clone libraries demonstrated that themajority of retrieved sequences from coral tissueslurry libraries affiliated with
gggg
-Proteobacteria
. Thiscontrasted with clone libraries of seawater and coralmucus, which were dominated by
aaaa
-
Proteobacteria
. Anumber of retrieved clone sequences were conservedbetween coral colonies; a result consistent with pre-vious studies suggesting a specific microbe–coralassociation.
rpoB
-DGGE patterns of replicate tissueslurry samples underestimated microbial diversity,but demonstrated that fingerprints were identicalwithin the same coral. These fingerprints were alsoconserved across coral colonies. The 16S rDNA-DGGE patterns of replicate tissue slurry sampleswere more complex, although non-metric multidimen-sional scaling (nMDS) analysis showed groupings ofthese banding patterns indicating that some bacterialdiversity was uniform within a coral colony. Sequencedata retrieved from DGGE analysis support clonelibrary data in that the majority of affiliationswere within the
gggg
-Proteobacteria
. Many sequencesretrieved also affiliated closely with sequencesderived from previous studies of microbial diversityof healthy corals in the Caribbean. Clones showing
high 16S rDNA sequence identity to both
Vibrio shiloi
and
Vibrio coralliilyticus
were retrieved, suggestingthat these may be opportunist pathogens. Compari-sons of retrieved microbial diversity between twodifferent sampling methods, a syringe extracted coralmucus sample and an airbrushed coral tissue slurrysample were also investigated. Non-metric multidi-mensional scaling of clone library data highlightedthat clone diversity retrieved from a coral mucuslibrary more closely reflected the diversity of sur-rounding seawater than a corresponding coral tissueclone library.
Introduction
Bacteria are known to be abundant and active aroundcorals. This dynamic microbiota can exist within a numberof coral niches, including the coral surface mucus layer(Ducklow and Mitchell, 1979; Paul
et al
., 1986; Ritchie andSmith, 1995; 2004), on the coral tissue surface (Frias-Lopez
et al
., 2002), within coral tissue itself (Williams
et al
., 1987; Shashar
et al
., 1994; Kushmaro
et al
., 1996;Banin
et al
., 2000) and in the surrounding reef waters(Sorokin, 1973; Gast
et al
., 1998; Frias-Lopez
et al
.,2002). These associations between bacteria and coralsare suspected to play an important, although at presentrelatively unknown role in coral health.
The bacterial communities associated with coralsare largely coral species specific, with microbial profilesreflecting phylogenetic relationships among coral species(Ritchie and Smith, 2004). Rohwer and colleagues (2002),identified 430 novel bacterial ribotypes associated withthree coral species. Many of these bacteria appear tohave symbiotic relationships with the animal, and it hasbeen suggested that corals may in fact harbour specificmicrobial communities for beneficial effect (Rohwer andKelley, 2004).
Understanding microbial communities associated withcorals and how they change through time is the key tounderstanding the health of reef corals. Shifts in the bac-terial community composition may affect coral health andsusceptibility to disease. Pantos and colleagues (2003)demonstrated that the bacterial community of the wholecoral colony is affected even when just a small part of thecolony shows signs of disease. This result demonstratesthat shifts in the normal microbiota, observed before signs

Bacteria associated with corals
1163
© 2005 Society for Applied Microbiology and Blackwell Publishing Ltd,
Environmental Microbiology
,
7
, 1162–1174
of visible stress, may be used as bio-indicators of bothenvironmental changes and disease.
Stress as a result of increased human and environmen-tal impacts on coastal regions adjacent to reefs may leadto changes in the associated microbial communities, withadverse effects on coral health (Ritchie and Smith, 1995).Coral bleaching has been linked to global warming and isconsidered one of the foremost threats to Indo-Pacificreefs. In some instances, bleaching has been directlyrelated to individual bacterial species that have increasedvirulence at high temperatures (Rosenberg and Ben-Haim, 2002). In particular, seasonal bleaching of the coral
Oculina patagonica
in the Mediterranean Sea is the resultof an infection with the bacterium
Vibrio shiloi,
in which anumber of virulence factors appear to be produced onlyat elevated temperatures, associated with the onset ofbleaching (Toren
et al
., 1998; Banin
et al
., 2001a,b, 2003).Another bacterial species
, Vibrio coralliilyticus
, is the aeti-ological agent of bleaching and tissue lysis in the coral
Pocillopora damicornis
(Ben-Haim and Rosenberg, 2002).Again, increased manifestation of the disease is associ-ated with elevated temperature, in this case linked toenhanced production of a lytic extracellular protease(Ben-Haim
et al
., 2003). Other common coral diseases,including black band, white pox and white plague arecaused by bacterial pathogens (Richardson, 1996, 1998;Richardson
et al
., 1997, 1998; Rosenberg and Ben-Haim,2002; Denner
et al
., 2003).Information on the spatial and temporal composition of
bacterial communities associated with corals is accumu-lating although still limited by a number of factors, includ-ing the difficulties in defining the microniches thatbacterial populations occupy within the coral and tech-niques for analysing coral-tissue and bacterial associa-tions. Within this study, we investigated the bacterialcommunity associated with
Pocillopora damicornis,
amajor reef-building coral found throughout the Great Bar-rier Reef (GBR). Comparisons of the bacterial communi-ties both within a single coral colony and between threeseparate coral colonies were made using molecularmicrobial techniques. Comparisons between two micro-bial sampling techniques commonly used in coral-micro-bial studies, the syringe based coral ‘mucus’ sampling
and the airbrushing of the coral to provide a ‘tissue slurry’sample, were also performed.
Results
Clone library based analysis
Molecular-based microbial analysis was performed onsamples of seawater (
~
1 m from coral colony A: 60clones), coral mucus (colony A: 55 clones) and tissueslurry samples of coral colonies A (64 clones), B (60clones) and C (52 clones). Seawater samples containedthe highest number of operational taxonomic unit (OTU)groups [39 distinct restriction fragment length polymor-phism (RFLP) patterns from 60 clones] representingpotential high bacterial diversity. The coral mucus libraryalso had a high number of OTU groups (35 distinct RFLPpatterns). In contrast, coral tissue slurry libraries had alower number of representative OTU groups being 23, 22and 25 distinct RFLP patterns for libraries A, B and Crespectively.
Different diversity indices representing RFLP richnessand evenness were calculated from each clone librarydata set (Table 1). The percentages of coverage of eachlibrary were relatively low, confirming high diversity of allenvironments sampled. Water and mucus clone librariesdemonstrated only low coverage of 38% and 42% respec-tively. Tissue slurry libraries had higher coverage esti-mates of 64%, 66% and 58% for colonies A, B and Crespectively. Rarefaction curves confirmed the coveragecalculation with water and mucus curves reaching highervalues than tissue slurry curves (Fig. 1). A larger numberof clones needed to be analysed within water and mucuslibraries to obtain a better representative picture of diver-sity within these environments. Although curves for tissueslurry samples began to flatten towards an asymptote,analysis of additional clones would also increase thedescription of diversity within these libraries. Other calcu-lated indices, including the Shannon-Weaver index andthe Fisher abundance model, confirmed the difference indiversity between samples (Table 1).
Statistical non-metric multidimensional scaling (nMDS)was performed on RFLP patterns from each clone library.
Table 1.
Diversity indices calculated from RFLP patterns of 16S rDNA clone libraries
Parameters
Clone library
PD/Water PD/Mucus PD/A PD/B PD/C
Number of clones analysed 60 55 64 60 52Coverage of clone libraries (%) 389 42 64 66 58Observed RFLP patterns 39 35 23 22 25Shannon-Weaver diversity (H
¢
) 3.5 3.2 2.9 2.8 2.9Fisher’s alpha (
a
) 48.3 43.1 12.9 12.5 18.9

1164
D. G. Bourne and C. B. Munn
© 2005 Society for Applied Microbiology and Blackwell Publishing Ltd,
Environmental Microbiology
,
7
, 1162–1174
Plots separated the 16S rDNA libraries into three distinctgroups (Fig. 2). The water and mucus libraries groupedclosely indicating similar RFLP pattern composition. Sim-ilarly, tissue slurry A and B libraries grouped togetheralthough were distinct from water and mucus libraries. Thelibrary derived from colony C tissue slurry was placedindividually away from the other libraries.
Clones representative of individual OTU groups fromeach library were sequenced to provide phylogeneticinformation (Fig. 3). Only OTU groups containing two ormore clones were sequenced. A total of 80 clones rep-resenting 51 OTUs were sequenced, representing 6OTUs from the water library, 13 OTUs from the mucuslibrary and 13, 8 and 11 OTUs from tissue libraries A, Band C respectively. Three potential chimeric sequenceswere identified and excluded from the analysis.Sequences belonging to the same OTU groups were
>
97% similar.Within the water library, 20% of clones were affiliated
with
a
-
Proteobacteria
(W-OTU1, W-OTU4, W-OTU6 andW-OTU8) and 8% of clones were affiliated with
g
-
Proteo-bacteria
(W-OTU3 and W-OTU7). The
g
-
Proteobacteria
clones affiliated with the SAR86 cluster, a group of uncul-tured organisms that constitute a significant component ofthe oceanic bacterioplankton community (Eilers
et al
.,2000). Other OTUs within the water library were repre-sented by just single clones indicative of the high diversityof the sample and were not sequenced.
Within the mucus library, 36% of the clones were affili-ated with
a
-
Proteobacteria
(M-OTU1, M-OTU3, M-OTU5,M-OTU14, M-OTU15) and 16% with
g
-
Proteobacteria
(M-OTU2, M-OTU7, M-OTU6 and M-OTU11). Again, many ofthese
g
-
Proteobacteria
mucus clones affiliated within theSAR86 cluster. A small group of clones affiliated with themarine picoplankton
Synechococcus
(M-OTU8) and
Prochlorococcus
(M-OTU4) while M-OTU10 was closelyrelated to marine
Actinomycetes
. Similarly to the waterclone library, a large number of clones (42%) in the mucuslibrary represented single OTU groups and were notsequenced.
A total of 81%, 54% and 48% of sequenced cloneswithin the tissue slurry libraries A, B and C were affiliatedwith
g
-
Proteobacteria
. In contrast, 0%, 8% and 19% ofclones from these respective libraries affiliated with
a
-
Proteobacteria.
A high proportion of
g
-
Proteobacteria
clones from libraries A (21%) and C (38%) grouped withinthe
Vibrionaceae
cluster. Two ribotypes from coral colonyA clustered within the
Vibrionaceae,
and demonstratedhigh 16S rDNA identity (
>
98%) with
Vibrio shiloi
and
Fig. 1.
Rarefaction curves for different RFLP patterns representing expected diversity of 16S rDNA clones for each clone library.
Clone number
0 10 20 30 40 50 60 70
Ex
pec
ted
div
ersi
ty
0
10
20
30
40
50
Water library
Coral mucus library
Coral library CCoral library A
Coral library B
Fig. 2.
Non-metric multidimensional scaling plot (nMDS
-
2 dimen-sional) representation of the 16S rDNA RFLP patterns of the Water, Mucus and tissue slurry (colonies A, B, C) clone libraries constructed in the study. The stress value a measure of significance of the calcu-lation is presented in the left hand bottom corner of the plot.
Coral Mucus Library
Coral Library A
Coral Library B
Coral Library C
Water Library
Stress = 0
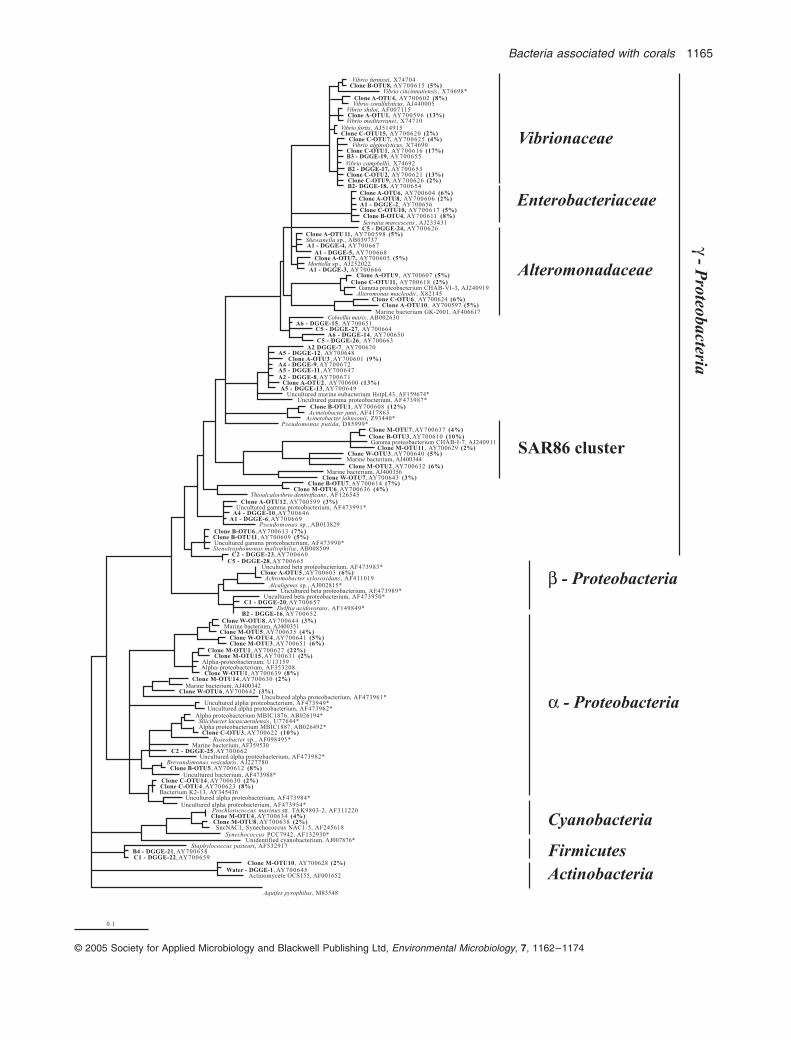
Fig. 3.
16S rRNA gene phylogenetic tree of sequences recovered from clone libraries and DGGE analysis of Water, Mucus, and tissue slurry samples of corals A, B and C, compared against sequences obtained from public databases. The scale bar represents 0.1 changes per nucleotide. The labels W (water), M (Mucus), A (tissue slurry colony A), B (tissue slurry colony B) and C (tissue slurry colony C) refer to clones or DGGE bands retrieved from the respective samples. GenBank accession numbers are provided for all clone, DGGE and reference isolate sequences. The proportion each clone represents for the respective clone library is represented in brackets following the clone name. Locations of DGGE bands are found in Fig. 5. Partial DGGE sequences were added to the phylogenetic tree using the parisimony algorithm tool in the ARB software package (Ludwig
et al
., 2004).
Aquifex pyrophilus
was used as the outgroup for analysis. Asterisk represents organisms for which previous molecular analyses of Caribbean corals (Rohwer
et al
., 2001; Cooney
et al
., 2002; Frias-Lopez
et al
., 2002) have demonstrated sequence affiliation.
Bacteria associated with corals
1165
© 2005 Society for Applied Microbiology and Blackwell Publishing Ltd,
Environmental Microbiology
,
7
, 1162–1174
0.1
Vibrio furnissii, X74704Clone B-OTU8, AY700615 (5%)
Vibrio cincinnatiensis , X74698*Clone A-OTU4, AY700602 (8%)Vibrio coralliilyticus, AJ440005
Vibrio shiloi, AF007115Clone A-OTU1, AY700596 (13%)Vibrio mediterranei, X74710
Vibrio fortis, AJ514915Clone C-OTU15, AY700620 (2%)
Clone C-OTU7, AY700625 (4%) Vibrio alginolyticus, X74690
Clone C-OTU1, AY700616 (17%)B3 - DGGE-19, AY700655
Vibrio campbellii, X74692B2 - DGGE-17, AY700653Clone C-OTU2, AY700621 (13%) Clone C-OTU9, AY700626 (2%)B2- DGGE-18, AY700654
Clone A-OTU6, AY700604 (6%)Clone A-OTU8, AY700606 (2%)A1 - DGGE-2, AY700656Clone C-OTU10, AY700617 (5%)
Clone B-OTU4, AY700611 (8%)Serratia marcescens , AJ233431C5 - DGGE-24, AY700626
Clone A-OTU11, AY700598 (5%)Shewanella sp., AB039737A1 - DGGE-4, AY700667
A1 - DGGE-5, AY700668Clone A-OTU7, AY700605 (5%)
Moritella sp., AJ252022A1 - DGGE-3, AY700666
Clone A-OTU9 , AY700607 (5%)Clone C-OTU11, AY700618 (2%)
Gamma proteobacterium CHAB-VI-3, AJ240919Alteromonas macleodii , X82145
Clone C-OTU6 , AY700624 (6%)Clone A-OTU10 , AY700597 (5%)
Marine bacterium GK-2001, AF406617Colwellia maris, AB002630
A6 - DGGE-15, AY700651C5 - DGGE-27, AY700664
A6 - DGGE-14, AY700650C5 - DGGE-26, AY700663
A2 DGGE-7, AY700670A5 - DGGE-12, AY700648
Clone A-OTU3 , AY700601 (9%)A4 - DGGE-9, AY700672A5 - DGGE-11 , AY700647A2 - DGGE-8, AY700671
Clone A-OTU2 , AY700600 (13%)A5 - DGGE-13, AY700649
Uncultured marine eubacterium HstpL43, AF159674* Uncultured gamma proteobacterium, AF473987*
Clone B-OTU1, AY700608 (12%)Acinetobacter junii, AF417863
Acinetobacter johnsonii, Z93440*Pseudomonas putida, D85999*
Clone M-OTU7 , AY700637 (4%)Clone B-OTU3, AY700610 (10%)Gamma proteobacterium CHAB-I-7, AJ240911
Clone M-OTU11 , AY700629 (2%)Clone W-OTU3, AY700640 (5%)Marine bacterium, AJ400344Clone M-OTU2 , AY700632 (6%)
Marine bacterium, AJ400356Clone W-OTU7, AY700643 (3%)
Clone B-OTU7, AY700614 (7%)Clone M-OTU6 , AY700636 (4%)
Thioalcalovibrio denitrificans , AF126545 Clone A-OTU12 , AY700599 (3%)
Uncultured gamma proteobacterium, AF473991*A4 - DGGE-10, AY700646
A1 - DGGE-6, AY700669Pseudomonas sp., AB013829
Clone B-OTU6, AY700613 (7%)Clone B-OTU11 , AY700609 (5%)Uncultured gamma proteobacterium, AF473990*Stenotrophomonas maltophilia , AB008509
C2 - DGGE-23, AY700660C5 - DGGE-28, AY700665
Uncultured beta proteobacterium, AF473983*Clone A-OTU5 , AY700603 (6%)
Achromobacter xylosoxidans , AF411019Alcaligenes sp., AJ002815*
Uncultured beta proteobacterium, AF473989*Uncultured beta proteobacterium, AF473950*
C1 - DGGE-20, AY700657Delftia acidovorans, AF149849*
B2 - DGGE-16, AY700652Clone W-OTU8, AY700644 (3%)Marine bacterium, AJ400351
Clone M-OTU5 , AY700635 (4%)Clone W-OTU4, AY700641 (5%)Clone M-OTU3 , AY700651 (6%)
Clone M-OTU1 , AY700627 (22%)Clone M-OTU15 , AY700631 (2%)
Alpha-proteobacterium, U13159 Alpha-proteobacterium, AF353208
Clone W-OTU1, AY700639 (8%)Clone M-OTU14 , AY700630 (2%)
Marine bacterium, AJ400342 Clone W-OTU6, AY700642 (3%)
Uncultured alpha proteobacterium, AF473961*Uncultured alpha proteobacterium, AF473949*
Uncultured alpha proteobacterium, AF473962*Alpha proteobacterium MBIC1876, AB026194*
Silicibacter lacuscaerulensis, U77644*Alpha proteobacterium MBIC1887, AB026492*
Clone C-OTU3 , AY700622 (10%)Roseobacter sp., AF098495*
Marine bacterium, AF359530C2 - DGGE-25, AY700662
Uncultured alpha proteobacterium, AF473982*Brevundimonas vesicularis, AJ227780
Clone B-OTU5, AY700612 (8%)Uncultured bacterium, AF473988*
Clone C-OTU14 , AY700630 (2%) Clone C-OTU4 , AY700623 (8%) Bacterium K2-13, AY345436
Uncultured alpha proteobacterium, AF473984*Uncultured alpha proteobacterium, AF473954*
Prochlorococcus marinus str. TAK9803-2, AF311220 Clone M-OTU4 , AY700634 (4%) Clone M-OTU8 , AY700638 (2%) SncNAC1, Synechococcus NAC1-5, AF245618
Synechococcus PCC7942, AF132930* Unidentified cyanobacterium, AJ007876*
Staphylococcus pasteuri, AF532917 B4 - DGGE-21, AY700658 C1 - DGGE-22, AY700659
Clone M-OTU10 , AY700628 (2%) Water - DGGE-1 , AY700645
Actinomycete OCS155, AF001652
Aquifex pyrophilus , M83548
g - Proteobacteria
Vibrionaceae
Enterobacteriaceae
Alteromonadaceae
a - Proteobacteria
b - Proteobacteria
Firmicutes
Cyanobacteria
Actinobacteria
SAR86 cluster

1166
D. G. Bourne and C. B. Munn
© 2005 Society for Applied Microbiology and Blackwell Publishing Ltd,
Environmental Microbiology
,
7
, 1162–1174
Vibrio coralliilyticus
, two species implicated as the caus-ative agents of coral bleaching (Kushmaro
et al
., 1996;Banin
et al
., 2000; Ben-Haim and Rosenberg, 2002).Only 5% of clones within the tissue slurry B librarygrouped within the
Vibrionaceae
cluster. The other
g
-pro-teobacterial clones were spread in the SAR86 cluster (B-OTU3), affiliated with
Stenotrophomonas
species (B-OTU11, B-OTU6), and also affiliated with sulfur-oxidizingbacteria such as
Thioalcalovibrio denitrificans
(B-OTU7).One ribotype was observed across all three tissue slurryclone libraries (A-OTU6, A-OTU8, B-OTU4, C-OTU10)and affiliated with
Serratia marcescens
, also previouslyidentified as a coral pathogen (Patterson
et al
., 2002).Remaining
g
-
Proteobacteria
clones from both tissueslurry libraries A and C grouped with the
Alteromona-daceae
cluster, affiliating with
Shewanella
sp. (A-OTU11),
Moritella
sp. (A-OTU7) and
Alteromonas
sp. (A-OTU9, C-OTU11).
A number of clones within this study grouped withsequences retrieved from previous studies of microbialdiversity associated with healthy corals located in the Car-ibbean (see Fig. 3). For example, two dominant clonegroups within the tissue slurry A clone library, A-OTU2 andA-OTU3, affiliated with an uncultured
g
-proteobacterium(GenBank accession AF159674) retrieved from the corals
Montastraea franksi
(Rohwer
et al
., 2001) and
Diploriastrigosa
(Frias-Lopez
et al
., 2002). Another study ofhealthy
Diploria strigosa
and
Montastraea annularis
colo-nies (Cooney
et al
., 2002) similarly identified clone
sequences closely affiliated with this organism. Clonesfrom tissue library B (B-OTU6 and B-OTU11) affiliatedwith
Stenotrophomonas
sp. identified as a dominant clonetype by Cooney and colleagues (2002). Affiliations werealso across phylogenetic divisions with, for example, cloneA-OTU5 closely related to
b
-Proteobacteria
clones alsorecovered in the studies of Cooney and colleagues(2002). Other close affiliations were seen in the
a
-
Proteobacteria
division with clones derived from mucus,water and tissue slurry libraries in this study and theseaffiliations are highlighted in Fig. 3.
DGGE Analysis –
rpoB
and 16S rRNA genes
The gene coding for the beta subunit of the RNA poly-merase, rpoB has been proposed as an alternative genefor PCR-DGGE based microbial community analysis(Dahllöf et al., 2000). rpoB gene fingerprints under-repre-sented the true complex nature of microbial communitieswithin samples analysed (Fig. 4). Replicate fingerprints ofthe water samples were distinct from all tissue slurry sam-ples. Tissue slurry samples from colony B and C werehomogenous with identical banding patterns indicatinghigh conservation of DGGE fingerprints within andbetween these coral samples. The fingerprint of the coralA sample was more complex although identical betweenreplicate samples of the same coral colony. The fingerprintof colony A was distinct from colonies B and C, however,the dominant band in the fingerprint of B and C was also
Fig. 4. DGGE profile of rpoB gene fragments of water, and replicate tissue slurry samples from coral colonies A, B and C.
1 2 3 2 21 34 15 6 654 543
A B CWater
1 2 3 4 5 6 7 8 9 10 11 12 13 14 15 16 17 18 19

Bacteria associated with corals 1167
© 2005 Society for Applied Microbiology and Blackwell Publishing Ltd, Environmental Microbiology, 7, 1162–1174
present in the fingerprint of colony A indicating a potentialconserved bacterial population (Fig. 4).
16S rDNA-DGGE analysis provided a more complexmicrobial fingerprint of each sample analysed (Fig. 5A).PCR products were rerun and each set of samplesshowed a reproducible DGGE fingerprint. The complexnature of this DGGE fingerprint makes interpretation ofthe data difficult. Many bands were present with similarmobility both within replicate samples of the same colonyand between samples of different coral colonies. Althoughsome bands were consistent across samples, there wasalso heterogeneity between the fingerprints of samplesboth within a colony and between colonies. As a meansto analyse this data, nMDS analysis of 16S rDNA-DGGEpatterns was performed. The 16S rDNA-DGGE finger-print of the water sample was distinct from all the othersamples analysed (Fig. 5B). Heterogeneity of the sam-ples within a coral colony and between colonies was con-firmed by nMDS analysis, although broad groupingscould be assigned (see Fig. 5B). Replicate tissue slurrysamples (A1–A6) from coral A grouped closely together.However replicate DGGE fingerprints from tissue slurrysamples B and C were heterogenous and no close dis-tinct separate groupings for these samples within thesame coral colony were observed. Although more com-plex, this pattern was consistent with the rpoB-DGGEobservations.
In order to describe the phylogenetic diversity of theamplified rDNA, selected dominant bands were excisedfrom the DGGE gel and sequenced (sequenced bandsmarked in Fig. 5A) with phylogenetic affiliations repre-sented in Fig. 3. Again, like the clone library analysis, themajority of sequences retrieved from the 16S rDNA-DGGE analysis of tissue slurry samples affiliated with g-Proteobacteria. Many of the DGGE sequences were sim-ilar to sequences recovered from the clone libraries. Forexample, DGGE bands 7, 8, 9, 11, 12 and 13 (derivedfrom coral samples A2, A4 and A5) affiliated with uncul-tured g-proteobacterial clones recovered previously fromcoral tissues, similar to clones from the A library (A-OTUs2 and 3). DGGE band 2 affiliated with Serratia marce-scens similar to clones A-OTU6, A-OTU8, B-OTU4, C-OTU10 and band 3 (sample A1) affiliated with a Moritellasp. similar to clone A-OTU7. A few Vibrio relatedsequences were recovered as dominant bands from tis-sue slurry sample B2. Similar migrating bands wereobserved in samples A and C, although these were notsequenced to confirm this affiliation. Only one sequencedDGGE band (Band 25) affiliated with an a-Proteobacteriaorganism. Other DGGE bands were dispersed and affili-ated with other groups in the g-Proteobacteria includingbands from colonies A and C (14, 15, 26, 27) affiliatingwith Colwellia species. Again like the clone library data,many retrieved DGGE sequences grouped with previously
identified coral-specific microbial sequences and thesehave been highlighted in Fig. 3.
Discussion
This study provides the first analysis and comparison ofmicrobial communities from a coral from the GBR. It con-firms that bacterial communities associated with the glo-bally distributed coral Pocillopora damicornis are diverseand abundant and support hypotheses of conservedcoral-microbial consortia.
Previous microbiological studies of corals have useddifferent sampling protocols to investigate microbial activ-ity and diversity. These protocols include syringes forremoving coral mucus in situ (Kellogg, 2004), airbrushingof coral tissue (Rohwer et al., 2002; Wegley, et al., 2004)and crushing of coral pieces (Pantos et al., 2003). Withinthis study, coral mucus and airbrushed coral tissue slurrysamples were compared as a means for assessing micro-bial diversity. Non-metric multidimensional scaling analy-sis of RFLP data of clone libraries demonstrated that thecoral mucus sample analysed in this study resembled abacterial fingerprint of the water column rather than thecoral tissue slurry samples. This assertion was supportedby statistical diversity indices (Table 1), which were com-parable for water and mucus libraries. It was alsosupported by rarefaction analysis (Fig. 1), which demon-strated a higher level of total diversity assessed for tissueslurry libraries, reaching clear asymptotes, as opposed toboth the mucus and water libraries. Phylogenetic analysisof the clone libraries also displayed a distinct shift insequence affiliation with water and mucus libraries domi-nated by a-proteobacterial sequences as opposed to tis-sue slurry libraries that were dominated by g-proteobacterial sequences. This result is probably not sur-prising given that the sampling method of using a syringeto scrape along the coral surface in situ to remove mucuswill also result in sampling of a large amount of surround-ing seawater. Nevertheless, these results have importantimplications for future studies of coral-associatedmicrobes, with mucus samples reflecting a different coralmicroenvironment and consequent microbial populationcompared to samples of coral tissue.
Non-metric multidimensional scaling analysis of the tis-sue slurry clone libraries demonstrated that coral C sep-arated from corals A and B, although DGGE fingerprintpattern analysis (both 16S rDNA and rpoB) demonstratedcorals B and C to be more similar. Despite these anoma-lies, retrieved sequences from all tissue slurry clone librar-ies were dominated by g-proteobacterial affiliatedorganisms, and similar DGGE bands with close sequenceidentity (bands 14, 15, 26, 27) were found across the coralcolonies sampled. Many clones in library C affiliatedclosely with clones from library A although they displayed

1168 D. G. Bourne and C. B. Munn
© 2005 Society for Applied Microbiology and Blackwell Publishing Ltd, Environmental Microbiology, 7, 1162–1174
Fig. 5. DGGE profile of 16S rRNA gene fragments of water, and replicate tissue slurry samples from coral colonies A, B and C.A. DGGE gel fingerprint. Numbers on the figure represent bands that were cut from the gel and sequenced. These sequences are presented in the phylogenetic tree in Fig. 3. The symbol ‘¥¥¥¥’ represents bands for which sequence data could not be obtained.B. Representation of non-metric multidimensional scaling (nMDS) plots for each sample. Data obtained by distance matrix analyses of DGGE fingerprints. The stress value a measure of significance of the calculation is presented in the left hand bottom corner of the plot.
1 2 3 2 21 34 15 6 654 654
A B C
Water
11
23
6 78
1010
13131212
1616
17171818
2020
1919
2323 2828
45
2121
15151414
11
25252424
2222
927272626
1 2 3 4 5 6 7 8 9 10 11 12 13 14 15 16 17 18
1
23
6 78
10
1312
16
1718
20
19
23 28
45
21
1514
11
2524
22
92726
C6
C5
C4
C2
B6B5 B4
B3
B1
A6
A5 A4
A3
A2
A1
Water
C1
Stress = 4.2
A
B

Bacteria associated with corals 1169
© 2005 Society for Applied Microbiology and Blackwell Publishing Ltd, Environmental Microbiology, 7, 1162–1174
quite distinct RFLP patterns. These distinct RFLP pat-terns, caused by minor sequence variations, contributedto the grouping of coral C away from the other coral tissueslurry samples in nMDS analysis despite phylogeneticanalysis indicating the opposite.
Heterogeneity of 16S rDNA is a typical feature of bac-teria isolated from natural environments that has implica-tions for the interpretation of banding patterns from 16SrDNA PCR-DGGE in studies of microbial diversity andchanges between environmental samples. Dahllöf andcolleagues (2000) demonstrated that PCR amplified rpoBgenes from environmental isolates result in single bandson DGGE gels that correlate with single species or pop-ulations, providing a more accurate reflection of microbialcommunities then 16S rDNA-DGGE. However, within thisstudy, banding fingerprints of coral samples analysed withrpoB-DGGE appeared to under-represent the total poten-tial microbial fingerprint. Primers used for rpoB-DGGEamplification have been designed on a limited bacterialrpoB gene database (Dahllöf et al., 2000) and thereforethe coverage of these primers for amplification of totalmicrobial diversity within a particular environment maybe limited. As the database of microbial rpoB genessequenced increases, the usefulness of this tool for anal-ysis of microbial communities will no doubt increase aswell. Within this study, although the rpoB-DGGE analysesprovided a potentially biased and limited banding profileof coral samples, the effect was the same and standard-ized for all coral samples and comparisons on this infor-mation can still be performed.
Clone library analysis demonstrated that the microbialcommunity of the mucus sample resembled a differentcoral microniche, one more closely associated with water.As a result, these mucus samples were not analysed byDGGE. Statistical nMDS analysis of DGGE fingerprintsdemonstrated some partitioning of samples with waterand colony A fingerprints separated from colony B and Cfingerprints. However the heterogeneity in these finger-prints of colonies B and C is shown by the occurrence ofall representative points being interdispersed in the nMDSplot (Fig. 5B). Previous studies have demonstrated thatbacteria have potentially multiple 16S rDNA genes withsmall nucleotide substitutions leading to multiple bands ofdifferent mobility on the DGGE profile (Fogel et al., 1999;Ueda et al., 1999; Dahllöf et al., 2000). This may providesome explanation to the heterogeneity in the 16S rDNADGGE banding patterns between the replicate samplesof the same coral colony and even between colonies.Sequence analysis appears to indicate this may be thecase with many sequences of similar identity beingretrieved from both DGGE profiles and clone libraries ofthe different tissue coral samples. Another explanation forcomplex banding patterns in DGGE is because of doublebands appearing on gels that have a similar DNA
sequence. This increases the complexity of DGGE profilesand makes interpretation difficult and may provide anotherreason for the heterogeneity of the DGGE patterns result-ing in the separation of the samples in nMDS analysis.Double bands may be related to degenerate positions inthe primers (Kowalchuk et al., 1997) or alternatively theycan be caused by abortion of the elongation reactionduring PCR caused by the GC-clamp forming stabledimers and hairpins (Nübel et al., 1996; Muyzer et al.,1998).
Molecular studies of corals have previously shown thatthe associated microbiota is extremely diverse in speciesrichness and abundance (Rohwer et al., 2001; Cooneyet al., 2002; Frias-Lopez et al., 2002; Rohwer et al.,2002). For example, Rohwer and colleagues (2002)identified 430 ribotypes from 14 coral samples in theCaribbean and found g-Proteobacteria followed by a-Pro-teobacteria to be the most common identifiable groups.Bacillus/Clostridium, Cytophaga-Flavobacter/Flexibacter-Bacterioides and cyanobacteria were also commonalthough less dominant in 16S rDNA banks. However, theabundance of different bacterial groups varied acrosssamples with some bacterial groups more common incertain coral species. This was highlighted by an earlierstudy that identified the dominant microbial groups asso-ciated with the Caribbean coral Montastraea franksi as a-Proteobacteria and cyanobacteria ribotypes (Rohweret al., 2001). Frias-Lopez and colleagues (2002) similarlydemonstrated that the microbial communities inhabitinghealthy coral tissue show marked differences betweenthree Caribbean corals. Sequences retrieved from clonelibraries of the coral Montastrea anularis exhibited higherbacterial diversity then libraries from healthy Montastreacavernosa and Diploria strigosa coral species (Frias-Lopez et al., 2002). These previous studies have all high-lighted the potential for corals to harbour species-specificmicrobiota (Frias-Lopez et al., 2002; Rohwer et al., 2002;Rohwer and Kelley, 2004). The phenomenon of conservedmicrobial consortia is not unique in the marine environ-ment. For example, sponges also appear to have mono-phyletic species-specific clusters of bacteria associatedwith the macroorganism (Hentschel et al., 2002).
Within this study, phylogenetic analysis of thesequences retrieved from the DGGE fingerprints showsome conservation of bacterial groups between coral col-onies and within colonies. DGGE analysis supported theclone library work in that the majority of sequencesretrieved clustered with the g-Proteobacteria and providessome support to the assertion of previous studies(Rohwer et al., 2002) that bacterial populations are con-served between coral colonies. An interesting observationof the study was the number of clone and DGGE retrievedsequences that affiliated with sequences recovered fromhealthy corals of the Caribbean. These affiliations were
1170 D. G. Bourne and C. B. Munn
© 2005 Society for Applied Microbiology and Blackwell Publishing Ltd, Environmental Microbiology, 7, 1162–1174
found across phylogenetic divisions and lend furthersupport to the observations that corals have specificassociated microbiota and may in fact harbour these pop-ulations. This is most strikingly observed with the obser-vation of a g-proteobacterial sequence retrieved bothwithin this study on the GBR (clones A-OTU2, A-OTU3and DGGE bands 7, 8, 9, 11, 12, 13) and a number ofprevious studies by Rohwer and colleagues (2001),Cooney and colleagues (2002) and Frias-Lopez and col-leagues (2002) in the Caribbean on healthy coral samplesof different species. Together, these results indicate thatmicrobial populations associated with corals may be glo-bally distributed. This seems to be analogous to coraldiseases with the best known example, Black Band Dis-ease (BBD) and associated microbial consortium, show-ing a consistent and global distribution (Frias-Lopez et al.,2003; Willis et al., 2004).
Both clone library and DGGE molecular-based studiesretrieved a number of sequences that affiliated with theVibrionaceae, indicating that members of this group mayform a natural part of the microbial community of healthycorals. Indeed, clone library analysis showed that vibriosconstituted a large proportion (21% and 38%) of the coralA and C clone libraries respectively. Previous molecularstudies have not highlighted vibrios as being a majorcomponent of healthy coral tissue (Rohwer et al., 2001;Cooney et al., 2002; Frias-Lopez et al., 2002; Rohweret al., 2002). Using culture-based methods, Ritchie andcolleagues (1994) showed that Vibrio populations wereabsent from healthy corals although they represented30% of isolates from bleached corals, suggesting that theymay be responsible for bleaching. Ritchie and Smith(2004) subsequently presented data showing that Vibriopopulations are present in coral prior to bleaching andincrease during a bleaching event, before returning toprevious levels during recovery. In this study, clones show-ing high 16S rDNA sequence identity to both Vibrio shiloiand Vibrio coralliilyticus were retrieved. These vibrioshave been confirmed as coral bleaching pathogens (Baninet al., 2000; Ben-Haim and Rosenberg, 2002; Rosenbergand Ben-Haim, 2002). Subsequent return visits to taggedcoral colonies found the corals to be healthy, without anyobvious signs of disease or bleaching. Thus, the role thatVibrio spp. may be playing here is unknown. These organ-isms may be a normal component of the healthy coralmicrobiota, with environmental triggers such as increasedtemperature switching on virulence factors to allow infec-tion and subsequent bleaching or necrosis of corals, asillustrated by Rosenberg (2004). Vibrios associated withcorals may therefore be opportunistic pathogens, as isobserved in infections of fish and invertebrates in aquac-ulture systems (Olafsen, 2001; Sudheesh and Xu, 2001;Vandenberghe et al., 2003). The study reported here linkswith another project looking at the diversity and properties
of cultivable bacteria isolated from corals from the GBRand other marine life from various geographic regions,focusing particularly on the Vibrionaceae (Thompsonet al., 2004). Further phenotypic and genotypic studies ofisolates obtained from corals of the GBR have been per-formed and will be presented elsewhere.
Experimental procedures
Sample collections
Three colonies of the coral Pocillopora damicornis located at~3–5 m depths were tagged at the weather station on DaviesReef (Latitude 18∞50.9¢S/Longitude 147∞41E) Great BarrierReef, Australia. Seawater samples (1 l) were taken in sterileNalgene high-density polyethylene bottles at 1 m distancesfrom each coral colony. The remaining seawater was imme-diately filtered through 0.22 mm Sterivex filter columns (Milli-pore), 1.8 ml of lysis buffer (40 mM EDTA: 50 mM Tris,pH 8.3; 0.75 M sucrose) was added to the filters and thesamples stored at -80∞C. Replicate mucus from each coralcolony was sampled in situ using 50 ml sterile syringes andthe coral mucus drawn into the syringe. Samples were filteredthrough 0.22 mm Sterivex filter columns (Millipore), filled withlysis buffer as above and stored at -80∞C. Coral tissue slurrysamples were obtained using the following procedure. Fromeach tagged colony, six replicate coral nubbins (~2–3 cm inlength) were harvested and immediately placed in plasticbags underwater. At the surface, each sample was washedtwice in 0.2 mm filtered and autoclaved artificial seawater(ASW) to remove loosely attached microbes. The sampleswere airbrushed (80 psi) with 5 ml ASW to removed coraltissue and associated microbes from the coral skeleton. Theslurry was homogenized in a hand held sterile glass homog-enizer to break up aggregates and aliquoted into cryovialsand stored at -80∞C for later molecular analysis. All coralsappeared healthy at the time of sampling and processing wasperformed within 1 h of sample collection.
DNA extraction and purification
DNA was extracted from seawater and coral mucus samplespreviously filtered through Sterivex filters using the procedureof (Schauer et al., 2000). DNA was extracted from tissueslurry samples using a modified urea extraction buffer proto-col (Asahida et al., 1996). Briefly, the tissue slurry samplewas resuspended in 100 ml of sterile ASW and ground inliquid nitrogen with a sterile pestle inside a 2 ml Eppendorftube. Urea extraction buffer (0.5 ml of 10 M urea, 0.5 M NaCl,160 mM Tris-HCl, 0.03 M EDTA and 0.5 M sarcosine) wasadded, the tissue re-ground in extraction buffer and shakenfor 5 min at 37∞C. An equal volume of phenol/chloroform/iso-amyl alcohol (25:24:1) was added and gently shaken for5 min at 37∞C. The liquid phase was removed and extractedwith an equal volume of chloroform/iso-amyl alcohol (24:1).The liquid phase was removed and 50 ml of sodium acetate(3 M) added along with an equal volume of isopropanol. DNAwas pelleted (13 000 g for 15 min) and washed with 70%ethanol. Extraction of DNA from corals also coextractedhumic and phenolic materials that inhibited PCR amplification

Bacteria associated with corals 1171
© 2005 Society for Applied Microbiology and Blackwell Publishing Ltd, Environmental Microbiology, 7, 1162–1174
of crude DNA (results not shown). Subsequently, DNA waspurified by electrophoresis through a 1.2% low melting aga-rose gel with 2% polyvinylpyrrolidone (PVP). High qualityDNA (>2 kb) was cut from the gel and purified using theQIAquick® gel extraction kit (QIAGEN), following the manu-facturer’s instructions. DNA was recovered in 50 ml sterilemilli-Q water, quantified using a GeneQuant Pro spectropho-tometer (Amersham Pharmacia Biotech) and stored at -20∞Cuntil required.
PCR amplification of 16S rDNA
Primers 27F and 1492R (Lane, 1991) were used for amplifi-cation of the 16S rDNA from bacterial isolated genomic DNAand environmentally extracted DNA from seawater, coralmucus and tissue slurry samples. 16S rDNA-DGGE PCRamplification of seawater and tissue slurry samples wereperformed with primers 1055F (Escherichia coli positions1055–1070) and 1392R-GC (E. coli positions 1392–1406)(Ferris et al., 1996). A 40-bp rich GC clamp was attached tothe 5¢ end of the 1392R primer (Muyzer et al., 1993; Ferriset al., 1996). These primers amplify a 323-bp section of the16S rDNA genes of members of the domain Bacteria, includ-ing the highly variable V9 region. rpoB-DGGE PCR amplifi-cation used primers rpoB1698F (Escherichia coli position1643) and rpoB2041R (Escherichia coli 2041) (Dahllöf et al.,2000). A GC clamp as outlined for the 16S rDNA-DGGE PCRwas added to the 5¢ end of the rpoB1698F primer.
All PCR was performed on a GeneAmp® model 9700temperature cycler (Perkin Elmer Cetus) as follows; 10 pmolof each primer, 2.5 mmol of each deoxyribonucleotide triph-osphate, 1 ¥ PCR buffer and 1 U of Taq DNA polymerase(QIAGEN) and adjusted to a final volume of 50 ml with sterilewater. The temperature cycling for the PCR reaction was asfollows; 27F/1492R: 1 cycle at 95∞C for 5 min; 30 cycles at95∞C for 1 min, 54∞C for 1 min and 72∞C for 2 min; and 1 finalcycle at 95∞C for 1 min, 54∞C for 1 min and 72∞C for 10 min1055/1392R-GC: as outlined in Ferris and colleagues (1996).rpoB1698F-GC/rpoB2041R: as outlined in Dahllöf and col-leagues (2000). PCR products were checked on 1% agarosegels.
Clone library construction and RFLP analysis
Amplified DNA from water, mucus and tissue slurry sam-ples A, B and C was ligated into a TOPO-TA Cloning®vector using the protocol of the manufacturer (Invitrogen).Ligated vector and insert were transformed into competentE. coli cells again using the methods of the manufacturerwith recombinant transformations selected by blue andwhite screening. Small-scale preparations of plasmids wereperformed using the methods of Saunders and Burke(1990). The complete cloned 16S rRNA gene of eachclone was re-amplified by PCR using the methods outlinedpreviously and the M13 forward and reverse primers sup-plied with the cloning kit. PCR products were separatelydigested with 7.5 U of the restriction endonucleases HhaIand HaeIII (Promega) for 3 h at 37∞C. The resulting frag-ments were analysed on 3% high quality ethidium bromidestained agarose gels and the restriction pattern compared.
Clones having identical RFLP patterns were grouped intoOTU groups. Representative clones from dominant OTUgroups (containing two or more clones with identical RFLPpatterns) were sequenced and phylogenetic analysis ofthese sequences performed.
Denaturing gradient gel electrophoresis analysis
PCR products were separated using an INGENY phorU-2(Ingeny International BV) DGGE system. Samples wereloaded onto 6.5% acrylamide gels run with 0.5 ¥ TAE buffer(0.02 M Tris base, 0.01 M sodium acetate, and 0.5 mM Na2
EDTA; pH adjusted to 7.4) and a 35–80% linear gradient ofurea and formamide for 16S rDNA-DGGE and a 45–65%linear gradient for rpoB-DGGE. The electrophoresis was runat 60∞C, first for 20 min at 20 V and subsequently for 16 h at75 V. After electrophoresis the gels were stained for 30 minwith SYBR Gold nucleic acid stain (MolecularProbes) in TAEbuffer, rinsed and photographed.
From 16S rDNA-DGGE gels, distinct bands were excisedfrom the gel and placed in 100 ml of sterile Milli-Q waterovernight to elute DNA. The bands were re-amplified andagain run on the DGGE system to ensure purity and correctmobility of re-amplified bands within the gels. Direct sequenc-ing of the bands was subsequently performed.
Sequencing and phylogenetic analysis
Plasmid DNA from each clone was purified using theQIAprep® miniprep kit (Qiagen) and sequenced to obtainan almost complete sequence of the 16S rDNA insert(> 1300 bp unless otherwise stated). All sequencing was per-formed using the Dynamic ET Dye (Amersham BioSciences)sequencing kit and reactions analysed on a MegaBACE DNAAnalysis System (Amersham BioSciences). Sequences werechecked for chimera formation with the CHECK_CHIMERAsoftware of the Ribosomal Database Project (Maidak et al.,1996). Sequence data were analysed with the ARB softwarepackage (Ludwig et al., 2004). Tree topology was evaluatedby reconstructing phylogenies using evolutionary distance(Phylip Distance Method with Jukes and Cantor model), max-imum parsimony (ARB and DNAPARS) and maximum likeli-hood (ARB and fastDNAml) analyses of the aligned near full-length sequences (>1000 bp) (Ludwig et al., 1998). Regionsof ambiguous sequence (N) were removed from the analysis.The confidence of branch points was determined using astrict consensus rule applied to the results of the three anal-ysis methods and a consensus tree produced. Aligned, par-tial 16S rRNA sequences (<1000 bp) were subsequentlyinserted into the consensus tree without changing the overalltree topology using the parsimony tool available within ARB.The phylogeny presented is based on the evolutionary dis-tance analysis.
The nucleotide sequence data of all clones reported in thispaper will appear in the GenBank nucleotide sequence data-base under the accession numbers AY700596–AY700644.Sequence data of DGGE bands will appear in the GenBanknucleotide database under accession numbers AY700645–AY700672.

1172 D. G. Bourne and C. B. Munn
© 2005 Society for Applied Microbiology and Blackwell Publishing Ltd, Environmental Microbiology, 7, 1162–1174
Statistical analysis
For DGGE banding patterns, the software program Gel-K2developed by Svein Norland (Department of Microbiology,University of Bergen, Norway) was used to make a binarymatrix based on presence or absence of aligned bands. From16S rDNA-DGGE and clone library RFLP binary data, the Rstatistical package (http://www.R-project.org) was used toconvert the data to a distance matrix. These data were anal-ysed using nMDS (Schiffman and Reynolds, 1981) and therelationships among samples are represented in plots of thefirst two dimensions of the nMDS solution.
Various indices and models were used to analyse the vari-ation of microbial diversity within clone libraries (Magurran,1988).
Richness indices. The Shannon-Weaver diversity index(Shannon and Weaver, 1963) was calculated as:
where pi is the proportion of clones belonging to the ith OTUand S is the total number of OTUs; RFLP patterns wereconsidered as OTUs (Moyer et al., 1994).
Abundance models. Fisher’s Alpha log series richness index(Fisher et al., 1943). The diversity of clone libraries was fur-ther investigated by rarefaction analysis (Hurlbert, 1971;Heck et al., 1975; Simberloff, 1978). Rarefaction curves wereproduced by using the analytical approximation algorithm ofHurlbert (1971). Calculations were performed on a personalcomputer with the freeware program aRarefact Win (Holland,1988). Coverage (C) values are calculated by the equation:
C = 1 - (n/N) ¥ 100
where n is the number of unique clones and N is the totalnumber of clones examined (Good, 1953).
Acknowledgements
We would like to thank Steven Delean at AIMS for help withstatistical analysis and Nicole Webster and Tim Simmondsfor help in preparation of this manuscript. We also thank BetteWillis, Eric Matson and the crew of AIMS RV Cape Fergusonfor help in field based activities. C. B. M. gratefully acknowl-edges financial support from the Leverhulme Trust.
References
Asahida, T., Kobayashi, T., Saitoh, K., and Nakayama, I.(1996) Tissue preservation and total DNA extraction fromfish stored at ambient temperature using buffers containinghigh concentrations of urea. Fisheries Sci 62: 727–730.
Banin, E., Israely, T., Kusmaro, A., Loya, Y., Orr, E., andRosenberg, E. (2000) Penetration of the coral-bleachingbacterium Vibrio shiloi into Oculina patgonica. Appl Envi-ron Microbiol 66: 3031–3036.
Banin, E., Israely, T., Fine, M., Loya, Y., and Rosenberg, E.(2001a) Role of endosymbiotic zooxanthellae and coralmucus in the adhesion of the coral-bleaching pathogenVibrio shiloi to its host. FEMS Microbiol Lett 199: 33–37.
¢ = - ( )=ÂH pi pii
s
ln1
Banin, E., Khare, S.K., Naider, F., and Rosenberg, E.(2001b) Proline-rich peptide from the coral pathogen Vibrioshiloi that inhibits photosynthesis of zooxanthellae. ApplEnviron Microbiol 67: 1536–1541.
Banin, E., Vassilakos, D., Orr, E., Martinez, R.J., and Rosen-berg, E. (2003) Superoxide dismutase is a virulence factorproduced by the coral bleaching pathogen Vibrio shiloi.Curr Microbiol 46: 418–422.
Ben-Haim, Y., and Rosenberg, E. (2002) A novel Vibrio sp.pathogen of the coral Pocillopora damicornis. Mar Biol 141:47–55.
Ben-Haim, Y., Zicherman-Keren, M., and Rosenberg, E.(2003) Temperature-regulated bleaching and lysis of thecoral Pocillopora damicornis by the novel pathogenVibrio coralliilyticus. Appl Environ Microbiol 69: 4236–4242.
Cooney, R.P., Pantos, O., Le Tissier, M.D.A., Barer, M.R.,O’Donnell, A.G., and Bythell, J.C. (2002) Characterisationof the bacterial consortium associated with the black banddisease in coral using molecular microbiological tech-niques. Environ Microbiol 4: 401–413.
Dahllöf, I., Baillie, H., and Kjelleberg, S. (2000) rpoB-basedmicrobial community analysis avoids limitations inherent in16S rRNA gene intraspecies heterogeneity. Appl EnvironMicrobiol 66: 3376–3380.
Denner, E.B., Smith, G.W., Busse, H.J., Schumann, P.,Narzt, T., Polson, S.W., et al. (2003) Aurantimonas corali-cida Gen. nov., sp. nov., the causative agent of whiteplague type II on Caribbean scleractinian corals. Int J SystEvol Microbiol 53: 1115–1122.
Ducklow, H.W., and Mitchell, R. (1979) Bacterial populationsand adaptions in the mucus layers of living corals. LimnolOceanogr 24: 715–725.
Eilers, H., Pernthaler, J., Glockner, F.O., and Amann, R.(2000) Culturability and in situ abundance of pelagic bac-teria from the North Sea. Appl Environ Microbiol 66: 3044–3051.
Ferris, M.J., Muyzer, G., and Ward, D.M. (1996) Denaturinggradient gel electrophoresis profiles of 16S rRNA-definedpopulations inhabiting a hot spring microbial mat commu-nity. Appl Environ Microbiol 62: 340–346.
Fisher, R.A., Corber, A.S., and Williams, C.B. (1943) Therelation between the number of species and the number ofindividuals in a random sample of an animal population. JAnim Ecol 12: 42–58.
Fogel, G.B., Collins, C.R., Li, J., and Brunk, C.F. (1999)Prokaryotic genome size and SSU rDNA copy number:estimation of microbial relative abundance from a mixedpopulation. Microb Ecol 38: 93–113.
Frias-Lopez, J., Zerkle, A.L., Bonheyo, G.T., and Fouke, B.W.(2002) Partitioning of bacterial communities between sea-water and healthy, black band diseased and dead coralsurfaces. Appl Environ Microbiol 68: 2214–2228.
Frias-Lopez, J., Bonheyo, G.T., Jin, Q., and Fouke, B.W.(2003) Cyanobacteria associated with coral black banddisease in Caribbean and Indo-Pacific reefs. Appl EnvironMicrobiol 69: 2409–2413.
Gast, G.J., Wiegman, S., Wieringa, E., Duyl, F.C., and Bak,R.P.M. (1998) Bacteria in coral reef water types: removalof cells, stimulation of growth and mineralization. Mar EcolProg Ser 167: 37–45.

Bacteria associated with corals 1173
© 2005 Society for Applied Microbiology and Blackwell Publishing Ltd, Environmental Microbiology, 7, 1162–1174
Good, I.J. (1953) The population frequencies of species andthe estimation to the population parameters. Biometrika40: 237–264.
Heck, K.L.J., Van Belle, G., and Simberloff, D. (1975) Explicitcalculation of the rarefaction diversity measurements andthe determination of sufficient sample size. Ecology 56:1459–1461.
Hentschel, U., Hopke, J., Horn, M., Friedrich, A.B., Wagner,M., Hacker, J., and Moore, B.S. (2002) Molecular evidencefor a uniform microbial community in sponges from differentoceans. Appl Environ Microbiol 68: 4431–4440.
Holland, S.H. (1988) A Rarefactwin Program, Version 1.2.[URL Document]. http://www.uga.edu/strata/Software.html
Hurlbert, S.H. (1971) The non-concept of species diversity:a critique and alternative parameters. Ecology 52: 577–586.
Kellogg, C.A. (2004) Tropical Archaea: diversity associatedwith the surface microlayer of corals. Mar Ecol Prog Ser273: 81–88.
Kowalchuk, G.A., Stephen, J.R., De Boer, W., Prosser, J.I.,Embley, T.M., and Woldendorp, J.W. (1997) Analysis ofammonia-oxidizing bacteria of the b subdivision of theclass Proteobacteria in coastal sand dunes by denaturinggradient gel electrophoresis and sequencing of PCR-amplified 16S ribosomal DNA fragments. Appl EnvironMicrobiol 63: 1489–1497.
Kushmaro, A., Loya, Y., Fine, M., and Rosenberg, E. (1996)Bacterial infection and coral bleaching. Nature 380: 396.
Lane, D.J. (1991) 16S/23S rRNA Sequencing. Chichester:John Wiley and Sons.
Ludwig, W., Strunk, O., Klugbauer, S., Klugbauer, N., Wei-zenegger, M., and Neumaier, J. (1998) Bacterial phylogenybased on comparative sequence analysis. Electrophoresis19: 554–568.
Ludwig, W., Strunk, O., Westram, R., Richter, L., Meier, H.,Yadhukumar, et al. (2004) ARB: a software package envi-ronment for sequence data. Nucleic Acids Res 32: 1363–1371.
Magurran, A.E. (1988) Ecological Diversity and its Measure-ment. Princeton, NJ: Princeton University Press.
Maidak, B.L., Olsen, G.J., Larsen, N., Overbeek, R.,McCaughey, M.J., and Woese, C.R. (1996) The Riboso-mal Database Project (RDP). Nucleic Acids Res 24: 82–85.
Moyer, C., Dobbs, F., and Karl, D. (1994) Estimation of diver-sity and community structure through restriction fragmentlength polymorphism distribution analysis of bacterial 16SrRNA genes from a microbial mat at an active, hydrother-mal vent system, Loihi Seamount, Hawaii. Appl EnvironMicrobiol 60: 871–879.
Muyzer, G., Dewaal, E.C., and Uitterlinden, A.G. (1993) Pro-filing of complex microbial populations by denaturing gra-dient gel electrophoresis analysis of polymerase chainreaction amplified genes coding for the 16S rRNA. ApplEnviron Microbiol 59: 695–700.
Muyzer, G., Brinkhoff, T., Nübel, N., Santegoeds, C.,Schäfer, H., and Wawer, C. (1998) Denaturing gradient gelelectrophoresis (DGGE) in microbial ecology. In MolecularMicrobial Ecology Manual vol. 3.4.4. Akkermans, A.D.L.,van Elsas, J.D., and de Bruijn, F.J. (eds). Dordrecht:Kluwer Academic Publishers, pp. 1–27.
Nübel, U., Engelen, B., Felske, A., Snaidr, J., Wieshuber, A.,Amann, R.I., et al. (1996) Sequence heterogeneities ofgenes encoding 16S rRNAs in Paenibacillus polymyxadetected by temperature gradient gel electrophoresis. JBacteriol 178: 5636–5643.
Olafsen, J.A. (2001) Interactions between fish larvae andbacteria in marine aquaculture. Aquaculture 200: 223–247.
Pantos, O., Cooney, R.P., Le Tissier, M.D.A., Barer, M.R.,O’Donnell, A.G., and Bythell, J.C. (2003) The bacterialecology of a plague-like disease affecting the Caribbeancoral Montastrea annularis. Environ Microbiol 5: 370–382.
Patterson, K.L., Porter, J.W., Ritchie, K.B., Polson, S.W.,Mueller, E., Peters, E.C., et al. (2002) The etiology of whitepox, a lethal disease of the Caribbean elkhorn coral,Acropora palmata. Proc Natl Acad Sci USA 99: 8725–8730.
Paul, J.H., Deflaun, M.F., and Jeffery, W.H. (1986) Elevatedlevels of microbial activity in the coral surface monolayer.Mar Ecol Prog Ser 33: 29–40.
Richardson, L.L. (1996) Horizontal and vertical migration pat-terns of Phormidium corallyticum and Beggiatoa spp. asso-ciated with black band disease of corals. Microb Ecol 32:323–335.
Richardson, L.L. (1998) Coral disease: what is really known?Trends Ecol Evol 13: 438–443.
Richardson, L.L., Kuta, K.G., Schnell, S., and Carlton, R.G.(1997) Ecology of the black band disease microbial con-sortium. In Eighth International Coral Reef Symposium.Lessios, H.A., and Macintyre, I.E. (eds). Panama: Balboa,pp. 597–600.
Richardson, L.L., Goldberg, W.M., Kuta, K.G., Aronson, R.B.,Smith, G.W., and Ritchie, K.B. (1998) Florida’s mysterycoral-killer identified. Nature 392: 557–558.
Ritchie, K.B., and Smith, G.W. (1995) Preferential carbonutilization by surface bacterial communities from watermass, normal, and white-band diseased Acropora cervi-cornis. Mol Mar Biol Biotech 4: 345–354.
Ritchie, K.B., and Smith, G.W. (2004) Microbial communitiesof coral surface mucopolysaccharide layers. In CoralHealth and Disease. Rosenberg, E., and Loya, Y. (eds).New York: Springer-Verlag, pp. 259–263.
Ritchie, K.B., Dennis, J.H., McGrath, T., and Smith, G.W.(1994) Bacteria associated with bleached and non-bleached areas of Montastrea anularis. In Proceedings ofthe 5th Symposium of the National History of the Bahamas.Kass, L.B. (ed.). San Salvador, Bahamas: Bahamian FieldStation, pp. 75–80.
Rohwer, F., and Kelley, S. (2004) Culture independent anal-yses of coral-associated microbes. In Coral Health andDisease. Rosenberg, E., and Loya, Y. (eds). New York:Springer-Verlag, pp. 265–277.
Rohwer, F., Breitbart, M., Jara, J., Azam, F., and Knowlton,N. (2001) Diversity of bacteria associated with the Carib-bean coral Montastraea franksi. Coral Reefs 20: 85–91.
Rohwer, F., Seguritan, V., Azam, F., and Knowlton, N. (2002)Diversity and distribution of coral-associated bacteria. MarEcol Prog Ser 243: 1–10.
Rosenberg, E. (2004) The bacterial disease hypothesis ofcoral bleaching. In Coral Health and Disease. Rosenberg,E., and Loya, Y. (eds). New York: Springer-Verlag, pp. 445–461.

1174 D. G. Bourne and C. B. Munn
© 2005 Society for Applied Microbiology and Blackwell Publishing Ltd, Environmental Microbiology, 7, 1162–1174
Rosenberg, E., and Ben-Haim, Y. (2002) Microbial diseasesof corals and global warming. Environ Microbiol 4: 318–326.
Saunders, S.E., and Burke, J.F. (1990) Rapid isolation ofminiprep DNA for double stranded sequencing. NucleicAcids Res 18: 4948.
Schauer, C., Massana, R., and Pedròs-Aliò, C. (2000) Spatialdifferences in bacterioplankton composition along the Cat-alan coast (NW Mediterranean) assessed by molecularfinger-printing. FEMS Microbiol Ecol 33: 51–59.
Schiffman, S.S., and Reynolds, M.L. (1981) Introduction toMultidimensional Scaling. Theory, Methods and Applica-tions. London, UK: Academic Press.
Shannon, C.E., and Weaver, W. (1963) The MathematicalTheory of Communication. Urbana, IL: University of IllinoisPress.
Shashar, N., Cohen, Y., Loya, Y., and Sar, N. (1994) Nitrogenfixation (acetylene reduction) in stony corals: evidence forcoral–bacterial interactions. Mar Ecol Prog Ser 111: 259–264.
Simberloff, D. (1978) Use of rarefaction and related methodsin ecology. In Biological Data in Water Pollution Assess-ment: Quantitative and Statistical Analyses. Dickson, K.L.,Cairns, J.J., and Livingston, R.J. (eds). Philadelphia, PA:American Society for Testing and Materials, pp. 150–165.
Sorokin, Y.I. (1973) Trophical role of bacteria in the ecosys-tem of the coral reef. Nature 242: 415–417.
Sudheesh, P.S., and Xu, H.-S. (2001) Pathogenicity of Vibrioparahaemolyticus in tiger prawn Penaeus monodon Fabri-
cius: possible role of extracellular proteases. Aquaculture196: 37–46.
Thompson, F.L., Thompson, C.C., Naser, S., Hoste, B., Van-demeulebroecke, V., Munn, C., et al. (2004) Photobacte-rium eurosenbergii sp. nov. & Enterovibrio coralii sp. nov.,vibrios associated with coral bleaching. Int J Syst EvolMicrobiol (in press). doi:10.1099/ijs.0.63370-0
Toren, A., Landau, L., Kushmaro, A., Loya, Y., and Rosen-berg, E. (1998) Effect of temperature on adhesion of Vibriostrain AK-1 to Oculina patagonica and on coral bleaching.Appl Environ Microbiol 64: 1379–1384.
Ueda, K., Seki, T., Kudo, T., Yoshida, T., and Kataoka, M.(1999) Two distinct mechanisms cause heterogeneity of16S rRNA. J Bacteriol 181: 78–82.
Vandenberghe, J., Thompson, F.L., Gomez-Gil, B., andSwings, J. (2003) Phenotypic diversity amongst Vibrio iso-lates from marine aquaculture systems. Aquaculture 219:9–20.
Wegley, L., YuY., Breitbart, M., Casas, V., Kline, D.I., andRohwer, F. (2004) Coral-associated Archaea. Mar EcolProg Ser 273: 89–96.
Williams, W.M., Viner, A.B., and Broughton, W.L. (1987)Nitrogen fixation (acetylene reduction) associated withthe living coral Acropora variablis. Mar Biol 94: 521–535.
Willis, B.L., Page, C.A., and Dinsdale, E.A. (2004) CoralDiseases on the Great Barrier Reef. In Coral Health andDisease. Rosenberg, E., and Loya, Y. (eds). New York:Springer-Verlag, pp. 69–104.