Super-Diffusivity in a Shear Flow Model¶from Perpetual Homogenization

TIDAL METHODS FOR ESTIMATING AQUIFER VERTICAL DIFFUSIVITY: HERON ISLAND, GREAT BARRIER REEF
Delton B. Chen
Senior Modeller, Aquaterra, Perth, Australia. Postal Address: Suite 4, 125 Melville Parade, Como, Western Australia 6151 Mobile: 0411131771 Tel: 08 9368 4044 Fax: 08 9368 4055 Email 1: [email protected] Email 2: [email protected] Abstract: Hydrogeological investigations at Heron Island (Chen & Krol, 1997; Chen, 2000) have encountered groundwater movement with tidal propagation patterns that differ markedly from patterns usually encountered in coastal aquifers. In the classic coastal situation the tidal signal propagates with exponentially smaller efficiency in relation to lateral distance from the shoreline (Ferris, 1951). The situation at Heron Island is very different, however, because the island is situated on a dual-aquifer: a hydrogeological model originally proposed for low atoll islands. The dual-aquifer at Heron Island involves a highly conductive lower-layer of Pleistocene-age limestone (Kh ˜ 3000; Kv ˜ 1000 m d-1) and a moderately conductive upper-layer of Holocene-age limestone and sediment infilling (Kv ˜ 3 to 80 m d-1). The lower layer rapidly transfers tidal forcing fro m the ocean to the Holocene-Pleistocene contact which underscores the whole island. Trends in tidal efficiency and lag in the upper layer are therefore related to vertical position and (a) tidal efficiency increases with depth, and (b) tidal lag decreases with depth.
Harmonic analysis of aquifer tidal propagation at Heron Island is undertaken in this study. The
harmonic efficiencies are analysed with Chen’s (2000) analytical formula for vertical tidal unconfined groundwater flow (VTUGF) to estimate the aquifer vertical diffusivity. This study is undertaken to publicise and validate the VTUGF formula by comparing the earlier estimates of Chen (2000) with the new estimates based on harmonic analysis. Chen (2000) based his original Heron Island diffusivity estimates on time -averaged tidal signals (an approximate approach) and on the actual tidal signals via an accurate numeric approach. Chen’s (2000) solutions for VTUGF not only provide a ‘tidal method’ for estimating aquifer vertical diffusivity, but the formula may also be used to benchmark computer-based groundwater models and determine permeability of soil cores in the laboratory. The current study introduces a non-dimensional Fourier number, NVTUGF, which simplifies the general relationship for VTUGF in non-deformable porous media. The theory predicts that a transition between ‘undrained’ and ‘fully drained’ flow occurs for NVTUGF between about 0.1 and 30.
Key Words: Tidal, groundwater, reef, island, Fourier, harmonic, diffusivity, conductivity, vertical.
Figure 1 Heron Island located at Heron Reef, the Great Barrier Reef, Australia.

INTRODUCTION Coral islands tend to attract inquisitive and adventurous people. Heron Island, a small coral cay
located in Australia’s Great Barrier Reef (GBR), receives plenty of attention being the site of a tourist resort and a scientific research station (Figures 1 and 2). Hydrogeological studies at Heron Island were undertaken in the 1980’s by Charlie et al. (1990) to improve understanding of the nutrient cycle, and in the 1990’s by Krol et al. (1992), Chen & Krol (1997) and Chen (2000) to provide the first reliable groundwater flow model for the island and to help evaluate prevailing wastewater disposal practices. The work by Chen and Krol (1997) and Chen (2000) constitutes the Heron Island Groundwater Project (HIGP) and this work was sponsored by The University of Queensland, P&O Resorts, and the Great Barrier Reef Marine Park Authority (GBRMPA). The Ph.D. dissertation of Chen (2000) is central to this paper and is referenced heavily.
Figure 2. Heron Island and location of the groundwater monitoring bores
(A. Jetty; B. harbour; C. shipwreck; D. helipad; E. beachrock; F. sewage treatment plant). Since the 1970’s a number of researchers have studied groundwater flow within low atoll
islands. One reason was to evaluate radionuclide transport at Bikini Atoll and Enetwetak Atoll where the US government had tested nuclear weapons between 1945 and 1958. This resulted in seminal work by Buddemeier and Holladay (1977) and work by Weatcraft and Buddemeier (1981), Herman, Buddemeier and Weatcraft (1986), Peterson (1991) and others. Some atoll island studies involved computer modelling to illustrate how tidal efficiencies increase with depth and how tidal lags decrease with depth unlike the classic coastal situation (e.g. Herman & Weatcraft, 1984; Underwood et al., 1992; Peterson & Gingerich, 1995). The tidal propagation patterns in these low atoll islands were explained in terms of a two-layered hydrostratigraphical model called a ‘dual-aquifer’ (Buddemeier and Holladay, 1977). The dual-aquifer allows very efficient tidal flow through an underlying unit of highly transmissive and highly porous reef-rock (Pleistocene in age). Situated above the lower unit is an upper unit of moderately permeable reef-rock (Holocene in age).
Chen (2000) found that the dual-aquifer conceptual model also applies to Heron Island. In his
study of Heron Island, Chen (2000) monitored tidal signals in the upper unconfined unit where the groundwater flow direction is predominately vertical. Chen (2000) coined the term vertical tidal unconfined groundwater flow (VTUGF) and derived an analytical expression for VTUGF assuming a single-frequency sinusoidal tide and watertable response. He also derived a general numeric scheme for VTUGF that addresses the complete tidal signal (implemented in a spreadsheet). These two solutions are presented in this paper. Chen (2000) used the solutions to estimate the vertical hydraulic diffusivity of the Heron Island aquifer from water levels electronically recorded in groundwater piezometers, however since Chen (2000) did not undertake a harmonic analysis of his field data, his
application of the analytic VTUGF solution was only approximate because it considered only time-averaged efficiencies. Consequently his analytic estimates of diffusivity are different to his numeric estimates with the later being more accurate theoretically.
In this paper the original data of Chen (2000) are analysed for spectral amplitude using a
discrete Fast Fourier Transform (FFT) and the resulting harmonic efficiencies are processed with the VTUGF analytic solution to provide new estimates of vertical diffusivity. These new diffusivity estimates are compared with Chen’s (2000) original estimates to validate the theory and to publicise the methods. The utility of the various methods and the results are discussed to assist future studies of coral reef islands.
By definition VTUGF involves vertical unconfined groundwater movement in response to tidal forcing at depth – a situation that is unusual in nature and only observed in some low reef and atoll islands. In most coastal aquifers (confined or unconfined) it is common to find that tidal signals propagate laterally in a manner consistent with Ferris’s (1951) analytical expression for tidal flow. Ferris’s (1951) classic formula predicts that tidal efficiency reduces exponentially with lateral distance assuming that flow is horizontal and the aquifer is semi-infinite and homogeneous. Ferris’s (1951) formula is often applied in field-scale studies (e.g., Millham & Howes, 1995; Smith, 1999; Merritt, 2004) but the formula is inappropriate for Heron Island where the assumption of horizontal flow is untenable. A lesser-known formula was developed by Carslaw and Jaeger (1959) to model heat conduction in solids. This formula can also be used to model the downward propagation of sinusoidal head signals in an elastic aquifer as might be produced by head forcing at the water table (e.g. Keller et al., 1989). The Carslaw and Jaeger (1959) formula is relevant when signal propagation is directed downwards and is affected by aquifer specific storage. However Chen’s (2000) analytical expressions for VTUGF (presented below) are relevant when signal propagation is directed upwards and is affected by aquifer specific yield. Hence these three equations address fundamentally different tidal situations and were derived independently of eachother. HYDROGEOLOGY
Regional Setting: The Great Barrier Reef
A coral reef is a rigid limestone framework that is created in situ by hermatypic (reef-building)
organisms, the most common of which are the scleractinian corals and the carboniferous algae. The coral framework is mostly dimorphous calcium carbonate (CaCO3) which exists either as calcite (rhombohedral crystals) or aragonite (orthorhombic crystals). Aragonite may be the original form in which most of the CaCO3 is deposited, especially in shallow waters, but this converts with time to the more stable calcite (Whitten and Brooks, 1987). Various proportions of the Ca2+ cations in the reef are replaced by magnesium or iron, giving rise to dolomite (CaMg(C03)2), magnesite (MgCO3), and siderite (FeCO3).
Coral reefs of the Great Barrier Reef (GBR) number approximately 2900 not including fringing
reefs (Hopley, 1982). These are mostly discrete carbonate slabs less than 250 m thick and less than 500 000 years of age: relatively young in geologic time scales (Davies, 1992). Basement geomorphology and climate are major controls on coral reef distribution in the GBR with most of the reefs having formed on the outer one-third of the continental shelf in warm, shallow, oligotrophic seawater (Hopley, 1982; Hopley, 1997). The geology of the GBR is further complicated by subsidence and warping of the continental shelf (Hopley, 1997). Eustatic changes in sea level during the Quaternary period are responsible for many of the heterogeneities within the geologic record. It is believed that transgressions (i.e. rising sea levels) have resulted in reef build -up, whilst regressions (i.e. falling sea levels) have resulted in reef emergence and subaerial erosion. Hence emergence and regression are major factors influencing the geomorphology of the GBR.
Most reef islands in the GBR, including Heron Island (Figure 1), are less than 5000 years old
corresponding to a stabilisation in sea level circa 6500 years ago and sedimentary processes since then (Hopley, 1997). The sediment itself is mostly biogenetic CaCO3 such as coralline debris, shells, skeletal remains, and the tests of Foraminifera and Halimeda. For a detailed account of the geology of the GBR the reader may wish to consult Hopley (1982; 1997).

Heron Reef and Heron Island Heron Island (0.2 km2) is a vegetated coral cay situated on Heron Reef (26 km2) in the Coral
Sea. At latitude 23º26’S and longitude 15º57’E, it is near the Tropic of Capricorn and about 75 km east of the Australian mainland (Figure 1). Heron Reef is a part of the Capricorn-Bunker Group of reefs located on the Queensland shelf in an area of the shelf called the Bunker High. This part of the shelf is relatively narrow, about 60 km wide, and 20 to 40 m below sea level.
Heron Reef has six major physiographic zones (Figure 1): (1) reef slope, (2) reef flat, (3) reef
rim, (4) Shallow Lagoon and (5) Blue Lagoon in the centre, and on the leeward side of the reef is (6) Heron Island. The reef rim is the top edge of the reef platform where coral grows to elevations somewhat higher than the reef flat, effectively creating a natural weir that helps to trap seawater on the coral reef during low tide.
Heron Island, population ~300, is an oval-shaped coral cay with a length of only 850 m (Figure
2). The cay supports a lush stand of Pisonia trees (Pisonia grandis) and provides an important breeding habitat for sea turtles and seabirds including shearwaters (Puffinus pacificus) and white-capped noddies (Anous minutus). The maximum elevation of the island is only 7 to 8 m MSL and there are three distinct soil layers (see Figure 3): (Layer 1) a 1-m-thick surface layer of silty-sand rich with detritus and plant roots, (Layer 2) a middle layer of gravely-sand, and (Layer 3) a lower layer of sandy-gravel. From detailed field studies, Chen (2000) found that the unsaturated zone, although only 3 to 4 m deep, inhibited groundwater recharge because the unsaturated hydraulic conductivity of the gravely-sand was very low when moisture levels were below a ‘critical’ value of 0.10 to 0.20 ml ml-1. The gravely-sand layer was therefore an impediment to deep percolation and promoted evapotranspiration. However rainfall of =100 mm per week was estimated to be enough to cause wetting of the soil profile down to the watertable (Chen, 2000).
Figure 3. Unconfined reef-rock aquifer and soil layering at Heron Island.
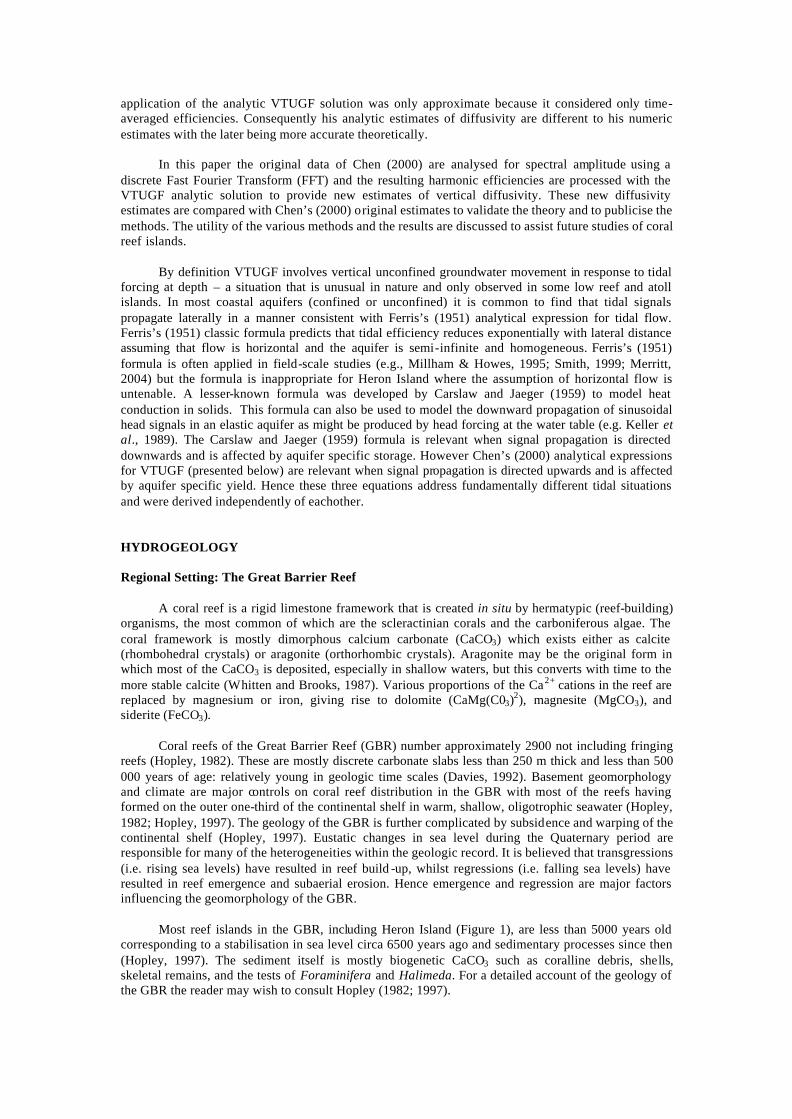
Dual-Aquifer Conceptual Flow Model The tidal groundwater flow at Heron Island was investigated by Charlie et al. (1990), Krol et al.
(1992), Chen & Krol (1997) and Chen (2000). As mentioned in the introduction, the dual-aquifer is comprised of two major zones in the reef rock platform: a highly-conductive lower-layer of Pleistocene-age limestone and an upper layer, 15 to 20 m thick, of modern limestone and sediment infilling (Jell and Flood, 1977). The coral cay, Heron Island, is a third aquifer zone comprised mainly of sand and gravel sized sediment. Deep drilling at Heron Island in 1937 (Richards, 1938; Richards and Hill, 1942) revealed a geologic sequence consisting of calcareous sands, in situ reef rock, foraminiferal and quartz sands, and lime muds. Maxwell (1962) generalised this geologic sequence as follows (Figure 4): (1) shallow reef rock (0-30 mbgl), (2) intermediate reef rock (30-150 mbgl), and (3) subreef sands (150-223 mbgl). The base of the dual-aquifer is the relatively impermeable sand at about 150 mbgl.
The coral cay aquifer is unconfined except for where strips of beachrock occur along the current shoreline and along older shorelines. It was interpreted by Chen (2000) that the reef flat near Heron Island is also confined (capped) by ‘reef plate’. Although reef plate is only mentioned in a small number of hydrogeological studies (e.g., Lam, 1974; Hunt & Peterson, 1980; Ayers and Vacher, 1986), reef plate is an important feature of a reef because it perches seawater on the reef flat at low tide. If a capping did not exist, then seawater would drain through the reef with the result possibly being extensive coral mortality.
Less is known about the hydrogeology of Heron Reef further away from Heron Island. The
hydrogeology of Blue Lagoon and Shallow Lagoon have not been studied and the dual-aquifer conceptual model, although applicable to Heron Island, is not detailed enough to describe groundwater flow within the whole reef. Most of Heron Reef is submerged and factors such as tides, waves, and reef bathymetry might induce flow through the reef structure. However the groundwater flow pattern far from Heron Island is difficult to speculate.
Figure 4. The dual-aquifer conceptual hydrogeological model for Heron Island and Reef
(refer A-A of Figure 1). The main tidal signal emanates from the lower unit of the dual-aquifer which underlies the
whole island (Figures 4 & 5). By simulating observed piezometric levels, Chen (2000) demonstrated with a numerical model that the lower-layer near Heron Island has a Kh ˜ 3000 m d-1 and Kv ˜ 1000 m d-1. He also found, using the tidal methods presented, that the upper-layer has a Kv of about 3 to 80 m d-1. The high K of the Pleistocene-age platform is the result of substantial sub-aerial weathering and diagenesis during emergence, whereas the moderate K of the Holocene-age layer is attributed to its original structure and sedimentation. Thus the Holocene-to-Pleistocene contact is a solution unconformity delineated by contrasts in porosity, aragonite/calcite composition, and bulk permeability (Hopley, 1982 & 1997). Estimates of the hydraulic conductivity, K, of the lower unit for atoll islands are as high as 1000 to 6000 m d-1 (Herman, Buddemeir & Weatcraft, 1986). Such high values of K are an indication of karst structure. A characteristic of the dual-aquifer is a propensity for tidal flows to propagate from the ocean floor through the lower layer and then vertically into the upper layer where it is unconfined (e.g., Herman and Weatcraft, 1984; Oberdorfer et al., 1990; Underwood, 1990; Underwood et al. 1992; Peterson and Gingerich, 1995).
Hydrology Heron Island has a subtropical maritime climate of hot wet summers and warm moderately-dry
winters. Rainfall averages at 1.07 m yr-1 (1957-1975) but there is also considerable annual variability due to irregular cyclones, storms and dry spells. By monitoring an area of forest soil for through-fall (rainfall less forest interception), soil moisture and soil potentials, Chen (2000) was able to develop and calibrate a one-dimensional soil-water transport and evapotranspiration model (called STEM). A ten year historical simulation with STEM indicated that the average annual recharge rate was about 0.23 m yr-1 approx. (20% of rainfall). His modelling also suggested that annual recharge is highly variable with essentially no recharge occurring during years of low rainfall. Evapotranspiration removed about 80% of rainfall on an annual basis. Observation Bores
In 1991 thirteen groundwater investigation wells were installed at Heron Island in two irregular
transects to give broad coverage (Figure 2). Each well was installed with either 2, 3, or 4 PVC piezometers, and the screened sections of the piezometers were packed with river sand and vertically isolated with bentonite clay. The maximum depth of drilling was 16.7 m below ground level (at well #6) and deeper drilling was prevented at all locations by excessive loss of drilling mud (presumably through reef rock cavities). Consequently the piezometers were only installed in the Holocene-age layer of the dual-aquifer and no potentiometric data were obtained for the deeper and highly transmissive Pleistocene-age layer. In 1994, Chen (2000) used pressure transducers and data loggers to record piezometric water levels at each well, at regular 10 minute intervals, for a duration of about one month.
Groundwater Quality
The groundwater is non-potable, brackish-to-brine, and salinity is similar to seawater near the
shoreline. The high salinities are a result of relatively low rainfall recharge (˜230 mm yr-1), the island’s small size, tidal mixing, and seawater intrusion through the beach. Anthropogenic water, including treated sewage discharge and pipe leakage, also created low salinity pockets. Charlie et al. (1990) and Chen & Krol (1997) found that stores of nitrate in the soil (0.25 to 9.8 mg g-1 as N) and in the groundwater were environmentally significant, and dissolved inorganic nitrogen (DIN) was 28 mg L-1 (as N) for locations greater than 60 m from the shoreline. The high nitrate concentrations are the result of rainwater leaching of nitrate in bird guano. Phosphorus was also present in high concentrations in the soil, but most of the guano derived phosphorus was immobilised within the soil profile and did not reach the groundwater. Average dissolved inorganic phosphorus (DIP) of groundwater was 0.098 mg L-1 (as P) for locations more than 60 m from the shoreline.
Groundwater Flow
The conceptual and computer models of Chen (2000) illustrate how tidal groundwater flow at
Heron Reef may be driven by the ocean tide acting on the seafloor and reef edge (Figures 4 & 5). The aquifer below Heron Island is not capped by reef plate, unlike most of the reef around the cay, and so groundwater can flow vertically through the lower layer and into the upper layer as shown in Figure 5. This is the main pathway for tidal signal propagation through the shallow aquifer at Heron Island and, as a consequence, the tidal signal is very strong (approaching 90-100% efficient) at the Holocene-to-Pleistocene contact at about 15 m below ground. The piezometric data for nearly all of the groundwater wells (except at well #6 on the beach) indicated that the shallow groundwater movement is predominantly VTUGF. Figure 6 shows a classic example of VTUGF time-series heads from nested piezometers (well #8). In the dual-aquifer conceptual model there are also large regions of aquifer where non-vertical groundwater flow occurs (refer Figure 5) however such regions were not drilled or monitored given the budgetary constraints of the HIGP.

Figure 5. Computer simulation of tidal groundwater movement at Heron Island and Reef: flow vectors at high tide (reproduced from Chen, 2000).
-1.5
-1
-0.5
0
0.5
1
1.5
86 87 88 89 90 91
Time (days 1994)
Wat
er L
evel
(m
MS
L)
Peizo 1 (depth = -9.22 m MSL)Peizo 3 (watertable)
Peizo 2 (depth = -5.75 m MSL)
Figure 6. Hydrographs from nested piezometers at Well #8 showing VTUGF in the middle of Heron
Island. Water levels presented are actual field data recorded at 10 minute intervals (m MSL).

-1.5
-1
-0.5
0
0.5
1
1.5
86 87 88 89 90 91
Time (days 1994)
Wat
er L
evel
(m
MS
L)
Peizo 1 (depth = -13.09 m MSL)
Peizo 4 (watertable)
Peizo 2 (depth = -9.14 m MSL)
Figure 7. Hydrographs from nested piezometers at Well #6 showing mixed-signals in the beach at
Heron Island. Water levels presented are actual field data recorded at 10 minute intervals (m MSL).
Field data from well #6 (Figure 7) revealed that a second tidal signal propagates through the
island’s beach and interacts with the main tidal signal which emanates from the Holocene-Pleistocene contact. At well #6 the groundwater is multi-directional and more complex than classic VTUGF because of the super-positioning of two signals. The second signal is forced by the tide on the reef flat and is a product of seepage-face hydraulics as indicated by as ymmetry in the water level hydrographs and higher average heads in shallower piezometers (Figure 7). Chen (2000) estimated that the tidal forcing across the beach results in roughly 2400 m3 d-1 of net seawater intrusion into the aquifer from the reef flat. This finding has significant implications for assessing groundwater flow and nutrient fluxing at Heron Island as the potential for groundwater discharge to the reef flat via the beach is much less than previously expected. TIDAL METHODS
The tidal methods of Chen (2000) are based on his analytic and numeric VTUGF solutions
(reproduced below). These methods can be used to estimate the vertical diffusivity, Dv, of an aquifer as long as the following conditions are reasonable:
I. Fluid flow obeys Darcy’s law.
II. The groundwater movement is vertical and unconfined. III. The fluid, solid grains and pore spaces are effectively incompressible. IV. The capillary zone has negligible effect on water-table movement. V. Fluid density gradients have negligible effect on flow.
VI. Tidal p ressure forcing occurs at depth. VII. Barometric pressure variations are insignificant or can be filtered from the water level data.
VIII. Inertial effects on groundwater are negligible. IX. Groundwater recharge is negligible or its effects can be filtered from the water level data by
de-trending the data.
Vertical diffusivity is the vertical hydraulic conductivity, K, divided by the specific yield, Sy, of the aquifer. Thus if Dv and Sy are known, then K is also known. The earlier work of Chen (2000) and in this study, Dv, is presented in terms of K and an assumed value of 0.30 for Sy. This Sy value is based on Enjebi Island (Oberdorfer, Hogan & Buddemeier, 1990) and Sy of the Heron Island aquifer was not measured in the field.

Tidal Efficiency
Tidal efficiency is a normalised measure of tidal signal strength and is defined as the amplitude
of head fluctuations in the aquifer divided by the amplitude of head fluctuations at a tidal boundary. Important in this study are the two versions of tidal efficiency: (1) the tidal efficiency of the watertable relative to a point in the aquifer, denoted by ?, and (2) the tidal efficiency of groundwater relative to the ocean tide, denoted by ?’. Tidal efficiencies can be calculated from the recorded tide or from the spectral components of the recorded tide.
Analytic Method
Chen’s (2000) conceptual model for VTUGF involves a vertical column of porous medium with
a single-frequency sinusoidal pressure imposed at the base of the column. The forcing head (gravity plus pressure terms) has amplitude A and angular frequency ? and occurs at elevation –L. For convenience the vertical datum (z=0) is coincident with the location of the watertable when there is no tidal forcing. The vertical datum is therefore analogous to mean sea level (MSL) in an island situation (neglecting the effects of recharge and fluid-density gradients). The equation for the total forcing head is:
( ) ( )tAtLH ωsin, =− (Equation 1)
where , A = amplitude of tidal signal at position z=-L as head (m) L = vertical distance to the forcing head (m) t = time (s) ? = tidal frequency (rad s -1)
The detail of how the tidal signal arrives at the base of the column is not important in the theory for VTUGF. For example, the signal could be created in a controlled laboratory experiment, or it might result from flow in a dual-aquifer. In the case of a dual-aquifer the forcing signal H(-L,t) may not be identical to the ocean tide as there is usually some attenuation and lag of the tidal signal inside the aquifer at all locations.
The forcing head, H(-L,t), drives transient flow through the column and subsequent watertable
fluctuations. A key measure of the flow response is the efficiency and lag of the watertable relative to the forcing head. If the watertable response is also a sinusoid (a simplifying assumption of the analytic solution) then the following expression can be used to define the water table with time, d(t), relative to the forcing head at z=-L:
( ) ( )γωηδ −= tAt sin (Equation 2)
where , ? = tidal efficiency of the watertable relative to the head at z=-L (m/m) ? = tidal lag of the watertable relative to the head at z=-L (rad)
A difference between the above two equations is that Equation 2 represents the motion of a
particle at the watertable (a moving point), whereas Equation 1 represents the head at z=-L (a fixed point). The total head at the watertable is equivalent to the watertable elevation because the watertable is always at atmospheric pressure.
During each cycle of VTUGF, the groundwater flow direction reverses from upward-flowing to
downward-flowing (at the high of the watertable) and from downward-flowing to upward-flowing (at the low of the watertable). At these two points in the tidal cycle, the vertical fluid speed is instantaneously zero and the column of water is instantaneously hydrostatic. Thus, when hydrographs from nested piezometers located in VTUGF are plotted together (e.g. see the hydrographs for Well #8 in Figure 6) the hydrographs crossover at the high and low of the watertable. Chen (2000) applied
trigonometry to the hydrostatic singularities to derive the following relationship between efficiency and lag at the watertable relative to the tidal signal at z=-L:
( )ηω
γ 1cos1 −= (Equation 3)
The inexact analytic solution to the watertable lag was also derived by Chen (2000) from
Darcy’s law and the continuity principle:
= −
K
LS yω
ωγ 1tan
1 (Equation 4)
where , K = average vertical hydraulic conductivity (m s -1) Sy = specific yield at the watertable (m3 m-3) The equation for the watertable effic iency is obtained by combining Equations 3 and 4, i.e.:
−=
KyLS ω
η 1tancos (Equation 5)
The complete inexact solution for the watertable motion is therefore (Chen, 2000):
( )
−
= −−
K
LSt
K
LSAt yy ω
ωω
ωδ 11 tan
1sintancos (Equation 6)
The above formula is not the exact solution to the VTUGF problem because there are temporal
changes in the aquifer effective depth that produce asymmetry and mathematical non-linearity. However Chen (2000) compared the results of the above equations with numerical results to show that the equations are very accurate for most practical applications (Chen, 2000). The reader may also validate the equations using a simulation code, like MODFLOW (Harbaugh & McDonald, 1996), for example.
The vertical diffusivity is provided by re-arranging Equation 5 as follows:
( )( )ηω
1costan −=L
SK
y
(Equation 7)
Equation 7 allows the estimation of vertical diffusivity, K/Sy, based on measured watertable efficiencies, ?. Note that ? is the ratio of head amplitudes at the water table to head amplitudes in groundwater at position L below the mean water table. In field studies L is the depth to the screened section of a piezometer and in laboratory studies L is the depth to the base of a soil column. The efficiency can be approximated from the high and low water levels of each tidal half-cycle, otherwise the efficiencies of the lunar and solar harmonic components may be calculated from suitable time-series data using Fourier analysis (as discussed in the section on Fourier analysis). Equation 4 also allows the estimation of K/Sy, based on a measured watertable lag, ?, however the accurate measurement of tidal lags may require electronic monitoring equipment.
Layered Aquifers
By monitoring the watertable and groundwater heads in at least two locations at depth (i.e. in
nested piezometers), it is possible to estimate vertical K in more than one vertical region or layer. For the case of N regions, the average vertical hydraulic conductivity is the harmonic mean of the N hydraulic conductivity values, as follows:
∑
∑
=
=
= N
i i
i
N
ii
KL
LK
1
1 (Equation 8)
where each region thickness Li has an associated vertical hydraulic conductivity Ki. The total aquifer thickness is the sum of the N thicknesses:
∑=
=N
iiLL
1
(Equation 9)
The harmonic mean K, when combined with Equation 6, yields a solution to VTUGF in layered
aquifers (Chen, 2000). In field applications, the layers can be defined by the locations of the screened intervals of the piezometers rather than by known stratigraphy. If there are contrasting material properties, especially in or near the inter-tidal zone, then flow non-linearity and errors may become significant. It is therefore recommended that the above formulae be checked against accurate numeric solutions whenever shallow contrasting layers are involved.
Dimensional Analysis
A dimensionless Fourier Number for VTUGF in non-deformable porous media (NVTUGF) is
presented (adapted from Chen, 2000):
ωπLSK
Ny
VTUGF
2= (Equation 10)
where ? is the angular frequency of the forcing with dimensions of radians per time. By replacing 2p/? with the time period, ?, an alternative equation for NVTUGF is provided:
LSKT
Ny
VTUGF = (Equation 11)
When NVTUGF is substituted into the inexact analytic solution, the following relationship is obtained (Chen, 2000):
= −
VTUGFNπ
η2
tancos 1 (Equation 12)
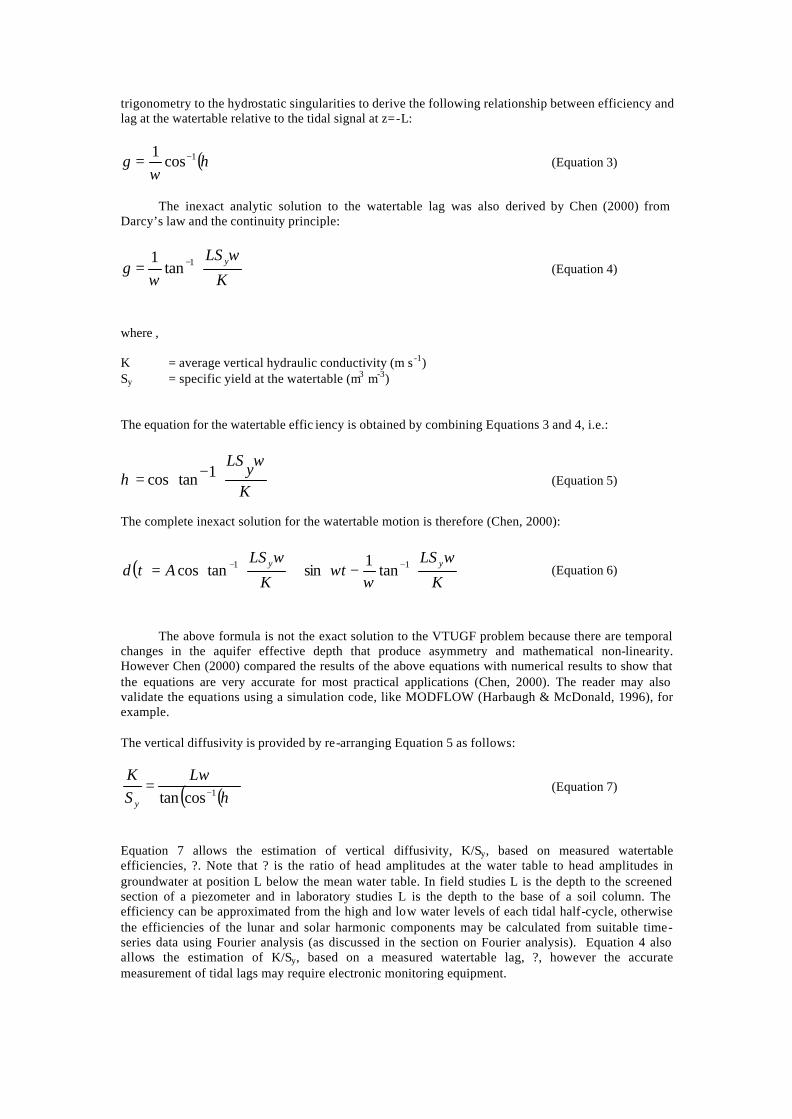
The above formula can be re-arranged, using the principles of trigonometry, to provide the following equivalent formula:
22
1
1
+
=
VTUGFNπ
η (Equation 13)
Equation 10 or 11 and Equation 12 or 13 are the general analytical solution for water table
efficiency in VTUGF systems when sinusoidal pressure-forcing occurs at depth and when elastic storage is negligible. Equation 12 is plotted in Figure 8 to show that the watertable efficiency can range anywhere between 0% (when NVTUGF is small) and 100% (when NVTUGF is large). The formulae therefore show that the responsiveness of groundwater to tidal forcing is greater when the periodicity of the tidal forcing is greater (and the tidal frequency smaller). The formulae also show that the responsiveness of groundwater to tidal forcing is greater in an aquifer with higher hydraulic diffusivity and/or lesser thickness. The VTUGF response can therefore range between a ‘undrained’ response and a ‘fully drained’ response depending on the aquifer properties and the forcing frequency. The transition between undrained and fully drained is defined by NVTUGF between about 0.1 and 30 (Figure 8).
00.10.20.30.40.50.60.70.80.9
1
0.001 0.01 0.1 1 10 100 1000
Non Dimensional Fourier Number
Eff
icie
ncy
at t
he
Wat
erta
ble
UNDRAINED RESPONSE
(CONFINED)
FULLY DRAINED RESPONSE
(UNCONFINED)
PARTIALLY DRAINED RESPONSE
(SEMI-CONFINED)
NVTUGF
Figure 8. A theoretical relationship between watertable efficiency and Fourier number for vertical tidal
unconfined groundwater flow. Numeric Method
Chen (2000) developed a numeric solution to VTUGF for implementation in a spreadsheet. The
solution uses finite-differences in time to calculate the fluid speed and watertable displacement at future times, as follows:
{ }( )0:
)(sin)(
)( →∆
+∆+−
−=∆+ ttL
ttAtKttv
δωδ
(Equation 14)
0:)(
)()( →∆∆∆+
+=∆+ tSy
tttvttt δδ
(Equation 15) where, A = amplitude of tidal signal at position z=-L as head (m) Kv = vertical hydraulic conductivity (m s -1) L = vertical distance to the forcing head (m) Sy = specific yield (m3 m-3) t = time (s) ? t = time step size (s) v = Darcian fluid velocity (m s -1) d = watertable elevation (m) ? = tidal frequency (rad s -1) Given that the piezometric water levels recorded in the field are unlikely to be pure sinusoids, the above VTUGF solution is modified to handle the field heads, i.e.:
.;,....3,2,1
0:),(
1
11
tjtNj
ttL
tLHSy
K
j
jjjj
∆==
→∆∆
+−−−
+=−
−− δ
δδδ
(Equation 16) where, H(-L,t) = is the field record of head at position z=-L and at time t (m) j = time step number (-)
When the above numeric formula is applied in the estimation of K/Sy, the time step size, ?t, needs to be reduced until numeric errors are insignificant. This may require interpolating the field data or, alternatively, recording water levels at sufficiently small time intervals. Many groundwater flow simulation packages could be used instead of Equation 16, however since Equation 16 can be implemented in a spreadsheet, it is relatively inexpensive. It can also handle any forcing pattern, including pure sinusoids, harmonic tides, or falling heads etc. A tidal method based on Equation 16 will require a calibration method (e.g. trial-and-error) to estimate the vertical diffusivity from available time-series data.
FOURIER ANALYSIS
The term Fourier analysis refers to any analysis method that compares a time series with
sinusoids. Harmonic analysis is a type of Fourier analysis which fits uniformly sampled time series data to a set of harmonic frequencies. The harmonic frequencies are integer multiples of one another and are limited to the range of zero to the Nyquist frequency (vN) where the Nyquist frequency is half the sampling frequency.
The discrete Fast Fourier Transform (FFT) is an algorithm that enables regularly sampled time
series data to be fitted by a set of harmonic frequencies. For the case of n data values, the FFT fits n/2 frequencies over the frequency range 2vN /n to vN. The FFT of the time series is a set of n/2 complex numbers, called Fourier coefficients, where the moduli are equal to the amplitudes of the fitted frequencies and the arguments are equal to the phases.
In this study the discrete FFT is undertaken using the Fourier data analysis tool provided with
Microsoft Office Excel 2003. This tool can analyse a maximum of 212 data that have been recorded at equal time intervals. The results of the discrete FFT, the complex Fourier coefficients, were converted to amplitudes using the IMABS function of Excel. These amplitudes were corrected, by dividing by n/2, before plotting as frequency spectra.
TIDE AND WATER LEVEL DATA
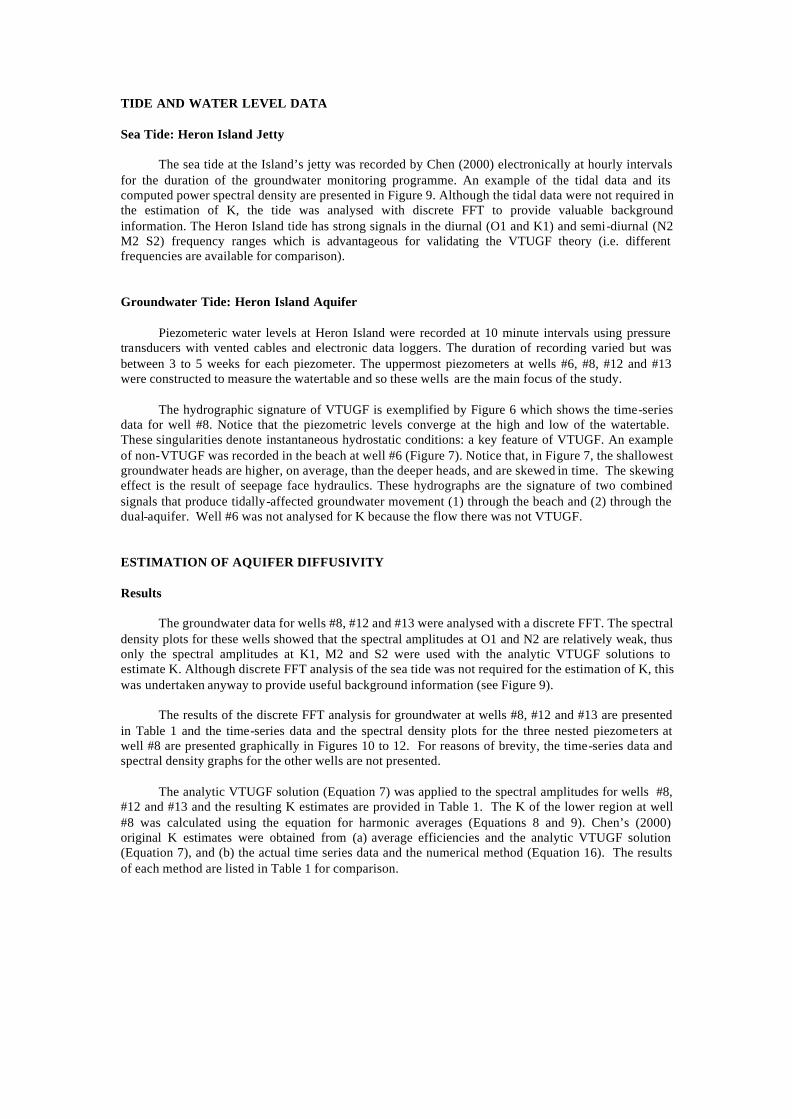
Sea Tide: Heron Island Jetty The sea tide at the Island’s jetty was recorded by Chen (2000) electronically at hourly intervals
for the duration of the groundwater monitoring programme. An example of the tidal data and its computed power spectral density are presented in Figure 9. Although the tidal data were not required in the estimation of K, the tide was analysed with discrete FFT to provide valuable background information. The Heron Island tide has strong signals in the diurnal (O1 and K1) and semi-diurnal (N2 M2 S2) frequency ranges which is advantageous for validating the VTUGF theory (i.e. different frequencies are available for comparison).
Groundwater Tide: Heron Island Aquifer
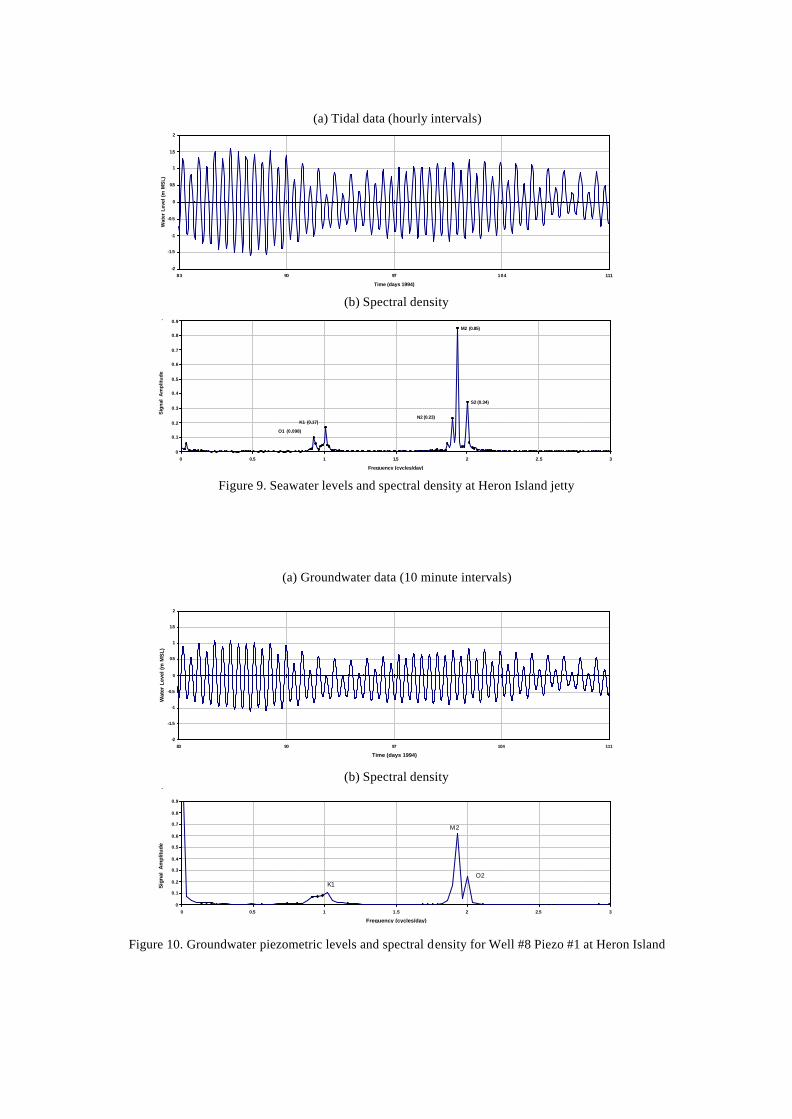
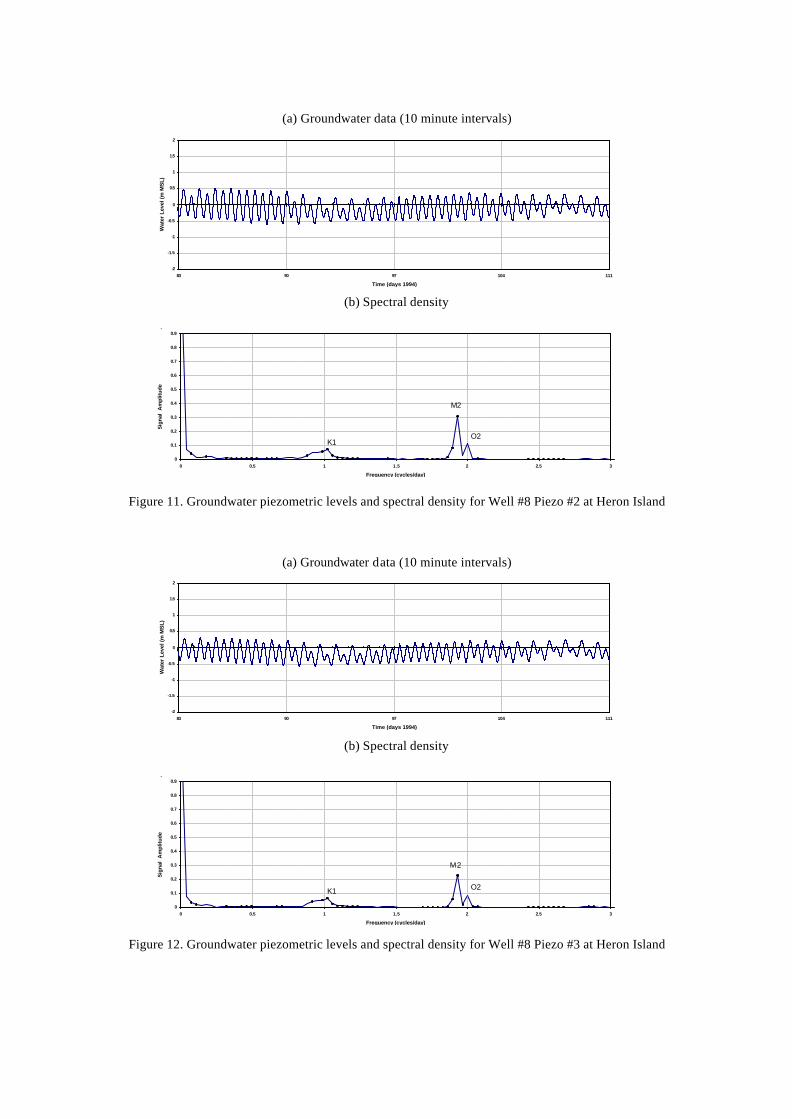
Piezometeric water levels at Heron Island were recorded at 10 minute intervals using pressure
transducers with vented cables and electronic data loggers. The duration of recording varied but was between 3 to 5 weeks for each piezometer. The uppermost piezometers at wells #6, #8, #12 and #13 were constructed to measure the watertable and so these wells are the main focus of the study.
The hydrographic signature of VTUGF is exemplified by Figure 6 which shows the time-series
data for well #8. Notice that the piezometric levels converge at the high and low of the watertable. These singularities denote instantaneous hydrostatic conditions: a key feature of VTUGF. An example of non-VTUGF was recorded in the beach at well #6 (Figure 7). Notice that, in Figure 7, the shallowest groundwater heads are higher, on average, than the deeper heads, and are skewed in time. The skewing effect is the result of seepage face hydraulics. These hydrographs are the signature of two combined signals that produce tidally-affected groundwater movement (1) through the beach and (2) through the dual-aquifer. Well #6 was not analysed for K because the flow there was not VTUGF. ESTIMATION OF AQUIFER DIFFUSIVITY
Results
The groundwater data for wells #8, #12 and #13 were analysed with a discrete FFT. The spectral
density plots for these wells showed that the spectral amplitudes at O1 and N2 are relatively weak, thus only the spectral amplitudes at K1, M2 and S2 were used with the analytic VTUGF solutions to estimate K. Although discrete FFT analysis of the sea tide was not required for the estimation of K, this was undertaken anyway to provide useful background information (see Figure 9).
The results of the discrete FFT analysis for groundwater at wells #8, #12 and #13 are presented
in Table 1 and the time-series data and the spectral density plots for the three nested piezometers at well #8 are presented graphically in Figures 10 to 12. For reasons of brevity, the time-series data and spectral density graphs for the other wells are not presented.
The analytic VTUGF solution (Equation 7) was applied to the spectral amplitudes for wells #8,
#12 and #13 and the resulting K estimates are provided in Table 1. The K of the lower region at well #8 was calculated using the equation for harmonic averages (Equations 8 and 9). Chen’s (2000) original K estimates were obtained from (a) average efficiencies and the analytic VTUGF solution (Equation 7), and (b) the actual time series data and the numerical method (Equation 16). The results of each method are listed in Table 1 for comparison.
K1 (0.17)
O1 (0.098)
S2 (0.34)
M2 (0.85)
N2 (0.23)
0
0.1
0.2
0.3
0.4
0.5
0.6
0.7
0.8
0.9
0 0.5 1 1.5 2 2.5 3
Frequency (cycles/day)
Sig
nal
Am
plit
ud
e
.
-2
-1.5
-1
-0.5
0
0.5
1
1.5
2
83 90 97 104 111
Time (days 1994)
Wat
er L
evel
(m
MS
L)
-2
-1.5
-1
-0.5
0
0.5
1
1.5
2
83 90 97 104 111
Time (days 1994)
Wat
er L
evel
(m
MS
L)
0
0.1
0.2
0.3
0.4
0.5
0.6
0.7
0.8
0.9
0 0.5 1 1.5 2 2.5 3
Frequency (cycles/day)
Sig
nal
Am
plitu
de
.
M2
O2K1
(a) Tidal data (hourly intervals)
(b) Spectral density
Figure 9. Seawater levels and spectral density at Heron Island jetty
(a) Groundwater data (10 minute intervals)
(b) Spectral density
Figure 10. Groundwater piezometric levels and spectral density for Well #8 Piezo #1 at Heron Island
-2
-1.5
-1
-0.5
0
0.5
1
1.5
2
83 90 97 104 111
Time (days 1994)
Wat
er L
evel
(m
MS
L)
0
0.1
0.2
0.3
0.4
0.5
0.6
0.7
0.8
0.9
0 0.5 1 1.5 2 2.5 3
Frequency (cycles/day)
Sig
nal
Am
plit
ud
e
.
M2
O2K1
-2
-1.5
-1
-0.5
0
0.5
1
1.5
2
83 90 97 104 111
Time (days 1994)
Wat
er L
evel
(m
MS
L)
0
0.1
0.2
0.3
0.4
0.5
0.6
0.7
0.8
0.9
0 0.5 1 1.5 2 2.5 3
Frequency (cycles/day)
Sig
nal
Am
plit
ud
e
.
M2
O2K1
(a) Groundwater data (10 minute intervals)
(b) Spectral density
Figure 11. Groundwater piezometric levels and spectral density for Well #8 Piezo #2 at Heron Island
(a) Groundwater data (10 minute intervals)
(b) Spectral density
Figure 12. Groundwater piezometric levels and spectral density for Well #8 Piezo #3 at Heron Island
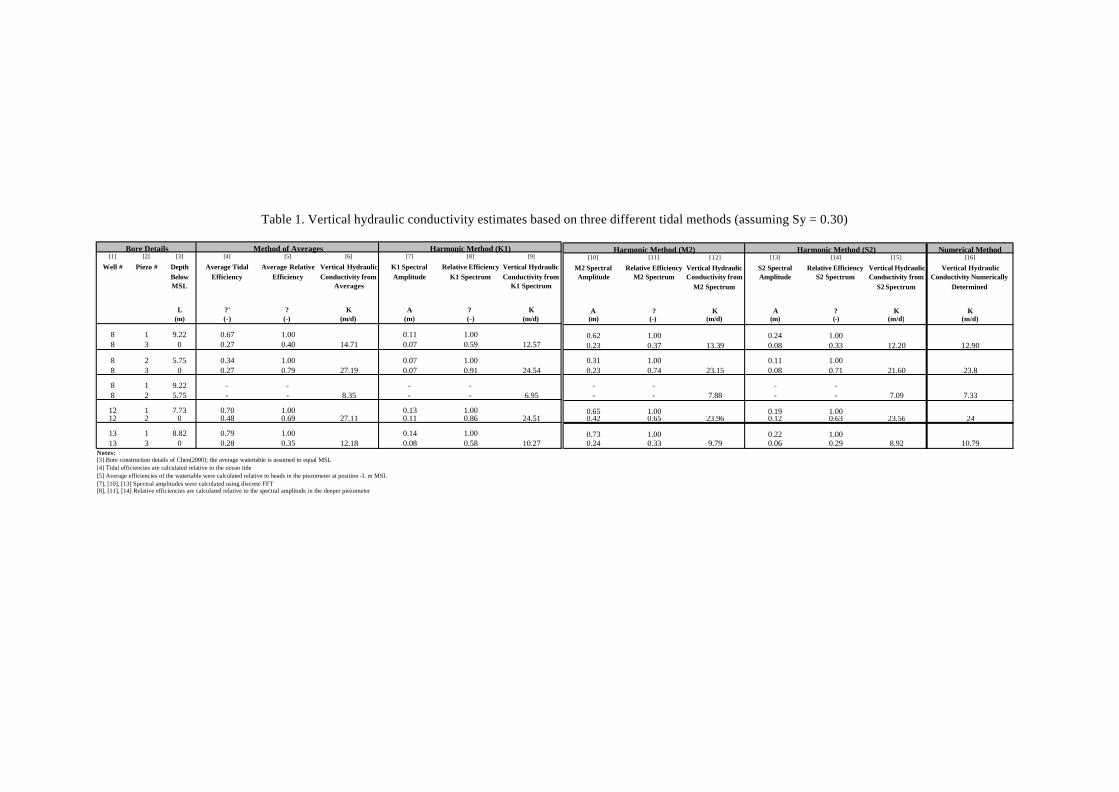
Table 1. Vertical hydraulic conductivity estimates based on three different tidal methods (assuming Sy = 0.30)
Bore Details Method of Averages Harmonic Method (K1)
[1] [2] [3] [4] [5] [6] [7] [8] [9]
Well # Piezo # Depth Below MSL
Average Tidal Efficiency
Average Relative Efficiency
Vertical Hydraulic Conductivity from
Averages
K1 Spectral Amplitude
Relative Efficiency K1 Spectrum
Vertical Hydraulic Conductivity from
K1 Spectrum
L ?' ? K A ? K(m) (-) (-) (m/d) (m) (-) (m/d)
8 1 9.22 0.67 1.00 0.11 1.008 3 0 0.27 0.40 14.71 0.07 0.59 12.57
8 2 5.75 0.34 1.00 0.07 1.008 3 0 0.27 0.79 27.19 0.07 0.91 24.54
8 1 9.22 - - - -8 2 5.75 - - 8.35 - - 6.95
12 1 7.73 0.70 1.00 0.13 1.0012 2 0 0.48 0.69 27.11 0.11 0.86 24.51
13 1 8.82 0.79 1.00 0.14 1.0013 3 0 0.28 0.35 12.18 0.08 0.58 10.27
Notes:[3] Bore construction details of Chen(2000); the average watertable is assumed to equal MSL[4] Tidal efficiencies are calculated relative to the ocean tide[5] Average efficiencies of the watertable were calculated relative to heads in the piezometer at position -L m MSL[7], [10], [13] Spectral amplitudes were calculated using discrete FFT[8], [11], [14] Relative efficiencies are calculated relative to the spectral amplitude in the deeper piezometer
Harmonic Method (M2) Harmonic Method (S2) Numerical Method[10] [11] [12] [13] [14] [15] [16]
M2 Spectral Amplitude
Relative Efficiency M2 Spectrum
Vertical Hydraulic Conductivity from
M2 Spectrum
S2 Spectral Amplitude
Relative Efficiency S2 Spectrum
Vertical Hydraulic Conductivity from
S2 Spectrum
Vertical Hydraulic Conductivity Numerically
Determined
A ? K A ? K K(m) (-) (m/d) (m) (-) (m/d) (m/d)
0.62 1.00 0.24 1.000.23 0.37 13.39 0.08 0.33 12.20 12.90
0.31 1.00 0.11 1.000.23 0.74 23.15 0.08 0.71 21.60 23.8
- - - -- - 7.88 - - 7.09 7.33
0.65 1.00 0.19 1.000.42 0.65 23.96 0.12 0.63 23.56 24
0.73 1.00 0.22 1.000.24 0.33 9.79 0.06 0.29 8.92 10.79
DISCUSSION AND CONCLUSIONS Three tidal methods are presented and discussed in this paper, namely:
Method 1 - Analytic VTUGF solution and average efficiencies; Method 2 - Analytic VTUGF solution and harmo nic efficiencies; and Method 3 - Numeric solution and actual time series data.
Method 1 and Method 3 were employed by Chen (2000) in the estimation of the vertical hydraulic conductivity, K, of the Holocene-age aquifer at Heron Island. In this study Method 2 was employed to further validate the theory via a cross comparison of results. The K estimates provided by the three methods (Table 1) are also based on the simplifying assumption that the aquifer specific yield, Sy, is 0.30. The aquifer vertical diffusivity, Dv, is equal to K divided by Sy.
The five sets of K listed in Table 1 are all highly correlated with each other (correl. coefficients > 0.99) giving credibility to the various approaches. A comparison of the various K values in Table 1 shows that K determined from average efficiencies are the most different, with a root mean square (RMS) difference of about 2 m d-1 relative to the other sets of K. On the other hand, the sets of K calculated from the K1 and M2 efficiencies are quite similar to the numerical estimates with an RMS of 0.5 to 0.6 m d-1. The set of K values based on the S2 efficiencies were less similar to the numerical estimates, with an RMS of 1.3 m d -1.
The overall differences in the K values from Method 2 and Method 3 may be attributed to the
approximate measures taken in the numeric method (i.e. the calibration), the imperfect nature of the discrete FFT analysis, and experimental error in the data. Chen (2000) undertook an error analysis and found that the experimental uncertainty in K is ±1 to ±5 m d-1 for the various well locations at Heron Island.
Method 1 is theoretically weaker than the other methods, because it ignores harmonic
interactions, and this would explain why the results of Method 1 are somewhat different to the results of the other two methods (Table 1). The K values determined analytically using Method 2 were calculated from the harmonic efficiencies for the K1, M2 and S2 signals: a theoretically sound approach because it accounts for harmonic interactions. These K values are similar to the values determined using Method 3, the numeric method, which also accounts for harmonic interactions. The exact cause for the differences between the K estimates based on K1, M2 and S2 efficiencies is unknown, but all the diffe rences are within experimental error.
For coral reef researchers, the VTUGF solutions provide a means of profiling the vertical
permeability of shallow reef material assuming that piezometers can be suitably placed into the reef. Chen (2000) found that the K of the Holocene-age layer at Heron Island actually decreased with greater depth, from 21 to 80 m d-1 to 3 to 16 m d-1, indicating a structural pattern to the Holocene age material. But obviously even the deepest piezometer was above the Holocene-Pleistocene contact. Below the contact K is presumably very high, of the order of 1000 m d-1, due to solution cavities and karst features.
On a practical note, the VTUGF solutions are a contribution to the available repertoire of tidal
methods and will benefit studies of dual-aquifer islands. The resources required to undertake tidal methods can be substantial and may exceed the reach of some studies, thus, when designing a field monitoring programme that involves VTUGF, it is recommended that a desk-top study be undertaken to evaluate the benefits and costs of the various options. A low-cost approach would be to estimate the vertical hydraulic K of the Holocene-age layer by recording watertable levels with a hand-held dipper and applying Method 3. Method 1 is least accurate because the tidal averaging ignores the diurnal and semi -diurnal frequency interactions. Furthermore, if drilling is not practical, then a major simplification would be to assume an approximate depth to the Holocene-Pleistocene contact and a 100% tidal efficiency at that contact.
Of more general significance is the theoretical relationship between the dimensionless Fourier Number for inelastic VTUGF (NVTUGF) and the watertable efficiency (Equation 12; Figure 8). Figure 8 indicates that (A) an undrained response occurs when NVTUGF is less than about 0.01-0.1, (B) a partially drained response occurs when NVTUGF is between about 0.1 and 30, and (C) a fully drained response occurs when NVTUGF is greater than about 30-80. This terminology is adapted from Domenico & Schwartz’s (1990) discussion of solid earth tides and transient blanket loading. When transient blanket loading is applied to an aquifer a pressure change occurs that is initially distributed between the solids and fluids as a function of aquifer porosity and volumetric compressibility of the water, solids and pore spaces. The ensuing groundwater flow is related to the aquifer hydraulic diffusivity. Domenico & Schwartz (1990) called the (relatively) fast groundwater flow situation a ‘drained response’ and the (relatively) slow groundwater flow situation an ‘undrained response’.
In this paper (refer Figure 8) the three NVTUGF ranges of undrained, partially drained and fully
drained, are also associated with the general terms confined, semi-confined and unconfined, respectively. This generalised terminology warrants further investigation and discussion because it relates a quantifiable parameter (NVTUGF) to these very general hydrogeological terms. It is therefore suggested that the non-dimensional formulae of Chen (2000) for VTUGF (Equations 8 to 12) can be used to classify vertical groundwater flow in inelastic porous aquifers as long as the forcing term (occurring at some depth below the watertable) can be represented/approximated with sinusoids of known periodicity. The analytical expression for VTUGF (Equation 6) may be used to benchmark groundwater simulation codes and may also inspire novel laboratory methods for permeability testing of soil samples (as an alternative to the falling-head test and the constant-head test). Additional theoretical work is also required to derive a more general analytical solution to VTUGF that includes both elastic and drainable storage terms.
ACKNOWLEDGEMENTS
§ Dr Andre Krol (Iron Ore Canada) and Dr David Lockington (Dept. of Civil Engineering, University of Queensland) for their supervisory support and technical advice.
§ Dept. of Chemical Engineering and the Heron Island Research Station, University of Queensland, for assistance with lab work and field studies.
§ Michael Noordink, Eva Biosca, Ian Murrell, Aino Jensen, Nicole Diatloff and others for providing valuable field assistance.
§ The HIGP (1991-2000) was jointly funded by the University of Queensland, The Great Barrier Reef Marine Park Authority (GBRMPA) and P&O Resorts.
§ Dr Anthony J. Smith at CSIRO Land and Water, Perth, for advice regarding FFT analysis. REFERENCES
Ayers JF, Vacher HL (1986). Hydrogeology of an atoll island: a conceptual model from detailed study
of a Micronesian example. Ground Water, 24: 185-198. Bloomfield P (1976). Fourier analysis of time series: an introduction. John Wiley & Sons, New York. Buddemeier RW, Holladay GL (1977). Atoll hydrology: Island ground-water characteristics and their
relationship to diagenesis. Proc. 3rd Int. Coral Reef Symp., Miami. Vol.2: 167-174. Carslaw HS & Jaeger JC (1959). Conduction of heat in solids, 2nd Ed. Oxford University Press, New
York, 1959, pp. 510. Charlie J, Heatwole H, Brock M (1990). Nutrient Dynamics on Coral Cays. Final Report to the Aust.
Res. Counc. (unpublished), Proj. No. A18615988, pp. 206. Chen DB (2000). The Hydrology and Hydrogeology of Heron Island, The Great Barrier Reef:
Modelling Natural Recharge and Tidal Groundwater Flow in a Coral Cay. A Thesis submitted to the University of Queensland as a requirement for admission to the degree of Ph.D.
Chen DB, Krol A (1997). Hydrogeology of Heron Island, Great Barrier Reef, Australia. In: Geology and Hydrogeology of Carbonate Islands, Developments in Sedimentology, Vol. 54, Chpt. 30 (edited by H.L. Vacher and T.M. Quinn). Elsevier, Amsterdam, pp. 948.
Davies PJ (1992). Origins of the Great Barrier Reef. Search, 23: 193-196. Domenico PA, Schwartz FW (1990). Physical and chemical hydrogeology. New York, Wiley, 1990. Ferris JG (1951). Cyclic fluctuations of water level as a basis for determining aquifer transmissibility.
IAHS Publ. 33, pp. 148-55. Harbaugh AW, McDonald MG (1996). User’s Documentation for MODFLOW-96, an update to the
U.S. Geological Survey Modular Finite-Difference Ground-Water Flow Model. U.S. Geological Survey Open-File Report 96-485. Reston, Virginia 1996.
Herman ME, Buddemeier RW, Weatcraft SW (1986). A layered aquifer model of atoll island
hydrology: validation of a computer simulation. Journal of Hydrology, 84: 303-322. Herman ME, Weatcraft SW (1984). Groundwater dynamics investigation of Enjebi Island, Enewetak
Atoll: an interpretive computer model simulation. In: Finite elements in water resources (editors: J.P.Laibale, C.A.Brebbia and G.Pinder). Springer-Verlag, New York:133-142.
Hopley D (1982). Geomorphology of the Great Barrier Reef: Quarternary development of coral reefs.
John Wiley-Interscience, New York, pp. 453. Hopley D (1997). Geology of reef islands of the Great Barrier Reef, Australia. In: Geology and
Hydrogeology of Carbonate Islands, Developments in Sedimentology, Vol. 54, Chpt. 29 (edited by H.L. Vacher and T.M. Quinn). Elsevier, Amsterdam, pp. 948.
Hunt CD, Peterson FL (1980). Groundwater resources of Kwajalein Islands, Marshall Islands.
University of Hawaii, Water Resources Research Centre. Tech. Report. No. 126, 91 pp. Jell JS, Flood PG (1977). Guide to the geology of reefs of the Capricorn and Bunker Groups, Great
Barrier Reef Province, with special attention to Heron Reef. In: Papers Dep. Geol., Univ. Queensland, Aust. Sedimentol. Group, 8(3):1-85.
Krol A, Noordink M, Jell J, Chen DB (1992). The Heron Island Groundwater Project. In: National
Conference on Environmental Engineering, Gold Coast, Australia. 17-19 June 1992, Reprints of papers. The Institute of Engineers Australia, National Conference Publication No 92/5.
Lam RK (1974). Atoll permeability calculated from tidal diffusion. J. Geophys. Res., 79(21): 3073-
3081. Maxwell WGH (1962). Lithification of carbonate sediments in the Heron Island Reef, Great Barrier
Reef. J. Geol. Soc. Aust., 8: 217-238. Millham NP, Howes BL (1995). A comparison of methods to determine K in a shallow coastal aquifer.
Ground Water, 33 (1): 49-57. Merritt ML (2004). Estimating hydraulic properties of the Floridan aquifer system by analysis of Earth-
tide, ocean-tide, and barometric effects, Collier and Hendry Counties, Florida. USGS, Water-Resources Investigations Report 03-4267. Tallahassee, Florida.
Oberdorfer JA, Hogan PJ, Buddemeier RW (1990). Atoll island hydrogeology: flow and freshwater
occurrence in a tidally dominated system. Journal of Hydrology, 120: 327-340. Peterson FL, Gingerich SB (1995). Modelling atoll island groundwater systems. In: Groundwater
models for resource analysis and management (Chapter 15), CRC Press Inc., 1995.

Peterson FL (1991). Recent advances in atoll hydrogeology. In: Groundwater in the Pacific rim countries. Proc. Sympo. Sponsored by the Irrigation & Drainage Division of the Am. Soc. of Civil Engineers, Honolulu, Hawaii, 23-25 July 1991, pp. 183.
Richards HC (1938). Boring operations at Heron Island, Great Barrier Reef (17 May to 13 Aug 1937).
Report of the Great Barrier Reef Comm., 4(3): 135-142. Richards HC, Hill D (1942). Great Barrier Reef bores, 1926 and 1937: descriptions, analyses and
interpretations. Report of the Great Barrier Reef Comm., 5: 1-111. Underwood MR (1990). Atoll island hydrogeology: conceptual and numerical models. Ph.D. Thesis in
geology and geophysics, May 1990. University of Hawaii, 1990. Underwood MR, Peterson FL, Voss CI (1992). Groundwater lens dynamics of atoll islands. Water
Resour. Res., 28(11): 2889-2902. Keller CK, Van der Kamp G, Cherry JA (1989). A multiscale study of the permeability of a thick
clayey till. Water Res. Res, Vo l 25(11): 2299-2317. Nov 1989. Weatcraft SW, Buddemeier RW (1981). Atoll island hydrology. Ground Water, 19(3): 311-320. Whitten DGA, Brooks JRV (1987). The Penguin Dictionary of Geology. Penguin Books Ltd, Great
Britain, 1987.
Copyright © 2022 FDOKUMEN