
Groundwater flow in an arsenic-contaminated aquifer, Mekong Delta, Cambodia
16
0883-2927/$ - see front matter © 2008 Elsevier Ltd. All rights reserved. doi:10.1016/j.apgeochem.2008.06.013 Applied Geochemistry 23 (2008) 3072–3087 Contents lists available at ScienceDirect Applied Geochemistry journal homepage: www.elsevier.com/locate/apgeochem 1. Introduction There has been extensive investigation into the geo- chemical processes leading to elevated As in the deltaic groundwaters in Asia and there is emerging consensus that reductive dissolution of Fe oxides is an important mechanism leading to As release to the porewaters of the aquifers in the region (Nickson et al., 2000; Harvey et al., 2002; McArthur et al., 2004; Islam et al., 2004). In contrast, there has been less agreement regarding the both the role of hydrology in As release and the importance of surficial processes as a source of As and/or organic C (see Harvey et al 2002 and associated discussion). Many studies pres- ent evidence that As is released from sediments at depth (e.g. McArthur et al., 2004; Islam et al., 2004), while near- surface processes have also been evoked (Polizzotto et al., 2005; Harvey et al., 2006). Based on work at a field site in Cambodia, the authors recently proposed that signifi- cant As is mobilized from shallow sediments with release and transport strongly influenced by surface hydrologic processes and coupled groundwater flow (Polizzotto et al., 2008). A tight linkage between As behavior and hydrology implies that ongoing and future anthropogenic activities (i.e. land use change, groundwater pumping, sediment excavation) will likely influence As behavior, potentially alleviating or exacerbating this massive health crisis. Elucidating the role of the hydrologic flow system on release (and transport) has been hampered by the flow complexity of the heavily pumped Bangladeshi aquifers where most research has been focused. Such local flow Groundwater flow in an arsenic-contaminated aquifer, Mekong Delta, Cambodia Shawn G. Benner a, * , Matthew L. Polizzotto b , Benjamin D. Kocar b , Somenath Ganguly a , Kongkea Phan c , Kagna Ouch c , Michael Sampson c , Scott Fendorf b a Department of Geosciences, Boise State University, Boise, ID 83705, USA b School of Earth Sciences, Stanford University, Stanford, CA 94305, USA c Resource Development International, Kien Svay, Kandal, Cambodia article info abstract Article history: Available online 4 July 2008 To advance understanding of hydrological influences on As concentrations within ground- waters of Southeast Asia, the flow system of an As-rich aquifer on the Mekong Delta in Cambodia where flow patterns have not been disturbed by irrigation well pumping was examined. Monitoring of water levels in a network of installed wells, extending over a 50 km 2 area, indicates that groundwater flow is dominated by seasonally-variable gradi- ents developed between the river and the inland wetland basins. While the gradient inverts annually, net groundwater flow is from the wetlands to the river. Hydraulic parameters of the aquifer (K t 10 ¡4 ms ¡1 ) and overlying clay aquitard (K t 10 ¡8 ms ¡1 ) were determined using grain size, permeameter and slug test analyses; when coupled with observed gradi- ents, they indicate a net groundwater flow velocity of 0.04–0.4 ma ¡1 downward through the clay and 1–13 ma ¡1 horizontally within the sand aquifer, producing aquifer residence times on the order 100–1000 a. The results of numerical modeling support this conceptual model of the flow system and, when integrated with observed spatial trends in dissolved As concentrations, reveal that the shallow sediments (upper 2–10 m of fine-grained mate- rial) are an important source of As to the underlying aquifer. © 2008 Elsevier Ltd. All rights reserved. * Corresponding author. E-mail address: [email protected] (S.G. Benner).
-
Upload
independent -
Category
Documents
-
view
1 -
download
0
Transcript of Groundwater flow in an arsenic-contaminated aquifer, Mekong Delta, Cambodia

Applied Geochemistry 23 (2008) 3072–3087
Contents lists available at ScienceDirect
Applied Geochemistry
journal homepage: www.elsevier.com/ locate /apgeochem
Groundwater flow in an arsenic-contaminated aquifer, Mekong Delta,
Cambodia
Shawn G. Benner a,*, Matthew L. Polizzotto b, Benjamin D. Kocar b, Somenath Ganguly a, Kongkea Phan c, Kagna Ouch c, Michael Sampson c, Scott Fendorf b
a Depart ment of Geo scienc es, Boise State Uni ver sity, Boise, ID 83705, USAb School of Earth Sci ences, Stan ford Uni ver sity, Stan ford, CA 94305, USAc Resource Devel op ment Inter na tional, Kien Svay, Kan dal, Cam bo dia
a r t i c l e i n f o
Article history:
Available online 4 July 2008
0883-2927/$ - see front matter © 2008 Else vier L
doi:10.1016/j.apgeochem.2008.06.013
* Cor re spond ing author.
E-mail address: sben ner@boise state.edu (S.G.
a b s t r a c t
To advance under stand ing of hydro log i cal influ ences on As con cen tra tions within ground-
wa ters of South east Asia, the flow sys tem of an As-rich aqui fer on the Me kong Delta in
Cam bo dia where flow pat terns have not been dis turbed by irri ga tion well pump ing was
exam ined. Mon i tor ing of water lev els in a net work of installed wells, extend ing over a
50 km2 area, indi cates that ground wa ter flow is dom i nated by sea son ally-var i able gra di-
ents devel oped between the river and the inland wet land basins. While the gra di ent inverts
annu ally, net ground wa ter flow is from the wet lands to the river. Hydrau lic param e ters of
the aqui fer (K t 10¡4 ms¡1) and over ly ing clay aqui tard (K t 10¡8 ms¡1) were deter mined
using grain size, per me am e ter and slug test anal y ses; when cou pled with observed gra di-
ents, they indi cate a net ground wa ter flow veloc ity of 0.04–0.4 ma¡1 down ward through
the clay and 1–13 ma¡1 hor i zon tally within the sand aqui fer, pro duc ing aqui fer res i dence
times on the order 100–1000 a. The results of numer i cal mod el ing sup port this con cep tual
model of the flow sys tem and, when inte grated with observed spa tial trends in dis solved
As con cen tra tions, reveal that the shal low sed i ments (upper 2–10 m of fine-grained mate-
rial) are an impor tant source of As to the under ly ing aqui fer.
© 2008 Else vier Ltd. All rights reserved.
1. Intro duc tion
There has been exten sive inves ti ga tion into the geo-
chem i cal pro cesses lead ing to ele vated As in the del taic
ground wa ters in Asia and there is emerg ing con sen sus
that reduc tive dis so lu tion of Fe oxides is an impor tant
mech a nism lead ing to As release to the pore wa ters of the
aqui fers in the region (Nick son et al., 2000; Har vey et al.,
2002; McAr thur et al., 2004; Islam et al., 2004). In con trast,
there has been less agree ment regard ing the both the role
of hydrol ogy in As release and the impor tance of sur fi cial
pro cesses as a source of As and/or organic C (see Har vey
et al 2002 and asso ci ated dis cus sion). Many stud ies pres-
td. All rights reserved.
Benner).
ent evi dence that As is released from sed i ments at depth
(e.g. McAr thur et al., 2004; Islam et al., 2004), while near-
sur face pro cesses have also been evoked (Po lizz ot to et al.,
2005; Har vey et al., 2006). Based on work at a field site
in Cam bo dia, the authors recently pro posed that sig nifi -
cant As is mobi lized from shal low sed i ments with release
and trans port strongly influ enced by sur face hydro logic
pro cesses and cou pled ground wa ter flow (Po lizz ot to et al.,
2008). A tight link age between As behav ior and hydrol ogy
implies that ongo ing and future anthro po genic activ i ties
(i.e. land use change, ground wa ter pump ing, sed i ment
exca va tion) will likely influ ence As behav ior, poten tially
alle vi at ing or exac er bat ing this mas sive health cri sis.
Elu ci dat ing the role of the hydro logic flow sys tem on
release (and trans port) has been ham pered by the flow
com plex ity of the heav ily pumped Ban glade shi aqui fers
where most research has been focused. Such local flow

S.G. Ben ner et al. / Applied Geochemistry 23 (2008) 3072–3087 3073
com plex ity has pre cluded the devel op ment of a site-spe-
cific, spa tially dis trib uted flow model that can enable eval-
u a tion of changes in geo chem i cal param e ters, inclu sive of
As con cen tra tions, along a con strained flow path. Despite
this com plex ity, a num ber of recent obser va tions indi cate
that hydro logic con di tions influ ence the result ing dis tri-
bu tion of dis solved As within the aqui fer (Har vey et al.,
2006; Klump et al., 2006; Post ma et al., 2007; Stute et al.,
2007).
Har vey et al. (2006) over came the chal lenges of a
spa tially dis trib uted mod el ing approach by uti liz ing a
detailed, lumped-param e ter model to dem on strate that
the aqui fer at their Mun sh i ganj site in Ban gla desh was rap-
idly flushed (res i dence times of <100 a), and that pump ing
for irri ga tion had altered the phys i cal and chem i cal nature
of the ground wa ter sys tem. Fur ther more, this eval u a tion
sug gested that ponds, which have been exca vated into the
sur fi cial clay layer at the site, may be a primary source of
recharge to the aqui fer. Klump et al. (2006), also work ing
in the Mun sh i ganj dis trict of Ban gla desh, cou pled 3H/3He
ground wa ter dat ing with con cep tual flow mod el ing to pro-
pose that the high est As con cen tra tions are found within a
zone of con ver gent flow pro duced by irri ga tion pump ing.
Sim i larly, Stute et al. (2007) sug gest, again based on 3H/3He
ground wa ter dat ing in Ban gla desh ground wa ter, that
ground wa ter flush ing (driven by pump ing) may explain
the spa tial dis tri bu tion of As in the aqui fer. At a sep a rate
site in Ban gla desh, van Geen et al. (2006) dem on strated a
cor re la tion between hydrau lic soil prop er ties and the con-
cen tra tion of As in the under ly ing aqui fer; areas with more
sand and less clay were cor re lated to lower As lev els. At
an inten sively instru mented field site on the Red River in
Viet nam, Post ma et al. (2007) doc u mented steep gra di ents
in As con cen tra tions along flow paths in the upper 10 m
of the aqui fer and detailed bio geo chem i cal changes along
inferred flow paths. In Po lizz ot to et al. (2008), the authors
pro posed a tightly cou pled hydro logic and geo chem i cal
model indi cat ing that ele vated As con cen tra tions within
the aqui fer are, at least in part, released from shal low sed-
i ments and trans ported to depth by infil trat ing sur face
water. While not exclu sion ary of other release pro cesses
and loca tions, the pro posed model pro vides a mech a nism
to explain As pro files through out the aqui fer. Here, a more
detailed descrip tion of the phys i cally-based hydro log i cal
frame work of ground wa ter flow that enabled this inter pre-
ta tion of observed spa tio tem po ral trends in ground wa ter
geo chem is try is pre sented. In a com pan ion sub mis sion,
the bio geo chem i cal pro files and mech a nisms lead ing to
As release from shal low sed i ments are described in detail
(Ko car et al., 2008).
The hydro logic com plex ity induced by ground wa ter
pump ing for irri ga tion has been over come by devel op ing
a model for a regional scale, As-rich, del taic aqui fer in
Cam bo dia where ground wa ter flow is min i mally dis turbed
by ground wa ter pump ing (Polya et al., 2005). Spe cifi cally,
an exten sive hydro logic data set, of regional extent, has
been cre ated and inter preted using sim ple mass bal ance/
flux cal cu la tions and numer i cal flow mod el ing, to develop
a site-spe cific, spa tially dis trib uted, model of the ground-
wa ter flow sys tem. The hy drog e ol o gy at the site is driven
by dra matic, sea son ally-var i able fluc tu a tions in sur face
water lev els and is strongly influ enced by a sur fi cial clay
depo si tional unit. It is dem on strated that, despite a sea-
sonal rever sal of flow direc tion, the net annual ground wa-
ter flow is down wards from wet land basins to the under-
ly ing aqui fer and hor i zon tal from the aqui fer to adja cent
riv ers.
1.1. Field site descrip tion
The 50 km2 field area is located on the Me kong Delta in
the Kan dal prov ince of Cam bo dia, SE of Phnom Penh (Lat.
11 31 3.90N, Long. 105 0 41.77E, Fig. 1). The Me kong River
is a broad river that car ries the sev enth larg est sed i ment
load in the world, the major ity of which is dis charged dur-
ing the wet sea son. The site is located at the upper end
of the delta and is bound by two del taic dis trib u tar ies of
the Me kong River (Me kong and Bas sac branches). As on
the other major del tas of Asia, Me kong topog ra phy is very
sub dued (max i mum ele va tion typ i cally <10 m) and is char-
ac ter ized by ele vated nat u ral levees along the riv er banks
reced ing to a native, sea son ally-flooded, wet land basin
between the two riv ers (Bus ch mann et al., 2007). The sed i-
ments of the Me kong Delta were depos ited over the pre vi-
ous 7.5 ka fol low ing the last sea level high-stand (Ngu yen
et al., 2000; Ta et al., 2002; Tam ura et al., 2007). At the site,
the sed i ment sequence is com posed of >30 m of aqui fer-
form ing sands over lain by approx i mately 15 m of silts and
clays (JICA, 2002; Tam ura et al., 2007). The aqui fer of the
low-lying Me kong flood plain in Cam bo dia is the primary
drink ing water source for much of the rural pop u la tion,
yet ele vated dis solved As con cen tra tions are com mon
(Polya et al., 2005; Berg et al., 2007). Within the aqui fer
at the field site, dis solved As con cen tra tions are nearly
uni ver sally ele vated with almost all wells within the aqui-
fer exceed ing 100 lg L¡1 (Fig. 2). Dur ing the study period,
ground wa ter pump ing through out the field site was lim-
ited to domes tic extrac tion.
2. Meth ods
2.1. Ground wa ter and sur face water mon i tor ing net work
A net work of 80 installed wells and 10 sur face water
mon i tor ing sites are dis trib uted through out the field area
(Fig. 1). At two loca tions addi tional near-sur face lysi me ters
and a sub set of closely spaced wells pro vide more detailed
spa tial anal y ses (see inten sive sites, Fig. 1). At most loca tions
outside the detailed mon i tor ing sites, wells are installed as
nested wells with one well screened across the water table
within the clay unit (4–12 m), and two wells screened in
the upper (20–30 m) and lower (36–60 m) por tions of the
aqui fer sands. Wells were installed using a locally devel-
oped man u ally-driven, direct rotary method (1.50, 3.8 cm,
diam e ter pipe with a 40, 10.2 cm, diam e ter open cut ting
tip) where a water-based slurry is pumped down the cen ter
pipe of the drill, lift ing drill cut tings to the sur face along
the annu lus between the drill pipe and drill hole. Wells are
com posed of 3.2 cm diam e ter PVC pip ing, typ i cally screened
over the lower 4 m. After instal la tion, wells were back filled
with sand over the screened inter val and capped with clay
or cement to the sur face.

3074 S.G. Ben ner et al. / Applied Geochemistry 23 (2008) 3072–3087
Mekong River
Wetland Basin
Bassac River
AbandonedRiver Channel
Ponds
0 1 2
kilometers
N
Well nest
Surface water
Core locations
Intensive sitesCross section
TC
TC51
TE51
TE11
MI11
BD11
PE51
PW31
BD51
PE31
PE21
PW11
TH11
TH71TC11
TC31
Mekong River
Wetland Basin
Bassac River
AbandonedRiver Channel
Ponds
0 1 2
kilometers
N
Well nest
Surface water
Core locations
Intensive sitesCross section
TC45
TC51
TE51
TE11
MI11
BD11
PE51
PW31
BD51
PE31
PE21
PW11
TH11
TH71TC11
TC31
Fig. 1. Field area map. Phnom Penh, the cap i tal of Cam bo dia, is located approx i mately 15 km to the west of the field area.
2.2. Water lev els
All ref er ence points, wells, and sur face water mon i tor-
ing sites used for water level mea sure ments were spa tially
linked by ver ti cal sur vey ing with an auto level (2.5 mm
accu racy per dou ble km run); field error was <5 mm on
closed loops.
Me kong River stage lev els were pro vided by the Me kong
River Com mis sion (MRC) and are rep re sen ta tive of the
recent his tor i cal aver age. Dis tance-weighted aver ages
from the Phnom Penh Port (upstream of the site) and the
Neak Lu ong (down stream) sta tions were used to cal i brate
the abso lute ele va tion of the water level mon i tor ing site in
the Me kong River, and ele va tions through out the field area
were ref er enced with these MRC data. Hydrau lic heads in
each well were mea sured weekly with an elec tronic water
level tape, and sur face water lev els were mea sured weekly
with a weighted mea sur ing tape from points of fixed ele-
va tion. Water lev els are reported as meters above mean
sea level (mASL).
m 0m 0001m 0002m 0003
0 m
-50 m
10 m
-20 m
-30 m
-40 m
0 m
-50 m
10 m
-20 m
-30 m
-40 m
-50 m
10 m
-20 m
0 m
-30 m
-40 m
-50 m
10 m
-20 m
0 m
-30 m
-40 m
-50 m
10 m
-20 m
0 m
-30 m
-40 m
wetlands ponds Mekong
240
10
100
400
650
0-7
80-120
390
540
600-750
900-1100
130
100
170-220
320-1200
0-30
300-550
920
1200
480
960
12-75
460670-850
450-930
950
920-1200
40-50
510-1030
770-1300
(0-100)
(100-400)
(400-850)(>850)
Fig. 2. Cross sec tional pro file along tran sect shown in Fig. 1, with As con cen tra tions, all val ues in lg L¡1. The num bers in paren the ses indi cate the range for
shaded con tours. The ver ti cal axis is expressed as meters above mean sea level (mASL).
S.G. Ben ner et al. / Applied Geochemistry 23 (2008) 3072–3087 3075
2.3. Tidal mon i tor ing
Daily, tid ally-driven changes in water lev els in the
Me kong and within ground wa ter wells were mea sured
using In-Situ Level Troll 500 and 700 Series pressure
trans duc ers. A trans ducer, set to record at a rate of once
per min ute, was placed in the Me kong approx i mately 2 m
below the river sur face. A sec ond pressure trans ducer was
then sequen tially placed in wells TC11, TH11, and TC31 for
approx i mately 48 h time peri ods, pro duc ing a series of
river-aqui fer paired data sets.
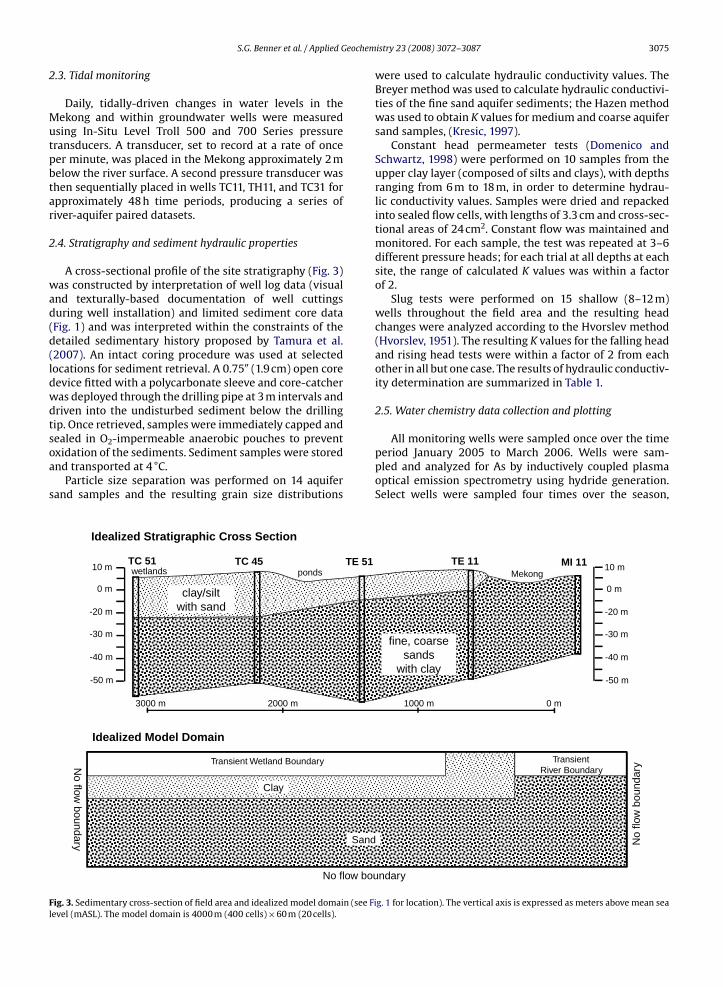
2.4. Stra tig ra phy and sed i ment hydrau lic prop er ties
A cross-sec tional pro file of the site stra tig ra phy (Fig. 3)
was con structed by inter pre ta tion of well log data (visual
and tex tur ally-based doc u men ta tion of well cut tings
dur ing well instal la tion) and lim ited sed i ment core data
(Fig. 1) and was inter preted within the con straints of the
detailed sed i men tary his tory pro posed by Tam ura et al.
(2007). An intact cor ing pro ce dure was used at selected
loca tions for sed i ment retrieval. A 0.750 (1.9 cm) open core
device fit ted with a poly car bon ate sleeve and core-catcher
was deployed through the dril ling pipe at 3 m inter vals and
driven into the undis turbed sed i ment below the dril ling
tip. Once retrieved, sam ples were imme di ately capped and
sealed in O2-imper me able anaer o bic pouches to pre vent
oxi da tion of the sed i ments. Sed i ment sam ples were stored
and trans ported at 4 °C.
Par ti cle size sep a ra tion was per formed on 14 aqui fer
sand sam ples and the result ing grain size dis tri bu tions
were used to cal cu late hydrau lic con duc tiv ity val ues. The
Bre yer method was used to cal cu late hydrau lic con duc tiv i-
ties of the fine sand aqui fer sed i ments; the Ha zen method
was used to obtain K val ues for medium and coarse aqui fer
sand sam ples, (Kre sic, 1997).
Con stant head per me am e ter tests (Dome nic o and
Sch wartz, 1998) were per formed on 10 sam ples from the
upper clay layer (com posed of silts and clays), with depths
rang ing from 6 m to 18 m, in order to deter mine hydrau-
lic con duc tiv ity val ues. Sam ples were dried and repacked
into sealed flow cells, with lengths of 3.3 cm and cross-sec-
tional areas of 24 cm2. Con stant flow was main tained and
mon i tored. For each sam ple, the test was repeated at 3–6
dif fer ent pressure heads; for each trial at all depths at each
site, the range of cal cu lated K val ues was within a fac tor
of 2.
Slug tests were per formed on 15 shal low (8–12 m)
wells through out the field area and the result ing head
changes were ana lyzed accord ing to the Hvors lev method
(Hvors lev, 1951). The result ing K val ues for the fall ing head
and ris ing head tests were within a fac tor of 2 from each
other in all but one case. The results of hydrau lic con duc tiv-
ity deter mi na tion are sum ma rized in Table 1.
2.5. Water chem is try data col lec tion and plot ting
All mon i tor ing wells were sam pled once over the time
period Jan u ary 2005 to March 2006. Wells were sam-
pled and ana lyzed for As by induc tively cou pled plasma
opti cal emis sion spec trom e try using hydride gen er a tion.
Select wells were sam pled four times over the sea son,
TE 11TE 51TC 45TC 51
fine, coarse sands
with clay
clay/siltwith sand
-50 m
10 m
-20 m
0 m
-30 m
-40 m
-50 m
10 m
-20 m
0 m
-30 m
-40 m
wetlands ponds MekongMI 11
m 0m 0001m 0002m 0003
TransientRiver Boundary
Transient Wetland BoundaryNo flow
boundary
No flow boundary
No
flow
bou
ndar
y
Clay
Sand
Idealized Stratigraphic Cross Section
Idealized Model Domain
Fig. 3. Sed i men tary cross-sec tion of field area and ide al ized model domain (see Fig. 1 for loca tion). The ver ti cal axis is expressed as meters above mean sea
level (mASL). The model domain is 4000 m (400 cells) £ 60 m (20 cells).

3076 S.G. Ben ner et al. / Applied Geochemistry 23 (2008) 3072–3087
DateNov-04 Mar-05 Jul-05 Nov-05 Mar-06
Ele
vatio
n A
bove
Sea
Lev
el (
m)
0
2
4
6
8Surface Water PondsMekong RiverWell TC31 Well TE11Well TC45 Well TC51
River > PondsPonds > River Ponds > River
Fig. 4. Sea sonal Me kong River, wet land and well hy dro graphs. Arrow indi cates dis tinct river hyd ro graph peak that is observed in ground wa ter wells and
cap tured in numer i cal mod el ing results.
estab lish ing that there was little var i a tion in con cen tra tion
within the aqui fer. The excep tion was observed tem po ral
vari a tions in the recharge and dis charge zones. Col lected
data from multiple tran sects was pro jected onto a sin gle
plane based on dis tance-from-the-river. The result ing two
dimen sional, cross-sec tional, plot of the data was then
con toured using visual inter po la tion.
2.6. Numer i cal mod el ing
Numer i cal mod el ing was under taken to fur ther eval u-
ate and refine (or revise) the emerg ing ground wa ter flow
con cep tu al i za tion. Model cal i bra tion was con ducted by
seek ing to repro duce the sea sonal trends in hydrau lic
heads observed in the mon i tor ing wells within the aqui-
fer. Aqui fer prop er ties were con strained by field-mea sured
or doc u mented lit er a ture val ues. It was also sought to
pro duce a net aver age flow field con sis tent with that dic-
tated by the mea sured annual gra di ents. In practice, this
entailed adjust ing the hydrau lic con duc tiv ity val ues of the
clay and the sand (within the con straints of the observed
range of val ues) to opti mize the rel a tive influ ence of the
sea sonal wet land and river hydrau lic head changes on the
aqui fer wells.
Numer i cal mod el ing was con ducted using MOD FLOW
and MOD PATH (McDon ald and Harb augh, 1988) under
both tran sient and steady-state (net annual) con di tions.
Sim u la tions were con ducted in a two-dimen sional cross-
sec tional grid (60 m, 20 cell depth; 4000 m, 400 cell width,
Fig. 3). An assump tion of sym me try between the Bas sac
and Me kong Riv ers enabled the estab lish ment of a no flow
bound ary at the cen ter of the wet lands and the mid dle of
the Me kong River. The base of the aqui fer (assumed to be
at 60 m depth) was also des ig nated a no flow bound ary
con di tion. Tran sient bound ary con di tions were defined by
a fit ted func tion of the 5 day run ning aver age of mea sured
water wet land/pond and river lev els over the time period
from Jan u ary 2005 to March 2006 (Fig. 4). These bound ary
con di tions were rep re sented by cells 12 m thick to accom-
mo date sea sonal head fluc tu a tions. The hydrau lic con duc-
tiv ity field was expressed as a sim pli fied 2-layer sys tem
with 13 m of clay over ly ing 36 m of sand.
Mate rial prop er ties were fixed based on field and lit-
er a ture val ues (Table 2) with the excep tion of hydrau lic
con duc tiv ity val ues, which were treated as the primary
vari ables dur ing tran sient model cal i bra tion. The range
of hydrau lic con duc tiv ity val ues was con strained by the
range of field-mea sured val ues and by the observed gra-
di ents across the clay (between the wet lands and the aqui-
fer) and across the sand (aqui fer to the river).
Model cal i bra tion was con ducted by adjust ing hydrau-
lic con duc tiv ity val ues for the clay and sand to repro duce
field-observed tem po ral trends (both sea sonal and daily-
tidal) in well water lev els at vary ing dis tances from the
Me kong River. The assump tion of two-dimen sion al ity (i.e.
all flow per pen dic u lar to the river) was eval u ated by com-
par ing the model results with observed trends along par al-
lel well tran sects.
The result ing hydrau lic con duc tiv ity val ues were used
in steady-state (annual aver age) flow sim u la tions in which
Table 1
Hydrau lic con duc tiv i ties for aqui fer sand and sur face clay sed i ments,
based on grain size anal y sis, con stant head per me am e ter test ing and slug
test anal y sis
Method Aqui fer sands Sur face clays
Grain size Per me am e ters Slug tests
Aver age K (ms¡1) 3.15E¡04 4.08E¡07 1.22E¡06
Stan dard
devi a tion (ms¡1)
3.02E¡04 5.94E¡07 1.89E¡06
Median K (ms¡1) 2.70E¡04 5.02E¡08 4.76E¡07
Num ber of sam ples 14 10 15

S.G. Ben ner et al. / Applied Geochemistry 23 (2008) 3072–3087 3077
the wet land and river heads were fixed to pro duce the
observed aver age annual head dif fer ences.
3. Results and dis cus sion
3.1. Stra tig ra phy
Through out the field area, a silt-clay aqui tard over ly ing
the sand aqui fer was observed at all drill loca tions (Fig. 3).
While dril ling and cor ing tech niques did not per mit col lec-
tion of con tin u ous, undis turbed cores, the observed stra-
tig ra phy is con sis tent with the sed i men tary pro file and
his tory of the upper Me kong Delta pro posed by Tam ura et
al. (2007). The upper silt/clay unit ranges in thick ness from
5 to 22 m, is typ i cally orange col ored at the sur face, and is
green to grey at its base. Car bon dat ing of this fine-grained
sequence indi cates that the entire unit was depos ited over
the pre vi ous 7.5 ka; the upper, orange col ored sed i ments
were likely depos ited over the pre vi ous 0.7 ka (Tam ura,
2007). Below the upper clay/silt unit, a dis tinct tran si tion
to sand-rich sed i ments is observed. The aqui fer sand unit
extends from an aver age depth of 15 m to the max i mum
depth of dril ling (60 m), and this unit is char ac ter is ti cally
fine to course grained, is grey in color, and con tains clay
lenses. Near the base of the sand unit at some loca tions
(par tic u larly prox i mal to the Me kong and Bas sac Riv ers),
coarse grained sands and grav els are observed. Depth to
bed rock is, how ever, poorly con strained. Based on ground-
penetrating radar anal y ses, JICA (2002) esti mated that
con sol i dated bed rock ranges from 120 to 160 m below the
sur face through out the upper delta region (JICA, 2002),
but this has not been con firmed by geo phys ics nor drilled
wells in the field area. In fact, one JICA bore hole near the
Bas sac River and south of the field area reached bed rock
at 70 m (JICA, 2002). Addi tion ally, exca va tion pits near
Phnom Penh, »20 km NW of the field area, encoun ter bed-
rock at 40 m. Local well dril ling, which was used to install
the wells in this study, does not extend beyond 60 m depth;
through out the field area bed rock was reached only at
Well PE51 in the cen ter of the wet lands – at 40 m depth.
3.2. Sur face water trends and gra di ents
The delta-scale gra di ent, as expressed by the slope of
the Me kong River from Phnom Penh to the ocean, is very
low, approx i mately 1 £ 10¡5 mm¡1. In con trast, local, sea-
son ally-var i able dif fer ences in water lev els between the
river and adja cent ponds and wet lands are often 2–6 m, pro-
duc ing gra di ents on the order of 1 £ 10¡3 mm¡1. As is evi-
dent in Fig. 4, the sur face water lev els in the river pro duce
a sea sonal sig na ture that is sim i lar to, but dis tinct from,
that observed in the adja cent wet lands. The river begins
ris ing in May or June and peaks in Octo ber at an ele va tion
of approx i mately 8 m above sea level (mASL). Fol low ing a
steep decline in Decem ber and Jan u ary, the river con tin-
ues to decline to a low of approx i mately 1 mASL, until the
rainy sea son com mences in June and the river again begins
to rise. In con trast, wet land water lev els decline through
August, reach ing a low at approx i mately 4 mASL, but then
sharply rise when the river reaches flood stage in Sep tem-
ber and inun dates the wet lands. Fol low ing inun da tion, the
wet lands exhibit a rapid increase in water lev els, peak ing
in Octo ber to approx i mately 7 mASL (Fig. 4).
The dif fer ences in water lev els between the wet lands
and the river pro duce sig nifi cant, and sea son ally-var i able,
gra di ents. The river begins ris ing before the wet lands and,
from July through Novem ber, the river is 2–4 m higher
than the wet lands. In con trast, the river falls much more
rap idly than the wet lands and there is a period of approx-
i mately 8 months dur ing which the wet lands are 2–6 m
higher than the river.
3.3. Ground wa ter trends and gra di ents
Ground wa ter heads also exhibit dra matic sea sonal var-
i a tion; lev els in wells fluc tu ate up to 8 m annu ally (Fig.
4). In gen eral, ground wa ter lev els exhibit sea sonal trends
that are sim i lar, but of decreased ampli tude and delayed
trend arrival, to those observed in the river. In fact, sea-
sonal changes in ground wa ter lev els fall along a trend
that lies between those observed in the wet lands and the
river. Wells fur ther from the river exhibit less sea sonal var-
i a tion. For exam ple, Well TE11, which is 180 m from the
river, is almost iden ti cal to river trends, expe ri enc ing »8 m
of sea sonal change while Well TC31, which is 920 m from
the river, var ies by 7 m annu ally, and Well TC45, 1800 m
from the river, exhib its approx i mately 5 m of annual head
change. Com par ing wet land and aqui fer water lev els
indi cates there is a strong down ward gra di ent (2–4 m of
hydrau lic head dif fer ence) through out the fall ing limb of
the hyd ro graph. How ever, when the river is ris ing and
higher than the wet lands, that gra di ent is reversed and
when the river peaks, many wells across the site, par tic u-
larly those in lower-ele va tion basins, exhibit arte sian con-
di tions, indic a tive of strong upward gra di ents.
The direc tion of ground wa ter flow within the aqui fer,
as expressed by observed gra di ents, is per pen dic u lar to
the river (Fig. 5). How ever, ground wa ter gra di ents between
the aqui fer and the river invert semi-annu ally; dur ing the
ris ing limb of the hyd ro graph there is gra di ent of approx-
i mately 10¡3 mm¡1 from the river into the aqui fer, and
when the river is fall ing there is a gra di ent of sim i lar mag-
ni tude from the aqui fer towards the river (Figs. 5 and 6).
While the gra di ent var ies sea son ally, the wet lands are
higher than the river for 8 out of the 12 months of the year.
Because the water lev els in the river, wet lands and aqui fer
were mea sured over an entire sea sonal water cycle, it is
Table 2
Mate rial prop er ties used in model sim u la tions
River Wet land Sand Clay
Spe cific stor age (m¡1)a 0 5 £ 10¡4 1 £ 10¡4 5 £ 10¡4
Poros ityb 1 0.5 0.2 0.5
Model cal i brated
param e ters
Hor i zon tal K (ms¡1)c 1 1 £ 10¡8 3.5 £ 10¡4 1 £ 10¡8
Ver ti cal K (ms¡1)c 1 1 £ 10¡8 3.5 £ 10¡4 1 £ 10¡8
a Based on the lit er a ture val ues (Thang ara jan et al., 1999; BGS and
DPHE, 2001; Flec ken stein et al., 2006; Koni kow and Neu zil, 2007; Mast er-
son and Ga rab e dian, 2007). b Based on the lit er a ture val ues (Dome nic o and Sch wartz, 1998). c Derived from tran sient model cal i bra tion.
3078 S.G. Ben ner et al. / Applied Geochemistry 23 (2008) 3072–3087
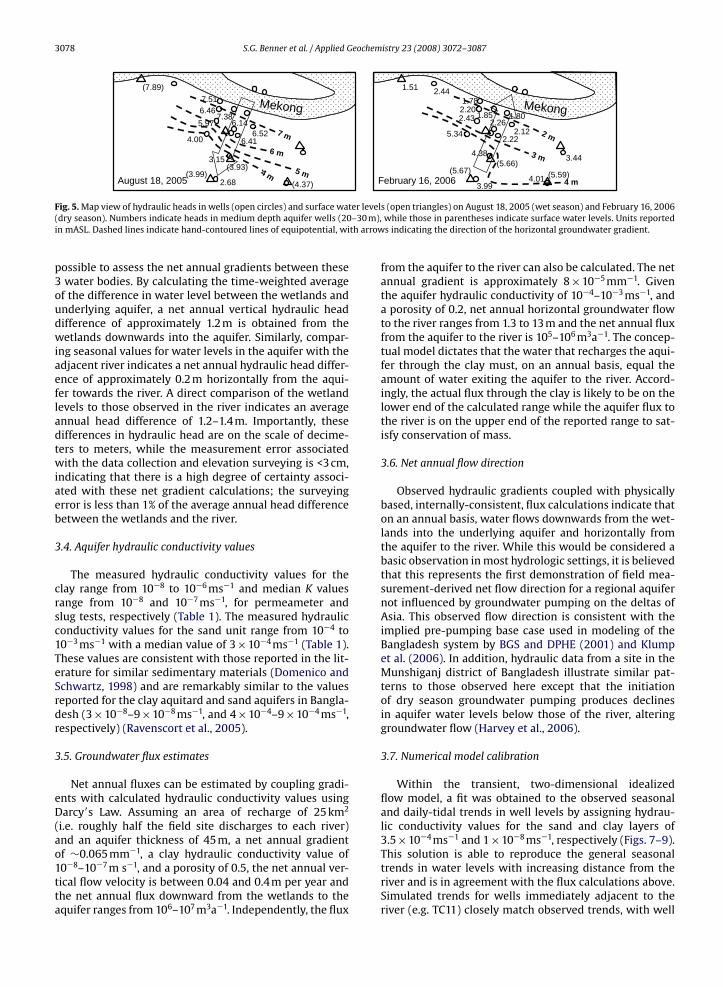
pos si ble to assess the net annual gra di ents between these
3 water bodies. By cal cu lat ing the time-weighted aver age
of the dif fer ence in water level between the wet lands and
under ly ing aqui fer, a net annual ver ti cal hydrau lic head
dif fer ence of approx i mately 1.2 m is obtained from the
wet lands down wards into the aqui fer. Sim i larly, com par-
ing sea sonal val ues for water lev els in the aqui fer with the
adja cent river indi cates a net annual hydrau lic head dif fer-
ence of approx i mately 0.2 m hor i zon tally from the aqui-
fer towards the river. A direct com par i son of the wet land
lev els to those observed in the river indi cates an aver age
annual head dif fer ence of 1.2–1.4 m. Impor tantly, these
dif fer ences in hydrau lic head are on the scale of deci me-
ters to meters, while the mea sure ment error asso ci ated
with the data col lec tion and ele va tion sur vey ing is <3 cm,
indi cat ing that there is a high degree of cer tainty asso ci-
ated with these net gra di ent cal cu la tions; the sur vey ing
error is less than 1% of the aver age annual head dif fer ence
between the wet lands and the river.
3.4. Aqui fer hydrau lic con duc tiv ity val ues
The mea sured hydrau lic con duc tiv ity val ues for the
clay range from 10¡8 to 10¡6 ms¡1 and median K val ues
range from 10¡8 and 10¡7 ms¡1, for per me am e ter and
slug tests, respec tively (Table 1). The mea sured hydrau lic
con duc tiv ity val ues for the sand unit range from 10¡4 to
10¡3 ms¡1 with a median value of 3 £ 10¡4 ms¡1 (Table 1).
These val ues are con sis tent with those reported in the lit-
er a ture for sim i lar sed i men tary mate ri als (Dome nic o and
Sch wartz, 1998) and are remark ably sim i lar to the val ues
reported for the clay aqui tard and sand aqui fers in Ban gla-
desh (3 £ 10¡8–9 £ 10¡8 ms¡1, and 4 £ 10¡4–9 £ 10¡4 ms¡1,
respec tively) (Rav ens cort et al., 2005).
3.5. Ground wa ter flux esti mates
Net annual fluxes can be esti mated by cou pling gra di-
ents with cal cu lated hydrau lic con duc tiv ity val ues using
Darcy9s Law. Assum ing an area of recharge of 25 km2
(i.e. roughly half the field site dis charges to each river)
and an aqui fer thick ness of 45 m, a net annual gra di ent
of »0.065 mm¡1, a clay hydrau lic con duc tiv ity value of
10¡8–10¡7 m s¡1, and a poros ity of 0.5, the net annual ver-
ti cal flow veloc ity is between 0.04 and 0.4 m per year and
the net annual flux down ward from the wet lands to the
aqui fer ranges from 106–107 m3a¡1. Inde pen dently, the flux
from the aqui fer to the river can also be cal cu lated. The net
annual gra di ent is approx i mately 8 £ 10¡5 mm¡1. Given
the aqui fer hydrau lic con duc tiv ity of 10¡4–10¡3 ms¡1, and
a poros ity of 0.2, net annual hor i zon tal ground wa ter flow
to the river ranges from 1.3 to 13 m and the net annual flux
from the aqui fer to the river is 105–106 m3a¡1. The con cep-
tual model dic tates that the water that recharges the aqui-
fer through the clay must, on an annual basis, equal the
amount of water exit ing the aqui fer to the river. Accord-
ingly, the actual flux through the clay is likely to be on the
lower end of the cal cu lated range while the aqui fer flux to
the river is on the upper end of the reported range to sat-
isfy con ser va tion of mass.
3.6. Net annual flow direc tion
Observed hydrau lic gra di ents cou pled with phys i cally
based, inter nally-con sis tent, flux cal cu la tions indi cate that
on an annual basis, water flows down wards from the wet-
lands into the under ly ing aqui fer and hor i zon tally from
the aqui fer to the river. While this would be con sid ered a
basic obser va tion in most hydro logic set tings, it is believed
that this rep re sents the first dem on stra tion of field mea-
sure ment-derived net flow direc tion for a regional aqui fer
not influ enced by ground wa ter pump ing on the del tas of
Asia. This observed flow direc tion is con sis tent with the
implied pre-pump ing base case used in mod el ing of the
Ban gla desh sys tem by BGS and DPHE (2001) and Klump
et al. (2006). In addi tion, hydrau lic data from a site in the
Mun sh i ganj dis trict of Ban gla desh illus trate sim i lar pat-
terns to those observed here except that the ini ti a tion
of dry sea son ground wa ter pump ing pro duces declines
in aqui fer water lev els below those of the river, alter ing
ground wa ter flow (Har vey et al., 2006).
3.7. Numer i cal model cal i bra tion
Within the tran sient, two-dimen sional ide al ized
flow model, a fit was obtained to the observed sea sonal
and daily-tidal trends in well lev els by assign ing hydrau-
lic con duc tiv ity val ues for the sand and clay lay ers of
3.5 £ 10¡4 ms¡1 and 1 £ 10¡8 ms¡1, respec tively (Figs. 7–9).
This solu tion is able to repro duce the gen eral sea sonal
trends in water lev els with increas ing dis tance from the
river and is in agree ment with the flux cal cu la tions above.
Sim u lated trends for wells imme di ately adja cent to the
river (e.g. TC11) closely match observed trends, with well
6.46
(7.89)
7.51
7.385.97
4.00
3.15
2.68
6.526.14
6.41
2.20
1.51
1.78
1.852.43
5.34
4.38
3.99
2.122.26
2.22
2.44
4.01
3.44
1.80
August 18, 2005 February 16, 20064 m 5 m
6 m
7 m
4 m
3 m
2 m
Mekong Mekong
(4.37)(3.99)
(3.93)(5.59)(5.67)
(5.66)
Fig. 5. Map view of hydrau lic heads in wells (open cir cles) and sur face water lev els (open tri an gles) on August 18, 2005 (wet sea son) and Feb ru ary 16, 2006
(dry sea son). Num bers indi cate heads in medium depth aqui fer wells (20–30 m), while those in paren the ses indi cate sur face water lev els. Units reported
in mASL. Dashed lines indi cate hand-con toured lines of equi po ten tial, with arrows indi cat ing the direc tion of the hor i zon tal ground wa ter gra di ent.

S.G. Ben ner et al. / Applied Geochemistry 23 (2008) 3072–3087 3079
lev els show ing nearly iden ti cal pat terns to those in the
river. At loca tions fur ther from the river (TC31 and TH51),
the sim u lated trends match the approx i mate 1 m decline
observed in high water peak mag ni tude. At about a half of
the more dis tal wells (TC51, TC45, TH71), the model under-
pre dicts the degree of atten u a tion. The model results are
able to cap ture partial atten u a tion of the dis tinct spike in
July on the river hyd ro graph (see arrow in Fig. 4); fur ther
con firm ing the dom i nant role the river plays in dic tat ing
sea sonal trends in ground wa ter lev els.
The daily-scale tidal sim u la tions repro duce the gen eral
observed trends with sim i lar mag ni tudes in peak heights
near to the river and almost com plete atten u a tion at more
dis tal wells (TC31). Like the sea sonal trends, the tidal sim u-
la tions bet ter emu late trends closer to the river.
Impor tantly, the two-dimen sional tran sient model is
equally suc cess ful match ing well trends along multiple
tran sects (Fig. 8), with dis tance-from-the-river being suf -
cient to obtain sim u la tion results sim i lar to those observed
in the field, con firm ing the assump tion that flow is dom i-
nantly per pen dic u lar to the river. Sim i larly, the model is
able to repro duce trends in water lev els observed in wells
adja cent to the Bas sac (BD11), sup port ing the assump tion
of sym me try with respect to the zone between the two
riv ers.
Tran sient model results shown in spa tially dis trib uted,
cross-sec tional for mat, also exhibit gen eral agree ment
with observed trends (com pare Figs. 6 and 10). The model
cap tures the ground wa ter flow direc tion and the net gra-
di ent between the river and wet lands, but it is less suc-
cess ful at cap tur ing the tran sient spa tial dis tri bu tion of
the gra di ent; the model results for August 18th over es ti-
mate head-drop across the clay.
3.8. Net annual flow sim u la tion
Using the net annual head dif fer ences cal cu lated from
the field data and the hydrau lic con duc tiv ity val ues deter-
mined in the tran sient model, a sim u la tion of the net
annual flow field was obtained (Fig. 11). In this sim u la tion,
the observed rel a tive head loss across the clay and sand
is con sis tently repro duced. As illus trated by the sim u lated
flow lines, water flows ver ti cally down wards through the
clay and nearly hor i zon tally through the aqui fer to the
river. Note that the sim u lated results are pre sented with
approx i mate ver ti cal exag ger a tion of 16 times, which visu-
ally empha sizes the lim ited ver ti cal com po nent of flow in
the sand. The flow veloc i ties and travel times along the
flow lines within the sim u la tion are shown in Tables 3 and
4. Sim u lated travel times through the clay are on the order
of 250 a, while travel times across the aqui fer vary from
600 a for the most dis tal flow lines to less than 140 a for
those close to the river. There fore, total travel times from
the wet land to the river range from about 400–900 a, val-
ues con sis tent with those from mass flux cal cu la tions.
These flow veloc i ties and res i dence times are remark ably
-50 m
10 m
-20 m
0 m
-30 m
-40 m
3000 m 2000 m 1000 m 0 m
3000 m 2000 m 1000 m 0 m
TC
21
TC
11
TC
31
TC
51
TC
45
2.69
2.75
4.9
4.95
6.145.89
5.216.43
6.543.15
5 m
4 m3m 6 m
Mekong7.89 mAugust 18th
2006
7 m
Wetland 4.00 m
-50 m
10 m
-20 m
0 m
-30 m
-40 m
TC
21
TC
11
TC
31
TC
51
TC
45
3 m
Mekong`1.50 m
2 m
Wetland 5.60 m
3.99
3.99
5.63
2.20
2.20
2.20
3.02
1.80
2.265.42
2.124.385 m
February 16th
2006
4 m
Fig. 6. Cross-sec tional view (along tran sect depicted in Fig. 1) of hydrau lic heads in wells and sur face waters on August 18, 2005 and Feb ru ary 16, 2006,
illus trat ing sea sonal shifts in gra di ents. Open cir cles indi cate well screen loca tions, and asso ci ated head val ues are in mASL. Dashed lines indi cate hand-
con toured lines of equal potential. Note that despite the ver ti cal exag ger a tion, cross-sec tions are to scale.

3080 S.G. Ben ner et al. / Applied Geochemistry 23 (2008) 3072–3087
sim i lar to those esti mated by ide al ized flow mod el ing
in Ban gla desh of 300 a to travel over 1000 m under pre-
pump ing con di tions (BGS and DPHE 2001).
3.9. Model uncer tainty and util ity
Given the ide al ity of the numer i cal model, it pro duces
a remark ably good fit to observed sea sonal and daily-tidal
trends. Impor tantly, how ever, the mod el ing results remain
under-con strained. In par tic u lar, the uncer tainty regard-
ing aqui fer stor ativ i ty val ues, which strongly influ ence
the tran sient sim u la tions, pre clude the use of the flow
mod el ing to mark edly improve esti mates of aqui fer res-
i dence times over those cal cu lated using flux esti mates.
The sim u lated flow lines are, how ever, inde pen dent of
stor ativ i ty val ues and are pri mar ily dic tated by the ratio
of clay to sand hydrau lic con duc tiv i ties (a ratio well-con-
strained within the sim u la tions). There fore, the flow lines
plot ted in Fig. 11 pro vide a sound esti mate of the over all,
generalized net sea sonal flow direc tion.
It is par tic u larly note wor thy that flow lines within the
clay are nearly ver ti cal, while flow lines within the aqui-
fer are nearly hor i zon tal. This flow geom e try sug gests that
track ing changes in chem is try along a ver ti cal pro file will
be most effec tive within the upper 5–20 m of clay at this
site. As those flow lines enter the under ly ing aqui fer and
are refracted to the hor i zon tal, the uncer tainty regard-
ing indi vid ual flow paths increases. There fore, within the
Transient WetlandBoundary
Transient RiverBoundary
No flow Boundary
No
Flo
w B
ound
ary
No F
low B
oundary
60 m
TC 11TC 21TC 21TC 45TC 45TC 51TC 51 TC 31TC 31
ClaySand
4000 m
TC 11
Time (d)50 150 250 350 450
Time (d)50 150 250 350 450
Time (d)50 150 250 350 450
Time (d)50 150 250 350 450
Time (d)50 150 250 350 450
Hyd
raul
ic H
ead
(m)
-2
0
2
4
6
8
10
Hyd
raul
ic H
ead
(m)
-2
0
2
4
6
8
10
Hyd
raul
ic H
ead
(m)
-2
0
2
4
6
8
10
Hyd
raul
ic H
ead
(m)
-2
0
2
4
6
8
10H
ydra
ulic
Hea
d (m
)
-2
0
2
4
6
8
10
ObservedSimulated
TC 21
ObservedSimulated
TC 31
ObservedSimulated
TC 45
ObservedSimulated
TC 51
ObservedSimulated
Fig. 7. Model cal i bra tion results to the TC well tran sect.

S.G. Ben ner et al. / Applied Geochemistry 23 (2008) 3072–3087 3081
deeper aqui fer it is more appro pri ate to exam ine aqui fer-
scale trends in chem i cal param e ters rather than attempt-
ing to track changes along indi vid ual flow lines.
Uncer tainty regard ing aqui fer thick ness also intro duces
uncer tainty to model results. The base of the aqui fer is esti-
mated to be at 60 m and a num ber of wells at the site were
drilled to depths near that range. There fore, there is a high
degree of con fi dence the aqui fer is not sig nifi cantly more
shal low. The aqui fer may, how ever, be thicker than mod-
eled. Depth to bed rock across the region may be as deep as
160 m. If those depths exist at this site, the primary impact
on model results would be an increase in the aqui fer res-
i dence time and/or an increase in the model-esti mated
aqui fer hydrau lic con duc tiv ity.
While the highly ide al ized approach used to develop
this con cep tual model has proven effec tive at the regional
scale, the local influ ences of hydrau lic het er o ge ne ity
should not be dis counted. Aqui fer sed i ments are often
highly het er o ge neous, and that het er o ge ne ity will often
pro duce com plex vari a tions in spe cific flow line paths,
vari a tions that are not cap tured by this con cep tual model.
The potential impact of such het er o ge ne ity (within the
clay) is dis cussed below.
3.10. Potential influ ence of hydrau lic het er o ge ne ity
For wells TC45, TC51 and TH71, the model over-pre dicts
draw down dur ing the fall ing limb of the hyd ro graph, sug-
Transient WetlandBoundary
Transient RiverBoundary
No flow Boundary
No
Flo
w B
ound
ary
No F
low B
oundary
60 m
TH11BD11TH51 TH71 TH31
Clay
Sand
4000 m
TH 11
Time (d)50 150 250 350 450
Time (d)50 150 250 350 450
Time (d)50 150 250 350 450
Time (d)50 150 250 350 450
Time (d)50 150 250 350 450 550
Hyd
raul
ic H
ead
(m)
-2
0
2
4
6
8
10
Hyd
raul
ic H
ead
(m)
-2
0
2
4
6
8
10H
ydra
ulic
Hea
d (m
)
-2
0
2
4
6
8
10
Hyd
raul
ic H
ead
(m)
-2
0
2
4
6
8
10
Hyd
raul
ic H
ead
(m)
-2
0
2
4
6
8
10
ObservedSimulated
TH 31
ObservedSimulated
TH 51
ObservedSimulated
TH 71
ObservedSimulated
BD 11
ObservedSimulated
Fig. 8. Model cal i bra tion results to the TH and BD well tran sects.

3082 S.G. Ben ner et al. / Applied Geochemistry 23 (2008) 3072–3087
gest ing the lim i ta tions of the ide al ized model for mu la tion.
For TC45, there is also a poor match dur ing and after the
hyd ro graph peak. Due to appre cia ble logis ti cal dif culty in
col lect ing data dur ing flooded con di tions, later time series
data for TC51 and TH71 are quite noisy; how ever at all three
of these sites, which are located prox i mal to one another,
the wells exhibit a sea sonal trend that more closely fol lows
that observed in the over ly ing wet lands (Fig. 3), sug gest-
ing increased influ ence of over ly ing sur face water at these
sites. To eval u ate this pos si bil ity, a model sim u la tion was
per formed in which the clay layer hydrau lic con duc tiv ity
prox i mal to these wells was increased to 6 £ 10¡7 ms¡1, a
change that sim u lates either a thin ning of the clay or an
increase in the hydrau lic con duc tiv ity at this loca tion (clay
win dow, Figs. 12 and 13). This sim u la tion pro duces results
that improve the fit with the observed data in these three
wells, indi cat ing that spa tial vari a tions in the clay thick-
ness or hydrau lic con duc tiv ity may explain sea sonal trends
in these wells and may be an impor tant fea ture of delta
ground wa ter flow sys tems, a trend con sis tent with Har-
vey et al. (2006). Impor tantly, these sim u la tions indi cate
that the local ized zone of increased recharge influ ences
wells some dis tance away (TC51 is almost 1000 m inland
of the sim u lated high con duc tiv ity clay win dow), with a
greater rel a tive influ ence on inland wells. This sim u la tion
also high lights how pref er en tial recharge can have a dis-
Fixed Head WetlandBoundary
Transient RiverBoundary
No flow Boundary
No
Flo
w B
ound
ary
No F
low B
oundary60 m
TH11
Clay
Sand
4000 m
TC 11TC 31TC 31
TC 11
Time (min)
0 1000 2000 3000
Time (min)
0 1000 2000 3000
Time (min)
0 1000 2000 3000
Hyd
raul
ic H
ead
(m)
4.1
4.2
4.3
4.4
4.5
Hyd
raul
ic H
ead
(m)
4.1
4.2
4.3
4.4
4.5
Hyd
raul
ic H
ead
(m)
4.1
4.2
4.3
4.4
4.5
MekongObserved WellSimulated Well
TH 11 MekongObserved WellSimulated Well
TC 31 MekongObserved WellSimulated Well
Fig. 9. Model cal i bra tion results to tidal fluc tu a tions at TC11, TH11 and TC31. Each sim u la tion was per formed with the plot ted Me kong data as a tran sient
bound ary con di tion and a fixed head wet land bound ary. For clar ity, all data was nor mal ized to the same ini tial hydrau lic head value of approx i mately
4.3 m.

S.G. Ben ner et al. / Applied Geochemistry 23 (2008) 3072–3087 3083
pro por tion ate influ ence on flow in the sub sur face; much
of the aqui fer water in this sim u la tion ema nates from the
‘clay win dow’. The pres ence of a clay win dow also reduces
aver age aqui fer res i dence times.
3.11. Link ing chem is try and net annual flow
Map ping the sim u lated net annual flow field on As con-
cen tra tions across the aqui fer (Fig. 14) pro vides insights on
the flow-chem is try rela tion ships, although cau tion should
River Boundary7.93 m
Wetland Boundary 3.95 m
No flow
boundary
No flow boundary
No
flow
bou
nda
ry
4 m
7 m6 m
5 m
River Boundary1.51 m
Wetland Boundary 5.41 m
No flow
boundary
No flow boundary
No
flow
bou
ndar
y
2 m3 m
4 m5 m
August 18th
February 16th
Fig. 10. Sim u lated hydrau lic head dis tri bu tion for August 18th, 2005 and Feb ru ary 16th, 2006. Com pare to observed field val ues in Fig. 6.
No flow
boundary
No flow boundary
No
flow
bou
ndar
y
Wetland Boundary (5.5 m MASL) River Boundary(4.0 m MASL)
Sand K=3.5 x 10⁻⁴ m sec-1
Clay K=1.0 x 10⁻⁸ m sec-1
a b c d e f
Fig. 11. Sim u lated flow field for net annual flow. Sim u lated travel times along each flow line are shown in Table 4.
Table 3
Net annual ver ti cal and hor i zon tal ground wa ter flow veloc i ties
Ver ti cal flow Hor i zon tal flow
Min i mum (K = 10¡8 ms¡1) Max i mum (K = 10¡7 ms¡1) Min i mum (K = 10¡4 ms¡1) Max i mum (K = 10¡3 ms¡1)
Aver age net flow veloc ity
(ma¡1)
0.04 0.43 1.3 13
Stan dard devi a tion (m) 0.003 0.034 0.87 8.8
Num ber of cal cu la tions 3 3 5 5
Table 4
Sim u lated travel times for flow paths in Fig. 11
Flow paths Travel time (a)
Clay Sand Total
a 285 604 889
b 285 431 716
c 281 307 588
d 272 215 487
e 261 136 398
f 248 70 319

3084 S.G. Ben ner et al. / Applied Geochemistry 23 (2008) 3072–3087
be used given the ide al ized nature of the flow sim u la tions.
Along nearly all sim u lated flow paths there is an increase
in As con cen tra tions with dis tance (age). The steep est gra-
di ents in As con cen tra tions are, how ever, observed along
the ver ti cal flow lines down wards across the sur fi cial clay
sed i ments (con cen tra tions increase from <1 to 500 lg L¡1
over a dis tance of 10 m), and the high est As con cen tra tions
within the shal low pore water appear to ema nate from
aban doned chan nel pond wet lands. Detailed pro files fur-
ther dem on strat ing gra di ents in As con cen tra tions across
the first 10 m of the flow path are pro vided and dis cussed in
detail in Ko car et al. (2008). Increases in As con cen tra tions
along ver ti cal pro files within the clay can be inter preted
to reflect increases in As con cen tra tions along a flow path.
In con trast, within the aqui fer, where flow is pri mar ily
hor i zon tal, ver ti cal sam pling pro files will cap ture waters
trav el ing along dis pa rate flow paths with poten tially very
dif fer ent ori gins and geo chem i cal his to ries.
Given the esti mated aqui fer res i dence times, the deeper
portion of the aqui fer con tains water that may be up to
1 ka and may reflect pro cesses that occurred at some dis-
tal loca tion under con di tions that may no longer be oper a-
TC 11
Time (d)50 150 250 350 450
Time (d)50 150 250 350 450
Time (d)50 150 250 350 450
Time (d)50 150 250 350 450
Time (d)50 150 250 350 450
ObservedSimulation ASimulation B
TC 21
ObservedSimulation ASimulation B
TH 71
ObservedSimulation ASimulation B
TC 45
ObservedSimulation ASimulation B
TC 51
ObservedSimulation ASimulation B
Hyd
raul
ic H
ead
(m)
-2
0
2
4
6
8
10
Hyd
raul
ic H
ead
(m)
-2
0
2
4
6
8
10
Hyd
raul
ic H
ead
(m)
-2
0
2
4
6
8
10
Hyd
raul
ic H
ead
(m)
-2
0
2
4
6
8
10H
ydra
ulic
Hea
d (m
)
-2
0
2
4
6
8
10
Fig. 12. Sim u la tions with ‘clay win dow’ (dashed) and with out (solid line) com pared to observed trends (dia mond sym bols).
No flow
boundary
No flow boundary
No
flow
bou
ndar
y
Wetland Boundary (5.5 m MASL) River Boundary(4.0 m MASL)
Sand K=3.5 x 10⁻⁴ m sec-1
Clay K=1.0 x 10⁻⁸ m sec-1
Fig. 13. Sim u lated flow field for net annual flow with ‘clay win dow’ (ver ti cal hashed area, K = 6 £ 10¡7 ms¡1). Diag o nal hashed area rep re sents water enter-
ing the aqui fer through the ‘clay win dow’.

S.G. Ben ner et al. / Applied Geochemistry 23 (2008) 3072–3087 3085
tional today. There fore, appli ca tion of the model to trends
in the deeper (and older) flow sys tem evokes sig nifi cant
uncer tainty. For exam ple, at the base of the aqui fer near
the mid dle of the pro file, water con tain ing highly ele vated
As con cen tra tions (>1000 lg L¡1) is observed. Accord ing
to the con cep tual model, this water entered that aqui fer
as recharge in the wet lands 1000 s of meters inland and
100 s of years ago and release from the sed i ments may
have occurred at any loca tion along that flow path. These
obser va tions sug gest that the great est cer tainty regard ing
the link ages between flow paths and pro cesses lead ing to
As release from sed i ments exists in the youn gest waters
flow ing down wards through the sur fi cial clay sed i ments.
Tem po ral mon i tor ing of ground wa ter As con cen tra-
tions indi cates that sea sonal var i a tion is only observed in
the zone of net recharge (shal low wells in the clay) and the
zone of net dis charge (at the bound ary with the river). In
the zone of recharge, the high est As con cen tra tions were
observed dur ing strong down ward flow, while near the
river, As con cen tra tions decline when river lev els are ris-
ing and river water is flow ing into the aqui fer (Po lizz ot to
et al., 2008). These trends are con sis tent with the pro posed
flow model and are indic a tive of rel a tively con ser va tive As
trans port within the aqui fer.
Het er o ge ne ity in the dis tri bu tion of the sur fi cial clay
would have a poten tially com plex influ ence on As dis tri bu-
tion in the aqui fer. Assum ing As release is pri mar ily from
near-sur face sed i ments, and if the release of As to the pore
water is rate-lim ited rel a tive to the change in infil tra tion
veloc ity, a clay win dow could act to dilute aqui fer waters
(as pro posed by van Geen et al., 2006). Alter na tively, if the
infil trat ing waters also pro mote higher rates of As release
(e.g. by pro vid ing a source of labile organic C), As con cen-
tra tions in the infil trat ing waters from the clay win dow
would remain high and could be the dom i nant source of
As to the aqui fer.
3.12. Com par i son with obser va tions at other sites
Locally unique char ac ter is tics indi cate that care
should be taken when attempt ing to com pare or con trast
results from dif fer ent research sites across the del tas
of Asia. How ever, As-rich del taic ground wa ters of Asia
share sim i lar geo logic his tory, topog ra phy, gross stra-
tig ra phy and dom i nant nat u ral hydro logic driv ers. All of
these aqui fers are located on mas sive del taic sequences
depos ited over the last 10 ka. As del taic sys tems, aqui fer
mate ri als were sim i larly depos ited and are com posed of
sim i lar grain size dis tri bu tions. At most sites through out
the del tas of Asia the aqui fer mate ri als are char ac ter-
ized as fine to medium grained sands with inter-bed ded
clays; most aqui fers are capped by fine-grained silts and
clays of vary ing thick ness. All these del taic aqui fer sys-
tems are located beneath sub dued, and often inverted,
topog ra phy. Levees adja cent to the riv ers are typ i cally the
ele va tion high point with inland wet land basins extend-
ing outward from the river levee sys tem. The sub dued
topog ra phy, cou pled with the low gra di ent of the river
sys tem, pro duces very low regional hydrau lic gra di ents
dic tated by the ele va tion of the land sur face rel a tive to
the dis tant ocean. In con trast, all the riv ers of the Asia
del tas undergo large sea sonal vari a tions in water lev els
(5–10 m) and, in the absence of sig nifi cant ground wa ter
extrac tion, these sea sonal fluc tu a tions strongly influ-
ence ground wa ter flow.
Direct quan ti ta tive com par i sons of hydrol ogy between
del tas are lim ited. How ever, hydrau lic con duc tiv ity val ues
for both the sand and clay at this site are remark ably sim i-
lar to those observed in Ban gla desh (BGS and DPHE, 2001).
The ide al ized flow-mod eled veloc ity esti mates for pre-
pump ing con di tions in Ban gla desh, are nearly iden ti cal to
those obtained for the pres ent field area (BGS and DPHE,
2001; Har vey et al., 2006). Fur ther more, recent obser va-
tions on the Red River, where the over ly ing clay layer is
also thick, sim i larly exhibit increas ing As con cen tra tions
over the clay pro file (Berg et al., 2008).
Given these sim i lar i ties, the first-order hydro logic
char ac ter is tics observed on the upper Me kong Delta may
pro vide a basis for under stand ing con di tions on other del-
tas of Asia prior to anthro po genic dis rup tion of the flow
sys tems. In par tic u lar, the ini tial con di tion of ground wa-
ter flow from wet lands towards the river may prove to
be a use ful assump tion when assess ing the cur rent com-
plex, irri ga tion-influ enced, flow sys tems observed at
many sites.
An impor tant caveat is that, while the hydro logic
driv ers of ris ing and fall ing riv ers cou pled with sea sonal
flood ing of wet lands are sim i lar, the amount of sur fi cial
clay across the Asian del tas var ies dra mat i cally, with some
sites in Ban gla desh report ing <1 m of clay com pared to
m 0m 0001m 0002m 0003
0 m
-50 m
10 m
-20 m
-30 m
-40 m
0 m
-50 m
10 m
-20 m
-30 m
-40 m
-50 m
10 m
-20 m
0 m
-30 m
-40 m
-50 m
10 m
-20 m
0 m
-30 m
-40 m
-50 m
10 m
-20 m
0 m
-30 m
-40 m
wetlands ponds Mekong(0-100)
(100-400)
(400-850) (>850)
Fig. 14. Sim u lated flow field for net annual flow (with out clay win dow) over lain with As con cen tra tions. Arsenic con cen tra tions are shown as shaded con-
tours, and val ues in paren the ses indi cate range of inter vals in lg L¡1.

3086 S.G. Ben ner et al. / Applied Geochemistry 23 (2008) 3072–3087
up to 20 m on the Me kong Delta. Given the sen si tiv ity of
the flow sys tem to the per me abil ity (or thick ness) of the
clay aqui tard, this may be a key param e ter that dif fer en-
ti ates flow behav ior at sites across the del tas of Asia. Clay
thick ness has a par tic u larly strong influ ence on aqui fer res-
i dence time and the degree of ver ti cal flow. In addi tion,
spa tial het er o ge ne ity in clay thick ness, likely to be more
dra matic when the clay unit is thin ner, will pro duce pref-
er en tial infil tra tion, a phe nom e non doc u mented to impact
As dis tri bu tion in Ban gla desh where the upper clay layer
is some times absent (van Geen et al., 2006; Stute et al.
2007).
4. Sum mary and con clu sions
The pre sented regional-scale hydro logic model has
been cal i brated against an exten sive field-col lected data-
set and pro vides an inter nally-con sis tent model of water
flow within the field area. The model con strains the net
annual flow direc tion and indi cates water flows down-
wards from wet lands through the clay aqui tard and hor i-
zon tally to dis charge at the river. Impor tantly, this model
pro vides a phys i cal frame work with which to inter pret
spa tially dis trib uted ground wa ter chem i cal data in the
con text of evolv ing com po si tion over time and dis tance.
Accord ingly, observed increases in As along flow paths at
this site are great est within the ver ti cal zone of recharge,
indi cat ing the impor tance of the shal low sed i ments as a
source of As to the aqui fer.
In a com pan ion pub li ca tion (Ko car et al., 2008), it is pro-
posed that aban doned chan nel ponds may be par tic u larly
impor tant sources of bio geo chem i cal As release. Indeed,
As con cen tra tion pro files align with mod eled flow lines
and the high est As con cen tra tions through out the aqui fer
are found along flow lines ema nat ing from the ponds. The
hydrau lic behav ior of wells TC45, TC51 and TH71, all prox-
i mal to but inland from the aban doned chan nel ponds,
sug gests the ponds may also pro duce zones of pref er en tial
recharge, poten tially due to the pres ence of sur fi cial depos-
its that are thin ner or more con duc tive. Such a unique
com bi na tion of bio geo chem i cal and phys i cal-hydro logic
prop er ties of aban doned chan nel ponds may con spire to
pro duce both high rates of As release and high rates of
recharge, poten tially deliv er ing much of the As observed
in the sub sur face.
Acknowl edge ments
This work was sup ported by the EVP pro gram of Stan-
ford’s Woods Insti tute for the Envi ron ment, two US. EPA
STAR grad u ate fel low ships, the Stan ford NSF Envi ron men-
tal Molec u lar Sci ences Insti tute (NSF-CHE-0431425), and
the Boise State Uni ver sity New Fac ulty Devel op ment
Fund. We appre ci ate the assis tance from Tom Clemo
(mod el ing), Monty Bus bee (sed i ment cor ing), Molly
Meyer (sur vey ing), Rebecca Neu mann (field assis tance),
Amna Aziz (hydrau lic con duc tiv ity deter mi na tion) and
the RDI staff (data col lec tion). We would like to extend
a thank you to our edi tor (David Polya) and review ers
(John Tel lam, Wil liam Bur gess, anon y mous) for their
help ful com ments.
Ref er ences
Berg, M., Sten gel, C., Trang, P.T.K., Viet, P.H., Samp son, M.L., Leng, M., Sam-reth, S., Fred er icks, D., 2007. Mag ni tude of arsenic pol lu tion in the Me kong and Red River Del tas – Cam bo dia and Viet nam. Sci. Total Envi-ron. 372, 413–425.
Berg, M., Trang, P.T.K., Sten gel, C., Bus ch mann, J., Viet, P.H., Van Dan, N., Giger, W., Stü ben, D., 2008. Hydro log i cal and sed i men tary con trols lead ing to arsenic con tam i na tion of ground wa ter in the Ha noi area, Viet nam: the impact of iron–arsenic ratios, peat, river bank depos its, and exces sive ground wa ter abstrac tion. Chem. Geol. 249, 91–112.
Brit ish Geo logic Sur vey and Depart ment of Pub lic Health Engi neer ing (BGS and DPHE), 2001. Arsenic Con tam i na tion of Ground wa ter in Ban gla desh, Key worth, UK.
Bus ch mann, J., Berg, M., Sten gel, C., Samp son, M.L., 2007. Arsenic and man-ga nese con tam i na tion of drink ing water resources in Cam bo dia: coin-ci dence of risk areas with low relief topog ra phy. Envi ron. Sci. Tech nol. 41, 2146–2152.
Dome nic o, P.A., Sch wartz, F.W., 1998. Phys i cal and Chem i cal Hy drog e ol-o gy. John Wiley, New York.
Flec ken stein, J.H., Nis won ger, R.G., Fogg, G.E., 2006. River-aqui fer inter-
ac tions, geo logic het er o ge ne ity, and low-flow man age ment. Ground Water 44, 837–852.
Har vey, C.F., Swartz, C.H., Bad ruzz aman, A.B.M., Keon-Blute, N., Yu, W., Ali, M.A., Jay, J., Bec kie, J.R., Nie dan, V., Brab an der, D., Oates, P.M., Ashf aque, K.N., Islam, S., He mond, H.F., Ahmed, M.F., 2002. Arsenic mobil ity and ground wa ter extrac tion in Ban gla desh. Sci ence 298, 1602–1606.
Har vey, C.F., Ashf aque, K.N., Yu, W., Bad ruzz aman, A.B.M., Ali, M.A., Oates, P.M., Michael, H.A., Neu mann, R.B., Bec kie, R., Islam, S., Ahmed, M.F., 2006. Ground wa ter dynam ics and arsenic con tam i na tion in Ban gla-desh. Chem. Geol. 228, 112–136.
Hvors lev, M.J., 1951. Time Lag and Soil Per me abil ity in Ground wa ter Obser va tions. US Army Corps of Engi neers Water way Exper i men tal Sta tion, Vicks burg, Miss.
Islam, F.S., Ga ult, A.G., Booth man, C., Polya, D.A., Char nock, J.M., Chat ter-jee, D., Lloyd, J.R., 2004. Role of metal-reduc ing bac te ria in arsenic release from Ben gal delta sed i ments. Nature 430, 68–71.
JICA, 2002. Assess ment of Ground wa ter Resources in Cam bo dia, Koku sai Ko gyo Co., Ltd.
Klump, S., Kip fer, R., Cir pka, O.A., Har vey, C.F., Brenn wald, M.S., Ashf aque, K.N., Bad ruzz aman, A.B.M., Hug, S.J., Im bo den, D.M., 2006. Ground wa-ter dynam ics and arsenic mobi li za tion in Ban gla desh assessed using noble gases and tri tium. Envi ron. Sci. Tech nol. 40, 243–250.
Ko car, B.D., Po lizz ot to, M.L., Ben ner, S.G., Samp son, M., Fen dorf, S., 2008. Bio geo chem i cal and depo si tional con trols on arsenic mobil ity within sed i ments of the Me kong Delta. Appl. Geo chem. (This vol ume).
Koni kow, L.F., Neu zil, C.E., 2007. A method to esti mate ground wa ter deple tion from con fin ing lay ers. Water Re sour. Res. 43, doi:10.1029/2006WR00559.
Kre sic, N., 1997. Quan ti ta tive Solu tions in Hy drog e ol o gy and Ground wa-ter Mod el ing. CRC, Boca Raton.
Mast er son, J.P., Ga rab e dian, S.P., 2007. Effects of sea-level rise on ground-wa ter flow in a coastal aqui fer sys tem. Ground Water 45, 209–217.
McDon ald, M.G., Harb augh, A.W., 1988. A mod u lar three-dimen sional finite-dif fer ence ground wa ter flow model. US Geol. Surv. Tech. Water-Re sour. Invest. 34 (Book 6), 586, (Chap ter A1).
McAr thur, J.M., Baner jee, D.M., Hud son-Edwards, K.A., Mish ra, R., Puro hit, R., Rav ens croft, P., Cro nin, A., Ho warth, R.J., Chat ter jee, A., Taluk der, T., Lowry, D., Hough ton, S., Cha dha, D.K., 2004. Nat u ral organic mat ter in sed i men tary basins and its rela tion to arsenic in anoxic ground wa ter: the exam ple of West Ben gal and its world wide impli ca tions. Appl. Geo chem. 19, 1255–1293.
Ngu yen, V.L., Ta, T.K.O., Tatei shi, M., 2000. Late holo cene depo si tional envi ron ments and coastal evo lu tion of the Me kong River Delta, South-ern Viet nam. J. Asian Earth Sci. 18, 427–439.
Nick son, R.T., McAr thur, J.M., Rav ens croft, P., Bur gess, W.G., Ahmed, K.M., 2000. Mech a nism of arsenic release to ground wa ter, Ban gla desh and West Ben gal. Appl. Geo chem. 15, 403–413.
Po lizz ot to, M.L., Har vey, C.F., Sut ton, S.R., Fen dorf, S., 2005. Pro cesses con-du cive to the release and trans port of arsenic into aqui fers of Ban gla-desh. Proc. Nat. Acad. Sci. USA 102, 18819–18823.
Po lizz ot to, M.L., Ko car, B.D., Ben ner, S.G., Samp son, M., Fen dorf, S., 2008. Near-sur face wet land sed i ments as a source of ar sen ic release to ground water in Asia. Nature 454, 505–508.
Polya, D.A., Ga ult, A.G., Di eb e, N., Feld man, P., Ro sen boom, J.W., Gil li gan, E., Fred er icks, D., Mil ton, A.H., Samp son, M., Row land, H.A.L., Lyth goe, P.R., Jones, J.C., Mid dle ton, C., Cooke, D.A., 2005. Arsenic haz ard in shal low Cam bo dian ground wa ters. Miner. Mag. 69, 807–823.

S.G. Ben ner et al. / Applied Geochemistry 23 (2008) 3072–3087 3087
Post ma, D., Lar sen, F., Hue, N.T.M., Duc, M.T., Viet, P.H., Nhan, P.Q., Jes sen, S., 2007. Arsenic in ground wa ter of the Red River flood plain, Viet nam: con trol ling geo chem i cal pro cesses and reac tive trans port mod el ing. Geo chim. Cos mo chim. Acta 71, 5054–5071.
Rav ens cort, P., Bur gess, W.G., Ahmed, K.M., Bur ren, M., Per rin, J., 2005. Arsenic in ground wa ter of the Ben gal Basin, Ban gla desh: dis tri bu tion, field rela tions, and hydro log i cal set ting. Hydrol. J. 13, 727–751.
Stute, M., Zheng, Y., Sch los ser, P., Horn eman, A., Dhar, R.K., Ho que, M.A., Sed di que, A.A., Sham sudduha, M., Ahmed, K.M., van Geen, A., 2007. Hydro log i cal con trol of As con cen tra tions in Ban gla desh ground wa ter. Water Re sour. Res. 43, doi:10.1029/2005WR00449 W09417.
Ta, T.K.O., Ngu yen, V.L., Tatei shi, M., Ko bay ash i, I., Tan a be, S., Sa i to, Y., 2002. Holo cene delta evo lu tion and sed i ment dis charge of the Me kong River south ern Viet nam. Qua tern. Sci. Rev. 21, 1807–1819.
Tam ura, T., Sa i to, Y., Si eng, S., Ben, B., Kong, M., Choup, S., Tsuk awaki, S., 2007. Depo si tional facies and radio car bon ages of a drill core from the Me kong River lowland near Phnom Penh, Cam bo dia: evi dence for tidal sed i men ta tion at the time of holo cene max i mum flood ing. J. Asian Earth Sci. 29, 585–592.
Thang ara jan, M., Linn, F., Uhl, V., Ba kaya, T.B., Gab aake, G.G., 1999. Mod el ling an inland delta aqui fer sys tem to evolve pre-devel op-ment man age ment schemes: a case study upper Tha mal a kane River val ley, Botswana, south ern Africa. Envi ron. Geol. 38, 285–295.
van Geen, A., Aziz, Z., Horn eman, A., Wein man, B., Dhar, P.K., Zheng, Y., Good bred, S., Ver steeg, R., Sed di que, A.A., Ho que, M.A., Ahmed, K.M., 2006. Preliminary evi dence of a link between sur face soil prop er ties and the arsenic con tent of shal low ground wa ter in Ban gla desh. J. Geo-chem. Explor. 88, 157–161.