Experimental investigation of gas diffusivity and CO2-binding ...
239
HAL Id: tel-03285120 https://tel.archives-ouvertes.fr/tel-03285120 Submitted on 13 Jul 2021 HAL is a multi-disciplinary open access archive for the deposit and dissemination of sci- entific research documents, whether they are pub- lished or not. The documents may come from teaching and research institutions in France or abroad, or from public or private research centers. L’archive ouverte pluridisciplinaire HAL, est destinée au dépôt et à la diffusion de documents scientifiques de niveau recherche, publiés ou non, émanant des établissements d’enseignement et de recherche français ou étrangers, des laboratoires publics ou privés. Experimental investigation of gas diffusivity and CO2-binding capacity of cementitious materials Mouna Boumaaza To cite this version: Mouna Boumaaza. Experimental investigation of gas diffusivity and CO2-binding capacity of cemen- titious materials. Materials. Université de La Rochelle; Technische Universität (Munich, Allemagne), 2020. English. NNT : 2020LAROS011. tel-03285120
-
Upload
khangminh22 -
Category
Documents
-
view
1 -
download
0
Transcript of Experimental investigation of gas diffusivity and CO2-binding ...

HAL Id: tel-03285120https://tel.archives-ouvertes.fr/tel-03285120
Submitted on 13 Jul 2021
HAL is a multi-disciplinary open accessarchive for the deposit and dissemination of sci-entific research documents, whether they are pub-lished or not. The documents may come fromteaching and research institutions in France orabroad, or from public or private research centers.
L’archive ouverte pluridisciplinaire HAL, estdestinée au dépôt et à la diffusion de documentsscientifiques de niveau recherche, publiés ou non,émanant des établissements d’enseignement et derecherche français ou étrangers, des laboratoirespublics ou privés.
Experimental investigation of gas diffusivity andCO2-binding capacity of cementitious materials
Mouna Boumaaza
To cite this version:Mouna Boumaaza. Experimental investigation of gas diffusivity and CO2-binding capacity of cemen-titious materials. Materials. Université de La Rochelle; Technische Universität (Munich, Allemagne),2020. English. �NNT : 2020LAROS011�. �tel-03285120�

0
Université de La Rochelle - Laboratoire des Sciences de l’Ingénieur pour l’Environnement
And
Technische Universität München - Ingenieurfakultät Bau Geo Umwelt
A thesis submitted to attain the degree of doctor of philosophy
in Civil Engineering
EXPERIMENTAL INVESTIGATION OF GAS DIFFUSIVITY AND CO2-
BINDING CAPACITY OF CEMENTITIOUS MATERIALS
By:
Mouna BOUMAAZA
Defense date: 24th June 2020
Jury
Véronique BAROGHEL-BOUNY Dr. HDR. IFSTTAR Champs sur marne. France Reviewer
Hong WONG Dr. associate professor. Imperial College London UK. Reviewer
Amiri OUALI Prof. Nantes university President of the jury
Nele DE BELIE Prof. Ghent University. Belgium Examiner
Abdelkarim AÏT-MOKHTAR Prof. La Rochelle Université. France Supervisor
Christoph GEHLEN Prof. Technische Universität München. Germany Supervisor
Bruno HUET Dr.Ing. LafargeHolcim Saint Quentin Fallavier. France
Supervisor
Philippe TURCRY Dr. Associate Professor. La Rochelle Université. France
Supervisor

I
PREFACE
This thesis was developed in collaboration (joint-supervision agreement) between the
University of La Rochelle (France), and the Technical University of Munich (Germany). The
financial support came from LafargeHolcim research center (Swiss-French Company) and
l’Association Nationale de la recherche et de la Technologie ANRT (France).
Institution: LafargeHolcim research center.
Doctoral schools: ED618 Euclide La Rochelle University, and Technical University of Munich
Laboratories: Laboratoire des Sciences de l’Ingénieur pour l’Environnement (LaSIE), and
Centrum Baustoffe und Materialprüfung (cbm)
PhD specialty: Civil engineering (Joint PhD).
Advisors:
Prof. Dr-Ing Abdelkarim AÏT-MOKHTAR: La Rochelle University
Dr-Ing Bruno HUET: LafargeHolcim research center
Prof. Dr-Ing Christoph GEHLEN: Technical University of Munich
MCF. Dr-Ing Philippe TURCRY: La Rochelle University

II
ACKNOWLEDGEMENTS
The work behind this dissertation has been possible owing to collaborations, inspiring
discussions, and genuine support from many people, from three different affiliations, and I
would like to express my gratitude to each one of them.
First, deep thanks go to the members of my thesis committee for their time, constructive
advices and valuable feedback on this thesis work.
I would like to express my gratitude to my advisors: Prof. AÏT-Mokhtar, Prof. Gehlen, Dr.
Turcry, and Dr. Huet who provided me extensive professional guidance. Their precious
scientific support was indispensable to the achievement of this research. I am grateful for
having the opportunity to work with passionate researchers; their overwhelming and
encouraging attitude is sincerely appreciated.
This work was supported by a grant from LafargeHolcim innovation Center, and ANRT
(Association nationale de la recherche et la technologie, France). This support is most
gratefully acknowledged. I am also grateful to LafargeHolcim innovation center scientific
committee for initiating and supporting this thesis project. Many thanks and appreciations go to
La Rochelle University for the Mobility scholarship that greatly helped financing my research
stay abroad.
From LafargeHolcim innovation center, I am grateful to my officemates Gérard PHAM, Quentin
OE, Guillaume POMMIER and my friend Bao CHEN for their constant support, for providing a
positive environment of work, for always bringing good mood and for their constant help in all
the laboratory work. A very special gratitude goes to Gabriel PHAM for giving me all personal
and professional support and guidance which made me complete my mission in
LafargeHolcim Innovation center. I am extremely thankful to him for his generous availability
and precious support; he willingly follows the whole process of my thesis work and provides
big help in the laboratory work. Thank you, Cassandre Le Galliard, for spending your
internship helping me with my thesis work, I enjoyed supervising your internship work. My
thanks and appreciation go to all the Durability and Modeling team members especially
Sebastien, Alain, Didier, and Aleth who have always offered their help and support. Thanks to
the staff in the analytical support team for their valuable help.
Big thanks go to my colleagues and friends at cbm institute in TUM for their warm welcome
during my stay in Munich. Thank you, Charlotte, for your nice office company, kind support,
and warm way of sharing your experience and knowledge. Special thanks go to Fabian,
Mareike, Nicolai, Thomas, Danial and Carla for their kindness and friendly welcome at the

III
institute. Thank you, Sylvia, Eduardo, Gregory for fun chats, laughter and coffee sharing. My
sincere thanks go to Prof. Heinz, Dr. Irbe, Dr.Ing Osterminski, and B.Sc. Ph.D. Bedoe for the
helpful and inspiring discussions and suggestions. Also, I would like to thank the Kern center
in TUM for their big help.
Deep thanks to my colleagues at La Rochelle University, where I spent the last period of my
thesis work. Anass, Suelen, Jean-David, Yunlu, and Marwan, thank you for your helpful
advices, kind welcome to the university and fun chats.
A special thanks to the technical and administrative staff for always being helpful and
accommodating when I most needed them: Mrs Sara Scapol (LafargeHoclcim), Dr.-Ing
Annette Spengler and Mrs Francesca Girotti (TUM, cbm), and Mrs Jennifer De La Corte
Gomez and Mrs Isabelle Hirsch (La Rochelle university).
Finally, I would not have managed to finalize this work without the genuine support from my
beloved friends. Thank you for listening to my frustrations and for your full support and love. I
would also like to thank my parents, brother and dear aunt for their love and belief in me. Most
of all, I thank you Yassine for your love, patience, and your everyday reminder of what is really
important to me.
IV
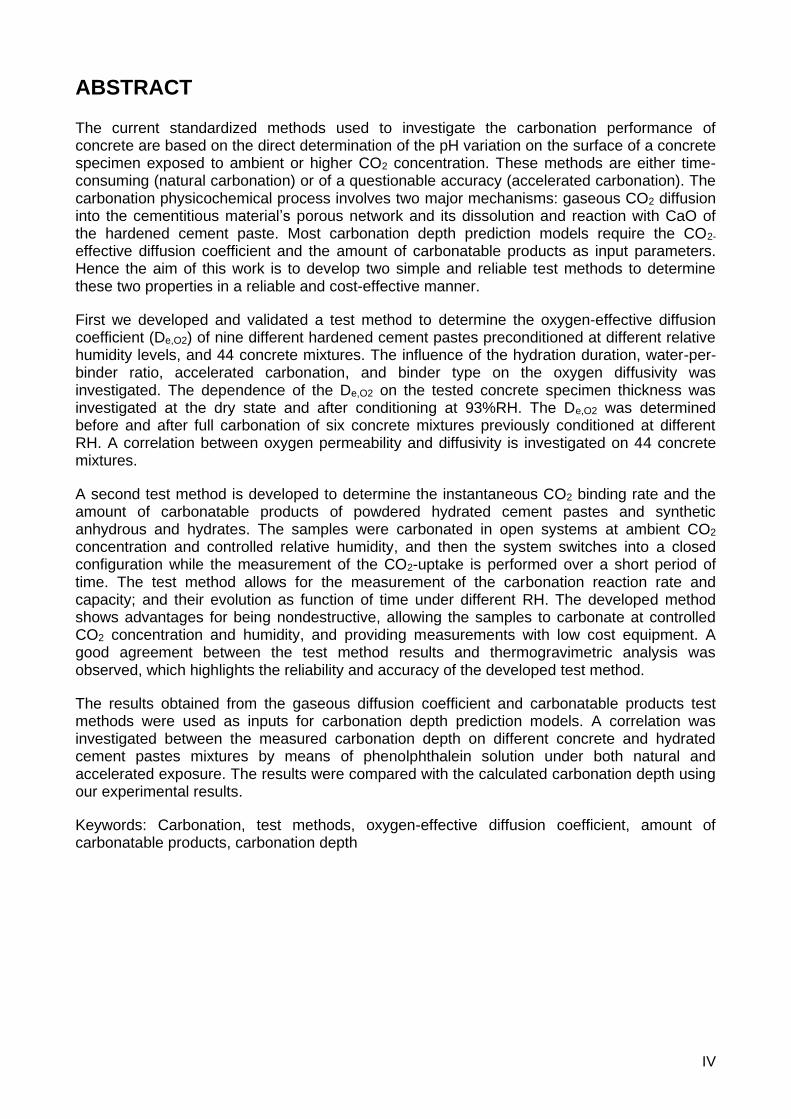
ABSTRACT
The current standardized methods used to investigate the carbonation performance of concrete are based on the direct determination of the pH variation on the surface of a concrete specimen exposed to ambient or higher CO2 concentration. These methods are either time-consuming (natural carbonation) or of a questionable accuracy (accelerated carbonation). The carbonation physicochemical process involves two major mechanisms: gaseous CO2 diffusion into the cementitious material’s porous network and its dissolution and reaction with CaO of the hardened cement paste. Most carbonation depth prediction models require the CO2-
effective diffusion coefficient and the amount of carbonatable products as input parameters. Hence the aim of this work is to develop two simple and reliable test methods to determine these two properties in a reliable and cost-effective manner.
First we developed and validated a test method to determine the oxygen-effective diffusion coefficient (De,O2) of nine different hardened cement pastes preconditioned at different relative humidity levels, and 44 concrete mixtures. The influence of the hydration duration, water-per-binder ratio, accelerated carbonation, and binder type on the oxygen diffusivity was investigated. The dependence of the De,O2 on the tested concrete specimen thickness was investigated at the dry state and after conditioning at 93%RH. The De,O2 was determined before and after full carbonation of six concrete mixtures previously conditioned at different RH. A correlation between oxygen permeability and diffusivity is investigated on 44 concrete mixtures.
A second test method is developed to determine the instantaneous CO2 binding rate and the amount of carbonatable products of powdered hydrated cement pastes and synthetic anhydrous and hydrates. The samples were carbonated in open systems at ambient CO2 concentration and controlled relative humidity, and then the system switches into a closed configuration while the measurement of the CO2-uptake is performed over a short period of time. The test method allows for the measurement of the carbonation reaction rate and capacity; and their evolution as function of time under different RH. The developed method shows advantages for being nondestructive, allowing the samples to carbonate at controlled CO2 concentration and humidity, and providing measurements with low cost equipment. A good agreement between the test method results and thermogravimetric analysis was observed, which highlights the reliability and accuracy of the developed test method.
The results obtained from the gaseous diffusion coefficient and carbonatable products test methods were used as inputs for carbonation depth prediction models. A correlation was investigated between the measured carbonation depth on different concrete and hydrated cement pastes mixtures by means of phenolphthalein solution under both natural and accelerated exposure. The results were compared with the calculated carbonation depth using our experimental results.
Keywords: Carbonation, test methods, oxygen-effective diffusion coefficient, amount of carbonatable products, carbonation depth
V
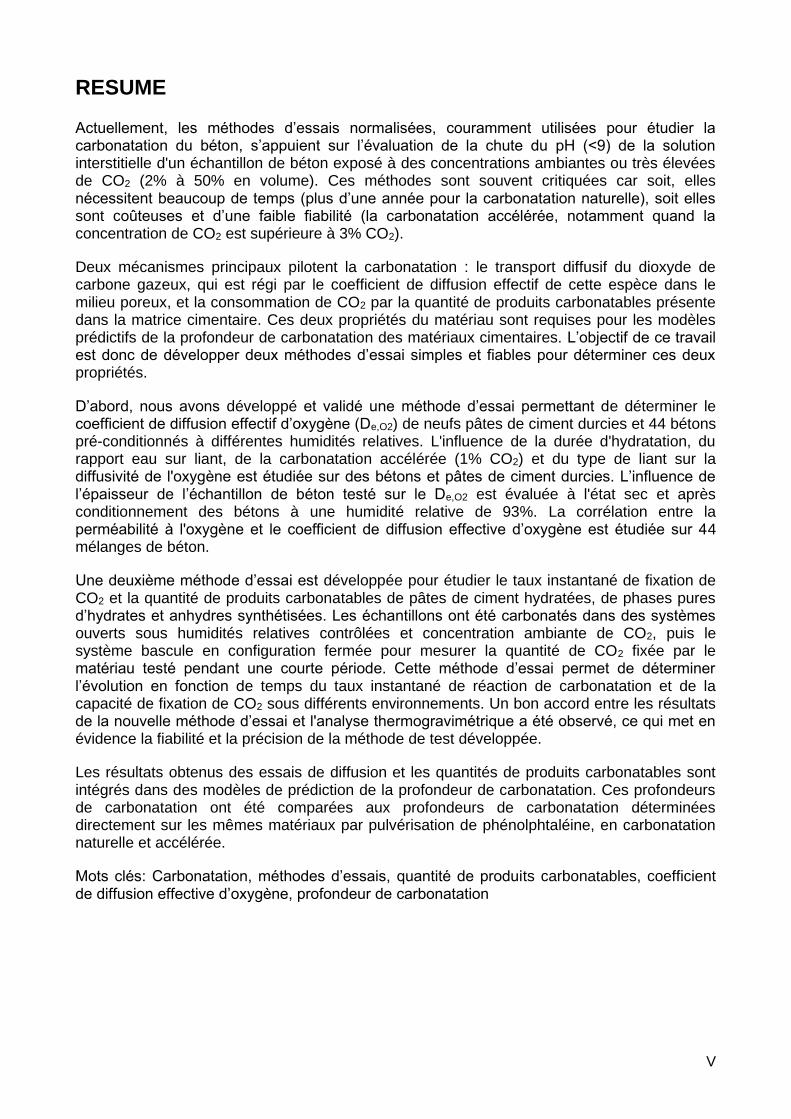
RESUME
Actuellement, les méthodes d’essais normalisées, couramment utilisées pour étudier la carbonatation du béton, s’appuient sur l’évaluation de la chute du pH (<9) de la solution interstitielle d'un échantillon de béton exposé à des concentrations ambiantes ou très élevées de CO2 (2% à 50% en volume). Ces méthodes sont souvent critiquées car soit, elles nécessitent beaucoup de temps (plus d’une année pour la carbonatation naturelle), soit elles sont coûteuses et d’une faible fiabilité (la carbonatation accélérée, notamment quand la concentration de CO2 est supérieure à 3% CO2).
Deux mécanismes principaux pilotent la carbonatation : le transport diffusif du dioxyde de carbone gazeux, qui est régi par le coefficient de diffusion effectif de cette espèce dans le milieu poreux, et la consommation de CO2 par la quantité de produits carbonatables présente dans la matrice cimentaire. Ces deux propriétés du matériau sont requises pour les modèles prédictifs de la profondeur de carbonatation des matériaux cimentaires. L’objectif de ce travail est donc de développer deux méthodes d’essai simples et fiables pour déterminer ces deux propriétés.
D’abord, nous avons développé et validé une méthode d’essai permettant de déterminer le coefficient de diffusion effectif d’oxygène (De,O2) de neufs pâtes de ciment durcies et 44 bétons pré-conditionnés à différentes humidités relatives. L'influence de la durée d'hydratation, du rapport eau sur liant, de la carbonatation accélérée (1% CO2) et du type de liant sur la diffusivité de l'oxygène est étudiée sur des bétons et pâtes de ciment durcies. L’influence de l’épaisseur de l’échantillon de béton testé sur le De,O2 est évaluée à l'état sec et après conditionnement des bétons à une humidité relative de 93%. La corrélation entre la perméabilité à l'oxygène et le coefficient de diffusion effective d’oxygène est étudiée sur 44 mélanges de béton.
Une deuxième méthode d’essai est développée pour étudier le taux instantané de fixation de CO2 et la quantité de produits carbonatables de pâtes de ciment hydratées, de phases pures d’hydrates et anhydres synthétisées. Les échantillons ont été carbonatés dans des systèmes ouverts sous humidités relatives contrôlées et concentration ambiante de CO2, puis le système bascule en configuration fermée pour mesurer la quantité de CO2 fixée par le matériau testé pendant une courte période. Cette méthode d’essai permet de déterminer l’évolution en fonction de temps du taux instantané de réaction de carbonatation et de la capacité de fixation de CO2 sous différents environnements. Un bon accord entre les résultats de la nouvelle méthode d’essai et l'analyse thermogravimétrique a été observé, ce qui met en évidence la fiabilité et la précision de la méthode de test développée.
Les résultats obtenus des essais de diffusion et les quantités de produits carbonatables sont intégrés dans des modèles de prédiction de la profondeur de carbonatation. Ces profondeurs de carbonatation ont été comparées aux profondeurs de carbonatation déterminées directement sur les mêmes matériaux par pulvérisation de phénolphtaléine, en carbonatation naturelle et accélérée.
Mots clés: Carbonatation, méthodes d’essais, quantité de produits carbonatables, coefficient de diffusion effective d’oxygène, profondeur de carbonatation

VI
ZUSAMMENFASSUNG
Die zurzeit verwendeten Methoden zur Untersuchung des Karbonatisierungs-widerstandes von Beton basieren auf der direkten Bestimmung des pH-Wertes der oberflächennahen Betonrandzone, die zuvor einer bestimmten Prüflagerung ausgesetzt war (relative Luftfeuchte, spezifische CO2-Konzentrationen). Diese Methoden sind jedoch entweder sehr zeitaufwändig (natürliche Karbonatisierung) oder von fraglicher Praxisnähe (beschleunigte Karbonatisierung). Der physikalisch-chemische Karbonatisierungsprozess beinhaltet zwei Hauptmechanismen: die Diffusion von gasförmigem CO2 in das poröse Netzwerk des Betons und dessen Auflösung und Reaktion mit CaO der ausgehärteten Zementsteins. Die meisten Modelle zur Vorhersage der Karbonatisierungstiefe erfordern den effektiven CO2-Diffusionskoeffizienten und die Menge an karbonatisierbarer Masse als Eingabeparameter. Ziel dieser Arbeit ist es, zwei einfache und zuverlässige Testmethoden zu entwickeln, um diese beiden Eigenschaften zuverlässig und kostengünstig zu bestimmen.
Nach Entwicklung und Validierung einer geeigneten Testmethode zur Messung von Sauerstoffdiffusionskoeffizienten (De,O2), wurden diese an neun verschiedenen Zementproben gemessen, die bei unterschiedlichen relativen Luftfeuchten vorkonditioniert wurden. Anschließend wurden 44 verschiedene Betonmischungen geprüft. Bei diesen wurde die Hydratationsdauer und der Wasserbindemittelwert variiert. Die Abhängigkeit des Sauerstoffdiffusionskoeffizienten De,O2 von der getesteten Betonprobendicke wurde im trockenen Zustand und nach Konditionierung bei 93% relativer Luftfeuchtigkeit untersucht. Der Sauerstoffkoeffizient De,O2 wurde vor und nach der vollständigen Carbonisierung von sechs Betonmischungen bestimmt, die zuvor bei unterschiedlicher relativer Luftfeuchtigkeit vorkonditioniert worden waren.
Eine zweite Testmethode wurde entwickelt, um die momentane CO2-Bindekapazität und die Menge an karbonatisierbarer Masse aus pulverförmigen Zementhydratpasten und synthetischen wasserfreien Produkten und Hydraten zu bestimmen. Die Proben wurden zunächst in offenen Systemen bei einer CO2-Konzentration in der Umgebung und einer kontrollierten relativen Luftfeuchtigkeit gegeben, um danach dann in eine geschlossene Konfiguration umzuwechseln. So konnte man die CO2-Aufnahme über einen kurzen Zeitraum nachverfolgen. Die Testmethode ermöglicht die Messung der Karbonatisierungsreaktionsrate und –kapazität in Abhängigkeit der Zeit unter verschiedenen relativen Luftfeuchten der Umgebungsluft. Es wurde eine gute Übereinstimmung zwischen den Ergebnissen der Testmethode und der thermogravimetrischen Analyse festgestellt, was die Zuverlässigkeit und Genauigkeit der entwickelten Untersuchungsmethodik unterstreicht.
Die Ergebnisse beider Tests wurden als Input für Vorhersagemodelle für den zeitabhängigen Karbonatisierungsfortschritt von Beton verwendet. Es wurde eine Korrelation zwischen der gemessenen Karbonatisierungstiefe an verschiedenen Beton- und Zementhydratmischungen mittels Phenolphthaleinlösung untersucht, wobei u. a. Karbonatisierungstiefen bestimmt nach natürlicher Lagerung mit berechneten/vorhergesagten Karbonatisierungstiefen, die mithilfe der vorgestellten Modellierung und Inputdaten aus Test miteinander verglichen wurden.
Schlüsselwörter: Karbonatisierung, Testmethoden, Sauerstoffdiffusionskoeffizient, Menge der karbonatisierbaren Masse, Karbonisierungstiefe

VII
TABLE OF CONTENTS
INTRODUCTION .......................................................................................................................1
I. CHAPTER I: THE CARBONATION PROCESS AND ITS CONSEQUENCES ON THE
REINFORCED CONCRETE ......................................................................................................4
1.1 Carbonation physicochemical process ............................................................................................................ 4
Gas diffusivity .................................................................................................................................................... 4
Chemical reaction .............................................................................................................................................. 6
i) Carbonation reaction of the main cement phases ............................................................................... 6
ii) Carbonation products .......................................................................................................................... 8
1.2 Consequences of carbonation ...................................................................................................................... 10
Effect of carbonation on microstructural properties ...................................................................................... 10
i) Total porosity ..................................................................................................................................... 10
ii) Pore size distribution (PSD) ................................................................................................................ 10
Effect of carbonation on other properties ...................................................................................................... 12
i) Water retention capacity ................................................................................................................... 12
ii) Permeability ....................................................................................................................................... 12
Effect of carbonation on the gas diffusivity .................................................................................................... 13
Corrosion initiation ......................................................................................................................................... 14
II. CHAPTER II: STATE OF THE ART ON THE PREDICTION OF THE CARBONATION
RATE ......................................................................................................................................17
2.1 Determination of the carbonation rate from the pH-indicator test .............................................................. 17
2.2 Determination of the carbonation rate from material properties ................................................................ 20
Gas diffusion coefficient .................................................................................................................................. 20
CO2-binding capacity ....................................................................................................................................... 26
2.3 Carbonation rate prediction models ............................................................................................................ 28
Square root of time model .............................................................................................................................. 29
Papadakis’ model ............................................................................................................................................ 30
Gehlen’s model ............................................................................................................................................... 31
III. CHAPTER III: TEST PROTOCOLS AND MATERIALS ................................................35
3.1 Microstructure characterization ................................................................................................................... 35

VIII
Water porosity ................................................................................................................................................ 35
Mercury Intrusion Porosimetry (MIP) ............................................................................................................. 35
Scanning Electron Microscopy (SEM) .............................................................................................................. 35
3.2 Physical properties ....................................................................................................................................... 36
Degree of water saturation ............................................................................................................................. 36
BET surface area .............................................................................................................................................. 37
Helium pycnometry ......................................................................................................................................... 37
Apparent oxygen permeability ........................................................................................................................ 37
3.3 Chemical composition .................................................................................................................................. 38
Thermogravimetric analysis (TGA) .................................................................................................................. 38
X-ray diffraction (XRD) ..................................................................................................................................... 39
3.4 Carbonation tests ......................................................................................................................................... 39
Natural carbonation ........................................................................................................................................ 39
Accelerated carbonation ................................................................................................................................. 40
3.5 Synthetic anhydrous and hydrates ............................................................................................................... 41
3.6 Hardened cement pastes (HCP) .................................................................................................................... 42
3.7 Concrete ...................................................................................................................................................... 43
Concrete mixtures tested to O2 permeability and O2 diffusivity ..................................................................... 46
Concrete mixtures used to investigate the influence of the specimen thickness on De,O2 ............................. 47
Concrete mixtures tested to the influence of accelerated carbonation on De,O2 ............................................ 47
IV. CHAPTER IV: MAIN RESULTS ....................................................................................49
4.1 Gas diffusivity of cementitious materials ..................................................................................................... 49
Test method .................................................................................................................................................... 49
i) The design of the diffusion cell .......................................................................................................... 49
ii) Test method protocol and validation ................................................................................................. 52
iii) CO2 diffusion coefficient vs. O2 diffusion coefficient ......................................................................... 54
Hardened cement pastes diffusivity................................................................................................................ 56
i) Influence of the hydration duration and degree of water saturation on De,O2 .................................. 56
ii) Influence of the water-per-binder ratio on De,O2 ............................................................................... 57
iii) Influence of accelerated carbonation on De,O2 ................................................................................... 57
iv) Influence of the pore size distribution on De,O2 .................................................................................. 59
Concrete diffusivity ......................................................................................................................................... 61
i) Influence of concrete specimen thickness on De,O2 ............................................................................ 61
ii) Influence of accelerated carbonation on De,O2 of concrete ............................................................... 66

IX
iii) Oxygen permeability vs oxygen diffusivity ......................................................................................... 69
4.2 CO2-binding capacity .................................................................................................................................... 71
Test method .................................................................................................................................................... 71
i) Equipment .......................................................................................................................................... 71
ii) Test protocol ...................................................................................................................................... 73
iii) Experimental data analysis ................................................................................................................ 74
CO2 binding capacity of the synthetic cement phases .................................................................................... 75
CO2 binding capacity of hydrated cement pastes ........................................................................................... 79
Comparison with TGA results .......................................................................................................................... 80
V. CHAPTER V: DISCUSSION.............................................................................................82
5.1 Limits and advantages of the developed test methods ................................................................................ 82
Gas diffusion coefficient test method ............................................................................................................. 82
CO2-binding capacity test method ................................................................................................................... 83
5.2 Materials properties .................................................................................................................................... 84
Influence of different parameters on De,O2 ..................................................................................................... 84
CO2-binding capacity and rate at different RH ................................................................................................ 86
5.3 Comparison of experimental results to Millington’s model .......................................................................... 88
5.4 Comparison of experimental results to literature models ............................................................................ 89
Prediction of the HCP carbonation depth ....................................................................................................... 89
Prediction of the concrete carbonation depth ................................................................................................ 92
i) Papadakis’ model ............................................................................................................................... 92
ii) Gehlen’s model .................................................................................................................................. 94
iii) Differences in the carbonation tests protocols .................................................................................. 97
5.5 Comparison between the carbonation test methods ................................................................................... 98
CONCLUSIONS .................................................................................................................... 100
PERSPECTIVES ................................................................................................................... 102
APPENDED DOCUMENTS .................................................................................................. 103
1 PAPER I: A NEW TEST METHOD TO DETERMINE THE GASEOUS OXYGEN
DIFFUSION COEFFICIENT OF CEMENT PASTES AS A FUNCTION OF HYDRATION
DURATION, MICROSTRUCTURE, AND RELATIVE HUMIDITY ......................................... 104

X
2 PAPER II: INFLUENCE OF CARBONATION ON THE MICROSTRUCTURE AND THE
GAS DIFFUSIVITY OF HARDENED CEMENT PASTES...................................................... 127
3 PAPER III: THE CO2-BINDING CAPACITY OF SYNTHETIC ANHYDROUS AND
HYDRATES: VALIDATION OF A TEST METHOD BASED ON THE INSTANTANEOUS
REACTION RATE ................................................................................................................. 152
EXTENDED ABSTRACT IN FRENCH .................................................................................. 181
REFERENCES ...................................................................................................................... 194
APPENDICES ....................................................................................................................... 208

1
Introduction
Concrete structures should fulfill their mechanical and durability functions during the specified
service life without unforeseen costs or repairs. Therefore, concrete must resist to the damage
process to which it is exposed in order to ensure that. Durability problems are caused by either
external harmful species (e.g. chloride ingress, acid attacks, sulfur, carbon dioxide) or internal
reactions within the concrete itself (e.g. alkali aggregate, expansion caused by differed
ettringite formation). Sometimes, concrete structures fail to achieve the specified service life,
or reach it at high cost of repair and maintenance [1].
Carbonation of concrete affects all above ground concrete structures (two-thirds of all concrete
structures [2]). When CO2 diffuses into the concrete structure, it dissolves and reacts with the
phases of the hydrated binder. Carbonation reactions lead to a decrease in the pH and result
in changes in the microstructure and moisture content. The decrease in pH leads to a risk of
corrosion of reinforcing steel. This causes repair and maintenance costs. In the UK alone,
about £20 billion of yearly expenditure [3]. In France, the maintenance and repair costs of a
concrete structure represent 0.25% of the concrete structure building cost [4].
Therefore, carbonation resistance of concrete is a key-property that should be determined with
sufficient accuracy, reliability and efficiency. The correct understanding and determination of
carbonation related properties is not only necessary for the prediction of long-term durability of
reinforced concrete structures, but it is also essential for maintenance and repair works on
existing structures.
Concrete carbonation has a depth progressing from the surface of the concrete inwards. This
depth is currently determined based on different standards [5]. These standards rely on direct
measurements of the pH variation due to carbonation of concrete specimen after a certain
preconditioning period and exposure to a certain concentration of CO2. The carbonation depth
is determined by means of pH-color indicators giving the latter at the limit of the colorless part.
Under natural carbonation exposure (0.04 vol.-% CO2), the test is criticized for being time-
consuming (>1 year). When the specimens are tested under accelerated conditions (1, 3 or 50
vol.-% CO2), the results representativeness of the real carbonation process is questionable.
Furthermore, there is currently no international or European agreement on the pre-conditioning
protocol, the CO2 concentration, and the geometry of the specimens exposed to accelerated
carbonation.

2
Numerous models have been developed to predict the carbonation depth of cementitious
material e.g. [6]. Most of these models require as input parameters the gaseous CO2-effective
diffusion coefficient and the amount of carbonatable products of the hardened cement paste.
Therefore, these properties are of high relevance regarding carbonation. So far, there are no
standardized test methods to determine them. A reliable determination of these two properties
using simple, reliable, time-saving, and cost-effective test methods would facilitate the
validation of the existing models, the prediction of the carbonation depth, and the quality
control of standardized and innovative cementitious materials.
The CO2-effective diffusion coefficient is usually deduced from empirical relationships
determined from tests on mixtures made of Portland cement [7]. The literature is not rich in
experimental studies of gas-diffusion coefficient (relatively to other methods such as
permeability and chloride ingress), and the existing procedures that can be found in the
literature are based on different principles [8], [9], [10]. Thus, the first objective of this work is
to develop an experimental device for determining the gas-effective diffusion coefficient of
different cementitious materials preconditioned at different relative humidity levels. Once
validated, this technique is used to investigate the influence of different parameters on the
gas-effective diffusion coefficient: material composition, hydration duration, degree of water
saturation (relative humidity), accelerated carbonation and concrete specimen size.
The uptake of gaseous carbon dioxide due to the carbonation reaction of calcium-bearing
phases in a cement paste is a parameter controlling the carbonation depth progress within
concrete. The CO2-binding capacity of cementitious materials indicates how much CO2, within
a defined carbonation time, is being taken up. This allows determining the amount of
carbonatable products within the hardened cement paste. This parameter can be theoretically
calculated if the cement composition is known [11]. However, the real amount of carbonatable
products is found to be not in line with these calculations (paper III). The experimental
determination of the real amount of bound-CO2 is currently investigated by means of
expensive devices (e.g. thermogravimetric analysis TGA) or inaccurate measurements (mass
variation). Therefore, the second part of the thesis work focuses on the experimental
investigation of the CO2-binding capacity of the main cement phases and hydrated cement
pastes exposed to natural carbonation under different relative humidity levels. A new method
is proposed, and the results reliability is checked by a comparison to TGA results.
The developed test methods are used to test different binders with Portland cement and
supplementary cementitious materials SCMs such as fly ash, slag, limestone, metakaolin and
silica fume, which is of high importance as the use of supplementary cementitious materials in
the cement industry has become a common practice to reduce the embodied energy and the

3
carbon dioxide emissions of concrete.
This manuscript is divided into five chapters. First, the basics for a better understanding of the
carbonation process and its consequences on different materials’ properties are presented
based on literature findings. The second chapter describes the current state of knowledge on
the carbonation tests based on the pH variation and the microstructural properties
determination. The third chapter gives information on the tested materials and presents the
test methods used to investigate the physical, chemical and microstructural properties of the
tested materials. The fourth chapter presents a detailed description of the developed test
methods that allows for the determination of the oxygen-effective diffusion coefficient and the
CO2-binding capacity. The influence of different parameters (such as relative humidity,
carbonation, hydration duration) on these two properties is presented in detail. The fifth
chapter presents a discussion of the thesis work findings with regards to the literature findings,
gives the limits and advantages of the developed test methods, and analyses of the
experimental data obtained on the tested materials. In this chapter, the carbonation depths
given by two carbonation depth prediction models using our experimental results are
compared to the carbonation depths determined by means of phenolphthalein solution on the
same materials exposed to natural and accelerated carbonation.

4
I. Chapter I: The carbonation process and its
consequences on the reinforced concrete
This chapter gives a description of the physicochemical process of carbonation, the main
mechanisms that control carbonation, and the consequences of carbonation on the
cementitious materials microstructure and transport properties based on previous results from
the literature.
1.1 Carbonation physicochemical process
Carbonation is an irreversible diffusion-reaction process leading to the neutralization of the
pore solution that protects the reinforcement from corrosion [12], [13]. The process includes
the diffusion of CO2 in the gaseous phase into the concrete pores, and its reaction with the
dissolved calcium from some cement phases in the pore solution [14]. Two properties are of
interest with regards to carbonation: the gaseous CO2-effective diffusion coefficient [3], [4],
and the total molar concentration of CaO in the hardened cement paste, in the form of
carbonatable products.
Gas diffusivity
In a porous medium, diffusion-based phenomenon are described by an effective diffusion
coefficient. The effective diffusion coefficient is based on the average cross-sectional area
open to diffusion and the distance traveled by molecules in the porous medium. The latter is
proportional to the self-diffusion coefficient but is reduced by a factor that takes into account
the reduced cross-sectional area (or porosity) available for diffusion, the tortuosity and
constrictivity factors of the pore space.
Fick’s laws are the most popular approach to evaluate gas diffusion. Fick’s first law describes
the correlation between the diffusive flux of a gas component and its concentration gradient:
the rate of transfer of a diffusing substance through unit area of a section is proportional to the
concentration gradient measured normally to the section. The negative sign in this equation
arises because diffusion occurs in the direction opposite to the direction of increasing
concentration [17]. Fick’s second law relates the unsteady diffusive flux to the concentration
gradient. Neglecting the absorption process and the gas solubility in the pore solution [18], and
considering a one dimensional diffusion of gas molecules, these laws can be written as:

5
Fick’s first law: J = −De,g ∂C
∂x Equation 1
Fick’s second law: ∂C
∂t=
∂
∂x(De,g
∂C
∂x) Equation 2
C [mol.m-3] is the gas concentration, J [mol.m-2.s-1] is the diffusion flux, De,g [m².s-1] is the gas-
effective diffusion coefficient.
The majority of carbonation models that have been published up until now are based on Fick’s
laws of diffusion [13][6]. Therefore, in the following, Fick’s second law of diffusion will be used
to analyze our experimental data.
As gas molecules travel through the porous media, two mechanisms can occur with a distinct
diffusion coefficient for each of them. These mechanisms depend on the characteristic of the
diffusing gas species and the microstructure of the porous medium.
• Molecular diffusion (Bulk diffusion): Occurs predominantly when molecule–molecule
collisions dominate over molecule–pore wall collisions. Different species of a mixture
move relatively to each other under the influence of concentration gradients.
• Knudsen diffusion (Free diffusion): molecules of different species move entirely
independently of each other. This occurs mainly when molecule–molecule collisions
can be ignored compared to molecule–pore wall collisions.
The predominant diffusion mechanism depends on the Knudsen number which is the ratio
between the mean free path λ [nm] (72 nm in the case of gaseous oxygen) and the pore
diameter dp [nm]:
Kn =λ
dp
Equation 3
• Knudsen diffusion is predominant when the Knudsen number is amply large (Kn > 10).
• Molecular diffusion is predominant when the Knudsen number is negligible (Kn < 10-2),
since the molecules collide with each other more frequently than with the pore walls.
A third diffusion mechanism can occur when both Knudsen and molecular diffusion coexist
(10-2 < Kn < 10). Table 1 gives an expression of the effective diffusion coefficients in these
three cases [9]. Note that it is reported that for concrete materials, Knudsen diffusion
contributes primarily for pores smaller than 50 nm. Ordinary diffusion occurs when the mean
free path of gas molecules is relatively short compared to the pores size and it is typically

6
shown in large pores [19].
Table 1: Mechanisms of gas diffusion in a porous media
Chemical reaction
i) Carbonation reaction of the main cement phases
Once the diffusion of carbon dioxide takes place, the gaseous CO2 dissolves in the moist
pores under suitable water content conditions. Part of the dissolved CO2 is converted to
carbonic acid, H2CO3, or its dissociation forms: hydrogen carbonates HCO3- or carbonate
Mechanism Diffusion coefficient [9]
Molecular diffusion
Dij,e = ϕ
Dij,0
- Dij,e [m²/s] is the diffusion coefficient of the gas i in the gas j
- Φ [-] is the porosity available for transport
- [-] the tortuosity factor - Dij,0 [m²/s] is the binary diffusion
coefficient of the gases i and j
Pure Knudsen diffusion
DK,e =ϕ
dp
3 (
8RT
π Mi
) 12
- DK,e [m²/s] is the diffusion under Knudsen regime
- Φ [-] the porosity available for transport
- [-] the tortuosity factor - dp [m] is the mean pore size - Mi [g/mol] the molecular mass of the
diffusing gas - R [g.m².K-1.mol-1.s-2], T[K] are the gas
constant and temperature respectively
Knudsen + molecular diffusion
1
Di′ =
1
Dij,e
+1
DK,e
- D’i [m²/s] is the diffusion coefficient under both Knudsen and molecular diffusion
Pore Wall
Pore Wall
Pore Wall
Pore Wall
Pore Wall
Pore Wall

7
CO32- depending on the pH of the pore solution. (See Equation 4, Equation 5, Equation 6,
and Figure 1).
Dissolution of carbon dioxide CO2 + H2O → H2CO3 Equation 4
Carbonic acids dissociation forms H2CO3 + H2O → H3O+ + HCO3
- Equation 5
HCO3- + H2O → H3O+ + CO3
2- Equation 6
Figure 1 shows that the dissociation forms of CO2 are directly related to the pH value of the
pore solution. During the carbonation of concrete, the pH of the pore solution decreases from
a basic value (about 13.5) to a value close to 9 [20]. Therefore, CO32- and HCO3
- are the
dissolved carbonate species majorly present in cementitious materials’ pore solution during
carbonation.
Figure 1: Distributions of the dissociation forms of carbonic acid [20]
The Ca+ ions dissolved in the pore solution from the Ca-bearing phases in a hardened
cement paste (HCP) react with the dissolved CO2 to form CaCO3. The amount of released
calcium ions depends on the amount of Ca-containing phases in the cement paste
(carbonatable products) and their solubility. The carbonation reactions of the main phases
in the HCP are shown in Table 2 [21][22].

8
Table 2 : Carbonation reactions of the main cement phases [25, 26]
Figure 2 gives a schematic description of the carbonation reaction of CH and C-S-H. Binders
with higher amounts of carbonatable products (e.g., CH and C-S-H) have a higher CO2-
binding capacity, and are more resistant to carbonation, if the latter is defined mainly as a
carbonation depth or front. Indeed the carbonation front is proportional to the inverse
square root of the amount of carbonatable products [6].
Figure 2: Main chemical species involved in the carbonation reaction [24]
ii) Carbonation products
The carbonation reaction takes place in stages and several intermediate reactions occur.
However, one of the final products is always one or many polymorphs of CaCO3, which are
precipitated in the porous network. Different polymorphs of calcium carbonate exist:
anhydrous crystalline polymorphs (calcite, aragonite and vaterite), hydrated forms
(monohydrocalcite, crystalline hexahydrate (ikaite, CaCO3·6H2O)) and amorphous
calcium carbonate hydrates [25], [26]. Indeed, calcium carbonate can also be found under
amorphous form and crystallizes with time to calcite or aragonite [27]. Note that during
carbonation, the first calcium carbonate formed is amorphous calcium carbonate [27].
Cement phase Reaction with CO2
Portlandite Ca(OH)2 + CO2 → CaCO3 + H2O Calcium Silicate CxSyHz + (x-x')CO2 → Cx'SyHz' + (x-x')CaCO3 + (z-z')H2O Ettringite 3CaO.Al2O3.3CaSO4.32H2O + 3CO2 → 3CaCO3 + 2AL(OH)3 +
3CaSO42H2O + XH2O Monosulfoaluminate 3CaO.Al2O3.CaSO4.12H2O + 4CO2 → 4CaCO3 + AL(OH)3 +
SO4 Alite C3S+ y H2O + (3- x)CO2 → xCSH + (3-x)CaCO3 Belite C2S+ y H2O + (2- x)CO2 → xCSH + (2-x)CaCO3

9
According to Radha et al. [27], the most unstable CaCO3 polymorph is the amorphous calcium
carbonate, followed by the crystalline forms: vaterite then aragonite and finally calcite which is
the most stable. The properties of the anhydrous crystalline CaCO3 polymorphs are shown in
Table 3.
Mineral Density [g.cm-3] Molar volume [cm3] Crystal shape Variation of volume [%]
Calcite 2.71 36.93 Prismatic 11.2 Aragonite 2.93 34.16 Fibrous 2.9 Vaterite 2.54 39.40 Spherical 18.7
Table 3 : Properties of the calcite polymorphs [28]
Figure 3 shows SEM images of the shape of calcite (trigonal), vaterite (hexagonal) and
aragonite (orthorhombic).
Figure 3 : SEM images of calcite (left), vaterite (center) and aragonite (right) [29]
The precipitation of a certain calcium carbonate polymorph during the carbonation reaction is
reported to be dependent upon various factors like the concentration of carbon dioxide, the
relative humidity, pH, Ca per Si ratio of C-S-H phase, duration of exposure and the phase of
the hydrated cement paste involved in the carbonation reaction [30], [25], [31], [32], [33].
However, the exact conditions that favors the precipitation of these polymorphs are not well
understood [34]. Morandeau [24] suggests that aragonite probably forms during carbonation of
C-S-H phase with low C/S, vaterite results from the carbonation of C-S-H with high C/S ratio
and calcite comes from the carbonation of CH. However, thermodynamic laws indicate that all
the polymorphs will eventually transform into the most stable phase: calcite [31].
Another product of carbonation is silica gel in the case of C-S-H carbonation, aluminum
hydroxide in the case of aluminate carbonation, and the carbonation of the anhydrous alite and
belite results in the formation of C-S-H as well [21][35].

10
1.2 Consequences of carbonation
Effect of carbonation on microstructural properties
i) Total porosity
As seen in Table 3, carbonation products cause a high volume variation since their volume is
higher than the primary reactants. Therefore, carbonation is expected to result in a reduction
of the concrete total porosity. Indeed, under natural carbonation conditions, Soja et al. [36]
found a decrease by around 4% in the MIP (Mercury intrusion porosimetry) total porosity of
hardened cement pastes (CEM II/B-LL). The same conclusion is drawn by Van de Heede et al.
[37] on high-volume fly ash and fly ash plus silica fume binder systems under natural and
accelerated carbonation (1% and 10% CO2).
Pham et al. [38] investigated the change in the water porosity of CEM I mortars after
accelerated carbonation (20% CO2) and found a total porosity decreased by almost 5%. The
reduction of porosity due to the carbonation reaction is also observed in the case of Portland
cement and blended cement concretes [39]. Morandeau [24] attributes the decrease in the
total porosity more to the decalcification of C-S-H phases than to the carbonation of
portlandite. It is worth noting that due to the porosity decrease, carbonation is also reported to
increase the compressive strength of concrete by 20 - 50% [40].
ii) Pore size distribution (PSD)
Carbonation also influences the cement paste pore size distribution. Miragliotta [41] observed
a decrease in the microporosity upon carbonation especially when the CO2 concentration
increases. Pham et al. [38] investigated the influence of accelerated carbonation (20% CO2,
65% RH, 20°C) on the pore size distribution of CEM I and CEM II pastes and mortars using
nitrogen adsorption. Pham et al. [38] found that carbonation caused a decrease in the volume
of microspores (radius <2 nm) for all materials, and a significant increase in the volume of the
meso-pores (2 nm < radius < 10 nm) for CEM II based materials. Only a slight increase in the
meso-pores volume is seen for CEM I mortars, while a clear decrease in the volume of these
pores is observed for CEM I pastes. In agreement with these findings, Lawrence et al. [42]
found that due to carbonation of lime mortars there is an increase in the volume of pores with
100 nm diameter, and an increase in the volume of pores with diameters below 30 nm. Ngala
et al. [43] state that the redistribution of the pore sizes of hardened cement pastes is linked to
the binder type: the proportion of large capillary pores (diameter ≈ 30 nm) is slightly increased
for the OPC pastes but much more significantly for the fly ash and slag pastes. Villain et al.

11
[44] investigated the changes in the pore size distribution with the water-per-cement ratio. For
cement pastes with W/C = 0.3 a reduction of the amount of pores of diameter between 100
and 12.5 nm is observed. The pastes with higher water to cement ratios indicate an increase
in the volume for pores of diameter between 100 and 50 nm. The volume of pores with a
diameter lower than 12.5 nm seems to be unchanged upon carbonation. Figure 4 shows
results of Soja el al [36] on the pore size distribution in CEM I and CEM II/B-M pastes before
carbonation (t0), after preconditioning for 12 months in a CO2-free environment (t0 + 12m no
CO2), and after exposure to natural carbonation for 12 months (t0 + 12m at 400ppm CO2). Soja
el al [36] suggests that the porosity redistribution during CO2-free exposure is due to drying.
After carbonation, a coarsening of the pore size distribution is seen in Figure 4.
Figure 4: Porosity analysis of Portland (CEM I) and blended cements (CEM II/B-M) exposed to 70 % RH and 400 or 0 ppm of CO2; exposure for 12 months after 28 day (t0) of curing, [36]
While there is an agreement in the literature about the fact that the decrease in the pores
volume (2-10 nm) is due to clogging due to calcite [38] formed from the carbonation of
portlandite, the increase in the capillary pore volume (10 nm to 100 micrometer) is explained
differently. Thiéry el al [45] (ref from [46]) suggests that the increase of macro capillarities
corresponds to the disappearance of the clusters of CH crystals replaced by a packing of
CaCO3 crystals leaving new voids. Other authors have attributed this increase to carbonation
shrinkage [47]. Indeed Omikrine-Metalssi el al [48] found that carbonation led to an increase of
shrinkage (hence a probable increase of cracking). Brunauer et al. [49] attributed the increase
in the capillary porosity volume to the cracks in the CaCO3 that surrounds the portlandite
crystals. In agreement with these results, Ranaivomanana [50] explains the formation of
additional macro-porosity after carbonation by the removal of the silica gel released after
decalcification of C-S-H that causes micro-cracks. These results reveal that the change in the
pore size distribution of cementitious materials upon carbonation depends on the materials

12
composition (CH and C-S-H content) and water-binder ratio. Therefore, the microstructure
changes must be investigated on various materials with different water-binder ratios, before
definite conclusions can be drawn.
Effect of carbonation on other properties
i) Water retention capacity
As a consequence of the pore size distribution changes after carbonation, the water retention
capacity of cementitious materials, which is directly related to their porous structure, varies
upon carbonation. Auroy et al. [51] found that after accelerated carbonation (3% CO2), the
water retention capacity of the CEM I paste only hardly changed, while the water retention
capacity of blended cement pastes (CEM III /A and CEM V/A) strongly decreased. The same
findings are assessed by Ranaivomanana [50] after accelerated carbonation (50% CO2) of
CEM I and CEM V/A concretes.
Figure 5: Desorption isotherms of CEM I and CEM III/A pastes (from [52] and [51])
Hyvert [53] investigated the sorption/desorption isotherms of CEM I, CEM II, and CEM III
mortars and found that at 65% RH the degree of water saturation of the non-carbonated
materials is 15% to 21% higher. The desorption isotherms show that the degree of water
saturation of carbonated CEM I and CEM II mortars is almost 10% higher at relative humidity
level lower than 50%, while at higher relative humidity level (>50%) non-carbonated mortars
are more water saturated than carbonated mortars. The recent work of Dutzer et al. [52]
(Figure 5) shows that carbonation (3 vol.% of CO2) induced cracking which are more
important for blended cement pastes than CEM I pastes, which could explain the decrease in
water retention capacity of these materials.
ii) Permeability
Ranaivomanana [50] found that the ethanol and gaseous oxygen permeability of concrete with

13
CEM I only slightly decreased after accelerated (50 vol.% of CO2) carbonation (by a factor of
0.8 and 0.1 respectively) despite the important decrease in the total porosity. However, for
CEM V/A ethanol and gas permeability increased by a factor of 6 and 2.5, respectively. In
agreement with these findings, Borges et al. [54] measured the oxygen permeability of a CEM
I paste and a CEM I paste with slag (75% and 90% clinker replacement) and found that the
CEM I paste permeability only slightly varied after carbonation (5 vol.% of CO2) whereas the
slag paste oxygen permeability increased significantly. Furthermore Tracz et al. [55] assessed
the nitrogen permeability before and after carbonation of hardened cement pastes and found
that the permeability decrease ranged from 15% to 42% depending on the W/C ratio.
However, according to Thiéry et al. [45], for CEM I concrete with a high w/c-ratio (0.84) the
permeability (evaluated using inverse analysis method) increased after carbonation by one
order of magnitude.
Auroy et al. [51] explains the variation of gas permeability upon carbonation (3 vol.% of CO2)
by a competition between porosity clogging due to the precipitation of CaCO3 and carbonation
induced micro-cracking. In fact, both parameters depend on the initial mineralogical
composition.
Effect of carbonation on the gas diffusivity
Soja et al. [36] determined the oxygen-effective diffusion coefficient for CEM II/B-LL pastes
before and after exposure to natural carbonation using the experimental setup described in
(Paper I). These paste diffusion coefficients slightly decreased (by a factor of 1.6 at the most)
after 12 months of natural carbonation. No definite conclusion can be drawn from these results
because: only one replicate was tested in both states, the 1.6 factor could be due to averaging
error.
Dutzer et al. [52] investigated the influence of accelerated carbonation (3 vol.% of CO2) on the
helium diffusivity of CEM I, CEM III/A, CEM V/A and a low alkalinity paste (LAC) at different
water saturation degrees. The experimental setup used for this investigation is described in
[9]. As shown in Figure 6, the He diffusion coefficient decreases for CEM I pastes and
increases by more than one order of magnitude (LAC paste) for blended cements. Dutzer et
al. [52] explains these results by accelerated carbonation-induced cracking, which are found to
be more important for blended cement pastes than for CEM I pastes.

14
Figure 6: Helium diffusion coefficient of the non‑carbonated and carbonated pastes [52]
Bertin [46] determined the oxygen-effective diffusion coefficient of CEM I and CEM I + 60%
Slag (cured for 6 months) upon carbonation (at 3 vol.% of CO2 65% RH) using the
experimental setup described in Paper I. The oxygen diffusivity of CEM I decreased upon
carbonation by almost one order of magnitude while it increased by more than one order of
magnitude for slag blended pastes. The influence of carbonation on three concrete types
made with CEM I, CEM I + 30 % fly ash and CEM I + 60% slag is also investigated using the
experimental setup described in [56] at the dry state only (oven-drying at 45°C). The oxygen
diffusivity decreased by a factor of about 4 and 2 for CEM I and fly ash concrete while it
increased by almost a factor of 2 for slag concrete. Bertin [46] explained the decrease in O2
diffusivity by the decrease in the total porosity and its increase by the fact that the pore
structure becomes coarser and its connectivity increases after carbonation due to the
decalcification of C-S-H.
Corrosion initiation
Steel reinforcement in non-carbonated concrete corrodes at very slow rates (<0.1 µm / year)
[57], thanks to the passivation layer formed by the high alkalinity of the hardened cement
paste. The carbonation reaction gives rise to a neutralization of the pore solution to pH below

15
9 [13],[47]. Therefore, the steel in concrete is no longer protected and begins to corrode
because the thin nanometric layer of impermeable Fe(OH)3 created around the steel
reinforcements is destroyed. As seen in Figure 7, depending on the electrical potential, the
reinforcements may be in the zone where Fe(OH)3 is no longer predominant but Fe2+ is. This
change is seen when the pH is lower than 9.
Figure 7: Pourbaix diagram
The fundamentals of corrosion of the reinforcement have been dealt with by several
researchers [13], [58], [57]. According to Tuutti [13], corrosion is considered as a two-stage
process (Figure 8). The initiation period (ti) (which takes years in the case of carbonation), is
the stage during which CO2 progresses in a time-dependent manner into the depth at which it
encounters the reinforcement in concrete. The propagation stage (tp) is the period after the
depassivation when active corrosion takes place. The addition of the two periods represents
concrete service life (tsr).
Figure 8: Corrosion service life of reinforced concrete (RC) structure [1]
Corrosion results in a formation of expansive corrosion products (rust) that occupy a bigger
volume than the original non-corroded steel [59]. Rust creates tensile stresses on the

16
surrounding concrete, leading to cracking and spalling of the concrete cover, which is a usual
consequence of steel corrosion in concrete [60]. Afterwards, the reinforcement is exposed to
external environment. Without suitable repair measures, this procedure leads from limitations
of serviceability to loss of load-bearing capacity of concrete structures [61]. Equation 7 gives
the balanced equation of the entire corrosion process.
Fe + ½ O2 + H2O → Fe (OH)2 Equation 7
In some cases, the deterioration is visible within a few years of construction in the form of
cover concrete cracking (Figure 9). This is one of the limit state indicators in defining the end
of functional service life for existing reinforced concrete structures undergoing corrosion.
Figure 9: example of carbonation-induced corrosion (Olympic Arena, Munich) [62]
Regarding the carbonation-induced corrosion, it is worth noting that even though theoretically,
corrosion starts when the carbonation front reaches the reinforcement [58], Yoon et al. [63]
observed corrosion of the reinforcement before the apparent carbonation depth has reached
the rebar. Hussain et al. [64] suggest that corrosion starts when the carbonation depth reaches
80% of the concrete cover.
Concrete cover depth and composition influence the ease of carbon dioxide, oxygen and
moisture ingress into the concrete, thus the corrosion rate of the rebar. A significant portion of
a reinforced concrete structure service life may be lost if the concrete carbonation properties
are not determined with enough accuracy.

17
II. Chapter II: State of the art on the prediction of
the carbonation rate
This section gives an overview of the available standardized and non-standardized
experimental methods related to carbonation. Advantages and limitations of the different
techniques are discussed. A presentation of two models commonly used to predict the
carbonation depth of cementitious materials is also given.
2.1 Determination of the carbonation rate from the pH-
indicator test
The determination of the carbonation depth is usually achieved by means of pH indicators
(thymolphtalein, phenolphtalein, m-nitrophenol, etc.). The materials are tested to carbonation
under two types of exposure conditions: natural exposure (around 0.04 vol.% of CO2 and
uncontrolled ambience) or under controlled relative humidity, temperature, and CO2
concentration [1]. The carbonation depth, which is judged to be the colorless part on the
specimen, is measured on the broken faces of the samples obtained by splitting and is the
average of different distance measurements to the central points on the face. The carbonation
rate is obtained by determining carbonation depths at different exposure times.
Although the exposure to natural carbonation is considered to be the most accurate method
for determining the carbonation rate of cementitious materials, it is highly criticized for its time-
consuming nature. Therefore, accelerated carbonation tests are usually performed by
increasing the CO2 concentration on the exposed surface of the specimen. This way, the
carbonation depth under accelerated conditions is higher than the depth under natural
carbonation. Indeed Limbachiya et al. [65] state that the carbonation depth determined under
accelerated carbonation (3.5 vol.% of CO2) for one week equals the carbonation depth
determined for one year under natural exposure.
According to Henry's law [66], the amount of dissolved gas in a liquid C [mol.L-1] is directly
proportional to its partial pressure above the liquid p [atm]. This relationship is described in
Equation 8. Henry’s constant kH [atm.L.mol-1] is a temperature-dependent constant.

18
p = kH C Equation 8
The equipment needed to perform these tests is: a climate chamber with controlled RH, T, and
CO2 concentration, a specimen splitting equipment, and a pH-indicator solution. The climate
chamber required for these measurements is costly and requires expensive safety equipment
especially when accelerated carbonation tests are performed with high CO2 concentration
(case of the standard XP P18-458 with 50 vol.% of CO2 concentration [5]).
Regarding the accuracy of the accelerated carbonation test, we have on one hand, Dhir et al.
[67] who suggest that accelerated carbonation at 4 vol.% of CO2 can provide an indication of
long term carbonation behavior of concrete since a good agreement between the carbonation
at natural and accelerated (4 vol.% of CO2) conditions is observed. In agreement with these
findings, Shah et al. [35] found that the micro-structural and phase assemblage changes under
accelerated conditions (3 vol.% of CO2) and natural carbonation exposure are similar.
Leemann et al. [68] show that the carbonation resistance of mortars carbonated at 1 vol.% and
4 vol.% of CO2 concentration is practically the same.
On the other hand, Yan [69] found that accelerated carbonation test results are significantly
lower than the carbonation depths calculated theoretically. This is mainly due to the clogging
of the pore system due to the water release due to carbonation. Increasing the CO2
concentration could result in a transmitted quantity of CO2 higher than the bound CO2 by the
material carbonation [20]. As a result, the rate of carbonation decreases gradually with the
increase of CO2 concentration. Furthermore, Bernal et al. [70] found that the reaction products
during accelerated and natural carbonation of alkali-activated binders are notably different
(bicarbonate favored at high CO2 partial pressure), and the pH drop of the pore solution is
much more important during the accelerated carbonation. Hyvert et al. [71] and Castellote et
al. [72] agree on the fact that the C-S-H degree of carbonation depends on the CO2
concentration during the carbonation reaction.
Accelerated carbonation reliability is also criticized for the following reasons: (i) European
inter-laboratory tests carried out by CEN (European Committee for Standardization) showed
that the test had a poor repeatability [73] (ii) the method depends only on the pH change and
therefore the influence may not be clearly identified if carbonation only partially occurs, or if
carbonation occurs but with pH beyond the scope changeable by indicator. Nevertheless, it is
a simple and easy method in a visual aspect for testing carbonation, which makes it widely
used.
As for the accelerated carbonation test, there is a variety of test protocols (see Table 4).
Differences occur regarding the CO2 concentration while the relative humidity of the test is

19
usually carried out at a relative humidity level that ranges between 55-70% RH under which
the progress of carbonation is reported to reach a maximum [74].
Regulation / recommendation / standards Test conditions
XP P18-458 (France) [5]
CO2: 50 ± 5 vol.% RH: 65 ± 5 % T: 20 ± 2°C 0, 7, 14 and 28 days
DAfStb Heft 510 [15] (German recommendation not an official German regulation)
CO2: 2 vol.% RH: 65 % T: 20 °C 28 days
BS EN 14629 (Great Britain) [75]
CO2: 1 vol.% RH: 60 ± 10 % T: 21± 2°C 0 and 56 days
BS 1881-210 (2013) (Great Britain) [76]
CO2: 4 ± 0.50 vol.% RH: 55 ± 5 % T: 20 ± 5°C 56, 63, and 70 days
ISO 1920-12:2015 [77]
CO2: 3 ± 0.5 vol.% RH: 55 ± 5 % RH T: 22 ± 2°C 70 days
SIA 262/1 (Swizerland) [78]
CO2: 4 ± 0.1 vol.% RH: 57 ± 3 % T: 20 ± 2°C 0, 7, 28 and 63 days
NT Build 357 (Nordtest) [79]
CO2: 3 vol.% RH: 60 ± 5 % T: 20 ± 2°C 0 and 56 days
LNEC E391 (Portugal) [59] Concrete. Determination of accelerated carbonation
CO2: 5 ± 0.1 vol.% RH: 60 ± 5 % T: 23 ± 3°C 14, 76, 166 and 351 days
CUR-Aanbeveling 48:2010 (Netherland Recommendation) Geschiktheidsonderzoek van nieuwe cementen voor toepassing in beton
CO2: 2 vol.% RH: 65 °% T: 20 °C 28, 56 days
GB T50082-2009 (China) Standard test methods of long-term performance and durability of ordinary concrete [80]
CO2: 20 ± 3vol.% RH: 70 ± 5 % T: 20 ± 2°C 2, 7, 14, 28 days
Table 4: Accelerated carbonation test methods in different countries (CO2 concentration, relative humidity, temperature and test durations)
The accuracy and reliability problems of the accelerated carbonation test limit its use to set the
concrete performance. However, shortly an European agreement (EN 12390-12:2018-10 [81])
on a suitable test method for determining the carbonation resistance under accelerated
conditions has been achieved: CO2: 3 ± 0.1 vol.-% ; RH: 57 ± 3 %; T: 20 ± 2°C; testing age

20
0, 7, 28 and 70 days.
A reliable prediction of the carbonation rate under natural exposure from the accelerated
carbonation test requires a mathematical relationship between both test results which is
challenging and sets the limit of the accelerated test method. Note that Rafai et al. [82]
compared the pH-indicator results to other test methods such as TGA and volumetric dosage
of CO2, and found that, besides the fact that it is unable to determine the amount of
carbonates in a concrete, the phenolphthalein solution leads to an underestimation of the
carbonation front.
2.2 Determination of the carbonation rate from material
properties
Besides the above mentioned test methods, another way to predict the carbonation rate of
cementitious materials can be achieved by means of the experimental determination of the
carbonation rate prediction models’ input parameters [8], [9]. The CO2-effective diffusion
coefficient and the amount of carbonatable products are the key material properties to model
the of carbonation rate. These properties are also appropriate durability indicators that could
be used in performance based and probabilistic durability design of concrete structures. When
determining these two properties, it is important to consider the strong dependence on the
degree of water saturation of the material (Paper I), [9], [85]. Pores that are well saturated
almost totally prevent the CO2-diffusion [86], and dry pores prevent the dissolution of gaseous
CO2 and reactive CaO.
Gas diffusion coefficient
The gas diffusion coefficient is a material property of high relevance regarding service life
prediction models [15], [6]. However, there is so far no standardized test method for the
determination of this property. In comparison to other transport properties such as permeability
and sorptivity, the literature is not rich with innovative experimental techniques for the
determination of the gas-effective diffusion coefficient of cementitious materials. The test
methods developed by some researchers are based on different principles, use different gas
species, allow for the performance of the test under different relative humidity levels, and their
reliability and detection limit are poorly documented.
One way to determine the gas-diffusivity is based on monitoring the time evolution of the gas
concentration in a downstream chamber due to the diffusion through the tested sample. The

21
concentration is measured by means of a gas sensor. Test methods based on this technique
(“accumulation”) (Figure 10 (a)) rely on the measurement of the concentration of the diffusing
gas 1, which can also be a mixture of gases, inside the lower chamber by means of the gas 1
analyzer, after diffusing through the sample. Note that the concentration of the gas 1 in the
upper chamber is usually kept constant. The experimental data collected in this case are the
concentration of the diffusing gas 1 as a function of time. These raw data are fitted to Fick’s
Laws described in section 1.1.1. An advantage of this test method is that the transient state
can be considered in the data analysis. Based on this technique, Houst [87] developed an
experimental setup for determining the gaseous oxygen diffusion coefficient of mortars and
concretes, and Namoulniara [88] developed a test method that allows to determine the CO2 -
effective diffusion coefficient of dry mortars. This test method is further improved by Gendron
[89]. Namoulniara [88] and Gendron [89] use CO2 as the diffusing specie through mortars and
hardened cement pastes since it is the gas of interest regarding carbonation. However,
partially saturated materials are not tested since with the presence of water CO2 reacts with
the hydration products causing precipitation of calcium carbonates which modifies the
materials’ microstructure and the diffusion process during the test itself. Indeed, Gendron [89]
uses CO2 diffusion tests on partially water-saturated specimens to investigate carbonation
rate. No information about the reliability, accuracy or cost-efficiency on these test methods is
given. Table 5 gives a summary of the existing test methods based on this principle.
(a)
(b)
Figure 10: The procedures for gas diffusion setups found in the literature [90]
A second type of procedure is shown in Figure 10 (b). One face of the specimen is exposed to
a flow of gas 2 and the other one is exposed to a steam of the diffusing gas 1. The gases flow
rates are maintained constant. The concentration of the gas 1 in the mix (gas 2 + gas 1) at the
output of the lower chamber is monitored using an analyzer. This concentration increases
gradually until the steady state is reached. Knowing the concentration of the gas 1 and its flow
rate, Fick’s first law of diffusion (Equation 1) can be used to calculate the effective diffusion
coefficient. Using this principle only the steady state is taken into consideration in the
determination of the diffusion coefficient. Note that Lawrence [8] test method for the
gas 1 gas 2
gas 1
gas 2
gas 1 analyser
Lowerchamber
Upperchamber
flow gas 1 flow gas 2
gas 1 + gas 2 gas 2 + gas 1
gas 2
Upperchamber
Lowerchambergas 1
gas 1 analyser

22
determination of oxygen-effective diffusion coefficient is based on this principle. This
experimental setup is also used by Leemann et al. [91] and Wong et al. [56] . Table 6 gives a
summary of the existing test methods based on this principle.
Different diffusing gas species used in the development of these experimental setups are
found in the literature. Lawrence [8], Leemann et al. [91], Wong et al. [56], and Houst [87]
diffusion tests are based on the determination of pure oxygen diffusion coefficient, since
oxygen is inert with most of the hydration products. Consequently, the materials microstructure
will not be altered during the test itself, and the determination of this gas-effective diffusivity is
possible for partially saturated materials. The CO2-effective diffusivity, which is the property of
interest regarding carbonation, is then determined from O2-effective diffusion coefficient [91].
Note that O2-diffusion coefficient is of high interest regarding corrosion, since the corrosion
rate of reinforcing bars is partly controlled by the diffusion of oxygen into concrete [13].
Sercombe et al. [9] , Boher [92], Vu [93] and Dutzer et al. [52] used Hydrogen, Helium or
Xenon as the diffusing specie, mainly because they do not react with the pore structure of
cement pastes.

23
Reference Experimental setup sketch Gas type
The lower value of the gas diffusivity [m2/s]
Sercombe et al. [9] Boher [92] Vu [93] Dutzer et al. [52]
He, Xe
3.10-12
Benavente et al. [94]
CO2 10-9
Houst[87]
CO2 and O2
Not reported
Namoulniara [95] Gendron [89]
CO2 10-12
Jung et al. [96] Soukup et al. [97] Papadakis et al. [6] Originaly by Wicke and Kallenbach and modified by Graham [98]
CO2 Not reported
Table 5: Summary of gas diffusion coefficient measurement methods based on the “accumulation” principle

24
reference Experimental setup sketch Gas type
The lower value of the gas diffusivity [m2/s]
Lawrence [8] Wong et al. [56] Leemann et al. [91] Villain et al. [99]
O2 and CO2
Not reported
Tuutti [13]
O2 Not reported
Peng et al. [100]
O2 5·10-9
Table 6: Summary of gas diffusion coefficient measurement methods based on the ‘flow’ analysis
The CO2-effective diffusion coefficient of cementitious materials can also be predicted from
empirical models [101]. As stated in section 1.1.1, the effective diffusion coefficient in a porous

25
media is correlated to the self-diffusion coefficient D0,CO2, the total porosity, the degree of water
saturation, and a parameter f called the “form factor”.
De,CO2 = ϕ ∗ (1 − Sl) ∗ f ∗ D0,CO2 Equation 9
The form factor f takes into account the tortuosity, constrictivity and connectivity of the porous
network. These parameters describe respectively: the increase of the path that the diffusing
specie must follow in the porous network, the pore sections variation, and the degree to which
a porous network is connected. Note that the quantification of these parameters is challenging.
Efforts have been carried out in the literature to determine an expression of the diffusion
coefficient (see Table 7). Papadakis et al. [83] (Equation 10) present an expression of the
effective diffusion coefficient of carbon dioxide as a function of the relative humidity of the air
(RH) and the porosity Φp of the hydrated cement paste and an experimental parameter B = 1.2
± 0.1·10-3 m/s1/2. Equation 10 was determined from experimental results obtained on a
Portland cement mortar.
Based on this model, Millington [102] (Equation 11) suggested a new model based on the
degree of water saturation Sl, the diffusion coefficient of carbon dioxide in air D0,CO2, the total
porosity of the material Φ and two parameters a and b. Currie [103] (Equation 12) modified
and enlarged former expression of the gas-effective diffusion coefficient by further explicitly
considering the constrictivity β, and tortuosity τ, which is defined as the ratio of the length of
the curve to the distance between the ends of it.
Model
De,CO2 = (ϕp ∗ (1 − RH) ∗ B)2 Equation 10
De,CO2 = (ϕ)a(1 − Sl)b D0,CO2 Equation 11
De,CO2 = ϕ(1 − Sl)𝛽
𝜏2 D0,CO2 Equation 12
Table 7: Some models of CO2-effective diffusion coefficient

26
CO2-binding capacity
The second parameter that controls the carbonation process is the amount of available
reactive carbonatable products. Indeed, according to Papadakis et al. [6], the carbonation rate
is inversely proportional to the square root of the amount of carbonatable products in the
material. From the composition of the cementitious material, one can calculate a theoretical
amount of the major phases contributing to the carbonation reaction in the cement paste (CH,
C-S-H, AFt, AFm, etc.). Huntzinger et al. [104] suggest that the theoretical CO2 consumption
(as a percentage of dry mass) in a hydrated Portland cement paste can be calculated as
follows:
%CO2= 0.785(%CaO-0.56 %CaCO3 -0.7%SO3) + 1.091%MgO + 0.71%Na2O
+ 0.468%K2O Equation 13
Where the %CO2 refers to the mass of CO2 consumed in the carbonation reaction compared
to the original unreacted mass of the sample. The stoichiometric mass factors shown in
Equation 13 assume that all of the CaO (except that bound in CaSO4 and CaCO3) will react to
form CaCO3, all the MgO will react to form MgCO3, and all of Na2O and K2O will convert to
Na2CO3 and K2CO3. The mass factors for K2O and Na2O are doubled if bicarbonates form
instead of carbonates.
Equation 13 is valid under the assumption that all the magnesium oxide, sodium oxide,
potassium oxide, and all the calcium oxide in the cement, excluding that in calcium carbonate
and calcium sulfur, are available to react with carbon dioxide to form carbonates. The major
limit of this model is the fact that for cements blended with pozzolanic additions, other phases
(e.g. Mg(OH)2, K(OH) and Na(OH)) may also contribute to the carbonation through a variety of
reaction pathways [105].
Thermogravimetric technique (TGA) is a valuable tool to quantify the amount of calcium
carbonate in cementitious materials [106]. This method consists of heating a powdered
hardened cement paste sample at a constant rate from room temperature to a temperature
usually higher than 1000°C. The mass variation of the sample is monitored as a function of the
temperature increasing. The carbonates formed during the carbonation reaction have certain
temperature decomposition ranges, which allows for the quantification of the amount of
carbonates (which is expressed relatively to the mass at 1000°C), and consequently the CO2
binding capacity. TGA is a technique that, although limited in scope to those reactions taking
place with a change in weight, gives results that are intrinsically quantitative. According to
27
Villain et al. [107] the mass loss due to calcium carbonates decomposition ranges between
580°C - 1000°C.
Note that there is no agreement in the literature concerning the temperature range of
decomposition of calcium carbonates [108]. Thiéry et al. [39] identified three temperature
ranges for a completed carbonation, which are summarized in Table 8. The authors pointed
out that a strict separation of the individual modifications is difficult, since the temperature
ranges overlap. They show also a preferential formation of calcite from the carbonation of
Ca(OH)2. The less well crystallized and thermodynamically more unstable forms of CaCO3 are
attributed to the carbonation of the C-S-H phases.
Decomposition
temperature range CaCO3 state
I (780 – 990 °C) well crystallized CaCO3 (calcite)
II (680 – 780 °C) thermally unstable, less well crystallized calcite
the thermal transformation of the metastable CaCO3 phases
Vaterite and Aragonite at about 440 - 470°C
III (550 – 680 °C) amorphous CaCO3
Table 8: Decomposition temperatures of the CaCO3 polymorphs [39]
Note that TGA technique is commonly used alongside complimentary techniques such as X-
ray diffraction (XRD/Rietveld), which is a technique for studying the crystalline materials [109].
CaCO3 polymorphs such as vaterite or aragonite can hardly be identified by means of TGA. X-
ray diffraction gives differentiated results in this case.
The major limits of these techniques are as follows: i) they are expensive; ii) the CO2
contained in the amorphous carbonated pastes is not considered by XRD; iii) the CO2 mass
loss due to some carbonates (e.g. MgCO3) has a temperature range that may overlap the
portlandite’s and the bound water in the C-S-H gel pores in TGA [107]; iv) the overlapping of
XRD reflections makes identification of individual phases difficult in a multi-phase hydrated
material [108].
Another way to quantify the amount of carbonatable products of cementitious materials is by
studying its CO2-uptake. Indeed, the potential for capturing CO2 from the atmosphere by
concrete carbonation is widely discussed in the literature. However, these discussions are
mainly carried out in the field of life cycle analysis of concrete structures during their service
life [110], [111], [112], [101]. The uses of the measurement of CO2-uptake due to carbonation

28
of cementitious materials in order to quantify the amount of carbonatable products and to
study the carbonation reaction kinetics are only scarcely documented. To our knowledge, the
main work with this approach is the one of Van Balen et al. [113], who developed an
experimental setup that consists of exposing a lime sample to 15% or 50% CO2 at a certain
relative humidity level in a closed loop (Figure 11).
Figure 11: CO2-uptake measurement device developed by van Balen et al. [113]
The carbonation reaction rate is measured continuously by the reduction of carbon dioxide
concentration in a closed system (Figure 11). The tested sample is spread thinly over a plastic
cup inside the sample holder ((2) Figure 11), exposed to air with a certain CO2 concentration
regulated at a certain relative humidity (1), the flow meter (3) sets the flow speed at 1.5L/min.
Monitoring of the CO2 concentration is performed using the sensor (5), (4) is a hermetically
sealed pump and (7) are valves that control the direction of the flow and the amount of CO2
concentration.
2.3 Carbonation rate prediction models
Several carbonation depth models have been developed in the literature [7][114][115]. In
LaSIE laboratory, several research works have been conducted in order to develop a
carbonation rate prediction model based on the physicochemical properties of the material.
Miragliotta [41] studied the carbonation process on the concrete surface and developed a
carbonation depth prediction model based on upscaling methods. Later, Delmi [116] focused
on modeling the coupling between carbonation process and moisture exchanges between
cement-based materials and their ambience of exposure. Omikrine-Metalssi [117] aimed at
29
modeling the coupling hydration-water exchanges by the resolution of the equations of mass
conservation. Younsi [118] studied the influence of drying on the accelerated carbonation
kinetics of blended cement concrete highly substituted by fly ash (50% in mass) and slag (75%
in mass). Recently Gendron [89] and Omikrine-Metalssi et al. [119] proposed a carbonation
depth prediction model that takes into account the evolution of total porosity, water saturation,
amount of CH, C-S-H and CaCO3 during carbonation. In the following, only two carbonation
depths which are the most commonly used are described and used in this thesis work.
Square root of time model
Carbonation begins at exposed surfaces and spreads inwards at a rate proportional to the
square root of time [21] in an environment protected from rain. Previous experimental studies
[13], of concrete carbonation have established that the thickness of the affected layer can be
modeled by the following simple model:
Xc = A ∗ √t Equation 14
Xc [mm] is the carbonation depth, A [mm/√year] is the carbonation rate, and t [year] is the
exposure time. A can be determined empirically based on accelerated and natural carbonation
tests or predicted from the physicochemical properties of the tested material.
Based on Fick’s first law of diffusion, Equation 14 can be written as a function of the mass of
the diffusing CO2 dg [kg/m²], the CO2 concentration difference between air and the carbonation
front ΔC [kg/m3], the carbonated layer thickness x [m] and the effective diffusion coefficient of
carbon dioxide De,CO2 [m²/s] [87] as seen in Equation 15. The CO2 amount required to
carbonate the carbonatable substances can be determined according to Equation 16 , where
dV [m3] is the specimen volume and a [kg/m3] is the amount of carbonatable products. In a
unitary approach, dV = dx. The substitution of Equation 16 in Equation 15 leads to Equation 17
for which the integration gives the carbonated layer thickness as a function of the gas
diffusivity and the amount of carbonatable products (Equation 18).
dg = −De,CO2 ΔC
x dt
Equation 15
dg = a dV = a dx Equation 16
a x dx = −De,CO2 ΔC dt Equation 17
x² = 2 De,CO2 ΔC
a dt
Equation 18

30
A = √2 De,CO2 ΔC
𝑎
Equation 19
The main assumptions of the determination of the carbonation rate A (as seen in Equation 19)
are the following:
• The carbonation reaction is instantaneous; therefore, the model is only valid for RH >
50%.
• The carbonation process is described based on an assumption of the existence of two
layers carbonated and non-carbonated, which implies the sharp carbonation front
existence.
• The water content, diffusion coefficient and concentration gradient between the surface
and the carbonation front are assumed constant.
The majority of carbonation models that have been published up until now are based on Fick’s
1st law of diffusion [13], [15]. For outdoor conditions, predictions from Equation 14 and
Equation 18 always overestimate the carbonation depth. Consequently, in those conditions,
these models are reported not to be sufficiently valid [15]. This result is to be expected since
the concrete pores at the surface subjected to rain would be more water saturated which
hinders the transport of gaseous carbon dioxide in the porous system. Moreover, this kind of
models does not take into account the microstructure changes due to carbonation such as
porosity clogging which modifies the diffusion coefficient.
Papadakis’ model
Papadakis et al. [6] developed an analytical model based on the physicochemical processes of
carbonation. The model assumptions imply the formation of a sharp carbonation front and
consider the cementitious material homogeneous, fully hydrated and in hydric equilibrium with
the ambient environment. These assumptions are the ones previously exposed for the square
root of time models.
The application range of this model is further developed in [83] using experimental results
carried out on CEM I concrete. The carbonation depth was determined by means of
phenolphthalein solution under accelerated carbonation conditions (50 vol.% of CO2, 65% RH)
from 1 to 20 days. The CO2-diffusion coefficient is determined for carbonated samples, and
the nitrogen diffusion coefficient is determined for non-carbonated samples using Wick-
Kallenbach experimental setup described in [18].

31
The model predicts the carbonation depth Xc[m] according to the square root of time, the CO2
concentration at the surface of the sample [CO2] [mol.m-3], the effective diffusion coefficient of
CO2 De,CO2 [m².s-1], the exposure time to carbonation t [s], and the amount of carbonatable
products [mol.m-3]. The latter is calculated from the amount of CH, C-S-H gel, C2S and C3S.
The general formula for calculating the carbonation depth is given in Equation 20:
Xc = √2 De,CO2 [CO2]
[CH] + 3[CSH] + 3[C3S] + 2[C2S]t Equation 20
Major limits of this model are: (i) the model does not take into account water transfers; (ii) the
model is only valid in an environment sheltered from rain; (iii) the assumption of a sharp
carbonation front (iv) the model is based on the diffusivity of carbonated CEM I concrete only
and needs to be validated for blended cement concretes (v) the amount of Ca-bearing phases
that can be carbonated depends on the RH which is not accounted in Papadakis' approach (vi)
the C-S-H are considered to be in the form C3-S2-H3 [83]. Note that the model is valid only
when the relative humidity is above 50%, that is to say that the kinetically limiting step is the
diffusion of CO2 through the porous network.
Gehlen’s model
For concrete structures protected from rain, models such as Papadakis’ could give rather good
results (especially for OPC concrete) [6]. However, in unsheltered environment, the
carbonation rate no longer obeys the square root law [15].
Therefore, the CEB Task Group V (1997) [6] developed an empirical approach, based on the
squared-root of time model representation, that applies to structural components sheltered and
subjected to rain. This approach is based on the introduction of a parameter called ‘the
weather function’. This weather function globally describes the effect of wetting events which
will partly block further ingress of CO2.
Based on this approach, Gehlen [15] developed a carbonation depth prediction model that
takes into account the environmental and executional effects on the CO2-diffusion coefficient,
shown in Equation 21. This model can also be found in the fib model code [84].
Xc = √2 · ke · kc · RNAC,O−1 · Ca · √t · W(t) Equation 21

32
R-1NAC,0 [mm2.year-1.kg-1.m3] is the inverse natural carbonation resistance of concrete,
determined in a standard test on specimens exposed to a standard climate (relative humidity
65 ± 5 % RH, temperature 20 ± 2 °C, CO2 concentration 0.04 ± 0.005 vol.% and at
atmospheric pressure). Ca [kg/m3] is the CO2 concentration of the ambient air.
In the case of accelerated carbonation tests, Gehlen [15] introduced a parameter kt for
converting carbonation resistances that are determined under accelerated conditions (ACC)
into resistances that are determined under natural carbonation conditions (NAC) εt is an error
term in the unit of RACC,0-1 for taking account of test-related errors in the determination of
RACC,0-1, and kt [-] is a regression parameter. Note that RACC,0
-1 is determined under CO2 2%
vol.% during 28 days under T=20°C and RHref = 65 %. Gehlen [15] suggests: kt = 1.25 ± 0.35
and ɛt = 0 ± 0.2.
The different model parameters take into account the impact of different environmental and
intrinsic conditions on the carbonation progress. The weather function W(t) [-] takes into
account the effect of re-wetting events.
The parameter ke [-] describes the effect of relative humidity of exposure on the gaseous CO2-
diffusion coefficient.
RNAC,O−1 = kt · RACC,O
−1 + εt Equation 22
W(t) = (t0
t)
(pwr.ToW)bw
2
• t0 [day]: is the time reference at which the carbonation experiments
started.
• t [day]: the time of the carbonation exposure.
• ToW [days] (time of wetness) is the number of days with a precipitation
quantity higher than 2.5 mm/day in a year.
• pwr [-] is the probability of wind-driven rain. It considers the exposure
orientation of vertical components to wind-driven rain.
• bw [-] is a regression exponent with a value of 0.428±0.170 [15].
Equation 23

33
The parameter kc [-] considers for the effect of curing/execution on the carbonation resistance,
taking 7 days as the curing date of reference.
The major advantage of this model is its validity for all cement types and a large range of
environments. In [120], Equation 21 was little revised, mainly to transfer the so-called inverse
carbonation resistance R-1NAC,0 [mm2.year-1.kg-1.m3] into a more common used carbonation rate
kNAC [mm.year-0.5]. kNAC is the carbonation rate for standard test conditions (W(t) = 1, ke = 1, kc
= 1, ka = 1, relative humidity 65 ± 5 % RH, temperature 20 ± 2 °C, CO2 concentration 0.04 ±
0.005 vol.% CO2 at atmospheric pressure). ka is a function describing the effect of CO2
concentration in the ambient air [–], Cl [kg.m-3] is the CO2 concentration during concrete
testing.
Xc = kNAC · √2 · ke · ka · kc · W(t) · √t Equation 26
ka =Ca
Cl
Equation 27
The limits of the model are as follows:
• The model is empirical; it combines different parameters obtained from experimental
data fit.
ke = (1 − RHactual
5 )2.5
(1 − RHref5 )
2.5
• RHactual [-] the average relative humidity in the location of the structural
component.
• RHref [-] is the relative humidity set as the reference humidity during the
basic examination.
Equation 24
kc = (7
tc
)bc
• tc [days]: is the curing time.
• bc [-]: regression exponent (-0.567±0.024) [15].
Equation 25
34
• Distribution of rainy days during the year is not taken into account.
• The number of days with a precipitation quantity higher than 2.5 mm/day in a year
(ToW) is not easy to find in the literature.
• The correlation between natural and accelerated carbonation is only established for the
following accelerated test procedure: 7 days of wet curing at 20°C then 21 days of
curing at RH=65% and T=20°C before 28 days of 2% CO2 exposure. This correlation
must be adapted for other accelerated test methods (under 3% CO2 concentration for
example).
• The environmental parameter ke overestimates the carbonation front for relative
humidity lower than the “optimal” RH, which is usually around 60%.
• The model is highly sensible to the kc parameter and the structural component
orientation (pdr).

35
III. Chapter III: Test protocols and materials
In this section, the main experimental techniques used in this thesis work are summarized.
The gas diffusion and CO2-binding capacity test methods developed during this thesis work
are presented in the Chapter IV.
3.1 Microstructure characterization
Water porosity
The water porosity corresponds to the porosity accessible to water, up to pores with a
diameter of 0.5 nm [121]. During this work, the water porosity of the tested concrete and
hardened cement pastes is determined by hydrostatic weighting following the standard NF
P18-459 [122]. The specimens are first placed under vacuum for 4 hours (pressure lower than
25 mbar). Then water is gradually added until the specimens are covered with about 20 mm of
water, and the vacuum is kept for 44±1 hour. The specimens are afterwards subjected to
hydrostatic weighing then weighed in air, in order to determine their volume and saturated
mass. The dry mass of the samples is obtained by oven-drying at 105°C until the mass
variation within a week is lower than 0.05%. The test can be applied to specimens of different
sizes and shapes. However, the test is not valid for specimens with a volume higher than 1.6
L.
Mercury Intrusion Porosimetry (MIP)
The pore structure of the tested hardened cement pastes, before and after carbonation, and
after hydration at different durations is characterized by means of Mercury Intrusion
Porosimetry (MIP) using a porosimeter AutoPore IV. MIP provides information about the pore
size distribution [123]. This technique is based on Laplace’s (Washburn) equation [124], [125],
which relates the pressure applied to the pore entry diameter through the surface tension of
mercury and the contact angle with mercury. Despite its limits, such as the “ink bottle” effect
[126], MIP is still considered as a method which provides valuable information about the pore
structure. Very often, researchers refer to these results in a qualitative manner [55].
Scanning Electron Microscopy (SEM)
Scanning electron microscopy (SEM) [127] is used for two main aims : i) to estimate the
degree of hydration of Slag hardened cement pastes (Paper I) and ii) to observe the

36
morphological changes upon carbonation of synthetic cement phases powders (CH, AFt, and
C3S) (Paper III).
Regarding the determination of the degree of hydration, SEM method was found to be more
reliable than other methods [128]. The observed sample comes from a thin disc (3mm in
thickness and 40mm in diameter) of a hardened cement paste crushed to obtain a piece of
about 1 to 4 cm² of surface. This sample is dried under vacuum in an oven at 40°C,
impregnated with degassed epoxy resin and hardener (PACK301) in a mold of 30 mm
diameter and placed under vacuum for 20 min at 20°C. The resin is hardened after 48 hours,
and then the surface of specimen is lapped, polished, cleaned using ethanol and placed under
vacuum for 1 hour at 20°C before SEM observations. The observations are made with a MEB-
FEG FEI Quanta 400 at an accelerated voltage of 15KeV.
Regarding the powders tested to observe morphological changes due to carbonation, they are
places on a carbon adhesive sample holder and coated using gold-palladium as a conductive
material. The observations are made in the secondary electrons’ mode. The number of
secondary electrons that can be detected, and thus the signal intensity, depends, among other
things, on the specimen topography. SEM can achieve a resolution better than 1 nanometer.
Specimens are observed in high vacuum in conventional SEM. Further details about the SEM
method used in this work are given in [127] and [129].
3.2 Physical properties
Degree of water saturation
During this work, the influence of the preconditioning relative humidity of HCP and concrete on
the gas diffusion coefficient is investigated. Therefore, the degree of water saturation Sl, which
is of high relevance regarding the transport properties of cementitious materials, is determined
for all tested specimens.
Sl =m − m0
msat − m0
Equation 28
The degree of water saturation is calculated using Equation 28, where m [g] is the mass of the
sample at moisture equilibrium, m0 [g] the dry mass, and msat [g] is the saturated mass. The
saturated mass of the samples is determined via water soaking under the vacuum for 48h. The
dry mass is obtained after oven-drying at 105°C until mass variation of the specimen is lower

37
than 0.05% within a week.
BET surface area
Brunauer-Emmett-Teller (BET) is a technique used to investigate the influence of natural
carbonation on the specific surface area of powdered synthetic anhydrous and hydrates
(Paper III). This technique is based on calculating the amount of adsorbate gas (Nitrogen in
our case) corresponding to a monomolecular layer on the surface of the solid. The physical
adsorption results from relatively weak forces (van der Waals forces). This amount is
correlated to the total surface area of the particles including pores in the surface. Therefore,
the surface developed by the grains and their inner porosity are determined.
Assumptions of the BET technique are: i) gas molecules behave ideally; ii) only one monolayer
forms; iii) all sites on the surface are equal; iv) no adsorbate-adsorbate interaction and v)
adsorbate molecule is immobile. The apparatus used is Tristar II 3020 micrometrics.
Helium pycnometry
Helium pycnometry is a technique used in order to determine the apparent density of particles
in synthetic anhydrous and hydrates before and after exposure to carbonation (Paper III). This
technique is based on gas displacement and the volume pressure relationship known as
Boyle's Law [130].
The tested specimens are stabilized at ambient temperature prior testing 20 ± 1°C. Closed
pores (i.e. those that do not communicate with the surface of the solid) are included in the
measured volume. The apparatus is the pycnometer ACCUPYC 2 1340 MICROMERITICS.
The measurement sequence is repeated until the results for the volume of the sample agree to
within 0.2%.
Apparent oxygen permeability
Gaseous oxygen permeability KO2 [m²] is a general durability indicator [131] that depends on
the porous network connectivity and the material micro-cracks [56]. This property is also
required in some applications such as internal lining of underground geo-reservoirs for gas
storage purposes. The apparent permeability is determined based on the Darcy law. Major
limits of this test method are:
• Gas permeability is highly influenced by drying-induced microcracks [56].
• Concrete gas permeability reflects the degree of its accessibility to gases under a

38
pressure gradient only, which is unsuitable for diffusion-based phenomena (such as
carbonation) [132].
• It is challenging to determine the influence of different degrees of water saturation on
the gas permeability of the specimens because of the difficulty to obtain readings on
the gas flow meter under the conditions of pressure difference employed in this test,
and the impossibility to pre-condition the 50 mm thickness concrete specimen at
different relative humidity levels in a reasonable time.
During this thesis work, the apparent oxygen permeability of different concrete mixtures is
determined following the XP P18-463 standard [133] which is based on the CEMBUREAU
apparatus [134][135]. Three replicates of the concrete are tested. After covering the specimen
sides with epoxy resin, they are oven dried in a well-ventilated oven at (80 ± 5)°C for 6 days
and placed in a desiccator for 24h. The first measurement is made at 7 days. The specimens
are then replaced in the oven at 105°C until constant mass and placed in desiccators 24h prior
testing. The gas permeability measurements are determined at an absolute pressure of 2 bars.
3.3 Chemical composition
Thermogravimetric analysis (TGA)
Thermogravimetric analysis (TGA) [106] is conducted on the powdered samples in order to
determine the amount of bound CO2 (B_CO2) in the specimens (Paper II and III). TGA
measurements are made under nitrogen flow at a heating rate of 10°C/min using a powdered
sample of around 30 mg sieved at 63 μm. The heating temperature varies from 30°C to
1000°C.
B_CO2 = mCO2
moxydes + mCO20 + mH2O
0 Equation 29
The amount of bound CO2 [gCO2.g-1cement] is calculated based on Equation 29, where mCO2
[g] is
the mass of CO2 present in the sample and given by the TGA (Temperature between 550°C
and 950°C [108]), moxydes [g] corresponds to the mass of the sample at 1000˚C, mCO20 [g] and
mH2O0 [g] are the masses of the CO2 and water initially present in the raw materials
respectively. TGA results give the temperature ranges attributable to the relevant
decomposition processes of the phases present in the tested specimen. TGA is carried out
using TG SETARAM 92-16 apparatus and the raw data are analyzed using SETSOFT 2000

39
software.
X-ray diffraction (XRD)
X-ray diffraction technique is used for the following aims: i) the determination of the degree of
hydration of Portland cement hardened cement pastes ( by analyzing the XRD results using
Rietveld method [109] (Paper I) and ii) the investigation of the carbonates crystal polymorphs
formed upon carbonation (Paper II and paper III).
Around 1g of the powdered material (sieved at 63 μm) is introduced in a Philips/PANalytical
X’Pert Pro-MPD diffractometer with an X’Celerator detector of an incident CuKα radiation
beam by 40 kV and 40 mA to a rotation sample. The specimens are scanned for 40 minutes
from 2θ = 5 to 65° by a step of 0.25° without protection from CO2 but in a relatively dry
environment (RH~40%). Despite the fact that X-ray diffraction (XRD) is a powerful technique, it
can only be used to study crystalline materials and should be coupled to TGA technique that
allows for the determination of the dry mass of the specimen.
3.4 Carbonation tests
Natural carbonation
The carbonation depth of concrete and hardened cement paste specimens is determined
under natural carbonation at 55% ± 5% RH and the ambient CO2 concentration of the
laboratory. The concrete specimens are cast in cylinder molds of 110 mm diameter and 220
mm height. The molds are then stored for 24 hours in a room regulated at 100% relative
humidity (20±1°C temperature) and demolded afterwards to be immersed in water of ambient
temperature (21°C) for a period of 90 days.
The protocol for natural carbonation test is as follows:
• The specimen sections (cylinders of 110 * 220 mm) are sealed with aluminum adhesive
to obtain radial carbonation.
• The samples are placed in a relative humidity-controlled room (55 ± 5%) at a
temperature of 20+/-2°C. The CO2 concentration is the atmospheric concentration which is
around 500 ppm.
• The carbonation depth of these specimens is determined after 1 and 2 years of
exposure. At these two periods, the concrete cylinders are sawed to discs of 50 mm height,

40
split into two parts and phenolphthalein solution is sprayed on the freshly split faces.
• The carbonation depth is given as the average of 16 readings (8 on each face of the
specimen.
The carbonation depth of six hardened cement pastes is determined under 55%RH and
ambient laboratory CO2 concentration. After a preconditioning period of 5 weeks in a climate
chamber with low CO2 concentration (soda lime was added inside the climate chamber). The
HCPs are exposed to natural carbonation for 5 months. The carbonation depths are
determined by phenolphthalein solution once a month. Note that 55% RH is chosen since it is
suggested that the most rapid carbonation of concrete occurs at a relative humidity near 50%
to 65% (as required also by the accelerated carbonates tests listed in Table 4).
Accelerated carbonation
The carbonation depth of concrete mixes is also determined under accelerated conditions (3%
CO2) over different exposure periods by means of phenolphthalein solution. The concrete
specimens subjected to accelerated carbonation, are tested following the protocol described
below:
• The cylinders are sawed to discs of 110 mm diameter and 105 mm height.
• The discs are then oven-dried at 45°C for 14 days. The relative humidity inside the
oven is lower than 10%.
• After the oven-drying, the discs are cooled at 65±5% RH and 20±2°C for 7 days. The
relative humidity is regulated by means of a saturated salt solution of ammonium nitrate.
• The carbonation depth is determined on one sample in order to evaluate the initial
carbonation depth after the 21-day long preconditioning period.
• The specimens are stored in a carbonation chamber at 65±5% RH, 20±2°C and
3±0.5% CO2 concentration by volume.
• Carbonation depths are determined after 28, 56 and 70 days for the concrete C_LS,
and 7, 14 and 28 days for concrete C_FA and C_SL (section 3.7). After each carbonation
period, three concrete cylinders are taken out of the carbonation chamber and split into two
parts. Phenolphthalein solution is sprayed on the freshly obtained faces. The carbonation
depth is an average of 10 values measured on the two split faces.

41
The influence of carbonation on the gas diffusivity and the microstructural properties of the
tested materials is investigated after carbonating the materials at 1 vol.% CO2 and 55% RH
(see Paper II). 1 .vol% CO2 by volume is chosen in order to avoid cracking [52] of the
materials and carbonate the samples in a relatively fast time comparing to natural carbonation
exposure. The accelerated carbonation is carried out until the pH-indicator is colorless on the
specimen surface.
3.5 Synthetic anhydrous and hydrates
In order to enhance the understanding of the carbonation kinetics of anhydrous phases,
triclinic tricalcium silicate (C3S), dicalcium silicate (β-C2S), and cubic tricalcium aluminate
(C3A), which are the three main non-hydrated phases present in the clinker are prepared. The
synthesis of these pure materials is carried out following a modified Pechini process as
described in [136]. The advantage of this method is that pure β-C2S can be formed with no
stabilizing impurities.
Table 9 shows the stoichiometric proportions of the synthetized materials used to prepare the
anhydrous phases and the heating temperature of each. These materials are first mixed by a
wet process in a rotary kiln; oven dried at 150°C, pressed in a cylinder press by 50 g portions
and heated gradually for 2 hours until the heating temperature is reached. C3S phase is
metastable at temperature lower than 1100°C and decomposes into dicalcium silicate and lime
[136].
The mix is slowly cooled until 1100°C, then rapidly cooled to ambient temperature at 10°C per
minute to prevent C3S decomposition [136]. Finally, these materials are grinded in a planetary
crusher and sieved using a 63 µm sieve. Pure triclinic alite, β-belite and cubic C3A are thus
produced.
CaO SiO2 Al2O3 Heating Temperature
C3S 73.7 26.3 - 1600°C C2S 65.1 34.9 - 1550°C C3A 62.2 - 37.8 1350°C
Table 9: Firing temperature and composition of the anhydrous minerals
The main hydrates present in a Portland cement are also prepared: Portlandite (CH), calcium
silica hydrates (C-S-H) (C/S ~ 0.9) and ettringite (AFt). The synthesis of ettringite is achieved
by mixing 27g of tricalcium aluminate and 51.6 g of gypsum for 4 hours using a wet process,
and then the mix is dried at a temperature of 50°C. Pure portlandite is prepared by means of a
decarbonation of Calcite at 1000°C, cooling it down to ambient temperature and adding water.

42
Calcium silicate hydrate with a C/S = 0.9 is synthesized with respect to the proportions shown
in Table 10. CaO is obtained from the calcination of Ca(OH)2 for 4h at 1100°C, SiO2 comes
from hydrophilic silica fume Aerosil 90 ®.
First, the mix is agitated for a month using a magnetic agitator, and then the solid phases are
separated from the solution by centrifugation for 2 min at 12000 tours per minute, to be finally
oven dried at 45°C under vacuum, slightly grinded and sieved to 63 µm.
C/S Formula CaO Mass SiO2 Mass Water volume
g g mL
0.9 C0.9SH1.7 3.7 4.3 391.5
Table 10 : Amount of reagents to prepare 10 g of C-S-H
The preparation of the materials is carried out using boiled water cooled down at ambient
temperature, and all the synthesized minerals are stored in closed bottles inside a chamber
under vacuum with soda lime to avoid carbonation during the storage period. Qualitative XRD
test is carried out on these phases directly after their synthesis (Table 40 in the appendix),
furthermore the initial degree of carbonation of these materials is determined by means of
TGA analysis (Paper III). More information about the preparation of these materials can be
found in Paper III.
3.6 Hardened cement pastes (HCP)
During this work, nine hardened cement pastes are tested for oxygen-effective diffusion
coefficient under different environmental conditions and after different hydration durations.
These materials are also characterized using different methods stated previously. Details
about the mix design of these materials and the investigations carried out are summarized in
Table 11. The oxide composition of the raw materials used to cast the HCP is given in Paper I
and Paper II. Note that the replacement of the cement by supplementary cementitious
materials is given in mass percentage for all mixes. The W/B ratio is a volumetric ratio for the
pastes HD_OPC_W/B, HD_OPC_SF_W/B and HD_OPC_Slag_W/B while it is a mass ratio for
the other mixes.

43
Paste name Cement type
Addition type and % mass
W/B Investigations
HD*_OPC_W/B
CEM I
-
1.6
and
1.9
(%vol)
The influence of hydration duration,
degree of water saturation, and W/B
ratio on De,O2.
The degree of hydration, the degree of
water saturation, the pore size
distribution and water porosity are
determined in the non-carbonated
state.
HD*_OPC_SF_W/B 10% silica
fume
HD*_OPC_Slag_W/B 50% Slag
PC6
CEM I
52.5 N
- 0.60
The influence of the degree of water
saturation and the accelerated
carbonation (1 %.vol of CO2) on De,O2.
Determination of the CO2-binding
capacity at three RH levels.
Determination of the degree of water
saturation, the total porosity and the
pore size distribution before and after
accelerated carbonation.
FA6 30% fly
ash 0.60
SL6 60% slag 0.60
LS6 40%
Limestone 0.60
SL35
CEM I
52.5 N
PM
50% Slag 0.35
MK45 CEM I
52.5 N
20%
Metakaolin 0.45
Table 11: Tested hardened cement pastes (*HD: hydration duration)
3.7 Concrete
A total of 44 different concrete mixtures are tested to oxygen permeability and diffusivity (Table
13) after drying at 105°C, only 10 concrete mixtures diffusivity is determined at different RH
levels.
32 concrete mixtures come from the French project PerfDub (approche PERFormantielle de la
DUrabilité des ouvrages en Béton). This project aims at designing on a national scale a
methodology for specifying the durability of concrete structures based on performance-based
approach specifications to bring together all relevant stakeholders and to make the
performance based specifications operational, which is not yet the case today [137]. During

44
PerfDub project, the durability properties are investigated on concrete mixtures made with
several standardized and non-standardized binders, various aggregates (rounded, crushed)
with different mineralogy and porosities (Table 12), and considering different compactness
(water to binder ratio varying from 0.35 to 0.60) to assess the evolution of the concrete
performance with changes in composition. The main objectives of this project can be
summarized as:
• Updating existing test procedures (standards, tests under standardization or
development), taking into account the influence of materials composition (SCMs,
aggregates, etc.).
• Developing new test procedures relevant to the investigations carried out.
• Investigating ageing effect and designing procedures to determine corresponding
input parameters.
• Providing a comprehensive database of experimental results on concrete mixtures
that comply or not with deemed-to-satisfy provisions.
Table 12 gives information about the different aggregate types used to cast the tested
concrete mixtures. It is worth noting that the aggregate mineralogy, shape and porosity are
different. The most porous aggregates are G2 and G4 with water absorption of around 2% and
4% respectively.
G1 G2 G3 G4 G5 G6 G7
Mineralogy Silica-limestone Alluvial
Silica-limestone Alluvial
Dense limestone
Limestone
Fine : marine Coarse: gneiss
Limestone Limestone
Shape Mixed rounded-crushed
Mixed rounded-crushed
Crushed Crushed
Fine : rounded Coarse: crushed
Crushed Crushed
Water adsorption
~ 1% ~ 2% ~ 0.6% ~ 4% ~ 0.6% ~ 0.6% ~0.8%
Table 12: Aggregate types of the concrete mixtures from Perfdub project (G1 to G5) and LafargeHolcim concrete (G6 and G7)

45
Concrete Total W/B
cement type cement content (kg/m3)
Aggregate type
Air (%)
Compressive stregth at 28
days (MPa)
1 (C_PC) 0.7 CEM I 280 G2 1.3 43.3
2 (C_FA) 0.7 CEM I + 30% FA 223 G2 1.9 33.3
3 0.6 CEM II/A-LL 280 G2 1 40.0
4 0.6 CEM III/A 280 G2 1.4 36.6
5 (C_SL) 0.8 CEMI + 60%slag 119 G2 1.5 26.4
6 0.5 CEM I + 30% LS 253 G2 2.4 34.4
7 (C_LS) 0.5 CEMI + 41% LS 270 G2 1.5 41.9
8 0.5 CEM II/A-LL 223 G2 1.3 30.6
9 0.6 CEM II/A-LL 161 G2 1.8 31.0
10 0.6 CEM II/A-LL 280 G2 1.5 32.1
11 0.5 CEM I 140 G1 0 49.6
12 0.5 CEM I 347 G1 1.4 57.8
13 0.5 CEM III/A 350 G1 1.8 51.2
14 0.5 CEM II/A-S 347 G3 1.1 56.1
15 0.4 CEM I 316 G1 2 60.0
16 0.5 CEM II/A-LL 363 G1 1 58.8
17 0.5 CEM II/B-S 350 G2 1.2 53.3
18 0.5 CEM II/B-S 342 G5 2.3 45.8
19 0.5 CEM I 386 G1 1.7 44.4
20 0.4 CEM I 189 G1 - 38.8
21 0.5 CEM II/A-LL 363 G1 1.6 39.4
22 0.4 CEM II/A-LL 154 G1 1.3 -
23 (C_SL4) 0.4 CEM I 52.5 N PM 200 G1 - -
24 0.4 CEM III/A 380 G1 - -
25 0.4 CEM III/A 370 G1 1.5 -
26 0.5 CEM III/A 371 G1 1.2 65.5
27 0.5 CEM V 369 G4 0.8 49.2
28 0.5 CEM V 369 G3 1 55.8
29 0.4 CEM I 357 G1 1.5 93.5
30 (C_MK) 0.5 CEM I + 20%MK 304 G2 2.5 62.3
31 0.4 CEM I + 20%MK 304 G3 1.9 66.5
32 0.5 CEM I +30% AS 253 G2 1.6 28.3
Table 13: the Perfdub concrete mixtures tested during this thesis project (- : missing information)

46
The other 12 concretes tested come from internal projects in LafargeHolcim research center
(see Table 14 from 33 to 44).
Concrete Total W/B
cement type cement content (kg/m3)
Aggregate type
Air (%)
Compression at 28 days (MPa)
33 (C1) 0.7 CEM I 280 G6 2 37.3
34 (C2) 0.4 CEM III/A 380 G6 2 63.4
35 (C3) 0.65 CEM III/A 280 G6 2 31.6
36 (C4) 0.4 CEM IV/A 380 G6 2 54.5
37 0.4 CEMI + 36% Slag 360 G7 2 92.0
38 0.4 CEMI + 19% Slag 360 G7 2 86.3
39 0.55 CEM I 340 G6 2 34.1
40 0.4 CEM I 380 G6 2 67.2
41 0.4 CEM II/B-LL 380 G6 2 44.9
42 0.65 CEM IV/A 280 G6 2 21.0
43 0.65 CEM I 280 G7 2 31.5
44 0.6 CEM III/A 280 G6 2 28.6
Table 14: The LafargeHolcim concrete mixtures tested during this thesis project
The different investigations carried out on the concrete mixtures shown in Table 13 and Table
14 are explained hereafter.
Concrete mixtures tested to O2 permeability and O2 diffusivity
The gas transport property commonly determined and for which the experimental method is
standardized is oxygen permeability (KO2) [133]. Therefore, the oxygen-effective diffusion
coefficient and oxygen permeability of a large set of concrete mixtures are compared in order
to investigate the correlation between these two transport properties.
Oxygen permeability is determined for 44 concrete mixes cured for 90 days following the
French Standards XP P18-463 [133], 32 concretes from Perfdub project, (see Table 13
concrete 1 to 32), and 12 concretes from LafargeHolcim (see Table 14 concrete 33 to 44).
For each concrete mix, three replicates of 50 mm thickness and 15 cm diameter are tested to
oxygen permeability after a drying at 105°C. Concrete specimens (33 to 44 in Table 14) are
cored into discs of 11 cm diameter to be tested to oxygen diffusivity. The specimens from
concrete 1 to 32 are sawed from 11 cm diameter and 22 cm height concrete cylinders. These
specimens are gradually dried: first at 50% RH, 50°C, 80°C and finally 105°C, until water

47
equilibrium criteria is reached: the mass variation of the specimens within a week is lower than
0.05%. 24 hours prior to the oxygen-effective diffusion and oxygen permeability tests, the
concrete specimens are placed inside a desiccator under vacuum for 24h to 48h in order to
cool down to room temperature without mass gain. Note that the specimens are gradually
dried in order to minimize drying-induced microckracking.
Concrete mixtures used to investigate the influence of the
specimen thickness on De,O2
An experimental campaign is carried out on four concretes in order to study the influence of
concrete specimen thickness on gas diffusivity (concretes C1, C2, C3 and C4). The concrete
specimens are sawed to different thicknesses and tested to oxygen diffusivity. 2% air content
is measured for these four concretes. The specimens’ diameter is sawed from 220 mm height
and 110 mm diameter cylinder. In order to collect statistical representative data, for each
concrete mix, nine discs of 5 mm and 10 mm thickness are sawed and tested to oxygen
diffusivity after preconditioning at 93% RH, and at the dry state (after oven-drying at 105°C).
Three discs of 50 mm thickness that respect the criteria of a thickness of two times the
minimum cover thickness [138] are also tested to oxygen diffusivity but only at the dry state.
Moisture equilibrium of these specimens is supposed to be reached when the mass variation
within a week is lower than 0.05%.
Concrete mixtures tested to the influence of accelerated
carbonation on De,O2
Six concrete mixes are chosen from PerfDub project in order to investigate the influence of the
degree of water saturation on the oxygen-effective diffusion coefficient under both non-
carbonated and carbonated states (accelerated carbonation 1 vol.% of CO2). These concretes
are sawed to 1 cm thickness (in order to test and precondition the specimens at different RH
levels in a reasonable time) from cylinders of 110 mm diameter and 220 mm height. The
tested concretes are:
• C_PC (concrete 1 in Table 13), C_FA (concrete 2 in Table 13), and C_SL (concrete 5
in Table 13 ) are cast using the same CEM I, at the same water-per-binder ratio but
with different additions types. Therefore, the influence supplementary cementitious
materials on the oxygen-effective diffusion coefficient can be investigated. C_PC and
C_FA are in accordance with the standards NF EN 206-1 [139], while C_SL is not in
accordance with the standards [139] since it contains a high proportion of Slag (60%,
i.e. higher than standard limit of 50% slag [19]).

48
• C_LS (concrete 7 in Table 13) is chosen to investigate the influence of a higher
limestone replacement (than recommended by the standards NF EN 206-1 [139]) on
the oxygen-effective diffusion coefficient.
• C_SL4 (concrete 23 in Table 13), and C_MK (concrete 30 in Table 13) are mixes of
interest to investigate the carbonation performance of a low water-per-binder ratio
concretes.

49
IV. Chapter IV: Main results
In the following chapter, we present in details the gas diffusivity and CO2 binding capacity test
methods developed during the framework of this thesis work and analyze the reliability and
detection limit of these experimental techniques. Results on the influence of different
parameters such as the relative humidity of preconditioning, the material composition,
hydration duration, carbonation… on the De,O2 are presented. The CO2 binding capacity of the
synthetic anhydrous and hydrates and HCP is determined at different RH levels.
4.1 Gas diffusivity of cementitious materials
Test method
i) The design of the diffusion cell
Gaseous carbon dioxide-effective diffusion coefficient is a property of high interest regarding
the carbonation performance study of cementitious materials. Since so far, there is no
standardized test method to determine this property, we designed and developed a new
equipment to determine the gas diffusion coefficient of hardened cement pastes and concrete
specimens. The main specifications set to design the diffusion test equipment are as follows:
• The diffusing gas must be safe and inert with most of the hydration products in order to
avoid alteration of the microstructure during the test itself.
Therefore, atmospheric oxygen is chosen as the diffusing gas mainly because it is non-
reactive with the hydration products. Moreover, the use of an oxygen bottle is avoided, which
is convenient for practical reasons and helps avoiding safety problems. The CO2-effective
diffusion coefficient can be deduced from that of oxygen using a simple model developed
originally by Thomas Graham [140]. This model validity has been confirmed several times [98].
• The test method must be easy to perform with minimum equipment.
Instead of using two diffusion cells as stated in the literature (see Table 5 and 6), a half
diffusion cell is designed and used as a “downstream chamber”. The “upstream chamber” in
our case is the climate chamber inside which the diffusion tests are carried out.
• The test method must allow for the determination of the gas diffusion coefficient under
different environments.

50
The inside volume of the diffusion cells is minimized in order to avoid drying of the samples
during the diffusion tests. Indeed, the mass variation of the tested specimens is determined
after each diffusion test and found to vary by no more than 0.02%. The climate chambers
inside which the diffusion tests are carried out are regulated at the same relative humidity level
under which the tested specimens are preconditioned.
• The analysis of the experimental results must take into consideration the transient
regime.
The raw data are accumulation curves of the gaseous oxygen that diffuses from the
atmosphere through the tested specimen inside the cell. These curves are analyzed using an
automatic tool that fits the data to Fick’s second law of diffusion taking into account both the
transient and steady states (see paper I).
• The test must be cost-effective and timesaving.
Regarding the tested specimens, thin specimens are tested which allows for preconditioning
and testing the diffusivity in a reasonable time. The tested method is developed using low-cost
but efficient equipment.
51
(a)
(b)
Figure 12: Diffusion cells sketches and photos (a) concrete diffusion cell and (b) hardened cement pastes diffusion cell
Figure 12 shows the diffusion cells designed in order to satisfy all the specifications stated
above. More details about the test method can be found in Paper I and [141]. Table 15 gives
information about the diffusion cells geometry. This geometry is determined to minimize the
internal volume because a large diffusion volume may cause drying of the sample during the
test. Moreover, the volume of the upstream chamber inside which the diffusion cell is placed is
200 to 571 times bigger than the inside volume of the diffusion cells, therefore the oxygen
concentration variation inside the climate chamber is negligible.
Internal diameter (mm) Internal length (mm) Total volume (ml)
Cement paste cell 44 45 68
Concrete cell 110 22 209
Table 15: Geometry of the diffusion cells
Note that during this work, the tested hardened cement pastes diameter is 40 mm and
thickness is 3±0.5 mm, while the tested concrete specimens have a diameter of 110 mm and a
thickness that varies between 5 mm and 50 mm (the influence of the concrete thickness on the

52
determined diffusivity is discussed in the following section 4.1.3 i) ).
ii) Test method protocol and validation
The tested sample (concrete or hardened cement paste) is placed between two rubber joints
and placed in the down part of the diffusion cell (see Figure 12). In the case of cement pastes,
the sample is tight against joints by screwing. In the case of concrete sample, clamping is
done by threaded rods. At the beginning of each test, the diffusion cell is flushed with nitrogen
for a short period of 30 seconds with a slow rate and placed inside a relative humidity-
controlled chamber. One face of the sample is then exposed to the internal volume of the cell
filled with nitrogen and the other face to the relative humidity-controlled air of the upstream
chamber which creates the concentration gradient of oxygen. Therefore, oxygen diffuses
successively through the sample into the cell where O2 concentration is monitored by a gas
sensor (Vernier ©). When the steady state is reached (i.e. when O2 concentration reaches
20%), the experiment is stopped and an accumulation curve (O2 concentration vs. time) is
collected.
Figure 13: The fit of the raw experimental data of the oxygen-effective diffusion coefficient test method
As seen in Figure 13, O2-effective diffusion coefficient (De,O2) is determined by fitting Fick’s
second law of diffusion to the data of the accumulation curve by least square method (see
Paper I). The tests are performed at a temperature of 20±1°C under atmospheric pressure.
Table 16 gives information about the reliability, measurement range, time, and conditions of
the test method. The repeatability coefficient shows to what extent the absolute difference
between two measurements on the same sample would differ in 90% of the occasions. The
coefficient of variation varies between 15% for hardened cement pastes to 26% for concrete

53
(average value).
Hardened cement paste cell
(Figure 12 (b))
Concrete diffusion cell
(Figure 12 (a))
Repeatability coefficient 7% to 10% Not investigated
Coefficient of variation 15% 26%
Testing time 30 min to 4 weeks 30 min to 3 days
Preconditioning time 2 days to 5 weeks 3 days to 6 months
Measurements
conditions
Ambient temperature and pressure, relative humidity level lower
than 93% (O2 sensor working conditions)
Measurement range 10-11 to 10-6 m²/s
Table 16: Summary of the main information about the O2 diffusion test method
It is worth noting that the long test period of 4 week was only reached for one HCP made with
10% silica fume replacement, hydrated for two months and preconditioned at 93% RH. Note
that the coefficient of variation is higher for concrete specimen mainly because of the effects of
heterogeneity of this material which results in a non-homogenous water distribution in the
concrete porous network which directly affects the oxygen diffusivity. Another way is used to
describe the data of the variation coefficient of De,O2 using the box plot (or whisker diagram) as
shown in Figure 14. This way, we can display the full range of variation (from min to max), the
likely range of variation (the inside of the box), and a typical value (the median) [142] at each
preconditioning state (from dry to 93% RH).
(a)
(b)
Figure 14: Box plots of the coefficient of variation corresponding to concrete specimens (a) oxygen-effective diffusion coefficient determined for different preconditioning environments for HCPs (b)
0%
20%
40%
60%
80%
100%
120%
140%
160%
dry (105°C) 33% 55% 93%
Variation coefficient -of De,O2
Preconditionning state
minmaxmediane
0%
20%
40%
60%
80%
100%
120%
140%
160%
dry(80°C)
33% 55% 76-86% 93%
Variation coefficient -of De,O2
Preconditionning state
minmaxmediane

54
Figure 14 (b) shows box plots, each corresponds to datasets of the variation coefficient of
experimentally determined diffusion coefficients after preconditioning the specimens at 5
states: oven-dried (105°C), 33%RH, and 55% RH, between 76% and 86% and 93% RH. For
each respective category, we have the following amounts of data for concrete (Figure 14 (a)):
32, 11, 9 and 26, and for HCP (Figure 14 (b)): 18, 30, 26, 24 and 21.
The spacing inside each box indicates the degree of dispersion of the variation coefficient,
which clearly depends on the preconditioning state. The average value of the coefficient of
variation varies from 9% at the dry state to 48% when the concrete specimen is preconditioned
at 93% RH. Note that the preconditioning period (due to the mass equilibrium criteria < 0.05%
within a week) could also result in a higher scatter of the data.
iii) CO2 diffusion coefficient vs. O2 diffusion coefficient
In the framework of this thesis work and Gendron’s thesis [89], an inter-laboratory comparison
was carried out on the same hardened cement pastes. These materials are first tested to
oxygen diffusivity using the experimental setup developed during this thesis work, and then the
CO2-effective diffusion coefficient of the same specimens is determined using the
experimental setup developed in La Rochelle University by Namoulniara first [88], and
improved later by Gendron [89]. The HCP tested are: 8M_OPC_1.9, 8M_OPC_1.6,
8M_OPC_Slag_1.6 and 8M_OPC_Slag_1.9 (see Table 11). The discs are gradually dried in
the oven at 80°C until constant mass, tested to oxygen diffusion using our experimental setup,
and then they are sent by post to La Rochelle University to be tested to CO2 diffusivity. Before
CO2 diffusion tests, the specimens are re-dried at 80°C to obtain as much as possible the
same hydric state than before O2 diffusion tests.
De,CO2 = 0,14 + 0,5*De,O2 , R² = 0.9
Figure 15: CO2-effective diffusion coefficient vs. O2-effective diffusion coefficient [90]
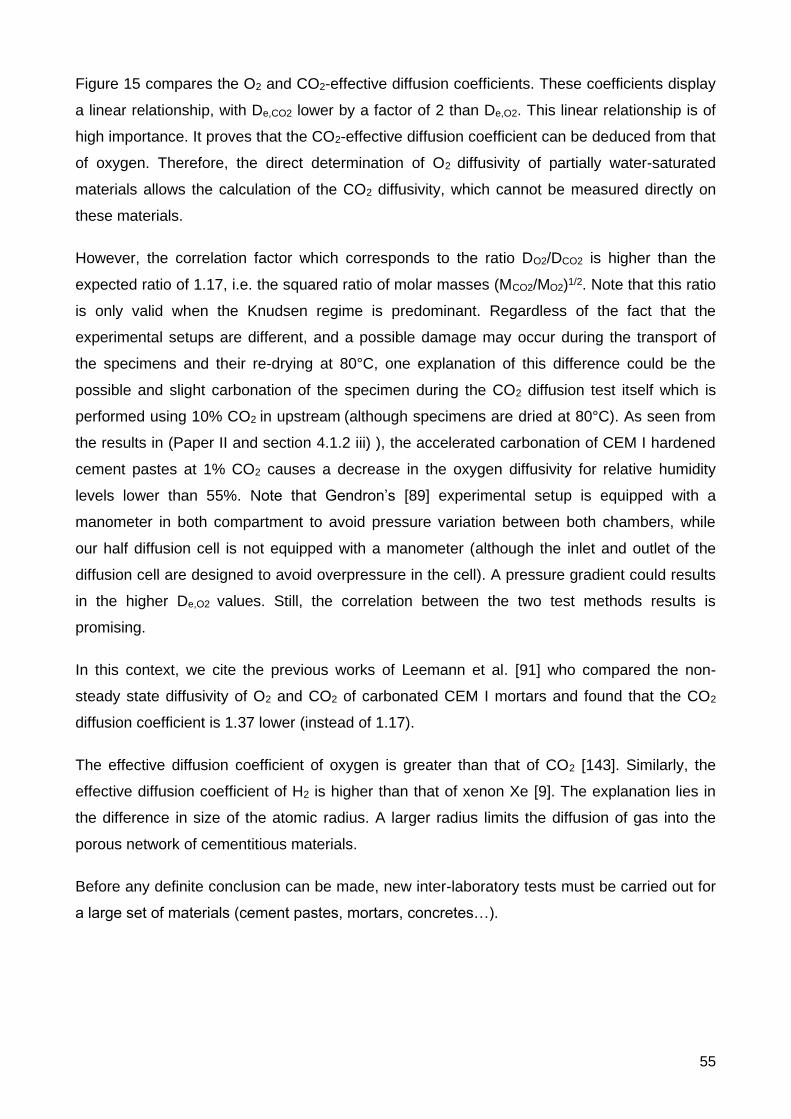
55
Figure 15 compares the O2 and CO2-effective diffusion coefficients. These coefficients display
a linear relationship, with De,CO2 lower by a factor of 2 than De,O2. This linear relationship is of
high importance. It proves that the CO2-effective diffusion coefficient can be deduced from that
of oxygen. Therefore, the direct determination of O2 diffusivity of partially water-saturated
materials allows the calculation of the CO2 diffusivity, which cannot be measured directly on
these materials.
However, the correlation factor which corresponds to the ratio DO2/DCO2 is higher than the
expected ratio of 1.17, i.e. the squared ratio of molar masses (MCO2/MO2)1/2. Note that this ratio
is only valid when the Knudsen regime is predominant. Regardless of the fact that the
experimental setups are different, and a possible damage may occur during the transport of
the specimens and their re-drying at 80°C, one explanation of this difference could be the
possible and slight carbonation of the specimen during the CO2 diffusion test itself which is
performed using 10% CO2 in upstream (although specimens are dried at 80°C). As seen from
the results in (Paper II and section 4.1.2 iii) ), the accelerated carbonation of CEM I hardened
cement pastes at 1% CO2 causes a decrease in the oxygen diffusivity for relative humidity
levels lower than 55%. Note that Gendron’s [89] experimental setup is equipped with a
manometer in both compartment to avoid pressure variation between both chambers, while
our half diffusion cell is not equipped with a manometer (although the inlet and outlet of the
diffusion cell are designed to avoid overpressure in the cell). A pressure gradient could results
in the higher De,O2 values. Still, the correlation between the two test methods results is
promising.
In this context, we cite the previous works of Leemann et al. [91] who compared the non-
steady state diffusivity of O2 and CO2 of carbonated CEM I mortars and found that the CO2
diffusion coefficient is 1.37 lower (instead of 1.17).
The effective diffusion coefficient of oxygen is greater than that of CO2 [143]. Similarly, the
effective diffusion coefficient of H2 is higher than that of xenon Xe [9]. The explanation lies in
the difference in size of the atomic radius. A larger radius limits the diffusion of gas into the
porous network of cementitious materials.
Before any definite conclusion can be made, new inter-laboratory tests must be carried out for
a large set of materials (cement pastes, mortars, concretes…).

56
Hardened cement pastes diffusivity
i) Influence of the hydration duration and degree of water saturation on De,O2
Figure 16 shows the influence of the degree of water saturation on the oxygen-effective
diffusion coefficient of three hardened cement pastes hydrated at 100% RH for three periods
(S = 1 day for OPC and S = 7 days for other HCPs, 2M = two months and 8M = eight months
for all HCPs). All hardened cement pastes are cast at a constant volumetric W/B ratio of 1.6.
Details about the specimens’ preparation and mix design can be found Table 11 and in paper
I. Note that each data point shown in Figure 16 is an average of the oxygen-effective diffusion
coefficient of three replicates.
At 7 days of hydration, samples with silica fume are found to be 9 times less diffusive than
Portland cement pastes and 4 times less diffusive than slag pastes. This could be due to the
extreme fineness of silica fume that densifies the microstructure, which increases the water
retention capacity, leading to a slower transport of oxygen through the sample [141] (Paper I).
Figure 16: Influence of hydration duration and degree of water saturation on the hardened cement pastes’ oxygen-effective diffusion coefficient (100% RH storage durations: S=1 day for OPC and S=7 days for the two others HCP, 2M = two months and 8M = eight months for all HCP)
5E-07
5E-11
1E-11
1E-10
1E-09
1E-08
1E-07
1E-06
0% 20% 40% 60% 80% 100%
De,
O2
(m²/
s)
Degree of water saturation
S_OPC_1.6
2M_OPC_1.6
8M_OPC_1.6
S_OPC_SF_1.6
2M_OPC_SF_1.6
8M_OPC_SF_1.6
S_OPC_Slag_1.6
2M_OPC_Slag_1.6
8M_OPC_Slag_1.6

57
The results in Figure 16 state that the hydration duration is a property that highly impacts the
oxygen-effective diffusion coefficient.
De,O2 of HCP hydrated only for 1 day (OPC) and 7 days (OPC_SF and OPC_Slag) is only
slightly dependent on the degree of water saturation and varies only by a factor of 3.5 at the
most in the degree of water saturation range from 0% to 40%. However, once the same HCPs
are hydrated for 2 months De,O2 is found to vary over three orders of magnitude with the
degree of water saturation of the tested specimens. Even after 8 months of hydration De,O2
continues decreasing with the degree of water saturation. This is mainly observed for samples
with slag and silica fume, as the reaction of SCMs is generally slower than the hydration
reaction of Portland cement and requires longer periods of hydration. It is also worth noting
that the three tested HCP behave differently regarding the oxygen-diffusivity even when
hydrated at the same duration.
ii) Influence of the water-per-binder ratio on De,O2
The influence of the water-per-binder ratio on the oxygen-effective diffusion coefficient is
investigated on three HCP mixes by varying the volumetric W/B from 1.6 to 1.9 (see Table 11).
The diffusion coefficient increases with the increase of the W/B by half to one order of
magnitude, depending on the binder type (Paper I). This result is expected as an increase in
the W/B results in an increase in the total porosity by around 3% at three hydration durations
(Paper I).
iii) Influence of accelerated carbonation on De,O2
The influence of accelerated carbonation (tests carried out at 55 %RH and 1 vol.% CO2
concentration) is investigated on six HCP (Table 11). Figure 17 shows that accelerated
carbonation has a different impact on each HCP and at each relative humidity of
preconditioning. When the tested specimens are preconditioned at 33% and 55% RH, the
De,O2 decreased after carbonation of PC6 and SL35 by a factor of 4.5 at the most, while for
the other HCP De,O2 increased by a factor of 1.1 for LS6 and 10 for SL6 previously conditioned
at the same relative humidity levels.
At the highest relative humidity level (93%), it is noticed that carbonation induced a high
increase in the oxygen-effective diffusion coefficient of the all specimens. De,O2 increased by a
factor of 2.5 for SL35 to three orders of magnitudes for FA6.

58
Figure 17: Influence of accelerated carbonation (1% CO2) on the oxygen-effective diffusion coefficient of six HCPs after preconditioning at three relative humidity levels: 33%, 55%, and 93% RH
In order to deepen the understanding of the influence of accelerated carbonation on the
oxygen-effective diffusion coefficient, the degree of water saturation after preconditioning at
the three relative humidity levels is determined before and after carbonation of all the HCP
using the protocol described in the section 3.2. Note that these values are determined in the
desorption way for all the specimens. Figure 18 shows that carbonation caused a significant
decrease in the water retention capacity especially at 93%RH, this result is in line with the
decrease of De,O2 upon carbonation, since a high degree of water saturation hinders the
transport of gases through the cementitious materials porous network (Paper I)[52][9].
1E-11
1E-10
1E-09
1E-08
1E-07
1E-06
1E-05
33 55 93 33 55 93 33 55 93 33 55 93 33 55 93 33 55 93
PC6 FA6 SL6 LS6 SL35 MK45
De,
O2
(m²/
s)RH(%)
Before carbonation Carbonated

59
Figure 18: Influence of accelerated carbonation (1% CO2) on the water saturation degree of six HCP
The degree of water saturation only slightly decreased upon carbonation for PC6 and SL35
when preconditioned at 33% and 55% RH, while it decreased by 13% for SL6 at these RH
levels which explains partially the higher diffusivity of these materials at these RH. However,
MK45 diffusion performance after carbonation is not completely in line with the Sl change upon
carbonation: at 33% and 55% relative humidity the degree of water saturation of MK45
increased by 6% and 9% respectively, while the oxygen-effective diffusion coefficient
increased by a factor of 1.4 and 2.3. At 93%RH, carbonated MK45 samples are only 3% less
water saturated than non-carbonated specimens, but the diffusion coefficient of carbonated
samples is almost two orders of magnitude higher. The latter could be due to cracking induced
by accelerated carbonation.
The total porosity is also determined before and after carbonation of the HCP following the test
protocol described in section 3.2, the results are given in Paper II. Accelerated carbonation
caused a decrease in the total porosity for all HCP by a factor that varies from 6% to 12%
depending on the binder type. The pore size distribution of these HCP and their composition
variation upon carbonation are also investigated (Paper II).
iv) Influence of the pore size distribution on De,O2
During this thesis work, the pore size distribution of all HCP specimens tested to oxygen-
diffusion (124 specimens) is investigated using mercury intrusion porosimetry. MIP results are
analyzed using an automatic tool that allows for the fitting of the data assuming that each
0%
20%
40%
60%
80%
100%
120%
33 55 93 33 55 93 33 55 93 33 55 93 33 55 93 33 55 93
PC6 FA6 SL6 LS6 SL35 MK45
Deg
ree
of
wat
er s
atu
rati
on
RH(%)
Before carbonation Carbonated

60
mode is of a normal distribution (Figure 19). This tool gives the mean pore diameter of each
mode and its corresponding volumetric fraction. From these two values, we calculated a
weighted average of the pore entry diameter for each HCP (denoted dm). Note that the number
of modes of each MIP data is chosen in order to optimize the fit. Table 39 gives the values of
the pore entry diameters and their volumetric fractions for all HCP.
Log(mean diameter) (m)
Figure 19: An example of MIP data automatically fitted
The mean pore entry diameter dm is compared to the effective-diffusion coefficients
determined experimentally on the HCP at different degrees of water saturation. The oxygen-
effective diffusion coefficient is corrected by the total porosity (𝜙) and the degree of water
saturation (Sl) of the tested samples. This correction is made in order to consider that the
transport process is made only through the gas filled pores. The so-corrected diffusivity, i.e.
D=De,O2/(𝜙(1-S)), is usually calculated using the so called “form factor” (𝜙(1-S)) depending on
parameters such as the tortuosity (see section 2.2.1). As seen in Figure 20, a good correlation
between this diffusion coefficient and dm of the hardened cement pastes is observed when the
degree of water saturation Sl is lower than 30%. The data are much more scattered when the
degree of water saturation is higher.
Vo
lum
ic f
ract
ion
of
Hg
intr
usi
on
[-]

61
Figure 20: Oxygen-effective diffusion coefficient vs. the mean weighted pore diameter of the HCP in log scale
This result could present a first step towards an investigation that allows relating the gas-
diffusivity of cementitious materials to their microstructure. The water content of the cement
paste and its pore size distribution are key properties to predicting gas-diffusion coefficients.
As seen in the section 1.1.1, under Knudsen diffusion (i.e. when the Kn > 10) the gas diffusion
coefficient is proportional to the mean pore diameter, which indicates that the gaseous oxygen
diffusion is under Knudsen regime when the degree of water saturation is lower than 30%. It is
also worth noting that the linear correlation between De,O2 and dm in log-scale is more
pronounced when dm is lower than 72 nm (which corresponds to the means free path of the
gaseous oxygen), i.e. when -log(dm) is lower than 7 (see blue circle in Figure 20).
It has to be noted that all diffusion coefficients data were obtained on partially saturated and
dried samples, whereas the MIP data were performed on the samples dried at 45°C. That is
why the correlation of the diffusion coefficient with porosity parameters can be distorted
especially at higher degrees of water saturation.
Concrete diffusivity
i) Influence of concrete specimen thickness on De,O2
Usually, when concrete transport properties are experimentally determined, common practice
y = 2,0x - 7,1R² = 0,1
y = 2,1x - 7,8R² = 0,5
y = 2,3x - 9,8R² = 0,8
6,0
6,5
7,0
7,5
8,0
8,5
9,0
9,5
10,0
10,5
11,0
6,5 7,0 7,5 8,0 8,5
-Lo
g(D
e,O
2/Φ
(1-S
l))
-Log(dm)
Sl > 60%
30% < Sl < 60%
Sl < 30%

62
is to test specimens with a thickness three times higher than the maximum aggregates size
present in the concrete, or two times the minimum cover thickness (50 mm) [138]. These
specimens are assumed to be representative of the structure’s property of interest.
Nevertheless, some researchers even suggest that a thickness of at least ten times the
maximum aggregate size is required to measure a reliable value of the transport property [144]
(according to [138]). A major limit of testing this kind of concrete specimens is the fact that it
requires very long periods of time to reach water equilibrium [145]. Indeed, as seen in Figure
21, the diffusion time is proportional to the square of the thickness of the tested specimen:
testing specimen with 50 mm thickness is 100 times more time-consuming than specimens
with 5 mm thickness.
Figure 21: Sketch of the experimental program carried out to investigate the influence on concrete specimen thickness (T1, T2, T3 are the diffusion times required for concrete specimens with a thickness of 50mm, 10mm and 5mm respectively)
Figure 22 displays how the oxygen-effective diffusion coefficient varies with the concrete
specimen thickness for four different concrete types dried at 105°C and preconditioned at 93%
RH. The vertical error bars present one standard error of the nine measured De,O2 for 5 mm
and 10 mm thick samples and for three De,O2 values of 50 mm discs. It can be seen from these
results that oxygen diffusivity increases slightly with the specimen thickness for different
concrete mixes (by a factor of 2.6 at the most). These results indicate an opposite trend as to
that which was expected. Note that De,O2 decreases by up to three orders of magnitude
(concrete C4) when the concrete specimens are preconditioned at 95% RH.
63
Figure 22: The effect of concrete specimen thickness on oxygen-effective diffusion coefficient
For dry specimens, the gas diffusivity variation with the concrete thickness could be a result of
drying-induced microcracks at 105°C. Indeed, the thermal gradient during oven-drying is lower
for thin samples, which could lead to a lower thermal stress in these samples hence less
damage/cracks would appear on thin samples. In order to verify the assumption of cracking
induced by thermal gradient, specimens of the concrete C2 are impregnated under vacuum at
200 mbars for 24 hours with a fluorescent resin and their cross section illuminated with an
ultra-violent lamp (Figure 23). The obtained images contradict the possible explanation of
thermal cracks. Thin samples appear to be more damaged that 50 mm thickness samples,
although no clear cracks are seen. It should be noted that this technique is usually used to
investigate materials more porous than concrete.
2E-10
2E-09
2E-08
2E-07
0 10 20 30 40 50 60
De,
O2(m
²/s)
Sample thickness (mm)
C1C2C3C4C1-95%C2-95%C3-95%C4-95%
-dry-dry-dry-dry

64
Thickness De,O2 (m2/s) at the dry state
Cross-section image
8 mm 3.10-8
50 mm 7.10-8
Figure 23: Cross-section of the impregnated concrete sample imaged with a microscope under UV lighting
As seen in Table 17, the total porosity of concretes C2, C3 and C4 slightly increases with the
specimen’s thickness. This could be due to the binder content in each disc. This content is
higher for 50 mm thickness samples. Higher binder content not only leads to a higher total
porosity but could also lead to a higher connectivity of the porous network, hence higher gas
diffusivity. This could be an explanation to the results observed in Figure 22. Indeed Winslow
et al. [146] found a sudden increase in the total porosity when the volumetric fraction of sand
in mortars goes from 44.8% to 48.6%. They explained these results by the interconnectivity of
the interfacial transition zones around the aggregates which varies from 15 to 20 µm. The
aggregate volume fraction of the four tested concrete mixtures is 70%, however the aggregate
volume fractions in thin specimens (5 mm and 10 mm) and 50 mm thickness specimens may
be different.

65
Concrete number
Thickness (mm)
Water porosity (%)
Average Diffusion coefficient at dry state (m²/s)
Average Diffusion coefficient after preconditioning at 93% RH (m²/s)
C1
5.4 14.4 9.5·10-08
(CV = 14%) 6.0·10-09
(CV = 30%) 10.3 13.7
50.0 14.1
C2
4.9 11.0 3.9·10-08
(CV = 5%) 2.8·10-09
(CV = 55%) 10.4 11.2
49.9 11.4
C3
5.6 13.3 5.5·10-08
(CV = 13%) 5.3·10-09
(CV = 15%) 10.4 14.4
48.7 14.6
C4
4.9 11.1 4.0·10-08
(CV = 12%) 2.1·10-09
(CV = 57%) 10.1 11.8
50.9 12.3
Table 17: Concrete gas diffusivity, water porosity and coefficient of variation (CV) under two environmental conditions
As seen in Figure 22 and Table 17, the averaging error for specimens preconditioned at 93%
RH is high and it includes the diffusion coefficient values for 10 mm thickness samples. This is
mainly due to the inhomogeneous distribution of water inside the specimen’s porous network.
De,O2 varied by a maximum factor of 2. Note that results from Table 17 show that the
coefficient of variation (CV) depends on the concrete type and the hydric state of the tested
samples. CV for dry samples is found to be lower than the CV for the samples conditioned at
93% RH. Note that the water saturation degree of these samples is found to vary between
65% and 70% [141].
In this context, we cite the previous work of Chan [138] who found that oxygen diffusivity
increases slightly with the ratio of the concrete specimen thickness to the maximum size of the
aggregate present in the concrete. His results show that the standard error bars were much
larger than the slope (diffusivity vs thickness); he then assumed that the increment was
originated from an averaging error. However, in our case results from Figure 22 show a slight,
but out of the error bars range increase of the effective diffusion coefficient of the four concrete
tested at the dry state. These results are in agreement with previous works of Gardner [147]
who found a slight increase of chloride diffusivity when varying the concrete specimens
thickness (5 mm, 10 mm, 15 mm and 25 mm). It is also worth noting that Tuutti [13] tested the
influence of different concrete specimen thickness on gaseous oxygen diffusion coefficient (10,
20, 30 and 50mm, fixe diameter of 150mm), and found results that contradict ours; the
effective diffusion coefficient of oxygen increased by a factor of almost 50 for thin specimens
66
(10 mm). He then explained these results by the fact that the degree of hydration in thick
specimens (50 mm) could be higher which results in lower porosity thus lower diffusivity. He
also suggests that thinner specimens are more inclined to crack which results in high
diffusivity. Besides the fact that our experimental technique and Tuutti’s are different, our
concrete specimens were cut after hydration of the concrete cylinder (11cm diameter 22cm
height) for 90 days therefore the concrete specimens have more or less the same hydration
degree [138].
To sum up, the dependence of De,O2 on the tested concrete specimens thickness must be
further investigated on different concrete mixtures before any definite conclusions can be
made.
ii) Influence of accelerated carbonation on De,O2 of concrete
Similarly to the investigations carried out on HCP, the influence of accelerated carbonation (1
vol.% CO2) on the oxygen-effective diffusion coefficient and the water saturation degree is
investigated on the concrete specimens described in section 3.7. Figure 24 shows that De,O2
increased by a factor that varies from 1.2 (C_FA) to 10 (C_MK and C_PC) for carbonated
concretes preconditioned at 93% RH. This result is observed for all concrete mixtures except
C_SL4 for which De,O2 slightly decreased by a factor of 1.6 but this could be due to an error of
averaging since the results are within the error bars. At intermediate relative humidity 55%RH,
carbonation caused a decrease of De,O2 by 1.4 and 3 for C_FA and C_PC respectively, while
the latter increased for other concrete mixtures by a factor of 9 (for C_SL) at the most. At low
relative humidity level (33%) De,O2 decreased for C_PC, C_FA, C_LS and C_SL4 by a factor
that varies from 1.33 (C_LS) to 10 (C_FA), while De,O2 increased only for C_SL and C_MK by
a factor of around 2. Note that although the influence of carbonation on the De,O2 is different
for each concrete mixture and each relative humidity level, the total porosity of all concrete
mixtures decreased upon carbonation (Figure 26).

67
Figure 24: Influence of accelerated carbonation (1% CO2) on the oxygen-effective diffusion coefficient of concrete
Figure 25 shows that the degree of water saturation of all tested concretes decreased upon
carbonation for the three relative humidity levels of preconditioning. An exception is seen for
C_MK. However, it is believed that for this mixture the degrees of water saturation obtained at
33% and 55% RH before and after carbonation could be erroneous (Sl at 55%RH is lower than
Sl at 33%RH) because of the inhomogeneous water distribution inside the material which did
not reach the equilibrium yet mainly because of the mass equilibrium criteria adopted in this
study (mass variation within a week<0.05%). We would like to note that the criteria of water
equilibrium followed in this thesis work (mass variation < 0.05% within a week) could results in
a non-homogenous water distribution inside the HCP and concrete specimens.
1E-10
1E-09
1E-08
1E-07
1E-06
33 55 93 33 55 93 33 55 93 33 55 93 33 55 93 33 55 93
C_PC C_FA C_SL C_LS C_SL4 C_MKD
e,O
2(m
²/s)
RH (%)
Before carbonation Carbonated

68
Figure 25: Influence of accelerated carbonation (1% CO2) on the degree of water saturation of concrete previously conditioned at 33%, 55%, and 93% RH
Figure 26 shows that the total porosity decreased for all six concrete mixtures by 1% to 5%.
This result is expected, since carbonation is known to decrease the total porosity of the
cementitious materials and this result is also seen for hardened cement pastes HCP (by up to
12%) (Paper II).
Papadakis et al. [6] reported a decrease by 6% to 9% in the total porosity of mortar specimens
upon carbonation. It is also reported that the variation in porosity is greater on cement pastes
compared to mortars and concretes [148] (Paper II). A high content of portlandite and C-S-H
tends to maximize the drop in porosity. Indeed, the decrease in the total porosity upon
carbonation is mainly due to the filling effect of calcium carbonate [55], since the molar
volumes of calcium carbonate polymorphs is higher than the molar volume of the hydration
products. For example, the carbonation of one mole of Portlandite is expected to result in the
reduction of the porous space by 2 cm3.mol-1 when calcite is formed [20].
0%
10%
20%
30%
40%
50%
60%
70%
80%
90%
100%
33 55 93 33 55 93 33 55 93 33 55 93 33 55 93
C_PC C_FA C_SL C_LS C_MK
Deg
ree
of
wat
er s
atu
rati
on
RH(%)
Before carbonation Carbonated

69
Figure 26 : effect of carbonation on the total porosity of the concrete specimen
iii) Oxygen permeability vs oxygen diffusivity
Currently, in performance based approach, the oxygen permeability is the transport property of
interest [133]. This measurement procedure is still preferred to gas diffusivity mainly due to its
ease of manipulation. Furthermore, the performance of a diffusivity test requires specific
attention to pressure variation which could be challenging. The oxygen permeability test
suitability to investigate the carbonation performance of concrete can be evaluated through a
comparison with the oxygen diffusivity.
Figure 27 compares the oxygen permeability with the oxygen diffusivity of 44 concretes dried
at 105°C in log-scale. For each mix, values of De,O2 and KO2 are computed as the average
value of three replicates. Markers on Figure 27 present the cement type used for the tested
concrete and colors indicate the W/B ratio. For example, a light red circle is a CEM I concrete
of a W/B = 0.65. The results show a very poor correlation between the two transport
properties. Therefore, the relevance of the gas permeability results to investigate the
carbonation performance of cementitious materials is questionable.
0
5
10
15
20
25
C_PC C_FA C_S C_L C_S37 C_MK
Wat
er
po
rosi
ty (
%)
Before Carbonation (BC) After Carbonation (C)
S L C_SL4

70
(a)
-Log(KO2)= 11.5 - 0,64*Log(De,O2)
R² = 0.24
Figure 27: O2-effective diffusion coefficient (-Log(De, O2)) vs O2 gas permeability (-Log(KO2))
These results could be explained by the fact that permeability and diffusion are two different
processes with two different driving mechanisms; pressure gradient and concentration
gradient respectively. Furthermore, the oxygen permeability and diffusivity may be influenced
differently by different factors including drying temperature, moisture distribution, gas pressure,
gas flow, and specimens’ geometry.
It is also worth noting that this comparison is carried out by determining the apparent
permeability and not the intrinsic KO2, and the drying protocol for the specimens tested to
oxygen-diffusivity is different than the drying protocol required by the French standard XP P18-
463 [133] for oxygen permeability although the determination of both transport properties was
carried out after drying at 105°C.
Drying induced microcracks (at 105°C), influences highly the oxygen permeability (a factor up
to 100), while they only vary De,O2 by a factor of 2 at the most [56].
Some researchers [99], [8], [149], [107] suggest that there is a good correlation between these
two properties. However, these results are only determined for a limited number of concrete
mixtures. Moreover, these results are established using different experimental setups than
ours and different drying protocol. Villani et al. [99] tested mortar samples prepared with OPC
cement with a water-per-cement of 0.30, 0.40, 0.42 and 0.50, and an aggregate volume
fraction of 55%. Oxygen diffusivity was determined using an equipment based on Lawrence

71
setup [8], and the oxygen permeability was determined following the procedure used in south
Africa [149]. The correlation between De,O2 and KO2 was established on 6 concretes.
Salvodi et al. [149] established a good correlation between De,O2 and KO2 of four concrete
mixtures made with OPC, Fly ash, Slag and silica fume. Oxygen Permeability was measured
using the South African Oxygen Permeability Index (OPI) test (after 7 days drying at 50°C) the
effective dry diffusion coefficient was calculated from results of accelerated carbonation test
and corrected by an environmental parameter.
4.2 CO2-binding capacity
Test method
i) Equipment
The second objective of this thesis work is to develop a new test method to determine the
second property of interest regarding carbonation: the CO2 binding capacity and reaction rate.
The main idea of this test method is to determine the carbonation kinetics and the amount of
carbonatable products based on the measurement of the instantaneous CO2 binding rate.
Therefore, an experimental setup is designed in order to meet the following specifications:
• The diffusion process must be neglected:
The tested samples are powdered materials sieved using a 63 µm sieve and of a mean
diameter of 43 µm. Using this grain size allows for neglecting the mass diffusion between the
grains according to Thiele modulus ϕn2 (Paper III).
The Thiele modulus is defined as the ratio of the diffusion time (Tdiffusion) to the reaction time
(Treaction). De,CO2 is the CO2-effective diffusion coefficient in air [1.6x10⁻⁵ m²/s], [CO2]0 [gCO2/m3]
is the CO2 concentration at the surface of the specimen, d [m] is the specimen thickness, k0
[gCO2.g-1powder.s-1] is the reaction kinetic constant and ρ [gpowder/m3] is the material density. Low
values of the Thiele modulus indicate the surface reaction control and a significant amount of
the CO2 diffusing well into the grains’ interior without reacting. High values of the Thiele
modulus indicate that the surface reaction is rapid and that the reactant is consumed very
close to the external surface so only very little penetrates into the interior of the grain [150].
ϕn2 =
Tdiffusion
Treaction=
d² ∗ k0 ∗ ρ
De,CO2 ∗ [CO2]0
Equation 30

72
Testing a powdered material allows for neglecting the mass diffusion according to the
calculation of this modulus (Further details about the computation of this number can be found
in Paper III).
• The ageing process / exposure to carbonation must be under controlled relative
humidity and ambient CO2 concentration.
The carbonation chambers, inside which the powdered specimens are exposed to
carbonation, are equipped with saturated salt solutions and a ventilation system to ensure
stable relative humidity and settled CO2 concentration at room concentration (Figure 28 (a)).
The air pump draws in the ambient air, passes it through the bubbler to regulate it at the RH of
the test by means of a saturated salt solution. Therefore, the pump circulates the air at the
room CO2 concentration and the desired RH inside the climate chamber. The flow rate of the
air pump is 300L/h. The volume of the chamber is of 40L and is well aerated thanks to an axial
fan.
• The total measurement time must be negligible with regards to the overall carbonation
period of the sample
The measurement time is set to 5 min to 15 min and the overall carbonation time is 28 days at
the most.
• Carbonation cells used to measure the CO2 uptake must be of variable volume since
the CO2 depletion time is proportional to the gas volume. The equipment must be easy
to handle and equipped with a CO2 sensor.
The measurement cell is designed in a cylindrical shape with an adjustable volume (from 10 to
285 ml thanks to a piston), and the upper side of the cell is equipped with a CO2 sensor
(Figure 28 (b)). For powders that are highly reactive with CO2, the cell volume is set at its
maximum value and vice versa.

73
(a) (b) (c)
Figure 28: CO2 binding capacity test method equipment: (a) climate chamber, (b) closed cell for carbonation, (c) sample holder [151]
The infrared CO2 sensor determines the CO2 uptake by the tested powder inside the cell once
the measurement starts (cell closed). The sensor is provided by CO2Meter. Its response time
is of 30 sec and its measurement range is of 0 – 10.000 ppm with an accuracy of 50 ppm.
Data logging is made using GasLab software which allows real-time data analysis.
ii) Test protocol
The tested materials are first grinded and sieved to 63 µm, then 1g of the powder is evenly
and thinly distributed on a sample holder (a disc of 110 mm diameter as shown in Figure 28
(c)) and placed inside a climate chamber regulated at a certain RH by means of saturated salt
solutions. Soda lime is added inside the climate chamber in order to avoid carbonation during
this preconditioning period of 15 days (CO2 concentration 10 ppm at the beginning of the
preconditioning period, this concentration was not monitored continuously).
The sample holders are then placed in the carbonation cell which is exposure to natural
carbonation (around 450 ppm) under a specific relative humidity in the open system that
consists of the equipment shown in Figure 28 (a).
The CO2 uptake by the tested specimen is determined in the closed cell shown in Figure 28 (b)
once a day the first week for a period of 15 min. Then, the frequency of CO2 uptake
measurement is adapted as a function of time evolution of the reaction rate. During the period
of 15 min, the CO2 sensor measures the decrease of CO2 concentration inside the closed cell,
where the reaction of carbonation took place. The test is stopped if the amount of
carbonatable products vs. the carbonation time reaches a plateau or when the CO2 depletion

74
rate is below the detection limit of the experimental setup or when the test is time-consuming:
longer than 28 days. This lower limit is determined by running a leakage test on the
carbonation cell for 24h after flushing it with gaseous nitrogen. The variation of CO2
concentration during the blank test corresponds to an equivalent CO2 instantaneous binding
rate of 6.10-10 gCO2.gcement-1.s-1. This value is computed using Equation 31, for which the slope
is the leakage rate. More details about the test method can be found in (Paper III). Six
carbonation cells are designed and used in this thesis work.
iii) Experimental data analysis
The collected raw data consist in the variation of CO2 concentration as a function of time
measured by a CO2 gas sensor over the carbonation exposure period (see Figure 29).
Figure 29: Raw experimental data of the CO2-uptake curves of Portlandite powder carbonated at 55% RH at different carbonation periods: 6 hours, 1, 2 days (gas volume = 200 mL), and 6 days (gas volume = 10 mL)
The initial CO2-consumption slope is determined from each CO2-uptake curve using a data
analysis software. The measured slope [ppm.s-1] is converted into an instantaneous CO2
binding rate IBR [gCO2.gcement.s-1] according to Equation 31. P [Pa], MCO2 [g.mol-1], Vg [m3], R
[m3.Pa.K−1.mol−1], and T [K] are the ambient pressure, the molar mass of carbon dioxide, the
inside volume of the closed cell, the ideal gas constant and the ambient temperature
respectively. m0 [g] is the mass of the tested specimen with no bound CO2 or water; it is
corrected by the TGA results (at 1000°C) performed after preconditioning of the powders.
0
50
100
150
200
250
300
350
400
450
500
0 2 4 6 8 10
CO
2 c
on
cen
trat
ion
(pp
m)
Time (min)
6 hours1 day2 days6 days
- Initial slope

75
IBR = Slope ∗ P ∗ MCO2 ∗ Vg
R ∗ T ∗ m0 Equation 31
B−CO2(t) = ∫ IBR dτ
t
t=0
Equation 32
carbonatable products =CBC ∗ cement dosage
MCO2
Equation 33
DoC =CBC
MBC
Equation 34
MBC = ∑ %CaO ∗ MCO2
MCaO− %SO3 ∗
MCO2
MSO3 Equation 35
The amount of CO2 bound at different exposure periods to carbonation (t) is determined by
trapezoidal integrating the curve of the instantaneous binding rate as a function of time
(Equation 32). The CO2 binding capacity (CBC) of the tested material after the overall
exposure period to carbonation is the amount of bound CO2 at the last CO2-uptake
measurement (CBC = B_CO2 (t = Tf)). The amount of carbonatable products (per m3 of the
material) [mol.m-3] is then deduced from the CO2-binding capacity [gCO2.gcement.s-1], the cement
dosage [kg.m-3] and the molar mass of carbon dioxide [g.mol-1] as shown in Equation 33. The
degree of carbonation (DoC) is calculated following Equation 34, where the maximum binding
capacity (MBC) is calculated from the chemical composition of the tested material assuming
that all CaO will be transformed into CaCO3 except the one that reacts with SO3 to form
CaSO4 (Equation 35). MSO3 [g.mol-1], MCO2 [g.mol-1], MCaO [g.mol-1], are the molar masses of
trioxide sulfur, carbon dioxide and calcium oxide respectively. Further information about the
test method can be found in Paper III.
CO2 binding capacity of the synthetic cement phases
In order to enhance the understanding of the carbonation behavior of the main cement phases
present in hydrated and non-hydrated cement pastes, portandite, ettringite, calsium-silicate-
hydrate (Ca/Si = 0.9), triclinic alite, β-belite and cubic Tricalcium aluminate are synthetized and
tested to natural carbonation using the method we developed (section above).

76
Figure 30: Variation of the Instantaneous binding rate (IBR) as a function of the degree of carbonation (DoC) at three relative humidity levels for synthetic anhydrous and hydrates
Figure 30 presents the evolution of the carbonation rate (IBR) with the degree of carbonation
(DoC) at three relative humidity levels for the carbonation periods shown in Table 18.
Material CH C-S-H Ettringite C2S C3S C3A
RH (%) 93 55 33 93 55 33 93 55 33 93 55 33 93 55 33 93 55 33
Ageing period (days) 14 15 25 27 27 27 35 11 29 13 13 13 14 14 15 13 13 13
Table 18: Carbonation exposure period of synthetic materials at different RH
The results show that the carbonation rate decreases remarkably with the increase of the
degree of carbonation except for ettringite powder carbonated at 93% RH. This result could be
due to the formation of carbonates layer on the surface of the tested grains, which hinders
further dissolution of the calcium oxide and transport of CO2. Figure 31 shows the
morphological changes on C3S and ettringite powder after carbonation at 93%RH. The
carbonate products cover the C3S surface while they precipitate between the ettringite
needles, which could explain the IBR variation of ettringite powder.
1E-10
1E-09
1E-08
1E-07
1E-06
0% 5% 10% 15%
IBR
( g
co2.g
pow
der-1
.s-1
)Degree of carbonation (DoC)
C3S_33%RH
C3S_55%RH
C3S_93%RH 1E-10
1E-09
1E-08
1E-07
1E-06
0% 2% 4%
IBR
( g
co2.g
pow
der-1
.s-1
)
Degree of carbonation (DoC)
C2S_33%RHC2S_55%RHC2S_93%RH 1E-10
1E-09
1E-08
1E-07
1E-06
0% 2% 4%
IBR
( g
co2.g
pow
der-1
.s-1
)
Degree of carbonation (DoC)
C3A_33%RHC3A_55%RHC3A_93%RH
1E-10
1E-09
1E-08
1E-07
1E-06
0% 20% 40%
IBR
( g
co2.g
pow
der-1
.s-1
)
Degree of carbonation (DoC)
CH_33%RHCH_55%RHCH_93%RH 1E-10
1E-09
1E-08
1E-07
0% 20% 40% 60%
IBR
( g
co2.g
pow
der-1
.s-1
)Degree of carbonation (DoC)
AFt_33%RHAFt_55%RHAFt_93%RH 1E-10
1E-09
1E-08
1E-07
0% 20% 40% 60%
IBR
( g
co2.g
pow
der-1
.s-1
)
Degree of carbonation (DoC)
C-S-H_33%RHC-S-H_55%RHC-S-H_93%RH

77
(a) C3S before carbonation
(b) C3S carbonated at 93%
(c) Non-carbonated Ettringite
(d) Ettringite carbonated at 93% RH
Figure 31 : Morphological evolution of C3S, and AFt powders after exposure to carbonation at 93% RH (Paper III)
Figure 30 shows that the degree of carbonation increases with the relative humidity under
which the carbonation experiments are carried out. This result is expected as the carbonation
reaction kinetics are controlled by the dissolution of gaseous CO2 and CaO. Portlandite and C-
S-H degree of carbonation reached around 26% even when carbonation at 33% and 55%
relative humidity due to their relatively higher solubility. For other materials, no significant
carbonation is observed at these relative humidity levels. Regarding anhydrous materials, only
C3S carbonated at 93%RH (DoC ≈ 14%). This result could be due to the formation of a C-S-H
layer on the grain surface as suggested SEM image in Figure 31 (b) (see Paper III).
The powders did not reach the theoretical maximum degree of carbonation (MBC). In fact, the
decrease of the rate of carbonation reaction can be related to the decrease of the reactive

78
surface area. During carbonation, calcite precipitates which results in the reduction of porosity.
Calcite creates also a layer which covers the non-carbonated materials and as a
consequence, carbonation reaction stops before the complete carbonation of materials (Paper
III).
Note that the BET surface area and density of these materials are determined before
carbonation and after carbonation at 93%RH. Results (Paper III) show that the surface area
increased for all powders except for portlandite and C-S-H powders, while the apparent
density decreased for anhydrous mineral and increased for portlandite and ettringite to values
close to the density of calcium carbonates (2.7 g/cm3) [152].
Fluctuations of the instantaneous binding rate are noticed in Figure 30 what can be explained
by the variability of the CO2 concentration at the beginning of each measurement because of
the presence of different operators inside the room. Figure 32 shows a distribution of the initial
CO2 concentration of the measurements and the number of the data in each range of the CO2
concentration. The mean value of the initial concentration is 474.5 ppm with a standard
deviation of 114.3 ppm. This result confirms that the initial CO2 concentration is mostly around
450 ppm.
Figure 32: Initial CO2 concentration distribution
Note that regulating the CO2 concentration inside a concrete laboratory is a challenging task
because of the depletion of atmospheric CO2 in the presence of cementitious materials and
the operators’ presence inside the room [3].

79
CO2 binding capacity of hydrated cement pastes
The hardened cement pastes shown in Table 11 are hydrated for 90 days, sawed to thin discs
of 3 mm thickness, dried under vacuum for 48 hours, grinded and sieved to 63 µm. The
powders are then preconditioned at three relative humidity levels (33%, 55% and 93% RH) for
15 days with soda lime before starting the atmospheric carbonation test. After this
preconditioning period, the initial degree of carbonation is determined by means of TGA
analysis (Equation 29). As seen in Figure 33, the HCP carbonated significantly during the
preconditioning period even though soda lime was added inside the climate chambers and the
CO2 concentration did not exceed 10 ppm. This carbonation could be due to a leakage
problem inside the climate chambers. The initial degree of carbonation varied from 9% (PC6 at
33%RH) to 44% (LS6 at 55% RH).
Figure 33: Variation of the Instantaneous binding rate (IBR) as a function of the degree of carbonation (DoC) at three relative humidity levels for the tested HCP
Figure 33 shows the evolution of the IBR with the DoC after 28 days of carbonation at 33%,
55% and 93% RH. Unlike pure synthetic phases (Figure 30), the maximum degree of
carbonation is reached when the carbonation test is carried out at 55%RH for PC6, LS6 and
MK45. The DoC values after 28 days of carbonation at 55% and 93% RH are close for FA6,
SL6 and SL35. At low relative humidity (33%RH), the degree of carbonation varied from 14%
1E-11
1E-10
1E-09
1E-08
1E-07
1E-06
0% 20% 40% 60%
IBR
( g
co2.g
pow
der-1
.s-1
)
Degree of carbonation (DoC)
PC6_33%RHPC6_55%RHPC6_93%RH 1E-11
1E-10
1E-09
1E-08
1E-07
1E-06
10% 20% 30% 40% 50%
IBR
( g
co2.g
pow
der-1
.s-1
)
Degree of carbonation (DoC)
FA6_33%RHFA6_55%RHFA6_93%RH
1E-11
1E-10
1E-09
1E-08
1E-07
1E-06
10% 30% 50%
IBR
( g
co2.g
pow
der-1
.s-1
)
Degree of carbonation (DoC)
SL6_33%RHSL6_55%RHSL6_93%RH
1E-11
1E-10
1E-09
1E-08
1E-07
1E-06
20% 40% 60% 80%
IBR
( g
co2.g
pow
der-1
.s-1
)
Degree of carbonation (DoC)
LS6_33%RHLS6_93%RHLS6_55%RH
1E-10
1E-09
1E-08
1E-07
1E-06
10% 30% 50%
IBR
( g
co2.g
pow
der-1
.s-1
)
Degree of carbonation (DoC)
SL35_33%RHSL35_55%RHSL35_93%RH 1E-11
1E-10
1E-09
1E-08
1E-07
1E-06
0% 50%
IBR
( g
co2.g
pow
der-1
.s-1
)
Degree of carbonation (DoC)
MK45_33%RHMK45_55%RHMK45_93%RH

80
to 30%, while it reached up to 53% and 46% when the HCP are carbonated at 55%RH and
93%RH respectively.
Comparison with TGA results
The degree of carbonation (DoC) determined using the new test method is compared with the
DoC obtained from TGA analysis. Figure 34 (a) shows that the results are in agreement (the
average percent error is 24%), which highlight the accuracy of the measurements with the IBR
method, since TGA results are hard evidence on the carbonation reaction.
(a)
(b)
Figure 34: DoC (degree of carbonation) results from TGA vs DoC results from carbonation cell (a) synthetic minerals (b) HCP
The DoC reached by the six hydrated cement pastes after 28 days of carbonation calculated
based on the CO2 IBR method are also compared with TGA results (Figure 34 (b)). The
degrees of carbonation from the new method are in a less favorable agreement with TGA
results in the case of HCP (average percent error of 35%). This result could be mainly due to

81
the high carbonation of the HCP during the preconditioning period and to the
representativeness of sample used for TGA analysis, which represents only 1/20th of the
powder tested to CO2 binding capacity CBC. In the case of HCP, the carbonation is more
complex since many reactions occur simultaneously. Still, the obtained results are
encouraging, giving that TGA is based on direct solid analysis and our test method consists in
instantaneous non-continuous measurements of the CO2 uptake.

82
V. Chapter V: Discussion
5.1 Limits and advantages of the developed test methods
This thesis project proposes two simple, timesaving, reliable and cost-effective test methods to
determine the carbonation properties required for carbonation depth prediction models. The
following chapter gives a summary of the main advantages and limits of the developed test
methods. The experimental data obtained using these techniques are discussed and
compared to literature findings and used as direct input parameters for two carbonation depth
prediction models. The results are compared to the carbonation depths given by a pH-indicator
under natural and accelerated exposures for HCPs and concrete specimens.
Gas diffusion coefficient test method
Oxygen-effective diffusion coefficient test method is interesting due to its ease and safe
manipulation, its non-destructive and time-saving nature, its potential to give an indication of
the material’s performance, and its ability to test all types of cementitious materials under
different degrees of water saturation in the range from 10-11 to 10-6 m2/s. The existing test
methods in the literature (section 2.2) are all based on the use of two half diffusion cells which
could raise leakage problems and increases the detection limit of the test method.
Furthermore the reproducibility and detection limit of these setups are scarcely reported
[13][87]. The test methods based on the determination of the CO2 diffusion coefficient [89][94]
limit the condition of the tested material to the dry state only. On the other hand, the test
methods based on the diffusivity of pure gaseous oxygen are neither practical nor safe
because of the need to use an oxygen bottle [100][13].
The coefficient of variation of our test method varies between 4% (at dry state) and 48% (at
93% RH) depending on the hydric state which controls the water distribution inside the
material. This result is promising comparing to the coefficient of variation of oxygen
permeability that varied between 10% and 94% at the dry state (from our results presented in
Figure 27). Nevertheless, the decision as to whether these results are to be judged ‘sufficiently
precise’ depends on how they are to be used.
Since the oxygen-effective diffusion coefficient test method measurement range is [10-11, 10-6]
m²/s, the diffusion coefficient of cementitious materials with high gas tightness cannot be
determined with sufficient precision. Furthermore, according to the previous works of Soukup
et al. [97] a small pressure difference (around 8 Pa) between the Wick Kallenbach and

83
Graham’s diffusion cells compartments (based on the flux principle), leads to a deviation of the
net volumetric diffusion flux by more than 5% specially for materials with a mean pore
diameter above 6µm. Moreover, the condition of application of the Graham’s law is the
pressure equality in both compartments [98]. Therefore, the influence of the pressure gradient
in our half diffusion cell must be investigated, even though care was taken to flush the inside of
the cell with a very slow flow rate.
Moreover, regarding the impact of the tested concrete specimen thickness, an increase in
De,O2 by a factor of 2.6 at the most is observed when the concrete thickness varies from 5 mm
to 50 mm. This variation could cause an underestimation of the carbonation depth by a factor
of 1.6 when testing only thin samples (which is more convenient). This variation is still very low
compared to drying induced microcracks effect on other transport properties such as gaseous
oxygen permeability [56][153]. Still the dependence of the oxygen diffusivity on the specimen
thickness is established for 4 concrete mixes only and further tests are necessary.
Note that the test method is already being used (Soja et al. [154][36], Bertin [46]) and a round
robin test to further validate the method is planned in the framework of the TC Rilem GDP
[155]. The main objective of the latter is building a consensus on gas diffusion test methods by
comparing testing principles.
CO2-binding capacity test method
The method developed to determine the CO2 binding capacity and rate is simple, safe, reliable
and cost-effective compared to thermogravimetric analysis. Results from this test method
allow for the determination of the amount of bound CO2 under different relative humidity levels,
rather than predicting this value from C-S-H and CH content in the paste or CaO content in the
cement. Moreover, the carbonation reaction kinetics can be determined at different periods of
carbonation which is of high interest in the modeling of the carbonation front progress.
The test method results are in a satisfactory agreement with the TGA results: the average
percent error is 24% and 35% for synthetic materials and HCP respectively. Note that there
are few test methods based on the determination of the CO2-binding capacity of powdered
HCP in a non-continuous manner [113][156], and the existing ones are based on the TGA
analysis [14] or the weight monitoring [157]. The first one is expensive and destructive while
the latter induces errors as the carbonation reaction is accompanied by water release also.
The developed method is rather time-consuming taking 7 to 28 days to complete. This is also
valid if the test method used is thermogravimetric analysis, as the carbonation exposure period
is the same. Nevertheless, one TGA result requires approximately 2 hours depending on the

84
heating rate, while a single CO2-uptake measurement doesn’t exceed 20 min. Still, the CO2-
binding capacity technique requires preconditioning in a CO2-free environment, which is rather
challenging from a practical point of view. Furthermore, the preconditioning period of the
tested powdered cementitious materials must be determined precisely prior preconditioning at
different relative humidity levels.
5.2 Materials properties
Influence of different parameters on De,O2
The diffusion coefficient increases with the increase of the volumetric W/B ratio (by half to one
order of magnitude), which can be explained by the formation of higher porous volume that
allows for an easier and faster ingress of gaseous oxygen. These results are in agreement
with several studies in the literature [143][9][55]. Bentz et al. [158] explains that, for a lower
W/B, the capillary porosity consists of a network of pores finer and more discontinuous.
Furthermore, Baroghel-Bouny [159] explains that when the W/C decreases, the capillary
porosity is reduced and the pore network becomes finer, which increases the water content at
a given RH. This result explains the increase in De,O2 with the volumetric W/B especially at
high relative humidity levels as a higher water content would hinder the gas transport. Note
that gas transport through water filled pores is 104 to 105 slower than gas transport through air
filled pore.
The diffusion coefficient decreased with the hydration duration. Prolonged hydration results in
the formation of more hydrates, finer porosity and a more tortuous network. Therefore, the
water retention capacity of the material increased highly which substantially reduces the
diffusion coefficient (by up to three orders of magnitudes), especially for samples with slag and
silica fume, as the reaction of SCM is generally slower than the hydration reaction of Portland
cement. Silica fume and Slag mixes diffusivity is around 10 times lower that OPC’s after 8
months of hydration. This could be explained by the fine pore structure of these mixes (see
Paper I). In this context we cite the previous work of De Belie et al. [160] that revealed the
high amount of gel pores in a HCP with 10% silica fume, related to the high amount of C-S-H.
The latter would increase the water retention capacity of the HCP which would result in a De,O2
10 times lower than De,O2 of OPC pastes.
The De,O2 highly decreases when the degree of water saturation is higher than 40% for HCP
hydrated for 2 and 8 months. De,O2 varied by up to three orders of magnitude from the dry state
to high degrees of water saturation (>80%). The higher degree of water saturation is seen on

85
well hydrated pastes as a prolonged hydration causes the formation of a greater amount of
hydrates that fill the capillary porosity and help retain higher amounts of water which hinders
the gas diffusivity. This result is consistent with other studies carried out on similar cement
pastes well hydrated using a different test method that also showed a great decrease in gas
diffusivity for RH>55% [161][56]. It is of high importance to note that even though the hydration
stopped samples were previously preconditioned at high relative humidity level (93% RH),
their degree of water saturation Sl is lower than 45% and the De,O2 only slightly depends on the
preconditioning RH. Therefore, it is more consistent to relate the carbonation performance of
the cementitious materials to their degree of water saturation rather than the relative humidity
of preconditioning.
Table 19 gives a summary of the influence of accelerated carbonation (1% CO2 at 55%RH) on
De,O2 and Sl of HCP and concrete (the results previously presented in Figure 24 and Figure
25). It is noted from these results that accelerated carbonation induced comparable effects on
the water retention capacity of all tested concretes and their corresponding HCP. However, an
opposite trend is observed regarding the oxygen diffusivity of fly ash materials: while the De,O2
decreased upon carbonation of concrete specimen, it increased highly upon carbonation of the
HCP at the three relative humidity levels. In agreement with our results on HCP, Dutzer et al.
[52] states that after accelerated carbonation (3% CO2) cracking dominates for blended
cements leading to significant increase in transport properties (gas diffusivity of helium and
nitrogen), while pore clogging is observed for OPC pastes which lower their gas diffusivity. In
agreement with our results on concrete specimens, Bertin [46] noted that the oxygen diffusivity
decreased by a factor of about 2 for fly ash concrete at the dry state while it increased by
almost a factor of 2 for slag concrete. The increase in the oxygen diffusivity could be explained
by the fact that the pore structure connectivity increases after carbonation due to the
decalcification of C-S-H.

86
De,O2 (BC) / De,O2 (C) Sl (BC) / Sl (C)
RH (%) 33 55 93 33 55 93
Hardened PC6 2.8 2.1 0.1 1.0 1.2 1.3
cement FA6 0.7 0.4 ~10-4 1.2 1.5 1.8
pastes SL6 0.2 0.1 0.0 1.6 1.6 1.3
LS6 1.1 0.9 0.2 1.3 1.3 1.9
SL35 4.6 3.1 0.4 1.0 1.2 1.1
MK45 0.7 0.4 0.0 0.9 0.9 1.0
Concrete
C_PC 2.5 2.5 0.1 1.2 1.0 1.4
C_FA 7.7 1.4 1.0 1.7 1.6 1.5
C_SL 0.6 0.1 0.1 1.7 2.1 1.4
C_LS 1.3 0.7 0.2 1.8 1.6 1.8
C_SL4 5.0 0.6 2.6 - - -
C_MK 0.6 0.2 0.1 1.0 1.0 0.8
Table 19 : Summary of the influence of accelerated carbonation (1% CO2) on Sl and De,O2 of concrete and their corresponding HCP. BC: before carbonation, C: carbonated
Regarding the direct link between the pore size distribution and the oxygen-effective diffusion
coefficient, our results reveal a good correlation between the pore diffusion coefficient
(corrected by Φ(1-Sl): apparent diffusivity) and the mean pore diameter of the hardened
cement pastes (in log-scale) when the degree of water saturation Sl is lower than 30% which
could be due to the predominance of Knudsen diffusion regime. In this context we cite the
previous works of Peretti et al. [85] who suggest that oxygen diffusivity is related to the
moisture-free porosity volume fraction with an exponential correlation, and Peng et al. [100]
who investigated the correlation between oxygen diffusivity and pore size distribution of rock
samples, repacked sand and sediment and found a linear regression coefficient that describes
the exponent in Archie’s law and the volumetric mean pore diameter. The correlation between
the critical pore radius obtained from MIP and the oxygen-effective diffusion coefficient
(obtained using our experimental setup) was also highlighted in the work of Soja [154].
CO2-binding capacity and rate at different RH
The CO2 binding capacity (CBC) and rate of the synthetic anhydrous, hydrates, and powdered
HCP is determined at three relative humidity levels (33%, 55% and 93%). The bound CO2 and
instantaneous binding rate increase with the relative humidity under which the carbonation of
synthetic materials test is carried out, while the maximum binding capacity of the hardened
cement pastes is observed at 55% RH. The amount of bound CO2 increases highly during the
first week of exposure to carbonation and only slightly varies afterwards (Paper III), which is of
high interest in a practical point of view since it could shorten the measurement time to 7 days
instead of 28 days.
Table 20 gives a summary of the CO2 binding capacity and the instantaneous binding rate of

87
the HCP and synthetic phases (detailed results are shown in sections 4.2.2 and 4.2.3). The
maximum CO2 binding capacity is observed for portlandite powders, followed by PC6 and the
other hydrated cement pastes. This result highlights the role of portlandite to fix CO2 in
cementitious materials. Furthermore, among synthetized phases, CH and C-S-H are the only
phases that carbonated also at 33% and 55% RH. These phases presence in the tested HCP
(see Paper II) could explain their carbonation at 33% and 55% RH, since no carbonation of the
other synthetized phases is noticed at these RH. The highest CBC is observed for the non-
blended HCP which contains the highest amount of CH (paper II). Since portlandite is
produced only by clinker, it is expected that the portlandite proportion decreases with the
proportion of clinker as already observed in previous works [162] [163] and in Paper II.
Regarding the CO2 binding capacity of hydrated cement pastes, an increase is noticed in the
CBC when the carbonation is carried out at 55% and 93% RH. However, the maximum CBC is
reached at 55% RH for most HCP except FA6.This result could be explained by the important
carbonation of these HCP during the preconditioning period.
MBC
(10-2
gco2 gcement-1)
CBC
(10-2 gco2 gcement-1)
IBR
(gco2 gcement-1s-1)
33%
RH
55%
RH
93%
RH 33% RH 55% RH 93% RH
Synthetic
phases
C3S 58 1.6 2.6 8.2 10-8 to 10-10 10-8 to 10-9 10-7 to 10-8
C2S 51 0.3 0.6 1.1 10-9 to 10-10 10-8 to 10-9 10-7 to 10-9
C3A 49 0.6 0.8 1.1 10-8 to 10-10 10-7 to 10-9
CH 60 14.3 16.0 23.0 10-6 to 10-9 10-7 to 10-8 10-6 to 10-9
AFt 39 0.3 2.7 16.4 10-8 to 10-10 10-8 to 10-9
C-S-H 36 6.4 9.3 22.0 10-8 to 10-9 10-8 to 10-9 10-7 to 10-9
Hardened
cement
pastes
PC6 60 14.6 25.0 21.4 10-6 to 10-9 10-6 to 10-9
FA6 44 6.3 20.0 21.0 10-7 to 10-10 10-7 to 10-9 10-7 to 10-10
SL6 45 8.3 17.5 16.1 10-6 to 10-9 10-6 to 10-9 10-7 to 10-9
LS6 38 11.1 21.5 17.8 10-6 to 10-9
SL35 42 8.2 19.7 18.6 10-7 to 10-9 10-6 to 10-9 10-7 to 10-9
MK45 45 6.0 25.0 16.0 10-7 to 10-9 10-7 to 10-9 10-7 to 10-10
Table 20: Summary of the CO2-binding capacity and rate of the HCP and synthetic minerals. MBC: maximum theoretical CO2 binding capacity (from mineral composition), CBC: maximum measured CO2 binding capacity, IBR: instantaneous binding rate.
Table 20 shows that the IBR of the tested materials varied over four orders of magnitudes and
depends on the material composition and the relative humidity under which the carbonation
tests are carried out. The highest IBR are observed for CH and PC6 powders.

88
5.3 Comparison of experimental results to Millington’s
model
As explained in section 2.2.1, the CO2-effective diffusion coefficient can be estimated using
models developed to predict De,CO2. Based on Millington model [102], Thiéry et al. [39]
proposed an expression (Equation 11) giving De,CO2 as a function of the water saturation
degree Sl , total porosity , and the CO2 diffusion coefficient in air (D0,CO2 = 1.6x10⁻⁵ m²/s).
Empirical parameters of this model (a = 2.74, b = 5.17) were obtained by fitting experimental
data of tests performed on carbonated mortars at different RH [11].
The oxygen-effective diffusion coefficient (De,O2) can be estimated from the CO2 diffusion
coefficient (De,CO2) using Graham’s law. Equation 36 gives De,O2 (from Millington’s model
Equation 11) and Graham’s law. MCO2 and MO2 are the molar mass of carbon dioxide and
oxygen respectively.
De,O2 = (MCO2
MO2)
12 D0,CO2 ϕa (1 − Sl)
b
Equation 36
Table 21 gives the total porosity Φ and the degree of water saturation Sl regression
parameters a and b of the HCP tested during this thesis work (Table 11). These parameters
are calculated by least square fitting of all the experimental data for each binder type (section
3.6).
Note that the good quality of the least square fit is achieved by minimizing value of the sum of
squared residuals r. In our case, r is in the range of 10-12 to 10-10 m²/s, which is lower than the
average measured diffusion coefficients.
OPC Silica fume Slag Fly ash Metakaolin Limestone
a 5.5 4.8 5.5 5.6 2.6 5.2
b 2.7 3.7 8.9 2.6 2.8 1.2
Residual (r) 8.9·10-11 9.8·10-12 7·10-11 5.8·10-12 2.7·10-11 2.8·10-10
Number of fitted data
94 71 114 18 21 21
Table 21: Calculation of Millington’s model parameters based on our experimental data obtained on HCP
The obtained parameters a and b are specific of each binder type. The total porosity
regression parameter a is around 5 for all binders except for metakaolin binder for which a is
equal to 2.6. The degree of water saturation Sl parameter b varies between 1.2 (limestone
HCP) to 8.9 (for Slag pastes). These results are obtained for non-carbonated specimens. Note

89
that Thiéry et al. [39] determined a and b parameters based on nitrogen diffusion tests
performed on carbonated, non-blended cement pastes and concretes [18], and obtained
obtained the empirical parameters values (a = 2.74, b = 5.17).
Recently, Gendron [89] found also that the exponent a depends on the binder type (a = 6.0
and 5.3 for slag and OPC non-carbonated mortars, respectively). These values are closed to
the ones found in the present work.
The major limitation of this kind of model is that the diffusion coefficient is related to averaged
descriptors of the pore structure, which are the total water porosity and the water saturation,
while neglecting actual pore-size distribution, binder type and pore connectivity.
5.4 Comparison of experimental results to literature models
In order to further analyze the experimental results obtained from the developed test methods,
the gas diffusivity and CO2 binding capacity results are used as input parameters in two
carbonation depth prediction models and the results are compared to the pH-indicator under
natural and accelerated carbonation
Prediction of the HCP carbonation depth
Based on the results shown in Chapter IV, the amount of carbonatable products of the tested
HCP and concrete are determined using Equation 33 (section 4.2.1). Table 22 gives the
amount of carbonatable products, the oxygen-effective diffusion coefficients determined before
and after carbonation. These results are obtained after preconditioning at 55%RH.
HCP
Amount of carbonatable
products [mol.m-3]
De,O2 [ 10-7 m².s-1]
of the HCP before carbonation
De,O2 [10-7 m².s-1]
of the HCP after carbonation
Carbonation rate
(mm/year0.5) HCP after
carbonation
PC6 6152 0.7 0.3 2.3
FA6 3306 0.5 1.2 5.9
SL6 1699 0.1 0.6 6.0
LS6 3129 2.6 3.1 9.8
MK45 5737 0.1 0.1 1.3
Table 22: Amount of carbonatable products, the oxygen-effective diffusion coefficient of HCPs at 55% RH before and after carbonation
In order to investigate the reliability of our test methods results, the five HCP (Table 21) are
exposed to natural carbonation at 55% RH for 5 months. The carbonation depths are
determined by phenolphthalein solution once a month. These depths are compared to the

90
carbonation depths calculated from our experimental results using the coefficient of diffusion
and the amount of carbonatable products shown in Table 22 and using Papadakis’ model
(Equation 20). Note that the amount of carbonatable products used in the our calculations are
obtained from our experimental results while Papadakis’ model relies on the phase
assemblage of the material (Chapter II section 2.3.2). Carbonation at 55% RH is chosen since
it is suggested that the most rapid carbonation of concrete occurs at a relative humidity near
50% to 65% (the RH required by the standards as shown in section 2.1). Note that the
carbonation depth calculations are carried out using the diffusion coefficient of carbonated and
non-carbonated HCP (Table 22) as input parameter in Papadakis’ model[164].

91
(a)
(b)
(c)
Figure 35: HCP carbonation depths determined with pH-indicator vs. the carbonation depths predicted using our experimental results
Figure 35 shows that the carbonation depths obtained from Papadakis’ model are well
correlated to the carbonation depths measured experimentally using phenolphthalein solution.
The vertical error bars are due to oxygen-effective diffusion coefficient variation within
replicates, and the horizontal errors bars are a result of averaging 5 carbonation depth
readings. A slightly better agreement is observed when the carbonation depth predictions are
made using the carbonatable products determined from TGA results (Figure 35 (b)). Still,
Figure 35 (a) and Figure 35 (b) results are very comparable which could indicate that the
diffusion coefficient controls the carbonation depth more than the amount of carbonatable
y = x
0E+0
2E-3
4E-3
6E-3
8E-3
1E-2
0E+0 2E-3 4E-3 6E-3 8E-3 1E-2
Xc
(m)
Pap
adak
is (
De,
O2
of
carb
on
ated
H
CP
an
d C
BC
fro
m c
ell)
Xc (m) pH-indicator
PC6FA6LS6SL6MK45
y = x
0E+0
2E-3
4E-3
6E-3
8E-3
1E-2
0E+0 2E-3 4E-3 6E-3 8E-3 1E-2
Xc
(m)
Pap
adak
is m
od
el (
De,
O2
of
carb
on
ated
HC
P a
nd
CB
C f
rom
TG
A)
Xc (m) pH-indicator
PC6FA6SL6LS6MK45
y = x
0E+0
2E-3
4E-3
6E-3
8E-3
1E-2
0E+0 2E-3 4E-3 6E-3 8E-3 1E-2
Xc
(m)
Pap
adak
is (
De,
O2
of
no
n-
carb
on
ated
HC
P a
nd
CB
C f
rom
cel
l)
Xc (m) pH-indicator
PC6
FA6
LS6
SL6
MK45

92
products. Indeed, for the tested HCPs, De,O2 varies over two orders of magnitude at 55% RH,
while the amount of carbonatable compounds varies only by a factor of 4 at the most. This
result was also confirmed by the previous works of Dutzer et al. [52] who indicate that the
change in mineralogy of HCP almost had any influence on the estimated carbonation rate,
while the increase in diffusivity is the major cause of the increase in carbonation rate.
Figure 35 (c) compares the carbonation depths obtained from the diffusion coefficient results
of non-carbonated HCP to the pH-indicator results and reveals that a better agreement is
observed when the carbonation depth predictions are carried out using the diffusion coefficient
of carbonated HCP. The pH-indicator results are slightly higher than Papadakis’ model. This
overestimation could be due to errors of averaging or microcracks within the samples (that
Papadakis model does not take into consideration).
The average percent error (the difference between the model results and the pH-indicator
divided by the pH-indicator results) between the results shown in Figure 35 (a), (b), and (c) is
31%, 29% and 37% respectively.
Prediction of the concrete carbonation depth
Table 23 shows the amount of carbonatable products (deduced from the CBC results of the
HCP), the De,O2, and the inverse carbonation resistance of the three concrete mixtures at 55%
RH. The lowest value of R-1NAC ( see section 2.3.3) is obtained for C_PC, and C_LS in the
carbonated, and non-carbonated states respectively. This result is mainly due to the decrease
of De,O2 upon carbonation for C_PC and its increase for carbonated C_LS (in addition to the
lower amount of carbonatable products of this concrete mixture).
Concrete
Amount of carbonatable
products (mol/m3)
De,O2 [10-7 m².s-1] before
carbonation
De,O2 [10-7 m².s-1]
after carbonation
R-1NAC (m2.s-1
.kgCO2.m-3)
Carbonated specimens
Non-carbonated specimens
C_PC 1584.5 0.9 0.3 4.1·10-10 1.1·10-09
C_FA 1013.6 0.7 0.5 1.0·10-09 1.3·10-09
C_LS 1350.0 0.5 0.7 1.0·10-09 7.2·10-10
Table 23 : Amount of carbonatable products, oxygen-effective diffusion coefficient and the inverse carbonation resistance of concrete at 55% RH before and after carbonation
i) Papadakis’ model
Figure 36 shows the results of the carbonation depth given by Papadakis’ model (Equation
20) using our experimental results and the carbonation depths given by the phenolphthalein
solution up to two years under natural carbonation exposure for concrete mixtures showed in
Table 23. Figure 36 (a) and (b) present the carbonation depths obtained using the diffusion

93
coefficient of non-carbonated and carbonated concretes respectively.
The pH-indicator predictions shown in Figure 36 computed using our experimental results and
Papadakis’ model lead to an overestimation of the latter by a factor of around 4.5 under
natural carbonation exposure.
(a)
(b)
(c)
(d)
Figure 36: Comparison of carbonation depth calculated from Papadakis model using our experimental data of gas diffusivity and CO2-binding capacity (Xc_papadakis) and carbonation depth determined directly concrete specimen (Xc_pH_indicator) under accelerated conditions
Figure 36 (c) and (d) show results of the carbonation depth determined under accelerated
exposure (3% CO2) using Papadakis’ model and the gas diffusivity of carbonated and non-
carbonated specimens respectively. In comparison with the results obtained under natural
y = x
0
4
8
12
16
0 4 8 12 16
Xc
(mm
) P
apad
akis
' m
od
el (
De,
O2
of
no
n-c
arb
on
ated
co
ncr
ete)
Xc (mm) pH-indicator (natural carbonation)
C_PCC_FAC_LS
y = x
0
4
8
12
16
0 4 8 12 16
Xc
(mm
) P
apad
akis
' mo
del
(D
e,O
2o
f ca
rbo
nat
ed c
on
cret
e)
Xc (mm) pH-indicator (natural carbonation)
C_PC
C_FA
C_LS
y = x
0
10
20
30
0 10 20 30
Xc
(mm
) P
apad
akis
' mo
del
(D
e,O
2o
f N
on
-car
bo
nat
ed c
on
cret
e )
Xc (mm) pH-indicator (Accelerated carbonation)
C_PCC_FAC_LS
y = x
0
10
20
30
0 10 20 30
Xc
(mm
) P
apad
akis
' mo
del
(D
e,O
2 o
f ca
rbo
nat
ed C
co
ncr
ete)
Xc (mm) pH-indicator (Accelerated carbonation)
C_PC
C_FA
C_LS

94
carbonation, a better agreement is observed in this case. Still, the model results overestimate
the pH-indicator results by a factor of around 2 (Figure 36 (c ) and (d)). It is worth noting that
the a pH-indicator is a chemical compound that changes its color depending on the pH of the
solution or surface with which it is in contact, while the carbonation depth models are based on
the physicochemical description of the carbonation process.
ii) Gehlen’s model
Since the carbonation depths are determined under natural sheltered exposure, the weather
function W (t) is taken equal to 1. The curing parameter kc is taken equal to 1 is the following,
since the tested concrete specimens are cured for 90 days (curing reference in our case).
(See section 2.3.3)
According to [15], the environmental parameter ke , which expresses the influence of RH on
the gas diffusion coefficient, can be determined directly from the relative humidity of reference
and the relative humidity of carbonation only ( Equation 24) regardless the concrete type.
In an attempt to determine this parameter from our experimental results, the ke parameter can
be determined using Equation 37 [15]. Xc,NAT, component [mm] is the carbonation depth of
stored specimens protected from rain that have carbonated under natural carbonation
conditions at time t, and Xc,NAT,Lab(t) [mm] is the carbonation depth at time t determined on
specimens that have carbonated naturally under laboratory conditions (identical curing to
component). The ratio of these parameters can be rewritten as a function of our experimental
data of diffusion coefficient and carbonatable products using Papadakis’ model. Taking 55%
as the relative humidity of reference and using Equation 37 [15] DRH and CPRH are the
diffusion coefficient and the amount of carbonatable products (mol/m3) determined at a certain
RH level respectively.
ke = (Xc,NAT, component(t)
Xc,NAT,Lab(t))
2
=
DRH
CPRH
D55% RH
CP55% RH
Equation 37
Figure 37 shows that the ke parameter value calculated for the tested concrete using results of
gas diffusivity at the non-carbonated and carbonated states. ke depends on the concrete
mixture and carbonation state. It is lower than 1 (from 0.03 to 0.9) when the relative humidity is
93% for concrete C_PC, C_FA, and C_LS, while it is higher than 1 for 33% RH which
highlights the fact that at this relative humidity level, the carbonation depth would progress
faster than at the relative humidity of reference (55% RH) for all tested concrete.

95
Since the natural carbonation tests are carried out at 65%RH, the ke parameter value used in
the calculation of the carbonation depths is determined by linear interpolation between the ke
parameter at 55% and 93% RH. The ke used in this study are 0.29, 0.71 and 0.49 for
concretes C_PC, C_FA, and C_LS respectively using the diffusion coefficient of non-
carbonated specimens, and 0.97, 0.89 and 0.98 for the same respective concretes in the
carbonated state.
Figure 37: ke parameter calculation determined using our experimental results
The high ke value for C_FA is due to the 10 times higher value of De,O2 at 33%RH than 55%
RH.
Figure 38 (a) and (b) compares the carbonation depths calculated using results of gas
diffusion coefficient of concrete previously preconditioned at 55% RH and the pH-indicator
results obtained under natural carbonation exposure. The inverse carbonation resistance of
the tested concretes is shown in Table 23. The model overestimates the carbonation depths
determined by means of the pH-indicator by a factor of 3.1 and 4 using the results of the
diffusion coefficient of non-carbonated and carbonated concrete specimens respectively.
0
5
10
15
20
25
30
33 55 93 33 55 93 33 55 93
C_PC C_FA C_LS
Envi
ron
emen
tal p
aram
eter
ke
[-]
RH (%)
Before carbonation
After carbonation

96
(a)
(b)
(c)
(d)
Figure 38: Comparison between the carbonation depths determined under natural carbonation using phenolphthalein and the carbonation depths obtained from Gehlen’s model. (a) Xc predicted using the diffusivity of non-carbonated concretes and (b) Xc results from the gas diffusion of carbonated concretes
The carbonation depth predictions shown in Figure 38 (c) and (d) compare the pH-indicator
results obtained under accelerated carbonation (section 3.4.2) using De,O2 results of non-
carbonated and carbonated concretes respectively. In comparison with the previous results
(Figure 38 (a) and (b)), the model results are in a better agreement with the pH indicator. In
this case, the model overestimates the carbonation depth by a factor of 1.4 and 1.8 using the
diffusivity results of non-carbonated and carbonated concretes respectively.
y = x
0
4
8
12
16
0 4 8 12 16
Xc
(mm
) G
ehle
n's
mo
del
(D
e,O
2o
f n
on
-ca
rbo
nat
ed c
on
cret
e)
Xc (mm) pH-indicator (natural carbonation)
C_PCC_FAC_LS
y = x
0
4
8
12
16
0 4 8 12 16
Xc
(mm
) G
ehle
n's
mo
del
(D
e,O
2o
f ca
rbo
nat
ed c
on
cret
e)
Xc (mm) pH-indicator (natural carbonation)
C_PC
C_FA
C_LS
y = x
0
5
10
15
20
0 5 10 15 20
Xc
(mm
) G
ehle
n's
mo
del
(D
e,O
2o
f n
on
-ca
rbo
nat
ed c
on
cret
e)
Xc (mm) pH-indicator (Accelerated carbonation)
C_PC
C_FA
C_LS
y = x
0
10
20
30
0 10 20 30
Xc
(mm
) G
ehle
n's
mo
del
(D
e,O
2o
f ca
rbo
nat
ed c
on
cret
e)
Xc (mm) pH-indicator (Accelerated carbonation)
C_PC
C_FA
C_LS

97
iii) Differences in the carbonation tests protocols
Differences between the carbonation depths obtained from the pH-indicator results and the
models results can be attributed to one or a combination of the following factors:
• It should be kept in mind that the carbonation depth prediction models are determined
using our experimental data, which are physical properties of the tested materials,
whereas the phenolphthalein solution results are a pH-indicator (pH < 9). The
overestimation obtained by the model results could be explained by the non-sharp
carbonation front leading to a higher ingress of CO2 (given by the models) than what is
indicated by the phenolphthalein solution.
• The concrete specimens exposed to accelerated carbonation tests were oven-dried at
45°C for 14 days before the exposure to accelerated carbonation tests, whereas the
specimens exposed to natural carbonation did not undergo this pretreatment.
Therefore, the specimens tested to accelerated carbonation are much less water
saturated than the specimens exposed to natural carbonation. This could explain the
better correlation observed between the models and the pH-indicator results obtained
under accelerated conditions. At the beginning of natural carbonation tests, specimens
are water-saturated and not at moist-equilibrium with the environment.
• The diffusion coefficient of carbonated specimens is determined after carbonation of
concrete specimens at 1% CO2 while the accelerated carbonation depths determined
by means of phenolphthalein solution are obtained from carbonation tests carried out at
3% CO2. Although Morandeau [24] states that the carbonation behavior of cementitious
materials is comparable if the CO2 concentration is lower than 3% .vol, the
microstructure of the concrete, which controls directly the diffusivity, could be affected
differently [69].
• For acceleration carbonation tests, the amount of carbonatable products is determined
under natural CO2 concentration while the carbonation depth of the concretes is
determined under 3% CO2 concentration.
• The models used to predict the carbonation depths using our experimental data are
based on the assumption of a constant water content of the material, while the
carbonation reaction is usually accompanied by water release.
98
5.5 Comparison between the carbonation test methods
Table 24 gives a summary of the main information about the pH-indicator test methods and
the developed test methods in this thesis work. The main advantages of the developed test
methods is their cost-efficiency, relatively time-saving nature (comparing to natural
carbonation tests), their fair repeatability and reproducibly (depending on the hydric state of
the tested material), and mainly the fact that these test method allow for the determination of
the cementitious materials physical properties that control the carbonation progress while the
pH-indicator tests give only information about the pH drop (<9). Still, the accuracy of the tests
methods results is to be investigated on a large set of materials before any definite
conclusions are made.

99
pH-indicator test methods Properties of the material
Natural carbonation
(mm)
Accelerated carbonation
(mm)
Gas diffusivity (m²/s)
CO2-binding capacity (gco2 gcement
-1)
Output xc xc De,O2 Carbonatable products
Accuracy Accurate
Above 3% CO2 by volume, the results accuracy is questionable. There is no international agreement on the test protocol
The models’ results overestimate the pH-indicators results by a factor of around 4 and 2 for concrete exposed to natural and accelerated carbonation respectively The error percent for the prediction of the HCP carbonation depth is around 35%. The average percent error between the CO2-binding capacity and TGA results is 24% and 35% for synthetic and HCP respectively.
Repeatability (%) [165]
10 3.6 to 9.1 7 to 10 -
Reproducibility (%) [165]
25 5.8 to 10.3 4 to 48 <30
Cost-efficiency Reasonable Quite expensive depending on safety regulations
Cost-effective
Test Duration > 365 days > 28 days
3 days to 4 weeks of preconditioning. 30 min to 6 days measurement
48 hours to 15 days of preconditioning (still to be determined precisely) 8 to 28 days of exposure to carbonation 5 min to 20 min CO2-uptake measurement
Detection limit - - 10-11 IBR = 10-10 gco2 gcement
-1 s-1
Main advantages
Innovative materials can be tested and reliably compared to a reference material Standardized test method
Very simple Standardized test method
Simple Rapid Affordable Results are required for service life prediction models
Main inconvenience
Time consuming Expensive
Requires automatic resolution of Fick’s second law of diffusion. Not commercially available at the moment. More investigations about the results accuracy are required. Non-standardized test methods
Table 24: Comparison between the carbonation tests

100
Conclusions
Existing tests to determine the carbonation resistance either take more than 365 days (natural
carbonation) or, if test duration is shortened by acceleration, results are criticized for lacking in
transferability to field behavior. In view of this, new tests have been developed during this
thesis work. The approach adopted in the study of carbonation is based on decoupling the
main mechanisms that control this physicochemical process, i.e. gas diffusion and CO2-
binding capacity. The main results from this work allow drawing the following conclusions.
By using the newly developed methods, oxygen diffusivity and the amount of carbonatable
products can be determined in a reliably short term comparing to natural carbonation tests (8
weeks at the latest instead of 1 year or more). Moreover, the developed test methods are
capable of reproducing expected results: the decrease of the oxygen diffusivity with the degree
of water saturation and hydration duration, and the dependence of the amount of carbonatable
products on the relative humidity of carbonation.
For all tested materials, the oxygen-effective diffusion coefficient of carbonated samples is less
dependent on the relative humidity of preconditioning comparing to the same materials before
carbonation. The oxygen-effective diffusion coefficient shows a good correlation with the mean
pore diameter of the tested HCPs (in log scale) when the degree of water saturation is lower
than 30%. This result proves the dependence of the gas diffusivity on the pore size distribution
and degree of water saturation of cementitious materials.
Although a decrease in the total porosity is observed after carbonation of all tested concrete
mixtures and HCP specimens, the De,O2 can either increase or decrease after carbonation. Its
variation depends on the material composition and degree of water saturation. Carbonation is
found to lower the water retention capacity of concrete and HCP.
The CO2 binding capacity and rate depend highly on the RH and material composition. The
highest CO2-binding capacity is noticed for portlandite, C-S-H, and OPC cement pastes
exposed to carbonation at 93%. Still, the maximum theoretical binding capacity of all tested
materials was not reached in the time scale of our experiments (28 days). The carbonation
process was extremely slowed before all calcium oxide is carbonated. An agreement is found
between TGA and the developed test method results.
Effective diffusion coefficient and CO2 binding capacities determined for HCP and concrete
were used as entry data of two literature analytical models. The results these models
overestimate the pH-indicators results by a factor of around 4 and 2 for concrete exposed to

101
natural and accelerated carbonation respectively. A better agreement is observed for the HCP
as the error percent for the prediction of their carbonation depths is around 35%, which could
be explained by more homogenous nature of the HCP in comparison to concrete that results in
more reliable De,O2 determination. The carbonation depth predictions made using the diffusion
coefficient of non-carbonated or carbonated concrete specimens are comparable as
carbonation affects the oxygen-diffusion coefficient especially at high relative humidity level.
Still, a large set of concretes should be tested to obtain statistically representative data before
definite conclusions can be made regarding the accuracy of the developed test methods
results.
The assessment of the gas diffusivity and amount of carbonatable products of Portland
cement pastes and blended pastes showed a comparable carbonation performance of the
blended cement pastes cast at low water-per-binder ratio to Portland pastes. This provides a
promising opportunity to decrease the clinker content in concretes without impacting
negatively the durability performance related to carbonation.
Although the experimental methods were developed to study the carbonation performance,
other applications could be considered.
The oxygen-effective diffusion coefficient test method can be also be used to control the
quality of innovative binders and study the diffusion-based phenomena of these materials, as
the gas diffusion coefficient is a specific durability indicator of cement based materials.
Oxygen diffusion coefficient could be used as an indicator for corrosion initiation, for the
assessment of corrosion propagation period in wet environment, and for the design of cathodic
protection.
The CO2 binding capacity test method could also be used to study the CO2 footprint of
concrete. Cement industry is known for being a massive CO2 emitter. Through carbonation,
concrete has a CO2 uptake potential and can take part in CO2 capture and storage
technologies. The effective carbonatable products of cement need to be experimentally
assessed as well as the rate of CO2 uptake.
The experimental data obtained from the developed test methods could be of high interest in
the study and validation of existing models based on reactive transport in porous media.

102
Perspectives
The oxygen-effective diffusion coefficient test method can be improved by adding a relative
humidity sensor (wireless) and a manometer inside the half-diffusion cell, while avoiding
leakage problems. This would permit to monitor the RH level inside the cell and any possible
pressure variation during the flushing period with nitrogen. It is also of importance to study the
effect of pressure gradient that could result from multi-species diffusion, temperature and
physical sorption of diffusing species on the oxygen-effective diffusion coefficient as the latter
is highly dependent on these parameters. The experimental data fit could be carried out
following Stefan Maxwell model that describes diffusion on multicomponent systems, which is
the case in our study (air – nitrogen).
Although no clear correlation was found between the oxygen diffusion coefficient and the
apparent permeability, it is of interest to further investigate the relation between these two
properties (for concrete specimens dried at 40°C for example) before any definite conclusions.
The experimental data collected from this thesis work of oxygen-diffusion coefficient, degree of
water saturation, pore size distribution and total porosity are of high importance in the
development of a microstructural model allowing for the prediction of oxygen-effective diffusion
coefficient from these parameters, in addition to the degree of hydration, and phase
assemblage of the tested materials.
The CO2-binding capacity test method can be further improved by increasing the
measurement frequency during the first week of carbonation and avoiding carbonation of the
tested materials during the preconditioning period, in order to minimize the integration errors.
The experimental data of IBR and CBC obtained from the synthetic materials can be
completed by further investigations (C-S-H phase with different C/S for instance) in an attempt
to investigate a possible prediction of the carbonation kinetics of a hydrated cement paste from
the kinetics of its constitutive phases.
The results obtained in this work and the following works would help to better understand the
process of carbonation and to advance the carbonation modeling by providing new set of data
for reactive transport models built by combining chemistry, microstructure and diffusivity. In a
global perspective, this will contribute to a more accurate prediction of the service life of real
concrete structures.

103
Appended documents
This thesis includes the following four appended documents, composed by three papers and
the appendices.
Paper I M. Boumaaza, B. Huet, G. Pham, P. Turcry, A. Aït-Mokhtar, C. Gehlen,
A new test method to determine the gaseous oxygen diffusion coefficient of cement
pastes as a function of hydration duration, microstructure, and relative humidity,
Mater. Struct. 51 (2018).
Paper II M. Boumaaza, P. Turcry, B. Huet, A. Aït-Mokhtar,
Influence of carbonation on the microstructure and the gas diffusivity of hardened
cement pastes, Constr. Build. Mater. 253 (2020) 119227.
Paper III M. Boumaaza, B. Huet, P. Turcry, A. Aït-Mokhtar,
The CO2-binding capacity of synthetic anhydrous and hydrates: validation of a test
method based on the instantaneous reaction rate. Cem. Concr. Res. 135 (2020)
106113

104
1 Paper I: A new test method to determine the
gaseous oxygen diffusion coefficient of cement
pastes as a function of hydration duration,
microstructure, and relative humidity
1.1 Abstract
A new test method is developed to determine the gaseous oxygen-effective diffusion
coefficient through hardened cement pastes conditioned at different relative humidity. The
method relies on the measurement of gaseous oxygen accumulation in the downstream
compartment of a diffusion cell and on the numerical fitting of a classical diffusion equation
(Fick’s second law) on experimental results. Oxygen-effective diffusion coefficients in the
range of 10-6 m²/s to 10-11 m²/s can be determined using this test method. The present paper
gives a detailed description of the experimental setup, the numerical procedure and presents
results obtained on different Portland-based cement pastes. Cement pastes containing silica
fume (SF) and slag are also tested. Samples are cast at two different volumetric water-per-
cement ratios (1.6 and 1.9 m3/m3), tested at three different ages (from 1 day to 8 months) and
preconditioned at different relative humidity (3% to 93%). Hence, the influence of cement
composition, hydration duration, relative humidity and the water-per-binder ratio on the
oxygen-effective diffusion coefficient De,O2 is investigated. Four microstructural properties: total
porosity, pore-size distribution, hydration degree and the degree of water saturation of the
tested samples are assessed as intermediate parameters to model oxygen diffusivity as a
function of the mix design. Results show that well hydrated blended cement pastes have lower
diffusivity than Portland pastes (over one order of magnitude for RH within [33-76] %), even
though their total porosity was higher than Portland pastes. For all cement pastes diffusivity is
found to be well correlated to the mean pore diameter of samples, at different degrees of water
saturation.
1.2 Introduction
Cement-based materials are composite of a binding matrix primarily containing hydrated
Portland cement paste, which is a porous medium with a continuous range of pore sizes from
nanometers to micrometers. This porous network makes the concrete structure exposed to
chemical reactions caused by the ingress of aggressive species from the environment. These
species may lead to the decrease of its mechanical and durability performance, thus to a

105
reduction of its expected service life.
The target service life of a concrete in a real environment is often estimated using a
performance approach based on so-called durability indicators, which are key material
properties with regard to durability [84][166]. Depending on the damage mechanism of the
material, adequate durability indicators should be chosen. For deterioration mechanisms that
involve the transport of aggressive species in the gas phase, gas diffusion coefficient which
describes a movement under a concentration gradient is the material property of interest in
this regard.
In a porous media, the gaseous-effective diffusion coefficient is the key parameter to describe
diffusion-based phenomena such as carbonation (diffusion of CO2 [39]), drying (diffusion of
water vapor [167]), and corrosion (diffusion of O2 [168]). Usually, the effective diffusion
coefficient De,g is correlated to the corresponding diffusion coefficient of the gaseous specie
through air D0,g by a correction term that accounts for the effects of the porous network
connection, the material hydrothermal condition, and microstructure [74]. The effective
diffusion coefficient for transport through the pores is macroscopic in nature since the entire
pore space needs to be considered [9].
Additionally, as gas molecules travel through the porous media, three different diffusivity
mechanisms can occur independently or simultaneously, depending on the characteristic of
the diffusing gas species and the microstructure of the porous media. These mechanisms are :
molecular diffusion, surface diffusion and Knudsen diffusion [99].
Note that usually the concrete penetrability property standardized and determined by most
laboratories is the gas permeability [169]. However, it is the gas diffusion coefficient that is a
particularly relevant input parameter for the service life prediction models [18][84]. We can
state the example of Papadakis model for concrete carbonation [83] that requires a CO2
diffusion coefficient and the amount of carbonatable products as input parameters to predict
the carbonation depth. Indeed, carbonation is a result of the diffusion of gaseous CO2 in the
material and its reaction with calcium from the cementitious material. Consequently, it is
relevant to experimentally determine the gaseous diffusion coefficient of cementitious
materials.
In this context, we may cite the work of Namoulniara [95] which involves the development of
an experimental setup to measure the CO2 effective diffusion coefficient on oven-dried, non-
carbonated cement pastes. The CO2 diffusion coefficient was investigated only at the dry state
to avoid the carbonation of the sample during the test itself. Measurements are performed with
pure CO2 gas using a two-chamber cell at atmospheric pressure and ambient temperature

106
(20°C). Portland cement pastes, limestone pastes and pastes containing slag were tested.
CO2 effective diffusion coefficients determined in this study are ranked between 10-8 m²/s and
10-7 m²/s.
Another example of studies involving the development of test methods to measure the gas
diffusion coefficient on cementitious materials is the experimental setup developed initially by
Lawrence(1984) [8] and used by Villani [99] and Wong [86]. The diffusion test consists of
exposing each side of a disc-shaped concrete sample to a stream of pure nitrogen and pure
oxygen, respectively at the same pressure and temperature, and measuring the concentration
of oxygen incorporated in the nitrogen stream after it has passed over the concrete specimen.
The diffusion coefficient is then computed using the equation introduced by Lawrence [8].
Values of oxygen diffusivity in the study carried out by Villani [99] are in the range of 10-8 m²/s
to 10-7 m2/s for mortar samples and between 10-9 m²/s to 10-7 m2/s for concrete samples.
These values correspond to a W/B between 0.3 and 0.7 and to preconditioning relative
humidity between 50% and 65%.
We also cite Houst’s experimental setup that allows for the simultaneous determination of
effective diffusion coefficients of two gases (CO2 and O2) as a function of the relative humidity.
The measuring cell is divided into two chambers by a porous disc of hydrated cement paste at
a temperature range from 20°C to 25°C. Oxygen and carbon dioxide diffuse from the upper
chamber through the sample into the lower chamber, where the two gases are monitored as a
function of time by gas analyzers. O2 and CO2 effective diffusion coefficients are calculated by
fitting the experimental data to an empirical function proposed by Papadakis [170]. Oxygen
and carbon dioxide diffusion coefficients are found to vary between 10-9 m²/s and 10-7 m²/s for
carbonated cement pastes and mortars at two W/B (0.4 and 0.5) and different relative humidity
(from 48% to 95%) [10]. The diffusion coefficient of other gases like hydrogen and xenon was
experimentally determined by Sercombe [9] on non-carbonated pastes pre-conditioned in
specific atmospheric conditions (from dry state to 100% RH). Results obtained for CEMI and
CEMV samples ranked between 10-7 m²/s to 10-12 m²/s.
In this contribution, we attempt to develop and validate a simple test method that allows for the
measuring of the gas diffusion coefficient through cement pastes. Since this material property
is highly dependent on mix design parameters, the degree of hydration, and environmental
parameters [9], measurements are made at different hydration durations and degrees of water
saturation (or alternatively relative humidity) and with two different water-per-cement ratios.
For an investigation of this kind, it is necessary that the pore microstructure of the specimen to
be tested does not change during the test itself; for this reason, it is relevant to perform the
test using an inert gas with respect to most hydration products. Therefore, the most convenient

107
gas specie for this experimental investigation is atmospheric oxygen. Carbon dioxide and
other gases, effective-diffusion coefficients can be deduced from that of oxygen using a simple
model developed by Thomas Graham[140]. Note that this law is found to be valid only in the
case of Knudsen diffusion [171][172].
The two main objectives of this study are summarized as follows: first, developing and
checking the reliability and range of validity of a simple technique to determine the oxygen
diffusion coefficient using gaseous oxygen from the atmosphere. Second, investigating the
influence of material composition, degree of water saturation, and hydration duration on De,O2
of Portland-based cement pastes.
Finally, it is worth noting that, to our knowledge, there is currently no standardized diffusion
test for cement pastes or concrete, which is another reason why this paper investigates the
effect of different material properties on the oxygen-effective diffusion coefficient.
1.3 Materials and methods
1.3.1 Tested materials
The present research focuses on investigating the diffusivity of thin, hardened cement pastes
rather than concrete or mortars for the following reasons: cement paste fraction of mortar or
concrete usually contributes for the greatest part of the porosity and thus determines their
transport properties to a great extent [9][173]. Conditioning thin cement paste samples at
different relative humidity and testing their oxygen diffusivity can be carried out in limited time,
while testing concrete or mortars requires experimental validation of the choice of the tested
specimen thickness in relation to the size of the grains of cement or aggregates of concretes.
Although they contain more porosities in the aggregate-paste interfacial zone [174], which
leads to the assumption that their transport properties are going to be higher, a study made by
Wong [56] has shown that their contribution is small on the overall transport properties.
The cement used to prepare the samples is an ordinary Portland cement for which the
chemical composition is shown in Table 25.

108
OPC Slag
SiO2 20.4 36.1
Al2O3 5.5 11.4
Fe2O3 2.5 0.2
CaO 64.8 42.1
MgO 1.16 7.6
K2O 0.23 0.4
Na2O 0.20 0.3
SO3 3.34 0.9
TiO2 0.15 0.5
Mn2O3 0.09 0.6
P2O5 0.27 -
ZrO2 - 0.02
Cr2O3 0.02 -
SrO 0.06 0.04
LOI 1.09 -
CO2 0.17
Table 25: Chemical composition of ordinary Portland cement and slag
Three cement pastes were tested: pastes with OPC only and two paste mixtures prepared by
replacing OPC with 50% slag and 10% silica fume by mass.
These additions grain size distribution, fineness and specific surface, are given in Table 26.
Table 26: Tested materials grain size distribution density and specific surface
All pastes are cast at two constant volumetric water-to-cement ratios: 1.6 and 1.9 (which
corresponds to 0.5 and 0.6 by weight for OPC pastes). Pastes are cast with respect to a
volumetric W/B so that the initial porosity of all the samples is similar (62% and 65%
theoretical initial porosity, respectively, assuming that the samples have no air content) and to
study samples with a wide range of pore structure characteristics [175].
The pastes are cast in cylindrical molds (4*11 cm), rotated for 24h to avoid any sedimentation
and stored at a relative humidity of 100% before being sawed under water. To investigate the
D10 µm D50 µm D90 µm D(4,3) µm Density g/cm3
Specific surface [BET] cm2/g
Slag 2.87 15.06 36.27 17.63 2.91 3656.0
Silica Fume >45µm = 1.5% 2.28 >1.5x10⁵
OPC 2.68 16.94 51.2 22.48 3.14 3630.0
109
influence of maturity, specimens were left in the mold at 100% RH and tested after different
hydration durations, namely: 1 day, two months and eight months for OPC samples, and 7
days, two months and eight months for OPC_SF and OPC_Slag mixes.
In the case of 1 or 7 days hydration duration, hydration is stopped by immersing the samples
in an organic solvent (isopropanol) to drive off the free water, and then samples are placed
under vacuum for 24 hours to drive out the solvent. Hydration stopping of other samples was
achieved by drying the samples at different relative humidity (RH) in well-aerated chambers at
two and eight months. We assume that hydration stops when the relative humidity drops below
80% [176].
Samples are preconditioned at the following relative humidity by means of saline solutions at a
temperature of 20°C : 33%(MgCl2), 55%(Mg(NO3)2), 76%(NaCl), 86%(KCl), 93%(KNO3).
Samples that are conditioned at 65% RH were stored in a relative humidity controlled room.
Dry samples were oven dried at 80°C, which corresponds to a relative humidity of 3%,
assuming a dew-point of 12°C since laboratory relative humidity is 70% at 20°C. The moisture
equilibrium state is assumed to be reached at a given preconditioning relative humidity when
the mass variation within a week is no more than 0.05% [86]. This equilibrium is usually
reached after four or five weeks.
For this test method, it is recommended to prepare samples thin enough to reduce moisture
equilibrium time and to allow oxygen to diffuse through them in a relatively short time.
Therefore, discs of 3 mm thickness and 4 cm diameter are sawed. These samples are cut
from the center of the specimens, and the outer surfaces were not tested. Since these
samples are to be tested for a transport property, water content should not increase during the
diffusion test itself. Therefore, samples’ weight is checked after each diffusion test, and the
mass variation is found to be negligible (0.02% < 0.05%). The oven-dried samples were
placed under a vacuum for 24h to cool down at laboratory temperature (20°C) before each
diffusion test.
Sample treatment before and during testing may cause microcracks. However, according to
Wong [56], oxygen diffusivity was found to vary only by a factor of 2 at most for samples with
microcracks dried at 105°C.
On the other hand, concrete in real structures is almost always micro-cracked. Testing only
laboratory materials that did not undergo severe environmental stress may be
unrepresentative.
In the following parts of this paper, samples will be named using the following convention:

110
Hydration duration_Composition_volumetric W/B.
1.3.2 Diffusion test protocol
The testing method gives an accumulation of O2 concentration from ambient air in the
downstream compartment called the “diffusion cell” until the steady state is reached. The main
element of this experimental setup is the diffusion cell shown in Figure 39. It consists of a high-
density polyethylene cell, separated from the ambient air by the sample, which is placed
between two silicon joints compressed by firmly tightening the screw on them to ensure air
tightness and unidirectional diffusion flux. The oxygen sensor is also surrounded by an O-ring
to minimize leakage of the setup.
The volume of the diffusion cell is flushed at the beginning of the test with pure nitrogen. This
gas is chosen because it is inert and safe. The N2 inlet and O2 outlet (plug and play system)
are designed to avoid any residual overpressure in the cell and to ensure gas tightness and
ease of handling during the flush.
The cell geometry is determined to enable the diffusion coefficient to be obtained with
sufficient reliability: minimizing the internal cell volume (113 cm3) helps to avoid hydric
changes of the sample during the test and to position the sensor as close as possible to the
sample. Plus, minimizing the cell volume allows for a reduction of the duration to reach the
steady state, hence, the diffusion test duration. This cell design also allows a range of
specimen sizes to be examined: from 2 mm to 16 mm.
A diffusion test consists of placing the sample and the oxygen sensor in the cell and flushing
the inside volume of the cell with nitrogen (this step usually takes 15 to 20 seconds to reach a
value of 0.3% of oxygen inside the cell, which avoids drying the sample during the flush). The
cell is then placed inside a climate chamber pre-equilibrated at the same relative humidity
used for the sample preconditioning. Oven-dried samples are placed in a chamber with silica
gel during the diffusion test. The relative humidity inside is 26%. These samples’ diffusion test
lasts from 30 min to 2h at the longest. Mass gain is checked after each diffusion test and found
to be negligible <0.02%.
The climate chamber atmosphere in contact with one face of the sample also acts as a steady-
state concentration of oxygen (20%). All diffusion tests are performed under constant
temperature (20°C) and pressure (1atm).
In the inside volume of the cell, the concentration of oxygen diffusing from the ambient air of
the climate chamber through the sample is measured continuously by the sensor.

111
Figure 39: Oxygen diffusion cell sketch
This sensor continuously measures the oxygen gas concentration using an electrochemical
cell with an accuracy of 1%, which is an acceptable level in the range of our measurements
0% to 21% volume O2 as no noise was observed on the collected data. Note that several
diffusion cells are used in order to perform diffusion tests in parallel.
1.3.3 Determination of the effective diffusion coefficient
Fick’s second law is the governing differential equation that evaluates gaseous diffusion
through a porous media. Neglecting the absorption process and gas solubility in water
confined in the media pores, considering one dimensional gas diffusion, and given the
assumption that there is no crack in the material, Fick’s second law can be written as follows
[39].
ϕ(1 − Sl)∂C
∂t=
∂
∂x(De,O2
∂C
∂x)
Equation 38
Where De,O2 is the oxygen-effective diffusion coefficient, C the oxygen concentration, the total
porosity and Sl the water saturation degree of the sample. Note that Equation 38 is also solved
in the inside volume of the cell to account for transient diffusion; for this volume we have
porosity = 1, water saturation = 0 and DO2-N2 = 10-5 m²/s.
The test method output is an accumulation curve of oxygen concentration as a function of
time. The oxygen diffusion coefficient is calculated from the automatic analysis of this curve,
using a Python program (Scipy.optimize.curve_fit [177]) that minimizes the difference between
experimental data and Fick’s second law model results by means of non-linear least squares

112
fitting.
The resolution of Fick’s second law is done using a Python finite volume package for solving
partial differential equations called FiPy [178].
The program outputs are the effective diffusion coefficient De,O2 and the uncertainty on the
calculation of De,O2. An example of the results of the calculation of oxygen-effective diffusion
coefficients from experimental data is given in Figure 40. This program allows for the
calculation of oxygen-effective diffusion coefficients over five orders of magnitude and
computes the relative standard error of the fitting, which is found to be negligible (0.1% to 1%).
Figure 40: Example of fitting result over five orders of magnitude De,O2. The bottom curve presents a leakage curve (De,O2= 8.1x10⁻¹² m²/s)
1.3.4 Other test procedures
Total porosity (i.e. the volumetric proportion of voids) is determined by water soaking under the
vacuum following the French standard NF P18-459. The dry mass of the samples is given by
oven-drying at 105°C. The following weights were recorded:
• mRH: mass of the sample when equilibrated at its corresponding RH.
• mdry: dry mass of the sample (dried in the oven at 105°C).
• mair: mass in the open air of the water-saturated sample.
• mhydro: hydrostatic weight, mass of the water-saturated sample by immersion in water
under a vacuum for 48h.
The total porosity and water saturation are then obtained from the following equations:

113
ϕ = mair − mdry
mair − mhydro Equation 39
Sl = mRH − mdry
mair − mdry Equation 40
Since the oxygen diffusion coefficient depends highly on the microstructural properties, it is
also of interest to get information about the pore-size distribution, a property that affects pores’
degree of water saturation. Therefore, mercury intrusion porosimetry [179] is performed on
one sample of each mix composition for the three different hydration durations. MIP samples
are cored out from the hardened cement paste and their diameter is 1cm. These samples are
pre-dried at 45°C for 24H.
The influence of these materials’ hydration degree on the oxygen-effective diffusion coefficient
is also of great relevance. Therefore, OPC and OPC_Slag hydration degrees at early age (1
day for OPC and 7 days for OPC_Slag), two months, and eight months of hydration are
assessed using the XRD/TGA technique (for OPC samples) and scanning electron microscopy
SEM (for OPC_Slag samples).
For Portland cement pastes, combining XRD with TGA analysis allows for quantitative
measurement of the degree of dissolution of un-hydrated cement phases [109].
For slag cement pastes, the SEM method can estimate the degrees of hydration of both
cement and slag in the mix and was found to be more reliable than other methods [128]. The
strategy used in this work is detailed in [127] and [129].
However, a reliable determination of the degree of hydration for SF samples becomes difficult
using SEM or XRD, as SF is a very amorphous product. Therefore, their degree of hydration
was taken from the literature from the work of Muller [180], who quantified the reaction degree
of 10% silica fume cement pastes with a ratio of W/B=0.5 using the 29Si MAS NMR technique.
1.4 Results
1.4.1 Test method validation
The experimental setup gas tightness is evaluated by performing a blank test. The test
consists of measuring a leak rate by filling the cell with nitrogen, replacing the sample by a
gastight disc and measuring the variation of oxygen concentration inside the cell. 11 cell
leakage rates are measured for 20 days, providing an average leakage rate of 3.6% in oxygen
concentration per month.

114
For each leakage test of a diffusion cell, we calculated the equivalent oxygen-effective
diffusion coefficient. The average value of this coefficient calculated on six cells is 1.74 x 10-
11m²/s ± 9 x 10-12. The leakage tests set the lower limits for the oxygen-effective diffusion
coefficient to be determined, which corresponds, in our case to oxygen diffusion coefficients of
values three or four times less than 8 x10-12 m²/s to determine a value of De,O2 with sufficient
reliability.
In order to assess the uncertainty of the method, repeatability and reproducibility are studied.
First, for repeatability to be established, the following conditions were respected: tests were
performed in the same location using the same diffusion setup by the same operator, under
the same conditions, and over a short period of time [181]. Diffusion coefficient measurements
are repeated 5 times on each of the three samples. The objective is to then quantify the
agreement and reliability of measurements. This agreement is described by reporting a
repeatability coefficient that can be estimated using the within-subject standard deviation,
which is the standard deviation of the measurement errors [181]. For our cells, this coefficient
is found to vary between 7% and 10%, which denotes that the absolute difference between
two measurements on the same sample is expected to differ no more than the repeatability
coefficient on 90% of occasions. Variability in measurements made on the same subject in a
repeatability study can then be ascribed only to errors due to the measurement process itself.
As for reproducibility, we investigated the closeness of agreement between the results of
diffusion tests conducted in different climate chambers equilibrated at the same relative
humidity of the samples to be tested, with three different diffusion cells on three replicates.
Reproducibility is then qualified with a standard deviation of the three measurements. An
example of a diffusion coefficient value determined on three replicates is De,O2 = 2x10⁻⁷±1x10⁻⁹
m²/s. The low standard deviation (1x10⁻⁹ m²/s) indicates that the three diffusion coefficients
tend to be close to the average value.
A further way to report the reproducibility is to report the coefficient of variation (ratio of the
standard deviation to the mean). During this work, 270 diffusion tests are performed, and an
average value of the coefficient of variation is found to be 15%. Note that the decision as to
whether these results are to be judged ‘sufficiently precise’ depends on how the
measurements’ results are to be used.

115
Figure 41: Box plots of the coefficient of variation corresponding to four orders of magnitude of the diffusion coefficient experimentally determined
Another way to describe the data of the variation coefficient calculated from the measurement
of the three replicates is the box plot (or whisker diagram). It is a standardized way of
displaying the distribution of data based on the five number summaries: minimum, first
quartile, median, third quartile, and maximum. This way we can display the full range of
variation (from min to max), the likely range of variation (the inside of the box), and a typical
value (the median) [142].
Figure 41 shows four box plots, each corresponds to datasets of the variation coefficient of
experimentally determined diffusion coefficients in Log-Scale. The spacing inside each box
indicates the degree of dispersion of the variation coefficient. The mean value of the diffusion
coefficient of these four box plots is in order: 3.4 x 10-07 m²/s, 4.2 x 10-08 m²/s, 3.3 x 10-09 m²/s
and 4.5 x 10⁻¹⁰ m²/s. For each respective category we have the following amounts of data: 20,
35, 18 and 12.
1.4.2 Results of diffusion tests
Results of oxygen-effective diffusion coefficients obtained on OPC, OPC_SF and OPC_Slag
pastes as a function of relative humidity are presented in Figure 42. Each oxygen-effective
diffusion coefficient value is an average of three replicates, and precision is expressed as the
standard deviation. The measured diffusion coefficient ranged from 10-7 and 10-6 m²/s for
hydration-stopped samples (denoted S) and from 10-11 m²/s and 10-7 m²/s for two-month (2M)
and eight-month (8M) hydrated samples. The figure shows that the oxygen diffusion coefficient
slightly decreases with the increase of relative humidity for hydration-stopped samples,
0,0%
0,5%
1,0%
1,5%
2,0%
2,5%
3,0%
3,5%
4,0%
4,5%
6 to 7 7 to 8 8 to 9 9 to 10
Co
effi
cien
t o
f va
riat
ion
( -L
og(
De,
O2
))
-Log(De,O2)
minmaxmediane

116
whereas it decreases significantly with relative humidity for fully hydrated samples. For all
samples, the diffusion of oxygen through dry pores is much faster than through wet pores: the
oxygen diffusion coefficient is half an order of magnitude higher for dry and hydration-stopped
samples and three orders of magnitude higher for dry hydrated samples. These results are
consistent with other studies carried out on similar cement pastes using a different test method
that also showed a great decrease in gas diffusivity for RH>55% [161][56].
It is also seen that lowering the volumetric W/B ratio can substantially decrease the oxygen
diffusion coefficient by half to one order of magnitude, depending on the binder type. Note that
OPC_SF samples hydrated for eight months are not tested at RH=93%, as measurements
were below the detection limit: the calculated oxygen diffusion coefficient is below the order of
magnitude of the leakage-equivalent diffusion coefficient (1.7x10⁻¹¹ m²/s).
a) b)
1E-11
1E-10
1E-09
1E-08
1E-07
1E-06
0% 20% 40% 60% 80% 100%
De
,O2
(m
²/s)
RH
S_OPC_1.9 S_OPC_1.62M_OPC_1.9 2M_OPC_1.68M_OPC_1.9 8M_OPC_1.6
1E-11
1E-10
1E-09
1E-08
1E-07
1E-06
0% 20% 40% 60% 80% 100%
De
,O2
(m
²/s)
RH
S_OPC_SF_1.9 S_OPC_SF_1.6
2M_OPC_SF_1.9 2M_OPC_SF_1.6
8M_OPC_SF_1.9 8M_OPC_SF_1.6

117
Figure 42: Experimentally determined oxygen-effective diffusion coefficients for (a) OPC samples, (b) OPC_SF samples and (c) OPC_Slag samples
1.4.3 Other microstructural properties’ measurements
i) Total porosity and pore-size distribution
For hardened cementitious materials, two types of porosity are usually distinguished: gel
porosity (i.e. internal porosity of the C-S-H gel phase) and capillary porosity[182]. The latter is
a residue of the space between the anhydrous grains that has not been filled by hydration
products [183]. This space is a function of the water-per-binder (W/B) volumetric ratio and
hydration duration. Therefore, in this study, water porosity is measured at three different ages
for all tested samples. Results are shown in Table 27. As expected, total porosity slightly
decreases with hydration duration between two months and eight months. By increasing the
volumetric W/B from 1.6 to 1.9, total porosity is increased by around 3% at three hydration
durations, which corresponds to the initial effect (62% and 65%).
c)
1E-11
1E-10
1E-09
1E-08
1E-07
1E-06
0% 20% 40% 60% 80% 100%
De
,O2
(m
²/s)
RH
S_OPC_Slag_1.9 S_OPC_Slag_1.6
2M_OPC_Slag_1.9 2M_OPC_Slag_1.6
8M_OPC_Slag_1.9 8M_OPC_Slag_1.6

118
Hydration duration
Paste sample
T=0 T= 1day(OPC) or 7 days (others)
T= Two months T= eight months
OPC_1.6 62 49.2 45.5 41.7
OPC_1.9 65 53.5 48.3 45.4
OPC_SF_1.6 62 48.3 47.0 44.9
OPC_SF_1.9 65 52.5 50.8 51.0
OPC_Slag_1.6 62 51.5 45.8 45.4
OPC_Slag_1.9 65 54.4 50.6 47.7
Table 27: Water porosity (%) at different hydration durations for all tested materials
However, total porosity is seen to significantly decrease with hydration duration at early age (1
and 7 days), which can be explained by the fact that the development of the microstructure is
highly controlled by the critical first few days after mixing [183]. The porosity of SF and slag
cement pastes is slightly higher (1% to 6%) than that of Portland cement paste, even at eight
months hydration. These results are in agreement with the work of Yu [124] who found that
total porosity of cement pastes blended with fly ash (30% and 50% replacement at W/B=0.4)
was higher than Portland pastes at ages up to 3 years.
For all other samples, we can see that the total porosity varies slightly as the hydration
proceeds from 1 day to eight months. Therefore, in order to provide important insights about
the microstructure and the porous system of our materials, changes in pore-size distribution
with hydration duration are obtained by mercury intrusion porosimetry (MIP). Results are
shown in the Appendix Fig 72. Capillary pores that are closely related to mass transport are
reported be within the size of 0.01µm to 10µm [182], this range of pore size is covered by the
results from MIP.
Observation of these results reveals that most of the pastes measured here have a pore-size
distribution with a mean pore diameter of less than 10µm, except for samples with silica fume
for which the pore-size distribution is less than 1µm. These results also show that hydration
causes the main porous mode to decrease this may be due to the progress of cement
hydration, which gradually decreases the volume fraction of large pores. It is also seen that an
increase in the volumetric water-per-binder ratio causes a shift from the main porous mode to
larger diameters.
ii) Water vapor sorption/desorption isotherm
Water vapor sorption/desorption isotherms, expressed in terms of water saturation degrees,

119
are graphically presented in Figure 43. These results are obtained only by sorption for
hydration-stopped samples and only by desorption for other samples. At 3% RH, all pastes
with different volumetric W/B ratios and at different hydration durations are in the same range
of water saturation: [0%, 10%]. From a relative humidity of 33%, the degree of water saturation
present in the samples increases substantially with hydration duration due to a change in the
pore structure as hydration proceeds. The water retention capacity at both early ages and 2
months is not significantly reduced when the volumetric W/B ratio is reduced from 1.9 to 1.6
m3/m3. However, at the hydration age of 8 months, a slight increase in water saturation is
observed when this ratio is reduced.
Figure 43: Water saturation degree at different relative humidity for: (a) OPC samples, (b) OPC_SF samples and (c) OPC_Slag samples
a) b)
c)
0%
10%
20%
30%
40%
50%
60%
70%
80%
90%
100%
0% 20% 40% 60% 80% 100%
Deg
ree
of
wat
er s
atu
rati
on
RH
S_OPC_1.6S_OPC_1.92M_OPC_1.62M_OPC_1.98M_OPC_1.68M_OPC_1.9
0%
10%
20%
30%
40%
50%
60%
70%
80%
90%
100%
0% 20% 40% 60% 80% 100%
Deg
ree
of
wat
er s
atu
rati
on
RH
S_OPC_SF_1.6S_OPC_SF_1.92M_OPC_SF_1.62M_OPC_SF_1.98M_OPC_SF_1.68M_OPC_SF_1.9
0%
10%
20%
30%
40%
50%
60%
70%
80%
90%
100%
0% 20% 40% 60% 80% 100%
Deg
ree
of
wat
er s
atu
rati
on
RH
S_OPC_Slag_1.6S_OPC_Slag_1.92M_OPC_Slag_1.62M_OPC_Slag_1.98M_OPC_Slag_1.68M_OPC_Slag_1.9

120
iii) Degree of hydration of the tested samples
The degree of hydration of the sample is also critical information required for the full
understanding of the material transport behavior, thus samples’ degree of hydration is
determined through the X-ray diffraction (XRD) technique and thermogravimetric analysis
(TGA) for OPC samples [28], after all diffusion tests are concluded. For that, samples are dried
in the oven at 105°C until constant mass, crushed/milled, and sieved through a 63µm sieve.
OPC_Slag samples’ degree of hydration was estimated by scanning electron microscopy
[184][179]. OPC_SF pastes degree of hydration was taken from previous works in literature
[175][180]. Results are shown in Table 28.
Hydration duration mix Additions’ degree of hydration
OPC degree of hydration
Determination method
1 day and 7 days
S_OPC_1.6 -
62.0% TGA/XRD
S_OPC_1.9 65.0%
S_OPC+SF_1.6 43.0% 80.0% Literature
S_OPC+SF_1.9
S_OPC+Slag_1.6 0.0% 89.8% SEM
S_OPC+Slag_1.9 0.0% 87.6%
2 months
2M_OPC_1.6 -
91.0% TGA/XRD
2M_OPC_1.9 93.0%
2M_OPC+SF_1.6 70.0% 91.0% Literature
2M_OPC+SF_1.9
2M_OPC+Slag_1.6 46.1% 94.1% SEM
2M_OPC+Slag_1.9 45.5% 96.1%
8 months
8M_OPC_1.6 -
95.5% TGA/XRD
8M_OPC_1.9 95.9%
8M_OPC+SF_1.6 80.0% 97.0% Literature
8M_OPC+SF_1.9
8M_OPC+Slag_1.6 77.8% 98.8% SEM
8M_OPC+Slag_1.9 80.5% 98.9%
Table 28: Degree of hydration of tested pastes at different hydration durations
1.5 Discussion
1.5.1 Test procedure
The diffusion test developed during this work allows for the determination of the oxygen-
effective diffusion coefficient of paste samples under well-controlled laboratory conditions. This
experimental setup provides reproducible and repeatable diffusion coefficients over 4 orders of
magnitude [10-6, 10-11 m2/s]. Furthermore, the test method has a short time of measurement at
dry state: 30 to 45min. It takes less than 5 weeks to stabilize the 3 mm thickness samples at a

121
certain relative humidity (for a water equilibrium criteria: less than 0.05% mass variation in a
week) and from 30min to four weeks to make most measurements, depending on the water
saturation degree of the sample and its composition. Two additional big advantages of this
experimental set-up are, first, it does not require an oxygen bottle, thus no safety problems
could arise, and, second, it contains low-priced equipment that is affordable for most
laboratories.
However, while the basic concept of the test method is relatively straightforward, handling the
experimental results involves a numerical resolution of Fick’s second law of diffusion, taking
into consideration the transient conditions. In addition to that, the determination requires
knowledge of the total porosity and degree of water saturation of the sample.
Note that the leakage test of the experimental setup sets the detection limit of oxygen-effective
diffusion coefficients: values below 10-12 m²/s cannot be determined with good precision. In this
context, we refer to the previous works of Peng on the development of a diffusion chamber to
measure oxygen gas diffusivity for different rocks and construction materials. These chambers’
leakage rate corresponded to a diffusion coefficient of 4.8 x 10⁻⁹ m²/s, which is due mainly to
the contact between the sample and its holder [100].
1.5.2 Effect of the water saturation degree on the diffusion coefficient
Results on oxygen diffusion coefficient as a function of relative humidity show that the
diffusivity of gaseous oxygen through cement pastes is quite sensitive to hygroscopic
conditions. Relative humidity of preconditioning determines the degree of saturation of the
pores that is directly related to the percentage of pores available to gas transport. The oxygen-
effective diffusion coefficient is found to vary between 10−6 m2/s for dry samples and 4x10⁻¹¹
m2/s for samples at high relative humidity.
At intermediate relative humidity (<55%), samples appear to be available to gas transport
mainly due to the increase of the pore space available to gases and due to the increase of
connectivity and to the reduced tortuosity of the gas path [99]. These results are in agreement
with some literature findings that suggest that at a relative humidity lower than 60%, the
variation in transport properties is negligible because most of the pores relevant to transport
(capillary pores and microcracks) have already been emptied [185][9].
On the other hand, samples conditioned at high relative humidity contain many saturated
pores that are effectively blocked and do not contribute to gaseous oxygen transport. Gaseous
oxygen can diffuse through water-filled space or through air-filled space but, in the former
case, the process is 104 to 105 times slower than in the latter [186], because oxygen has a low

122
solubility in water (10-4 mol/l). In addition to that, at high relative humidity (RH>60%), mobility of
oxygen in the gas phase is limited by the comparatively high-water content in the pores. These
results are in agreement with some previous works that suggest that the influence of pore
saturation on the transport properties of cement-based materials is only significant when the
preconditioning relative humidity (RH) is greater than about 60% [167][145].
1.5.3 Influence of the degree of hydration
Regarding the impact of hydration duration on the oxygen-effective diffusion coefficient, results
show that this coefficient is greatly affected by the degree of hydration: good and prolonged
hydration reduces the oxygen diffusion coefficient by up to four orders of magnitude at high
relative humidity, and a constant degree of hydration. Note that if the hydration is stopped at
early age by drying at low relative humidity, it could restart at high relative humidity or
exposure to water during the water porosity measurements [176].
The oxygen diffusion coefficient’s variation with relative humidity is more pronounced for fully
hydrated samples. At high relative humidity, the oxygen diffusion coefficient for samples at two
months hydration is one order of magnitude lower than hydration-stopped samples and two to
three orders of magnitude lower at eight months hydration. This may be explained by the fact
that a longer hydration promotes the formation of a greater amount of hydrates that fill the
capillary porosity and help retain higher water content for samples at the same RH as seen in
Figure 43.
1.5.4 Influence of paste composition
Another important factor that influences De,O2 is the volumetric W/B ratio because it directly
affects the pore structure and diffusivity of the concrete. The lowering of the volumetric W/B
ratio slightly decreases the oxygen diffusion coefficient for hydration-stopped samples and
samples that were hydrated for two months, whereas it causes a higher decrease of De,O2 for
samples that were hydrated for eight months, especially OPC_SF samples.
Although the effect of SCMs is not appreciated in the early age (before 7 days), samples with
10% silica fume gave the most remarkable positive effect on transport properties and pore
refinement, as it can also serve as a pore filler that provides additional nucleation due to small
particle size. It is established that for the two tested supplementary cementing materials at a
volumetric W/B = 1.6 (silica fume and slag), oxygen diffusivity decreases by at least one order
of magnitude at two and eight months at all levels of relative humidity. The lowest oxygen-
effective diffusion coefficient is observed for mixes with silica fume at volumetric W/B = 1.6 ;
this is the case mainly because of two reasons: (a) SF is extremely finer than slag and is thus

123
more effective in densifying the microstructure of the cement paste matrix and (b) SF has a
higher reactivity [187], and OPC have a higher degree of hydration degree in the mix with 10%
SF replacement [175] . After only seven days of hydration, Figure 43 shows that silica fume
samples retain slightly more water than slag samples, which can be explained by the fact that
relatively fine pores are formed in pastes of silica fume.
1.5.5 Pore-size distribution effect
Using an automatic analysis that allows for the fitting of the data from the MIP analysis
(Appendix 1), the porous structure of these pastes is found to be of unequal trimodal type. For
each mode, we calculated the mean pore diameter and its corresponding volumetric fraction
and standard deviation (Figure 74). Using these results, a weighted arithmetic mean of the
mean pore diameter of each mode is calculated and compared with the diffusion coefficients
determined experimentally on samples with different saturation degrees. Figure 44 shows the
relation between the oxygen-effective diffusion coefficients from our experimental data at three
different saturation degree ranges: 1.83% to 20%, 40% to 60% and 80% to 95.8%, and the
mean pore diameter of the tested samples in Log-scale. An analysis of this figure reveals that
oxygen-effective diffusion coefficients display a somewhat linear trend with respect to the
mean pore diameter with a slope of 1.4 and 1.6 and 2.9 for the three degrees of water
saturation ranges 1.83% - 20%, 20% - 40% and 80% - 95.8% respectively, with the following
regression coefficients: 0.92, 0.60, and 0.63. Dispersion in experimental data is more
pronounced for samples with high degrees of water saturation.
Figure 44: Oxygen-effective diffusion coefficient versus weighted mean pore diameter in Log-scale at three different saturation degree ranges
6
6,5
7
7,5
8
8,5
9
9,5
10
10,5
6,8 7 7,2 7,4 7,6 7,8 8
-Lo
g(D
e,O
2)
-Log(d)
Sl : 80% - 95.8%
Sl : 40% - 60%
Sl : 1.83% - 20%

124
The dependence of the effective diffusion coefficient experimentally measured on the mean
pore diameter of the samples is consistent with the theoretical estimation of the gas diffusion
coefficient under Knudsen diffusivity. Indeed, the Knudsen diffusion coefficient Dk is directly
proportional to the mean pore diameter d, as seen in Equation 41 [92], where ϕ is the porosity
available for the transport, τ is the tortuosity, T [°K] is the temperature, and Mgas is the molar
mass of the diffusing gas. Note that this equation is valid under the assumption that the pores
in which diffusion can take place are cylindrical and interconnected [10].
DK =ϕ
d
3 (
8RT
π Mgas)
12
Equation 41
Knudsen flow is known to occur in the gaseous phase of the pores when gas molecules collide
much more frequently with the pore walls than with each other. This diffusion mechanism
generally occurs when the mean pore diameter is much lower than the mean free path of
oxygen molecules at atmospheric pressure and 20°C ie: d < 50 nm [19] ( -log(d) >> 7.3),
which is the case of most of the data shown in Figure 44. However, for high degrees of water
saturation (Sl > 20%), the big dispersion of the data does not allow for the definite conclusion
of Knudsen regime predominance. It is also of relevance to note that Equation 41 is developed
for materials that are entirely inert with regards to the gas-diffusing species. In our case,
pastes containing slag are expected to react with oxygen due to the oxidation of the sulfur
content species [188].
Pore size does contribute to the effective diffusion coefficient as much as the degree of water
saturation. For the same range of water degree of saturation, the oxygen diffusion coefficient
varies over one to three orders of magnitude when the mean pore diameter varies within one
order of magnitude.
1.5.6 Comparison with literature model
The oxygen-effective diffusion coefficient may also be estimated using models developed to
predict the carbon-dioxide-effective diffusion coefficient and Graham’s law. The most
commonly used model for De,CO2 prediction is Papadakis model [83], giving the diffusion
coefficient as a function of the ambient RH. Based on these experimental data, Thiéry [39]
proposed a derived expression giving the coefficient as a function of the water saturation
degree Sl , total porosity , and the carbon-dioxide-diffusion coefficient in air (Dair,CO2 = 1.6x10⁻⁵
m²/s).
De,CO2 = Dair,CO2 ϕa (1 − Sl)b

125
Equation 42
Empirical parameters in this model (a = 2.74, b = 5.17) were obtained by fitting experimental
data of tests performed on carbonated mortars at different RH [11]. The oxygen-effective
diffusion coefficient can be estimated from the carbon-dioxide diffusion coefficient using
Graham’s law, where MCO2 and MO2 are the molar mass of carbon dioxide and oxygen
respectively.
De,O2 = (MCO2
MO2)
12 Dair,CO2 ϕa (1 − Sl)
b
Equation 43
Using Equation 43, regression parameters a and b are recalculated by least square fitting of all
the experimental data of this work for each mix. Note that the good quality of the least square
fit is achieved by minimizing value of the sum of squared residuals r. In our case r is in the
range of 10-7 m²/s, which is in the same order of magnitude as the measured diffusion
coefficients. These large residuals could give a large uncertainty on the prediction of the
regression coefficients a and b.
• For OPC samples : a = 5.5 ; b = 2.2 ; r = 7,2x10⁻⁷
• For OPC_SF samples : a = 7.5 ; b = 4.9 ; r = 3.5x10⁻⁷
• For OPC_Slag samples : a=6.8 ; b=2.4 ; r = 3.9x10⁻⁷
These results show that the total porosity regression coefficients (a in equation Equation 43):
5.5, 7.5, and 6.8) are more than two times higher compared with the Thiéry model (a = 2.74),
whereas the water saturation degree parameter b is found not to vary so much for silica fume
(a=4.9, compared to 5.17 for Thièry model). However, it is two times lower for OPC pastes.
Note that these model parameters were developed based on nitrogen diffusion tests
performed on carbonated, non-blended cement pastes and concretes [18].
The major limitation of this model is that the diffusion coefficient is related to an averaged
descriptor of the pore structure, which is the total porosity and the water saturation, while
neglecting actual pore-size distribution and topology. These kinds of models do not take into
consideration the binder type or the effects of hydration that affect the microstructure, unless
regression coefficients become specific of each mix design.

126
1.6 Conclusions
In this work, a new test method is developed to determine the oxygen-effective diffusion
coefficient of cement pastes. It is used to measure diffusion coefficients of cement pastes
made with different binders and volumetric W/B ratios at different water saturation degrees
and hydration durations.
The test method is interesting due to its ease of manipulation, its non-destructive nature, its
potential to give a reasonable indication of the material quality, and its ability to more closely
monitor site conditions by testing the samples at different RH. This method is proven capable
of rapidly measuring the diffusion coefficient for hardened cement paste of 3 mm thickness in
a reasonable duration (30 minutes to 4 weeks) and with a good accuracy for oxygen-effective
diffusion coefficients between 10-10 m²/s and 10-6 m²/s.
According to the results obtained from this work, the hydration duration is found to be a
property that highly impacts the oxygen diffusion coefficient. Prolonged hydration substantially
reduces the diffusion coefficient, especially for samples with slag and silica fume, as the
reaction of SCM is generally slower than the hydration reaction of Portland cement and
requires longer periods of hydration. The diffusion coefficient and total porosity increase with
the decrease of hydration duration and the increase of the volumetric W/B ratio. This can be
explained by the formation of higher connectivity and porous volume that allows for an easier
and faster ingress of gaseous oxygen.
Hydration duration, volumetric W/B ratio, and the material composition control the pore-size
distribution of the cement paste, which influences the liquid saturation of the pores at different
preconditioning relative humidity. Thus, knowledge of the water content of the cement paste
and its pore-size distribution are key properties to predicting gas-diffusion coefficients. It is
expected that the collected data can thus be extrapolated to other gases like carbon dioxide
and therefore used in the service life models of carbonation induced corrosion.

127
2 Paper II: Influence of carbonation on the
microstructure and the gas diffusivity of
hardened cement pastes
2.1 Abstract
The influence of carbonation on the oxygen-effective diffusion coefficient (De,O2) of hardened
cement pastes (HCP) is investigated in the scope of durability. Experiments are carried out on
HCP made with different binders (Portland cement, fly ash, slag, metakaolin binders) and
water-to-binder ratios at three relative humidity levels. At a given RH, the change in De,O2 due
to carbonation depends on the mix composition. However, in most of cases, De,O2 increases
after carbonation, despite the porosity clogging. This is explained by both the decrease in the
water saturation degree, especially at high RH, and the change in the pore size distribution. A
good correlation is found between the mean pore diameter and gas diffusivity before and after
carbonation at low water saturation degree (R² > 0.84 on a log-log scale). De,O2 is significantly
less dependent on the water saturation degree after carbonation.
2.2 Introduction
Carbonation is recognized as a significant cause of corrosion in concrete reinforcement
[189][190].This physicochemical process causes diverse chemo-mechanical changes in the
cement paste, especially changes in the microstructure and chemistry of the cementitious
matrix [48][31].
The first mechanism controlling concrete carbonation is the gaseous CO2 diffusion process by
which CO2 moves through the gas-filled pores. This phenomena is governed by an effective-
diffusion coefficient, which is a durability indicator of concrete, a quality parameter indicating
the level of gas tightness of cementitious materials, and a relevant input parameter for service
life prediction models of concrete in a real environment [6][84][191]. Previous works [86][192]
show that transport properties of cementitious materials are highly dependent on the degree of
water saturation. Hence, the determination of transport properties at various hydric states is of
high importance. On the other hand, carbonation causes numerous changes in the cement
paste microstructure [31][35]. It should be noted that, in the literature, experimental data on the
effect of carbonation on gas diffusivity are lacking compared to investigations on other
transport phenomena such as chloride diffusion and water transfer [51][193][194]. The
microstructure of the hardened cement paste (HCP) determines the transport properties of

128
concrete to a high extent, since HCP is the component that contributes for the greatest part of
the concrete porosity [9][195]. Therefore, in the present work, diffusion tests are carried out on
HCP samples, employing an experimental setup from our previous works [192]. The latter
uses atmospheric oxygen as the diffusing gas and allows for the determination of oxygen
diffusivity under different hygrometric conditions. Admittedly, major differences exist between
O2 and CO2 gases: their solubility in fluids, their molecular size, etc. Nevertheless, it is
possible to obtain a good prediction of CO2 diffusivity by means of values of O2 diffusivity
[100][91]. Plus, the CO2-effective diffusion coefficient of partially water saturated cementitious
materials cannot be measured using gaseous CO2 since it chemically reacts with the calcium-
bearing phases of the materials and changes their microstructure.
The second mechanism controlling the carbonation progress of concrete is the CO2-binding
capacity of its hardened cement paste. This property is directly related to the amount of the
calcium-bearing phases that could dissolve and react to result in the formation of calcite. The
amount of carbonatable compounds influences the rate of carbonation: a higher amount of
carbonatable compounds hinders the carbonation depth progress [6]. Note that the amount of
bound CO2 varies with the different humidity levels in each exposure site: the pastes exposed
to the higher humidity (unsheltered from rain) are those fixing a higher amount of CO2 [196].
The partial replacement of cement with alternative powders entails a considerable
environmental impact. However, the use of these additions, also called Supplementary
Cementitious Materials (SCMs) should not adversely affect the behavior of the material. SCMs
can be classified into pozzolanic, hydraulic or inert substances. There are great differences in
the respective contribution of each SCM’s type to the hydration reaction of the cement and,
consequently, to the HCP microstructure. Therefore, it is important for the carbonation
resistance of cementitious materials to know what role an optional additive play in the
microstructure of the material.
In the present work, the oxygen-effective diffusion coefficient of six different HCPs blended
with fly ash, slag, limestone and metakaolin additions is determined after full hydration (90
days) in the non-carbonated state and after full carbonation under 1% CO2 concentration by
volume. The influence of the degree of water saturation is assessed at both states after a
preconditioning at three relative humidity levels: 55%, 95% and 33%. The microstructural
changes, phase assemblage and CO2-binding capacity of the tested HCPs are investigated
using water porosity, mercury intrusion porosimetry (MIP), and XRD and TGA techniques,
respectively. The carbonation resistance is deduced from this work’s results using a
deterministic model from the literature. The carbonation performance of the six HCPs is
compared to experimental results after exposing the HCPs to carbonation in a room regulated

129
at 50%RH.
2.3 Materials and methods
2.3.1 Cement pastes mixtures
With the aim of testing the most widely used binders, six types of cement pastes, including
blended cements, are tested. Two cement types are used to prepare the samples. The oxide
composition of the raw materials is given in Table 29. The cement pastes mix compositions
are shown in Table 30. Note that the water-per-binder ratio W/B is expressed in mass and the
replacement percentage of the additions is expressed in relation to the total amount of
additions plus ordinary Portland cement (i.e. CEMI according to European nomination). Only
binary systems are investigated. Note that in the case of limestone, the EN 197-1 standard
accepts 35% of replacement at the most [197]. Therefore, it was decided to increase the
limestone content to 40% to evaluate the consequences of such a high value.
Material Constituent (% )
CaO SiO2 Al2O3 Fe2O3 MgO K2O Na2O SO3 TiO2 LOI
CEMI 52.5 N 64.1 20.1 5.2 3.3 0.8 0.76 0.28 3.0 1.8
CEMI 52.5
N PM 60.8 19.27 4.59 3.25 2.01 0.97 0.19 2.88 1.99
Fly ash 5.08 83.45 1.66 1.4 0.58 <5
Slag 43.7 37.4 10.8 0.5 6.5 0.36 0.49 0.1 0.6 <1.5
Metakaolin 0.2 55 40 1.4 0.1 0.4 0.4 - 1.5 1
Table 29: Oxide composition of the raw materials

130
Mix name W/B Cement type Addition type Addition content
(wt%)
Air content
(vol%)
PC6 0.60 CEM I 52.5 N - 0 0.2
FA6 0.60 CEM I 52.5 N FA 30 0.1
SL6 0.60 CEM I 52.5 N Slag 60 0.7
LS6 0.60 CEM I 52.5 N Limestone 40 1.0
SL35 0.35 CEM I 52.5 N PM Slag 50 0.1
MK45 0.45 CEM I 52.5 N MK 20 0.1
Table 30: Mix design of the tested cement pastes
2.3.2 Preparation of the HCPs samples
The cement pastes are prepared using a waring blender until homogenization of the fresh mix.
The pastes are poured in cylindrical molds (diameter 4 cm; height 10 cm) and vibrated to
remove entrapped air bubbles. The molds are rotated for 24h in order to avoid the
sedimentation of solid particles. The mixes are then demolded and stored in a 100% RH room
at ambient temperature for 90 days. Note that the hydration duration is a very important
parameter when studying pastes containing pozzolanic additions such as fly ash. After 90
days, it is supposed that the portlandite content of such a paste will only slightly change over a
further hydration duration, since most of the pozzolanic hydration reactions have already taken
place [198][199][200]. For each mix, 6 molds are prepared. The air content of each mold is
determined through the density measurements of the fresh paste. Cylinders with the lowest air
content are used for the diffusion tests (Table 30).
For each HCP mix, two cylinders are used for the diffusion tests before carbonation and two in
the carbonated state. From these cylinders, thin samples of 2.5 mm are sawed using a
precision saw. Testing thin samples is convenient since they carbonate and reach water
equilibrium in a reasonable amount of time (3 to 5 weeks). First, 60 discs are used to be tested
in the non-carbonated state. These discs are placed directly in climate chambers equilibrated
at three different relative humidity levels (33% 55% and 93%). The hygrometry is maintained
at a constant level by means of saturated salt solutions, and soda lime was added in the
climate chambers in order to avoid the carbonation of the samples during preconditioning. The
CO2 concentration inside these chambers did not exceed 10 ppm (using a sensor with a
detection limit of 75 ppm). In parallel, 60 discs from the six paste mixtures are tested in the
carbonated state. Full carbonation of the tested samples is achieved using accelerated

131
carbonation in an environment-controlled climate chamber equipped with a system that allows
for an accurate regulation of the CO2 partial pressure and temperature. Prior to carbonation,
the 60 discs are kept in a room regulated at 55% relative humidity for a month in order to
reach a constant degree of water saturation that promotes carbonation. Afterwards, they are
placed in the carbonation chamber with a CO2 content of 1 ± 0.2% for six weeks and 55%RH.
This value is chosen to ensure the representativeness of the mineralogical evolution compared
to atmospheric carbonation [201], to avoid the cracking of the cement paste after carbonation,
and to carbonate the samples in a reasonable amount of time. The temperature at each
conditioning step is 20°C. The carbonation progress is monitored in a simple way through a
phenolphthalein solution: the colorlessness of the phenolphthalein indicator test was the
termination criterion. This procedure is chosen to examine samples with the same or
comparable progress of carbonation. The oxygen-effective diffusion coefficient is also
determined for carbonated samples at three relative humidity levels. Note that in order to test
the carbonated HCP at 93% RH, all the discs are first water saturated under vacuum for 48h
and placed in a climate chamber at 93%RH until mass equilibrium is reached. The reason
behind water saturating these samples is to test all the HCPs in the desorption state only. After
all diffusion tests are performed, the samples are dried in the oven at 105°C to reach their dry
mass, which allows for the determination of their degree of water saturation at the three
relative humidities chosen.
2.3.3 Oxygen-effective diffusion coefficient
The oxygen-effective diffusion coefficient is measured using an experimental setup developed
during our previous works [192]. The test method relies on the accumulation of gaseous
oxygen inside a diffusion cell called a “downstream chamber”. The tested specimens are discs
with a diameter of 4 cm and a thickness of 2.5 mm. This experimental setup contains no
upstream chamber: one face of the tested specimen is in contact with the ambient air of the
climate chamber (volume of 40 L), i.e. at an O2 concentration of around 20% by volume, and
the other face is in contact with the inside volume of the cell (68ml). The absence of the O2
bottle is of relevance from a practical point of view. The volume of the climatic chamber is
much larger than the volume of the downstream cell, so the oxygen concentration in the
climatic chamber is constant over the test duration. At the beginning of the test, the
downstream chamber is flushed with nitrogen for 20s to reach an O2 concentration lower than
0.3%. The experimental setup (Figure 45) is then placed inside a temperature and relative
humidity-controlled climate chamber (also called an “upstream chamber”).

132
Figure 45: Schematic description of the setup of the determination of the oxygen-effective diffusion coefficient
By means of saturated salt solutions, the relative humidity inside the climate chamber is set at
the same relative humidity as the one used for the pre-conditioning of the tested samples
during the diffusion test. The relative humidity level is monitored inside the climate chamber by
means of a sensor during the test period and found to vary slightly (2% to 5% at the most).
Oxygen diffuses successively from the ambient air through the sample into the cell initially
filled with nitrogen. Oxygen concentration is monitored inside the cell by an oxygen gas
sensor. This sensor allows for continuous readings of the oxygen concentration. All
measurements are carried out at 20°C and 1 atm. The oxygen-effective diffusion coefficient is
determined by minimizing the residue between the experimental and numerical accumulation
curve. The numerical accumulation curve is obtained by solving Fick’s second law of diffusion
with a finite volume solver in python called fipy, version 3.1.3 [178]. More details about the
experimental setup and data analysis are given in [192].
2.3.4 Microstructure characterization techniques
Water porosity (𝜙) is obtained using hydrostatic weighting and oven-drying the HCP samples
at 105°C. The specimens are preliminarily water-saturated under vacuum for 48h following the
current standard used in France [202]. The pore size distribution of the samples is determined
using mercury intrusion porosimetry (MIP). The degree of water saturation of the tested

133
samples at 33%, 55% and 93% RH is calculated using Equation 44, where m is the mass of
the sample at moisture equilibrium, m0 the dried mass, and msat the saturated mass. The
saturated mass of the 2.5 mm thick samples is determined via water soaking under the
vacuum for 48h. The dry mass is obtained after drying the samples in the oven at 105°C for 3
days.
Sr =m − m0
msat − m0 Equation 44
Changes in the pore structure characteristics of the paste samples after exposure to 1% CO2
are assessed using mercury intrusion porosimetry. MIP provides information about the
connectivity of the pores and reveals information about pore geometry [123]. This technique is
based on the Laplace equation [125], which relates the pressure applied to the pore diameter.
This diameter actually corresponds to the entry diameter of the pore. The tested samples are
small blocks of a typical size of a few mm to 1 cm. These samples are cored out from the
hardened cement paste discs and pre-dried at 45°C for 24h. Note that the smallest pores (gel
pores) are only partly measured by this technique. Thus, the water porosity is certainly higher
[179].
Note that these tests are carried out right after sawing the thin cement pastes under water
(and pre-drying at 45°C for MIP test) in order to avoid carbonation of the discs. After
carbonation, when the pH-indicator becomes colorless over the 3mm thickness samples,
water porosity, pore size distribution and degree of water saturation are determined on the
carbonated discs. MIP test is run on one specimen only while the other tests are carried out on
three replicates.
2.3.5 Mineralogical changes
Before and after carbonation of the HCP, one complete disc of each mix at both states is
grinded and sieved completely using a sieve of 63 µm, and then 30 mg of this powder is used
for the TGA and XRD tests. Only one test is run for each mix.
The mineralogical changes induced by carbonation are identified using TGA and XRD
techniques. The degree of carbonation (DoC) is determined using TGA. DoC is defined as the
CO2-bound with respect to the total theoretical maximum binding capacity MBC (equation 4).
The six cement paste mixtures are finely powdered and sieved using a sieve of 63 µm for
these analyses. TGA (Metller TGA-DSC 3+) is used to quantify all carbonates polymorphs.
Around 30 mg of the powder sample is placed in the device and heated from 30 to 1000°C at

134
10°C/min under a small nitrogen flow (20 mL/min). The temperature of the carbonates’
decomposition is assumed to range from 550 to 1000°C [108]. Previous work of Radha et al.
[27] shows that the decomposition temperature of all carbonates polymorphs is around 800°C.
The samples’ degree of carbonation DoC is determined based on the amount of anhydrous
cement using equations 3 and 2:
DoC = BC
MBC Equation 45
B−CO2 =mCO2
550−1000°
mOxyde1000°C + mCO2
0 + mH2O0
Equation 46
MBC = ∑ carbonatable cationic oxide
M(carbonatable cationic oxide)∗ MCO2 − SO3 ∗
MCO2
MSO3
Equation 47
Where B-CO2 is the bound CO2, mCO2550−1000° is the mass loss that corresponds to the
decarbonation of CaCO3,mCO20 , and mH2O
0 are, respectively, the CO2 and water amount
present in the raw materials (cement and mineral additions used). MBC is the maximum
amount of CO2 that could be present in the sample if all CaO (except the one coming from
CaCO3 present in the raw materials, and the one introduced in the mix LS6 as an additive)
was carbonated. This value could be approximately inferred by the quantity of its main
carbonatable cationic oxides such as CaO, MgO, SO3, etc.
The amount of SO3 is deduced in the calculation of the maximum degree of carbonation
because in the presence of an excess of sulfate anions, calcium cations react with sulfate
anions to form gypsum at room temperature even when the system is buffered by atmospheric
CO2.
The X-ray diffraction (XRD) is used to identify the nature and amount of the different calcium
carbonate polymorphs. XRD tests were carried out with a Philips/PANalytical X’Pert Pro-MPD
Powder Diffractometer with an X’Celerator detector of an incident CuKα radiation beam by 40
kV and 40 mA to a rotation sample. The specimens are scanned for 40 minutes from 2θ = 5 to
65° by a step of 0.25° without protection from CO2 and in a dry environment (RH~40%).
The carbonation depths of the six HCPs are measured directly by means of phenolphthalein
solution after exposing side-sealed discs of 3 cm thickness and 4 cm diameter to natural
carbonation in a relative humidity-controlled room at 50%. The carbonation depth is measured

135
once a month for six months. Note that the samples were preconditioned for one week in a
climate chamber with soda lime prior exposure to carbonation.
2.4 Results
2.4.1 Changes in the chemical composition
The amount of portlandite, calcite and other hydration products such as C-S-H and ettringite is
estimated before and after the carbonation test. The recorded mass losses during TGA are
expressed in the percentage relative to the residual mass of the sample at 1000°C.
Before carbonation (g /100g)
After carbonation (g /100g)
Temperature range (°C)
30-350 350-550 550-950 30-350 350-550 550-950
Released component
H2O H2O CO2 H2O H2O CO2
Main cement phases [108]
C-S-H, AFt & other
hydrates CH 𝐶𝑐̅
C-S-H, AFt & other
hydrates CH 𝐶𝑐̅
PC6 18.4 9.2 4.4 10.8 7.6 36.6
FA6 16.0 5.7 4.7 5.1 0.7 33.4
SL6 15.3 4.0 3.5 5.4 0.6 30.5
LS6 12.3 6.0 21.3 4.9 1.2 51.2
SL35 14.4 5.0 4.5 5.0 0.6 27.7
MK45 19.9 4.7 4.4 5.9 0.5 24.9
Table 31: TGA results before and after carbonation of the six HCP
Table 31 presents the TGA results on the evolution of the content of bound water and CO2 to
portlandite (CH), (C-S-H), and calcium carbonate, respectively. The six HCP are tested before
and after accelerated carbonation at 1%. The high content of calcium carbonate before the
carbonation of the paste’s LS6 corresponds to the unreacted limestone present in the initial
mix, while the small amounts of calcium carbonate present in the other HCPs before
carbonation are due to the initial CO2 amount in cement (up to 2%) and to a slight carbonation
of the paste during the preparation and conditioning in a CO2-low concentration environment
(10ppm). Results from Table 31 reveal that portlandite is still present only in the PC6 after
carbonation, while it is consumed for blended systems. Even though the highest amount of
calcium carbonate formed after carbonation is observed for PC6, the lowest consumptions of
hydration products upon carbonation are observed for this HCP. Before carbonation (BC),
results from Table 32 also reveal that a slight amount of calcite was formed during the

136
preparation of the samples. The portlandite content of the blended cement pastes is
remarkably lower than the portlandite content of PC6 because they contain less OPC that can
hydrate to form portlandite. Moreover, the reduced amount of portlandite formed is consumed
by the pozzolanic reaction of fly ash, slag, and metakaolin.
PC6 FA6 SL6 LS6 SL35 MK45
BC C BC C BC C BC C BC C BC C
Calcite% <2 9.2 <2 10.8 2.3 30 39.8 66.6 5.2 13.4 3.5 8.3
Portlandite% 18.0
7.8 4.8 5.4
8.5
4.0
6.0
Ettringite% <2
<2
<2
<2
<2
<2
Vaterite% 77 57.3 57.8 13.7 56.7 78.1
Aragonite% 7.7 9 6.4 22.5 6.7
Table 32: Estimation of the content of some crystal minerals before (BC) and after carbonation (C) based on the raw data from XRD analysis
Results from Table 32 show that for all HCPs the CaCO3 polymorph predominantly formed
after carbonation is the metastable vaterite (vaterite is the second most metastable CaCO3
polymorph after amorphous calcium carbonate [27]). Calcite and aragonite formation also took
place but to a much lesser extent. Only the samples with limestone powder showed an
exception, containing mainly calcite after carbonation. The presence of limestone seems to
favor the further precipitation of calcite. According to [30], calcite precipitates preferentially on
limestone particles as the latter acts as a nucleation surface for calcite.
2.4.2 Degree of carbonation
The amount of bound-CO2 during the preparation and the conditioning of the six HCPs (B-
CO2ini), and the bound CO2 after the carbonation test (B-CO2
f) are investigated using TGA
analysis (cf Table 5). These values are used to calculate the carbonation degree, expressed
as the bound CO2 per maximum bound CO2 (MBC). Note that the amount of limestone
introduced initially during the preparation of the LS6 is deducted in the calculation of the initial
and final degrees of carbonation in table 5 and not deduced in the results of table 3.
Table 33 shows results of the amount of CO2 that disappeared due to the carbonation of
portlandite in the HCPs. This value (𝐶𝑂2𝐶𝐻) is calculated according to Equation 48.

137
CO2CH = (
Δ%CH
MH2OMCO2) ∗
1
B−CO2f
Equation 48
Δ%CH (results taken from Table 31) corresponds to the variation of the amount of water in
portlandite per unit mass of anhydrous cement before and after carbonation. 𝐵−𝐶𝑂2𝑓
is the total
amount of bound-CO2 after carbonation of the HCPs (results shown in Table 31) MCO2 and
MH2O are the molar masses of carbon dioxide and water respectively. Note that the small
amount of CO2 present in the raw materials (<2%) is taken into consideration in these
calculations.
The highest degree of carbonation is observed for PC6, even though the amount of bound
CO2 by portlandite is the lowest comparing to other systems, which highlights the important
carbonation of other phases (C-S-H, ettringite… c.f Table 31). Meanwhile the lowest degree of
carbonation is observed for SL35 (Table 33). This could be explained by the low diffusivity of
the SL35 (due to the low water-binder-ratio 0.35) and their high C-S-H content. Previous works
in the literature show that the carbonation of C-S-H leads to the formation of calcium-enriched
silica gel. Part of the calcium would remain trapped in this gel and would not participate in the
formation of CaCO3 [203].
Although the phenolphthalein solution was colorless for all the six HCP after the accelerated
carbonation period, the degree of carbonation of these materials varies between 34.1% and
68.4%. This result highlights the questionable reliability of the pH-indicator method to study the
carbonation performance of cementitious materials. In agreement with this results, Omikrine-
Metalssi et al. [204] show that the carbonation continues even 1cm beyond the carbonation
depth indicated by the phenolphthalein indicator. Andrade [205] also states that the DoC in the
carbonated zone is not a direct function of the carbonation depth.

138
MBC
B-CO2ini DOCini B-CO2
f DOCf
CO2 fixed by
portlandite /
Total CO2
Carbonatable
compounds
gCO2/100g
anhydrous
gCO2/100g
anhydrous %
gCO2/100g
anhydrous % %
mol/m3
PC6 51.2 3.1 6.1 35.3 68.4 10.7 8686.1
FA6 37.6 2 5.3 24.3 64.7 36.6 4017.4
SL6 43.1 2 4.5 21.5 49.9 27.2 2087.4
LS6 30.5 0.4 1.3 17.1 56.1 22.9 2432.1
SL35 43.4 2.4 5.5 14.8 34.1 38.8 2465.4
MK45 41.5 3.2 7.6 20.8 50.2 41.2 4773.6
Table 33: Bound CO2 values before (B-CO2in) and after carbonation (B-CO2f); carbonation degrees of the tested material before (DoCini) and after carbonation (DoCf); maximum CO2–binding capacity (MBC), and the amount of carbonatable compounds of the six HCPs
Note that the amount of carbonatable compounds is deduced from the final bound-CO2 by
multiplying this value with the cement dosage and dividing by the molar mass of carbon
dioxide. This property is a direct input parameter required by service life prediction models
(Equation 49).
2.4.3 Porosity changes upon carbonation
Figure 46 gives the porosities of the six HCPs before and after full carbonation. The total water
porosity of the carbonated cement pastes is 6 to 12% smaller than the total porosity of HCPs
before carbonation. The carbonation of the hydrates phases in cement is known to cause an
increase in the solid phase volume.
Figure 46 : Influence of carbonation on the water porosity of the six HCPs. BC: before carbonation C: carbonated
0
10
20
30
40
50
60
Tota
l poro
sity
(%)

139
Although FA6, SL6, and MK45 contain a large amount of C-S-H, their total porosity decrease
was lower than PC6. This could be due to the smaller molar volume (change due to
carbonation) of low Ca/Si C-S-H in HCPs with pozzolanic additions, which generally causes a
slight decrease in the porosity [206]. The effect of carbonation on the six HCPs’ pore size
distribution (PSD) is investigated by means of MIP (Figure 47). It is noted that for PC6
carbonation resulted in a reduction of the amount of small pores (d<8 nm) and a formation of a
large amount of pores with a bigger diameter than 20 nm. The carbonation of the paste FA6
even induced the disappearance of pores with a small diameter < 10 nm and the formation of
pores with a diameter of 200 nm. Note that this paste pore size distribution goes from a
bimodal distribution to a trimodal distribution upon carbonation. This result is also observed for
the pastes’ SL6; the pore size distribution goes from a monomodal distribution centered on
pores with a diameter of 10 nm to a bimodal distribution of higher pore diameter: 60 and 30
nm. A coarsening in the pore size distribution of LS6 is observed: carbonated LS6 contains a
lower number of small pores and a shift of the main mode to a bigger pore diameter is
observed. As for SL35, carbonation caused the formation of small pores with a diameter of
around 3 nm, the clogging of pores with a diameter of around 7 nm, and an increase in the
pores entry diameter. This result is also observed on MK45, where carbonation caused a
clogging of pores with a diameter of 20 nm and an appearance of a small amount of pores with
a bigger diameter of 40 nm after carbonation.

140
Figure 47 : MIP results on the PSD of the six HCPs before carbonation (BC) and after carbonation (C)
0
0,05
0,1
0,15
0,2
0,25
0,3
0,35
0,001 0,01 0,1 1 10
Merc
ury
in
cre
menta
l volu
me (
mL/(
g.µ
m))
Mean diameter(µm)
PC_BC
PC6_C
0
0,1
0,2
0,3
0,4
0,5
0,6
0,7
0,001 0,01 0,1 1 10
Merc
ury
in
cre
menta
l volu
me (
mL/(
g.µ
m))
Mean diameter(µm)
FA6_BC
FA6_C
0
0,05
0,1
0,15
0,2
0,25
0,3
0,35
0,4
0,45
0,5
0,001 0,01 0,1 1 10
Merc
ury
in
cre
menta
l volu
me (
mL/(
g.µ
m))
Mean diameter(µm)
SL6_BCSL6_C
0
0,05
0,1
0,15
0,2
0,25
0,3
0,35
0,001 0,01 0,1 1 10
Merc
ury
in
cre
menta
l volu
me (
mL/(
g.µ
m))
Mean diameter(µm)
LS6_BCLS6_C
0
0,02
0,04
0,06
0,08
0,1
0,12
0,001 0,01 0,1 1
Merc
ury
in
cre
menta
l volu
me (
mL/(
g.µ
m))
Mean diameter(µm)
SL35_BC
SL35_C
0
0,02
0,04
0,06
0,08
0,1
0,12
0,14
0,16
0,18
0,001 0,01 0,1 1
Merc
ury
in
cre
menta
l volu
me (
mL/(
g.µ
m))
Mean diameter(µm)
MK45_BCMK45_C
PC6_BC

141
2.4.4 Effect of carbonation on the water retention capacity
0%
10%
20%
30%
40%
50%
60%
70%
80%
90%
100%
0% 20% 40% 60% 80% 100%
Degre
e o
f w
ate
r satu
ratio
n (
vol%
)
Relative humidity
PC6_BC
PC6_C
0%
10%
20%
30%
40%
50%
60%
70%
80%
90%
100%
0% 20% 40% 60% 80% 100%
Degre
e o
f w
ate
r satu
ratio
n (
vol%
)Relative humidity
FA6_BC
FA6_C
0%
10%
20%
30%
40%
50%
60%
70%
80%
90%
100%
0% 20% 40% 60% 80% 100%
Degre
e o
f w
ate
r satu
ratio
n (
vol%
)
Relative humidity
SL6_BC
SL6_C
0%
10%
20%
30%
40%
50%
60%
70%
80%
90%
100%
0% 20% 40% 60% 80% 100%
Degre
e o
f w
ate
r satu
ratio
n (
vol%
)
Relative humidity
LS6_BC
LS6_C

142
Figure 48: The degree of water saturation (vol%) of the tested HCPs before carbonation (BC) and after carbonation (C) at three relative humidity levels
Results shown in Figure 48 indicate that carbonation exerts a different effect on the water
retention capacity of the hardened cement pastes. For pastes PC6, FA6, LS6 and SL35, the
degree of water saturation at 33%RH only slightly changed; however, at 55% RH, carbonated
samples are 3% to 17% less water saturated and at 93% RH, carbonated samples are 11% to
41% less water saturated. As for SL6, carbonated samples are 20% less water saturated at
almost all relative humidity levels; however, carbonated MK45s are 6% to 9% more water
saturated than the non-carbonated samples at 33% and 55% RH, and only 3% less water
saturated at 93% relative humidity. Note that the decrease in the water retention capacity upon
carbonation is investigated in the first desorption isotherm (from water saturated condition) and
is more significant for blended cement pastes and appears to be all the more significant as the
amount of additions and the water-per-binder ratio are high (SL6).
2.4.5 Effect of carbonation on oxygen-effective diffusion coefficient
0%
10%
20%
30%
40%
50%
60%
70%
80%
90%
100%
0% 20% 40% 60% 80% 100%
Degre
e o
f w
ate
r satu
ratio
n (
vol%
)
Relative humidity
SL35_BC
SL35_C
0%
10%
20%
30%
40%
50%
60%
70%
80%
90%
100%
0% 20% 40% 60% 80% 100%
Degre
e o
f w
ate
r satu
ratio
n (
vol%
)
Relative humidity
MK45_BC
MK45_C

143
Figure 49: Oxygen-effective diffusion coefficient of the tested HCPs before and after carbonation at three degrees of water saturation
1E-11
1E-10
1E-09
1E-08
1E-07
1E-06
0 20 40 60 80 100
Oxygen d
iffu
sio
n c
oeff
icie
nt (m
²/s)
Degree of water saturation (%)
PC6_BC
PC6_C
1E-11
1E-10
1E-09
1E-08
1E-07
1E-06
0 20 40 60 80 100
Oxygen d
iffu
sio
n c
oeff
icie
nt (m
²/s)
Degree of water saturation (%)
FA6_BC
FA6_C
1E-11
1E-10
1E-09
1E-08
1E-07
1E-06
0 20 40 60 80 100
Oxygen d
iffu
sio
n c
oeff
icie
nt (m
²/s)
Degree of water saturation (%)
SL6_BC
SL6_C
1E-11
1E-10
1E-09
1E-08
1E-07
1E-06
0 20 40 60 80O
xygen d
iffu
sio
n c
oeff
icie
nt (m
²/s)
Degree of water saturation (%)
LS6_BC
LS6_C
1E-11
1E-10
1E-09
1E-08
1E-07
1E-06
0 20 40 60 80 100
Oxygen d
iffu
sio
n c
oeff
icie
nt (m
²/s)
Degree of water saturation (%)
SL35_BC
SL35_C1E-11
1E-10
1E-09
1E-08
1E-07
1E-06
0 20 40 60 80 100
Oxygen d
iffu
sio
n c
oeff
icie
nt (m
²/s)
Degree of water saturation (%)
MK45_BC
MK45_C
144
The oxygen-effective diffusion coefficient depends both on the degrees of water saturation
corresponding to the relative humidity of preconditioning and on the state of carbonation
(Figure 49). PC6 pastes exhibit a decrease in the oxygen-effective diffusion coefficient by a
factor of 3 at low and intermediate relative humidity upon carbonation, whereas an increase in
De,O2 by a factor of 21 at 93% RH is observed upon carbonation. The same is observed for
SL35; De,O2 decreased by a factor of 5 and 3 at 33% and 55% RH, respectively, and increased
by a factor of 2.5 at 93% RH.
As for FA6 pastes, carbonation caused an increase in the De,O2 at all relative humidity levels
by a factor of 1.5, 2.3 and 1000 at 33%, 55% and 93% RH, respectively. De,O2 also increased
for SL6 by a factor of 4, 9 and 93 at 33%, 55% and 93% RH, respectively, while for LS6, De,O2
is hardly influenced by carbonation at 33% and 55% RH while it increased by a factor of 7 at a
high RH of 93%. Note that LS6 diffusivity before carbonation is the highest. Carbonated MK45
exhibits higher oxygen diffusivity at all RHs. De,O2 increases by a factor of 1.5, 2.3 and 60 at
33%, 55% and 93% RH, respectively. Note that the oxygen-effective diffusion coefficient is
highly dependent on the relative humidity of preconditioning for non-carbonated HCPs and
only slightly dependent on the RH of carbonated HCPs.
2.5 Discussion
2.5.1 Microstructural changes upon carbonation
The decrease in the total porosity given in the results (Figure 46) is also noticed by several
authors in the literature [36][20], either on-site [207][208] or under accelerated exposure
conditions [18][43]. Pihlajavaara et al. [143] and Tri et al. [43] measured a decrease in the total
porosity (clogging) ranging from 10% to 15% on CEMI-based carbonate cement pastes (0.3
<W/C <0.8). Figure 46 shows that the nature of the binder is involved in the variation of
porosity; the highest porosity change is found for PC6 (12%). In agreement with our findings,
Hyvert [53] also found that the total porosity variation is more important for CEMI (9.4%)
materials than CEMIII (6%) materials. This result could be directly linked to the nature and
relative amount of the hydrates formed by pozzolanic reactions that lower the amount of
portlandite and that lower the Ca to Si ratio in C-S-H phases, as the high content of C-S-H
tends to maximize this drop in porosity [20]. Note that FA6 total porosity is 5 to 7% higher than
the total porosity of PC6. This result was also obtained by Papadakis el al [172] when testing
mortar samples prepared with 30% fly ash, an increase in porosity of 13% is found.
The pore size distribution is also strongly impacted by carbonation (cf. Figure 47). When the
W/B is high, which is the case of the HCPs PC6, SL6, and LS6, the carbonation caused a
coarsening of the PSD. However, for SL35 and MK45, carbonation resulted in the formation of

145
both finer and coarser pores. Johannesson and Utgenannt [209] also reported a redistribution
of pore sizes upon carbonation in Portland cement mortar samples. The authors predicted that
well-carbonated mortar has a significantly higher volume of pores in the pore size range of 2 to
7 nm. Those MIP results are also consistent with the observations of Shah et al. [35].
As a consequence of the variation in the pore size distribution and porosity of the HCPs upon
carbonation, the water retention capacity decreased notably (Figure 48). These results are
explained, together with the overall evolution of pore size distribution, by the consumption of
the C-S-H phase after carbonation and the increase of pore entry diameter. In agreement with
our results, it has been reported by Johannesson and Utgenannt [209] that the degree of water
saturation (obtained by desorption) for the non-carbonated mortars is higher (by 15%) when
compared with a well-carbonated sample, especially at 95% relative humidity. The reduction of
liquid saturation (Sl) is observed in spite of the reduction of total porosity (), which means that
the average volume content of water per unit volume of paste decreases but the pore entry
diameter tends to increase upon carbonation.
2.5.2 Mineralogical changes
Table 31, 32, and 33 results show that after carbonation, portlandite is still present in
carbonated PC6 (only 10% of bound-CO2 was due to carbonation of portlandite) while it is
highly consumed for blended cement pastes. In agreement with our findings, Soja et al. [36]
determined a higher portlandite consumption for blended cements with limestone with regards
to OPC pastes after exposure to natural carbonation, which is a rather encouraging result for
predicting the natural carbonation mechanisms from accelerated carbonation tests at 1% CO2.
MK45, which contains 20% metakaolin, also showed an almost complete depletion of
portlandite (41% of the total bound-CO2 is due to portlandite carbonation Table 33) and a high
consumption of C-S-H after carbonation at 1% CO2 (cf Table 31: TGA results). The same
conclusion is drawn by Machner et al. [210], who noted that carbonation caused an almost
complete decomposition of the C-S-H phase and the consumption of the portlandite after
carbonation at 1% CO2 of HCPs with 20% metakaolin. XRD results (Table 32) show the
formation of the three CaCO3 polymorphs for all HCPs with a high amount of calcite for LS6
and a predominant formation of vaterite for other HCP. The high formation of vaterite could be
explained by the carbonation of CSH phases. Indeed, Black et al. [211][212] studied the
carbonation of synthetic C-S-H in which the initial Ca/Si ratio appeared to influence the
crystalline carbonate species formed. For Ca/Si ratios greater than 0.67, principally calcite and
vaterite were observed and for ratios below 0.50, aragonite was most prevalent. Thiéry et al.
[39] attributed the more poorly crystallized and the more thermodynamically unstable forms of
CaCO3 to the carbonation of the CSH phases.

146
2.5.3 Oxygen-effective diffusion coefficient
The pronounced reduction in the total porosity as a result of carbonation (precipitation of
calcium carbonates causes clogging of total porosity) of the six HCPs is expected to positively
affect the durability performance of the materials, thus reducing the oxygen-effective diffusion
coefficient. This is indeed observed for PC6, LS6 and SL35 at 33%, at 55% RH. This reduction
could be explained by the fact that carbonation only slightly varied the degree of water
saturation at these two RH levels (3 to 8%). However, at a high relative humidity of 93%, the
O2-effective diffusion coefficient for carbonated samples decreased notably by a factor that
varies from 2.4 (SL35) to 10 (LS6). This result is a consequence of the decrease of the water
retention capacity of these HCPs after carbonation (cf. Figure 48). An increase in the diffusion
coefficient is obtained after the carbonation of FA6 and SL6 because of the low degree of
water saturation of these samples upon carbonation (cf. Figure 48). In agreement with our
results, Dutzer et al. [52] show an increase in the gaseous helium diffusivity upon accelerated
carbonation (3% CO2 vol.) for blended cement pastes, a result they attributed to the cracking
induced carbonation.
However, De,O2 results of MK45 are inconsistent: Although the degree of water saturation
slightly increased upon carbonation (Figure 48) and MIP results showed the formation of
small porosity for carbonated samples (Figure 47), the oxygen-effective diffusion coefficient
increased at all RH levels (factor up to 60 at 93% RH). This result could be explained by the
slight increase of the largest pore diameter, even if its volume fraction is lowered (Figure 47).
Note that the oxygen-effective diffusion coefficient of the six HCPs after carbonation is less
dependent on the RH of preconditioning compared to the non-carbonated state diffusivity. Soja
et al. [36] investigated the influence of natural carbonation on the oxygen-effective diffusion
coefficient on CEMI and limestone blended cement pastes. Results show a lower oxygen-
effective diffusion coefficient even for limestone blended samples equilibrated at 70% RH.
Houst et al. [143] noted that the carbonation of Portland cement paste samples caused a
decrease in the diffusivity of CO2 and O2 at intermediate RH. These microstructural
modifications strongly modify the transfer properties in cementitious materials, especially in
terms of diffusion and permeability. However, we noticed that this conclusion is only valid for
PC6, LS6 and SL35 at low and intermediate relative humidity levels. Our results on the
variation of De,O2 upon carbonation for the six HCPs can be summarized as follows: (i) for
blended cement pastes with a W/B 0.45 and 0.6, an increase of the gas diffusivity is observed
at all RH levels, (ii) PC6 and SL35 show a decrease in the diffusion coefficient at 33% and
55% RH and an increase in the De,O2 at 93% RH, (iii) for all HCP (but LS6), De,O2 is less
dependent on the RH in the carbonated state.

147
2.5.4 Gas-diffusivity vs mean pore diameter
Using an automatic tool that allows for the fitting of the data from the MIP analysis (Figure 47),
the mean pore diameter and its corresponding volumetric fraction is computed assuming that
each mode is of a normal distribution (Figure 50). This analysis is carried out for all HCPs
before and after carbonation. The number of modes of each MIP result is chosen in order to
optimize the fit.
Log(mean diameter) (m)
Figure 50: An example of MIP data automatically fitted
Using these results, a weighted arithmetic mean (the weight in the volumetric fraction of each
mode) diameter of each paste’s MIP data (Figure 47) is calculated and compared with the
effective-diffusion coefficients determined experimentally on samples with a saturation degree
lower than 50%. The oxygen-effective diffusion coefficient is corrected by the total porosity (𝜙)
and the degree of water saturation (Sl) of the tested samples. This correction is made in order
to consider that the transport process is made only through the gas filled pores.
Vo
lum
ic f
ract
ion
of
Hg
intr
usi
on
[-]

148
Figure 51: Oxygen-effective diffusion coefficient versus weighted mean pore diameter at different of saturation degrees
Under the Knudsen diffusion assumption, the effective diffusion coefficient is directly
proportional to the mean pore diameter of the cementitious material when the mean pore
diameter is lower than the mean free path of oxygen molecules at atmospheric pressure and
200C ( i.e. –log(dm)>7) [19][10]. Indeed, Figure 51 shows that the oxygen-effective diffusion
coefficient displays a somewhat linear trend (in log-scale) with respect to the weighted mean
pore diameter (-Log (dm) > 7). For carbonated and non-carbonated samples, the slope equals
0.9±0.05 (R2 = 0.92) and 1.6±0.2 (R2 = 0.84), respectively. These results show that the pore
size distribution and the degree of water saturation are appropriate material properties to
consider in the modeling of the gas-diffusivity of cementitious materials. Note that this result is
consistent with previous findings in the literature [192] carried out on HCPs hydrated at
different durations.
2.5.5 Carbonation performance of different HCPs
The carbonation rate (mm/year0.5) of the tested HCPs is calculated at 55% RH from the results
of oxygen gas diffusivity at the carbonated state and TGA results of the amount of
carbonatable compounds (Table 33). Note that the carbonatable compounds are the product
of the cement dosage in the paste by the CO2-binding capacity. This 55% relative humidity is
chosen since it is suggested that the most rapid carbonation of concrete occurs at a relative
humidity near 50% to 65%, which is also the recommended RH for natural carbonation tests
by the EN 12390-10 standard [197]. The carbonation depth (Xc) of these HCPs are calculated
based on the Papadakis deterministic model [6] (Equation 49), where [CO2]0 is the ambient
CO2 concentration (400±25ppm) converted to mol.m-3, t is the carbonation exposure duration
6
6,2
6,4
6,6
6,8
7
7,2
7,4
7,6
7,8
6,6 6,8 7 7,2 7,4 7,6 7,8 8
-Lo
g(D
e,O
2/𝜙
*(1
-Sl)
)
-Log(dm)
Before carbonation
Carbonated samples

149
(s), De,CO2 the CO2-effective diffusion coefficient in the carbonated layer, and CM [mol.m-3] is
the carbonatable compoudns of the paste. Note that De,CO2 is calculated using Graham’s law,
which allows it to be deduced from the O2-effective diffusion coefficient.
𝑥𝑐 = √2 𝐷𝑒,𝐶𝑂2 [𝐶𝑂2]0
𝑐𝑎𝑟𝑏𝑜𝑛𝑎𝑡𝑎𝑏𝑎𝑙𝑒 𝑐𝑜𝑚𝑝𝑜𝑢𝑛𝑑𝑠𝑡 Equation 49
SL35 results are not shown on Figure 52 because no sharp carbonation depth could be seen
on these samples even after 4 months of exposure.
HCP Carbonation kinetics (mm/year0.5)
PC6 1.7
FA6 4.6
SL6 4.7
LS6 9.6
SL35 1
MK45 1.6
Table 34 : Carbonation kinetics calculated under natural carbonation (400 ppm) carbonation at 55% RH
Figure 52: HCPs’ Xc determined with pH-indicator vs Xc predicted using Papadakis’ model
Figure 52 shows that the carbonation depths obtained from Papadakis’ model are correlated to
the carbonation depths measured experimentally using phenolphthalein solution. The
horizontal error bars are due to oxygen-effective diffusion coefficient variation within replicates,
and the vertical errors bars are a result of averaging 5 carbonation depth readings. The pH-
indicator results are slightly higher than Papadakis’ model; this overestimation could be due to
errors of averaging or microcracks within the samples (that the model does not take into
consideration).
As expected, PC6 and blended HCPs with low W/B ratios (SL35 and MK45 c.f Table 34 )
present the highest carbonation resistance. These results are explained by the very low gas
diffusion coefficient of the SL35 and MK45 and PC6’s high amount of carbonatable products.
Although PC6 contains the highest carbonatable products, SL35 and MK45 have a higher
y = 1,2x + 0,0R² = 0,8
0E+0
2E-3
4E-3
6E-3
8E-3
1E-2
0E+00 2E-03 4E-03 6E-03 8E-03 1E-02 1E-02
Xc
fro
m p
H-i
nd
icat
or
(m)
Xc from Papadakis model (m)
PC6FA6LS6SL6MK45

150
carbonation resistance (i.e lower carbonation kinetics). These results show that the
carbonation depth progression is mainly driven by the CO2-effective diffusion coefficient of
these pastes: the gas-diffusivity of SL35 and MK45 is 10 and 2 times lower than for PC6,
respectively. Therefore, the low value of gas diffusivity can compensate for the low
carbonatable compounds content. FA6, containing 30% fly ash, showed low carbonation
resistance high carbonation kinetics of 4.6 mm/year0.5). Fly ash is known to react with the
calcium hydroxide CH formed during the hydration of the cement to form calcium silicate
hydrate C-S-H with a lower C/S ratio [206] than the C-S-H phase in pure Portland cement.
Indeed, various studies in the literature found increased carbonation depths of concrete when
adding fly ash. Morandeau et al. [213] reported that with increasing clinker by fly ash (0%,
30%), the carbonation depth under accelerated carbonation (10% CO2, 63% RH) increases by
a factor of 2. SL6 and SL35 with 60% and 50% slag replacement by mass, respectively,
contain a comparable amount of carbonatable compounds because of the similar cement
composition. In spite of that, SL6 carbonation resistance is almost 5 times higher than SL35
(cf. Table 34). This is due to the low W/B ratio of SL35, which caused the oxygen-effective
diffusion coefficient of SL35 to be 26 times lower than SL6. In comparison to PC6, SL6, which
is cast at the same W/B (0.6), has a carbonation kinetic that is 2.8 times higher. This is
explained by the low carbonatable compound of SL6 compared to PC6 (cf. Table 32).
Furthermore, HCPs containing slag have a C-S-H phase with a C/S ratio around 1.5 and
below [214]. LS6 performed the worst concerning carbonation resistance. This is due to the
high limestone substitution level (40%), low carbonatable products, and high oxygen-effective
diffusion coefficient in both carbonated and non-carbonated states. The latter is due to the
coarser pore structure compared to pure Portland cement (PC6) (cf. Figure 47), which is
characterized by larger, interconnected pores. Such a pore structure promotes gaseous CO2
transport. The high carbonation kinetics of limestone cement pastes is also justified with the
fact that calcite forms preferentially on limestone particles, and less on portlandite and the C-
S-H phases [30][215]. The latter would prevent their further carbonation or slow it down
considerably. Lollini et al. [216] reported that with a limestone content of 15%, no influence on
the carbonation behavior was observed, but at 30%, a remarkable worsening of the
carbonation resistance is observed (by 60% to 80%). The MK45 carbonation rate is found to
be comparable to that of PC6, although the latter is cast at a W/B ratio of 0.6 and the MK45
W/B ratio is 0.45, and MK45 carbonatable compounds is twice lower than PC6. Note that
MK45 gas diffusivity is two times lower than PC6, which compensates for the lower amount of
carbonatable compounds in MK45 pastes. Bucher et al. [217] investigated the natural and
accelerated carbonation (4% CO2) of concrete specimen with a cement replacement of 15 to
25% metakaolin cast at a water per binder ratio of 0.6. In this case, the carbonation depth of
concrete with metakaolin is found to be 2 to 4 times higher than the carbonation depth of

151
concrete specimen with CEMI: the higher the metakaolin content, the greater the carbonation
depth.
2.6 Conclusions
The results of this work allow drawing the following conclusions:
• Despite a porosity clogging, carbonation induces an increase in the oxygen-effective
diffusion coefficient for most of the tested HCPs at all relative humidity levels. Only the
Portland cement paste with W/B=0.6 and the slag paste with W/B=0.35 have a
decreased gas diffusivity at 33% and 55% RH after carbonation.
• The oxygen-effective diffusion coefficient variation upon carbonation at a given RH is
explained by changes in both the water retention capacity and the pore size
distribution.
• For all HCPs, the oxygen-effective diffusion coefficient is less dependent on the relative
humidity of preconditioning after carbonation than before.
• The gas diffusion coefficient shows a good correlation with the mean pore diameter of the
tested HCPs (in log scale) when the degree of water saturation is lower than 50%. This
result is established for both carbonated and non-carbonated HCPs, which proves the
direct dependence of the gas diffusivity on the pore size distribution and degree of
water saturation of cementitious materials.
• Regarding the durability performance, the theoretical carbonation rate should be
dominated by the gas diffusivity, since, for the tested HCPs, the latter varies over two
orders of magnitude, while the amount of carbonatable compounds varies only by a
factor of 4.
• Materials made with a combination of OPC, slag or metakaolin could behave as well as
material containing only OPC with respect to carbonation, providing a low gas diffusivity
which can be obtained by a W/B ratio carefully optimized. This could provide a real
opportunity to decrease the clinker content in concretes without impacting negatively
the durability performance related to carbonation. Further studies on the reinforcement
corrosion rate using this kind of mixtures must be carried out before definite conclusion
can be made.

152
3 Paper III: The CO2-binding capacity of synthetic
anhydrous and hydrates: validation of a test
method based on the instantaneous reaction
rate
3.1 ABSTRACT
In the present work, a new experimental setup is designed and validated to characterize the
CO2-binding capacity of cementitious materials based on their instantaneous rate of CO2
uptake. An experimental investigation is carried out on synthetized anhydrous (C3S, C2S, C3A)
and hydrates (CH, C-S-H, AFt) exposed to ambient CO2 concentration at three different
relative humidity (RH) levels. The BET surface area and the density are determined before
and after exposure to natural carbonation. Results show that the CO2- binding capacity and
rate increases highly with the RH. The instantaneous binding rate of the materials ranges from
10-6 to 5.10-10 gco2.gpowder-1.s-1. The highest degree of carbonation is found for ettringite powder
(DoC=45%). C2S and C3A are only slightly carbonated (DoC=3%), while significant
carbonation of C3S is observed only at 93% RH (DoC=14%). A good (R2=0.94) agreement
between the results determined using the new test method and thermogravimetric analysis
(TGA) is noticed.
Key words: CO2-binding capacity; instantaneous binding rate; test method; hydrates;
anhydrous
3.2 INTRODUCTION
Steel bars in reinforced concrete are protected from corrosion by means of a passivation layer,
which forms at high pH values (>12). This high pH environment is obtained from the
surrounding hydrated cement paste. However, once the atmospheric CO2 manages to move
through the concrete porous network [192], it dissolves in the pores’ water, forming carbonate
ions (CO32-) [218] that reacts with the reactive calcium content from the calcium-bearing
phases in the cement. This reaction converts Ca2+ ions into calcium carbonate (CaCO3).
Carbonation is the term used to describe this physicochemical process.
The carbonation front is usually determined using a colorimetric method based on a pH
indicator solution, such as phenolphthalein [204]. This method provides only an approximate
measurement of the real carbonation depth in terms of pH values and does not give an

153
estimation of the carbonation extent at any depth [190].
The carbonation depth and rate are controlled by the diffusion process of gaseous CO2 and
the CO2-binding capacity [6], which is the quantity of CO2 bound per mass of binder. Test
methods that determine the gas diffusivity of cementitious materials can be found in the
literature, e.g. [192][141][8][94]. Although gas diffusion is in many situations the slowest
mechanism of the overall process [22], an accurate quantification of the CO2-binding capacity
is of critical importance for understanding and modeling the carbonation behavior of
cementitious materials. So far, to the authors’ knowledge, there is no standardized test method
that allows determining these two properties. To address this issue, it is very important to
develop reliable, accurate, cost-effective and time-saving test methods to determine the gas
transport property of cementitious materials and their CO2-binding capacity and rate
separately.
One way to evaluate the CO2-binding capacity is applying the thermogravimetric analysis
technique (TGA) to measure the weight loss resulting from the thermal decomposition of
different phases in the cementitious materials. The temperature of decarbonation is defined
separately for each mineral. Usually, the weight loss peak between 530°C to 950ºC is caused
by the decomposition of CaCO3 and the consequent release of CO2 [108]. This technique in
destructive, allows a rough quantification of the CO2-binding capacity in an uncontinous way
and gives an average value of its cumulative rate. TGA is sometimes coupled with XRD-
Rietveld that helps quantifying the amounts of CO2 bound in the crystalline phases only. Major
limitations of these techniques are that the CO2 contained in the amorphous carbonated
pastes is not considered by XRD and the CO2 mass loss due to some carbonates (e.g.
MgCO3) has a temperature range that may overlap the portlandite’s and the bound water in
the C-S-H gel pores in TGA results [107].
Other techniques in the literature have been developed to examine the CO2-binding capacity
and rate. Van Balen et al. [113] developed an experimental setup to continuously measure the
carbon dioxide uptake of lime samples. It consists of a closed loop in which a mixture of air
and carbon dioxide (15-50% CO2 concentration) is introduced at a certain RH (at 20°C). From
the analysis of the CO2 concentration vs. time, the uptake rate (derivative), maximum and
average speed of carbon dioxide uptake is calculated. These authors found that the
carbonation reaction is zeroth order within the CO2 concentration range of their study (as also
reported by Shih-Min Shih et al. [219] ). A good reliability of the test method (10-20%) is
reported, but the test method results do not agree with the TGA results.
El-Turki el al [157] developed a micro-balance technique to measure the mass variation of

154
samples of mortars, cement and lime pastes during carbonation at 100% CO2 concentration
by volume and a RH between 65% and 97%. Analysis of the mass-variation data provides
direct determination of the carbonation rates. However, using this method, it is challenging to
distinguish between the mass change due to water vapor absorption and the mass gain due to
carbonation. The weight gain technique induces a lot of errors for evaluating the carbonation
extent [156].
Little information on the carbonation kinetics and mechanisms of the anhydrous and hydrates
can be found in the research involving carbonation of cementitious materials. The present
work seeks to address this gap through an investigation of the carbonation kinetics and
mechanisms of the main hydrates (CH, AFt, and C-S-H) and anhydrous phases (C3S, C2S,
and C3A) present in concrete. First, a simple and affordable test method is developed and
validated. This method allows determining the CO2-binding capacity and rate of cementitious
materials by monitoring their CO2 uptake during the exposure to ambient CO2 concentration in
a RH and temperature-controlled environment. Direct measurements of carbon dioxide uptake
should avoid possible errors using weight gain as a measure for the carbonation process, as
has been shown by Aono [220]. A range of complementary analytical techniques, including
thermogravimetric analysis (TGA), Brunauer-Emmett-Teller (BET), density, and scanning
electron microscopy (SEM) are used to help the further understanding of the carbonation
behavior of the tested materials.
3.3 MATERIALS
3.3.1 Synthetic minerals preparation
In order to enhance the understanding of the carbonation kinetics of the anhydrous phases of
cement paste, triclinic tricalcium silicate (C3S), dicalcium silicate (β-C2S) and cubic tricalcium
aluminate (C3A), which are the three main anhydrous phases present in the clinker, are
prepared. The synthesis of these pure materials was carried out following a modified Pechini
process, as described in [136]. The advantage of this method is that pure β-C2S can be
formed with no stabilizing impurities. Phases are produced, respecting the stoichiometric
amounts of the oxide components of the anhydrous phases. The heating temperature for C3S,
C2S and C3A are: 1600°C, 1550°C, and 1350°C, respectively. These materials are grinded
and sieved to 63 µm.
The main hydrated phases present in Portland cement were also prepared: portlandite (CH),
calcium silica hydrates (C-S-H), and ettringite (AFt). The synthesis of ettringite is achieved by
mixing tricalcium aluminate and gypsum using a wet process and then dried at 50°C. Pure
portlandite was prepared by calcite decarbonation at 1000°C, cooling it down to ambient

155
temperature and adding water. Calcium silicate hydrate with a Ca/Si = 0.9 was synthesized
using CaO obtained from the calcination of Ca(OH)2 for 4h at 1100°C, SiO2 comes from
hydrophilic silica fume Aerosil 90®. The water-per-solid ratio was 49. The mix was agitated for
a month and then the solid phases were separated from the solution by centrifugation for 2
min at 12000 rpm, to be finally oven dried at 45°C under vacuum. The quality of the synthesis
was controlled by means of a qualitative XRD test. Even though the preparation of the
materials was done in a CO2-free environment using boiled water cooled down to ambient
temperature, and all the synthesized minerals were stored in closed bottles inside a chamber
under vacuum with soda lime, traces of calcite were present in the XRD results and were
quantified using the thermogravimetric analysis (TGA) technique. After preparation of the
samples, their density was measured using the helium pycnometer technique. The initial
densities were found to agree with the results found by Balonis et al. [152].
3.3.2 Solid analysis
A Brunauer–Emmett–Teller (BET) measurement was conducted on all the tested samples
before and after the CO2-binding capacity test. This technique uses an inert gas that does not
react with the materials surfaces as an adsorbate to quantify the specific surface area [49]. In
our case, the sample was first outgassed in a vacuum oven at 0.04 atm and 45°C.
The density of the tested samples is measured applying the helium pycnometer method [130]
using the ACCUPYC 2 1340 MICROMERITICS pycnometer. A powdered specimen of about
5 g was compacted and placed inside a cell of a known volume pressurized with helium.
TGA tests were conducted in order to determine the bound CO2 caused by the preparation of
the samples before we began our tests, and the overall CO2 binding capacity of the material
afterwards [106]. The TGA measurements were made under nitrogen flow at a heating rate of
10°C/min until 1000°C using a powdered sample of around 30 mg sieved at 63 μm.
The amount of bound CO2 is calculated based on Equation 50, where mCO2 is the mass of CO2
present in the sample and given by the TGA results, m0 corresponds to the mass of the
sample at 1000˚C, mH2O0 is the mass of water initially present in the raw materials.
CBC = mCO2
m0 + mH2O0 Equation 50
The XRD technique was mainly used after the synthesis of the materials to evaluate their
purity qualitatively and investigate the type of carbonates formed upon carbonation. Around

156
1 g of the powdered material (sieved at 63 μm), was introduced in a Philips/PANalytical X’Pert
Pro-MPD diffractometer with an X’Celerator detector of an incident CuKα radiation beam by
40 kV and 40 mA to a rotation sample. The specimens were scanned for 40 minutes from 2θ =
5 to 65° by a step of 0.25° without protection from air CO2 and in a dry environment
(RH~40%).
Parallel to these experiments, scanning electron microscopy SEM [127] technique was used in
order to observe the morphological changes in some powders upon carbonation. The powders
were placed on a carbon adhesive sample holder and coated using gold-palladium as
conductive material. The observations were made with a MEB-FEG FEI Quanta 400 device in
the secondary electrons mode at an accelerated voltage of 15 KeV.
3.3.3 Carbonation exposure conditions and equipment
In order to perform a CO2-binding capacity test, 1 g of the tested powder was evenly and thinly
distributed over a PVC sample holder (Figure 53 (a)) of 110 mm diameter for exposure in the
carbonation chamber in a room at 20 ± 2°C (Figure 53 (b)). The RH inside the climate
chamber was controlled by means of saturated salt solutions.
(a)
(b)
Figure 53: (a) A tested powder sample on the sample holder; (b) climate chamber during the natural carbonation of the powder specimen
In order to maintain the CO2 concentration constant inside the climate chamber, an air pump

157
of 300L/h flow rate was used to pass the ambient air through a bubbler filled with a saturated
salt solution to regulate it at a certain RH and circulate it inside the climate chamber. This way,
the RH, temperature and CO2 concentration (450 ± 100 ppm) were kept constant inside the
climate chamber. The volume of the chamber (40L) was well-ventilated thanks to a ventilator
that ensured homogenization of the humid air at ambient CO2 concentration.
3.3.4 Instantaneous rate measurements
3.3.4.1 Principle and apparatus
A new experimental device able to directly measure the CO2-uptake of powdered samples was
designed. The principle is to place a given mass of reactive powder in a closed gas volume of
controlled initial composition. The measured CO2 depletion in the gas phase over a short time
interval (minutes) is then exactly compensated by the CO2 uptake in the solid. During the
carbonation period, the instantaneous CO2 uptake of the powder was measured occasionally
in a closed system (closed cell). The frequency of the CO2 uptake measurements was twice a
day for the first three days of carbonation and once a day afterwards. The experimental data
collected from these experiments were CO2 depletion curves in a closed cell over the
carbonation exposure period. The carbonation cell (Figure 54) consists of a closed system in
which the sample holder containing the powdered material is introduced during the CO2-
uptake measurements. The cell is a cylinder having an outside and inside diameter of 140 mm
and 120 mm, respectively.
(a)

158
Figure 54 : (a) the carbonation cell sketch (b) photo of the carbonation cell
The cell cover incorporates the infrared IR CO2 gas sensor. An O-ring with a round cross-
section is placed around the cover in order to seal the interface between the cover and the cell
body. The cell closure is done manually by means of four stainless steel lockable clips. The
total measurement time of the CO2 uptake by the sample must be negligible with regards to
the overall carbonation period. Therefore, the cell body contains a 140 mm diameter piston of
an adjustable height to vary the inside volume of the chamber. The latter can vary from 10 to
285 mL. The tests were carried out at ambient temperature (20°C) and pressure (1 atm).
3.3.4.2 Analysis of the rates (from experimental data)
The experimental setup allows for the direct measurements of the CO2-uptake of the tested
powders at different times of exposure to ambient CO2 concentration. Figure 55 gives
examples of CO2 depletion in the gas phase over time in the case of ettringite powder after 1,
2, 5 and 30 days of exposure to ambient CO2 concentration in a climate chamber regulated at
93% RH. CO2 depletion in the gas correspond to CO2 uptake by the solid: we refer only to CO2
uptake curves later in the document. The measurement period was around 30 min long. Each
curve allows defining a rate of carbon dioxide uptake, which is proportional to its initial slope. It
is noticed from Figure 55 that ettringite’s reaction rate decreases as the carbonation reaction
proceeds to drop sharply after 30 days of carbonation when the detection limit is reached.
(b)

159
Figure 55: CO2-uptake curves of ettringite powder at different carbonation periods: 1 and 2 days (gas volume = 123 mL), 5 and 30 days (gas volume = 10 mL)
By considering the CO2-uptake curves, the instantaneous binding rate (IBR), the bound-CO2
(B_CO2), and the degree of carbonation (DoC) are determined.
First, the initial slope (S) of each CO2-uptake curve was determined automatically by
maximizing the R-squared and minimizing the mean squared error using statistical software
(JMP). The instantaneous binding rate is then calculated according to Equation 51, where IBR
(gCO2 g-1powder s-1) is the instantaneous CO2-binding rate, S (s-1) is the CO2-uptake initial slope,
P (Pa) the ambient pressure, R (m3⋅Pa⋅K−1⋅mol−1) the ideal gas constant, T (K) the ambient
temperature, Vg (m3) the inside volume of the carbonation cell, MCO2 (g) the molar mass of
carbon dioxide, and m0 (g) is the mass of the material with neither unbound CO2 nor water.
This mass was calculated from the mass of the tested powder corrected by the mass loss
results from TGA before carbonation of the sample (at 1000°C).
IBR = S ∗ P ∗ MCO2 ∗ Vg
R ∗ T ∗ m0 Equation 51
B_CO2 = ∫ IBR dtT
t=0
Equation 52
DoC =CBC
MBC
Equation 53
MBC = ∑ %CaO ∗ MCO2
MCaO− %SO3 ∗
MCO2
MSO3 Equation 54
The bound-CO2 (B_CO2) is deduced from the IBR by the trapezoidal integration of the IBR
0
50
100
150
200
250
300
350
400
450
500
0 10 20 30
CO
2concentr
atio
n (
ppm
)
Time(min)
1_day
2_days
5_days
30_days

160
values between two CO2-uptake measurements (from t=0 to T the time of the CO2 uptake
measurement) (Equation 52). The total CO2-binding capacity (CBC) of the tested powder is
the maximum value of the B_CO2 at the end of the carbonation period.
Note that the B_CO2 is expressed as the mass of CO2 bound per mass of the powder (m0). The
degree of carbonation is calculated following Equation 53, where the maximum binding
capacity (MBC) is calculated from the chemical composition of the tested material assuming
that all CaO will be transformed into CaCO3 except the one that reacts with SO3 to form
CaSO4. The oxides molar ratio is given from the stoichiometry of the chemical formulas of
each synthesized material. MSO3, MCO2, MCaO (g/mol) are the molar masses of trioxide sulfur,
carbon dioxide and calcium oxide, respectively.
3.3.4.3 Analysis of the reaction order
The analysis of the CO2-uptake curves determined using our experimental setup allows for the
determination of the reaction order and the rate constant ki (see Equation 55, 56 and 57). The
analysis of the reaction order is of relevance regarding the measured instantaneous binding
rates (see Equation 51) that are corrected according to the reaction rate.
The order of the reaction was determined by analyzing the slope of the linear graph obtained,
whether with [CO2], ln ([CO2]) or 1/[CO2], versus time and the linear fit quality (R-squared).
Zero order [CO2](t) = −k0 ∗ t + [CO2]0 Equation 55
First order ln ([CO2](t)) = −k1 ∗ t + ln ([CO2]0) Equation 56
Second order 1
[CO2](t)= −k2 ∗ t +
1
[CO2]0 Equation 57
The order of reaction of a reactant indicates how much the rate of reaction changes if the
concentration of the reactant is changed. The CO2 concentration has no effect on the reaction
rate of zeroth order reactions, while for first-order reactions, the rate of reaction changes
directly with the concentration of the corresponding reactant. For second-order reactions, the
rate of reaction changes as the square of the reactant concentration.
3.3.4.4 Test method and detection limit
In this work, six carbonation cells were used in parallel. Cells leakage rates were determined
by performing blank tests: the cells were first flushed with nitrogen (from the inlet as shown on

161
Figure 53), then the CO2 concentration inside the cell was measured for 48 hours. Note that
the blank tests were performed on all the cells at their maximum (285 mL) and minimum (10
mL) volumes. The collected data (CO2 concentration vs. over time) were analyzed to calculate
an equivalent CO2-binding rate that sets the lower detection limit of the test method. Figure 56
(a) gives an example of leakage tests on a given cell (cell3). The minimum IBR that can be
measured using our experimental setup depends on the mass of the tested powder. Figure 56
(b) shows the decrease of the minimum IBR with the mass of the sample. However,
experiments are conducted using 1 g of the powder in order to minimize the thickness of the
grains layer and thus avoid mass diffusion during the carbonation exposure time. Therefore,
the detection limit of the cell taken as an example is set at 5.8x10⁻¹⁰ gCO2.gpowder-1.s-1.
(a)
(b)
Figure 56: (a) example of a leakage test performed on a closed cell (cell3), (b) the minimum IBR that can be detected as a function of the sample mass
0
50
100
150
200
250
300
0 1000 2000 3000
CO
2_p
pm
Time (min)
vol_max_cell3 vol_min_cell3
5,8E-10
8,9E-11
5E-11
5E-10
0 2 4 6 8
Min
imu
m IB
R (
gco
2.g
cem
ent-
1.s
-1)
Mass of the tested powder (g)
cell3_vol_max cell3_vol_min

162
Note that the highest IBR (1.1x10⁻⁶ gCO2.gpowder-1.s-1) determined with our test method
corresponds to the value of the most reactive material (portlandite powder) tested during the
first day of exposure to carbonation at the highest RH (93%).
3.4 Results
3.4.1 TGA and XRD results
3.4.1.1 TGA results of the materials after carbonation at 93% RH
Figure 57 shows the TGA results of the tested powders after carbonation at 93% RH. The
TGA results are shown after carbonation at this RH only because the C3S powder only
carbonates at 93%RH. It is worth noting that a peak is observed from 550°C to 950°C after
carbonation of the materials. This result corresponds well to the temperature range of the
decomposition of calcium carbonate reported in the literature [108]. After carbonation of C2S
and C3S at 93% RH, TGA results show a certain amount of bound water (temperature range
[150-250°C]), which could be due to the formation of C-S-H during the preconditioning.
The TGA results of carbonated ettringite and C3A show a peak around 280-300°C, which
corresponds to the decomposition of aluminum hydroxide. According to Collier [108], the
thermal decomposition of aluminum hydroxide occurs within the same temperature range.
Figure 57: TGA results of C3S, C2S, C3A, AFt, CH and C-S-H after carbonation at 93% RH
3.4.1.2 CO2-binding capacity of the tested materials
-0,06
-0,05
-0,04
-0,03
-0,02
-0,01
0
0 200 400 600 800 1000
dm
/m (
min
-1)
Temperature (°C)
C3S
C2S
C3A
Aft
CH
C-S-H

163
The bound-CO2 of the synthetic materials was determined using TGA, just before the
conditioning at different RH levels with soda lime. Table 35 (column TGA initial in 10-2 gCO2 g-
1powder) shows that some carbonation of the powdered samples could not be avoided, even if
great care was taken to fill the climate chamber with soda lime (the CO2 concentration inside
the chamber was found to be less than 10 ppm). The maximum initial bound CO2 is reached
for portlandite powder (4.1 * 10-2 gCO2 g-1powder , DoC = 6.8%).
The bound CO2 was also determined by TGA at the end of the carbonation period
corresponding to the durations given in Table 35. Note that the initial bound CO2 is deduced
from these results. The CO2-binding capacity of all the systems under all conditions is
determined using Equation 50. Table 35 shows that the CO2-binding capacity of all materials
increases with the RH of exposure. The degree of carbonation varies between 1% and 45%,
which highlights the incomplete carbonation of the materials, inspite of the very low rate at the
end of the ageing period.
Material
Theoretical maximum
binding capacity 10-2 gCO2 g-
1powder
B_CO2 in 10-2 gCO2 g-1
powder before the carbonation
test (degree of
carbonation)
RH (%)
CO2 (ppm)
Ageing period (days)
B_CO2 in 10-2 gCO2.g-
1powder
after the carbonation test
(degree of carbonation)
CH 59.5 4.1 (7%)
93 ~450 14 23 (39%)
55 ~450 15 13.8 (23%)
33 ~450 25 7.0 (12%)
C-S-H 35.9 2.9 (8%)
93 ~450 27 11.0 (31%)
55 ~450 27 5.4 (15%)
33 ~450 27 2.2 (6%)
Ettringite 38.9 2.1 (5%)
93 ~450 35 17.6 (45%)
55 ~450 11 3.5 (9%)
33 ~450 29 1.5 (4%)
C2S 51.2 0.1 (0.1%)
93 ~10 32 0.5 (1%)
~450 13 1.5 (3%)
55 ~450 13 0.8 (2%)
33 ~450 13 0.4 (1%)
C3S 57.9 0.1 (0.1%)
93 ~10 32 2.1 (1.2%)
~450 14 8.0 (14%)
55 ~450 14 3.2 (6%)
33 ~450 15 0.6 (1%)
C3A 48.9 0.6 (1.2%)
93 ~10 32 1 (2.1%)
~450 13 1.5 (3%)
55 ~450 13 1 (2%)
33 ~450 13 0.3 (1%)
Table 35: B_CO2 before and after the carbonation test at three RH levels: TGA results
In order to investigate the possible carbonation and hydrate formation by anhydrous materials

164
during the preconditioning at 33%, 55% and 93% RH, the powders were stored inside climate
chambers regulated at these RH for 32 days. Soda lime was added inside the climate
chamber to avoid carbonation during this preconditioning period (CO2=10ppm). The TGA raw
data reveal only two peaks: [100-250°C] and [550-950°C]. The first corresponds to bound
water, which could be a result of the formation of C-S-H for C3S and C2S, and the formation of
aluminum hydroxide for C3A powders [108]. Table 35 shows that the degree of carbonation
after the preconditioning without soda lime of anhydrous minerals at 93% RH varies between
0.1% and 1.2%.
3.4.1.3 XRD results
XRD tests were carried out before the exposure of the materials to carbonation, after
carbonation at 93% RH, and also after preconditioning of the anhydrous powders (C3S, C2S
and C3A) at 93%RH with soda lime for 32 days (CO2 = 10 ppm) in order to investigate any
possible formation of hydrates. Note that only the 93% RH exposure was tested for anhydrous
minerals preconditioned without CO2 and all materials carbonated at 93% RH, since the
amount of bound CO2 was the highest at this RH level. Indeed, Flatt et al. [221] suggest that
alite stops hydrating below 80% RH. Qualitative XRD results are summarized in Table 36. All
the powders did not carbonate fully, since a trace of the pure mineral in the powder is
confirmed by XRD results (Table 36).
Material State Calcite Aragonite Vaterite Gypsum C3S AFt CH C2S C3A
CH
After carbonation at 93%RH
++ - - - - - + - -
C-S-H ++ + + - - - - - -
AFt + ++ - ++ - + - - -
C3S ++ - + - ++ - - - -
C2S + - - - - - - ++ -
C3A + - - - - - - ++
C2S After conditioning at 93%RH with soda lime.
- - - - - - - ++
C3S - - - - ++ - - - -
C3A - - - - - - - - ++
Table 36: results of qualitative XRD on synthetic materials after carbonation at 93% RH (++: phase highly present, +: phase present in lower quantity, -: phase not detected)

165
Results show that the only carbonate formed after the carbonation period of pure portlandite is
calcite, which agrees with several findings in the literature [222][223]. Calcite is also the
primary polymorph produced during the carbonation of C-S-H coexisting with small amounts of
aragonite and vaterite, which could be linked to the Ca/Si ratio of the tested C-S-H (0.9).
Indeed, Black et al. [211][212] studied the carbonation of synthetic C-S-H in which the initial
Ca/Si ratio appeared to influence the crystalline carbonate species formed. For Ca/Si ratios
greater than 0.67, principally calcite and vaterite were observed, whereas for ratios below
0.50, aragonite was most prevalent.
Ettringite carbonation is expected to form gypsum and amorphous aluminum hydroxide, which
were not detected by XRD analysis (Table 36). However, the TGA results in Figure 57 for
carbonated ettringite at 93% RH show a peak around 280-300°C, which corresponds to the
decomposition of aluminum hydroxide according to Collier [108]. In agreement with our results,
Nishikawa [224] and Zhou [225] reported that the carbonation of synthetic ettringite is
accompanied by increasing formation of vaterite or aragonite, alumina gel and gypsum.
However, Zhou and Glasser [225] observed only vaterite as the carbonate product formed,
while Nishikawa et al. [224] described vaterite forming initially but aragonite being predominant
at later stages.
The XRD analysis of the carbonated C3S powder shows the formation of calcite as the main
carbonation product with a trace of vaterite, while the analysis of the C3A and β-C2S powders
after 14 days of natural carbonation at 93% RH only revealed small traces of calcite.
The XRD analysis of the C3A and β-C2S powders after 14 days of natural carbonation at 93%
RH only revealed small traces of calcite. This result is due to the small B_CO2 of β-C2S and C3A
and could be also a consequence of the formation of an amorphous calcium silicate
hydrocarbonate phase that is also shown by several researchers [226][227][228]. It is worth
noting that no calcium hydroxide is detected by the XRD analysis after carbonation of C3S.
XRD results show no trace of calcite even though the degree of carbonation of anhydrous
materials reached up to 1.2% (cf. Table 35). This could be explained by the formation of
amorphous calcium carbonate.
Research conducted by Seishi et al. [226] on the morphology of the carbonates formed after
the reaction of pure C3S with 5% CO2 concentration under saturated humidity at room
temperature revealed that calcite was the main product, coexisting with vaterite and aragonite.
However, aragonite is recognized as the main carbonate for β-C2S coexisting with traces of
calcite and vaterite. Our differing results may be due to the fact that CO2 concentrations differ.
Han et al. [229] showed that C3S and C2S carbonation reaction results in the formation of

166
CaCO3 and silica gel.
3.4.2 Microstructure results (BET, SEM)
The BET surface area and density of anhydrous minerals CH and ettringite were determined
before the beginning of the carbonation test and after carbonation at the three levels of RH.
Figure 58 (b) shows that the BET surface area increased by a maximum factor of 1.7 when the
anhydrous minerals and ettringite are carbonated at 33% and 55% RH, while it increased
significantly (by a factor of 7) when these materials are carbonated at 93% RH. Nevertheless,
for portlandite powder, the BET surface area decreases with the RH under which the
carbonation test was carried out (by a factor of 6 at 93% RH). Regarding the density variation
upon carbonation (Figure 58 (a)), an opposite trend is noticed: the density of the anhydrous
phases decreased with the RH (by almost 1g/cm3) and the density of portlandite and ettringite
increased significantly with the RH of carbonation. The BET surface area of C-S-H powder
was only tested after carbonation at 93% RH and the density was not determined for practical
reasons. A high decrease in the BET surface area was noticed on this powder (from 190 m²/g
to 88 m²/g), which could be due to the precipitation of carbonates on the surface of the grains.
(a)
1,7
1,9
2,1
2,3
2,5
2,7
2,9
3,1
3,3
C3S C2S C3A Ettringite CH
Density (
g/c
m3)
Before carbonation
Carbonation at 33% RH
Carbonation at 55% RH
Carbonation at 93% RH

167
(b)
Figure 58 : The density (a) and BET surface area (b) of the materials before and after carbonation at different RH
Figure 59 shows the SEM images of C3S, CH and AFt before carbonation and after
carbonation at 93% RH. These images allow for the observation of the morphological evolution
of the grains upon carbonation. Figure 59 (b) and (c) show an increase in the amount of
carbonation products on the surface of C3S and CH after carbonation. As for ettringite powder,
carbonation is known to result in the formation of carbonates (vaterite and aragonite), alumina
gel and gibbsite [36]. Figure 59 (f) shows the formation of carbonate crystals between the
needles of ettringite with a shape that resemble to vaterite (hexagonal) and calcite (trigonal)
[29]. Indeed, XRD results (Table 36) confirm the formation of these two carbonates.
0
5
10
15
20
25
C3S C2S C3A Ettringite CH
BE
T s
urf
ace a
rea
(m²/
g)

168
(a) C3S before carbonation
(b) C3S carbonated at 93%
(c) CH before carbonation
(d) CH carbonated at 93%
(e) Non-carbonated ettringite
(f) Ettringite carbonated at 93% RH
Figure 59 : Morphological evolution of C3S, CH and AFt powders before carbonation and after exposure to carbonation at 93% RH
5 μm

169
3.4.3 Reaction order analysis
(a)
(b)
(c)
Figure 60: Reaction order analysis of portlandite after 6 hours and 15 days of exposure to carbonation. Order 0 (a), order 1 (b), order 2 (c)
Figure 60 shows an example of the reaction order analysis of portlandite powder carbonated
at 33% RH. The analysis of Figure 60 reveals that the best linear fit for the considered
timescale is obtained for the zeroth order (cf. Table 37). Consequently, the carbonation
reaction kinetics (hence the CO2 binding capacity) are independent of the CO2 concentration
within the concentration range of our experiments (450 ± 100 ppm). In agreement with these
results, Van Balen et al. [230] and Shih et al. [219] suggest that the carbonation reaction of
lime and portlandite powders at 7 - 17% CO2 and 3.15-12.6% of CO2, respectively, are of
order 0.
y = -32,71x + 456,00R² = 0,99
y = -6,52x + 448,83R² = 0,95
0
50
100
150
200
250
300
350
400
450
500
0 5 10
CO
2(p
pm
)
Time (min)
6 hours
15 days
y = -0,03x + 6,02R² = 0,96
y = -0,01x + 6,12R² = 0,81
5,0
5,2
5,4
5,6
5,8
6,0
6,2
0 5 10ln
([C
O2])
Time (min)
6 hours
15 days
y = 0,00x + 0,00R² = 0,97
y = 0,00x + 0,00R² = 0,82
0,0E+0
5,0E-4
1,0E-3
1,5E-3
2,0E-3
2,5E-3
3,0E-3
3,5E-3
0 5 10
1/[
CO
2]
Time (min)
6 hours
15 days

170
Material RH (%) Exposure period
(day) order 0 order 1 order 2
CH
93 1 0.98 0.97 0.86
8 0.69 0.62 0.68
55 2 0.98 0.98 0.80
13 0.88 0.80 0.81
33 8 hours 0.99 0.96 0.96
15 0.85 0.81 0.82
C-S-H
93 6 hours 0.99 0.99 0.98
7 0.92 0.91 0.91
55 5 hours 0.99 0.99 0.98
22 0.82 0.81 0.82
33 1 0.99 0.99 0.98
22 0.54 0.51 0.53
AFt
93 1 0.99 0.97 0.96
28 0.91 0.89 0.87
55 8 hours 0.96 0.95 0.94
17 0.91 0.92 0.89
33 8 hours 0.97 0.83 0.83
10 0.67 0.29 0.29
C3S
93 4 hours 0.95 0.94 0.93
9 0.99 0.99 0.97
55 1 0.99 0.98 0.98
12 0.78 0.78 0.79
33 6 hours 0.96 0.95 0.94
6 0.42 0.41 0.36
C2S
93 1 0.96 0.96 0.96
11 0.96 0.97 0.97
55 0 0.96 0.96 0.97
11 0.92 0.92 0.91
33 2 0.92 0.92 0.92
10 0.84 0.83 0.84
C3A
93 2 0.97 0.97 0.91
10 0.95 0.89 0.96
55 0 0.97 0.96 0.97
9 0.57 0.56 0.56
33 0 0.85 0.85 0.85
10 0.19 0.20 0.21
Table 37: R-square values for the reaction order analysis
Table 37 gives a summary of the reaction order analysis of the tested materials at different RH
levels, and the R-squared of the linear fit analysis of the reaction orders. From analyzing the
CO2-uptake curves, it is noticed that the carbonation reaction during the first week of exposure
is zeroth order in most cases. However, for anhydrous powders, a good fit is obtained for all
orders. This result could be due to the carbonation reaction of more than one reactant. Still,
Table 37 shows very comparable results of the fit quality of the CO2-uptake curves for order 0,

171
1 and 2.
3.4.4 CO2-binding capacity of anhydrous minerals from IBR
For each tested anhydrous material, Figure 61 and Figure 62 give the IBR and 𝐵_𝐶𝑂2,
respectively. The IBR of anhydrous materials decreases with the exposure time. Note that
since the IBR values are higher than the detection limit of the setup (5.8x10⁻¹⁰ gco2.gpowder-
1.s-1), these results refer to the properties of the materials rather than to any cell leakage. The
IBR depends on the RH: the higher the RH, the higher the CO2-binding rate. The IBR varies
from [10-8 to 10-10 ], [10-8 to 10-9], and [10-7 to 10-9] gco2.gpowder-1.s-1 when the carbonation
tests are carried out at 33% RH, 55% RH, and 93% RH, respectively. It is known that the
controlling factor in the carbonation reaction rate is the dissolution of CaO and gaseous CO2.
At high RH, there is more water present to dissolve CaO and CO2, which increases the rate of
the reaction. After 14 days of exposure to ambient CO2 in climate chambers with constant RH
levels (33, 55 and 93%), no anhydrous material reached the maximum binding capacity MBC,
which was theoretically calculated (Table 35).
A slight carbonation of C2S and C3A powders was observed. The highest CBC was observed
for C3S powders carbonated at 93% RH. Furthermore, Figure 61.b shows that, after 14 days of
exposure, the amount of bound CO2 at 93% RH of the C2S powder continued to increase but
at a very slow rate (2x10⁻⁹ gCO2.gpowder.s-1) while this rate was 10 times higher for C3S powder.

172
(a) (a)
(b) (b)
1E-10
1E-09
1E-08
1E-07
1E-06
0 5 10 15
IBR
( g
co2.g
pow
der-
1.s
-1)
Carbonation time (days)
C3S_33%RH
C3S_55%RH
C3S_93%RH
0
0,01
0,02
0,03
0,04
0,05
0,06
0,07
0,08
0,09
0,1
0 5 10 15
B_C
O2 (
gco2.g
pow
der-
1)
Carbonation time(days)
C3S_33%RH
C3S_55%RH
C3S_93%RH
1E-10
1E-09
1E-08
1E-07
1E-06
0 5 10 15
IBR
( g
co2.g
pow
der-
1.s
-1)
Carbonation time (days)
C2S_33%RH
C2S_55%RH
C2S_93%RH
0
0,01
0,02
0,03
0,04
0,05
0,06
0,07
0,08
0,09
0,1
0 5 10 15
B_C
O2 (g
co2.g
pow
der-
1)
Carbonation time(days)
C2S_33%RH
C2S_55%RH
C2S_93%RH

173
(c) (c)
Figure 61: IBR of anhydrous phases Figure 62: the amount of bound CO2 at different carbonation periods of anhydrous phases
3.4.5 CO2-binding capacity of hydrates from IBR
For each tested hydrate, Figure 63 and Figure 64 give the IBR and B_CO2, respectively. Figure
63 (a) shows that the IBR of ettringite powder decreased by one order of magnitude only after
2 days of carbonation at 33% and 55% RH. At 55%, the IBR only slightly changed afterwards
even after 29 days of carbonation, while the detection limit of the experimental setup was
reached after 8 days of carbonation at 33% RH. Therefore, the experiments at these two RH
levels were stopped after 11 and 28 days. Ettringite powder only slightly carbonates at 33%
and 55% RH: CBC are 0.1.10-2 and 2.10-2 gco2.gpowder-1, respectively. On the other hand, at
93% RH, ettringite carbonated with a high IBR until 28 days of exposure, to reach a B_CO2 of
16.10-2 gco2.gpowder-1 that slightly varied afterwards. The present results confirm that the role of
water in the carbonation of ettringite is highly important. It was also reported by Robl et al.
[231] that ettringite only carbonates at 400 ppm CO2 when ambient RH is higher than 60%.
Figure 63(b) shows that the IBR of portlandite decreased by 3 orders of magnitudes after 10
days of exposure to ambient CO2 concentration at 93% and 55% RH. Consequently, Figure
64(b) shows that the B_CO2 increased significantly during the first 10 days of exposure to
carbonation to reach a plateau that corresponds to its CBC afterwards (19.10-2 and 16.10-2
gco2.gpowder-1 at 93 and 55% RH respectively). When carbonated at 33% RH, portlandite’s IBR
only decreased significantly after 16 days of carbonation to reach a CBC of 10.10-2 gco2.gpowder-
1.
1E-10
1E-09
1E-08
1E-07
1E-06
0 5 10 15
IBR
( g
co2.g
pow
der-
1.s
-1)
Carbonation time (days)
C3A_33%RH
C3A_55%RH
C3A_93%RH
0
0,01
0,02
0,03
0,04
0,05
0,06
0,07
0,08
0,09
0,1
0 5 10 15
B_C
O2 (g
co2.g
pow
der-
1)
Carbonation time(days)
C3A_33%RH
C3A_55%RH
C3A_93%RH

174
(a) (a)
(b) (b)
1E-10
1E-09
1E-08
1E-07
1E-06
0 10 20 30
IBR
( g
co2.g
pow
der-
1.s
-1)
Carbonation time (days)
AFt_33%RH
AFt_55%RH
AFt_93%RH
0
0,05
0,1
0,15
0,2
0,25
0,3
0 10 20 30 40
B_C
O2 (g
co2.g
pow
der-
1)
Carbonation time(days)
AFt_33%RH
AFt_55%RH
AFt_93%RH
1E-10
1E-09
1E-08
1E-07
1E-06
0 10 20 30
IBR
( g
co2.g
pow
der-
1.s
-1)
Carbonation time (days)
CH_33%RH
CH_55%RH
CH_93%RH
0
0,05
0,1
0,15
0,2
0,25
0,3
0 10 20 30 40
B_C
O2
(gco2.g
pow
der-
1)
Carbonation time(days)
CH_33%RH
CH_55%RH
CH_93%RH

175
(c) (c)
Figure 63: IBR of hydrates phases Figure 64: the amount of bound CO2 at different carbonation periods of hydrates
As shown in Figure 63 (c), the IBR of the C-S-H powder decreased by almost one order of
magnitude after two days of carbonation at 93% and 55% RH, 2 orders of magnitude at 33%
RH after 9 days and only slightly varied afterwards. At three RH levels, the CBC of C-S-H
powder was not reached, as observed in Figure 64 (c): the B_CO2 continues increasing even
after 28 days of exposure to ambient carbon dioxide.
3.5 Discussion
3.5.1 Reaction vs. mass diffusion
In an attempt to identify the mass transport effect and the reactivity of the tested powders on a
powder layer scale, the dimensionless Thiele modulus (Φ²n) was used to compare the
transport and the reaction timescales. 𝜙𝑛2 is an important dimensionless number within the
dual lens approach reaction, it appears in the mass balance, after introducing the
dimensionless spatial variable [150].
The Thiele modulus is defined as the ratio of the diffusion time (Tdiffusion) to the reaction time
(Treaction). De,CO2 is the CO2-effective diffusion coefficient in air (1.6x10⁻⁵ m²/s), [CO2]0 (gCO2/m3)
is the CO2 concentration at the surface of the grain, d(m) is the powder layer thickness, k0 is
1E-10
1E-09
1E-08
1E-07
1E-06
0 10 20 30
IBR
( g
co2.g
pow
der-
1.s
-1)
Carbonation time (days)
C-S-H_33%RH
C-S-H_55%RH
C-S-H_93%RH
0
0,05
0,1
0,15
0,2
0,25
0,3
0 10 20 30 40
B_C
O2
(gco2.g
pow
der-
1)
Carbonation time(days)
C-S-H_33%RH
C-S-H_55%RH
C-S-H_93%RH
ϕn2 =
Tdiffusion
Treaction=
d² ∗ k0 ∗ ρ
De,CO2 ∗ [CO2]0 Equation 58

176
the reaction kinetic constant (gCO2.g-1powder.s-1) and ρ (gpowder/m3) is the powder density. Low
values of the Thiele modulus indicate surface reaction control and a significant amount of the
CO2 diffusing well into the grains’ interior without reacting. High values of the Thiele modulus
indicate that the surface reaction is rapid and that the reactant is consumed very close to the
external surface so only very little penetrates into the interior of the grain [150].
Highest reaction kinetic constant (10-6 gCO2.g-1
powder.s-1 ) Lowest reaction kinetic constant (10-10 gCO2.g-1
powder.s-1 )
Powder layer thickness (d in mm)
3 350
Table 38: The critical powder layer thickness at the lowest and highest values of the kinetic constant (Thiele modulus = 1)
The critical thickness of the powder layer is determined for a 𝜙𝑛2 = 1 and the kinetic rate
constant varies between 10-10 and 10-6 gCO2.g-1powder.s-1 (lowest and highest values determined
from our experiments). For a powder layer of a thickness lower than 3 mm (which is the case
in our study), the Thiele modulus is largely lower than 1. This result shows that the diffusion of
CO2 into the pores water is fast; so that the limiting factor is the CO2 uptake by the solids.
3.5.2 From instantaneous rate to “cumulative” CO2 uptake
The reliability of our test method results was investigated by comparing to the CBC values at
the end of the carbonation period of each material obtained by both TGA and our method (cf.
Table 35). Figure 65 shows that the CBC from TGA analysis and the CBC calculated based on
our test method are in agreement. No evidence of an offset related with mineral type, relative
humidity or range of CBC is noticed. These results are very promising regarding the accuracy
and reliability of the new test method because they show that the analysis of the CO2-uptake
curves corresponds well to the carbonation reaction, since TGA data are hard evidence that
the uptake of carbon dioxide is due to carbonation [113].

177
Figure 65: TGA CO2-binding capacity vs. the carbonation cell CO2-binding capacity (JMP)
The difference between TGA and the carbonation cell results could be a consequence of a
slight carbonation during the preconditioning of the powders in the climate chamber even
though soda lime was added. Moreover, the nature of these test methods is different: the CBC
from TGA is determined purely on the basis of changes in the mass with respect to
temperature and in correspondence with the amount of volatile matter and moisture content,
and the carbonation cell test method is based on the measurement of the instantaneous CO2
binding rate determined punctually during the carbonation period.
Note that the amount of bound CO2 determined by the developed test method is dependent on
the frequency of the CO2-uptake measurements, especially during the first three days of
exposure to ambient CO2 concentration. The results reliability also depends on the response
time and precision of the CO2 gas sensor, especially for highly reactive phases.
The test method can be improved by using a CO2 sensor with lower response time, performing
more measurements, which results in the improvement of integration method accuracy, and
controlling the CO2 concentration inside the room, especially for first and second order
reactions.
Nevertheless, the agreement between the results obtained from the two techniques is quite
promising (Figure 65), since they differ by no more than 38% for the range of the conditions
and materials tested.
3.5.3 Reaction mechanisms
3.5.3.1 Anhydrous carbonation

178
Regarding the carbonation of anhydrous materials, the CBC of C2S and C3A powders didn’t
exceed 2.10-2 gCO2.g-1powder. However, C3S powder carbonated significantly at 93% RH only
(DoC = 14%).
Figure 58 shows a decrease in the density and a significant increase in the BET surface area
of C3S and C2S powders due to carbonation, which can be explained by the formation of a thin
layer of C-S-H on the surface of the grains [232][233]. Indeed, Houst et al. [87] reported that
the carbonation of β-C2S and C3S results in the formation of aragonite, silica gel and a small
amount of C-S-H, no trace of calcium hydroxide is observed during the carbonation [87].
The same result is observed for C3A powder, which could be due to the formation of aluminum
hydroxide since Figure 57 shows that the TGA results of C3A powder after exposure to
carbonation reveal a peak around 280-300°C, which corresponds to the decomposition of
aluminum hydroxide.
The fact that only C3S powder reacted at 93% RH could be explained by the high reactivity of
C3S with water, giving rise to the formation of calcium hydroxide and a number of different
amorphous or poorly crystalline calcium silicate hydrates phases that would carbonate rapidly.
These results are generally consistent with previous studies, which show that even though
C3A is much more water reactive than C3S and C2S [22], it only carbonates slowly.
3.5.3.2 Hydrates carbonation
The amount of bound CO2 of both anhydrous and hydrates increased with the RH level where
water is more available for the dissolution of CO2 and CaO.
Although portlandite powder carbonated significantly at the three RH levels, the CBC is
reached only after 7 days of carbonation. Images of portlandite powder shown in Figure 59
could explain the rapid decrease of the IBR, which would be due to the fact that the
carbonation takes place on the surface of the grains, and its rate of proceeding inwards is very
slow. Hence, when the surface is covered with CaCO3, the carbonation is practically ceased.
This is also facilitated by the relatively small surface areas of portlandite crystals in
comparison with calcium silicate hydrates. This phenomenon is similar to the one addressed
by Sohn and Szekeley [234] for porous solid pellets, where intragrain diffusion resistance may
become so large that it will control the progress of the reaction process. Moreover, Galan et al.
[235] investigated the permeability of the CaCO3 layer on the surface of portlandite and
reported that this layer provides significant protection against diffusion of Ca2+ and OH− ions,
which hinders further carbonation. However, in the case of ettringite, which is a fibrous-form
material, the carbonates could form between its needles (see Figure 59) which would not

179
hinder the CO2 diffusion or the CaO dissolution. Indeed, Figure 64 shows that the CBC of
ettringite is reached 18 days after portlandite’s and the IBR remains constant for 20 days when
ettringite is carbonated at 93% RH.
The carbonation of C-S-H is found to occur at a slower initial rate than the carbonation of CH
because of the more rapid dissolution of CH [39][236]. This behavior reverses when the
formation of microcrystalline CaCO3 around reacting CH crystals inhibits further accessibility
and slows down the portlandite dissolution, while the carbonation rate of C-S-H remains
almost constant (very slow variation) even after 27 days of carbonation.
TGA and carbonation cell results show that the pure hydrates did not carbonate completely,
their degree of carbonation did not exceed 45% in the present study (Table 35). In agreement
with our results concerning portlandite’s carbonation, Grandet [237] reported that the degree of
carbonation of portlandite is limited to 50-60%. Concerning the carbonation of pure ettringite,
Castellote [238] found that ettringite carbonates up to 50% under 0.03% CO2 and 3% CO2,
and carbonates completely at 10% CO2.
3.5.4 Application of the results of this work
Results from this work would help to enhance the understanding of the kinetics of carbonation
at high RH on the reactivity of clinker phases (C3S, C3A, C4AF) during storage in silos or bags
for long periods under different RH levels, which is an important issue for the industrial field.
The developed test method could be used to compare the CO2 binding capacity of existing or
innovative binders to assess their actual environmental benefits of CO2 uptake by carbonation
and investigate the life cycle assessment of cementitious materials after their preparation (in
the case of precast concrete), during their service life, and after the end of the service life
(recycled concrete) [239]. The NF P19-839, NF EN 16757 standards [239] state that the
degree of carbonation of concrete strucures varies between 40% and 85% in a dry climate and
under exposure to rain, respectively. However, our results in Table 35 reveal that even at 93%
RH, the portlandite’s degree of carbonation reached 39% only and the IBR varied very slightly
after 7 days of carbonation. This suggests that higher RH or water content in addition to
wetting drying cycle should be further investigated in terms of rate and maximum CO2 uptake.
The results of this work could also improve the modeling of carbonation kinetics and the
prediction of the shape of the carbonation front when the diffusion coefficient is also assessed.
Since our results show that the CO2-binding capacity of hydrates is reached after only 6 days
(CH) or over 28 days (C-S-H) of exposure to carbonation, this means that the carbonation
reaction could continue behind the carbonation depth determined by means of a pH indicator

180
results, which means that the carbonation front shape is not completely sharp [190][39][11].
3.6 CONCLUSIONS
In the present work, a new test method is developed to determine the carbonation kinetics of
the main synthetic phases present in the cement. Results allow us to draw the following
conclusions:
• An original experimental setup was developed in order to measure the instantaneous
CO2 binding rate (IBR) and determine the amount of bound CO2 during all periods of
carbonation. The test method is advantageous because of its simplicity and cost-
efficiency. Results from this test method agree with TGA results, which is promising
regarding the accuracy and reliability of the test method. However, the test method
could be improved by using sensors with lower response time and by increasing the
frequency of the CO2-uptake measurements to minimize the errors of the integration
step.
• The controlling factor of the amount of bound CO2 is the surface water-adsorbed, since
the CO2 binding capacity is found to increase with the RH under which carbonation
tests were undertaken.
• Portlandite carbonates significantly compared to other hydrates, even at low RH, and
the only carbonate formed is calcite. Ettringite carbonates remarkably at 93% RH
(DoC=45%) and only slightly at 55% and 33% RH. Even though the carbonation rate of
C-S-H is initially lower than that of portlandite, its carbonation continues with a constant
rate even after 28 days of exposure, especially at 93% RH.
• No significant carbonation of the anhydrous materials was noticed. The actual amount
of bound CO2 was found to be lower than the theoretical maximum binding capacity
calculated for all powders. Only at 93% RH, C3S powders were carbonated
(DoC=14%), which could be due to the formation of C-S-H as intermediate reaction
product at this high RH level.
• The maximum degree of carbonation (DoC = 45%) was observed for ettringite powder,
followed by portlandite (DoC = 38%) carbonated at 93% RH, which highlights the
important contribution of these two hydrates in the carbonation performance of
aluminous cements and Portland cements, respectively.

181
Extended abstract in French
I- Introduction
La durabilité d’un ouvrage en béton armé est en grande partie liée à l’aptitude du béton à
résister à la pénétration des agents agressifs. Le mécanisme de vieillissement des structures
le plus courant, et qui touche toutes les structures en contact avec l’air atmosphérique, est
sans aucun doute la carbonatation [240]. Ce processus physico-chimique entraine la baisse
du pH de la solution porale qui conduit à une dépassivation des aciers du béton armé [13].
Sans protection alcaline, les armatures sont exposées à un risque de corrosion.
Actuellement, les méthodes d’essais normalisées, couramment utilisées pour étudier la
carbonatation du béton, s’appuient sur l’évaluation qualitative de la chute du pH de la solution
interstitielle sur la section perpendiculaire à la surface d'un échantillon de béton exposé à des
concentrations ambiantes ou très élevées de CO2 (2% à 50% en volume). Ces méthodes sont
souvent critiquées, soit parce qu’elles nécessitent beaucoup de temps (plus d’une année pour
la carbonatation en conditions atmosphériques), soit parce qu’elles sont coûteuses et d’une
faible fiabilité (la carbonatation en conditions accélérées, notamment quand la concentration
en CO2 est supérieure à 3% CO2 [241]). Néanmoins, le test avec un indicateur coloré, comme
la phénolphtaléine, reste une technique pratique pour déterminer une profondeur de
carbonatation (qui correspond à un seuil de pH = 9), par comparaison à d’autres méthodes
(XRD, TGA), mais ses limites doivent être gardées présentes à l’esprit.
Deux mécanismes principaux pilotent la carbonatation : le transport diffusif du dioxyde de
carbone gazeux, qui est régi par le coefficient de diffusion effectif de cette molécule dans le
milieu poreux, et la consommation du CO2 une fois dissous par la masse de produits
carbonatables. Ces deux phénomènes sont à prendre en compte dans les modèles
scientifiques prédictifs de la durabilité des matériaux cimentaires [6][15].
Un manque de données expérimentales sur les propriétés que sont le coefficient de diffusion
du CO2 et la capacité de fixation du CO2 par le matériau ressort particulièrement lorsqu’on
veut utiliser des modèles de la littérature qui prennent en compte les conditions
environnementales [45]. Ce manque est dû principalement à l’absence de méthodes d’essais
simples et fiables pour la détermination de ces propriétés sous différents environnements
[242].
Le présent travail a pour but de développer deux nouvelles méthodes d’essai pour évaluer,
d’une part, le coefficient de diffusion effectif de gaz et, d’autre part, la masse de produits

182
carbonatables et la cinétique de fixation du CO2 de matériaux cimentaires. En outre, notre
objectif est de caractériser l’effet de différents paramètres sur ces deux propriétés, comme la
composition du matériau, la durée d’hydratation, l’état de carbonatation et l’humidité relative
ambiante. Toutes les données expérimentales ainsi obtenues sont analysées et discutées au
regard de la littérature, pour être finalement intégrées comme entrées de deux modèles de
prédictions de la profondeur de carbonatation [6][15].
II- Programme expérimental
2.1 Pâtes de ciments
Au cours de ce travail de thèse, le coefficient de diffusion effectif d'oxygène de neufs pâtes de
ciment durcies a été déterminé sous différentes conditions environnementales et à différentes
durées d'hydratation (Article I et II). Ce résumé présente un exemple de résultats obtenus sur
trois pâtes de ciment les plus couramment utilisées (Tableau 1). La pâte de ciment contient
l’essentiel de la porosité des mortiers et du béton ordinaire, et détermine ainsi dans une large
mesure leurs propriétés de transport. Au premier ordre, la fraction volumique de la pâte de
ciment permet le passage de la pâte au béton [173].
Pâtes de ciment Type de ciment Addition et
pourcentage de remplacement
E/L Humidité relative de pré-conditionnement
HD*_OPC_SF_W/B OPC 10% silica fume 1.6 (%vol)
Sec (Étuvage à
80°C)
33%, 55%, 76% et
93%
PC6 CEM I 52.5 N
- 0.60 33%, 55% et 93%
SL6 60% slag 0.60
Tableau 1: Trois pâtes de ciment testées au cours de ce travail
L'influence de la durée d'hydratation, l’humidité relative (HR) de pré-conditionnement, la
composition (rapport volumique eau sur liant et type de liant) et la carbonatation accélérée sur
le coefficient de diffusion effectif de l'oxygène est évalué. Pour ces matériaux à l’équilibre
hydrique à une HR donnée, nous avons aussi déterminé le degré de saturation en eau, la
distribution de la taille des pores et la porosité à l’eau, avant et après carbonatation accélérée.
La capacité de fixation du dioxyde de carbone de poudres des pâtes de ciments durcies et des
principaux anhydres (C2S, C3S, C3A) et hydrates (CH, C-S-H, AFt) a été déterminée à trois
niveaux d'humidité relative en utilisant la méthode d’essai que nous avons développée. Les
résultats obtenus sont comparés aux analyses thermogravimétrique (ATG) des mêmes

183
échantillons afin d’évaluer la fiabilité des résultats de la nouvelle méthode d’essai.
2.2 Bétons
Le coefficient de diffusion de trois bétons (Tableau 2) avant et après carbonatation accélérée
(1% CO2, 55% HR) a été déterminé après pré-conditionnement à 33%, 55% et 93% HR. La
masse de produits carbonatables des pâtes de ciment durcies équivalentes (fabriquées en
utilisant le rapport E/L effectif des bétons) a été déterminées avec la nouvelle méthode d’essai
décrite dans la partie 3.2. Les échantillons de béton ont été découpés dans des éprouvettes
de 22cm de longueur et 11cm de diamètre. Afin de pouvoir pré-conditionner et tester ces
échantillons de béton dans un temps raisonnable, l’épaisseur des échantillons testés varie
entre 8mm et 11mm. L’erreur liée à la dépendance de De,O2 à l’épaisseur de l’échantillon testé
est prise en compte dans [90].
C_PC C_FA C_LS
Rapport E/L 0.66 0.67 0.5
Air (%) 2 1.9 0.9
Type de ciment CEM I 52.5 R CEM I 52.5 R CEM I 52.5 R
Type d’addition - 30% Cendres
volantes 40% Filler calacaire
Gravillon 6/20.8 mm (kg/m3)
830 782 771
Sable (0/4mm) (kg/m3) 906 946 706
Classe de résistance C25/30 C25/30 C25/30
Ciment (kg/m3) 280 223 270
Tableau 2: Composition des trois des bétons testés

184
III- Méthodes d’essais développées
3.1 Cellule de diffusion d’oxygène
Le gaz choisi pour cette méthode d’essai est l’oxygène, puisque c’est un gaz inerte vis-à-vis
des matériaux cimentaires. La diffusion de l’oxygène n’entrainera pas de modifications de la
microstructure et permettra d’effectuer la mesure en un temps relativement court. La méthode
d’essai que nous avons développée pour la détermination du coefficient de diffusion de
l’oxygène consiste en la mesure de la concentration de l’oxygène de l’air qui diffuse à travers
un disque de matériau à l’intérieur d’une cellule de diffusion. Dans le cas des pâtes de ciment,
le disque a 4 mm de diamètre et 3±0.5 mm d’épaisseur. Dans le cas du béton, les échantillons
sont de 110 mm de diamètre et d’une épaisseur qui varie entre 5 mm et 50 mm [141]. Au
cours de l’acquisition, la cellule est mise dans une chambre climatique à 20°C et à humidité
relative contrôlée. L’équipement permet la lecture continue de la concentration en oxygène à
l’intérieur de la cellule de diffusion. Le coefficient de diffusion de l’oxygène est calculé à partir
de la courbe d’accumulation de la concentration de l’oxygène mesuré en fonction du temps
jusqu’à atteindre l’état stationnaire, c’est-à-dire une concentration de 20% d’O2 à l’intérieur de
la cellule.
L’élément essentiel de ce dispositif est la cellule de diffusion (Figure 66 a) qu’on appelle aussi
« chambre aval ». Il s’agit d’une cellule en polyéthylène haute densité (PEHD), étanche au
gaz, séparée de l’air ambiant de la chambre climatique par l’échantillon. Cette cellule est
purgée à l’azote en début d’essai, puis placée à l’intérieur d’une chambre climatique à 20°C.
L’humidité relative à l’intérieur de cette « chambre amont » est maintenue constante et égale à
celle de l’échantillon testé, afin de contrôler la saturation en eau de l’échantillon. Comme le
volume de la chambre amont est beaucoup plus grand que le volume cumulé de la cellule de
diffusion (68 ml et 209 ml pour les cellules pour pâtes de ciment et béton respectivement), le
séchage de l’échantillon pendant l’essai est négligeable (variation de masse <0.02%).
L’oxygène de l’air ambiant diffuse successivement à travers l’échantillon, puis dans la cellule
remplie initialement d’azote. Un capteur à l’intérieur de la cellule permet de mesurer la
concentration en oxygène en fonction du temps de façon continue.

185
(a)
(b)
(c)
Figure 66. (a) Cellule de diffusion d’oxygène pour pâtes de ciments hydratée ; (b) cellule de diffusion pour béton (c) ; courbes d’accumulation expérimentales et théoriques après minimisation automatique.
L’essai fournit comme résultat une courbe de diffusion : concentration en O2 en fonction du
temps (Figure 66 c). Le coefficient de diffusion effectif est calculé automatiquement à partir de
la courbe expérimentale à l’aide d’un programme en langage Python [178]. Ce dernier permet
de calculer directement le coefficient de diffusion d’oxygène en minimisant l’écart entre les
concentrations mesurées et celles calculées par résolution numérique de la deuxième loi de
Fick (Équation 1). Les données d’entrée nécessaires au calcul de minimisation sont les
concentrations en O2, les échéances de temps, les paramètres de configuration relatifs à
l’échantillon (saturation en eau, porosité et géométrie), à la cellule (géométrie, fuite), ainsi que
les concentrations initiales et aux limites.
Seconde loi de Fick ϕ(1 − Sl)∂C
∂t=
∂
∂x(De,O2
∂C
∂x) Équation 1
• Φ [-] et Sl [-] sont la porosité totale de l’échantillon et son degré de saturation en eau.

186
• De,O2 [m²/s] et C(%) sont le coefficient de diffusion effective de l’oxygène et la
concentration relative de ce gaz dans la cellule de diffusion.
L’étanchéité du dispositif expérimental a été évaluée en réalisant un test de fuite. Il s’agit de
mesurer la variation de concentration de l’oxygène à l’intérieur de la cellule en remplaçant
l’échantillon par un disque étanche en PEHD. Sous l’hypothèse d’un débit de fuite linéaire en
fonction du temps, nous avons mesuré un taux de fuite de 0.014% vol/heure, ce qui permet de
déterminer avec le dispositif des coefficients de diffusion allant jusqu’à 10-11 m²/s.
3.2 Capacité de fixation de CO2
La méthode d’essai de la capacité de fixation du CO2 consiste à exposer un échantillon en
poudre à une carbonatation naturelle sous une humidité relative donnée. 1 g de poudre est
uniformément et finement réparti sur un porte-échantillon (disque de 110 mm de diamètre
(Figure 67 (b)) pour se carbonater dans une chambre climatique (Figure 67 (a)). La
concentration en CO2 et l'humidité relative pendant la carbonatation de la poudre sont
maintenues constantes à l'aide d’un équipement qui permet la circulation de l’air ambiant
régulé à l’humidité relative de l’essai dans la chambre de carbonatation (Figure 67 (a)).
(a)
(b)
Figure 67: (a) Chambre climatique utilisée pendant la carbonatation naturelle de l’échantillon de poudre, (b) cellule de carbonatation [151]
La vitesse de fixation instantanée de CO2 par la poudre est mesurée dans une cellule fermée
ponctuellement à différentes périodes de carbonatation. La durée de cette mesure doit être
négligeable par rapport à la période de carbonatation globale de l'échantillon. Le temps de
fixation de CO2 étant proportionnel au volume de gaz, la cellule est équipée d'un piston qui

187
permet la variation de son volume interne de 10 ml à 285 ml. Pour les poudres très réactives
avec le CO2, le volume de la cellule est réglé à sa valeur maximale et inversement. La mesure
totale avec la cellule fermée n’a pas dépassé 7 heures pour un temps total de carbonatation
dans un système ouvert d’environ 28 jours. La fréquence de la mesure de la fixation de CO2
est d’une fois par jour la première semaine et est ensuite adaptée en fonction de l'évolution
temporelle du taux de carbonatation. La concentration de CO2 à l'intérieur de la cellule est
mesurée à l'aide d'un capteur d'absorption infrarouge qui mesure également l'humidité relative
et la température.
La pente des courbes de fixation de CO2 en fonction du temps est déterminée à l'aide d'un
logiciel d'analyse de données (JMP). La pente mesurée (en ppm/s) est convertie en un taux
instantané de fixation de CO2 IBR (exprimée en gCO2.gcement.s-1) selon l'Équation 2, où P, MCO2,
Vg, R, T sont respectivement la pression ambiante, la masse molaire du dioxyde de carbone,
le volume intérieur de la cellule de carbonatation, la constante des gaz parfaits, et la
température ambiante. m0 est la masse de l'échantillon testée sans CO2 lié ni eau, corrigée
par les résultats de l’ATG réalisés après le pré-conditionnement des poudres.
IBR = Slope ∗ P ∗ MCO2 ∗ Vg
R ∗ T ∗ m0 Équation 2
B_CO2 = ∫ IBR dtT
t=0
Équation 3
carbonatable mass =CBC ∗ cement dosage
MCO2
Équation 4
La quantité de CO2 fixé à différentes échéances d’exposition de carbonatation est déterminée
selon l’Équation 3 en intégrant la valeur d’IBR sur la durée totale de carbonatation T. Ainsi, la
masse de produits carbonatables est déduite de la quantité de CO2 fixé à la fin des essais de
carbonatation en utilisant Équation 4.

188
IV- Résultats principaux
4.1 Validation des méthodes d’essais
La Figure 68 (a) montre cinq boîtes à moustaches correspondant chacune au coefficient de
variation des coefficients de diffusion déterminés expérimentalement après le pré-
conditionnement des échantillons de pates de ciment dans cinq états: séchés au four (105 °
C), équilibrés à une humidité relative (HR) de 33% et à 55%, entre 76% et 86% et à 93% HR.
Pour chaque catégorie, nous disposons des quantités de données suivantes d’échantillons de
pâtes, c’est-à-dire respectivement 18, 30, 26, 24 et 21 valeurs.
L'espacement à l'intérieur de chaque boite indique le degré de dispersion du coefficient de
variation, qui dépend clairement de l'état de pré-conditionnement. La valeur moyenne du
coefficient de variation varie de 9% à l'état sec à 48% lorsque l'échantillon de béton est pré-
conditionné à 93% HR. Notons que la courte période de pré-conditionnement (en raison du
critère d'équilibre de masse <0,05% sur une semaine) pourrait également entraîner une
dispersion plus importante des données à cause d’une distribution hétérogène de l’eau dans
l’espace poreux.
La Figure 68 (b) compare le degré de carbonatation (DoC) déterminé à l'aide de la méthode
de suivi de la carbonatation développée dans nos travaux aux DoC déterminés par ATG. Les
résultats sont cohérents, ce qui met en évidence la précision des mesures avec la méthode
développée, car les résultats d’ATG sont une preuve de la réaction de carbonatation. Ce
résultat est prometteur quant à l’exactitude et à la fiabilité de la nouvelle méthode d’essai.
Cela prouve que l’analyse des courbes d’absorption de CO2 correspond bien à la réaction de
carbonatation.

189
(a)
(b)
Figure 68: (a) Coefficient de variation du coefficient de diffusion d’oxygène en fonction de l’humidité relative (b) Capacité de fixation du CO2 déterminé avec la cellule de carbonatation en fonction de la capacité de fixation déterminée par ATG
4.2 Influence de la carbonatation et de l’hydratation sur les propriétés des
matériaux testés
Sur la Figure 69, chaque valeur du coefficient de diffusion effectif de l’oxygène est la moyenne
géométrique de trois coefficients de diffusion. La Figure 69 (a) montre que le coefficient de
diffusion effectif de l'oxygène dépend à la fois du degré de saturation correspondant à
l'humidité relative du préconditionnement et de l'état de carbonatation. De,O2 des pâtes PC6
diminue d'un facteur 3 à 33% et 55% d’humidité relative et augmente d’un facteur de 21 à
93% HR à l’état carbonaté. Alors que le coefficient de diffusion a augmenté après
carbonatation d'un facteur de 4, 9 et 93 à 33%, 55% et 93% HR respectivement. La
distribution de la taille des pores de ces matériaux a été évaluée dans l’article II. Une
distribution de la taille des pores plus grossière est remarquée après carbonatation, ce qui
cause une diminution du degré de saturation en eau des échantillons carbonatés notamment
quand on les préconditionne à 93%HR. De plus, le coefficient de diffusion est bien corrélé au
diamètre moyen des pores des pâtes de ciment testées, lorsque le degré de saturation en eau
est inférieur à 30% (voir section 4.1.2 iv) ). Ce résultat est établi pour les pâtes de ciment
carbonatées et non carbonatées, ce qui prouve la dépendance directe de la diffusivité de
l’oxygène à la distribution de la taille des pores et au degré de saturation en eau.
0%
20%
40%
60%
80%
100%
120%
140%
160%
dry (80°C) 33% 55% 76-86% 93%
Coefficient de
variation
HR de préconditionnement
min
max
mediane

190
(a)
(b)
Figure 69: (a) Influence de la carbonatation sur De,O2 à différents degrés de saturation en eau et (b) influence de la durée d’hydratation sur De,O2 (S = 7 jours, 2M = 2 mois, 8M = 8 mois).
La Figure 69 (b) présente le coefficient de diffusion effectif de l’oxygène en fonction de
l’humidité relative des échantillons hydratés pendant 7 jours (S), 2 mois (2M) et 8 mois (8M).
Une durée de cure plus longue engendre une diminution significative du coefficient de
diffusion de l’oxygène (De,O2 diminue jusqu’à trois ordres de grandeur). En effet, une cure plus
longue favorise la formation d’une plus grande quantité d’hydrates (notamment les C-S-H) qui
viennent combler et fractionner davantage la porosité capillaire [243]. Le coefficient de
diffusion dépend fortement de l’humidité relative de l’échantillon. Cette dépendance est plus
importante lorsque l’échantillon est bien hydraté. Plus l’humidité relative est élevée, plus les
pores sont remplis d’eau ; le réseau poreux de l’échantillon accessible au transport de
l’oxygène devient discontinu et l’échantillon est donc moins diffusif. L’influence du rapport eau
sur liant sur le coefficient de diffusion de ces pâtes de ciment a été évaluée dans nos travaux
précédents (Article I). De,O2 augmente avec le rapport eau/liant (E/L) (de 1,6 à 1,9 en
volumique). Ce résultat est en accord avec les recherches de [158] qui explique que, pour un
E/L plus faible, la porosité capillaire est constituée d’un réseau de pores plus fin et plus
discontinu.
4.3 Capacité de fixation de CO2 à différentes HR
La Figure 70 présente l'évolution de la vitesse instantanée de fixation du CO2 (IBR) en
fonction du degré de carbonatation (DoC) à trois niveaux d'humidité relative pour deux phases
1E-11
1E-10
1E-09
1E-08
1E-07
1E-06
0% 20% 40% 60% 80% 100%
Oxy
gen
eff
ect
ive
dif
fusi
on
co
eff
icie
nt
(m²/
s)Degree of water saturation
PC6_BC
PC6_C
SL6_BC
SL6_C
5E-11
1E-11
1E-10
1E-09
1E-08
1E-07
1E-06
0% 20% 40% 60% 80% 100%
De
,O2
(m
²/s)
Degree of water saturation
S_OPC_SF_1.6
2M_OPC_SF_1.6
8M_OPC_SF_1.6

191
synthétisées (CH et C3S) et deux pâtes de ciment hydratées (PC6 et SL6).
Figure 70: Variation de la vitesse instantanée de fixation du CO2 (IBR) en fonction du degré de carbonatation à trois niveaux d'humidité relative.
La Figure 70 montre que le degré de carbonatation des matériaux synthétisés augmente avec
l'humidité relative sous laquelle les essais de carbonatation sont effectués. Ce résultat est
attendu car la cinétique de la réaction de carbonatation est contrôlée par la dissolution de CO2
et du CaO. Dans le cas du C3S, la carbonatation est très faible à 33% et 55% HR, alors qu’à
93%HR le degré de carbonatation atteint 14%. Cela pourrait être dû à une hydratation du C3S
à ce niveau d’humidité relative (voir article III).
Le degré de carbonatation maximal est observé à 55% HR pour les pâtes de ciment
hydratées. Notons aussi que le degré de carbonatation au début des mesures était non nul, à
cause d’une carbonatation pendant le préconditionnement de ces matériaux pendant 15 jours,
alors que de la chaux sodée avait été introduite dans la chambre climatique pour réduire au
maximum la concentration en CO2.
V- Modélisation de la profondeur de carbonatation
L’ensemble des données obtenues grâce aux essais de diffusion d’oxygène et de
1E-10
1E-09
1E-08
1E-07
1E-06
0% 20% 40%
IBR
( g
co2.g
pow
der-1
.s-1
)
Degree of carbonation (DoC)
CH_33%RHCH_55%RHCH_93%RH 1E-10
1E-09
1E-08
1E-07
1E-06
0% 5% 10% 15%
IBR
( g
co2.g
pow
der-1
.s-1
)
Degree of carbonation (DoC)
C3S_33%RH
C3S_55%RH
C3S_93%RH
1E-11
1E-10
1E-09
1E-08
1E-07
1E-06
0% 20% 40% 60%
IBR
( g
co2.g
pow
der-1
.s-1
)
Degree of carbonation (DoC)
PC6_33%RHPC6_55%RHPC6_93%RH 1E-11
1E-10
1E-09
1E-08
1E-07
1E-06
10% 30% 50%
IBR
( g
co2.g
pow
der-1
.s-1
)
Degree of carbonation (DoC)
SL6_33%RHSL6_55%RHSL6_93%RH

192
détermination de la masse de produits carbonatables a été utilisé comme données d’entrée
dans deux modèles de prédiction de la profondeur de carbonatation [6][15]. Les profondeurs
ainsi calculées ont été comparées à des profondeurs de carbonatation déterminées
expérimentalement sur des échantillons de pâte et béton, mis en carbonatation naturelle ou
accélérée pendant plusieurs mois. Les profondeurs de carbonatation expérimentales ont été
mises en évidence avec un indicateur de pH (phénolphtaléine).
Les Figure 71 (a) et (b) comparent les profondeurs expérimentales aux résultats obtenus
avec le modèle de Papadakis (section 5.4). Le modèle sous-estime les profondeurs obtenues
expérimentalement. On note néanmoins une corrélation entre résultats d’essai et valeurs
calculées (erreur 31% et 37% pour les résultats de la Figure 71 (a) et (b) respectivement).
Cette corrélation est meilleure quand on utilise le coefficient de diffusion d’échantillons
carbonatés plutôt que celui déterminé sur échantillons non carbonatés.
(a)
(b)
(c)
(d)
y = x
0E+0
2E-3
4E-3
6E-3
8E-3
1E-2
0E+0 2E-3 4E-3 6E-3 8E-3 1E-2Xc
(m)
Pap
adak
is (
De,
O2
car
bo
nat
ed H
CP
an
d C
BC
fro
m c
ell)
Xc (m) pH-indicator
PC6FA6LS6SL6MK45
y = x
0E+0
2E-3
4E-3
6E-3
8E-3
1E-2
0E+0 2E-3 4E-3 6E-3 8E-3 1E-2Xc
(m)
Pap
adak
is (
De,
O2
no
n-c
arb
on
ated
H
CP
an
d C
BC
fro
m c
ell)
Xc (m) pH-indicator
PC6FA6LS6SL6
MK45
y = x
0
10
20
30
0 10 20 30
Xc
(mm
) P
apad
akis
' mo
del
(D
e,O
2 o
f ca
rbo
nat
ed C
co
ncr
ete)
Xc (mm) pH-indicator (Accelerated carbonation)
C_PCC_FAC_LS
y = x
0
10
20
30
0 10 20 30
Xc
(mm
) P
apad
akis
' mo
del
(D
e,O
2 o
f N
on
-car
bo
nat
ed )
Xc (mm) pH-indicator (accelerated carbonation)
C_PCC_FAC_LS

193
Figure 71: Comparaison de profondeurs de carbonatation déterminées expérimentalement (indicateur de pH) et de profondeurs calculés avec le modèle de Papadakis en utilisant nos résultats de De,O2 et produits carbonatables comme données d’entrée.
Les Figure 71 (c) et (d) comparent les profondeurs de carbonatation expérimentales aux
résultats du modèle de Papadakis dans le cas de trois bétons exposée à une carbonatation
accélérée (3% CO2, 65% HR). On note cette fois que le modèle surestime la profondeur d’un
facteur de 2.0 et 1.5, en utilisant les résultats des échantillons carbonatés et non carbonatés
respectivement.
VI- Conclusion
Deux méthodes d’essai ont été développées pour déterminer la diffusivité de l'oxygène et la
capacité de fixation du CO2. Ces méthodes sont capables de reproduire des résultats de la
littérature, comme une diminution de la diffusivité de l’oxygène avec le degré de saturation en
eau et la durée d’hydratation, ou encore une dépendance de la quantité de produits
carbonatables à l’humidité relative ambiante.
Les principaux résultats de nos travaux, peuvent être les suivants :
• Le coefficient de diffusion effectif de l'oxygène de matériaux carbonatés dépend moins
de l'humidité relative du pré-conditionnement que le coefficient des mêmes matériaux
avant carbonatation.
• La capacité et la vitesse de fixation du CO2 par carbonatation dépendent fortement de
l'humidité relative et de la composition du matériau. Le processus de carbonatation est
fortement ralenti avant que les produits carbonatables ne soient consommés.
A l’aide des méthodes développées, la diffusivité de l'oxygène et la quantité de produits
carbonatables peuvent être déterminées de manière fiable, sur une durée d’essai courte par
comparaison aux essais de carbonatation naturelle (au plus 8 semaines au lieu de 1 an ou
plus). Ces propriétés pourraient servir de données d’entrée à des modèles de prédiction de la
profondeur de carbonatation basés sur la loi de Fick. Si prometteuse soit-elle, cette approche
doit encore être confortée par une confrontation entre les résultats de tels modèles et des
profondeurs de carbonatation naturelle obtenues sur des durées significatives.

194
REFERENCES
[1] J. Olumuyiwa Ikotun, Effects of concrete quality and cover depth on carbonation-induced reinforcement corrosion and initiation of concrete cover cracking in reinforced concrete structures, PhD thesis. University of the Witwatersrand, Johannesburg, 2017.
[2] L.J. Parrott, Some effects of cement and curing upon carbonation and reinforcement corrosion in concrete, Mater. Struct. 29 (1996) 164–173.
[3] M.R. Jones, R.K. Dhir, M.D. Newlands, A.M.O. Abbas, A study of the CEN test method for measurement of the carbonation depth of hardened concrete, Mater. Struct. 33 (2000) 135–142.
[4] Comité génie civil et bâtiment, Le patrimoine des ouvrages d’art en France : Entretien et surveillance, 2018.
[5] AFNOR, Norme XP P18-458, Essai pour béton durci – Essai de carbonatation accélérée - Mesure de l’épaisseur de béton carbonaté, 2008.
[6] V.G. Papadakis, C.G. Vayenas, M.N. Fardis, A reaction engineering approach to the problem of concrete carbonation, AIChE J. 35 (1989) 1639–1650.
[7] M. Thiery, Modélisation de la carbonatation atmosphérique des matériaux cimentaires : Prise en compte des effets cinétiques et des modifications microstructurales et hydriques. PhD thesis, Ecole nationale des ponts et chaussées, 2005.
[8] C.D. Lawrence, Transport of oxygen through concrete, in: Br. Ceram. Proc., 1984: pp. 277–293.
[9] J. Sercombe, R. Vidal, C. Gallé, F. Adenot, Experimental study of gas diffusion in cement paste, Cem. Concr. Res. 37 (2007) 579–588.
[10] Y.F. Houst, F.H. Wittmann, Diffusion de gaz et durabilité du béton armé, in: IABSE Symp. Durab. Struct., Lisbon, 1989: pp. 139–144.
[11] L.J. Parrott, D.C. Killoh, Carbonation in a 36 year old, in-situ concrete, Cem. Concr. Res. 19 (1989) 649–656.
[12] L. Bertolini, M. Carsana, M. Gastaldi, F. Lollini, E. Redaelli, Corrosion of Steel in Concrete and Its Prevention in Aggressive Chloride-Bearing Environments, in: 5th Int. Conf. Durablity Concr. Struct., Shenzhen, China, 2016.
[13] K. Tuutti, Corrosion of steel in concrete, PhD thesis, Royal Institute of Technology, Stockholm, 1982.
[14] W. Ashraf, J. Olek, V. Atakan, Carbonation Reaction Kinetics, CO2 Sequestration Capacity, and Microstructure of Hydraulic and Non-Hydraulic Cementitious Binders, in: Fourth Int. Conf. Sustain. Constr. Mater. Technol., Las Vegas, USA, 2016.
[15] C. Gehlen, Probabilistische Lebensdauerbemessung von Stahlbetonbauwerken-Zuverlässigkeitsbetrachtungen zur wirksamen Vermeidung von Bewehrungskorrosion, PhD thesis. RWTH Aachen, 2000.
[16] S. Von Greve-dierfeld, C. Gehlen, Performance based durability design , carbonation part 1 – Benchmarking of European present design rules, Struct. Concr. 17 (2016) 309–328.
[17] S.W. Webb, K. Pruess, The use of Fick’s law for modeling trace gas diffusion in porous media, Transp. Porous Media. 51 (2003) 327–341.
[18] V.G. Papadakis, C.G. Vayenas, M.N. Fardis, Physical and chemical characteristics affecting the

195
durability of concrete, ACI Mater. J. 8 (1991) 186–196.
[19] Y. Xi, Z.P. Bazant, L. Molina, H.M. Jennings, Moisture diffusion in cementitious materials, Advn. Cem. Bas. Mat. 1 (1994) 258–266.
[20] M. Auroy, Impact de la carbonatation sur les propriétés de transport d’eau des matériaux cimentaires. PhD thesis, Université Paris-Est, 2014.
[21] H.F.W. Taylor, Cement Chemistry, 2nd ed, Thomas Telford Publishing, 1997.
[22] J. Sun, Carbonation Kinetics of Cementitious Materials Used in the Geological Disposal of Radioactive Waste, PhD thesis. University College London, 2010.
[23] T. Grounds, H.G. Midgley, D.V. Nowell, Carbonation of ettringite by atmospheric carbon dioxide, Thermochim. Acta. 135 (1988) 347–352.
[24] A. Morandeau, Carbonatation atmosphérique des systèmes cimentaires a faible teneur en portlandite, PhD thesis. Universite Paris-Est, 2013.
[25] P. López-Arce, L.S. Gómez-Villalba, S. Martínez-Ramírez, M. Álvarez de Buergo, R. Fort, Influence of relative humidity on the carbonation of calcium hydroxide nanoparticles and the formation of calcium carbonate polymorphs, Powder Technol. 205 (2011) 263–269.
[26] Y.B. Hu, M. Wolthers, D.A. Wolf-Gladrow, G. Nehrke, Effect of pH and phosphate on calcium carbonate polymorphs precipitated at near-freezing temperature, Cryst. Growth Des. 15 (2015) 1596–1601.
[27] A.V. Radha, T.Z. Forbes, C.E. Killian, P.U.P.A. Gilbert, A. Navrotsky, Transformation and crystallization energetics of synthetic and biogenic amorphous calcium carbonate, Proc. Natl. Acad. Sci. 107 (2010) 16438–16443.
[28] M. Balonis, F.P. Glasser, The Density of Cement Phases, Cem. Concr. Res. (2009) 1–61.
[29] E. Hamza, Contribution à l’étude des eaux géothermales du sud tunisien : etude des mecanismes et de la prevention des phenomenes d’entartrage, PhD thesis. L’Institut National des Sciences Appliquées de Toulouse, 1999.
[30] Q.. Phung, N. Maes, D. Jacques, E. Bruneel, I. Van Driessche, G. Ye, G. De Schutter, Effect of limestone fillers on microstructure and permeability due to carbonation of cement pastes under controlled CO2 pressure conditions, Constr. Build. Mater. 82 (2015) 376–390.
[31] B. Šavija, M. Luković, Carbonation of cement paste: Understanding, challenges, and opportunities, Constr. Build. Mater. 117 (2016) 285–301.
[32] S. Zdenek, Carbonization of porous concrete and its main binding components, Cem. Concr. Res. I (1971) 645–662.
[33] E.T. Stepkowska, J.L. Pérez-Rodríguez, M.J. Sayagués, J.M. Martínez-Blanes, Calcite, vaterite and aragonite forming on cement hydration from liquid and gaseous phase, J. Therm. Anal. Calorim. 73 (2003) 247–269.
[34] G. Wolf, C. Günther, Thermophysical investigations of the polymorphous phases of calcium carbonate, J. Therm. Anal. Calorim. 65 (2001) 687–698.
[35] V. Shah, K. Scrivener, B. Bhattacharjee, S. Bishnoi, Changes in microstructure characteristics of cement paste on carbonation, Cem. Concr. Res. 109 (2018) 184–197.
[36] W. Soja, H. Maraghechi, F. Georget, K. Scrivener, Changes of microstructure and diffusivity in

196
blended cement pastes exposed to natural carbonation, in: MATEC Web Conf. ICCRRR, Cape Town, South Africa, 2018: p. 199.
[37] P. Van den Heede, M. De Schepper, N. De Belie, Accelerated and natural carbonation of concrete with high volumes of fly ash: chemical, mineralogical and microstructural effects, R. Soc. Open Sci. 6 (2019).
[38] S.T. Pham, W. Prince, Effects of Carbonation on the Microstructure and Macro Physical Properties of Cement Mortar, Int. J. Civ. Environ. Eng. 7 (2013) 434–437.
[39] M. Thiery, G. Villain, P. Dangla, G. Platret, Investigation of the carbonation front shape on cementitious materials: Effects of the chemical kinetics, Cem. Concr. Res. 37 (2007) 1047–1058.
[40] J.H. Seo, I.T. Amr, S.M. Park, R.A. Bamagain, B.A. Fadhel, G.M. Kim, A.S. Hunaidy, H.K. Lee, CO2 uptake of carbonation-cured cement blended with ground volcanic ash, Materials (Basel). 11 (2018).
[41] R. Miragliotta, Modélisation des processus physico-chimiques de la carbonatation des bétons préfabriqués - prise en compte des effets de paroi, PhD thesis. La Rochelle université, 2000.
[42] R.M. Lawrence, T.J. Mays, S.P. Rigby, P. Walker, D. D’Ayala, Effects of carbonation on the pore structure of non-hydraulic lime mortars, Cem. Concr. Res. 37 (2007) 1059–1069.
[43] V.T. Ngala, C.L. Page, Effect of carbonation on pore structure and diffusional properties of hydrated cement pastes, Cem. Concr. Res. 27 (1997) 995–1007.
[44] G. Villain, M. Thiery, Impact of carbonation on microstructure and transport properties of concrete, in: 10DBMC Int. Conférence Durab. Build. Mater. Components, Lyon , France, 2005.
[45] M. Thiéry, P. Faure, A. Morandeau, G. Platret, J. Bouteloup, P. Dangla, V. Baroghel-Bouny, P. Dangla, Effect of carbonation on the microstructure and the moisture properties of cement-based materials, in: Int. Conf. Durab. Build. Mater. Components, Porto - Portugal, 2011.
[46] M. Bertin, Impact du séchage au jeune âge sur la carbonatation des matériaux cimentaires avec additions minérales, PhD thesis. Université Paris-Est marne la vallée, 2017.
[47] D.J. Anstice, C.L. Page, M.M. Page, The pore solution phase of carbonated cement pastes, Cem. Concr. Res. 35 (2005) 377–383.
[48] O. Omikrine Metalssi, A. Aït-Mokhtar, P. Turcry, B. Ruot, Consequences of carbonation on microstructure and drying shrinkage of a mortar with cellulose ether, Constr. Build. Mater. 34 (2012) 218–225.
[49] E. Brunauer, Stephen; Emmett, P. H.; Teller, Adsorption of Gases in Multimolecular Layers, J. Am. Chem. Soc. (1938) 309–319.
[50] H. Ranaivomanana, Transferts dans les milieux poreux réactifs non saturés : application à la cicatrisation de fissure dans les matériaux cimentaires par carbonatation, PhD thesis. Université Toulouse III - Paul Sabatier, 2010.
[51] M. Auroy, S. Poyer, P. Le Bescop, J. Torrenti, T. Charpentier, M. Moskura, X. Bourbon, Impact of carbonation on unsaturated water transport properties of cement-based materials, Cem. Concr. Res. 74 (2015) 44–58.
[52] V. Dutzer, W. Dridi, S. Poyet, P. Le Bescop, X. Bourbon, The link between gas diffusion and carbonation in hardened cement pastes, Cem. Concr. Res. 123 (2019) 105795.
[53] N. Hyvert, Application de l’approche probabiliste à la durabilité des produits préfabriqués en béton, PhD thesis. Université Paul Sabatier - Toulouse III, 2009.

197
[54] P.H.R. Borges, J.O. Costa, N.B. Milestone, C.J. Lynsdale, R.E. Streatfield, Carbonation of CH and C-S-H in composite cement pastes containing high amounts of BFS, Cem. Concr. Res. 40 (2010) 284–292.
[55] T. Tracz, T. Zdeb, Effect of hydration and carbonation progress on the porosity and permeability of cement pastes, Materials (Basel). 12 (2019) 192.
[56] H.S. Wong, M. Zobel, N.R. Buenfeld, R.W. Zimmerman, Influence of the interfacial transition zone and microcracking on the diffusivity, permeability and sorptivity of cement-based materials after drying, Mag. Concr. Res. 61 (2009) 571–589.
[57] B. Huet, Comportement à la corrosion des armatures dans un béton carbonaté . Influence de la chimie de la solution interstitielle et d ’une barrière de transport, PhD thesis. INSA Lyon, 2005.
[58] A. Belda Revert, K. De Weerdt, K. Hornbostel, M.R. Geiker, Carbonation-induced corrosion: Investigation of the corrosion onset, Constr. Build. Mater. 162 (2018) 847–856.
[59] P.F. Marques, C. Chastre, Â. Nunes, Carbonation service life modelling of RC structures for concrete with Portland and blended cements, Cem. Concr. Compos. 37 (2013) 171–184.
[60] T. El Maaddawy, K. Soudki, A model for prediction of time from corrosion initiation to corrosion cracking, Cem. Concr. Compos. 29 (2007) 168–175.
[61] F. Hunkeler, L. Lammar, Anforderungen an den Karbonatisierungswiderstand von Betonen, Schweizerischer Verband der Strassen- und Verkehrsfachleute (VSS), 2012.
[62] S. Lay, P. Schiessl, Service life models - Instructions on methodology and application of models for the prediction of the residual service life for classified environmental loads and types of structures in Europe, Report, cbm – Technische Universität München, 2004.
[63] I.S. Yoon, O. Çopuroǧlu, K.B. Park, Effect of global climatic change on carbonation progress of concrete, Atmos. Environ. 41 (2007) 7274–7285.
[64] R.R. Hussain, T. Ishida, M. Wasim, Experimental investigation of time dependent non-linear 3D relationship between critical carbonation depth and corrosion of steel in carbonated concrete, Corros. Eng. Sci. Technol. 46 (2011) 657–660.
[65] M. Limbachiya, M.S. Meddah, Y. Ouchagour, Use of recycled concrete aggregate in fly-ash concrete, Constr. Build. Mater. 27 (2012) 439–449.
[66] R. Sander, Compilation of Henry’s law constants (version 4.0) for water as solvent, Atmos. Chem. Phys. 15 (2015) 4399–4981.
[67] R.K. Dhir, M.C. Limbachiya, M.J. McCarthy, A. Chaipanich, Evaluation of Portland limestone cements for use in concrete construction, Mater. Struct. 40 (2007) 459–473.
[68] A. Leemann, P. Nygaard, J. Kaufmann, R. Loser, Relation between carbonation resistance, mix design and exposure of mortar and concrete, Cem. Concr. Compos. 62 (2015) 33–43.
[69] Y. Yan, T. Guanbao, W. Ling, C. Suping, C. Yin, Difference between natural and accelerated carbonation of concrete at 2 % CO2 and 20 % CO2, Rom. J. Mater. 48 (2018) 70–75.
[70] S.A. Bernal, J.L. Provis, D.G. Brice, A. Kilcullen, P. Duxson, J.S.J. Van Deventer, Accelerated carbonation testing of alkali-activated binders significantly underestimates service life: The role of pore solution chemistry, Cem. Concr. Res. 42 (2012) 1317–1326.
[71] N. Hyvert, A. Sellier, F. Duprat, P. Rougeau, P. Francisco, Dependency of C-S-H carbonation rate on CO2 pressure to explain transition from accelerated tests to natural carbonation, Cem. Concr. Res. 40 (2010) 1582–1589.

198
[72] M. Castellote, C. Andrade, X. Turrillas, J. Campo, G.J. Cuello, Accelerated carbonation of cement pastes in situ monitored by neutron diffraction, Cem. Concr. Res. (2008).
[73] M.R. Jones, M.D. Newlands, A. Abbas, Carbonation Testing Of Hardened Concrete And The Effect Of Cement Type, in: 9th Int. Conf. Durab. Build. Mater. Components, Brisbane, Australia, 2002.
[74] A. Leemann, F. Moro, Carbonation of concrete - the role of CO2 concentration, relative humidity and CO2 buffer capacity, Mater. Struct. 50 (2017).
[75] BS EN 14629, Products and systems for the protection and repair of concrete structures - Test methods - Determination of chloride content in hardened concrete, Br. Stand. (2007).
[76] W. Le Tang, H.S. Lee, V. Vimonsatit, T. Htut, J.K. Singh, W.N.F.W. Hassan, M.A. Ismail, A.H. Seikh, N. Alharthi, Optimization of micro and nano palm oil fuel ash to determine the carbonation resistance of the concrete in accelerated condition, Materials (Basel). 12 (2019).
[77] Iso 1920-12:2015 (E), Determination of the carbonation resistance of concrete — Accelerated carbonation method, 2015.
[78] SIA 262/1:2013, Concrete Structures Supplementary specifications. Appendix I Carbonation resistance, 2013.
[79] NT Build 357, Concrete, Repairing Materialsand Protective Coating: Carbonation resistance, (1984).
[80] D. Cui, W. Sun, N. Banthia, Use of tomography to understand the influence of preconditioning on carbonation tests in cement-based materials, Cem. Concr. Compos. 88 (2018) 52–63.
[81] EN 12390-12:2018-10, Determination of the carbonation resistance of concrete – Accelerated carbonation method, 2018.
[82] N. Rafaï, H. Hornain, G. Villain, V. Baroghel Bouny, G. Platret, T. Chaussadent, Comparaison et validité des méthodes de mesure de la carbonatation, Rev. Française Génie Civ. 6 (2002) 251–274.
[83] V.G. Papadakis, C.G. Vayenas, M.N. Fardis, Experimental Investigation and Mathematical-Modeling of the Concrete Carbonation Problem, Chem. Eng. Sci. 46 (1991) 1333–1338.
[84] International Federation for Structural Concrete, MC-SLD:2006. Model Code for Service Life Design, in: Model Code Bull. 34, 2006: p. 116.
[85] C. Peretti, A. Leemann, R. Loser, P. Lura, Influence of Different Conditioning Regimes on the Oxygen Diffusion and Oxygen Permeability of Concrete, in: 2nd Int. Conf. Microstruct. Relat. Durab. Cem. Compos., Amsterdam, 2012.
[86] H.S. Wong, N.R. Buenfeld, M.K. Head, Estimating transport properties of mortars using image analysis on backscattered electron images, Cem. Concr. Res. 36 (2006) 1556–1566.
[87] Y.F. Houst, Diffusion de gaz, carbonatation et retrait de la pate de ciment durcie, PhD thesis. Ecole polytechnique federale de Lausanne, 1992.
[88] K.D. Namoulniara, Etude expérimentale de la diffusion du CO2 et des cinétiques de carbonatation de matériaux cimentaires à faible dosage en clinker, PhD thesis. La Rochelle université, 2015.
[89] F. Gendron, Carbonatation des matériaux cimentaires Étude de la diffusion du CO2, PhD thesis. La Rochelle université, 2019.
[90] F. Gendron, M. Boumaaza, P. Turcry, B. Huet, A. Aït-Mokhtar, Gas Diffusion in Cementitious Materials: Test Methods Review, in: SynerCrete’18 Int. Conf. Interdiscip. Approaches Cem. Mater. Struct. Concr., Funchal - Madeira, 2018.

199
[91] A. Leemann, R. Loser, B. Münch, P. Lura, Steady-state O2 and CO2 diffusion in carbonated mortars produced with blended cements, Mater. Struct. 50 (2017) 247.
[92] C. Boher, Etude expérimentale et modélisation de la diffusion gazeuse à travers des milieux poreux partiellement saturés en eau. Application aux verres Vycor, géopolymères et pâtes de ciment CEMV., Université de Toulouse, 2012.
[93] T.-H. VU, Caractérisation de la phase solide et transferts de gaz dans les milieux poreux insaturés. Etude expérimentale et modélisation appliquées à la diffusion de l’hydrogène dans les matériaux cimentaires, PhD thesis.Université de Toulouse, 2009.
[94] D. Benavente, C. Pla, Effect of pore structure and moisture content on gas diffusion and permeability in porous building stones, Mater. Struct. Constr. 51 (2018) 1–14.
[95] K. Namoulniara, P. Turcry, A. Aït-Mokhtar, Measurement of CO2 effective diffusion coefficient of cementitious materials, Eur. J. Environ. Civ. Eng. 2016. 8189 (2016).
[96] S.H. Jung, M.K. Lee, B.H. Oh, Measurement device and characteristics of diffusion coefficient of carbon dioxide in concrete, ACI Mater. J. 108 (2011) 589–595.
[97] K. Soukup, P. Schneider, O. Šolcová, Wicke-Kallenbach and Graham’s diffusion cells : Limits of application for low surface area porous solids, Chem. Eng. Sci. 63 (2008) 4490–4493.
[98] K. Soukup, P. Schneider, O. Šolcová, Comparison of Wicke-Kallenbach and Graham’s diffusion cells for obtaining transport characteristics of porous solids, Chem. Eng. Sci. 63 (2008) 1003–1011.
[99] C. Villani, R. Loser, M.J. West, C. Di Bella, P. Lura, W.J. Weiss, An inter lab comparison of gas transport testing procedures: Oxygen permeability and oxygen diffusivity, Cem. Concr. Compos. 53 (2014) 357–366.
[100] S. Peng, Q. Hu, S. Hamamoto, Diffusivity of rocks: Gas diffusion measurements and correlation to porosity and pore size distribution, Water Resour. Res. 48 (2012).
[101] K.H. Yang, E.A. Seo, S.H. Tae, Carbonation and CO2 uptake of concrete, Environ. Impact Assess. Rev. 46 (2014) 43–52.
[102] R.J. Millington, Gas Diffusion in Porous Media, Science, 130 (1959) 100–102.
[103] J.A. Currie, Gaseous diffusion in porous media Part 1. - A non-steady state method, Br. J. Appl. Phys. (1960).
[104] D.N. Huntzinger, J.S. Gierke, L.L. Sutter, S.K. Kawatra, T.C. Eisele, Mineral carbonation for carbon sequestration in cement kiln dust from waste piles, J. Hazard. Mater. 168 (2009) 31–37.
[105] R. Andersson, K. Fridh, H. Stripple, M. Häglund, Calculating CO2 uptake for existing concrete structures during and after service life, Environ. Sci. Technol. 47 (2013) 11625–11633.
[106] Y. Guo, C. Zhao, C. Li, Thermogravimetric analysis of carbonation behaviors of several potassium-based sorbents in low concentration CO2, J Therm Anal Calorim. 119 (2014) 441–451.
[107] G. Villain, M. Thiery, G. Platret, Measurement methods of carbonation profiles in concrete : Thermogravimetry, chemical analysis and gammadensimetry, Cem. Concr. Res. 37 (2007) 1182–1192.
[108] N.C. Collier, Transition and decomposition temperatures of cement phases – a collection of thermal analysis data, Ceramics-Silikaty. 60 (2016) 338–343.
[109] K.L. Scrivener, T. Füllmann, E. Gallucci, G. Walenta, E. Bermejo, Quantitative study of Portland

200
cement hydration by X-ray diffraction/Rietveld analysis and independent methods, Cem. Concr. Res. 34 (2004) 1541–1547.
[110] E. Possan, W.A. Thomaz, G.A. Aleandri, E.F. Felix, A.C.P. dos Santos, CO2 uptake potential due to concrete carbonation: A case study, Case Stud. Constr. Mater. 6 (2017) 147–161.
[111] B. Lagerblad, Carbon dioxide uptake during concrete life cycle-State of the art, Swedish Cement and Concrete Research Institute. CBI report, 2005.
[112] H.S. Lee, X.Y. Wang, Evaluation of the carbon dioxide uptake of slag-blended concrete structures, considering the effect of carbonation, Sustain. 8 (2016).
[113] K. Van Balen, Carbonation reaction of lime, kinetics at ambient temperature, Cem. Concr. Res. 35 (2005) 647–657.
[114] F. Georget, A Reactive Transport Simulator for Cement Pastes, PhD thesis. Princeton University, 2017.
[115] I. Galan, C. Andrade, Comparison of Carbonation Models, in: 3rd Int. RILEM PhD Student Work. Model. Durab. Reinf. Concr., University of Minho, Guimarães, Portugal, 2009.
[116] M.M.Y. Delmi, Etude de l’hydratation et du couplage carbonatation-échanges hydriques dans les mortiers et bétons, PhD thesis. La Rochelle université, 2004.
[117] O. Omikrine Metalssi, Pour obtenir Étude des couplages hydratation-échanges hydriques- carbonatation dans les mortiers modifiés polymères Remerciements, PhD thesis. La Rochelle université, 2006.
[118] A. Younsi, Carbonatation de bétons à forts taux de substitution du ciment par des additions minérales, PhD thesis. Université de La Rochelle, 2012.
[119] O. Omikrine Metalssi, A. Aït-Mokhtar, P. Turcry, A proposed modelling of coupling carbonation-porosity-moisture transfer in concrete based on mass balance equilibrium, Constr. Build. Mater. 230 (2020) 116997.
[120] S. Von Greve-dierfeld, C. Gehlen, Performance-based durability design , carbonation part 2 – Classification of concrete, Struct. Concr. J. FIB. 17 (2016) 523–532.
[121] C. Galle, Effect of drying on cement-based materials pore structure as identified by mercury intrusion porosimetry A comparative study between oven- , vacuum- , and freeze-drying, Cem. Concr. Res. 31 (2001) 1467–1477.
[122] Association Française de Normalisation (AFNOR), NF P18-459, Essai pour béton durci Essai de porosité et de masse volumique, 2010.
[123] E. Berodier, K. Scrivener, Evolution of pore structure in blended systems, Cem. Concr. Res. 73 (2015) 25–35.
[124] Z. Yu, G. Ye, The pore structure of cement paste blended with fly ash, Constr. Build. Mater. 45 (2013) 30–35.
[125] O. Coussy, Surface Energy and Capillarity, in: Mech. Phys. Porous Solids, John Wiley, 2010: pp. 121–122.
[126] F. Moro, H. Böhni, Ink-bottle effect in mercury intrusion porosimetry of cement-based materials, J. Colloid Interface Sci. 246 (2002) 135–149.
[127] S. Meulenyzer, J. Chanussot, S. Crombez, J.J. Chen, Spectral-spatial image processing strategies for

201
classifying multispectral SEM-EDS X-Ray maps of cementitious materials, in: 14th Euroseminar Microsc. Appl. to Build. Mater., Helsingør, Denmark, 2013.
[128] M.H.N. Yio, J.C. Phelan, H.S. Wong, N.R. Buenfeld, Determining the slag fraction, water/binder ratio and degree of hydration in hardened cement pastes, Cem. Concr. Res. 56 (2014) 171–181.
[129] V. Kocaba, E. Gallucci, K.L. Scrivener, Methods for determination of degree of reaction of slag in blended cement pastes, Cem. Concr. Res. 42 (2012) 511–525.
[130] D. Helsel, M. A., Ferraris, C. F., and Bentz, Comparative study of methods to measure the density of Cementious powders, J. Test. Eval. 44 (2016) 2147–2154.
[131] V. Baroghel-Bouny, Développement d’une approche globale, performantielle et prédictive de la durabilité des structures en béton (armé) sur la base d’indicateurs de durabilité Bilan et perspectives, LCPC, 2008.
[132] M. Hamada, Carbonation of concrete, in: Princeton University Library, 1385: p. 302.
[133] AFNOR, XP P18-463 Essai de perméabilité aux gaz sur béton durci, 2011.
[134] J.J. Kollek, The determination of the permeability of concrete to oxygen by the Cembureau method-a recommendation, Mater. Struct. 22 (1989) 225–230.
[135] Rilem TC 116-PCD, Permeability of concrete as a criterion of its durability, Mater. Struct. 32 (1999) 174–179.
[136] F. Sorrentino, Upscaling the synthesis of tricalcium silicate and alite, Cem. Wapno Bet. 8 (2008) 177–183.
[137] France, PerfDub project, (2015). https://www.perfdub.fr/en/.
[138] W.Y. Chan, The effect of specimen size on the measured mass transport properties of concrete, in: 1st Civ. Environ. Eng. Student Conf. Imp. Coll. London, 2012.
[139] NF EN 206/CN, Béton-Spécification, performance, production et conformité-Complément national à la norme NF EN 206, 2014.
[140] T. Graham, On the law of the diffusion of gases, London Edinburgh Philos. Mag. J. Sci. 2 (1833) 269–351.
[141] M. Boumaaza, B. Huet, P. Turcry, A. Aït-Mokhtar, C. Gehlen, D. Heinz, Gas diffusivity test method development : effect of cement paste saturation degree and concrete specimen thickness, in: 12th Fib Int. PhD Symp. Civ. Eng., Prague Czech republic, 2018.
[142] R.L. Nuzzo, The Box Plots Alternative for Visualizing Quantitative Data, PM&R. 8 (2016) 268–272.
[143] Y. Houst, F.H. Wittmann, Influence of porosity and water content on the diffusivity of CO2 and O2 through hydrated cement paste, Cem. Concr. Res. 24 (1994) 1165–1176.
[144] P. Soongswang, M. Tia, D. Bloomquist, Factors affecting the strength and permeability of concrete made with porous limestone, ACI Mater. J. 88 (1991) 400–406.
[145] L.J. Parrott, Moisture conditioning and transport properties of concrete test specimens, Mater. Struct. 27 (1994) 460–468.
[146] D.N. Winslow, M.D. Cohen, D.P. Bentz, K.A. Snyder, E.J. Garboczi, Percolation and pore structure in mortars and concrete, Cem. Concr. Res. 24 (1994) 25–37.
[147] T. Gardner, Chloride transport through concrete and implications for rapid chloride testing, PhD
202
thesis. University of Cape Town, 2006.
[148] T.C. Powers, A Hypothesis on Carbonation Shrinkage, J. Portl. Cem. Assoc. Res. Dev. Lab. (1962) 40–50.
[149] B.G. Salvoldi, H. Beushausen, M.G. Alexander, Oxygen permeability of concrete and its relation to carbonation, Constr. Build. Mater. 85 (2015) 30–37.
[150] H.S. Fogler, From Elements of Chemical Reaction Engineering, in: I. Pearson Education (Ed.), Simulating Ecol. Evol. Syst. C, 2010: pp. 820–860.
[151] M. Boumaaza, B. Huet, C. Le Galliard, P. Turcry, A. Aït-mokhtar, C. Gehlen, Experimental determination of carbonation related durability indicators : gas diffusivity and CO2 binding capacity, in: 15th Int. Congr. Chem. Cem., Prague, Czech Republic, 2019.
[152] M. Balonis, F.P. Glasser, The density of cement phases, Cem. Concr. Res. 39 (2009) 733–739.
[153] Z. Wu, H.S. Wong, N.R. Buenfeld, Effect of confining pressure and microcracks on mass transport properties of concrete, Adv. Appl. Ceram. 113 (2014) 485–495.
[154] W. Soja, Carbonation of low carbon binders, PhD thesis. Ecole polythechnique federale de Lausanne, 2019.
[155] RILEM, GDP: Test Methods for Gas Diffusion in Porous Media, (2019). https://www.rilem.net/groupe/gdp-test-methods-for-gas-diffusion-in-porous-media-386.
[156] V. Nikulshina, M.E. Gálvez, A. Steinfeld, Kinetic analysis of the carbonation reactions for the capture of CO2 from air via the Ca(OH)2 – CaCO3– CaO solar thermochemical cycle, Chem. Eng. J. 129. 129 (2007) 75–83.
[157] A. El-Turki, M.A. Carter, M.A. Wilson, R.J. Ball, G.C. Allen, A microbalance study of the effects of hydraulicity and sand grain size on carbonation of lime and cement, Constr. Build. Mater. 23 (2009) 1423–1428.
[158] D.P.P. Bentz, O.M. Jensen, A.M. Coats, F.P.P. Glasser, Influence of silica fume on diffusivity in cement-based materials I. Experimental and computer modeling studies on cement pastes, Cem. Concr. Res. 30 (2000) 953–962.
[159] V. Baroghel-Bouny, Water vapour sorption experiments on hardened cementitious materials. Part I: Essential tool for analysis of hygral behaviour and its relation to pore structure, Cem. Concr. Res. 37 (2007) 414–437.
[160] N. De Belie, J. Kratky, S. Van Vlierberghe, Influence of pozzolans and slag on the microstructure of partially carbonated cement paste by means of water vapour and nitrogen sorption experiments and BET calculations, Cem. Concr. Res. 40 (2010) 1723–1733. doi:10.1016/j.cemconres.2010.08.014.
[161] H.S. Wong, N.R. Buenfeld, J. Hill, A.W. Harris, Mass transport properties of mature wasteform grouts, Adv. Cem. Res. 19 (2007) 35–46.
[162] M. Saillio, V. Baroghel-Bouny, M. Bertin, S. Pradelle, J. Vincent, Phase assemblage of cement pastes with SCM at different ages, Constr. Build. Mater. 224 (2019) 144–157.
[163] M. Ben Haha, B. Lothenbach, G. Le Saout, F. Winnefeld, Influence of slag chemistry on the hydration of alkali-activated blast-furnace slag - Part II: Effect of Al2O3, Cem. Concr. Res. 42 (2012) 74–83.
[164] V.G. Papadakis, C.G. Vayenas, M.N. Fardis, Fundamental modeling and experimental investigation of concrete carbonation, ACI Mater. J. 88 (1991) 363–373.

203
[165] DIN EN 12390-10:2019-03, Prüfung von Festbeton - Teil 10: Bestimmung des Karbonatisierungswiderstandes von Beton bei atmosphärischer Konzentration von Kohlenstoffdioxid; Deutsche Fassung EN 12390-10:2018, Beuth, Berlin, 2018.
[166] V. Baroghel-Bouny, K. Kinomura, M. Thiery, S. Moscardelli, Easy assessment of durability indicators for service life prediction or quality control of concretes with high volumes of supplementary cementitious materials, Cem. Concr. Compos. 33 (2011) 832–847.
[167] K. Sakata, A study on moisture diffusion in drying and drying shrinkage of concrete, Cem. Concr. Res. 13 (1983) 216–224.
[168] B. Huet, V. L’hostis, G. Santarini, D. Feron, H. Idrissi, Steel corrosion in concrete: Determinist modeling of cathodic reaction as a function of water saturation degree, Corros. Sci. 49 (2007) 1918–1932.
[169] A.A. Hamami, P. Turcry, A. Aït-Mokhtar, Influence of mix proportions on microstructure and gas permeability of cement pastes and mortars, Cem. Concr. Res. 42 (2012) 490–498.
[170] S. Demis, M.P. Efstathiou, V.G. Papadakis, Computer-aided modeling of concrete service life, Cem. Concr. Compos. 47 (2014) 9–18.
[171] M.M. Mezedur, M. Kaviany, W. Moore, Effect of pore structure, randomness and size on effective mass diffusivity, AIChE J. 48 (2002) 15–24.
[172] V.G. Papadakis, Effect of supplementary cementing materials on concrete resistance against carbonation and chloride ingress, Cem. Concr. Res. 30 (2000) 291–299.
[173] Z. Bajja, W. Dridi, B. Larbi, P. Le Bescop, The validity of the formation factor concept from through-out diffusion tests on Portland cement mortars, Cem. Concr. Compos. 63 (2015) 76–83.
[174] K.L. Scrivener, A.K. Crumbie, P. Laugesen, The interfacial transition zone (ITZ) between cement paste and aggregate in concrete, Interface Sci. 12 (2004) 411–421.
[175] P. Termkhajornkit, R. Barbarulo, G. Chanvillard, Microstructurally-designed cement pastes: A mimic strategy to determine the relationships between microstructure and properties at any hydration degree, Cem. Concr. Res. 71 (2015) 66–77.
[176] B. Jeffrey W., J. Hamlin M., L. Richard A., N. Andre, S. George W., S. Jeffrey S., S. Karen L., T. Jeffrey J., Mechanisms of cement hydration, Cem. Concr. Res. 41 (2011) 1208–1223.
[177] T.E. Oliphant, SciPy: Open source scientific tools for Python, Comput. Sci. Eng. 9 (2007) 10–20.
[178] J.E. Guyer, D. Wheeler, J.A. Warren, FiPy: Partial differential equations with python, Comput. Sci. Eng. 11 (2009) 6–15.
[179] A. Abell, K. Willis, D. Lange, Mercury Intrusion Porosimetry and Image Analysis of Cement-Based Materials., J. Colloid Interface Sci. 211 (1999) 39–44.
[180] A.C.A. Muller, Characterization of porosity & C-S-H in cement pastes by 1H NMR, PhD thesis. Ecole polytechnique fédérale de Lausanne, 2014.
[181] J.W. Bartlett, C. Frost, Reliability, repeatability and reproducibility: Analysis of measurement errors in continuous variables, Ultrasound Obstet. Gynecol. 31 (2008) 466–475.
[182] T.C. POWERS, Structure and Physical Properties of Hardened Portland Cement Paste, J. Am. Ceram. Soc. 41 (1958).
[183] H.M. Jennings, J.J. Thomas, J.J. Chen, D. Rothstein, Cement Paste as a Porous Material, Handb.

204
Porous Solids. (2002) 2971–3028.
[184] X. Feng, E.J. Garboczi, D.P. Bentz, P.E. Stutzman, T.O. Mason, Estimation of the degree of hydration of blended cement pastes by a scanning electron microscope point-counting procedure, Cem. Concr. Res. 34 (2004) 1787–1793.
[185] F. Jacobs, Permeability to gas of partially saturated concrete, Mag. Concr. Res. 50 (1998) 115–121.
[186] T.R. Marrero, E.A. Mason, Gaseous Diffusion Coefficients, J. Phys. Chem. Ref. Data. 1 (1972).
[187] Feldman R. F. and Cheng Yi. H., Properties of Portland cement - silica fume pastes, Cem. Concr. Res. 15 (1985) 765–774.
[188] M. Rhamdhani, The Characterisation of Oxygen in Metal / Slag Reactions, in: Electr. Furn. Conf. Proc., 2002: pp. 787–796.
[189] W. Ashraf, Carbonation of cement-based materials: Challenges and opportunities, Constr. Build. Mater. 120 (2016) 558–570.
[190] P. Turcry, L. Oksri-Nelfia, A. Younsi, A. Aït-Mokhtar, Analysis of an accelerated carbonation test with severe preconditioning, Cem. Concr. Res. (2014).
[191] C. Thiel, C. Gehlen, Compliance testing for probabilistic durability design purposes, in: Sixth Int. Symp. Life-Cycle Civ. Eng. (IALCCE 2018), Ghent, Belgium, 2018.
[192] M. Boumaaza, B. Huet, G. Pham, P. Turcry, A. Aït-Mokhtar, C. Gehlen, A new test method to determine the gaseous oxygen diffusion coefficient of cement pastes as a function of hydration duration , microstructure , and relative humidity, Mater. Struct. 51 (2018) 1–31.
[193] H. Jansson, R. Snibb, K. Bohlin, I. Lofgren, Carbonation of concrete with mineral additions, in: Proc. XXIII Nord. Concr. Res. Symp., Aalborg, Denmark, 2017: pp. 101–104.
[194] N. Issaadi, A. Nouviaire, R. Belarbi, A. Aït-Mokhtar, Moisture characterization of cementitious material properties : Assessment of water vapor sorption isotherm and permeability variation with ages, Constr. Build. Mater. 83 (2015) 237–247.
[195] O. Amiri, A. Aït-Mokhtar, M. Sarhani, Tri-dimensional modelling of cementitious materials permeability from polymodal pore size distribution obtained by mercury intrusion porosimetry tests, Adv. Cem. Res. 17 (2005) 39–45.
[196] C. Andrade, A.S. Miguel, Updating Carbon Storage Capacity of Spanish Cements, Sustain. 10 (2018) 4806.
[197] EN 197-1, Cement Part 1: Composition, Specifications and Conformity Criteria for Common Cements, Br. Stand. (2011).
[198] E.M.J. Berodier, Impact of the Supplementary Cementitious Materials on the kinetics and microstructural development of cement hydration, PhD thesis. Ecole polytechnique federale de lausanne, 2015.
[199] C. Naber, S. Stegmeyer, D. Jansen, F. Goetz-Neunhoeffer, J. Neubauer, The PONKCS method applied for time resolved XRD quantification of supplementary cementitious material reactivity in hydrating mixtures with ordinary Portland cement, Constr. Build. Mater. 214 (2019) 449–457.
[200] A.K. Schindler, K.J. Folliard, Influence of supplementary cementing materials on the heat of hydration of concrete, in: Adv. Cem. Concr. IX Conf., Colorado, 2003: pp. 10–14.
[201] M. Auroy, S. Poyet, P. Le Bescop, J.M. Torrenti, T. Charpentier, M. Moskura, X. Bourbon, Comparison

205
between natural and accelerated carbonation (3% CO2): Impact on mineralogy, microstructure, water retention and cracking, Cem. Concr. Res. 109 (2018) 64–80.
[202] Association Française de Normalisation (AFNOR), Determination of real and apparent densities, open and total porosities, in: AFNOR (Ed.), NF EN 1936, 2007.
[203] K. Suzuki, N. Tadahiro, S. ITO, Formation and carbonation of CSH in water, Cem. Concr. Res. 15 (1985) 213–224.
[204] O. Metalssi, A. Aït-Mokhtar, A proposed methodology for a quantitative investigation of carbonation in polymer-modified mortars, Exp. Tech. 33 (2009) 59–65.
[205] C. Andrade, Evaluation of the degree of carbonation of concretes in three environments, Constr. Build. Mater. 230 (2020) 116804.
[206] A. Morandeau, M. Thiéry, P. Dangla, Investigation of the carbonation mechanism of CH and C-S-H in terms of kinetics, microstructure changes and moisture properties, Cem. Concr. Res. 56 (2014) 153–170.
[207] S.E. Pihlajavaara, Some results of the effect of carbonation on the porosity and pore size distribution of cement paste, Mater. Struct. (1968) 521–527.
[208] S.E. Pihlajavaara, P. Esko, Effect of carbonation on microstructural properties of cement stones, Cem. Concr. Res. 4 (1974) 149–154.
[209] B. Johannesson, P. Utgenannt, Microstructural changes caused by carbonation of cement mortar, Cem. Concr. Res. 31 (2001) 925–931.
[210] A. Machner, M. Zajac, M. Ben Haha, K.O. Kjellsen, M.R. Geiker, K. De Weerdt, Stability of the hydrate phase assemblage in Portland composite cements containing dolomite and metakaolin after leaching, carbonation, and chloride exposure, Cem. Concr. Compos. 89 (2018) 89–106.
[211] L. Black, K. Garbev, I. Gee, Surface carbonation of synthetic C-S-H samples: A comparison between fresh and aged C-S-H using X-ray photoelectron spectroscopy, Cem. Concr. Res. (2008).
[212] L. Black, K. Garbev, G. Beuchle, P. Stemmermann, D. Schild, X-ray photoelectron spectroscopic investigation of nanocrystalline calcium silicate hydrates synthesised by reactive milling, Cem. Concr. Res. 36 (2006) 1023–1031.
[213] A.E. Morandeau, M. Thiery, P. Dangla, C.E. White, Accelerated carbonation modelling of fly ash-blended cement paste, in: RILEM Int. Symp. Concr. Model., Beijing, China, 2014.
[214] I.G. Richardson, The nature of C-S-H in hardened cements, Cem. Concr. Res. 29 (1999) 1131–1147.
[215] Q.T. Phung, N. Maes, E. Jacops, D. Jacques, G. De Schutter, G. Ye, Insights and issues on the correlation between diffusion and microstructure of saturated cement pastes, Cem. Concr. Compos. 96 (2019) 106–117.
[216] F. Lollini, E. Redaelli, L. Bertolini, Effects of portland cement replacement with limestone on the properties of hardened concrete, Cem. Concr. Compos. 46 (2014) 32–40.
[217] R. Bucher, P. Diederich, G. Escadeillas, M. Cyr, Service life of metakaolin-based concrete exposed to carbonation: Comparison with blended cement containing fly ash, blast furnace slag and limestone filler, Cem. Concr. Res. 99 (2017) 18–29.
[218] C.J. Engelsen, H. Justnes, CO2-binding by concrete – carbonation speed, degree and binding capacity, in: 13th NCB Int. Semin. Cem. Build. Mater., 2013: pp. 1–10.

206
[219] S.-M. Shih, C.-S. Ho, Y.-S. Song, J.-P. Lin, Kinetics of the Reaction of Ca(OH) 2 with CO 2 at Low Temperature, Ind. Eng. Chem. Res. 38 (1999) 1316–1322.
[220] T. Aono, Studies on the reactions between gas and solid, part II, absorption of CO2 by CaO and Ca(OH)2, Bull. Chem. Soc. Jpn. 6 (1931) 319–324.
[221] R.J. Flatt, G.W. Scherer, J.W. Bullard, Why alite stops hydrating below 80% relative humidity, Cem. Concr. Res. 41 (2011) 987–992.
[222] O. Regnault, V. Lagneau, H. Schneider, Experimental measurement of portlandite carbonation kinetics with supercritical CO2, Chem. Geol. 265 (2009) 113–121.
[223] I. Galan, F.P. Glasser, D. Baza, C. Andrade, Assessment of the protective effect of carbonation on portlandite crystals, Cem. Concr. Res. 74 (2015) 68–77.
[224] T. Nishikawa, K. Suzuki, S. Ito, Decomposition of synthesized ettringite by carbonation, Cem. Concr. Res. 22 (1992) 6–14.
[225] Q. Zhou, F.P. Glasser, Kinetics and mechanism of the carbonation of ettringite, Adv. Cem. Res. 12 (2000) 131–136.
[226] G. Seishi, S. Kenzo, K. Takeshi, Calcium silicate carbonation products, J. Am. Ceram. Soc. 78 (1995).
[227] V. Rostami, Y. Shao, A.J. Boyd, Z. He, Microstructure of cement paste subject to early carbonation curing, Cem. Concr. Res. (2012).
[228] O. Shtepenko, C. Hills, A. Brough, M. Thomas, The effect of carbon dioxide on beta-dicalcium silicate and Portland cement, Chem. Eng. J. 118 (2006) 107–118.
[229] J. Han, G.H. Pan, W. Sun, C.H. Wang, D. Cui, Application of nanoindentation to investigate chemomechanical properties change of cement paste in the carbonation reaction, Sci. China Technol. Sci. 55 (2012) 616–622.
[230] G.Y. Marija Nedeljković, Bahman Ghiassi, Stefan Melzer, Chris Kooij, Sieger van der Laan, CO2 binding capacity of alkali-activated fly ash and slag pastes, Ceram. Int. (2018).
[231] T.L. Robl, U.M. Graham, D.N. Taulbee, W. Giles, on the long term stability of products made from dry FGD materialsThe effect of carbonation reactions, ACS Div. Fuel Chem. (1996).
[232] J.F. Young, R.L. Berger, J. Breese, Accelerated Curing of Compacted Calcium Silicate Mortars on Exposure to CO2, J. Am. Ceram. Soc. 5 (1974) 394–398.
[233] D. Wang, Y. Fang, Y. Zhang, J. Chang, Changes in mineral composition, growth of calcite crystal, and promotion of physico-chemical properties induced by carbonation of β-C2S, J. CO2 Util. 34 (2019) 149–162.
[234] H.Y. Sohn, J. Szekely, The effect of intragrain diffusion on the reaction between a porous solid and a gas, Chem. Eng. Sci. 29 (1974) 630–634.
[235] I. Galan, C. Andrade, P. Mora, M.A. Sanjuan, Sequestration of CO2 by concrete carbonation, Environ. Sci. Technol. 44 (2010) 3181–3186.
[236] I.G. Richardson, G.W. Groves, A.R. Brough, C.M. Dobson, The carbonation of OPC and OPC/silica fume hardened cement pastes in air under conditions of fixed humidity, Adv. Cem. Res. 5 (1993) 81–86.
[237] J. Grandet, Contribution à l’étude de la prise et de la carbonatation des mortiers au contact des matériaux poreux, PhD thesis. Université Toulouse III, 1975.

207
[238] M. Castellote, L. Fernandez, C. Andrade, C. Alonso, Chemical changes and phase analysis of OPC pastes carbonated at different CO2 concentrations, Mater. Struct. 515–525 (2009).
[239] Association Française de Normalisation (AFNOR), NF P19-839, NF EN 16757, (2017).
[240] S.O. Ekolu, A review on effects of curing, sheltering, and CO2 concentration upon natural carbonation of concrete, Constr. Build. Mater. 127 (2016) 306–320.
[241] C.A. García-González, A. Hidalgo, C. Andrade, M.C. Alonso, J. Fraile, A.M. López-Periago, C. Domingo, Modification of composition and microstructure of Portland cement pastes as a result of natural and supercritical carbonation procedures, Ind. Eng. Chem. Res. 45 (2006) 4985–4992.
[242] DuraCrete, The European Union – Brite EuRam III. Compliance Testing for Probabilistic Design Purposes, 1999.
[243] M. Hassoune, F. Ghomari, A. Khelidj, A. Bezzar, B. Touil, Influence des paramètres de composition et de cure sur la diffusivité des bétons à base de matériaux locaux, Nat. Technol. (2013) 2–9.

208
Appendices
1 Appendix of Paper I
a) b)
c)
Figure 72: Pore size distribution from mercury intrusion: OPC samples. (b) OPC_Silica Fume samples and (c) OPC_Slag samples
0
0,5
1
1,5
2
2,5
3
3,5
4
0,001 0,01 0,1 1
Incr
emen
tal m
ercu
ry v
olu
me
(%
)
Pore diameter (µm)
S_OPC_1.6S_OPC_1.92M_OPC_1.62M_OPC_1.98M_OPC_1.68M_OPC_1.9
0
0,5
1
1,5
2
2,5
3
3,5
4
4,5
5
0,001 0,01 0,1 1
Incr
emen
tal m
ercu
ry v
olu
me
(%
)
pore diameter (µm)
S_OPC_SF_1.6
S_OPC_SF_1.9
2M_OPC_SF_1.6
2M_OPC_SF_1.9
8M_OPC_SF_1.6
8M_OPC_SF_1.9
0
0,5
1
1,5
2
2,5
3
3,5
0,001 0,01 0,1 1 10
Incr
emen
tal m
ercu
ry v
olu
me
(%
)
Pore diameter (µm)
S_OPC_Slag_1.6
S_OPC_Slag_1.9
2M_OPC_Slag_1.6
2M_OPC_Slag_1.9
8M_OPC_Slag_1.6
8M_OPC_Slag_1.9

209
Figure 73: The preconditioning climate chamber (left) and the drying oven (80°C) (right)

210
2 Appendix of Paper II
2.1 Results of the automatic fit of the MIP data
Log(mean diameter) (m)
PC6_BC
Log(mean diameter) (m)
PC6_C
Log(mean diameter) (m)
FA6_BC
Log(mean diameter) (m)
FA6_C
Log(mean diameter) (m)
SL6_BC
Log(mean diameter) (m)
SL6_C
Vo
lum
ic f
ract
ion
of
Hg
intr
usi
on
[-]
Vo
lum
ic f
ract
ion
of
Hg
intr
usi
on
[-]
V
olu
mic
fra
ctio
n o
f H
g in
tru
sio
n [
-]
Vo
lum
ic f
ract
ion
of
Hg
intr
usi
on
[-]
Vo
lum
ic f
ract
ion
of
Hg
intr
usi
on
[-]
Vo
lum
ic f
ract
ion
of
Hg
intr
usi
on
[-]

211
Log(mean diameter) (m)
LS6_BC
Log(mean diameter) (m)
LS6_C
Log(mean diameter) (m)
SL35_BC
Log(mean diameter) (m)
SL35_C
Log(mean diameter) (m)
MK45_BC
Log(mean diameter) (m)
MK45_C
Figure 74: The automatic fit of the MIP raw data, before carbonation (BC) and after carbonation (C)
Vo
lum
ic f
ract
ion
of
Hg
intr
usi
on
[-]
Vo
lum
ic f
ract
ion
of
Hg
intr
usi
on
[-]
Vo
lum
ic f
ract
ion
of
Hg
intr
usi
on
[-]
Vo
lum
ic f
ract
ion
of
Hg
intr
usi
on
[-]
Vo
lum
ic f
ract
ion
of
Hg
intr
usi
on
[-]
Vo
lum
ic f
ract
ion
of
Hg
intr
usi
on
[-]

212
diameter_1 diameter_2 diameter_3 Vol_fraction_1 Vol_fraction_2 Vol_fraction_3
[m] [m] [m] S_OPC_1.6 3.2 10-09 3.2 10-08 1.8 10-07 0.07 0.33 0.60
S_OPC_1.9 7.3 10-09 1.7 10-07 4.2 10-07 0.24 0.63 0.13
S_OPC+SF_1.6 3.3 10-09 4.1 10-08 1.4 10-07 0.06 0.63 0.32
S_OPC+SF_1.9 3.2 10-09 4.9 10-08 1.6 10-07 0.05 0.65 0.30
S_OPC+Slag_1.6 3.3 10-09 6.1 10-08 2.2 10-07 0.18 0.62 0.20
S_OPC+Slag_1.9 3.4 10-09 9.2 10-08 3.9 10-07 0.18 0.59 0.23
2M_OPC_1.6 3.3 10-09 2.1 10-08 9.3 10-08 0.14 0.40 0.46
2M_OPC_1.9 3.0 10-09 2.6 10-08 1.0 10-07 0.16 0.26 0.58
2M_OPC+SF_1.6 3.6 10-09 3.9 10-08 6.0 10-08 0.29 0.53 0.18
2M_OPC+SF_1.9 3.1 10-09 3.5 10-08 8.4 10-08 0.07 0.77 0.15
2M_OPC+Slag_1.6 4.4 10-09 2.3 10-08 1.2 10-07 0.31 0.42 0.26
2M_OPC+Slag_1.9 3.0 10-09 2.3 10-08 1.6 10-07 0.31 0.49 0.20
8M_OPC_1.6 3.7 10-09 1.3 10-08 6.6 10-08 0.13 0.27 0.60
8M_OPC_1.9 8.4 10-09 6.4 10-08 2.5 10-07 0.49 0.33 0.18
8M_OPC+SF_1.6 3.2 10-09 1.7 10-08 5.3 10-08 0.10 0.57 0.33
8M_OPC+SF_1.9 3.3 10-09 2.1 10-08 6.4 10-08 0.11 0.55 0.34
8M_OPC+Slag_1.6 3.3 10-09 1.2 10-08 8.1 10-08 0.29 0.59 0.12
8M_OPC+Slag_1.9 3.3 10-09 1.1 10-08 6.8 10-08 0.24 0.57 0.19
LS6_C 3.9 10-07 2.0 10-07 4.5 10-08 0.37 0.18 0.45
LS6_C 3.9 10-07 2.0 10-07 4.5 10-08 0.37 0.18 0.45
LS6_NC 1.6 10-07 4.3 10-08 3.5 10-09 0.32 0.64 3.8 10-02
FA6_C 1.0 10-07 3.6 10-08 2.7 10-09 0.40 0.57 2.2 10-02
LS6_NC 1.6 10-07 4.3 10-08 3.5 10-09 0.32 0.64 3.8 10-02
SL6_C 6.1 10-08 2.3 10-08 0.32 0.68 FA6_C 1.0 10-07 3.6 10-08 2.7 10-09 0.40 0.57 2.2 10-02
FA6_NC 5.4 10-08 1.1 10-08 0.59 0.41 SL6_C 6.1 10-08 2.3 10-08 0.32 0.68 PC6_C 2.0 10-08 6.9 10-08 3.4 10-09 0.87 0.12 8.5 10-03
PC6_NC 5.4 10-08 8.3 10-09 3.6 10-09 0.62 0.31 7.5 10-02
FA6_NC 5.4 10-08 1.1 10-08 0.59 0.41 SL6_NC 1.5 10-08 1.0 LS6_C 3.9 10-07 2.0 10-07 4.5 10-08 0.37 0.18 0.45
PC6_C 2.0 10-08 6.9 10-08 3.4 10-09 0.87 0.12 8.5 10-03
PC6_NC 5.4 10-08 8.3 10-09 3.6 10-09 0.62 0.31 7.5 10-02
SL6_NC 1.5 10-08 1.0 FA6_C 1.0 10-07 3.6 10-08 2.7 10-09 0.40 0.57 2.2 10-02
MK45_NC 1.5 10-08 3.7 10-09 0.85 0.15 SL35_NC 3.4 10-08 6.1 10-09 0.55 0.45 SL35_C 4.3 10-08 7.0 10-09 3.4 10-09 0.77 0.11 0.12
MK45_C 4.5 10-08 6.4 10-09 3.3 10-09 0.73 0.17 9.8 10-02
LS6_NC 1.6 10-07 4.3 10-08 3.5 10-09 0.32 0.64 3.8 10-02
MK45_NC 1.5 10-08 3.7 10-09 0.85 0.15 SL35_C 4.3 10-08 7.0 10-09 3.4 10-09 0.77 0.11 0.12
PC6_C 2.0 10-08 6.9 10-08 3.4 10-09 0.87 0.12 8.5 10-03
SL6_C 6.1 10-08 2.3 10-08 0.32 0.68 MK45_C 4.5 10-08 6.4 10-09 3.3 10-09 0.73 0.17 9.8 10-02
SL35_NC 3.4 10-08 6.1 10-09 0.55 0.45 SL35_C 4.3 10-08 7.0 10-09 3.4 10-09 0.77 0.11 0.12

213
PC6_NC 5.4 10-08 8.3 10-09 3.6 10-09 0.62 0.31 7.5 10-02
FA6_NC 5.4 10-08 1.1 10-08 0.59 0.41 MK45_C 4.5 10-08 6. 10-09 3.3 10-09 0.73 0.17 9.8 10-02
SL6_NC 1.5 10-08 1.0 MK45_NC 1.5 10-08 3.7 10-09 0.85 0.15
SL35_NC 3.4 10-08 6.1 10-09 0.55 0.45
Table 39: Summary of the MIP results

214
2.2 Composition of the raw materials
Figure 75: Metakaolin composition and properties
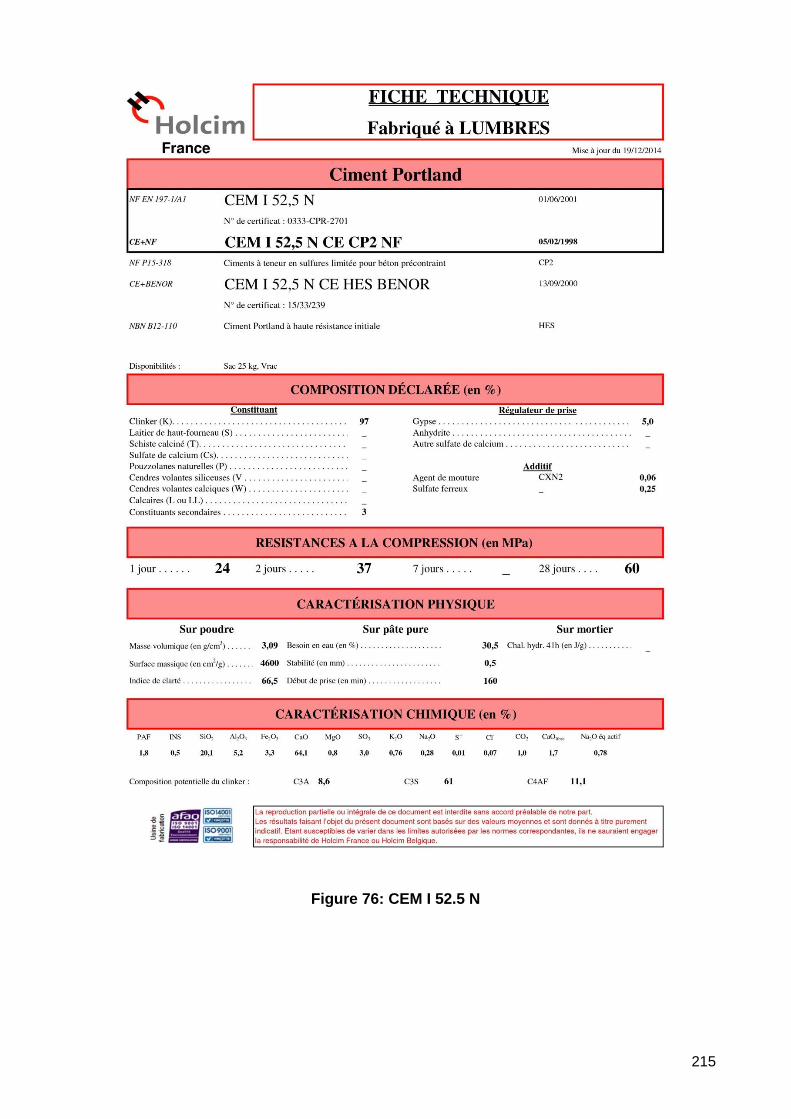
215
Figure 76: CEM I 52.5 N

216
Figure 77: CEM I 52.5 N CE PM

217
Figure 78: Limestone addition composition
218
Figure 79: Slag composition

219
Figure 80: Fly ash composition

220
3 Appendix of Paper III
: Existing phase (very high probability) , : Possibly existing phase , –: Non-detected phase
Table 40 : XRD qualitative results after the synthesis of CH, C-S-H, AFt, C3A, C3S and C2S
Larn
ite
Calc
ium
Sil
icate
Calc
ium
Alu
min
um
Oxid
e
Gyp
su
m
Po
rtla
nd
ite
Ett
rin
git
e
Calc
ite
Do
lom
ite
Cri
sto
bali
te
Sil
lim
an
ite
Vate
rite
tob
erm
ori
te
Akerm
an
ite
Kali
op
hilit
e
Co
rdie
rite
Calc
ium
Sil
icate
Jaro
sit
e
An
ort
hit
e
Lazu
rite
Essen
eit
e
am
orp
ho
us
Ca
2S
iO4
Ca3S
iO5
Ca3A
l 2O
6
CaS
O4
. 2H
2O
Ca(O
H) 2
Ca6A
l 2(S
O4)3
(OH
)12· 2
6
H2O
An
d / o
r
Ca6(A
l(O
H)6
) 2(S
O4)
3(H
2O
) 25.7
CaC
O3
CaM
g(C
O3) 2
SiO
2
Al 2
SiO
5
CaC
O3
Ca
2M
gS
i 2O
7
KA
lSiO
4
2M
gO
· 2A
l 2O
3·5
SiO
2
gam
ma
-Ca
2S
iO4
KF
e3(S
O4) 2
(OH
)6
(Ca.N
a)(
Si.
Al)
4O
8
Na7A
l6S
i6O
24S
3
Ca(F
e1.4
Al0
.6)S
iO6
C3S triclinic – – – – – – – – – – – – – – –
C2S Béta – – – – – – – – – – – – –
C3A Cubic – – – – – – – – – – – – – – – – –
Ettringite – – – – – – – – – – –
Portlandite – – – – – – – – –
– – – – – – – –
C-S-H0.9 – – – – – – – – – – – – – – – – – –

221
Figure 81 : C2S Experimental x-ray diffraction spectra obtained on anhydrous powders preconditioned at 93%RH during 32 days in low-CO2 concentration
C2S hydraté à 93%
01-075-2100 (C) - Perovskite - CaTiO3 - Y: 10.65 % - d x by: 1. - WL: 1.54056 - Cubic - a 3.79500 - b 3.79500 - c 3.79500 - alpha 90.000 - beta 90.000 - gamma 90.000 - Primitive - Pm-3m (221) - 1 - 54.6557 - I/Ic PD
00-009-0413 (*) - Mayenite, syn - Ca12Al14O33 - Y: 8.92 % - d x by: 1. - WL: 1.54056 - 0 -
00-035-0591 (*) - Merwinite, syn - Ca3Mg(SiO4)2 - Y: 9.43 % - d x by: 1. - WL: 1.54056 - 0 -
00-031-0297 (*) - Calcium Silicate - Ca2SiO4 - Y: 42.76 % - d x by: 1. - WL: 1.54056 - 0 -
00-033-0302 (*) - Larnite, syn - Ca2SiO4 - Y: 98.24 % - d x by: 1. - WL: 1.54056 - Monoclinic - a 9.31000 - b 6.75650 - c 5.50590 - alpha 90.000 - beta 94.460 - gamma 90.000 - Primitive - P21/n (14) - 4 - 345.289 - F30
Operations: Import
C2S hydraté à 93% - File: PLA-18-05154-T (1801169).raw - Type: 2Th/Th locked - Start: 5.000 ° - End: 64.993 ° - Step: 0.017 ° - Step time: 59.7 s - Temp.: 25 °C (Room) - Time Started: 0 s - 2-Theta: 5.000 ° - Theta: 2
Lin
(C
ps)
0
10
20
30
40
50
60
70
80
90
100
110
120
130
140
150
2-Theta - Scale
35 40 50 60
Lin
(C
ps)
0
10
20
30
40
50
60
70
80
90
100
110
120
130
140
150
5 10 20 30
d=
2.5
4
d=
2.5
2
d=
2.4
8 d=
2.4
5
d=
2.4
1
d=
2.3
3
d=
2.3
0d=
2.2
8
d=
2.1
9
d=
2.1
7
d=
2.1
3
d=
2.0
9
d=
2.0
5d=
2.0
4
d=
2.0
2
d=
1.9
8
d=
1.9
1
d=
1.8
9
d=
1.8
5
d=
1.8
0
d=
1.7
9
d=
1.7
7d=
1.7
6
d=
1.7
3
d=
1.7
1
d=
1.6
9
d=
1.6
8
d=
1.6
6
d=
1.6
4 d=
1.6
3
d=
1.6
1d=
1.6
1
d=
1.5
9
d=
1.5
7
d=
1.5
5
d=
1.5
3
d=
1.5
1
d=
1.5
0
d=
1.4
8
d=
1.4
6
d=
1.4
5d=
1.4
5d=
1.4
4
d=
5.6
1
d=
4.9
0
d=
4.6
4
d=
4.3
2
d=
4.0
6
d=
3.8
2d=
3.7
8
d=
3.3
8
d=
3.2
4
d=
3.1
7
d=
3.0
5d=
3.0
1
d=
2.8
8
d=
2.7
9
d=
2.7
5
d=
2.7
2
d=
2.6
9
d=
2.6
1

222
Figure 82 : C3A Experimental x-ray diffraction spectra obtained on anhydrous powders preconditioned at 93%RH during 32 days with low CO2 concentration (lower than 10ppm)
C3A hydraté à 95%RH
00-014-0083 (D) - Calcium Aluminum Oxide Carbonate Hydrate - Ca4Al2CO9.11H2O - Y: 15.10 % - d x by: 1. - WL: 1.54056 - 0 -
00-024-0217 (*) - Katoite, syn - Ca3Al2(OH)12 - Y: 21.91 % - d x by: 1. - WL: 1.54056 - 0 -
00-038-1429 (*) - Calcium Aluminum Oxide tricalcium aluminate - Ca3Al2O6 - Y: 100.98 % - d x by: 1. - WL: 1.54056 - 0 -
Operations: Import
C3A hydraté à 95%RH - File: PLA-18-04989-T 1801119.raw - Type: 2Th/Th locked - Start: 5.000 ° - End: 64.993 ° - Step: 0.017 ° - Step time: 59.7 s - Temp.: 25 °C (Room) - Time Started: 0 s - 2-Theta: 5.000 ° - Theta:
Lin
(C
ps)
0
100
2-Theta - Scale
35 40 50 60
Lin
(C
ps)
0
100
5 10 20 30
d=
2.4
7
d=
2.4
1
d=
2.3
8
d=
2.3
6
d=
2.2
9d=
2.2
8
d=
2.2
2
d=
2.2
0
d=
2.1
8
d=
2.1
4
d=
2.1
0
d=
2.0
8
d=
2.0
4
d=
1.9
9
d=
1.9
5
d=
1.9
4
d=
1.9
1
d=
1.8
9d=
1.8
8
d=
1.8
7
d=
1.8
4
d=
1.8
2d=
1.8
1
d=
1.8
0
d=
1.7
8 d=
1.7
4
d=
1.7
3
d=
1.7
1
d=
1.7
0
d=
1.6
8
d=
1.6
6
d=
1.6
5
d=
1.6
3d=
1.6
2
d=
1.6
0
d=
1.5
7
d=
1.5
6d=
1.5
5
d=
1.5
2
d=
1.5
0
d=
1.4
9
d=
1.4
8
d=
1.4
6d=
1.4
6d=
1.4
5
d=
8.8
2
d=
7.6
1
d=
6.8
3
d=
6.2
3
d=
5.4
0
d=
5.1
3
d=
4.9
0
d=
4.6
0
d=
4.4
4
d=
4.2
3
d=
4.0
8
d=
3.8
6
d=
3.7
9
d=
3.7
0
d=
3.5
0
d=
3.3
6d=
3.3
3
d=
3.2
5
d=
3.1
4
d=
3.0
5
d=
2.9
9
d=
2.9
3
d=
2.8
7
d=
2.8
3d=
2.8
1d=
2.7
9
d=
2.7
0
d=
2.5
8d=
2.5
7

223
Figure 83: XRD results of C3S powder conditioned at different RH in a CO2-low environment
C3S hydraté à 95%
00-033-0302 (*) - Larnite, syn - Ca2SiO4 - Y: 19.03 % - d x by: 1. - WL: 1.54056 - 0 -
99-090-0001 (U) - C3S MONOCLINIQUE - 3CaO.SiO2 - Y: 39.37 % - d x by: 1. - WL: 1.54056 - 0 -
00-031-0301 (*) - Calcium Silicate - Ca3SiO5 - Y: 65.39 % - d x by: 1. - WL: 1.54056 - 0 -
Operations: Import
C3S hydraté à 95% - File: ECH-1800126 (1801139).raw - Type: 2Th/Th locked - Start: 5.000 ° - End: 64.993 ° - Step: 0.017 ° - Step time: 59.7 s - Temp.: 25 °C (Room) - Time Started: 0 s - 2-Theta: 5.000 ° - Theta: 2.5
Lin
(C
ps)
0
10
20
30
40
50
60
70
80
90
100
2-Theta - Scale
35 40 50 60
Lin
(C
ps)
0
10
20
30
40
50
60
70
80
90
100
5 10 20 30
d=
2.5
6
d=
2.4
6d=
2.4
4 d=
2.3
3d=
2.3
2
d=
2.2
8
d=
2.2
6d=
2.2
4
d=
2.1
9
d=
2.1
7
d=
2.1
3
d=
2.1
1d=
2.1
0d=
2.0
8
d=
2.0
5d=
2.0
4
d=
2.0
1
d=
1.9
9d=
1.9
8 d=
1.9
4d=
1.9
3
d=
1.9
1
d=
1.8
4
d=
1.8
3
d=
1.8
0
d=
1.7
8d=
1.7
7d=
1.7
6
d=
1.7
4
d=
1.7
0
d=
1.6
8
d=
1.6
5
d=
1.6
3d=
1.6
3
d=
1.6
1
d=
1.5
7
d=
1.5
5
d=
1.5
3d=
1.5
2
d=
1.5
0d=
1.4
9d=
1.4
9
d=
1.4
7d=
1.4
7
d=
1.4
6
d=
11.0
3
d=
5.9
5
d=
5.5
1
d=
4.3
7
d=
4.1
0 d=
3.8
8
d=
3.7
4d=
3.7
0d=
3.6
7
d=
3.5
4
d=
3.4
5
d=
3.3
7
d=
3.2
6
d=
3.0
4d=
3.0
2
d=
2.9
7
d=
2.8
4
d=
2.7
9d=
2.7
6d=
2.7
3
d=
2.7
0
d=
2.6
1

224
Figure 84: TGA results of anhydrous phases conserved at 3 RH during 32 days in an ambiance with low CO2 concentration (lower than 10ppm)
-0,016
-0,014
-0,012
-0,01
-0,008
-0,006
-0,004
-0,002
0
0 200 400 600 800 1000
dm
(m
g)
Temperature (°C)
C2S_55%
C2S_33%
C2S_93%-0,016
-0,014
-0,012
-0,01
-0,008
-0,006
-0,004
-0,002
0
0 200 400 600 800 1000
dm
(m
g)
Temperature (C)
C3S_33%
C3S_55%
C3S_93%
-0,016
-0,014
-0,012
-0,01
-0,008
-0,006
-0,004
-0,002
0
0 200 400 600 800 1000
dm
(m
g)
Temperature (°C)
C3A_33%
C3A_55%
C3S_93%

225
(a)
(b)
(c)
Figure 85 : grain size distribution of Portlandite (a), Ettringite (b) and C3S (c) powders before carbonation (NC) and after exposure to ambient CO2 at 93% RH (C_93%)
0
2
4
1E-02 1E-01 1E+00 1E+01 1E+02 1E+03 1E+04
Volu
me (
%)
size (µm)
NC_CH
C_CH_93%
0
2
4
1E-02 1E+00 1E+02 1E+04
Volu
me (
%)
Size (µm)
NC_Ettringite
C_Ettringite_93%
0
2
4
6
8
1E-02 1E+00 1E+02 1E+04
Volu
me (
%)
Size (µm)
NC_C3S
C_C3S_93%

226
C3S carbonated at 33%
C3S carbonated at 55%
CH Carbonated at 33%
CH Carbonated at 55%
Figure 86 : SEM images of C3S and CH powders after carbonation at 33% RH and 55% RH
5 μm

227