Are self-description scales better than agree/disagree scales?
35
University of Nebraska - Lincoln University of Nebraska - Lincoln DigitalCommons@University of Nebraska - Lincoln DigitalCommons@University of Nebraska - Lincoln Sociology Department, Faculty Publications Sociology, Department of 2020 Are self-description scales better than agree/disagree scales? Are self-description scales better than agree/disagree scales? Jerry Timbrook Jolene Smyth Kristen M. Olson Follow this and additional works at: https://digitalcommons.unl.edu/sociologyfacpub Part of the Family, Life Course, and Society Commons, Quantitative, Qualitative, Comparative, and Historical Methodologies Commons, and the Social Psychology and Interaction Commons This Article is brought to you for free and open access by the Sociology, Department of at DigitalCommons@University of Nebraska - Lincoln. It has been accepted for inclusion in Sociology Department, Faculty Publications by an authorized administrator of DigitalCommons@University of Nebraska - Lincoln.
-
Upload
khangminh22 -
Category
Documents
-
view
3 -
download
0
Transcript of Are self-description scales better than agree/disagree scales?

University of Nebraska - Lincoln University of Nebraska - Lincoln
DigitalCommons@University of Nebraska - Lincoln DigitalCommons@University of Nebraska - Lincoln
Sociology Department, Faculty Publications Sociology, Department of
2020
Are self-description scales better than agree/disagree scales? Are self-description scales better than agree/disagree scales?
Jerry Timbrook
Jolene Smyth
Kristen M. Olson
Follow this and additional works at: https://digitalcommons.unl.edu/sociologyfacpub
Part of the Family, Life Course, and Society Commons, Quantitative, Qualitative, Comparative, and
Historical Methodologies Commons, and the Social Psychology and Interaction Commons
This Article is brought to you for free and open access by the Sociology, Department of at DigitalCommons@University of Nebraska - Lincoln. It has been accepted for inclusion in Sociology Department, Faculty Publications by an authorized administrator of DigitalCommons@University of Nebraska - Lincoln.

Are self-description scales better than agree/disagree scales?
Jerry Timbrook RTI International, USA
Jolene D. Smyth and Kristen Olson University of Nebraska-Lincoln, USA
Corresponding author — Jerry Timbrook, RTI International, 3040 East Cornwallis Road, Research Triangle Park, NC 27709, USA. Email: [email protected]
ORCIDJerry Timbrook https://orcid.org/0000-0001-6897-5689 Jolene D Smyth https://orcid.org/0000-0001-8905-8804
Abstract Questions using agree/disagree (A/D) scales are ubiquitous in survey research be-cause they save time and space on questionnaires through display in grids, but they have also been criticized for being prone to acquiescent reports. Alternatively, ques-tions using self-description (SD) scales (asking respondents how well a statement describes them from Completely to Not at All) can also be presented in grids or with a common question stem, and by omitting the word agree, SD scales may reduce acquiescence. However, no research has examined how response patterns may dif-fer across A/D and SD scales. In this article, we compare survey estimates, item non-response and nondifferentiation across these two types of scales in a mail survey. We find that SD scales outperform A/D scales for non-socially desirable questions that ask about positive topics. For questions that ask about negative topics, we find that estimates for SD items are significantly more negative than A/D items. This may occur because the SD scale is unipolar and has only one negative response option
1
digitalcommons.unl.edu
Published in International Journal of Market Research (2020)DOI: 10.1177/1470785320971592 Copyright © 2020 Jerry Timbrook, Jolene D Smyth, and Kristen Olson. Published by SAGE Publications. Used by permission.

T imbrook , Smyth , & Olson in Intl Journal of Market Research (2020 ) 2
(Not at All), whereas the bipolar A/D scale has two negative response options (Dis-agree and Strongly Disagree). We recommend that researchers use SD scales for nonsocially desirable positive valence questions.
Keywords: agree/disagree scales, data quality, mail survey, questionnaire design, self-description scales
Introduction
Survey and market researchers collecting data on attitudes and opin-ions have a variety of scales from which to choose. For example, to measure self- versus other-orientation, a researcher could ask respon-dents to report how much they agree or disagree with the statement, “Helping others is important to me.” Conversely, they could ask re-spondents to report how well the statement “Helping others is im-portant to me” describes them.
While these two types of questions—agree/disagree (A/D) and self-description (SD)—have some features in common, they also differ in important ways that may affect the quality of the data reported and the circumstances under which each should be used. That is, under-standing how a scale’s design features affect response behavior and data quality can guide a surveyor’s choice of scale (DeCastellarnau, 2018). Although there is a long history of empirical evaluation of A/D questions (e.g., Alwin et al., 2018; Berg & Rapaport, 1954; Lenski & Leggett, 1960; Saris et al., 2010), SD scales are relatively uninvesti-gated. Moreover, we know of no research that directly compares the two scale types in self-administered surveys.
Our research takes an important first step toward evaluating SD scales. We compare A/D and SD scales to understand how responses differ across the two scales when measuring the same construct. Us-ing six positive valence and five negative valence items in a mail sur-vey, we compare survey estimates (mean and standard deviation as in Christian & Dillman, 2004) and two undesirable response behaviors—item nonresponse and nondifferentiation (the most extreme form of which is straightlining)—across A/D and SD questions. Through our investigation, we seek to answer the following research questions:

T imbrook , Smyth , & Olson in Intl Journal of Market Research (2020 ) 3
Research Question 1 (RQ1): Do survey estimates (i.e., mean and standard deviation) differ between A/D and SD scales?
Research Question 2 (RQ2): Does item nonresponse differ between A/D and SD scales?
Research Question 3 (RQ3): Does nondifferentiation differ between A/D and SD scales?
Background of the study
A/D scales
Questions using A/D scales ask respondents to indicate the degree to which they agree or disagree with a particular statement (e.g., “Help-ing others is important to me”) (see Table 1 for an example). A/D scales are popular because they can easily measure most constructs (Saris et al., 2010), allow multiple items to be placed together with a common question stem, and can be designed to have the same num-ber and labels of response options (Dillman et al., 2014). In self-ad-ministered modes, agree/disagree items are often presented in a grid, saving questionnaire space. In addition, as A/D scales have been used widely for many years, researchers often include them in surveys to maintain trend data (Holbrook, 2013).
Table 1. Example of agree/disagree and self-description scales.
Agree/disagree (A/D) Self-description (SD)
Question stem To what extent do you agree How well does the or disagree with the following following statement statement: describe you?
Item prompt Helping others is important Helping others is important to me. to me.
Response options Strongly Agree Completely Agree Mostly Neither Agree nor Disagree Somewhat Disagree A Little Bit Strongly Disagree Not at All

T imbrook , Smyth , & Olson in Intl Journal of Market Research (2020 ) 4
Despite their ubiquity, A/D scales have been criticized for having poor data quality. For example, A/D scales are prone to acquiescence bias because respondents are artificially more likely to agree with a statement than disagree (Berg & Rapaport, 1954; Holbrook et al., 2003; Krosnick & Presser, 2010; Lenski & Leggett, 1960; Narayan & Krosnick, 1996; Saris et al., 2010; Schuman & Presser, 1996), particu-larly with positive valence statements (i.e., when it would be socially acceptable to agree with an item) (Ross & Mirowsky, 1984). However, when it is not socially acceptable to agree with the premise of an item (i.e., negative valence items such as psychological distress), the acqui-escence effect disappears; respondents instead endorse categories that present them in the best light.
A/D scales are also bipolar (Dillman et al., 2014), meaning that atti-tudes are measured across two dimensions (agreement and disagree-ment), with a zero point in the middle. This zero point can either be explicit (e.g., a Neither Agree nor Disagree option) or implicit (i.e., the point where response options change from agree to disagree). Bi-polar scales have demonstrated questionable item reliability, poten-tially because respondents must concurrently evaluate the direction (e.g., Agree vs. Disagree), intensity (e.g., selecting Strongly or not), and neutrality (e.g., selecting the 0-point or not) of each assessment (Al-win et al., 2018).
SD scales
SD scales represent a potential alternative to A/D scales. Questions using SD scales ask respondents to indicate how much a particular statement describes them. For a 5-point SD scale, response options can include Completely, Mostly, Somewhat, A Little Bit, and Not at All (see Table 1). SD scales lack a “neutral” response option, but since they ask respondents to make a self-evaluation, a topic on which re-spondents are likely well-informed, respondents may be less likely to need a “neutral” category.
The design of SD scales makes them an attractive choice for col-lecting attitude and opinion data from respondents. As SD questions share a common stem and response options, like A/D questions, they can be presented efficiently as a set. However, unlike A/D scales, SD scales omit the word agree, reducing the likelihood of acquiescence, and they are unipolar, which may increase reliability (Alwin et al., 2018).

T imbrook , Smyth , & Olson in Intl Journal of Market Research (2020 ) 5
SD scales have been used in research on education (Pintrich et al., 1993), health and aging (Burgard et al., 2009), personality (Kruger & Gilovich, 2004), religion (Astin et al., 2011), and Need for Cognition/Need to Evaluate scales (Nir, 2011) and in major surveys including the General Social Survey (Smith et al., 2018), the Medical Expendi-ture Panel Survey (Agency for Healthcare Research and Quality, 2017), and the World Values Survey (Inglehart et al., 2014). Despite the possi-ble benefits of SD scales and their ubiquity in research, to our knowl-edge no published research has compared SD and A/D questions in a mail survey. This article adds to the literature on A/D and SD scales by comparing mean values, standard deviations, item nonresponse, and nondifferentiation across the two scales in a mail survey.
Hypotheses
We start with the hypothesis that for positive valence items (top panel of Figure 1), SD questions will produce lower estimated means, indi-cating less positive answers, than A/D questions (H1a).1 We expect this for two reasons. First, approximately 10% of respondents to A/D scales engage in acquiescence that biases responses in a positive direction
Figure 1. Positive and negative valence mail survey items with agree/disagree and self-description scales. *Respondents were randomly assigned to receive either the agree/disagree or self-description scale for both the positive and negative valence grids. We display only one valence grid per scale to save space.

T imbrook , Smyth , & Olson in Intl Journal of Market Research (2020 ) 6
(Krosnick & Presser, 2010). By excluding the word “agree,” SD scales reduce the chance for such acquiescence. Second, because of differ-ences in scale polarity—the A/D items in our surveys have only two positive response options, (Strongly Agree and Agree) whereas the SD items have four (Completely, Mostly, Somewhat, and A Little Bit)—positive responses to the positive valence SD items are allowed to be spread out across the top four response options rather than concen-trated in only the top two.
However, a competing hypothesis is that means (and by exten-sion, rates of top-two-box reporting) for positive valence SD and A/D scales will not differ (H1b). The lower responses due to reduced ac-quiescence and the provision of four positive response options in the SD scale may be offset by increased positive responding due to social desirability, especially on more sensitive items. In particular, socially desirable reporting may increase if the SD scale feels more personal and self-evaluative than the A/D scale (i.e., the degree of closeness differs across the scales). For example, it may be more extreme for a respondent to say that the statement “Helping others is important to me” describes them Completely than it would be to Strongly Agree with the statement. That is, the wording of the response options them-selves may catalyze a need to edit responses due to social desirabil-ity. In sum, we expect small or no differences between estimates from A/D and SD scales for positive valence items that are more socially desirable (H1b) and larger differences for items that are less socially desirable (H1a).
Acquiescence is less concerning for negative valence items (bottom panel of Figure 1) because it is not socially acceptable to agree with a negative construct (e.g., losing one’s temper) (Ross & Mirowsky, 1984). Thus, for these items, we hypothesize (H2a) no difference in means between SD and A/D scales because there will be no positive bias in the A/D items without acquiescent behavior. However, two additional features may affect responses. First, the increased personal closeness of SD items may invoke social desirability concerns, pushing responses to this scale toward the most negative response option (i.e., Not at All), especially for items where social desirability concerns are great-est. Second, because the SD scale only has one negative response option (Not at All) compared with the A/D scale’s two (Strongly Dis-agree and Disagree), all negative responses have to be concentrated

T imbrook , Smyth , & Olson in Intl Journal of Market Research (2020 ) 7
in a single response option (i.e., a difference due to scale polarity), potentially exacerbating a negative shift in estimates. Thus, counter to H2a, we alternatively hypothesize (H2b) that the SD scale will have lower means than the A/D scale on negative valence items because responses will be more concentrated in the most negative response option (e.g., more bottom-box reporting).
Researchers strive to measure the variability that exists in a popu-lation for a particular construct, but question design can affect these estimates of variation. In a unipolar SD scale, four positive response options allow for capturing more variation for positive valence items compared with only two positive response options in the bipolar A/D scale. Thus, we hypothesize (H3) that responses to SD scales will have larger standard deviations than responses to A/D scales for positive valence items.
In contrast, respondents using an SD scale have only the zero point to distance themselves from a negative valence item compared with two response options for those using a bipolar A/D scale. Thus, we hypothesize (H4) that SD scales will have smaller standard deviations than A/D scales for negative valence items.
High item nonresponse commonly indicates low data quality (Groves, 1989). Question topic, structure (e.g., open vs. closed-ended), and complexity are associated with item nonresponse (Dillman et al., 2002). However, in this study, A/D and SD items are generally equiva-lent on each of these features. The same questions are asked to all re-spondents, and both scales use the same structure (i.e., they are both 5-point closed-ended scales). Thus, we hypothesize (H5) that there will be no differences in the rates of item nonresponse across SD and A/D scales for positive and negative valence items.
Several of the same features that we expect to influence means and standard deviations may also influence nondifferentiation, which is the tendency to select the same or nearly the same response op-tion across a set of items when respondent burden is high and/or mo-tivation is low (Krosnick, 1991). For example, in a set of positive va-lence items, the increased tendency for acquiescence, which should be constant over items, and the fact that there are only two posi-tive response options in A/D scales will concentrate responses in the Strongly Agree and Agree response options, increasing nondifferenti-ation. Having more positive response options in SD scales will allow

T imbrook , Smyth , & Olson in Intl Journal of Market Research (2020 ) 8
for more variation in positive responses across items, potentially re-ducing nondifferentiation. Moreover, while SD scales are less prone to acquiescence, they are perhaps more prone to social desirability, an effect that will vary over items of differing sensitivity. As a result, in a set of positive valence items of varying sensitivity, we expect less nondifferentiation (i.e., more differentiation) in SD than in A/D scales (H6). Scale polarity is expected to be the primary driver of nondiffer-entiation for negative valence questions because acquiescence is not expected. SD scale respondents have only one negative response op-tion to reject the premise of a negative valence question, while A/D respondents have two. Therefore, we hypothesize (H7) that the SD scale will have more nondifferentiation than the A/D scale in a set of negative valence items. Our hypotheses are summarized in Table 2.
Method
Data
The data for this study come from the National Health, Wellbeing and Perspectives Study (NHWPS) survey. NHWPS was a 12-page ques-tionnaire (including a cover page) with 77 questions fielded by the University of Nebraska–Lincoln’s Bureau of Sociological Research be-tween April 10 and August 12, 2015. A total of 6,000 addresses were randomly sampled from the USPS Delivery Sequence File, and 1,002
Table 2. Summary of hypotheses.
Outcome Item valence Hypothesis Hypothesis number
Mean Positive SD < A/D H1a SD = A/D H1b Mean Negative SD = A/D H2a SD < A/D H2b Standard deviation Positive SD > A/D H3 Negative SD < A/D H4 Item nonresponse rate Positive SD = A/D Negative SD = A/D H5 Nondifferentiation Positive SD < A/D H6 Negative SD > A/D H7
SD: self-description; A/D: agree/disagree.

T imbrook , Smyth , & Olson in Intl Journal of Market Research (2020 ) 9
respondents completed and returned the survey (American Associ-ation for Public Opinion Research [AAPOR] RR1 = 16.7%). The “next birthday” within-household selection method was used to randomly select the survey respondent.
NHWPS asked questions related to health, mental health, well-be-ing, victimization, current events, and demographics. There were two versions of the questionnaire. In Version 1, two grid questions were presented using an A/D scale (response options: Strongly Agree, Agree, Neither Agree nor Disagree, Disagree, Strongly Disagree). In Version 2, the same two grid questions were presented with a SD scale (Com-pletely, Mostly, Somewhat, A Little Bit, Not at All). The first grid ques-tion contained six items that asked about topics with a positive va-lence (e.g., “I consider myself a good person.”). The second contained five items that asked about topics with a negative valence (e.g., “I lose my temper pretty easily.”) (see Figure 1). A total of 3,000 addresses were randomly assigned to each questionnaire version (Version 1: n = 522, AAPOR RR1 = 17.4%; Version 2: n = 480, AAPOR RR1 = 16.0%).
Substantive responses are examined using the mean and stan-dard deviation for each of the 11 survey items. Both scales are coded 1–5 with 1 assigned to Strongly Disagree/Not at All and 5 assigned to Strongly Agree/Completely. A top-two-box reporting variable is coded 1 if the respondent selected one of the highest two response options (i.e., answers of 4 or 5 on either scale), and a 0 otherwise. Similarly, a bottom-two-box reporting variable is coded 1 for answers using the lowest two response options (i.e., answers of 1 or 2 on either scale), and 0 otherwise. Finally, since the unipolar SD scale has only one neg-ative response option (i.e., Not At All), we examine bottom-one-box reporting as a sensitivity analysis; this variable is coded 1 for answers using the lowest response option (i.e., answers of 1 on either scale), and 0 otherwise.
Nondifferentiation is operationalized in two ways. First, as what we call “set variance” and second, as straightlining. Set variance is calcu-lated by first obtaining the standard deviation of each respondent’s answers (missing items are excluded) to each set of items within a grid (calculated using the rsd [row standard deviation] function in Stata 14.2) and then squaring it. Straightlining, which is a more stringent operationalization of nondifferentiation, is represented by a variable coded 1 if the respondent selected the same answer for every item in the set and 0 if they did not.

T imbrook , Smyth , & Olson in Intl Journal of Market Research (2020 ) 10
The main independent variable is an indicator of the scale version respondents used to complete the items with A/D coded 0 and SD coded 1.
We control for respondents’ age (grand mean centered) and level of education (using three dichotomous indicators: high school grad-uate or less, some college, or college graduate or more) (see Supple-mental Appendix A for question wording). Missing, don’t know, and refusal answers for age (12%) and education (6%), were imputed to the mean (age) or modal category (education). The overall average age of respondents was 57.35 years, and did not significantly differ across the A/D respondents ( x ̅= 57.46 years) and the SD respondents ( x ̅= 57.24; t = 0.218, p = .828) (Table 3). The majority of respondents were at least college graduates (50.80%), and education also did not differ significantly across experimental versions of the survey (χ2= 2.565, p = .277).
Finally, because some of our hypotheses hinge on social desirabil-ity of items, for interpretation purposes, we provide ratings of the so-cial desirability of each item. Ten graduate students2 were briefed on the concept of social desirability, and rated each of the 11 items us-ing the scale Not At All Socially Desirable (=1), A Little Bit Socially De-sirable (=2), Somewhat Socially Desirable (=3), Very Socially Desirable (=4), and Extremely Socially Desirable (=5). We report the mean scores for each item in Table 4 alongside our first set of results. The intra-class correlation (ICC) estimating the consistency of agreement among coders is 0.66 (p < .01), indicating good reliability (Cicchetti, 1994).
Table 3. Summary of respondent characteristics.
Overall Agree/disagree Self-description t-test/χ2
Number of respondents 1,002 522 480 Age (in years) 57.35 57.46 57.24 0.218 Education High school graduate or less (ref.) 19.26% 18.97% 19.58% 2.565 Some college 29.94% 27.97% 32.08% College graduate or more 50.80% 53.07% 48.33%
There were no significant differences in respondent age or education between the A/D and SD versions.

T imbrook , Smyth , & Olson in Intl Journal of Market Research (2020 ) 11
Analysis methods
We begin by examining unweighted response distributions across the scale versions. For each of the 11 items, we use t-tests for bivariate analyses and ordinary least squares (OLS) regression models predict-ing each item’s average response for multivariate analysis. In the mul-tivariate OLS models, scale version, respondent age (centered), and education are entered as predictors. We then examine item variance across scale versions using the test for equality of standard deviations (sdtest in Stata). As a sensitivity analysis, we also examine rates of top-two-box, bottom-two-box, and bottom-one-box reporting across the scales using tests of proportions (prtest).
Next, we compare item nonresponse rates across scale versions us-ing tests of proportions for bivariate analyses and binary logistic re-gression models for multivariate analysis.
Finally, we examine set variance and straightlining. We compare set variance for each of the two question sets using t-tests for bivariate analyses and OLS regression models for multivariate analysis. To exam-ine straightlining across scales, we use tests of proportions for bivariate analyses and binary logistic regression models for multivariate analysis.
Table 4. Item social desirability ratings and means.
Social desirability Agree/ Self- rating Overall disagree description
Diff.
Mean SD Mean SE Mean SE Mean SE t-value SD − A/D
Positive valence Q6A: Good citizen 3.20 0.98 4.656 0.017 4.621 0.023 4.694 0.026 –2.110 0.073* Q6B: Moral person 4.10 0.83 4.642 0.017 4.639 0.023 4.645 0.026 –0.172 0.006 Q6C: Leader 1.90 0.94 3.653 0.032 3.764 0.040 3.533 0.050 3.628 –0.231*** Q6D: Help community 2.60 0.92 3.984 0.027 4.054 0.033 3.906 0.044 2.728 –0.148** Q6E: Help others 3.20 1.08 4.350 0.024 4.371 0.030 4.326 0.038 0.950 –0.045 Q6F: Positive community impact 2.40 0.80 3.869 0.031 3.957 0.037 3.773 0.049 3.029 –0.184**
Negative valence Q33A: Lose temper 2.30 0.90 2.069 0.030 2.191 0.043 1.934 0.040 4.359 –0.257*** Q33B: Treat others badly 3.10 1.30 2.051 0.031 2.246 0.043 1.836 0.044 6.678 –0.410*** Q33C: Stay away when angry 3.40 1.36 2.066 0.034 2.277 0.046 1.835 0.048 6.677 –0.442*** Q33D: Hard to stay calm 2.50 1.28 2.514 0.035 2.728 0.048 2.277 0.047 6.666 –0.451*** Q33E: Hurt others when angry 3.40 1.62 1.590 0.029 1.805 0.043 1.354 0.037 7.874 –0.451***
SE: standard error; SD: self-description; A/D: agree/disagree. For items with the A/D scale, Strongly Agree = 5, Agree = 4, Neither Agree nor Disagree = 3, Disagree = 2, and Strongly Dis-
agree = 1. For the SD scale, Completely = 5, Mostly = 4, Somewhat = 3, A Little Bit = 2, and Not At All = 1. * p < .05 ; ** p < .01 ; *** p < .001

T imbrook , Smyth , & Olson in Intl Journal of Market Research (2020 ) 12
Results
Survey estimates
Table 4 displays means overall and by version for each item, and bi-variate tests of differences across scale versions. Higher means in-dicate responses leaning toward Strongly Agree/Completely. For the positive valence question (Q6), three of the six items had significantly lower means in the SD version, consistent with H1a. These results po-tentially indicate that the SD scale has (a) less acquiescence and/or (b) more spread of positive responses across positive response options. These differences were generally on the magnitude of one-quarter of a standard deviation or less, corresponding to a Cohen’s d < 0.25, a “small” effect size. For instance, the estimated mean response to “I am a community leader” was 3.764 using the A/D scale (between Agree and Neither Agree nor Disagree), but dropped slightly to 3.533 using the SD scale (between Somewhat and Mostly), a difference of 0.231 (the pooled standard deviation for this item is approximately 1). No-tably, these three items had the lowest mean social desirability ratings of the items in the Q6 set, consistent with our hypothesis that the dif-ferences between A/D and SD scales would occur on items that were lower in social desirability (H1a).
The remaining three items had the highest social desirability rat-ings of the Q6 set. One item (Q6A) had a statistically significantly higher mean with the SD scale (i.e., trending toward the socially de-sirable Completely response), although the difference in average re-sponses was quite modest (only 0.07, or about 0.13 standard devi-ations, a small effect size). Means for the other two items (Q6B and Q6E) did not significantly differ across scale versions. These results are consistent with our hypothesis that respondents may have engaged in socially desirable reporting using the SD scale on items that were higher in social desirability (H1b). This response behavior may have led to no differences between A/D and SD means for Q6B and Q6E, or in the case of Q6A, a slightly higher SD mean.
Consistent with H2b, for all five of the negative valence items (Q33), SD items had significantly lower means than their A/D counterparts at the p < .001 level, with differences on the magnitude of around half of a standard deviation, or a “medium” effect size. For instance, the

T imbrook , Smyth , & Olson in Intl Journal of Market Research (2020 ) 13
estimated mean for “When someone treats me badly, I think it is okay to treat them badly” was 2.246 for the A/D scale (between Disagree and Neither Agree nor Disagree), but 1.836 for the SD scale (between Not at All and A Little Bit). This may indicate that respondents using the unipolar SD scale to answer negative valence items anchor their answers on the lowest (Not at All) response option since it is the only option that rejects the item’s premise. These differences are larger for items with higher social desirability ratings. Multivariate results (see Supplemental Appendix B), and top-two-box, bottom-two-box, and bottom-one-box results (Supplemental Appendices C and D) for these items generally follow the same pattern.
Table 5 displays the standard deviation and variance for each item overall and by treatment. Consistent with H3, a majority of the mail survey positive valence items (four of the six items) were statistically significantly more variable with the SD scale (p < .001). This supports the hypothesis that by providing more positive response options, the SD scale fosters more variability across respondents for positive va-lence items. Only two of the five negative valence items had statisti-cally significantly less within-item variance with the SD scale (p < .01). Thus, contrary to H4, having only a single response option to express a “no” answer with the SD scale does not reduce within-item variance for a majority of negative valence items.
Table 5. Item variance by scale. Overall Overall Agree/ Agree/ Self- Self- F-value Diff. standard variance disagree disagree description description standard deviation standard variance standard variance deviation deviation deviation SD − A/D
Positive valence Q6A: Good citizen 0.546 0.299 0.528 0.278 0.564 0.318 0.874 0.036 Q6B: Moral person 0.545 0.297 0.527 0.278 0.564 0.318 0.872 0.037 Q6C: Leader 1.004 1.008 0.915 0.837 1.081 1.169 0.716 0.166*** Q6D: Help community 0.853 0.728 0.739 0.547 0.957 0.917 0.597 0.218*** Q6E: Help others 0.745 0.556 0.672 0.451 0.819 0.670 0.673 0.147*** Q6F: Positive community impact 0.959 0.920 0.845 0.714 1.063 1.129 0 .633 0.218***
Negative valence Q33A: Lose temper 0.933 0.871 0.981 0.962 0.859 0.738 1.303 –0.122** Q33B: Treat others badly 0.984 0.968 0.969 0.939 0.956 0.913 1.029 –0.013 Q33C: Stay away when angry 1.062 1.128 1.045 1.092 1.034 1.068 1.022 –0.011 Q33D: Hard to stay calm 1.085 1.178 1.102 1.214 1.017 1.034 1.174 –0.085 Q33E: Hurt others when angry 0.928 0.861 0.983 0.966 0.801 0.641 1.507 –0.182***
SD: self-description; A/D: agree/disagree. ** p < .01 ; *** p < .001

T imbrook , Smyth , & Olson in Intl Journal of Market Research (2020 ) 14
Item nonresponse
The item nonresponse rates for all 11 items were very low, ranging from 0.6% to 2.3% (Supplemental Appendix E), and, with the exception of one item, did not significantly differ across the A/D and SD scales (supporting H5). The exception is Q33D (ability to stay calm during a disagreement), in which the SD scale had a higher item nonresponse rate (SD = 2.292%, A/D = 0.575%, z = 2.31, p < .05), but this differ-ence was small (less than 2 percentage points) and likely due to Type I error. These results are confirmed in multivariate models controlling for age and education (Supplemental Appendix F).
Nondifferentiation
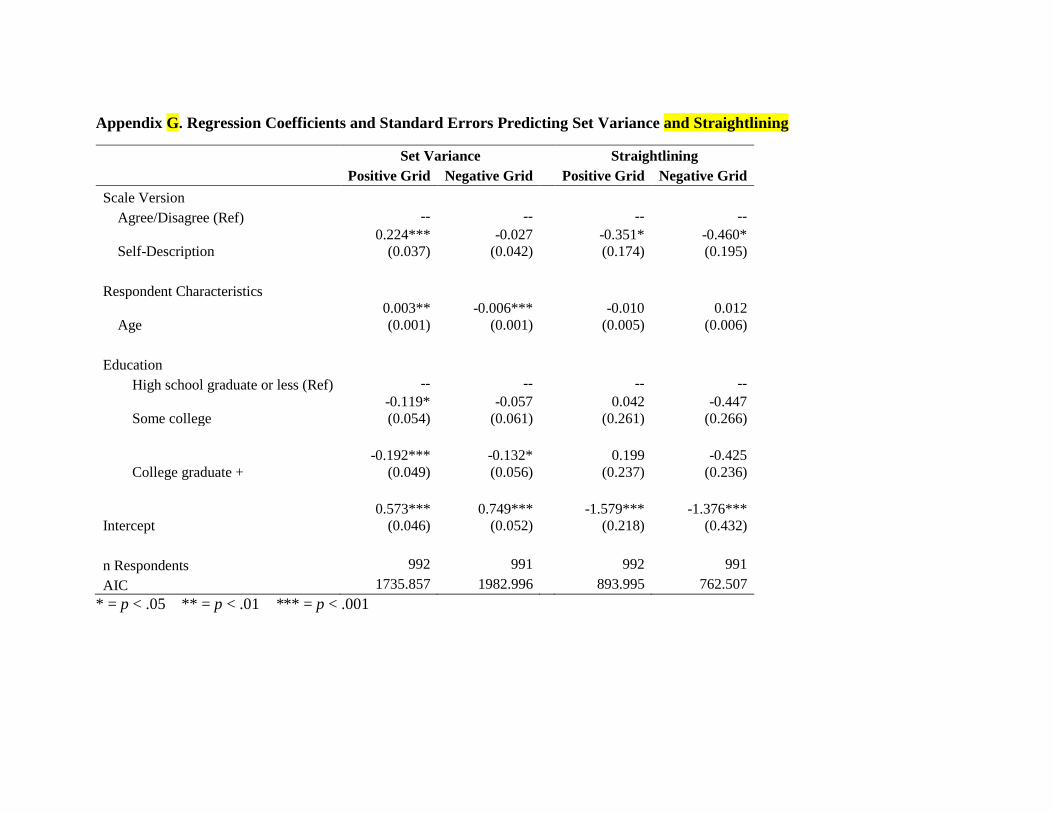
The top panel of Table 6 shows the bivariate results comparing set variance across scales (i.e., variance across items in a set within respon-dents). For the positive valence questions, the SD set of items had sig-nificantly more response variance (i.e., less nondifferentiation) than the A/D set (t = 6.15, p < .001) as hypothesized (H6). This indicates that the SD scale encouraged more variability in responses across items in these sets. Contrary to H7, variance across the items in the negative valence grid did not differ across treatments (t = 0.51, p = .611). Re-sults for both the positive and negative valence items are confirmed in multivariate models controlling for respondent age and education (see Supplemental Appendix G).
The bottom panel of Table 6 shows the straightlining results. Over-all, 16.63% of respondents straightlined on the positive valence mail grid. Consistent with H6, the SD scale had 4.9 percentage points fewer respondents straightlining for this question (z = 2.05, p < .05). For the negative valence grid, the overall straightlining rate was 13.02%, and the SD scale had 5.0 percentage points fewer straightlining than the A/D scale (10.381 vs. 15.414, z = 2.35, p < .05), contrary to H7.3 Once again, these results are confirmed by multivariate analyses controlling for age and education (see Supplemental Appendix G).

T imbrook , Smyth , & Olson in Intl Journal of Market Research (2020 ) 15
Discussion
Researchers’ choice of response options for scales can affect the data they obtain. In this study, we add to the literature describing the im-pact of that choice in a mail survey by comparing the effects of SD and A/D scales on response distributions, nondifferentiation, and straight-lining using items with both positive and negative valence. This is the first study to our knowledge to test the implications of using an SD scale versus an A/D scale.
In support of H1a, our results show that SD scales obtain different responses than A/D scales for the three positive valence mail items that were scored as the least socially desirable: “I consider myself a leader,” “Helping my community is important to me,” and “I can make a positive difference in the community around me.” When compared with A/D scales, SD scales for these three items had lower estimated means (consistent with H2b), larger standard deviations (supporting H3), and equivalent rates of item nonresponse (supporting H5). In ad-dition, SD scales produced less nondifferentiation than A/D scales in the positive valence items (consistent with H6). These differences may have resulted from reduced acquiescence with the SD scale, the dif-ference in polarity across the two scales (i.e., SD scales better capture variability that exists in the population on these items), or both. Since SD scales overcome many of the downsides of A/D scales while still
Table 6. Nondifferentiation by scale.
Set variance Overall Agree/disagree Self-description t-value Diff. SD − A/D Variance SE Variance SE Variance SE
Q6 Pos. Valence Grid 0.547 0.019 0.438 0.020 0.666 0.032 6.150 0.228*** Q33 Neg. Valence Grid 0.652 0.021 0.663 0.029 0.641 0.031 0.509 –0.022
Straightlining Overall Agree/disagree Self-description t-value Diff. SD − A/D % SE % SE % SE
Q6 Pos. Valence Grid 16.633 1.183 18.956 1.724 14.105 1.597 2.049 –4.851* Q33 Neg. Valence Grid 13.017 1.069 15.414 1.585 10.381 1.404 2.352 –5.033*
SD: self-description; A/D: agree/disagree; SE: standard error. * p < .05 ; *** p < .001

T imbrook , Smyth , & Olson in Intl Journal of Market Research (2020 ) 16
retaining many advantages, we recommend that survey researchers collecting rating data for non-socially desirable positive valence items use SD scales instead of A/D scales.
For the three most socially desirable positive valence mail items (i.e., “I consider myself a good citizen,” “I consider myself a moral per-son,” “Helping others is important to me”), the self-evaluative nature of the SD scales seem to result in socially desirable responding. This results in statistically equal (two items) or slightly higher (one item) estimated means in the SD treatment compared with the A/D treat-ment (generally supporting H1b). However, presenting these as SD rather than A/D items also resulted in less nondifferentiation (H6). Al-though the potential for measurement bias in response distributions seems similar between these two scale types (i.e., due to acquies-cence for A/D, and social desirability for SD), this reduction in nondif-ferentiation leads us to cautiously recommend using SD scales over A/D scales for socially desirable items with a positive valence. How-ever, we note that further research is needed to replicate these find-ings and should also examine if there is a level of sensitivity at which the increased social desirability in SD items puts them at a disadvan-tage relative to A/D items.
We are more skeptical about using the SD scale for negative va-lence items. Consistent with H2b, the SD scale produced significantly lower estimated means for all negative valence items. This likely hap-pened because the SD scales are unipolar, and negative responses were concentrated among a single negative response option at the low end of the scale. With the bipolar A/D scale, responses are spread among multiple negative response options. This concentration of neg-ative responses in a single category also likely led to smaller stan-dard deviations for negative valence items asked using the SD scale, though these differences were significant for only two of these five items (i.e., offering limited support for H4). In a welcome departure from H7, however, the SD scale was equal to the A/D scale in terms of nondifferentiation for negative valence items when it was opera-tionalized as set variance, and it did result in a slight reduction in the percent of respondents who straightlined.
Taken together, our results are generally positive regarding the util-ity of SD scales, but they also highlight the need to jointly consider the valence and social desirability of the items and the scale type (i.e.,

T imbrook , Smyth , & Olson in Intl Journal of Market Research (2020 ) 17
unipolar or bipolar, number of scale points, etc.) when making such decisions. Offering more response options that match an item’s va-lence tends to increase within-item variance and can decrease non-differentiation and straightlining. Thus, while SD scales appear to be advantageous in positive valence items, the fact that they are unipo-lar may be to their detriment in negative valence items.
While our results suggest that SD scales are a better choice than A/D scales in some circumstances, A/D scales are ubiquitous in mar-keting and survey research and may still have advantages over SD scales in certain cases. For example, respondents may be more famil-iar with A/D scales and may answer them more quickly than SD scales. Clients may also be more accustomed to A/D scales and prefer them over SD scales in surveys they sponsor. In addition, many psychomet-ric instruments have been validated using A/D scales (e.g., customer satisfaction; Nicholls et al., 1998), and would need to be revalidated if researchers wished to use SD scales for these instruments instead. Finally, historical trend data may rely on questions with A/D scales. Bridge studies would be required to explore how trend lines might change when replacing A/D scales with SD scales.
There are several important avenues for future research on the topic of SD scales. For example, we examined a limited number of questions. Furthermore, most questions in this study were rated as “A Little Bit” or “Somewhat” socially desirable by our coders. Replica-tion of this study on additional positive and negative valence items and additional questions from the extreme (i.e., high and low) ends of the social desirability range would provide more insights into the joint role of valence and social desirability on answering. In addition, the social desirability of each question in this study was rated by grad-uate students. It is possible that our respondents, who are generally older than our graduate student raters, might view the social desir-ability of these questions differently. These results would be strength-ened by asking the respondents themselves to rate the social desir-ability of these questions (as in Kreuter et al., 2008).
One concern in studies like this is that respondent motivation may wane in long questionnaires, affecting indicators of data quality. How-ever, the battery items we analyze in this study were presented toward the beginning of the questionnaire (i.e., in the first half) where respon-dent motivation likely is highest (Krosnick, 1991). Future work should

T imbrook , Smyth , & Olson in Intl Journal of Market Research (2020 ) 18
nonetheless replicate this study on a shorter questionnaire. Also, the presentation order of the battery questions was constant in this study (i.e., the positive valence battery was always displayed before the neg-ative valence battery), as was item order within each battery (e.g., Q6A was always displayed before Q6B, Q6B before Q6C, and so on). Fu-ture studies should vary the order of the batteries within the question-naire and the items within the batteries to disentangle any potential order effects from the differences across items that we observe here.
Future research should also expand beyond this necessary first step of looking at patterns of response at the individual item level to as-sessing correlational outcomes, including concurrent and predictive validity. Likewise, sets of A/D items are commonly scaled together to create a composite measure(s) of underlying characteristics. Future research should examine how SD scales affect scale reliability, factor loadings, and other indicators of measurement equivalence through structural equation models.
Future work should also explore whether these results extend to survey modes beyond mail. As mail and web surveys are both self-administered and use the visual communication channel, we would expect similar findings in web surveys as we observe here in a mail survey. A/D and SD scales may perform differently, however, across self-administered and interviewer-administered modes. In visual modes like mail, respondents can look back to the question and scale labels as needed, but in aural modes like telephone, respondents have to hold this information in working memory while formulating their answers (Christian et al., 2007; de Leeuw, 2005; Dillman et al., 2014; Olson et al., 2018). This extra effort may increase the tendency to ac-quiesce on questions with A/D scales due to satisficing behaviors (Krosnick, 1991). Likewise, because the presence of an interviewer can exacerbate social desirability effects (de Leeuw, 2005), responses to SD items may suffer from more social desirability in interviewer-ad-ministered modes than in self-administered modes. As a starting point for future studies, we provide results from an experiment comparing A/D and SD scales on the same outcomes from this study in a tele-phone survey (Supplemental Appendix H). Although this experiment is not a direct mode comparison and is limited to only four positive valence items, we hope that these supplemental analyses will inform future research on the topic.
T imbrook , Smyth , & Olson in Intl Journal of Market Research (2020 ) 19
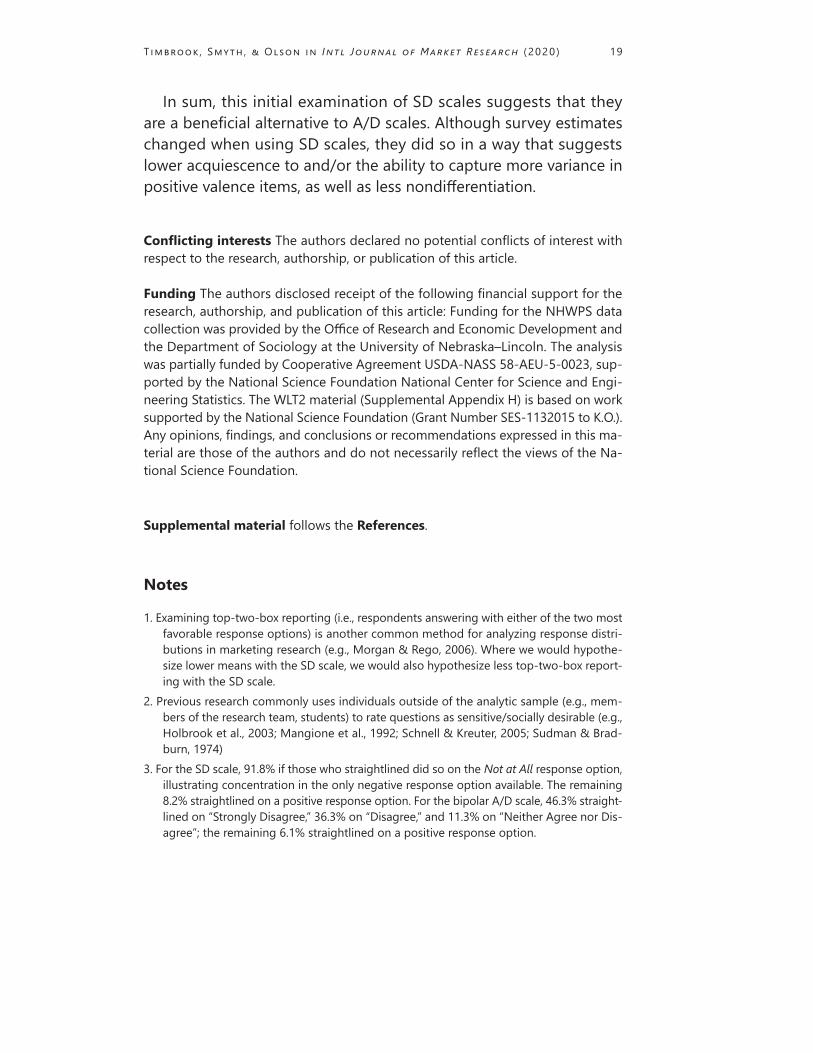
In sum, this initial examination of SD scales suggests that they are a beneficial alternative to A/D scales. Although survey estimates changed when using SD scales, they did so in a way that suggests lower acquiescence to and/or the ability to capture more variance in positive valence items, as well as less nondifferentiation.
Conflicting interests The authors declared no potential conflicts of interest with respect to the research, authorship, or publication of this article.
Funding The authors disclosed receipt of the following financial support for the research, authorship, and publication of this article: Funding for the NHWPS data collection was provided by the Office of Research and Economic Development and the Department of Sociology at the University of Nebraska–Lincoln. The analysis was partially funded by Cooperative Agreement USDA-NASS 58-AEU-5-0023, sup-ported by the National Science Foundation National Center for Science and Engi-neering Statistics. The WLT2 material (Supplemental Appendix H) is based on work supported by the National Science Foundation (Grant Number SES-1132015 to K.O.). Any opinions, findings, and conclusions or recommendations expressed in this ma-terial are those of the authors and do not necessarily reflect the views of the Na-tional Science Foundation.
Supplemental material follows the References.
Notes
1. Examining top-two-box reporting (i.e., respondents answering with either of the two most favorable response options) is another common method for analyzing response distri-butions in marketing research (e.g., Morgan & Rego, 2006). Where we would hypothe-size lower means with the SD scale, we would also hypothesize less top-two-box report-ing with the SD scale.
2. Previous research commonly uses individuals outside of the analytic sample (e.g., mem-bers of the research team, students) to rate questions as sensitive/socially desirable (e.g., Holbrook et al., 2003; Mangione et al., 1992; Schnell & Kreuter, 2005; Sudman & Brad-burn, 1974)
3. For the SD scale, 91.8% if those who straightlined did so on the Not at All response option, illustrating concentration in the only negative response option available. The remaining 8.2% straightlined on a positive response option. For the bipolar A/D scale, 46.3% straight-lined on “Strongly Disagree,” 36.3% on “Disagree,” and 11.3% on “Neither Agree nor Dis-agree”; the remaining 6.1% straightlined on a positive response option.

T imbrook , Smyth , & Olson in Intl Journal of Market Research (2020 ) 20
References
Agency for Healthcare Research and Quality. (2017). MEPS Survey Questionnaires. https://meps.ahrq.gov/survey_comp/survey.jsp
Alwin, D. F., Baumgartner, E. M., & Beattie, B. A. (2018). Number of response categories and reliability in attitude measurement. Journal of Survey Statistics and Methodology, 6(2), 212–239.
Astin, A. W., Astin, H. S., & Lindholm, J. A. (2011). Assessing students’ spiritual and religious qualities. Journal of College Student Development, 52(1), 39–61.
Berg, I. A., & Rapaport, G. M. (1954). Response bias in an unstructured questionnaire. The Journal of Psychology, 38(2), 475–481.
Burgard, S. A., Brand, J. E., & House, J. S. (2009). Perceived job insecurity and worker health in the United States. Social Science & Medicine, 69(5), 777–785.
Christian, L. M., & Dillman, D. A. (2004). The influence of graphical and symbolic language manipulations on responses to self-administered questions. Public Opinion Quarterly, 68(1), 57–80.
Christian, L. M., Dillman, D. A., & Smyth, J. D. (2007). The effects of mode and format on answers to scalar questions in telephone and web surveys. In J. M. Lepkowski, C. Tucker, J. M. Brick, E. D. de Leeuw, L. Japec, P. J. Lavrakas, M. W. Link, & R. L. Sangstera (Eds.), Advances in telephone survey methodology (pp. 250–275). John Wiley.
Cicchetti, D. V. (1994). Guidelines, criteria, and rules of thumb for evaluating normed and standardized assessment instruments in psychology. Psychological Assessment, 6(4), 284–290.
DeCastellarnau, A. (2018). A classification of response scale characteristics that affect data quality: A literature review. Quality & Quantity, 52(4), 1523–1559.
de Leeuw, E. D. (2005). To mix or not to mix data collection modes in surveys. Journal of Official Statistics, 21(5), 233–255.
Dillman, D. A., Eltinge, J. L., Groves, R. M., & Little, R. J. A. (2002). Survey nonresponse in design, data collection, and analysis. In R. M. Groves, D. A. Dillman, J. L. Eltinge, & R. J. A. Little (Eds.), Survey nonresponse (pp. 3–26). Wiley.
Dillman, D. A., Smyth, J. D., & Christian, L. M. (2014). Internet, phone, mail, and mixed-mode surveys: The tailored design method (4th ed.). Wiley.
Groves, R. M. (1989). Survey errors and survey costs. Wiley. Holbrook, A. L. (2013, October 23). Agree-disagree questions: Problems and some
solutions [Paper presentation]. Webinar presented as part of the American Association for Public Opinion Research Online Continuing Education Program. http://www.srl.uic.edu/seminars/SRL_Webinar_041114.pdf
Holbrook, A. L., Green, M. C., & Krosnick, J. A. (2003). Telephone versus face-to-face interviewing of national probability samples with long questionnaires. Public Opinion Quarterly, 67(1), 79–125.
Hox, J. J. (1994). Hierarchical regression models for interviewer and respondent effects. Sociological Methods & Research, 22(3), 300–318.

T imbrook , Smyth , & Olson in Intl Journal of Market Research (2020 ) 21
Inglehart, R., Haerpfer, C., Moreno, A., Welzel, C., Kizilova, K., Diez-Medrano, J., Lagos, M., Norris, P., Ponarin, E., & Puranen, B. (2014). World values survey questionnaire. http://www.worldvaluessurvey.org/WVSDocumentationWV6.jsp
Kreuter, F., Presser, S., & Tourangeau, R. (2008). Social desirability bias in CATI, IVR, and web surveys: The effects of mode and question sensitivity. Public Opinion Quarterly, 72(5), 847–865.
Krosnick, J. A. (1991). Response strategies for coping with the cognitive demands of attitude measures in surveys. Applied Cognitive Psychology, 5(3), 213–236.
Krosnick, J. A., & Presser, S. (2010). Question and questionnaire design. In P. V. Marsden & J. D. Wright (Eds.), Handbook of survey research (2nd ed., pp. 263–314). Emerald Group.
Kruger, J., & Gilovich, T. (2004). Actions, intentions, and self-assessment: The road to self-enhancement is paved with good intentions. Personality and Social Psychology Bulletin, 30(3), 328–339.
Lenski, G. E., & Leggett, J. C. (1960). Caste, class, and deference in the research interview. American Journal of Sociology, 65(5), 463–467.
Mangione, T., Fowler, F. J., & Louis, T. A. (1992). Question characteristics and interviewer effects. Journal of Official Statistics, 8(3), 293–307.
Morgan, N. A., & Rego, L. L. (2006). The value of different customer satisfaction and loyalty metrics in predicting business performance. Marketing Science, 25(5), 426–439.
Narayan, S., & Krosnick, J. A. (1996). Education moderates some response effects in attitude measurement. Public Opinion Quarterly, 60(1), 58–88.
Nicholls, J. A. F., Gilbert, G. R., & Roslow, S. (1998). Parsimonious measurement of customer satisfaction with personal service and the service setting. Journal of Consumer Marketing, 15(3), 239–253.
Nir, L. (2011). Motivated reasoning and public opinion perception. Public Opinion Quarterly, 75(3), 504–532.
Olson, K., & Bilgen, I. (2011). The role of interviewer experience on acquiescence. Public Opinion Quarterly, 75(1), 99–114.
Olson, K., & Peytchev, A. (2007). Effect of interviewer experience on interview pace and interviewer attitudes. Public Opinion Quarterly, 71(2), 273–286.
Olson, K., Smyth, J. D., & Cochran, B. (2018). Item location, the interviewer–respondent interaction, and responses to battery questions in telephone surveys. Sociological Methodology, 48(1), 225–268.
Pintrich, P. R., Smith, D. A. F., Garcia, T., & McKeachie, W. J. (1993). Reliability and predictive validity of the Motivated Strategies for Learning Questionnaire (MSLQ). Educational and Psychological Measurement, 53(3), 801–813.
Ross, C. E., & Mirowsky, J. (1984). Socially-desirable response and acquiescence in a cross-cultural survey of mental health. Journal of Health and Social Behavior, 25(2), 189–197.
Saris, W., Revilla, M., Krosnick, J. A., & Shaeffer, E. M. (2010). Comparing questions with agree/disagree response options to questions with item-specific response options. Survey Research Methods, 4(1), 61–79.

T imbrook , Smyth , & Olson in Intl Journal of Market Research (2020 ) 22
Schnell, R., & Kreuter, F. (2005). Separating interviewer and sampling-point effects. Journal of Official Statistics, 21(3), 389–410.
Schuman, H., & Presser, S. (1996). Questions and answers in attitude surveys: Experiments on question form, wording, and context. SAGE.
Smith, T., Davern, M., Freese, J., Morgan, S. L., Son, J., Schapiro, B., & Chatterjee, A. (2018). General social surveys, 1972-2018: Cumulative codebook. National Opinion Research Center.
Sudman, S., & Bradburn, N. M. (1974). Response effects in surveys: A review and synthesis. Aldine.

Appendix A. Question Wording
Education. What is the highest degree or level of school you have completed? Less than high
school; High school or equivalent (GED); Some college but no degree; Associates degree (AA,
AS); Bachelor’s degree (BA, BS); Master’s Degree (MA, MS, MEng, MEd, MSW, MBA);
Professional degree beyond a bachelor’s degree (MD, DDS, DVM, LLB, JD); Doctorate degree
(PhD, EdD)
Age. Your date of birth: MM/DD/YYYY

Appendix B. Regression Coefficients and Standard Errors Predicting Average Responses
Positive Valence Items Negative Valence Items
Q6A Q6B Q6C Q6D Q6E Q6F Q33A Q33B Q33C Q33D Q33E
Scale Version
Agree/Disagree
(Ref) -- -- -- -- -- --
-- -- -- -- --
Self-Description
0.076*
(0.034)
0.007
(0.035)
-0.225***
(0.063)
-0.143**
(0.054)
-0.041
(0.047)
-0.176**
(0.060)
-0.264***
(0.058)
-0.416***
(0.061)
-0.455***
(0.065)
-0.458***
(0.067)
-0.459***
(0.057)
Respondent
Characteristics
Age
0.004***
(0.001)
0.004**
(0.001)
-0.005*
(0.002)
-0.001
(0.002)
-0.004**
(0.001)
-0.008***
(0.002)
-0.007***
(0.002)
-0.006**
(0.002)
-0.012***
(0.002)
-0.007**
(0.002)
-0.003
(0.002)
Education
High school grad
or less (Ref) -- -- -- -- -- --
-- -- -- -- --
Some college
0.070
(0.050)
0.100
(0.051)
0.148
(0.093)
0.089
(0.080)
0.095
(0.069)
0.200*
(0.088)
-0.212*
(0.085)
-0.270**
(0.089)
-0.070
(0.095)
-0.196*
(0.099)
-0.162
(0.084)
College grad +
0.085
(0.046)
0.093*
(0.046)
0.250**
(0.085)
0.190**
(0.073)
0.172**
(0.063)
0.360***
(0.080)
-0.327***
(0.078)
-0.372***
(0.081)
-0.285**
(0.087)
-0.279**
(0.090)
-0.295***
(0.077)
Intercept
4.556***
(0.043)
4.561***
(0.043)
3.590***
(0.079)
3.928***
(0.067)
4.254***
(0.059)
3.710***
(0.074)
2.423***
(0.072)
2.518***
(0.075)
2.447***
(0.081)
2.931***
(0.083)
2.007***
(0.071)
N 991 988 987 984 989 986 990 986 989 988 990
AIC 1599.874 1599.389 2787.673 2473.483 2217.713 2675.216 2634.418 2703.973 2842.041 2911.035 2592.898
* = p < .05 ** = p < .01 *** = p < .001

Appendix C. Item Social Desirability Ratings, Top-Two and Bottom-Two-Box Reporting
Social
Desirability
Rating
Top-Two-Box
Reporting
Overall
Top-Two-Box
Reporting
Agree/Disagree
Top-Two-Box
Reporting
Self-Description
Mean
Std.
Dev. % SE % SE % SE z-value
Diff.
SD – A/D
Positive Valence Q6A: Good citizen 3.20 0.98 97.074 0.536 97.872 0.635 96.203 0.879 1.558 -1.669 Q6B: Moral person 4.10 0.83 97.368 0.510 97.670 0.665 97.040 0.780 0.618 -0.630 Q6C: Leader 1.90 0.94 56.332 1.580 59.884 2.160 52.442 2.304 2.355 -7.442* Q6D: Help community 2.60 0.92 75.102 1.379 80.156 1.761 69.574 2.125 3.834 -10.582*** Q6E: Help others 3.20 1.08 89.282 0.984 91.876 1.203 86.441 1.577 2.760 -5.435** Q6F: Positive community impact 2.40 0.80 67.546 1.492 72.621 1.967 61.996 2.239 3.560 -10.625***
Negative Valence
Q33A: Lose temper 2.30 0.90 7.879 0.857 10.79 1.364 4.671 0.974 3.569 -6.119*** Q33B: Treat others badly 3.10 1.30 8.520 0.890 11.241 1.392 5.532 1.056 3.207 -5.709** Q33C: Stay away when angry 3.40 1.36 10.617 0.981 13.734 1.516 7.204 1.192 3.330 -6.530*** Q33D: Hard to stay calm 2.50 1.28 21.559 1.309 29.866 2.011 12.367 1.522 6.679 -17.499*** Q33E: Hurt others when angry 3.40 1.62 5.455 0.723 6.950 1.119 3.814 0.883 2.170 -3.136*
Social
Desirability
Rating
Bottom-Two-Box
Reporting
Overall
Bottom-Two-Box
Reporting
Agree/Disagree
Bottom-Two-Box
Reporting
Self-Description
Mean Std.
Dev.
% SE % SE % SE z-value Diff.
SD – A/D Positive Valence Q6A: Good citizen 3.20 0.98 0.202 0.143 0.000 0.000 0.422 0.298 -1.478 0.422 Q6B: Moral person 4.10 0.83 0.202 0.143 0.000 0.000 0.423 0.299 -1.477 0.423 Q6C: Leader 1.90 0.94 10.74 0.986 7.558 1.165 14.225 1.611 -3.379 6.667*** Q6D: Help community 2.60 0.92 4.776 0.680 2.140 0.639 7.660 1.228 -4.055 5.520*** Q6E: Help others 3.20 1.08 1.921 0.437 0.774 0.386 3.178 0.808 -2.751 2.404** Q6F: Positive community impact 2.40 0.80 7.404 0.834 3.495 0.810 11.677 1.481 -4.901 8.182***
Negative Valence Q33A: Lose temper 2.30 0.90 72.828 1.415 67.437 2.059 78.769 1.886 -4.003 11.332*** Q33B: Treat others badly 3.10 1.30 72.414 1.424 66.085 2.086 79.362 1.869 -4.659 13.277*** Q33C: Stay away when angry 3.40 1.36 69.565 1.464 61.702 2.140 78.178 1.903 -5.625 16.476*** Q33D: Hard to stay calm 2.50 1.28 55.972 1.58 47.784 2.195 65.032 2.204 -5.453 17.248*** Q33E: Hurt others when angry 3.40 1.62 85.758 1.111 81.081 1.723 90.890 1.326 -4.411 9.809***
* = p < .05 ** = p < .01 *** = p < .001

Appendix D. Item Social Desirability Ratings and Bottom-One-Box Reporting
Social
Desirability
Rating
Bottom-One-
Box Reporting
Overall
Bottom-One-Box
Reporting
Agree/Disagree
Bottom-One-
Box Reporting
Self-Description
Mean
Std.
Dev. % SE % SE % SE z-value
Diff.
SD – A/D
Positive Valence
Q6A: Good citizen 3.20 0.98 0.101 0.101 0.000 0.000 0.211 0.211 -1.045 0.211
Q6B: Moral person 4.10 0.83 0.101 0.101 0.000 0.000 0.211 0.211 -1.044 0.211
Q6C: Leader 1.90 0.94 2.837 0.529 0.388 0.274 5.520 1.053 -4.851 5.132***
Q6D: Help community 2.60 0.92 0.915 0.304 0.195 0.195 1.702 0.597 -2.481 1.507*
Q6E: Help others 3.20 1.08 0.607 0.247 0.387 0.273 0.847 0.422 -0.932 0.46
Q6F: Positive community impact 2.40 0.80 2.028 0.449 1.165 0.473 2.972 0.783 -2.011 1.807*
Negative Valence
Q33A: Lose temper 2.30 0.90 29.596 1.452 26.012 1.928 33.546 2.178 -2.594 7.534**
Q33B: Treat others badly 3.10 1.30 33.164 1.500 22.481 1.840 44.894 2.297 -7.466 22.413***
Q33C: Stay away when angry 3.40 1.36 37.209 1.538 26.499 1.943 48.941 2.303 -7.293 22.442***
Q33D: Hard to stay calm 2.50 1.28 17.713 1.215 13.102 1.483 22.815 1.940 -3.993 9.713***
Q33E: Hurt others when angry 3.40 1.62 62.626 1.538 47.876 2.197 78.814 1.883 -10.049 30.938***
* = p < .05 ** = p < .01 *** = p < .001

Appendix E. Item Nonresponse Rates
Overall Agree/Disagree Self-Description
% SE
% SE % SE t/z-value
Diff.
SD – A/D
Positive Valence
Q6A: Good citizen 1.098 0.329 0.958 0.427 1.250 0.507 0.443 0.292
Q6B: Moral person 1.397 0.371 1.341 0.503 1.458 0.547 0.158 0.117
Q6C: Leader 1.497 0.384 1.149 0.467 1.875 0.620 0.945 0.726
Q6D: Help community 1.796 0.420 1.533 0.538 2.083 0.652 0.656 0.551
Q6E: Help others 1.297 0.358 0.958 0.427 1.667 0.584 0.991 0.709
Q6F: Positive community impact 1.597 0.396 1.341 0.503 1.875 0.619 0.674 0.534
Negative Valence
Q33A: Lose temper 1.198 0.344 0.575 0.331 1.875 0.619 1.890 1.300
Q33B: Treat others badly 1.597 0.396 1.149 0.467 2.083 0.652 1.178 0.934
Q33C: Stay away when angry 1.297 0.358 0.958 0.426 1.667 0.584 0.991 0.709
Q33D: Hard to stay calm 1.397 0.371 0.575 0.331 2.292 0.683 2.313 1.717*
Q33E: Hurt others when angry 1.198 0.344 0.766 0.382 1.667 0.584 1.309 0.900
Note: A/D=Agree-Disagree; SD=Self-Description. * = p < .05 ** = p < .01 *** = p < .001

Appendix F. Regression Coefficients and Standard Errors Predicting Item Nonresponse
Positive Valence Items Negative Valence Items Q6A Q6B Q6C Q6D Q6E Q6F Q33A Q33B Q33C Q33D Q33E
Scale Version
Agree/Disagree (Ref) -- -- -- -- -- -- -- -- -- -- --
Self-Description
0.318
(0.610)
0.106
(0.539)
0.524
(0.532)
0.323
(0.481)
0.597
(0.575)
0.362
(0.509)
1.252
(0.671)
0.646
(0.522)
0.604
(0.576)
1.430*
(0.658)
0.815
(0.620)
Respondent
Characteristics
Age
-0.003
(0.019)
-0.009
(0.016)
0.009
(0.016)
0.017
(0.015)
0.016
(0.018)
0.009
(0.016)
0.013
(0.018)
0.022
(0.016)
0.024
(0.018)
0.037*
(0.018)
0.041*
(0.020)
Education
High school grad or
less (Ref) -- -- -- -- -- --
-- -- -- -- --
Some college
-1.164
(1.233)
-1.197
(0.875)
-0.407
(0.829)
-1.064
(0.721)
-0.772
(0.926)
-0.697
(0.776)
-1.501
(1.166)
-1.029
(0.879)
-1.711
(1.130)
-0.934
(0.886)
-1.589
(1.135)
College grad +
0.422
(0.799)
-0.309
(0.621)
0.187
(0.677)
-0.500
(0.539)
0.103
(0.689)
-0.113
(0.611)
0.117
(0.691)
0.066
(0.605)
-0.155
(0.626)
-0.045
(0.632)
-0.195
(0.645)
Intercept
-4.718***
(0.792)
-3.889***
(0.575)
-4.483***
(0.677)
-3.707***
(0.512)
-4.581***
(0.705)
-4.092***
(0.593)
-5.022***
(0.793)
-4.370***
(0.630)
-4.363***
(0.653)
-5.124***
(0.774)
-4.716***
(0.721)
N 1002 1002 1002 1002 1002 1002 1002 1002 1002 1002 1002
AIC 127.686 154.955 163.721 185.823 145.330 172.165 132.084 167.894 141.665 144.812 129.556
* = p < .05 ** = p < .01 *** = p < .001
Appendix G. Regression Coefficients and Standard Errors Predicting Set Variance and Straightlining
Set Variance Straightlining Positive Grid Negative Grid Positive Grid Negative Grid
Scale Version
Agree/Disagree (Ref) -- -- -- --
Self-Description
0.224***
(0.037)
-0.027
(0.042)
-0.351*
(0.174)
-0.460*
(0.195)
Respondent Characteristics
Age
0.003**
(0.001)
-0.006***
(0.001)
-0.010
(0.005)
0.012
(0.006)
Education
High school graduate or less (Ref) -- -- -- --
Some college
-0.119*
(0.054)
-0.057
(0.061)
0.042
(0.261)
-0.447
(0.266)
College graduate +
-0.192***
(0.049)
-0.132*
(0.056)
0.199
(0.237)
-0.425
(0.236)
Intercept
0.573***
(0.046)
0.749***
(0.052)
-1.579***
(0.218)
-1.376***
(0.432)
n Respondents 992 991 992 991
AIC 1735.857 1982.996 893.995 762.507
* = p < .05 ** = p < .01 *** = p < .001
Appendix H. Comparing A/D and SD Scales in a Telephone Survey
Methods
A/D and SD scales may perform differently across mail and telephone modes because the
cognitive demand and social desirability imposed by modes differs (de Leeuw, 2005). In this
appendix, we compare A/D to SD scales in a telephone survey to establish patterns and inform
future research. This analysis, however, includes only positive valence items asking about topics
that differ from our mail survey. We emphasize that this is not an experimental mode comparison
to the mail survey (e.g., different surveys, timing, and questions), and thus we cannot directly
test mode-related hypotheses.
The data for this study come from the Work and Leisure Today 2 (WLT2) survey, a dual-
frame random-digit dial telephone survey of U.S. adults conducted by Abt SRBI during August
and September 2015. The survey had 58 questions about employment, types of leisure activities,
use of technology, and demographics and had 902 respondents (AAPOR RR3=7.8%). For
landline numbers, the Rizzo method of within-household selection (using the next birthday
method for households with 3 or more adults) was used to randomly select the survey respondent
from among adult household members. For cell phone numbers, the person who answered the
phone was interviewed. WLT2 also contained two experimental questionnaire versions. In
Version One, four positive valence items (see Appendix H Figure 1) were presented in a battery
with an A/D scale (n=451, AAPOR RR3=7.4%). In Version Two, the same items were presented
in a battery with a SD scale (n=451, AAPOR RR3=8.4%). All four items asked respondents
about their job (e.g., “If I work hard at my job, I can get ahead”). These items were administered
only to respondents who indicated they were employed via a filter question, so final sample sizes
for these questions were n=215 for the A/D scale, and n=227 for the SD scale.

Appendix H Figure 1. Battery of Positive Valence Items from the Telephone Survey with
Agree/Disagree and Self-Description Scales.
We examine the same dependent variables (i.e., average responses, item variance, item
nonresponse, set variance, and straightlining) and independent variable (i.e., a 0/1 indicator of
scale version) as in the mail survey. We also code the social desirability of each telephone item
as in the mail survey. Respondent characteristics for the telephone sample, overall and by
experimental version, are presented in Appendix H Table 1. In the telephone survey, each
respondent is nested within an interviewer, yielding a multilevel data structure (Hox, 1994;
Olson and Bilgen, 2011; Olson and Peytchev, 2007). In all bivariate analyses of the telephone
survey, we account for this clustering using Stata’s complex survey design procedures (svy
procedures).

Appendix H Table 1. Summary of Respondent Characteristics.
Overall
Agree/
Disagree
Self-
Description
t-test/Chi-
Square
Number of Respondents 902 451 451
Age (in years) 54.21 54.68 53.75 0.773
Education
High school graduate or less
(Ref) 31.26% 31.71% 30.82% 5.631
Some college 26.16% 22.84% 29.49% College graduate or more 42.57% 45.45% 39.69%
Results
Average responses to three of the four items in the telephone survey did not differ across
scale versions at the p<.05 level (Appendix H Table 2). These same three items, however, were
more variable with the SD scale versus the A/D scale (p<.05) (Appendix H Table 3). Item
nonresponse rates were low and did not significantly differ across the A/D and SD scales for all
four items (Appendix H Table 4). The SD set of items had significantly more response variance
(i.e., less nondifferentiation) than the A/D set (t=3.43, p<.01) (top panel of Appendix H Table 5).
Finally, while the A/D set of items had more straightlining (30.7% of respondents) than the SD
set (26.0% of respondents), the difference was not significant (t=-1.01, p=.320) (bottom panel of
Appendix H Table 5).

Appendix H Table 2. Item Social Desirability Ratings and Means
Social
Desirability
Rating Overall Agree/Disagree Self-Description
Mean
Std.
Dev.
Mean SE Mean SE Mean SE t-value
Diff.
SD – A/D
Q9A: I like my job 2.00 1.18 4.235 0.035 4.265 0.050 4.207 0.049 -.820 -0.058
Q9B: Access to job equipment 1.50 0.92 4.311 0.052 4.206 0.071 4.410 0.064 2.140 0.204*
Q9C: Proud to work at job 2.70 1.00 4.382 0.046 4.315 0.047 4.445 0.070 1.540 0.130
Q9D: Hard work and get ahead 2.50 1.43 3.662 0.063 3.729 0.060 3.597 0.109 -1.060 -0.132 Note: A/D=Agree/Disagree; SD=Self-Description. For items with the A/D scale, Strongly Agree was coded as 5, Agree=4, Neither Agree nor Disagree=3,
Disagree=2, and Strongly Disagree=1. For the SD scale, Completely=5, Mostly=4, Somewhat=3, A Little Bit=2, and Not At All=1. * = p < .05 ** = p < .01
*** = p < .001
Appendix H Table 3. Item Variance by Scale
Overall
Std. Dev.
Overall
Variance
Agree/
Disagree
Std. Dev.
Agree/
Disagree
Variance
Self-
Description
Std. Dev.
Self-
Description
Variance f-value
Diff.
Std. Dev.
SD – A/D
Q9A: I like my job 0.851 0.725 0.748 0.560 0.939 0.882 0.635 0.191***
Q9B: Access to job equipment 0.869 0.756 0.880 0.774 0.849 0.721 1.074 -0.031
Q9C: Proud to work at job 0.798 0.637 0.733 0.537 0.852 0.726 0.740 0.119*
Q9D: Hard work and get ahead 1.255 1.574 1.101 1.213 1.387 1.923 0.630 0.286***
Note: A/D=Agree/Disagree; SD=Self-Description. * = p < .05 ** = p < .01 *** = p < .001
Appendix H Table 4. Item Nonresponse Rates
Overall Agree/Disagree Self-Description
% SE
% SE % SE t/z-value
Diff.
SD – A/D
Q9A: I like my job 0.000 0.000 0.000 0.000 0.000 0.000 -- 0.000
Q9B: Access to job equipment 0.226 0.221 0.465 0.431 0.000 0.000 -- -0.465
Q9C: Proud to work at job 0.453 0.323 0.930 0.649 0.000 0.000 -- -0.930
Q9D: Hard work and get ahead 1.584 0.681 0.465 0.432 2.643 1.224 1.680 2.178
Note: A/D=Agree-Disagree; SD=Self-Description. * = p < .05 ** = p < .01 *** = p < .001

Appendix H Table 5. Nondifferentiation by Scale
Set Variance
Overall Agree-Disagree Self-Description
t-value
Diff.
SD – A/D Variance SE Variance SE Variance SE
Q9 Pos. Valence
Battery 0.692 0.048 0.553 0.041 0.823 0.067 3.430 0.270**
Straightlining
Overall Agree-Disagree Self-Description Diff.
SD – A/D % SE % SE % SE t/z-value
Q9 Pos. Valence
Battery 28.281 2.336 30.698 3.677 25.991 2.888 -1.010 -4.707
Note: A/D=Agree/Disagree; SD=Self-Description. * = p < .05 ** = p < .01 *** = p < .001