Transport policy and climate change: How to decide when experts disagree
8
Transport policy and climate change: How to decide when experts disagree Maria Berrittella a, *, Antonella Certa b , Mario Enea b , Pietro Zito c a Centro Interdipartimentale di Ricerca per la Programmazione Informatica dell’Economia e Tecnologia (CIRPIET), Universita ` degli Studi di Palermo, V.le delle Scienze, 90128 Palermo, Italy b Dipartimento di Tecnologia Meccanica, Produzione e Ingegneria Gestionale (DTMPIG), Universita ` degli Studi di Palermo, V.le delle Scienze, 90128 Palermo, Italy c Dipartimento di Ingegneria dei Trasporti (DITRA), Universita ` degli Studi di Palermo, V.le delle Scienze, 90128 Palermo, Italy 1. Introduction The transport system has mutual interactions and multi- dimensional effects on environment (i.e. in terms of urban air pollution, climate change and land use), economic develop- ment (i.e. in terms of GDP) and social equity (i.e. in terms of accessibility, human health, life quality of cities and metro- politan areas). Amongst the industries, transport is the sector with the fastest growth of greenhouse gases emissions, both in developed and in developing countries. In developed countries this problem is intensified with substantial growth in transport volumes. For example, in Italy, passenger and freight traffic have risen, respectively, by 29.5% and 22.75%, in the period 1990–2000. These traffic flows are expected to grow in the next years and, if no environmental policy action is applied by the government, the greenhouse gas emissions will increase (Mazzarino, 2000). The Italian government has developed the new Master Plan, which deals with the Kyoto Protocol on Climate Change of 1997. On the basis of this Protocol, the transport sector is committed to contribute to 15% reduction (with respect to the 1990 levels) of its CO 2 emissions. This is equivalent to reduce the CO 2 emissions by about 30 millions tons per year (t/year). On the other hand, developing countries strongly rely on energy consumption for their daily mobility. For example, in Singapore the rapid economic development has led to increase the demand for land transportation, which is strongly dependent on oil. Various measures and recommendations were announced and documented in the Singapore Green Plan to reduce the greenhouse gas emissions Poh and Ang (1999). The aim of the different plans to reduce the greenhouse gas emissions and, hence, the adverse climate change impacts, can usually be achieved by different transport policies, each characterized quantitatively and qualitatively by different effects on the transportation system itself, as well as on environmental science & policy 11 (2008) 307–314 article info Published on line 17 March 2008 Keywords: Analytic hierarchy process Transport policies Climate change Uncertainty abstract Transport is the sector with the fastest growth of greenhouse gases emissions in many countries. Accumulation of these emissions may cause uncertain and irreversible adverse climate change impacts. In this context, we use the analytic hierarchy process (AHP) to face the question on how to select the best transport policy if the experts have different opinions and beliefs on the occurrence of these impacts. Thus, both the treatment of uncertainty and dissent are examined for the ranking of transport policies. The opinions of experts have been investigated by a means of a survey questionnaire. A sensitivity analysis of the experts’ weights and the criteria’ weights confirms the robustness of the results. # 2008 Elsevier Ltd. All rights reserved. * Corresponding author. Tel.: +39 091 238412; fax: +39 091 423105. E-mail address: [email protected] (M. Berrittella). available at www.sciencedirect.com journal homepage: www.elsevier.com/locate/envsci 1462-9011/$ – see front matter # 2008 Elsevier Ltd. All rights reserved. doi:10.1016/j.envsci.2008.01.008
Transcript of Transport policy and climate change: How to decide when experts disagree
e n v i r o n m e n t a l s c i e n c e & p o l i c y 1 1 ( 2 0 0 8 ) 3 0 7 – 3 1 4
avai lab le at www.sc iencedi rec t .com
journal homepage: www.e lsev ier .com/ locate /envsc i
Transport policy and climate change: How to decidewhen experts disagree
Maria Berrittella a,*, Antonella Certa b, Mario Enea b, Pietro Zito c
aCentro Interdipartimentale di Ricerca per la Programmazione Informatica dell’Economia e Tecnologia (CIRPIET),
Universita degli Studi di Palermo, V.le delle Scienze, 90128 Palermo, ItalybDipartimento di Tecnologia Meccanica, Produzione e Ingegneria Gestionale (DTMPIG),
Universita degli Studi di Palermo, V.le delle Scienze, 90128 Palermo, ItalycDipartimento di Ingegneria dei Trasporti (DITRA), Universita degli Studi di Palermo,
V.le delle Scienze, 90128 Palermo, Italy
a r t i c l e i n f o
Published on line 17 March 2008
Keywords:
Analytic hierarchy process
Transport policies
Climate change
a b s t r a c t
Transport is the sector with the fastest growth of greenhouse gases emissions in many
countries. Accumulation of these emissions may cause uncertain and irreversible adverse
climate change impacts. In this context, we use the analytic hierarchy process (AHP) to face
the question on how to select the best transport policy if the experts have different opinions
and beliefs on the occurrence of these impacts. Thus, both the treatment of uncertainty and
dissent are examined for the ranking of transport policies. The opinions of experts have
means of a survey questionnaire. A sensitivity analysis of the experts’
ria’ weights confirms the robustness of the results.
Uncertaintyweights and the crite
been investigated by a
# 2008 Elsevier Ltd. All rights reserved.
1. Introduction
The transport system has mutual interactions and multi-
dimensional effects on environment (i.e. in terms of urban air
pollution, climate change and land use), economic develop-
ment (i.e. in terms of GDP) and social equity (i.e. in terms of
accessibility, human health, life quality of cities and metro-
politan areas).
Amongst the industries, transport is the sector with the
fastest growth of greenhouse gases emissions, both in
developed and in developing countries. In developed countries
this problem is intensified with substantial growth in
transport volumes. For example, in Italy, passenger and
freight traffic have risen, respectively, by 29.5% and 22.75%,
in the period 1990–2000. These traffic flows are expected to
grow in the next years and, if no environmental policy action is
applied by the government, the greenhouse gas emissions will
increase (Mazzarino, 2000). The Italian government has
* Corresponding author. Tel.: +39 091 238412; fax: +39 091 423105.E-mail address: [email protected] (M. Berrittella).
1462-9011/$ – see front matter # 2008 Elsevier Ltd. All rights reserveddoi:10.1016/j.envsci.2008.01.008
developed the new Master Plan, which deals with the Kyoto
Protocol on Climate Change of 1997. On the basis of this
Protocol, the transport sector is committed to contribute to
15% reduction (with respect to the 1990 levels) of its CO2
emissions. This is equivalent to reduce the CO2 emissions by
about 30 millions tons per year (t/year). On the other hand,
developing countries strongly rely on energy consumption for
their daily mobility. For example, in Singapore the rapid
economic development has led to increase the demand for
land transportation, which is strongly dependent on oil.
Various measures and recommendations were announced
and documented in the Singapore Green Plan to reduce the
greenhouse gas emissions Poh and Ang (1999).
The aim of the different plans to reduce the greenhouse gas
emissions and, hence, the adverse climate change impacts,
can usually be achieved by different transport policies, each
characterized quantitatively and qualitatively by different
effects on the transportation system itself, as well as on
.

e n v i r o n m e n t a l s c i e n c e & p o l i c y 1 1 ( 2 0 0 8 ) 3 0 7 – 3 1 4308
environment, economic growth and social context. But as
there is uncertainty on the occurrence of those impacts, a
problem on how to select the best transport policy arises. The
expected utility theory (EUT) is not appropriate as a general
theory of decision-making under pure uncertainty, which
prevails when the space of outcomes is well defined, but the
decision maker has no basis for assigning probabilities to the
different outcomes, such as in the case of climate change
impacts. By construction, von Neumann-Mongersten utilities
are insensitive to low probability events and, hence, this
makes the expected utility approach inadequate for evaluat-
ing events under pure uncertainty. Furthermore, a second
reason is that decision makers have different attitudes to
gains and losses. Kahneman and Tversky (1979) found that
disutility that people experienced from a loss of some
magnitude often outweighed the utility from a gain of the
same magnitude.
In this context, we have faced the problem by collecting the
opinions of experts. However, the choice may become difficult
if the experts have different beliefs and opinions. Thus, the
problem to take into account is that of a decision-maker that
faces a panel of experts with differing beliefs about alternative
transport policies to reduce climate change impacts.
To our knowledge this paper is the first which concerns with
the evaluation of the transport policies at global level. In facts,
although various studies have been carried out on the design
and evaluation of transport strategies (Colorni et al., 1999; May
et al., 2000; Vold, 2005), essentially, all these works analyse the
optimal transport strategy in urban areas or at local level.
Furthermore, as there is uncertainty on the occurrence of the
climate change impacts and there is lack of consensus among
experts about them, the paper addresses the question on how to
form transport policies when the experts disagree.
The opinions of experts have been surveyed by a means of a
questionnaire. The experts were chosen as individuals with an
in-depth understanding of the transport policies and their
effects on climate change. Experts did not have to agree on the
relative importance of the criteria or the rankings of the
alternatives, but each expert entered his judgements giving a
distinct, identifiable contribution to the issue. The experts had
tocomparesixpolicyoptions: (i)voluntaryagreementsamongst
industries to improve the ecological efficiency of new vehicles;
(ii) incentives for turnover of car fleet renewal; (iii) tax schemes
aiming at promoting environmental-friendly transport modes;
(iv) better integration between transport planning and land
uses; (v) new and better transport infrastructures; (vi) devel-
opment of intelligent transport system (ITS) technologies.
We have applied the analytic hierarchy process (AHP),
developed by Saaty (1980), which decomposes the decisional
Table 1 – The AHP pairwise comparison scale
Numerical values Verbal scale
1 Equal importance of both elements
3 Moderate importance of one element over anoth
5 Strong importance of one element over another
7 Very strong importance of one element over ano
9 Extreme importance of one element over anothe
2, 4, 6, 8 Intermediate values
process in a hierarchy of criteria, subcriteria, attributes and
alternatives through a set of weights. The AHP has been widely
applied to assess numerous complex environmental and
economic problems (Alphonce, 1997; Ramanathan, 2001; Duke
and Aull-hyde, 2002; Ferrari, 2003). Furthermore, we run the
sensitivity analysis to test under which conditions the ranking
of policies may change if some parameters change. The
method has involved specifying a certain number of experi-
ments, which set different possible combinations of two
parameters: the criteria’ weights and the experts’ weights. The
sensitivity analysis confirms the robustness of the policy
ranking.
2. The methodology
The AHP is a method of measurement for formulating and
analyzing decisions. Saaty (1980) provided a theoretical
foundation for the AHP, which is a decision support tool
appropriate to solve complex decision problems taking into
account tangible and intangible aspects. Therefore, it supports
decision makers to make decisions involving their experience,
knowledge and intuition.
The AHP decomposes the decision problem into ele-
ments, according to their common characteristics, and
levels, which correspond to the common characteristic of
the elements. The topmost level is the ‘‘focus’’ of the
problem or ultimate goal; the intermediate levels corre-
spond to criteria and sub-criteria, while the lowest level
contains the ‘‘decision alternatives’’. If each element of each
level depends on all the elements of the upper level, then
the hierarchy is complete; otherwise, it is considered
incomplete. The elements of each level are compared
pairwise with respect to a specific element in the immediate
upper level.
Table 1 reports the pairwise comparison scale used in the
AHP developed by Saaty (1977). It allows to convert the
qualitative judgments into numerical values, also with
intangible attributes.
For computing the priorities of the elements, a judgmental
matrix is assumed as follows:
A ¼
a11 a12 . . . a1n
a21 a22 . . . a2n
. . . . . . . . . . . .an1 an2 . . . ann
2664
3775 (1)
where aij represents the pairwise comparison rating between
the element i and element j of a level with respect to the upper
Explanation
Two elements contribute equally
er Experience and judgment favour one element over another
An element is strongly favoured
ther An element is very strongly dominant
r An element is favoured by at least an order of magnitude
Used to compromise between two judgments
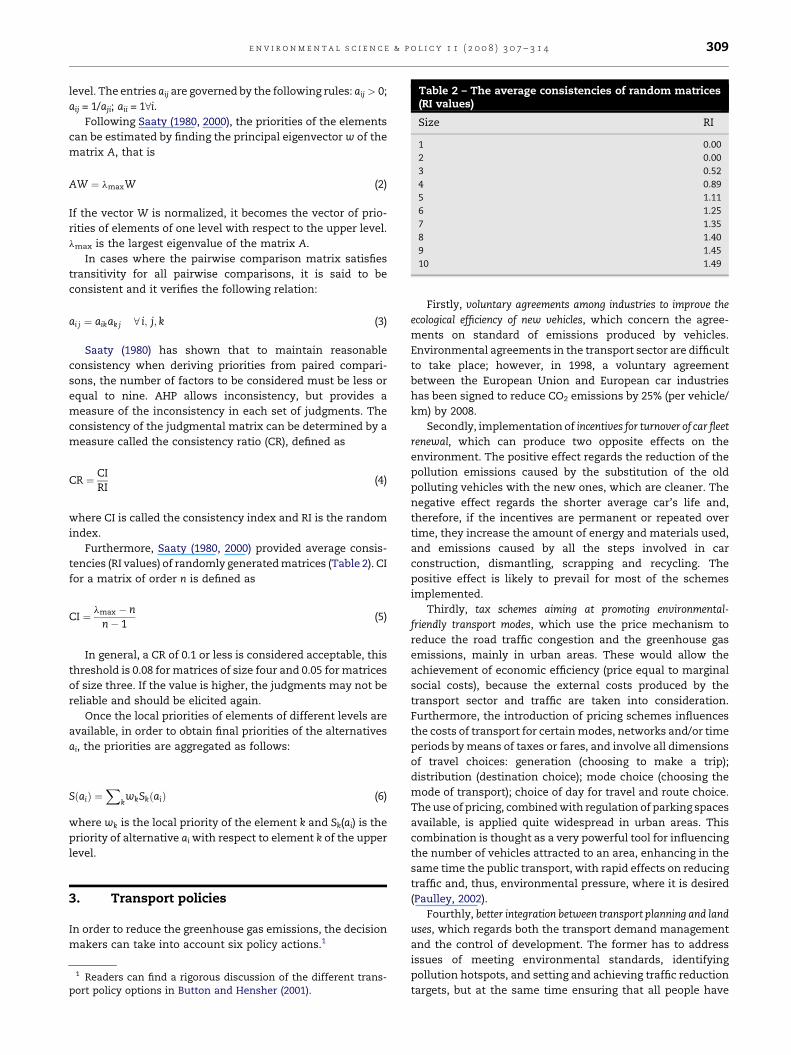
Table 2 – The average consistencies of random matrices(RI values)
Size RI
1 0.00
2 0.00
3 0.52
4 0.89
5 1.11
6 1.25
7 1.35
8 1.40
9 1.45
10 1.49
e n v i r o n m e n t a l s c i e n c e & p o l i c y 1 1 ( 2 0 0 8 ) 3 0 7 – 3 1 4 309
level. The entries aij are governed by the following rules: aij > 0;
aij = 1/aji; aii = 18i.Following Saaty (1980, 2000), the priorities of the elements
can be estimated by finding the principal eigenvector w of the
matrix A, that is
AW ¼ lmaxW (2)
If the vector W is normalized, it becomes the vector of prio-
rities of elements of one level with respect to the upper level.
lmax is the largest eigenvalue of the matrix A.
In cases where the pairwise comparison matrix satisfies
transitivity for all pairwise comparisons, it is said to be
consistent and it verifies the following relation:
ai j ¼ aikak j 8 i; j; k (3)
Saaty (1980) has shown that to maintain reasonable
consistency when deriving priorities from paired compari-
sons, the number of factors to be considered must be less or
equal to nine. AHP allows inconsistency, but provides a
measure of the inconsistency in each set of judgments. The
consistency of the judgmental matrix can be determined by a
measure called the consistency ratio (CR), defined as
CR ¼ CIRI
(4)
where CI is called the consistency index and RI is the random
index.
Furthermore, Saaty (1980, 2000) provided average consis-
tencies (RI values) of randomly generated matrices (Table 2). CI
for a matrix of order n is defined as
CI ¼ lmax � nn� 1
(5)
In general, a CR of 0.1 or less is considered acceptable, this
threshold is 0.08 for matrices of size four and 0.05 for matrices
of size three. If the value is higher, the judgments may not be
reliable and should be elicited again.
Once the local priorities of elements of different levels are
available, in order to obtain final priorities of the alternatives
ai, the priorities are aggregated as follows:
SðaiÞ ¼X
kwkSkðaiÞ (6)
where wk is the local priority of the element k and Sk(ai) is the
priority of alternative ai with respect to element k of the upper
level.
3. Transport policies
In order to reduce the greenhouse gas emissions, the decision
makers can take into account six policy actions.1
1 Readers can find a rigorous discussion of the different trans-port policy options in Button and Hensher (2001).
Firstly, voluntary agreements among industries to improve the
ecological efficiency of new vehicles, which concern the agree-
ments on standard of emissions produced by vehicles.
Environmental agreements in the transport sector are difficult
to take place; however, in 1998, a voluntary agreement
between the European Union and European car industries
has been signed to reduce CO2 emissions by 25% (per vehicle/
km) by 2008.
Secondly, implementation of incentives for turnover of car fleet
renewal, which can produce two opposite effects on the
environment. The positive effect regards the reduction of the
pollution emissions caused by the substitution of the old
polluting vehicles with the new ones, which are cleaner. The
negative effect regards the shorter average car’s life and,
therefore, if the incentives are permanent or repeated over
time, they increase the amount of energy and materials used,
and emissions caused by all the steps involved in car
construction, dismantling, scrapping and recycling. The
positive effect is likely to prevail for most of the schemes
implemented.
Thirdly, tax schemes aiming at promoting environmental-
friendly transport modes, which use the price mechanism to
reduce the road traffic congestion and the greenhouse gas
emissions, mainly in urban areas. These would allow the
achievement of economic efficiency (price equal to marginal
social costs), because the external costs produced by the
transport sector and traffic are taken into consideration.
Furthermore, the introduction of pricing schemes influences
the costs of transport for certain modes, networks and/or time
periods by means of taxes or fares, and involve all dimensions
of travel choices: generation (choosing to make a trip);
distribution (destination choice); mode choice (choosing the
mode of transport); choice of day for travel and route choice.
The use of pricing, combined with regulation of parking spaces
available, is applied quite widespread in urban areas. This
combination is thought as a very powerful tool for influencing
the number of vehicles attracted to an area, enhancing in the
same time the public transport, with rapid effects on reducing
traffic and, thus, environmental pressure, where it is desired
(Paulley, 2002).
Fourthly, better integration between transport planning and land
uses, which regards both the transport demand management
and the control of development. The former has to address
issues of meeting environmental standards, identifying
pollution hotspots, and setting and achieving traffic reduction
targets, but at the same time ensuring that all people have
e n v i r o n m e n t a l s c i e n c e & p o l i c y 1 1 ( 2 0 0 8 ) 3 0 7 – 3 1 4310
appropriate levels of accessibility to jobs, services and
facilities. The latter has to control the development of
activities within existing public transport corridors (mainly,
with integrated public transport systems by time scheduling,
space coordination and fare integration) and by making the
city structure more easily accessible, improving living condi-
tions and decentralizing business and services activities.
(Banister, 2001).
Fifthly, implementation of new and better transport infra-
structures. The transport systems depend on the capacity of the
infrastructure. The rapid growth in transport demand and,
hence, of the congestion in transport infrastructures (port,
airport, highways and rail stations) requires either new
constructions or transport demand management policies.
Environmental and social costs involved in the construction of
new infrastructures make this solution unacceptable and not
good in the long period, because the expected growth demand
will be able to cause still worse congestion levels. On the other
hand, transport demand management policies can increase
the capacity of infrastructures through information provision.
Nevertheless, in all cities road construction is still seen as an
important measure, as well as the construction of pedestrian
areas. Construction of public transport infrastructure depends
on the present public transport system and on the size of the
city. Bus and/or tram lanes are used or planned and light rail
systems are in use in many cities. Park and ride facilities are
built in the larger cities and off street parking facilities in
smaller cities. Traffic calming infrastructure and cycle paths
have been planned in many cities (Lakshmanan and Ander-
son, 2001; May et al., 2003).
Finally, development of intelligent transport systems (ITS) and
information technologies are now emerging as a set of key tools
for improvement in the management of the transportation
network. These must be considered in the context of travel
demand management, because the new and emerging
technologies allow to improve the modal split of travel. There
is a number of possible ways to affect peoples’ choices as to
which mode of travel to select in space and in time, in broad
terms. These are the following:
(i) r
educe the reliance or attractiveness of private transportthrough measure, such as private vehicle access control;
(ii) in
crease the attractiveness of more environmental andsustainable forms of transport (such as public transport,
car pooling);
(iii) u
se of new telematics means to reduce the reliance ontravel to congested business areas and city centres by trip
substitution in the form of teleworking/telecommuting.
2 The experts have been selected from Institute for TransportStudies (University of Leeds, Leeds, UK), Institute for Environmentand Sustainability, Transport and Air Quality Unit (EuropeanCommission, Ispra, Italy), Danish Transport Research Institute(Denmark) and Centre for Transport Research (Roskilde Univer-sity, Denmark).
In terms of integrated transport and demand management,
a key requirement is to facilitate the interchange between the
private and public transport. Whilst the information provi-
sion, both on trip and pre-trip, provides the mechanism by
which the traveller make an informed decision on mode, time
and route, public transport, dedicated bus lanes and other bus
priority measures are the key to provide a service with more
reliable travel times and a quicker route through the congested
road network. The provision of information is a means for the
success of transport integration and interchange. Intelligent
transport systems offer many new routes for the provision of
this information before the user begins his or her trip. These
systems also dynamically provide information to users on trip
through in-vehicle delivery of information, roadside mounted
VMS, personal information devices (SMS mobile phone) as
well as the internet, kiosks and information boards at
interchange facilities (Taylor, 2001; Chowdhury and Sadek,
2003).
4. Assessment of alternative transportpolicies
In order to evaluate alternative transport policies to reduce the
adverse climate change impacts, we have investigated the
opinions of nine experts on transport policies and economics
by a means of a survey questionnaire. The expert sample is
formed by two associate professors and seven researchers
coming from different academic institutions.2 Their scientific
research is mainly on transport policy and environment.
Consulting more experts avoids bias that may be present
when the judgements are considered from a single expert.
Experts did not have to agree on the relative importance of the
criteria or the rankings of the alternatives. Each expert entered
his judgement and gave a distinct, identifiable contribution to
the issue.
For the case study, a three-level AHP has been applied, as
shown in Fig. 1. The first level is composed of the final goal one
wishes to attain in carrying out the project: reduction of the
adverse climate change impacts due to the transport sector.
The second level represents the criteria on the basis of
which the projects are to be evaluated:
� a
doption of fuels with reduced carbon content (C1);� t
echnological improvements in the ecological efficiency ofvehicles (C2);
� in
crease in the public and multi-modal transport marketshare (C3);
� im
provements due to better mobility management systems(C4).
The third level presents the policy options, which are:
� v
oluntary agreements amongst industries to improve theecological efficiency of new vehicles (A1);
� in
centives for turnover of car fleet renewal (A2);� t
ax schemes aiming at promoting environmental-friendlytransport modes (A3);
� b
etter integration between transport planning and land uses(A4);
� n
ew and better transport infrastructures (A5);� d
evelopment of intelligent transport system (ITS) technol-ogies (A6).
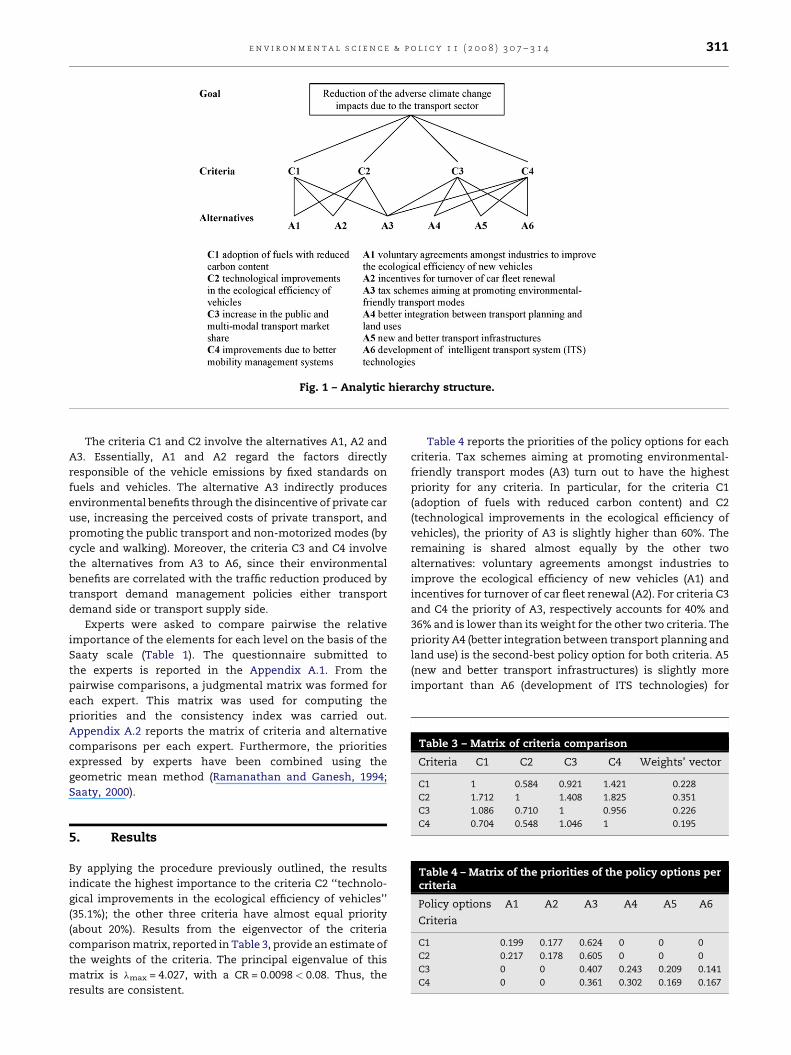
Fig. 1 – Analytic hierarchy structure.
Table 3 – Matrix of criteria comparison
Criteria C1 C2 C3 C4 Weights’ vector
C1 1 0.584 0.921 1.421 0.228
C2 1.712 1 1.408 1.825 0.351
e n v i r o n m e n t a l s c i e n c e & p o l i c y 1 1 ( 2 0 0 8 ) 3 0 7 – 3 1 4 311
The criteria C1 and C2 involve the alternatives A1, A2 and
A3. Essentially, A1 and A2 regard the factors directly
responsible of the vehicle emissions by fixed standards on
fuels and vehicles. The alternative A3 indirectly produces
environmental benefits through the disincentive of private car
use, increasing the perceived costs of private transport, and
promoting the public transport and non-motorized modes (by
cycle and walking). Moreover, the criteria C3 and C4 involve
the alternatives from A3 to A6, since their environmental
benefits are correlated with the traffic reduction produced by
transport demand management policies either transport
demand side or transport supply side.
Experts were asked to compare pairwise the relative
importance of the elements for each level on the basis of the
Saaty scale (Table 1). The questionnaire submitted to
the experts is reported in the Appendix A.1. From the
pairwise comparisons, a judgmental matrix was formed for
each expert. This matrix was used for computing the
priorities and the consistency index was carried out.
Appendix A.2 reports the matrix of criteria and alternative
comparisons per each expert. Furthermore, the priorities
expressed by experts have been combined using the
geometric mean method (Ramanathan and Ganesh, 1994;
Saaty, 2000).
C3 1.086 0.710 1 0.956 0.226
C4 0.704 0.548 1.046 1 0.195
Table 4 – Matrix of the priorities of the policy options percriteria
Policy options A1 A2 A3 A4 A5 A6
Criteria
C1 0.199 0.177 0.624 0 0 0
C2 0.217 0.178 0.605 0 0 0
C3 0 0 0.407 0.243 0.209 0.141
C4 0 0 0.361 0.302 0.169 0.167
5. Results
By applying the procedure previously outlined, the results
indicate the highest importance to the criteria C2 ‘‘technolo-
gical improvements in the ecological efficiency of vehicles’’
(35.1%); the other three criteria have almost equal priority
(about 20%). Results from the eigenvector of the criteria
comparison matrix, reported in Table 3, provide an estimate of
the weights of the criteria. The principal eigenvalue of this
matrix is lmax = 4.027, with a CR = 0.0098 < 0.08. Thus, the
results are consistent.
Table 4 reports the priorities of the policy options for each
criteria. Tax schemes aiming at promoting environmental-
friendly transport modes (A3) turn out to have the highest
priority for any criteria. In particular, for the criteria C1
(adoption of fuels with reduced carbon content) and C2
(technological improvements in the ecological efficiency of
vehicles), the priority of A3 is slightly higher than 60%. The
remaining is shared almost equally by the other two
alternatives: voluntary agreements amongst industries to
improve the ecological efficiency of new vehicles (A1) and
incentives for turnover of car fleet renewal (A2). For criteria C3
and C4 the priority of A3, respectively accounts for 40% and
36% and is lower than its weight for the other two criteria. The
priority A4 (better integration between transport planning and
land use) is the second-best policy option for both criteria. A5
(new and better transport infrastructures) is slightly more
important than A6 (development of ITS technologies) for
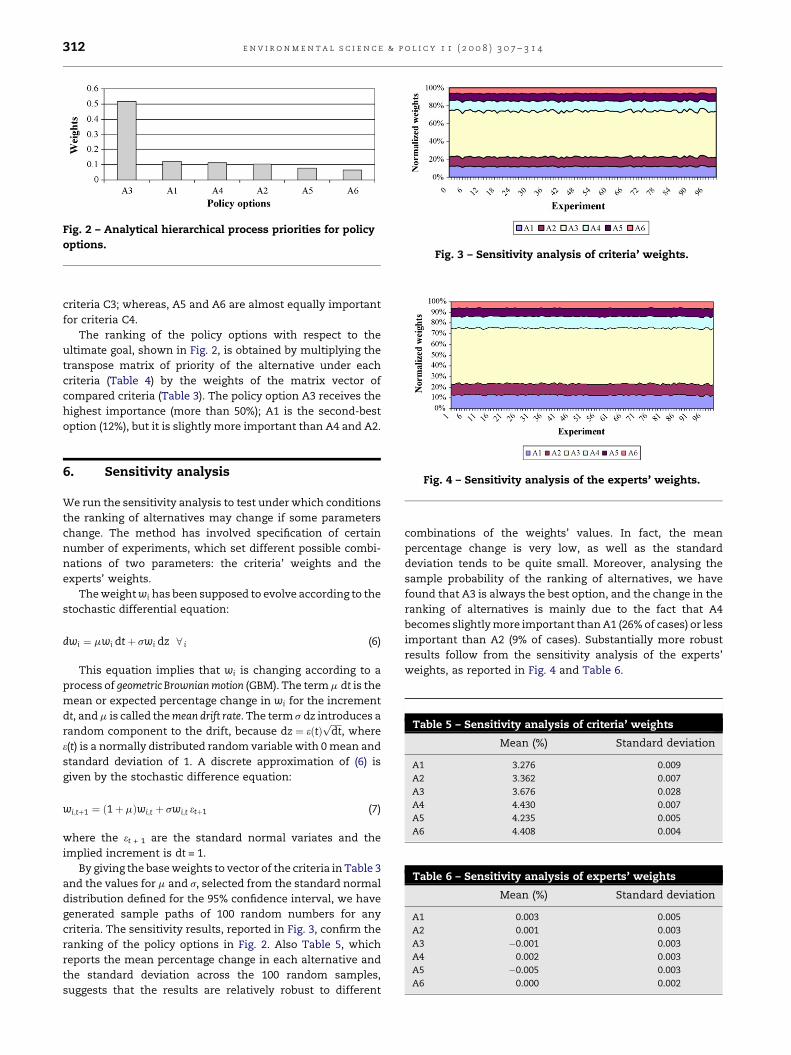
Fig. 2 – Analytical hierarchical process priorities for policy
options.Fig. 3 – Sensitivity analysis of criteria’ weights.
e n v i r o n m e n t a l s c i e n c e & p o l i c y 1 1 ( 2 0 0 8 ) 3 0 7 – 3 1 4312
criteria C3; whereas, A5 and A6 are almost equally important
for criteria C4.
The ranking of the policy options with respect to the
ultimate goal, shown in Fig. 2, is obtained by multiplying the
transpose matrix of priority of the alternative under each
criteria (Table 4) by the weights of the matrix vector of
compared criteria (Table 3). The policy option A3 receives the
highest importance (more than 50%); A1 is the second-best
option (12%), but it is slightly more important than A4 and A2.
Table 5 – Sensitivity analysis of criteria’ weights
Mean (%) Standard deviation
A1 3.276 0.009
A2 3.362 0.007
A3 3.676 0.028
A4 4.430 0.007
A5 4.235 0.005
A6 4.408 0.004
Fig. 4 – Sensitivity analysis of the experts’ weights.
Table 6 – Sensitivity analysis of experts’ weights
Mean (%) Standard deviation
A1 0.003 0.005
A2 0.001 0.003
A3 �0.001 0.003
A4 0.002 0.003
A5 �0.005 0.003
A6 0.000 0.002
6. Sensitivity analysis
We run the sensitivity analysis to test under which conditions
the ranking of alternatives may change if some parameters
change. The method has involved specification of certain
number of experiments, which set different possible combi-
nations of two parameters: the criteria’ weights and the
experts’ weights.
The weight wi has been supposed to evolve according to the
stochastic differential equation:
dwi ¼ mwi dtþ swi dz 8 i (6)
This equation implies that wi is changing according to a
process of geometric Brownianmotion (GBM). The term m dt is the
mean or expected percentage change in wi for the increment
dt, and m is called the mean drift rate. The term s dz introduces a
random component to the drift, because dz ¼ eðtÞffiffiffiffiffidtp
, where
e(t) is a normally distributed random variable with 0 mean and
standard deviation of 1. A discrete approximation of (6) is
given by the stochastic difference equation:
wi;tþ1 ¼ ð1þ mÞwi;t þ swi;t etþ1 (7)
where the et + 1 are the standard normal variates and the
implied increment is dt = 1.
By giving the base weights to vector of the criteria in Table 3
and the values for m and s, selected from the standard normal
distribution defined for the 95% confidence interval, we have
generated sample paths of 100 random numbers for any
criteria. The sensitivity results, reported in Fig. 3, confirm the
ranking of the policy options in Fig. 2. Also Table 5, which
reports the mean percentage change in each alternative and
the standard deviation across the 100 random samples,
suggests that the results are relatively robust to different
combinations of the weights’ values. In fact, the mean
percentage change is very low, as well as the standard
deviation tends to be quite small. Moreover, analysing the
sample probability of the ranking of alternatives, we have
found that A3 is always the best option, and the change in the
ranking of alternatives is mainly due to the fact that A4
becomes slightly more important than A1 (26% of cases) or less
important than A2 (9% of cases). Substantially more robust
results follow from the sensitivity analysis of the experts’
weights, as reported in Fig. 4 and Table 6.

e n v i r o n m e n t a l s c i e n c e & p o l i c y 1 1 ( 2 0 0 8 ) 3 0 7 – 3 1 4 313
7. Discussion and conclusions
Amongst the alternative policies, the tax schemes aiming at
promoting environmental-friendly transport modes have been
identified as the best transport policy to reduce the adverse
climate change impacts. Thus, the experts still now retain that
only if people pay for the full costs due to their choices, then the
reduction in traffic, and, hence, of emissions, is obtained,
because pricing policies are able to affect the behaviour of road
users, increasing their perceived costs of private transport.
However, this policy action may fail if the willingness to pay by
road users is high. Furthermore, as in any use of prices, there are
problems of fairness and equity: a ban which applies equally to
everybody is often perceived as fairer than using prices, which
affect some people than others. It follows that a key role has to
be played by the public transport system, which should be able
to attract major shares of the transport demand by information
diffusion (pre- and on-trip) and by improving the perceived
quality of the service. Also, government should promote public
and environmental-friendly transport modes, such as car
sharing and car-pooling, or non-motorized modes. The efforts
of planning should be addressed to modify the behaviour of
users, rationalizing their trips (reducing number of kilometres
run and eliminating unnecessary trips), and rebalancing their
modal choices to reduce climate change impacts.
As the ranking of policies depends strongly on the sample of
interviewed experts, to avoid bias in the results, a sensitivity
analysis has been run, that confirms the robustness of the
results. Of course, the results may change if other groups, such
as stakeholders, policy makers and citizen groups, are involved.
But the choice to select only experts finds reasons in the fact
that experts, more than the other groups, are challenged to
meet the needs of stakeholders and public. Finally, the
methodology is striking. It integrates two relevant questions
in the effectiveness of policy assessment: how uncertainty is
managed and how opposing insights are dealt with.
Acknowledgements
We are grateful to Agne Dobranskyte, the experts and two
anonymous reviewers for their useful comments. We also
thank Carlo Carraro and Fondazione ENI Enrico Mattei (FEEM,
Italy), where an earlier version of the paper circulated as
working paper and by which we have received suggestions to
improve the paper.
Appendix A. Supplementary data
Supplementary data associated with this article can be
found, in the online version, at doi:10.1016/j.envsci.2008.01.008.
r e f e r e n c e s
Alphonce, C.B., 1997. Application of the analytic hierarchyprocess in agriculture in developing countries. Agric. Syst.53, 97–112.
Banister, D., 2001. Transport planning. In: Button, K.J., Hensher,D.A. (Eds.), Handbook of Transport Systems and TrafficControl, Vol. 3. Pergamon, pp. 9–19.
Button, K.J., Hensher, D.A., 2001. Handbook of TransportSystems and Traffic Control. Pergamon, Oxford (UK).
Chowdhury, M.A., Sadek, A., 2003. Fundamentals of IntelligentTransportation Systems Planning. Artech House, Boston.
Colorni, A., Laniado, E., Muratori, S., 1999. Decision supportsystems for environmental impact assessment of transportinfrastructures. Transport. Res. D 4, 1–11.
Duke, J.M., Aull-hyde, R., 2002. Identifying public preferences forland preservation using the analytic hierarchy process. Ecol.Eco. 42, 131–145.
Ferrari, P., 2003. A method for choosing from among alternativetransportation projects. Eur. J. Oper. Res. 150, 194–203.
Kahneman, D., Tversky, A., 1979. Prospect theory: an analysis ofdecision making under risk. Econometrica 47, 263–291.
Lakshmanan, T.R., Anderson, W.P., 2001. Infrastructurecapacity. In: Button, K.J., Hensher, D.A. (Eds.), Handbook ofTransport Systems and Traffic Control. Pergamon, Oxford(UK).
May, A., Sheperd, S.P., Timms, P.M., 2000. Optimal transportstrategies for European cities. Transportation 27, 285–315.
May, A.D., Jopson, A.F., Matthews, B., 2003. Research challengesin urban transport policy. Transport Policy 10, 157–164.
Mazzarino, M., 2000. The economics of the greenhouse effect:evaluating the climate change impact due to the transportsector in Italy. Energy Policy 28, 957–966.
Paulley, N., 2002. Recent studies on key issues in road pricing.Transport Policy 7, 175–177.
Poh, K.L., Ang, B.W., 1999. Transportation fuels and policy forSingapore: an AHP planning process. Comput. Ind. Eng. 37,507–525.
Ramanathan, R., 2001. A note on the use of the analytichierarchy process for environmental impact assessment. J.Environ. Manage. 63, 27–35.
Ramanathan, R., Ganesh, L.S., 1994. Group preferenceaggregation method employed in the AHP: an evaluationand an intrinsic process for deriving members’ weightages.Eur. J. Oper. Res. 79, 249–265.
Saaty, T.L., 1977. A scaling method for priorities in hierarchialstructures. J. Math. Psychol. 15, 234–281.
Saaty, T.L., 1980. The Analytic Hierarchy Process: Planning,Priority Setting and Resource Allocation. McGraw-Hill, NewYork.
Saaty, T.L., 2000. Fundamentals of Decision Making and PriorityTheory with the Analytic Hierarchy Process. RWSPublication, Pittsburg.
Taylor, M.A.P., 2001. Intelligent transport systems. In: Button,K.J., Hensher, D.A. (Eds.), Handbook of Transport Systemsand Traffic Control. Pergamon, Oxford (UK).
Vold, A., 2005. Optimal land use and transport planning for theGreater Oslo area. Transport. Res. A 39, 548–565.
Maria Berrittella is a senior research fellow at the University ofPalermo, Italy. She holds a MSc in Environmental Economics fromthe Environment Department, University of York, UK, and a PhD inEconomics from ‘‘La Sapienza’’ University, Italy. She is also lec-turer of Applied Economics for Engineering. Her research has beenfocused mainly on climate change and water policy.
Antonella Certa is a doctoral candidate at the University ofPalermo in the Economic Analysis, Technology Innovation andManagement of the Development Policy Studies Program. Herresearch has been focused mainly on multicriteria analysis.
Mario Enea is professor at the University of Palermo in ProjectManagement, Industrial Plant Management and Applied Econom-

e n v i r o n m e n t a l s c i e n c e & p o l i c y 1 1 ( 2 0 0 8 ) 3 0 7 – 3 1 4314
ics for Engineering. His research fields include production man-agement, scheduling problems related to project management,optimal layout problems, environmental impact evaluation andwaste management.
Pietro Zito is a senior research fellow at the University of Palermo,Italy. He holds a PhD in Transport Engineering from the Universityof Palermo, Italy. His research has been focused mainly on trans-port policy and modelling.