A Method for Constructing Likert Scales
12
A METHOD FOR CONSTRUCTING LIKERT SCALES JAMAL MUNSHI ABSTRACT: Likert scales may be tailored for any given instrument and semantics by performing a pretest using unmarked lines as continuous scales, measuring the distances marked by the respondents, and using cluster analysis to determine the optimal number and placement of scale points for the actual study. The tailor-made scale is likely to produce an instrument of higher precision than one constructed with an arbitrary number of scale points and arbitrary placement of the scale points 1 . 1. INTRODUCTION Semantic scales like the Likert, the Stapel, and the Semantic Differential, are used for constructing most instruments used in business research. The precision and accuracy of these instruments determine the extent to which measurement errors can be avoided and are therefore of great concern to business researchers. An instrument with low precision can cause Type II errors by failing to detect real effects while those with low accuracy may detect spurious effects that do not exist. It has long been recognized that the precision (reliability) and the accuracy (validity) of verbal instruments are determined to a large degree by the design and construction of the scales (Thurstone 1928). In this study, we focus our attention on the Likert scale and consider three characteristics of semantic scales with respect to scale quality. The principal objective of this research is to develop a method for determining the number of choices that should be used. The related questions of the assumption of equal intervals and of symmetry are also addressed. We then offer a method for constructing semantic scales that we believe will reduce measurement error. Other scale characteristics such as the length of the scale, the semantics of the scale, balanced versus unbalanced construction, and bipolar versus unidimensional scales are also considered but are not the subject of this study. Likert himself, in his original paper, did not consider the number of choices to be an important issue (Likert 1932) stating only that "If five alternatives are used, it is necessary to assign values from one to five with the three assigned to the undecided position." It is implied that the actual number of choices may be left to the tastes of individual researchers. In practice researchers often do assign the number of choices arbitrarily according to personal taste or past convention. By choices we mean the number of alternatives that are to be included in the scale. There are at least three aspects of this issue. In one view, typified by that of Green and Rao (1970) and of Lehmann and Hulbert (1972), the response evoked by the scale statement is assumed to be continuous and linear and therefore can be subdivided into any number of infinitesimal and equal intervals between which the subject are not indifferent. According to this logic, the error imposed by a scale with a fixed number of choices is simply the round-off error committed when the assumed continuous response is converted into a scale choice. In this model, the precision of the scale necessarily increases with the number of choices used and the induced measurement error asymptotically approaches zero. Therefore no optimality can exist. 1 Date: Various conference presentations in the 1990s. Revised in April 2014 for submission to this online archive. Key words and phrases: semantic scales, Likert scale, instrument reliability, instrument validity, survey research, research instruments, scale design Author affiliation: Professor Emeritus, Sonoma State University, Rohnert Park, CA, 94928
Transcript of A Method for Constructing Likert Scales
A METHOD FOR CONSTRUCTING LIKERT SCALES
JAMAL MUNSHI
ABSTRACT: Likert scales may be tailored for any given instrument and semantics by performing a pretest
using unmarked lines as continuous scales, measuring the distances marked by the respondents, and using
cluster analysis to determine the optimal number and placement of scale points for the actual study. The
tailor-made scale is likely to produce an instrument of higher precision than one constructed with an arbitrary
number of scale points and arbitrary placement of the scale points1.
1. INTRODUCTION
Semantic scales like the Likert, the Stapel, and the Semantic Differential, are used for constructing most
instruments used in business research. The precision and accuracy of these instruments determine the
extent to which measurement errors can be avoided and are therefore of great concern to business
researchers. An instrument with low precision can cause Type II errors by failing to detect real effects
while those with low accuracy may detect spurious effects that do not exist.
It has long been recognized that the precision (reliability) and the accuracy (validity) of verbal
instruments are determined to a large degree by the design and construction of the scales (Thurstone
1928). In this study, we focus our attention on the Likert scale and consider three characteristics of
semantic scales with respect to scale quality.
The principal objective of this research is to develop a method for determining the number of choices that
should be used. The related questions of the assumption of equal intervals and of symmetry are also
addressed. We then offer a method for constructing semantic scales that we believe will reduce
measurement error. Other scale characteristics such as the length of the scale, the semantics of the scale,
balanced versus unbalanced construction, and bipolar versus unidimensional scales are also considered
but are not the subject of this study.
Likert himself, in his original paper, did not consider the number of choices to be an important issue
(Likert 1932) stating only that "If five alternatives are used, it is necessary to assign values from one to
five with the three assigned to the undecided position." It is implied that the actual number of choices may
be left to the tastes of individual researchers. In practice researchers often do assign the number of choices
arbitrarily according to personal taste or past convention.
By choices we mean the number of alternatives that are to be included in the scale. There are at least three
aspects of this issue. In one view, typified by that of Green and Rao (1970) and of Lehmann and Hulbert
(1972), the response evoked by the scale statement is assumed to be continuous and linear and therefore
can be subdivided into any number of infinitesimal and equal intervals between which the subject are not
indifferent. According to this logic, the error imposed by a scale with a fixed number of choices is simply
the round-off error committed when the assumed continuous response is converted into a scale choice. In
this model, the precision of the scale necessarily increases with the number of choices used and the
induced measurement error asymptotically approaches zero. Therefore no optimality can exist.
1 Date: Various conference presentations in the 1990s. Revised in April 2014 for submission to this online archive.
Key words and phrases: semantic scales, Likert scale, instrument reliability, instrument validity, survey research, research instruments, scale design Author affiliation: Professor Emeritus, Sonoma State University, Rohnert Park, CA, 94928

A METHOD FOR CONSTRUCTING LIKERT SCALES, JAMAL MUNSHI, 2014 2
Neither Green and Rao nor Lehmann and Hulbert tested these ideas empirically. Instead they presented an
analysis using simulated data that verifies the mathematical intuition that as the number of choices is
increased the rounding errors decrease; at first rapidly and then more slowly. The maximum rounding
error is always half the distance between adjacent choices. As the number of choices increases, this
distance shrinks geometrically.
The authors contend that optimality in this case is determined by cost considerations. Fewer choices are
more economical and easier to use. The cost of additional choices must be justified by an increase in
precision. Since additional scale choices offer diminishing marginal precision, it is posited that at some
point the marginal increase in precision will not outweigh the additional cost. It is at that point that an
optimum can be said to exist. However, Green and Rao agree with Murphy and Likert (1938) that the
optimum number of alternatives is likely to depend on the application and the number of items in the
instrument.
But the value of the simulation studies suffers from the lack of empirical data to support the assumptions.
In particular, there is no evidence to support the implicit condition that subjects can differentiate between
an infinite number of choices on a continuous scale. Studies by other psychologists (Miller 1956) record
the contrary finding that the number of levels of any variable that can be internalized is not only finite but
small. And the present study shows that, given a continuous scale, subjects do not respond over a uniform
distribution but in predictable clusters.
An alternate approach to the determination of an optimum number of choices is that of raw empiricism.
Rather than assume a continuous true response, these studies test instruments which have anywhere from
two to eleven scale choices. The quality of these instruments is then assessed directly using various
measures. Early studies used split half reliability as a criterion of scale quality. In later works, the measure
of quality has included Cronbach Alpha reliability, test-retest reliability, concurrent validity, predictive
validity, and combinations of these.
One of the earliest such studies was by Symonds (1924) who used split-half reliability measures to
discover that coarser scales have lower consistency. He suggested increasing the number of choices as a
means of increasing the instrument reliability implying that reliability always increases with the number
of scale choices. He did not directly address the issue of optimality but hinted that cost considerations
could limit the number of choices used because it was taken for granted that "coarser scales are more
readily used than finer scales."
The earliest work suggesting the existence of an optimum number of choices independent of cost is that
of Pemberton (1933). Given Symonds' hypothesis that fewer scales points are more desirable than more
and Symonds' finding that finer scales have higher reliability than coarser scales, Pemberton sought to
find "how coarse a scale we could use without lowering reliability" below a minimum acceptable value".
Pemberton studied five to eleven point bipolar scales with a sample of 450 students. Using test-retest
reliability to assess scale quality he found, contrary to Symonds, that the reliability did not always
increase with the number of scale points but rose to a maximum of 0.82 at seven intervals and thereafter
decreased. This suggests that an optimality exists purely on the basis of reliability without recourse to the
economy of coarseness.
Murphy and Likert (1938) extended the concept of scale quality by including the number of items and the
number of choices in an overall measure of instrument quality. They suggested that the split half
reliability is a function of the total number of choices in the instrument. The total number of choices is
computed as the intervals per scale times the number of items. The implication is that the optimum
A METHOD FOR CONSTRUCTING LIKERT SCALES, JAMAL MUNSHI, 2014 3
number of intervals in a scale does not exist independent of the number of items but that a joint optimum
for both variables could be found on the basis of instrument reliability.
They showed that when the total number of items was reduced from 44 to 36, the loss of split-half
reliability could be reversed by increasing the number of scale choices from 3 to 5. They explain that this
is due to the fact that the total number of answer choices were actually increased from 132 (44 times 3) to
180 (36 times 5). The split half reliability rose from 0.88 to 0.94 as a result.
This notion, that the number of scale points can be balanced against the number of items to achieve a
given reliability, was confirmed by Bendig (1954) and again in very similar studies by Komorita (1963)
and Komorita and Graham (1965). These authors decomposed the Likert scale into a polarity component
(agree or disagree) and an intensity component (degree of agree or disagree) to determine the role played
by intensity in determining scale quality.
Using split-half and Cronbach Alpha reliability as measures of consistency they found that when the
number of items is large, the intensity component was unimportant. This implies that the internal
consistency is not affected by the number of choices beyond the minimum of two needed to establish the
polarity. Peabody (1962) also reported the dominance of the directional component of the Likert scale
over the intensity component. He proposed that his findings justified a two-point or dichotomous
agreement scale of either agree or disagree. This hypothesis was later supported by Komorita and others.
The findings of Bendig, Peabody, and Komorita were generalized by Jacoby and Matell (1971) and
Matell and Jacoby (1972) to include other measures of scale quality. They confirmed the dominance of
dichotomy in determining reliability and the relative irrelevance of additional scale choices to assess
intensity. The significant contribution of the Jacoby and Matell studies was to show that the irrelevance
also applied to test-retest reliability, concurrent validity, and predictive validity.
Contrary to the findings of Pemberton, these studies do not posit the existence of an optimum number of
choices based on scale quality alone. They predict an asymptotically increasing function but show that the
increase in quality beyond two or three choices may not be warranted by the additional cost and
complexity of the instrument and of the data gathering process.
2. THEORY
2.1 Scale quality. In a broad sense, the quality of a scale describes its ability to faithfully reflect the
attitude or opinion to be measured. A significant part of this construction involves the semantics of the
scale - the adjectives, words, phrases, and sentence construction that will elicit the correct internal
response in the subject. This aspect of scale construction is strictly outside the scope of this study.
In this study we assume that the correct response has already been internally generated in the subject. It
now remains for the instrument designer to provide the subject with the most suitable vehicle for its
expression; and produce data in a form that can be readily collected by normal survey methods and easily
analyzed with conventional statistical procedures. Within this framework, the important question for scale
designers is this: How is the information being internalized by the subject?
More specifically, we would like to know; whether the degree of agreement is continuous or discrete and
if it is discrete we would like to know the number of discrete levels being used; whether there is a neutral
point; whether the negative and positive responses on either side of the neutral are viewed as symmetrical;
A METHOD FOR CONSTRUCTING LIKERT SCALES, JAMAL MUNSHI, 2014 4
and whether the discrete levels are at equal distances. If the distances are not equal we would like to know
what these distances ought to be. The answers to these questions will allow us to construct a response
scale that closely matches the internal response of the subject and therefore reduces measurement error
that might have been caused by forcing a subject to express his feelings through an scale that does not
correspond to the one that has been internalized by the subject.
The question of continuity has been addressed by Miller (1956) who has postulated that the internal
process is discrete and that the number of discrete steps involved is "seven plus or minus two" . Other
psychologists (for example Simon and Newell 1971) have largely supported this view. It may therefore be
inappropriate to assume that the attitude and opinions scales are internalized in a continuum. The
implication is that construction of precise scales should be attempted only after the correct number of
intervals has been discovered and further, that the correct or optimal number should be based not on
cost/benefit analyses but on the information processing characteristics of the human subjects.
If too few choices are provided on the scale, then the subject may wish to select a non-existent choice in
between two consecutive choices. Since such a choice does not exist, the response will likely be randomly
assigned to either of the adjacent existing choices. Clearly, such a random assignment of choices will
lower the correlation between items that are, in truth, highly correlated. The loss in correlation helps to
explain the improvement in reliability with finer scale construction found by the black-box empiricists
mentioned above. On the other hand, if the scale has too many choices, then the subject will be indifferent
between two or more consecutive choices that represent a single internal level. Being forced to select only
a single choice rather than a range, the subject randomly assigns the response to one of the choices within
this range. Once again, the random assignment reduces correlation and all measures of reliability and
consistency. Pemberton's empirical results show that this may indeed be the case.
2.2 Symmetry and Equal Distances. Various authors have shown that the response to verbal scales
are subject to framing error. For example Kahneman and Tversky (1984) found that the response to the
same statement can vary depending on whether it is stated as a positive (90% chance of surviving an
illness) or a negative (10% chance of dying from the illness). This served as an experimental verification
of effects detected by empirical researchers Worcester and Burns (1975). Worcester and Burns conducted
a field test in which they found asymmetric responses to positive and negative framing of the same verbal
cue. A more generalized finding of questionnaire framing effects was reported by Wildt and Mazis (1978)
in which they report effects not only of the semantics of the items but of the location of the phrase in
relation to the endpoints of the scale. These findings indicate that the assumption of symmetry normally
implicit in scale construction may not be valid.
The questions of scale construction being pursued here are "How many scale choices should be used and
where should these choices be placed on the scale?". The second question raises the issue of distance. The
use of equal intervals is controversial and it has been argued that unless the equality of the intervals can
be experimentally verified, scale data can only be treated as ordinal and a measurement error is
introduced when they are used as interval data (Martilla and Garvey 1975).
Although Labovitz (1970) has argued that the magnitude of such measurement errors is small when the
number of items in a single summated score is large, it still remains a quest of business research to
improve the precision and accuracy of the research instruments by reducing this error (Ashton 1990). One
way to reduce this error and render Likert scale data more `interval like is to determine the true distances
between scale choices so that they may be appropriately weighted.
The present study offers a method by which the true distances can be discovered. It is proposed that the
use of this method will result in scales in which the number of choices and their placement on the scale
A METHOD FOR CONSTRUCTING LIKERT SCALES, JAMAL MUNSHI, 2014 5
more closely reflect the response structure being elicited. It is further proposed that the use of scales
constructed in this manner will reduce errors of measurement and interpretation that can be introduced by
an inappropriate number of choices and their arbitrary placement on the scale.
3. METHODOLOGY
The method of discovery being proposed contrasts with the method of testing used in previous research
that presented subjects with scales containing a selected and discrete number of equally and
symmetrically spaced choices. In the proposed discovery method, we present the subject with only a line
allowing her, in essence, to construct her own scale. By averaging the choices and distances chosen over
the entire sample, we can determine whether there is a consensus as to the existence and nature of a
discrete semantic scale.
The questionnaire used in the study contained eight items that were extracted from an inventory of items
having to do with foreign direct investment in Asia. The five-point scale normally used with such items
was replaced with a straight line which measured 76 mm in length. The subjects were asked to place a
tick mark anywhere on this line to indicate the strength of agreement with the corresponding statement.
The distance from the left end of the line to the mark is taken as being proportional to the degree of
agreement. The subjects were informed that a mark at the extreme left end denotes absolute disagreement
while one at the extreme right end means complete agreement.
Two hundred and ten business travelers waiting at SFO2 for flights to Asia were used as subjects in this
study. To increase the variety of responses so that all parts of the response line will be used the eight
items were divided into two groups of four bipolar subsets. The subjects were aware that they were
participating in a study but were informed of the actual nature of the experiment only after they had
completed the questionnaire.
The full sample consisted of 1615 marked lines. The distance from the left end of the line to the tick
marks in each marked line was measured to within half a millimeter. An analysis of the distribution of
these distances was then undertaken to determine whether the entire length was used in a homogeneous
and random manner or whether there existed any cluster patterns. A uniform or unimodal distribution
would indicate that a true response over a continuous scale exists. However, if the distribution is multi-
modal it would indicate discrete regions of response.
The number of these distinct clusters of responses may be interpreted as a consensus on the number of
scale points identified by the subjects. Moreover, since the respondents are not forced to choose among
pre-assigned equal-interval scale points, the distances between these clusters may also be interpreted.
Specifically, if these clusters do not occur at equal intervals or in a symmetrical arrangement, then we
would have reason to suspect that the use of equal interval and symmetrical scales will introduce
measurement errors.
Assignment of scale weights according to the distances of these clusters from the left end point would
more accurately represent interval data than would equal interval scales. This method is somewhat similar
to that employed by Didow, Keller, and Barksdale (1985). In their procedure, weights are iteratively
assigned to Likert scale points until a maximum discrimination is obtained where one is hypothesized.
The method used increases the probability of Type I errors since the instrument becomes biased towards
2 San Francisco International Airport
A METHOD FOR CONSTRUCTING LIKERT SCALES, JAMAL MUNSHI, 2014 6
rejecting the hull hypothesis. The method proposed in this study is independent of the hypothesis to be
tested by the instrument.
4. DATA ANALYSIS AND RESULTS
4.1 The data are clustered. The distribution of the 1615 responses showed that the tick marks were
not uniform over the length of the line. There were segments where the responses were concentrated and,
equally important, where they were conspicuously sparse. A visual analysis suggested that the responses
were in fact clustered around a number of identifiable points on the line. It is significant that these scale
points were not assigned by the researcher but selected independently by a number of different subjects.
No subject was aware of the responses of the other subjects.
4.2 Importance of the dichotomy. The distribution is heavily loaded on the ends; 369 of the 1615
points, or 23 percent of all distances, are either at 0 mm or 76 mm - the two extremes. These marks are
easily distinguished from all others as a separate class of marks and their position in the line is not in
question. It is also clear that these marks do not represent a failure to understand the directions because
the same respondent has placed marks at the ends and also at various distances within the line. Since their
true position is not in question, it is not deemed necessary to subject the end points to statistical analyses
and we assume that the end points represent two of the scale points needed. It now remains for statistical
analysis to extract the remaining scale points from the 1246 remaining points that are placed at some
distance along the line.
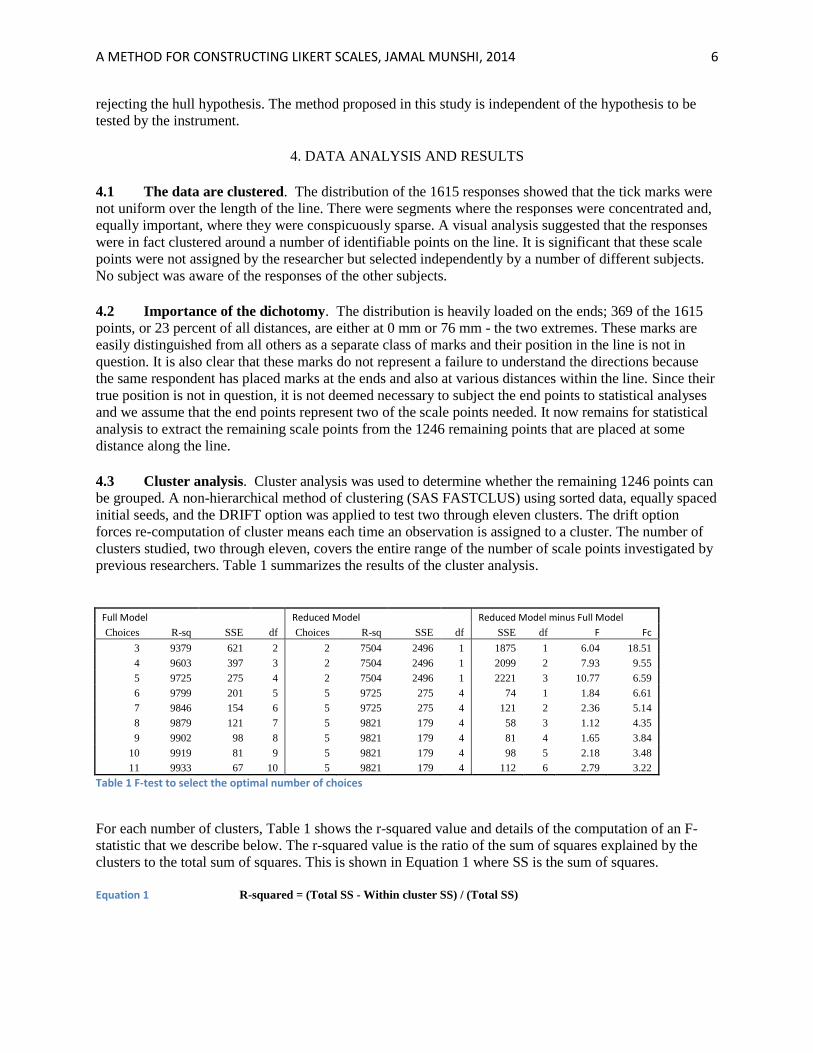
4.3 Cluster analysis. Cluster analysis was used to determine whether the remaining 1246 points can
be grouped. A non-hierarchical method of clustering (SAS FASTCLUS) using sorted data, equally spaced
initial seeds, and the DRIFT option was applied to test two through eleven clusters. The drift option
forces re-computation of cluster means each time an observation is assigned to a cluster. The number of
clusters studied, two through eleven, covers the entire range of the number of scale points investigated by
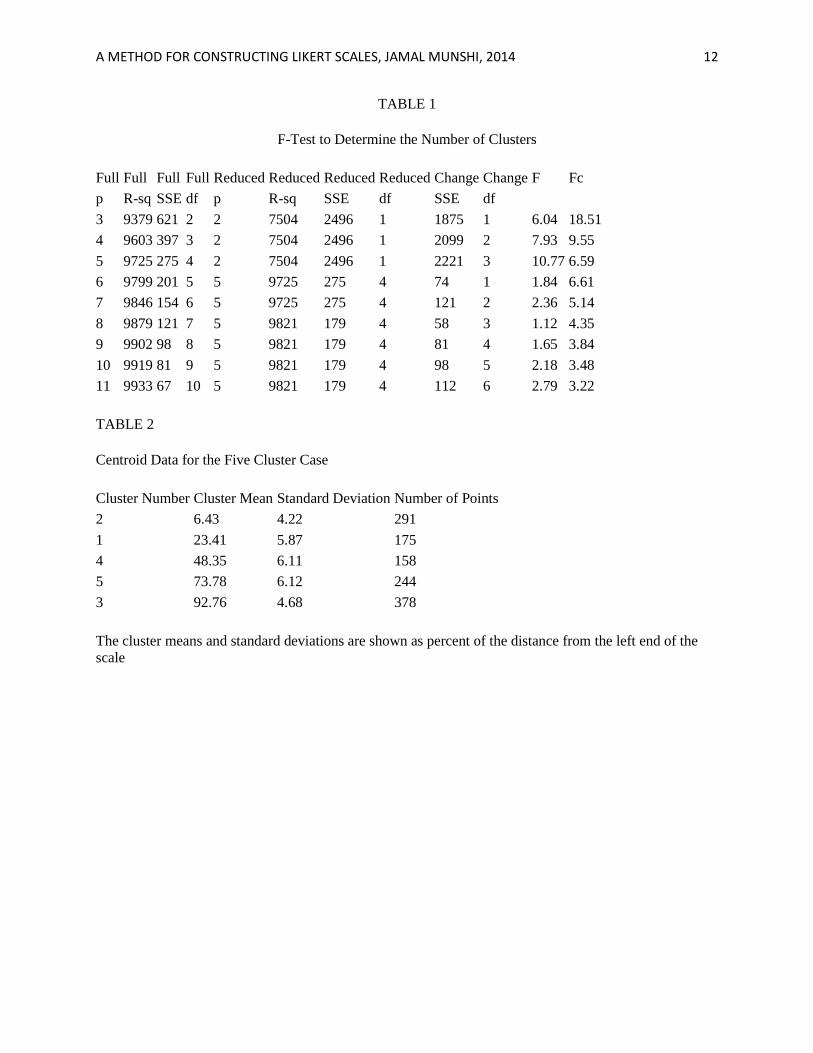
previous researchers. Table 1 summarizes the results of the cluster analysis.
Full Model Reduced Model Reduced Model minus Full Model
Choices R-sq SSE df Choices R-sq SSE df SSE df F Fc
3 9379 621 2 2 7504 2496 1 1875 1 6.04 18.51
4 9603 397 3 2 7504 2496 1 2099 2 7.93 9.55
5 9725 275 4 2 7504 2496 1 2221 3 10.77 6.59
6 9799 201 5 5 9725 275 4 74 1 1.84 6.61
7 9846 154 6 5 9725 275 4 121 2 2.36 5.14
8 9879 121 7 5 9821 179 4 58 3 1.12 4.35
9 9902 98 8 5 9821 179 4 81 4 1.65 3.84
10 9919 81 9 5 9821 179 4 98 5 2.18 3.48
11 9933 67 10 5 9821 179 4 112 6 2.79 3.22
Table 1 F-test to select the optimal number of choices
For each number of clusters, Table 1 shows the r-squared value and details of the computation of an F-
statistic that we describe below. The r-squared value is the ratio of the sum of squares explained by the
clusters to the total sum of squares. This is shown in Equation 1 where SS is the sum of squares.
Equation 1 R-squared = (Total SS - Within cluster SS) / (Total SS)

A METHOD FOR CONSTRUCTING LIKERT SCALES, JAMAL MUNSHI, 2014 7
The within cluster SS can be considered to be analogous to an error sum of squares or SSE. Thus the
higher the r-squared, the tighter the clusters.
Table 1 shows a significant explanatory power of the simple dichotomy. More than 75% of the total sum
of squares in the data can be explained by two just clusters. This finding is consistent with previous
research such as that of Bendig, Komorita, and Peabody, that postulated a low power of the intensity
component of the Likert scale compared to the simple polarity. On the other hand, it is apparent in
examining Table 1 that SSE rapidly declines when the number of clusters is increased beyond two. If only
two choices are used, the additional sum of squares that can be explained by three or more clusters will be
considered to be random measurement error and will tend to reduce the power of the instrument.
Therefore, two choices are not enough in this case.
We hypothesize at this point that the sample of 1246 distances was drawn from a population of only ω
distinct values but that in the process of drawing the sample, some measurement error was introduced so
that the sample values are multimodally distributed around these ω distances. We would like to discover
the value of ω.
The 1246 data points actually consist of 180 distinct distances. It is obvious that if 180 clusters are
selected (i.e. ω=180), r-squared will be identically unity since the error sum of squares will be exactly
zero. For any number of clusters less than 180, a finite amount of variance within the clusters will be
introduced. Conversely, as the number of clusters is increased from two to eleven, r-squared increases.
The increase in r-squared is rapid at first but then flattens out. The flattening of the r-squared curve
suggests that there exists an optimal number of clusters beyond which the improvement in r-squared is
not statistically significant. We therefore use this principle to determine the value of ω which we may
consider to be the optimal number of clusters.
4.4 The optimal number of clusters. The differences between the cluster means and the distances
within the clusters can be viewed as residuals in regression terminology. If the sampling distribution of
the cluster residuals are normally distributed then the mean square error terms will be chi-square
distributed and their ratio will be F-distributed.
The F-distribution can be used to construct tests for determining the required number of clusters; that is,
to test any value of ω. Using the definition of r-squared presented we can express the error sum of squares
as,
Equation 2 SSE = SST * (1 - R2 )
where SSE = error sum of squares and SST=treatment sum of squares. The degrees of freedom, µ,
associated with a given number of clusters, υ, is υ-1. Using these equations, we can now set up a statistic
to test the difference in explanatory power between two number of clusters υ1 and υ2 where υ2> υ1as
Equation 3 F = [ (SSE1 - SSE2 )/(µ1 - µ2 ) ] / [ SSE2 / µ2 ]
The null hypothesis (Ho) is that the sum of squares explained by υ1 clusters is the same as that explained
by υ2 clusters. Under conditions of the null hypothesis, the ratio of chi-squares will be F-distributed with
numerator degrees of freedom of (µ1 - µ2) and denominator degrees of freedom of µ2.
Substituting
Equation 4 SSE = SST (1-R2)
A METHOD FOR CONSTRUCTING LIKERT SCALES, JAMAL MUNSHI, 2014 8
and canceling the SST term which appears in the numerator and denominator, we get
Equation 5 F = [ ( R22 - R12 ) / R22 ] * [ µ2 / ( µ1 - µ2 ) ]
For hypothesis testing, this F-statistic is then compared with the critical value (Fc) at alpha = 0.05, with
numerator degrees of freedom = (µ1 - µ2), and denominator degrees of freedom = µ2. If the F-statistic
computed exceeds this critical value, then we reject the null hypothesis and conclude that υ2 clusters
explains significantly more of the total sum of squares than does υ1 clusters.
The F-statistics are shown in Table 1. In line 1, υ=3 is compared with two υ=2. The F-value is 6.04. Since
this is less than the critical value of 18.51 we fail to reject Ho and find insufficient evidence that three
clusters are better than two. This finding is inconsistent with that of Jacoby and Matell who proposed
Likert scales with three alternatives.
Next we redefine our full model to have four clusters and once again compare the full model now defined
by υ=4 with the reduced model. The reduced model is still the case with υ=2. We are unable to reject Ho
at the 5% level.
We therefore move up to υ=5 as the full model and compare that with the reduced model which is still
defined by υ=2 as our current best model. Here we find that the F-statistic is larger than the critical value
so we reject Ho and replace the dichotomous model with υ=5 as our new best model.
Comparisons of υ=6 through 11 with υ=5 in Table 1 shows that the improvement in explanatory power of
the additional clusters is not statistically significant at the 5% level. Thus, we keep υ=5 as our best model
and therefore the the optimal number of clusters in the range considered. Our unbiased estimate of ω is
therefore that ω=5.
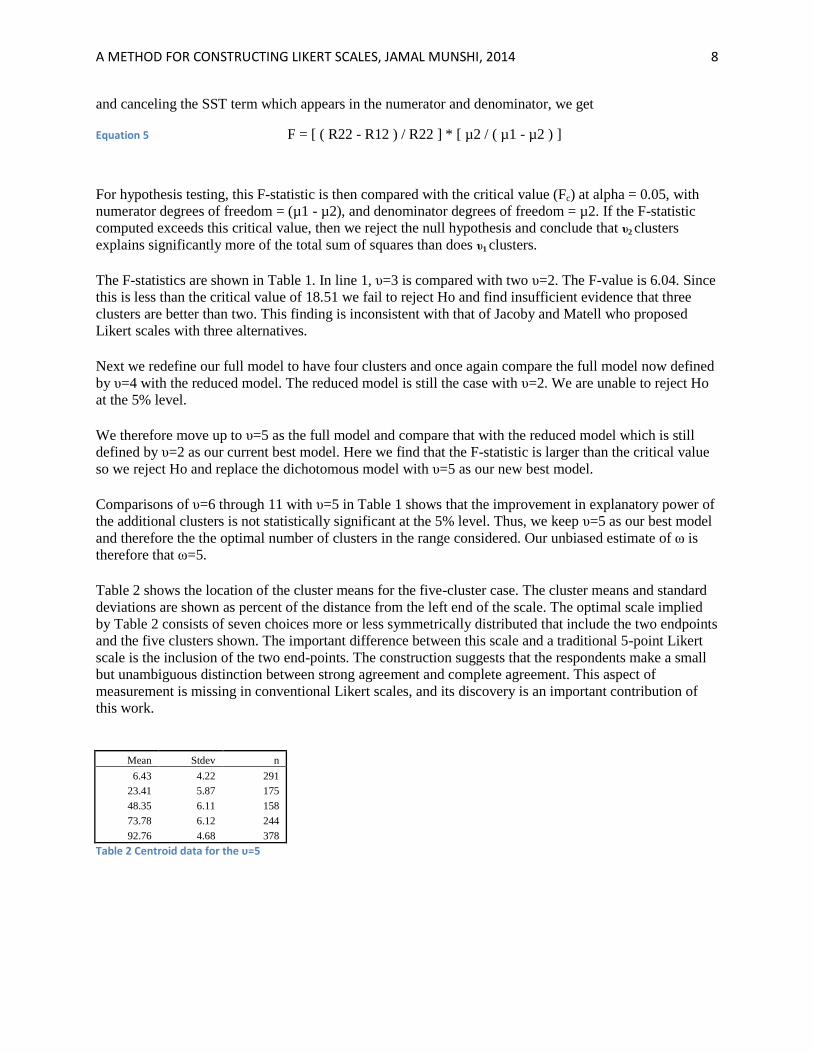
Table 2 shows the location of the cluster means for the five-cluster case. The cluster means and standard
deviations are shown as percent of the distance from the left end of the scale. The optimal scale implied
by Table 2 consists of seven choices more or less symmetrically distributed that include the two endpoints
and the five clusters shown. The important difference between this scale and a traditional 5-point Likert
scale is the inclusion of the two end-points. The construction suggests that the respondents make a small
but unambiguous distinction between strong agreement and complete agreement. This aspect of
measurement is missing in conventional Likert scales, and its discovery is an important contribution of
this work.
Mean Stdev n
6.43 4.22 291
23.41 5.87 175
48.35 6.11 158
73.78 6.12 244
92.76 4.68 378
Table 2 Centroid data for the υ=5
A METHOD FOR CONSTRUCTING LIKERT SCALES, JAMAL MUNSHI, 2014 9
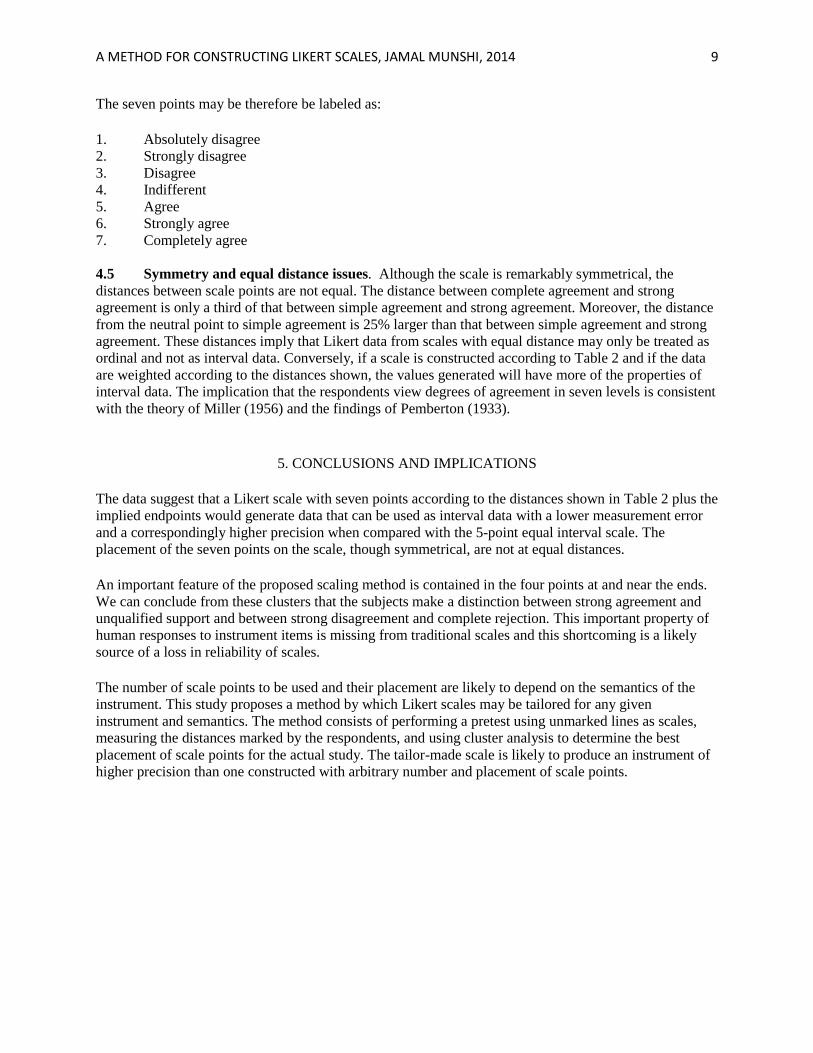
The seven points may be therefore be labeled as:
1. Absolutely disagree
2. Strongly disagree
3. Disagree
4. Indifferent
5. Agree
6. Strongly agree
7. Completely agree
4.5 Symmetry and equal distance issues. Although the scale is remarkably symmetrical, the
distances between scale points are not equal. The distance between complete agreement and strong
agreement is only a third of that between simple agreement and strong agreement. Moreover, the distance
from the neutral point to simple agreement is 25% larger than that between simple agreement and strong
agreement. These distances imply that Likert data from scales with equal distance may only be treated as
ordinal and not as interval data. Conversely, if a scale is constructed according to Table 2 and if the data
are weighted according to the distances shown, the values generated will have more of the properties of
interval data. The implication that the respondents view degrees of agreement in seven levels is consistent
with the theory of Miller (1956) and the findings of Pemberton (1933).
5. CONCLUSIONS AND IMPLICATIONS
The data suggest that a Likert scale with seven points according to the distances shown in Table 2 plus the
implied endpoints would generate data that can be used as interval data with a lower measurement error
and a correspondingly higher precision when compared with the 5-point equal interval scale. The
placement of the seven points on the scale, though symmetrical, are not at equal distances.
An important feature of the proposed scaling method is contained in the four points at and near the ends.
We can conclude from these clusters that the subjects make a distinction between strong agreement and
unqualified support and between strong disagreement and complete rejection. This important property of
human responses to instrument items is missing from traditional scales and this shortcoming is a likely
source of a loss in reliability of scales.
The number of scale points to be used and their placement are likely to depend on the semantics of the
instrument. This study proposes a method by which Likert scales may be tailored for any given
instrument and semantics. The method consists of performing a pretest using unmarked lines as scales,
measuring the distances marked by the respondents, and using cluster analysis to determine the best
placement of scale points for the actual study. The tailor-made scale is likely to produce an instrument of
higher precision than one constructed with arbitrary number and placement of scale points.
A METHOD FOR CONSTRUCTING LIKERT SCALES, JAMAL MUNSHI, 2014 10
6. REFERENCES
Albaum, Gerald, Roger Best, and Del Hawkins, The Measurement Properties of Semantic Scale Data,
Journal of the Market Research Society, Vol. 19 No.1 (1977)
Ashton, Dub, Seminar in Marketing Research, Lecture, University of Arkansas, Spring 1990.
Bendig, A.W., Reliability and the Number of Rating Scale Categories, Journal of Applied Psychology,
Vol. 38 (1954) pp. 8-10
Carmines, Edward G., and Richard A. Zeller, Reliability and Validity Assessment, Sage Publications,
Beverly Hills, CA. Sixth Printing (1983)
Crespi, Irving, Use of a Scaling Technique in Surveys, Journal of Marketing, Vol. 25 (July 1961) pp. 69-
72
Dickson, John, and Gerald Albaum, A Method for Developing Tailormade Semantic Differentials for
Specific Marketing Content Areas, Journal of Marketing Research, Vol. 14 (February 1977), pp. 87-91
Didow, Nocholas M., Kevin L. Keller, and Hiram C. Barksdale, Improving Measure Quality by
Alternating Least Squares Alternate Scaling, Journal of Marketing Research, Vol. 22, (1985) pp. 30-40
Green, Paul E., and Vithala R. Rao, Rating Scales and Information Recovery - How Many Scales and
Response Categories to Use?, Journal of Marketing, Vol. 34 (July 1970) pp. 33-39
Jacoby, Jacob and Michael Matell, Three Point Likert Scales Are Good Enough , Journal of Marketing
Research, Vol. 8 (November 1971) pp. 495-500
Kahneman, Daniel and Amos Tversky, Choices, Values, and Frames, The American Psychologist, Vol.
39 No. 4 (1984) pp. 341-350
Komorita, S.S., Attitude Content, Intensity, and the Neutral Point on a Likert Scale, The Journal of Social
Psychology, Vol. 61 (1963) pp. 327-334
Komorita, S.S., and K. Graham, Number of Scale Points and the Reliability of Scales, Educational and
Psychological Measurement, Vol. 4 (November 1965) pp. 987-995
Labovitz, Sanford, The Assignment of Numbers to Rank Order Categories, American Social Review, Vol.
35 (1970) pp. 515-524
Lehmann, Donald R. and James Hulbert, Are Three Point Scales Always Good Enough, Journal of
Marketing Research, Vol. 9, (November 1972) pp. 444-446
Likert, Rensis, A Technique for the Measurement of Attitudes, Archives of Psychology, Vol. 140, (June
1932)
Martilla, J.A., and D. Garvey, Four Subtle Sins of Marketing Research, Journal of Marketing, Vol. 39 No.
1 (1975) pp. 8-15
Matell, Michael, and Jacob Jacoby, Is There an Optimal Number of Alternatives for Likert Items?,
Journal of Applied Psychology, Vol.56 No. 6 (1972) pp. 506-509
Miller, George A., The Magical Number Seven, Plus or Minus Two: Some Limits on Our Capacity for
Processing Information, Psychological Review, Vol. 63 (march 1956), pp. 81-97
Mindak, William A., Fitting the Semantic Differential to the Marketing Problem, Journal of Marketing,
(April 1961), pp. 28-33
Murphy, George, and Rensis Likert, Public Opinion and the Individual: A Psychological Study of Student
Attitudes on Public Questions With a Re-Test Five Years Later, Harper Books, NY, (1938)
Osgood, Charles E., The Nature and Measurement of Meaning, Psychological Bulletin, Vol. 49 No. 3,
(May 1952) pp. 197-233
Peabody, Dean, Two Components in Bipolar Scales: Direction and Extremeness, Psychological Review,
Vol. 69 (March 1962) pp. 65-73
Pemberton, Earl, A Technique for Measuring the Optimum Rating Scale for Opinion Measures,
Sociology and Social Research, Vol. 17, (1933) pp. 470-472
Simon, H.A., and A. Newell, Human Problem Solving: The State of the Theory in 1970, American
Psychologist, Vol. 26 (1971) pp. 145-159
Symonds, Percival M., On the Loss of Reliability in Rating Due to Coarseness of the Scale, Journal of
Experimental Psychology, Vol. 7 (1924) pp. 456-460

A METHOD FOR CONSTRUCTING LIKERT SCALES, JAMAL MUNSHI, 2014 11
Thurstone, L.L., Attitudes Can Be Measured, The American Journal of Sociology, Vol. 33 No. 4, (1928),
pp. 529-554
Woldt, Albert R., and Michael B. Mazis, Determinants of Scale Response: Label Versus Position, Journal
of Marketing Research, Vol. 15 (May 1978), pp. 271-267
Worcester, Robert M., and Timothy R. Burns, A Statistical Examination of the Relative Precision of
Verbal Scales, Journal of the Market Research Society, Vol. 17 (July 1975) pp. 181-197
A METHOD FOR CONSTRUCTING LIKERT SCALES, JAMAL MUNSHI, 2014 12
TABLE 1
F-Test to Determine the Number of Clusters
Full Full Full Full Reduced Reduced Reduced Reduced Change Change F Fc
p R-sq SSE df p R-sq SSE df SSE df
3 9379 621 2 2 7504 2496 1 1875 1 6.04 18.51
4 9603 397 3 2 7504 2496 1 2099 2 7.93 9.55
5 9725 275 4 2 7504 2496 1 2221 3 10.77 6.59
6 9799 201 5 5 9725 275 4 74 1 1.84 6.61
7 9846 154 6 5 9725 275 4 121 2 2.36 5.14
8 9879 121 7 5 9821 179 4 58 3 1.12 4.35
9 9902 98 8 5 9821 179 4 81 4 1.65 3.84
10 9919 81 9 5 9821 179 4 98 5 2.18 3.48
11 9933 67 10 5 9821 179 4 112 6 2.79 3.22
TABLE 2
Centroid Data for the Five Cluster Case
Cluster Number Cluster Mean Standard Deviation Number of Points
2 6.43 4.22 291
1 23.41 5.87 175
4 48.35 6.11 158
5 73.78 6.12 244
3 92.76 4.68 378
The cluster means and standard deviations are shown as percent of the distance from the left end of the
scale