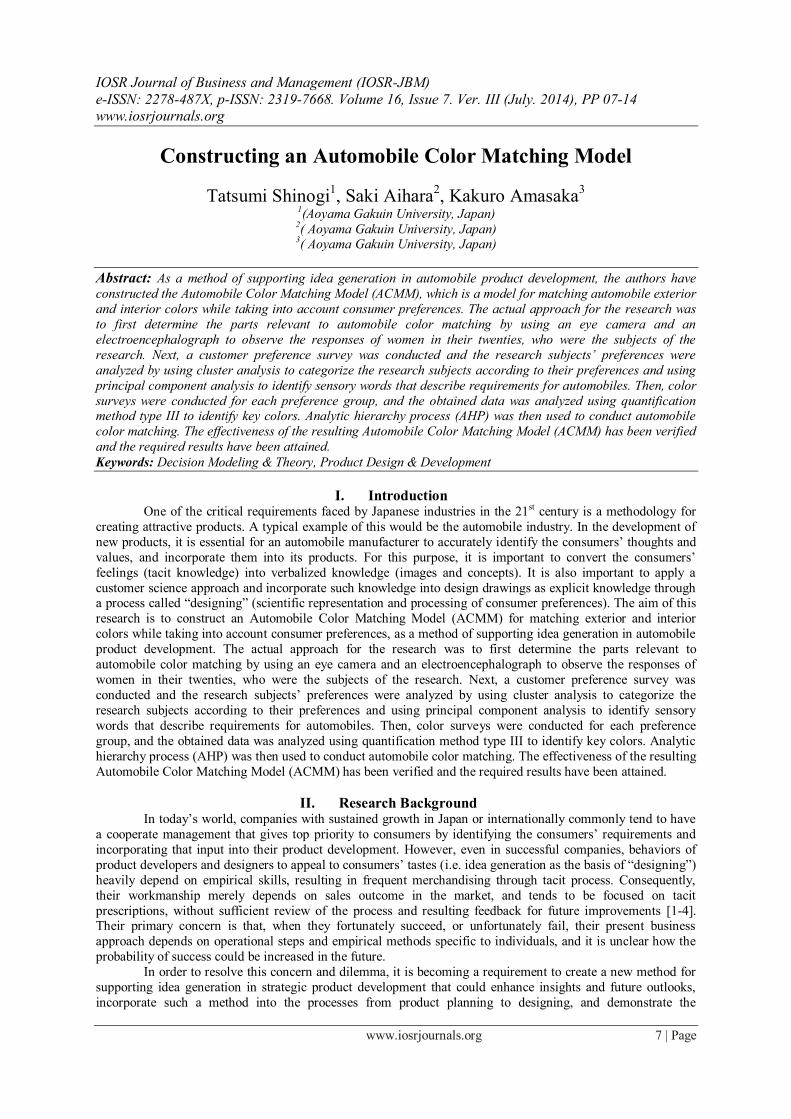
Constructing an Automobile Color Matching Model
8
IOSR Journal of Business and Management (IOSR-JBM) e-ISSN: 2278-487X, p-ISSN: 2319-7668. Volume 16, Issue 7. Ver. III (July. 2014), PP 07-14 www.iosrjournals.org www.iosrjournals.org 7 | Page Constructing an Automobile Color Matching Model Tatsumi Shinogi 1 , Saki Aihara 2 , Kakuro Amasaka 3 1 (Aoyama Gakuin University, Japan) 2 ( Aoyama Gakuin University, Japan) 3 ( Aoyama Gakuin University, Japan) Abstract: As a method of supporting idea generation in automobile product development, the authors have constructed the Automobile Color Matching Model (ACMM), which is a model for matching automobile exterior and interior colors while taking into account consumer preferences. The actual approach for the research was to first determine the parts relevant to automobile color matching by using an eye camera and an electroencephalograph to observe the responses of women in their twenties, who were the subjects of the research. Next, a customer preference survey was conducted and the research subjects’ preferences were analyzed by using cluster analysis to categorize the research subjects according to their preferences and using principal component analysis to identify sensory words that describe requirements for automobiles. Then, color surveys were conducted for each preference group, and the obtained data was analyzed using quantification method type III to identify key colors. Analytic hierarchy process (AHP) was then used to conduct automobile color matching. The effectiveness of the resulting Automobile Color Matching Model (ACMM) has been verified and the required results have been attained. Keywords: Decision Modeling & Theory, Product Design & Development I. Introduction One of the critical requirements faced by Japanese industries in the 21 st century is a methodology for creating attractive products. A typical example of this would be the automobile industry. In the development of new products, it is essential for an automobile manufacturer to accurately i dentify the consumers‟ thoughts and values, and incorporate them into its products. For this purpose, it is important to convert the consumers‟ feelings (tacit knowledge) into verbalized knowledge (images and concepts). It is also important to apply a customer science approach and incorporate such knowledge into design drawings as explicit knowledge through a process called “designing” (scientific representation and processing of consumer preferences). The aim of this research is to construct an Automobile Color Matching Model (ACMM) for matching exterior and interior colors while taking into account consumer preferences, as a method of supporting idea generation in automobile product development. The actual approach for the research was to first determine the parts relevant to automobile color matching by using an eye camera and an electroencephalograph to observe the responses of women in their twenties, who were the subjects of the research. Next, a customer preference survey was conducted and the research subjects‟ preferences were analyzed by using cluster analysis to categorize the research subjects according to their preferences and using principal component analysis to identify sensory words that describe requirements for automobiles. Then, color surveys were conducted for each preference group, and the obtained data was analyzed using quantification method type III to identify key colors. Analytic hierarchy process (AHP) was then used to conduct automobile color matching. The effectiveness of the resulting Automobile Color Matching Model (ACMM) has been verified and the required results have been attained. II. Research Background In today‟s world, companies with sustained growth in Japan or internationally commonly tend to have a cooperate management that gives top priority to consumers by identifying the consumers‟ requirements and incorporating that input into their product development. However, even in successful companies, behaviors of product developers and designers to appeal to consumers‟ tastes (i.e. idea generation as the basis of “designing”) heavily depend on empirical skills, resulting in frequent merchandising through tacit process. Consequently, their workmanship merely depends on sales outcome in the market, and tends to be focused on tacit prescriptions, without sufficient review of the process and resulting feedback for future improvements [1-4]. Their primary concern is that, when they fortunately succeed, or unfortunately fail, their present business approach depends on operational steps and empirical methods specific to individuals, and it is unclear how the probability of success could be increased in the future. In order to resolve this concern and dilemma, it is becoming a requirement to create a new method for supporting idea generation in strategic product development that could enhance insights and future outlooks, incorporate such a method into the processes from product planning to designing, and demonstrate the
-
Upload
independent -
Category
Documents
-
view
2 -
download
0
Transcript of Constructing an Automobile Color Matching Model
IOSR Journal of Business and Management (IOSR-JBM)
e-ISSN: 2278-487X, p-ISSN: 2319-7668. Volume 16, Issue 7. Ver. III (July. 2014), PP 07-14 www.iosrjournals.org
www.iosrjournals.org 7 | Page
Constructing an Automobile Color Matching Model
Tatsumi Shinogi1, Saki Aihara
2, Kakuro Amasaka
3
1(Aoyama Gakuin University, Japan) 2( Aoyama Gakuin University, Japan) 3( Aoyama Gakuin University, Japan)
Abstract: As a method of supporting idea generation in automobile product development, the authors have
constructed the Automobile Color Matching Model (ACMM), which is a model for matching automobile exterior
and interior colors while taking into account consumer preferences. The actual approach for the research was
to first determine the parts relevant to automobile color matching by using an eye camera and an
electroencephalograph to observe the responses of women in their twenties, who were the subjects of the
research. Next, a customer preference survey was conducted and the research subjects’ preferences were
analyzed by using cluster analysis to categorize the research subjects according to their preferences and using
principal component analysis to identify sensory words that describe requirements for automobiles. Then, color
surveys were conducted for each preference group, and the obtained data was analyzed using quantification method type III to identify key colors. Analytic hierarchy process (AHP) was then used to conduct automobile
color matching. The effectiveness of the resulting Automobile Color Matching Model (ACMM) has been verified
and the required results have been attained.
Keywords: Decision Modeling & Theory, Product Design & Development
I. Introduction One of the critical requirements faced by Japanese industries in the 21st century is a methodology for
creating attractive products. A typical example of this would be the automobile industry. In the development of
new products, it is essential for an automobile manufacturer to accurately identify the consumers‟ thoughts and
values, and incorporate them into its products. For this purpose, it is important to convert the consumers‟
feelings (tacit knowledge) into verbalized knowledge (images and concepts). It is also important to apply a
customer science approach and incorporate such knowledge into design drawings as explicit knowledge through a process called “designing” (scientific representation and processing of consumer preferences). The aim of this
research is to construct an Automobile Color Matching Model (ACMM) for matching exterior and interior
colors while taking into account consumer preferences, as a method of supporting idea generation in automobile
product development. The actual approach for the research was to first determine the parts relevant to
automobile color matching by using an eye camera and an electroencephalograph to observe the responses of
women in their twenties, who were the subjects of the research. Next, a customer preference survey was
conducted and the research subjects‟ preferences were analyzed by using cluster analysis to categorize the
research subjects according to their preferences and using principal component analysis to identify sensory
words that describe requirements for automobiles. Then, color surveys were conducted for each preference
group, and the obtained data was analyzed using quantification method type III to identify key colors. Analytic
hierarchy process (AHP) was then used to conduct automobile color matching. The effectiveness of the resulting
Automobile Color Matching Model (ACMM) has been verified and the required results have been attained.
II. Research Background In today‟s world, companies with sustained growth in Japan or internationally commonly tend to have
a cooperate management that gives top priority to consumers by identifying the consumers‟ requirements and
incorporating that input into their product development. However, even in successful companies, behaviors of
product developers and designers to appeal to consumers‟ tastes (i.e. idea generation as the basis of “designing”)
heavily depend on empirical skills, resulting in frequent merchandising through tacit process. Consequently,
their workmanship merely depends on sales outcome in the market, and tends to be focused on tacit
prescriptions, without sufficient review of the process and resulting feedback for future improvements [1-4]. Their primary concern is that, when they fortunately succeed, or unfortunately fail, their present business
approach depends on operational steps and empirical methods specific to individuals, and it is unclear how the
probability of success could be increased in the future.
In order to resolve this concern and dilemma, it is becoming a requirement to create a new method for
supporting idea generation in strategic product development that could enhance insights and future outlooks,
incorporate such a method into the processes from product planning to designing, and demonstrate the

Constructing an Automobile Color Matching Model
www.iosrjournals.org 8 | Page
effectiveness thereof [5]. A number of different types of research have been undertaken concerning automobile
design incorporating consumer preferences. Many studies concerning the exterior focus on the forms and colors
of automobiles, while meters and colors have been popular themes of studies focused on the interior [6-11].
Nevertheless, no studies have been undertaken combining the exterior and the interior, and the methodology for
combining exterior and interior colors is left as a theme for future studies. A status survey conducted on
companies related to automobile design uncovered that not much emphasis has been placed on combination, and
that the voice of the consumer has been interpreted based on intuition and experience, due to a lack of parameters for incorporating such inputs into design. These indicate the necessity of a model for matching
colors of the exterior and interior. While consumers have had a declining desire to own automobiles in Japan,
consumers in their 20s still have a relatively high appetite (Fig 1). In the meantime, as compared to their male
counterparts, female consumers are more interested in design, both for the exterior and for the interior (Fig 2).
These suggest that the automobile industry should primarily target female consumers in their 20s to most
effectively enhance the market.
Fig. 1. Will for buying a car
Fig. 2. Key point when buying a car
III. Proposal Of ACMM, A Model For Matching Automobile Exterior And
Interior Colors Thus the authors thought it necessary to visualize consumer preferences and link them to actual color
matching, in order to enable color matching for the automobile exterior and interior. Therefore, the authors
intended to establish Automobile Color Matching Model (ACMM), a model for matching automobile exterior and interior colors, as indicated in Fig 3. Details will follow in Steps 1 to 3. As was mentioned in the previous
section, female consumers in their 20s were selected as the scope of application for this model, because they
lead to the most effective enhancement of market.
Fig. 3. Automobile color matching model (ACMM)
Constructing an Automobile Color Matching Model
www.iosrjournals.org 9 | Page
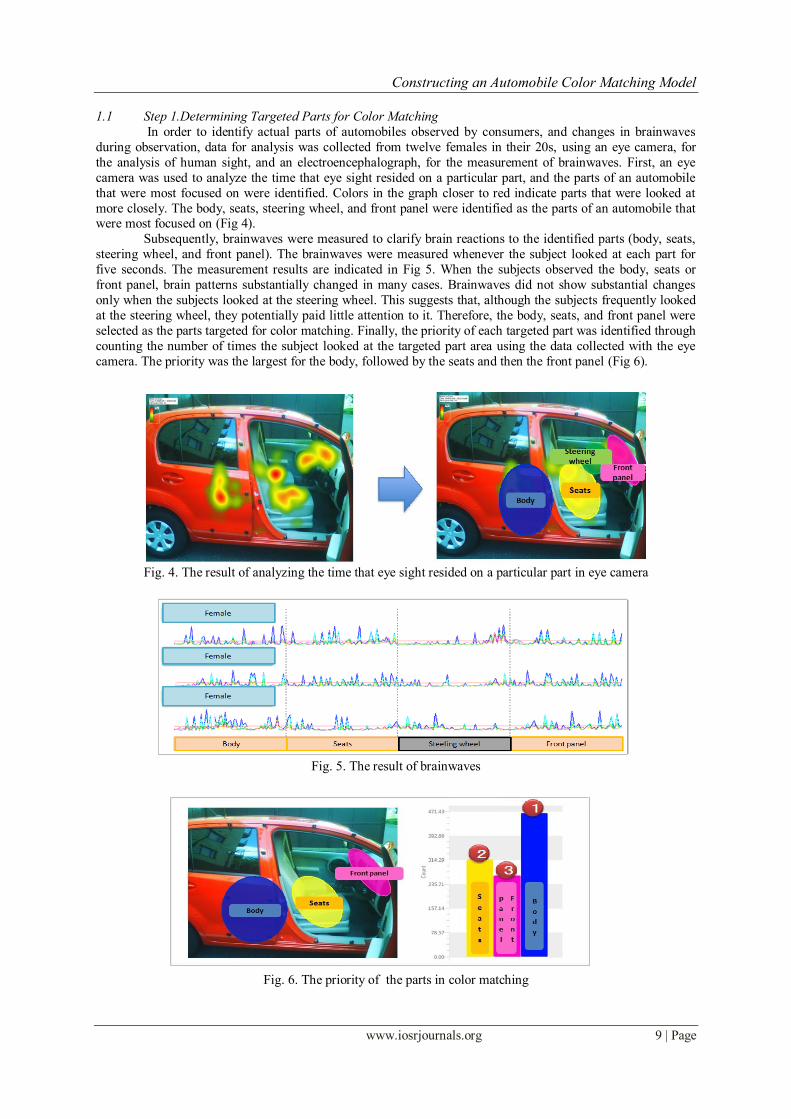
1.1 Step 1.Determining Targeted Parts for Color Matching
In order to identify actual parts of automobiles observed by consumers, and changes in brainwaves
during observation, data for analysis was collected from twelve females in their 20s, using an eye camera, for
the analysis of human sight, and an electroencephalograph, for the measurement of brainwaves. First, an eye
camera was used to analyze the time that eye sight resided on a particular part, and the parts of an automobile
that were most focused on were identified. Colors in the graph closer to red indicate parts that were looked at
more closely. The body, seats, steering wheel, and front panel were identified as the parts of an automobile that were most focused on (Fig 4).
Subsequently, brainwaves were measured to clarify brain reactions to the identified parts (body, seats,
steering wheel, and front panel). The brainwaves were measured whenever the subject looked at each part for
five seconds. The measurement results are indicated in Fig 5. When the subjects observed the body, seats or
front panel, brain patterns substantially changed in many cases. Brainwaves did not show substantial changes
only when the subjects looked at the steering wheel. This suggests that, although the subjects frequently looked
at the steering wheel, they potentially paid little attention to it. Therefore, the body, seats, and front panel were
selected as the parts targeted for color matching. Finally, the priority of each targeted part was identified through
counting the number of times the subject looked at the targeted part area using the data collected with the eye
camera. The priority was the largest for the body, followed by the seats and then the front panel (Fig 6).
Fig. 4. The result of analyzing the time that eye sight resided on a particular part in eye camera
Fig. 5. The result of brainwaves
Fig. 6. The priority of the parts in color matching

Constructing an Automobile Color Matching Model
www.iosrjournals.org 10 | Page
3.2 Step 2.Consumer Preference Survey
A consumer preference survey was conducted to stratify consumer preferences, and to clarify what
consumers wanted from automobile colors. A questionnaire was used as a means of the survey. The survey was
conducted over fifty females in their 20s, asking 1) what automobile colors they liked, and 2) what magazines
they were reading. In Question 1), twenty keywords were provided, as listed in Fig 7 (cute, cool, unique,
refined, orthodox, chic, novel, sophisticated, futuristic, girly, classy, simple, traditional, fresh, fashionable,
urban, conspicuous, clean, gentle, sporty), to represent images that the subjects wanted from automobile colors. Respondents were asked to answer rating each keyword on a scale of seven. In Question 2), respondents were
supposed to freely describe their answers.
Fig. 7. The perceptional key words
3.3 Classification of Preferences and Identification of Perceptional Keywords
Cluster analysis was conducted to classify the subjects by their preferences. Responses to Question 1)
were used as data for analysis. The analysis method applied sample classification, standardization, Ward‟s method, and Euclidean distance. Fig 8 (a) indicates the dendrogram for this analysis, suggesting that females in
their 20s could be classified into Groups A through D. Freely described responses to Question 2) indicate that
subjects in the same group prefer magazines for similar fashion styles. Based on these results, Group A was
defined as „Girlish‟, B as „Elegant‟, C as „Boyish‟, and D as „Thrifty‟ (Fig 8 (b)).
Subsequently, principal component analysis was conducted using data collected in Question 1), in
order to clarify relationships between consumer preferences and perceptional keywords. For the purpose of
verifying the significance of each principal component, factor loading, which indicates correlation between the
component and the original variant, was identified. Then a factor loading scatter diagram was formulated for
Principal Component 1 and Principal Component 2. According to Principal Component 1, “conspicuous”,
“novel”, “unique” and similar perceptional keywords indicated strong positive values, while “chic”, “refined”,
“clean”, etc. showed negative values. According to Principal Component 2, “sporty” and “cool” had positive
values, in contrast to negative values for “cute” and “girly”. These results can be interrupted as suggesting that, in the context of automobile colors, Principal Component 1 is an axis for preference to flamboyant or chic,
while preference to cool or cute is indicated by the axis of Principal Component 2. Thus relationships between
perceptional keywords and significances of principal components could be clarified.
Finally, the results of cluster analysis were compared with the results of principal component analysis,
in order to clarify the characteristics of each group, and identify perceptional keywords by preference. Subjects
were classified according to a scatter diagram formulated based on Principal Component 1 and Principal
Component 2, and were compared to the groups defined in cluster analysis (Fig 9 (a)).The four groups based on
cluster analysis could also be delineated on the principal component score scatter diagram. Therefore, by
converting the principal component score scatter diagram into a factor score scatter diagram, perceptional
keywords for each group could be picked up from its distribution area in the diagram. The identified keywords
for „Girlish‟ were “cute”, “girly”, “gentle” and “urban”. For „Elegant‟ the keywords were “refined”, “classy”, “chic” and “clean”. For „Boyish‟ the keywords were “cool”, “sporty”, “simple” and “orthodox”; and for
„Thrifty‟ they were “unique”, “novel”, “conspicuous”, and “fashionable” (Fig 9 (b)).

Constructing an Automobile Color Matching Model
www.iosrjournals.org 11 | Page
Fig. 8. (a) Classifying the subjects by their preferences; (b) The classification of the fashion
Fig. 9. (a) Cluster analysis and the principal component score scatter diagram.; (b) The principal component
score scatter diagram and factor score scatter diagram
1.2 Step 3.Color Matching
Subsequently, preferred automobile colors were identified for each of the four groups as classified in
the previous section („Girlish‟, „Elegant‟, „Boyish‟ and „Thrifty‟), and design matching was undertaken based on
AHP. First, in order to identify preferred automobile colors, subjects were shown PCCS hue rings, and were
asked to answer “1” if they liked the hue and “0” if they disliked it (Fig 10 (a)). Subsequently, a hue ring liked
by each group was identified using the Quantification Method Type III. Fig 10 (b) indicates the scores of respective variants. According to the vertical axis, the positive area
was defined as “high saturation”, because tones with high saturation were concentrated in this area. Similarly,
the negative area was defined as “low saturation”. According to the horizontal axis, the positive area was
defined as “low brightness”, because tones with low brightness were concentrated in this area. Similarly, the
negative area was defined as “high brightness”. Referring to the grouping based on the consumer preference
survey in the previous section, the tones preferred by each group could also be identified as indicated in Fig 11
(a). The „Girlish‟ group preferred light grayish, light and soft tones. The „Elegant‟ group liked dull, deep and
grayish tones. The „Boyish‟ group liked vivid, soft and dull tones, and the 'Thrift' group preferred vivid, bright
and strong colors. These results also seem reasonable from the viewpoint of their respective preferred fashion
styles. Because the „Girlish‟ group likes soft and cute clothes, the „Boyish‟ group prefers sporty and/or standard
items, the „Elegant‟ group likes chic and classy clothes, and the 'Thrift' group loves unique items, the
classification above can be deemed appropriate. Subsequently, a questionnaire survey by the scale of seven was conducted concerning colors contained
in the identified hue rings, and colors with high mean values were included in the scope of matching. Fig 11 (b)
indicates the selected colors.
Finally, AHP analysis for matching was conducted for the colors selected for each group, in the order
of priority of parts (body, seats, and front panel in this order). The aim for AHP was the matching of automobile
colors. The perceptional keywords for each group, as identified in 3.2, were used as the relevant parameters.
Colors selected for each group were used as alternatives. The following analysis process is described taking the

Constructing an Automobile Color Matching Model
www.iosrjournals.org 12 | Page
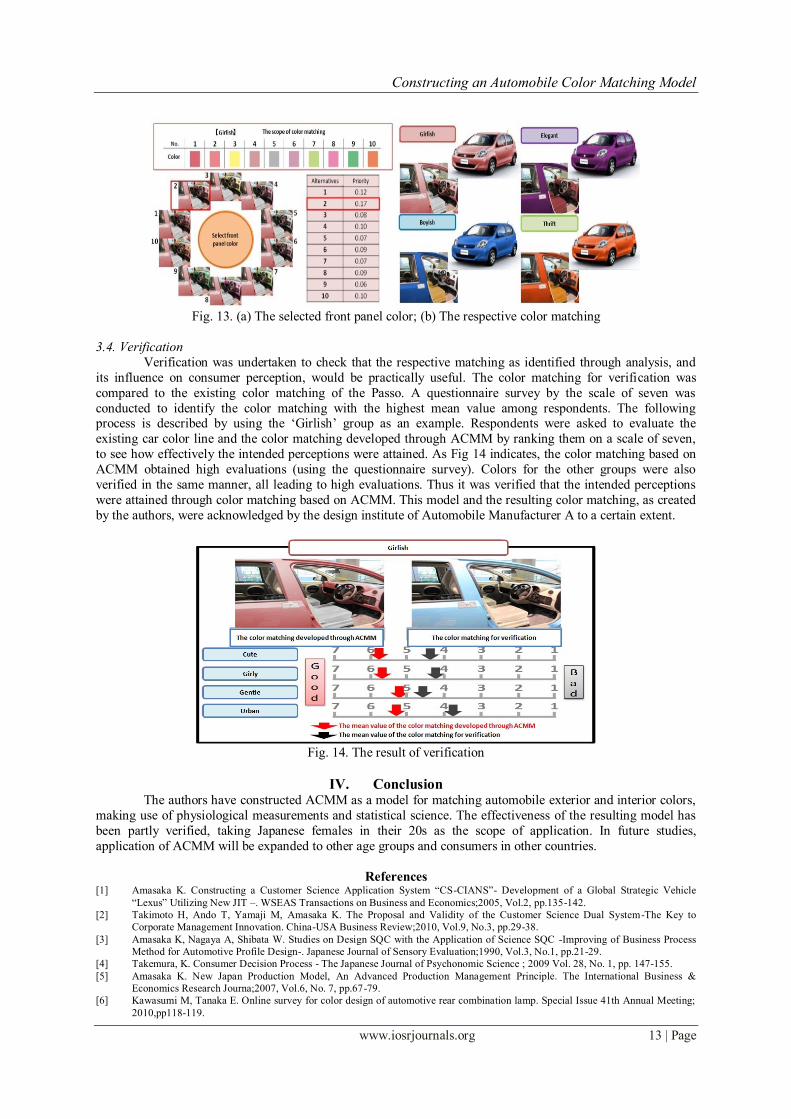
„Girlish‟ group as an example. First, the body color was determined. As Fig 12 (a) indicates, Alternative 2 was
selected as the body color, because its significance was the highest. In the subsequent process, the selected body
color was set while the seat color was determined. As Fig 12 (b) indicates, Alternative 5 was selected as the seat
color, because its significance was the highest. Finally, the selected combination of body color and seat color
was set while the front panel color was determined. As Fig 13 (a) indicates, Alternative 2 was selected as the
front panel color, because it indicated the largest value. Through these steps, automobile design matching has
been determined for the „Girlish‟ group. In the same manner, the respective color matching for „Elegant‟, „Boyish‟ and 'Thrift' was analyzed and determined, as indicated in Fig 13 (b).
Fig. 10. (a) A questionnaire of hue rings; (b) The scores of respective variants on the Quantification Method
Type III
Fig. 11.(a) The classification of hue rings by each groups; (b) The color of the scope of matching
Fig. 12. (a)The selected body color; (b) The selected seat color
Constructing an Automobile Color Matching Model
www.iosrjournals.org 13 | Page
Fig. 13. (a) The selected front panel color; (b) The respective color matching
3.4. Verification
Verification was undertaken to check that the respective matching as identified through analysis, and
its influence on consumer perception, would be practically useful. The color matching for verification was
compared to the existing color matching of the Passo. A questionnaire survey by the scale of seven was
conducted to identify the color matching with the highest mean value among respondents. The following process is described by using the „Girlish‟ group as an example. Respondents were asked to evaluate the
existing car color line and the color matching developed through ACMM by ranking them on a scale of seven,
to see how effectively the intended perceptions were attained. As Fig 14 indicates, the color matching based on
ACMM obtained high evaluations (using the questionnaire survey). Colors for the other groups were also
verified in the same manner, all leading to high evaluations. Thus it was verified that the intended perceptions
were attained through color matching based on ACMM. This model and the resulting color matching, as created
by the authors, were acknowledged by the design institute of Automobile Manufacturer A to a certain extent.
Fig. 14. The result of verification
IV. Conclusion The authors have constructed ACMM as a model for matching automobile exterior and interior colors,
making use of physiological measurements and statistical science. The effectiveness of the resulting model has
been partly verified, taking Japanese females in their 20s as the scope of application. In future studies,
application of ACMM will be expanded to other age groups and consumers in other countries.
References [1] Amasaka K. Constructing a Customer Science Application System “CS-CIANS”- Development of a Global Strategic Vehicle
“Lexus” Utilizing New JIT –. WSEAS Transactions on Business and Economics;2005, Vol.2, pp.135-142.
[2] Takimoto H, Ando T, Yamaji M, Amasaka K. The Proposal and Validity of the Customer Science Dual System-The Key to
Corporate Management Innovation. China-USA Business Review;2010, Vol.9, No.3, pp.29-38.
[3] Amasaka K, Nagaya A, Shibata W. Studies on Design SQC with the Application of Science SQC -Improving of Business Process
Method for Automotive Profile Design-. Japanese Journal of Sensory Evaluation;1990, Vol.3, No.1, pp.21-29.
[4] Takemura, K. Consumer Decision Process - The Japanese Journal of Psychonomic Science ; 2009 Vol. 28, No. 1, pp. 147-155.
[5] Amasaka K. New Japan Production Model, An Advanced Production Management Principle. The International Business &
Economics Research Journa;2007, Vol.6, No. 7, pp.67-79.
[6] Kawasumi M, Tanaka E. Online survey for color design of automotive rear combination lamp. Special Issue 41th Annual Meeting;
2010,pp118-119.
Constructing an Automobile Color Matching Model
www.iosrjournals.org 14 | Page
[7] Asami H, Owada H, Murata Y, Takebuchi S, Amasaka K. The A-VEDAM Model for Approaching Vehicle Exterior Design.
Journal of Business Case Studie;2011, Vol. 7, No. 5,.pp.1-8.
[8] Satake, I., Ando, K., Kuwano, K., Sato, T., Hattori, H. and Kajiwara, K. Study on Relationship between Automotive Exterior Color
and Automotive Shape Category -J. Color Sci. Assoc. Jpn; 2004, Vol. 28, No. 2, pp. 102-110.
[9] Yoshida, T. Evolution and Future Trends of Paint Color for Automobiles, Color Designs and Painting Schemes -J. Soc. Autom.
Eng. Jpn; 2003, Vol. 57, No. 5, pp. 4-9.
[10] Fujieda, S., Masuda, Y. and Nakahata, A. Development of Automotive Color Designing Process -J. Soc. Autom. Eng.
Jpn; 2007,Vol. 61, No. 6, pp. 79-84.
[11] Asakura S, Kanke R, Tomimatsu K, Amasaka K. A studey of an automobile intereer and extereer color matching. Aoyamagakuin
University;2012.