AUTOMOBILE CRASH TEST FACILITY AND PRELIMINARY ...
140
AUTOMOBILE CRASH TEST FACILITY AND PRELIMINARY ANALYSIS OF LOW SPEED CRUSH CHARACTERISTICS by GRANT W. MIYASAKl B.A.Sc, The University of Toronto A THESIS SUBMITTED IN PARTIAL FULFILMENT OF THE REQUIREMENTS FOR THE DECREE OF MASTER OF APPLIED SCIENCE in THE FACULTY OF GRADUATE STUDIES DEPARTMENT OF CIVIL ENGINEERING We accept this thesis as conforming to the required standard THE UNIVERSITY OF BRITISH COLUMBIA September, 1987 © Grant W. Miyasaki, 1987
-
Upload
khangminh22 -
Category
Documents
-
view
0 -
download
0
Transcript of AUTOMOBILE CRASH TEST FACILITY AND PRELIMINARY ...
AUTOMOBILE CRASH TEST FACILITY AND PRELIMINARY ANALYSIS OF LOW SPEED
CRUSH CHARACTERISTICS
by
GRANT W. MIYASAKl
B.A.Sc, The University of Toronto
A THESIS SUBMITTED IN PARTIAL FULFILMENT OF
THE REQUIREMENTS FOR THE DECREE OF
MASTER OF APPLIED SCIENCE
in
THE FACULTY OF GRADUATE STUDIES
DEPARTMENT OF CIVIL ENGINEERING
We accept this thesis as conforming
to the required standard
THE UNIVERSITY OF BRITISH COLUMBIA
September, 1987
© Grant W. Miyasaki, 1987

In presenting this thesis in partial fulfilment of the requirements for an advanced
degree at the University of British Columbia, I agree that the Library shall make it
freely available for reference and study. I further agree that permission for extensive
copying of this thesis for scholarly purposes may be granted by the head of my
department or by his or her representatives. It is understood that copying or
publication of this thesis for financial gain shall not be allowed without my written
permission.
Department of Cli/ll £t\«JI*.€tfi\4
The University of British Columbia 1956 Main Mall Vancouver, Canada V6T 1Y3
Date OcJoljlr' f /? 7
DE-6(3/81)

ABSTRACT
A large percentage of automobile accidents in city traffic occur at speeds
below 15 mph. Unfortunately there is a scarcity of experimental crash data at these
low speeds to help investigators to reconstruct accidents. Accident reconstruction
experts have consequently attached a low level of confidence to speed predictions
from vehicle crush at the low end of the speed spectrum. The need for more
experimental crash data, especially in a low speed range, has repeatedly been
mentioned by accident investigators. The University of British Columbia Accident
Research Croup has constructed a crash test facility in conjunction with the
Insurance Corporation of British Columbia to address this need. The lCBC-UBC
barrier is a low speed crash test facility.
A description of the ICBC-UBC crash barrier, its systems and crash testing
techniques at the ICBC-UBC facility are presented in this thesis. Also multiple
impacts on the same vehicle are investigated to see if this technique provided
accumulated crush data that reproduced known high speed crashes. In addition, the
preliminary findings are presented on the impact speed to initiate permanent crush
and subsequent implications toward vehicle crush characteristics in a low speed
range.
ii

TABLE OF CONTENTS
ABSTRACT ii
LIST OF TABLES v
LIST OF FIGURES vi
ACKNOWLEDGEMENT ix
1. INTRODUCTION 1
2. LITERATURE REVIEW 4 2.1. First Full Frontal Barrier Impact Test 4 2.2. UCLA-ITTE Crash Test Facility 5 2.3. Ford Motor Company Test Facility 6 2.4. Road Research Laboratory Test Facility 10 2.5. General Motors Corporation Automotive Crash Test Facility 11 2.6. Crash Test Techniques at Fiat 12 2.7. Transport Canada Motor Vehicle Test Centre 13 2.8. A Few Other Crash Test Techniques 14 2.9. Conclusion 14
3. ICBC-UBC CRASH TESTING FACILITY DESIGN AND CONSTRUCTION 15 3.1. Introduction 15 3.2. Overview of the Crash Testing Facility 16 3.3. Test Site 18 3.4. Crash Barrier 20 3.5. Propulsion System 24 3.6. Speed Measurement 26 3.7. Recording of the Impact Event 29 3.8. Release Mechanisms 29
3.8.1. Main release mechanism 30 3.8.2. Redundant release mechanism 34
3.9. Data Collection 39 3.10. Safety Considerations , 41
4. VALIDATION OF ICBC-UBC CRASH TESTING FACILITY 42 4.1. ICBC-UBC Crash Testing Facility and SAE Recommendations 42 4.2. Validation of ICBC-UBC Crash Test Facility Results 43
5. HIGH SPEED CRASH DATA FROM REPEATED IMPACTS 53 5.1. Introduction 53 5.2. Campbell's Derivation of Energy Absorbed in Residual Crush 54 5.3. Absorbed Energy in Crush from Multiple Impacts 60
5.3.1. Force-residual crush response of multiple impacts 62 5.3.2. Quantification of crush energy from multiple impacts 64
5.4. Repeated Crash Tests 68
iii

6. BUMPER PERFORMANCE LEVEL AND LOW SPEED ENERGY ABSORPTION CHARACTERISTICS 73
6.1. Low Speed Bumper Tests 74 6.2. Graphical Interpretation of Crush Energy in the Low Speed Range .... 75 6.3. Crush Energy of the Two Regime Model 83 6.4. Three Regime Model of Vehicle Crush Characteristics 84
7. APPLICATIONS TO THE CRASH3 PROGRAM 88
8. CONCLUSION 98
9. FURTHER AND FUTURE RESEARCH 101 9.1. Further Research 101
9.2. Future Research 103
BIBLIOGRAPHY 105
APPENDIX I 109
APPENDIX II 115
APPENDIX III 119
APPENDIX IV 123
APPENDIX V 126
iv

LIST O F TABLES
Table 4.1 : Errors of fit/prediction 48
Table 4.2 : Honda test data 52
Table 5.1 : Double impact results 68
Table 5.2 : Double impact equivalent speed 69
Table 6.1 : Bumper tests 74
Table 7.1 : Speed-residual crush coefficients 91
Table 7.2 : Force-residual crush coefficients 91
Table 7.3 : Energy of deformation across the residual crush profile 94
v

LIST O F FIGURES
Figure 2.1 : UCLA-ITTE test setup 7
Figure 2.2 : Ford Motor Company crash barrier construction 9
Figure 2.3 : Towing arrangement 9
Figure 2.4 : Fiat catapult 12
Figure 3.1 : Towing arrangement 17
Figure 3.2 : Site plan view - original and prepared site 19
Figure 3.3 : Acceleration-speed-distance relationship 21
Figure 3.4 : Crash barrier 23
Figure 3.5 : Speed trap-remote electronics unit & sensor 27 unit
Figure 3.6 : Main release mechanism 31
Figure 3.7 : Main release dynamic load test results 33
Figure 3.8 : Main release static load test results 35
Figure 3.9 : Main release calculated static release force - 36 maximum spring travel/spring constant/ static release force
Figure 3.10 : Main release calculated static release force - 37 incline angle/friction coefficient/ static release force
Figure 3.11 : Redundant release mechanism 38
vi

Figure 3.12 : Redundant release dynamic load test results 40
Figure 4.1 : Crash test results of 1975 to 1981 Honda Civics 45
Figure 4.2 : Residual plot of lCBC-UBC, Transport Canada, 46 and Strother et al data
Figure 4.3 : Frequency distribution of errors of fit/pred. 47 (Honda Civics)
Figure 4.4 : Crash test results of 1971-1972 full size C M . 49 cars
Figure 4.5 : Residual plot of ICBC-UBC and Campbell data 50
Figure 4.6 : Frequency distribution of errors of fit/pred. 51 (Full size C M . cars)
Figure 5.1 : Force-residual crush response 56
Figure 5.2 : Measured force-crush responses 58
Figure 5.3 : Impact speed-residual crush curve 61 1971-1972 C M . vehicles
Figure 5.4 : Crush energy of a vehicle repeatedly impacted 63
Figure 5.5 : Possible deviation of multiple impact data from single impact data 67
Figure 5.6 -. Multiple impact test results-1977 Honda Civic 70
Figure 5.7 : Multiple impact test results-1971 C M . Cutlass 72
Figure 6.1 : Single regime force per unit width-residual 77 crush model
Figure 6.2 : Two regime speed-residual crush model 78
vii

Figure 6.3 : Two regime force-residual crush model 80
Figure 6.4 : Higher order force-residual crush function 81
Figure 6.5 : Two regime energy plot 82
Figure 6.6 : Impact speed vs residual crush for full frontal 85 barrier tests for C M . Citations 1979-1982
Figure 6.7 : Three regime speed-residual crush model 87
Figure 7.1 : Impact speed vs residual crush 90 1975-1981 Honda Civic
Figure 7.2 : Force per unit width vs residual crush 92 1975-1981 Honda Civic
Figure 7.3 : Damage pattern 93
Figure 1-1 : Triangular deceleration pulse 112
Figure I-2 : Effect of wall movement on earth pressure 112
113 Figure I-3 : Crash barrier free body diagram
Figure IV-1 : Force response for elastic and plastic crushing 124
viii

ACKNOWLEDGEMENT
This thesis would not have been possible without the assistance of many
people. 1 would like to thank Dr. Francis Navin for his advice and guidance in
preparation of this thesis, and for the coordination of the crash barrier project. I
thank Mike MacNabb for his contributions to the design and coordination of the
facility. His assistance was responsible for much of the success of the test facility.
Thanks are extended to the staff at the Insurance Corporation of British
Columbia - Material Damage Center. The assistance of John Gane, Bob Wilson, Larry
Kenmare, and lain Saville in the construction and preparation of the test facility and
help in testing of vehicles is greatly appreciated.
I would like to thank Rod Nussbaumer for designing the speed trap
electronics and also John Nepomuceno for building the speed trap switch box.
In addition, I would like to acknowledge the work and assistance of
Richard Postgate and Max Nazar in building the release mechanisms.
Financial assistance came from the Natural Science and Engineering Research
Council.
ix

1. INTRODUCTION
At the scene of an automobile accident, one of the most important pieces
of information to the accident reconstruction expert is the damage pattern on the
vehicle since this provides a vital clue to the speed change during impact. The
residual crush profile provides a measure of the energy dissipated during the
collision. More precisely, it indicates the quantity of the vehicle's kinetic energy that
is absorbed in residual crush. The energy absorbed in residual crush is necessary for
predicting speed changes of the vehicles involved in the accident. Residual crush is
the permanent crush on the vehicle or plastic deformation.
In order to determine the energy absorbed in residual crush, the crush
characteristics of the vehicle must be known. The vehicle's front structure behaves
like a plastic spring during a collision. The pre-compression force (force to begin
displacement) and the increase in force with displacement (spring constant) are the
parameters that describe the characteristics of a spring. Similary, these two
parameters define the crush characteristics of the vehicle. The force to initiate
permanent crushing and the increase in force with further residual crushing define
the crush characteristics of the vehicle's front structure. Different vehicles absorb
different quantities of energy per unit of residual crush. A vehicle that has a stiff
front structure absorbs a greater energy per unit of residual crush than a vehicle
with a soft front structure. In summary, the crush characteristics of a vehicle enable
the quantity of energy absorbed to be calculated from which the speed change of
the vehicle is determined.
1

2
The crush characteristics of the vehicle's front structure are derived from
full frontal barrier collisions. In a full frontal barrier impact, the energy absorbed in
residual crush is easily determined since all of the vehicle's kinetic energy is
consumed in deforming the structure. To determine the stiffness of a specific
vehicle model, many full frontal barrier impacts are conducted at different speeds.
From the impact speed and residual crush data of these tests, the vehicle crush
characteristics are derived.
The source of most crash data is the compliance tests conducted for
Canadian and U.S. Federal Motor Vehicle Safety Standards. These tests are full
frontal barrier collisions in a medium impact speed range of 48 to 56 km/hr. Since
most crash data is in this narrow speed range, there is a scarcity of experimental
data at the low and high end of the speed spectrum. Consequently, speed
estimates from the residual crush in a .low speed range are being challenged
because of this lack of data. In response to this need for crash data, a test facility
was constructed by the University of British Columbia Accident Research Group in
conjunction with the Insurance Corporation of British Columbia (ICBC).
The research for this thesis consists of two major topics. The first topic is
design and construction of a reliable, low cost, low speed crash test facility. The
calibration of the barrier was done by collecting impact speed and residual crush
for a few different vehicles and compare them to known results.
The second part of the research involves the analysis of data produced at
the facility. A program of crash tests were conducted to investigate the following

3
two topics:
•Determination of frontal crush characteristics from
repeated impacts on the same vehicle - To reduce the
cost of data collection, one method suggested is to
use the same cars in multiple impacts. This technique
was investigated because of its potential to save
research money. The theory behind repeated impacts
will be presented and crash tests performed to evaluate
this theory.
•Examine the energy absorption capacity of bumper
systems - Tests were conducted to determine the
energy absorbing capacity of the Honda Civic bumper
system and/or impact speed required to initiate
permanent crush.
Chapter 2 is a literature review of the systems and techniques used to
conduct vehicle crash tests. In Chapter 3 is a full documentation of the design and
construction of the ICBC-UBC test facility, and Chapter 4 has the validation data of
the ICBC-UBC test facility. A preliminary analysis of the multiple impact technique is
presented in Chapter 5. An investigation of the threshold speed and crush
characteristics at the low end of the speed spectrum is presented in Chapter 6. An
application of the proposed crush behaviour model of Chapter 6 is outlined in
Chapter 7 where an equivalent barrier speed is predicted from a example accident
case. Chapter 8 is the conclusion and Chapter 9 identifies areas of further research.

2. LITERATURE REVIEW
Vehicle impact testing has been quite extensive and encompasses a wide
variety of different crash configurations as well as many different objects being
struck. In addition, impact testing includes individual components as well as full
scale vehicles. This review is confined to full scale barrier impact testing. The
evolution of barrier impact testing is sketched from the early primitive, yet effective
techniques of the 1950's, to the present sophisticated procedures. Different crash
test facilities in North America and Europe are described with a focus on the
following topics:
•Crash barrier design
'•Propulsion of the test vehicle
•Directional control of the test vehicle
•Speed control of the test vehicle
•Instrumentation and data acquisition
In addition, the motivation behind undertaking the full scale barrier testing will be
outlined.
2.1. FIRST FULL FRONTAL BARRIER IMPACT TEST
Barrier impact testing began in 1934 when C M . crashed a vehicle into a
retaining wall. In that test the vehicle was driven at a low speed to allow the
4

5
driver to jump out just prior to impact.
This technique was very simple since the driver controlled the vehicle. The
vehicle's own engine was used for propulsion and a driver steered the vehicle and
controlled the speed. However, the technique was limited to very low speeds, and
the safety of the driver remained a problem.
2.2. UCLA-ITTE CRASH TEST FACILITY
An automobile crash test facility was constructed by the University of
California in the 1950's. The purpose of the crash tests were to compare the
restraining features of the chest-type, lap-type and shoulder-type safety belt. In
addition, the collapse characteristics of automobile structures were investigated. More
specificially, the deceleration pulse was examined and the causes for departure of
this deceleration pulse from the ideal uniform deceleration pulse were investigated.
This crash barrier consisted of large diameter utility poles sunk 2.4 m into
the ground and supported by cross members and braces. The barrier was backed
by earth fill to provide additional resistance. The impact surface was 2.4 m high
and 4.3 m wide.
The test vehicle was propelled toward the barrier by pushing it with
another vehicle (control car). The control car would push the test vehicle until it
was 30 m from the barrier then break away, decelerate and stop 12 m short of
the barrier.

6
Directional control was maintained by remote control steering that utilizes a
selsyn motor. A selsyn motor is held in contact with an auxiliary steering wheel in
the control car. Movement of this steering wheel rotates the shaft of the selsyn
motor which changes the output from the selsyn. This output is transmitted to an
identical motor in the test car which is held in contact with its steering wheel.
The output produces a similar movement of the selsyn shaft and steering wheel. A
person in the control car steers the test vehicle with the auxiliary steering wheel.
Trial runs were conducted so the desired impact speed could be achieved.
Trial runs showed that by pushing the test vehicle to 48 km/hr at 30 m from the
barrier it would decelerate, while coasting, to the desired impact speed of 40
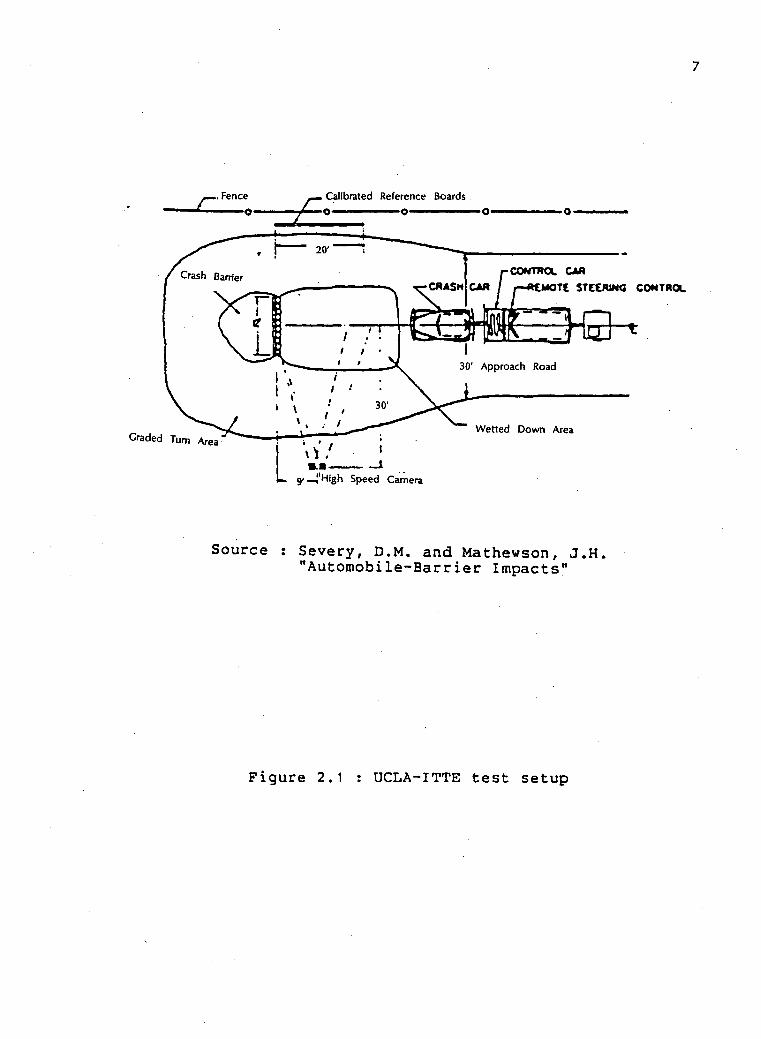
km/hr. Figure 2.1 is a diagram of the test arrangement.
The test vehicle was fully instrumented. An anthropometric dummy was
placed in the driver seat and instrumented with accelerometers in the chest cavity
and head. Strain guages were mounted to record the impact forces on the foot
rest, seat and chest level safety belt. The signals from these detectors were sent to
the recording equipment on the control vehicle by an 30 m cable. High speed
cameras were used to record the impact event.
2.3. FORD MOTOR COMPANY TEST FACILITY
A crash test facility of the Ford Motor Company has provided full scale
collisions during the 1950's and 1960's. Tests were conducted to determine what
happens to occupants during a collision. The dynamics of the dummies and injury
7
Source : Severy, D.M. and Mathewson, J.H. "Automobile-Barrier Impacts"
Figure 2.1 UCLA-ITTE test setup

8
mechanisms were investigated by observing the damage sustained by the dummy
from striking the interior of the passenger compartment.
The crash barrier is constructed of 0.6 m diameter logs embedded vertically
1.8 m into a trench that is packed with a concrete fill. The barrier is backed by a
sand pile and the impact surface is faced with oak planks. The barrier is 5.5 m
wide, 1.8 m high and 4.5 m long as shown in Figure 2.2.
The test vehicle is towed by a tow car with a cable toward the barrier.
The test vehicle is displaced 3.3 m laterally and 10 m behind the tow car. This
arrangement is shown in Figure 2.3. Trial runs are performed on an open area to
determine the steering wheel position which provides accurate tracking and correct
impact direction. A release mechanism which is actuated manually, releases the tow
cable just prior to impact. The towing distances for various impact speeds are
established when the tow car is operating at full throttle while towing a 1800 kg
car. Setting these towing distances allows control of impact speed.
The test vehicle is instrumented with accelerometers mounted on the frame
and floor pan of the passenger compartment to measure decelerations during
impact, and tensiometers are mounted on the seat belt to measure loads during
impact. Dummies with accelerometers in the head and stomach cavity are placed in
the front and rear seats. The signals from these transducers are sent through an
electric cable to an instrumentation van which follows alongside the test vehicle.
High speed cameras placed at the side of the barrier record the impact, and high
speed cameras mounted on the the test vehicle record the movements of the

PLAN
LOGS-2 It. DIA. 12 ft. IONG
OAK PIANKIHG
DIRECTION OF lUPACTsOf) 6 h.HIGH
ROAD SURFACE | . ;~
PACKED Fill
CONCRETE \\WM' ELEVATION
Source : Fredericks, A.L. "Automobile Crash Research"
Figure 2.2 : Ford Motor Company crash barrier construction
INSTRUMENTATION VAN
CRASHING CAR
TOW BIRD
Source : Haynes, A.L. Fredericks, R.H. and Ruby, W.J, "Automotive Collision Impact Phenomena"
Figure 2.3 Towing arrangement

10
dummies.
2.4. ROAD RESEARCH LABORATORY TEST FACILITY
A crash test facility at the Road Research Laboratory track in Crowthorne,
England built in the 1960's has provided crash information on European cars. The
crash barrier is constructed of 56 concrete blocks that are held together with tie
rods. The barrier weighs 91,000 kg and is 1.8 m high, 3.7 m wide and 6.4 m
long.
The crash car has its ignition switched on, and the clutch and appropriate
gear engaged. A control car pushes the crash car until its engine starts, and
thereafter the crash car accelerates under its own power. The control car follows 'a
short distance behind since the vehicles are connected by the electrical cables of
the instrumentation. Directional control is maintained by remote control steering with
a selsyn motor. A person in the control car remotely steers the crash car. The
desired speed at impact is achieved by setting the throttle opening, the distance of
the crash car from the barrier and the speed to which the crash car is pushed.
Trial runs are conducted to determine these settings for the desired impact speed.
The crash car is instrumented with accelerometers, event markers,
displacement meters and strain guages. The acclerometers are mounted on the floor
to measure decelerations of the passenger compartment. The event markers are
contact strips which are placed on the front bumper to record the instant of
impact. They are also placed behind the engine block to record the time from first

11
impact and the passenger compartment moving forward to the engine block.
Displacement meters are placed in the passenger compartment to measure
movement of the steering wheel column. The strain guages are clamped to the
seat belts to measure the loads during impact. Dummies with accelerometers in the
chest cavity are placed in the front seats. High speed motion cameras are used to
record the deformation of the car and movement of the dummies.
2.5. GENERAL M O T O R S C O R P O R A T I O N A U T O M O T I V E CRASH TEST FACILITY
General Motors Corporation built a crash test facility in the 1%0's to
provide data for development of crashworthy automobiles and testing for compliance
to U.S. Federal Motor Vehicle Safety Standards. The barrier at this facility consists of
a formation of concrete packed with sand with a subgrade foundation. The mass of
the barrier is 64,000 kg and the impact face is 2.1 m high and 3 m wide.
The tow system consists of an endless cable that forms a continuous loop.
The cable passes through a friction drive system composed of pulleys, drive-drum
and tensioners. The cable is wrapped around the drive-drum and maintained in
position by guide pulleys. A vehicle mounted on ground stands powers the
drive-drum with a shaft connecting the rear axle to the drive-drum. Directional
control of the test vehicles are maintained with a dolly and guide rail. The test
vehicle is chained to the dolly which slides along the flange of the guide rail.
Speed control is acheived by manually balancing the power input to the system
against the system speed. A tach generator connected to the drive-drum provides a
measurement and display of speed for the person controlling the speed.

1.6. CRASH TEST TECHNIQUES AT FIAT 12
Fiat has tried a number of different and unique techniques for crashing
cars. One of these techniques is a catapult which launches a vehicle with springs
at speeds up to 40 km/hr. This test rig is shown in Figure 2.4.
Barrier Release
dampers t ravel2 .3m max
Source : Franchini, E. "Crash Testing Evolution at Fiat"
Figure 2.4 : Fiat catapult
Another technique attempted was to push the test vehicle with another
vehicle. The test vehicle was steered by a long steering column which extended
through the rear window to a person in the pushing car. As the vehicle nears the
barrier, the pushing car brakes and the steering column slides off so the test car
travels freely to the barrier.
A more elaborate method of conducting crash tests was to radio control

13
the whole vehicle operation. The test vehicles were equiped with pneumatic jacks
to steer, shift gears and actuate the clutch, accelerator and brake. Radio signals
sent to the test vehicle actuated the various actions of the vehicle.
Fiat's new Safety Center built in the 1970's is a versatile crash test facility
capable of staging many different collision configurations. It has a 2 million kg solid
concrete block for testing trucks of up to 18,000 kg and a smaller 320,000 kg
concrete block. Vehicles are propelled by a two ton trolley rolling on rails in a
culvert below the surface. The trolley is driven by a closed loop cable powered by
an electric motor. The motor speed is controlled by a central computer.
2.7. T R A N S P O R T C A N A D A M O T O R VEHICLE TEST CENTRE
A crash test facility in Blainville, Quebec was built for compliance testing of
vehicles to Canadian Federal Motor Vehicle Safety Standards. Vehicle testing began
in 1979 and to date over one hundred vehicles have been tested.
The crash barrier is a solid 180 metric tonne reinforced concrete block that
is 4 m high, 5.8 m long and 3.4 m wide. It rests on a concrete pad that is
supported by piles.
The test vehicle is propelled by a cable that is driven by a winch
powered by an electric motor. Directional control is maintained by a guide rail. The
test vehicle is chained to a dolly which slides along the guide rail.

14
Test vehicles are fully instrumented with anthropometric dummies and
accelerometers. High speed cameras are mounted overhead, below and at both
sides of the vehicle.
2.8. A FEW OTHER CRASH TEST TECHNIQUES
Daimler Benz has staged collisions by propelling the test vehicle with a steam
rocket which pushes the vehicle. The present test rig that Daimler Benz uses for
propulsion and guidance of test vehicles is a linear motor drive which accelerates a
trolley along a channel. The Swedish State Power Board used gravity to propel the
test vehicles. In this technique, vehicles were dropped from a crane. Volvo has also
used gravity to propel vehicles wherein test vehicles descended down a sloping
track.
2.9. CONCLUSION
1. There are as many different methods used to run the tests as facilities.
2. Most barriers are becoming progressively more costly to build and complex to
operate.
3. Proprietory data limited the availability of the results.

3. ICBC-UBC CRASH TESTING FACILITY DESIGN AND CONSTRUCTION
3.1. INTRODUCTION
A need for low speed automobile crash data had motivated the
UBC-Accident Research Croup to design and construct a crash test facility. The
whole facility is comprised of six different design components. The components are:
Site Layout Barrier design Propulsion system Speed measurement High speed video camera Release mechanisms Data collection Safety considerations
Many of the components had, a number of alternatives considered before arriving at
the final design. In this section the design and construction of each of the facility
components will be described.
The low cost of the facility should be emphasized. Unlike other test
facilities, the ICBC-UBC facility was not intended to have expensive instrumentation
and control systems because impact speed and residual crush is the primary
information sought. Simplicity was sought throughout the design and construction.
The design and construction of the testing facility was a joint project
between the University of British Columbia - Accident Research Croup (UBC-ARC)
and the Insurance Corporation of British Columbia (ICBC). The role of the UBC-ARC
was to design and construct the testing facility while ICBC would provide the site,
maintain the facility, and supply vehicles. Personell from both the UBC-ARC and
15
16
ICBC conduct the crash tests.
3.2. OVERVIEW OF THE CRASH TESTING FACILITY
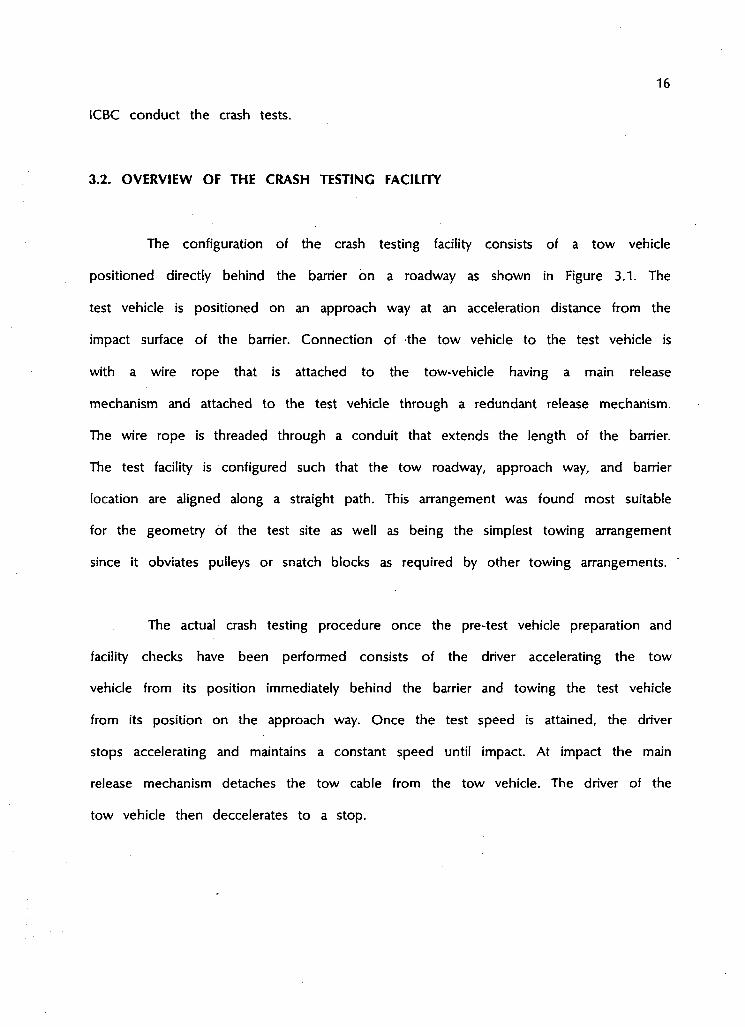
The configuration of the crash testing facility consists of a tow vehicle
positioned directly behind the barrier on a roadway as shown in Figure 3.1. The
test vehicle is positioned on an approach way at an acceleration distance from the
impact surface of the barrier. Connection of the tow vehicle to the test vehicle is
with a wire rope that is attached to the tow-vehicle having a main release
mechanism and attached to the test vehicle through a redundant release mechanism.
The wire rope is threaded through a conduit that extends the length of the barrier.
The test facility is configured such that the tow roadway, approach way, and barrier
location are aligned along a straight path. This arrangement was found most suitable
for the geometry of the test site as well as being the simplest towing arrangement
since it obviates pulleys or snatch blocks as required by other towing arrangements.
The actual crash testing procedure once the pre-test vehicle preparation and
facility checks have been performed consists of the driver accelerating the tow
vehicle from its position immediately behind the barrier and towing the test vehicle
from its position on the approach way. Once the test speed is attained, the driver
stops accelerating and maintains a constant speed until impact. At impact the main
release mechanism detaches the tow cable from the tow vehicle. The driver of the
tow vehicle then deccelerates to a stop.

REDUNDANT RELEASE MECHANISM MAIN RELEASE MECHANISM CRASH BARRIER
/
TOW CABLE \ ^
-fy-
TOW CABLE \ ^
-fy-TOW-VEHICLE
/ ( SAND FILL CONCRETE BLOCKS
TEST VEHICLE
Figure 3.1 : Towing arrangement

18
3.3. TEST SITE
A plan view of the ICBC Surrey test site is shown in Figure 3.2. It is 195
metres long and 30.5 metres wide and is bounded by King George Highway at the
west end, a residential lot at the east end and both commercial and residential lots
on the north and south sides. An existing building that is used for vehicle repairs
occupies 93 m of the west portion of the lot. The section of the lot behind this
building is the testing area which measures 102 m long and 30.5 m wide.
Preparation of the site involved clearing and levelling, and spreading a gravel surface
for the tow road. A 15 cm deep "approach" depression was excavated for the
barrier placement, see Figure 3.2.
The testing site arrangement has the approach way to the barrier starting at
the back face of the building and ending at the barrier impact surface 27.5 m
away. The barrier extends 9 m from the end of the approach way , and the tow
road continues from the back of the barrier to the east property line which is a
distance of 65.5 m. The approach way and barrier lie within an existing chain link
fence which provides a secure area from unauthorized personell entering the testing
area.
At the outset it was decided that the tow system would be designed to
accelerate the test vehicle at 0.10 C . This acceleration governed the length of
approach way and tow road. At an acceleration of 0.10 C over a 27.5 m approach
way, the test vehicle can attain a velocity of 26 km/h. This approach length is
sufficient for our earlier tests which will run at less than 26 km/h. For later tests at

3 PJ
rt 03
King George Hwy. TJ n>
TJ 0) n rt) Cb
3 0 . 5 m O
0)
in rr 01
rr
l O C
n>
L O a c
rt)
D
3
rt) H »- 3
o
id 3 o
0) If n x MM % H y, x '
TJ •-1 rt)
TJ 0J
rt) a cn
It
a
R e s i d e n t i a l Lots 6L

20
speeds between 26 km/h and 40 km/h, the approach way can be extended by
opening two garage doors on the east and west sides of the building and towing
the test vehicle through the building.
The 65.5 m tow road allows enough distance for the tow vehicle to
accelerate to 40 km/hr then decelerate at 0.5 C to a stop with excess roadway as
a margin of safety. The curves of Figure 3.3 shows the acceleration-speed-distance
relationship used in determining the roadway lengths.
3.4. CRASH BARRIER
The low speed crash barrier is a rigid non-moveable wall designed for a
40 km/h impact of a 1820 kg vehicle. It is constructed of concrete blocks and
earth fill. The blocks are solid concrete which interlock and are typically used for
retaining wall systems. Each block measures 0.75 m wide, 1.5 m long and 0.75 m
high, and weighs 1995 kg. The blocks interlock with a set of keys on the top and
matching slots on the underside.
Interlocking concrete blocks were chosen instead of a poured concrete wall
for two reasons: the material and construction cost of an interlocking block barrier
is much less than one of poured concrete. Also the blocks may be easily moved
if necessary.
3
A total of 30 blocks and 23 m of earth fill are used in the barrier pictured in Figure 3.4. Eighteen blocks are stacked to form the barrier wall that is

Figure 3.3 : Acceleration-speed-distance relationship

22
3.0 m wide, 2.3 m high and 2.3 m thick. Behind the barrier wall are two side
block walls that are 2.3 m high and 3.0 m long. The side walls contain the 23 3
m of earth fill as well as providing resistance to movement. The whole barrier is
set in a 15 cm deep excavation for increased resistance to movement. The overall
dimensions of the barrier are 9.1 m in length, 2.1 m high and 3.0 m wide.
The impact surface is 3.0 m wide and 2.1 m high and faced with 3/4
inch plywood in accordance with SAE Recommended Practice J850a. Two blocks
were specially cast with a hole for placement of the 8 cm pipe through which the
tow cable passes. The pipe is flared at both ends to reduce abrasion of the tow
cable.
The total mass and configuration of the barrier was designed by
consideration of the applied forces during impact and resistance forces. A triangular
deceleration pulse was used to approximate the vehicle deceleration on impact. The
applied force during impact was then calculated utilizing Newton's second law:
Force = mass * acceleration
The resistance forces come from friction between the concrete blocks and ground,
and the passive pressure of the earth fill. A net force during the impact event
imparts a velocity to the barrier and as the impact force subsides a net resistance
force deccelerates the barrier. Appendix I shows the calculations of the barrier
movement.
According to these calculations, the barrier is sufficient to limit movement
to less than 1% of the permanent crush of the vehicle as specified in SAE

F i g u r e 3.4 : C r a s h b a r r i e r
24
Recommendations (J850a). The total mass of the barrier is 100,000 kgs which also
meets the recommendations of approximately 98,000 kgs of compacted earth fill or
equivalent which is stated in an earlier version of the SAE Recommendations (J850).
Although the barrier meets SAE Recommendations the crush results obtained
will still require a barrier validation to ensure compatibility of results to other
barriers. This involves comparing ICBC-UBC crush results to those of other crash
barriers under similar test conditions.
3.5. P R O P U L S I O N SYSTEM
As previously mentioned, the test vehicle is pulled by a tow vehicle with a
wire rope. The tow vehicle is a Chevrolet pickup truck capable of providing
sufficient power to accelerate a test vehicle at 0.10 G. From initial tests, the gravel
tow road surface was found to provide sufficient traction to accelerate at 0.10 G.
The acceleration of the tow vehicle is actually governed by the withdrawal force of
the main release mechanism.
The tow cable is a 9.5mm (3/8 inch) diameter, 12 x 24 construction wire
rope that is 45.7 m long. A 12 x 24 construction was chosen since strength is
required rather than flexibilty. The 6.4 tonnes breaking strength is more than
adequate to sustain the towing force.
Initially guidance of the test vehicle was to be accomplished by two
means.

25
1. The steering is locked with the wheels directed along the line of travel.
2. The tow cable pulls the test vehicle in the direction of travel. The tow cable pull is maintained along the approach way centerline by the guidance conduit in the barrier.
However, a trial test indicated that these two guidance methods were
inadequate. It is difficult to set the wheels precisely directed towards the barrier
and at a low speed the cable pull does not keep the test vehicle aimed at the
barrier. These problems resulted in the test vehicle wandering off the approach way
at the start of its acceleration. The simple solution was to have a person running
alongside the test vehicle with one hand on the steering wheel. When the test
vehicle reaches a speed of approximately 20 km/hr the person guiding the vehicle
lets the vehicle travel the remaining distance on its own accord. At speeds higher
than approximately 20 km/hr and the shorter length of tow cable, the test vehicle
maintains better directional stability than at lower speeds and thus the directional
pull of the tow cable is sufficient to keep the vehicle on course for the remaining
distance. This guidance method has produced mixed success because of the gravel
approaches.
A guide rail system will be installed to improve the directional accuracy
and reliability when a concrete approach is built. In this system a steel U-channel
beam will be laid along the length of the approach way and the test vehicle's
wheels will be guided in the trough of the U-channel. This type of system has
been used successfully by most facilities in North America.

26
3.6. SPEED MEASUREMENT
Impact speed measurement was made with three different devices. The
primary speed measurement is obtained from a speed trap. The speed trap has a
sensor unit and a remote electronics unit. The sensor unit is housed in a box that
is 1 metre in length and width and 10 cm deep with three switch levers on top
spaced 30.58 cm apart. The unit is set flush to the approach way surface 3 metres
back from the barrier face, and positioned to one side of centerline for the front
tire of the test vehicle to pass over. A picture of the speed trap is shown in
Figure 3.5 .
The remote electronics unit contains the timer and microprocessor for
interpreting the signals sent from the sensor unit via wires. It is equipped with a
digital display giving an immediate reading of speed in miles per hour and is
accurate to within one percent. The speed trap is powered by 12v DC current
provided by a 12v car battery.
When the test vehicle's front tire trips the first switch an electronic
counter starts, tripping of the second switch records the counter reading, and
tripping of the third switch stops the counter. Thus, two timer readings are
obtained which provides two speed measurements. Comparison of the two speed
measurements indicates whether the vehicle was accelerating or decelerating prior to
impact. If the two measurements differ significantly the vehicle's speed is changing
and therefore the actual speed at impact is somewhat different than indicated by
the speed trap. It is important to have an accurate speed measurement since even

F i g u r e 3.5 : Speed t r a p - r e m o t e e l e c t r o n i c s u n i t & s e n s o un 11

28
a small difference in speed results in a substantial difference in the vehicle's kinetic
energy.
Two redundant impact speed measurements are available from a video
camera and from a fifth wheel attached to the tow vehicle . The video camera is
located on one side of the crash site perpendicular to the vehicle path at impact.
The camera has an internal timer to record the time to 1/100 of a second. Impact
speed is determined from playback of the video showing the time and movement
of the vehicle past markers on the approach way.
The fifth wheel looks much like a bicycle wheel. It is attached to the tow
vehicle by an arm extending from a set of wheel forks and is rolled alongside the
tow vehicle. An optical sensor sends a pulse signal - which has a frequency
proportional to the angular velocity of the wheel - to an electronics unit on board
the tow vehicle. The signal is processed and the tow vehicle's speed is recorded
on tape. The tow vehicle's speed should be very close to the velocity of the test
vehicle. Since the fifth wheel measurement gives an indirect measurement of the
test vehicle's speed, it is the least accurate, however the measurement is valuable if
the other measurement methods fail.
Both the speed trap and fifth wheel give an immediate velocity
measurement while the speed measurement from the high speed camera is
obtainable after playback of the video.

29
3.7. R E C O R D I N G O F THE IMPACT EVENT
Crash testing facilities typically capture the vehicle impact with high speed
cameras that have a resolution of 200 to 1000 frames per second as specified by
SAE recommendation J850a. These cameras are very expensive and require a
professional camera operator. These cameras cost approximately $12,000 and the
rental rate is $300 per day plus approximately $300 per day for a camera operator.
Such equipment was too costly for this project.
Standard commercial video cameras are positioned on both sides of the
site perpendicular to the vehicle path at the instant of barrier contact. An overhead
video camera is mounted on a boom directly above the barrier contact point. The
standard video cameras are used for visual recording of the impact only. The
scanning rate of 30 frames per second is not sufficient for micromotion analysis of
the impact.
3.8. RELEASE MECHANISMS
Two release mechanisms were designed to separate the test vehicle from
the towing vehicle. The main release mechanism on the tow vehicle will usually
release with each test, however if it fails a redundant release mechanism will detach
the tow cable from the test vehicle.

30
3.8.1. Main release mechanism
The main release mechanism is bolted to the rear bumper of the tow
vehicle and is designed to release the cable upon test vehicle impact. Having the
cable release from the tow vehicle prevents a whipping cable and need to rethread
it through the barrier conduit after each test. The main release is shown in Figure
3.6 .
The main release has two rollers: one roller is fixed in position while the
second roller is free to slide up and down in a slot. Both rollers are free to
rotate. The roller that is free to slide up and down is spring loaded with two
springs that push the rollers together. A wedge with notches on each side is
pushed between the two rollers' forcing them apart. The rollers seat into the
notches on each side of the wedge. The force of the springs on the rollers resists
the outward movement of the rollers from the notches when a withdrawal force is
applied to the wedge. The incline angle of the wedge is shallow allowing the
wedge to slide into position with minimal force. The steep incline angle in the
notches produces a high resistance force against outward movement of the wedge.
The tow cable is connected to the wedge with cable clamps. At impact the
tension generated in the tow cable pulls the wedge from the roller assembly.
Two required characteristics of the release mechanism are to withstand a
high static load before releasing and yet release with low energy expended.
Retension at a high static load is required to prevent premature releasing of the
cable while the test vehicle is accelerated. A low release energy is desirable so that

F i g u r e 3.6 : M a i n r e l e a s e mechanism

32
a minimal amount of energy is added by the release mechanism to the test
vehicle's kinetic energy at impact . These two properties of the mechanism can be
controlled by the altering the pre-compression of the springs, the incline angle in
the notch and the spring stiffness.
An impact test apparatus was set up to determine the release energy. This
involved mounting the mechanism on a test stand and applying an impact load.
The impact loading system consisted of a round steel guide bar hanging from the
wedge with a stopper plate at the bottom end of the bar. Different sizes of steel
weights dropped at different heights along the guide bar produced different impact
loads and energy applications. The potential energy in the drop height and weight
is converted to kinetic energy which is applied to the release mechanism.
The wedge has a incline angle of 40 degrees and the springs have a
stiffness of 1750 N/cm (1000 lb/inch). When the maximum spring travel is set to
1.3 cm, the release energy is 90 N*m (66 ft-lbs). Compared to 4700 N*m (3500
ft-lb) kinetic energy of a 1400 kg car travelling at 25 km/hr, the release energy
represents only an 1.9% increase. Results of the release energy tests is shown in
Figure 3.7 .
A 2000 N force is the calculated static tension in the cable to pull the
test vehicle at 0.10 G, however , a substantially greater force is generated when
slack in the cable is taken up. Towing tests were conducted and the release
mechanism settings sufficient to prevent premature releasing were determined to be:
•1750 N/cm (1000 lb/in) spring constant *1.3 cm (0.5 in) maximum spring travel

Figure 3.7 : Main release dynamic load test results U l

34
*40 degree incline in the wedge notches
Static load tests conducted with the above release settings gave a withdrawal force
of 4000 N (9001b). Figure 3.8 displays the results of static load tests using a 530
N/cm spring. Figure 3.9 is a plot of the calculated relationship between maximum
spring travel, spring constant and static release force. Figure 3.10 is a plot of the
calculated relationship between incline angle, friction coefficient and static release
force. These latter two plots were used as a guide for selecting the release
mechanism settings during the design stage.
3.8.2. Redundant release mechanism
The redundant release mechanism acts as a link between the trailing end
of the tow cable and the test vehicle. Two chains connected to the redundant
release mechanism are hooked to the underside of the test vehicle and the wire
rope is engaged into the release mechanism. A picture of the release mechanism is
shown is Figure 3.11 .
The principle behind its operation is a brass pin holding the tow cable to
the release mechanism which will shear on impact only if the main release fails.
The release mechanism has two steel plates between which a closed swaged socket
is positioned. The closed swaged socket is crimped to one end of the tow cable
and held in place between the plates by a shear pin. The brass shear pin is slid
through 9.5 mm (3/8 inch) holes in one plate, the swage and the other plate, thus
securing the swage and tow cable in place. The tow cable is released by shearing
of the brass pin at the two interfaces between the plates and swage. The brass

Figure 3.8 : Main release static load test results on

Figure 3.9 : Main release calculated static release force -maximum spring travel/spring constant/static release force

Figure 3.10 : Main release calculated static release force -incline angle/friction coefficient/static release force

F i g u r e 3.11 Redundant r e l e a s e mechan i sm

39
shear pin is 9.5 mm in diameter and at the shear locations the pin is notched to
a smaller diameter. The pin diameter at the notches is machined to 6.75 mm and
will not shear at impact unless the main release fails. The closed swage socket is 1
11/16 inch at its widest point which will allow it to pass through the 3 inch
diameter conduit in the barrier.
Both static and dynamic load tests were performed on the shear pins using
the same testing apparatus as the main release. The shear pin can resist 14,000 N
which is 10,000 N greater than the withdrawal force of the main release. The
energy to shear the pin is 156 N*m which is 66 N*m greater than the energy
required by the main release. The shear pin size is sufficient to retain the tow
cable during towing and does not add a significant amount of energy to the test
car when the main release mechanism fails to operate. Figure 3.12 shows the
relationship between shear area and energy to shear the pin derived from the
dynamic load tests.
3.9. DATA COLLECTION
The raw data collected from the tests are impact speed and residual crush.
The residual crush measurements are accomplished by taking measurements before
and after the collision. Prior to testing, the vehicle's dimensions are measured. The
dimensions recorded are front or rear overhang, wheelbase, front and rear track
width, and front or rear vehicle width. After impact, the same dimensions are
recorded from which the residual crush is determined. The data form in Appendix II
shows the additional vehicle information recorded.

1 6 0
0 . 8
Shear p i n area
Figure 3.12 : Redundant release dynamic load test results

41
Measurement of elastic rebound and rebound velocity will be made with
the video cameras. During the impact, four images are recorded from which
maximum deformation just prior to elastic rebound is determined. This gives the
dynamic crush, and the difference between the dynamic and residual crush is the
elastic rebound.
3.10. SAFETY CONSIDERATIONS
The test facility was designed with a number of safety features such as a
2.5 m high chain link fence encompassing the barrier and approach way, and a
redundant release mechanism. A recommendation of all safety procedures to be
followed and safety equipment required are outlined in the manual of Appendix III.

4. VALIDATION OF ICBC-UBC CRASH TESTING FACILITY
4.1. ICBC-UBC CRASH TESTING FACILITY AND SAE RECOMMENDATIONS
Systems and components of the crash test facility were designed in
accordance to SAE Recommendation J850a. The purpose of the recommendation is
to "establish sufficient standardization of barrier collision methods that results of
tests at different facilities may be compared".
The specification for the barrier states "The barrier size and construction
should be sufficient to limit barrier face motion to less than 1% of the permanent
crush of the vehicle". Theoretically, the barrier mass is sufficient to meet this
specification, however trial tests were required to determine the actual movement.
The following factors were identified as possible reasons for data that is
not comparable.
•Excessive movement of the barrier
•Speed measurement not accurate
•Accelerating test vehicle at impact
•Vehicle does not strike the barrier at exactly 90 degrees
The extent of these factors were investigated in trial tests.
Trial tests have shown a slight movement between the concrete blocks of
the barrier. The whole barrier is not sliding on its foundation and there is no
42

43
permanent shifting of the blocks. However, any movement indicates that some of
the kinetic energy of the vehicle is expended in movement rather than dynamic
crush of the vehicle.
Speed measurement accuracy was checked by comparing the measurements
from the speed trap and high speed video. These two measurements were within
0.5 mph of each other (note: Imperial units are used from here on since
speed-crush data has traditionally been presented in these units).
An accelerating vehicle at impact will have inertial forces from the wheels
which may increase the amount of crush. The speed trap gives two speed
measurements from which acceleration at impact can be determined.
i
A vehicle was directed into the barrier at a twenty degree angle to the
barrier face. The average residual crush was much less than a collision at 90
degrees to the barrier surface. Thus, directional accuracy is an important factor in
full frontal barrier crash testing. If collisions occur at less than a 90 degree angle,
then the test falls into the category of an angled barrier impact. From past crash
testing experience, I estimate that an impact angle between 90°±5° is equivalent to
a full frontal impact.
4.2. VALIDATION OF ICBC-UBC CRASH TEST FACILITY RESULTS
Validation of the results from the test facility involves comparison to the
data of other test facilities. A 1975 and 1977 Honda Civic and a 1971 CM.
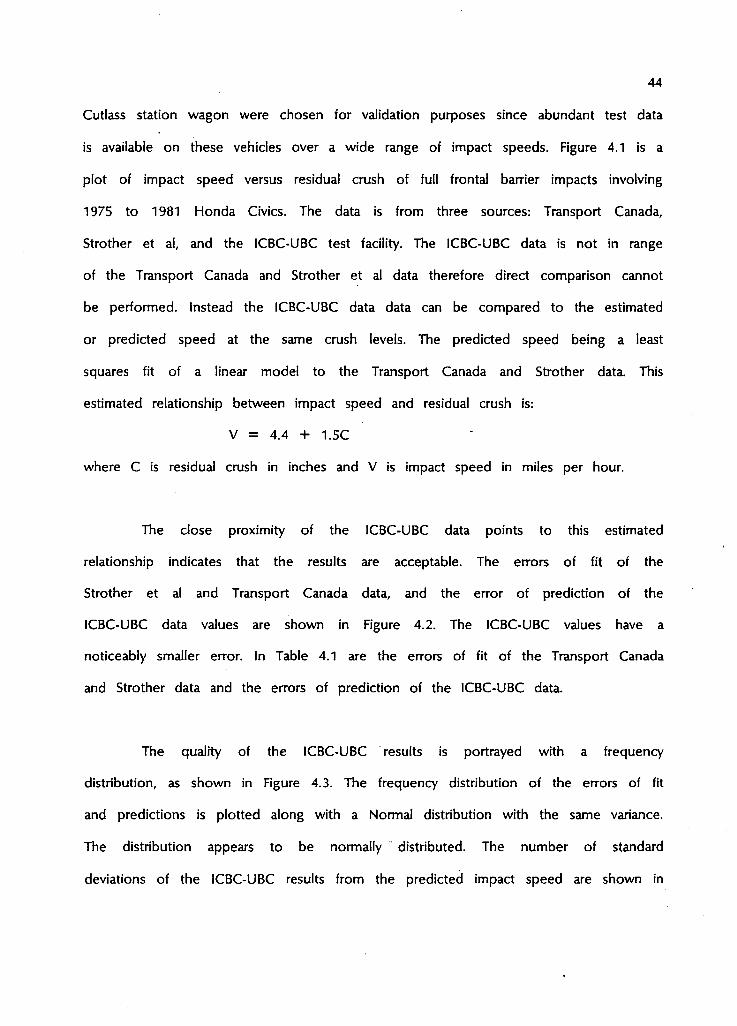
44
Cutlass station wagon were chosen for validation purposes since abundant test data
is available on these vehicles over a wide range of impact speeds. Figure 4.1 is a
plot of impact speed versus residual crush of full frontal barrier impacts involving
1975 to 1981 Honda Civics. The data is from three sources: Transport Canada,
Strother et al, and the ICBC-UBC test facility. The ICBC-UBC data is not in range
of the Transport Canada and Strother et al data therefore direct comparison cannot
be performed. Instead the ICBC-UBC data data can be compared to the estimated
or predicted speed at the same crush levels. The predicted speed being a least
squares fit of a linear model to the Transport Canada and Strother data. This
estimated relationship between impact speed and residual crush is:
V = 4.4 + 1.5C
where C is residual crush in inches and V is impact speed in miles per hour.
The close proximity of the ICBC-UBC data points to this estimated
relationship indicates that the results are acceptable. The errors of fit of the
Strother et al and Transport Canada data, and the error of prediction of the
ICBC-UBC data values are shown in Figure 4.2. The ICBC-UBC values have a
noticeably smaller error. In Table 4.1 are the errors of fit of the Transport Canada
and Strother data and the errors of prediction of the ICBC-UBC data.
The quality of the ICBC-UBC results is portrayed with a frequency
distribution, as shown in Figure 4.3. The frequency distribution of the errors of fit
and predictions is plotted along with a Normal distribution with the same variance.
The distribution appears to be normally distributed. The number of standard
deviations of the ICBC-UBC results from the predicted impact speed are shown in

Figure 4.1 : Crash test results of 1975 to 1981 Honda Civics

a 6
c o
TJ OJ u a
\ 4J
J-l o u a
A ICBC-UBC • Transport Canada O Strother et al
V-Impact speed (mph)
Figure 4.2 : Residual plot of ICBC-UBC, Transport Canada, and Strother et al data ^

0.4 -n
0 .35 -
0.3 H
E r r o r o f f i t / p r e d i c t i o n (mph)
4.3 : F r e q u e n c y d i s t r i b u t i o n o f e r r o r s o f f i t / p r e d . (Honda C i v i c s )

48
Table 4.1.
Figure 4.4 is a plot of impact speed and residual crush of 1971-1972 full
size CM. vehicles from Campbell. A regression line is drawn and the ICBC-UBC
impact result of the CM. Cutlass is also plotted. The ICBC-UBC data point lies
outside of the speed range of the data, however assuming the estimated
relationship is valid to a crush level of four inches then the closeness of the data
point to the line indicates that it is also valid. The error of fit of the Campbell
data and the error of prediction of the ICBC-UBC value is plotted in Figure 4.5.
At a crush level of 3.8 inches, the estimated relationship over-predicts speed by 0.8
mph. The distribution of the errors of fit and the Normal distribution are shown in
Figure 4.6. The ICBC-UBC result is 0.4 standard deviations from the expected
impact speed.
Table 4.1 : Errors of fit/prediction
DATA SOURCE
Transp. Canada Transp. Canada Transp. Canada Transp. Canada Transp. Canada Strother Strother Strother Strother Strother ICBC-UBC ICBC-UBC ICBC-UBC ICBC-UBC
IMPACT ERROR OF STANDARD SPEED FIT OR DEVIATION (mph) PREDICTION
(mph)
28.7 1.5 29.7 -0.4 29.2 4.9 34.9 2.7 29.3 -2.4 8.9 -0.6 13.9 -0.8 27.1 -2.1 27.1 -3.7 40.0 0.8 19.7 0.3 0.1 19.2 0.6 0.2 18.3 0.7 0.3 17.3 1.2 0.5

C-Residual crush (inches)
Figure 4.4 : Crash test results of 1971-1972 f u l l size G.M. cars

• ICBC-UBC Q Campbell
rP. -TJB-• •
•
I 1 1 I 2 0 4 0 6 0
Predicted speed (mph)
Figure 4.5 : Residual plot of ICBC-UBC and Campbell data (1971-1972 f u l l size G.M. cars)
o

Error of fit/prediction (mph)
Figure 4.6 : Frequency distribution of errors of fit/pred. (Full size G.M. cars)

52
Repeatability is the ability of the testing facility to reproduce the same
damage for the same test variables. To check the repeatability of the test facility,
the Honda Civics were tested at impact speeds within a narrow range of 17 to 20
mph, as shown in Figure 4.1. The slight differences in residual crush is consistent
with the slight differences in impact speeds. These tests confirm the repeatabilty of
the test facility. Table 4.2 contains the Honda test data.
TABLE 4.2 : Honda test data
Impact Speed Residual Crush (mph) (inches)
19.7 19.2 18.3 17.3
10.0 9.5 8.8 7.8
The speed and crush data from the ICBC-UBC test facility are consistent
with predicted values of Transport Canada and Strother data. Thus, the ICBC-UBC
test facility produces results that can be compared with other test facilities.
5. H IGH SPEED C R A S H DATA F R O M REPEATED IMPACTS
5.1. I N T R O D U C T I O N
There is a scarcity of barrier crash data at either low and very high
speeds. Multiple low speed impacts performed on the same vehicle may be
equivalent to a single higher speed impact. If a equivalence exists then relatively
inexpensive low speed crash tests can be performed to generate high speed crash
data. This chapter will quantify the speed-residual crush relationship of repeated low
speed impacts and attempt to verify the the relationship by conducting a series of
repeated low speed crash tests.
Conducting high speed testing in a 40 to 60 mph speed range is a more
costly undertaking than low speed testing. First, a testing facility to accomodate
high speed crashes requires substantially larger components and systems. The barrier
must be considerably more massive, usually requiring a subgrade foundation and a
solid reinforced concrete block. A more powerful and sophisticated propulsion
system is required or alternatively a longer approach and guidance track is required.
Producing the damage pattern of a high speed impact from repeated low
speed impacts has the added benefit of providing crash data over a range of
speeds from a single vehicle. After each low speed collision, the progressive crush
and equivalent barrier speed gives a new data value further along on the
speed-residual crush curve. Three or four speed-residual crush values obtainable from
a single vehicle drastically reduces the cost of test vehicles.
53

54
A high speed crash derived from repeated low speed crashes may be
applicable when damage pattern and impact speed is the only information of
interest. Obviously safety information such as occupant dynamics and deceleration
histories during a high speed collision cannot be derived from repeated impacts.
5 . 2 . CAMPBELL'S DERIVATION O F ENERGY A B S O R B E D IN RESIDUAL C R U S H
The following list defines the variables used in this chapter.
C = Plastic deformation (referred to as residual crush)
a 0 = Force per unit width to initiate residual crushing
a x = The increase in force per unit width with residual crush
f = Force per unit width
W 1 = Width of residual crush
W 0 = Vehicle width
b„ = Impact speed to initiate residual crushing
bi = Slope of impact speed-residual crush line
V = Impact speed
E = Absorbed energy
Equivalent speed: the vehicle speed which has a
kinetic energy which equals the total kinetic energy of the
multiple impacts.

55
Campbell's pioneering work in quantifying the energy absorbed in residual
crush provides the foundation to derive an equivalence between multiple low speed
impacts and a single high speed impact (Campbell,1974). Campbell's crush energy
model is based on residual crush, or plastic crush, which is the crush remaining
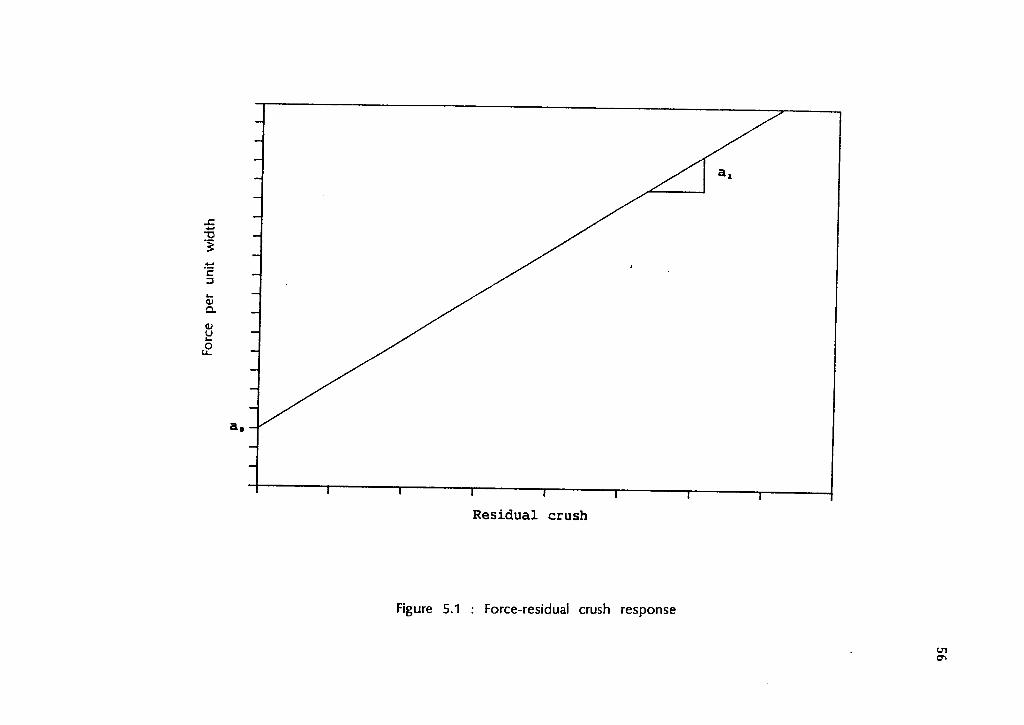
after the impact. In this model, force per unit width is assumed to be linearly
related to residual crush as depicted in Figure 5.1.
f • a, + a xC (1)
The parameters a 0 and a x define the force-residual crush response where a 0 is the
force at which residual crushing begins and a x is the increase in force with plastic
deformation. The force response cannot be fully defined in terms of residual crush
alone and as such it is not an entirely correct representation of the force response
during plastic deformation. However, the force response of equation (1) provides an
effective relationship of the energy absorbed in residual crush. Appendix IV describes
a more accurate force response in terms of elastic and plastic crush which would
more closely emulate the true force response.
Integrating the force per unit width (equation (1) ) with respect to residual
crush and width gives the energy absorbed in residual crush.
E = J / (ao+axOdC dw + constant a 0 0
The constant represents the energy stored in the initial elastic range. This is the
fundamental model for crush energy adopted by accident reconstructionists and has
been incorporated into the CRASH3 program. The accuracy of this model has been
tested extensively and has shown to yield acceptable results when correct stiffness
i 1 r
R e s i d u a l crush
Figure 5.1 : Force-residual crush response
57
parameters are specified (Woolley et al,1986). This model represents the current
'state-of-the-art' in determining the absorbed energy from vehicle damage.
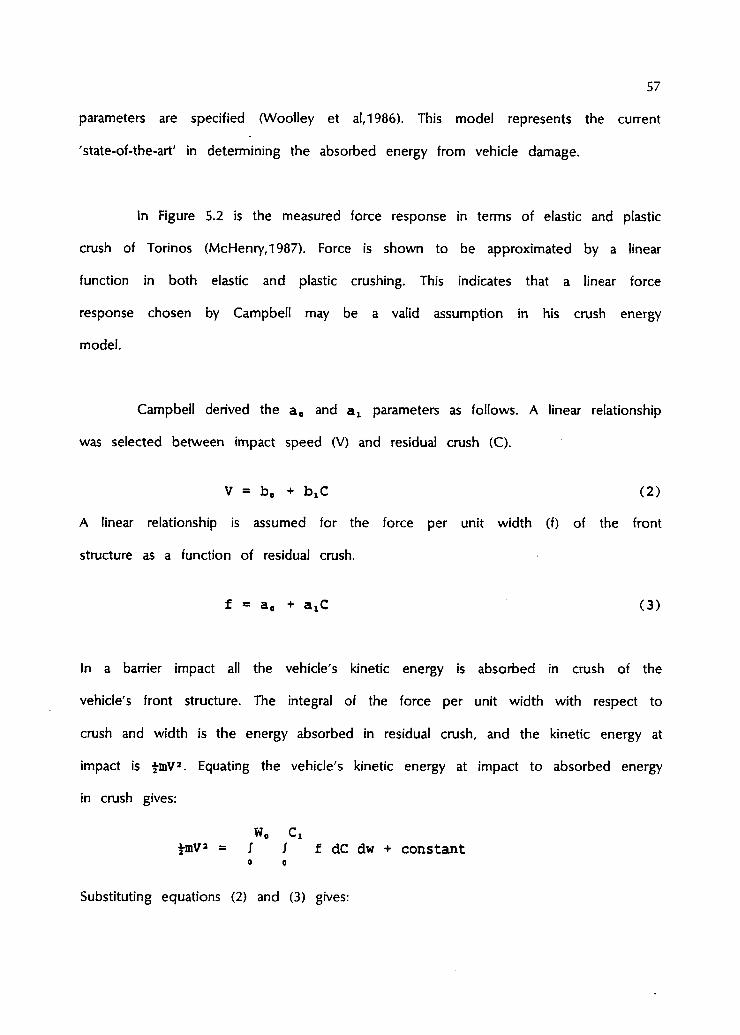
ln Figure 5.2 is the measured force response in terms of elastic and plastic
crush of Torinos (McHenry,1987). Force is shown to be approximated by a linear
function in both elastic and plastic crushing. This indicates that a linear force
response chosen by Campbell may be a valid assumption in his crush energy
model.
Campbell derived the a 0 and a x parameters as follows. A linear relationship
was selected between impact speed (V) and residual crush (C).
V = b 0 + b xC ( 2 )
A linear relationship is assumed for the force per unit width (f) of the front
structure as a function of residual crush.
f = a 0 + a xC (3 )
In a barrier impact all the vehicle's kinetic energy is absorbed in crush of the
vehicle's front structure. The integral of the force per unit width with respect to
crush and width is the energy absorbed in residual crush, and the kinetic energy at
impact is fmV2. Equating the vehicle's kinetic energy at impact to absorbed energy
in crush gives:
W. C x
£mV 2 = ; / f dC dw + constant 0 0
Substituting equations (2) and (3) gives:
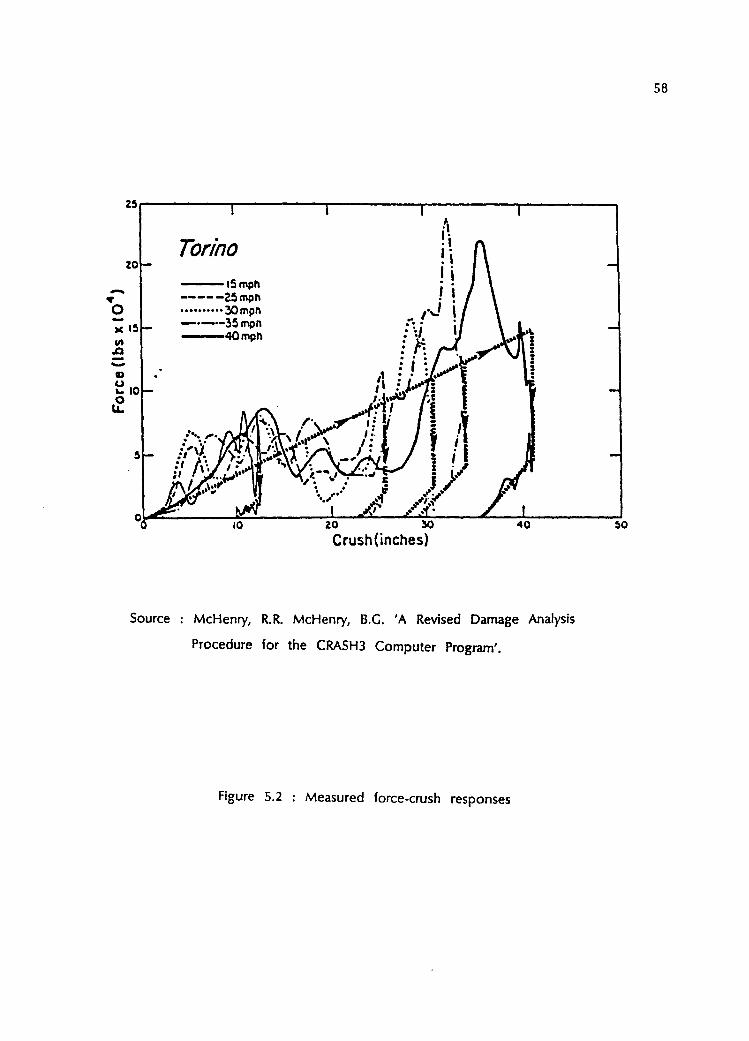
Crush(inches)
Source : McHenry, R.R. McHenry, B.C. 'A Revised Damage Analysis Procedure for the CRASH3 Computer Program'.
Figure 5.2 : Measured force-crush responses

59
W0 C, tmCbo+biC) J= / / (a 0+ a iC)dC dw + constant (4)
0 0
The constant term is required to account for some initial energy absorbed in elastic
deformation with no residual crush. In equation (2) an impact speed of b 0 is
required to initiate residual crushing of the vehicle. This impact speed is the kinetic
energy absorbed in the initial elastic deformation. The elastic deformation is
comprised of deflection in the bumper system and elastic bending of the front
structure. When the input energy exceeds the energy absorbed by elastic
deformation, the front structure undergoes plastic deformation.
The parameters a 0 and a 1 can be related to the coefficients b 0 and b x
by integrating equation (4) and solving by comparison of like terms.
a = S ^ (5)
mb? a, - ( 6 ,
constant=tmbo (7)
Thus, the force per unit width can be expressed in terms of the coefficients b 0
and b L which are derived from full frontal barrier collisions. The b 0 and bx
coefficients are unique to each vehicle model or category of vehicles.
f = a„ + a i C = J (b0bx+ bjc) (8) "0
The integral of equation (8) with respect to residual crush and width gives the
60
absorbed energy
+ mb?C
W0
)dC dW + tmbo
where Cj is the residual crush and Wx is the width of residual crush. This general
equation allows the absorbed energy to be determined for different damage
patterns.
The major assumptions of this model are: force is linearly related to
residual crush and the stiffness is constant across the front of the vehicle. Also the
residual crush must be across the full height of the vehicle's front structure for the
model to be applicable.
5.3. ABSORBED ENERGY IN CRUSH FROM MULTIPLE IMPACTS
As shown previously the key parameters a 0 and at of the crush energy
model are expressed in terms of the coefficients b„ and b x which are derived
from full frontal barrier impacts. The b„ coefficient is the impact speed intercept
and the b x coefficient is the slope of the impact impact speed-residual crush line.
These coefficients are derived from a least squares fit of a linear model to impact
speed-residual crush data. To derive the coefficients of a specific vehicle model or
category of vehicles, many vehicles must be crash tested to establish the impact
speed-residual crush function. In Figure 5.3 the impact speed-residual crush data of
1971-1972 G.M. vehicles are plotted which exemplifies a linear relationship between
impact speed and residual crush (Campbell,1974). If this same function can be
established by repeatedly impacting the same vehicle then the cost for test vehicles

Source : "Energy basis for collision severity", Campbell,K.L, 1974.
Figure 5.3 : Impact speed-residual crush curve 1971-1972 CM. vehicles

62
can be reduced.
The impact speed-residual crush function of Figure 5.3 was established by
crash testing many vehicles once only. It may be possible that one vehicle
repeatedly impacted will produce impact speed-residual crush data that follows the
function derived from single impacts on vehicles. The b 0 and b x coefficient could
then be determined for a particular vehicle model by conducting multiple impacts
on as few as two vehicles. A postulated force-residual crush response of a
repeatedly impacted vehicle will be presented which will produce the same linear
impact speed-residual crush function of singly impacted vehicles. The assumptions
inherent in this model will help in identifying possible reasons for deviations from
the impact speed-residual crush function of single impacts.
5.3.1. Force-residual crush response of multiple impacts
Figure 5.4 depicts the postulated force-residual crush response of multiple
impacts. The energy absorbed in the initial elastic crush plus area 1 represents the
energy absorbed in the first impact. The energy absorbed in the second impact and
third impact is represented by areas 2 and 3 respectively. The total energy
absorbed in the three repeated impacts is the initial elastic crush of the first impact
plus areas 1, 2 and 3. Thus for the second impact, the same force-residual crush
response is assumed to continue beyond the residual crush, d , of the first impact.
The force-residual crush response models the energy absorbed during plastic
crushing. For a single impact, the energy absorbed in the elastic range is the
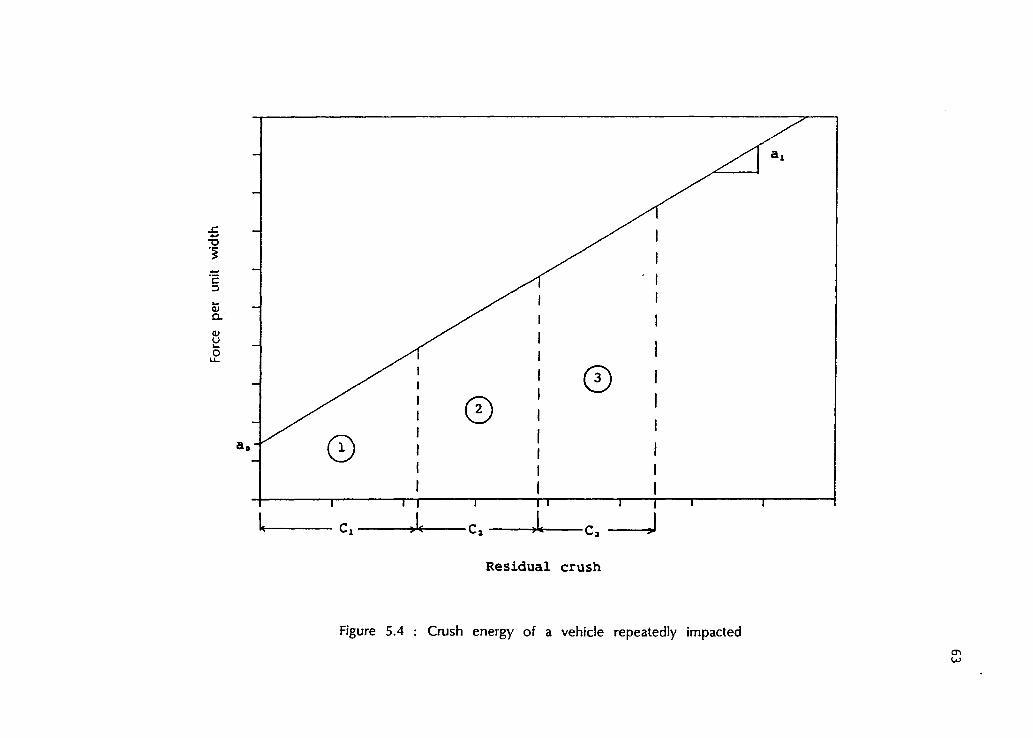
Figure 5.4 : Crush energy of a vehicle repeatedly impacted OJ

64
energy required to initiate residual crushing or plastic deformation. This energy is
accounted for by the constant term in equation (1). In the multiple impact model
the same force-residual crush response is assumed, however for the second and
subsequent impacts the energy absorbed in the initial elastic crush is neglected. The
validity of this model and the associated assumptions is tested with experimental
data. The next section will derive the impact speed-residual crush relationship that is
generated from the force-residual crush response of Figure 5.4.
5.3.2. Quantification of crush energy from multiple impacts
Using Campbell's force-crush model a relationship for crush energy will be
derived in terms of the residual crush from the first impact, C x, and the residual
crush from the second impact, C2-
The energy absorbed in two full frontal impacts on the same vehicle is
E - J / ( a 0+ a iC)dC dw + tmbo (9) 3 0 0
where Ci+Cj is the total residual crush from both impacts and mbj is the energy
absorbed in the elastic range of the first impact. Substituting equations (5) and (6)
for a 0 and a x gives
W0 Ci+Cj jab b jfoiQ , E a - / J ( - ^ + )dC dW + *mb0
0 0 "0 "0
Integrating the above equation.
mb?(C,+C,) 2 2 a 2

65
It can be shown that the relationship between the equivalent speed (E )
and cumulative residual crush is the same as the impact speed-residual crush
function of single impacts. Equating the total absorbed energy of both impacts to
the equivalent kinetic energy of both impacts (£mV^) yields
mb?(C,+C,)2 , tmv^ = ttb.MCx+0 + I V l
2
l ) + tmb,
After some rearranging, this reduces to
V e q = b 0 + MCj+C,) ( 1 0 )
The above equation can be generalized as follows
n V = b e + b x I C ( 1 1 )
e q i = l 1
where n is the number of impacts and is the residual crush of the ith impact.
In this model, the total residual crush from multiple impacts on a vehicle
has an equivalent speed equal to the impact speed of a single impact with the
same residual crush. The cumulative residual crush and equivalent speed from
repeated crashes should lie on the impact speed-residual crush line of full frontal
barrier impacts.
Multiple impacts on the vehicle will give a trace of the impact
speed-residual crush function from which the crush characteristics or parameters b 0
and b x can be determined. The underlying assumption of the multiple impact
theory is the total energy absorbed in residual crush is the same regardless of

66
whether that residual crush level is produced in one impact or many impacts. For
this major assumption to be valid, a number of other assumptions were made
relating to the force-residual crush behaviour of the vehicle. The above force-residual
crush model and assumptions will help in identifying possible reasons for deviations
of the multiple impact results from the speed-crush function. The assumptions made
in the model are:
1. The energy absorbed in the elastic crush for the second and subsequent impacts is negligible
2. The force versus residual crush is a linear relationship.
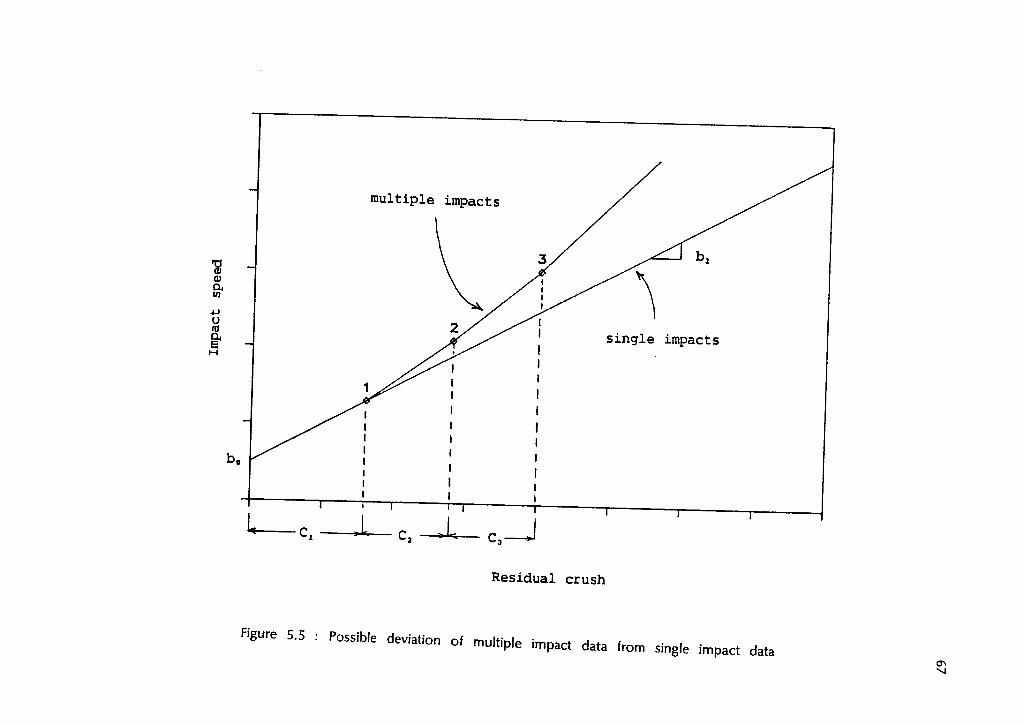
If the first assumption is not valid and significant energy is absorbed in
the elastic crush of the second and subsequent impacts then the multiple impact
data may show a significant deviation from the impacts speed-residual crush line of
single impacts. This deviation is depicted in Figure 5.5 where in multiple impacts a
higher equivalent speed is required to produce the same crush as a single impact.
This deviation results from the greater quantity of elastic energy absorbed from
repeated impacts.
Experimental tests on vehicles were conducted to determine whether the
equivalent barrier speed versus cumulative crush will trace the impact speed-residual
crush line of single impacts and provide the same b„ and bx coefficients. The next
section presents the result of the tests.
m u l t i p l e impacts
R e s i d u a l crush
Figure 5.5 : Possible deviation of mu.tip.e impact data from singie impact data

68
5.4. R E P E A T E D C R A S H T E S T S
To verify the relationship between the equivalent speed and cumulative
crush from repeated impacts, repeated crash tests were conducted on a 1977 and
1974 Honda Civic, and a 1971 CM. Cutlass station wagon. All of the vehicles
underwent two full frontal barrier impacts test; the results of these tests are given
in Table 5.1.
Table 5.1 : Double impact results
MAKE/MODEL IMPACT No. ACTUAL RESIDUAL IMPACT CRUSH
SPEED(mph) (in)
1977 Honda Civic 1 19.2 9.5 2 18.8 4.3
1974 Honda Civic 1 18.3 8.8 2 15.2 4.6
CM. Cutlass SA/V 1 9.4 3.8 2 14.5 10.0
The impact speed and residual crush for the first impact is as shown in the table.
For two impacts, the equivalent speed is the speed such that the kinetic energy is
equal to the total kinetic energy of both impacts. Thus, the equivalent speed of
the two impacts is calculated as follows:
eq
where V x is the impact speed in the first impact and V 2 is the impact speed in
the second test. This reduces to
v „ = <v* + v2
2) *

69
or can be be written in a more general form as
n j, V = ( I V?) 2
^ i = 1 i '
The residual crush of both impacts is the total residual crush.
n C = Z C.
i - l 1
The equivalent speed and total residual crush for two impacts are presented in
Table 5.2.
Table 5.2 : Double impact equivalent speed
MAKE/MODEL EQUIVALENT TOTAL SPEED RESIDUAL (mph) CRUSH (in)
1977 Honda Civic 26.9 13.8 1974 Honda Civic 23.8 13.5 CM. Cutlass SAW 17.3 13.8
Figure 5.6 is a plot of impact speed and residual crush for 1975 to 1981
Honda Civics and the ICBC-UBC multiple impact test results. The impact speed and
residual crush of the first impact on the 1977 Honda is designated with an 'AT
and the equivalent speed and total residual crush of the double impact is
designated with a 'A2'. The single and double impact result on the 1974 Honda is
designated with 'B1' and 'B2'. The double impact data values for both Hondas lie
very close to the speed-residual crush relationship for single impacts. The predicted
equivalent speed for the 1977 Honda is 25.1 mph which is an 1.8 mph
under-prediction. The predicted equivalent speed for the 1974 Honda is 24.7 mph

5 0
-Residual crush (inches)
Figure 5.6 : Multiple impact test results - 1977 Honda Civic V I o
71
which is a 0.9 mph over-prediction. Refering once again to Figure 4.3 depicting the
distribution in the errors of fit and prediction, the double impact result of the
1977 Honda has an error of 1.8 mph. This error has a standard deviation of 0.7.
The 1974 Honda has an error of -0.9 mph which is a standard deviation of 0.4.
Figure 5.7 is a plot of single impact test data of 1971-1972 full size CM.
vehicles and the multiple impact test results. The predicted equivalent speed of the
second impact is 19 mph which is an 1.7 mph over-prediction. The experimental
equivalent speed is 1.0 standard deviation from the estimated or predicted value.
The close proximity of the double impact data values to the derived
relationship indicates repeated impacts on the same vehicle can produce impact
speed-residual crush data of single impacts. The theory is valid for repeated impacts
with an equivalent speed up to 27 mph. A more extensive crash testing program
should be undertaken to conclusively validate this theory.

Figure 5.7 : Multiple impact test result - 1971 CM. Cutlass ro

6. BUMPER PERFORMANCE LEVEL AND LOW SPEED ENERGY ABSORPTION
CHARACTERISTICS
The barrier impact speed to initiate residual crushing of the vehicle
(threshold speed) is one of two parameters in the linear relationship between
impact speed and residual crush. Past experimental data suggests that this parameter
is approximately 5 mph. That is extrapolation of the linear relationship gives a 5
mph intercept. If a 5 mph intercept, b„ parameter, is accepted then collection of
data will be greatly simplified since the speed-crush function will depend on a
single variable bx (Navin,1986). Only one valid test point is necessary to derive the
parameter b 2 . Tests were conducted to investigate the threshold speed and assess
the validity of assuming a 5 mph intercept.
Before presenting the results of the tests, it is important that a few issues
on the b 0 parameter is understood. The 5 mph intercept is derived from a linear
regression process utilizing data from crash tests in a medium speed range. It is a
"best fit" parameter from the regression process and as such may not have any
physical significance. At very low speeds the crush characteristics of vehicles may be
different from those in a medium speed range, consequently the linear
speed-residual crush function may not be valid at very low speeds. In summary, the
5 mph value for b„ may be a valid parameter in defining the crush characteristics
in a medium speed range however may have no physical significance for low speed
impacts. If this is the case then the b„ parameter cannot be validated from
bumper tests.
73

74
6.1. LOW SPEED BUMPER TESTS
Bumper tests were conducted to determine the impact speed to initiate
residual crush. A 1977 Honda Civic with an energy absorbing bumper system was
propelled into the barrier three times at progressively higher speeds. The impact
speed and damage sustained are shown in Table 6.1 .
Table 6.1 : Bumper tests
Test No. Impact speed Damage observed (mph)
1 4.4 None
2 7.2 Slight superficial damage to bumper
3 10.8 Dents on exterior body panels
After the first impact there was no damage to the bumper system. The second
impact at 7.2 mph produced only slight superficial damage to the bumper, the
bumper fully rebounded and there was no residual crush of the vehicle overhang.
In the third impact, the bumper contacted the exterior body panels producing two
small dents at the left and right side. The bumper fully recovered and there was
no measurable shortening of the the overhang. These tests indicate that the
threshold speed at which permanent crush or shortening of the vehicle begins is
greater than 10.8 mph. A data value in Figure 5.6 shows four inches of crush at
10 mph. This value from a paper by Strother et al contradicts our findings.
The b„ parameter which is approximately 5 mph is much less than the
threshold speed which has been shown to be greater than 10.8 mph. Thus, the b„

75
parameter defines the crush characteristics in a medium speed range and is not the
threshold speed. The limited number of tests indicate that for early model Honda
Civics, an extrapolated linear speed-residual crush relationship will underestimate
impact speed when the speed is low. Since there is a lack of low speed crash
data on most vehicle models, the linear speed-residual crush function is assumed to
extend back to b 0- Consequently, for most vehicle collisions impact speed may be
underestimated for low speed changes. Vehicle manufacturers are likely to design
bumper systems to protect the vehicle in collisions at somewhat higher than 5 mph
to surpass Federal safety standards. It can therefore be argued that most vehicles
will exhibit threshold speeds greater than the 5 mph b 0 parameter. This suggests
that more parameters are required to characterize a vehicle's stiffness from low to
high residual crush levels.
6.2. GRAPHICAL INTERPRETATION OF CRUSH ENERGY IN THE LOW SPEED
RANGE
Since the threshold speed is greater than 5 mph for Honda Civics, more
energy is being absorbed or dissipated by the bumper system than considered in
Campbell's work. In Campbell's derivation of energy absorbed in residual crush, the
force per unit width increases linearly with residual crush.
f = a„ + a xC
The area under this linear function is the energy absorbed in residual crush
(Campbell, 1974). The energy arbsorbed in the elastic range or bumper system is
£mb§ where b e is the threshold speed. Graphically, this energy is represented by

76
the area under the extension of the linear function as shown in Figure 6.1 (See
Appendix V for a full derivation). The C g dimension is a hypothetical elastic
deflection and is equal to b o / b ^
To account for the higher absorption characteristics of the bumper system,
a two regime force-residual crush model is proposed and a corresponding two
regime speed-residual crush function. Figure 6.2 illustrates this model. In Figure 6.2
the lower end of the speed spectrum is characterized by a flatter speed-crush
function which is valid from a residual crush of zero to the intersection point C j .
This linear function is defined by the parameters b 2 and b 3 where b 2 is the
threshold speed derived from bumper tests. A two regime force response is one
possible explaination to quantify the absorption characteristics at low residual crush
levels. '
The linear force-residual crush function selected for regime I should satisfy
two criterion. First, in Figure 6.3b the area under this function from C x to C„ -
which represents the energy absorbed by the bumper system - should equal
tmbi/W,,. Second, the area under the function from C x to should equal the
area under the single regime force-residual crush function over the same range. That
is the energy absorbed for a residual crush of is the same for both the two
regime model and single regime model. This is a necessary condition to produce
speed predictions consistent with the original least square speed-residual crush
function. A force-residual crush function for regime I that has a higher crush energy
than the single regime model will over-predict speeds.

Figure 6.1 : Single regime force per unit width-residual crush model •vl "vl
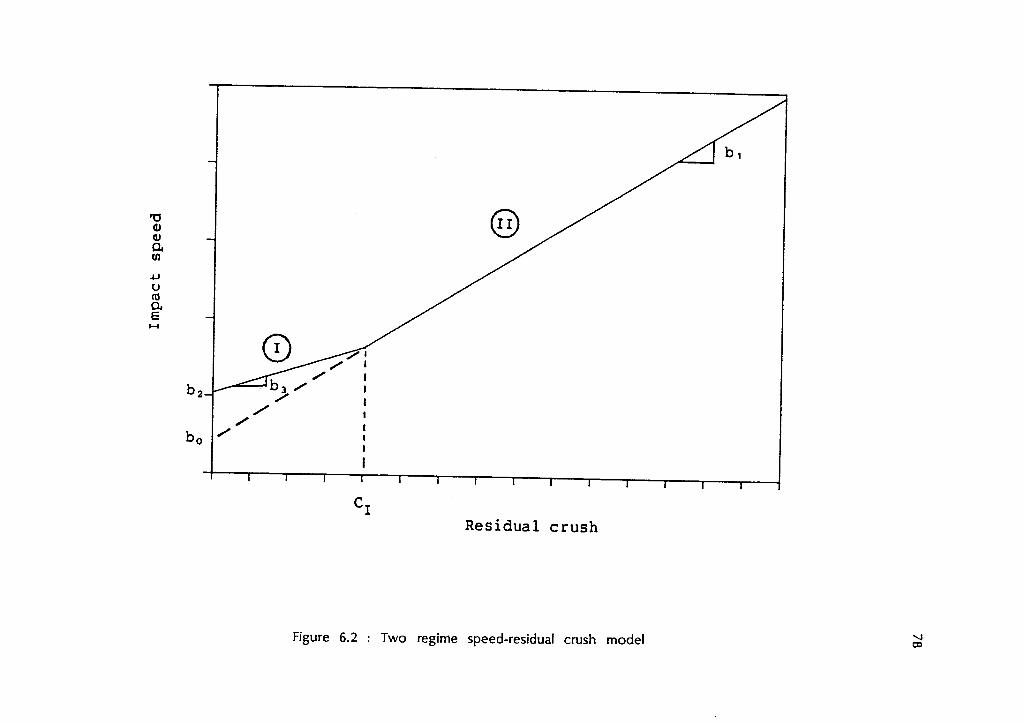
Figure 6.2 : Two regime speed-residual crush model vi 03

79
In Figure 6.3a is a depiction of the force-residual crush function that meets
the above two criterions. The function defined by parameters a 0 and ax is the
conventional force-residual crush function that is assumed in Campbell's work. The
function defined by parameters a 2 and a 3 corresponds to the low speed regime
and the larger area under this function from C to C 0 accounts for the higher
energy absorbed in the bumper system. At crush levels of - where regime II
begins there is a step in the function. At present a physical interpretation cannot
be attached to this step, however it may be considered as an approximation to a
more complex non-linear function as shown in Figure 6.4 .
The crush characteristics of vehicles can be represented by energy plots as
derived in a paper by Strother et aKStrother et al.,1986). The square root of the
crush energy E has a linear relationship to residual crush. The mathematical ct
expression for this relationship is:
2E ( )t„ A / ( B ) t + (B)*C
" 0
where A corresponds to the force intercepts a 2 of regime I and a 0 of regime II,
and B corresponds to the slopes a 3 of regime I and a,, of regime II. E is the
crush energy which is
W0 C E = £mV* « j / (A+BC)dC dw + A 2/2B
a 0 0
Figure 6.5 depicts the energy plot for the single regime model and the two regime
model. At the low end of the energy plot (Regime I), the energy absorbed is
higher for the two regime model than the single regime model for crush levels
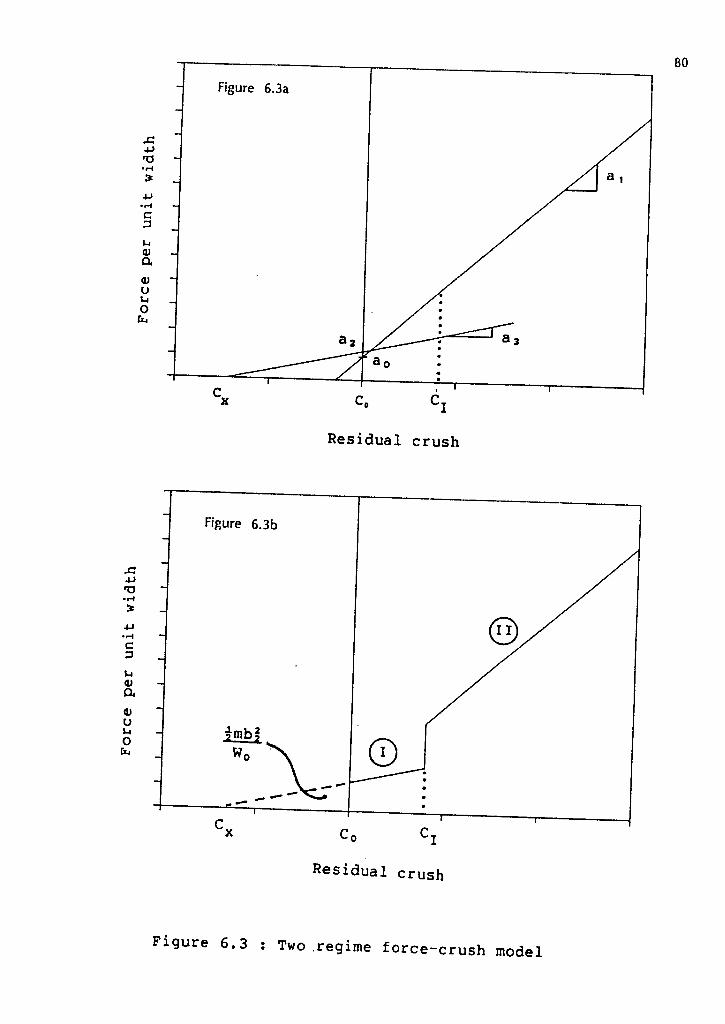
Figure 6.3a
4J TJ •H
C
a <u o o
c.
Residual crush
x: 4-1 TJ
c a Ul OJ
a a> u o
X
Residual crush
Figure 6.3 : Two regime force-crush model

Figure 6.4 : Higher order force-residual crush function 00

O
\ 63 o CM
U <U c a>
JC in D L i
O
a, / (a , )
a 0/(aj)
R e s i d u a l c r u s h
Source : "Crush Energy i n A c c i d e n t R e c o n s t r u c t i o n " . S t r o t h e r et a l (1986), SAE 860371
Fi g u r e 6.5 : Two regime energy p l o t 00

83
less than Cj. However, at a crush level of C j , the two models converge and the
energy absorption characteristics are the same.
The advantage of a two regime model is more accuracy at speeds just
above the threshold speed. Since a high percentage of collisions occur at these
very low speeds, there is a definite need for this improvement. Also a single
regime model cannot effectively replicate the energy absorption characteristics over
the whole speed spectrum. Adaptation of a single regime model to the low speed
range by making large shifts in the b 0 and b x parameters can adversely affect
crush energy characteristics at higher speeds. Quality of prediction is sacrificed at
medium speeds for better prediction at lower speeds. On the other hand adding a
third parameter to the model substantially increases complexity.
6.3. CRUSH ENERGY OF THE TWO REGIME MODEL
The parameters a 2 and a 3 in the two regime model can be expressed in
terms of the coefficient b 2 and b 3 .
_ mbiba _ mxb Bb 3 a 2 = =
W Q W Q
mbj a ' = w0
where x=^*- . The solution for these two parameters are shown in Appendix V. b 0
The force per unit width in the low speed regime is:
f _ nixboba + mb2C W#) WQ
In frontal collisions, the energy absorbed in crush at crush levels less than
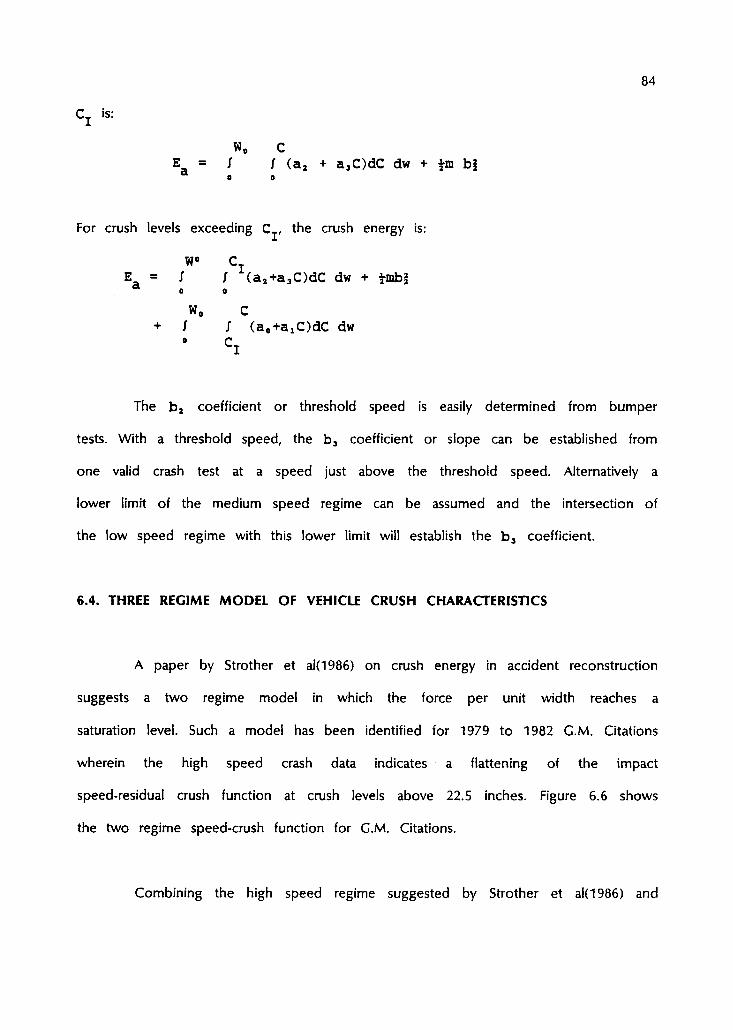
84
Cj is:
W, C E = J / (a2 + a3C)dC dw + $m bf
a 0 0
For crush levels exceeding Cj, the crush energy is:
W° Cj E = J / (a2+a3C)dC dw + tmbf
a o 0 W0 C
+ / / (ao+axOdC dw ° C I
The b 2 coefficient or threshold speed is easily determined from bumper
tests. With a threshold speed, the b 3 coefficient or slope can be established from
one valid crash test at a speed just above the threshold speed. Alternatively a
lower limit of the medium speed regime can be assumed and the intersection of
the low speed regime with this lower limit will establish the b 3 coefficient.
6 . 4 . THREE REGIME MODEL OF VEHICLE CRUSH CHARACTERISTICS
A paper by Strother et al(1986) on crush energy in accident reconstruction
suggests a two regime model in which the force per unit width reaches a
saturation level. Such a model has been identified for 1979 to 1982 G .M. Citations
wherein the high speed crash data indicates a flattening of the impact
speed-residual crush function at crush levels above 22.5 inches. Figure 6.6 shows
the two regime speed-crush function for G .M. Citations.
Combining the high speed regime suggested by Strother et al(1986) and
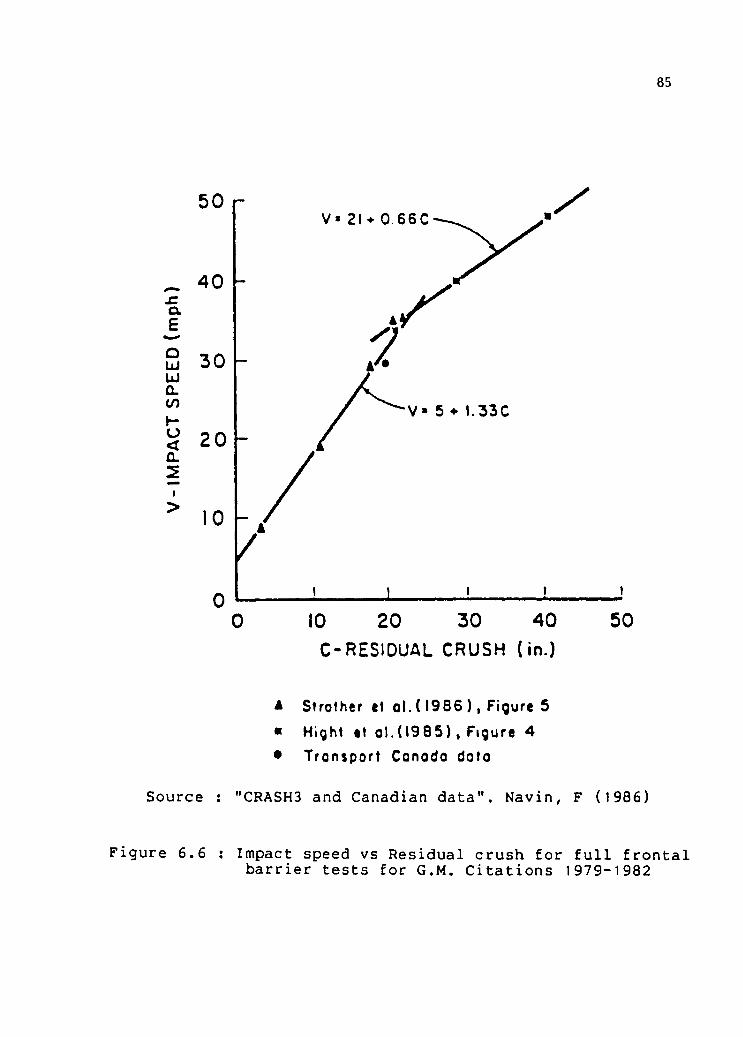
85
C-RESIDUAL CRUSH (in.)
A Strother et ol.( 1986 ), Figure 5
• Hight «t o l . (1985) , Figure 4
* Transport Conodo data
Source : "CRASH3 and Canadian data". Navin, F (1986)
Figure 6.6 : Impact speed vs Residual crush for f u l l frontal barrier tests for G.M. Citations 1979-1982

86
the low speed regime proposed in this research produces a three regime model, ln
this model the vehicle exhibits three different crush characteristics which are obeyed
for a specific crush range. Figure 6.7 depicts the impact speed-residual crush
function of the three regime model. Regime II reflects the crush characteristics of
Campbell's original single regime model.
A two regime force response is a proposed model of the energy
absorption characteristics at low residual crush levels. Other factors may also
significantly affect the amount of residual crush and energy absorbed. At low impact
speeds, the energy level is relatively low and as a result the vehicle rotation or
pitch during impact may represent a significant quantity of energy that is not
absorbed in residual crushing.

Residual crush
Figure 6.7 : Three regime speed-residual crush model 03 VI

7. APPLICATIONS TO THE CRASH3 PROGRAM
CRASH 3 is a widely used computer program for reconstruction of vehicle
accidents. Contained within it are two methods for determination of accident
speeds: reconstruction based on the damage and reconstruction based on the
vehicle trajectories and conservation of linear momentum. Reconstruction on a
damage basis has been criticized for its large errors in speed prediction due partly
to the lack of vehicle specific crush characteristics. In addition, the predictive
capability in a low and high speed range has been challenged due to the lack of
crash data in these ranges.
The CRASH3 program categorizes vehicles according to wheelbase because
of a lack of vehicle specific crush characteristics. All vehicles within a category are
assumed to have the crush characteristics of the overall group. However, large
errors have been demonstrated and attributed to this categorization (Woolley et
al,1986). Some vehicles exhibit markedly different crush characteristics than the
characteristics assigned to its size category which results in large speed prediction
errors. As a result it has been suggested that vehicles be further stratified by their
relative stiffness (Navin,1986). Within each size category, vehicles would be assigned
to stiff, normal and soft categories. One step further would be to determine the
crush characteristics of each vehicle model, however the data requirements and cost
may not be commensurate with the improved accuracy.
A multiple impact technique, as presented in Chapter 5 shows much
promise as a method of producing inexpensive crash data. This technique can be
88

89
of great benefit for producing the data requirements to further stratify vehicle crush
characteristics according to relative stiffness.
Presently, the CRASH3 program predicts accident speeds on a damage basis
with a single regime force-residual crush model. Crash data from tests in a medium
speed range are used to define the crush characteristics (a„ and ax parameters),
however these characteristics may not be valid at low speeds and as a
consequence the accuracy of the CRASH3 program can be challenged in the low
speed range. Preliminary tests at the ICBC-UBC facility indicates that there is a
definable low speed regime.
The two regime model for the crush characteristics presented in Chapter 6
will be utilized to demonstrate its application to the CRASH3 program. Using the
test data on the Honda Civics from Strother et al, Transport Canada and ICBC-UBC,
the parameters of a two regime force-residual crush function will be derived, and
an equivalent barrier speed will be predicted for a Honda Civic involved in an
accident. This prediction will be compared to the equivalent barrier speed prediction
from the CRASH3 program. The equivalent barrier speed is defined by Campbell as
the " vehicle velocity at which the kinetic energy of the vehicle would equal the
energy which was absorbed in plastic deformation."
Figure 7.1 shows the two regime speed-residual crush model for 1975-1981
Honda Civics. A least squares fit to the data determined regime II. The ICBC-UBC
data suggests that a residual crush of 8 inches is the lower limit to regime II. The
y-intercept or threshold speed of regime I was determined from crash tests. The


y-intercept and slope of regime I and regime II is tabulated in Table 7.1.
91
Table 7.1 : Speed-residual crush coefficients
Regime I Y-intercept (b 2) 10.8 mph Slope (bj) 0.7 mph/in
Regime II Y-intercept (b 0) 4.4 mph
Slope (b x) 1.5 mph/in
The parameters for the two regime force-residual crush function were calculated
using equations (1) to (4) in Appendix V which are tabulated in Table 7.2. The
mass (m) is 5.7 lb*sec 2/in and the vehicle width is 58.5 inches. Figure 7.2 shows
the force-residual crush function of 1975-1981 Honda Civics.
Table 7.2 : Force-residual crush parameters
Regime I Y-intercept (a 2) 227.8 lb/in Slope (a 3) 14.7 Ib/in*in
Regime II Y-intercept (a„) 199.1 lb/in Slope ( a i) 67.9 lb/in*in
In Figure 7.3 is the residual crush profile of a Honda Civic involved in a
frontal collision with a rigid immovable object such as a bridge abutement. The six
residual crush dimensions in inches are C O.O, C2=2.3, C3=6.2, C4=8.0,
C5=9.3, C,=14.8. Using a trapezoidal approximation to the area within the profile,
the residual crush for the first interval is (C1+c2)/2. Since the crush for this
interval lies within the range of regime I, the force-crush parameters are a 2 and
a 3. The energy of deformation is:


Figure 7 . 3 : Damage pattern is U )

94
E = / / (a3+a3C)dC dw + ^ o o 2a 3
r W / „ a3C2 _ aJW = / (a,C + ~Z— )dw +-*— o 2 2a,
where W is the width of residual crush. Substituting the crush of interval 1 ((Cx+C,)/2 ) for C gives
E = ;W l
( a 2(C 1 +C 7,) + a ^ C ^ C , * Cf) +a|W1. c o 2 8 2a3
where W x is the width of residual crush interval 1. Integrating over the width of interval 1 gives:
. ( a.CC.+C,) a3(C?+2C,C,+ Cj) +a]j^ c 2 2 1 2a3
E = 22081 lb*in c
These calculations are repeated for intervals 2 and 3. For intervals 4 and 5 which has crush levels in regime II, the a 0 and a x parameters are utilized for calculating the energy of deformation. Table 7.3 summarizes the crush energy for each interval.
Table 7.3 : Energy of deformation across the residual crush profile
Interval Residual Width of Crush Crush (in) Crush (in) Energy (lb • in)
1 1.2 10 22081 2 4.3 10 29581 3 7.1 10 39291 4 8.7 10 45539 5 12.1 10 76209
Total - W= 50 EN=212700

95
The crush energy in Table 7.3 assumes the forces producing the deformation acts
normal to the edge of the vehicle. If the principle direction of force is inclined to
the edge of the vehicle the following correction factor must be applied to
(Smith, R.A. and Noga, J.T., 1982).
Correction factor = (1 + tan Ja)
where a is indicated on Figure 7.3. Thus, the corrected energy of deformation is:
E • (1 + tan*a)E N
= (1 + tan*(15°))(212700)
= 227972 lb-in
The line of action of the force vector does not pass through the center of mass.
The non-central impact factor (7) used is 0.97. This factor is determined by the
relationship
where K is the radius of gyration about a vertical axis through the center of mass
and H is the moment arm of the line-of-action of the average force about a
vertical axis through the center of mass (Smith, R.A. and Noga, J.T., 1982).
The delta-V for a vehicle in a two-vehicle crash is computed in the
CRASH3 algorithm by the relation:
7 = K * / ( K * + H 2 )

96
Since the Honda Civic struck a rigid immovable object, the energy absorbed by the
object (E 2) is zero and its mass (m 2) can be considered infinite. Therefore delta-V
for the vehicle is:
where E x is the energy absorbed by the vehicle in crush. Delta-V for the Honda
AV X = 279 i n / s e c • 15.8 mph
Using the CRASH3 computer program, the delta-V for the Honda Civic is:
AV X = 16.1 mph
The CRASH 3 computation of delta-V utilizes a single regime force-residual crush
model with average stiffness parameters of vehicles in the "micro" category. There
is a small difference in the delta-V prediction which is largely due to the difference
in crush coefficients utilized by CRASH3 and those derived from Honda Civic crash
tests. When the same calculations are repeated using a single regime model with
the Honda Civic crush coefficients, the delta-V is 14.5 mph. This is a 1.3 mph
difference between the two regime model and single regime model.
The Honda Civic crush is a hypothetical accident case created to exemplify
the application of the two regime model in computing delta-V. Since the true
delta-V is not known, the accuracy of this model cannot be judged. Full scale
staged collisions should be conducted to determine the accuracy of the speed
Civic is:

97 predictions.

8. CONCLUSION
A very inexpensive and reliable low speed crash test facility has been built
which has proven successful for controlled crash tests. The test results have been
verified indicating the facility does replicate results from other barriers. At present,
the facility has the following capabilities:
•The tow system can accelerate the test vehicle to 30 km/h.
•the crash barrier has been designed for an impact of an
1800 kg car at 40 km/h.
•The speed trap provides a speed measurement with an
accuracy of ± 1 % .
•Impact speed can be controlled to within ± 2 km/h.
•Both full frontal and full rear impacts can be performed on
vehicles.
•Data derived from each test is impact speed and residual
crush. At present the facility does not have a high speed
camera for making dynamic crush measurements.
•A high test rate of one crash test per hour can easily be
achieved.
There has not been any known experimental investigations of repeated
98
99
impact tests on the same vehicle. Repeated impact tests were conducted to verify
this technique of generating impact speed-residual crush data. The findings from
these test are:
•A second low speed impact on the same vehicle produces
speed-crush data (ie. crush characteristics) that is comparable to
a single equivalent higher speed impact.
•The standard deviation of the errors of prediction indicate
that the double impact results are equivalent to a single
higher speed impact.
Low speed crash tests were conducted to determine the speed to initiate
residual crush of vehicles with an energy absorbing bumper system. The following
conclusions were drawn.
•The threshold speed of Honda Civics with an energy
absorbing bumper system is much higher than 8 km/h (5
mph). This is an indication that vehicles with an energy
absorbing bumper system (ie. isolators) will exhibit threshold
speeds above 8 km/h.
•A least squares fit of a linear model to speed-crush data in
a medium speed range (48-55 km/h) may not be valid at
speeds below 20 to 25 km/h.
•At the low end of the speed spectrum, a second

speed-crush regime exists for specific vehicle models. The crush
characteristics at low crush levels is different than at higher
crush levels.
•The accuracy of delta-V predictions in low speed collisions
may be improved when a two regime model is utilized.

9. FURTHER AND FUTURE RESEARCH
The crash testing facility opens up many areas for research. There is still
further research to be pursued on the topics covered in this thesis, as well as
other areas of future research on low speed collisions. The research interests of
many different organizations can be pursued through low speed crash testing. The
University community, insurance industry, accident investigators, and small automobile
manufacturers can benefit from the test facility. In this chapter, further research on
the topics covered in this thesis will be identified and the future research interests
of ICBC and UBC Accident Research Group will be outlined. In addition, the
research interests of private firms will be outlined.
9.1. FURTHER RESEARCH
Further tests should be conducted into full frontal repeated impacts on the
same vehicle. A comprehensive testing program should be established to
complement the tests already completed. In particular repeated impact tests should
be conducted on a vehicle of each size category as defined by the CRASH 3
program. The number of impacts and impact speed of each vehicle tested should
provide equivalent speeds that cover the whole speed spectrum. The equivalent
speed has been defined as
n x
V = ( Z V?) 2
where is the impact speed of the impact. For example, four impacts each
at an impact speed of 32 km/h (20mph) is equivalent to four impacts at impact
101

102
speeds of 32 km/h, 45 km/h, 55 km/h and 64 km/h (20 mph, 28 mph ,34 mph
and 40 mph). This program of tests is needed to further validate the multiple
impact technique.
More crash tests are needed to determine the crush characteristics in the
low speed regime for different vehicle models. The threshold speed for vehicles of
different mass and with different bumper systems should be established. The slope
of the speed-crush function for different vehicle models is also needed, ln addition,
the accuracy of prediction over the low speed regime should be evaluated. At low
impact speeds, the kinetic energy and crush energy is relatively low and
consequently some of the assumptions may produce significant errors in prediction
which would otherwise be insignificant at high impact speeds. For example, it is
assumed that the force-crush characteristics does not vary across the vehicle width.
In an offset low speed impact with an immovable object, a slight variation in
stiffness across the vehicle width may have a significant effect on speed prediction.
By setting up the ICBC-UBC facility for pole impacts, the variation in stiffness
across the front of the vehicle can be tested.
At low speeds more consistent speed predictions may be derived by
considering both static and dynamic crush rather than only static or residual crush.
By determining the percentage of total crush that is dynamic crush - for different
vehicle models and at different crush levels - the total crush can be determined
from the level of static crush. Prediction of equivalent barrier speeds can then be
based on both static and dynamic crush. Crash tests recorded with a high speed
camera would provide dynamic crush data from which the dynamic crush percentage

as a function of the static crush level can be determined.
103
9 . 2 . F U T U R E R E S E A R C H
The future research interests of ICBC and UBC Accident Research Group
are:
• Repair Strengths - Damage to repaired vehicles in a controlled barrier
impact can be investigated to assess how the repaired area alters the
energy absorption characteristics of the vehicle during collision. This has a
direct bearing on the risk of injury to the occupants.
• Repairability and Damagability - The repair costs of different vehicle makes
and models can be evaluated to assess premiums for the different
vehicles.
• Side Impacts - In a low speed side impact the passenger compartment is
subjected to some intrusion. Conducting side impact tests at low speeds
can provide information on injury risks to occupants for different vehicles.
• Effect of Corrosion on Structural Integrity - Corrosion degradation in
structural frame rails of older vehicles can be investigated to assess the
effects on vehicle stiffness.
• Seat belt tests - Once a suitable dummy is obtained, tests will be
undertaken on four point seat belts to assess their effectiveness on injury
reduction. Three point seat belts will also be tested.

104
Private firms have expressed an interest in conducting test for the following
research:
• Accident reconstruction experts have a significant percentage of cases
involving collisions at less than 5 mph. Consequently, they are interested
in the elastic deflection of the energy absorbing bumper system and its
relation to impact speed.
• An automobile manufacturer has expressed a need for conducting 30
mph crash test on prototype vehicles to gain prior knowledge on their
ability to pass Canadian Motor Vehicle Safety Standards.

B I B L I O G R A P H Y
Appleby, M.R. and Morris, A.G.R. "Automobile Damageability and Insurance Costs", SAE paper 740305, 1974.
Bartee, E.M. Engineering Experimental Design Fundamentals. Prentice-Hall lnc.,Englewood Cliffs, N.J., 1968.
Bigg, G.W. "Uses and Abuses of Speed Change Results from Crush Analysis", Proc. of the Canadian Multidisciplinary Road Safety Conference IV, May 26-28, 1985.
Bleckert, H. and Mack, G. "Linear Drive for Crash Test Facility", Siemens Review, No. 7, 1977.
Campbell, K.L. "Energy Basis for Collision Severity", SAE paper 740565, 1974.
Franchini, E. "Crash Testing Evolution at Fiat", SAE paper 660165, 1966.
Fredericks, R.H. "Automobile Crash Research", SAE paper S363, 1962.
Guenther, D.A., Goodwin, L.G. and Bookwalter, J.C. "Barrier Equivalent Impacts Speeds: An Analytical Review With Some Experimental Validation", Proc. of the Canadian Multi-disciplinary Road Safey Conference III, May 27-30, 1984.
Haynes, A.L., Fredericks, R.H. and Ruby, W.J. "Automotive Collision Impact Phenomena", Highway Research Board Bulletin V. 142, 1956.
Hight, P.V. and Lent-Koop, D.B. "Correlation Between Delta V, Barrier Equivalent Velocity and Crush in Automobile Collisions", Proc. of the Canadian Multidisciplinary Road Safety Conference III, May 27-30, 1984.
Jones,!.S. and Jennings, P.W. "Development and Evaluation of the CRASH2 Program for Use Under European Conditions",
105

106
SAE paper 810473, 1981.
Lundstrom, LC. "The Safety Factor in Automotive Design", SAE paper 660539, 1967.
Macmillan, R.H. "Vehicle Impact Testing", SAE paper 700404, 1970.
Macaulay, M.A. "Vehicle Frontal Barrier Impacts", TRRL Report LR 481, 1972.
McHenry, R.R. "A Comparison of Results Obtained With Different Analytical Techniques for Reconstruction of Highway Accidents", SAE paper 740565, 1974.
McHenry, R.R. and McHenry, B.C. "A Revised Damage Analysis Procedure for the CRASH Computer Program", SAE paper 861894, 1987.
Meriam, J.L. Dynamics. 2d ed. John Wiley, 1975.
Miller, P.M., Ryder M.O., and Shoemaker, N.E. "Crash Energy Management in Subcompact Automobiles", SAE paper 740572, 1974.
Myers,R.H. Classical and Modern Regression With Applications. Boston Massachusetts: Duxbury, 1986.
Navin, F., Navin N., and MacNabb M. "CRASH 111 and Canadian Data", SAE paper 870499, 1987.
O'Neill, B. "Bumper Perfomance Level and Insurance Loss Experience", SAE paper 840224, 1985.
Scott, D. "Versatile Crash Test Facility has Cable Drive", Automotive Engineering, V.85 No. 7, July 1977.
Severy, D.M. and Mathewson, J.H. "Automobile-Barrier Impacts", Highway Research Board Bulletin 91, 1953.
107
Severy, D.M. "Automobile Collisions on Purpose", Human Factors V. 2 No. 4, Nov. 1960.
Sinke, R.A. and Prevost, T.C. "An Automotive Crash Test Facility", SAE paper 700527, 1970.
Smith, R.A. and Noga, J.T. "Accuracy and Sensitivy of Crash", National Highway Traffic Safety Adminstration Technical Report No. DOT-HS-806152, March 1982.
Snider, H.P. "Vehicle Instrumentation for Crash Testing", IEEE Transactions on Industrial Electronics and Control Instrumentation, V. IECI-11, 1964.
Stonex, K.A. "Single-Car Accident Problem", SAE paper 811 A, 1965.
Strother, C.E., Woolley, R.L., James, M.B. and Warner, CY. "Crush Energy in Accident Reconstruction" SAE paper 860371, 1986.
Wilson, R.A. "A Review of Vehicle Impact Testing: How it Began and What is Being Done", SAE paper 700403, 1970.
Woolley R.L., Warner, CY. and Tagg, M.D. "Inaccuracies in the CRASH3 Program",SAE paper 850255, 1986.
A Review of Canadian Bumper Standards, Insurance Corporation of British Columbia, 1986.
Research Trends, Cornell Aeronautical Laboratory Inc., Summer-Autumn 1972.
Society of Automotive Engineers Handbook, "Barrier Collision Tests", SAE J850a, 1986.
Foundation Engineering. 1974.
"Crash Testing at Fiat", Engineering, Aug 1966

"Controlled Vehicle Impacts-Instrumentation Test Procedure", RRL Report LR92, 1967.

APPENDIX I
Crash Barrier Calculations
109

Crash Barrier Calculations
110
The barrier movement was calculated by considering the impact force of
the vehicle and the resistive forces from the passive earth pressures and friction
between the concrete blocks and foundation. During impact, the deceleration of the
vehicle is assumed to increase to a peak then decrease to zero. The deceleration
of the vehicle multiplied by its mass is the force applied to the barrier according
to Newton's second law. The deceleration history is approximated by a triangular
pulse with a peak deceleration of 40g as shown in Figure 1-1. The passive earth
pressure generated by the gravel fill behind the barrier wall increases as the
movement of the wall increases. This is shown in Figure I-2 where the ratio of
horizontal to vertical stress (K) increases with horizontal movement. The friction force
between between the concrete blocks and foundation is assumed to be fully
developed with the slightest movement.
Since the impact force and passive resistance are a function of time and
barrier displacement, the net force, barrier velocity, and acceleration were calculated
at time steps of 0.01 seconds. A net force is calculated which accelerates the
barrier. Ti:e velocity and displacement of the barrier at the end of the time step is
then calculated from the acceleration which is assumed to be constant over the
time step. The displacement allows calculation of a new net force and subsequently
acceleration in the next time step. These calculations are repeated until the barrier
velocity reaches zero. Table 1-1 show the calculations of the barrier movement.
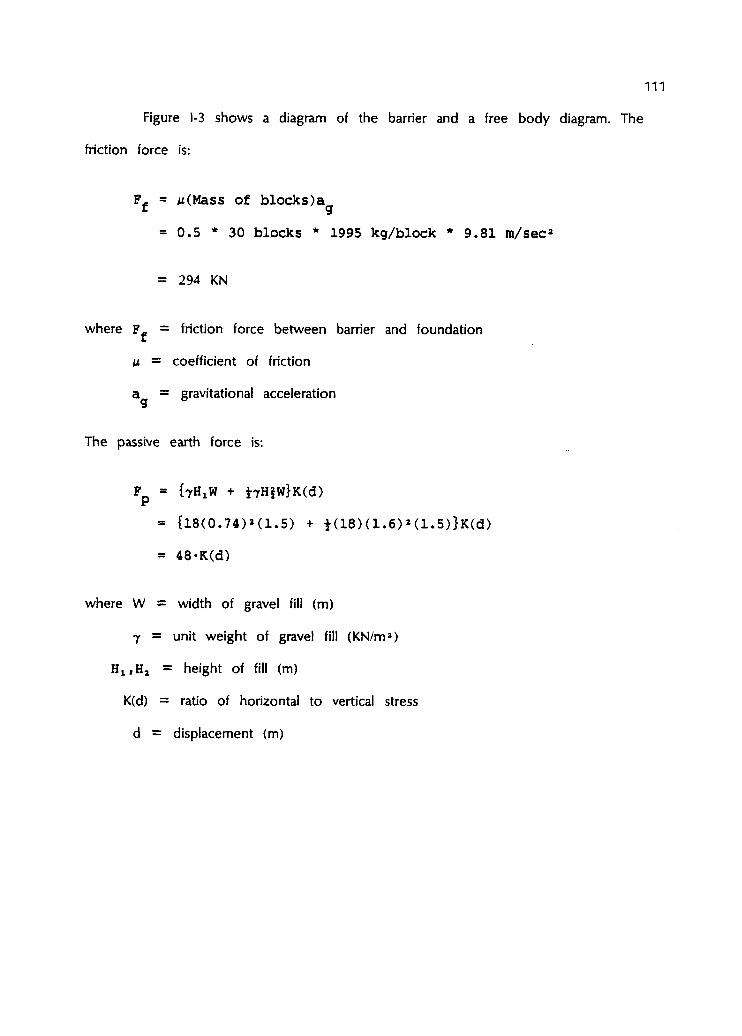
1 1 1
Figure I-3 shows a diagram of the barrier and a free body diagram. The
friction force is:
F. = M(Mass of blocks)a
= 0.5 * 30 blocks * 1995 kg/block * 9.81 m/seca
= 294 KN
where F f = friction force between barrier and foundation
u = coefficient of friction
a g = gravitational acceleration
The passive earth force is:
F p - (7HiW + i-7H2W}K(d)
= (18(0.74)*(1.5) + i(18)(1.6)*(1.5)}K(d) = 48-K(d)
where W = width of gravel fill (m)
j = unit weight of gravel fill (KN/mJ)
H W H , = height of fill (m)
K(d) = ratio of horizontal to vertical stress
d = displacement (m)

* 10.0
» 8.0
4.0 3.0 < u
- 2.0 ' ec
>
o
2 O N
CM:
o x
1.0 0.8
0.6 0.5 0.4
0.3
0.2
< 0.1 0£
I-.1
— —
1 i i i i — r ^ • ^ ^ D E N S E -
1 1 I _ H / • ^ L O O S E
/ • —
1 • "••*". . .
// K
P
A C T I V E S T A T E T P A S S I V E S T A T E -
— : L O O S E — ^ /
J —
> » v C O M P A C T —
I
D E N S E > ^ ,
L__ ! 1 l |
112
WALL ROTATION , — . H
Source : Foundation E n g i n e e r i n g ,1974.
Figure 1-2 : E f f e c t of wall movement on e a r t h pressure
70
60 -4
so H
40 -4
30 -J
20 H
10 H
20 40 60 80 100 120 Time a f t e r c o l l i s i o n onset (msec)
F i g u r e 1-1 : T r i a n g u l a r d e c e l e r a t i o n p u l s e

Elevation view
Figure 1-3 : Crash barrier free body diagram

114
Table I - l : B a r r i e r c a l c u l a t i o n s
TlK Tlas lncrcaeot . DUUoct Velocity lipact force I FujlTt resist Frlclioa lei force Accelerilloo l«c) (see) l«/J) IB] force (III force (•) |U)
0.00 0.0 0.0 0.01 lit 1.0 -46 -130 0 0.0
0.01 0.0 0.0
0.01 0.0 0.0 0.01 249 1.0 -46 -201 0 0.0
0.02 0.0 0.0
0.02 ao 0.0 0.01 392 1.0 -48 -294 50 0.14
0.03 4.202-05 0.00M
0.03 • 4.202-05 O.0OH 0.01 552 1.0 -48 -294 210 3.51
0.04 3.022-01 0.043
0.04 3.022-04 0.043 0.01 113 1.0 -41 -294 311 6.20
0.05 1.042-03 0.105
0.05 1.042-03 0.105 0.01 534 1.1 -53 -294 161 3.12
0.06 I.21E-03 0.135
0.06 1.212-03 0.135 0.01 261 1.1 -53 -294 -60 -1.34
0.01 2.502-03 ft 123
0.01 2.508-03 0.123 0.01 0 (.2 -56 -294 -352 -5 .M
0.06 3.402-03 0.064
0.1)9 3.402-03 0.064 0.01 0 1.2 -56 -294 -352 -5.U
0.09 3.152-03 0.005
0.09 3.152-03 0.005 0.01 0 1.2 -56 -294 -352 -S.U
0.10 3.152-03 0.00
Movement o f b a r r i e r - 0.0 '038 m » 3 . 8 mm « 0 . 1 5 i n c h e s
S t a t i c c r u s h o f a v e h i c l e a t 40 k m / h r » 508 mm • 20 i n c h e s
Movement o f b a r r i e r a s a % o f c r u s h « ( 0 . 1 5 / 2 0 ) * 100 - 0 .75%

APPENDIX II
Data Collection Form
i
115

116
I C B C - U B C T E S T F A C I L I T Y
Date: Ambient Temp. : Times Impact Ho.:
VEHICLE IXFORHATIOK VEHICLE DESCRIPTION
Venule Hake: VIM : Date of Kanufac.:
Vehicle Hodel: Klleaf e:
CRASH TEST
Location of Impact i Front Q Rear Q
Front end Rear end
Total tt of previous lmnaets
* of previous Impacts i t ICBC teat f a c i l i t y
VEHICLE DIHENSIOHS
Le f t Side Before A f t e r
Front Overhang _ _ _ _ _ _ _ _ _ _ _ _ Wheel Base Rear Overhang _ _ _ _ _ _
Front Rear
width . Track Width _ _ _ _ _ _ _
Frame Type: unlbody ladder frame Enflne Displacement:
Test Weight:
Hanufac. Weight:
Right Side Before A f t e r

117
SPEED HEASUREHENTS
Speed T r a p V i d e o Replay
ftverall SDeed : F i r s t M a r k e r Soaclna::
F i r s t Time I n t e r v a l : Second M a r k e r S o a c l n f :
Second Time I n t e r v a l : F i r s t Time I n t e r v a l :
Difference l n T i m e : second Time I n t e r v a l :
Other Hethod
S p e c i f y :
Speed Measurement:
COMMENTS

11 8

APPENDIX III
Recommended Safety Procedures
119
120
RECOMMENDED SAFETY PROCEDURES FOR CRASH TESTING
To ensure the safety of all on-site personnel during testing, the following
safety procedures and equipment are recommended.
Test Vehicle Preparation
•Completely drain fuel tank, lines and carburator of gasoline
•Remove battery
•Put maximum allowable air pressure in test vehicle tires
Site Preparation
•Close and lock all gates and garage doors during testing to
prevent people wandering onto the test area.
•Line both sides of the approach road to the barrier with guard
rails to prevent runaway test vehicles from leaving the site.
•Erect appropriate fencing around the tow road to keep
unauthorized people away from the test area.
•A guide rail for directional control of the test vehicle is strongly
recommended.
Equipment Check
•Check that the gap between the rollers of the main release is

121
not less than 1.1 cm (0.45 in).
•Check that the rollers are clean of debris, free to rotate, and
well greased.
•Check that the redundant release has the correct shear pin (Only
the designated brass shear pin is to be used)
•Inspect the entire length of the tow cable prior to each test for
frays, kinks and/or broken strands.
•Inspect the wire rope clamps to ensure they are firmly in place.
•Do not proceed with testing if there are deficiencies in any of
the above.
•The cab of the tow vehicle should be protected with a wire
cage.
Personnel Safety
•During testing all personnel except the tow vehicle driver and
test controller are to stay at least 15 m (50 feet) back from the
tow lanes and barrier.
•The driver of the tow vehicle shall wear an approved motorcycle
helmet and a properly adjusted 3 point seat belt while operating
the tow vehicle.
•Heavy gloves on personnel handling test vehicles especially after

1 2 2
barrier impact.
•No smoking around test vehicles.
Test Procedure
•During the testing only two personnel are to be in the test
area: the tow vehicle driver and the test controller. All other
personnel are to stay out of the designated test area.
•Radio communication shall be set up between the driver of the
tow vehicle and the test controller.
•The test controller is responsible for ensuring that all personnel
are in the safe location during testing.
•The tow vehicle driver shall watch for unauthorized people
entering the site behind the the barrier just prior to testing.
•The test controller shall stand a safe distance to one side of the
approach and tow roads.
•The tow vehicle driver must wait for clearance from the test
controller before commencing the test.
•Once the test has commenced there is only limited abort
capabilities. Should the test controller notice an unsafe situation he
must immediately signal the tow vehicle driver to halt acceleration.

APPENDIX IV
Force response during elastic and plastic deformation
123

124
Force response during elastic and plastic deformation
McHenry has suggested that a force response, in the initial elastic range
and in plastic deformation, would be more accurately emulated with a zero force
intercept as shown in Figure 1V-1.
Elastic and plastic crush
Figure IV-1 : Force response for elastic and plastic crushing
In this force response, the applied force increases linearly from zero as the
vehicle deforms elastically. The force continues to increase linearly as the vehicle
deforms plastically. At maximum elastic and plastic crushing, the vehicle's velocity is
zero for a barrier impact. This the approach period of the collision and the
corresponding velocity change is called the approach velocity change. Once
maximum crush is attained, the vehicle begins to rebound away from the barrier.

125
The applied force drops sharply as the elastic crush is restored. The restoration of
elastic crush produces a rebound velocity change.
The total change in velocity is the sum of the approach velocity change
and rebound velocity change. During the approach period, the energy stored and
absorbed in elastic and plastic crush is the area under the force response from
zero to maximum elastic and plastic crush.
This force response proposed by McHenry is more realistic than Campbell's
force response based on residual crush, however it is less practical since the
maximum elastic and plastic crush is not easily obtained. Following an automobile
collision, residual crush is the only measurement available. A force response in terms
of residual crush provides a practical and robust model of the energy absorbed per
unit of residual crush.
Wx Cx E = J J (a 0+axC)dC dw + constant
a 0 0
McHenry pointed out that Campbell's crush energy model neglects the
restored energy during the rebound period and only considers the energy absorbed
and stored during the approach period. Consequently, the approach velocity change
is determined in this model.

A P P E N D I X V
Solutions for Crush Parameters b
Solutions for Crush Parameters a
126

127
Solution for the linear extension of the force-crush function
The area under the linear extension of the force-crush function can be
shown to represent the energy absorption capacity of the bumper system or the
energy absorbed in the elastic range before permanent crushing occurs. First, the
C dimension in the above figure will be established as follows: e C = ^ e a,
The parameters a„ and a i are equal to:
^ _ mbub! ^ _ mbf W o Wp
which can be substituted into the above expression.
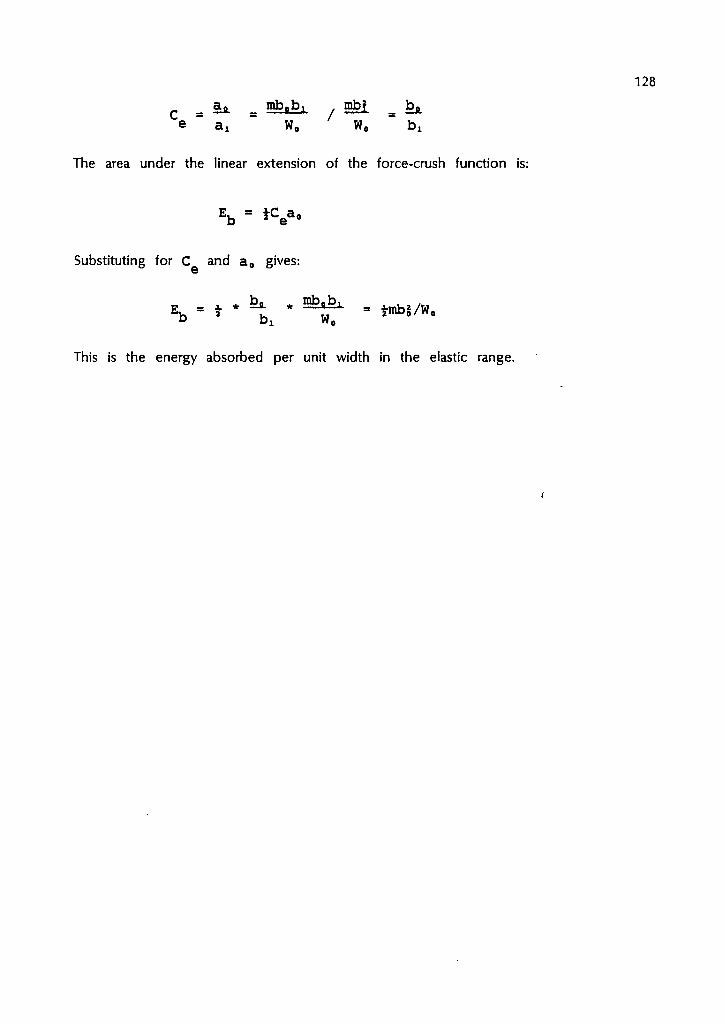
The area under the linear extension of the force-crush function
E b - frCea0
Substituting for C g and a 0 gives:
This is the energy absorbed per unit width in the elastic range.

129
Solution for crush parameters a c , a,, a 7 > a 3
Solution for Regime I parameters:
W0 C t m V*K„= ' / (f)dC dw
W„ C j-mCbj+bjC) = J J (aj, + a3C)dC dw + constant
tmbl+mbjbjC + i-mbJC1 = a2W0C + JajC'W,, + constant
Comparison of like terms gives:
constant = fmb?
mb2bi W. a, = (1)
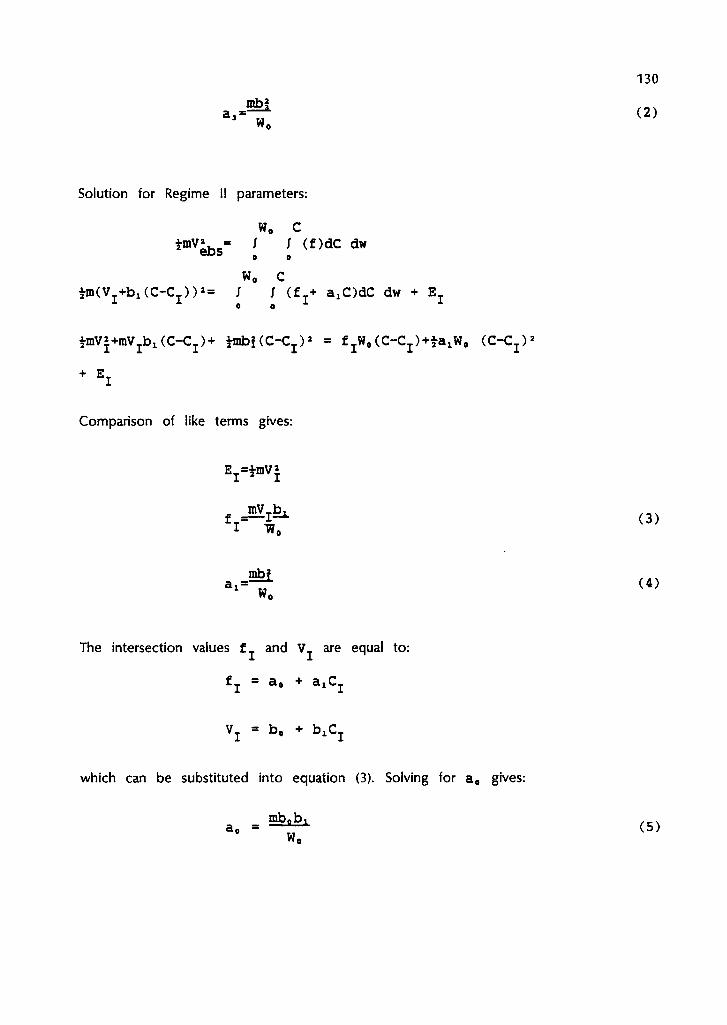
mbj, 130
(2)
Solution for Regime II parameters: W„ C
i-mv* = ; ; (f)dc dw 0 0
w0 c imCV.+biCC-C.))'- / / (f_+ axC)dC dw + E.
0 o
i-mVj+mV.bxCC-C.)* imb?(C-C.)2 = f_W0(C-C_)+ta1W0 (C-C_)2
+ E,
Comparison of like terms gives:
E.-i-mVj
1 ^ 0
mb?
The intersection values f and V_ are equal to:
f_ = a, + axC_
V . = b 0 + bxCj
which can be substituted into equation (3). Solving for a„ gives:
a. = (5)