Crash behavior of composite structures - Chalmers ...
109
Crash behavior of composite structures A CAE benchmarking study Master’s thesis in Applied Mechanics MARCUS ANDERSSON PETTER LIEDBERG Department of Applied Mechanics Division of Material and Computational Mechanics CHALMERS UNIVERSITY OF TECHNOLOGY G¨ oteborg, Sweden 2014 Master’s thesis 2014:40
-
Upload
khangminh22 -
Category
Documents
-
view
4 -
download
0
Transcript of Crash behavior of composite structures - Chalmers ...

Crash behavior of composite structuresA CAE benchmarking studyMaster’s thesis in Applied Mechanics
MARCUS ANDERSSONPETTER LIEDBERG
Department of Applied MechanicsDivision of Material and Computational MechanicsCHALMERS UNIVERSITY OF TECHNOLOGYGoteborg, Sweden 2014Master’s thesis 2014:40


MASTER’S THESIS IN APPLIED MECHANICS
Crash behavior of composite structures
A CAE benchmarking study
MARCUS ANDERSSONPETTER LIEDBERG
Department of Applied Mechanics
Division of Material and Computational Mechanics
CHALMERS UNIVERSITY OF TECHNOLOGY
Goteborg, Sweden 2014

Crash behavior of composite structuresA CAE benchmarking studyMARCUS ANDERSSONPETTER LIEDBERG
c© MARCUS ANDERSSON , PETTER LIEDBERG, 2014
Master’s thesis 2014:40ISSN 1652-8557Department of Applied MechanicsDivision of Material and Computational MechanicsChalmers University of TechnologySE-412 96 GoteborgSwedenTelephone: +46 (0)31-772 1000
Cover:Mesh of a corrugated composite specimen used in crush simulation
Chalmers ReproserviceGoteborg, Sweden 2014

Crash behavior of composite structuresA CAE benchmarking studyMaster’s thesis in Applied MechanicsMARCUS ANDERSSONPETTER LIEDBERGDepartment of Applied MechanicsDivision of Material and Computational MechanicsChalmers University of Technology
AbstractIn order to enable further implementation of composite structures in future crashworthy designs, a good wayof modeling composite materials needs to be defined. Many composites exhibit an even energy absorptionduring crushing, which is advantageous during e.g. a car crash, since this leads to a constant deceleration of animpacting object. This is what makes composite materials interesting in crashworthy structures, apart fromthe fact that composites exhibits a high stiffness-to-weight ratio. Damage in fiber reinforced polymers canoccur with a combination of many failure mechanisms, such as delamination, fiber kinking, fiber pullouts andmatrix crack propagation. During crushing of composites, most of these modes can be observed. There aremany software using different techniques and material models for fiber reinforced polymers, consequently, thevarious methods need to be evaluated.
As an initial part of the project, a literature study of relevant research and development concerning crashmodeling of composite structures was conducted in order to obtain an overview of the existing possibilities incommercially available finite element software. Furthermore, simulations have been performed using the softwareLS-DYNA and RADIOSS. The theory and behavior of three different material models were investigated. Theinvestigated material models are: MAT54 and MAT262 in LS-DYNA and LAW25 in RADIOSS. Simulationsthat were performed were compared with results from a physical test. More specifically, the force-displacementand energy absorption-displacement were compared.
All three material models use different material parameters, failure models and degradation schemes. MAT54is a simple model, for which many input parameters lack direct physical meaning. Failure is based on theChang-Chang failure criterion. MAT262 is an advanced material model based on fracture toughness andincludes a continuum damage behavior. LAW25 in RADIOSS is also an advanced material model and involvesa plasticity formulation which gives the user the possibility to define a complex stress-strain curve.
All tested material models could be tuned to match the test data, but with different accuracy. The predictabilitycould not be commented for the material model MAT262 and LAW25, since vital material data could not beobtained. All material data was known for MAT54 and the material model exhibits a poor predictability.
Keywords: composite failure, crush, crash, Finite element method, LS-DYNA, MAT54, MAT262, RADIOSS,LAW25
i

ii

PrefaceThis Master’s thesis project is a part of the research project “Modelling crash behaviour in future lightweightcomposite vehicles” financially supported partly by Vinnova and partly by the industrial partners of the projectVolvo Car Corporation, AB Volvo, Autoliv, Altair Engineering, DYNAmore Nordic, AF Industry AB, SemconAB and Escenda Engineering AB (50%). The work was carried out during the spring semester of 2014 (30higher educational credits, at the CAE department at AF office in Gothenburg, Sweden. The examinationwas done by the department of Applied Mechanics at Chalmers University of technology and the work wassupervised by AF.
First of all we would like to thank Jonas Zachrison for giving us the opportunity to carry out this Master’sthesis at AF. Furthermore, our supervisors Henrik Nilsson and Teodor Bengtsson deserves a huge thanks,for their support and guidance throughout the project. We would also like thank all employees at TechnicalAnalysis at AF who made us feel welcome from the very first day. A special thanks goes to Martin Fagerstrom,our examiner at Chalmers University of Technology, for the great patience, support and knowledge he has givenus. Lastly, we would like to thank our families and friends for their devotion and encouragement.
Marcus Andersson and Petter Liedberg
Gothenburg, June, 2014
iii

iv

Contents
Abstract i
Preface iii
Contents v
1 Introduction 11.1 Purpose . . . . . . . . . . . . . . . . . . . . . . . . . . . . . . . . . . . . . . . . . . . . . . . . . . . 11.2 Delimitations . . . . . . . . . . . . . . . . . . . . . . . . . . . . . . . . . . . . . . . . . . . . . . . . 11.3 Method . . . . . . . . . . . . . . . . . . . . . . . . . . . . . . . . . . . . . . . . . . . . . . . . . . . 1
2 Relevant research on modeling of crushing 32.1 JAMS project in composite crashworthiness . . . . . . . . . . . . . . . . . . . . . . . . . . . . . . . 32.2 Projects in LS-DYNA . . . . . . . . . . . . . . . . . . . . . . . . . . . . . . . . . . . . . . . . . . . 42.3 Project in RADIOSS . . . . . . . . . . . . . . . . . . . . . . . . . . . . . . . . . . . . . . . . . . . . 82.4 Project in ABAQUS . . . . . . . . . . . . . . . . . . . . . . . . . . . . . . . . . . . . . . . . . . . . 92.5 Project in PAM-CRASH . . . . . . . . . . . . . . . . . . . . . . . . . . . . . . . . . . . . . . . . . . 9
3 Theory 123.1 What is a composite? . . . . . . . . . . . . . . . . . . . . . . . . . . . . . . . . . . . . . . . . . . . 123.1.1 Fiber reinforced polymers . . . . . . . . . . . . . . . . . . . . . . . . . . . . . . . . . . . . . . . . 123.2 Main failure modes of composites . . . . . . . . . . . . . . . . . . . . . . . . . . . . . . . . . . . . . 133.2.1 Delamination . . . . . . . . . . . . . . . . . . . . . . . . . . . . . . . . . . . . . . . . . . . . . . . 133.2.2 Matrix failure . . . . . . . . . . . . . . . . . . . . . . . . . . . . . . . . . . . . . . . . . . . . . . . 143.2.3 Fiber failure . . . . . . . . . . . . . . . . . . . . . . . . . . . . . . . . . . . . . . . . . . . . . . . 143.3 Crushing of composites . . . . . . . . . . . . . . . . . . . . . . . . . . . . . . . . . . . . . . . . . . 15
4 Crush test 18
5 LS-DYNA 215.1 Introduction . . . . . . . . . . . . . . . . . . . . . . . . . . . . . . . . . . . . . . . . . . . . . . . . . 215.1.1 Simulation model of the corrugated specimen in LS-DYNA . . . . . . . . . . . . . . . . . . . . . 215.1.2 Available material models in LS-DYNA . . . . . . . . . . . . . . . . . . . . . . . . . . . . . . . . 235.2 Simulations with MAT54/55 - Enhanced composite damage . . . . . . . . . . . . . . . . . . . . . . 245.2.1 Theory of failure model and degradation scheme in MAT54 . . . . . . . . . . . . . . . . . . . . . 245.2.2 Description of Material Card MAT54 . . . . . . . . . . . . . . . . . . . . . . . . . . . . . . . . . 265.2.3 Uniaxial simulations with one element . . . . . . . . . . . . . . . . . . . . . . . . . . . . . . . . . 315.2.4 Tensile dog-bone simulations with different element sizes . . . . . . . . . . . . . . . . . . . . . . 335.2.5 Implementation of MAT54 in crush simulations . . . . . . . . . . . . . . . . . . . . . . . . . . . . 345.2.6 Crush simulation using baseline model with MAT54 . . . . . . . . . . . . . . . . . . . . . . . . . 365.2.7 Investigation of mesh dependency in crush simulations with MAT54 . . . . . . . . . . . . . . . . 385.3 Simulation with MAT262 - Laminated fracture Daimler Camanho . . . . . . . . . . . . . . . . . . 405.3.1 Theory of failure model and degradation scheme in MAT262 . . . . . . . . . . . . . . . . . . . . 405.3.2 Description of material card MAT262 . . . . . . . . . . . . . . . . . . . . . . . . . . . . . . . . . 435.3.3 Uniaxial simulations with one element . . . . . . . . . . . . . . . . . . . . . . . . . . . . . . . . . 465.3.4 Tensile dog-bone simulations with different element sizes . . . . . . . . . . . . . . . . . . . . . . 485.3.5 Implementation of MAT262 in crush simulations . . . . . . . . . . . . . . . . . . . . . . . . . . . 505.3.6 Crush simulation using baseline model with MAT262 . . . . . . . . . . . . . . . . . . . . . . . . 50
6 RADIOSS 556.1 Introduction to RADIOSS . . . . . . . . . . . . . . . . . . . . . . . . . . . . . . . . . . . . . . . . . 556.1.1 Simulation model of the corrugated specimen in RADIOSS . . . . . . . . . . . . . . . . . . . . . 556.1.2 Composites and anisotropic materials in RADIOSS . . . . . . . . . . . . . . . . . . . . . . . . . . 566.2 Simulations with material LAW25 . . . . . . . . . . . . . . . . . . . . . . . . . . . . . . . . . . . . 576.2.1 Theory and material parameters of LAW25 . . . . . . . . . . . . . . . . . . . . . . . . . . . . . . 57
v

6.2.2 Uniaxial simulations with one element . . . . . . . . . . . . . . . . . . . . . . . . . . . . . . . . . 656.2.3 Tensile dog-bone simulations with different element sizes . . . . . . . . . . . . . . . . . . . . . . 676.2.4 Crush simulation using baseline model with LAW25 . . . . . . . . . . . . . . . . . . . . . . . . . 686.2.5 Investigation of mesh dependency in crush simulations with LAW25 . . . . . . . . . . . . . . . . 70
7 Comparison between LS-DYNA and RADIOSS 747.1 Material data inputs . . . . . . . . . . . . . . . . . . . . . . . . . . . . . . . . . . . . . . . . . . . . 747.2 Implementation of material models . . . . . . . . . . . . . . . . . . . . . . . . . . . . . . . . . . . . 747.3 Advantages and disadvantages . . . . . . . . . . . . . . . . . . . . . . . . . . . . . . . . . . . . . . 75
8 Concluding remarks 77
9 Future work 78
References 79
Appendices
A Appendix - MAT54 IA.1 Material card used in base line model using MAT54 . . . . . . . . . . . . . . . . . . . . . . . . . . IA.2 Parameter study - Sensitivity of material model parameters in MAT54 . . . . . . . . . . . . . . . . IIA.3 Parameter study - Sensitivity of simulation model for MAT54 . . . . . . . . . . . . . . . . . . . . . X
B Appendix - MAT262 XIIB.1 Material card used in the simulation with uniform mesh model using MAT262 . . . . . . . . . . . XIIB.2 Material card used in the simulation with irregular mesh model using MAT262 . . . . . . . . . . . XIII
C LAW 25 XIVC.1 Sensitivity of material model parameters in LAW 25 . . . . . . . . . . . . . . . . . . . . . . . . . . XIVC.2 Influence of crushing velocity with RADIOSS model . . . . . . . . . . . . . . . . . . . . . . . . . . XVIC.3 Material Parameters of the Baseline Model with LAW 25 . . . . . . . . . . . . . . . . . . . . . . . XVIII
vi

1 Introduction
Focus in this Master’s thesis is on benchmarking existing commercial CAE software regarding crushing ofcomposites materials. Crash simulation tools with a truly predictive capability is one of the most prominentenablers for the introduction of fiber reinforced polymer composites in structural automotive parts, therebyallowing for significant weight reduction at maintained or even improved crashworthiness. The industrialrelevance is manifested by the substantial industrial interest in the current project.
1.1 Purpose
The main purpose of this thesis was to give relevant information regarding composite modeling to the researchproject Modelling crash behaviour in future lightweight composite vehicles. This was done by investigating andevaluating how commercial CAE software can be used to model crushing of composite materials. Results fromthe CAE software were compared with results from a physical crushing test. In order to fulfill the specifiedpurpose following subgoals were stated:
• Present how the theory regarding failure of composites is implemented in commercial software, especiallyduring crushing.
• To model a quasi-static crushing test using both LS-DYNA and RADIOSS and compare with experimentalresults obtained from a physical crush test, reported in the literature.
• To assess the tested software regarding flexibility, level of detail and required material parameters.
• To find and compare advantages and disadvantages for the tested software.
1.2 Delimitations
To stay within the time-frame of the master thesis project the following delimitations have been specified:
• The project has focused mainly on two commercial software, LS-DYNA and RADIOSS, since the companieswho distributes these software are involved in the research project “Modelling crash behavior in futurelightweight composite vehicles” which this Master’s thesis project is a part of.
• Each software has several material models for composites. The focus will be on one simple and oneadvanced material model in LS-DYNA and one advanced material model in RADIOSS.
• Only single-shell models will be investigated, since solid models tend to be too expensive regarding CPUcost in full vehicle crash simulations.
• Other types of advanced element modeling, such as several shells stacked on top of each other withcohesive elements in between each shell, have not been tested.
1.3 Method
In the beginning of the project, a literature study was performed, to investigate what damage mechanismsoccur during crushing of composites, as well as how the energy is absorbed in the material. A second literaturestudy was performed to investigate other projects, where FE-software have been used to solve the same type ofcrushing problems.
Tutorials and courses were taken for the software that were used in the project. The software that have beenused are the preprocessor ANSA (version 15.0.0), as well as LS-DYNA (version R7.1.0) and RADIOSS (version12.0). The software that was used for post-processing was HyperView (version 12.0).
1

In ANSA, the geometry and mesh of the specimen from the crush test were created. The composite stack-upand material model were also defined in ANSA, with the keywords and functions of the respective softwareconsidered. The loads and boundary conditions were determined in order to match the physical crush test andthe results from the simulations were compared with the results from the same test.
For LS-DYNA, two material models were tested, MAT54 and MAT262. The chapter covering LS-DYNAsimulations thus includes an introductory part where the FE-model specifics (used in simulations with bothmaterial models) are presented. This is followed by a section covering the theory and description of materialmodel specifics of MAT54. Results from simulations with MAT54 are also presented here. Then, a sectionregarding the theory and description of material model specifics of MAT262 follows. The results from simulationswith MAT262 are included here as well.
For RADIOSS, only one material model was tested, LAW25. The RADIOSS chapter is structured in the sameway as the LS-DYNA chapter. First, the descriptions of the FE-model specifics are presented, followed bythe theory and description of material model specifics. Then the results from simulations with LAW25 arepresented.
The strategy for simulations with each material model is presented in the list below:
• Investigate the theory of the material model.
• Describe the material card and material model parameters.
• Perform uniaxial tests on a simple model, to verify the material behavior.
• Perform simulations on dog-bone specimens, to investigate element size dependency.
• Perform simulations on the corrugated specimen that was used in the actual crush test.
• Investigate sensitivity of material model parameters.
2

2 Relevant research on modeling of crushing
Composite materials is a field in which a lot of research is going on, especially when it comes to failure modelsand fracture mechanics. The interest in the subject comes from the possibilities that composites can provide.For example, composites often exhibit high stiffness (and strength) to weight ratio and high energy absorptionin axial crushing. Much of the mechanical research addresses the problem of how to make it possible to captureall phenomena that occur during failure of the material. Different approaches on how to do this can be found.As pointed out in [1] there are two major branches, the micro-mechanical and the macro-mechanical approach.There are many reports where the micro-mechanical behavior is observed and methods developed to take thesemechanisms into account. Micro-mechanical modeling, will put high demands on computer performance and isthus unpractical for engineers in crash analysis [1]. However, some researches express that the micro-mechanicalbehavior needs to be included in the material models in order to accurately capture the complex mechanicsin composites. Many software today use macroscopic strength criteria to estimate the strength in compositematerials. The limitations in today’s computer performance makes the macroscopic perspective favorable, butin many cases it leaves uncertainties whether all aspects of composite crash behavior are captured and if themodels are truly predictive.
Many of the studies performed in the literature have been made on components with simple geometry, suchthat a real test can be performed in a controlled manner, where all necessary data can be measured. The dataobtained from simulations are then verified against the data from the real test. The following section willdescribe how different software have been used by others in the field of crash analysis of composite components.
2.1 JAMS project in composite crashworthiness
The Federal Aviation Administration, FAA, is a national aviation authority in the United States. One of FAA’smajor function is to define the certification methods and standards regulating civil aviation. Composites arenon-standard technology with limited shared databases, methods and guidelines. In 2003, FAA announced theinitiation of a joint award between the Wichita State University and the University of Washington to createthe Joint Advanced Material and Structures Center of Excellence, JAMS.
JAMS is a major player in the development of composite materials and methodology. One of its projects isto examine the crashworthiness of composite structures which is a relative new topic for the FAA certifica-tion[2]. The objective is to develop a guidance certification analysis and test protocol for composite fuselagecrashworthiness certification in order to increase the confidence and level of safety of composite components.
The crashworthiness project started in 2009 and is an ongoing project divided into four stages, see Figure2.1. Stage 1 is to perform axial crushing tests on corrugated specimens and investigate the predictability andcorrelation for different commercial software. Stage 2 is to repeat the axial crushing test but for a numberof different c-channel specimens. Stage 3 is to investigate the the characterization of joints and strain rateeffects on both quasi-static and dynamic tests. Stage 4 is to simulate dynamic crushing of sub-assembly modelse.g. fuselage support with bolted joints. The software investigated throughout these four stages is mainlyLS-DYNA, RADIOSS, PAM-CRASH and ABAQUS.
3

(a) (b) (c) (d)
Figure 2.1: Stage 1 to 4 in JAMS crashworthiness project [2]. (a) Axial crushing on corrugated specimen. (b)Axial crushing on c-channels. (c) Strain rate sensitivity and joints. (d) Sub-assembly simulation
The JAMS crashworthiness project involves many of the big mechanical companies in the United States. e.g.General Motors, Ford, and Boeing Research & Technology.
The specimen, used in stage 1 of the JAMS crashworthiness project, is the same as is used in this master thesis,see Figure 2.2. Simulations have been performed with different software and different material models. A lot ofthe detailed results from the investigated software are not published or found. So far the result of the projectdetermines that none of the software are truly ”predictive” but all of the software can reproduce the test witha variation in accuracy [2]. This project with its well known partners has influenced other researchers and thesame geometries are recurrent in many other projects.
Figure 2.2: Simulations of a corrugated specimen in different software [2]
2.2 Projects in LS-DYNA
Methods trying to capture the crushing behavior have been tried with different material models and approachesin LS-DYNA, e.g. with shells, tiebreak contact, cohesive elements and solids.
Simulation of corrugated specimen with MAT54 using shell elements
In [3], Feraboli and co-workers, has simulated a crushing behavior of a corrugated specimen as part of JAMS’scrashworthiness project. The simulation was performed with ordinary shell elements and with the materialmodel MAT54. The specimen is exposed to an axial crushing where a rigid plate is moved towards the laminate,see Figure 2.3. A user defined contact was implemented such that several element rows are into contact withthe rigid plate at the same time, thus controlling that the laminate never hangs freely when elements aredeleted. The material properties are degraded using the Chang-Chang failure criterion, see Subsection 5.2.1,and elements are deleted when a maximum strain limit is reached.
4

Figure 2.3: Corrugated specimen crushed towards a shell [3]
With the approach, made by Feraboli et al., a progressive row-by-row failure was achieved. The reaction force,between the corrugated specimen and the rigid plate, will increase to a high peak value and drop down tozero, as an element row is deleted. The spiky reaction force is filtered with a SAE600 filter, see Figure 2.4a.In Figure 2.4b the filtered reaction force is compared to test data and show a good correlation. The studyshows that a simple shell definition using MAT54 (with all material data known) can be tuned to get a goodcorrelation, but is not a predictable model.
(a) (b)
Figure 2.4: Reaction force from simulations by Feraboli et al. [3]. (a) Raw data compared to filtered data(SAE600 filter). (b) Filtered data (SAE600 filter) compared to test data
Simulation of impact on a pressure vessel using thick-shells and solid elements with MAT22
In [4], a carbon fiber reinforced plastic vessel was modeled during a crash test. To simplify the testing and themodeling the vessel was cut into a cylinder and fixed to a stand, see Figure 2.5. A sled device with an impactorwas crashed into the side of the vessel segment. Modeling this thick composite structure with only shell elementswill produce inaccurate results. A cost efficient way to increase the accuracy through the thickness is to usethick-shells instead of letting solid elements represent each ply. Thick-shells (type 3) utilize a 3D stress state,instead of only in-plane stresses. The test was performed with both thick-shells elements and solid elements.Each thick-shell represented a few of the used plies in the test, whereas the solid element model had a layerof solid elements representing each individual ply. In all simulations the simple material model MAT22 wasused. MAT22 is based on a reduced Chang-Chang failure criterion, where elements are deleted when theChang-Chang criterion is fulfilled.
5

Figure 2.5: Setup of crash test [4]
Since each individual layer is modeled as a thick shell the computational time is increased radically comparedto if regular shell elements would have been used, thus modeling all plies at once. Between each layer a tiebreakcontact is defined. The tiebreak contact transmits both compressive and tensile forces with optional failurecriterion. Each ply is thus glued together and has a failure criterion to model the delamination behavior of thelaminate. In Figure 2.6 a cross section of the vessel can be seen with thick-shell and solid elements. At the topof the figure, the impactor comes into contact with the laminate.
(a) (b)
Figure 2.6: Cross-section of the pressure vessel [4]. (a) Thick shell model with tiebreak contact. (b) Solidelement model.
Neither of the performed simulations can reproduce the reaction force from the sled test accurately, as can beseen in Figure 2.7. A more advanced material model should have been used in order to enhance the accuracy.Both thick shells and solid elements are good tools to capture the behavior through the thickness since theydo not smear the material properties as the shell model do. Even though the size of the model is increasedthe thick-shells are more cost efficient, than letting solid elements represent each individual ply. This materialmodel do not include delamination, therefore a tiebreak contact is a good way of introducing delamination tothe model.
6

Figure 2.7: Comparison of reaction force for different element formulations in the simulation with the pressurevessel [4]
Simulation of impact attenuator on a racing car using shell elements with MAT55
In [5] and [6], computational crash simulations on an impact attenuator has been performed using LS-DYNA.The same simulation has also been performed with RADIOSS [5]. During the development of a small formula-style racing car an impact attenuator is made of a carbon fiber composite material, see Figure 2.8. The racecar is part of the yearly Formula SAE race. Formula SAE is a student design and manufacturing competitionorganized by the Society of Automotive Engineers, SAE. To ensure drivers safety in high speed crashes, specialimpact structures are designed to absorb the kinetic energy during a crash situation.
The front impact attenuator is a thin walled crash box made of carbon fiber. In the simulation a rigid wall withthe mass of 300kg is crashed into the impact attenuator with a speed of 7m/s. To trigger a correct crushingbehavior the number of plies is reduced in three steps, first 7 plies (red), then 9 plies (green) and last 10 plies(blue), see Figure 2.8b. The impact attenuator is model with shell elements and material model MAT55. Someof the strength reduction parameters implemented in MAT55 are used to further improve the progressive failurebehavior.
(a) (b)
Figure 2.8: Illustration of the placement and shape of the impact Attenuator [5]. (a) Formula SAE racing car.(b) Impact Attenuator.
The result from the simulations correlate quite well to the performed test, seen in Figure 2.9. This shows thatunder right circumstances quite simple models can model a crush situation. Whether the result is predictive orjust adjusted to correlate with the test is not discussed.
7

Figure 2.9: Reaction force from test and simulation for the impact attenuator [5]
2.3 Project in RADIOSS
The crush simulations performed on the race car attenuator described earlier in Section 2.2, see Figure 2.8a and2.8b [5], was also done with the explicit finite element solver RADIOSS. Modeling of the composite materialwas done by using Type10-Composite Shell. With this property multiple layers of composite material can bemodeled with constant layer thickness and material definition, but variable material direction. Material modelLAW25 has been used, with the built in Tsai-Wu plasticity formulation, which enables the material to yield inall in-plane directions and hardening of the material is isotropic.
With LAW25, a layer in the composite can get completely damaged and loose its mechanical properties eitherdue to tensile strain limits or maximum plastic work limits. The complete failure of a layer due to tensilefailure strains is preceded by material stiffness degradation after a certain strain value is reached in tensilefiber, or transverse, direction. The maximum plastic work limit can be specified to be taken into account in alldirections, including compression. Plastic work is defined as the work that is done during plastic strain.
The final deletion of elements can be set to occur if either one layer, or all layers has reached maximum plasticwork limit, but also if tensile failure strains are exceeded in fiber or transverse direction. In [5] they have usedelement deletion if the maximum plastic work limit is reached in one ply. The force-displacement results canbe seen in Figure 2.10. Apart from the initial peak force, the force from simulation follows the trend of theexperiment curve and the authors of the article are pleased with the results.
Figure 2.10: Force displacement curve from simulations, with RADIOSS, performed on the attenuator comparedwith the experimental results [5].
8

2.4 Project in ABAQUS
A similar corrugated composite specimen that was used by the JAMS project [7] has been modeled by 3DSSimulia [8]. Simulia have used their own commercial software, Abaqus/Explicit, to demonstrate its benefits.They state that their model consider both in-plane fracture mechanisms as well as the interlaminar delaminationmechanism. Their approach was to model 8 layers of individual continuum shell elements (SC8R) with asurface based cohesive contact between each layer of shell elements. The continuum shell elements act similarto conventional shell elements but have the geometry of three-dimensional solid elements. The cohesive contactbetween the shell elements enables the model to simulate delamination between the layers.
The in-plane behavior is considered by using a built-in user subroutine (VUMAT), which is a constitutivemodel for fabric-reinforced composite material. This model uses stiffness degradation after damage initiationin either fiber or matrix cracking. For the damage behavior, both initiation parameters, such as tensile andcompressive strengths of fiber, and damage evolution coefficients are needed. The damage evolution coefficientsare based on fracture energies per unit area. In shear loading, plastic deformation is available.
Delamination, due to failure of the interface between the shells, is initiated by defining the quadratic nominalstress criterion (QUADS) in the cohesive contact. This criterion is based on maximum allowed normal andshear stress. After damage is initiated, the degradation of the contact was done via an exponential softeninglaw.
The model was meshed with elements of 1x0.5 mm2 giving a total of one half million degrees of freedom. Theresults from simulation compared to those from test are quite satisfying, see Figures 2.11a and 2.11b. However,the time required for the simulation is not presented.
(a) (b)
Figure 2.11: The model and results from [8]. (a) The model after some crushing. (b) Load-displacement results
2.5 Project in PAM-CRASH
In [1], the commercial explicit finite element software PAM-CRASH is used to model two different approacheson crushing of a square composite tube. The first model was built with several shells stacked on each other andthe second was modeled with only one shell. The test that provided the reference data for the simulations canbe seen in Figure 2.12.
9

Figure 2.12: The test performed in [1]. Left figure shows test specimen in the test rig. The right figure is thetest specimen after crushing.
In the first model different layers of shell elements have been joined together using cohesive elements. The shellsare of PAM-CRASH material model 131, with property type 7, which is a fabric composite global ply model.When loading the material its in-plane properties will be degraded due to micro-cracking before ultimate failure.The cohesive elements are one-dimensional of material model 303. Two adjacent shells are tied together with apenalty formulation, where a slave node on one shell is connected with a master segment on the other shell.Failure of the inter laminar elements is based on the model proposed by Pickett et al. [9]. This delaminationapproach is implemented in the PAM-CRASH code. The failure will occur when critical elastic fracture energies,stored in a crack, are exceeded. Mode 1 and 2 (opening and in-plane shear mode respectively) fracture isconsidered in this model, but also mixed mode delamination. In the material model, for the cohesive elements,maximum allowed stress is defined, with which the elastic energy limits for both modes are computed [1].
Mesh dependence was tested by adopting two different mesh sizes. One of 7x7 mm2 and one of 4x4 mm2.The results differed in how the crushing load oscillated around its average force. For the larger mesh size theoscillations were greater, but both mesh sizes resulted in same average crushing force.
Different amount of inter laminar element layers (3, 4 and 5) was tested. The results with the stacked shellmodel indicates an underestimation of energy absorption. The reason for this is discussed and assumed to bedue to the model’s inability to accurately take friction effects into account. The friction along already crushedmaterial is not included. Sliding between the shell layers is also not included due to the fact that two adjacentshells are actually not in contact (cohesive elements in between). However, deformation of the cohesive interlaminar elements, who are placed in between the layers of shells, give rise to some energy absorption. Anothercomment made is that the model was not robust in the sense that it could give completely different crushingbehavior if just a small modification of parameters was made.
The second model in [1] was built with a single layer of shell elements. Same material as in the stackedshell model is used in this simulation (material model 131), but in addition a crushing zone model is applied.Crushing zone is where the model first go into contact with the plate, which it is crushed against. The crushingzone formulation is progressively activated for elements that are located in the region of crushing. The materialresponse is changed to give an elastic-perfectly plastic behavior in the crushing direction. The element isdeleted when a minimum allowed ratio between the current element area and the initial area is reached.
This model gave stable results which were very close to the reference data. The single layer shell model was alsoless time consuming to simulate. At least 30% less time was required. However, the model does not capturethe fracture mechanisms that occur in a real test. Figures 2.13a - 2.13d illustrate a small excerpt of the resultsobtained with the stacked shell and the single shell models.
10

(a) (b)
(c) (d)
Figure 2.13: The different models and corresponding results obtained in [1]. (a) Stacked shell model, with 5inter laminar layers, after crushing. (b) The propagation of crushing in the single shell model. (c) Results fromthe tests with 5 inter laminar layers and variations in values on critical energy release rates. (d) Results fromthe single shell model.
11

3 Theory
3.1 What is a composite?
When two or more materials are combined on a macroscopic-scale they form a composite. A typical exampleof composite material is ply-wood, where thin layers of wood are glued together with the wood grain of thelayers in different angles to gain strength and stiffness in more than one direction. Another example is concrete,where aggregate particles are mixed with a binding material, which glues the aggregates together. This thesisis however only to discuss the composites of fiber reinforced polymers, FRP. Common materials to use in FRPsare fibers of carbon or glass in a matrix of epoxy or polymer thermosets. The FRPs can be divided into twodifferent groups, short fiber reinforced polymers and long fiber reinforced polymers. Another delimitation inthis thesis is that only long fiber composites are considered, and the FRP acronym will henceforth only refer tothe long fiber group.
3.1.1 Fiber reinforced polymers
FRPs can be of single-layer or multi-layer type. The single-layer type also includes composites where severallayers are stacked with the material orientation in same direction. The multi-layered composites are whereseveral layers are stacked with fibers orientation in different directions. Each layer can be unidirectional, whereall fibers in that specific layer are aligned in one direction. They can also be woven, where the fibers have two,or more, directions. The idea of having layers with different material orientation is to give different strengthsand stiffness of the laminate to various directions.
In contrast to many other engineering materials, such as metals, composites are not isotropic. They areanisotropic in the sense that the properties (stiffness, strength, toughness etc.) differ in different directions.Layered FRPs are rather orthotropic, which means that properties are different i three perpendicular directions.The orthotropic directions can have different notations. The longitudinal fiber direction is often denoted asdirection 1, A, or L. Transverse direction is denoted 2, B or T . The out-of-plane direction is denoted 3, C orT ′, see Figure 3.1. These directions are local to each ply in the stack-up. If the properties in all transversedirections to the fiber are the same, the material is defined as transversely orthotropic.
Figure 3.1: Illustration of how the orthotropic directions are defined.
For a unidirectional ply, such as that in Figure 3.1, the mechanical properties are highly dependent on the fiberfraction. The properties of the matrix and the fibers are combined, where the fiber fraction is what determinesthe longitudinal and transverse stiffness properties for that ply. When plies with different angles for the fiberdirection are stacked, the contributions from each layer are transformed to follow a global coordinate system,see Figure 3.2.
Figure 3.2: Illustration of how material orientation is related to coordinate systems.
12

When the transformation for each layer is done, the property contributions from each layer can be added up inthree different matrices, the extensional stiffness matrix, coupling stiffness matrix and bending stiffness matrix(A, B and D respectively in Equations 3.1 and 3.2). Where the contribution from each ply in the two lattermatrices depends on the distance to the mid-plane of the laminate. These matrices are what couples forces andmoments to strains and curvatures in the laminate. Two relations can be written as in Equation 3.1 and 3.2
Nx
Ny
Nxy
=[A] ε
0x
ε0y
γ0xy
+[B] kxkykxy
(3.1)
Mx
My
Mxy
=[B] ε
0x
ε0y
γ0xy
+[D] kxkykxy
(3.2)
Where N are the forces, M are the moments, k are the curvatures and ε0 are the mid-plane strains. Furtherinformation on how the stiffness matrices are derived and constructed can be read in [10].
3.2 Main failure modes of composites
When a composite is subject to loading, several different failure modes are present. Most of the software usedtoday in crash analysis of composites are based on macro-mechanics and can not capture all of the failuremodes on a microscopic scale. However, quite accurate estimations of global energy absorption can be obtained,but it is of importance to be aware of the possible failure modes in crushing of composites in order to assessthe quality of simulations.
According to [11] the main failure modes of fiber-reinforced composites are delamination, matrix compressivefailure, matrix tensile failure, fiber compressive failure and fiber tensile failure. Each of these modes requiresome explanation. The schematic Figures 3.3 and 3.4 show how different loading give different angle on thecrack.
(a) (b)
Figure 3.3: Matrix failure modes. (a) Shear matrix failure due to compression in transverse direction. (b)Tensile matrix failure perpendicular to tensile load in transverse direction.
(a) (b)
Figure 3.4: Fiber failure modes. (a) Shear fiber failure due to compression in fiber direction. (b) Tensile fiberfailure perpendicular to tensile load in fiber direction.
3.2.1 Delamination
When it comes to fracture mechanics and crash analysis one of the interesting characteristics is the amountenergy the material will be able to absorb. In [10] it is described that during loading, energy is absorbed in
13

two different main mechanisms. The first is deformation of the material and the second is formation of newsurfaces, such as cracks. If a composite material undergoes deformation to such extent that delamination cracksare present, these cracks will absorb a significant amount of energy when they propagate. A delamination crackis often preceded by a crack who has propagated through a ply until it has reached the fibers of an adjacent ply.Then the crack may branch off to go along the interface in between the plies, causing the delamination crackto form. Delamination is often found in specimens who have been subject to bending, due to predominantout-of-plane shear stresses. Figure 3.5 illustrates a cutout of a specimen subjected to impact, causing it tobend, where matrix cracking in the intermediate transverse ply has grown to the interfaces between the pliescausing delaminations.
Figure 3.5: Delamination crack in specimen due to impact which has caused bending [12]
3.2.2 Matrix failure
When a composite fail in compressive matrix mode, the crack is most often at an angle to the loading direction.This failure mode is therefore primarily a shear matrix failure, as stated in [11], an illustration of which can beseen in Figure 3.3a.
Failure due to transverse tensile loading can depend on either matrix tensile failure or constituent debonding.In contrast to compressive matrix failure, the fracture plane in tensile matrix failure is perpendicular to theloading as illustrated in Figure 3.3b [10].
3.2.3 Fiber failure
If a composite is loaded in compression in the fiber direction, different failure modes can occur. The Poisson’sratio effect, causing tensile stresses in transverse direction, can initialize cracks at the interface between fiberand matrix. This mode is called transverse tensile failure. Another compressive fiber failure mode is fibermicro-buckling. The micro-buckling of two adjacent fibers can buckle in-phase or out-of-phase. However, it ismost likely that the buckling of fibers occur in-phase, see Figure 3.6a, if the fibers are densely packed. This,in-phase mode is also called shear mode, since the matrix exhibits mostly shear strains. For carbon fibers, theangle of the crack is often at approximately 45◦to the loading axis [10]. The shear mode is typically triggeredat imperfections like voids in the matrix, making the fiber loose its lateral support. It can also be triggeredwhere the fibers are misaligned. This mode cause kink bands to form [11]. Figure 3.6a illustrates a kink band,shear mode failure, through a single bundle of fibers, while Figure 3.6b illustrates kink bands through severalplies and matrix cracking in the transverse intermediate plies.
14

(a) (b)
Figure 3.6: Kink band formations due to compression in fiber direction [13]. (a) Kink band through a singlebundle of fiber. (b) Kink bands through several bundles of fibers and matrix cracking in the intermediatetransverse plies.
When fibers are loaded in longitudinal direction, they will break in a brittle behavior at their weakest crosssections. Fibers, who are brittle, fail at low fracture strains. Even though the high strength contribution ina composite comes from the fibers, the energy absorption from fiber breakage when a composite fails is verylow. But, as stated in [10] the presence of fiber influences the various failure modes and thereby also the totalabsorbed energy. When fibers break the bonds between matrix and fiber can also break and cracks can goalong the fibers. This behavior is what cause fiber pullouts.
3.3 Crushing of composites
When it comes to crash of structures, especially in vehicle applications, it is of great interest to have a designand material which can absorb the energy required to achieve an impact at an acceptable level of deceleration.Tests have shown that composites generally are good at absorbing energy during a somewhat constant crushload, since many different energy absorbing mechanisms occur simultaneously. Therefore composites are usefulin crashworthy applications. It is however important for the structure to be designed in such way that thestructure fails in a progressive energy absorbing manner. For example if the structure fails in global Eulerbuckling the energy absorption will be much lower than if it fails in progressive crushing [14].
Many crush tests on composites have been performed, where the failure modes, energy absorption and crushingforce is observed. In order to avoid catastrophic failure, such as Euler buckling, long thin-walled structuresshould not be used. In many tests a chamfered edge is used where the crushing is to be initiated.
Figure 3.7 shows an example of crushing where the progressive behavior is triggered by a chamfered edge. Thefigure is based on an actual test performed by Hull [15], from which he describes an average behavior of thecrushing at different stages for a cross section of the tube. In this test a stack-up of [90/0]2S has been used. Inthe first stage the inner 90◦layer is compressed and fails in shear and is forced to move inwards, marked with(a) in Figure 3.7. As this layer is forced inwards, compressive stresses along its fiber direction will eventuallymake it buckle and kink.
When the middle axial layers come into contact with the rigid plate, which the tube is crushed against, bucklingand kink bands take form in those layers, (b). As crushing proceeds, crushed material forms a debris wedge, (c).A debris wedge can be seen in most crush tests similar to this, and is what cause both inter- and intralaminartransverse cracks parallel to the axial fibers in the middle. This will split the material and force it towards theinside and outside of the tube. A central crack will cause mode I delamination. The splitting of the plate iscalled splaying and results in fronds. The plies who exhibit splaying do not fracture, they are rather exposed toextensive bending, which cause interlaminar and intralaminar shear cracks to form, (d) [16]. Delamination inthe splay, between the 90◦and 0◦ply, will most likely be mode II delamination, which is a shearing mode.
15

The outer 90◦layer will, apart from transverse shear cracks in the matrix due to compression, experience tensilestresses in its fiber direction, as the material is forced outwards. This will eventually make it fail in tensile fibermode.
Figure 3.7: A schematic illustration of how crushing of a tube with chamfered edge can occur, modified from[15].
Figure 3.8a shows a crushed tube from another crush test where a braided composite tube has been crushed.The fronds from splaying of the material is clearly visible. Figure 3.8b shows a cross section of the same tube.
(a) (b)
Figure 3.8: Tube crush test, from [17]. (a) Tube after crush test. (b) A cross section of the crushed tube.
A typical force-displacement curve of axial crushing can be seen in Figure 3.9. Usually there is an initial forcepeak, followed by stable crushing where the force are kept at an almost constant level. The initial peak is highersince no failure modes have yet been triggered. The zone between the force peak and the stable crush zoneis called the transition zone. The transition zone is highly dependent on how the crushing is triggered. Theconstant force in the stable crush zone makes the deceleration of an impacting object constant. This, togetherwith the high stiffness-to-weight ratio, is what make composites good in applications where a crashworthystructure is important.
16

Figure 3.9: Typical force-displacement curve for a specimen subject to crushing.
As already mentioned, the energy absorption is of great interest in crush tests. The total energy, W , absorbedduring crushing can be expressed according to Equation 3.3.
W =∫∆
0Fds
(3.3)
Where ∆ is the crush distance and F is the measured force. The specific energy absorption, Es can then alsobe determined, according to Equation 3.4, as the energy absorbed per unit mass.
ES =W
ρAl (3.4)
Where ρ is the density, A is the cross-sectional area, l is the crushed length. The specific energy absorptiondepends on more than material properties. It is also highly dependent the stack-up of plies and geometry of thespecimen. In cases where the weight of the structure is an important parameter the specific energy absorptionis a good value to use in comparisons between materials and geometries.
17

4 Crush test
The test, which has provided the reference values for the simulations of this thesis, was performed by Feraboliand co-workers [3]. A corrugated specimen was used, see Figure 4.1. The specimen was crushed axially betweentwo hardened polished steel surfaces and the force needed to crush the specimen at a constant velocity of 25mm/min (1 in/min) was measured. By having the corrugated profile, the specimen is self-supporting. Thus, noother support is required to keep it from buckling.
Figure 4.1: The corrugated specimen used in crush test [3].
The material was of unidirectional tape T700 carbon fibers and 2510 epoxy prepreg. The lamina stack-up was[0/90]3s (i.e. 12 plies) with a total thickness of 2.0 mm (0.079 in). On the end, where crushing is desired, theedge is chamfered 45◦. This helps to initiate crushing and avoid initial spikes in crush loads. The height of theplate is 76.2 mm (3 in) and the width is 50.8 (2 in). More details regarding dimensions of the plate can befound in Figure 4.2
Figure 4.2: Profile and side-view of the test specimen [7]
Many tests on same type of specimen were performed. Figure 4.3 illustrates one specimen after crushing. Theforce-displacement and the energy absorption-displacement curves from one of the tests can be seen in Figures4.4a and 4.4b. The force curve has a high initial peak followed by a somewhat constant crush load. The nearconstant force is reflected in the linear shape of the energy absorption curve.
18

Figure 4.3: The corrugated specimen after crushing [3].
(a) (b)
Figure 4.4: Results presented in [3]. (a) Force - Displacement curve from crush test (Note that axes showpounds and inches). (b) Energy Absorption - Displacement curve from crush test (Note that axes show Jouleand inches)
The material data that was presented by Feraboli for unidirectional tape of the material used in this test, canbe seen in Table 4.1.
Table 4.1: Parameters adopted from [3] to be used in simulations.
Property Symbol Value
Density ρ 1.52 g/cm3
Modulus in direction 1 E11 127 GPa
Modulus in direction 2 E22 8.41 GPa
Shear modulus G12 4.21 GPa
Major Poisson’s ratio ν12 0.309
Minor Poisson’s ratio ν21 0.02049
Strength in tension direction 1 σ1tu 2200 MPa
Strength in tension direction 2 σ2tu 48.9 MPa
Strength in compression direction 1 σ1cu 1470 MPa
Strength in compression direction 2 σ2cu 199 MPa
Shear strength σ12u 154 MPa
19

These material parameters are those that have been used as input parameters for the simulations of thisproject and have been considered to be correct, i.e. these values have been used consistently in all simulations.Furthermore, the model in simulations was built, to resemble the test specimen, with the dimensions accordingto Figure 4.2, with the same stack-up of plies (i.e. 12 plies, [0/90]3S). The 45◦chamfer on one side of thespecimen was modeled by reducing the thickness by 0.5 in one row of elements in the finite element mesh.
20

5 LS-DYNA
5.1 Introduction
LS-DYNA is a commercial software developed by Livermore Software Technology Corporation. It is an advancedgeneral purpose finite element program mainly used by the automobile, aerospace, bioengineering, constructionand manufacturing industries. Originally developed to solve highly nonlinear transient dynamic finite elementanalyses using explicit time integration, but more capabilities have been added. LS-DYNA now has a vastnumber of simulation capabilities, including nonlinear dynamics, rigid body dynamics, thermal analysis, fluidanalysis, failure analysis, crack propagation, multi-physics coupling, etc, and can be tailored to fit many otherfields. Implicit solver is also available.
LS-DYNA is an entirely command line driven software and a single executable file is needed to run thesimulation. The input file is called a keyfile (.key) and is written on ASCII format. Hence the keyfile can beprepared using any text editor, but dedicated preprocessors are commonly used. Throughout this project thirdparty software, ANSA (version 15.0.0) and Hyperview (version 12.0), are used for pre- and post-processingpurposes in LS-DYNA.
5.1.1 Simulation model of the corrugated specimen in LS-DYNA
To know how to set up your simulation model, the physical behavior of the test needs to be understood.The setup of the model can be divided into three main parts, the geometry, the material and the boundaryconditions. Focus in this project is to analyze the material definition, but to achieve an accurate simulation, agood combination of all simulation options are required. This section aims to describe the simulation model anddetailed software-specific issues for LS-DYNA. The implementation of material card MAT54 and MAT262, willbe described in Subsection 5.2 and Subsection 5.3, respectively. It should be noted that all values of parametershave been transformed to fit the following units: Stress in [MPa], force in [N], distance in [mm], energy in[Nmm] and time in [s]. For detailed information of LS-DYNA specific keywords described in this section, cf.[18].
In order to use a composite material in LS-DYNA a property called PART COMPOSITE has to be defined.Here is the lamina stack-up of the composite defined, together with lamina thicknesses and element formulation.The material cards are then coupled to the PART COMPOSITE. The material direction of each element iseither defined in the material card or with an additional card called ELEMENT SHELL BETA, which willoverride the material direction in the material card. Note that not all material cards can handle all typesof element definitions. Usually the element definitions are divided into shell, thick-shell and solid elements.Within each definition there are many different element formulations, e.g. Belytschko-Tsay, fully integratedshells etc. They differ in number of nodes, integration points, degrees of freedom, and kinematics.
Both MAT54 and MAT262 are compatible with regular shells and thick shells, as well as with solids. In thissimulation, regular shell elements are used, since this is a common approach to reduce costs in crash simulationsand this project aims to investigate the usage of composites under these circumstances. The usage of shellelements lead to limitations in capturing delamination and gives a low accuracy of out-of-plane stresses, whichare important parameters in fracture mechanics.
The corrugated specimen is meshed with fully integrated shell elements of type 16, with four in-plane integrationpoints. From an accuracy standpoint the fully integrated elements are preferred over the under-integratedelement formulation, e.g. type 2, since the fully integrated do not suffer from hourglass modes. The under-integrated elements tend to be too soft and can have problems with hourglass forming, but are cost efficientsince only one in-plane integration point is used. The shell definition through the thickness for compositematerials is defined to one integration point for each layer, hence the corrugated specimen with its 12 plies hasa total of 4 times 12 integration points.
Just as in the crushing test the simulation model needs a trigger to initiate the failure where the specimen iscrushed to the ground. The trigger is modeled as a single element row with reduced thickness at the crushfront of the corrugated specimen, with the only purpose to initiate failure. Both the main laminate and the
21

trigger part has the same material with the same amount of plies, but the thickness of the trigger is reducedfrom 2.00mm to 0.50mm. Different triggers, element sizes and mesh layouts have been tried before choosing abaseline model.
The movement of the laminate is defined with a prescribed motion, BOUNDARY PRESCRIBED MOTION,applied to the nodes at the top of the laminate, see Figure 5.1. The motion is purely vertical and the remainingfive degrees of freedom are fixed for the constrained nodes at the boundary condition. The prescribed velocityis ramped up to a constant value of 2000mm/s in order to speed up the simulation. The effect of usinga higher velocity than the performed quasi-static crushing test will be discussed in Subsection 5.2.6. Byfurther reducing the cost of the simulation, mass scaling is also used in order to maintain the time step at anaffordable level, i.e. to keep the total simulation time low. To reduce vibrations and shockwave propagationcaused by the high velocity, 10% damping is added to the stiffness matrix of the system, with the functionDAMPING PART STIFFNESS. This stiffness damping is an effective way of suppressing high frequencies inthe system.
Figure 5.1: Basic simulation model used in LS-DYNA
A predefined standard contact condition, CONTACT AUTOMATIC NODES TO SURFACE, is used betweenthe ground and the laminate, where the nodes of the laminate are slaves to the master surface of the ground.The contact condition utilize a penalty method. Both dynamic and static friction is used to minimize oscillationof the laminate. The ground is constructed as a shell, fixed in space with the rigid body material card, MAT20.Even though MAT20 defines a rigid body it includes density, Young’s modulus and Poisson’s ratio which areused in the computation of the reaction force in the contact condition. The ground is assumed to be made ofsteel.
An important parameter to specify when using the shell definitions for composites in LS-DYNA is the LAMSHTflag in the control card, CONTROL SHELL. This parameter activates laminate theory in the calculation of theshear strain through the thickness. Otherwise the shear strain is assumed to be constant through the thicknessof the shell. An assumption that can be grossly incorrect if there are drastic differences in the elastic propertiesfrom ply-to-ply, e.g. if sandwich type composites is used. Generally the result tend to be too stiff if thiscorrection flag is not used [19]. Also activate the NFAIL4 parameter in the CONTROL SHELL allowing highlydistorted element to be deleted before they lead to instabilities causing error termination of the simulation.Note that the whole element is deleted not just the integration points of the plies.
Additional helpful parameters unique to each material model and which are strongly recommended to activate,are the history variables. The history variables include damage parameters in different modes for each ply andcrashfront visualization. In order to get the history variable printed out, the IMATL flag has to be activein the DATABASE BINARY D3PROP section. The DATABASE card controls what and how often certainparameters are written to the result files. As default the result from only three integration points throughthe thickness are written to the result files. In the DATABASE EXTENT BINARY section the NEIPS andNEIPH parameters controls how many of the integration points that the result to the history variables arewritten. NEIPS is used for shells and NEIHP is used for solids.
22

5.1.2 Available material models in LS-DYNA
The simulated material behavior is governed by the material model. The input parameters to the materialmodel are defined in the material card, which usually include some elastic anisotropic material properties,material coordinate definitions and other model parameters such as failure criterion. Each material modelutilizes a different model strategy for failure initiation prediction, material properties and degradation schemes.Specific model parameters are also included in the material card. These parameters do not always have animmediate physical meaning but are needed to run the simulation and tune the material behavior. The amountof unphysical parameters varies between the material models, but are included in all models.
Within the failure surface, the composite materials behaves orthotropic linear elastic, although some modelscan include plastic behavior. When failure is reached, the material properties are degraded according to thedegradation scheme. Some material models utilize a discontinuous failure where the material properties areset to zero when a ply reaches a certain failure condition, i.e. the ply is either undamaged or fully damaged.The degradation is generally on the elastic anisotropic material parameters, e.g. Young’s moduli, shear moduliand Poisson’s ratios. Other material models utilize a continuum damage mechanics model where the materialproperties are reduced after failure is initiated, in order to capture a more physical behavior. The damage ofthe ply goes from a undamaged state to a fully damaged state according to the degradation scheme. A ply isremoved when the fully damage state is reached, i.e. the integration points of the ply will no longer contributeto the element stiffness.
Available material cards for composite modeling can be seen in Table 5.1 [19].
Table 5.1: Available materials for composite modeling in LS-DYNA
Material Laws Description Elements
Material card Failure condition Elements Comments
MAT22Composite Damage
Reduced Chang-Chang Shell, Thickshell, Solid
Simple brittle model.No crashfront algorithm
MAT54/55Enhanced Composite Damage
54: Chang-Chang55: Modified Tsai-Wuand reduced Chang-Chang
Shell, Thickshell, Solid
Improvement of MAT22.Crashfront algorithm.Strength reductions parameters.
MAT58Laminated Composite Fabric
Modified Hashin Shell, Thickshell
Similar to MAT54.Smooth stress strain relation.Continuum damage model withexponential softening.Crashfront algorithm.Non-Linear shear behavior.
MAT59Composite Failure Model
Modified Hashin Shell, Thickshell, Solid,SPH
Similar to MAT58.Super imposed linear isotropicviscoelasticity.
MAT116/117/118Composite Layup
No failure Shell Elastic response only
MAT158Rate Sensitive Composite Fab-
ric
Modified Hashin Shell, Thickshell
Same as MAT58.Rate sensitive.
MAT161/162Composite MSC
Hashin Shell, Thickshell, Solid
Extra licenses required.MAT161 offers delamination pre-dictions with solid elements.
Continued on next page
23

Table 5.1 – Continued from previous page
Material Laws Description Elements
MAT261Laminated Fracture Daimler
Pinho
Pinho Shell, Thickshell
Physical based failure criteria.Continuum damage model.Linear softening evolution basedon fracture toughness.
MAT262Laminated Fracture Daimler
Camanho
Camanho Shell, Thickshell
Physical based failure criteria.Continuum damage model.Similar but a more simple modelthan MAT261.Bi-linear/linear softening evolu-tion based on fracture toughness.
5.2 Simulations with MAT54/55 - Enhanced composite damage
Material model MAT54 is one of the most tested composite material definitions in LS-DYNA. It is is oftenused in dynamic failure simulations since it requires a reduced number of measured material input parameters.
Material card MAT54/55 is an enhanced version of the simplified material model MAT22. MAT54 makes useof the full Chang-Chang failure criteria where failure can occur in tensile fiber mode, compressive fiber mode,tensile matrix mode and compressive matrix mode. In MAT55, the tensile and compressive fiber mode aretreated as in the Chang-Chang failure criterion, but for the matrix modes the Tsai-Wu criteria is used instead.
In MAT54/55 an elastic-plastic stress-strain behavior is used, allowing a more ductile failure process. Thestress is increased linearly until the failure criteria is reached in one mode. Then the stress-strain behavior iseither ideal plastic or the maximum stress is reduced to a residual stress (since version R5), depending on howcertain parameters is defined in the material card. The integration point in a certain layer is removed when aspecified failure strain is reached.
In addition to the regular material behavior, a crashfront algorithm may be added, which offers a softeningfactor to the strength in the elements of the crashfront. This can be used to suppress global buckling and trima progressive failure. Strain rate dependent strength can also be implemented in the model, via the functionDEFINE CURVE. The material models can be used for shells, thick-shell and solids elements.
5.2.1 Theory of failure model and degradation scheme in MAT54
MAT 54/55 uses an orthortopic elastic stress-strain relation, until failure is reached in any of the four failuremodes described in Section 3.2. All failure modes are defined in the plane of the shell, since the shell definitionand MAT54/55 works under the assumption of plane stress. MAT54 makes use of the full Chang-Changcriterion, seen in Equations 5.1-5.4, which is formulated as a separate criterion for each of the four failuremodes. MAT55 makes use of a modification of the Tsai-Wu criterion in matrix failure, see Equation 5.5, anduses the Chang-Chang criterion in the tensile and compressive fiber mode. The terms that are dependent ofthe longitudinal stress, in the Tsai-Wu criterion, are removed. Only terms dependent on the transverse andshear stress are used in the matrix mode for MAT55.
In the degradation scheme, used in MAT54/55, the affected parameters are either undamaged or fully damaged.When failure is reached in one of the four failure modes, some of the orthotropic elastic material parameters areset to zero, such as the Young’s moduli, Poisson’s ratios and shear moduli. Which of the material parametersset to zero, depends on the reached failure criteria. The degraded parameters are shown together with eachfailure criteria in Equations 5.1-5.5. The degradation of Young’s modulus causes the stress-strain relation tobecome ideal-plastic after failure, see Figure 5.2, for an explanatory stress-strain relation. If unloading occur,the failure criteria will not be fulfilled and the degraded parameters are undamaged again.
24

Figure 5.2: Example of simple ideal-plastic stress-strain relation
In the tensile fiber mode, Equation 5.1, the effect of the shear stress is added to the failure criteria. The shearstress weighing factor β is used to explicitly define the influence of the shear stress in the fiber tension mode. Ifβ is set to zero the maximum-stress-failure criteria is used in the tensile fiber mode and a β value of one givesthe Hashin failure criteria. Since tensile and shear stresses have a less affect on the result than the compressivestresses the β parameter will not have a such a big influence of the simulation. β = 0 Max stress failure criteria
β = 1 Hashin failure condition
If failure occurs in the tensile fiber mode, the Young’s moduli for both fiber and matrix direction are set tozero. As well as the shear modulus and Poisson’s ratio in ab-direction.
The compressive fiber mode, Equation 5.2, is basically a maximum stress condition, where the ply is damagedwhen the compressive fiber strength is reached. The Young’s modulus in fiber direction and both Poisson’sratios are set to zero.
All of the matrix failure modes, equations 5.3-5.5, takes a multiaxial stress state into account. The parametersset to zero varies, for the matrix modes.
Tensile fiber mode:
e2f =
(σaXT
)2
+ β
(σabSC
)− 1
≥ 0 failed
< 0 elasticif σa > 0 (5.1)
Degradation after failure: Ea = Eb = Gab = νab = 0
Compressive fiber mode:
e2c =
(σaXC
)2
− 1
≥ 0 failed
< 0 elasticif σa < 0 (5.2)
Degradation after failure: Ea = νba = νab = 0
Tensile matrix mode:
e2m =
(σbYT
)2
+
(σabSC
)2
− 1
≥ 0 failed
< 0 elasticif σb > 0 (5.3)
Degradation after failure: Eb = Gab = νba = 0
25

Compressive matrix mode:
e2d =
(σb
2SC
)2
+
[(YC2SC
)2
− 1
]σbYC
+
(σabSC
)2
− 1
≥ 0 failed
< 0 elasticif σb < 0 (5.4)
Degradation after failure: Eb = Gab = νba = νab = 0
Tensile and compressive matrix mode used by the Tsai-Wu failure criterion:
e2md =
(σ2b
YCYT
)+
(σ2ab
SC
)2
+(YC − YT )σb
YCYT− 1
≥ 0 failed
< 0 elastic(5.5)
Degradation after failure: Ea = Eb = Gab = νba = νab = 0
5.2.2 Description of Material Card MAT54
The material card for MAT54/55 has eight data block columns and nine rows. The blue variables, whichconstitute most of card 1 and card 2, are elastic orthotropic material parameters for the longitudinal, transverseand normal direction. Since the assumption of plane stress is made for MAT54 and for the LS-DYNA shelldefinition, the out of-plane-stress σ33 is zero. Hence the out-of-plane material parameters are not used. Thisimplies that MAT54 can not predict delamination, a failure mechanism highly dependent on the out-of-planestress.
The red variables control the material coordinate system for each element. It is essential to define the materialdirection to control the anisotropic behavior of the material.
The green variables are failure modeling parameters. Card 5 consists mainly of strain parameters and unphysicaltuning parameters. The strain parameters control that the element is kept after the failure criterion is reachedand is not deleted until the failure strain is exceeded. Card 6 consists of strength limits to the Chang-Chang orTsai-Wu failure criterion and card 7-9 are optional tuning parameters.
Table 5.2: Material card MAT54/MAT55
Card 1 MID RO EA EB (EC) PRBA (PRCA) (PRCB)
Card 2 GAB GBA GCA (KF) AOPT
Card 3 A1 A2 A3 MANGLE
Card 4 V1 V2 V3 D1 D2 D3 DFAILM DFAILS
Card 5 TFAIL ALPH SOFT FBRT YCFAC DFAILT DFAILC EPS
Card 6 XC XT YC YT SC CRIT BETA
Card 7 PFL EPSF EPSR TSMD SOFT2
Card 8 SLIMT1 SLIMC1 SLIMT2 SLIMC2 SLIMS NCYRED SOFTG
Card 9 LCXC LCXT LCYX LCYC LCSC DT
26

In Table 5.3 there is a short description of each parameter in MAT54. The more important parameter will beexplained further in this section.
Table 5.3: Description of input parameters in MAT54/MAT55
Variable Definition
MID Material identification number
RO Mass density
EA Young’s modulus in longitudinal direction, Ea
EB Young’s modulus in transverse direction, Eb
(EC) Young’s modulus in normal direction, Ec. Not used in MAT54/55!
PRBA Minor Poisson’s ratio, νba
PRBC Minor Poisson’s ratio, νbc
(PRCB) Minor Poisson’s ratio, νcb. Not used in MAT54/55!
GAB Shear modulus Gab
GBC Shear modulus Gbc
GCA Shear modulus Gca
(KF) Bulk modulus of failed material. Not used in MAT54/55!
AOPT Material direction option
A1, A2, A3 Components of vector A, for AOPT=2
MANGLE Material angle, for AOPT=0.
V1, V2, V3 Components of vector V, for AOPT=3
D1, D2, D3 Components of vector D, for AOPT=2
DFAILM Maximum strain for matrix straining in both tension and compres-sion
DFAILS Maximum tensorial shear strain
TFAIL Time step size for element deletion
ALPH Shear stress parameter for non linear term
SOFT Softening reduction factor for material strength in crashfront ele-ments.
FBRT Softening parameter for fiber tensile strength after failure hasoccurred in compressive matrix mode
YCFAC Reduction factor for compressive fiber strength after failure hasoccurred in compressive matrix mode
DFAILT Maximum strain for fiber tension
DFAILC Maximum strain for fiber compression
EFS Effective failure strain
XC Longitudinal compressive strength
XT Longitudinal tensile strength
YC Transverse compressive strength
Continued on next page
27

Table 5.3 – Continued from previous page
Variable Definition
YT Transverse tensile strength
SC Shear strength
CRIT Failure criteria to use (MAT54 Chang-Chang criterion, MAT55Tsai-Wu criterion)
BETA Weighing factor for shear term in tensile fiber mode
PFL Percentage of layer needed to fail until crashfront is initiated andstrength is reduced in neighboring elements
EPSF Damage initiation transverse shear strain
EPSR Final rapture transverse shear strain
TSMD Transverse shear maximum damage
SOFT2 Optional orthogonal softening reduction factor. When active,SOFT becomes parallel reduction factor
SLIMT1 Factor to determine minimum stress limit after maximum stressoccurred for fiber tension
SLIMC1 Factor to determine minimum stress limit after maximum stressoccurred for fiber compression
SLIMT2 Factor to determine minimum stress limit after maximum stressoccurred for matrix tension
SLIMC2 Factor to determine minimum stress limit after maximum stressoccurred for matrix compression
SLIMS Factor to determine minimum stress limit after maximum stressoccurred for shear
NCYRED Number of cycles for stress reduction from maximum to minimumstress
SOFTG Softening reduction factor for transverse shear stiffness for crash-front elements
LCXC Load curve ID for XC vs strain rate. Will override parameter XC
LCXT Load curve ID for XT vs strain rate. Will override parameter XT
LCYC Load curve ID for YC vs strain rate. Will override parameter YC
LCYT Load curve ID for YT vs strain rate. Will override parameter YT
LCSC Load curve ID for SC vs strain rate. Will override parameter SC
DT Strain rate averaging option
28

The LS-DYNA theory manual [20] and keyword manual [19] do not contain detailed information on how to usethe model parameters. Thus it is important to provide additional explanations and recommendations here.
Failure strains
The strain-to-failure criterion is active if the maximum strains are defined in the material card. It is alwaysrecommended to specify the maximum strains, since the elements are not deleted otherwise. The maximumstrains are defined for all in-plane directions: DFAILT for maximum fiber tension, DFAILC for maximum fibercompression, DFAILS for maximum tensorial shear strain and DFAILM for maximum matrix straining. Notethat the maximum matrix strain is defined for both tension and compression. The matrix strain limit is oftendifferent in tension and compression for ordinary composite materials, thus the choice of DFAILM must beestimated if two of these limits are known for the material. The maximum strains have to be higher than the”failure strain” in order not to affect the Chang-Chang criterion. By definition DFAILC must be negative andall other maximum stresses positive.
Residual stresses
In addition to the ideal plastic behavior a residual stress can be defined in all directions: SLIMT1 for thefiber tension, SLIMT2 for matrix tension, SLIMC1 for fiber compression, SLIMC2 for matrix compression andSLIMS for shear. After the failure criterion is reached the stress will drop down to the residual stress instead ofmaintaining its maximum stress level.
CRIT
The CRIT parameter in the material card controls which of the two failure criterion is used. If the Chang-Changcriterion is used the material card is called MAT54 and MAT55 if the Tsai-Wu criterion is used. It is, at thetime of publication of this report, recommended to use MAT54 instead of MAT55, since not all of the mostrecent enhancements has been implemented in MAT55 yet (version R7.0) [21].
TFAIL
Element deletion is controlled by either the Chang Chang failure criterion or the maximum strains, if theseparameters are active in the material card. The model parameters, TFAIL, offers an additional way of elementdeletion. In general, highly distorted elements that do not carry any load are not deleted by the failure criterion.To handle highly distorted elements in the analysis, a very small time step is required. The simulation willthus be costly and the time step can decrease rapidly. As a remedy, TFAIL can be activated to take the timestep in considered for element deletion. Further more, it should be remarked that the crashfront algorithmonly works if TFAIL is greater than zero. Without the crashfront algorithm the softening reduction factorSOFT is inactive. It is recommended to always have TFAIL active, even if additional element deletion is notrequired in the simulation. TFAIL can either be defined in units of time or as quotient of the initial time stepin the simulation. Costly elements which requires a time step beneath the TFAIL condition are deleted. Theinitial time step set by LS-DYNA will give a rough indication of time steps used throughout the simulation andTFAIL should be set to a much smaller value.
tfail ≤ 0 No element deletion by time step size.
0 < tfail < 0.1 TFAIL is defined in units of time. Elements are deleted when their
required time step is smaller than TFAIL.
tfail ≥ 0.1 TFAIL is defined as a quotient of the initial time step. Elements are
deleted when their required time step causes the quotient between
the current time step and the initial time step to be lower than TFAIL.
29

ALPH
In plane-stress, which is used with a modification in MAT54, the strain is expressed as a function of the stressterms. An additional shear term is added to the plane-stress condition, according to Equation 5.6. The ALPHvariable is a weight factor for the non-linear shear stress term and shown as α in Equation 5.6 below. Theα factor could be measured experimentally in the range of 0 < α ≤ 1, but is calibrated by a trial and errorapproach, since no such test have been performed. In the current work, where the test specimen is crushedaxially the shear stress does not have a big influence.
ε1 = 1E1
(σ1 − ν1σ2)
ε2 = 1E2
(σ2 − ν2σ1)
2ε12 = 1G12
τ12 + ατ312
(5.6)
SOFT
A important parameter with a great influence on the result is the softening reduction factor, SOFT. It reducesthe material strength in the elements immediately behind of the crashfront. Elements sharing same nodesas one of the deleted elements will get reduced strength. How the strength reduction is implemented is notspecified in the LS-DYNA manuals, [18, 19]. According to Feraboli et al. in [22] the strength reduction isimplemented according to Equation 5.7.
[X ′T , X′C , Y
′T , Y
′C ] = SOFT ∗ [XT , XC , YT , YC ]
where 0 < SOFT ≤ 1(5.7)
The default SOFT value is 1, i.e no strength reduction, and the strength is reduced as the SOFT value islowered. The value of SOFT needs to be found by trial and error.
Figure 5.3 illustrates the spread of the SOFT parameter. In Figure 5.3a, three elements in a uniform meshare damaged. When the elements are removed, the crashfront algorithm will be activated and the softeningfactor will affect the neighboring elements, see Figure 5.3b. SOFT is an unphysical parameter, but the strengthsoftening could be seen as a way to imitate the effect of delamintion and other fracture mechanisms. In crushsimulation SOFT can prevent global buckling and promote progressive crushing behavior. The reaction forceand the energy in the system are then lowered, since the crashfront elements can not maintain the same amountof stress as their original strength.
(a) (b)
Figure 5.3: Illustration of the how the strength softening is initiated. (a) Elements are damage and will bedeleted according the their strain limit. (b) Spread of crashfront algorithm with initiated strength softening.
The impact of the SOFT parameter is highly dependent on the shape of the mesh. With a uniform mesh,where many elements are in contact at the same time, the crashfront algorithm will spread rapidly along anelement row and the SOFT parameter will have significant influence on the result. Elements are removed rowby row. If the mesh has a more random pattern, the crashfront algorithm will not spread so easily and theSOFT parameter will have a reduced effect.
An optional ”orthogonal” softening reduction factor, SOFT2, can also be defined. If SOFT2 is active, theSOFT parameter will only reduce the strength ”parallel” to the crash direction while the SOFT2 parameterreduces the strength ”orthogonal” to the crash direction, see Figure 5.4. Elements in between the SOFT and
30
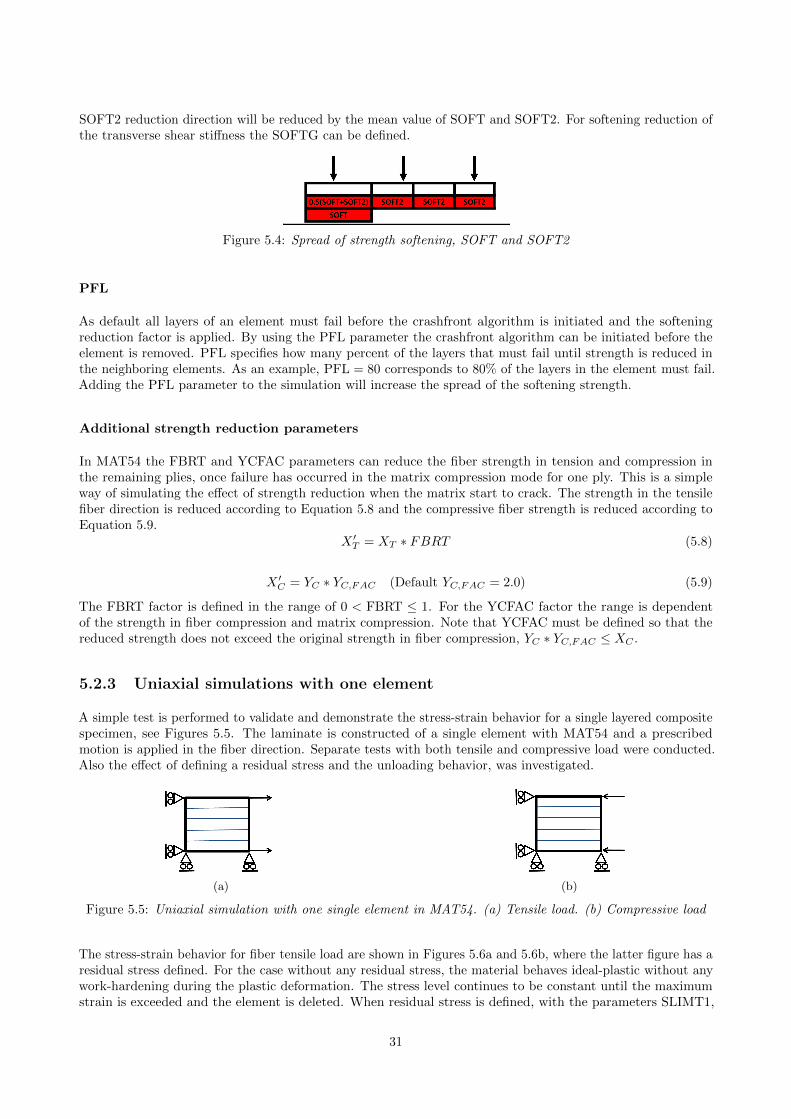
SOFT2 reduction direction will be reduced by the mean value of SOFT and SOFT2. For softening reduction ofthe transverse shear stiffness the SOFTG can be defined.
Figure 5.4: Spread of strength softening, SOFT and SOFT2
PFL
As default all layers of an element must fail before the crashfront algorithm is initiated and the softeningreduction factor is applied. By using the PFL parameter the crashfront algorithm can be initiated before theelement is removed. PFL specifies how many percent of the layers that must fail until strength is reduced inthe neighboring elements. As an example, PFL = 80 corresponds to 80% of the layers in the element must fail.Adding the PFL parameter to the simulation will increase the spread of the softening strength.
Additional strength reduction parameters
In MAT54 the FBRT and YCFAC parameters can reduce the fiber strength in tension and compression inthe remaining plies, once failure has occurred in the matrix compression mode for one ply. This is a simpleway of simulating the effect of strength reduction when the matrix start to crack. The strength in the tensilefiber direction is reduced according to Equation 5.8 and the compressive fiber strength is reduced according toEquation 5.9.
X ′T = XT ∗ FBRT (5.8)
X ′C = YC ∗ YC,FAC (Default YC,FAC = 2.0) (5.9)
The FBRT factor is defined in the range of 0 < FBRT ≤ 1. For the YCFAC factor the range is dependentof the strength in fiber compression and matrix compression. Note that YCFAC must be defined so that thereduced strength does not exceed the original strength in fiber compression, YC ∗ YC,FAC ≤ XC .
5.2.3 Uniaxial simulations with one element
A simple test is performed to validate and demonstrate the stress-strain behavior for a single layered compositespecimen, see Figures 5.5. The laminate is constructed of a single element with MAT54 and a prescribedmotion is applied in the fiber direction. Separate tests with both tensile and compressive load were conducted.Also the effect of defining a residual stress and the unloading behavior, was investigated.
(a) (b)
Figure 5.5: Uniaxial simulation with one single element in MAT54. (a) Tensile load. (b) Compressive load
The stress-strain behavior for fiber tensile load are shown in Figures 5.6a and 5.6b, where the latter figure has aresidual stress defined. For the case without any residual stress, the material behaves ideal-plastic without anywork-hardening during the plastic deformation. The stress level continues to be constant until the maximumstrain is exceeded and the element is deleted. When residual stress is defined, with the parameters SLIMT1,
31

the stress will drop to the defined residual stress after failure is initiated and keep a constant stress level untilthe element is deleted by the maximum strain limit.
(a) (b)
Figure 5.6: Stress-strain behavior in tensile fiber direction. (a) Stress-strain behavior in fiber direction - Tensileload. (b) Tensile load and residual stress (SLIMT1) defined.
In Figure 5.7, the stress-strain relation during compressive fiber load is shown, without and with residual stress.The same ideal-plastic behavior is shown in all directions. Since the strength and failure modes are differentdepending on the direction, the stress levels will differ as well.
(a) (b)
Figure 5.7: Stress-strain behavior in compressive fiber direction. (a) Compressive load. (b) Compressive loadwith residual stress (SLIMC1) defined.
A cyclic load case has also been tested, in order to investigate the unloading behavior. If the element isallowed to unload, the failure criteria will be deactivated since the stress is decreased. The previous damagedparameters are then set to an undamaged state, and the unloading will follow the elastic material parameters.In Figure 5.8a the element is stretched until failure occurs in tensile fiber mode. During the ideal-plasticstress-strain behavior, the element is allowed to unload. When the element is stretched again, the stress willincrease elastically until the element fails according to the tensile failure mode.
If the same cyclic test is carried out with a residual stress defined, the unloading will differ from the ideal-plasticcase, see Figure 5.8b. The unloading will occur with a lowered Young’s modulus, thus allowing the strain thereach the same level as in the ideal-plastic case.
(a) (b)
Figure 5.8: Stress-strain behavior in tensile fiber direction during unloading. (a) Unloading in a ideal-plasticstate. (b) Unloading during a state with residual stress (SLIMT1).
32

This smooth and controlled stress strain behavior can only be seen with a few elements and with a stack-up ofonly one ply. If many elements interact, only some of the elements will experience damage while others willunload elastically and never reach the maximum stress. When the stack-up is increased to a few layers, some ofthe layers will reach failure before others and some of the elastic material parameters are degraded, affectingthe global element strain and stress levels. The stress and strain behavior is then chaotic with both unloadingand material degradations. The behavior is then to hard to analyze.
5.2.4 Tensile dog-bone simulations with different element sizes
To investigate the mesh sensitivity of MAT54, a small tensile dog-bone test was performed, see Figure 5.9a.The specimens are fixed at the left boundary and pulled with a prescribed velocity in the x-direction on theright boundary. In the waist of the three specimens a 2x2 mm big square is placed. Each square has samematerial definition, but is meshed with three different elements sizes: 4 elements with the size of 1x1 mm2, 9elements with the size of 0.67x0.67 mm2 and 16 elements with the size of 0.5x0.5 mm2.
In Figure 5.9b, the deformed shape of the specimens is shown during a certain time step in the simulation,where the specimen with the big elements in its waist is still intact while the specimens with the smallerelements in the waist has failed. This is a clear evidence that the simulation with MAT54 is mesh dependent,when small elements will experience failure earlier than larger elements.
(a) (b)
Figure 5.9: Tensile dog-bone test with different element sizes using MAT54. (a) Undeformed state, beforeapplied load. (b) Deformed state, during applied load.
In Figure 5.10a, the absorbed energy for each square in the waist of the three specimens is shown as a functionof the displacement. The energy added to the system is increased as the specimens are stretched. Since themeasured elements in the waist are cut off from the moving boundary condition, no more energy will be addedto the system. One can easily see that the specimen with the smallest element size in the waist has failed firstat a very low energy level, then the middle sized elements and last the largest elements. The mesh dependencyis an effect of the lack of length scaling, when computing the stress strain relation for each element, furtherdiscussed in Subsection 5.3.4. This is seen in Figure 5.10b where all three element sizes will have the exactsame stress strain relation, i.e. increase elastic until the failure condition is reached and then ideal plasticuntil the maximum strain limit. Due to localization only some of the elements will take damage according tothe Chang Chang criterion. The other elements will stay in the elastic zone and unload, when the damagedelements fail according to their maximum strain limit.
In Figure 5.10c, the force needed to stretch each specimen is shown. The stress levels and the cross-sectionareas are the same for all specimens, giving the same force-displacement relation independent of element size.However, since a large element can withstand a larger displacement before the strain limit is reached, the forceis allowed to operate over a long period compared to a small element.
33

(a) (b)
(c)
Figure 5.10: Result from tensile dog-bone test for elements of different sizes in MAT54. (a) Absorbed energyin each Part ID. (b) Stress-Strain behavior for elements of different sizes. (c) Force needed to stretch eachspecimen.
According to these findings the energy needed to simulate a crack propagation through the specimen willdecrease, when the resolution of the mesh is refined. This mesh dependency is often noted for material modelswithout regularization.
5.2.5 Implementation of MAT54 in crush simulations
The baseline model with MAT54 implemented, which is used to simulate the performed crushing test, isdescribed in the following section. The setup of the simulation model is described in Subsection 5.1.1 and thissection aims to describe more detailed material card specific issues for MAT54.
The first approach of finding a baseline model was an uniform mesh with an element size of 1x1mm2. Theprogressive failure behavior could be trimmed such that the trigger row was first to be deleted, thus initiatingthe strength reduction parameter SOFT in the neighboring elements of the crashfront, see Figure 5.11a, wherethe elements experiencing strength reduction is shown in red. When the strength is reduced in the elementrow closest to the contact, a progressive row-by-row failure process is achieved. Since a whole element row isdeleted at approximately the same time, the laminate will loose contact with the ground. The reaction force,measured in the contact condition, will reach a peak value when the laminate is in contact with the ground anddrop to zero when a row is deleted, see Figure 5.11b. The reaction force will then stay at zero for a short while,until the laminate comes into contact again. This progressive row-by-row failure is achieved by calibrating thereduction parameters YCFAC, FBRT, SOFT and maximum strain limits, by trial and error. The simulationwith the uniform mesh is very sensitive and a small change can lead to a failed simulation.
34

(a) (b)
Figure 5.11: Result from simulations on a uniform mesh with MAT54. (a) Crashfront in an uniform mesh. (b)The reaction force goes to zero.
The oscillatory progressive behavior, where the load is periodically dropped to zero, do not correspond to theexperimental behavior and can introduce additional shockwaves and vibration to the simulation. In an attemptto achieve a more even crushing, the element size was reduced to 0.5x0.5mm2. This mesh refinement however,did not lead to an improvement in the results. Since MAT54 is mesh dependent the behavior of the coarsemodel could not be transferred directly to the new finer mesh and the parameters had to be adjusted again.The simulations with the finer mesh exhibited a higher sensitivity level and the failure could not be confined tothe contact between the laminate and the ground. Instead the failure had a tendency to propagate fast throughan element row either close to the prescribed motion at the top of the laminate, hence cutting off the boundarycondition, or cutting of a random row at the center of the laminate.
A successful attempt to get a more even progressive row-by-row failure, where the load never drops down tozero, has been made in other work by [3] by introducing an user-defined contact. The contact is defined sothat several element rows are in contact with the ground at the same time, thus never losing contact when anelement row is removed. This is done by manually defining a reaction force as a function of the penetration inthe contact. Since this project aims to mimic industrial needs, where such contacts can not be used in crashanalysis, the user defined contact was left out. A predefined standard contact, applicable for crash simulations,was used throughout this project.
Naturally, a simple way of maintaining a non-zero reaction force is to always have elements in contact with theground. By adopting an irregular discretization of the specimen, thus removing the possibilities of row-by-rowfailure, a continuous progressive behavior was achieved. Tests with both a complete random mesh, attainedby using triangular elements, and an irregular mesh using quadratic elements, attained by a manual meshedlayout, was successful.
The irregular mesh with quadratic elements was used in the baseline model and its irregular mesh can be seenin Figure 5.12. The mesh is symmetric about a vertical centerline, with each element row inclined towards thecenter of the laminate. By constructing the mesh this way, it was possible to avoid that a whole element rowcomes into contact with the ground at the same time. Please note however that the trigger row is kept as anuniform mesh, since its intention is to trigger the failure behavior over the whole crushing front. In total 5266quadratic elements was used in the model with an addition of 32 triangular elements in order to fill intricatespaces. The element size is approximately 1x1 mm2.
35

Figure 5.12: Irregular mesh with quadratic shell elements
The numerical values used in material card MAT54 for the baseline model can be seen in Table A.1 in AppendixA. From experience of the current project, it appears as if as long as the model exhibit a stable behavior manyof the model-parameters can be combined in a different way and still reach a good correlation to the test data.In this baseline model the strength reduction parameters has been kept to a minimum in order not to lower thereaction force to much. The aim of the calibration of the material parameters was to obtain a stable crushingwith periodic oscillations and low amplitude. This was achieved with the SOFT parameter set to 5% strengthreduction. A low strength reduction in comparison with the uniform mesh, which needed a strength reductionin about 40% to achieve a progressive behavior. The FBRT and YCFAC were set to 10% and ∼19% fiberstrength reduction respectively, when the compressive matrix mode is activated. Note that the maximumstrains had to be set to 10% to achieve a good behavior.
5.2.6 Crush simulation using baseline model with MAT54
The chosen baseline model has a continuous progressive failure behavior and a good correlation with the testdata. Illustrations of the crushing behavior in the simulation can be seen in Figure 5.13, where the elementsaffected by SOFT are shown in red. Since the mesh is irregular, approximately half of the elements in contactwith ground are deleted, while the other half stays in contact, produces a reaction force that will never go downto zero. The baseline model is much more stable than simulations with the uniform mesh. Material parameterscan be changed in a greater interval without a failed simulation, e.g. buckling or an exploded laminate.
(a) (b)
36

(c) (d)
Figure 5.13: Simulation with the baseline model with MAT54. (a) Before crushing. (b) Trigger row removed.(c) Continues progressive behavior. (d) Simulation ended.
The reaction force, measured as the sum of all nodal forces in the contact, can be seen in Figure 5.14a. Exceptfor the initial peak, where the trigger row is deleted, the correlation with the test data is very good, eventhough the oscillations in the simulation have a larger amplitude. The same goes for the energy introduced tothe system, seen in Figure 5.14b. The initial force peak causes an initial increase of the energy in the system.After the trigger row is removed, the rate of the energy absorption is consistent with the experiment.
(a) (b)
Figure 5.14: Result from the baseline model using MAT54. (a) Reaction force. (b) Energy absorption in thesystem.
Sensitivity of material parameters and setup of simulation model
The sensitivity of the failure modeling parameters in MAT54 has been investigated. A parameters study, wherethe baseline model is changed with one parameter at a time, has been performed. The result can be seenSection A.2 in Appendix A. The result can be summarized as follows. The most influential parameters areSOFT, YCFAC and the failure strain limits. A lowered value of the parameter SOFT will decrease the reactionforce and the absorbed energy in the simulation. Too low values can cause instabilities. The fiber strengthreduction parameters YCFAC exhibit a similar effect on the simulation as the SOFT parameter and has a biginfluence of the result. The failure strains are vital parameters to specify correctly. A too low strain limitgive catastrophic failure and high strain limits give increased reaction force and energy absorption, since theelements are kept longer. Residual stresses could be an effective way of tuning the reaction force and energy inthe simulation.
The sensitivity of the setup of the simulation model was investigated for different velocities and triggers. Theresult can be seen in Section A.3 in Appendix A. A notable difference could be seen for different velocities, butthe simulation time can be reduced greatly. The thickness and the strength of the trigger have a big effect ofthe failure initiation. However, the behavior is hard to control and the force peak can not be decreased enoughto correlate well with the test data.
37

5.2.7 Investigation of mesh dependency in crush simulations with MAT54
To further verify the mesh dependency of MAT54, a comparison of four different mesh layouts is presentedhere, see Figure 5.15:
• Uniform mesh layout with quadratic shell elements, with an element size of 1x1 mm2
• Uniform mesh layout with quadratic shell elements, with an element size of 0.5x0.5 mm2
• Random mesh layout, achieved by using only triangular shell elements, with a side length of 1.5 mm
• The baseline model with its irregular mesh was added for comparison, approximately 1x1 mm2
All simulations were performed with the same setup and material parameters (baseline values). The onlydifference in this investigation was the layout of the mesh.
(a) (b)
(c) (d)
Figure 5.15: Comparison of 4 different mesh layouts using the same material data in MAT54. (a) UniformQuadratic mesh 1x1mm2. (b) Uniform Quadratic mesh 0.5x0.5mm2. (c) Baseline model - Irregular Quadraticmesh 1x1mm2. (d) Triangular mesh with a side length of 1.5 mm.
Both the simulations with the uniform mesh had the failure initiated in the crushing front. However, after ashort time interval the failure starts to propagate at the top element row where the motion is prescribed, thuseventually removing the effect of the boundary condition, as can be seen in Figure 5.15a and 5.15b. In thesimulation with the triangular mesh a continuous progressive failure was achieved.
In Figure 5.16, the reaction forces and the absorbed energies are compared for the different cases. The reactionforce for the two cases with uniform mesh is dropped to zero, as the failure has propagated through the toprow and laminate is no longer in contact with the ground. No more energy is then introduced to the system.
The model with triangular mesh shows a stiffer response than the baseline model but has a stable crushingbehavior. However, the crash front algorithm never became active during the simulation, due to the random
38

mesh. Hence, the simulation with the triangular mesh do not experience any strength reduction by the SOFTparameter.
(a) (b)
Figure 5.16: Comparison of the results from the different mesh layouts with MAT54. (a) Reaction force. (b)Absorbed energy.
Tuned parameters with triangular elements
By adjusting the strength and strain parameters, the triangular mesh can be trimmed to have good correlationwith the test data. The reaction force and the energy response for such a modified model with a triangularmesh and adjusted parameters are shown in Figure 5.17.
(a) (b)
Figure 5.17: Result from triangular mesh with adjusted parameters in MAT54. (a) Reaction force. (b) Absorbedenergy.
39

5.3 Simulation with MAT262 - Laminated fracture Daimler Ca-manho
MAT262 is one of the most advanced composite material model in LS-DYNA and utilizes a physically basedfailure criterion. The failure criterion is based on theory from Camanho et al. [23, 24] which is a continuumdamage model where the constitutive relation is degraded with an exponential evolution law. However, MAT262exhibits a linear or bi-linear degradation and the implementation of the degradation scheme is not explainedin the theory manual. The degradation is activated by a set of damage activation functions, working in fourfailure modes described in Section 3.2. When an activation function is active the degradation law start to actin the corresponding direction.
A bi-linear, for fiber direction, and linear, for matrix direction, softening evolution is available for the stressstrain behavior. For shear, a non-linear behavior with hardening can be defined. The softening evolutionis based on fracture toughness, i.e. the energy needed for a material containing a crack to resist fracture.In addition a crashfront algorithm with a softening strength parameter can be implemented, as in MAT54.MAT262 is compatible with shells, thick shells and solids.
5.3.1 Theory of failure model and degradation scheme in MAT262
The failure model used by MAT262 is an orthotropic continuum damage model. The failure mechanisms arerepresented with a set of scalar damage variables in each ply. When failure is activated, the scalar damageparameters are reduced exponentially, in an interval of dM ∈ [0, 1], where (M = 1+, 1−, 2+, 2−, 6), dM = 0is undamaged and dM = 1 is fully damaged. It should be remarked that the evolution of damage in eachfailure mode is governed by a so-called smeared crack model, activated by the activation functions mentionedabove. The basic underlying assumption is that failure occurs in a cohesive manner forming a crack alonga critical failure plane, the orientation of which is determined by the angle that maximizes the respectiveactivation function. This cohesive behavior is then smeared of the entire element by scaling the associatedfracture toughness with the characteristic element length as discussed in Subsection 5.3.2 below. For completedetails of the model, please refer to [23, 24].
The damage variables, d1+ and d1−, are associated with tensile and compressive fiber failure, whereas the, d2+and d2−, damage parameters is associated with the transverse matrix cracking due to tensile and compressiveload. The shear damage parameter, d6, damage variable is influenced by longitudinal and transverse cracks.The contribution from tensile and compressive damage, for each failure mode, can never occur simultaneousaccording to Equation 5.10. The damage is either due to tensile load or due to compressive load for each mode.
d1 = d1+〈σ11〉|σ11|
+ d1−〈−σ11〉|σ11|
d2 = d2+〈σ22〉|σ22|
+ d2−〈−σ22〉|σ22|
(5.10)
The damage parameters are included in the compliance tensor in the constitutive law, thus reducing thematerial parameters and affecting the global material properties. In Equation 5.11, the constitutive law isshown, which couples the effective stress tensor, σ, to the strain, ε. The damage parameters are included in thelamina compliance tensor represented in Voigt notation in Equation 5.12.
σ = H−10 : ε (5.11)
Where
H =
1
(1− d1)E1−ν21
E20
−ν12
E1
1
(1− d2)E20
0 01
(1− d6)G12
(5.12)
40

If the fully damaged state is reached for one of the failure modes the integration point is removed for that ply.
Damage occur when the activation functions φM (M = 1+, 1−, 2+, 2−, 6) are activated, see Equation 5.15 to5.19. The activation functions represent each of the four failure modes described in Section 3.2.
The activation function for the tensile fiber mode is derived from a maximum allowable strain criterion, withthe effective stress tensor σ computed from the constitutive law.
The activation function for compressive fiber failure assumes that a kink band is triggered, under the circumstancethat the lateral support given from the surrounding matrix to the fibers, has failed due to the compressivestress. The fiber misalignment is caused by the kink band formation and is included in the failure conditionby the stress tensor, σm, transformed into the angle, ϕ, of the fiber misalignment, see Equation 5.16. Anillustration of the fiber kinking and the stress represented in the fiber misalignment, can be seen in Figure 5.18.
Figure 5.18: Kinkband stress tensor
In the tensile matrix mode the fracture occurs in a plane perpendicular to the loading direction, i.e. with afracture angle of 0◦. The transverse crack grows by a combination of the in-plane shear and the transversetensile stress. For the compressive matrix mode the fracture angle is assumed to be α0=53◦, included inEquation 5.22. The failure is dependent of the effective shear stresses, τeff , acting on the fracture planetogether with a friction coefficient and the fracture angle.
In Equation 5.13 to 5.22 the activation functions and damage evolutions are presented for each failure mode.Note that only the basics of the model are described in this section. For more detailed information regardingall constituent parameters, cf. [23, 24].
Tensile fiber mode:
φ1+ =σ11 − ν12σ22
XT
φ1+ > 1 failure activated
φ1+ ≤ 1 no failure(5.13)
Softening evolution of damage parameter, when failure is activated:
d1+ = 1− (1− dL1+)(1− dE1+) (5.14)
Compressive fiber mode:
φ1− =
⟨|σm
12| − ηLσm22
⟩SL
φ1− > 1 failure activated
φ1− ≤ 1 no failure(5.15)
Where the kinking stress is computed as:
σm22 = σ11sin
2(ϕC) + σ22cos2(ϕC)cos(ϕC)− 2|σ12|sin(ϕC)cos(ϕC)
σm12 = (σ22 − σ11)sin(ϕC)cos(ϕC) + |σ12|(cos2(ϕC)− sin2(ϕC))
(5.16)
Softening evolution of damage parameter, when failure is activated:
d1− = 1− 1
r1−exp[A1−(1− r1−)] (5.17)
41

Tensile matrix mode:
φ2+ =
√(1− g)
σ22
YT+ g
(σ22
YT
)2
+
(σ12
SL
)2 φ2+ > 1 failure activated
φ2+ ≤ 1 no failurefor σ22 ≥ 0 (5.18)
φ2+ =
⟨|σ12| − ηLσ22
⟩SL
φ2+ > 1 failure activated
φ2+ ≤ 1 no failurefor σ22 < 0 (5.19)
Softening evolution of damage parameter, when failure is activated:
d2+ = 1− 1
f2+(r2+)exp[A2+(1− f2+(r2+))] (5.20)
Compressive matrix mode:
φ2− =
√√√√(τeffT
ST
)2
+
(τeffT
ST
)2 φ2− > 1 failure activated
φ2− ≤ 1 no failure(5.21)
where the kinking shear is computed as:
τTeff = 〈−σ22cos(α0)[sin(α0)− ηT cos(α0)cos(θ)]〉
τLeff = 〈cos(α0)[|σ12|+ ηLσ22cos(α0)sin(θ)]〉(5.22)
Softening evolution of damage parameter, when failure is activated:
d2− = 1− 1
r2−exp[A2−(1− r2−)] (5.23)
Where the additional variables, stated in [23, 24], used in the fracture model are:
• XT , XC , YT , YC , SL are the material strength in all directions
• dL1+, dE1+ are auxiliary damage variables
• φC is the misalignment angle
• AM (M = 1+, 1−, 2+, 2−, 6) are constants defining the exponential law
• rM (M = 1+, 1−, 2+, 2−, 6) are auxiliary threshold variables
• g is the fracture toughness ratio
• θ is the sliding angle
• ηL, ηT are friction coefficients
• f2+ is a forced softening parameter
The scalar damage parameters for longitudinal, d1+, d1−, and transverse, d2+, d2−, failure modes are onlydegraded when their corresponding activation function experience failure. The shear damage parameter, d6, isdegraded if any of the four activation functions are active. Its exponential softening evolution can be seen inEquation 5.24.
d6 = 1− 1
r2−exp[A6(1− r2+)] (5.24)
42

5.3.2 Description of material card MAT262
The material card for MAT262 has eight data block colons and seven rows, presented in Table 5.4. The blueparameters are elastic orthotropic material parameters for the longitudinal, transverse and normal direction.The red parameters control the material coordinate system for each element.
The green parameters are model parameters. Flags to control the failure behavior are defined in card 2.Strength parameters and fracture toughness for different directions can be found in card 4 and 5. Card 6consists of the strength and the fracture toughnesses defining the bi-linear behavior in the fiber direction. Thenon-linear shear behavior and strength softening parameters are defined in card 7.
Table 5.4: Material card MAT262
Card 1 MID RO EA EB EC PRBA PRCA PRCB
Card 2 GAB GBA GCA AOPT DAF DKF DMF EFS
Card 3 XP YP ZP A1 A2 A3
Card 4 V1 V2 V3 D1 D2 D3 MANGLE
Card 5 GXC GXT GYC GYT GSL GXCO GXTO
Card 6 XC XT YC YT SL XCO XTO
Card 7 FIO SIGY ETAN BETA PFL PUCK SOFT
In Table 5.5 there is a short description of each parameter in MAT262, cf. [25]. The more important parameterwill be explained further in this section.
Table 5.5: Description of input parameters in MAT262
Variable Definition
MID Material identification number
RO Mass density
EA Young’s modulus in longitudinal direction, Ea
EB Young’s modulus in transverse direction, Eb
EC Young’s modulus in normal direction, Ec
PRBA Minor Poisson’s ratio, νba
PRBC Minor Poisson’s ratio, νbc
PRCB Minor Poisson’s ratio, νcb
GAB Shear modulus Gab
GBC Shear modulus Gbc
GCA Shear modulus Gca
AOPT Material direction option
DAF Flag to control if an integration point should fail based on longitu-dinal (fiber) tensile failure or not
DKF Flag to control if an integration point should fail based on longitu-dinal (fiber) compressive failure or not
Continued on next page
43

Table 5.5 – Continued from previous page
Variable Definition
DMF Flag to control if an integration point should fail based on trans-verse (matrix) failure or not
EFS Maximum effective strain for element layer failure
XP, YP, ZP Coordinates of point p for AOPT=1 and AOPT=4
A1, A2, A3 Components of vector A, for AOPT=2
V1, V2, V3 Components of vector V, for AOPT=3
D1, D2, D3 Components of vector D, for AOPT=2
MANGLE Material angle, for AOPT=0 and AOPT=3
GXC Fracture toughness for longitudinal compressive failure mode
GXT Fracture toughness for longitudinal tensile failure mode
GYC Fracture toughness for transverse compressive failure mode
GYT Fracture toughness for transverse tensile failure mode
GSL Fracture toughness for in-plane shear failure
GXCO Fracture toughness for longitudinal compressive failure mode todefine bi-linear damage evolution
GXTO Fracture toughness for longitudinal tensile failure mode to definebi-linear damage evolution
XC Longitudinal compressive strength
XT Longitudinal tensile strength
YC Transverse compressive strength
YT Transverse tensile strength
SL Shear strength
XCO Longitudinal compressive strength at inflection point to define abi-linear damage evolution
XTO Longitudinal tensile strength at inflection point to define a bi-lineardamage evolution
FIO Fracture angle in pure transverse compression, default=53◦
SIGY In-plane shear yield stress
ETAN Tangent modulus for in-plane shear plasticity
BETA Hardening parameter for in-plane shear plasticity. Regulates themix between kinematic and isotropic hardening
PFL Percentage of layer needed to fail until crashfront is initiated andstrength is reduced in neighboring elements
PUCK Flag for evaluation and post-processor of Puck’s inter-fiber-criterion
SOFT Softening reduction factor for material strength in crashfront ele-ments.
44

Implementation of fracture toughness
The damage caused by the crack growth is localized in a narrow band close to the crack, cf. also the discussionabove. When using finite elements it is important that the energy needed to withstand the crack, i.e. thefracture toughness, is the same regardless of the size of the elements in which the crack propagates. Oneapproach to achieve this (approximately) is by scaling the fracture toughness, GM (the energy per unit areaassociated with propagating a crack) with a characteristic length of the finite element, l∗, thus computing theenergy dissipated per unit volume for each element, gM , seen in Equation 5.25. The index M stands for eachfailure direction for tension or compression.
gM =GM
l∗, M = 1+, 1−, 2+, 2−, 6 (5.25)
For quadratic shell elements, the characteristic length is defined according to Equation 5.26. The characteristiclength is dependent on the area associated with the integration points of the element, AIP , and the angle ofthe mesh line with the crack direction, γ.
l∗ =
√AIP
cos(γ), where |γ| ≤ 45◦ (5.26)
The dissipated energy is used to define an area beneath the stress strain curve, thus introducing an element sizedependency to the stress strain relation. The fracture toughness is defined separately for each failure mode. Abi-linear stress strain behavior can be defined for both tensile and compressive fiber failure. Two values for thefracture toughness is then defined e.g. GXT and GXTO, giving two areas beneath the stress strain curve, seeFigure 5.19a. A inflection point stress, XTO is then required to control the boundary between the two areas.
For modeling matrix failure a linear stress strain softening behavior is used, thus only one fracture toughnessvalue is needed, see Figure 5.19b. The in-plane shear exhibits a ductile behavior and can be defined with ayield stress, SIGY , a tangential stiffness, ETAN , and a hardening parameter, BETA, see Figure 5.19c.
(a) (b) (c)
Figure 5.19: Stress strain behavior in MAT262. (a) Fiber direction. (b) Matrix direction. (c) Shear direction.
45

Critical finite element length
If the element size is set too large snapback can occur, resulting in a failed simulation. Snapback occurs whenthe strain is forced to be reduced even though the element is supposed to be elongated, due to the loading.Therefore a critical relation exists between the characteristic element length, Young’s moduli, fracture toughnessand strength. The critical finite element size is defined according to Equation 5.27
l∗ ≤ 2EMGM
X2M
, M = 1+, 1−, 2+, 2−, 6 (5.27)
Strength reduction parameters
The softening reduction factor for material strength, SOFT, is used to reduce the strength of the elementsimmediately behind the crashfront. The SOFT parameter is used when a crashfront algorithm is active.The PFL parameter define, in percent, how many of the plies in an element that must fail before the SOFTparameter is spread to the neighboring elements. The PFL and SOFT parameters are the same as thosedescribed in Subsection 5.2.2.
5.3.3 Uniaxial simulations with one element
The uniaxial test performed in Subsection 5.2.3, see Figure 5.5, to validate and demonstrate the stress-strain-behavior for a single layered composite specimen is repeated for MAT262. The laminate is constructed of ansingle element with MAT262 and a prescribed motion is applied in the fiber direction. Separate tests with bothtensile, compressive and shear load was conducted for two different element sizes, 1x1mm2 and 2x2mm2. Thesame materials was used for both element sizes.
The stress strain behavior in the fiber direction for both tension and compression are shown i Figure 5.20. Abi-linear stress strain relation has been defined with four values for the fracture toughness in the fiber direction.Two values in fiber tension and two in fiber compression are needed. When the failure is activated, the softeningevolution begins. The stress is reduced linearly until the inflection point stress is reached and the softeningevolution changes its gradient. As expected a distinct difference can be seen between the two element sizescaused by the length scaling of the fracture toughness.
(a) (b)
Figure 5.20: Stress strain behavior in fiber direction for MAT262. (a) Tensile load. (b) Compressive load.
46

The stress strain behavior for the matrix direction only requires two fracture toughness values, one in tensionand one in compression. The linear softening evolution is much easier to control than the bi-linear behavior infiber direction, since only one parameters control the whole behavior. Also in this direction, a distinct differencecan be observed between the small and the big element model, see Figure 5.21.
(a) (b)
Figure 5.21: Stress strain behavior in matrix direction for MAT262. (a) Tensile load. (b) Compressive load.
The shear strain exhibits a similar behavior as the matrix direction, except for the linear plastic behavior afterthe yield stress is reached.
Figure 5.22: Stress strain behavior in shear
Important findings in this work, besides verifying the length scaling function, is the difficulty to define thebi-linear fiber behavior. Even though the critical finite element size condition in Equation 5.27 is fulfilled, thestrain can still exhibit snapback instabilities. The snapback instability is caused when the stress strain curve isturned inwards. The sum of e.g. GXT and GXTO, can fulfill the critical size condition, but if the relationbetween the two areas and the inflection point are wrong, snapback can still occur, see Figure 5.23. It can behard to interpret the stress-strain curves in simulations, where several layers are used in the composite, dueto progressive failure of the plies and element deletion, causing unloading and degradation of the material.Therefore, the element size should be verified through simple simulations, where the stress-strain behavior iseasier to interpret and snapback of strains can be detected.
47

The critical elements size still gives a indication of the allowable maximum size of the elements and the risk forsnapback increase with large elements.
(a) (b)
Figure 5.23: Illustration of snapback, even if the critical element size condition is fulfilled. (a) Snapback, due tosmall GXT . (b) Snapback, due to small GXTO.
The length scaling, used in MAT262, prevents a mindset based on failure strain, since the failure strain changesfor different element sizes and fracture toughnesses.
5.3.4 Tensile dog-bone simulations with different element sizes
To investigate the mesh sensitivity of MAT262, the tensile dog-bone test performed in Subsection 5.2.4 forMAT54, is repeated. The left boundary of the specimens is fixed and a horizontal prescribed motion acts on theright boundary. MAT262 uses length scaling which is dependent of the area associated with each integrationspoint in each element. The length calculation is embedded in the FE-code and can not be controlled. Therefore,two tests where the elements had different aspect ratios were performed, in order to examine if the lengthscaling algorithm could handle distorted elements as well.
The undeformed tensile dog-bone specimens with perfectly square elements are shown in Figure 5.24a. Whenthe specimens are stretched one can easily see that the damage is localized to one element column, see Figure5.24b. The remaining elements will unload elastically as the damaged element row is removed.
(a) (b)
Figure 5.24: Tensile dog-bone test with different element sizes using MAT262. (a) Undeformed state. (b)Deformed state, where damage is localized to one element column.
The energy needed to stretch the specimens can be seen in Figure 5.25a for the different element sizes. Allspecimens break at the same time at approximately the same energy level. However, there is still a smalldifference. Note that the specimen with the smallest element size have a slightly higher energy than thespecimens with the larger elements. In Figure 5.25b, the stress strain relation is shown for one of the failedelements, which absorb all damage in each specimen. The effect of the length scaling is clearly visible. In
48

Figure 5.25c, the force needed to stretch each specimen is shown. As for the energy comparison, only a smalldifference can be seen in the force-displacement relation.
(a) (b)
(c)
Figure 5.25: Result from tensile dog-bone test for elements of different sizes in MAT262. (a) Energy -Displacement in each dog-bone. (b) Stress-Strain behavior. (c) Force needed to stretch each specimen.
The simulation is repeated with elements with bad aspect ratio. Each element is elongated through the wholewaist of the specimens, see the undeformed specimens in Figure 5.26a. In Figure 5.26b, the specimens areshown in a deformed state. Note that the two specimens with smallest elements have broken while the specimenwith the largest elements is still active.
(a) (b)
Figure 5.26: Tensile dog-bone test with different element sizes with bad aspect ratio in MAT262. (a) Undeformedstate. (b) Deformed state, where the smaller elements have been deleted.
In Figure 5.27a, the energy needed to stretch each specimen is shown. The difference is larger between theelement with bad aspect ratio than in the simulation with perfectly squared elements. Once can also see thatthe specimen with largest elements requires a higher energy to break than the specimens with smaller elements.This corresponds to a behavior as if no length scaling would have been used, since larger element requireshigher energy to be stretched. A comparison between the two simulations shows that approximately ∼ 40%
49

lower energy is required to break the specimens with worse aspect ratio than those with squared elements.
In Figure 5.27b, the stress strain relation is shown for the deleted elements. Only a small difference betweenthe smaller and larger elements can be seen. The length scaling is not satisfactory for elements with bad aspectratio.
(a) (b)
Figure 5.27: Result from tensile dog-bone test for element with different size and aspect ratio in MAT262. (a)Energy - Displacement in each dog-bone. (b) Stress-Strain behavior.
One can conclude that the theory presented by Camanho et al. works well for different perfectly squaredelement sizes, but the length scaling algorithm do not work satisfactory for badly sized elements. However, thisis only tested with tensile loading in the fiber direction. Additional testing is required, e.g. with an angledfracture plane, but this is out-of-scope of the current work.
5.3.5 Implementation of MAT262 in crush simulations
The simulation model used in the baseline model for MAT54, see Subsection 5.2.5, is used for simulationswith MAT262 as well. With this model, two aspects have been varied: the material card parameters anddifferent mesh layouts. Both simulations with a uniform mesh layout using 1x1 mm2 elements and the irregularmesh layout used in the baseline model of MAT54, have been performed. Values of the fracture toughness arethe main parameters to vary in the material card of MAT262 in order to trim the behavior, since no otheradditional parameters except for shear behavior and one softening strength parameters are available. It hasbeen observed that generally, a high fracture toughness gives a stiff response with risk for buckling. A toolow fracture toughness on the other hand gives crack propagation through element rows that are not at thecrushing front. Values for the parameters used in MAT262 can be found in, Table B.1 for the uniform meshand Table B.2 for the irregular mesh, in Appendix B.
Data on fracture toughness are hard to find, even though the behavior has been investigated by a vast numberof researches, cf. [10]. A large number of aspects may effect the fracture toughness in a laminate. Variablessuch as the constituent properties, fiber volume fraction, fiber-matrix interface strength, laminate configuration,stacking sequence, test temperature and fabrication procedures, cf. [10]. Because of the large number ofvariables involved, the test result for one type of laminate is not necessary transferable to another laminate.Data corresponding to the used composite material could not be found. Values of the fracture toughnesseswere arbitrarily chosen. These values fulfill the critical length criterion in Equation 5.27.
5.3.6 Crush simulation using baseline model with MAT262
Simulations with MAT262 has shown a promising behavior, but since all fracture toughnesses are unknown, thepredictability for MAT262 can not be commented. The model for MAT262 was tested with different meshes,one with uniform layout and one with irregular layout. Both cases could be trimmed such that the resultscorrelate well with the test data.
50

Model response during simulation with a uniform mesh
The simulations with the uniform mesh can achieve either a brittle progressive row-by-row failure behavior or aductile folding behavior, depending on how the fracture toughness parameters are defined. Generally, a lowfracture toughness gives a brittle response since the failure strain is lowered. On the same basis a high fracturetoughness gives a more ductile behavior since the allowable strain is increased. Both the amount of energy anelement can absorb and when a element is deleted, are controlled by the fracture toughness.
In the fiber direction, the stress behavior can not be controlled solely by increasing or decreasing the fracturetoughness, since three parameters interacts. The sum of, e.g GXT and GXTO, control the amount of energy anelement can absorb. If GXT has a large value and the inflection point is high, a high stress level is maintainedin the begin of the stress-strain relation. GXTO will get a lower proportion of the total fracture toughnessand the failure strain will be shortened. Therefore a rather brittle behavior is achieved, where elements areremoved early. If the material card is defined such that both GXT and the inflection point stress have lowvalues, the GXTO will get a bigger proportion of the total fracture toughness. The stress level will decreaserapidly. However, higher failure strain is allowed. Observations have shown that a more ductile behavior isachieved when the elements are kept longer in the simulations. The fracture toughness in fiber direction, canthus achieve a brittle or a ductile behavior, depending on the setup in the material card.
In Figure 5.28a an example of brittle behavior is shown. Elements are deleted after a low failure strain, verysimilar to a progressive row-by-row failure. In Figure 5.28b an example of a ductile behavior is shown. Aprogressive folding behavior is achieved, where many of the distorted elements are not removed. The distortedelements have been damaged and can not carry any significant load, but the elements are kept due to theirhigh failure strain.
(a) (b)
Figure 5.28: Example of two different behavior in MAT262. (a) Brittle failure. (b) Ductile failure.
Simulations with uniform mesh
In Figure 5.29, the maximum compressive fiber damage is shown at the beginning and the end of the simulation.The damage is localized to elements in contact with the ground and spreading upwards. A progressive failureis achieved. Approximately half of the elements of a row are removed at the same time. At the end of thesimulation, the damage has spread and reached the top of the laminate. The damage at the top of the laminateis not critical, but could increase if the simulation is run further. The simulation with MAT262 shows a stablebehavior, even if the parameters are varied in a large interval.
51

(a) (b)
Figure 5.29: Simulation with uniform mesh, showing compressive fiber damage. (a) Damage short after triggerrow is removed. (b) Damage at the end of the simulation.
The mean value of the reaction force correlates well with the test data, see Figure 5.30a. Even though the coarsemesh is used, the reaction force never drops down to zero. Although it is very close to zero, some elements arestill in contact. The reaction force exhibits high amplitudes, with some additional lower periods where manyelements are detached from the laminate at the same time. In the stable crush zone, the energy absorbed perunit length has a good correlation with test data, see Figure 5.30b, but the initial energy absorption should belowered for perfect correlation.
(a) (b)
Figure 5.30: Result from the simulation with uniform mesh. (a) Reaction force. (b) Absorbed energy.
Simulations with irregular mesh
The simulation with the irregular mesh worked well. At the beginning all damage is localized in the triggerrow, seen Figure 5.31a, where the compressive fiber damage is shown. When the trigger row is removed theprogressive failure is initiated and damage is spread through elements closest to the ground, see Figure 5.31b.As the simulation proceed, the damage is only localized to the elements close to the ground. However, thereis some strange damage that occur in the middle of the laminate. Elements at the top of the laminate staysundamaged throughout the simulation.
52

(a) (b)
Figure 5.31: Simulation with irregular mesh, showing compressive fiber damage. (a) Irregular mesh - Triggerrow is damaged. (b) Irregular mesh - Continuous progressive behavior.
The reaction force for the irregular mesh, see Figure 5.32a, shows an even crush load. The amplitude of theoscillations is close to the amplitudes from the test data. Except for the initial high peak, the reaction forcecorrelates very well with the test data. The same goes for the energy curve, see Figure 5.32b.
(a) (b)
Figure 5.32: Result from the simulation with irregular quad mesh. (a) Reaction force. (b) Absorbed energy.
Effect of strength reduction parameter
A major finding is that the crashfront algorithm does not work in MAT262, thus the softening reduction factor,SOFT, is never activated. A parameters study has been performed, where the SOFT parameter was variedfrom 100% down to 50%. In Figure 5.33 the reaction force is shown for different SOFT values. Note that allsimulation curves coincide in the figure. All SOFT values give the exact same result and the crashfront can notbe seen in the history variables. The implementation of the crashfront algorithm in MAT262 must be debuggedby DYNAmore support.
53

Figure 5.33: Parameter study for different SOFT values
No further parameter studies has been performed for MAT262.
54

6 RADIOSS
6.1 Introduction to RADIOSS
RADIOSS, which is a product of Altair HyperWorks, is a finite element solver that over the years mainly hasfocused on explicit large displacement and non-linear simulations, such as crash and impact analysis in theautomotive industry as well as manufacturing processes. However, in recent years implicit analysis is also apossibility in RADIOSS.
In this project it is only the explicit feature of RADIOSS that has been tested. The model that has been usedfor the simulations has, just as for the LS-DYNA model, been built in the preprocessor ANSA version 15.0. Insome cases keywords have been implemented manually in the text file, due to the fact that ANSA is not alwaysfully updated with all the keywords needed in the RADIOSS model.
6.1.1 Simulation model of the corrugated specimen in RADIOSS
The corrugated plate, on which simulations were performed with the LS-DYNA software, was also modeled andsimulated with RADIOSS. In this section, the important features of the model are described and how it wasbuilt. Just as for the model in LS-DYNA, this RADIOSS model can be divided into four parts, which includethe boundary conditions, contact definition, the trigger row and the composite modeling. It should be notedthat all values of parameters have been transformed to fit the following units: Stress in [MPa], forces in [N],distance in [mm] and time in [s].
The boundary at the top of the laminate was set to move with a constant velocity, pushing the laminatedownwards towards the rigid steel plate, with the RADIOSS keyword IMPVEL. The velocity was as beforeramped up from zero to a velocity of 2000 mm/s. As discussed briefly in the LS-DYNA Subsection 5.2.5, anincrease of velocity requires that extra damping is added to the model in order to dampen out shockwaves.The dynamic relaxation keyword, DYREL, is added to attenuate the shockwaves. This damping keyword wasthe first that was tested. Preliminary simulations showed that unphysical shockwaves were greatly reduced. Astudy, to investigate the influence of increasing the velocity, was performed and is presented in Appendix C.2.
Between the composite laminate and the rigid steel plate a contact interface of TYPE7 was used. This is, asdescribed in the RADIOSS theory manual, a general purpose contact [26]. It is based on a penalty method,where nodes on the laminate are slaves to the master surfaces on the ground.
For modeling of the composite stack-up, with layer thickness and material orientation, property TYPE11(SH-SANDW) is used. By specifying a vector, the user can determine which direction should be the 0◦directionfor the layers. Then for each layer the angle, thickness and material id for that specific ply is determined. Thisproperty type allows to have different material cards on each layer. In the simulations of the corrugated plate,the same thickness and material id have been used for each layer, only varying the orientation of the fiberdirection. The shell element formulation, Ishell, that was used was of fully-integrated Batoz elements.
For fully-integrated Batoz shell elements, 4 integration points are used in-plane and 1 integration point perlayer through the thickness, which means that there in the current model is a total of 4x12=48 integrationpoints per element. Using the DEF SHELL keyword, flags can be activated to incorporate thickness change(Ithick = 1) and the calculation of strains for post-processing (Istrain = 1).
The trigger row, at the bottom of the corrugated plate, was modeled to have half the thickness of the mainlaminate, but the same amount of layers and material properties. With the initial mesh size of 1x1 mm2, oneelement row was used for the trigger definition.
55

Figure 6.1: Basic simulation model in RADIOSS
6.1.2 Composites and anisotropic materials in RADIOSS
In RADIOSS, there are several different material laws available for composites. When choosing material law,one has to make sure that the element type and element formulation that is going to be used in the simulationare compatible with the chosen material law. Element types that are available for composite material lawsin RADIOSS are shells, thick shells and solids, where the different types can also vary in number of nodesper element. In extension to that, different element formulations are available with different integration rules,such as e.g. under-integrated Belytschko elements, or fully integrated Batoz elements. For more informationregarding element formulations see [27].
When modeling composites with solid elements in RADIOSS, one element per composite ply is needed [28].A simple composite plate, which easily could consist of more than 10 plies, would require a huge amount ofelements as opposed to when modeling the composite with shell elements. When using shell elements, only oneelement is required to model all layers, where each layer of the composite is represented with one integrationpoint through the thickness. This will reduce the simulation time compared to solid elements. The drawback ofusing shell elements is that delamination can not be modeled. The different material laws which can be used tomodel composites and anisotropic materials in RADIOSS are presented in Table 6.1.
Table 6.1: Available laws for composite and anisotropic materials in RADIOSS [29]
Material Laws Description Elements
LAW19Fabric
Linear elastic for orthotropic shells Shells
LAW58fabric
Non-linear elastic for anisotropic shells Shells
LAW28Honeycomb
Non-linear pseudo-plastic orthotropic solids withoutstrain rate effect
Shells, Solids
LAW68Cosserat medium
Shells, Thick Shells, Solids
LAW73Thermal Hill orthotropic
Shells
LAW74Thermal Hill orthotropic 3D
Shells, Thick Shells, Solids
LAW50Crushable foam
Non-linaer pseudo-plastic orthotropic solids withstrain rate effect
Shells, Thick Shells, Solids
Continued on next page
56

Table 6.1 – Continued from previous page
Material Laws Description Elements
LAW32Hill
Elasto-plastic anisotropic shells
Shells
LAW43Hill (tabulated)
Shells
LAW57Three parameter Barlat
Shells
LAW72Anisotropic Hill
Shells, Thick Shells, Solids
LAW12Tsai-Wu formula for solid
Elasto-plastic orthotropic composites
Thick Shells, Solids
LAW14Composite Solid
Thick Shells, Solids
LAW15Composite Shell Chang-Chang
Shells
LAW25Composite Shell
Shells, Thick Shells, Solids
LAW53Foam model
Shells, Thick Shells, Solids
6.2 Simulations with material LAW25
The choice of material law is important depending on the application and requirements on the simulation. Thereare, as mentioned, several material laws for composites dedicated to different applications. For elastic-plasticorthotropic composite shells there are two dedicated material laws, LAW15 and LAW25. They are similar,since their plasticity models are based on the same criterion, Tsai-Wu plasticity model. LAW15 uses a fullycoupled plasticity model with a built in Chang-Chang failure criterion. In LAW25 it is possible to define theyield limits in the orthotropic directions in tension, compression and shear. The failure criterion in LAW25 isbased on maximum plastic work or tensile strain in the orthotropic directions. If another failure criterion is tobe used with LAW25, it has to be added separately. There are different failure criteria available for composites,such as Chang-Chang, Hashin, Puck and Ladeveze. The reference guide for RADIOSS recommends the user touse LAW25 over LAW15 [29], thus LAW25 is the material law that has been tested for the simulations in thisproject. In the section that follows, the theory regarding the parameters and properties of LAW25 is described.
6.2.1 Theory and material parameters of LAW25
There are two variants of LAW25. The two variants differ in plasticity model formulation. By setting theformulation flag, Iform, to either 0 or 1, one chooses either a plasticity model based on Tsai-Wu formulation orCRASURV formulation, respectively. The Tsai-Wu formulation leaves the user with less parameters to defineand could be seen as a simpler model.
With the CRASURV formulation, the user can specify different plasticity hardening parameters in all directions.This is preferable when modeling a crushing problem. For example, compression in transverse direction of acomposite ply tend to yield a lot more before failure than compression in longitudinal direction. A more ductilestress-strain curve can then be obtained by setting lower values for the hardening parameters for the materialin compressive transverse direction. By using the Tsai-Wu formulation, the user is restricted to have the same
57

plasticity hardening parameters for all directions. Another limitation with the Tsai-Wu formulation is thatsoftening of the material followed by residual stresses is not possible, whereas it is possible with CRASURV.Due to the limitations with the Tsai-Wu formulation, CRASURV formulation was chosen to be investigated andthe hardening of this formulation will be described in this section. For further reading regarding the Tsai-Wuformualtion, the reader is referred to [30]. Table 6.2 illustrates the structure and which parameters that areincluded in LAW25 with the CRASURV formulation.
Table 6.2: Material card LAW25, CRASURV formulation
(1) (2) (3) (4) (5) (6) (7) (8) (9) (10)
Card 1 ρ
Card 2 E11 E22 ν12 Iflag E33
Card 3 G12 G23 G31 εf1 εf2
Card 4 εt1 εm1 εt2 εm2 dmax
Card 5 Wpmax Wpref Ioff Iflawp
Card 6 c ε0 α ICCglobal
Card 7 σt1y b1
t n1t σt
1max c1t
Card 8 εt11 εt12 σt1rs Wpmax
t1
Card 9 σt2y b2
t n2t σt
2max c2t
Card 10 εt21 εt22 σt2rs Wpmax
t2
Card 11 σc1y b1
c n1c σc
1max c1c
Card 12 εc11 εc12 σc1rs Wpmax
c1
Card 13 σc2y b2
c n2c σc
2max c2c
Card 14 εc21 εc22 σc2rs Wpmax
c2
Card 15 σt12y b12
t n12t σt
12max c12t
Card 16 εt121 εt12
2 σt12rs Wpmax
t12
Card 17 γini γmax dmax
Card 18 Fsmooth Fcut
The blue parameters in Table 6.2 on card 1-3 are parameters that consider the elastic behavior of the materialin the orthotropic directions, such as Young’s and shear moduli. The cyan colored parameters on card 3-6 arethose related to the calculation of damage in the composite and failure of the elements. The black parameters incard 6 and 18 are related to strain rate effects, which have not been used in the simulations of this project, sincethe test that is modeled was performed under quasi-static conditions. In cards 7-16, parameters which controlyield, plasticity hardening and softening of the material can be found. Green parameters are those for tensionin both longitudinal and transverse direction, red for compression in both longitudinal and transverse directionand the magenta colored ones for shear. On card 17 are parameters to be used for a delamination damagecalculation. This is however not applicable for shell elements, since the out-of-plane stresses are required.
In Table 6.3 there is a short description of each parameter in LAW25. The more important parameters will bedescribed below in this text.
58

Table 6.3: Description of input parameters in LAW25
Variable Definition
ρ Initial density
E11 Young’s modulus in longitudinal direction
E22 Young’s modulus in transverse direction
ν12 Major Poisson’s ratio
Iflag Plasticity formulation flag. Set to 0 for Tsai-Wu. Set to 1 for CRASURV
E33 Young’s modulus in normal direction
G12 Shear modulus in direction 12
G23 Shear modulus in direction 23
G31 Shear modulus in direction 31
εf1 Total failure strain in direction 1
εf2 Total failure strain in direction 2
εt1 Tensile rupture strain in direction 1
εm1 Maximum strain in direction 1
εt2 Tensile rupture strain in direction 2
εm2 Maximum strain in direction 2
dmax Composite tensile strength at maximum damage. When failure has occured, schematically,σ = (1− dmax)Eε
Wpmax Maximum plastic work
Wpref Reference plastic work (Default = 1.0)
Ioff Total element failure criteria for shells. Determines when shell is deleted.
= 0: Shell is deleted if Wp > Wpmax for one layer
= 1: Shell is deleted if Wp > Wpmax for all layers
= 2: Shell is deleted if for each layer Wp > Wpmax or tensile failure in direction 1
= 3: Shell is deleted if for each layer Wp > Wpmax or tensile failure in direction 2
= 4: Shell is deleted if for each layer Wp > Wpmax or tensile failure in direction 1 and 2
= 5: Shell is deleted if for all layers Wp > Wpmax or tensile failure in direction 1, or if forall layers Wp > Wpmax or tensile failure in direction 2
= 6: Shell is deleted if for each layer Wp > Wpmax or tensile failure in direction 1 or 2
Iflawp Flag for max plastic work in multiple directions.
= 0: flag is deactivated. The W ijpmax has no effect
= 1: activated. In direction 1, for both tension and compression, the plastic work rupturecriterion becomes the specified value of plastic work, W ij
pmax, for the corresponding
direction. But in direction 2 it is the lower value of W ijpmax and Wpmax.
c Global strain rate coefficient for plastic work criterion
ε0 Reference strain rate
Continued on next page
59

Table 6.3 – Continued from previous page
Variable Definition
α F12 reduction factor
ICCglobal Global composite plasticity parameters flag for strain rate computation. By setting to 1,2, 3 or 4 one can let the strain rate have different influence on maximum stress limits andmaximum plastic work.
σt1y Yield stress in tension, direction 1
bt1 Hardening parameter in tension, direction 1
nt1 Hardening exponent in tension, direction 1
σt1max Maximum stress in tension, direction 1
ct1 Strain rate coefficient in tension, direction 1
εt11 Initial softening strain in tension, direction 1
εt12 Maximum softening strain in tension, direction 1
σt1rs Residual stress in tension, direction 1
W t1pmax Maximum plastic work in tension, direction 1
σt2y Yield stress in tension, direction 2
bt2 Hardening parameter in tension, direction 2
nt2 Hardening exponent in tension, direction 2
σt2max Maximum stress in tension, direction 2
ct2 Strain rate coefficient in tension, direction 2
εt21 Initial softening strain in tension, direction 2
εt22 Maximum softening strain in tension, direction 2
σt2rs Residual stress in tension, direction 2
W t2pmax Maximum plastic work in tension, direction 2
σc1y Yield stress in compression, direction 1
bc1 Hardening parameter in compression, direction 1
nc1 Hardening exponent in compression, direction 1
σc1max Maximum stress in compression, direction 1
cc1 Strain rate coefficient in compression, direction 1
εc11 Initial softening strain in compression, direction 1
εc12 Maximum softening strain in compression, direction 1
σc1rs Residual stress in compression, direction 1
W c1pmax Maximum plastic work in compression, direction 1
σc2y Yield stress in compression, direction 2
Continued on next page
60

Table 6.3 – Continued from previous page
Variable Definition
bc2 Hardening parameter in compression, direction 2
nc2 Hardening exponent in compression, direction 2
σc2max Maximum stress in compression, direction 2
cc2 Strain rate coefficient in compression, direction 2
εc21 Initial softening strain in compression, direction 2
εc22 Maximum softening strain in compression, direction 2
σc2rs Residual stress in compression, direction 2
W c2pmax Maximum plastic work in compression, direction 2
σ12y Yield stress, direction 12
b12 Hardening parameter, direction 12
n12 Hardening exponent, direction 12
σ12max Maximum stress, direction 12
c12 Strain rate coefficient, direction 12
ε121 Initial softening strain, direction 12
ε122 Maximum softening strain, direction 12
σ12rs Residual stress, direction 12
W 12pmax Maximum plastic work, direction 12
γini Delaminition shear strain
γmax Maximum shear strain
dmax Maximum value for delamination damage factor
Fsmooth Smooth strain rate option flag. =0: no strain rate smoothing. =1: strain rate smoothingactive
Fcut Cutoff frequency for strain rate filtering
61

CRASURV plasticity model
By using the CRASURV formulation a nonlinear mixed hardening is enabled. The yield surface equation ispresented in Equation 6.1 and the associated Fij factors are presented in Equation 6.2.
F (Wp) = 1 = F1(Wp)σ1 + F2(Wp)σ2 + F11(Wp)σ21 + F22(Wp)σ2
2 + F44(Wp)σ212 + 2F12(Wp)σ1σ2 (6.1)
F1 = − 1
σc1y
+1
σt1y
F2 = − 1
σc2y
+1
σt2y
F11 =1
σc1yσ
t1y
F22 =1
σc2yσ
t2y
F44 =1
(σ12y)2
F12 = −α2
√F11F22
(6.2)
Note that the CRASURV formulation is on the same form as the Tsai-Wu yield criterion. The Fij factors arefunctions of the yield stresses, but the yield stresses used in equation 6.2 are functions of the plastic work.Thus, the yield surface is updated due to the hardening of the material and is a function of the plastic work. InEquation 6.3, the hardening of the yield limits is presented.
σc1y = σc
10(1 + bc1(Wp)(nc1))(1 + cc1ln(
ε
ε0))
σc2y = σc
20(1 + bc2(Wp)(nc2))(1 + cc2ln(
ε
ε0))
σt1y = σt
10(1 + bt1(Wp)(nc1))(1 + ct1ln(
ε
ε0))
σt2y = σt
20(1 + bt2(Wp)(nt2))(1 + ct2ln(
ε
ε0))
σ12y = σ120(1 + b12(Wp)(n12))(1 + c12ln(ε
ε0))
(6.3)
It is the σc10, σ
c20, σ
t10, σ
t20, σ120 parameters that are the initial yield limits and input parameters in LAW25.
If F (Wp) < 1 in Equation 6.1 the material is in an elastic state. If F (Wp) = 1 the material is in a plasticadmissible state and the state of stress is on the yield surface. When the current stresses in calculations exceedsthe yield surface, such that F (Wp) > 1, they are plastic inadmissible stresses and must be projected onto theyield surface in order to satisfy Equation 6.1, see Figure 6.2.
62

Figure 6.2: If the yield surface is exceeded, stresses are plastic inadmissible and must be projected onto the yieldsurface [30]
In equation 6.3 one can see that, other than the dependency of plastic work, there is also a dependency onthe strain rate, ε. If a material is deformed with high velocity it can be more resilient to deform. A higherstrain rate has been showed to give higher ultimate stress in composite materials [31]. The strain rate can thusbe important to consider when using LAW25 in dynamic applications. However, that part of the expressionin equation 6.3 has been ignored in the simulations of this work by setting the c parameters to 0, since aquasi-static problem has been modeled.
Figure 6.3 illustrates an example of how the yield surface can change.
Figure 6.3: Example of how the yield surface can change [30]
Plastic work in CRASURV formulation
When the material starts to yield, the strain in the material can be divided into two parts: the elastic strainand the plastic strain. The plastic strain is the strain which causes the material to be unable to go back toits initial state. The plastic work, Wp, is defined by the work that is done during the plastic deformation. Aschematic definition of plastic work is illustrated in Figure 6.4.
63

Figure 6.4: Schematic illustration of plastic work.
The plastic work is calculated individually for each layer. If the flag Iflawp = 0, the plastic work limit will bethe same in all directions, namely Wpmax.
If Iflawp = 1, The plastic work is calculated in the same way, but instead of having just one maximum limit,the limits can be different in all directions. Limits are then specified by the W ij
pmax parameters, see Table6.3. Which plastic work limit that will lead to rupture, then depends on in which direction the yield limit isexceeded:
• If σ11 > σt1y, the plastic work rupture criterion becomes W t1
pmax.
• If σ11 < −σc1y the plastic work rupture criterion becomes W c1
pmax.
• If σ22 < −σi2y (tension or compression) the criterion becomes inf(W i2
pmax,Wpmax).
• If abs(σ12) > σ12y,the plastic work rupture criterion becomes W 12pmax.
Strain limits, damage and softening
When the material is strained to its tensile rupture strain limit, εti, damage factors start to reduce the stiffnessof the layer. Equation 6.4 shows how the damage factors are calculated.
di =εi − εtiεmi − εti
for i = 1, 2 and ε≥εti (6.4)
Where εmi is the maximum strain. The stiffnesses, E11, E22 and G12 is then reduced according to equation 6.5.
E′ii = (1− di)Eii for i = 1, 2
G′12 = (1− d1)(1− d2)G12
(6.5)
The stiffness reduction proceeds until the damage factor reaches its specified maximum value, dmax (defaultvalue in RADIOSS is 0.999 for this parameter).
Apart from the tensile rupture strain limits, which is the starting point for damage calculation, there are alsoinitial and maximum softening strains. Initial softening strains are denoted εti1 and maximum softening strainsεti2 . The tensile rupture strains and initial softening strains have a similar effect on the material, but instead ofcalculating damage to complete failure of the layer, the initial softening strains makes the stress fall down on aspecified residual stress, σti
rs. The initial softening strain activates when the stress should be decreased and the
64

maximum softening strain is the strain, from which a constant residual stress level should be kept. Figure 6.5aillustrates a stress-strain curve in tension with softening of the material followed by tensile rupture and damagecalculation up to maximum strain. Figure 6.5b illustrates a stress-strain curve in compression with softening ofthe material followed by failure due to plastic work.
(a) (b)
Figure 6.5: Stress-strain curves in tension and compression illustrating softening and failure behavior.(a) Failureof layer in tension. (b) Failure of layer in compression.
Deletion of elements
An increase of plastic work will increase the yield surface until the maximum plastic work is reached. Thenwhat happens, depends on what value the Ioff parameter is set to. It is a flag, which can be set to a integerfrom 0-6. All options for the Ioff flag are described in Table 6.3. Each value gives a deletion condition for theelements, based on whether maximum plastic work limits or maximum tensile strains are reached for the layersof the composite. If the user sets the value of Ioff to 6, which has been used in this work, the deletion of theelement occurs if maximum plastic work or tensile maximum strain in direction 1 or 2 is reached for each layer.According to the RADIOSS theory manual [30] it is option 5 and 6 that give the most physical behavior.
To summarize the section above, the mechanical properties after yield in the composite are determined by theplasticity model, strain limits and plastic work limits. Hardening is determined by the hardening parameters.Softening strains control when residual stresses should be activated. Tensile rupture strain limits control whenthe stiffness should be degraded with damage factors. Plastic work limits and the maximum strains controlwhen an element should be deleted.
6.2.2 Uniaxial simulations with one element
Just as for LS-DYNA, a simple test on a single layered composite specimen was conducted with RADIOSS andLAW25, see Figure 5.5a and 5.5b. The specimen was subject to both tension and compression in fiber direction.
Figure 6.6a presents the stress-strain results of the specimen. Initially the response is elastic, with a linearstress increase. When the material reaches its yield stress, the slope of the curve is determined by the hardeningcoefficients b and n, according to equation 6.3 (no strain rate effects has been included). Then the maximumstress is reached, and the material behaves ideally plastic until it reaches the tensile rupture strain, εt1. However,the plastic behavior can of course be suppressed by setting the tensile rupture strain to a value that occursbefore the yield stress is reached and thereby obtain a brittle failure.
When the maximum strain, εmi, is reached the layer has a residual stiffness determined by dmax. If all layershas reached εmi and the Ioff parameter is set to 6, the element is deleted.
Figure 6.6b presents results from a simulation very similar to the one presented in Figure 6.6a. It is the sameelastic response, and the same plastic behavior until it reaches the specified initial softening strain, εt11 . Thenthe yield surface is decreased and the stresses are lowered accordingly in a linear manner to meet the point
65

where the maximum softening strain, εt12 , and residual stress,σt1rs, coincide. The stress is then kept constant
at the residual stress until tensile rupture strain, εt1 is reached and the damage procedure starts. The layerreaches total failure at the maximum strain, εm1
(a) (b)
Figure 6.6: Two ways to define stress-strain curves in tension for a 0◦lamina. (a) With ideal plastic behaviorat maximum stress: (a1) Elastic. (a2) Hardening. (a3) Maximum stress. (a4) Tensile rupture strain (a5)Maximum strain. (b) Softening followed by residual stress: (b1) Initial softening strain. (b2) Maximum softeningstrain. (b3) Tensile rupture strain. (b4) Maximum strain.
When the material is in compression the plastic behavior after yield is the same as in tension. What differs theresponse in compression from the response in tension is that in compression there is no strain limit as εt1. Thefailure criterion in compression depends only on plastic work. Figure 6.7a presents the results from a simplecompression test of an element with only one layer with fibers in the 0◦direction. Just as the case for tension,the material is elastic followed by plasticity after the yield stress is reached. Then the material reaches themaximum stress in compression and have an ideal plastic behavior. Softening of the material then occurs atthe initial softening strain and the stress decrease to the residual stress, on which it is kept until the maximumplastic work limit is reached and then the element has failed.
Figure 6.7b shows that the softening of the material can be set to occur at any strain. Here the softening is setbefore the maximum stress is reached, making the stress go down to the residual stress, until the plastic worklimit is reached.
(a) (b)
Figure 6.7: Two ways to define stress-strain curves in compression for a 0◦lamina.(a) Ideal plastic behaviorbefore stress softening and residual stress. Element is deleted when plastic work limit is reached. (b) Stresssoftening and residual stress. Element is deleted when plastic work limit is reached.
The general behavior of the material seen in Figures 6.6-6.7, can also be achieved in transverse direction.LAW25 works in the same way for fiber and transverse direction, but differs between tension and compression.
66

6.2.3 Tensile dog-bone simulations with different element sizes
In LS-DYNA, the dependency of element size was investigated trough conducting a tensile dog-bone test, wherethree different element sizes were used. The same numerical test has been performed for LAW25 in RADIOSS.Three mesh sizes were tested. The waist of the specimen is of quadratic shape and the number of elements inthe waists was set to 4, 9 and 16, giving the elements at the waists same aspect ratio. The element sizes are1x1 mm2, 0.67x0.67 mm2 and 0.5x0.5 mm2 respectively. In all three dog-bones the same material has beenused. Figure 6.8 illustrates the dog-bones when they all have failed.
Figure 6.8: Tensile dog bone test after failure.
Although the same material was used in all specimens, different amount of energy was absorbed. Figure 6.9ashows the absorbed energy of each specimen as a function of displacement. All three energy curves follow thesame path until failure is reached. After failure, the curve is kept at a constant energy level. The smallestelement size, 0.5x0.5 mm2, fails first. Shortly after failure of the small element, the slightly larger element fails.At last the largest element size, 1x1 mm2 fails. The energy absorption is thus higher for the largest elementsand the smallest element size absorbed the least amount of energy.
Figure 6.9b shows the force required to pull the each specimen. The force response before failure is the same forall specimens. When the specimens fail, the forces drop to zero. A larger element exhibits more displacementbefore the maximum tensile strain is reached, which is why the specimen with the largest elements withstandsa slightly higher force before failure. The mesh size is thus important to consider when tuning the materialparameters of LAW25.
(a) (b)
Figure 6.9: Results from tensile dog-bone test for elements of different sizes. (a) Energy-displacement for eachdog bone. (b) Force-displacement for each dog-bone.
67

6.2.4 Crush simulation using baseline model with LAW25
In order to find a good response for the corrugated specimen model, various setups of the parameters in thematerial card was tried. Many of the simulations gave unwanted results, and the sensitivity of the modelwas significant. A small change in a parameter setup, which gave good progressive crushing behavior, couldalter the response completely. Since the only available material data was elastic parameters and strengths,parameters such as yield limits, hardening coefficients and strain limits were roughly estimated and testedby trial and error. Preliminary simulations was carried out, but to find a more stable model a parameterstudy was performed. The sensitivity in the simulations due to parameter variations in the material model wasinvestigated in the parameter study. This parameter study is presented in Appendix, Section C.1. From theresults of the study, a setup of parameters which gave a stable progressive crushing behavior was found. Thesetup is presented in Table C.3 in Appendix C and is henceforth called the baseline model.
In the baseline model, there are some parameters that are not used. For example, there are no softening strainsor residual stresses utilized in tension. This is due to the fact that composites usually fail in a brittle mannerin this failure mode. That is also why the yield limits in tension have been set close to the maximum stresses,since there is normally no notable plasticity in tension. In compression however, the yield limits are set to occurat approximately half the maximum stress levels. In shear, the yield limit is set to occur at approximately athird of the maximum stress, due to the fact that FRPs tend to yield much in shear [10]. Softening strains andresidual stresses are set in compression.
As mentioned in Subsection 6.2.1, where the plastic work limits were discussed, there is a flag, Iflawp, whichenables the user to have different plastic work limits in the in-plane directions. This flag was not used in thiswork since the values of the limits were hard to tune in and no good results were obtained, which is also whythat value is left blank in Table C.3.
Illustrations of the simulation with the baseline model can be seen in Figure 6.10. The contour in those figuresindicates different levels of accumulated plastic strains, i.e where at least one of the layers in the elements havepassed the yield limit. One can see that the plastic strains are located close to the crushing front.
(a) (b)
68

(c) (d)
Figure 6.10: Crushing process of the baseline model. (a) Before crushing. (b) Initial crushing. (c) Mid crushing.(d) After crushing.
Figure 6.11a shows the force-displacement plot. The results, drawn with green color, are spiky and need to befiltered in order to get a smoother curve and a better view of the results. The results are filtered in the timedomain with a SAE600 filter, and that curve is drawn in blue. The harmonic behavior of the curve reflectsthat the simulation in a stable way removes one row of elements at a time. However, the average crushingload is higher than the test data. The test data has an average crushing load of approximately 15 kN, whilstthe filtered result curve has an average of roughly 18 kN. The energy plot in Figure 6.11b shows a too steepresult, i.e. the energy absorption per unit time (which is proportional to unit length in this case) is too high.Although many parameter variations to get closer to test data were made (maintaining stiffnesses and strengthsas before), these are the results that came closest to test data with a stable crushing behavior.
(a) (b)
Figure 6.11: Results from baseline simulations. (a) Force-displacement curve of the baseline model. (b) Energyabsorption of the baseline model.
69
6.2.5 Investigation of mesh dependency in crush simulations with LAW25
To investigate the mesh dependency, different meshes were tested. A mesh with finer uniform quad elements,one with triangular elements (sidelengths of 1.5 mm) and one mesh with irregular quad elements (approximately1x1 mm) were tested. In these simulations, the same material parameters as in the baseline model have beenused. Figures 6.12 and 6.13 shows the force-displacement and energy curves for each of the tested meshes.
Figure 6.12: Force-displacement curves for different meshes with same material.
Figure 6.13: Energy absorption curves for different meshes with same material.
The response for the meshes is obviously very different from each other. None of the curves are near to coincidewith another, except for the energy absorption of the two with uniform meshes. In Figure 6.14 close-up picturesof the crushing for each simulation are presented. For the uniform mesh with element size of 1x1 mm2, inFigure 6.14a, the elements are deleted row-by-row at the crush front. For the other simulations, especially inthe case of the finer quad mesh in Figure 6.14b, elements which are not at the crush front fails. This causelarge pieces of the mesh to be detached from the plate. Thus, the plate will lose contact in that region. This isreflected in the high peaks and low drops of the force-displacement curve for the uniform 0.5x0.5 mm2 elementsize. The energy absorption is however, as mentioned, close to the curve for 1x1 mm2 element size, see Figure6.13, but since the behavior of the crushing differs to much, no thorough conclusion can be drawn from this.
In the case for the mesh with triangular elements some elements are detached early in the simulation, seeFigure 6.14c, but as the simulation proceeds, the crushing force is stabilized and fairly good crushing behavioris obtained, see Figure 6.12. However, the average crushing load is higher than for all other mesh variations.
The same behavior early in the simulation as for the case with triangular elements was also obtained with theirregular quad mesh. But for the irregular quad mesh a larger piece of mesh is detached, leaving a smaller
70

region of elements in contact. This can be seen in Figure 6.14d. In the bottom right corner a large piece isdetached along the mesh lines. As the simulation proceeds a stable crushing of the elements still in contact isachieved, but since less elements are in contact, the force is lowered significantly, see Figure 6.12.
(a) (b)
(c) (d)
Figure 6.14: Figures from crushing simulations with different meshes. (a) Uniform mesh with element size 1x1mm2. (b) Uniform mesh with element size 0.5x0.5 mm2. (c) Triangular mesh. (d) Irregular quad mesh.
It may be noteworthy that none of the meshes had elements deleted at the top of the plate, where the velocityboundary condition is applied. In the simulations with LS-DYNA, this was a problem with some of the meshes.
71

Tuned parameters with triangular elements
Different meshes with same material parameters gave very different results. But further simulations wasperformed for each of the mesh, tuning the parameters of the material card, to see whether it was possible toachieve stable crushing behavior with each mesh.
For the triangular mesh, a fairly stable response could be achieved, where the major parameter adjustmentswere to reduce the maximum plastic work limit and to lower the yield stress in compression for the fiberdirection. An illustration of the crushing of a triangular mesh can be seen in Figure 6.15.
(a) (b)
Figure 6.15: Crushing simulation with triangular elements. (a) Initial crushing. (b) After crushing.
The force-displacement and energy absorption curve for the simulation with triangular elements can be seen inFigure 6.16. The force response indicates that the crushing is about to stabilize at a slightly too high averagecrushing force. Which is also observed in the energy response, which has a slightly too steep curve, comparedto test data, at the end of the simulation.
(a) (b)
Figure 6.16: Results from simulation with triangular elements. (a) Force-displacement. (b) Energy absorption.
Tuned parameters with irregular quad elements
Further simulations were also performed on the model with irregular quad mesh. The results with this mesh,presented earlier in this section, showed that there were problems with large pieces that were detached fromthe plate rather than being progressively crushed. Several attempts were performed to tune the parameters inorder to alleviate or remove that problem, but it was done without success. The problem remained, whichone can see in Figure 6.17. A large piece of the plate is detached in the bottom right corner of the plate. Themajor changes from the baseline parameter setup was to increase the maximum plastic work limit.
72

(a) (b)
Figure 6.17: Crushing simulation with irregular quad mesh. (a) Initial crushing. (b) After crushing. Largepiece of elements that were detached early in simulation has stayed in the same place.
During the remainder of the simulation, the detached piece of elements stays in the place where it first wasseparated from the plate and since no self contact definition was used, the rest of the plate penetrates thatpiece of elements. At the end of the simulation, the whole plate is in contact with the ground. At this point,the force is stabilized very close to the test data curve, see Figure 6.18a. The energy curve in Figure 6.18b, alsoshows that the energy absorption per unit length of the simulation curve is the same as that for the test data.
(a) (b)
Figure 6.18: Results from simulation with irregular quad mesh. (a) Force-displacement. (b) Energy absorption.
73

7 Comparison between LS-DYNA and RADIOSS
LS-DYNA and RADIOSS have shown to be similar when it comes to modeling the composite structure, e.g.the stack-up of plies and fiber direction. However, the investigated material models differ. This chapter willhighlight and compare the major differences between the three material models, MAT54 and MAT262 inLS-DYNA and LAW25 in RADIOSS, which were investigated in this project.
7.1 Material data inputs
Since the available material data was limited to Young’s moduli, shear modulus, Poisson’s ratio and materialstrengths, many of the material parameters for the three material models had to be estimated. However, forthe case when using MAT54, all the required actual material data was available, but many unphysical modelparameters needed to be used in order to stabilize the model. These unphysical parameters need to be tuned,no matter how much information is known about the material.
In MAT262, additional information about the material is required, i.e the fracture toughness in all relevantfailure modes and the non-linear behavior in shear. Experimental tests are required to determine theseparameters. Even though MAT262 is a more advanced material model than MAT54, it requires less inputparameters. Apart from the SOFT and PFL parameters, all of the utilized input parameters of MAT262 havea physical meaning. The SOFT and PFL parameters were both inactive during the simulations.
LAW25, with the CRASURV formulation, is the material model that requires the most material data. It wouldrequire extensive testing in order to determine all of the parameters. Assumptions, such as linear response intension, that were made in this work, could be done in order to reduce the amount of unknown parameters.
7.2 Implementation of material models
MAT54 is the simplest of the three tested material models, as it lacks a continuum degradation scheme.However, the abrupt changes in the stress-strain curve can have a negative effect on the stability of the model.
The theory which MAT262 is based on is the most advanced of the three material models and it requires nounphysical parameters. However, there have been simplifications of the theory implementation to LS-DYNA.For example, the material degradation in fiber direction has been given a bi-linear response in LS-DYNA,whereas the theory describes an exponential degradation.
LAW25 is the only of the three material models, in which yield limits and hardening can be specified in alldirections. Of the three tested material models, LAW25 gives most freedom to specify the stress-strain curve.However, the vast number of parameters and the coupling between them makes it complex to achieve a desiredbehavior.
Figure 7.1 illustrates a schematic example of how the stress-strain response can be modeled in tension with thethree models.
74

Figure 7.1: Schematic comparison of uniaxial stress-strain curves between the material models.
7.3 Advantages and disadvantages
Through the modeling process and results from simulations in this project, with each of the material models,advantages and disadvantages can be stated. These are compiled in Tables 7.1 - 7.3.
Table 7.1: Advantages and disadvantages when modeling with MAT54 in LS-DYNA
Simulation with MAT54
Advantages Disadvantages
+ Few measured parameters needed - Many unphysical parameters required to stabilizethe model
+ Simple model - Unstable model with uniform mesh
- Low predictability
- No continuum failure model
- Dependent of mesh layout
- Element size dependent
Table 7.2: Advantages and disadvantages when modeling with MAT262 in LS-DYNA
Simulation with MAT262
Advantages Disadvantages
+ Only parameters with physical meaning (if SOFTis inactive)
- Additional tests needed to determine fracture tough-nesses
+ Energy based failure, with length scaling of fracturetoughness, reduces element size dependency
- Length scaling of fracture toughness can be influ-enced incorrectly by bad aspect ratio of elements
+ Continuum damage model
75

Table 7.3: Advantages and disadvantages when modeling with LAW25 in RADIOSS
Simulation with LAW25
Advantages Disadvantages
+ Flexibility when specifying the stress-strain behav-ior
- Many parameters which need to be determinedthrough tests
+ Many parameters with physical meaning - Some parameters are difficult to measure in test
+ Freedom to choose how deletion of elements shouldbe done
- High coupling between material parameters
- Dependent of mesh layout
- Element size dependent
- Very sensitive to parameter variations
76

8 Concluding remarks
This project has shown the complexity to run explicit crush simulations of composite structures. Simulationscan give good results, close to test data, but there are uncertainties if the used material model parametersrepresent the real physics. This makes it uncertain whether the material models are predictive or not. ForMAT54, all the required material data was known, but the model was very unstable and could not givesatisfactory results with a uniform mesh. A different shape on the mesh did however give a more stable model.To change the mesh to be irregular, in order to obtain stable results is unwanted.
Using LAW25 did not cause the same problems with the uniform mesh. However, the absence of requiredmaterial data made it difficult to tune the material parameters to correlate the simulation results to the testdata. When using an irregular mesh it was easier to match the results with test data.
MAT262 did not show the same mesh dependency, due to the length regularization of fracture toughness. Thisway of considering fracture, appears to be advantageous.
Another uncertainty regarding the simulations, is that the instabilities in the models can not be said to solelycome from parameter sensitive material models. Instabilities can also, to a large extent, come from other modelcharacteristics, such as badly tuned contact definition or incorrect damping in the model.
The delamination failure mechanism is not possible to capture using only a single-shell simulation model.However, there are good estimations of how to capture the in-plane failure behavior. Delamination has greatinfluence on other failure mechanisms that will occur during crushing. The results from this project indicatesthat additional failure mechanisms, such as delamiantion, are required to accurately capture the behavior ofcomposite materials during crushing.
77
9 Future work
If FE-software analysis is to be used when verifying composite designs in crashworthy structures, predictabilityof the material models needs to be confirmed. For this purpose, additional experimental testing should beperformed to calibrate the model parameters and simulations of the corrugated specimen should thereafter berepeated with these parameters to better be able to assess the predictability of each model.
In order to model delamination of composites, multiple shells tied together with either cohesive elements ortie contacts should be used. This will increase the complexity and size of the model compared to single-shellmodeling, but by only using cohesive elements between some of the plies, the size increase of the model doesnot have to be too great. This type of modeling should definitely be considered and investigated in future work.
Adding solid elements, or more advanced shell elements, could also be used in order to capture out-of-planestresses and may improve quality of the results. This should also be investigated further.
There are, apart from the investigated macro-mechanics based material models, other software plug-ins thatare partially based on micro-mechanics. Due to lack of time, these could not be investigated in this project,but in future works they should definitely be evaluated and compared with the macro-mechanics based models.Even though the CPU cost might increase, the results may be more accurate.
In order to fully understand the material models that are available, simulations of specimens with othergeometries and different load cases need to be performed. Dynamical effects, such as strain rate dependency,should also be investigated.
78

References
[1] Modelling of {CFRP} crushing structures in explicit crash analysis. Composites Part B: Engineering60.0 (2014), 725 –735. issn: 1359-8368.
[2] The Joint Advanced Materials and Structures Center of Excellence (JAMS). Crashworthiness of compositesstructures: Experiment and Simulation. AMTAS FALL MEETING 2012 (2012).
[3] P. Feraboli et al. LS-DYNA MAT54 modeling of the axial crushing of a composite tape sinusoidalspecimen. Composites Part A 42.11 (2011), 1809–1825.
[4] M. Chatiri, T. Gull, and A. Matzenmiller. An assessment of the new LS-DYNA layered solid element:basics, patch simulation and its potential for thick composite structures analysis. 7th European LS-DYNAConference (2009).
[5] G. Belingardi and J. Obradovic. Numerical crash analysis of composite racing car front impact attenuatorby use of explicit FEM codes. Applied Mechanics and Materials 82 (2011), 290–295.
[6] J. Obradovic, S. Boria, and G. Belingardi. Lightweight design and crash analysis of composite frontalimpact energy absorbing structures. Composite Structures 94.2 (2012), 423.
[7] P. Feraboli. Development of a Corrugated Test Specimen for Composite Materials Energy Absorption.Journal of Composite Materials 42.3 (2008), 229–256.
[8] Simulation of the Quasi-static Crushing of a Fabric Composite Plate. Abaqus Technology Brief TB-11-QSC-1 (2011).
[9] Computational methods for predicting impact damage in composite structures. Composites Science andTechnology 61.15 (2001), 2183 –2192. issn: 0266-3538.
[10] B. D. Agarwal, L. J. Broutman, and K Chandrashekhara. Analysis and Performance of Fiber Composites.Third edition. New Jersey: John Wiley & sons, Inc., 2006.
[11] S. T. Pinho et al. Failure models and criteria for FRP under in-plane or three-dimensional stress statesincluding shear non-linearity. NASA Langley research center (2005).
[12] Impact-induced delamination of composites: a 2D simulation. Composites Part B: Engineering 29.5(1998), 589 –602. issn: 1359-8368.
[13] L. Grauers, R. Olsson, and R. Gutkin. Energy absorption and damage mechanisms in progressive crushingof corrugated NCF laminates: Fractographic analysis. Composite Structures 110 (2014), 110–117.
[14] A. M. Robinson and J. J. Carruthers. Energy absorption capability and crashworthiness of compositematerial structures: A review. Applied Mechanics Reviews (1998).
[15] D. Hull. A unified approach to progressive crushing of fibre-reinforced composite tubes. CompositesScience and Technology 40.4 (1991), 377–421.
[16] G. C. Jacob et al. Crashworthiness of automotive composite material systems. Journal of CompositeMaterials 36.7 (). issn: 0021-9983.
[17] M. Okano, A. Nakai, and H. Hamada. Axial crushing performance of braided composite tubes. InternationalJournal of Crashworthiness 10.3 (2005), 287–294.
[18] LS-DYNA Keyword Users Manual - Volume I. Version R7.0. Livermore Software Technology Corporation,February 2013.
[19] LS-DYNA Keyword Users Manual - Volume II. Material Models. Version R7.0. Livermore SoftwareTechnology Corporation, February 2013.
[20] LS-DYNA Theory Manual. Livermore Software Technology Corporation, John O Hallquist, Mars 2006.[21] Introduction to Composite Material Modeling with LS-DYNA. Stefan Hartmann, Thomas Kloppel, Cristian
Liebold, Dynamore, 2014.[22] ().[23] P. Maimı et al. A continuum damage model for composite laminates: Part I – Constitutive model.
Mechanics of Materials 39.10 (2007), 897–908.[24] P. Maimı et al. A continuum damage model for composite laminates: Part II – Computational implemen-
tation and validation. Mechanics of Materials 39.10 (2007), 909–919.[25] LS-DYNA Keyword Users Manual - Volume II. Material Models. Version R7.1 (revision: 5442). Livermore
Software Technology Corporation, May 19, 2014.[26] Radioss Theory Manual. Large displacement Finite Element Analysis Chapter 8 - Interfaces. Version 12.0.
Altair Engineering, Inc., November 2012.[27] Radioss Theory Manual. Large displacement Finite Element Analysis Chapter 5 - Element library.
Version 12.0. Altair Engineering, Inc., November 2012.
79

[28] A. HyperWorks. HyperWorks for Composite Analysis. 2013.[29] Altair RADIOSS 12.0. Reference guide. Version 12.0. Altair Engineering, Inc., 2013.[30] Radioss Theory Manual. Large displacement Finite Element Analysis Chapter 9 - Materials. Version 12.0.
Altair Engineering, Inc., November 2012.[31] Experimental investigation of high strain-rate behaviour of fabric composites. Composite Structures 106.0
(2013), 264 –269. issn: 0263-8223.

Appendices

A Appendix - MAT54
A.1 Material card used in base line model using MAT54
Table A.1: Baseline values for material card MAT54
Card 1 MID RO EA EB (EC) PRBA (PRCA) (PRCB)
1 1.52E-9 127000 8140 - 0.02049 - -
Card 2 GAB GBA GCA (KF) AOPT
4210 4210 4210 - 2
Card 3 A1 A2 A3 MANGLE
1 0 0 -
Card 4 V1 V2 V3 D1 D2 D3 DFAILM DFAILS
- - - - - - 0.10 0.10
Card 5 TFAIL ALPH SOFT FBRT YCFAC DFAILT DFAILC EPS
8E-9 0.1 0.95 0.9 6 0.10 -0.10 -
Card 6 XC XT YC YT SC CRIT BETA
1470 2200 199 48.9 154 MAT54 0.5
Card 7 PFL EPSF EPSR TSMD SOFT2
1 - - - 1
Card 8 SLIMT1 SLIMC1 SLIMT2 SLIMC2 SLIMS NCYRED SOFTG
1 1 1 1 1 - -
Card 9 LCXC LCXT LCYX LCYC LCSC DT
- - - - - -
I

A.2 Parameter study - Sensitivity of material model parameters inMAT54
The sensitivity of the model parameters in material model MAT54 are investigated in this section. A parameterstudy has been performed where the baseline model is changed with one parameter at a time, see Table A.2.
Table A.2: Parameter study - Model parameters in MAT54
Parameter: Baseline value: Parametric variation:
SOFT 0.95 0.50, 0.70, 0.90, 0.95, 0.97, 0.99, 1 (Off)
FBRT 0.9 0.50, 0.80, 0.90, 1 (Off)
YCFAC 6 0 (Off), 2, 4, 6, 7
SLIM(T1,T2,C1,C2,S) 1 0.10, 0.50, 0.90, 0.95, 1 (Off)
PFL 1 0.49, 0.50, 0.9, 0.95, 1 (Off)
ALPH 0.1 0, 0.10, 0.50, 1
BETA 0.5 0, 0.10, 0.50, 1
DFAILT 0.10 0 (Off), 0.01, 0.05, 0.10, 0.20
DFAILC -0.10 0 (Off), -0.01, -0.05, -0.09, -0.10, -0.12, -0.20
DFAILM 0.10 0 (Off), 0.01, 0.05, 0.10, 0.20
DFAILS 0.10 0 (Off), 0.01, 0.05, 0.10, 0.20
SOFT
Even though the crashfront algorithm is partly suppressed for the base line model, compared to an uniformmesh, the SOFT parameter is still important. Both the reaction force and the absorbed energy are considerablylowered as the SOFT parameter is gradually reduced from 100% to 50%, see Figure A.1. A surprising conclusionis that the progressive behavior can be achieved even when the SOFT parameter is turned off, not possible forthe case with uniform mesh.
(a) (b)
Figure A.1: Parameter study with different SOFT values. (a) Comparison of reaction forces. (b) Comparisonof absorbed Energies.
II

YCFAC and FBRT
FBRT and YCFAC reduces the strength in fiber tension and compression respectively. A gradually decrease intensile strength from 100% down to 50% by lowering the FBRT parameter, slightly lowers the reaction forceand energy in the simulation, see Figure A.2. The tensile fiber mode only has a small effect on the simulation,since the laminate is compressed and not stretched. The YCFAC parameter on the other hand has a big effecton the result. A variation in the interval of 2 to 7 corresponding to a compressive fiber strength reduction of73% and 4% respectively, had a large affect on the reaction force and energy in the system, see Figure A.3.
(a) (b)
Figure A.2: Parameter study with different FBRT values. (a) Comparison of reaction forces. (b) Comparisonof absorbed Energies.
(a) (b)
Figure A.3: Parameter study with different YCFAC values. (a) Comparison of reaction forces. (b) Comparisonof absorbed Energies.
III

Residual stresses
The residual stress for different directions; SLIMC1, SLIMC2, SLIMT1, SLIMT2, SLIMS was changed all atonce in the parameter study. A lowered residual stress will lower the energy in the system compared to thedefault ideal-plastic stress behavior, but not as much as expected, A.4. A too low residual stress, i.e. beneath50% of the strength limit, will either cut of big pieces, see Figure A.5a or make the laminate explode, see FigureA.5b.
(a) (b)
Figure A.4: Parameter study with different residual stresses. (a) Comparison of reaction forces. (b) Comparisonof absorbed Energies.
(a) (b)
Figure A.5: Two illustrations of the behavior of the residual stresses. (a) SLIM=0.1 - Laminate will explode.(b) SLIM=0.5 - Big pieces will be cut off.
IV

PFL
The PFL parameter exhibits an unexpected behavior. When the percentage of the layers needed to fail untilthe crashfront algorithm is initiated, is lower below 100% the reaction force and absorbed energy is loweredas well. But for all reductions, 90% to 49%, the response will be exactly the same. An explanation is thathalf of the plies have a 0◦fiber direction and the remaining half have a 90◦fiber direction. Since the strainis measured for the whole element, all plies with the same fiber direction will be deleted at the same time,thus the crashfront algorithm can only distinguish between 100% or 50% of the deleted plies. The value ofPFL=49% should however effect the result. An explanation could be that the value is rounded up to 50%.
(a) (b)
Figure A.6: Parameter study with different PFL values. (a) Comparison of reaction forces. (b) Comparison ofabsorbed Energies.
Failure strains
Generally, a low strain limit gives a low energy response, whereas a high strain limit increases the energy in thesystem as the elements are kept for a longer time. The maximum strain limits are vital parameters to specifycorrectly. In these simulations gave strain limits for, DFAILT, DFAILM and DFAILS below 5%, a catastrophicfailure, whereas the DFAILC had 9% as the lowest limit.
By turning off DFAILC the whole simulation will failed completely. For strain limits beneath 9%, big pieces ofthe laminate is cut off, see Figure A.8. Comparison of reaction forces and energies for DFAILC, can be seenin Figure A.7. If DFAILM is turned off, the FBRT and YCFAC parameters are disabled, and the reactionforce and energy will be very high, see Figure A.9, but the simulation can still be run. For a too low strainlimit, beneath 5%, the laminate will be cut into pieces. Both DFAILC and DFAILM have a big impact on thesimulation according to the energy curves and should not be turned off.
If DFAILS is turned off the simulation can be run, but with big pieces cut off from the laminate and for astrain limit beneath 5%, the whole laminate will explode, see Figure A.11. A similar behavior has also beenobserved associated to DFAILT. If this option is turned off, global buckling occurs and for a too low strainvalue, big pieces are cut off from the laminate, see Figure A.13. When a good progressive failure is achievedthe different values on the tensile strain limit will not have a big affect on the result. Comparison of reactionforces and energies for DFAILS and DFAILT, can be seen in Figure A.10 and A.12, respectively.
V

(a) (b)
Figure A.7: Parameter study with different DFAILC values. (a) Comparison of reaction forces. (b) Comparisonof absorbed Energies.
(a) (b)
Figure A.8: Two illustrations of the behavior of different DFAILC values. (a) DFAICS=0.01 - Big pieces willbe cut off. (b) DFAILC=0.05 - Big pieces will be cut off.
VI

(a) (b)
Figure A.9: Parameter study with different DFAILM values. (a) Comparison of reaction forces. (b) Comparisonof absorbed Energies.
(a) (b)
Figure A.10: Parameter study with different DFAILS values. (a) Comparison of reaction forces. (b) Comparisonof absorbed Energies.
VII

(a) (b)
Figure A.11: Two illustrations of the behavior of different DFAILS values. (a) DFAILS=OFF - Big pieces willbe cut off. (b) DFAILS=0.01 - Exploded laminate.
(a) (b)
Figure A.12: Parameter study with different DFAILT values. (a) Comparison of reaction forces. (b) Comparisonof absorbed Energies.
VIII

(a) (b)
Figure A.13: Two illustrations of the behavior of different DFAILT values. (a) DFAILT=OFF - Global buckling.(b) DFAILT=0.01 - Big pieces will be cut off.
ALPH and BETA
Variation of the ALPH and BETA parameters only have a small effect on the result, compared to the otherparameters. In Figures A.14 and A.15, the result from the parametric study can be seen for ALPH and BETAparameter, respectively.
(a) (b)
Figure A.14: Parameter study with different ALPH values. (a) Comparison of reaction forces. (b) Comparisonof absorbed Energies.
IX

(a) (b)
Figure A.15: Parameter study with different BETA values. (a) Comparison of reaction forces. (b) Comparisonof absorbed Energies.
A.3 Parameter study - Sensitivity of simulation model for MAT54
The sensitivity of the setup of the simulation model is discussed in this section. A short parameter study hasbeen performed to analyze the effect of the used velocity. Different approaches for the modeling of the triggerrow have also tested in order to analyze the effect on the initial peak of the reaction force. In Table A.3, theparametric variations can be seen.
Table A.3: Parameter study - Model parameter in MAT54
Parameter: Baseline model: Variation in simulation model:
Velocity 2000 mm/s 20 mm/s, 200 mm/s, 2000 mm/s
Trigger thick-ness
0.50 mm t=0.50 mm, Strength=25%t=0.50 mm, Strength=50%t=0.50 mm, Baseline valuest=1.00 mm, Strength=50%t=1.00 mm, Baseline values
Influence of crushing velocity
The quasi-static test was performed with a velocity of 0.42 mm/s (1 in./min). Such a low crushing speed wouldbe extremely costly to simulate. Since no strain rate dependent parameters are defined for the material model,vibrations and wave propagation are the only dynamic aspect affecting the simulation by an increased crushingspeed. With added damping, the assumption was that the effect of the increased velocity would be canceledout. However, a notable difference can be seen in the result, see Figure A.16. The highest velocity, 2000 mm/s,gives the highest response and the lowest velocity, 20 mm/s gives the lowest response. The increased velocity isnecessary to reduce the simulation time. Increased damping could reduce the dynamic effects further.
X

(a) (b)
Figure A.16: Parameter study with different velocities. (a) Comparison of reaction forces. (b) Comparison ofabsorbed Energies.
Influence of different triggers
In Figure A.17 the reaction force and absorbed energy can be seen for triggers with different thickness andstrengths. A too strong trigger can make the whole laminate to buckle or to initiate failure in the wrong placeof the laminate. A trigger thickness of 1 mm will cause the laminate to break at the middle and the initialpeak will be very high. Generally, a thin trigger with low strength, will lower the initial force peak. Even atrigger thickness of 1 mm can be used if the strength is decreased. However, the thinest trigger with the loweststrength, do not give the lowest force peak. The failure initiation is hard to control and the trigger can not bemade to mimic the test data.
(a) (b)
Figure A.17: Parameter study with different triggers. (a) Comparison of reaction forces. (b) Comparison ofabsorbed Energies.
XI

B Appendix - MAT262
B.1 Material card used in the simulation with uniform mesh modelusing MAT262
Table B.1: Material card MAT262 with values for simulation with uniform mesh
Card 1 MID RO EA EB EC PRBA PRCA PRCB
1 1.52E-9 127000 8140 8140 0.02049 0.02049 0.3
Card 2 GAB GBA GCA AOPT DAF DKF DMF EFS
4210 4210 4210 2 0 0 0
Card 3 XP YP ZP A1 A2 A3
- - - 1 0 0
Card 4 V1 V2 V3 D1 D2 D3 MANGLE
- - - - - - -
Card 5 GXC GXT GYC GYT GSL GXCO GXTO
100 300 60 60 60 100 500
Card 6 XC XT YC YT SL XCO XTO
1470 2200 199 48.9 154 400 800
Card 7 FIO SIGY ETAN BETA PFL PUCK SOFT
53 - - - - - 1
XII

B.2 Material card used in the simulation with irregular mesh modelusing MAT262
Table B.2: Material card MAT262 with values for simulation with irregular mesh
Card 1 MID RO EA EB EC PRBA PRCA PRCB
1 1.52E-9 127000 8140 8140 0.02049 0.02049 0.02049
Card 2 GAB GBA GCA AOPT DAF DKF DMF EFS
4210 4210 4210 2 1 0 0
Card 3 XP YP ZP A1 A2 A3
- - - 1 0 0
Card 4 V1 V2 V3 D1 D2 D3 MANGLE
- - - - - - -
Card 5 GXC GXT GYC GYT GSL GXCO GXTO
30 40 40 40 40 100 120
Card 6 XC XT YC YT SL XCO XTO
1470 2200 199 48.9 154 300 300
Card 7 FIO SIGY ETAN BETA PFL PUCK SOFT
53 - - - - - 1
XIII

C LAW 25
C.1 Sensitivity of material model parameters in LAW 25
Preliminary simulations resulted in a parameter setup which gave a fairly stable model. With this setup, aparameter study was executed. Important parameters were varied to investigate how the response would change.The results from the parameter study gave a better understanding of the material model and an optimizedparameter setup could be defined. This setup of parameters is the baseline model, described in Section 6.2.4,with which mesh dependency studies were performed, presented in Section 6.2.5.
The variation of parameters that was used in the study is listed in Table C.1. Since the model that was usedbefore the parameter study gave a too stiff response, the general goal was to investigate how the load could belowered, thus many of the parameter variations are lower than than the start values.
The mesh that was used in the parameter study was with uniform quad elements with a size of 1x1 mm2.
Table C.1: Parameter study - LAW 25
Parameter: Start values: Variation in simulation model:Tensile rupture strains εt1 = 0.010
εt2 = 0.0085εt1 = 0.008, εt2 = 0.005εt1 = 0.0085, εt2 = 0.006εt1 = 0.009, εt2 = 0.0075εt1 = 0.010, εt2 = 0.0085εt1 = 0.011, εt2 = 0.009
Maximum tensile strains εm1 = 0.016εm2 = 0.015
εm1 = 0.013, εm2 = 0.012εm1 = 0.014, εm2 = 0.013εm1 = 0.015, εm2 = 0.014εm1 = 0.016, εm2 = 0.015εm1 = 0.017, εm2 = 0.016
Initial softening strains εc11 = 0.012εc21 = 0.017
εc11 = 0.010, εc21 = 0.015εc11 = 0.011, εc21 = 0.016εc11 = 0.012, εc21 = 0.017εc11 = 0.013, εc21 = 0.018εc11 = 0.014, εc21 = 0.019
Maximum softeningstrains
εc12 = 0.10εc22 = 0.10
εc12 = 0.07, εc22 = 0.07εc12 = 0.10, εc22 = 0.07εc12 = 0.07, εc22 = 0.10εc12 = 0.10, εc22 = 0.10εc12 = 0.12, εc22 = 0.12
Maximum plastic work Wpmax = 4.75 Wpmax = 4.3Wpmax = 4.55Wpmax = 4.65Wpmax = 4.75Wpmax = 4.85
Residual stresses σc1rs = 570σc2rs = 110σt12rs = 50
σc1rs = 100, σc2
rs = 20, σt12rs = 10
σc1rs = 300, σc2
rs = 50, σt12rs = 30
σc1rs = 570, σc2
rs = 110, σt12rs = 50
σc1rs = 700, σc2
rs = 120, σt12rs = 60
σc1rs = 900, σc2
rs = 140, σt12rs = 80
Yield stress (compressionand shear)
σc1y = 710σc
2y = 90σt
12y = 45
σc1y = 690, σc
2y = 80, σt12y = 30
σc1y = 700, σc
2y = 85, σt12y = 40
σc1y = 710, σc
2y = 90, σt12y = 45
σc1y = 720, σc
2y = 95, σt12y = 50
σc1y = 730, σc
2y = 100, σt12y = 55
Continued on next page
XIV

Table C.1 – Continued from previous pageParameter: Start values: Variation in simulation model:Hardening coefficients(compression and shear)
bc1 = 0.135, nc1 = 0.81bc2 = 0.115, nc2 = 0.80b12 = 2.2, n12 = 0.3
bc1 = 0.125, nc1 = 0.725, bc2 = 0.100,nc2 = 0.70, b12 = 2.0, n12 = 0.24
bc1 = 0.128, nc1 = 0.750, bc2 = 0.105,nc2 = 0.725, b12 = 2.1, n12 = 0.26bc1 = 0.131, nc1 = 0.775, bc2 = 0.110,nc2 = 0.750, b12 = 2.15, n12 = 0.28bc1 = 0.135, nc1 = 0.81, bc2 = 0.115,nc2 = 0.80, b12 = 2.2, n12 = 0.3bc1 = 0.138, nc1 = 0.825, bc2 = 0.120,nc2 = 0.800, b12 = 2.25, n12 = 0.32bc1 = 0.141, nc1 = 0.850, bc2 = 0.125,nc2 = 0.825, b12 = 2.3, n12 = 0.34bc1 = 0.144, nc1 = 0.875, bc2 = 0.130,nc2 = 0.850, b12 = 2.35, n12 = 0.36
Residual stiffness dmax = 0.914 dmax = 0.88dmax = 0.90dmax = 0.914dmax = 0.93dmax = 0.95
The results from the parameter study showed that variation of a single parameter is not sufficient to obtain areduced force in the force-displacement plot. The response could be altered completely. Many of the variationswas however done in pairs of parameters. For example, the tensile rupture strains in both fiber and transversedirection were varied simultaneously. The results from varying the tensile rupture strains show that the responsechanges quite much, even though small variations are made. This can be seen in Figure C.1 and C.2, where itis clear that the model is very sensitive. The larger drops in the force-displacement curves indicates that therehas been deletion or detachment of more than one row at the crush front. This behavior is unwanted.
XV

Figure C.1: Force-displacement curves for variation of tensile rupture strains, εt1 and εt2.
Figure C.2: Energy-displacement curves for variation of tensile rupture strains, εt1 and εt2.
In order to find a better agreement with test data, more parameter variations have to be taken in consideration.An idea was that decreasing the yield limits would give lower response in the force-displacement curve. This,however, only led to instabilities as well, as for the case of other parameter variations.
C.2 Influence of crushing velocity with RADIOSS model
An important variation to investigate was the velocity of the crushing, see Table C.2. An increase of velocitywas done in order to reduce simulation time. Therefore as mentioned in Subsection 6.1.1 damping was addedto reduce the dynamic effects, introduced by the increased velocity.
Table C.2: Veloctiy variations with the RADIOSS model
Parameter: Start value: Variation in simulation model:Velocity 2000 mm/s 20 mm/s
200 mm/s2000 mm/s
Figure C.3 and C.4 shows the results from the velocity variation. The difference in response at very lowdisplacement can be explained by the fact the ramping (i.e. the acceleration) of the velocity was not scaled. Abetter way would have been to scale the ramping proportionally. The cases where the velocity is 20 mm/sand 2000 mm/s give fairly similar results, while the case where 200 mm/s gives a little less stable response.With these results at hand, it seems like the velocity increase actually can be troublesome, but the increase was
XVI

highly necessary. The simulation with 2000 mm/s took about 30 minutes on 8 cores, while the simulations for200 and 20 mm/s took 75 minutes and 12 hours respectively on 8 cores.
Figure C.3: Force-displacement curves for variation of crushing velocity.
Figure C.4: Energy-displacement curves for variation of crushing velocity.
XVII

C.3 Material Parameters of the Baseline Model with LAW 25
Table C.3: Material card LAW 25, baseline model
(1) (2) (3) (4) (5) (6) (7) (8) (9) (10)
Card 1 ρ
1.52E-9
Card 2 E11 E22 ν12 Iflag E33
127000 8410 0.309 1
Card 3 G12 G23 G31 εf1 εf2
4210 4210 4210 0.06 0.06
Card 4 εt1 εm1 εt2 εm2 dmax
0.011 0.016 0.009 0.016 0.91
Card 5 Wpmax Wpref Ioff Iflawp
4.75 6
Card 6 c ε0 α ICCglobal
0 0 1
Card 7 σt1y b1
t n1t σt
1max c1t
2190 0.13 0.8 2200 0
Card 8 εt11 εt12 σt1rs Wpmax
t1
Card 9 σt2y b2
t n2t σt
2max c2t
48 0.13 0.8 48.9 0
Card 10 εt21 εt22 σt2rs Wpmax
t2
Card 11 σc1y b1
c n1c σc
1max c1c
730 0.13 0.81 1470 0
Card 12 εc11 εc12 σc1rs Wpmax
c1
0.013 0.10 600 0
Card 13 σc2y b2
c n2c σc
2max c2c
100 0.12 0.8 199 0
Card 14 εc21 εc22 σc2rs Wpmax
c2
0.018 0.10 120
Card 15 σt12y b12
t n12t σt
12max c12t
45 2.2 0.3 154 0
Card 16 εt121 εt12
2 σt12rs Wpmax
t12
0.065 0.12 50
Card 17 γini γmax dmax
Card 18 Fsmooth Fcut
XVIII