Crash wortiness
68
Fundamental Principles for Vehicle/ Occupant System Analysis Page 159 Fundamental Principles f undamental Principles f undamental Principles f undamental Principles f undamental Principles for or or or or Vehicle/Occupant Syst ehicle/Occupant Syst ehicle/Occupant Syst ehicle/Occupant Syst ehicle/Occupant Systems ems ems ems ems Analysis Analysis Analysis Analysis Analysis Clifford C. Chou 4.1 Introduction Restraint systems are safety devices that are designed to assist in restraining the occupant in the seating position, and help reduce the risk of occupant contact with the vehicle interior, thus helping reduce the risk of injury in a vehicular crash event. This chapter describes fundamental dynamics principles for occupant restraint systems analysis. These principles are essential and are the established basis on which restraint systems are designed and analyzed for the problems involved in automotive safety. At its simplest, automotive safety is a matter of reducing the relative velocity between the occupants and the vehicle interior to help reduce the risk of injury to the occupant during a collision. Newton’s Laws indicate that a change in an occupant’s velocity requires a force to be applied to the occupant. To reduce the risk of injury to the occupant, safety engineers analyze the maximum force that can be applied to the driver or passenger without injury. Consequently, it is necessary to quantify the injury parameters in a manner that permits them to be used as performance numbers in safer designs. Since automobile manufacturers must design their products to comply with certain Federal Motor Vehicle Safety Standards (FMVSS) for occupant protection, the injury criteria specified in these standards must be met. Standards pertaining to occupant protection are FMVSS 208 for frontal impact protection and FMVSS 214 for side impact protection, which will be described later. All new cars to be sold in the United States are also required to meet a range of federal safety standards that meet the need for motor vehicle safety features such as windshields that resist penetration and steering wheel assemblies designed to absorb crash energy and help cushion the occupants upon impact. The most familiar safety restraint features required by federal standard are safety belts and supplemental air bag restraint systems. Other non-regulated restraint systems
-
Upload
independent -
Category
Documents
-
view
0 -
download
0
Transcript of Crash wortiness

Fundamental Principles for Vehicle/Occupant System Analysis
Page 159
FFFFFundamental Principles fundamental Principles fundamental Principles fundamental Principles fundamental Principles forororororVVVVVehicle/Occupant Systehicle/Occupant Systehicle/Occupant Systehicle/Occupant Systehicle/Occupant Systemsemsemsemsems
AnalysisAnalysisAnalysisAnalysisAnalysisClifford C. Chou
4.1 Introduction
Restraint systems are safety devices that are designed to assist in restraining theoccupant in the seating position, and help reduce the risk of occupant contactwith the vehicle interior, thus helping reduce the risk of injury in a vehicular crashevent. This chapter describes fundamental dynamics principles for occupantrestraint systems analysis. These principles are essential and are the establishedbasis on which restraint systems are designed and analyzed for the problemsinvolved in automotive safety.
At its simplest, automotive safety is a matter of reducing the relative velocitybetween the occupants and the vehicle interior to help reduce the risk of injury tothe occupant during a collision. Newton’s Laws indicate that a change in anoccupant’s velocity requires a force to be applied to the occupant. To reduce therisk of injury to the occupant, safety engineers analyze the maximum force thatcan be applied to the driver or passenger without injury. Consequently, it isnecessary to quantify the injury parameters in a manner that permits them to beused as performance numbers in safer designs. Since automobile manufacturersmust design their products to comply with certain Federal Motor Vehicle SafetyStandards (FMVSS) for occupant protection, the injury criteria specified in thesestandards must be met. Standards pertaining to occupant protection are FMVSS208 for frontal impact protection and FMVSS 214 for side impact protection,which will be described later.
All new cars to be sold in the United States are also required to meet a range offederal safety standards that meet the need for motor vehicle safety features suchas windshields that resist penetration and steering wheel assemblies designed toabsorb crash energy and help cushion the occupants upon impact. The mostfamiliar safety restraint features required by federal standard are safety belts andsupplemental air bag restraint systems. Other non-regulated restraint systems

Fundamental Principles for Vehicle/Occupant System Analysis
Page 160
include energy- absorbing E-A (or collapsible) steering column and E-A kneebolsters.
There is abundant literature dealing with the effectiveness of restraint systemssuch as belts and supplemental airbags in providing occupant protection inautomobile crashes. Statistics indicate that mandatory seat belt usage and airbagshave significantly reduced occupant fatality and injury (see Chapter 7 -Anthropomorphic Test Devices). In addition, each vehicle design must complywith FMVSS 208 and 214 for frontal and side impact occupant protection,respectively. The requirements of the FMVSS 208 standard include a 30 mph (48k/hr) impact to a non-movable rigid barrier. New FMVSS 208 requires also theoffset impact and the rigid barrier impact at different velocities. This chapteraddresses only the rigid barrier impact tests in which the potential injury to theoccupant is assessed by using Hybrid III anthropomorphic dummies (refer toChapter 7 – Anthropomorphic Test Devices for details). Hybrid III, the mostadvanced test dummy for frontal impact, possesses human-like impact responsein critical body regions such as the head, neck and thorax. Injury severity indicesmeasured from Hybrid III in barrier tests include the Head Injury Criterion (HIC),chest G, chest deflection, femur load and neck loads and moments. Therequirements of FMVSS 214 are assessed using a moving deformable barrier(MDB) impacting the driver side of a target vehicle. Potential injury includespeak pelvic acceleration and TTI (Thoracic Trauma Index). If any of these injuryseverity indices exceeds the dummy performance number limits specified by thestandards, the vehicle design must be modified until the requirements are met.However, relying exclusively on crash tests for design improvement is veryinefficient. Furthermore, in the early stage of design, not all hardware has beenfabricated, yet competing design concepts must be evaluated.
With rapid advancement in digital computer technology and CAE methodology,simulation has become an essential and useful tool in the design stage.Mathematical models can provide quick assessment of various design conceptsand explore new design directions. A review of mathematical models widely usedby the automotive industry for occupant simulations is given by Prasad andChou [1]. Detailed occupant modeling technology for restraint systems is alsopresented in Chapter 5 – Design Tools: Human Body Modeling.
To design an effective restraint system that stops the occupant within the vehiclecompartment without injuring the occupant, it is essential to know the requiredstopping distance. An example: consider the stopping distance required by thechest if the tolerance level of 60 g’s is not to be exceeded. Note that a “g” isusually used in the automotive safety field to indicate a force being applied to anoccupant, as will be described later. First, the optimum or minimum stopping

Fundamental Principles for Vehicle/Occupant System Analysis
Page 161
distance would be achieved with a square wave (uniform) deceleration pulse,a.k.a. Equivalent Square Wave (ESW). This would require a 6-in stopping distancefrom 30 mph, or a 24-in stopping distance from 60 mph. These values are optimumand will never be reached in practice. A more reasonable stopping pulse shape isa half-sine deceleration pulse, which requires 9.7 in from 30 mph and 37.7 in from60 mph without exceeding 60 g’s. Thus, it is obvious that larger distances arerequired to stop from high velocities at sub-injury levels. Studies of stoppingdistance under various ideal pulses are given by Patrick [2], and Chou and Nyquest[3].
Now considering the vehicle, available distances can be determined. In a 30-mphbarrier collision, a typical full-size car can have up to 28 in of front-end crush. TheNational Highway Transportation Safety Administration (NHTSA) has conductednumerous New Car Assessment Programs (NCAP) on cars produced byautomobile manufacturers, and maintains a crash database with a range of dynamiccrush information and occupant response data. In addition, there is about 15 inbetween the occupant and the interior, and during impact perhaps as much as 6 indeformation of the interior compartment, for a total of about 49 in. Referring backto the 60 g’s half-sine wave example, it appears that occupants should be able tosurvive a 60 mph collision, which requires a stopping distance of 37.7 in with theassumed half-sine pulse shape. In a barrier collision such as a car striking abridge abutment or some other immovable object (which is extremely rare in thereal world), the vehicle stops before an unrestrained occupant hits the interior. Inthis case, the front-end crush and the interior space are of no value. The occupantcontinues forward at the original vehicle velocity until striking the stopped interiorwith only the assumed 6 in of stopping distance available.
It is obvious that to survive high-speed collisions, it is essential to use the front-end crush and available distance between the occupant and the interior. This isaccomplished when a restraint is used. The air bag, energy absorbing steeringcolumn and safety belts are all restraint systems that slow the occupant shortlyafter the vehicle starts to decelerate. The front-end crush and interior distance areboth useful to some extent. Part of the distance is lost in a harness by slack andbelt stretch. The distance between the driver and the steering wheel is lost in thecase of the energy-absorbing column restraint, and the distance of the front-endcrush and occupant space traversed during the sensing and deployment time forthe air bag are lost. However, the remaining useful distance does increase thesurvival velocity appreciably. Occupant kinematics under a given restraint systemwill be described later using simple models. Details of a barrier crash will now beconsidered to show the temporal requirements of the restraint systems. Dynamicside impact test procedure used in FMVSS 214 and side impact analysis is givenin Section 4.4 – Application of Concepts to Vehicle/Occupant Analysis.

Fundamental Principles for Vehicle/Occupant System Analysis
Page 162
4.2 Barrier Collision
Analysis of a vehicle in a frontal crash event, in general, consists of studies ofthe vehicle response and the occupant response. Basically, there are two stagesin a vehicle frontal impact with a fixed barrier: the primary and the secondaryimpacts. The primary impact is the collision between the vehicle front-end structureand the fixed barrier. During this impact mode, the major portion of the crashenergy is absorbed by way of structural deformation that produces a crash pulsetransmitted to the occupant compartment. The compartment intrusion is largelyaffected by the extent of the vehicle front-end deformation which is, in turn,influenced by vehicle design parameters such as the strength of the structuralmembers, the available package space, the stack-up of non-crushable powertraincomponents, the vehicle mass, and the test speed. The secondary impact isbetween the occupant and the restraint system and/or the vehicle interior. Theoccupant responses are measured by parameters such as the HIC, chest g’s,chest deflection, and femur loads. These are affected by the vehicle crash pulse,the extent of the intrusion and the intrusion rate into the occupant compartment,the restraint system, the vehicle interior profile/stiffness, and the dummyconstruction/instrumentation.
Traditional design methodology requires full vehicle crash testing to determineresponses of an occupant, restrained or unrestrained, when contacting vehicleinteriors with or without compartment intrusion. Integrated structural andoccupant simulation modeling offers several potential advantages over thetraditional full-vehicle crash testing. These include early design guidance, shortervehicle design and development time, optimization of structural and packageefficiency, evaluation of design alternatives and reduced prototype testrequirements.
Since the frontal rigid barrier collision is considered to be the most severe andperhaps the most easily reproduced, it was used as the basis for comparingperformance of safety systems in the past. FMVSS 208 adopts this test mode asa standard to evaluate the vehicle crashworthiness for occupant protection. Thisstandard specifies performance requirements for the protection of vehicleoccupants in crashes. The purpose of establishment of the standard is to reducethe number of deaths of vehicle occupants and the severity of injuries on theroads. This is accomplished by specifying vehicle crashworthiness requirementsin terms of force and deceleration measurements on a 50th-percentile Hybrid IIIdummy as a human surrogate in crash tests, and by specifying active and passiverestraint requirements. Descriptions of the development and biofedelity of various

Fundamental Principles for Vehicle/Occupant System Analysis
Page 163
anthropomorphic test dummies are given in Chapter 7 – Anthropomorphic TestDevices.
To meet the requirements of FMVSS 208, vehicles impacting a fixed barrier eitherperpendicular or at a 30 degree angle at a speed of 30 mph must provide protectionfor the front-seated Hydrid III dummy occupants as follows:
a) Head Injury Criterion (HIC) - The resultant acceleration at the center of gravityof the dummy head must be such that the expression:
( )HICt t
adt t tt
t=
−
−∫
1
2 1
2 5
2 11
2
.
(4.2.1)
does not exceed 700 where a is the resultant acceleration expressed as a multipleof g, and t1 and t2 are any two points in time during the crash of the vehicle whichare within a 15 ms time interval.
b) Chest Injury (CLIP) - The resultant acceleration at the center of gravity of thedummy chest shall not exceed 60 g’s, except for the intervals whose cumulativeduration is not more than 3 ms.
c) Femur Loads - The compressive force transmitted axially through each dummyupper leg shall not exceed 2,250 lbs.
d) Chest Deflection - The chest deflection shall not exceed 76.2 mm.
Barrier test vehicles are instrumented to provide vehicle acceleration/decelerationdata that are representative of an acceleration experienced in the passengercompartment. Generally, two triaxial accelerometers are mounted to the rockerpanels at the base of the B-pillar for such measurements. In the analysis of frontalbarrier or rear impacts, it is customary to use the vehicle longitudinal componentof acceleration from underneath the B-pillar, located in an undeformed area of thevehicle occupant compartment. In general, the deceleration-time history is asuperposition of a spectrum of frequencies representing the instrumentationnoises, elastic-plastic vibrations, structural collapse, and engine/accessoriesinteractions as they impact one another. An unfiltered or raw deceleration-timehistory provides little information of value. In order to utilize crash data,techniques for characterizing the deceleration pulse with various degrees ofapproximations have been developed. Several techniques have been developedto characterize the vehicle compartment deceleration pulse, along with the

Fundamental Principles for Vehicle/Occupant System Analysis
Page 164
associated vehicle structural configuration for identifying significant structuralbehavior of the vehicle in a frontal barrier crash. Huang et al [4] and Chou and Lim[5] have presented and summarized these techniques. Equivalent Square Wave(ESW), mentioned in the Introduction section, is a specific type of thischaracterization, and will be discussed later.
The barrier collision is the most severe type of collision. A 30 mph barrier collision,for example, is approximately equal to a head-on collision in which two identicalcars are both traveling at 30 mph. Another illustration of its severity is shown bya front-end collision in which the bullet or the striking car traveling 60 mph strikesa stationary vehicle, resulting in about the same severity of collision as the 30mph barrier collision.
A collision sequence can best be explained by referring to the events during thecollision and the record of the collision. A mid-sized car crashed into a 120,000-lbreinforced concrete barrier at 32.2 mph, shown in Figure 4.2.1. The driver was anunbelted 50th-percentile Hybrid III dummy protected by the steering assemblyairbag. The right front passenger was an identical dummy restrained by a three-point restraint system design.
In addition to vehicle instrumentation, both the driver and right front passenger50th-percentile Hybrid III dummies are instrumented with triaxial accelerometers atthe centers of gravities of the head and chest, and load cells at the femur. Therecorded data are processed according to SAE J211 specification as shown inTable 4.2.1. The filtered data are then analyzed for calculating injury performancenumbers mentioned above, and used further for assessing dummy performancein compliance with FMVSS 208.
4.3 Basic Laws and Concepts of Motion
Basic laws and concepts of motion are covered in Mechanics, which is the physicalscience concerned with the motion and deformation of bodies under the action offorces. It is the basic science underlying much of engineering analysis and willbe applied to understanding of the vehicle and occupant under the influence offorces and the operation of occupant restraint systems in automobiles.
The four fundamental elements of mechanics are force (F), mass (M), length (L)and time (T). However, only three independent dimensions are needed, namely,MLT or FLT, but the concept of force is not truly defined by saying that itsdimension is ML/T2. Some of the characteristics of forces and mass are discussedbelow.

Fundamental Principles for Vehicle/Occupant System Analysis
Page 165
Force is a push or a pull exerted on a body. In Newton’s formulation, it was the“action of one body to another body.” It may be exerted by actual contact or ata distance as in case of gravitational forces and magnetic forces. It is oftenconvenient, however, to think of the force as being exerted by a force field on abody, without inquiring too closely into what bodies are responsible for thepresence of the field. This is especially useful for the force on a charged particlein an electrical or magnetic field whose form may be known either from a theoretical
Table 4.2.1 Data fData fData fData fData filtiltiltiltiltering reqering reqering reqering reqering requirementsuirementsuirementsuirementsuirements
Fig. 4.2.1 Mid sized vehicle crash against a full rigidbarrier
epyTataD epyTataD epyTataD epyTataD epyTataD ssalCretliF ssalCretliF ssalCretliF ssalCretliF ssalCretliF
daeH noitarelecca 0001EAS
tsehCnoitarelecca 081EAS
noitcelfed 081EAS
rumeF daol 06EAS

Fundamental Principles for Vehicle/Occupant System Analysis
Page 166
calculation or by an experimental mapping of the field. Force is a vector quantityand possesses the following characteristics:
magnitudedirectionpoint of application (or line of action in rigid-body mechanics)
The magnitude of a force measures how large or intense it is, and is oftenrepresented graphically by the length of an arrow (as in a vector sense) along theline of action. The direction of a force is defined by the line of action and thesense of the force as indicated by an arrow.
In rigid-body mechanics, the point of application does not matter, since the forcewill have the same effect no matter where it is applied on its line of action. This issometimes called the principle of transmissibility. The effects of a force acting ona body are of two kinds:
external effects (rigid body)• acceleration of the body if it is unconstrained (change of motion)• bringing into action other forces (support reaction) if it is constrainedinternal effects (deformable body)• deformation (changing in shape and size)
The distinction is artificial but useful. A rigid body is an idealization, but if thedeformations of a body are small enough, the external and internal effects mayfrequently be analyzed separately. This Chapter will not discuss internal effects,which are a principal concern of strength of materials. The two kinds of effectsfurnish two methods by which force magnitudes may be measured: stretching acalibrated spring balance, and observing the acceleration imparted to a standardmass.
Mass is a scalar quantity of matter in a body, measuring the inertia of a body withrespect to its tendency to resist being accelerated when acted upon by a givenunbalanced force. But if the force in question is gravitational force, the magnitudeof the force is also proportional to the mass of the body on which it acts. Massand weight are not the same thing. Weight is the gravitational force acting. Itvaries inversely as the square of the distance from the center of the earth (as doesthe free-fall acceleration g), while the mass of a body is the same in all positionsin Newtonian mechanics. In addition, mass is also the measure of the quantity ofenergy contained in a body.

Fundamental Principles for Vehicle/Occupant System Analysis
Page 167
Energy is another concept that governs motion, and will be discussed in Section4.3.6 – Energy and Work.
4.3.1 Basic Principles of Postulates
Six postulates are usually stated as the basis of this science of Newtonianmechanics of particles and rigid bodies: Newton’s Three Laws of Motion, TheParallelogram Law for Adding Forces, The Principle of Transmissibility, andNewton’s Law of Gravitation. Only Newton’s Second Law and the ParallelogramLaw are needed to predict the motion of a particle (or a body) under given forces.Newton’s Law of Gravitation and Newton’s Third Law deal with interactionsbetween two particles. The other two postulates, Newton’s First Law of Motionand the Principle of Transmissibility, are sometimes omitted. Newton’s First Lawis redundant, since it is merely a special case of the Second Law. The Principle ofTransmissibility begins to matter only when dealing with a rigid body of finiteextent instead of with idealized mass point particles. It can be derived from theother postulates, if Newton’s Third Law is assumed to apply to the interactionforces in the system of particles forming the rigid body.
4.3.2 Particle Under Given Forces
The Parallelogram Law postulates that if two forces act at a point, their combinedeffect is the same as that of a single force acting at the same point and equal to thevector sum of the two forces.
Newton’s Second Law postulates that the time rate of change of the momentumof a body (a particle or a system of particles) is proportional to the vector sum ofall the forces acting on the body:
( )v vF kddt
mv∑ = (4.3.2.1)
where m is the mass of the body and mv is the momentum. If units are chosen sothat k = 1, and m is considered constant, this leads to a more familiar form:
F = ma = mdv/dt (4.3.2.2)
where a = dv/dt is the acceleration, and F now denotes the total force (or netforce) on the body. Eq. 4.3.2.2 therefore defines the relationship between theforce applied to a body and acceleration or the rate of change in velocity the bodywill experience. From Eq. 4.3.2.2, one can rewrite
Fundamental Principles for Vehicle/Occupant System Analysis
Page 168
a = F/m. (4.3.2.3)
This means that the acceleration of a body is directly proportional to the net forceacting on the body and inversely proportional to the mass of the body, and isalways in the direction of the net force.
The Second Law has meaning only if some reference system is given relative towhich the velocity and acceleration are measured. It holds in an inertial referencesystem and for all engineering problems to date, the so-called fixed stars may beconsidered an inertial system. Indeed, for most ordinary engineering work, theearth may be considered an inertial reference, and this chapter often refers to“fixed axes,” meaning fixed to the earth.
4.3.3 Interactions
Newton’s Third Law postulates that if one body exerts a force on a second body,then the second body exerts on the first body a force equal in magnitude, oppositein direction and collinear with the first force. This is the meaning concealed bythe words, “action equals reaction.” Newton’s Third Law deals with interactionforces between two bodies, which may contact or push each other. Note thatboth bodies may be in accelerated motion. It should be further noted that theThird Law has nothing at all to do with equilibrium, which is described for onebody only.
If the two interacting bodies were subject to no other external forces, then theSecond Law and Third Law together would imply that the rate of change ofmomentum of one body is equal and opposite to the rate of change of momentumof other one, so that the total momentum of the system (vector sum) would beconstant. Thus, the interaction forces are such as to conserve the momentum ofthe system of the two bodies. The conservation of momentum might be taken asthe basic postulate and the Third Law derived from it, a procedure particularlyattractive for some electromagnetic interactions, where the Third Law fails tohold but where conservation of momentum is still satisfied, if the momentumcarried by the electromagnetic field is included in the total momentum.
Newton’s Law of Gravitation postulates that any two particles are attracted towardeach other by a force whose magnitude is inversely proportional to the square of

Fundamental Principles for Vehicle/Occupant System Analysis
Page 169
the distance between them, F=Km1m2 /r2. By the Third Law, body one experiences
a force equal and opposite to the force experienced by body two.
4.3.4 Two Additional Postulates
Newton’s First Law postulates that a body under the action of no forces wouldcontinue to travel in a straight line with constant velocity. This is merely a specialcase of the Second Law.
The Principle of Transmissibility postulates that the external effects of a forceacting on a rigid body are independent of the point of application of the force onits line of action. Force is thus a “sliding vector,” which may be considered to actanywhere along a certain line of action. This evidently does not apply to theinternal effects, since a different deformation of a body is produced by pullingforward on the front of it than by pushing forward on the back of it. Manydeductive treatments of the science of mechanics derive this principle as aconclusion from the other postulates by considering the rigid body as a collectionof particles.
4.3.5 Idealizations
In Newtonian mechanics, some idealizations are made in the analyses. The objectin motion is considered a “particle,” which is assumed to be a rigid body underthe action of concentrated forces.
4.3.6 Energy and Work
Two additional concepts that govern motion apply to vehicle and occupantkinematics as well as occupant restraint systems. These are: Energy, which is theproperty (or capacity) of a body or a system that enables it to do work andovercome resistance, and Work, which is the transference of energy from onebody to the other. Energy is an abstract concept, which cannot be seen, felt,tasted or smelled. The only time energy becomes evident is when it changes.Energy appears in many forms including thermal (heat), solar (light), electrical(electricity), and mechanical energies. The most commonly known energies arekinetic energy (K.E.) and potential energy (P.E.). In mechanical systems, a forcedoes work on a body provided that the point where the force is applied has acomponent of displacement in the direction of force. The work done, or energytransferred to or from the body, is then equal to the magnitude of the force timesthe distance over which it acts. The kinetic energy, which is the energy of motion

Fundamental Principles for Vehicle/Occupant System Analysis
Page 170
of a body, is equal to half its mass multiplied by its velocity squared as expressedby the following relationship:
K.E. = (m.v2)/2 (4.3.6.1)where m is the mass of the body and v is the velocity. Potential energy is a storedenergy within a body or a system because of its position with respect to otherbodies. When energy is in the stored state, a body or a system has the potentialfor doing work.
4.3.7 Conservation of Energy
The Law of Conservation of Energy states that energy within a body or a systemcannot be created or destroyed, and it may be transferred from one form intoanother, but the total amount of energy never changes. When consideringmechanical systems, such as the occupant restraint systems in this chapter, thework output of a system cannot exceed the work input. Energy transmitted to asystem is equal to the work done by forces externally to the system, which isequal to the product of the force (F) exerted and the distance (d) through whichthe force moves:
Work = Fd. (4.3.7.1)
Ideally, all of the work input should be transformed to work output. In practice,this does not happen, although one can simplify the assumption. Inefficiencyexists whenever energy is transformed from one form to another. Efficiency isdefined as the percent of the work put into a system that is converted into usefulwork output, and can be expressed by the ratio:
Efficiency = work done / energy used (4.3.7.2)
4.4 Application of Concepts to Vehicle/OccupantAnalysis
4.4.1 Background
Elemental dynamics shows that the force required to change a velocity isproportional to acceleration. In order to simplify the explanation of automotivesafety, complicating factors such as relative motion that produces injury whenthe head rotates or extends rearward, causing the so-called whiplash injury, willnot be considered. Emphasis will be placed on the fundamentals of elementary

Fundamental Principles for Vehicle/Occupant System Analysis
Page 171
dynamics with the understanding that there are other complicating factors andspecifications that must be considered in the final design. The parameter thatcauses injury is force, which can be measured with a force transducer (or loadcell) or inferred from the acceleration of the body. Further simplification is madeby assuming that rigid body dynamics apply, understanding that the humanbody is not a rigid body. Human tolerance (or injury criteria) to impact is usuallygiven in terms of g’s. A “g” as generally used by biomechanics engineers andautomotive researchers is the acceleration of gravity. The fundamental expressionderived from Newton’s Second Law as given in Eq. 4.3.2.2 is used in automotivesafety analysis:
F = ma. (4.4.1.1)
This equation can be rewritten as:
F = W/g (ng) (4.4.1.2)
where n denotes the acceleration in multiples of acceleration of gravity. Cancelingthe g in the denominator with the g in the numerator, the above expression resultsin the form:
F = Wn (4.4.1.3)
Therefore, the force acting on a body is equal to the multiples of accelerationmultiplied by the weight of that body. For example, if the human head can standabout 80 g’s for several milliseconds without injury, then multiplying the 80 g’s bythe weight of the head (15 lbs) arrives at a force of about 1200 lbs without headinjury. Of course, this requires that the force be distributed over the head sothere is no localized deformation or skull fracture at the point of impact. Thechest can stand about 60 g’s if the force is distributed.
The advantage of establishing the tolerance in g units is that the stopping distancerequired without exceeding the tolerance can be calculated by the basic laws andconcepts of motion presented in Section 4.3 – Basic Laws and Concepts of Motion.
To apply these basic laws and concepts to the study of occupant kinematics withautomotive restraint systems, it is noted that Newton’s First Law implies thatboth the vehicle and occupant engaged in the deceleration process must beacted upon by forces. Newton’s Second Law states that the velocity acquired bythe vehicle and/or the occupant, either increasing (positive) or decreasing(negative), is proportional to the product of the applied force and the duration forwhich it is applied and inversely proportional to their respective mass. When

Fundamental Principles for Vehicle/Occupant System Analysis
Page 172
designing an automotive safety device for occupant protection, safety engineerswould like to achieve as long a duration as possible. But some physical packagelimitations may preclude this. If the time available for a particular velocity changecannot be accomplished within a long duration, but in a shorter one, a very largeforce must be exerted to achieve the required velocity change in accordance withNewton’s Second Law. If the force applied to the occupant exceeds the humantolerance level, it generates conditions that could become hazardous topassengers within the vehicle.
Discussions to this point implicitly assume that the bodies under the influence offorces are rigid bodies that are non-deformable during the course of motion. Inthe real world, both the vehicle and the occupant are actually deformable bodies.This capacity to deform, which is an internal effect of a force acting on bodiesthrough changing its shape and the associated state of stresses, does notinvalidate the laws of motion but does introduce an interesting aspect to theconcept of strain energy.
4.4.2 Vehicle Response
A vehicle that initially travels at 30 mph can decrease its velocity to zero viadifferent processes. This vehicle can be stopped by various means including
coasting (gradually slow down);normal stop;panic stop;crashing into a barrier.
In the first three cases, gradually coasting the vehicle or applying the brakes tothe vehicle generate so-called friction forces of varying magnitudes between thetires and road surface. In coasting, vehicle deceleration only approaches 1 g,while in panic stopping, the vehicle can generate higher friction forces. Thesefriction forces at the tire/road interface will act on the vehicle due to action andreaction, and eventually bring the vehicle to stop. These tire forces, acting in theopposite direction of the motion, will bring the vehicle to a stop. Among thesethree cases, the work done, which is equal to the initial energy, will be identical,and equal to the initial kinetic energy. Since different magnitudes of the frictionforces are generated for these three cases, their respective stopping distancesvary accordingly. Generally, the smaller the friction force, the larger the stoppingdistance, thus, the longer the vehicle will take to stop under an identical initialcondition for a given velocity.

Fundamental Principles for Vehicle/Occupant System Analysis
Page 173
In the case where a vehicle crashes into a rigid fixed barrier, less stopping distanceis required than the aforementioned cases. The vehicle loses all of its kineticenergy in a fraction of a second through front-end structural deformations. Theamount of deformation is equal to the stopping distance of the vehicle. Since thestopping distance of a vehicle in the barrier crash is normally short, a much higherforce is generated at the barrier interface.
Although the vehicle stops in all these cases, several differences among them areworth noting:
a) Since the vehicle in four cases undergoes the same velocity change, theproduct F.dt from Eq. 4.3.2.2 is the same. Therefore, the vehicle experiences smallforces for a longer time in the first three cases, and a larger force for a short timein a crash environment as in the fourth case.
b) As noted in the coasting, normal and panicking situations, the braking forceperforms work, thus removing energy from the vehicle. In the case of barrierimpact, the force at the barrier that arrests the motion of the vehicle does notmove; therefore, does not transfer any energy away from the vehicle. The kineticenergy is converted into a potential energy stored within the vehicle by means offront-end structural deformation. The amount of this structural deformation iscalled the dynamic crush of a vehicle. In other words, the total kinetic energy isabsorbed by the crushing of the front-end of the vehicle since the energy must beconserved.
c) The stopping distances vary in all cases. In coasting situation, the vehiclerequires a long stopping distance, while in barrier crashes, the vehicle stops at adistance of approximately 30 in. in a 30 mph barrier impact. The average force thatcan be determined by the K.E. divided by the stopping distance from Eq. 4.3.7.1affects significantly the occupant response within the vehicle compartment.
As pointed out earlier, design of a vehicle whose performance meets the safetyrequirements can be tested using prototype and production vehicles. The vehiclestopping distance (or dynamic crush) in barrier tests largely depends on crashpulses. These pulses are in fact signals representing vehicle deceleration timehistories measured by accelerometers mounted at the non-crash zone of theoccupant compartment (i.e. rocker at the “B”-pillar or seat cross members). Thedynamic crush can be determined by double integration of the vehicle crashpulse with known initial impact velocity. Figure 4.4.2.1 – Longitudinal VehicleDeceleration at Rocker/B-Pillar shows a typical deceleration time (Gv-T) history ofa mid-size vehicle during a fixed barrier impact test at 30 mph. Integration of thedeceleration yields a velocity change as a function of time (Vv-T) as shown in

Fundamental Principles for Vehicle/Occupant System Analysis
Page 174
Figure 4.4.2.2 – Longitudinal Vehicle Velocity. Further integration of the Vv-Tcurve gives the vehicle displacement time (Dv-T) history shown in Figure 4.4.2.3– Longitudinal Vehicle Displacement. The vehicle stopping distance occurred atthe maximum displacement, which in this particular case shown in Figure 4.4.2.3 is23.2 in. This is referred to as the vehicle dynamic crush or vehicle dynamic crushlength, Xv. The relationship between the crash pulse and the restraint systemperformance in a vehicle will be addressed in regard to the occupant restraintsystem designs. Furthermore, the deceleration and displacement time historieswith time as a common parameter can be cross-plotted to obtain a deceleration vs.displacement, shown in Figure 4.4.2.4. Assuming the frictional forces arenegligible, it is noted that the area under the deceleration vs. displacement curve(or Gv vs. Dv) in Figure 4.4.2.4 is equal to the initial kinetic energy of the vehicle,that is:
12
2
0mv mG dxV
Vx= ∫ (4.4.2.1)
In Figure 4.4.2.4, the deceleration vs. displacement curve can be circumscribedwith a “square-wave or rectangular pulse” whose height and width are the peakdeceleration and the maximum dynamic crush, respectively. This can then beused to determine the efficiency of a crash pulse and demonstrate the concept ofan “Equivalent Square Wave.”
4.4.3 Pulse Waveform Efficiency (ηηηηη)
The efficient utilization of the vehicle available package space in front-endstructure, which depends on the pulse waveform efficiency, is of vital importance.It is defined as:
pulse rrectangula or wave squarebingcircumscri theby enclosed AreantDisplaceme vs. onDecelerati of curve the under Area=η (4.4.3.1)
η =
12
2mv
mX Av p
(4.4.3.2)
If v is in mph, Ap in g’s and Xv in inches, then:

Fundamental Principles for Vehicle/Occupant System Analysis
Page 175
Fig. 4.4.2.2 Longitudinal vehicle velocity (1stintegration of longitudinal deceleration)
0.000 0.020 0.040 0.060 0.080 0.100 0.120
Time (sec)
Acc
eler
atio
n (G
's)
40
30
20
10
0
Fig. 4.4.2.1 Longitudinal vehicle deceleration at rocker/B-pillar

Fundamental Principles for Vehicle/Occupant System Analysis
Page 176
0.000 0.020 0.040 0.060 0.080 0.100 0.120
Time (sec)
30
20
10
0
Dis
plac
emen
t (in
)
Fig. 4.4.2.3 Longitudinal vehicle displacement (2ndintegration of longitudinal deceleration)
Fig. 4.4.2.4 Vehicle deceleration versus displacement
Displacement (in)
Acc
eler
atio
n (G
's)
00 10 20
20
30
40
30
10

Fundamental Principles for Vehicle/Occupant System Analysis
Page 177
η =0 4008 2. v
X Av p (4.4.3.3)
4.4.4 Equivalent Square Wave (ESW):
Square wave is an idealized pulse that is used in many crash-related analyses.The concept to determine its equivalent rectangular shaped pulse of constant g-level from any arbitrary shaped pulse is an Equivalent Square Wave (ESW). Toobtain an ESW, an average force Favg acting on the vehicle from the barrier iscalculated from the following expression:
FmvXavg
v=
12
2
(4.4.4.1)
An ESW, expressed in terms of g’s, is calculated by dividing Favg by the weight ofthe vehicle, which is mg:
ESWFmg g
vX
avg
v= =
12
2
(4.4.4.2)
Using mph for v, inches for Xv and g = 32.2 ft/s2, the above equation becomes:
ESWvX v
=
0 4008
2
. (4.4.4.3)
Therefore, an ESW can be computed by knowing the initial velocity and themaximum vehicle crush, both of which are design parameters for the vehicle andrestraint systems. Other hypothetical pulses such as half-sine, haversine, cosineand triangular waveforms used for basic analysis of occupant as well as vehiclekinematics are presented by Patrick [2], and Chou and Nyquest [3].
4.4.5 Effect of Pulse Shape
Consider two idealized pulse shapes, namely, a square and a triangular waveform.The waveform efficiency of a square pulse is 100 percent, while the efficiency ofthe triangular waveform is 50 percent. For a 3,000 lb vehicle impacted with a fixedbarrier at 35 mph, assuming the same maximum crush (or deformation) of 30 in.,

Fundamental Principles for Vehicle/Occupant System Analysis
Page 178
the force-deformation curves are shown in Figures 4.4.5.1 – Force as Function ofDynamic Crush/Square Pulse, and 4.4.5.2 – Force as a Function of Dynamic Crush/Triangular Pulse. It is seen that the vehicle structure in the triangular pulse caseexperiences a higher force, and that of the square pulse experiences a lower force.The GV vs. DV curves are shown in Figures 4.4.5.3 – Acceleration as a Function ofDynamic Crush/Square Pulse, and 4.4.5.4 – Acceleration as a Function of DynamicCrush/Triangular Pulse, exhibiting that the vehicle with the triangular pulse caseexperiences a higher “peak” deceleration force than the square pulse. The crashpulses are generally considered as “forcing functions” acting on the vehicle toaffect the occupant’s movement within its compartment. Therefore, a higherforce will be exerted on the occupant in case of a triangular pulse than in a squareone, and, in order to stop the occupant inside the occupant compartment requiresa greater demand on the restraint system, as summarized in Table 4.4.5.1.--Forcerequired on occupant restraint system.
How a front-end crushes is as important as how much it is crushed. Ideally, theforce-displacement (or deceleration/acceleration vs. time) curve should approacha square pulse, an optimal waveform. While in reality, design of a vehicle structureto behave like a square wave is not possible, an ESW concept is useful inestablishing a basic requirement for a vehicle to meet regulatory requirements.Today’s front-end structures of passenger vehicles are designed to be morecrashworthy by managing crash energy through effective use of available crushspace. Sled tests and occupant model simulations indicated that crash pulsesover ESW of 20 g make it difficult to meet FMVSS 208 dummy performance criteria.Theoretically, when a square wave of 20 g is used, a crush distance of 24 in isrequired for a 35 mph frontal impact with a fixed barrier. However, a square wavecannot be achieved with today’s technology, and a vehicle is required to providean extra 20 to 25 percent deformation or 29 to 30 in overall for a better crashenergy management. Vehicle structure design methodologies are presented inChapter 2 – Design of Vehicle Structures for Crash Energy Management.
4.4.6 Occupant Response
The processes of force application and associated energy transfers that occur tothe occupants within the vehicle are very similar to the cases discussed previouslyin the Section 4.4.2 – Vehicle Response. Two extreme cases, namely, a coastingand a crashing vehicle, will be used for demonstrating occupant response in thissection. The principles presented here are applicable equally well to the normaland panic braking situations. During the deceleration, various types of forces,such as friction forces generated between the occupant and the seat, foot/toe-board and hands-to-steering-wheel interaction forces will act on the unrestrained

Fundamental Principles for Vehicle/Occupant System Analysis
Page 179
Fig. 4.4.5.1 Force as function of dynamic crush –square pulse
F
D v
49 klb
30"
48 klb
F
D v
98 klb
30"
Fig. 4.4.5.2 Force as function ofdynamic crush -triangular pulse

Fundamental Principles for Vehicle/Occupant System Analysis
Page 180
G v
D v
32
30"
Fig. 4.4.5.4 Acceleration as a function of dynamic crush – triangular pulse
F
D v
49 klb
30"
Fig. 4.4.5.3 Acceleration as a function of dynamic crush

Fundamental Principles for Vehicle/Occupant System Analysis
Page 181
occupant of the coasting vehicle. These forces will slow the occupant downwithin the vehicle and remove kinetic energy from the occupant. The unrestrainedoccupant inside the crashing vehicle; however, will experience different kinematics.Since the crashing car stops so quickly – within 0.1s – the occupant continues tomove forward at the same initial velocity within the compartment until impact withthe surfaces of vehicle interior structural components such as the steeringassembly, instrument panel, knee bolster or windshield, which are now stopped.The contact forces generated from occupant interaction with these componentsurfaces will apply to the occupant, thus reducing the occupant’s velocity tozero. Depending on the characteristics of these components, very large forcesmay be generated if the components are too stiff and do not absorb much energy.The occupant’s kinetic energy, therefore, must be transformed to other forms ofenergy that remain within the occupant’s body. This transformed energy causesinjuries to the occupant, which constitute the subject of many impact biomechanicsresearch studies.
In order to reduce the impact injury to the occupant, various restraint systemshave been designed, exist, and will be continuously improved for occupantprotection during a vehicular crash event. Examples show how significantly theintroduction of an occupant restraint system into the above scenarios changethe kinematics of the occupant. In order to examine and illustrate the differencesbetween the unrestrained occupant in a braking vehicle and a crashing vehicle,and a restrained occupant in a crashing car, the velocity time (Vv- T) histories areneeded. In Figure 4.4.6.1 – Velocity-Time Histories/Vehicle and Occupant, the
ralugnairT ralugnairT ralugnairT ralugnairT ralugnairT*esluP *esluP *esluP *esluP *esluP esluPerauqS esluPerauqS esluPerauqS esluPerauqS esluPerauqS
erutcurtS ecrofrehgiH ecrofrewoL
regnessaPtnemtrapmoC noitareleccarehgiH noitareleccarewoL
tnapuccO ecrofrehgiH ecrofrewoL
metsyStniartseR dnamedretaerG dnamedresseL
esluperauqssahsurcelcihevemasnodesaB*
Table 4.4.5.1 FFFFForororororce reqce reqce reqce reqce required on occupant restraintuired on occupant restraintuired on occupant restraintuired on occupant restraintuired on occupant restraintsystemsystemsystemsystemsystem

Fundamental Principles for Vehicle/Occupant System Analysis
Page 182
velocities of the occupant and the vehicle over the ground are plotted as a functionof time, and differences between the various scenarios discussed above can beeasily explained. The advantage of using the Vv-T diagram is that many importantparameters are discernible from this diagram, including:
the acceleration of the vehicle and/or the occupant is directly related to theslope of the velocity-time curve at any time t;
the difference, at any time t, between the occupant and the vehicle velocitytime curves represents the relative velocity (D v) between them; and
the displacement of the vehicle and occupant over the ground is representedby the area under their respective velocity-time curves with respect to the timeaxis, and the relative displacement of the occupant with respect to the vehicleis the area between their respective velocity-time curves.
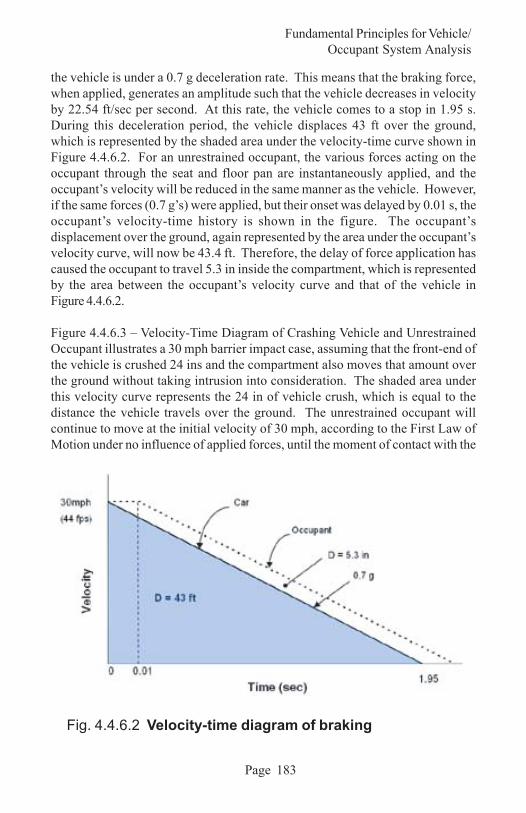
Figure 4.4.6.2 – Velocity-Time Diagram of Braking Vehicle and Occupant showsthe velocity-time history for the braking vehicle. It is reasonable to assume that
Fig. 4.4.6.1 Velocity-time histories/ vehicle and occupant
0 20 40 60 80 100 120
Time (ms)
30
20
10
0
-10
-20
40
Velo
city
(mph
)
Legend
occupant_vvehicle_v
Fundamental Principles for Vehicle/Occupant System Analysis
Page 183
the vehicle is under a 0.7 g deceleration rate. This means that the braking force,when applied, generates an amplitude such that the vehicle decreases in velocityby 22.54 ft/sec per second. At this rate, the vehicle comes to a stop in 1.95 s.During this deceleration period, the vehicle displaces 43 ft over the ground,which is represented by the shaded area under the velocity-time curve shown inFigure 4.4.6.2. For an unrestrained occupant, the various forces acting on theoccupant through the seat and floor pan are instantaneously applied, and theoccupant’s velocity will be reduced in the same manner as the vehicle. However,if the same forces (0.7 g’s) were applied, but their onset was delayed by 0.01 s, theoccupant’s velocity-time history is shown in the figure. The occupant’sdisplacement over the ground, again represented by the area under the occupant’svelocity curve, will now be 43.4 ft. Therefore, the delay of force application hascaused the occupant to travel 5.3 in inside the compartment, which is representedby the area between the occupant’s velocity curve and that of the vehicle inFigure 4.4.6.2.
Figure 4.4.6.3 – Velocity-Time Diagram of Crashing Vehicle and UnrestrainedOccupant illustrates a 30 mph barrier impact case, assuming that the front-end ofthe vehicle is crushed 24 ins and the compartment also moves that amount overthe ground without taking intrusion into consideration. The shaded area underthis velocity curve represents the 24 in of vehicle crush, which is equal to thedistance the vehicle travels over the ground. The unrestrained occupant willcontinue to move at the initial velocity of 30 mph, according to the First Law ofMotion under no influence of applied forces, until the moment of contact with the
Fig. 4.4.6.2 Velocity-time diagram of braking

Fundamental Principles for Vehicle/Occupant System Analysis
Page 184
vehicle interior components, such as the instrument panel. If the initial clearancebetween the occupant and the panel is 24 in and if the occupant contacts thepanel just as the vehicle has stopped, the occupant will have translated 48 in withrespect to the ground. If the deflection of the panel allows only additional 3 in ofmotion, the occupant will come to rest 11 ms later at a constant deceleration of 120g, which is obtained from a=v2/2s, where v = 30 mph and s= 3 in. The occupantdeceleration can be further reduced if the panel can deform more to absorb theoccupant’s kinetic energy. For the unrestrained occupant in this case, the speedof impact to the interior is equal to the speed change of the vehicle, since theoccupant contacts the interior after the vehicle is completely stopped. The relative
speed of occupant impact with the interior is typically attributed to occupantpotential injuries. The speed at which the occupant hits the interior componentsmay be different from the speed change of the vehicle if the occupant is restrainedwith various restraint systems.
Figure 4.4.6.4 – Velocity-Time Diagram of Crashing Vehicle and Restrained Driverillustrates the velocity-time histories for the same vehicle and a restrainedoccupant. Since a restraint system has a “slack,” and cannot apply restrainingforce to the occupant immediately, an effectiveness time of 0.030 s is assumed.
Fig. 4.4.6.3 Velocity-time diagram of crashing vehicleand unrestrained occupant

Fundamental Principles for Vehicle/Occupant System Analysis
Page 185
During this time, the occupant will continue at an initial velocity of 30 mph andwill travel 15.8 in within the compartment as shown in the velocity-time curve. Ifthe occupant comes to rest at the same time as the vehicle, the restraint forceneeds to be applied to decelerate the occupant at 22.4 g in the next 0.061 s. Duringthis period of restraint, the occupant will move another 5.4 in within thecompartment. The occupant’s total displacement over the ground is then 32 in,which is comprised of 24 in of vehicle crush and 8 in of relative motion within thecompartment. Note that, in this case, the time required to reduce the occupant’sinitial velocity to zero has been increased by six times as compared to theunrestrained occupant case, 0.061 s in the restrained case vs. 0.01 s in theunrestrained case. From the above examples, the occupant’s deceleration is 22.4g and 120 g in restrained and unrestrained condition, respectively. From Newton’sSecond Law, the magnitude of the forces applied to the restrained occupant will
therefore be reduced to one-sixth the magnitude of the forces applied to theunrestrained occupant (22.4 g vs. 120 g). The benefit of a restraint system thuscan be realized.
If the instrument panel is 18 inches in front of the occupant as in the previousexample, and because the occupant traveled only 8 in in the compartment, theoccupant will have missed the panel by 10 in. If the applied restraint forces weremodified such that the occupant uses the entire 18 in of interior space to arrest his
Fig. 4.4.6.4 Velocity-time diagram of crashing vehicleand restrained driver

Fundamental Principles for Vehicle/Occupant System Analysis
Page 186
motion, then the occupant’s velocity-time curve will be as shown by the dashedline in Figure 4.4.6.4. This indicates that the time to reduce the occupant’s velocityto zero can be extended from 60 to 98 ms. Newton’s Second Law indicates that therestraining forces will also be half as large as the previous case and one-eighth ofthe hypothetical unrestrained case.
4.5 Axioms for Good Occupant Restraint Performanceand Design
The basic concept discussed in Section 4.3 - Basic Laws and Concepts of Motion,allows establishment of:
the relationship between the acceleration, velocity and displacement in time.the relationships between forces and motions of a system; andenergy of system(s) such as occupant and vehicle.
Using an ESW concept, the following relationships hold:
AVXs
v= 0
2
2 (4.5.1)
and
TVAs
s= 0
(4.5.2)
where As is the deceleration of the equivalent square wave, V0 the initial velocity,and Xv the maximum vehicle crush or the maximum stopping distance. It shouldbe noted that Ts is different from the crash duration, T, of an actual pulse. Thecrash duration, in general, is not a design objective, because it is beyond designers’control.
Combining the above relationships with considerations of general structuralenergy management for impact with controlled collapse mechanisms, humananatomy and injury mechanisms and biomechanic tolerance level, Eppinger [6]and Patrick [2] suggested certain guidelines that help designers and engineersestimate design requirements of a given restraint system, evaluate their restraintsystem performance, and apply the results to the design of an optimal restraintsystem in meeting or exceeding safety performance requirements.

Fundamental Principles for Vehicle/Occupant System Analysis
Page 187
These guidelines are cited here for reference:
1) From Eq. 4.3.2.2, maximize the time over which restraint forces are appliedto minimize the magnitude of the forces applied to an occupant. According toEq 4.3.2.2, this, in turn, will minimize the “g”-level, which should be belowhuman tolerance levels. The total time is very difficult to control or design.However, the effectiveness of the belt (to be discussed in Section 4.7 –Compatibility between Restraint System and Vehicle Front Structure) can be aparameter in a restraint system design.
2) Maximize the distance of the occupant’s travel over the ground by utilizingthe vehicle crush and the available space within the occupant compartment.Therefore, a restraint system should be designed to provide sufficient cushioning(or the necessary distance) for decelerating the occupant.
3) Minimize the effectiveness time of a restraint system by applying as great arestraint force as soon as possible during the impact event. This force shouldnot exceed the established tolerance level in terms of dummy performancenumbers as specified in FMVSS requirements.
4) Minimize body articulations, local deformations and rate of deformations,and local inertial accelerations during the restraint event. Minimize excessiverelative motion between body segments and body-to-vehicle interiors.
5) Minimize concentrated forces on sharp edges and hard surfaces. Distributeforces over the greatest possible area. Distributed forces are preferable toconcentrated forces in design of occupant protection systems. Structuresgenerally deform less with distributed loads and therefore, deformation-basedinjuries are reduced. This reduces local surface pressures applied to a bodyregion that have also been related to structural failure.
6) Use energy-absorbing materials designed to crush at forces below humantolerance levels and extract energy from the occupant by maximizing the energyabsorption during crush or deformation. Force-distributing padding is preferredover major energy-absorbing structures such as steering hub, knee contactarea, instrument panel and interior components.
7) Maximize the efficiency of a restraint system by designing as closely as possibleto a square waveform. This is most effective in terms of utilizing a minimumpackage space requirement.

Fundamental Principles for Vehicle/Occupant System Analysis
Page 188
8) Maintain compartment integrity and minimize structural intrusions in bothmagnitudes and relative velocities.
4.6 Vehicle/Occupant Velocity Profiles
Vehicle/occupant velocity-time histories obtained from barrier tests will bediscussed in this section. Examples of a braking vehicle vs. a crashing vehicleusing velocity profiles will be demonstrated. This may include applications toside and car-to-car impacts.
4.6.1 Frontal Impact Analysis
A frontal crash is a two-impact event. In the first (primary) impact, the vehiclestrikes a barrier, causing the front-end to crush. Kinetic energy of the vehicle isexpended in deforming the vehicle’s front structure. The design of the front-end,rear, or side to crumple in a collision and absorb crash energy is called crashenergy management or crashworthiness.
The second (secondary) impact occurs when the occupant continues to moveforward as a free-flight mass and strikes the vehicle interior or interacts with orloads the restraint system. Some of the kinetic energy is expended in deformingthe vehicle interior or the restraint system, and in compressing the occupant’storso. The remaining kinetic energy is dissipated as the occupant decelerateswith the vehicle.
During the secondary impact, injury may occur while the occupant is loading theinterior or the restraint system, if the impact loading or severity exceeds the injurythreshold level. The kinetic energy of the occupant’s torso should be dissipatedgradually for the impact to be non-injurious. If there is a large differential velocitybetween the occupant and the interior, much of the kinetic energy must bedissipated during the impact of the occupant with the interior or the restraintsystem. If the second impact is of a very short duration, the resulting force on theoccupant can exceed human tolerance levels. The kinetic energy dissipatedduring the second impact is a function of the occupant’s mass and of the differentialvelocity of the occupant to the interior.
Energy-absorbing (EA) materials on the interior, and devices such as EA steeringcolumns, belts and air bags provide two important synergistic benefits. First,these enhance “ride-down” for the occupant within the vehicle compartment.Second, these absorb some of the energy of the second impact.

Fundamental Principles for Vehicle/Occupant System Analysis
Page 189
“Ride-down” can be described as managing the occupant’s energy by takingadvantage of the gradual deceleration of the vehicle measured at rocker at B-pillaror at any non-deformed location in the vehicle, such as seat cross members. Atthe onset of a frontal crash, the unbelted free-flight occupant and the deceleratingvehicle interior have the same initial velocity. The vehicle interior slows downwhile decelerating as the front-end structure of the vehicle crushes. The occupanttravels at the initial speed until the occupant contacts the interior. Vehicle interiorcomponents such as instrument panels in current production vehicles are paddedwith EA materials that allow crushing to produce an earlier coupling (engagement)of the occupant with the gradually decelerating interior. The forces required todecelerate the occupant during ride-down should be kept below human tolerancelevels. The earlier contact also results in a smaller differential (relative) velocitybetween the occupant and the interior, thus reducing the portion of the occupantkinetic energy that must be dissipated in the second impact. Some mathematicaltreatment of this ride-down phenomenon is presented in Section 4.9 – Ride-DownConcept and Application.
EA materials can be designed through selection of appropriate characteristics tocrush at forces below human tolerance levels. EA materials absorb energy whilebeing crushed, and because of this crush, the occupant’s differential velocitywith the interior in the second impact is reduced over a longer period of time thanthat from impacting with a rigid surface. This produces lower deceleration forceson the occupant.
4.6.2 Side Impact Analysis
Theories outlined in Section 4.4 – Application of Concepts to Vehicle/OccupantAnalysis, can be used in side impact analysis [7]. Use of velocity-time history foranalysis of a typical FMVSS 214 (NHTSA-type) side impact test can bedemonstrated to study the effects of structural upgrading vs. occupant cushioningcountermeasure.
4.6.2.1 Baseline Analysis
The significant crash event in a typical NHTSA-type side impact test is explainedby analyzing the velocity profiles of Figure 4.6.2.1.1 – Typical Velocity Profile inSide Impact. The profiles are obtained by the numerical integration of accelerometerdata taken from the following locations:
Center of gravity (CG) of the moving deformable barrier (MDB)

Fundamental Principles for Vehicle/Occupant System Analysis
Page 190
Non-impacted left-hand rocker of the target vehicleDoor inner panel at the armrestSide Impact Dummy (SID) pelvis
The following momenta exchanges are taking place:the primary momentum exchange taking place between the MDB and the tar-get vehicle. During this event, the rigid body motion of the target vehicleincreases while the MDB velocity decreases until at some point in time, boththe MDB and the target vehicle achieve a common velocity.the momentum exchange taking place between the MDB and the door. Thedoor quickly attains the high velocity of the MDB.finally, the momentum exchange taking place as the intruding door comes intocontact with the stationary SID. The dummy pelvis, hit by a fast-intrudingdoor, is quickly accelerated in the lateral direction.
Door-to-dummy interaction forces can be reviewed by looking at the door andthe dummy “free-body” diagram of Figure 4.6.2.1.2 – Door and SID “Free-body”Diagrams. The forces acting on the door are:• FMDB is the punch-through force of the MDB acting on the door.
Fig. 4.6.2.1.1 Typical velocity profile in side impact

Fundamental Principles for Vehicle/Occupant System Analysis
Page 191
Fstructure is the body side structural resistance of the target vehicle that resistsdoor intrusion. This structural resistance is provided by door support frame(consisting of the hinge pillar, door hinges, A-pillar, roof side rail, B-pillar,latch/striker, and the rocker), the door anti-intrusion beam, the floor pan/crossmembers, instrument panel (I/P), I/P cross car beam, cowl, header, and the roofskin/bow). This force is the integral of the door support frame reaction pres-sures acting on the door peripheral areas and is shown in Figure 4.6.2.1.2 asone-half of its concentrated load in two locations to facilitate explanation.Fdummy is the door-to-dummy interaction force, which also is the reaction forceacting on the dummy.
Using Newton’s Second Law, which states that the rate of change in the doorlinear momentum is equal to the summation of forces acting on the door free-body diagram:
(4.6.2.1)
and solving for Fdummy, one obtains the following:
[ ]structuredoordoorMDBdummy
FvMdtdFF −+= (4.6.2.2)
Thus, it is noted that:
decreasing the MDB punch-through force (FMDB) would decrease the force
Fig. 4.6.2.1.2 Door and SID “free-body” diagrams
structure / 2
dummy
structure / 2
dummy dummy dummyMDBF
F
F
F
F =M a
SID
[ ] dummy structure MDB door door F F F F v M dt d − − = = − ∑
Fundamental Principles for Vehicle/Occupant System Analysis
Page 192
acting on the dummy (Fdummy).decreasing the rate of change in the linear momentum of the door by makingthe door lighter or decreasing the door intrusion velocity would decrease theforce acting on the dummy.increasing the struck vehicle body side structural resistance (Fstructure) wouldalso decrease the force acting on the dummy.
Referring to the free-body diagram of SID as shown in Figure 4.6.2.1.2 and usingNewton’s Second Law, the mass of the SID (Mdummy) represents that of a 50th-percentile male, which is difficult to change. Because the federal governmentregulates the maximum allowable dummy acceleration (adummy), the only recoursefor the automobile manufacturers is to limit the force acting on the dummy (Fdummy)so as not to exceed the allowable dummy acceleration limits. This simple analysisprovides some insight into the important parameters that affect dummy responsesduring side impact and allow for development of countermeasure strategies.
Countermeasures for limiting the force on the dummy during side impact include:
· reducing the door intrusion velocity and hence, its rate of change in linearmomentum via structural upgrading of the body side. This would reduce theseverity of the subsequent momentum exchange between the door and thedummy.
· limiting the peak forces acting on the dummy (Fdummy) using a foam cushionwith a nearly constant force-crush characteristic or a deployable side airbag.This would reduce the MDB punch-through force (FMDB) while also makingthe door inner sheet metal and trim more compliant for occupant cushioning,thereby further reducing Fdummy.optimizing the specific stiffness by maximizing the structural stiffness/unitmaterial usage of the vehicle body side structure via efficient structural designand use of an airbag or foam cushion. This strategy is an optimum combina-tion of the first two strategies.
4.6.2.2 Effects of Structural Ugrading
Figure 4.6.2.2.1 – Effects of a Hypothetical Structural Upgrade shows the effectsof structural upgrading based on hypothetical simulation and the results of anupgraded experimental vehicle. These curves reflect general trends as summarizedbelow:

Fundamental Principles for Vehicle/Occupant System Analysis
Page 193
The crash event between the MDB and the target vehicle is shortened. The MDBslows at a faster rate while the struck vehicle rigid body motion speeds up at ahigher rate. The door intrusion and intrusion velocity are reduced. The reductioncan be significant, depending on the extent of structural upgrade. The dummypelvis, hit by a slower intruding door, is subjected to a milder acceleration asevident by the slope the dummy pelvis velocity curve. Therefore, the momentumexchange between the door and the dummy pelvis is reduced accordingly.However, the structural upgrade weight penalty to achieve this effect is enormous.The weight penalty is estimated at more than 18 kg (40 lbs) for a 2-door compactvehicle, since the structural stiffness is needed upfront at the early stage of thecrash event prior to the door developing significant intrusion and intrusionvelocity. Furthermore, Transportation Research Laboratory [8] has shown thatcertain structural upgrading of the vehicle body side structure could lead to anundesirable intrusion profile of B-pillar/door by tilting inboard at the “waistline”and concentrating the impact load on the occupant in the thorax region. A moredesirable crush pattern for the B-pillar/door is to remain upright during side impactfor a more evenly distributed impact loading on the occupant.
4.6.2.3 Effects of Cushioning
Fig. 4.6.2.2.1 Effects of a hypothetical structuralupgrade

Fundamental Principles for Vehicle/Occupant System Analysis
Page 194
Figure 4.6.2.3.1 – Effects of Load-limiting Cushioning illustrates the effects ofload-limiting constant force-crush cushioning. In the case of no cushioning, thereaction force of a stiff door panel, represented in Figure 4.6.2.3.1 by a stiff linearspring constant (K1), increases in direct proportion to the panel deflection (δ) asthe dummy leans heavily against the door during side impact. The force (Fdummy)acting on the dummy pelvis, which is equal to K1δ causes the pelvis acceleration(in the Mpelvisapelvis term) to exceed the federal limits. Figure 4.6.2.3.1 also illustratesthe condition in which a load-limiting constant force-crush spring is connected inseries with the same stiff spring of the door inner panel. Initially, when the dummyis hit by the intruding door and as the reaction force (Fdummy) begins to rise but isless than Fconstant, the stiff spring K1 will deflect up to δ1 until Fdummy = Fconstant. At thispoint onward, the load-limiting spring will begin to crush (δ ) at a constant force(Fconstant). The dummy pelvis, subjected to an appropriate level of this constantreaction force from the door, will accelerate at a constant level without exceedingthe federal requirement as long as the cushion does not bottom out.
Figure 4.6.2.3.2 – The Deployable Door Trim System, shows the design conceptof a deployable door trim system. A pusher foam is bonded to the inner surfaceof the door outer panel. A polyurethane foam cushion is stowed in the spacebetween the glass plane and the door trim panel, thus maximizing the amount ofprotective foam without decreasing the interior space of the occupantcompartment. During a side impact, the cushioning of the door by the impacting
Fig. 4.6.2.3.1 Effects of load-limiting cushioning

Fundamental Principles for Vehicle/Occupant System Analysis
Page 195
vehicle causes the foam cushions to be deployed toward the occupant. Theload-limiting foam cushion pushes the occupant away from the intruding door ata controlled acceleration rate, thus providing lowered dummy injury indicators.
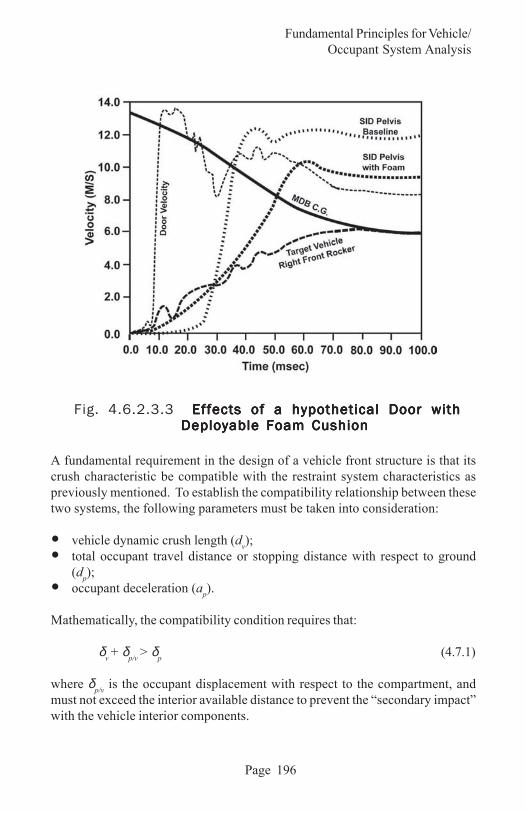
Figure 4.6.2.3.3 – Effects of a hypothetical Door with Deployable Foam Cushion,uses a hypothetical test to illustrate:
the crush duration between the MDB and the target vehicle will remain un-changed from the baseline (Figure 4.6.2.1.1. Typical Velocity Profile in SideImpact)the door velocity profile will remain unchanged from Figure 4.6.2.1.1the deploying load-limiting foam cushion contacts the dummy pelvis early inthe crash event and accelerates it away from the intruding door sooner thanthat of the baselineconsequently, the dummy pelvis will experience a milder acceleration as evi-dent from the slope of its velocity historythus, the strategy is to use a deploying door trim with the load-limiting foamcushion behind it to quickly push the stationary SID away from the intrudingdoor steel at a controlled rate.
4.7 Compatibility Between Restraint System and Vehicle Front Structure
Fig. 4.6.2.3.2 The deployable door trim system
Fundamental Principles for Vehicle/Occupant System Analysis
Page 196
A fundamental requirement in the design of a vehicle front structure is that itscrush characteristic be compatible with the restraint system characteristics aspreviously mentioned. To establish the compatibility relationship between thesetwo systems, the following parameters must be taken into consideration:
vehicle dynamic crush length (dv);total occupant travel distance or stopping distance with respect to ground(dp);occupant deceleration (ap).
Mathematically, the compatibility condition requires that:
δv + δp/v > δp (4.7.1)
where δp/v is the occupant displacement with respect to the compartment, andmust not exceed the interior available distance to prevent the “secondary impact”with the vehicle interior components.
Fig. 4.6.2.3.3 Effects of a hypothetical Door with Effects of a hypothetical Door with Effects of a hypothetical Door with Effects of a hypothetical Door with Effects of a hypothetical Door with Deployable Foam Cushion Deployable Foam Cushion Deployable Foam Cushion Deployable Foam Cushion Deployable Foam Cushion

Fundamental Principles for Vehicle/Occupant System Analysis
Page 197
Total occupant displacement can be established using a simple idealized modeldescribing the restraint system performance, which is a function of systemcharacteristics that are specified to comply with the established injury criteria.In Figure 4.7.1 — Idealized Model, the occupant kinematics are characterized bythree parameters: the restraint system effectiveness time te, deceleration onsetrate α, and the maximum deceleration Ap. Total occupant travel distance withrespect to ground is the sum of the distances the occupant travels during theconstant speed phase, the constant onset phase and the constant decelerationphase. It can be expressed in terms of te, α, and Ap by:
Fig. 4.7.1 Idealized model

Fundamental Principles for Vehicle/Occupant System Analysis
Page 198
δp = 12 V0[te + Ap/2α] + 12 V02/64.4 Ap - 16.104 Ap
3/ α 2 (4.7.2)where
dðp is in inches;V0: ft/secte: secAp : g’sað: g/s
More detailed derivation of equations are given in Section 4.8 - Restrained OccupantModel (Analytical Approach)..
Physical interpretation of the occupant travel distances during each phase, aspreviously mentioned, is presented schematically in Figure 4.7.2 –OccupantMovement in a Barrier Impact. For a given set of parameters te, Ap, and α , afamily of curves, for example, velocity vs. time, can be obtained using Eq. (4.7.2)for various impact speeds. The area under a velocity-time history curve representsthe occupant travel distance relative to ground and the slope of the velocitycurve equals the acceleration levels of the occupant. Figure 4.7.3 – Chest Travelduring Fixed Barrier Impact shows examples using te = 0.034 s., Ap = 40 g’s and α= 1000 g/s for different velocities.
Let D denote the available interior distance. As previously mentioned, it is desiredthat:
δ p/v < D (4.7.3)
It then follows from Eq. (4.7.1) that
δ v > δ p - D (4.7.4)
The quantity, δ p - D, in Eq. (4.7.4) sets the minimum vehicle crush distancerequired to satisfy the compatibility between structural and restraintcharacteristics.
With this background, trade-offs can be made between the required vehicle crushand the effectiveness time te for various impact velocities, provided that therestraint system performance parameters can be chosen so that the interioravailable distance is fully utilized. Variations in the effectiveness time te allow theanalysis of potential benefits of early triggering of the passive restraint system.

Fundamental Principles for Vehicle/Occupant System Analysis
Page 199
4.7.1 Analysis
The hypothetical analysis presented below is carried out for the belt and thesupplemental airbag restraint systems.
4.7.1.1 Belt Restraint System
Baseline parameters selected for 30 mph, 35 mph, and 40mph analyses are listed inTable 4.7.1.1.1 using D = 18 in.
Fig. 4.7.2 Occupant movement in a barrier impact

Fundamental Principles for Vehicle/Occupant System Analysis
Page 200
Substituting the above parametric values into Eq. (4.7.2) and using Eq. (4.7.4), avehicle crush distance of 22 in is obtained for the 30 mph case. This value
Fig. 4.7.3 Chest TChest TChest TChest TChest Trararararavvvvvel During Fixel During Fixel During Fixel During Fixel During Fixed Barrier Imed Barrier Imed Barrier Imed Barrier Imed Barrier Impactpactpactpactpact
Table 4.7.1.1.1 Values of baseline parameters
hpm03 hpm03 hpm03 hpm03 hpm03 hpm53 hpm53 hpm53 hpm53 hpm53 hpm04 hpm04 hpm04 hpm04 hpm04
temitssenevitceffE e s430.0 s430.0 s430.0
etartesnO α s/g007 s/g008 s/g0001
A.leceDtnatsnoC p g04 g04 g04

Fundamental Principles for Vehicle/Occupant System Analysis
Page 201
represents dynamic vehicle crush of a current small-sized vehicle at 30 mph barriercrash. Dynamic crush for the 35 mph and 40 mph cases are found to be 29 in and35 in, respectively, based on these hypothetical values.
Parametric studies can be conducted by varying the effectiveness time te from0.034 s (baseline) to 0.030 s, 0.025 s., 0.020 s, and 0.010 s. Results are shown inFigure 4.7.1.1.1 – Minimum Required Vehicle Crush, where the minimum requiredvehicle crush is plotted as a function of impact speed. Two remarks are worthmaking in view of Figure 4.7.1.1.1.
First, the minimum required vehicle crush decreases as the effectiveness timedecreases. A certain amount of reduction in vehicle length can then be realizedand benefit from application of a pre-crash sensor in early triggering restraintsystem.
Second, theoretically, using early triggering restraint system, the 35 mph impactcould also be achieved with no increase in vehicle length using the 30 mph
Fig. 4.7.1.1.1 Minimum required vehicle crush versusimpact speed for various belt restraintsystem parameters

Fundamental Principles for Vehicle/Occupant System Analysis
Page 202
baseline structure. This would result in a vehicle deceleration of 22.5 g’s.
4.7.1.2 Supplemental Airbag Restraint System (SARS)
Supplemental airbag restraint system is the best-known passive restraint systemintroduced for occupant protection in frontal impacts. The SARS is automaticallydeployed after a certain crash severity is reached. Two distinct locations, thesteering wheel and the instrument panel, are currently used for the air baginstallation to protect the driver and the right front seat passenger, respectively,during frontal impacts. Additional locations sometimes include the rear seat,door side panel, the roof and the knee bolster area. For each location, designparameters such as bag size, bag pressure and deployment time are different,depending on the human body regions to be protected and their respectivetolerance levels.
The crash sensor is the heart of a SARS. It requires high operating reliability indetermining whether a “true” collision has occurred. The sensor performancecan be affected by its location on the vehicle. Different types of sensors alsorequire various sensing times depending on sensor mechanism and crash signals.Sensor performance requires sensor calibration and algorithm development, whichis beyond the scope of this chapter. Additional information on this topic isavailable through the Society of Automotive Engineers, SAE, which sponsors aseminar on fundamentals of crash sensing [10].
The sensing times may vary from 8 ms to 13 ms with a threshold velocity ofapproximately 10 to 15 mph, at which the actuators trigger. After the sensingmechanism has determined that a collision has occurred, it triggers a sequence ofevents that result in bag deployment. Studies show that the entire sequence ofoperations is completed in approximately 40 to 50 ms. A passenger bag requiresa total deployment time of 50 ms, of which approximately 30 ms is elapsed forinflation. Therefore, should a sensor provide an early triggering capability, areduction of 15 ms to 18 ms in the sensing and triggering phases can probably berealized. Following the analysis outlined in Section 4.7.1.1 – Belt Restraint Systemversus Impact Speed for Various Belt Restraint System Parameters, the minimumrequired vehicle crush distance can be determined. Assuming that the bag willnot be bottomed out in protecting occupants, one may take D = 16 in in theanalysis. Results shown in Figure 4.7.1.2.1 – Minimum Required Vehicle Crushversus Impact Speed for Various Air Bag Restraint System Parameters are therequired vehicle crush length for various air bag effectiveness times, that is, 50ms, 40 ms, 35 ms and 32 ms. Higher onset rates and constant deceleration areused since the bag would act as a non-linear “hard” spring, and the minimum

Fundamental Principles for Vehicle/Occupant System Analysis
Page 203
required crush distance based on the supplemental airbag restraint systemperformance is larger than that determined for the belt restraint systems.
4.8 Restrained Occupant Models (Analytical Approach)
The simulation of a restrained occupant and vehicle front-end dynamics in afrontal collision has been demonstrated in the open literature with different modelsof varying degrees of complexity [1]. Two simple models [4, 9, 11] found in theliterature can be used to demonstrate as a useful tool in guiding the design in theconcept phase (early stage) of the vehicle development. The chest decelerationof a front passenger is idealized in two different ways. One way is to use a trilinearsegment approximation to the chest deceleration as mentioned in Section 4.7 –Compatibility between Restraint System and Vehicle Front Structure (see Figure4.7.1), while the other uses a sine-wave approximation. No provisions are madefor studying driver behavior because of the steering wheel and column
Fig. 4.7.1.2.1 Minimum required vehicle crush versusimpact speed for various air bag restraintsystem parameters

Fundamental Principles for Vehicle/Occupant System Analysis
Page 204
interactions. The models are used to calculate the required stopping distance ofthe occupant relative to the ground for a given restraint system design, impactspeed, and the maximum allowable chest deceleration as specified in FMVSS 208for occupant protection. Knowing the available vehicle interior space, the requiredvehicle crush distance and the average vehicle deceleration can then be calculated.The two analytical models are described next.
4.8.1 The Trilinear Chest Deceleration Model for BeltedOccupant Response
In this model, the response of a restrained passenger in a vehicle frontal barrierimpact is idealized by dividing the time that is required to decelerate the occupantfrom an initial velocity V0 to stop (a zero final velocity) into three time domains asshown in Figure 4.8.1.1 – Trilinear Belted Occupant Model.
Fig. 4.8.1.1 Trilinear belted occupant model

Fundamental Principles for Vehicle/Occupant System Analysis
Page 205
In the first domain, 0 < t < te, the occupant velocity is assumed to be constant,since the occupant is in a free flight because of the belt slack. The occupantcontinues to move at the initial velocity of the vehicle until time te. At t = te, therestraint system becomes effective, and therefore, it is referred to as theeffectiveness time of the belt (or restraint system).
When te < t < t2, the restraint slack has been taken up. The occupant startsinteracting with the restraint at a certain relative velocity, and then begins todecelerate due to the induced belt loads until a maximum chest deceleration isreached. The occupant motion during this period is assumed to be at a constantdeceleration rate (onset rate).
In the third period, t2 < t < t3, the occupant velocity continues to reduce until itvanishes. The maximum chest displacement is reached at time tp.
The equations describing this idealized occupant response are presented forreference:
LetV0 = initial occupant (also vehicle) velocity in ft/s (or mph).
Αp = maximum occupant (front passenger side) chestdeceleration in g’s.α&
= occupant deceleration onset rate in g’s/s.g = gravity acceleration (32.2 ft/s2).
t < t1, the distance traveled by the occupant δ p1 is
δp eV t1 0= . (4.8.1.1)where t1 = the belt effectiveness time te
In the second period, te < t < t2, time of constant onset rate, t0, is determined to be
t = t - t = A
ep
0 2&α for V2 > 0 (4.8.1.2)
The occupant velocity change ∆V is
2020
21 gtVVV α&=−=∆ for V2 > 0 (4.8.1.3)
The distance traveled by the occupant δp2 is

Fundamental Principles for Vehicle/Occupant System Analysis
Page 206
δα
p t Vg
t2 0 0 02
6= −
&(4.8.1.4)
or δα αp
pi
pAV
g A2
2
6= −
& & (4.8.1.5)
In the third period, t2 < t < t3; if V2 is positive, that is, V2 > 0, which implies thatoccupant is still in motion, the time required for the occupant to reach the finalvelocity V3 = 0 at a constant deceleration Ap is:
t = t - t = V
gA cp
3 22
for V2 > 0 (4.8.1.6)
The distance traveled by the occupant during this period, δp3, can be determinedfrom the following expression:
δp cV t3 212
= (4.8.1.7)
or δαp
p
p
AV
g A3 0
2 21
2 2= −
& (4.8.1.8)
For a given vehicle collision speed V0 and maximum chest deceleration Αp, theRequired Chest Displacement (RCD) relative to the ground and the total time tpfor the occupant to reach zero velocity can be obtained from Eq. (4.8.1.9) and Eq.(4.8.1.10), respectively:
RCD p p p= + +δ δ δ1 2 3 (4.8.1.9)and
t = t + t + t p e o c (4.8.1.10)
Thus, RCD and tp can be defined by two parameters of the restraint system,namely, the effectiveness time te and the onset rate α for a given maximum chestdeceleration.

Fundamental Principles for Vehicle/Occupant System Analysis
Page 207
The effectiveness time te varies with the restraint system, and is affected by thedeployment design parameters of the supplemental airbag restraint system andthe slack in the belt restraint system at a given vehicle collision speed. Therefore,te is customarily assumed to be constant in the restraint system model analysis,although it varies with the impact velocity.
The onset rate α& in g’s/s, varies with the relative velocity of the occupant to thevehicle, and the belt and airbag restraint loading states. For a given vehicleimpact speed, the onset rate depends on the vehicle crush characteristics. Someexample values of these three parameters are shown in Table 4.8.1.1 – Parametersfor Vehicle/Occupant System Analysis - Trilinear Belted Case for different typesof belt webbing.
The sensitivity analysis of the chest travel distance to the restraint systemperformance parameters is studied using this model. The results are shown inFigures 4.8.1.2 – Occupant Travel versus Effectiveness Time and 4.8.1.3 –Occupant Travel versus Chest Acceleration.
From Figure 4.8.1.2, it is evident that a more effective restraint system requiresless te, thus reducing the chest travel distance. When te = 30 ms. for example, thechest travel distance during this period is 15.8 in and 18.5 in for impact velocitiesof 30 mph and 35 mph, respectively.
Table 4.8.1.1 PPPPParamearamearamearamearametttttererererers fs fs fs fs for vor vor vor vor vehicle/occupant systehicle/occupant systehicle/occupant systehicle/occupant systehicle/occupant systemememememanalysis - trilinear belted caseanalysis - trilinear belted caseanalysis - trilinear belted caseanalysis - trilinear belted caseanalysis - trilinear belted case
metIte
)sm(a
)s/s’g(Ap
)s’g(
1esaCnoitagnole%81-31(tlebtniop-3
)gnibbew43 0001 04
2esaCnoitagnole%6-3(tlebtniop-3
)gnibbew03 0021 04
3esaChtiwgnibbew%6-3(tlebtniop-3
)redaolerp02 0021 04

Fundamental Principles for Vehicle/Occupant System Analysis
Page 208
A fundamental requirement in the design of a vehicle front-end structure is thatits crush characteristics be compatible with the restraint system characteristics.Let δp/v be the vehicle dynamic crush length and δp/v be the belted occupantdisplacement relative to the vehicle compartment. Mathematically, thecompatibility condition requires that
δ δ v p/v RCD + = (4.8.1.11)
where RCD is established based on given restraint system parameters describedabove. To prevent the “secondary impact,” δP /v must not exceed the availableinterior distance as previously stated. Determination of δp/v, therefore, dependson a vehicle’s interior design, and can be estimated using approaches describednext.
The travel of a restrained right front seat occupant relative to the vehicle δp/vinside the passenger compartment is one of the important parameters fordetermining the required vehicle crush distance in a frontal barrier impact. Theamount of δp/v depends on the details of the instrument panel design (for thedriver, it depends on the steering column design), and also the design of other
Fig. 4.8.1.2 Occupant travel versus effectiveness timeat different impact speeds
40 mph
30 mph
35 mph
24
20
16
12
825 30 35
Effectiveness Time (ms)
Occ
upan
t Tra
vel
p
(inc
h)δ
1

Fundamental Principles for Vehicle/Occupant System Analysis
Page 209
components such as seat belts, anchorage and seats, which may not be availablein the concept stage of design. A method for estimating δp/v is shown in Figure4.8.1.4 — δp/v from Head to Windshield Distance, based on the distance betweenthe occupant’s head and the windshield along the vehicle’s longitudinal axis.However, observations of motion of a restrained dummy occupant with belt onlyin a frontal barrier impact show that in most cases the dummy head does notcontact the windshield, but may contact the instrument panel in a combined
Maximum Chest Acceleration (g's)
30 mph22
20
18
16
36 40 44 48
Occ
upan
t Tra
vel
p +
p
(i
nche
s)δ
2δ
3
35 mph28
26
24
22
36 40 44 48
Occ
upan
t Tra
vel
p +
p
(i
nche
s)δ
2δ
3
Case 1
Case 2
Case 3
Case 1
Case 2
Case 3
Fig. 4.8.1.3 Occupant travel versus effectiveness timeat 30 mph and 35 mph impact speeds
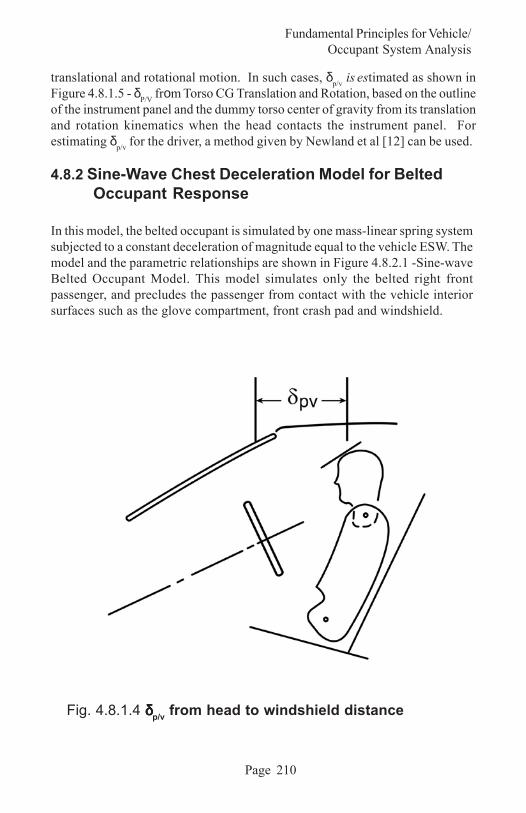
Fundamental Principles for Vehicle/Occupant System Analysis
Page 210
translational and rotational motion. In such cases, δp/v is estimated as shown inFigure 4.8.1.5 - δP/V frοm Torso CG Translation and Rotation, based on the outlineof the instrument panel and the dummy torso center of gravity from its translationand rotation kinematics when the head contacts the instrument panel. Forestimating δp/v for the driver, a method given by Newland et al [12] can be used.
4.8.2 Sine-Wave Chest Deceleration Model for BeltedOccupant Response
In this model, the belted occupant is simulated by one mass-linear spring systemsubjected to a constant deceleration of magnitude equal to the vehicle ESW. Themodel and the parametric relationships are shown in Figure 4.8.2.1 -Sine-waveBelted Occupant Model. This model simulates only the belted right frontpassenger, and precludes the passenger from contact with the vehicle interiorsurfaces such as the glove compartment, front crash pad and windshield.
Fig. 4.8.1.4 δδδδδp/v from head to windshield distance


Fundamental Principles for Vehicle/Occupant System Analysis
Page 212
k: Restraint system stiffness, lb/ in.
( )e x ESWmax max&&= −2 0π Wo: Effective occupant weight, lb.
( )&&max
*x ESW ft02
1 1 2= + +
π f: Occupant-restraint
natural frequency, Hz.
t ESW* . /= 0 072 δ &&xt01
: Occupant deceleration at ti, g.
t tf fti = +
−*
*tan1
21
21
π π tI: Time at which emax occurs
(inflection time), sec.
t v ESWv = 0 0456 0. / emax: “maximum” onset rate of theoccupant deceleration, g/sec.
( )τ
π ππG t
ftf
= ++ −
**tan 1 2
2&&
maxx0 :“maximum” occupant
deceleration, g.
Fig. 4.8.2.1 Sine-wave belted occupant model

Fundamental Principles for Vehicle/Occupant System Analysis
Page 213
te: Maximum onset rate intercepttime, s.
& .*x ESWor = 158 δ t*: Occupant-restraint contact
time, sec.
( )( ) ( )&& .. /max
*x ESW f ftv02
3 5 1 2= + π δ: restraint system slack, in.
Τv: Time at which maximumvehicle deformationoccurs, sec.
=0.556 emax/f2 Vo: Initial vehicle-barrier impact
velocity, mph
( )f x xo ov= −3127. &&max
δ τG: Time at which occurs, sec.
( ) ( )ESW x f xo o= +&& / . &&max max
220 204 2δ & *xor : Occupant restraint
relative contact velocity, mph.
x V ESWvm o= 0 4 2. / &&max
x0 : Maximum occupant-
vehicle relativevelocity, mph.
t tESWei0 = −
maxxov: Occupant-vehicle interior
travel, in.xvm: Maximum vehicle
deformation, in.to: Maximum onset rate intercept
time, sec.

Fundamental Principles for Vehicle/Occupant System Analysis
Page 214
4.8.3 Constant Deceleration Model for Vehicle Response(ESW)
This model assumes that the vehicle deceleration remains constant during vehiclecrush, namely, Αv = constant = ESW.
The vehicle velocity-time and crush-time histories are given by the followingequations:
( )V t V A tv= −0 (4.8.3.1)
X V t A tv v= −021
2(4.8.3.2)
The time when the vehicle stops Tv and the maximum vehicle dynamic crush δvcan be obtained from Eqs. (4.8.3.3) and (4.8.3.4), respectively.
T V Av v= 0 / (4.8.3.3)
δv vV T=12 0 (4.8.3.4)
Rewriting Eqs. (4.8.3.3) and (4.8.3.4) yields a useful expression:
vv
VAδ
204.0= (4.8.3.5)
where V0 is in mph, δv is in inches and Αv is in g’s.
Eqs (4.8.3.3) and (4.8.3.4) are used to calculate the time Tv and the crush distancesδv required to stop the vehicle during a frontal barrier impact from initial speeds V0of 30, 35, and 40 mph, assuming a constant deceleration Α v of 16 g’s to 24 g’s.The results are shown below: (Table 4.8.3.1)
4.9 Ride-Down Concept and Application
Ride-down, as mentioned in Section 4.6 – Vehicle/Occupant Velocity Profiles, is amechanism whereby the occupant is in contact with the vehicle interior beforethe vehicle velocity approaches zero. This is advantageous for possible reductionof occupant loads by ride-down since the second collision occurs at a lesserrelative velocity than that would have occurred when the vehicle is completely

Fundamental Principles for Vehicle/Occupant System Analysis
Page 215
stopped. Using the ESW concept, the mechanism of ride-down can be illustratedas follows:
Let Av be an ESW vehicle deceleration;Vo be the vehicle impact velocity;δ v be the vehicle dynamic crush or stopping distance;Vr be the relative velocity between the occupant and vehicle
interior or the ride-down velocity;δ occ be the initial spatial distance between the occupant and
vehicle interior;
then, the time for vehicle to stop is:
tVAv
o
v= (4.9.1)
The time of occupant contacting the interior is:
v
occc A
t δ2= (4.9.2)
For ride-down benefit, it is required that:
Table 4.8.3.1 Time and crush distances reqTime and crush distances reqTime and crush distances reqTime and crush distances reqTime and crush distances required tuired tuired tuired tuired tooooostop a vehicle for fontal impactstop a vehicle for fontal impactstop a vehicle for fontal impactstop a vehicle for fontal impactstop a vehicle for fontal impact
Av hpm03 hpm53 hpm04
s’g ces/tf 2 Tv sm δvni Tv sm δvni Tv sm δvni
61 2.515 4.58 5.22 36.99 76.03 8.311 90.04
81 6.975 19.57 40.02 65.88 82.72 32.101 36.53
02 446 23.86 40.81 17.97 55.42 01.19 70.23
22 4.807 11.26 04.61 64.27 23.22 28.28 51.92
42 8.277 49.65 30.51 24.66 64.02 29.57 27.62

Fundamental Principles for Vehicle/Occupant System Analysis
Page 216
t tv c> (4.9.3)
From the above equations, it is then required that:
occv
o
AV δ>2
2
(4.9.4)
Noting that δ v = Vo2/2Av, Eq. (4.9.4) reduces to
δ v > δ occ (4.9.5)
Eq. (4.9.5) indicates that interior space must be less than the vehicle crush inorder to achieve possible ride-down. The relative velocity of the occupant to thevehicle interior at time tc is:
occvr AV δ22 = (4.9.6)
Since Av=V02/(2δ v), the relative velocity Vr can then be expressed in terms of δ v
and δ occ as:
21
0
=
v
occr VV
δδ
(4.9.7)
Some interesting remarks can be made upon reviewing Eq. (4.9.7):If dðocc> dðv, the occupant impacts the vehicle interior when the vehicle isstopped or is in rebound. It is then possible that the second collision velocitymay be equal to or greater than the initial impact velocity.The second collision velocity varies as the square root of the ratio of dðocc/dðv. Note that dðv is a function of Av and Vr.
The above ride-down analysis is based on an ESW approach. More rigorousanalyses of occupant ride-down are given by Maeda et al [13], Matsui [14],Huang and Loo [15] and Katoh and Nakahama [16]. In a recent publication byHuang [17], more discussions and applications can be found. The analysis issummarized below:

Fundamental Principles for Vehicle/Occupant System Analysis
Page 217
Let the occupant mass be mo, the vehicle mass be mv, the occupant position attime t be xo(t), and the vehicle position at time t be xv(t). When the occupantundergoes a deceleration of ao(t), the occupant’s impact energy absorbed is:
( ) ( )E m a t dx tt
0 00 0 0= ∫ (4.9.8)
Let (4.9.9)
then, Eq. (4.9.8) can be rewritten as:
( ) ( )E m a ds t m a dx tt t
v0 00 0 00 0= +∫ ∫ (4.9.10)
where 2
000 21 vmE = . Note that s(t) is the occupant displacement relative to the
vehicle, and represents the occupant stroke into a restraint system.
In Eq. (4.9.10), the occupant energy to be dissipated can be divided into twoparts: energy absorbed by the restraint system as represented by the first integral,and energy dissipated by the ride-down with the vehicle as indicated in thesecond term. If the restraint system can be represented as a linear spring with astiffness k, then the first integral in Eq. (4.9.10) becomes:
( )m a ds t ksds kt
00 0 0
212∫ ∫= =
δδ (4.9.11)
where δ is the maximum stretch of the restraint system.
Let the ride-down efficiency, η Rd, be defined as the ratio of the energy absorbedby the ride-down to the total kinetic energy of the occupant. Mathematically, itcan be expressed as:
where v0 is the initial vehicle velocity. Similarly, the restraint-system efficiencycan be defined as:
( ) ( ) ( )txtxtsv
−=0

Fundamental Principles for Vehicle/Occupant System Analysis
Page 218
( )000
/ 0 Etdsamt
RS∫=η (4.9.13)
The expression given by Eq. (4.9.12) provides an indicator for relative evaluationbetween crashes under a combined performance of the vehicle structure and theoccupant restraint system. The same ride-down efficiency may be due to acombination of different vehicle crashes and various restraint systemcharacteristics.
Based on 35 mph collision tests in NCAP by NHTSA, Katoh and Nakahama [16]calculated the ride-down efficiency using Eq. (4.9.12) by substituting ao(t) withthe AP component of the occupant chest deceleration. These results are shownin Figure 4.9.1 – Passenger Chest g and Ride-down Efficiency. It can be seen thatthe occupant chest deceleration decreases as the ride-down efficiency increases.
Fig. 4.9.1 Passenger chest g and ride-down efficiency
RIDE-DOWN EFFICIENCY (CHEST DECELERATION)
CH
ES
T G
G
%
30
60
50
40
7030 40 50
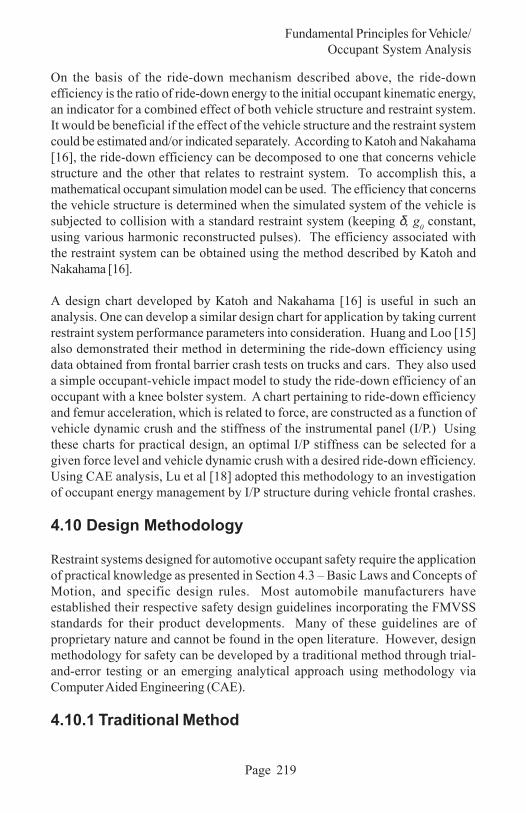
Fundamental Principles for Vehicle/Occupant System Analysis
Page 219
On the basis of the ride-down mechanism described above, the ride-downefficiency is the ratio of ride-down energy to the initial occupant kinematic energy,an indicator for a combined effect of both vehicle structure and restraint system.It would be beneficial if the effect of the vehicle structure and the restraint systemcould be estimated and/or indicated separately. According to Katoh and Nakahama[16], the ride-down efficiency can be decomposed to one that concerns vehiclestructure and the other that relates to restraint system. To accomplish this, amathematical occupant simulation model can be used. The efficiency that concernsthe vehicle structure is determined when the simulated system of the vehicle issubjected to collision with a standard restraint system (keeping δ, g0 constant,using various harmonic reconstructed pulses). The efficiency associated withthe restraint system can be obtained using the method described by Katoh andNakahama [16].
A design chart developed by Katoh and Nakahama [16] is useful in such ananalysis. One can develop a similar design chart for application by taking currentrestraint system performance parameters into consideration. Huang and Loo [15]also demonstrated their method in determining the ride-down efficiency usingdata obtained from frontal barrier crash tests on trucks and cars. They also useda simple occupant-vehicle impact model to study the ride-down efficiency of anoccupant with a knee bolster system. A chart pertaining to ride-down efficiencyand femur acceleration, which is related to force, are constructed as a function ofvehicle dynamic crush and the stiffness of the instrumental panel (I/P.) Usingthese charts for practical design, an optimal I/P stiffness can be selected for agiven force level and vehicle dynamic crush with a desired ride-down efficiency.Using CAE analysis, Lu et al [18] adopted this methodology to an investigationof occupant energy management by I/P structure during vehicle frontal crashes.
4.10 Design Methodology
Restraint systems designed for automotive occupant safety require the applicationof practical knowledge as presented in Section 4.3 – Basic Laws and Concepts ofMotion, and specific design rules. Most automobile manufacturers haveestablished their respective safety design guidelines incorporating the FMVSSstandards for their product developments. Many of these guidelines are ofproprietary nature and cannot be found in the open literature. However, designmethodology for safety can be developed by a traditional method through trial-and-error testing or an emerging analytical approach using methodology viaComputer Aided Engineering (CAE).
4.10.1 Traditional Method
Fundamental Principles for Vehicle/Occupant System Analysis
Page 220
In a traditional fashion, Patrick [2] outlined a generic systematic approach to asafety design, assuming a given vehicle structure, with the following steps:
Establish the specifications for the safety design including crash modes andimpact velocities.Establish dummy performance numbers pertaining to FMVSS to be met.Estimate the occupant stopping distances for the established tolerance levelsbased on the dummy performance numbers.Study the vehicle to obtain the total available stopping distance. This willinclude the front-end crush, side crush and roof crush if all the conditions areto be included in the design. The interior space and crush distance for theinterior components must also be determined. The deceleration pulse shapefor the vehicle for the collisions under consideration should be obtained frombarrier crash tests and the displacement- and velocity-time curves calculatedfrom the record. Other helpful data include the relative velocity and displace-ment of the occupant with respect to the vehicle in the unrestrained condition.Note that this also can be done using Restrained Occupant Response Analy-sis tool given in Section 4.8– Vehicle / Occupant velocity profiles (AnalyticalApproach).Compare the distance available from Step 4 with the distance from Step 3. Thiscomparison will determine how efficient the use of the stopping distance mustbe, and will, in some cases, determine the type of restraint system to be incor-porated. This is discussed in the compatibility between restraint system andvehicle front-end structure presented in Section 4.7 – Compatibility BetweenRestraint System and Vehicle Front Structure.Decide on the basic safety system to be incorporated into the vehicle. De-pending upon the conditions, this could be EA material cushioning (or pad-ding), a conventional belt system, belt systems with load limiter and/orpretensioner, a supplemental airbag restraint system, smart restraint systems,or even combinations of these.Calculate the performance requirements for each component. If the belt re-straint system is to be utilized, the stiffness of the webbing and the anchorpoints must be determined together with the forward motion of the occupantunder the loading conditions.Design the system based on the calculated performance requirements and thetype of system chosen.Build a prototype restraint system for impact sled testing.Conduct sled tests to determine whether adequate/satisfactory performancehas been achieved. Modify the prototype system as required to improve thesystem performance.Install a built prototype in a vehicle for prove-out testing.Conduct barrier crash tests and evaluate the results to assess whether the

Fundamental Principles for Vehicle/Occupant System Analysis
Page 221
prototype system meets the performance requirements. Modify, if necessary,and continue testing and modification until the system functions satisfacto-rily.
Again, it should be emphasized that the above design steps are generic and willvary from design to design and with guidelines established by individualmanufacturers. Restraint system design engineers must modify the necessarysteps to make the procedure fit their specific requirement accordingly.
The traditional method, which requires part fabrication, testing, and furtherrefinement, is generally too cumbersome and time-consuming for providing designdirection in the development stage. As an example, to meet FMVSS testrequirements the concept phase of car development could include:
2 car lines2 impact speeds: 30 mph FMVSS 208 and 35 mph NCAP (New Car AssessmentProgram conducted by NHTSA to provide consumers safety information onnew cars);3 different restraint systems (3-point belt, airbag and combination);2 powertrain types;2 weight conditions (the lightest and the heaviest).
This requires a total of 48 combinations of restraint systems and possible vehicleconfigurations to be tested for design directions. This testing will be laborintensive, time-consuming and costly. To reduce the number of tests, computersimulation technology or computer aided engineering (CAE) can be employed forrapid evaluation and iteration of designs to drive the safety design developmentprocess.
4.10.2 CAE Methods
Computer simulation provides a means of expanding the study of automotivesafety-related issues. In CAE methodology development process, some testresults will be used for developing vehicle structural and restraint simulationmodels. For example, static front-end component crush tests and non-linearfinite element analysis can be used to develop lumped-mass structural models forvarious vehicle configurations. Results from sled tests with instrumented dummiescan be used to develop dummy occupant simulation models with various restraintsystems.
Fundamental Principles for Vehicle/Occupant System Analysis
Page 222
Computer models can simulate the structural response to a crash event. Thereare also computer models that can simulate the dummy occupant response to acrash event. These models separately simulate the structural crash performancefrom the dummy response, whereas, in actual crash event, these response occurconcurrently. With a rigid body or FEA method, combined structural/occupantsimulation models are now available for predicting the dummy occupant responseto vehicle interior contact with or without compartment intrusion during frontalimpacts. This system approach through “computer” testing becomes a moredesign-driven analytical tool in the design of safety restraint systems byautomobile manufacturers and suppliers. More detailed analytical methods aredescribed in Chapter 5: Design Tools: Human Body Modeling.
4.11 Conclusion
In today’s quest for continued improvement in automotive safety, various restraintsystems have been developed to provide occupant protection in a wide varietyof crash environments under different directions and conditions. It is extremelydifficult, and of course not attempted here, to present rigorous mathematicaltreatments to cover occupant kinematics in complicated real world situations. Inthis Chapter, some fundamental principles of dynamics are presented and appliedto examples with primary discussions on the vehicle/occupant response in frontalimpact analysis only, even though side crash events are lightly touched upon.
The performance of a restraint system depends on vehicle structural performance.The compatibility between restraint system and vehicle front structure given inSection 4.7 – Compatibility between Restraint System and Vehicle Front Structureaddresses the importance of this aspect. A given restraint system that performswell with specific vehicle front-end structural characteristics may not yield anidentical performance with different vehicle structures during a similar crash. Themethod presented in this chapter allows conceptual studies of both the restraintsystem and vehicle crash pulse in an ideal one-dimensional analysis of dynamicsusing basic principles presented in Section 4.3 – Basic Laws and Concepts ofMotion. These principles can be applied to study occupant responses in nearlyall directional types of impact, such as frontal, side, and rear, with respect to themagnitude of velocity change of occupant, the rate of change in velocity, andhow the change in velocity is accomplished. For more complicated analysis ofoccupant and vehicle structural responses, mathematical models using eitherrigid-body-based programs (MADYMO[19], ATB[20], for example) or deformable-

Fundamental Principles for Vehicle/Occupant System Analysis
Page 223
body-based non-linear finite element codes (LS-DYNA[21], PAM-CRASH[22],RADIOSS[23], for example) are currently used among auto manufacturers in designof advanced/ smart restraint systems for impact safety protection of occupants.
4.12 Acknowledgments
The author would like to thank the following individuals:
Mr. B. B. Fileta for discussing occupant/restraint modelsDr. Rolf Eppinger for the use of some of his axioms in this chapter
4.13 References
1. Prasad, P. and Chou, C.C., “A Review of Mathematical OccupantSimulation Models,” Chapter 6, Accident and Injury - Biomechanicsand Prevention, edited by A. M. Nahum and J. W. Melvin, Verlag-Springer,1993.
2. Patrick, L.M., “Human Tolerance to Impact and Its Application to SafetyDesign,” Biomechanics and Its Application to Automotive Design, SAEPublication P-49, Jan. 1973.
3. Chou, C.C., and Nyquest, G. W., “Analytical Studies of the Head InjuryCriterion (HIC), ” SAE Paper No. 740082, 1974.
4. Huang, M., Lawson, G. P., Powell, B. K and Walker, J. H., “Characterizationof Vehicle Deceleration Time Histories in the Analysis of ImpactDynamics,” SAE Paper No. 770013, 1977.
5. Chou, C. C., and Lim, G. G., “Characterization of Vehicle DecelerationUsing Harmonic Analysis,” The 20th FISITA Conference, 1988.
6. Eppinger, R., “Occupant Restraint Systems,” Chapter 8, Accident Injury- Biomechanics and Prevention, Edited by A. M. Nahum and J. W. Melvin,Springer-Verlag, 1993, pp. 186 - 197.
7. Lim, G. G., Prasad, P., Chou, C. C., Walker, L. A., Sundararajan, S., Fletcher,F. D. and Chikola, J. A., “Development of The Deployable Door Trim

Fundamental Principles for Vehicle/Occupant System Analysis
Page 224
System,” An addendum of the proceedings, Automotive Body Interior& Safety Systems, Vol. 23, IBEC, Oct. 1-3, 1996, Detroit.
8. Hobbs, C. A., “Dispelling the Misconceptions about Side ImpactProtection,” SAE Paper No. 950879, 1995, Detroit.
9. Hofferberth, J. E. and Tomassoni, J. E., “A Study of Structural andRestraint Requirements for Automobile Crash Survival,” Proceedings ofthe Third International Congress on Automotive Safety, Vol II, pp. 28-1to 28-88, 1974.
10. Chan, C. “Fundamentals of Crash Sensing,” SAE Seminar Video Tutorial,available through Professional Development Division, call (724) 772-7148.
11. Huang, M., “An Analysis of the Vehicle-Occupant Impact Dynamicsand Its Application,” SAE Paper No. 830977, 1983.
12. Newland, C., Scheffel, G., Armstrong, M. and Seyer, K., “A ScientificMethod for Analyzing Vehicle Safety,” The 16th International TechnicalConference on Experimental Safety Vehicle, June 1-4, Windsor, Canada,1998, Paper No. 98-S11-O-05.
13. Maeda, T., Irie, N. and Sato, S., “On the Occupant Crash ProtectionSystem of the Nissan ESV,” SAE Paper No. 730589, 1973.
14. Matsui, S., “A Method of Estimating the Crashworthiness of BodyConstruction,” 6th Experimental Safety Vehicles, pp. 302 - 309.
15. Huang, M. and Loo, M., “A Study on Ride-Down Efficiency and OccupantResponses in High Speed Crash Tests,” SAE-SP-1077, SAE Paper No.950656, 1995.
16. Katoh, H. and Nakahama, R., “Study on the Ride-Down Evaluation,” 9th
International Technical Conference on Experimental Safety Vehicles, 1982,Kyoto.
17. Huang, M., Vehicle Crash Mechanics, CRC Press, 2002, pp. 67- 83.
18. Lu, D., Riley, J., Schleicher, G. and Jurosek, M., “An Investigation ofOccupant Energy Management by I/P Structures During Vehicle Frontal

Fundamental Principles for Vehicle/Occupant System Analysis
Page 225
Crash,” AMD-Vol. 210/BED-Vol. 30, Crashworthiness and OccupantProtection in Transportation Systems, ASME, 1995.
19. MADYMO User’s Manual, Version 5.1, TNO Department of InjuryPrevention, TNO Road-Vehicle Research Institute.
20. Fleck, J. T. and Butler, F. E., “Validation of Crash Victim Simulator: Vol. 1- Engineering Manual - Part I: Analytical Formulation, Department ofTransportation Report No. DOT-HS-806-279, Dec. 1981; Vol. 2 -Engineering Manual - Part II : Validation Effort, Department ofTransportation Report No. DOT-HS-806-280, Aug. 1982.
21. Hallquist, J. O., “LS-DYNA Theoretical Manual”, Livermore SoftwareTechnology Corporation, 1998.
22. PAM-Crash Reference Manual, Version 2001, PAM System International.
23. RADIOSS Input Manual, Version 3.1, 01/1996, Mecalog Sarf, France.
Additional References:
24. Strother, C. E., and Morgan, R. M., “The Efforts of the National HighwayTraffic Safety Administration in the Development of Advanced PassiveProtection Systems and Child Restraint Systems,” Third InternationalConference on Occupant Protection, SAE Conference Proceedings P-53, 1974, pp. 246-267.
25. Lau, I. V., Capp, J. C. and Obermeyer, J. A., “A Comparison of Frontal andSide Impact: Crash Dynamics, Countermeasures and Subsystem Tests,”The 35th Stapp Car Crash Conference, Proceedings, SAE P-251, 1991,pp. 109-124. (SAE Paper No. 912896).
26. Horsch, J. D., Viano, J. C. and Decou, J., “History Safety Research andDevelopment on the General Motors Energy-Absorbing SteeringSystem,” The 35th Stapp Car Crash Conference Proceedings, SAE P-251,pp. 1-46. (SAE Paper No. 912890).
27. “Focus on Passive Safety,” Automotive Engineer, October/November1996, pp. 42-54.

Fundamental Principles for Vehicle/Occupant System Analysis
Page 226
28. Agelidis, N. and Chou, C. C., “Parametric Study of the Effect of CrashPulse Shape on Dummy Response using MADYMO,” 1991 ASME WinterAnnual Meeting.
29. Prasad, P., “Side Impact Simulation Study for Door Bolster Requirements,”Report prepared for Advanced Safety and Structures TechnologyDepartment, Vehicle Development Technology, March 31, 1980.
30. Suzuki, N., Sonoda, Y., Takahashi, K., Suzuki, T., Tawarayama, T. andDokko, Y., “Optimization of Vehicle Deceleration Curves for OccupantInjury,” JSAE Conference Proceedings 924, 1992-10. Paper No. 924024.
31. DuWaldt, F. A., “Matched Driver Restraint Systems,” SAE Paper No.730974.
32. Johnson, P.R. and Wiltse, W. E., “Front Structural Strength as It AffectsOccupant Injury-Reduction and Survival,” Proceedings of the GeneralMotors Corp. Automotive Safety Seminars, Milford, Michigan, July 11-12, 1968.
33. Aljundi, B., Skidmore, M., Poeze, E. and Slaats, P., “Occupant SafetySimulations for Interior Design,” Proceedings of the 35th AnnualSymposium, SAFE Association, Phoenix, Arizona, Sept. 8-10, 1997, pp.390-404.
34. Martin, C. E. and Kroell, C. K., “Influence of Vehicle Crush Distance,Occupant Spacing, and Interior Crush Stiffness on Severity of Occupant-Interior Impact,” SAE Paper No. 670034, 1967.