Risk factors for a farm vehicle public road crash
6
Please cite this article in press as: Costello, T.M., et al., Risk factors for a farm vehicle public road crash. Accid. Anal. Prev. (2008), doi:10.1016/j.aap.2008.08.029 ARTICLE IN PRESS G Model AAP-1760; No. of Pages 6 Accident Analysis and Prevention xxx (2008) xxx–xxx Contents lists available at ScienceDirect Accident Analysis and Prevention journal homepage: www.elsevier.com/locate/aap Risk factors for a farm vehicle public road crash Theresa M. Costello a,1 , Michael D. Schulman b,∗ , Roger E. Mitchell a a Department of Psychology, North Carolina State University, P.O. Box 7801, Raleigh, NC 27695, United States b Department of Sociology and Anthropology, North Carolina State University, P.O. Box 8107, Raleigh, NC 27695, United States article info Article history: Received 17 September 2007 Received in revised form 8 July 2008 Accepted 29 August 2008 Keywords: Agriculture Crashes Farmers Farm vehicles Haddon matrix Injury Public roads Crash risk abstract Driver, vehicle, public road, and farm enterprise characteristics were examined for their combined associ- ation with farm vehicle public road crash group membership. North Carolina farms experiencing a public road crash from 1992 to 2003 (n = 200) were compared with a non-crash control group (n = 185) for a 1:1 case:control ratio. Five characteristics were associated with increased odds of crash group member- ship in the combined model (likelihood ratio = 175.95; d.f. = 15; p < .001): use of non-English speaking drivers (OR = 3.71); use of non-family hired help drivers (OR = 4.25); types of non-farm vehicle public road use (OR = 1.39); farm injury history (OR = 1.33); and, use of younger farm vehicle drivers (OR = 1.02). Farms reporting older farm vehicle drivers (OR = 0.97), and low farm income (OR = 0.29) were less likely crash group members. Recommendations are discussed for incorporating findings into farm vehicle crash prevention research and interventions. © 2008 Elsevier Ltd. All rights reserved. 1. Introduction Farm vehicle public road crashes are a major safety concern for farmers (Costello et al., 2003; Luginbuhl et al., 2003; NCDOL, 1999) even though official statistics show that they are a relatively rare event (less than 1 percent of annual public road crashes in North Carolina see NCDOL, 1999). Indeed, farm vehicle drivers appear at a much higher risk for a public road crash than non-farm vehicle drivers when exposure, i.e., vehicle miles traveled (VMT), is con- sidered (Costello et al., 2003; Glascock et al., 1995). When a farm vehicle public road crash does occur, it is five times more likely to result in a fatality than a non-farm vehicle-type crash (American Trucking Associations, 2000). Few empirical studies of farm vehi- cle public road crashes exist (Costello et al., 2003; Gerberich et al., 1996; McCurdy and Carroll, 2000) and such studies tend to concentrate on driver characteristics to the exclusion of broader environmental characteristics. ∗ Corresponding author. Tel.: +1 919 515 9016; fax: +1 919 515 2610. E-mail addresses: [email protected] (T.M. Costello), michael [email protected] (M.D. Schulman), roger [email protected] (R.E. Mitchell). 1 902 Woodbine Drive, P.O. Box 2522 Chapel Hill, NC 27515, United States. Tel.: +1 919 929 8903; fax: +1 919 929 8903. 1.1. Background and previous studies This research examines driver, vehicle, farm enterprise, and pub- lic road characteristics identified in the literature as increasing the risk for a public road crash involving a farm vehicle (Doss and Pfister, 1972; Ogden, 1997; Layde et al., 1993, 1995; Grieshop et al., 1996). Examining farm vehicle driver characteristics, younger drivers are often at a higher risk for injury than middle age individuals because of deficiencies in skill and experience (McCurdy and Carroll, 2000). Older drivers are often at higher risk for injury than middle age indi- viduals because of sensory and muscular deficits and age-related medical conditions (Pickett et al., 1996). With regard to farm and non-farm vehicle characteristics, farms that utilize large size vehicles are at increased risk for a farm vehi- cle public road crash because of the challenges involved in sharing a narrow, two-lane road with large, slow-moving farm vehicles (Mason, 2003). Passenger cars are most frequently involved in farm vehicle public road crashes, followed by trucks, and other non-farm vehicle types (Glascock et al., 1995; Hughes and Rodgman, 2000; Batten, 2000). Characteristics of the farm enterprise are also important. Farms that use hired help, specifically hiring non-family or non-English speaking workers, have higher risk for injury due to workers’ inex- perience and communication challenges (Grieshop et al., 1996). Smaller farms are at increased risk for accidents or injuries com- pared with larger size farms because of the challenges of getting the farm work done under time pressure constraints, often with 0001-4575/$ – see front matter © 2008 Elsevier Ltd. All rights reserved. doi:10.1016/j.aap.2008.08.029
Transcript of Risk factors for a farm vehicle public road crash

A
R
Ta
b
a
ARRA
KACFFHIPC
1
feeCadsvrTcace
m(
T
0d
ARTICLE IN PRESSG ModelAP-1760; No. of Pages 6
Accident Analysis and Prevention xxx (2008) xxx–xxx
Contents lists available at ScienceDirect
Accident Analysis and Prevention
journa l homepage: www.e lsev ier .com/ locate /aap
isk factors for a farm vehicle public road crash
heresa M. Costelloa,1, Michael D. Schulmanb,∗, Roger E. Mitchell a
Department of Psychology, North Carolina State University, P.O. Box 7801, Raleigh, NC 27695, United StatesDepartment of Sociology and Anthropology, North Carolina State University, P.O. Box 8107, Raleigh, NC 27695, United States
r t i c l e i n f o
rticle history:eceived 17 September 2007eceived in revised form 8 July 2008ccepted 29 August 2008
eywords:
a b s t r a c t
Driver, vehicle, public road, and farm enterprise characteristics were examined for their combined associ-ation with farm vehicle public road crash group membership. North Carolina farms experiencing a publicroad crash from 1992 to 2003 (n = 200) were compared with a non-crash control group (n = 185) for a1:1 case:control ratio. Five characteristics were associated with increased odds of crash group member-ship in the combined model (likelihood ratio = 175.95; d.f. = 15; p < .001): use of non-English speakingdrivers (OR = 3.71); use of non-family hired help drivers (OR = 4.25); types of non-farm vehicle public
griculturerashesarmersarm vehiclesaddon matrix
njury
road use (OR = 1.39); farm injury history (OR = 1.33); and, use of younger farm vehicle drivers (OR = 1.02).Farms reporting older farm vehicle drivers (OR = 0.97), and low farm income (OR = 0.29) were less likelycrash group members. Recommendations are discussed for incorporating findings into farm vehicle crashprevention research and interventions.
© 2008 Elsevier Ltd. All rights reserved.
1
lr1EooOvm
tca
ublic roadsrash risk
. Introduction
Farm vehicle public road crashes are a major safety concern forarmers (Costello et al., 2003; Luginbuhl et al., 2003; NCDOL, 1999)ven though official statistics show that they are a relatively rarevent (less than 1 percent of annual public road crashes in Northarolina see NCDOL, 1999). Indeed, farm vehicle drivers appear atmuch higher risk for a public road crash than non-farm vehiclerivers when exposure, i.e., vehicle miles traveled (VMT), is con-idered (Costello et al., 2003; Glascock et al., 1995). When a farmehicle public road crash does occur, it is five times more likely toesult in a fatality than a non-farm vehicle-type crash (Americanrucking Associations, 2000). Few empirical studies of farm vehi-le public road crashes exist (Costello et al., 2003; Gerberich etl., 1996; McCurdy and Carroll, 2000) and such studies tend tooncentrate on driver characteristics to the exclusion of broader
Please cite this article in press as: Costello, T.M., et al., Risk factorsdoi:10.1016/j.aap.2008.08.029
nvironmental characteristics.
∗ Corresponding author. Tel.: +1 919 515 9016; fax: +1 919 515 2610.E-mail addresses: [email protected] (T.M. Costello),
ichael [email protected] (M.D. Schulman), roger [email protected]. Mitchell).1 902 Woodbine Drive, P.O. Box 2522 Chapel Hill, NC 27515, United States.el.: +1 919 929 8903; fax: +1 919 929 8903.
(vvB
tspSpt
001-4575/$ – see front matter © 2008 Elsevier Ltd. All rights reserved.oi:10.1016/j.aap.2008.08.029
.1. Background and previous studies
This research examines driver, vehicle, farm enterprise, and pub-ic road characteristics identified in the literature as increasing theisk for a public road crash involving a farm vehicle (Doss and Pfister,972; Ogden, 1997; Layde et al., 1993, 1995; Grieshop et al., 1996).xamining farm vehicle driver characteristics, younger drivers areften at a higher risk for injury than middle age individuals becausef deficiencies in skill and experience (McCurdy and Carroll, 2000).lder drivers are often at higher risk for injury than middle age indi-iduals because of sensory and muscular deficits and age-relatededical conditions (Pickett et al., 1996).With regard to farm and non-farm vehicle characteristics, farms
hat utilize large size vehicles are at increased risk for a farm vehi-le public road crash because of the challenges involved in sharingnarrow, two-lane road with large, slow-moving farm vehicles
Mason, 2003). Passenger cars are most frequently involved in farmehicle public road crashes, followed by trucks, and other non-farmehicle types (Glascock et al., 1995; Hughes and Rodgman, 2000;atten, 2000).
Characteristics of the farm enterprise are also important. Farmshat use hired help, specifically hiring non-family or non-English
for a farm vehicle public road crash. Accid. Anal. Prev. (2008),
peaking workers, have higher risk for injury due to workers’ inex-erience and communication challenges (Grieshop et al., 1996).maller farms are at increased risk for accidents or injuries com-ared with larger size farms because of the challenges of gettinghe farm work done under time pressure constraints, often with
ING ModelA
2 ysis an
lFaawipa
Padq(
prrpaercp
2
2
fafdapsta
2
ccicrb
2
spiew
2
lt
(onocnOficscthpsropecwibfI
phbnptwtbcc2pca
2
chcc
tvawrald
ARTICLEAP-1760; No. of Pages 6
T.M. Costello et al. / Accident Anal
imited help (Gerberich et al., 1996; McCurdy and Carroll, 2000).arm operators’ perceptions and awareness of the risks involved inn activity vary (Bernstein, 1996; Grieshop et al., 1996; Laugherynd Hammond, 1999). In addition, farmers’ previous agriculturalork injuries are associated with an increased risk for additional
njuries (Norris et al., 2000; Browning et al., 1998). Variation in riskerceptions and injury experience may impact farm safety practicesnd farmer behavior.
Public road conditions also contribute to increased crash risk.ublic road use results in “conflict” due to traffic density and sharingpublic resource with a growing population of non-farm vehiclerivers (Satterthwaite, 1981; Kita, 2000). Farms are sharing onceuiet rural roads with a growing population of non-farm vehiclesCostello and Wogalter, 2003).
In summary, farm vehicle public road crashes are complex socialhenomena that occur within the context of the public road envi-onment (Batten, 2000). Inherent in the use of limited publicesources such as public roads is the act of “sharing.” The com-lex nature of this public road “sharing” relationship suggests thatcombination of driver, vehicle, farm enterprise, and public road
nvironmental characteristics contribute to farm vehicle publicoad crash risk. This study investigates the extent to which theseharacteristics contribute to an increased risk of a farm vehicleublic road crash using data collected from North Carolina farms.
. Methods
.1. Case–control study design
A case–control design was used to compare farms reporting aarm vehicle public road crash with farms that had not experiencedcrash. A case was defined in this study as a North Carolina resident
arm operator or owner/operator, who met the following criteria:rives farm vehicles on public roads; is 18 years of age or older;nd either he/she or the farm help had experienced a farm vehicleublic road crash between 1992 and 2003. Controls met the samecreening criteria, except that neither the farmer respondent norhe farm help had experienced a farm vehicle crash between 1992nd 2003.
.2. Crash case time frame
A long inclusion period (1992–April, 2003) was selected forases in this study because of the small number of farm vehiclerashes reported each year on North Carolina public roads (approx-mately 300 crashes annually). Eighty-seven percent of all crashases occurred within 8 years of the survey. Ten respondents, whoeported a crash prior to 1992, were included in the non-crash groupecause the incident occurred outside of the designated time frame.
.3. Farm as unit of sampling
This study used the farm as the unit of sampling and analy-is rather than individual farm vehicle drivers. This decision wasrompted by (a) the difficulty of deriving a complete sample of
ndividual farm vehicle drivers in North Carolina and (b) the inter-st in capturing the effect of farm enterprise level characteristics,hich calls for sampling at the level of the farm.
Please cite this article in press as: Costello, T.M., et al., Risk factorsdoi:10.1016/j.aap.2008.08.029
.4. Participants
A USDA-sponsored agricultural program database provided aist of North Carolina resident farm land owners and farm opera-ors (owners of farm land and renters) with unique phone numbers
saf
s
PRESSd Prevention xxx (2008) xxx–xxx
n = 46,910) from which a SAS program for random selection with-ut replacement and random ordering generated 20,000 telephoneumbers for sequential calling. Calls were made at different timesf the day and the week to reduce sampling bias, and at least 3all backs were made before determining that a number couldot be contacted. A total of 14,800 phone numbers were called.f those 14,800 calls, 24 percent were unable to be screened
or several reasons. Approximately 1.4 percent of calls were tondividuals who refused to be screened. Approximately 22 per-ent of calls were placed to numbers that were either out ofervice (n = 1807), no longer where a farmer lives (n = 683), orould not be contacted (n = 807). Approximately 76 percent ofhe total 14,800 numbers called (i.e., 11,299 numbers) were toouseholds that allowed successful screening. Approximately 34ercent (n = 3902) of households successfully screened met inclu-ion eligibility criteria. The eligibility criteria were: North Carolinaesident farm operators or owner/operators; 18 years of age orlder; actively farming; and, reporting driving farm vehicles onublic roads at the time of the study. Reasons for not meetingligibility criteria were no longer farming or driving a farm vehi-le on public roads. Not all farm land owners in the databaseere actively operating farms (i.e., retired from farming and rent-
ng land to active farmer but participating in a USDA programecause of ownership of land). Informed consent was obtainedrom all respondents following protocols approved by the NCSURB.
Eligible individuals were asked to participate in a 20 min tele-hone survey, which included a question as to whether he/she oris/her farm help had experienced a farm vehicle public road crashetween 1992 and 2003. A total of 236 interviews (i.e., with 208o-crash respondents and 28 crash case respondents) were com-leted in part one of the telephone interviews. The 208 becamehe no crash control cases. From that point on, eligible individualsere screened and asked to complete the interview only if they or
heir farm help had experienced a farm vehicle public road crashetween 1992 and 2003. A total of 188 crash case surveys wereompleted in the second phase of sampling. Combined with the 28rash cases identified in the first phase of interviewing, a total of16 crash cases were available for data analysis. Altogether, a sam-le of 216 farm vehicle public road crash cases and 208 no-crashontrols resulted in a 1:1 case–control ratio. No eligible individualssked to complete the survey refused.
.5. Measures
The dependent variable in this study was dichotomous, withrashes defined as either the farm operator or owner/operator oris/her farm help having experienced a farm vehicle public roadrash between 1992 and 2003. Crashes were coded as 1, and no-rashes as zero (0).
All measures in this study were self-report with the farm opera-or or owner/operator respondent reporting characteristics of farmehicle public road use for his/her respective farm, rather than forspecific driver. In addition, farm operators or owner/operatorsere asked questions about the status of driver, vehicle and envi-
onmental characteristics at the time of the interview, rather thant the time of the crash. Driver, vehicle, farm enterprise and pub-ic road environmental independent variables were measured asescribed below.
Age of youngest farm vehicle driver is a continuous variable mea-
for a farm vehicle public road crash. Accid. Anal. Prev. (2008),
ured by asking farm operator or owner/operator respondents thege of the youngest individual driving farm vehicles on public roadsor their farm.
Age of oldest farm vehicle drivers is a continuous variable mea-ured by asking farm operator or owner/operator respondents the

ING ModelA
ysis an
af
tf
oia
oivwr
otow
olf
ohtmo
oortbft
soefvcrva
o(f
am
gcs($gti1
pure
2
rewptadmcatcs
rvtpvpsT
3
3
op(a1p(cUafh
itiso
sInm
ARTICLEAP-1760; No. of Pages 6
T.M. Costello et al. / Accident Anal
ge of the oldest individual driving farm vehicles on public roadsor their farm.
Public road driving exposure was measured by asking farm opera-ors or owner/operators the number of hours per week they or theirarm help drive farm vehicles on public roads during busy months.
Farm help status was measured by asking farm operators orwner/operators whether they have non-family hired help driv-ng farm vehicles on public roads. Yes responses were coded as 1nd no responses were coded as zero (0).
Non-English speaking help status was measured by asking farmperators or owner/operators whether any of their farm help driv-ng farm vehicles on public roads were non-English speaking. Thisariable, initially measured continuously (i.e., “how many. . .”),as dichotomized so that Yes responses were coded as 1 and no
esponses were coded zero (0).Farm injury history was measured by asking farm operators or
wner/operators how many times while working in agriculturehey had been injured badly enough on the job to miss a day of workr receive medical treatment. This was used us a dummy variableith any yes responses coded as one (1).
Farm vehicle age was measured by asking farm operators orwner/operators the age of the farm vehicles they drive on pub-ic roads. The age of the oldest farm vehicle mentioned was usedor data analysis and model testing.
Farm truck—usage was measured by asking farm operators orwner/operators what types of farm vehicles they or their farmelp drive, tow or load and transport on public roads, besides farmractors. Farm truck types (i.e., pick up trucks and dump trucks)
entioned were summed as zero (0) for no mention or one (1) forne or more mentions for use in data analysis and model testing.
Large size farm vehicle—usage was measured by asking farmperators or owner/operators what types of farm vehicles theyr their farm help drive, tow or load and transport on publicoads, besides farm tractors. Large size farm vehicle types men-ioned (i.e., combines, harvesters, specialty equipment and hayalers) were summed as zero (0) for no mention or one (1)or one or more mentions for use in data analysis and modelesting.
Total non-farm vehicle public road use characteristics were mea-ured by asking farm operators or owner/operators the followingpen-ended question: “what are the roads you use to transport farmquipment used for besides farming?” Responses were summedor use in data analysis and model testing. Examples of non-farmehicle public road use included: local traffic; commuter route;onstruction site access; livestock trucking route; constructionoute. Summary scores ranged from one (1) to seven (7) non-farmehicle public road uses. Higher scores indicated a greater numbernd variety of non-farm vehicle public road uses.
Traffic density was measured by asking farm operators andwner/operators whether their farm was located in an area with:1) little traffic, (2) moderate traffic, or (3) heavy traffic. Responserequencies were used for data analysis and model testing.
Number of farm operations was measured by asking farm oper-tors or owner/operators “how many farm operations they own oranage.”Farm income was measured by asking farmers to report their
ross annual farm sales. Gross annual farm sales responses wereategorized into one of three groups based on US agricultural cen-us data categories for gross annual farm sales, namely: low income<$25,000 annual gross farm sales); medium income ($25,000 to
Please cite this article in press as: Costello, T.M., et al., Risk factorsdoi:10.1016/j.aap.2008.08.029
99,999 annual gross farm sales); and high income ($100,000 orreater annual gross farm sales) (USDA, 1999). Medium income washe referent group. Farm size is often measured in agricultural stud-es using farm income as a proxy variable (Murphy, 2003; USDA,999).
3
d
PRESSd Prevention xxx (2008) xxx–xxx 3
Several variables included in the study to assess farm drivererceptions (e.g., actions taken to prevent crashes, perceived roadse conflict, perceived danger in driving farm vehicles on publicoads) were eliminated from the analyses because they could bendogenous to the crash process itself.
.6. Data analysis
Logistic regression was used to test the proposed research modelegarding farm vehicle public road crash group membership differ-nces. SAS for Windows was used for all data analyses. Outliersere identified using the following criteria: A Cook CI-interval dis-lacement statistic of .13 or greater; and a positive change in allhree of the following statistics, namely, the logistic regression X2,nd the linear regression R2, and R2 adjusted when variable waseleted from the model. After cleaning data for outliers (n = 9) andissing data (n = 30), a sample of n = 200 crash cases and n = 185 no-
rash controls were available for data analysis. The final data set fornalysis without the outliers and missing data cases was very closeo the goal of having a one to one ratio of crash cases and no-crashontrols. We elected not to use the outliers and missing data caseso as to not to create possible biases in the measured variables.
A combined model of driver, vehicle, farm enterprise, and publicoad environmental variables posited to be associated with farmehicle public road crash group membership was compared withhe constant-only model by means of a likelihood ratio test at a< .05 significance level. The unique contribution of each individualariables was tested using the Wald statistic and the odds ratiooint estimate, along with the 95% Wald confidence limits. Onlytatistically significant independent variables are presented in theables for reasons of parsimony.
. Results
.1. Sample description
The mean age of North Carolina resident farm operators orwner/operators in this study (n = 385) was 55 years, which is com-arable to USDA agricultural census data (1999) for North Carolinamean = 55 years). Mean acreage for the study sample was 539cres, which was higher than the North Carolina census mean of85 acres. A mean annual gross farm sales of $133,000 for this sam-le was lower than the North Carolina census mean of $155,000NCOSPL, 1997, 2000). This study’s sample represents a smaller per-entage of low income farms (28%) than the North Carolina (67%)SDA agricultural census data, and a higher percentage of mediumnd large income farms. Descriptive statistics (means) showed thatarms with crashes had more workers, farmed more acres, and hadigher gross farm sales than non-crash farms.
These findings suggest that, although the study sample is similarn age and race to the North Carolina agricultural census popula-ion, North Carolina resident farm operators or owner/operatorsncluded in the USDA agricultural program database may differomewhat from the average US Census data profile for North Car-lina farmers.
The means and percentages of the independent variablesignificant in the combined model are displayed in Table 1.ntercorrelations between independent variables, significant andon-significant, ranged from r = 0.1 to r = 0.64, with no evidence ofulticollinearity.
for a farm vehicle public road crash. Accid. Anal. Prev. (2008),
.2. Model testing
The study’s model tested the combined association of fifteenriver, vehicle, public road, farm enterprise, and farm operator char-
ARTICLE IN PRESSG ModelAAP-1760; No. of Pages 6
4 T.M. Costello et al. / Accident Analysis and Prevention xxx (2008) xxx–xxx
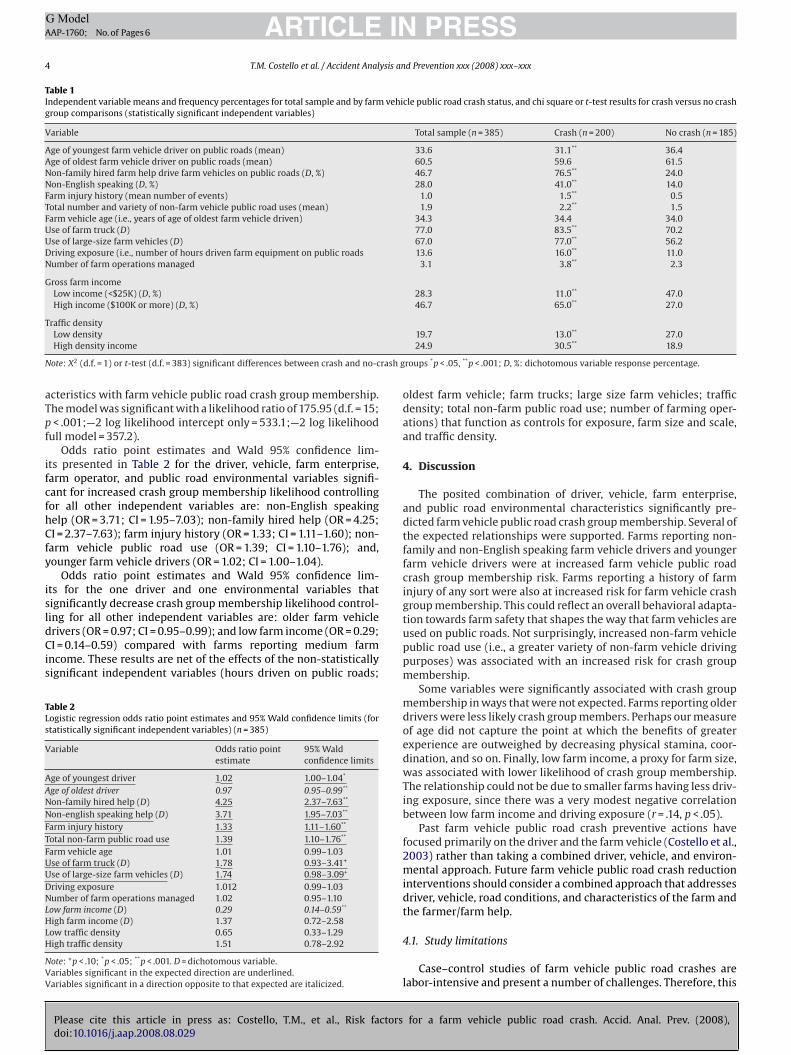
Table 1Independent variable means and frequency percentages for total sample and by farm vehicle public road crash status, and chi square or t-test results for crash versus no crashgroup comparisons (statistically significant independent variables)
Variable Total sample (n = 385) Crash (n = 200) No crash (n = 185)
Age of youngest farm vehicle driver on public roads (mean) 33.6 31.1** 36.4Age of oldest farm vehicle driver on public roads (mean) 60.5 59.6 61.5Non-family hired farm help drive farm vehicles on public roads (D, %) 46.7 76.5** 24.0Non-English speaking (D, %) 28.0 41.0** 14.0Farm injury history (mean number of events) 1.0 1.5** 0.5Total number and variety of non-farm vehicle public road uses (mean) 1.9 2.2** 1.5Farm vehicle age (i.e., years of age of oldest farm vehicle driven) 34.3 34.4 34.0Use of farm truck (D) 77.0 83.5** 70.2Use of large-size farm vehicles (D) 67.0 77.0** 56.2Driving exposure (i.e., number of hours driven farm equipment on public roads 13.6 16.0** 11.0Number of farm operations managed 3.1 3.8** 2.3
Gross farm incomeLow income (<$25K) (D, %) 28.3 11.0** 47.0High income ($100K or more) (D, %) 46.7 65.0** 27.0
Traffic density
N rash g
aTpf
ifcfhCfy
isldCis
TLs
V
AANNFTFUUDNLHLH
NVV
odaa
4
adtffcig
Low densityHigh density income
ote: X2 (d.f. = 1) or t-test (d.f. = 383) significant differences between crash and no-c
cteristics with farm vehicle public road crash group membership.he model was significant with a likelihood ratio of 175.95 (d.f. = 15;< .001;—2 log likelihood intercept only = 533.1;—2 log likelihood
ull model = 357.2).Odds ratio point estimates and Wald 95% confidence lim-
ts presented in Table 2 for the driver, vehicle, farm enterprise,arm operator, and public road environmental variables signifi-ant for increased crash group membership likelihood controllingor all other independent variables are: non-English speakingelp (OR = 3.71; CI = 1.95–7.03); non-family hired help (OR = 4.25;I = 2.37–7.63); farm injury history (OR = 1.33; CI = 1.11–1.60); non-
arm vehicle public road use (OR = 1.39; CI = 1.10–1.76); and,ounger farm vehicle drivers (OR = 1.02; CI = 1.00–1.04).
Odds ratio point estimates and Wald 95% confidence lim-ts for the one driver and one environmental variables thatignificantly decrease crash group membership likelihood control-
Please cite this article in press as: Costello, T.M., et al., Risk factorsdoi:10.1016/j.aap.2008.08.029
ing for all other independent variables are: older farm vehiclerivers (OR = 0.97; CI = 0.95–0.99); and low farm income (OR = 0.29;I = 0.14–0.59) compared with farms reporting medium farm
ncome. These results are net of the effects of the non-statisticallyignificant independent variables (hours driven on public roads;
able 2ogistic regression odds ratio point estimates and 95% Wald confidence limits (fortatistically significant independent variables) (n = 385)
ariable Odds ratio pointestimate
95% Waldconfidence limits
ge of youngest driver 1.02 1.00–1.04*
ge of oldest driver 0.97 0.95–0.99**
on-family hired help (D) 4.25 2.37–7.63**
on-english speaking help (D) 3.71 1.95–7.03**
arm injury history 1.33 1.11–1.60**
otal non-farm public road use 1.39 1.10–1.76**
arm vehicle age 1.01 0.99–1.03se of farm truck (D) 1.78 0.93–3.41+
se of large-size farm vehicles (D) 1.74 0.98–3.09+
riving exposure 1.012 0.99–1.03umber of farm operations managed 1.02 0.95–1.10ow farm income (D) 0.29 0.14–0.59**
igh farm income (D) 1.37 0.72–2.58ow traffic density 0.65 0.33–1.29igh traffic density 1.51 0.78–2.92
ote: +p < .10; *p < .05; **p < .001. D = dichotomous variable.ariables significant in the expected direction are underlined.ariables significant in a direction opposite to that expected are italicized.
tuppm
mdoedwTib
f2midt
4
l
19.7 13.0** 27.024.9 30.5** 18.9
roups *p < .05, **p < .001; D, %: dichotomous variable response percentage.
ldest farm vehicle; farm trucks; large size farm vehicles; trafficensity; total non-farm public road use; number of farming oper-tions) that function as controls for exposure, farm size and scale,nd traffic density.
. Discussion
The posited combination of driver, vehicle, farm enterprise,nd public road environmental characteristics significantly pre-icted farm vehicle public road crash group membership. Several ofhe expected relationships were supported. Farms reporting non-amily and non-English speaking farm vehicle drivers and youngerarm vehicle drivers were at increased farm vehicle public roadrash group membership risk. Farms reporting a history of farmnjury of any sort were also at increased risk for farm vehicle crashroup membership. This could reflect an overall behavioral adapta-ion towards farm safety that shapes the way that farm vehicles aresed on public roads. Not surprisingly, increased non-farm vehicleublic road use (i.e., a greater variety of non-farm vehicle drivingurposes) was associated with an increased risk for crash groupembership.Some variables were significantly associated with crash group
embership in ways that were not expected. Farms reporting olderrivers were less likely crash group members. Perhaps our measuref age did not capture the point at which the benefits of greaterxperience are outweighed by decreasing physical stamina, coor-ination, and so on. Finally, low farm income, a proxy for farm size,as associated with lower likelihood of crash group membership.
he relationship could not be due to smaller farms having less driv-ng exposure, since there was a very modest negative correlationetween low farm income and driving exposure (r = .14, p < .05).
Past farm vehicle public road crash preventive actions haveocused primarily on the driver and the farm vehicle (Costello et al.,003) rather than taking a combined driver, vehicle, and environ-ental approach. Future farm vehicle public road crash reduction
nterventions should consider a combined approach that addressesriver, vehicle, road conditions, and characteristics of the farm andhe farmer/farm help.
for a farm vehicle public road crash. Accid. Anal. Prev. (2008),
.1. Study limitations
Case–control studies of farm vehicle public road crashes areabor-intensive and present a number of challenges. Therefore, this

ING ModelA
ysis an
sttb
4
ocwcsotrmctesricha
4
mdtvcd“tsdfueo
vuo(bmfretta
4
efrtrst
udiv
4
c
rosabsbttaiaNaNhCtddtrfft
c(b“geobssboo
i
4
tcwiv
ARTICLEAP-1760; No. of Pages 6
T.M. Costello et al. / Accident Anal
tudy had a number of limitations, in particular, ones pertainingo: recall accuracy and measurement time periods; survey ques-ion design and measurement; the level of analysis; and, samplingias. Each limitation is addressed below.
.1.1. Measurement time periodsCrash cases were considered eligible for the study if they
ccurred from 1992 to 2003. Since the occurrence of farm vehi-le public road crashes is such a rare event, a longer time periodas chosen in order to capture a sufficient number of cases. We
hose not to ask respondents to describe the characteristics of apecific crash (e.g., driver characteristics, traffic patterns) becausef concern about the accuracy of recall of details of a crash inhe distant past. For this reason, questions were asked about cur-ent conditions, with the assumption that these would, for theost part, be indicative of prior conditions. If these conditions
hanged since the crash, the actual relationships between predic-or variables and case–control status would be obscured. To thextent that conditions changed as a result of a crash (e.g., increasedafety practices from pre-crash to post-crash), this could very welleduce differences between the control and crash conditions. Theres no indication that such differences occurred. However, futurease–control studies of this type might ask respondents what theyad done differently (if anything) in response to the occurrence ofcrash.
.1.2. Survey design and measurementThere are several potential weaknesses with regard to choices
ade in the design of this study. First, the respondent was asked toescribe characteristics of the farm and/or farm environment (e.g.,raffic density, farm income, and so on). There was no independenterification of the respondent’s responses. Second, given the diffi-ulty of doing a comprehensive assessment of the experiences of allrivers on a farm in a brief phone interview, we chose to select anindex” person or item for particular questions. To assess the degreeo which there was a history of farm injury (i.e., a proxy for farmafety), we asked about the experiences of the interview respon-ent himself/herself. To assess the age (and presumed safety) of
arm equipment, we asked the age of the oldest farm vehicle beingsed. This obviously creates measurement problems if the experi-nces of the index respondent are not generally representative ofthers working on the farm.
There are some other potential weaknesses with regard to thealidity of the instruments used in this study. A number of variablessed in this study were measured using single item closed andpen-ended questions. In addition, retrospective recall of eventssuch as number of hours driving a farm vehicle) may be suscepti-le to error. There are certainly methodologies from other areas thatight increase the validity of retrospective recall (e.g., the time-line
ollow-back technique that has been used to increase the validity ofecall of frequency of alcohol use) (Sobell and Sobell, 1992). How-ver, such approaches are time intensive and difficult to use in briefelephone surveys where soliciting participation is a challenge. Fur-her research in the validation of measures in the farm vehicle crashrea would be helpful.
.1.3. Level of analysisThe thrust of this study was to examine how driver, vehicle, farm
nterprise, and public road environmental characteristics at thearm level related to crash group status. The assumption was that
Please cite this article in press as: Costello, T.M., et al., Risk factorsdoi:10.1016/j.aap.2008.08.029
espondents’ responses serve as an approximate measure of charac-eristics of the farm enterprise. (For example, the owner/operator’seport of his/her injury history was taken as a proxy for attention toafety issues by the farm enterprise). To the extent that the opera-or or owner/operator’s responses were atypical of the farm overall,
wwdaE
PRESSd Prevention xxx (2008) xxx–xxx 5
se of these measures would obscure actual relationships. Indepen-ent measurement of farm-level characteristics (e.g., rates of farm
njury) are difficult to obtain, but would increase confidence in thealidity of results.
.1.4. Sampling biasTwo possible limitations of the study involve potential bias in
onstruction of the sample and in the self-election of respondents.First, a USDA agricultural program database for North Carolina
esident farm land owners and farm operators (owners and rentersf farm land) was used to generate the sampling frame for thistudy. Eligibility criteria ruled out farm land owners who were notctively farming, resulting in a large number of ineligible num-ers. Farm operators not participating in a USDA program (i.e., verymall scale “hobby” farms) are not necessarily listed in this dataase. Comparison of the study sample demographic profile withhe North Carolina agricultural census profile in Table 1 indicatedhat the study sample had fewer small size farms, higher mean farmcreage, and reported lower mean gross farm income. These find-ngs suggest a potential sampling bias, and thus, raise questionsbout the generalizability of the study to the total population oforth Carolina farmers. A comparison of farm vehicle driver agend percentage of crashes by month for this study with those oforth Carolina crash report data (Hughes and Rodgman, 2000),owever, suggests that the study sample is comparable to Northarolina farmers reporting a vehicle public road crash. Therefore,hese findings suggest that although the USDA agricultural programatabase may have provided a biased sampling frame, crash caseata comparisons suggest the study sample is reasonably represen-ative of North Carolina farmers who drive farm vehicles on publicoads and are involved in a crash. In other words, very small-scalearms that may not be participating in a USDA program, and there-ore not part of the USDA database, are also the farms that tend noto drive farm vehicles on public roads.
Second, as discussed earlier, approximately 22 percent ofalls were placed to numbers that were either out of servicen = 1807), no longer where a farmer lived (n = 683), or could note contacted (n = 807). It is undetermined how many of theseunscreened” phone numbers actually represent non-identified eli-ible participants. It is also unclear to what extent non-identifiedligible participants might be different from those farm owners orwner/operators who were successfully screened. Thus, there maye bias in the individuals successfully screened in this study. Futuretudies might devote increased resources to following more inten-ively a small subsample of non-responders to check for samplingias. Investigators might also examine whether degree of difficultyf recruitment in their own sample is related to important predictorr dependent variables.
In spite of these limitations, significant relationships were foundn expected directions, suggesting the robustness of these findings.
.2. Implications for future interventions
Driver age, farm help status, non-family hired help, and his-ory of farm injury were associated with farm vehicle public roadrash group membership. Intervention research should determinehether farm vehicle driver licensing, training, testing and mon-
toring programs would be effective methods for reducing farmehicle public road crash risk. Readers should note that farms
for a farm vehicle public road crash. Accid. Anal. Prev. (2008),
ho used non-family hired help and non-English speaking helpere more likely to be in the crash group, but the study did notetermine the identify of the driver of the crash (i.e., whether thectual crash-involved driver was non-family hired help and/or non-nglish speaking help).

ING ModelA
6 ysis an
Owmuaimi
4
2rca
cpImb
ocagtrc
A
5trTtDBJ
R
A
B
B
B
C
C
D
G
G
G
H
K
L
L
L
L
M
M
M
N
N
N
N
O
P
S
Sreported ethanol consumption. In: Allen, J., Litten, R.Z. (Eds.), Measuring AlcoholConsumption: Psychosocial and Biological Methods. Humana Press, Totowa, NJ,
ARTICLEAP-1760; No. of Pages 6
T.M. Costello et al. / Accident Anal
The public road environment is changing in North Carolina.nce quiet roads used by farm vehicles are now being sharedith an increasing number and variety of non-farm vehicles. Peakorning and afternoon times are key time periods for public road
se and thus ripe for public road competition and conflict. Whensked, farmers suggested such things as slow moving vehicle lanes,mproved signage, driver training, and better speed limit enforce-
ent as possible interventions. Traffic pattern and time usagenformation would be helpful.
.3. Conclusion
Public road crashes are complex social phenomena (Batten,000). A combination of driver, vehicle, farm enterprise, and publicoad environmental characteristics were associated with farm vehi-le public road crash group membership, providing important cluesbout risk factors that warrant attention and possible intervention.
The increase in urban growth in North Carolina is expected toontinue. Urban and agricultural traffic often compete for the sameublic road resources at the same key time periods during the day.
n addition, farm vehicles are often large and slow moving. Com-uters and faster moving vehicles may become frustrated driving
ehind farm vehicles and attempt unsafe passing maneuversIn summary, the data from this study suggest a combination
f driver, vehicle, public road, and farm enterprise characteristicsontribute to increased farm vehicle public road crash risk. Thus,multifaceted approach to farm vehicle public road safety that
oes beyond the farmer and farm vehicle is warranted. Agricul-ure remains an important industry in North Carolina, so furtheresearch and intervention examining how farmers and non-farmersan safely share public roads is warranted.
cknowledgments
Support for this research came from NIOSH grantU500H07551-04 to the Southern Coastal Agromedicine Cen-er and North Carolina State University. Additional support waseceived from the North Carolina Agricultural Research Service.he opinions expressed are those of the authors who would like tohank the following individuals for their guidance and input: Dr.’saniel Bauer, Hank Cole, Ronald Czaja, David Dickey, Ron Huges,ill Hunter, Paul Leigh, and Michael Wogalter; Regina Luginbuhl;
oy Smith; and, the North Carolina agricultural community.
eferences
merican Trucking Associations, 2000. Sharing the road with farm equip-ment. SafetyNet (Online). Available at: www.truckline.com/safetynet/highway/sharing farm equipment.htm.
atten, D.F., 2000. Safety and collective behavior on congested traffic networks. In:von Holst, H., Nygren, A., Andersson, A.E. (Eds.), Transportation, Traffic Safety
Please cite this article in press as: Costello, T.M., et al., Risk factorsdoi:10.1016/j.aap.2008.08.029
and Health: Man and Machine. Springer-Verlag, Berlin, Germany.ernstein, P.L, 1996. Against the Gods: The Remarkable Story of Risk. John Wiley &
Sons, Inc., Hoboken, NJ.rowning, S.R., Truszczynaska, H., Reed, D., McKnight, R.H., 1998. Agricultural
injuries among older Kentucky farmers: the farm family health and hazardsurveillance study. American Journal of Industrial Medicine 33, 341–353.
U
PRESSd Prevention xxx (2008) xxx–xxx
ostello, T., Schulman, M., Luginbuhl, R., 2003. Understanding the public healthimpacts of farm vehicle public road crashes in North Carolina. Journal of Agri-cultural Safety and Health 9 (1), 19–32.
ostello, T., Wogalter, M., 2003. Driver attitudes, beliefs and reported behavior asso-ciated with sharing public roads with farm vehicles. In: Proceedings of the HFES47th Annual Meeting.
oss, H.J., Pfister, R.G., 1972. Nature and Extent of Farm Machinery Use in Rela-tion to Frequency of Accidents in Michigan and Ohio. Michigan State University,Agricultural Engineering Department, East Lansing, Mich.
erberich, S., Robertson, L., Gibson, R., Reiner, C., 1996. An epidemiological studyof roadway fatalities related to farm vehicles: United States. Journal of Occupa-tional and Environmental Medicine 38 (11), 1135–1140.
lascock, L.A., Bean, T.L., Woo, R.K., Carpenter, T.G., Holmes, R.G., 1995. A summaryof roadway accidents involving agricultural machinery. Journal of AgriculturalSafety and Health 1 (2), 93–104.
rieshop, J., Stiles, M., Villanueva, N., 1996. Prevention and resiliency: a cross culturalview of farmworkers’ and farmers’ beliefs about work safety. Human Organiza-tion 55 (1), 25–32.
ughes, R., Rodgman, E., 2000. Crashes involving farm tractors and other farmvehicles/equipment in North Carolina, 1995–1999. Prepared for North CarolinaDivision of Motor Vehicles (NCDMV), Commercial Motor Vehicle EnforcementSection. University of North Carolina, Highway Safety Research Center, ChapelHill, NC.
ita, H., 2000. Design of driving environment, driving behavior, and traffic safety. In:von Holst, H., Nygren, A., Andersson, A.E. (Eds.), Transportation, Traffic Safety andHealth: Human Behavior. Springer-Verlag, Berlin, Germany.
aughery, K.R., Hammond, A., 1999. Overview. In: Wogalter, M.S., DeJoy, D.M.,Laughery, K.R. (Eds.), Warnings and Risk Communication. Taylor & Francis, Inc.,Philadelphia, PA.
ayde, P.M., Nordstrom, D.L., Stueland, D., Brand, L., Olson, K.A., 1995. Machine-related occupational injuries in farm residents. Annual of Epidemiology 5,419–426.
ayde, P.M., Stueland, D., Nordstrom, D.L., Olson, K.A., Follen, M.A., Brand, L., Konitzer,K., Herr, J., Leick, I., Lezotte, C., 1993. Identifying Preventable Risk Factors for FarmInjuries. Centers for Disease Control and Prevention, Atlanta, GA.
uginbuhl, R.C., Jones, V.C., Langley, R.L., 2003. Farmer’s perceptions and concerns:the risks of driving farm vehicles on rural roadways in North Carolina. Journalof Agricultural Safety and Health 9 (4), 327–348.
ason, G., 2003. Telephone Conversation Regarding Farm Vehicle Speed and PublicRoad Use. The Tractor Place, Inc., Knightdale, NC.
cCurdy, S.A., Carroll, D.J., 2000. Agricultural injury. American Journal of IndustrialMedicine 38, 463–480.
urphy, D.J., 2003. Chapter 1: Reasons and motivations for conducting this review.In: Looking Beneath the Surface of Agricultural Safety and Health. AmericanSociety of Agricultural Engineers, St. Joseph, MI.
CDOL, 1999. Fifth annual gold star luncheons: fixing grower’s sights on rural high-way safety. The Cultivator 15 (May), 1–2.
COSPL, 1997. Population Growth 1980–1990. Office of State Planning, Raleigh, NC.Available at: www.ospl.state.nc.us/demog/estgr0.htm.
COSPL, 2000. Population growth 1990–1999. Office of State Planning, Raleigh, NC.Available at: www.ospl.state.nc.us/demog/c99estp.htm.
orris, F., Matthews, B.A., Riad, J.K., 2000. Characterological, situational, and behav-ior risk factors for motor vehicle accidents: a prospective examination. AccidentAnalysis and Prevention 32, 505–515.
gden, K.W., 1997. The effects of paved shoulders on accidents on rural highways.Accident Analysis and Prevention 29 (3), 353–362.
ickett, W., Chipman, M.L., Brison, R.J., Holness, D.L., 1996. Medications asrisk factors for farm injury. Accident Analysis and Prevention 28 (4), 453–462.
atterthwaite, S.P., 1981. A survey of research into relationships between traffic acci-dents and traffic volumes. Supplementary Report SR 692, p. 43. Transport andRoad Research Laboratory, Crowthorne, UK.
obell, L.C., Sobell, M.B., 1992. Timeline followback: a technique for assessing self-
for a farm vehicle public road crash. Accid. Anal. Prev. (2008),
pp. 41–72.SDA, 1999. Historical highlights: 1997 and earlier census years. In: 1997 Census
of Agriculture, North Carolina. USDA National Agricultural Statistics Service,Washington, DC.