Benthic remineralization in the northwest European continental margin (northern Bay of Biscay
16
This article appeared in a journal published by Elsevier. The attached copy is furnished to the author for internal non-commercial research and education use, including for instruction at the authors institution and sharing with colleagues. Other uses, including reproduction and distribution, or selling or licensing copies, or posting to personal, institutional or third party websites are prohibited. In most cases authors are permitted to post their version of the article (e.g. in Word or Tex form) to their personal website or institutional repository. Authors requiring further information regarding Elsevier’s archiving and manuscript policies are encouraged to visit: http://www.elsevier.com/copyright
Transcript of Benthic remineralization in the northwest European continental margin (northern Bay of Biscay
This article appeared in a journal published by Elsevier. The attachedcopy is furnished to the author for internal non-commercial researchand education use, including for instruction at the authors institution
and sharing with colleagues.
Other uses, including reproduction and distribution, or selling orlicensing copies, or posting to personal, institutional or third party
websites are prohibited.
In most cases authors are permitted to post their version of thearticle (e.g. in Word or Tex form) to their personal website orinstitutional repository. Authors requiring further information
regarding Elsevier’s archiving and manuscript policies areencouraged to visit:
http://www.elsevier.com/copyright
Author's personal copy
Research papers
Benthic remineralization in the northwest European continental margin(northern Bay of Biscay)
K. Suykens a, S. Schmidt b, B. Delille a, J. Harlay a,c, L. Chou c, C. De Bodt c, N. Fagel d, A.V. Borges a,n
a Unite d’Oceanographie Chimique, Universite de Li�ege, Belgiumb Environnements et Paleoenvironnements Oceaniques, CNRS—Universite Bordeaux 1, Francec Laboratoire d’Oceanographie Chimique et Geochimie des Eaux, Universite Libre de Bruxelles, Belgiumd Laboratoire des Argiles, Geochimie et Environnement Sedimentaires, Universite de Li�ege, Belgium
a r t i c l e i n f o
Article history:
Received 3 February 2010
Received in revised form
23 November 2010
Accepted 24 December 2010Available online 20 January 2011
Keywords:
Continental shelf
Benthic organic carbon degradation
CaCO3 dissolution
Benthic silica fluxes
Benthic NO3 fluxes
a b s t r a c t
We report a dataset of sediment characteristics and biogeochemical fluxes at the water–sediment
interface at the northwest European continental margin (northern Bay of Biscay). Cores were obtained
in June 2006, May 2007 and 2008, at 18 stations on the shelf break (120–180 m), and at 2 stations on
the continental slope (520 and 680 m). Water–sediment fluxes of dissolved oxygen (O2), total alkalinity
(TA), nitrate (NO�3 ), and dissolved silicate (DSi) were measured at a total of 20 stations. Sediment
characteristics include: grain size, chlorophyll-a (Chl-a) and phaeopigment (Phaeo) content, particulate
organic (POC) and inorganic (PIC) carbon content, and lead-210 (210Pb) and thorium-234 (234Th)
activities. Sediments were sandy (fine to coarse) with organic matter (OM) (1.0–4.0%) and Chl-a (0.01–
0.95 mg g�1) contents comparable to previous investigations in the same region, and a relatively high
PIC fraction (0.8–10.2%). Water–sediment O2 fluxes (�2.4 to �8.4 mmol O2 m�2 d�1) were low
compared to other coastal environments and correlated well with OM and Chl-a content. 234Th activity
profiles indicated that Chl-a sediment content was mainly controlled by physical mixing processes
related to local hydrodynamics. The correlation between water–sediment fluxes of O2 and NO�3indicated a close coupling of nitrification/denitrification and total benthic organic carbon degradation.
Dissolution of biogenic silica (0.05–0.95 mmol m�2 d�1) seemed uncoupled from organic carbon
degradation, as characterized by water–sediment O2 fluxes. The link between water–sediment fluxes
of TA and O2 indicated the occurrence of metabolic driven dissolution of calcium carbonates (CaCO3) in
the sediments (�0.3370.47 mmol m�2 d�1), which represented �1% of the pelagic calcification rates
due to coccolithophores measured during the cruises. These CaCO3 dissolution rates were below those
reported in sediments of continental slopes and of the deep ocean, probably due to the high over-
saturation with respect to CaCO3 of the water column overlying the continental shelf sediments of the
northern Bay of Biscay. Rates of total benthic organic carbon degradation were low compared to water
column rates of primary production and aphotic community respiration obtained during the cruises.
& 2011 Elsevier Ltd. All rights reserved.
1. Introduction
Understanding the controls on carbon (C) remineralization andburial in continental margin sediments is relevant for the descrip-tion of the global C cycle. While continental margins onlyrepresent �20% of the total seafloor, they contain �50–60% ofthe total sediment volume (Burdige, 2006). In addition, shallowcarbonates deposited in reefs, banks, bays and shelves account for33% of the oceanic calcium carbonate (CaCO3) production andabout 38% of oceanic CaCO3 accumulation (Milliman, 1993).
Carbon is drawn down from the surface ocean by the reductionof dissolved inorganic carbon (DIC) to particulate organic carbon
(POC) through photosynthesis, and by the precipitation of CaCO3
by pelagic calcifiers and reef-building organisms. Much of theorganic carbon (OC) is rapidly converted back to carbon dioxide(CO2) in the water column as a result of heterotrophic oxidation.Only a small proportion of OC reaches the sea floor, and is buriedand preserved. The burial of OC in marine sediments representsthe major link between ‘‘active’’ surface pools of C in the oceans,in the atmosphere, on land, and in marine sediments, and C poolsthat cycle on much longer, geological time scales, i.e., C insedimentary rocks, and petroleum deposits (Burdige, 2006).
In aphotic sediments, the C added to the water–sedimentinterface in the form of organic matter (OM) can be approximatedby the Redfield stoichiometry (CH2O)106(NH3)16H3PO4 (Redfieldet al., 1963) and is largely remineralized by bacterial metabolism.The timing, amount and freshness of the OM delivered to thesediments have important consequences for the structure of
Contents lists available at ScienceDirect
journal homepage: www.elsevier.com/locate/csr
Continental Shelf Research
0278-4343/$ - see front matter & 2011 Elsevier Ltd. All rights reserved.
doi:10.1016/j.csr.2010.12.017
n Corresponding author. Tel.: +32 4 3663187.
E-mail address: [email protected] (A.V. Borges).
Continental Shelf Research 31 (2011) 644–658
Author's personal copy
benthic communities (e.g., Heip et al., 2001) and the geochemistryof the sediment (e.g., Berner, 1980). This, in turn, affects thetiming and magnitude of sedimentary nutrient fluxes and oxygen(O2) demand (e.g., Soetaert et al., 1996). The occurrence of specificrespiratory processes is controlled by the free energy yield permole of OC oxidized by each of the electron acceptors (Froelichet al., 1979). Oxidation of OM by O2 (Eq. (1)) is the most efficientrespiratory process in terms of energy acquired per mole of Coxidized. The microbially mediated oxidation of OM by O2, whichtakes place in the uppermost layer of the sediments, alsopromotes the dissolution of CaCO3 (Froelich et al., 1979; Caiet al., 1995; Jahnke et al., 1997; Jahnke and Jahnke, 2000)
CH2O+O2-CO2+H2O (1)
CaCO3+CO2+H2O-Ca2 + +2HCO3� (2)
In addition, suboxic and anoxic remineralization are importantprocesses at continental margins (Burdige, 2006). The oxidation ofOM by nitrate (NO�3 , denitrification) produces protons and alsopromotes the dissolution of CaCO3. In contrast, the oxidation ofMn2 + , Fe2 + and SO2�
4 reduces protons (and hence produces totalalkalinity (TA)) and may induce the precipitation of CaCO3
(Boudreau et al., 1992).In mixed oxic and anoxic sediments, aerobic respiration and
denitrification are the most efficient redox reactions to degradeOM. Due to bioturbation, bioirrigation and molecular diffusion,internal redox cycling reactions couple aerobic chemolithotrophicreactions with aerobic respiration, such that there is no net loss ofreduced intermediates during the redox cycling. Hence, O2
appears to be the main oxidant of OM, and O2 fluxes provide areasonable good estimate of the overall rate of sediment OMoxidation, even though aerobic respiration is a variable fraction ofthe total diagenetic C degradation (Burdige, 2006).
Sandy sediments cover about 70% of continental shelves and areoften thought to be poor in OM and other reactive substances(Boudreau et al., 2001). However, water flow through sands convertsthese sediments into effective filter systems (Boudreau et al., 2001)transporting suspended particles, algae and bacteria into the sedi-ments. The studies by Boudreau et al. (2001) and Rusch et al. (2006)show that, in most sandy shelf sediments, OM has a higher averagedegradability than in most finer-grained sediments, since the freshlyproduced OC in sands is not diluted by accumulating aged material.
The objective of this study is to evaluate diagenetic OMdegradation and CaCO3 dissolution in sediments. We sampledsurface sediments, at depths between 124 and 680 m, during threecruises in June 2006, May 2007 and 2008 along the shelf break ofthe northwest European continental margin (northern Bay ofBiscay). We present a dataset of sediment characteristics (grainsize, chlorophyll-a (Chl-a) and phaeopigment (Phaeo) contents,POC and PIC content, and lead-210 (210Pb) and thorium-234 (234Th)activities) and of biogeochemical water–sediment fluxes (O2, TA,NO�3 , and dissolved silicate (DSi)). Such a combination of sedimentcharacteristics and of fluxes at the water–sediment interfacecontributes to estimate a C budget of sandy sediments of thenorthern Bay of Biscay in late-spring early-summer.
2. Materials and methods
2.1. Site description
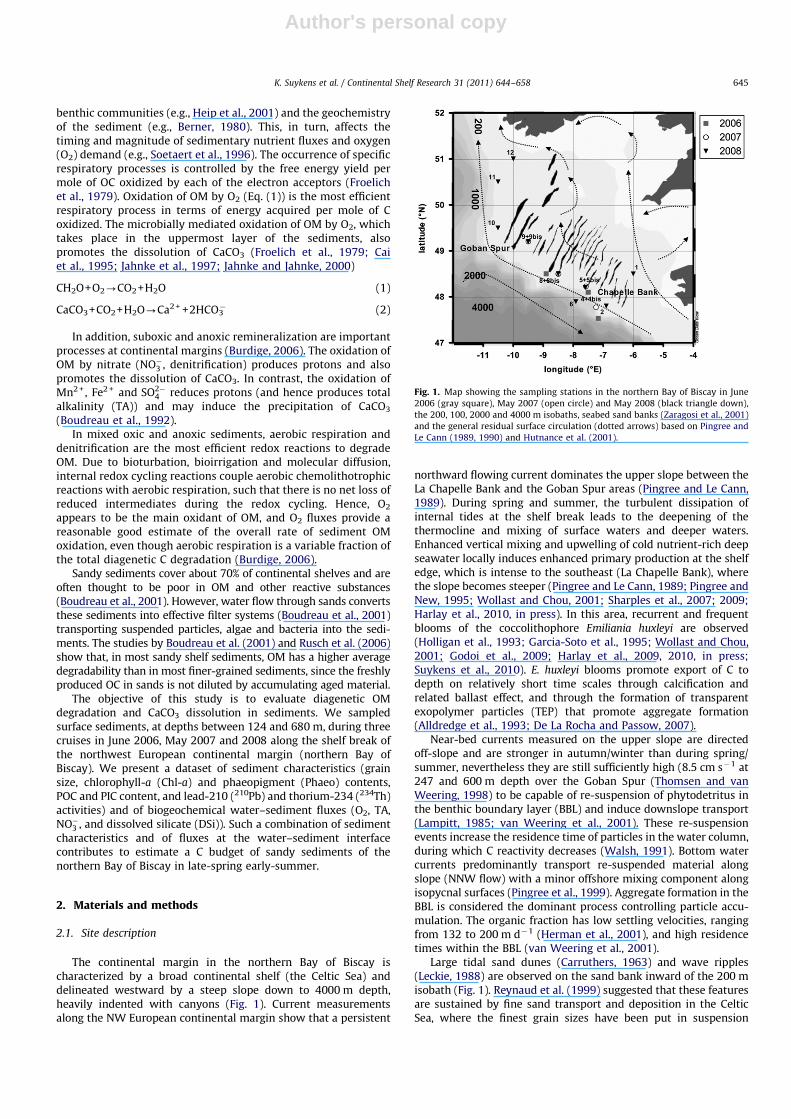
The continental margin in the northern Bay of Biscay ischaracterized by a broad continental shelf (the Celtic Sea) anddelineated westward by a steep slope down to 4000 m depth,heavily indented with canyons (Fig. 1). Current measurementsalong the NW European continental margin show that a persistent
northward flowing current dominates the upper slope between theLa Chapelle Bank and the Goban Spur areas (Pingree and Le Cann,1989). During spring and summer, the turbulent dissipation ofinternal tides at the shelf break leads to the deepening of thethermocline and mixing of surface waters and deeper waters.Enhanced vertical mixing and upwelling of cold nutrient-rich deepseawater locally induces enhanced primary production at the shelfedge, which is intense to the southeast (La Chapelle Bank), wherethe slope becomes steeper (Pingree and Le Cann, 1989; Pingree andNew, 1995; Wollast and Chou, 2001; Sharples et al., 2007; 2009;Harlay et al., 2010, in press). In this area, recurrent and frequentblooms of the coccolithophore Emiliania huxleyi are observed(Holligan et al., 1993; Garcia-Soto et al., 1995; Wollast and Chou,2001; Godoi et al., 2009; Harlay et al., 2009, 2010, in press;Suykens et al., 2010). E. huxleyi blooms promote export of C todepth on relatively short time scales through calcification andrelated ballast effect, and through the formation of transparentexopolymer particles (TEP) that promote aggregate formation(Alldredge et al., 1993; De La Rocha and Passow, 2007).
Near-bed currents measured on the upper slope are directedoff-slope and are stronger in autumn/winter than during spring/summer, nevertheless they are still sufficiently high (8.5 cm s�1 at247 and 600 m depth over the Goban Spur (Thomsen and vanWeering, 1998) to be capable of re-suspension of phytodetritus inthe benthic boundary layer (BBL) and induce downslope transport(Lampitt, 1985; van Weering et al., 2001). These re-suspensionevents increase the residence time of particles in the water column,during which C reactivity decreases (Walsh, 1991). Bottom watercurrents predominantly transport re-suspended material alongslope (NNW flow) with a minor offshore mixing component alongisopycnal surfaces (Pingree et al., 1999). Aggregate formation in theBBL is considered the dominant process controlling particle accu-mulation. The organic fraction has low settling velocities, rangingfrom 132 to 200 m d�1 (Herman et al., 2001), and high residencetimes within the BBL (van Weering et al., 2001).
Large tidal sand dunes (Carruthers, 1963) and wave ripples(Leckie, 1988) are observed on the sand bank inward of the 200 misobath (Fig. 1). Reynaud et al. (1999) suggested that these featuresare sustained by fine sand transport and deposition in the CelticSea, where the finest grain sizes have been put in suspension
Fig. 1. Map showing the sampling stations in the northern Bay of Biscay in June
2006 (gray square), May 2007 (open circle) and May 2008 (black triangle down),
the 200, 100, 2000 and 4000 m isobaths, seabed sand banks (Zaragosi et al., 2001)
and the general residual surface circulation (dotted arrows) based on Pingree and
Le Cann (1989, 1990) and Hutnance et al. (2001).
K. Suykens et al. / Continental Shelf Research 31 (2011) 644–658 645
Author's personal copy
during reworking events under the combined effect of waves andtidal currents, and have partly settled down during motionlessstages during neap tides and fair weather. This explains the co-existence of coarse-grained wave ripples and fine-grained sandpatches in the upper bank area (Channon and Hamilton, 1976).
2.2. Cruises
Three cruises were carried out in the northern Bay of Biscayfrom 31/05/2006 to 09/06/2006 (BG06/11 cruise), 10/05/2007 to24/05/2007 (BG07/12 cruise), and 07/05/2008 to 23/05/2008(BG08/12 cruise). Due to shorter ship-time, sampling during theJune 2006 cruise was limited to the area around the La ChapelleBank, while during the other two cruises sampling was alsocarried out further north along the continental margin (Fig. 1).Sampling was mainly concentrated on the continental shelf edge;only 2 stations (stations 2 (2006) and 6 (2008)) were carried outon the continental slope (Table 1).
2.3. Water column sampling
Sampling of bottom water was carried out with a rosette of 12Niskin bottles (12 L) coupled to a Conductivity–Temperature–Depth probe (Seabird SBE21). Water column TA, Chl-a, Phaeo andO2 measurements were carried out as described below. pH wasmeasured with a combined electrode (METROHM 6.0232.100)calibrated on the total hydrogen ion concentration scale usingTRIS (2-amino-2-hydroxymethyl-1,3-propanediol) and AMP (2-aminopyridine) buffers prepared at a salinity of 35 accordingto Dickson (1993). The saturation state of calcite (OCAL) wascomputed from pH and TA using the carbonic acid dissociationconstants of Mehrbach et al. (1973) as refitted by Dickson andMillero (1987), the calcite solubility of Mucci (1983), and the Ca2 +
concentration calculated from salinity using the ratio givenby Riley and Tongudai (1967), following the recommendationsof Lewis and Wallace (1998) and Dickson et al. (2007). Nitrate+nitrite (NOX) concentrations were determined colorimetricallywith a Technicon Autoanalyzer system, on 20 mL samples, usingthe method described by Grasshoff et al. (1983). DSi was deter-mined on 20 mL samples using the colorimetric method describedby Grasshoff et al. (1983) on a Skalar automatic analyzer.
Suspended particulate matter (SPM) concentration was deter-mined on 2 L samples filtered onto a pre-weight Nucleporemembrane (0.4 mm, +¼47 mm) and then rinsed 3 times withan isotonic solution to remove the salt. The filter was placed in aPetri dish and kept at �20 1C until analysis. Prior to the analysis,filters were dried at 50 1C overnight and kept at room tempera-ture in a desiccator. The weight of particles retained on themembrane was determined by subtracting the weight of the filterbefore and after filtration. For the particulate C analysis, 250 mLof seawater was filtered in duplicate on pre-combusted (4 h,500 1C) 25 mm GF/F filters. Filters retaining the particulate matterwere stored at �20 1C until elemental analysis with a FisonsNA-1500. Within three months of the cruise, filters were driedovernight at 50 1C. Total particulate carbon (TPC) content wasmeasured on the filters by elemental analysis. For the determina-tion of POC, CaCO3 particles were first removed by overnightexposure to strong acid fumes and then analyzed for the Ccontent. PIC was determined by subtracting POC from TPC.Calibration of the analyzer was performed using certified refer-ence stream sediment (STSD-2) from the Geological Survey ofCanada. Samples for Chl-a determination were obtained byfiltering 250 mL of seawater on 47 mm GF/F filters and werestored at �20 1C until analysis by fluorimetry. T
ab
le1
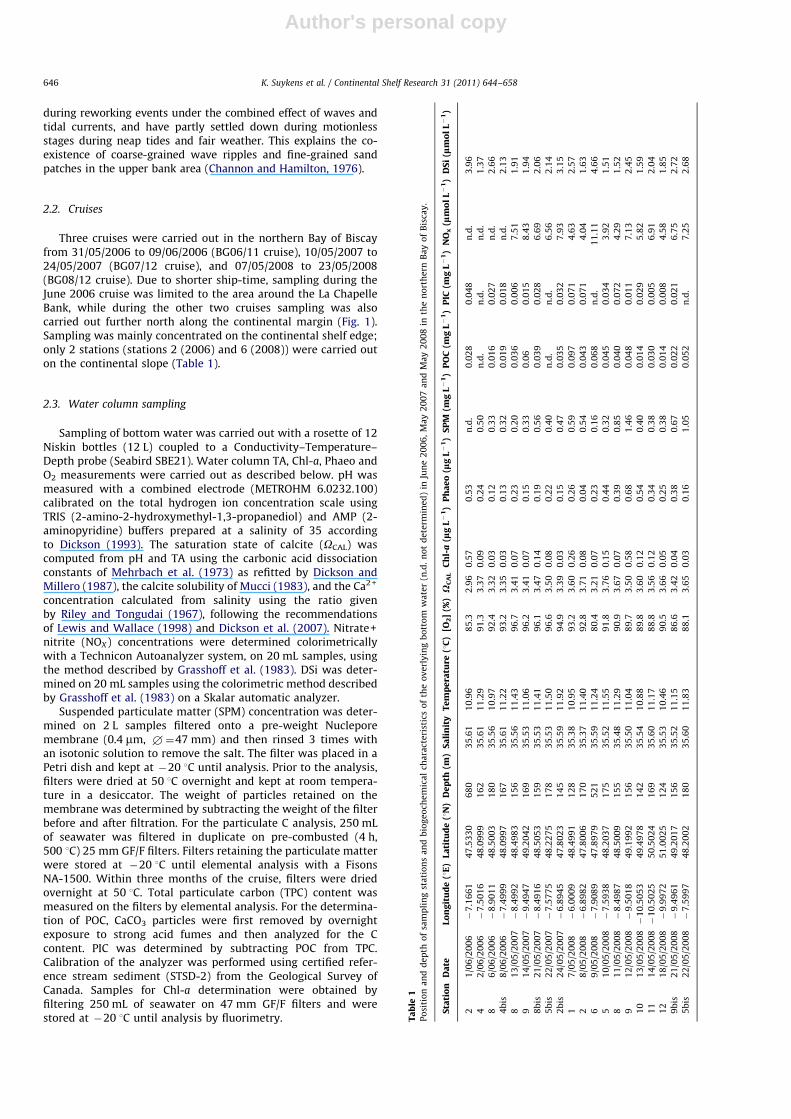
Po
siti
on
an
dd
ep
tho
fsa
mp
lin
gst
ati
on
sa
nd
bio
ge
och
em
ica
lch
ara
cte
rist
ics
of
the
ov
erl
yin
gb
ott
om
wa
ter
(n.d
.n
ot
de
term
ine
d)
inJu
ne
20
06
,M
ay
20
07
an
dM
ay
20
08
inth
en
ort
he
rnB
ay
of
Bis
cay
.
Sta
tio
nD
ate
Lo
ng
itu
de
(1E
)L
ati
tud
e(1
N)
De
pth
(m)
Sa
lin
ity
Te
mp
era
ture
(1C
)[O
2]
(%)
XC
AL
Ch
l-a
(lg
L�
1)
Ph
ae
o(l
gL�
1)
SP
M(m
gL�
1)
PO
C(m
gL�
1)
PIC
(mg
L�
1)
NO
x(l
mo
lL�
1)
DS
i(l
mo
lL�
1)
21
/06
/20
06
�7
.16
61
47
.53
30
68
03
5.6
11
0.9
68
5.3
2.9
60
.57
0.5
3n
.d.
0.0
28
0.0
48
n.d
.3
.96
42
/06
/20
06
�7
.50
16
48
.09
99
16
23
5.6
11
1.2
99
1.3
3.3
70
.09
0.2
40
.50
n.d
.n
.d.
n.d
.1
.37
86
/06
/20
06
�8
.90
11
48
.50
03
18
03
5.5
61
0.9
79
2.4
3.3
20
.03
0.1
20
.33
0.0
16
0.0
27
n.d
.2
.66
4b
is8
/06
/20
06
�7
.49
99
48
.09
97
16
73
5.6
11
1.2
29
3.2
3.3
50
.03
0.1
30
.32
0.0
19
0.0
18
n.d
.2
.13
81
3/0
5/2
00
7�
8.4
99
24
8.4
98
31
56
35
.56
11
.43
96
.73
.41
0.0
70
.23
0.2
00
.03
60
.00
67
.51
1.9
1
91
4/0
5/2
00
7�
9.4
94
74
9.2
04
21
69
35
.53
11
.06
96
.23
.41
0.0
70
.15
0.3
30
.06
0.0
15
8.4
31
.94
8b
is2
1/0
5/2
00
7�
8.4
91
64
8.5
05
31
59
35
.53
11
.41
96
.13
.47
0.1
40
.19
0.5
60
.03
90
.02
86
.69
2.0
6
5b
is2
2/0
5/2
00
7�
7.5
77
54
8.2
27
51
78
35
.53
11
.50
96
.63
.50
0.0
80
.22
0.4
0n
.d.
n.d
.6
.56
2.1
4
2b
is2
4/0
5/2
00
7�
6.8
94
54
7.8
02
31
45
35
.59
11
.92
94
.93
.39
0.0
30
.15
0.4
70
.03
50
.03
27
.93
3.1
5
17
/05
/20
08
�6
.00
09
48
.49
91
12
83
5.3
81
0.9
59
3.2
3.6
00
.26
0.2
60
.59
0.0
97
0.0
71
4.6
32
.57
28
/05
/20
08
�6
.89
82
47
.80
06
17
03
5.3
71
1.4
09
2.8
3.7
10
.08
0.0
40
.54
0.0
43
0.0
71
4.0
41
.63
69
/05
/20
08
�7
.90
89
47
.89
79
52
13
5.5
91
1.2
48
0.4
3.2
10
.07
0.2
30
.16
0.0
68
n.d
.1
1.1
14
.66
51
0/0
5/2
00
8�
7.5
93
84
8.2
03
71
75
35
.52
11
.55
91
.83
.76
0.1
50
.44
0.3
20
.04
50
.03
43
.92
1.5
1
81
1/0
5/2
00
8�
8.4
98
74
8.5
00
91
55
35
.48
11
.29
90
.93
.67
0.0
70
.39
0.8
50
.04
00
.07
24
.29
1.5
2
91
2/0
5/2
00
8�
9.5
01
84
9.1
99
21
56
35
.50
11
.04
89
.73
.50
0.5
80
.68
1.4
60
.04
80
.01
17
.13
2.4
5
10
13
/05
/20
08�
10
.50
53
49
.49
78
14
23
5.5
41
0.8
88
9.8
3.6
00
.12
0.5
40
.40
0.0
14
0.0
29
5.8
21
.59
11
14
/05
/20
08�
10
.50
25
50
.50
24
16
93
5.6
01
1.1
78
8.8
3.5
60
.12
0.3
40
.38
0.0
30
0.0
05
6.9
12
.04
12
18
/05
/20
08�
9.9
97
25
1.0
02
51
24
35
.53
10
.46
90
.53
.66
0.0
50
.25
0.3
80
.01
40
.00
84
.58
1.8
5
9b
is2
1/0
5/2
00
8�
9.4
96
14
9.2
01
71
56
35
.52
11
.15
86
.63
.42
0.0
40
.38
0.6
70
.02
20
.02
16
.75
2.7
2
5b
is2
2/0
5/2
00
8�
7.5
99
74
8.2
00
21
80
35
.60
11
.83
88
.13
.65
0.0
30
.16
1.0
50
.05
2n
.d.
7.2
52
.68
K. Suykens et al. / Continental Shelf Research 31 (2011) 644–658646
Author's personal copy
2.4. Sediment core sampling and incubations
Twenty undisturbed sediment box cores were collected for on-board incubations during the 3 cruises at 20 stations on thecontinental shelf and the upper slope of the La Chapelle Bank andon the continental shelf of the Goban Spur (Fig. 1; Table 1). Somestations were visited each year. Four cores were sub-sampled in50 cm long Plexiglas tubes, with an internal diameter of 8 cm, fromeach box core, as soon as the box core was on deck. The average corelength was 14.5 cm, ranging between 8.0 and 20.0 cm. The overlyingwater was kept in the tube to avoid disturbance of the sedimentinterface. When necessary, bottom water, sampled with a Niskinbottle at the same station, was added to completely fill the tube.Average water volume inside the tubes was 1.670.3 dm3. A 5 cmTeflon-coated magnetic stirring bar was inserted into the tubes at�5 cm above the water–sediment interface to stir the incubatedwater, and a Polyvinyl chloride stopper was used to avoid gasexchange with the atmosphere. The cores were kept in the dark andthermostated at 11 1C, close to the temperature of bottom watersoverlying the sediments (Table 1). The overall procedure betweenthe arrival of the box core on deck and the start of the incubations(T0) lasted about 45 min. O2, TA, DSi and NO�3 were sampled withplastic syringes at T0 and at the end of the incubation (T1), andtransferred in glass or plastic containers. At either T0 or T1, the totalsampled volume for all analysis was �170 mL. T1 was sampled after24 h during the incubations in 2006. In 2007 and 2008, theincubation time was increased to 42 h, to increase the sensitivityof concentration differences of all quantities, by using a secondincubation set, allowing the incubation of two stations (8 cores intotal) in parallel. Samples for O2 were fixed immediately aftercollection and analyzed within 24 h; TA, NO�3 and DSi samples werefiltered through 0.2 mm polycarbonate membrane filters and storedat ambient temperature, �20 and 4 1C, respectively. At the end ofthe incubations, two cores were sampled for PIC, POC, Chl-a andPhaeo in the top 5 cm with an interval of 1 cm. Samples for POC andPIC were dried onboard and stored in 50 mL plastic containers, andsamples for Chl-a and Phaeo determination (�2 cm3 of sediment)were stored in glass containers at �20 1C. One core was used as awhole for the granulometric analysis and was kept at ambienttemperature in a closed bucket. During the 2007 and 2008 cruises,the fourth core was extruded for 234Th and 210Pb determination insediments taken at a resolution of 1 cm interval along the wholecore; the samples were stored at 4 1C. An aliquot of sediment wassub-sampled during the last three stations of the 2008 cruise at thewater–sediment interface with a plastic syringe for TEP determina-tion. The water–sediment fluxes of O2 (FO2), TA (FTA), DSi (FDSi) andNO�3 ðFNO�3 Þ were computed from the changes in concentrationbetween T0 and T1, and expressed per surface unit. A negative fluxcorresponds to an uptake of the solute by the sediments from theoverlying water, and a positive flux corresponds to a release of thesolute from the sediment to the overlying water.
To reduce the total sampled volume at T0 and T1, samples forO2, TA, DSi and NO�3 were not duplicated on each core, although ateach station incubations were performed on 4 cores to allow therepresentation of flux heterogeneity related to small scale spatialvariability. The precisions of analysis given hereafter are based onreplication of measurements in the water column samples basedon the same analytical techniques.
The dissolved O2 concentration was measured on 60 mL biolo-gical oxygen demand bottles with an automated Winkler titrationtechnique using a potentiometric endpoint determination, with anaverage precision of 70.6 mmol L�1. Reagents and standardizationswere similar to those described by Knap et al. (1996). Measurementsof TA were carried out by potentiometric titration with HCl 0.1 M on50 mL samples and endpoint determination according to Gran(1952) with an average precision of 74.0 mmol L�1, and data were
quality checked with certified reference material acquired fromAndrew Dickson (Scripps Institution of Oceanography, University ofCalifornia, San Diego). DSi concentrations were measured asdescribed above with an average precision 70.3 mmol L�1. Theanalysis of NO�3 was carried out as described above, with an averageprecision of 70.6 mmol L�1.
The concentrations of Chl-a and Phaeo were quantified fluor-imetrically following Yentsch and Menzel (1963) after extractionovernight at 4 1C in the dark in 90% acetone; after analysis, thesediments were dried and weighted. Granulometric analysis wasperformed by wet sieving over 2000, 500, 250, 125 and 63 mmsieves. After an initial drying of a sediment sample (approximately30 g) for 48 h at 60 1C, the percentage of OM was estimated by losson ignition (LOI) at 550 1C for 4 h (% OMLOI) (Dean, 1974; Heiriet al., 2001) with a precision from 70.01% to 70.20%. This methodignites all OM and is traditionally converted to % POC using aconversion factor ranging from 1.7 to 2.2 as reported in soilliterature (Sutherland, 1998). However a fixed conversion factoris not always appropriate because it changes with the nature of OMin the sediments (Howard and Howard, 1990; Sutherland, 1998;Santisteban et al., 2004) and with the grain size (Sutherland, 1998).The conversion factor was computed by comparing the % OMLOI tothe % POC analysis of the same samples by elemental analysis (%POCEA) with a Fisons NA-1500 on 50 mg samples as describedabove for water column POC measurements. As the % OMLOI:%POCEA ratios were not well correlated to median grain size(r2¼0.13, not shown), we were not able to deduce an appropriate
conversion factor. Therefore, we chose not to convert OM to POCcontent, and hereafter we use and discuss the % OMLOI data.
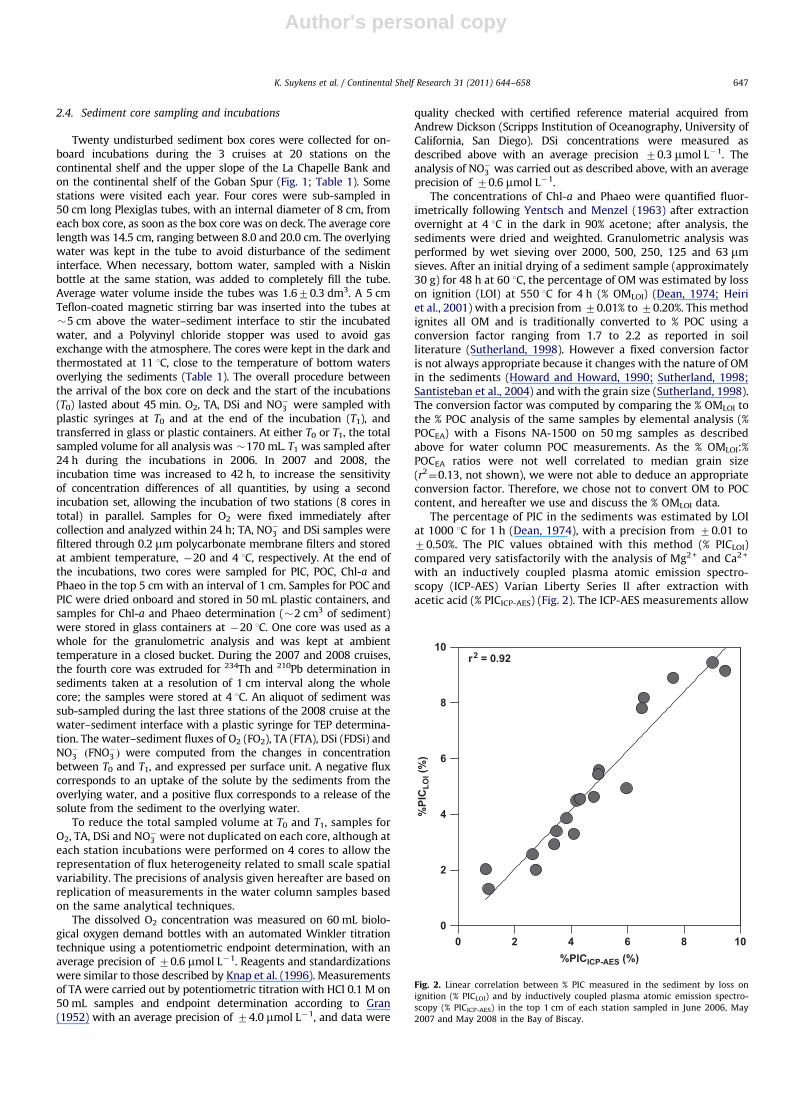
The percentage of PIC in the sediments was estimated by LOIat 1000 1C for 1 h (Dean, 1974), with a precision from 70.01 to70.50%. The PIC values obtained with this method (% PICLOI)compared very satisfactorily with the analysis of Mg2 + and Ca2 +
with an inductively coupled plasma atomic emission spectro-scopy (ICP-AES) Varian Liberty Series II after extraction withacetic acid (% PICICP-AES) (Fig. 2). The ICP-AES measurements allow
0 2 4 6 8 100
2
4
6
8
10r2 = 0.92
%PICICP-AES (%)
%PI
CLO
I (%
)
Fig. 2. Linear correlation between % PIC measured in the sediment by loss on
ignition (% PICLOI) and by inductively coupled plasma atomic emission spectro-
scopy (% PICICP-AES) in the top 1 cm of each station sampled in June 2006, May
2007 and May 2008 in the Bay of Biscay.
K. Suykens et al. / Continental Shelf Research 31 (2011) 644–658 647
Author's personal copy
evaluating the PIC content as the sum of calcium and magnesiumcarbonates. The carbonates in these sediments contain little Mg2 +
(maximum of 4–5 mol% of Mg2 +, data not shown).The first 2.5 cm of surface sediment, sub-sampled for TEP
determination, were re-suspended in 40 mL of distilled water andhomogenized. Duplicates of 4–12 mL of the supernatant werefiltered through 0.4 mm Nuclepore filters and transparent parti-cles were stained with 0.5 mL of acidic Alcian Blue aqueoussolution (pH 2.6) according to Passow and Alldredge (1995). Theamount of TEP is given in mmol C m�2 of seafloor at 3 stations(5bis, 9bis and 12) considering a porosity of 46% in sandysediments, and a 0.75 mg C (mg X eq)�1 factor to convert TEPconcentrations into C units (Passow, 2002).
210Pb and 234Th are naturally occurring radionuclides inmarine sediments, and have been widely used as chronometersfor estimating accumulation and mixing rates in marine and lakesediments (Koide et al., 1973; Robbins and Edgington, 1975;Cochran and Aller, 1979; Schmidt et al., 2007). Particles, organicor inorganic, scavenge natural radionuclides in the water columnand deposit 210Pb and 234Th at the seabed in excess (210Pbxs;234Thxs) of that produced within sediments by the decay of theirparent isotopes, 226Ra and 238U, respectively. As sediments areburied, 234Th and 210Pb decay with their respective half-life(24.1 d and 22.3 yr). The distribution of such particle-reactiveradionuclides in a sediment column can result from either simplesediment accumulation or mixing plus sediment accumulation(De Master et al., 1985). The effects can be resolved usingradionuclides with different half-lives. The 210Pb method givesan average accumulation rate for the past 100 yr while 234Th isapplicable for the past three months. A first test on a corecollected in June 2006 showed very low levels of radionuclidesin bulk sediments because of the sandy nature of sediment,radionuclides being carried on the fine fraction. Therefore, forthe cores obtained in 2007 and 2008, sediment samples weresieved through 63 mm and dried at 60 1C. This fraction was usedto measure 210Pb, 226Ra, 234Th, and 238U by gamma spectrometry(Schmidt et al., 2009). The gamma spectrometer is a low back-ground, high-efficiency, well-shaped-detector (Canberra, Gevolume 280 cm3), placed in a lead shield and protected fromcosmic ray muons by an anti-cosmic shielding made of plasticscintillators. 210Pb was determined by its specific ray at 46.5 keV,226Ra by the rays of its decay products, at 295 and 352 keV for214Pb, at 609 keV for 214Bi, and 234Th by its rays at 63.2 and92 keV. 238U is not a gamma emitter, nevertheless its values weredetermined through 234Th by measuring selected samples a fewmonths later (after the decay of the unsupported fraction of234Th). International Atomic Energy Agency standards (RGU-1and RGTh-1) were used for the calibration of the g detector. Thecounting error was one standard deviation of counting, andcounting times lasted from 4 to 24 h. Excess 234Th and 210Pb insediment, i.e., scavenged from seawater, were calculated bysubtracting the activity supported by their parent isotope, 238Uor 226Ra, from the total measured 234Th and 210Pb activities. For234Th, due to its short half-live, the values were also corrected forradioactive decay that occurred between sample collection andsample counting. Errors on excess values were calculated bypropagating errors on activity determinations.
Due to its very short half-life, 234Thxs should be present only atthe water–sediment interface. Its penetration to variable depthsindicates efficient mixing of the upper sediments, usually bybioturbation. The simplest way to derive bioturbation rates (Db)from radionuclide profiles is to assume mixing as a diffusiveprocess occurring at a constant rate within a surface mixed layerunder steady state (Aller and Cochran, 1976; Boudreau, 1986;Schmidt et al., 2002a, 2007). Such assumption allows the deter-mination of Db from the plot of radionuclide activity as a function
of depth, according to
½234Thxs�z ¼ ½
234Thxs� 0 exp �z
ffiffiffiffiffiffil
Db
s !ð3Þ
where [234Thxs]0,z is the activity (mBq g�1) of excess 234Th at thewater–sediment interface, z is the sediment depth, and l is thedecay constant of 234Th (10.5 yr�1).
We present 234Th-derived mixing rates as an indication ofparticle input over the last few weeks. Such mixing rates must beconsidered as instantaneous signals (Aller and De Master, 1984;Schmidt et al., 2007).
3. Results
3.1. Surface waters
The three cruises were carried out after the main spring bloomthat peaked in mid-April (associated to diatoms), during theperiod corresponding from peak to declining normalized waterleaving radiance (indicative of the occurrence of coccolithophoridblooms) (Harlay et al., in press; Suykens et al., 2010). Overall,higher remotely sensed Chl-a as well as normalized water leavingradiance was observed at the Goban Spur compared to the LaChapelle Bank during the three years. Some inter-annual varia-bility in remotely sensed Chl-a was observed with highest con-centrations in 2008 (up to 5.0 mg L�1 at Goban Spur). During the3 cruises, remote sensing images revealed several patches of coldwater (sea surface temperature o14 1C) along the shelf break inthe whole study area (Suykens et al., 2010), corresponding to thesignature of enhanced vertical mixing due to turbulent dissipa-tion related to the generation of internal tides (Pingree et al.,1999; Wollast and Chou, 2001). Vertical profiles of temperatureshowed increased stratification over the continental shelf com-pared to the shelf break during the 3 years. Remote sensingimages, vertical profiles of biogeochemical variables (O2, partialpressure of CO2, dissolved inorganic nutrients, Chl-a, Harlay et al.,2009, in press; Suykens et al., 2010; Harlay, Chou, Suykens,Borges, unpublished) and process measurements (primary pro-duction, calcification, planktonic community respiration, bacterialproduction; Harlay et al., 2009, in press; Harlay, Chou, Suykens,Borges, unpublished) suggest that the sampling was carried out atthe onset of the coccolithophorid bloom during the May 2007 and2008 cruises and towards the declining bloom phase, during theJune 2006 cruise. Upwelling of deep cold water brings nutrients tosurface waters and sustains phytoplankton activity along thecontinental margin as well as a coccolithophorid bloom alongthe shelf edge, in the warmer and more stratified waters (Harlayet al., 2010, in press; Suykens et al., 2010). In May 2007, windspeeds and storm events (ship-board measurements averaged10 m s�1 with a maximum of 30 m s�1) were higher than in May2008 (average wind speed of 7 m s�1 with a maximum of17 m s�1), and than June 2006 (average wind speed of 7 m s�1
and maximum of 15 m s�1).
3.2. Bottom water characteristics
Bottom waters sampled from 7 to 30 m above the sea floorwere characterized by temperatures ranging between 10.5 and11.9 1C and salinities ranging between 35.37 and 35.61, and werewell oxygenated (% O2480%) (Table 1) as also reported at theGoban Spur at depths between 208 and 4460 m (Heip et al.,2001). The lowest % O2 values in bottom waters were observed atthe 2 deepest stations (80.4% at 521 m depth (station 6 in May2008) and 85.3% at 680 m depth (station 2 in June 2006)), while
K. Suykens et al. / Continental Shelf Research 31 (2011) 644–658648
Author's personal copy
the highest values (96.7%) were observed in May 2007 (Table 1).NO�3 ranged from 3.9 to 11.1 mmol L�1 and DSi ranged from 1.4 to4.7 mmol L�1 (Table 1), in agreement with values previouslyreported at similar depths at La Chapelle Bank (Wollast andChou, 2001; Hydes et al., 2001). Chl-a and Phaeo concentrationsof bottom waters were low (0.03–0.58 and 0.04–0.68 mg L�1,respectively) and the highest concentrations were observed dur-ing the May 2008 cruise (Table 1). SPM values ranged from 0.20 to1.46 mg L�1 (Table 1), falling in the lower end of the rangeobserved by Thomsen and van Weering (1998) (0.2–10.0 mg L�1
in the BBL from 5 to 50 cm height above the seafloor) at GobanSpur at depths between 208 and 4460 m. POC and PIC concentra-tions ranged from 0.014 to 0.097 mg L�1 and from 0.005 to0.072 mg L�1, respectively (Table 1). The concentrations of POCwere in agreement with the values of 0.04 mg L�1 at 208 m depthand 0.08 mg L�1 at 668 m depth in the BBL at Goban Spurreported by Thomsen and van Weering (1998).
3.3. Sediments
The overall median grain size was 285 mm (excluding the twocoarser stations 1 and 8 in May 2008), at the La Chapelle Bank andGoban Spur (Table 2). The lowest median grain sizes wereobserved over the Goban Spur (262 mm) and in the two upperslope stations (190 mm at 521 m depth (station 2 in 2006) and127 mm at 680 m depth (station 6 in 2008)). This distribution is inagreement with previously published values along the northeastshelf break (Reynaud et al., 1999; van Weering et al., 2001).
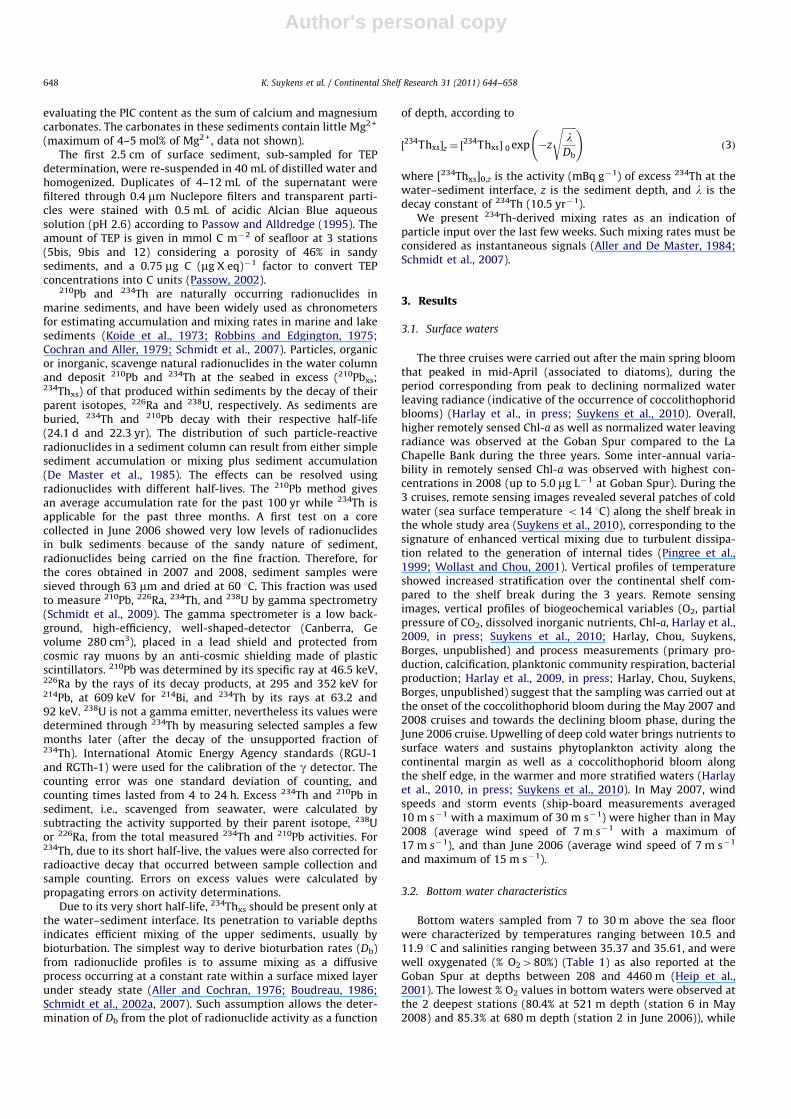
Surface sediment Chl-a content showed distinct ranges betweenthe 3 cruises: the highest values, were observed in May 2008(0.21–0.95 mg g�1), intermediate values in May 2007 (0.08–0.27 mg g�1) and the lowest values (0.01–0.05 mg g�1) in June2006 (Fig. 3 and Table 2). In May 2008, high Chl-a values werealso observed into the top 5 cm of the sediments indicative ofrecent deposition of phytoplankton material (except station 9bis).Surface sediment Phaeo values in May 2007 and 2008 werecomparable, ranging between 0.3 and 2.2 mg g�1 and were lowerin June 2006, when they ranged between 0.02 and 1.03 mg g�1
(Table 2). Chl-a:Phaeo ratios in the top 5 cm of the sediments werehighest in May 2008 compared to the other two cruises (Fig. 3),indicating more recently deposited phytoplankton particles.
The sediment % OMLOI ranged between 1.4% and 4.0% (Table 2)and falls in the range observed by Epping et al. (2002) at thecontinental margin and shelf slope (depth o1000 m) of theIberian margin (0.5–4.5%). The sediments were relatively rich inPIC (% PIC between 1.3% and 9.5%) (Table 2) and fall in the rangereported by Epping et al. (2002) at the Iberian margin (0.6–9.0%)at depths between 104 and 4941 m. Flach and Heip (1996)observed higher % CaCO3 from �20% at 208 m up to �70% at
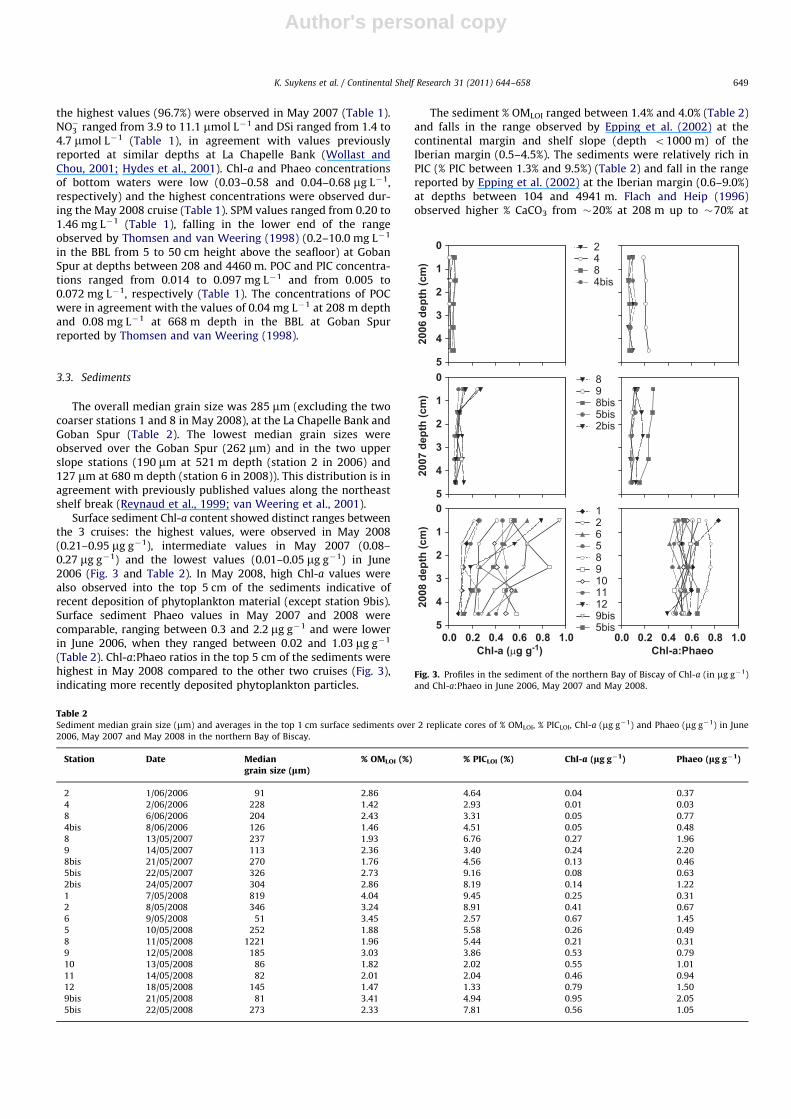
Table 2Sediment median grain size (mm) and averages in the top 1 cm surface sediments over 2 replicate cores of % OMLOI, % PICLOI, Chl-a (mg g�1) and Phaeo (mg g�1) in June
2006, May 2007 and May 2008 in the northern Bay of Biscay.
Station Date Mediangrain size (lm)
% OMLOI (%) % PICLOI (%) Chl-a (lg g�1) Phaeo (lg g�1)
2 1/06/2006 91 2.86 4.64 0.04 0.37
4 2/06/2006 228 1.42 2.93 0.01 0.03
8 6/06/2006 204 2.43 3.31 0.05 0.77
4bis 8/06/2006 126 1.46 4.51 0.05 0.48
8 13/05/2007 237 1.93 6.76 0.27 1.96
9 14/05/2007 113 2.36 3.40 0.24 2.20
8bis 21/05/2007 270 1.76 4.56 0.13 0.46
5bis 22/05/2007 326 2.73 9.16 0.08 0.63
2bis 24/05/2007 304 2.86 8.19 0.14 1.22
1 7/05/2008 819 4.04 9.45 0.25 0.31
2 8/05/2008 346 3.24 8.91 0.41 0.67
6 9/05/2008 51 3.45 2.57 0.67 1.45
5 10/05/2008 252 1.88 5.58 0.26 0.49
8 11/05/2008 1221 1.96 5.44 0.21 0.31
9 12/05/2008 185 3.03 3.86 0.53 0.79
10 13/05/2008 86 1.82 2.02 0.55 1.01
11 14/05/2008 82 2.01 2.04 0.46 0.94
12 18/05/2008 145 1.47 1.33 0.79 1.50
9bis 21/05/2008 81 3.41 4.94 0.95 2.05
5bis 22/05/2008 273 2.33 7.81 0.56 1.05
0
1
2
3
4
5
898bis5bis2bis
2007
dep
th (c
m)
0.0 0.2 0.4 0.6 0.8 1.0
0
1
2
3
4
5
1265891011129bis5bis
Chl-a (μg g-1)
2008
dep
th (c
m)
0
1
2
3
4
5
2484bis
2006
dep
th (c
m)
0.0 0.2 0.4 0.6 0.8 1.0Chl-a:Phaeo
Fig. 3. Profiles in the sediment of the northern Bay of Biscay of Chl-a (in mg g�1)
and Chl-a:Phaeo in June 2006, May 2007 and May 2008.
K. Suykens et al. / Continental Shelf Research 31 (2011) 644–658 649
Author's personal copy
4460 m in Goban Spur. Macroscopic and microscopic (withoptical microscope) examinations of the surface sediments sug-gest that most of the PIC was related to debris of bivalve shells.
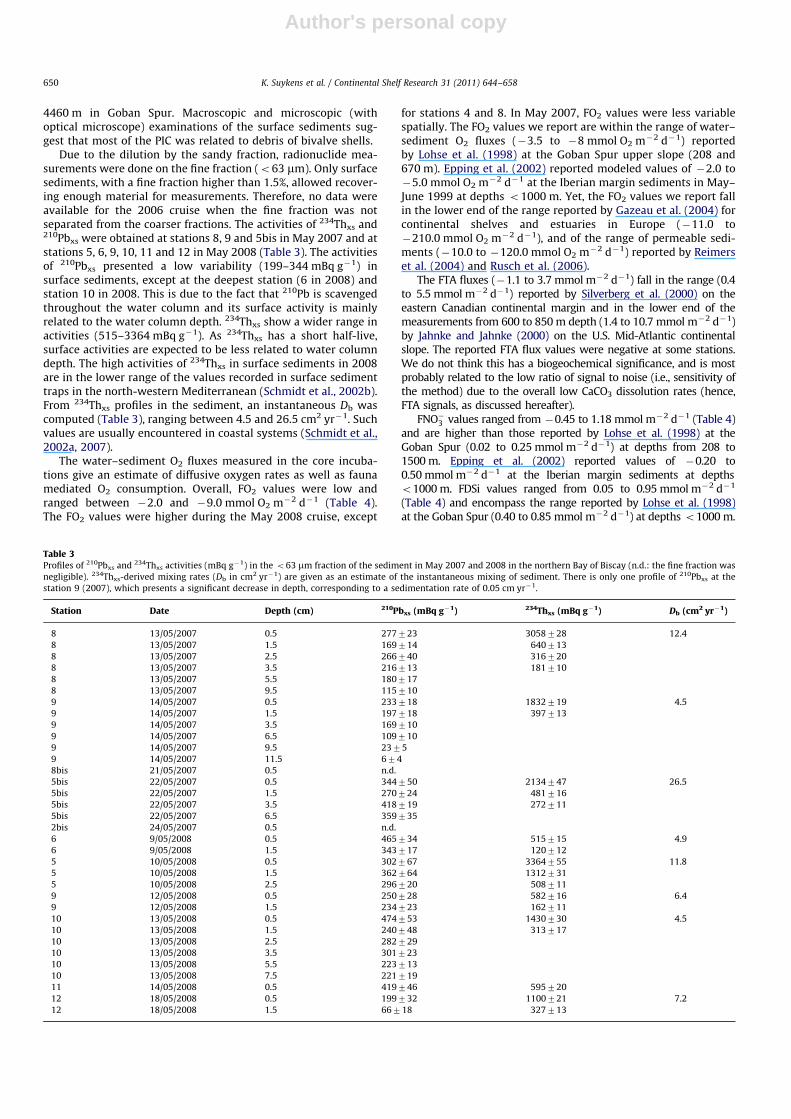
Due to the dilution by the sandy fraction, radionuclide mea-surements were done on the fine fraction (o63 mm). Only surfacesediments, with a fine fraction higher than 1.5%, allowed recover-ing enough material for measurements. Therefore, no data wereavailable for the 2006 cruise when the fine fraction was notseparated from the coarser fractions. The activities of 234Thxs and210Pbxs were obtained at stations 8, 9 and 5bis in May 2007 and atstations 5, 6, 9, 10, 11 and 12 in May 2008 (Table 3). The activitiesof 210Pbxs presented a low variability (199–344 mBq g�1) insurface sediments, except at the deepest station (6 in 2008) andstation 10 in 2008. This is due to the fact that 210Pb is scavengedthroughout the water column and its surface activity is mainlyrelated to the water column depth. 234Thxs show a wider range inactivities (515–3364 mBq g�1). As 234Thxs has a short half-live,surface activities are expected to be less related to water columndepth. The high activities of 234Thxs in surface sediments in 2008are in the lower range of the values recorded in surface sedimenttraps in the north-western Mediterranean (Schmidt et al., 2002b).From 234Thxs profiles in the sediment, an instantaneous Db wascomputed (Table 3), ranging between 4.5 and 26.5 cm2 yr�1. Suchvalues are usually encountered in coastal systems (Schmidt et al.,2002a, 2007).
The water–sediment O2 fluxes measured in the core incuba-tions give an estimate of diffusive oxygen rates as well as faunamediated O2 consumption. Overall, FO2 values were low andranged between �2.0 and �9.0 mmol O2 m�2 d�1 (Table 4).The FO2 values were higher during the May 2008 cruise, except
for stations 4 and 8. In May 2007, FO2 values were less variablespatially. The FO2 values we report are within the range of water–sediment O2 fluxes (�3.5 to �8 mmol O2 m�2 d�1) reportedby Lohse et al. (1998) at the Goban Spur upper slope (208 and670 m). Epping et al. (2002) reported modeled values of �2.0 to�5.0 mmol O2 m�2 d�1 at the Iberian margin sediments in May–June 1999 at depths o1000 m. Yet, the FO2 values we report fallin the lower end of the range reported by Gazeau et al. (2004) forcontinental shelves and estuaries in Europe (�11.0 to�210.0 mmol O2 m�2 d�1), and of the range of permeable sedi-ments (�10.0 to �120.0 mmol O2 m�2 d�1) reported by Reimerset al. (2004) and Rusch et al. (2006).
The FTA fluxes (�1.1 to 3.7 mmol m�2 d�1) fall in the range (0.4to 5.5 mmol m�2 d�1) reported by Silverberg et al. (2000) on theeastern Canadian continental margin and in the lower end of themeasurements from 600 to 850 m depth (1.4 to 10.7 mmol m�2 d�1)by Jahnke and Jahnke (2000) on the U.S. Mid-Atlantic continentalslope. The reported FTA flux values were negative at some stations.We do not think this has a biogeochemical significance, and is mostprobably related to the low ratio of signal to noise (i.e., sensitivity ofthe method) due to the overall low CaCO3 dissolution rates (hence,FTA signals, as discussed hereafter).
FNO�3 values ranged from �0.45 to 1.18 mmol m�2 d�1 (Table 4)and are higher than those reported by Lohse et al. (1998) at theGoban Spur (0.02 to 0.25 mmol m�2 d�1) at depths from 208 to1500 m. Epping et al. (2002) reported values of �0.20 to0.50 mmol m�2 d�1 at the Iberian margin sediments at depthso1000 m. FDSi values ranged from 0.05 to 0.95 mmol m�2 d�1
(Table 4) and encompass the range reported by Lohse et al. (1998)at the Goban Spur (0.40 to 0.85 mmol m�2 d�1) at depths o1000 m.
Table 3Profiles of 210Pbxs and 234Thxs activities (mBq g�1) in the o63 mm fraction of the sediment in May 2007 and 2008 in the northern Bay of Biscay (n.d.: the fine fraction was
negligible). 234Thxs-derived mixing rates (Db in cm2 yr�1) are given as an estimate of the instantaneous mixing of sediment. There is only one profile of 210Pbxs at the
station 9 (2007), which presents a significant decrease in depth, corresponding to a sedimentation rate of 0.05 cm yr�1.
Station Date Depth (cm) 210Pbxs (mBq g�1) 234Thxs (mBq g�1) Db (cm2 yr�1)
8 13/05/2007 0.5 277723 3058728 12.4
8 13/05/2007 1.5 169714 640713
8 13/05/2007 2.5 266740 316720
8 13/05/2007 3.5 216713 181710
8 13/05/2007 5.5 180717
8 13/05/2007 9.5 115710
9 14/05/2007 0.5 233718 1832719 4.5
9 14/05/2007 1.5 197718 397713
9 14/05/2007 3.5 169710
9 14/05/2007 6.5 109710
9 14/05/2007 9.5 2375
9 14/05/2007 11.5 674
8bis 21/05/2007 0.5 n.d.
5bis 22/05/2007 0.5 344750 2134747 26.5
5bis 22/05/2007 1.5 270724 481716
5bis 22/05/2007 3.5 418719 272711
5bis 22/05/2007 6.5 359735
2bis 24/05/2007 0.5 n.d.
6 9/05/2008 0.5 465734 515715 4.9
6 9/05/2008 1.5 343717 120712
5 10/05/2008 0.5 302767 3364755 11.8
5 10/05/2008 1.5 362764 1312731
5 10/05/2008 2.5 296720 508711
9 12/05/2008 0.5 250728 582716 6.4
9 12/05/2008 1.5 234723 162711
10 13/05/2008 0.5 474753 1430730 4.5
10 13/05/2008 1.5 240748 313717
10 13/05/2008 2.5 282729
10 13/05/2008 3.5 301723
10 13/05/2008 5.5 223713
10 13/05/2008 7.5 221719
11 14/05/2008 0.5 419746 595720
12 18/05/2008 0.5 199732 1100721 7.2
12 18/05/2008 1.5 66718 327713
K. Suykens et al. / Continental Shelf Research 31 (2011) 644–658650
Author's personal copy
4. Discussion
4.1. Spatial patterns
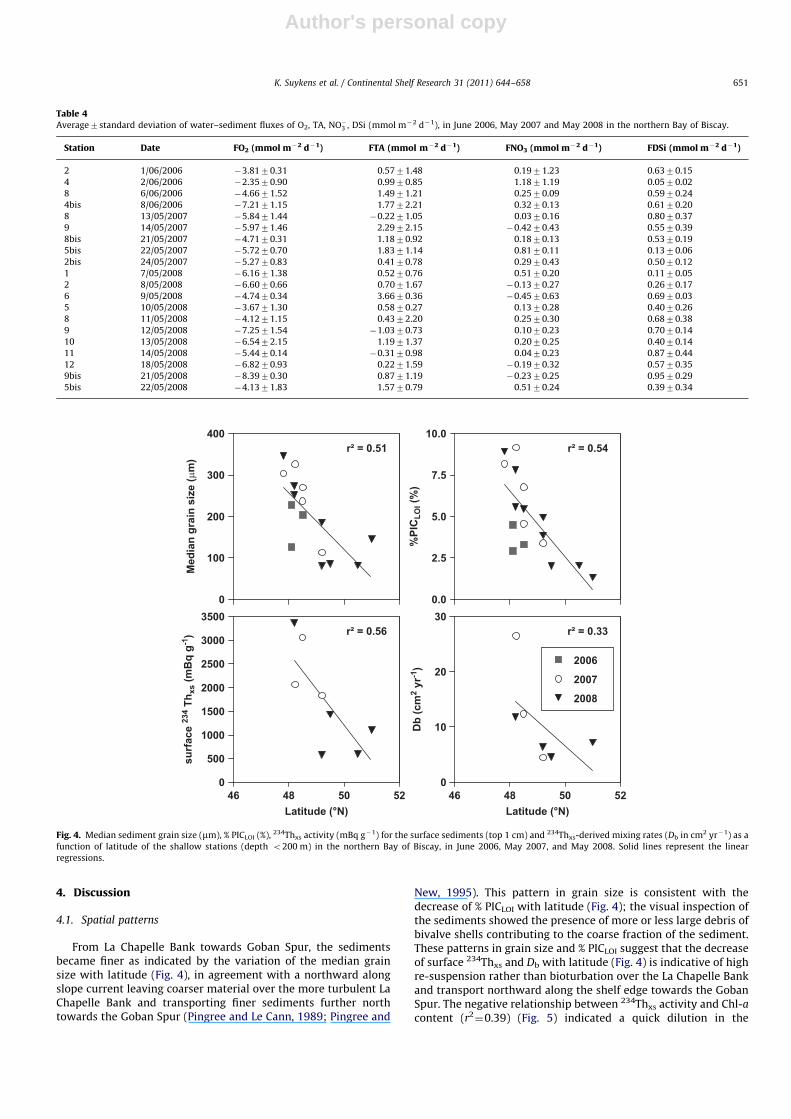
From La Chapelle Bank towards Goban Spur, the sedimentsbecame finer as indicated by the variation of the median grainsize with latitude (Fig. 4), in agreement with a northward alongslope current leaving coarser material over the more turbulent LaChapelle Bank and transporting finer sediments further northtowards the Goban Spur (Pingree and Le Cann, 1989; Pingree and
New, 1995). This pattern in grain size is consistent with thedecrease of % PICLOI with latitude (Fig. 4); the visual inspection ofthe sediments showed the presence of more or less large debris ofbivalve shells contributing to the coarse fraction of the sediment.These patterns in grain size and % PICLOI suggest that the decreaseof surface 234Thxs and Db with latitude (Fig. 4) is indicative of highre-suspension rather than bioturbation over the La Chapelle Bankand transport northward along the shelf edge towards the GobanSpur. The negative relationship between 234Thxs activity and Chl-a
content (r2¼0.39) (Fig. 5) indicated a quick dilution in the
0
100
200
300
400r² = 0.51
Med
ian
grai
n si
ze (μ
m)
46 48 50 520
500
1000
1500
2000
2500
3000
3500r² = 0.56
Latitude (°N)46 48 50 52
0
10
20
30r² = 0.33
Latitude (°N)
Db
(cm
2 yr
-1)
0.0
2.5
5.0
7.5
10.0r² = 0.54
2006
2007
2008
%PI
CLO
I (%
)
surf
ace
234
Thxs
(mB
q g-1
)
Fig. 4. Median sediment grain size (mm), % PICLOI (%), 234Thxs activity (mBq g�1) for the surface sediments (top 1 cm) and 234Thxs-derived mixing rates (Db in cm2 yr�1) as a
function of latitude of the shallow stations (depth o200 m) in the northern Bay of Biscay, in June 2006, May 2007, and May 2008. Solid lines represent the linear
regressions.
Table 4Average7standard deviation of water–sediment fluxes of O2, TA, NO�3 , DSi (mmol m�2 d�1), in June 2006, May 2007 and May 2008 in the northern Bay of Biscay.
Station Date FO2 (mmol m�2 d�1) FTA (mmol m�2 d�1) FNO3 (mmol m�2 d�1) FDSi (mmol m�2 d�1)
2 1/06/2006 �3.8170.31 0.5771.48 0.1971.23 0.6370.15
4 2/06/2006 �2.3570.90 0.9970.85 1.1871.19 0.0570.02
8 6/06/2006 �4.6671.52 1.4971.21 0.2570.09 0.5970.24
4bis 8/06/2006 �7.2171.15 1.7772.21 0.3270.13 0.6170.20
8 13/05/2007 �5.8471.44 �0.2271.05 0.0370.16 0.8070.37
9 14/05/2007 �5.9771.46 2.2972.15 �0.4270.43 0.5570.39
8bis 21/05/2007 �4.7170.31 1.1870.92 0.1870.13 0.5370.19
5bis 22/05/2007 �5.7270.70 1.8371.14 0.8170.11 0.1370.06
2bis 24/05/2007 �5.2770.83 0.4170.78 0.2970.43 0.5070.12
1 7/05/2008 �6.1671.38 0.5270.76 0.5170.20 0.1170.05
2 8/05/2008 �6.6070.66 0.7071.67 �0.1370.27 0.2670.17
6 9/05/2008 �4.7470.34 3.6670.36 �0.4570.63 0.6970.03
5 10/05/2008 �3.6771.30 0.5870.27 0.1370.28 0.4070.26
8 11/05/2008 �4.1271.15 0.4372.20 0.2570.30 0.6870.38
9 12/05/2008 �7.2571.54 �1.0370.73 0.1070.23 0.7070.14
10 13/05/2008 �6.5472.15 1.1971.37 0.2070.25 0.4070.14
11 14/05/2008 �5.4470.14 �0.3170.98 0.0470.23 0.8770.44
12 18/05/2008 �6.8270.93 0.2271.59 �0.1970.32 0.5770.35
9bis 21/05/2008 �8.3970.30 0.8771.19 �0.2370.25 0.9570.29
5bis 22/05/2008 �4.1371.83 1.5770.79 0.5170.24 0.3970.34
K. Suykens et al. / Continental Shelf Research 31 (2011) 644–658 651

Author's personal copy
sediment of ‘‘freshly’’ deposited matter over the La Chapelle Bankdue to strong mixing. An enrichment of older OM (indicated by %OMLOI) as well as recently deposited matter (indicated by Chl-a)was observed in relation to finer grain fraction (Fig. 5). The mixingdepth and intensity are usually much lower at the shelf edge andon the slope compared to near-shore coastal systems (vanWeering et al., 2001; Schmidt et al., 2002a). Previous workby Reynaud et al. (1999) in the La Chapelle Bank area showedhigh reworking events of the sand banks (Fig. 1) by waves andtides, inducing the winnowing of the fine fraction. The re-suspended sediments are then transported across the banksdominated by shelf residual currents and long-term drift(Reynaud et al., 1999). Profiles of 210Pbxs were almost constantover the top �10 cm, for every cruise, indicating a strong mixingof these sediments (Table 3). This is in agreement with theobservations by Rusch et al. (2006 and references therein) thathigher current regimes over a sandy floor can flush the sedimentsurface down to several cm depth. This is also in agreement withthe observed successive re-suspension and re-deposition of par-ticles in sediments of the Bay of Biscay (Thomsen and vanWeering, 1998). Therefore 210Pbxs profiles registered mixingevents, and are not appropriate for sedimentation rate determi-nation, which is very low in the area (Reynaud et al., 1999;Thomsen and van Weering, 1998; Heip et al., 2001; van Weeringet al., 2001).
The higher water column integrated Chl-a content (Fig. 5) wasconsistent with higher primary production at La Chapelle Bankthan at Goban Spur (Joint et al., 2001) due to higher verticalmixing at La Chapelle Bank related to turbulent dissipation ofinternal tides (Wollast and Chou, 2001). The La Chapelle Bank
area appeared to be the area of the onset of the phytoplanktonblooms with higher primary production (as reported by Harlayet al. (in press) in June 2006) upon which the water mass stratifiesand the bloom ages as it moves over the shelf. The negativerelationship between the Chl-a content of the sediment interfaceand water column integrated Chl-a (Fig. 5) indicates a decouplingbetween organic C production in surface waters (around LaChapelle Bank) and deposition in the sediments (towardsGoban Spur).
4.2. Temporal patterns
234Thxs activities at the water–sediment interface are mainlyrelated to freshly deposited particles due to the rapid settlingparticles from the surface water, associated with pelagic produc-tion, or due to re-suspended particles, that scavenged 234Th in thedeep bottom layer. Besides a spatial pattern, no temporal trendwith regards to for instance sediment Chl-a content during thedifferent cruises could be observed from 234Thxs activities. Thissuggests that scavenging of 234Th by re-suspension was the mostimportant process. Chl-a in the sediments was highest in 2008indicating that more recently phytoplanktonic OM was deposited(Fig. 3) as confirmed by the high Chl-a:Phaeo ratios. Yet, 234Thactivities in the surface sediment in 2008 bracket the valuesobtained in 2007 when Chl-a and Chl-a:Phaeo ratios indicate lessfreshly deposited phytoplankton material.
In the northern Bay of Biscay, TEP has been shown to be asignificant contributor of the pelagic POC stock (between 12% and54%) and a potential contributor to the vertical flux of particulate
0 1000 2000 3000 40000.0
0.2
0.4
0.6
0.8
1.0r² = 0.39
234Thxs activity (mBq g-1)0 1 2 3 4 5
0
1
2
3
4
r² = 0.33
2006
2007
2008
%<63 μm
%O
MLO
I (%
)
0 20 40 60 800.0
0.2
0.4
0.6
0.8
1.0r² = 0.52
water integrated Chl-a (μg m-2)
Chl
-a (μ
g g-1
)
Chl
-a (μ
g g-1
)
Chl
-a (μ
g g-1
)
0 1 2 3 4 50.0
0.2
0.4
0.6
0.8
1.0
r² = 0.44
%<63µm
Fig. 5. Surface sediment (top 1 cm) Chl-a content (mg g�1) versus surface sediment 234Thxs activity (mBq g�1) and versus the integrated water column Chl-a (mg m�2),
grain size content o63 mm (%) versus % OMLOI and versus surface sediment Chl-a content (mg g�1) of the surface sediments (top 1 cm) of the shallow stations (depth
o200 m) in the northern Bay of Biscay in June 2006, May 2007 and May 2008. Solid lines represent the linear regressions.
K. Suykens et al. / Continental Shelf Research 31 (2011) 644–658652

Author's personal copy
material (Harlay et al., 2009). At stations 5bis, 9bis and 12 (2008),TEP-C was sampled in the surface of sediments and concentra-tions were as high as 29 mmol C m�2 which corresponds to �10%of the average pelagic integrated TEP-C at these 3 stations(Harlay, Chou, unpublished) (Fig. 6). TEP-C in the surface of thesediments was positively correlated to sediment Chl-a andnegatively to FO2. Hence, TEP-C export to the sediments andfurther diagenetic degradation could be a major sink for pelagicTEP in the area, which needs to be confirmed by furthermeasurements.
4.3. Fluxes: OM diagenesis
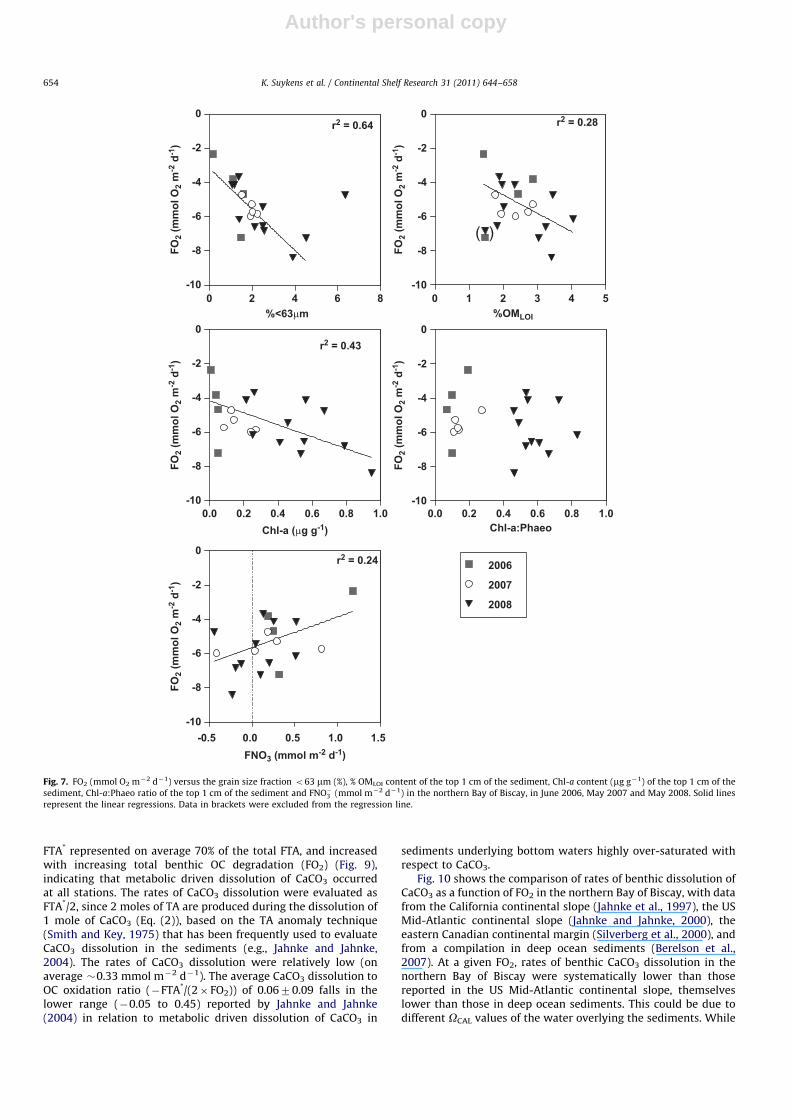
In sediments underlying well-oxygenated bottom waters,sediment O2 consumption is the most widely used measurementof total benthic remineralization (Thamdrup and Canfield, 1996).The relationships between FO2 and the grain size fractiono63 mm (r2
¼0.64) and Chl-a content of the top 1 cm of thesediments (r2
¼0.43), as well as % OMLOI (r2¼0.28) indicate that
FO2 rates were a direct function of the availability of OM (Fig. 7).However, OC degradation processes did not show a preferencetowards ‘‘fresher’’ phytoplanktonic OM as indicated by the lack ofrelationship between FO2 and the Chl-a:Phaeo ratios (Fig. 7).
FO2 and FNO�3 were positively correlated (r2¼0.24), with a
transfer of NO�3 from the water column to the sediment at stationswhere the sediment uptake of O2 was highest, while at stationswhere the sediment uptake of O2 was lowest, the sedimentsreleased NO�3 to the water column (Fig. 7). This would indicatethat at the stations where benthic OC degradation was the mostintense, part of the sediment was suboxic or anoxic, leading todenitrification. Hence, with increasing OC degradation, the efflux ofNO�3 from the sediments to the water column decreased due toremoval of NO�3 by denitrification. At the two deep stations (2(2006) and 6 (2008)) and 3 stations situated over the shelf of theGoban Spur (9, 9bis and 12 (2008)), the water column providedNO�3 for benthic denitrification, and a flux of NO�3 from the watercolumn to the sediment was observed. These findings are in overallagreement with the model of Middelburg et al. (1996) for con-tinental margin sediments in general, and with the field measure-ments of Balzer et al. (1998) on the continental slope and shelf atGoban Spur at depths from 300 m to 5200 m.
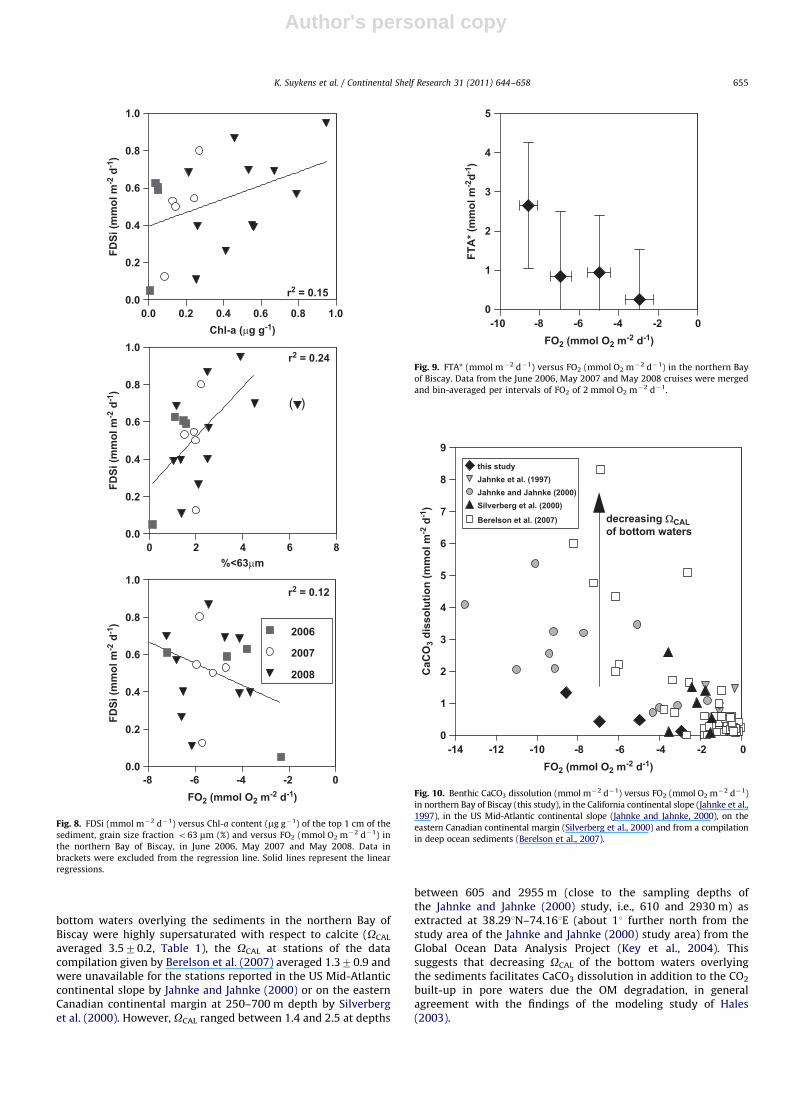
The vast majority of biogenic silica produced in surface watersdissolves in the water column during particle sinking (�50%dissolves in the upper 100 m of the water column, Nelson et al.(1995)). Diatom aggregation allows a more rapid transport ofbiogenic silica through the water column, thereby reducing thetime spent by biogenic silica in undersaturated surface waters(e.g., Alldredge et al., 1995). Yet, the positive FDSi in the northernBay of Biscay indicates further biogenic silica dissolution in thesediments. The positive correlations between FDSi and Chl-a
(r2¼0.15) as well as to the grain size o63 mm (r2
¼0.24) (Fig. 8)could indicate that the dissolution of biogenic silica is, to someextent (given the low statistical significance of the linear regres-sions), controlled by the stock of biogenic silica in the sediments.Bacterial degradation in the sediments (hence FO2) removes theOM coating of frustules, and accelerates the rate of dissolution ofbiogenic silica (Smith et al., 1996; Rabouille et al., 1997; Bidle andAzam, 1999). The FDSi:FO2 ratio ranged in absolute values from0.01 to 0.25 with an average of 0.0970.05. This is close to thevalue of 0.1 that can be predicted from the average of Si:C ratio inmarine diatoms reported by Brzezinski (1985). Yet, the lowstatistical significance of the correlation between FDSi and FO2
(r2¼0.12) (Fig. 8) would indicate that FDSi was mainly due to the
dissolution of the stock of biogenic silica in the sediments andrelatively independent of OM degradation. Indeed, the dissolutionof biogenic silica is mainly a purely thermodynamic process(Michalopoulos and Aller, 2004) and the regeneration of DSi andother inorganic nutrients are to a large extent decoupled(e.g., Broecker and Peng, 1982).
4.4. Fluxes: metabolic driven dissolution of CaCO3
OM oxidation by O2 and oxidation in oxic sediments of diffusingreduced solutes, produced by anaerobic degradation of OM, cause abuild-up of CO2 and decrease of pH in pore waters, leading tosubsequent CaCO3 undersaturation and dissolution (Emerson andBender, 1981; Broecker and Peng, 1982; Canfield and Raiswell,1991; Hales and Emerson, 1996, 1997; Martin and Sayles, 1996;Jahnke et al., 1997; Jahnke and Jahnke, 2000; Hales, 2003). Therelationship between FNO�3 and FO2 indicated the occurrence ofdenitrification that leads to an increase of TA (Froelich et al., 1979).On the other hand, the release of NO�3 and PO3�
4 by OM degradationleads to a decrease of TA. Hence, we computed FTA* as the flux ofTA corrected for the effects of denitrification and for the effect ofNO�3 and PO3�
4 release from OM remineralization. Hence, FTA*
should only be driven by CaCO3 dissolution.The change of TA due to aerobic remineralization (FTAAR) was
computed according to:
FTAAR ¼179FO29
138ð4Þ
We roughly evaluated denitrification as the differencebetween the observed FNO�3 and the flux of NO�3 expected onlyfrom OM remineralization evaluated from the observed FO2 andusing the O2:NO�3 Redfield ratio of 138:16 (Redfield et al., 1963).The estimates of denitrification computed this way ranged from0.0 to 1.2 mmol m�2 d�1 with an average of 0.5 mmol m�2 d�1,in agreement with the denitrification value of 0.6 mmol m�2 d�1
reported at 200 m by Balzer et al. (1998) in Goban Spur.The change of TA (FTAdenitr) related to denitrification was
computed as
FTAdenitr ¼169FO29
138�FNO�3 ð5Þ
The FTA* was computed as
FTA� ¼ FTAþFTAAR�FTAdenitr ð6Þ
0 10 20 300.50
0.75
1.00
-10
-8
-6
-4
-2
0
TEP-C (mmolC m-2)
Chl
-a (µ
g g-
1 )
FO2 (
mm
ol O
2 m-2
d-1
)
Fig. 6. Chl-a concentrations (mg g�1) in the top 1 cm of the sediment and FO2
(mmol O2 m�2 d�1) versus TEP-C (mmolC m�2) at stations 5bis, 9bis and 12 of the
May 2008 cruise in the northern Bay of Biscay.
K. Suykens et al. / Continental Shelf Research 31 (2011) 644–658 653
Author's personal copy
FTA* represented on average 70% of the total FTA, and increasedwith increasing total benthic OC degradation (FO2) (Fig. 9),indicating that metabolic driven dissolution of CaCO3 occurredat all stations. The rates of CaCO3 dissolution were evaluated asFTA*/2, since 2 moles of TA are produced during the dissolution of1 mole of CaCO3 (Eq. (2)), based on the TA anomaly technique(Smith and Key, 1975) that has been frequently used to evaluateCaCO3 dissolution in the sediments (e.g., Jahnke and Jahnke,2004). The rates of CaCO3 dissolution were relatively low (onaverage �0.33 mmol m�2 d�1). The average CaCO3 dissolution toOC oxidation ratio (�FTA*/(2� FO2)) of 0.0670.09 falls in thelower range (�0.05 to 0.45) reported by Jahnke and Jahnke(2004) in relation to metabolic driven dissolution of CaCO3 in
sediments underlying bottom waters highly over-saturated withrespect to CaCO3.
Fig. 10 shows the comparison of rates of benthic dissolution ofCaCO3 as a function of FO2 in the northern Bay of Biscay, with datafrom the California continental slope (Jahnke et al., 1997), the USMid-Atlantic continental slope (Jahnke and Jahnke, 2000), theeastern Canadian continental margin (Silverberg et al., 2000), andfrom a compilation in deep ocean sediments (Berelson et al.,2007). At a given FO2, rates of benthic CaCO3 dissolution in thenorthern Bay of Biscay were systematically lower than thosereported in the US Mid-Atlantic continental slope, themselveslower than those in deep ocean sediments. This could be due todifferent OCAL values of the water overlying the sediments. While
0 2 4 6 8-10
-8
-6
-4
-2
0
%<63μm
0.0 0.2 0.4 0.6 0.8 1.0-10
-8
-6
-4
-2
0r2 = 0.43
Chl-a (μg g-1)
0 1 2 3 4 5-10
-8
-6
-4
-2
0r2 = 0.28r2 = 0.64
%OMLOI
0.0 0.2 0.4 0.6 0.8 1.0-10
-8
-6
-4
-2
0
Chl-a:Phaeo
-0.5 0.0 0.5 1.0 1.5-10
-8
-6
-4
-2
0r2 = 0.24 2006
2007
2008
FNO3 (mmol m-2 d-1)
FO2
(mm
ol O
2 m
-2 d
-1)
FO2
(mm
ol O
2 m
-2 d
-1)
FO2
(mm
ol O
2 m
-2 d
-1)
FO2
(mm
ol O
2 m
-2 d
-1)
FO2
(mm
ol O
2 m
-2 d
-1)
Fig. 7. FO2 (mmol O2 m�2 d�1) versus the grain size fraction o63 mm (%), % OMLOI content of the top 1 cm of the sediment, Chl-a content (mg g�1) of the top 1 cm of the
sediment, Chl-a:Phaeo ratio of the top 1 cm of the sediment and FNO�3 (mmol m�2 d�1) in the northern Bay of Biscay, in June 2006, May 2007 and May 2008. Solid lines
represent the linear regressions. Data in brackets were excluded from the regression line.
K. Suykens et al. / Continental Shelf Research 31 (2011) 644–658654
Author's personal copy
bottom waters overlying the sediments in the northern Bay ofBiscay were highly supersaturated with respect to calcite (OCAL
averaged 3.570.2, Table 1), the OCAL at stations of the datacompilation given by Berelson et al. (2007) averaged 1.370.9 andwere unavailable for the stations reported in the US Mid-Atlanticcontinental slope by Jahnke and Jahnke (2000) or on the easternCanadian continental margin at 250–700 m depth by Silverberget al. (2000). However, OCAL ranged between 1.4 and 2.5 at depths
between 605 and 2955 m (close to the sampling depths ofthe Jahnke and Jahnke (2000) study, i.e., 610 and 2930 m) asextracted at 38.291N–74.161E (about 11 further north from thestudy area of the Jahnke and Jahnke (2000) study area) from theGlobal Ocean Data Analysis Project (Key et al., 2004). Thissuggests that decreasing OCAL of the bottom waters overlyingthe sediments facilitates CaCO3 dissolution in addition to the CO2
built-up in pore waters due the OM degradation, in generalagreement with the findings of the modeling study of Hales(2003).
0 2 4 6 80.0
0.2
0.4
0.6
0.8
1.0r2 = 0.24
%<63μm
0.0 0.2 0.4 0.6 0.8 1.00.0
0.2
0.4
0.6
0.8
1.0
r2 = 0.15
Chl-a (μg g-1)
-8 -6 -4 -2 00.0
0.2
0.4
0.6
0.8
1.0r2 = 0.12
2006
2007
2008
FO2 (mmol O2 m-2 d-1)
FDSi
(mm
ol m
-2 d
-1)
FDSi
(mm
ol m
-2 d
-1)
FDSi
(mm
ol m
-2 d
-1)
Fig. 8. FDSi (mmol m�2 d�1) versus Chl-a content (mg g�1) of the top 1 cm of the
sediment, grain size fraction o63 mm (%) and versus FO2 (mmol O2 m�2 d�1) in
the northern Bay of Biscay, in June 2006, May 2007 and May 2008. Data in
brackets were excluded from the regression line. Solid lines represent the linear
regressions.
-14 -12 -10 -8 -6 -4 -2 00
1
2
3
4
5
6
7
8
9this studyJahnke et al. (1997)Jahnke and Jahnke (2000)
Berelson et al. (2007) decreasing ΩCALof bottom waters
Silverberg et al. (2000)
FO2 (mmol O2 m-2 d-1)
CaC
O3
diss
olut
ion
(mm
ol m
-2 d
-1)
Fig. 10. Benthic CaCO3 dissolution (mmol m�2 d�1) versus FO2 (mmol O2 m�2 d�1)
in northern Bay of Biscay (this study), in the California continental slope (Jahnke et al.,
1997), in the US Mid-Atlantic continental slope (Jahnke and Jahnke, 2000), on the
eastern Canadian continental margin (Silverberg et al., 2000) and from a compilation
in deep ocean sediments (Berelson et al., 2007).
-10 -8 -6 -4 -2 00
1
2
3
4
5
FO2 (mmol O2 m-2 d-1)
FTA
* (m
mol
m-2
d-1)
Fig. 9. FTA* (mmol m�2 d�1) versus FO2 (mmol O2 m�2 d�1) in the northern Bay
of Biscay. Data from the June 2006, May 2007 and May 2008 cruises were merged
and bin-averaged per intervals of FO2 of 2 mmol O2 m�2 d�1.
K. Suykens et al. / Continental Shelf Research 31 (2011) 644–658 655
Author's personal copy
5. Conclusions
We acquired a dataset of water–sediment biogeochemical fluxesand sediment characteristics in the northwest European continentalmargin (northern Bay of Biscay) in June 2006, May 2007 and May2008, mostly on the continental shelf (o180 m depth), and twostations on the continental slope (520 and 680 m depth). Totalbenthic OC degradation rates as evaluated by water–sediment O2
fluxes (�2.4 to �8.4 mmol O2 m�2 d�1) were low due to the sandynature (fine to coarse) of the sediment with a low % OMLOI content(1% to 4%) comparable to other observations over the open marginand continental shelf of the Bay of Biscay at similar depths (Flachand Heip, 1996; Lohse et al., 1998; Epping et al., 2002). Excess 234Thand 210Pb activity profiles indicated that sediments were influencedby strong physical mixing leading to lower deposition of OM in thesediments at the La Chapelle Bank and northward transport towardsGoban Spur. The observations showed no temporal pattern betweenthe three cruises and suggest a decoupling between surface waterOM production and surface sediment OM deposition probably dueto strong hydrodynamics in the bottom waters.
The overall average during the 3 cruises of FO2 measurementswas ��5.571.5 mmol O2 m�2 d�1, which represents�8% of thepelagic primary production measured during the cruises (70744mmolC m�2 d�1; Harlay et al., in press; Harlay, unpublished). Theoverall average of FO2 values represents �4% of the pelagic respira-tion in the aphotic zone measured during the cruises (137760 mmolC m�2 d�1; Harlay et al., in press; Suykens and Borges,unpublished). The correlation between FTA and FO2 suggests theoccurrence of metabolic driven CaCO3 dissolution in the sediments.The CaCO3 dissolution rates were lower than those reported by otherstudies in continental slope and deep ocean sites due to the muchhigher OCAL of bottom waters overlying the continental shelf stationsof the northern Bay of Biscay. Rates of CaCO3 dissolution averaged forthe three cruises (�0.3370.47 mmol m�2 d�1) represent �1% ofthe pelagic calcification rates due to coccolithophores measuredduring the cruises (�34732 mmol m�2 d�1) (Harlay et al., inpress; Harlay, unpublished). Visual inspection of sediments indicatedthat most of the PIC was related to bivalve shells (which mostprobably drove the bulk of benthic CaCO3 dissolution). This implies adecoupling of calcification by coccolithophores and the dissolution inthe sediments of CaCO3. Hence, PIC produced by coccolithophores iseither stored in the sediments or exported out of the system, butdoes not seem to be significantly dissolved in the sediments.
The water–sediment biogeochemical fluxes measured duringthis study are characteristic of a late-spring early-summer situationin the northern Bay of Biscay. At this period of the year, OMavailability in superficial sediments is probably the highest owingto deposition of OM produced during the spring bloom and duringsummer at the shelf edge sustained by inputs of nutrients fromenhanced vertical mixing by internal tides (Pingree and New, 1995).Consequently, benthic OM degradation rates are expected to bemaximal in the area during late-spring early-summer. In autumnand winter, benthic OM degradation rates are expected to be lower:reduced primary production (Joint et al., 2001) leads to lowerdeposition of OM, and stronger near-bed currents increase sedimentre-suspension (Thomsen and van Weering, 1998). As we showed,benthic CaCO3 dissolution is mainly metabolic driven (i.e., coupledto OM degradation), dissolution rates of CaCO3 in the sedimentsreported in this study are expected to correspond to yearly max-imum; they are likely to be lowest in autumn and winter.
Acknowledgments
We are grateful to the officers and crewmembers of theR.V. Belgica and to J. Backers, J.-P. De Blauw and G. Deschepper
(Unit of the North Sea Mathematical Models) for their supportduring the cruises, to N. Roevros and M.-V. Commarieu foranalytical assistance, and to M. Goni (Associate Editor) and oneanonymous reviewer for constructive comments on a previousversion of the manuscript. This work was carried out in the frameof Belgian Science Policy PEACE (Role of pelagic calcification andexport of carbonate production in climate change) project (SD/CS/03A), and contributes to the European Integrated Project Towardsan integrated marine carbon sources and sinks assessment(CARBOOCEAN, 511176). Radionuclide determinations werefunded by the Action Concertee Incitative of French ResearchMinistry ARTTE (Application of Radionuclides as Tracers of parti-culate Transfer in the Environment) program. AVB and BD areresearch associates at the Fonds National de la RechercheScientifique.
References
Alldredge, A.L., Passow, U., Logan, B.E., 1993. The abundance and significance of aclass of large, transparent organic particles in the ocean. Deep-Sea Res. I 40,1131–1140.
Alldredge, A.L., Gotschalk, C., Passow, U., Riebesell, U., 1995. Mass aggregation ofdiatom blooms: insights from a mesocosm study. Deep-Sea Res. II 42, 9–28.
Aller, R.C., De Master, D.J., 1984. Estimates of particle flux and reworking at thedeep-sea floor using 234Th/238U disequilibrium. Earth Planet. Sci. Lett. 67,308–318.
Aller, R.C., Cochran, J.K., 1976. 234Th/238U disequilibrium in near-shore sediment:particle reworking and diagenetic timescales. Earth Planet. Sci. Lett. 29, 37–50.
Balzer, W., Helder, W., Epping, E., Lohse, L., Otto, S., 1998. Benthic denitrificationand nitrogen cycling at the slope and rise of the N.W. European ContinentalMargin (Goban Spur). Prog. Oceanogr. 42, 111–126.
Berelson, W.M., Balch, W.M., Najjar, R., Feely, R.A., Sabine, C., Lee, K., 2007. Relatingestimates of CaCO3 production, export, and dissolution in the water column tomeasurements of CaCO3 rain into sediment traps and dissolution on the seafloor: a revised global carbonate budget. Global Biogeochem. Cycles 21(GB1024). doi:10.1029/2006GB002803.
Berner, R.A., 1980. A rate model for organic matter decomposition during bacterialsulfate reduction in marine sediments. In: Biogeochemistry of organic matterat the sediment–water interface, Marin. Colloq. Int. CNRS No. 293, pp. 35–44.
Bidle, K.D., Azam, F., 1999. Accelerated dissolution of diatom silica by naturalmarine bacterial assemblages. Nature 397, 508–512.
Boudreau, B.P., 1986. Mathematics of tracer mixing in sediments: I. Spatially-dependant, diffusive mixing. Am. J. Sci. 286, 161–198.
Boudreau, B.P., Canfield, D.E., Mucci, A., 1992. Early diagenesis in a marinesapropel, Mangrove Lake, Bermuda. Limnol. Oceanogr. 37, 1738–1753.
Boudreau, B.P., Huettel, M., Forster, S., Jahnke, R.A., McLachlan, A., Middelburg, J.J.,Nielsen, P., Sansone, F.J., Taghon, G.L., Van Raaphorst, W., Webster, I.T.,Weslawski, J.M., Wiberg, P., Sundby, B., 2001. Permeable marine sediments:overturning an old paradigm. Eos Trans. AGU 82 (133), 135–136.
Broecker, W.S., Peng, T.H., 1982. Tracers in the Sea. Eldigio Press Lamont DohertyGeological Observatory, Palisades, NY.
Burdige, D.J., 2006. Geochemistry of Marine Sediments. Princeton University Press.Cai, W.-J., Reimers, C., Shaw, T., 1995. Microelectrode studies of organic carbon
degradation and calcite dissolution at a California Continental rise site.Geochem. Cosmochim. Acta 59, 497–511.
Canfield, D.E., Raiswell, R., 1991. Carbonate dissolution and precipitation: itsrelevance to fossil preservation. In: Alisson, P.A., Briggs, D.E.G. (Eds.), Taph-onomy: Releasing the Data Locked in the Fossil Record: Topics in Geobiology,vol. 9. Plenum Press, New York, pp. 411–453.
Carruthers, J.N., 1963. History, sand waves and near-bed currents of La ChapelleBank. Nature 197, 942–946.
Channon, R.D., Hamilton, D., 1976. Wave and tidal current sorting of shelfsediments, southwest of England. Sedimentology 23, 17–42.
Cochran, J.K., Aller, R.C., 1979. Particle reworking in sediments from the New YorkBight Apex: evidence from 234Th/238U disequilibrium. Estuarine Coastal Mar.Sci. 9, 739–747.
Dean, W.E., 1974. Determination of carbonate and organic matter in calcareoussediments and sedimentary rocks by loss on ignition: comparison with othermethods. J. Sed. Petrol. 44, 242–248.
De La Rocha, C.L., Passow, U., 2007. Factors influencing the sinking of POC and theefficiency of the biological carbon pump. Deep-Sea Res. II 54, 639–658.
De Master, D.J., Mc Kee, B.A., Nittrouer, C.A., Brewster, D.C., Biscaye, P.E., 1985.Rates of sediment reworking at the HEBBLE site based on measurements of234Th, 137Cs and 210Pb. Mar. Geol. 66, 133–148.
Dickson, A.G., 1993. The measurement of sea water pH. Mar. Chem. 44, 131–142.Dickson, A.G., Millero, F.J., 1987. A comparison of the equilibrium constants for the
dissociation of carbonic acid in seawater media. Deep-Sea Res. 34, 1733–1743.Dickson, A.G., Sabine, C.L., Christian, J.R., 2007. Guide to best practices for ocean
CO2 measurements. PICES Special Publication 3, 191 pp.
K. Suykens et al. / Continental Shelf Research 31 (2011) 644–658656
Author's personal copy
Emerson, S., Bender, M.L., 1981. Carbon fluxes at the sediment–water interface:calcium carbonate preservation. J. Mar. Res. 39, 139–162.
Epping, E., van der Zee, C., Soetaert, K., Helder, W., 2002. On the oxidation andburial of organic carbon in sediments of the Iberian margin and Nazare Canyon(NE Atlantic). Progr. Oceanogr. 52, 399–431.
Flach, E., Heip, C., 1996. Seasonal variations in faunal distribution and activityacross the continental slope of the Goban Spur area (NE Atlantic). J. Sea Res.36, 203–215.
Froelich, P.N., Klinkhammer, G.P., Bender, M.L., Luedtke, N.A., Heath, G.R., Cullen,D., Dauphin, P., Hammond, D., Hartman, B., Maynard, V., 1979. Early oxidationof organic matter in pelagic sediments of the eastern equatorial Atlantic;suboxic diagenesis. Geochim. Cosmochim. Acta 43, 1075–1090.
Garcia-Soto, C., Fernandez, E., Pingree, R.D., Harbour, D.S., 1995. Evolution andstructure of a shelf coccolitophore bloom in the Western English Channel.J. Plankton Res. 17, 2011–2036.
Gazeau, F., Smith, S., Gentili, B., Frankignoulle, M., Gattuso, J.-P., 2004. TheEuropean coastal zone: characterization and first assessment of ecosystemmetabolism. Estuarine Coastal Shelf Sci. 60, 673–694.
Godoi, R.H.M., Aerts, K., Harlay, J., Kaegi, R., Chul-Un, R., Chou, L., Van Grieken, R.,2009. Organic surface coating on Coccolithophores—Emiliania huxleyi: its deter-mination and implication in the marine carbon cycle. Microchem. J. 91, 266–271.
Gran, G., 1952. Determination of the equivalence point in potentiometric titrationsof seawater with hydrochloric acid. Oceanol. Acta 5, 209–218.
Grasshoff, K., Ehrhardt, M., Kremling, K., 1983. Methods of Seawater Analysis.Verlag Chemie, Weinheim.
Hales, B., 2003. Respiration, dissolution, and the lysocline. Paleoceanography 18,1099. doi:10.1029/2003PA000915.
Hales, B., Emerson, S.R., 1996. Calcite dissolution in sediments of the Ontong-JavaPlateau: in situ measurements of porewater O2 and pH. Global Biogeochem.Cycles 5, 529–543.
Hales, B., Emerson, S.R., 1997. Calcite dissolution in sediments of the Ceara Rise: insitu measurements of porewater O2, pH and CO2(aq). Geochim. Cosmochim.Acta 61, 501–514.
Harlay, J., Borges, A.V., Zee, Van Der, Delille, C., Godoi, B., Schiettecatte, R.H.M.,Roevros, L.-S., Aerts, N., Lapernat, K., Rebreanu, P.-E., Groom, L., Daro, S., VanGrieken, M.-H., Chou, L., R., 2010. Biogeochemical study of a coccolithophoridbloom in the northern Bay of Biscay (NE Atlantic Ocean) in June 2004. Progr.Oceanogr. 86, 317–336.
Harlay, J., Chou, L., De Bodt, C., Van Oostende, N., Piontek, J., Suykens, K., Engel, A.,Sabbe, K., Groom, S., Delille, B., Borges, A.V. Biogeochemistry and carbon massbalance of a coccolithophore bloom in the northern Bay of Biscay (June 2006).Deep-Sea Res. I, in press, doi:10.1016/j.dsr.2010.11.005.
Harlay, J., De Bodt, C., Engel, A., Jansen, S., d’Hoop, Q., Piontek, J., Van Oostende, N.,Groom, S., Sabbe, K., Chou, L., 2009. In-situ abundance and size distribution oftransparent exopolymer particles (TEP) in a coccolithophorid bloom in thenorthern Bay of Biscay (June 2006). Deep-Sea Res. I 56, 1251–1265.
Heip, C.H.R., Duineveld, G., Flach, E., Graf, G., Helder, W., Herman, P.M.J., Lavaleye,M., Middelburg, J.J., Pfannkuche, O., Soetaert, K., Soltwedel, T., de Stigter, H.,Thomsen, L., Vanaverbeke, J., de Wilde, P., 2001. The role of benthic biota insedimentary metabolism and sediment–water exchange processes in theGoban Spur area (NE Atlantic). Deep-Sea Res. II 48, 3223–3243.
Heiri, O., Lotter, A.F., Lemcke, G., 2001. Loss on ignition as a method for estimatingorganic and carbonate content in sediments: reproductibility and compar-ibility of results. J. Paleolimnol. 25, 101–110.
Herman, P.M.J., Soetaert, K., Middelburg, J.J., Heip, C., Lohse, L., Epping, E., Helder,W., Antia, A.N., Peinert, R., 2001. The seafloor as the ultimate sediment trap:using sediment properties to constrain benthic–pelagic exchange processes atthe Goban Spur. Deep-Sea Res. II 48, 3245–3264.
Holligan, P.M., Fernandez, E., Aiken, J., Balch, W.M., Boyd, P.W., Burkill, P.H., Finch, M.,Groom, S.B., Malin, G., Muller, K., Purdie, D.A., Robinson, C., Trees, C.C., Turner,S.M., van der Wal, P., 1993. A biogeochemical study of the coccilithophore,Emiliania huxleyi, in the North Atlantic. Global Biogeochem. Cycles 7, 879–900.
Howard, P.J.A., Howard, D.M., 1990. Use of organic carbon and loss-on-ignition toestimate soil organic matter in different soil types and horizons. Biol. Fertil.Soils 9, 306–310.
Hutnance, J.M., Coelho, H., Griffiths, C.R., Knight, P.J., Rees, A.P., Sinha, B.,Vangriesheim, A., White, M., Chatwin, P.G., 2001. Physical structures, advec-tion and mixing in the region of Goban spur. Deep-Sea Res. II 48, 2979–3021.
Hydes, D.J., Le Gall, A.C., Miller, A.E.J., Brockmann, U., Raabe, T., Holley, S., Alvarez-Salgado, X., Antia, A., Balzer, W., Chou, L., Elskens, M., Helder, W., Joint, I.,Orren, M., 2001. Supply and demand of nutrients and dissolved organic matterat and across the NW European shelf break in relation to hydrography andbiogeochemical activity. Deep-Sea Res. II 48, 3023–3047.
Jahnke, R.A., Jahnke, D.B., 2000. Rates of C, N, P and Si recycling and denitrificationat the US Mid-Atlantic continental slope depocenter. Deep Sea Res. I 47,1405–1428.
Jahnke, R.A., Jahnke, D.B., 2004. Calcium carbonate dissolution in deep-seasediments: implications of bottom water saturation state and sedimentcomposition. Geochem. Cosmochim. Acta 68, 47–59.
Jahnke, R.A., Craven, D.B., McCorkle, D.C., Reimers, C.E., 1997. CaCO3 dissolution inCalifornia continental margin sediments: the influence of organic matterremineralization. Geochem. Cosmochim. Acta 61, 3587–3604.
Joint, I., Wollast, R., Chou, L., Batten, S., Elskens, M., Edwards, E., Hirst, A., Brurkill,P., Groom, S., Gibb, S., Miller, A., Hydes, D., Dehairs, F., Antia, A., Barlow, R.,Rees, A., Pomroy, A., Brockmann, U., Cummings, D., Lampitt, R., Loijens, M.,Mantoura, F., Miller, P., Raabe, T., Alvarez-Salgado, X., Stelfox, C., Woolfenden,
J., 2001. Pelagic production at the Celtic Sea shelf break. Deep-Sea Res. II 48,3049–3081.
Key, R.M., Kozyr, A., Sabine, C.L., Lee, K., Wanninkhof, R., Bullister, J.L., Feely, R.A.,Millero, F.J., Mordy, C., Peng, T.-H., 2004. A global ocean carbon climatology:results from Global Data Analysis Project (GLODAP). Global Biogeochem.Cycles 18 (GB4031). doi:10.1029/2004GB002247.
Knap, A.H., Michaels, A.E., Close, A., Ducklow, H.W., Dickson, A.G., 1996. Protocolsfor the Joint Global Ocean Flux Study (JGOFS) core measurements. JGOFSReports, 19, Bergen, Norway, UNESCO.
Koide, M., Bruland, K.W., Goldberg, E.D., 1973. Th-228/Th-232 and Pb-210geochronologies in marine and lake sediments. Geochim. Cosmochim. Acta37, 1171–1183.
Lampitt, R.S., 1985. Evidence for the seasonal deposition of detritus to the deep-sea floor [Porcupine Bight, NE Atlantic] and its subsequent resuspension.Deep-Sea Res. 32, 885–897.
Leckie, D.A., 1988. Wave-formed, coarse-graines ripples and their relationship tohummocky cross-stratification. J. Sed. Petrol. 58, 607–622.
Lewis, E., Wallace, D.W.R., 1998. CO2SYS-Program developed for the CO2 systemcalculations. Report ORNL/CDIAC-105, Carbon Dioxide Information AnalysisCenter.
Lohse, L., Helder, W., Epping, E.H.G., Balzer, W., 1998. Recycling of organic matteralong a shelf-slope transect across the N.W. European Continental Margin(Goban Spur). Progr. Oceanogr. 42, 77–110.
Martin, W.R., Sayles, F.L., 1996. CaCO3 dissolution in sediments of the Ceara Rise,western equatorial Atlantic. Geochim. Cosmochim. Acta 60, 243–263.
Mehrbach, C., Culberson, C.H., Hawley, J.E., Pytkowicz, R.M., 1973. Measurement ofthe apparent dissociation constants of carbonic acid in seawater at atmo-spheric pressure. Limnol. Oceanogr. 18, 897.
Michalopoulos, P., Aller, R.C., 2004. Early diagenesis of biogenic silica in theAmazon delta: alteration, authigenic clay formation, and storage. Geochim.Cosmochim. Acta 68 (5), 1061–1085.
Middelburg, J.J., Soetaert, K., Herman, P.M.J., Heip, C.H.R., 1996. Denitrificationin marine sediments: a model study. Global Biogeochem. Cycles 10,661–673.
Milliman, J.D., 1993. Production and accumulation of calcium carbonate in theocean: budget of a nonsteady state. Global Biogeochem. Cycles 7, 927–957.
Mucci, A., 1983. The solubility of calcite and aragonite in seawater at varioussalinities, temperatures, and one atmosphere total pressure. Am. J. Sci. 283,781–799.
Nelson, D.M., Treguer, P., Brzezinski, M.A., Leyneart, A., Queguiner, B., 1995.Production and dissolution of biogenic silica in the ocean: revised globalestimates, comparison with regional date and relationship to biogenic sedi-mentation. Global Biogeochem. Cycles 9, 359–372.
Passow, U., 2002. Transparent exopolymer particles (TEP) in aquatic environ-ments. Prog. Oceanogr. 55, 287–333.
Passow, U., Alldredge, A.L., 1995. A dye-binding assay for the spectrophotometricmeasurement of transparent exopolymer particles (TEP). Limnol. Oceanogr.40, 1326–1335.
Pingree, R.D., Le Cann, B., 1989. Celtic and Armorican slope and shelf residualcurrents. Prog. Oceanogr. 23, 303–339.
Pingree, R.D., New, A.L., 1995. Structure, seasonal development and sunglintspatial coherence of the internal tide on the Celtic and Armorican shelvesand in the Bay of Biscay. Deep-Sea Res. I 42, 245–284.
Pingree, R.D., Le Cann, B., 1990. Structure, strength and seasonality of the slopecurrents in the Bay of Biscay region. J. Mar. Biol. Assoc. UK 70, 857–885.
Pingree, R.D., Garcia-Soto, C., Sinha, B., 1999. Position and structure of theSubtropical/Azores Front region from combined Lagrangian and remote sen-sing (IR/altimeter/SeaWiFS) measurements. J. Mar. Biol. Assoc. UK 79,769–792.
Rabouille, C., Gaillard, J.-F., Treguer, P., Vincendeau, M.-A., 1997. Biogenic silicarecycling in surficial sediments across the Polar Front of the Southern Ocean(Indian Sector). Deep-Sea Res. II 44, 1151–1176.
Redfield, A.C., Ketchum, B.H., Richards, F.A., 1963. The influence of organisms onthe composition of sea-water. In: Hill, M.N. (Ed.), The Sea, vol. 2. TheComposition of Seawater. Wiley, New York, pp. 26–87.
Reimers, C.E., Stecher III, H.A., Taghon, G.L., Fuller, C.M., Huettel, M., Rusch, A.,Ryckelynck, N., Wild, C., 2004. In situ measurements of advective solutetransport in permeable shelf sands. Cont. Shelf Res. 24, 183–201.
Reynaud, J.-Y., Tessier, B., Berne, S., Chamley, H., Debatist, M., 1999. Tide and wavedynamics on a sand bank from the deep shelf of the Western Channelapproaches. Mar. Geol. 161, 339–359.
Riley, J.P., Tongudai, M., 1967. The major cation/chlorinity ratios in sea water.Chem. Geol. 2, 263–269.
Robbins, J.A., Edgington, D.N., 1975. Determination of recent sedimentation ratesin Lake Michigan using 210Pb and 137Cs. Geochim. Cosmochim. Acta 39,285–304.
Rusch, A., Huettel, M., Wild, C., Reimers, C.E., 2006. Benthic oxygen consumptionand organic matter turnover in organic-poor, permeable shelf sands. Aquat.Geochem. 12, 1–19.
Santisteban, J.I., Mediavilla, R., Lopez-Pamo, E., Dabrio, C.J., Zapata, M.B.R., Garcıa,M.J.G., Castano, S., Martınez-Alfaro, P.E., 2004. Loss in ignition: a qualitative orquantitative method for organic matter and carbonate mineral content insediments? J. Paleolimnol. 32, 287–299.
Schmidt, S., van Weering, T.C.E., Reyss, J.-L., van Beek, P., 2002a. Seasonaldeposition and reworking at the sediment–water interface on the north-western Iberian Margin. Progr. Oceanogr. 52, 331–348.
K. Suykens et al. / Continental Shelf Research 31 (2011) 644–658 657
Author's personal copy
Schmidt, S., Andersen, V., Belviso, S., Marty, J.-C., 2002b. Strong seasonality inparticle dynamics of north–western Mediterranean surface waters as revealedby 234Th/238U. Deep-Sea Res. I 49, 1507–1518.
Schmidt, S., Gonzalez, J.-L., Lecroart, P., Tronczynski, J., Billy, I., Jouanneau, J.-M.,2007. Bioturbation at the water–sediment interface of the Thau Lagoon:impact of shellfish farming. Aquat. Living Resour. 20, 163–169.
Schmidt, S., Howa, H., Mouret, A., Lombard, F., Anschutz, P., Labeyrie, L., 2009.Particle fluxes and recent sediment accumulation on the Aquitanian margin ofBay of Biscay. Cont. Shelf Res. 29, 1044–1052.
Sharples, J., Tweddle, J.F., Green, J.A.M., Palmer, M.R., Kim, Y.-N., Hickman, A.E.,Holligan, P.M., Moore, C.M., Rippeth, T.P., Simpson, J.H., Krivtsov, V., 2007.Spring-neap modulation of internal tide mixing and vertical nitrate fluxes at ashelf edge in summer. Limnol. Oceanogr. 52, 1735–1747.
Sharples, J., Moore, C.M., Hickman, A.E., Holligan, P.M., Tweddle, J.F., Palmer, M.R.,Simpson, J.H., 2009. Internal tidal mixing as a control on continental marginecosystems. Geophys. Res. Lett. 36, L23603. doi:10.1029/2009GL040683.
Silverberg, N., Sundby, B., Mucci, A., Zhong, S., Arakaki, T., Hall, P., Landen, A.,Tengberg, A., 2000. Remineralization of organic carbon in eastern Canadiancontinental margin sediments. Deep-Sea Res. II 47, 699–731.
Smith, C.R., Hoover, D.J., Doan, S.E., Pope, R.H., De Master, D.J., Dobbs, F.C., Altabet,M.A., 1996. Phytodetritus at the abyssal seafloor across 101 of latitude in thecentral equatorial Pacific. Deep-Sea Res. 43, 1309–1338.
Smith, S.V., Key, G.S., 1975. Carbon dioxide and metabolism in marine environ-ments. Limnol. Oceanogr. 20, 493–495.
Soetaert, K., Herman, P.M.J., Middelburg, J.J., 1996. A model of early diagenetic processesfrom the shelf to abyssal depths. Geochim. Cosmochim. Acta 60, 1019–1040.
Sutherland, R.A., 1998. Loss-on-ignition estimates of organic matter and relation-ships to organic carbon in fluvial bed sediments. Hydrobiologia 389, 153–167.
Suykens, K., Delille, B., Chou, L., De Bodt, C., Harlay, J., Borges, A.V., 2010. Dissolvedinorganic carbon dynamics and air-sea carbon dioxide fluxes during cocco-lithophore blooms in the Northwest European continental margin (northernBay of Biscay). Global Biogeochem. Cycles 24 (GB3022). doi:10.1029/2009GB003730.
Thamdrup, B., Canfield, D.E., 1996. Pathways of carbon oxidation in continentalmargin sediments off central Chile. Limnol. Oceanogr. 41, 1629–1650.
Thomsen, L., van Weering, T.C.E., 1998. Spatial and temporal variability ofparticulate matter in the benthic boundary layer at the N.W. EuropeanContinental Margin (Goban Spur). Prog. Oceanogr. 42, 61–76.
van Weering, T.C.E., De Stigter, H.C., Balzer, W., Epping, E.H.G., Graf, G., Hall, I.R.,Helder, W., Khripounoff, A., Lohse, L., McCave, I.N., Thomson, L., Vangriesheim,A., 2001. Benthic dynamics and carbon fluxes on the NW European continentalmargin. Deep-Sea Res. II 48, 3191–3221.
Walsh, J.J., 1991. Importance of continental margins in the marine biogeochemicalcycling of carbon and nitrogen. Nature 350, 53–55.
Wollast, R., Chou, L., 2001. The carbon cycle at the ocean margin in the northernGulf of Biscay. Deep-Sea Res. II 48, 3265–3293.
Yentsch, C.S., Menzel, D.W., 1963. A method for determination of chlorophyll andphaeophytin by fluorescence. Deep-Sea Res. 10, 22l–231.
Zaragosi, S., Eynaud, F., Pujol, C., Auret, G.A., Turon, J.-L., Garlan, T., 2001. Initiationof the European deglaciation as recorded in the northwestern Bay of Biscayslope environments (Meriadzek Terrace and Trevelyan Escarpment): a multi-proxy approach. Earth Planet. Sci. Lett. 188, 493–507.
K. Suykens et al. / Continental Shelf Research 31 (2011) 644–658658