Impact of coral spawning on the biogeochemistry of a Hawaiian reef
Author's personal copy
Biogeochemistry and carbon mass balance of a coccolithophore bloom in thenorthern Bay of Biscay (June 2006)
J. Harlay a,b,n, L. Chou a, C. De Bodt a, N. Van Oostende c, J. Piontek d, K. Suykens b, A. Engel d, K. Sabbe c,S. Groom e, B. Delille b, A.V. Borges b
a Laboratoire d’Oceanographie Chimique et Geochimie des Eaux, Universite Libre de Bruxelles, Campus de la Plaine, CP208, boulevard du Triomphe, B-1050 Brussels, Belgiumb Chemical Oceanography Unit, Universite de Li�ege, Institut de Physique (B5), B-4000 Sart Tilman, Belgiumc Protistology and Aquatic Ecology, Gent University, Krijgslaan 281-S8, B-9000 Gent, Belgiumd HGF Young Investigators Group, Global change and the future marine carbon cycle, Alfred Wegener Institute, Am Handelshafen 12, D-27570 Bremerhaven, Germanye Remote Sensing Group, Plymouth Marine Laboratory, Prospect Place, West Hoe, Plymouth PL1 3DH, United Kingdom
a r t i c l e i n f o
Article history:
Received 20 August 2010
Received in revised form
12 November 2010
Accepted 18 November 2010Available online 24 November 2010
Keywords:
Bay of Biscay
Coccolithophores
Emiliania huxleyi
Primary production
Calcification
Dark community respiration
CO2 fluxes
a b s t r a c t
Primary production (PP), calcification (CAL), bacterial production (BP) and dark community respiration
(DCR) were measured along with a set of various biogeochemical variables, in early June 2006, at several
stations at the shelf break of the northern Bay of Biscay. The cruise was carried out after the main spring
diatom bloom that, based on the analysis of a time-series of remotely sensed chlorophyll-a (Chl-a), peaked
in mid-April. Remotely sensed sea surface temperature (SST) indicated the occurrence of enhanced
vertical mixing (due to internal tides) at the continental slope, while adjacent waters on the continental
shelf were stratified, as confirmed by vertical profiles of temperature acquired during the cruise. The
surface layer of the stratified water masses (on the continental shelf) was depleted of inorganic nutrients.
Dissolved silicate (DSi) levels probably did not allow significant diatom development. We hypothesize
that mixing at the continental slope allowed the injection of inorganic nutrients that triggered the
blooming of mixed phytoplanktonic communities dominated by coccolithophores (Emiliania huxleyi) that
were favoured with regards to diatoms due to the low DSi levels. Based on this conceptual frame, we used
an indicator of vertical stratification to classify the different sampled stations, and to reconstruct the
possible evolution of the bloom from the onset at the continental slope (triggered by vertical mixing)
through its development as the water mass was advected on-shelf and stratified. We also established a
carbon mass balance at each station by integrating in the photic layer PP, CAL and DCR. This allowed
computation at each station of the contribution of PP, CAL and DCR to CO2 fluxes in the photic layer, and
how they changed from one station to another along the sequence of bloom development (as traced by the
stratification indicator). This also showed a shift from net autotrophy to net heterotrophy as the water
mass aged (stratified), and suggested the importance of extracellular production of carbon to sustain the
bacterial demand in the photic and aphotic layers.
& 2010 Elsevier Ltd. All rights reserved.
1. Introduction
During coccolithophore blooms, carbon (C, all abbreviations aredefined in Table 1) cycling in the photic zone is driven by theproduction and degradation of organic matter (primary production(PP) and community respiration), and the production and dissolu-tion of biogenic calcite (CaCO3). Both processes transfer C to depthand impact on the speciation of dissolved inorganic C (DIC) and CO2
flux across the air–sea interface (Purdie and Finch, 1994;Buitenhuis et al., 1996, 2001; Crawford and Purdie, 1997;
Frankignoulle and Borges, 2001; Suykens et al., 2010a). Changesof C fluxes of pelagic calcifiers under ocean acidification (e.g., Orret al., 2005), namely a decrease in calcification rates, could providea negative feedback in response to increasing atmospheric CO2 assuggested by controlled experiments either in cultures (e.g.,Riebesell et al., 2000; Sciandra et al., 2003; De Bodt et al., 2008,2010) or mesocosms (e.g., Delille et al., 2005; Riebesell et al., 2007).Further, due to their relatively large contribution to the phyto-planktonic community, and their complex life cycle which alter-nates between naked and calcified forms, the effect ofcoccolithophores on CO2 fluxes is variable during bloom develop-ment, altering the ratio of calcification (CAL) to PP (Billard andInouye, 2004). Understanding and quantifying the C cyclingassociated with coccolithophore blooms under natural conditionsis needed to correctly parameterize and validate biogeochemical
Contents lists available at ScienceDirect
journal homepage: www.elsevier.com/locate/dsri
Deep-Sea Research I
0967-0637/$ - see front matter & 2010 Elsevier Ltd. All rights reserved.
doi:10.1016/j.dsr.2010.11.005
n Corresponding author at: Chemical Oceanography Unit, Universite de Li�ege,
Institut de Physique (B5), B-4000 Sart Tilman, Belgium.
E-mail address: [email protected] (J. Harlay).
Deep-Sea Research I 58 (2011) 111–127

Author's personal copy
models that aim at predicting feedbacks related to ocean acidifica-tion and incorporate knowledge obtained from perturbationlaboratory experiments.
Coccolithophore blooms have an identifiable spectral signature(reflectance) on the 555 nm band from remote sensing (Balch et al.,2005, 2007; Balch and Utgoff, 2009) and have frequently beenobserved in the English Channel (GREPMA, 1988; Garcia-Soto et al.,1995), the Celtic Sea and the Bay of Biscay (Holligan et al., 1983;Garcia-Soto and Pingree, 2009; Harlay et al., 2010; Suykens et al.,2010a) from high reflectance (HR) patches on satellite images.These HR patches have been attributed to blooms of the cocco-lithophore Emiliania huxleyi, which can reach concentrations above108 liths L�1 (Holligan et al., 1993).
We carried out a survey at the continental margin of thenorthern Bay of Biscay in early June 2006 when a HR patchassociated with a coccolithophore bloom was observed. We reportphysico-chemical and biogeochemical parameters (temperature,nutrients, chlorophyll-a (Chl-a), and oxygen saturation (%O2)),elemental composition of suspended particulate matter as wellas community metabolic rates like the daily rates of CAL, PP,bacterial production (BP), and dark community respiration (DCR).Remotely sensed images and the output of a physical model wereused to analyse the seasonal phytoplankton dynamics. Finally,based on community metabolic rate measurements, we computeand discuss a C mass balance for the photic zone.
2. Materials and methods
2.1. Study site
The study area is at the shelf break of the Celtic Sea in thenorthern Bay of Biscay, located in the eastern North Atlantic Ocean(Fig. 1). The topography of the shelf-edge of the northern Bay ofBiscay defines the particular physical conditions at the La ChapelleBank and the Meriadzek Terrace: combined to strong tidal currents,
Table 1List and definition of abbreviations used in text.
Abbreviation Definition
%O2 Oxygen saturation
AVHRR Advanced very high resolution radiometer
BOD Biological oxygen demand
BP Bacterial production
C Carbon
CaCO3 Calcium carbonate
CAL Calcification
Chl-a Chlorophyll-a
CO2 Carbon dioxide
CTD Conductivity-temperature-depth
DCR Dark community respiration
DIC Dissolved inorganic carbon
DSi Dissolved silicate concentration
GPP Gross primary production
HPLC High performance liquid chromatography
HR High reflectance
Kd Diffuse attenuation coefficient
Lwn(555) Normalized water-leaving radiance at 555 nm
MLD Mixed layer depth
MODIS Moderate-resolution imaging spectrometer
NMCF Net metabolic carbon flux
NCP Net community production
O2 Oxygen
PAR Photoysynthetically active radiation
pCO2 Partial pressure of carbon dioxide
PIC Particulate inorganic carbon
PO4 Phosphate concentration
POC Particulate organic carbon
PP Primary production
PPd Dissolved primary production
PPtot Total primary production
SeaWIFs Sea-viewing Wide Field-of-view Sensor
SST Sea surface temperature
TCA Trichloroacetic acid
TEP Transparent exopolymer particles
TEP-C Transparent exopolymer particles carbon concentration
TPC Total particulate carbon
UML Upper mixed layer
Fig. 1. Map of the northern Bay of Biscay showing bathymetry (Smith and Sandwell, 1997), the location of the stations and surface currents (Pingree and Le Cann, 1989;
Pingree, 1993; Pingree et al., 1999 and Huthnance et al., 2001). The stations 1 and 4 were revisited after 9 and 6 days, respectively, and referred to as 1bis and 4bis in the text.
J. Harlay et al. / Deep-Sea Research I 58 (2011) 111–127112
Author's personal copy
the steep slope enhances shear stress and generates internal tidesand turbulence which favours vertical mixing (Pingree and New,1995). These hydrographic properties are evidenced by the dis-tribution of sea surface temperature (SST) on satellite images,where a cold patch of water streches during spring and summer,when sufficient stratification has developed, between the 200 mand the 2000 m isobaths (Wollast and Chou, 2001). The verticalmixing occurs by pulses at the shelf break and erodes the seasonalthermocline leading to the upward transport of deeper water,sustaining biological activity during spring and summer by sup-plying nutrients to the photic zone (Pingree et al., 1986; Joint et al.,2001; Wollast and Chou, 2001; Sharples et al., 2007, 2009). Sharpleset al. (2007) showed that during spring tides, enough nitrate pulsesare released to the photic zone to sustain new production ofphytoplankton and to induce shifts in the plankton community on afortnighly basis (spring and neap tide oscillations). The use ofphytoplankton pigments used as biomarkers indicates that themost abundant taxa are prymnesiophytes, among which thecoccolithophore E. huxleyi, with two short blooms of diatoms inspring and fall (Joint et al., 2001). Along-slope currents north-western winds contribute to the advection of surface waters andgeneral cross-slope water motion (Huthnance et al., 2001; Sharpleset al., 2007).
2.2. Sampling strategy
Samples were collected at the continental margin between 31May and 9 June 2006 (Fig. 1; Table 2). The cruise was split into twolegs (first leg: 31st May to 3rd June; second leg: 5th June to 9thJune), during which two stations (1 and 4) were revisited after 9 and6 days, respectively, and named 1bis and 4bis. The stations werelocated over the continental shelf at depthso180 m (stations 1, 4, 7and 8) and along the shelf break and slope at depths of �600 m(stations 2 and 5) and �1600 m (stations 3 and 6).
2.3. Vertical hydrography and light attenuation
A Seabird CTD (SBE21), with a rosette sampler of 12 Niskin bottles(10 L), was used to determine vertical profiles of temperature andsalinity, and to collect seawater for chemical and biological analyses.
At each station, water was collected at dawn at 3, 20, 40, 60, 80, 100and 150 m depth. Vertical profiles of in situ photosynthetic activeradiation (PAR) were acquired in the water column with a SeabirdSBE19 equipped with a LiCor Li-192-SA PAR sensor, around noon foreach station. From the PAR profile, the downwelling diffuse attenua-tion coefficient Kd (m�1) and the photic depth (corresponding to 1% ofthe incoming PAR) were determined.
2.4. Inorganic nutrients
Samples were filtered through 0.4 mm Nuclepore filters andpreserved at �20 1C for total phosphate (PO4) and 4 1C fordissolved silicate (DSi) until analysis. Seawater PO4 and DSiconcentrations were measured colorimetrically with the molyb-date/ascorbic acid method (Grasshoff et al., 1983).
2.5. Photosynthetic pigments concentration
2.5.1. Fluorometric determination of Chl-a
Chl-a concentration was determined fluorometrically accordingto Yentsch and Menzel (1963): 250 ml of seawater was filteredthrough a glass fibre filter (47 mm Whatman GF/F) which was thenwrapped in aluminium foil and stored on board at �20 1C beforeanalysis. Extraction of pigments was carried out overnight at�20 1C in the dark, in 10 ml 90% acetone and centrifuged for10 min at 5000 rpm before the fluorescence measurement with aShimatzu RF-1501 spectrofluorophotometer.
2.5.2. High performance liquid chromatographic (HPLC)
determination of pigments
About 500–3500 ml of seawater was filtered through glass fibrefilters (47 mm Whatman GF/F) that were subsequently stored inliquid nitrogen onboard the ship and during transport. Extraction ofthe pigments was performed in 90% acetone. The frozen filters werecut into small pieces (several mm�1 cm) and sonicated (pulses)for 30 s (50 W) in a centrifuge tube with 3.5 ml 90% acetone. Theextracts were cleared from debris by filtering through a 0.2 mmTeflon syringe filter after centrifuging at �5 1C for 4 min at 700g.
The HPLC method, based on Wright and Jeffrey (1997), allowedseparation of the different pigments that were used to estimate the
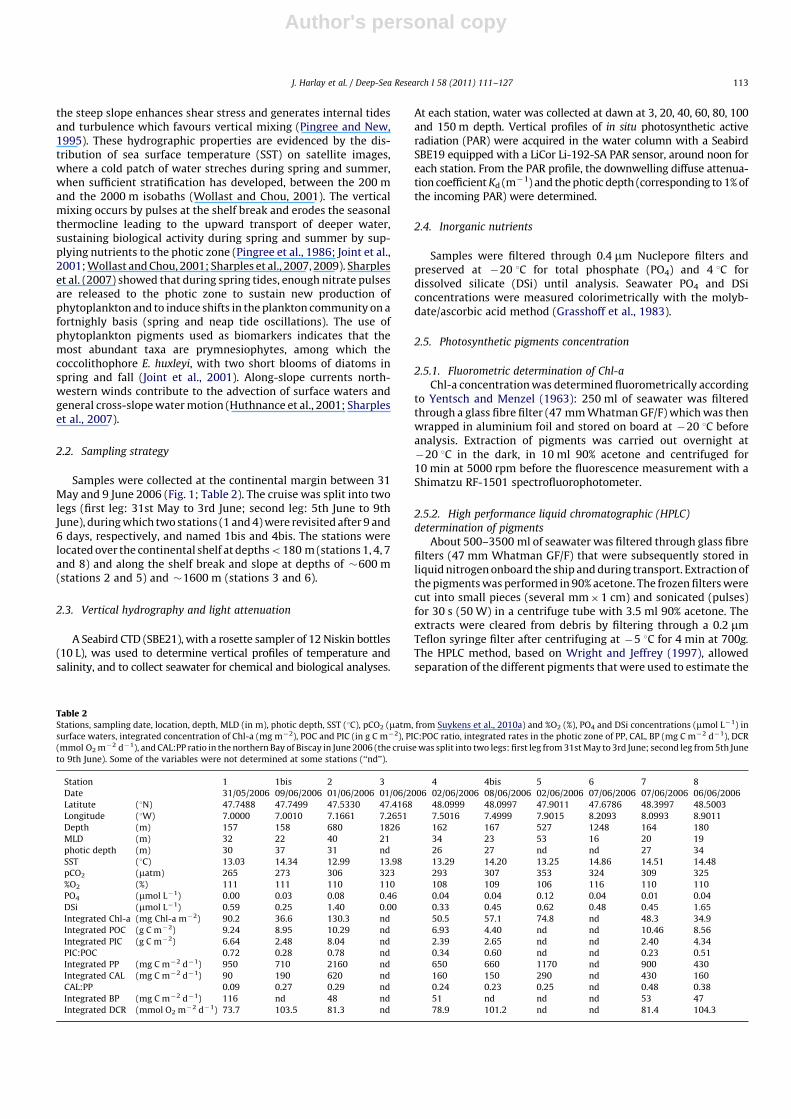
Table 2Stations, sampling date, location, depth, MLD (in m), photic depth, SST (1C), pCO2 (matm, from Suykens et al., 2010a) and %O2 (%), PO4 and DSi concentrations (mmol L�1) in
surface waters, integrated concentration of Chl-a (mg m�2), POC and PIC (in g C m�2), PIC:POC ratio, integrated rates in the photic zone of PP, CAL, BP (mg C m�2 d�1), DCR
(mmol O2 m�2 d�1), and CAL:PP ratio in the northern Bay of Biscay in June 2006 (the cruise was split into two legs: first leg from 31st May to 3rd June; second leg from 5th June
to 9th June). Some of the variables were not determined at some stations (‘‘nd’’).
Station 1 1bis 2 3 4 4bis 5 6 7 8
Date 31/05/2006 09/06/2006 01/06/2006 01/06/2006 02/06/2006 08/06/2006 02/06/2006 07/06/2006 07/06/2006 06/06/2006
Latitute (1N) 47.7488 47.7499 47.5330 47.4168 48.0999 48.0997 47.9011 47.6786 48.3997 48.5003
Longitude (1W) 7.0000 7.0010 7.1661 7.2651 7.5016 7.4999 7.9015 8.2093 8.0993 8.9011
Depth (m) 157 158 680 1826 162 167 527 1248 164 180
MLD (m) 32 22 40 21 34 23 53 16 20 19
photic depth (m) 30 37 31 nd 26 27 nd nd 27 34
SST (1C) 13.03 14.34 12.99 13.98 13.29 14.20 13.25 14.86 14.51 14.48
pCO2 (matm) 265 273 306 323 293 307 353 324 309 325
%O2 (%) 111 111 110 110 108 109 106 116 110 110
PO4 (mmol L�1) 0.00 0.03 0.08 0.46 0.04 0.04 0.12 0.04 0.01 0.04
DSi (mmol L�1) 0.59 0.25 1.40 0.00 0.33 0.45 0.62 0.48 0.45 1.65
Integrated Chl-a (mg Chl-a m�2) 90.2 36.6 130.3 nd 50.5 57.1 74.8 nd 48.3 34.9
Integrated POC (g C m�2) 9.24 8.95 10.29 nd 6.93 4.40 nd nd 10.46 8.56
Integrated PIC (g C m�2) 6.64 2.48 8.04 nd 2.39 2.65 nd nd 2.40 4.34
PIC:POC 0.72 0.28 0.78 nd 0.34 0.60 nd nd 0.23 0.51
Integrated PP (mg C m�2 d�1) 950 710 2160 nd 650 660 1170 nd 900 430
Integrated CAL (mg C m�2 d�1) 90 190 620 nd 160 150 290 nd 430 160
CAL:PP 0.09 0.27 0.29 nd 0.24 0.23 0.25 nd 0.48 0.38
Integrated BP (mg C m�2 d�1) 116 nd 48 nd 51 nd nd nd 53 47
Integrated DCR (mmol O2 m�2 d�1) 73.7 103.5 81.3 nd 78.9 101.2 nd nd 81.4 104.3
J. Harlay et al. / Deep-Sea Research I 58 (2011) 111–127 113
Author's personal copy
taxonomic composition of the phytoplankton community,expressed in % of total Chl-a for each phytoplankton group,according to the Bayesian Compositional Estimator (Van denMeersche et al., 2008). Standard pigment mixtures were used toallow identification and quantification of the detected pigmentpeaks in the chromatogram.
Fluorometric Chl-a was sampled with a higher vertical resolu-tion than HPLC Chl-a; hence, hereafter, only the fluorometric Chl-aare shown and discussed, while the HPLC pigment data are used todiscuss the taxonomic composition of phytoplankton.
2.6. Particulate organic (POC) and inorganic (PIC) carbon
Seawater (200–2000 ml) was filtered onto duplicate precom-busted (4 h, 500 1C) 25 mm Whatman GF/F filters. The sampleswere stored at –20 1C until analysis. Within three months after thecruise, the filters were dried overnight at 50 1C. One set of theduplicate filters was acidified overnight under HCl fumes at roomtemperature in order to remove inorganic carbon. The filtered area
was stamped out with a calibrated punch in order to remove theexternal ring of the filter. Filters were packed in solvent-rinsed tinsample boats for analysis. The POC and the total particulate carbon(TPC) concentrations in the suspended matter were determinedsequentially with a Fisons NA-1500 CHN microanalyzer. The PICconcentration was calculated by difference between TPC and POC.Five standards (STSD2, certified reference stream sediment fromthe Geological survey of Canada) and four blanks were used toderive the calibration with least-squares regression.
2.7. Processes measurements
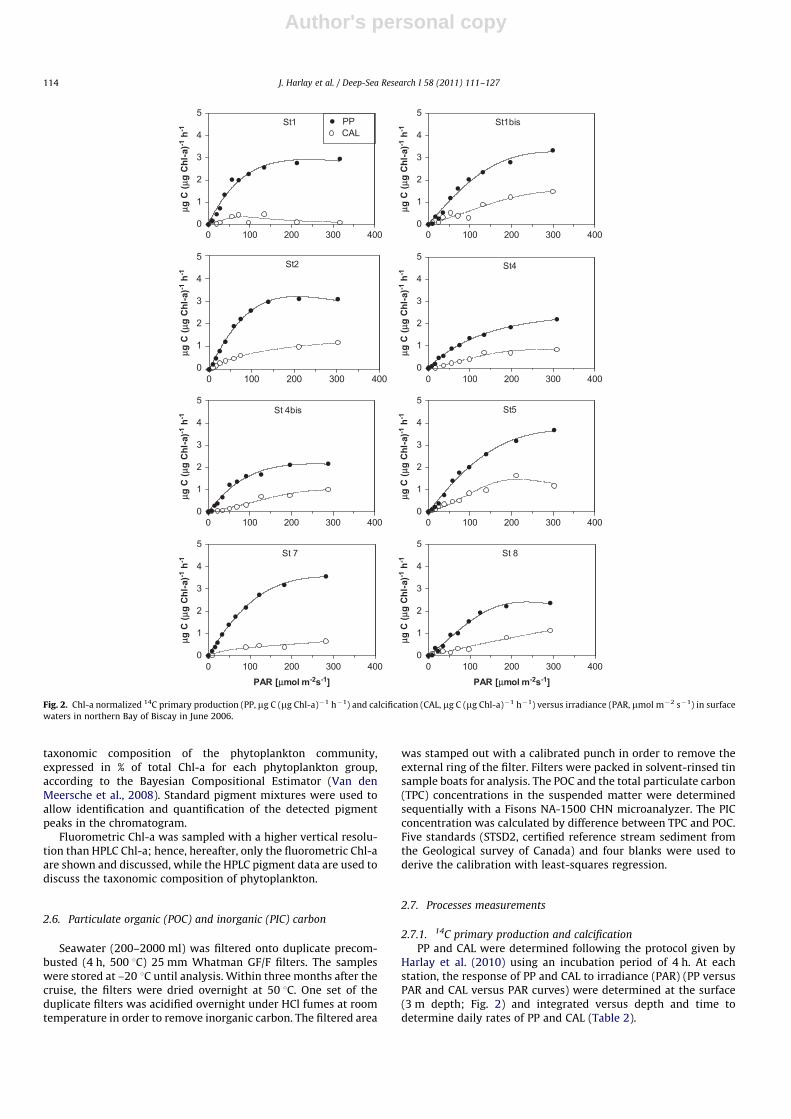
2.7.1. 14C primary production and calcification
PP and CAL were determined following the protocol given byHarlay et al. (2010) using an incubation period of 4 h. At eachstation, the response of PP and CAL to irradiance (PAR) (PP versusPAR and CAL versus PAR curves) were determined at the surface(3 m depth; Fig. 2) and integrated versus depth and time todetermine daily rates of PP and CAL (Table 2).
St1
0 100 200 300 4000
1
2
3
4
5PPCAL
μg C
(μg
Chl
-a)-1
h-1
μg C
(μg
Chl
-a)-1
h-1
μg C
(μg
Chl
-a)-1
h-1
μg C
(μg
Chl
-a)-1
h-1
μg C
(μg
Chl
-a)-1
h-1
μg C
(μg
Chl
-a)-1
h-1
μg C
(μg
Chl
-a)-1
h-1
μg C
(μg
Chl
-a)-1
h-1
St1bis
0 100 200 300 4000
1
2
3
4
5
St2
0 100 200 300 4000
1
2
3
4
5St4
0 100 200 300 4000
1
2
3
4
5
St 4bis
0 100 200 300 4000
1
2
3
4
5St5
0 100 200 300 4000
1
2
3
4
5
St 7
0 100 200 300 4000
1
2
3
4
5St 8
0 100 200 300 4000
1
2
3
4
5
PAR [μmol m-2s-1] PAR [μmol m-2s-1]
Fig. 2. Chl-a normalized 14C primary production (PP, mg C (mg Chl-a)�1 h�1) and calcification (CAL, mg C (mg Chl-a)�1 h�1) versus irradiance (PAR, mmol m�2 s�1) in surface
waters in northern Bay of Biscay in June 2006.
J. Harlay et al. / Deep-Sea Research I 58 (2011) 111–127114

Author's personal copy
2.7.2. Bacterial production
Bacterial production was determined by the incorporation of3[H]-thymidine. Samples (10–20 ml) were incubated in duplicatewith 10 nM of 3[H]-thymidine for 90 min in the dark close to in situ
temperature. After incubation, samples were poisoned with 2%formalin and filtered on 0.2 mm polycarbonate filters. According toFuhrman and Azam (1982), samples were rinsed with ice-cold 5%TCA and radio-assayed by liquid scintillation counting with UltimaGold AB as scintillation cocktail. To calculate bacterial biomassproduction from thymidine incorporation, a conversion factor of1.74�1018 cells mol�1 incorporated thymidine with an averagecell volume of 0.03 mm3 was assumed (Kirchman, 1992). Further-more, a carbon conversion factor of 0.3�10�6 mg C mm�3 cell�1
was used (Fuhrman and Azam, 1982).
2.8. Pelagic dark community respiration (DCR) and dissolved oxygen
saturation (%O2)
Water samples were collected from Niskin bottles in biologicaloxygen demand (BOD) bottles. Concentration of dissolved O2 wasmeasured by automated Winkler titration with potentiometricend-point detection using a Metrohm redox electrode (6.0451.100)and Metrohm titrator (Dosimat 625). Reagents and standardiza-tions were similar to those described by Knap et al. (1996). Thesaturation concentration of seawater with respect to oxygen wascomputed with the algorithm given by Benson and Krause (1984).
DCR measurement was determined on 3 replicates (60 ml BODbottles) fixed immediately after collection with the Winklerreagents while 3 other replicates were incubated for 24 h in thedark, cooled with running seawater pumped from 2.5 m depth.Dissolved O2 in the water column was determined on 50 mlsubsamples from a 300 ml BOD bottle.
2.9. Integration of the data
As a way of reconstructing the bloom sequence and successionof the mixed phytoplankton community, and showing how thiscreates an ecological niche favourable for coccolithophores, avail-able biogeochemical parameters and processes were plottedagainst the difference of seawater density between 100 and 3 m
(Dr100 m–3 m). The Dr100 m–3 m values are used as indicators of thedegree of stratification of the water column, and this approach waspreferred because it is easily computed and is sufficient for thepurpose of the analysis. The use of mixed layer depth (MLD) as adescriptor for stratification gave similar patterns as Dr100 m–3 m
(not shown).
3. Results
3.1. Seasonal evolution of key remotely sensed biological and
modelled physical variables
Time-series from late winter to late summer 2006 of remotelysensed Chl-a, and normalized water-leaving radiance at 555 nm(Lwn(555)), and modelled key physical variables (upper mixed layer(UML) and SST) were used to set our cruise in the frame of theoverall seasonal cycle of phytoplankton biomass, and the physicalconditions prevailing in the area before and after the cruise. Chl-aincreased rapidly in early April 2006 with the onset of the springbloom and peaked in mid-April (Fig. 3), in agreement with previousobservations in the area (Wollast and Chou, 2001; Hydes et al.,2001; Joint et al., 2001). A second peak of Chl-a was observed threeweeks later, after which Chl-a concentration decreased, andremained low from early July onwards. After the second peak ofChl-a, Lwn(555) representing the backscatter of suspended calcite,hence of the coccolithophore cells and liths, increased by 3-foldfrom winter values (0.3–0.5 mW cm�2 mm�1 sr�1) to peak in mid-May (�1.1 mW cm�2 mm�1 sr�1) one week before our cruise, anddecreased to background level in late June. In mid-April, SST startedto increase from the winter value (�11 1C), coinciding with the firstpeak of Chl-a. The UML depth started shoaling in mid-April toattain, in mid-May, a value of �35 m, corresponding to the depth ofthe photic layer. Lwn(555) started to increase when the mixed layerdepth attained a value of �35 m, to peak about three weeks later, inmid-May, concomitantly to an increase of SST. A deepening of theUML and a decrease of SST occurred just before the start of thecruise, due to stormy weather, and coincided with a decrease ofLwn(555). The possible scenario underlying this decrease ofLwn(555) is a mixing of surface water and a redistribution of the
0.00
0.25
0.50
0.75
1.00
1.25
1.50
L wn
(555
) [m
W c
m-2
μm
-1 s
r-1]
0
50
100
150
200
MLD
[m]
J F M A M J J A SJ F M A M J J A S0
1
2
3
4
5
10
12
14
16
18
20
22
Month (2006)
Chl
-a [μ
g L-
1 ]
SST
[°C
]
Chl-aLwn (555)SSTMLD
Fig. 3. Time series from January to September 2006 of remotely sensed weekly Chl-a concentrations (mg L�1) (left axis) and Lwn (555) (mW cm�2 mm�1 sr�1; left axis),
modelled MLD (m; right axis) and SST (1C; right axis) for a box in in the northern Bay of Biscay [48.51–48.01N; 8.01–7.51W]. The vertical dotted lines correspond to the period of
the cruise (31 May to 9 June 2006). Chl-an and Lwn (555) are Level-3 Sea-viewing Wide Field-of-view Sensor data (http://reason.gsfc.nasa.gov/Giovanni/), and MLD and SST
were simulated by Met Office National Centre for Ocean Forecasting for the North-East Atlantic 1/81 model.
J. Harlay et al. / Deep-Sea Research I 58 (2011) 111–127 115
Author's personal copy
suspended matter through the water column. The period of thecruise coincided with a period of thermal re-stratification with anincrease of SST and a shoaling of the UML depth that remained closeto 25 m until September as SST increased up to 19 1C.
3.2. Biogeochemical settings in June 2006
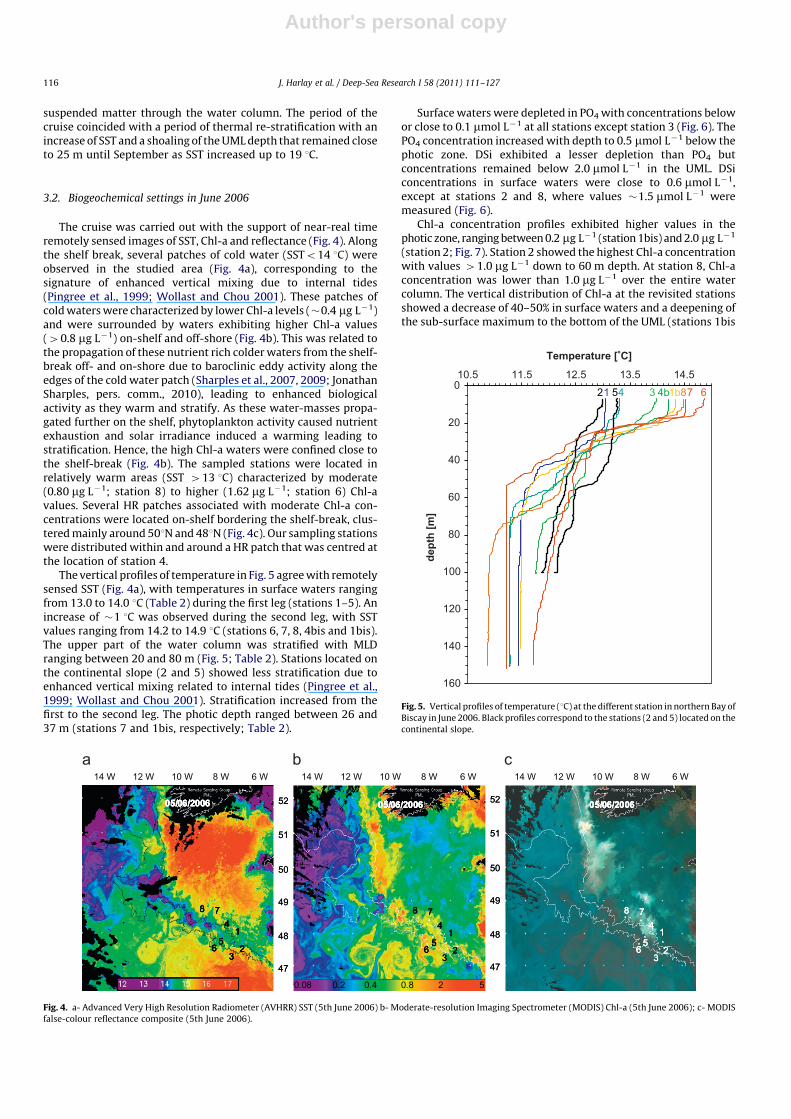
The cruise was carried out with the support of near-real timeremotely sensed images of SST, Chl-a and reflectance (Fig. 4). Alongthe shelf break, several patches of cold water (SSTo14 1C) wereobserved in the studied area (Fig. 4a), corresponding to thesignature of enhanced vertical mixing due to internal tides(Pingree et al., 1999; Wollast and Chou 2001). These patches ofcold waters were characterized by lower Chl-a levels (�0.4 mg L�1)and were surrounded by waters exhibiting higher Chl-a values(40.8 mg L�1) on-shelf and off-shore (Fig. 4b). This was related tothe propagation of these nutrient rich colder waters from the shelf-break off- and on-shore due to baroclinic eddy activity along theedges of the cold water patch (Sharples et al., 2007, 2009; JonathanSharples, pers. comm., 2010), leading to enhanced biologicalactivity as they warm and stratify. As these water-masses propa-gated further on the shelf, phytoplankton activity caused nutrientexhaustion and solar irradiance induced a warming leading tostratification. Hence, the high Chl-a waters were confined close tothe shelf-break (Fig. 4b). The sampled stations were located inrelatively warm areas (SST 413 1C) characterized by moderate(0.80 mg L�1; station 8) to higher (1.62 mg L�1; station 6) Chl-avalues. Several HR patches associated with moderate Chl-a con-centrations were located on-shelf bordering the shelf-break, clus-tered mainly around 501N and 481N (Fig. 4c). Our sampling stationswere distributed within and around a HR patch that was centred atthe location of station 4.
The vertical profiles of temperature in Fig. 5 agree with remotelysensed SST (Fig. 4a), with temperatures in surface waters rangingfrom 13.0 to 14.0 1C (Table 2) during the first leg (stations 1–5). Anincrease of �1 1C was observed during the second leg, with SSTvalues ranging from 14.2 to 14.9 1C (stations 6, 7, 8, 4bis and 1bis).The upper part of the water column was stratified with MLDranging between 20 and 80 m (Fig. 5; Table 2). Stations located onthe continental slope (2 and 5) showed less stratification due toenhanced vertical mixing related to internal tides (Pingree et al.,1999; Wollast and Chou 2001). Stratification increased from thefirst to the second leg. The photic depth ranged between 26 and37 m (stations 7 and 1bis, respectively; Table 2).
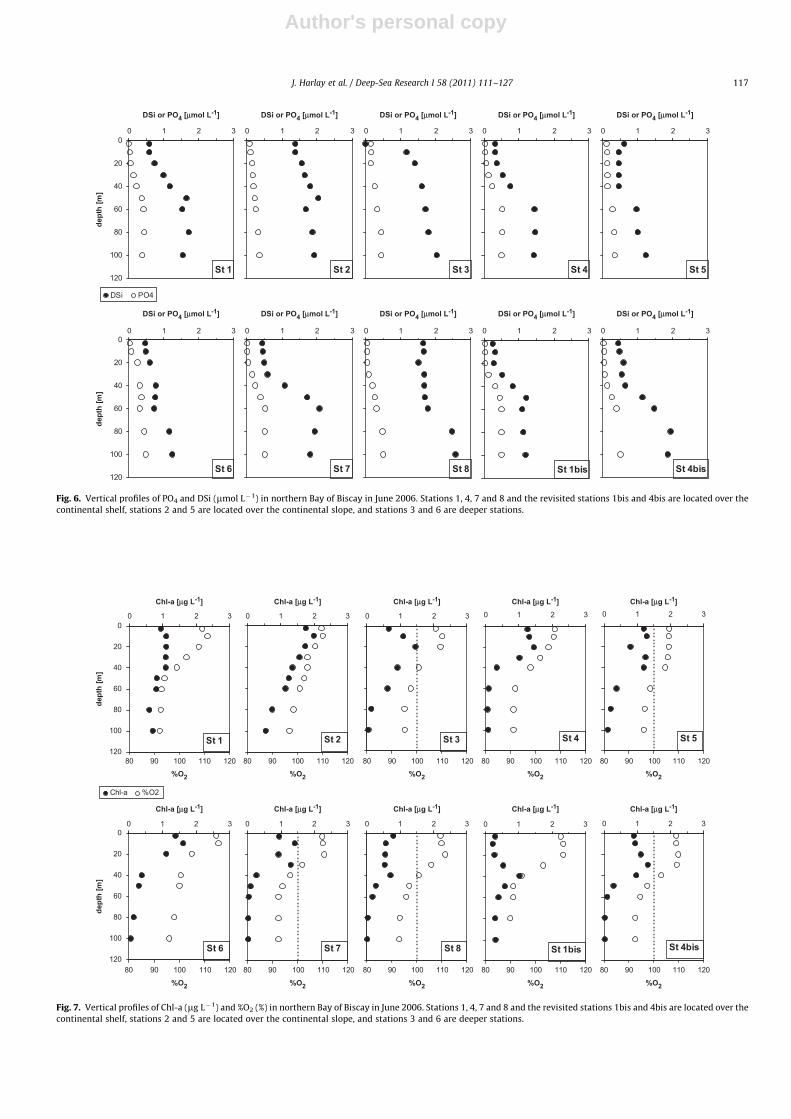
Surface waters were depleted in PO4 with concentrations belowor close to 0.1 mmol L�1 at all stations except station 3 (Fig. 6). ThePO4 concentration increased with depth to 0.5 mmol L�1 below thephotic zone. DSi exhibited a lesser depletion than PO4 butconcentrations remained below 2.0 mmol L�1 in the UML. DSiconcentrations in surface waters were close to 0.6 mmol L�1,except at stations 2 and 8, where values �1.5 mmol L�1 weremeasured (Fig. 6).
Chl-a concentration profiles exhibited higher values in thephotic zone, ranging between 0.2 mg L�1 (station 1bis) and 2.0 mg L�1
(station 2; Fig. 7). Station 2 showed the highest Chl-a concentrationwith values 41.0 mg L�1 down to 60 m depth. At station 8, Chl-aconcentration was lower than 1.0 mg L�1 over the entire watercolumn. The vertical distribution of Chl-a at the revisited stationsshowed a decrease of 40–50% in surface waters and a deepening ofthe sub-surface maximum to the bottom of the UML (stations 1bis
0.2 0.4 0.80.08
1
23
4
56
78
05/06/2006
1
23
4
6
78
05/06/2006
5
52
51
50
49
48
47
52
51
50
49
48
47
1
3
4
56
78
05/06/2006
2
1
23
4
56
78
05/06/2006
2
1
23
4
56
78
05/06/2006
1
23
4
6
78
05/06/2006
51
23
4
6
78
05/06/2006
1
23
4
6
78
05/06/2006
5
6 W8 W12 W14 W 6 W8 W12 W14 W
52
51
50
49
48
47
6 W8 W12 W14 W
52
51
50
49
48
47
1
3
4
56
78
05/06/2006
2
1
3
4
56
78
05/06/2006
2
5
10 W 10 W 10 W
Fig. 4. a- Advanced Very High Resolution Radiometer (AVHRR) SST (5th June 2006) b- Moderate-resolution Imaging Spectrometer (MODIS) Chl-a (5th June 2006); c- MODIS
false-colour reflectance composite (5th June 2006).
0
20
40
60
80
100
120
140
160
Temperature [°C]
dept
h [m
]
21 54 3 4b1b87 6
10.5 11.5 12.5 13.5 14.5
Fig. 5. Vertical profiles of temperature (1C) at the different station in northern Bay of
Biscay in June 2006. Black profiles correspond to the stations (2 and 5) located on the
continental slope.
J. Harlay et al. / Deep-Sea Research I 58 (2011) 111–127116
Author's personal copy
St 1
0
20
40
60
80
100
120
0 1 2 3
dept
h [m
]
DSi PO4
St 2
0 1 2 3
St 3
0 1 2 3
St 4
0 1 2 3
St 5
0 1 2 3
St 6
0
20
40
60
80
100
120
0 1 2 3
DSi or PO4 [μmol L-1] DSi or PO4 [μmol L-1] DSi or PO4 [μmol L-1] DSi or PO4 [μmol L-1] DSi or PO4 [μmol L-1]
dept
h [m
]
St 7
0 1 2 3
St 8
0 1 2 3
St 1bis
0 1 2 3
St 4bis
0 1 2 3
DSi or PO4 [μmol L-1] DSi or PO4 [μmol L-1] DSi or PO4 [μmol L-1] DSi or PO4 [μmol L-1] DSi or PO4 [μmol L-1]
Fig. 6. Vertical profiles of PO4 and DSi (mmol L�1) in northern Bay of Biscay in June 2006. Stations 1, 4, 7 and 8 and the revisited stations 1bis and 4bis are located over the
continental shelf, stations 2 and 5 are located over the continental slope, and stations 3 and 6 are deeper stations.
0
20
40
60
80
100
120
0 1 2 3
dept
h [m
]
80 90 100 110 120
%O2
Chl-a %O2
St 1
0 1 2 3
80 90 100 110 120
St 2
0 1 2 3
80 90 100 110 120
St 3
0 1 2 3
80 90 100 110 120
St 4
0 1 2 3
80 90 100 110 120
St 5
0
20
40
60
80
100
120
0 1 2 3
Chl-a [μg L-1]
dept
h [m
]
80 90 100 110 120
St 6
0 1 2 3
80 90 100 110 120
St 7
0 1 2 3
80 90 100 110 120
St 8
0 1 2 3
80 90 100 110 120
St 1bis
0 1 2 3
80 90 100 110 120
St 4bis
Chl-a [μg L-1] Chl-a [μg L-1] Chl-a [μg L-1] Chl-a [μg L-1]
Chl-a [μg L-1] Chl-a [μg L-1] Chl-a [μg L-1] Chl-a [μg L-1] Chl-a [μg L-1]
%O2 %O2 %O2 %O2
%O2 %O2 %O2 %O2 %O2
Fig. 7. Vertical profiles of Chl-a (mg L�1) and %O2 (%) in northern Bay of Biscay in June 2006. Stations 1, 4, 7 and 8 and the revisited stations 1bis and 4bis are located over the
continental shelf, stations 2 and 5 are located over the continental slope, and stations 3 and 6 are deeper stations.
J. Harlay et al. / Deep-Sea Research I 58 (2011) 111–127 117
Author's personal copy
and 4bis). The Chl-a concentration reported here was within therange reported by Rees et al. (2002) (o1.4 mg L�1) and Head et al.(1998) (o0.8 mg L�1), during early stages of coccolithophoreblooms in the North Sea.
Daily depth-integrated PP (Table 2) was globally lower than orclose to 1000 mg C m�2 d�1 except for station 2 (continentalslope), where a maximum value of 2160 mg C m�2 d�1 wasobserved (Table 2). The lowest PP rate was measured at station8 (430 mg C m�2 d�1), in the HR zone. These PP values were of thesame magnitude to those reported in the same area in June 2004(Harlay et al., 2010).
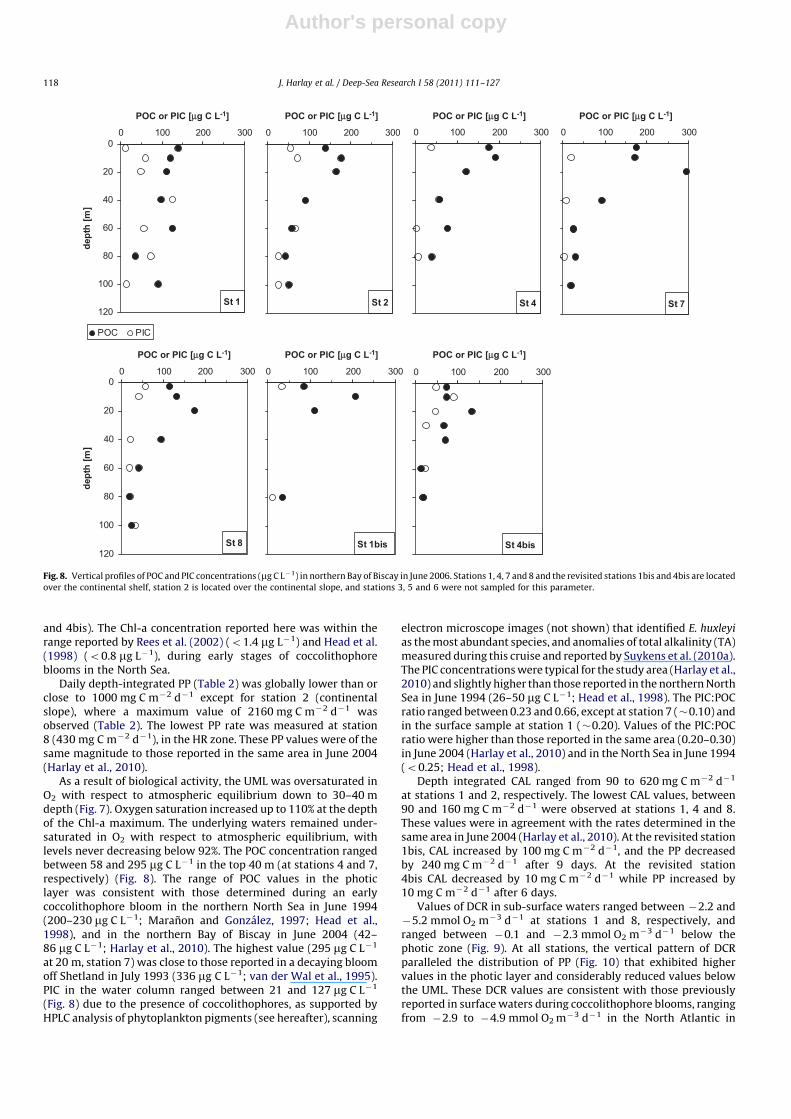
As a result of biological activity, the UML was oversaturated inO2 with respect to atmospheric equilibrium down to 30–40 mdepth (Fig. 7). Oxygen saturation increased up to 110% at the depthof the Chl-a maximum. The underlying waters remained under-saturated in O2 with respect to atmospheric equilibrium, withlevels never decreasing below 92%. The POC concentration rangedbetween 58 and 295 mg C L�1 in the top 40 m (at stations 4 and 7,respectively) (Fig. 8). The range of POC values in the photiclayer was consistent with those determined during an earlycoccolithophore bloom in the northern North Sea in June 1994(200–230 mg C L�1; Maranon and Gonzalez, 1997; Head et al.,1998), and in the northern Bay of Biscay in June 2004 (42–86 mg C L�1; Harlay et al., 2010). The highest value (295 mg C L�1
at 20 m, station 7) was close to those reported in a decaying bloomoff Shetland in July 1993 (336 mg C L�1; van der Wal et al., 1995).PIC in the water column ranged between 21 and 127 mg C L�1
(Fig. 8) due to the presence of coccolithophores, as supported byHPLC analysis of phytoplankton pigments (see hereafter), scanning
electron microscope images (not shown) that identified E. huxleyi
as the most abundant species, and anomalies of total alkalinity (TA)measured during this cruise and reported by Suykens et al. (2010a).The PIC concentrations were typical for the study area (Harlay et al.,2010) and slightly higher than those reported in the northern NorthSea in June 1994 (26–50 mg C L�1; Head et al., 1998). The PIC:POCratio ranged between 0.23 and 0.66, except at station 7 (�0.10) andin the surface sample at station 1 (�0.20). Values of the PIC:POCratio were higher than those reported in the same area (0.20–0.30)in June 2004 (Harlay et al., 2010) and in the North Sea in June 1994(o0.25; Head et al., 1998).
Depth integrated CAL ranged from 90 to 620 mg C m�2 d�1
at stations 1 and 2, respectively. The lowest CAL values, between90 and 160 mg C m�2 d�1 were observed at stations 1, 4 and 8.These values were in agreement with the rates determined in thesame area in June 2004 (Harlay et al., 2010). At the revisited station1bis, CAL increased by 100 mg C m�2 d�1, and the PP decreasedby 240 mg C m�2 d�1 after 9 days. At the revisited station4bis CAL decreased by 10 mg C m�2 d�1 while PP increased by10 mg C m�2 d�1 after 6 days.
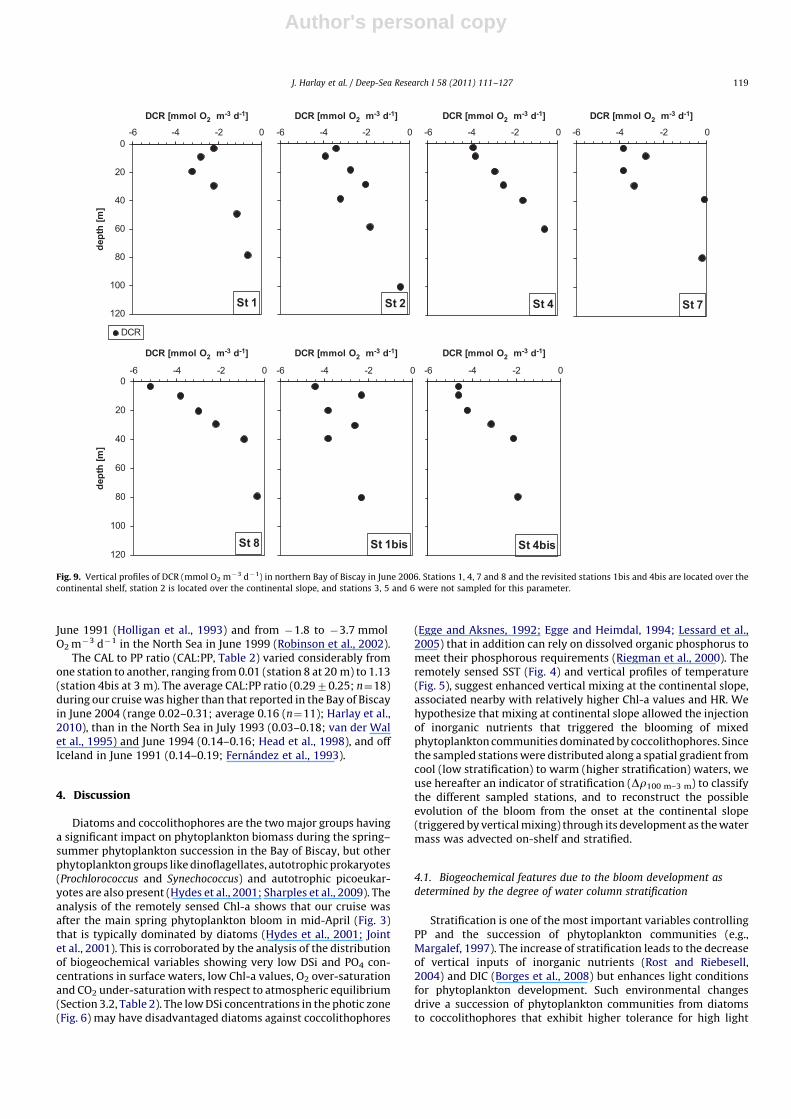
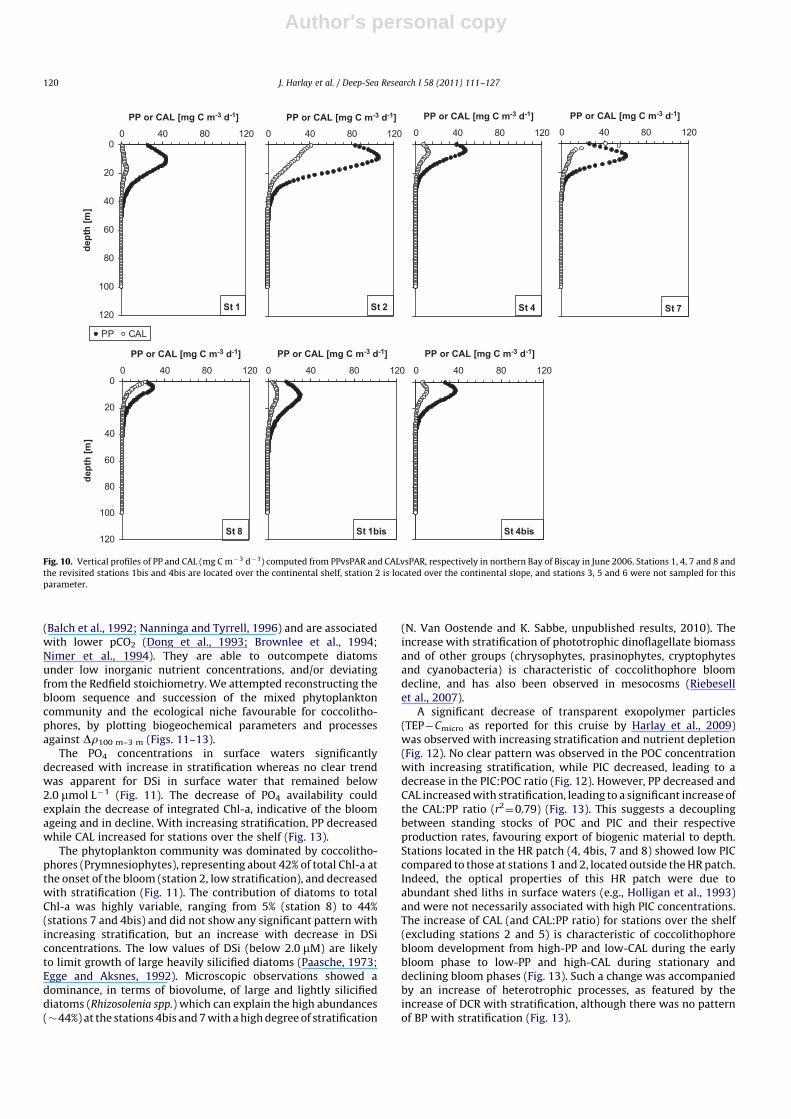
Values of DCR in sub-surface waters ranged between �2.2 and�5.2 mmol O2 m�3 d�1 at stations 1 and 8, respectively, andranged between �0.1 and �2.3 mmol O2 m�3 d�1 below thephotic zone (Fig. 9). At all stations, the vertical pattern of DCRparalleled the distribution of PP (Fig. 10) that exhibited highervalues in the photic layer and considerably reduced values belowthe UML. These DCR values are consistent with those previouslyreported in surface waters during coccolithophore blooms, rangingfrom �2.9 to �4.9 mmol O2 m�3 d�1 in the North Atlantic in
St 1
0
20
40
60
80
100
120
0 100 200 300
POC or PIC [μg C L-1]
dept
h [m
]
POC PIC
St 2
0 100 200 300
St 4
0 100 200 300
St 7
0 100 200 300
St 8
0
20
40
60
80
100
120
0 100 200 300
dept
h [m
]
St 1bis
0 100 200 300
St 4bis
0 100 200 300
POC or PIC [μg C L-1] POC or PIC [μg C L-1] POC or PIC [μg C L-1]
POC or PIC [μg C L-1] POC or PIC [μg C L-1] POC or PIC [μg C L-1]
Fig. 8. Vertical profiles of POC and PIC concentrations (mg C L�1) in northern Bay of Biscay in June 2006. Stations 1, 4, 7 and 8 and the revisited stations 1bis and 4bis are located
over the continental shelf, station 2 is located over the continental slope, and stations 3, 5 and 6 were not sampled for this parameter.
J. Harlay et al. / Deep-Sea Research I 58 (2011) 111–127118
Author's personal copy
June 1991 (Holligan et al., 1993) and from �1.8 to �3.7 mmolO2 m�3 d�1 in the North Sea in June 1999 (Robinson et al., 2002).
The CAL to PP ratio (CAL:PP, Table 2) varied considerably fromone station to another, ranging from 0.01 (station 8 at 20 m) to 1.13(station 4bis at 3 m). The average CAL:PP ratio (0.2970.25; n¼18)during our cruise was higher than that reported in the Bay of Biscayin June 2004 (range 0.02–0.31; average 0.16 (n¼11); Harlay et al.,2010), than in the North Sea in July 1993 (0.03–0.18; van der Walet al., 1995) and June 1994 (0.14–0.16; Head et al., 1998), and offIceland in June 1991 (0.14–0.19; Fernandez et al., 1993).
4. Discussion
Diatoms and coccolithophores are the two major groups havinga significant impact on phytoplankton biomass during the spring–summer phytoplankton succession in the Bay of Biscay, but otherphytoplankton groups like dinoflagellates, autotrophic prokaryotes(Prochlorococcus and Synechococcus) and autotrophic picoeukar-yotes are also present (Hydes et al., 2001; Sharples et al., 2009). Theanalysis of the remotely sensed Chl-a shows that our cruise wasafter the main spring phytoplankton bloom in mid-April (Fig. 3)that is typically dominated by diatoms (Hydes et al., 2001; Jointet al., 2001). This is corroborated by the analysis of the distributionof biogeochemical variables showing very low DSi and PO4 con-centrations in surface waters, low Chl-a values, O2 over-saturationand CO2 under-saturation with respect to atmospheric equilibrium(Section 3.2, Table 2). The low DSi concentrations in the photic zone(Fig. 6) may have disadvantaged diatoms against coccolithophores
(Egge and Aksnes, 1992; Egge and Heimdal, 1994; Lessard et al.,2005) that in addition can rely on dissolved organic phosphorus tomeet their phosphorous requirements (Riegman et al., 2000). Theremotely sensed SST (Fig. 4) and vertical profiles of temperature(Fig. 5), suggest enhanced vertical mixing at the continental slope,associated nearby with relatively higher Chl-a values and HR. Wehypothesize that mixing at continental slope allowed the injectionof inorganic nutrients that triggered the blooming of mixedphytoplankton communities dominated by coccolithophores. Sincethe sampled stations were distributed along a spatial gradient fromcool (low stratification) to warm (higher stratification) waters, weuse hereafter an indicator of stratification (Dr100 m–3 m) to classifythe different sampled stations, and to reconstruct the possibleevolution of the bloom from the onset at the continental slope(triggered by vertical mixing) through its development as the watermass was advected on-shelf and stratified.
4.1. Biogeochemical features due to the bloom development as
determined by the degree of water column stratification
Stratification is one of the most important variables controllingPP and the succession of phytoplankton communities (e.g.,Margalef, 1997). The increase of stratification leads to the decreaseof vertical inputs of inorganic nutrients (Rost and Riebesell,2004) and DIC (Borges et al., 2008) but enhances light conditionsfor phytoplankton development. Such environmental changesdrive a succession of phytoplankton communities from diatomsto coccolithophores that exhibit higher tolerance for high light
St 1
0
20
40
60
80
100
120
-6 -4 -2 0
DCR [mmol O2 m-3 d-1]
dept
h [m
]
DCR
St 2
-6 -4 -2 0
St 4
-6 -4 -2 0
St 7
-6 -4 -2 0
St 8
0
20
40
60
80
100
120
-6 -4 -2 0
dept
h [m
]
St 1bis
-6 -4 -2 0
St 4bis
-6 -4 -2 0
DCR [mmol O2 m-3 d-1] DCR [mmol O2 m-3 d-1] DCR [mmol O2 m-3 d-1]
DCR [mmol O2 m-3 d-1] DCR [mmol O2 m-3 d-1] DCR [mmol O2 m-3 d-1]
Fig. 9. Vertical profiles of DCR (mmol O2 m�3 d�1) in northern Bay of Biscay in June 2006. Stations 1, 4, 7 and 8 and the revisited stations 1bis and 4bis are located over the
continental shelf, station 2 is located over the continental slope, and stations 3, 5 and 6 were not sampled for this parameter.
J. Harlay et al. / Deep-Sea Research I 58 (2011) 111–127 119
Author's personal copy
(Balch et al., 1992; Nanninga and Tyrrell, 1996) and are associatedwith lower pCO2 (Dong et al., 1993; Brownlee et al., 1994;Nimer et al., 1994). They are able to outcompete diatomsunder low inorganic nutrient concentrations, and/or deviatingfrom the Redfield stoichiometry. We attempted reconstructing thebloom sequence and succession of the mixed phytoplanktoncommunity and the ecological niche favourable for coccolitho-phores, by plotting biogeochemical parameters and processesagainst Dr100 m–3 m (Figs. 11–13).
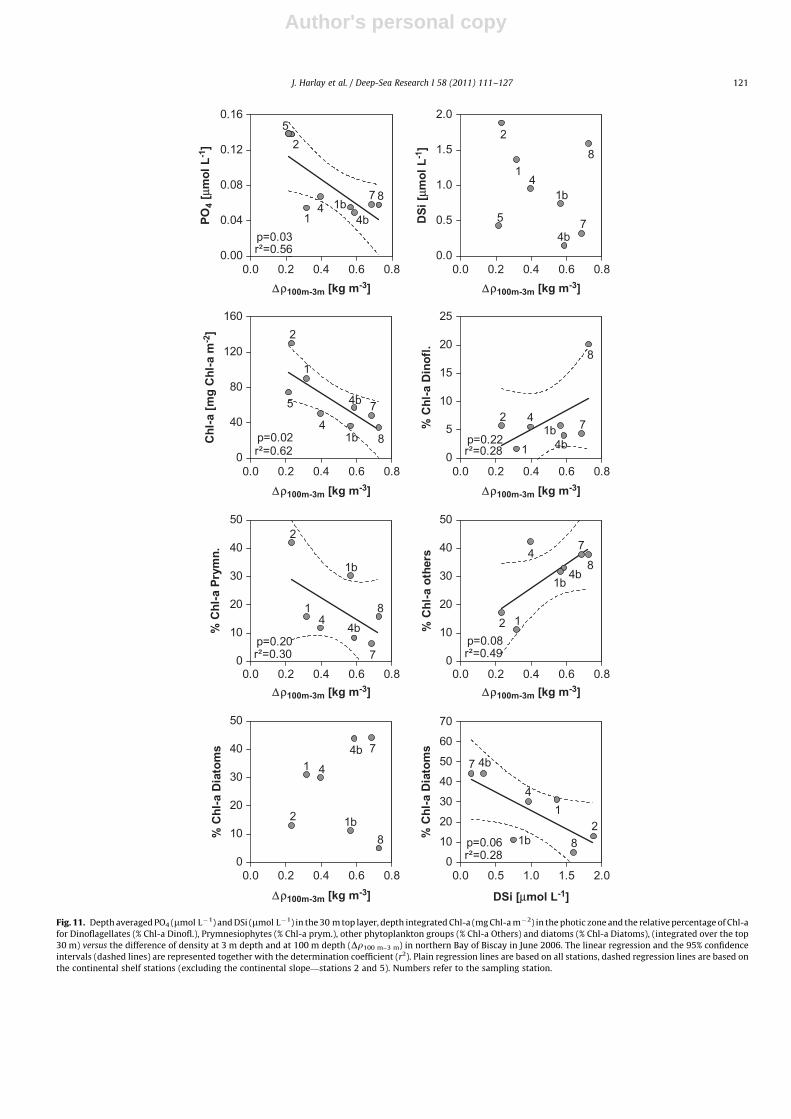
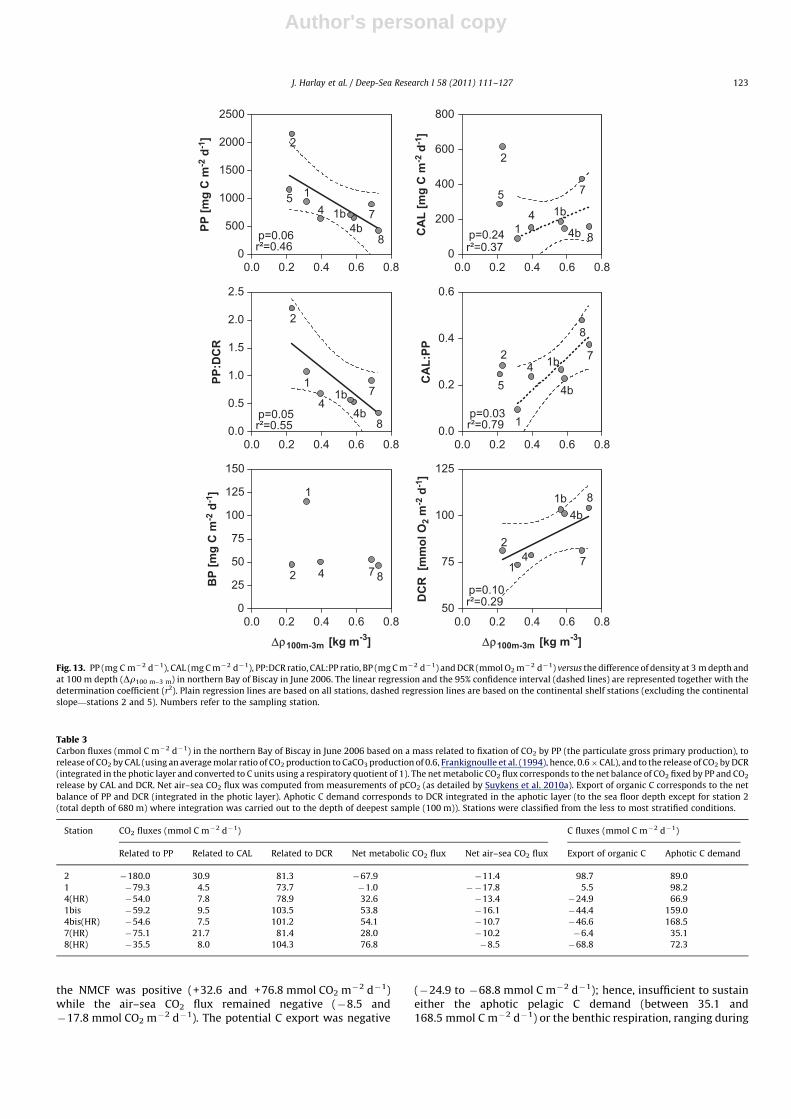
The PO4 concentrations in surface waters significantlydecreased with increase in stratification whereas no clear trendwas apparent for DSi in surface water that remained below2.0 mmol L�1 (Fig. 11). The decrease of PO4 availability couldexplain the decrease of integrated Chl-a, indicative of the bloomageing and in decline. With increasing stratification, PP decreasedwhile CAL increased for stations over the shelf (Fig. 13).
The phytoplankton community was dominated by coccolitho-phores (Prymnesiophytes), representing about 42% of total Chl-a atthe onset of the bloom (station 2, low stratification), and decreasedwith stratification (Fig. 11). The contribution of diatoms to totalChl-a was highly variable, ranging from 5% (station 8) to 44%(stations 7 and 4bis) and did not show any significant pattern withincreasing stratification, but an increase with decrease in DSiconcentrations. The low values of DSi (below 2.0 mM) are likelyto limit growth of large heavily silicified diatoms (Paasche, 1973;Egge and Aksnes, 1992). Microscopic observations showed adominance, in terms of biovolume, of large and lightly silicifieddiatoms (Rhizosolenia spp.) which can explain the high abundances(�44%) at the stations 4bis and 7 with a high degree of stratification
(N. Van Oostende and K. Sabbe, unpublished results, 2010). Theincrease with stratification of phototrophic dinoflagellate biomassand of other groups (chrysophytes, prasinophytes, cryptophytesand cyanobacteria) is characteristic of coccolithophore bloomdecline, and has also been observed in mesocosms (Riebesellet al., 2007).
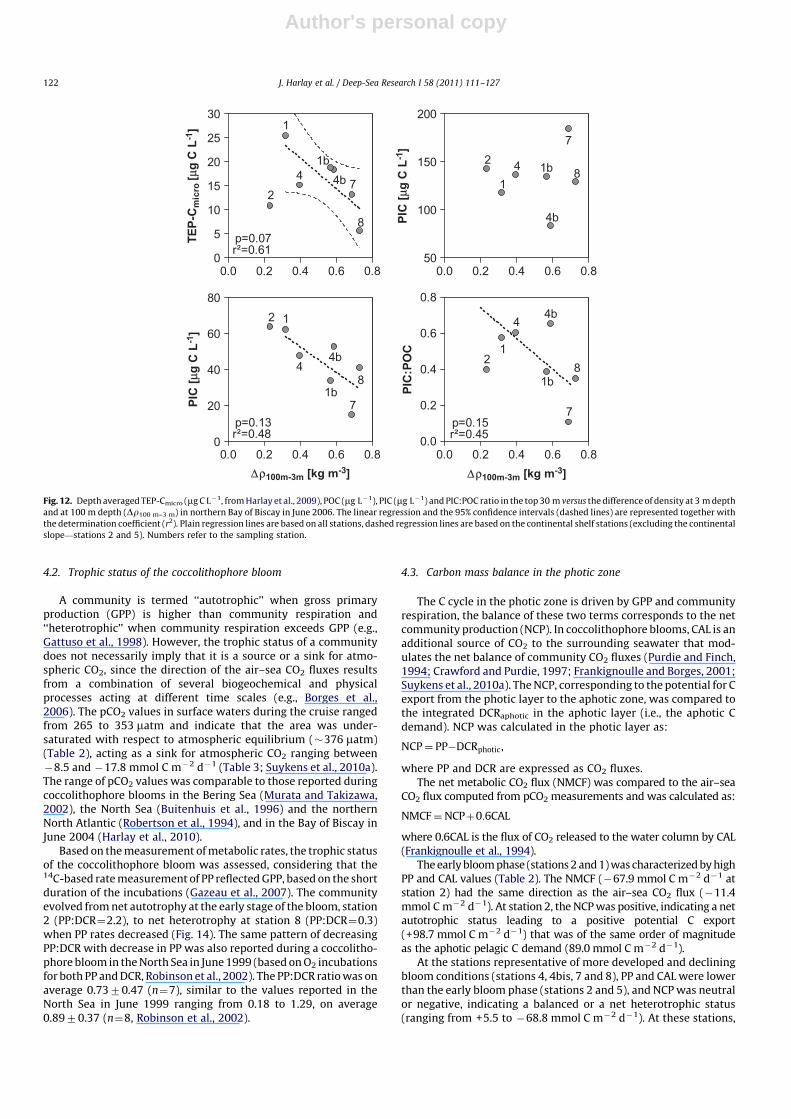
A significant decrease of transparent exopolymer particles(TEP�Cmicro as reported for this cruise by Harlay et al., 2009)was observed with increasing stratification and nutrient depletion(Fig. 12). No clear pattern was observed in the POC concentrationwith increasing stratification, while PIC decreased, leading to adecrease in the PIC:POC ratio (Fig. 12). However, PP decreased andCAL increased with stratification, leading to a significant increase ofthe CAL:PP ratio (r2
¼0.79) (Fig. 13). This suggests a decouplingbetween standing stocks of POC and PIC and their respectiveproduction rates, favouring export of biogenic material to depth.Stations located in the HR patch (4, 4bis, 7 and 8) showed low PICcompared to those at stations 1 and 2, located outside the HR patch.Indeed, the optical properties of this HR patch were due toabundant shed liths in surface waters (e.g., Holligan et al., 1993)and were not necessarily associated with high PIC concentrations.The increase of CAL (and CAL:PP ratio) for stations over the shelf(excluding stations 2 and 5) is characteristic of coccolithophorebloom development from high-PP and low-CAL during the earlybloom phase to low-PP and high-CAL during stationary anddeclining bloom phases (Fig. 13). Such a change was accompaniedby an increase of heterotrophic processes, as featured by theincrease of DCR with stratification, although there was no patternof BP with stratification (Fig. 13).
St 1
0
20
40
60
80
100
120
0 40 80 120
PP or CAL [mg C m-3 d-1] PP or CAL [mg C m-3 d-1]
dept
h [m
]
PP CAL
St 2
0 40 80 120
St 4
0 40 80 120
St 7
0 40 80 120
St 8
0
20
40
60
80
100
120
0 40 80 120
dept
h [m
]
St 1bis
0 40 80 120
St 4bis
0 40 80 120
PP or CAL [mg C m-3 d-1] PP or CAL [mg C m-3 d-1]
PP or CAL [mg C m-3 d-1] PP or CAL [mg C m-3 d-1] PP or CAL [mg C m-3 d-1]
Fig. 10. Vertical profiles of PP and CAL (mg C m�3 d�1) computed from PPvsPAR and CALvsPAR, respectively in northern Bay of Biscay in June 2006. Stations 1, 4, 7 and 8 and
the revisited stations 1bis and 4bis are located over the continental shelf, station 2 is located over the continental slope, and stations 3, 5 and 6 were not sampled for this
parameter.
J. Harlay et al. / Deep-Sea Research I 58 (2011) 111–127120
Author's personal copy
0.0 0.2 0.4 0.6 0.80.00
0.04
0.08
0.12
0.16
2
14 1b
4b
7 8
5
r²=0.56p=0.03
Δρ100m-3m [kg m-3]
PO4
[μm
ol L
-1]
0.0 0.2 0.4 0.6 0.80.0
0.5
1.0
1.5
2.0
2
14
1b
4b7
8
5DSi
[μm
ol L
-1]
0.0 0.2 0.4 0.6 0.80
40
80
120
1602
1
41b
4b 7
8
5
r²=0.62p=0.02C
hl-a
[mg
Chl
-a m
-2]
0.0 0.2 0.4 0.6 0.80
5
10
15
20
25
2
1
41b
4b
7
8
r²=0.28p=0.22
% C
hl-a
Din
ofl.
0.0 0.2 0.4 0.6 0.80
10
20
30
40
502
14
1b
4b
7
8
r²=0.30p=0.20
% C
hl-a
Pry
mn.
0.0 0.2 0.4 0.6 0.80
10
20
30
40
50
2 1
4
1b4b
7
8
r²=0.49p=0.08
% C
hl-a
oth
ers
0.0 0.2 0.4 0.6 0.80
10
20
30
40
50
2
1 4
1b
4b 7
8% C
hl-a
Dia
tom
s
0.0 0.5 1.0 1.5 2.00
10
20
30
40
50
60
70
21
4
1b
4b7
8r²=0.28p=0.06
DSi [μmol L-1]
% C
hl-a
Dia
tom
s
Δρ100m-3m [kg m-3]
Δρ100m-3m [kg m-3]Δρ100m-3m [kg m-3]
Δρ100m-3m [kg m-3] Δρ100m-3m [kg m-3]
Δρ100m-3m [kg m-3]
Fig. 11. Depth averaged PO4 (mmol L�1) and DSi (mmol L�1) in the 30 m top layer, depth integrated Chl-a (mg Chl-a m�2) in the photic zone and the relative percentage of Chl-a
for Dinoflagellates (% Chl-a Dinofl.), Prymnesiophytes (% Chl-a prym.), other phytoplankton groups (% Chl-a Others) and diatoms (% Chl-a Diatoms), (integrated over the top
30 m) versus the difference of density at 3 m depth and at 100 m depth (Dr100 m–3 m) in northern Bay of Biscay in June 2006. The linear regression and the 95% confidence
intervals (dashed lines) are represented together with the determination coefficient (r2). Plain regression lines are based on all stations, dashed regression lines are based on
the continental shelf stations (excluding the continental slope—stations 2 and 5). Numbers refer to the sampling station.
J. Harlay et al. / Deep-Sea Research I 58 (2011) 111–127 121
Author's personal copy
4.2. Trophic status of the coccolithophore bloom
A community is termed ‘‘autotrophic’’ when gross primaryproduction (GPP) is higher than community respiration and‘‘heterotrophic’’ when community respiration exceeds GPP (e.g.,Gattuso et al., 1998). However, the trophic status of a communitydoes not necessarily imply that it is a source or a sink for atmo-spheric CO2, since the direction of the air–sea CO2 fluxes resultsfrom a combination of several biogeochemical and physicalprocesses acting at different time scales (e.g., Borges et al.,2006). The pCO2 values in surface waters during the cruise rangedfrom 265 to 353 matm and indicate that the area was under-saturated with respect to atmospheric equilibrium (�376 matm)(Table 2), acting as a sink for atmospheric CO2 ranging between�8.5 and �17.8 mmol C m�2 d�1 (Table 3; Suykens et al., 2010a).The range of pCO2 values was comparable to those reported duringcoccolithophore blooms in the Bering Sea (Murata and Takizawa,2002), the North Sea (Buitenhuis et al., 1996) and the northernNorth Atlantic (Robertson et al., 1994), and in the Bay of Biscay inJune 2004 (Harlay et al., 2010).
Based on the measurement of metabolic rates, the trophic statusof the coccolithophore bloom was assessed, considering that the14C-based rate measurement of PP reflected GPP, based on the shortduration of the incubations (Gazeau et al., 2007). The communityevolved from net autotrophy at the early stage of the bloom, station2 (PP:DCR¼2.2), to net heterotrophy at station 8 (PP:DCR¼0.3)when PP rates decreased (Fig. 14). The same pattern of decreasingPP:DCR with decrease in PP was also reported during a coccolitho-phore bloom in the North Sea in June 1999 (based on O2 incubationsfor both PP and DCR, Robinson et al., 2002). The PP:DCR ratio was onaverage 0.7370.47 (n¼7), similar to the values reported in theNorth Sea in June 1999 ranging from 0.18 to 1.29, on average0.8970.37 (n¼8, Robinson et al., 2002).
4.3. Carbon mass balance in the photic zone
The C cycle in the photic zone is driven by GPP and communityrespiration, the balance of these two terms corresponds to the netcommunity production (NCP). In coccolithophore blooms, CAL is anadditional source of CO2 to the surrounding seawater that mod-ulates the net balance of community CO2 fluxes (Purdie and Finch,1994; Crawford and Purdie, 1997; Frankignoulle and Borges, 2001;Suykens et al., 2010a). The NCP, corresponding to the potential for Cexport from the photic layer to the aphotic zone, was compared tothe integrated DCRaphotic in the aphotic layer (i.e., the aphotic Cdemand). NCP was calculated in the photic layer as:
NCP¼ PP�DCRphotic,
where PP and DCR are expressed as CO2 fluxes.The net metabolic CO2 flux (NMCF) was compared to the air–sea
CO2 flux computed from pCO2 measurements and was calculated as:
NMCF¼NCPþ0:6CAL
where 0.6CAL is the flux of CO2 released to the water column by CAL(Frankignoulle et al., 1994).
The early bloom phase (stations 2 and 1) was characterized by highPP and CAL values (Table 2). The NMCF (�67.9 mmol C m�2 d�1 atstation 2) had the same direction as the air–sea CO2 flux (�11.4mmol C m�2 d�1). At station 2, the NCP was positive, indicating a netautotrophic status leading to a positive potential C export(+98.7 mmol C m�2 d�1) that was of the same order of magnitudeas the aphotic pelagic C demand (89.0 mmol C m�2 d�1).
At the stations representative of more developed and decliningbloom conditions (stations 4, 4bis, 7 and 8), PP and CAL were lowerthan the early bloom phase (stations 2 and 5), and NCP was neutralor negative, indicating a balanced or a net heterotrophic status(ranging from +5.5 to �68.8 mmol C m�2 d�1). At these stations,
0.0 0.2 0.4 0.6 0.80
5
10
15
20
25
30
2
1
41b
4b 7
8
r²=0.61p=0.07TE
P-C
mic
ro [μ
g C
L-1
]
0.0 0.2 0.4 0.6 0.850
100
150
200
2
14 1b
4b
7
8
0.0 0.2 0.4 0.6 0.80
20
40
60
802 1
4
1b
4b
7
8
r²=0.48p=0.13
PIC
[μg
C L
-1]
PIC
[μg
C L
-1]
0.0 0.2 0.4 0.6 0.80.0
0.2
0.4
0.6
0.8
21
4
1b
4b
7
8
r²=0.45p=0.15
PIC
:PO
C
Δρ100m-3m [kg m-3] Δρ100m-3m [kg m-3]
Fig. 12. Depth averaged TEP-Cmicro (mg C L�1, from Harlay et al., 2009), POC (mg L�1), PIC (mg L�1) and PIC:POC ratio in the top 30 m versus the difference of density at 3 m depth
and at 100 m depth (Dr100 m–3 m) in northern Bay of Biscay in June 2006. The linear regression and the 95% confidence intervals (dashed lines) are represented together with
the determination coefficient (r2). Plain regression lines are based on all stations, dashed regression lines are based on the continental shelf stations (excluding the continental
slope—stations 2 and 5). Numbers refer to the sampling station.
J. Harlay et al. / Deep-Sea Research I 58 (2011) 111–127122
Author's personal copy
the NMCF was positive (+32.6 and +76.8 mmol CO2 m�2 d�1)while the air–sea CO2 flux remained negative (�8.5 and�17.8 mmol CO2 m�2 d�1). The potential C export was negative
(�24.9 to �68.8 mmol C m�2 d�1); hence, insufficient to sustaineither the aphotic pelagic C demand (between 35.1 and168.5 mmol C m�2 d�1) or the benthic respiration, ranging during
0.0 0.2 0.4 0.6 0.80
500
1000
1500
2000
2500
5
2
14 1b
4b7
8r²=0.46p=0.06PP
[mg
C m
-2 d
-1]
0.0 0.2 0.4 0.6 0.80
200
400
600
800
2
5
14 1b
4b
7
8r²=0.37p=0.24
0.0 0.2 0.4 0.6 0.80.0
0.5
1.0
1.5
2.0
2.5
2
1
41b
4b
7
8r²=0.55p=0.05
PP:D
CR
0.0 0.2 0.4 0.6 0.80.0
0.2
0.4
0.6
5
2
1
4 1b
4b
7
8
r²=0.79p=0.03
CA
L:PP
0.0 0.2 0.4 0.6 0.80
25
50
75
100
125
150
2
1
4 7 8
Δρ100m-3m [kg m-3]
0.0 0.2 0.4 0.6 0.850
75
100
125
2
14
1b4b
7
8
r²=0.29p=0.10
Δρ100m-3m [kg m-3]
DC
R [
mm
ol O
2 m
-2 d
-1]
BP
[mg
C m
-2 d
-1]
CA
L [m
g C
m-2
d-1
]
Fig. 13. PP (mg C m�2 d�1), CAL (mg C m�2 d�1), PP:DCR ratio, CAL:PP ratio, BP (mg C m�2 d�1) and DCR (mmol O2 m�2 d�1) versus the difference of density at 3 m depth and
at 100 m depth (Dr100 m–3 m) in northern Bay of Biscay in June 2006. The linear regression and the 95% confidence interval (dashed lines) are represented together with the
determination coefficient (r2). Plain regression lines are based on all stations, dashed regression lines are based on the continental shelf stations (excluding the continental
slope—stations 2 and 5). Numbers refer to the sampling station.
Table 3Carbon fluxes (mmol C m�2 d�1) in the northern Bay of Biscay in June 2006 based on a mass related to fixation of CO2 by PP (the particulate gross primary production), to
release of CO2 by CAL (using an average molar ratio of CO2 production to CaCO3 production of 0.6, Frankignoulle et al. (1994), hence, 0.6�CAL), and to the release of CO2 by DCR
(integrated in the photic layer and converted to C units using a respiratory quotient of 1). The net metabolic CO2 flux corresponds to the net balance of CO2 fixed by PP and CO2
release by CAL and DCR. Net air–sea CO2 flux was computed from measurements of pCO2 (as detailed by Suykens et al. 2010a). Export of organic C corresponds to the net
balance of PP and DCR (integrated in the photic layer). Aphotic C demand corresponds to DCR integrated in the aphotic layer (to the sea floor depth except for station 2
(total depth of 680 m) where integration was carried out to the depth of deepest sample (100 m)). Stations were classified from the less to most stratified conditions.
Station CO2 fluxes (mmol C m�2 d�1) C fluxes (mmol C m�2 d�1)
Related to PP Related to CAL Related to DCR Net metabolic CO2 flux Net air–sea CO2 flux Export of organic C Aphotic C demand
2 �180.0 30.9 81.3 �67.9 �11.4 98.7 89.0
1 �79.3 4.5 73.7 �1.0 ��17.8 5.5 98.2
4(HR) �54.0 7.8 78.9 32.6 �13.4 �24.9 66.9
1bis �59.2 9.5 103.5 53.8 �16.1 �44.4 159.0
4bis(HR) �54.6 7.5 101.2 54.1 �10.7 �46.6 168.5
7(HR) �75.1 21.7 81.4 28.0 �10.2 �6.4 35.1
8(HR) �35.5 8.0 104.3 76.8 �8.5 �68.8 72.3
J. Harlay et al. / Deep-Sea Research I 58 (2011) 111–127 123

Author's personal copy
the cruise from �2.3 to �7.2 mmol O2 m�2 d�1 at stations 2, 4,4bis and 8 (Suykens et al., 2010b).
One caveat in the community C mass balance given in Table 3 isthat a steady state was assumed. It is well established that inaquatic ecosystems there is a variable but usually strong decou-pling in time and space of organic C production and consumption.This decoupling could explain the low export of organic carboncomputed at most stations that cannot meet the aphotic C demand.Furthermore, air–sea CO2 fluxes are an integrated signal of thewater mass biogeochemical history because of the very longequilibration time of surface waters with respect to atmosphericCO2 due to the buffering capacity of seawater. Also, CO2 dynamicsintegrate both physical (e.g., vertical mixing, advection, and waterresidence time) and purely thermodynamic (mainly water tem-perature change) effects, as discussed at length by e.g., Borges et al.(2006). This appears to be the most likely explanation for the netsink of atmospheric CO2 computed from the pCO2 measurementsfor all stations, while the balance of community metabolic ratesleads to a net release of CO2 in the photic layer during the maturingand declining bloom phases.
The other caveat in the C mass balance (Table 3) is that we onlyconsidered the measurements of PP in the particulate phase. In allaquatic ecosystems, the contribution of dissolved PP (PPd) isvariable but always significant compared to particulate PP (e.g.,Baines and Pace, 1991). We did not measure PPd due to thedifficulty of estimating this quantity with the 14C incubationmethod (Marra, 2002 and references therein). The biogeochemicalmodel of Joassin et al. (2008) that describes C dynamics incoccolithophore blooms validated with mesocosm experiments(Delille et al., 2005), was used to estimate PPd and to refine the Cmass balance (Table 4). Estimated PPd ranged between 14% and 28%
of total primary production (PPtot¼PP+PPd) which is similar to therange (6–24%) reported by Rees et al. (2002) during a coccolitho-phore bloom in the North Sea in June 1999.
Based on the C mass balance accounting for PPd (Table 4), NMCFwas negative at stations 1, 2, 4 and 5, at rates of the same order ofmagnitude as the air–sea CO2 fluxes. The NMCF was balanced atstation 7. At stations 1, 2, 4, 5 and 7, a net export of organic C wascomputed that is of the same order of magnitude as the aphotic Cdemand. The trend in export of organic C is consistent with theconceptual model of bloom development with higher C export atthe onset of the bloom (stations 1, 2 and 5), lower C export at themature bloom phase (stations 4 and 7), and low or no export duringthe declining bloom phase (stations 8, 1bis and 4bis). This is alsoconsistent with the phytoplankton composition derived from HPLCmeasurements showing an increasing contribution of dinoflagel-lates, chrysophytes, prasinophytes and cryptophytes as the bloommatured and declined (Fig. 11), since most of these phytoplanktonspecies have a low potential for sedimentation and vertical exportdue to their small size, lack of inorganic cell wall structures, ormobility (flagellates).
Labile sugars are high C content organic compounds exuded byphytoplankton, constituting a fraction of the C released by PPd.Their contribution to the C fixed photosynthetically, depends onthe growth stage of the coccolithophore E. huxleyi (Fernandez et al.,1996). Among dissolved C losses, of particular interest is theproduction of some polysaccharides that can aggregate to formsticky C-rich particles such as TEP (Passow, 2002). During meso-cosm experiments with E. huxleyi, C losses due to TEP formation andsettling of aggregates had a significant impact on the C budget(Engel et al., 2004; Delille et al., 2005; Joassin et al., 2008). Duringthis cruise, the carbon content of TEP (TEP-C) averaged 12% of POCand attained 68% of POC at certain depths (Harlay et al., 2009). Thedynamics of TEP formation during bloom development modifiesthe properties of macroaggregates (Logan et al., 1995; Engel, 2000;Kahl et al., 2008) and the presence of calcite in these aggregatesincreases their settling velocity (ballast effect; Franc-ois et al.,2002). However, TEP concentrations were higher during the earlyphases of the bloom and tightly coupled to primary production andphytoplankton standing stocks (Fig. 12). This is consistent with thelow export of C computed for the maturing and declining bloomphases (Tables 3 and 4). The comparison of the C mass balancesgiven in Tables 3 and 4, certainly highlights the importance of PPd inC flows during coccolithophore blooms, although it is acknow-ledged that the estimates of PPd herein are rough approximationsand should be used with caution.
5. Synthesis and conclusions
A bloom of mixed phytoplankton community dominated bycoccolithophores was studied at the continental margin of thenorthern Bay of Biscay, where enhanced biological activity resulted
r 2 = 0.98
0.0
0.5
1.0
1.5
2.0
2.5
0 500 1000 1500 2000 2500PP [mg C m-2 d-1]
PP:D
CR
Biscay (June 2006)North Sea (June 1999)
Fig. 14. PP:DCR versus PP (mg C m�2 d�1) in northern Bay of Biscay in June 2006 and
in the North Sea in June 1999, during a coccolithophore bloom (Robinson et al.,
2002).
Table 4Carbon fluxes (mmol C m�2 d�1) in the northern Bay of Biscay in June 2006. All computations are identical to Table 2 (refer to caption for details) with the exception that PPtot
corresponds to the sum of particulate PP and PPd (computed using the biogeochemical model of Joassin et al., 2008).
Station CO2 fluxes (mmol C m�2 d�1) C fluxes (mmol C m�2 d�1)
Related to PPtot Related to CAL Related to DCR Net metabolic CO2 flux Net air–sea CO2 flux Export of organic C Aphotic C demand
2 �205.6 30.9 81.3 �93.5 �11.4 124.3 89.0
1 �108.8 4.5 73.7 �30.5 �17.8 35.0 98.2
4(HR) �114.4 7.8 78.9 �27.8 �13.4 35.5 66.9
1bis �65.7 9.5 103.5 47.3 �16.1 �37.9 159.0
4bis(HR) �63.8 7.5 101.2 44.9 �10.7 �37.4 168.5
7(HR) �101.4 21.7 81.4 1.7 �10.2 19.9 35.1
8(HR) �39.2 8.0 104.3 73.1 �8.5 �65.1 72.3
J. Harlay et al. / Deep-Sea Research I 58 (2011) 111–127124
Author's personal copy
from local nutrient inputs into the UML, due to physical forcing(mainly internal tides) as deduced from vertical profiles of tem-perature and remotely sensed SST (cooler and less stratified waterpatches at the shelf break and the continental slope). It ishypothesized that the vertical mixing at the shelf-break triggeredthe bloom of mixed phytoplankton communities dominated bycoccolithophores, and that the bloom developed and then declinedas these water masses were transported over the continental shelfdue to baroclinic eddy activity along the edges of the cold waterpatch, stratifying as they warmed.
The cruise took place after the main spring bloom of, probably,large diatoms that peaked in mid-April (based on the temporalevolution of Chl-a from remote sensing images and modelled deepUML favourable to the development of large diatoms). Hence,during our cruise, the area was strongly depleted in DSi with levelso2.0 mM that are limiting for diatom growth (Egge and Aksnes,1992). Additional inputs of nutrients by vertical mixing at the shelfbreak would then favour phytoplankton development and thesuccession from diatoms to coccolithophores.
The analysis of data as a function of an indicator of stratificationallowed the reconstruction of the bloom sequence, wherebycoccolithophores dominated in low stratified conditions and, asstratification intensified, their abundance declined in favour ofdinoflagellates, chrysophytes, prasinophytes and cryptophytes.Furthermore, coccolithophores shifted from an organic productiondominated-phase to a more inorganic production dominated-phase, as shown by the increase of the CAL:PP ratio withstratification.
A C mass balance in the photic layer was computed along agradient between the high production zone (stations 2 and 5) andthe HR zone (station 8). The pCO2 measurements indicated thatsurface waters acted as a net sink for atmospheric CO2 during allphases of the bloom, although TA data reported by Suykens et al.(2010a) showed that CAL had a large impact on surface seawaterdissolved carbonate chemistry. Hence, CAL related to coccolitho-phore blooms had the potential to decrease the sink of atmosphericCO2 but did not reverse the direction of the flux. Net communityautotrophy was only found for the early phase of the bloom. Duringthe maturing and declining phases of the bloom, potential exportfrom the photic layer could not meet the aphotic C demand. This Cmass balancing approach suffers from several caveats. Firstly,steady-state is assumed but C dynamics need to be integratedover longer time scales due to the decoupling in time and space oforganic carbon production and degradation. Secondly, the impor-tance of PPd and its potential incorporation into TEP duringcoccolithophore blooms is likely a significant C flux sustainingthe heterotrophic C demand in the twilight zone, as suggested byKoeve (2005). Indeed, when comparing the C mass balance in thephotic layer and the air–sea CO2 fluxes and the aphotic C demand,the C community mass balance established using estimated PPd
was more consistent.The effects of ocean acidification on marine communities will
likely lead to a decoupling of C and N cycling, modifying C export todepth and providing a feedback on increasing atmospheric CO2
(Riebesell et al., 2007). As a result of the expected reduction of CALin bloom forming coccolithophores in a high CO2 ocean (Riebesellet al., 2000; Delille et al., 2005) and associated changes in the ballastof aggregates by biogenic calcite (De La Rocha and Passow, 2007;Hofmann and Schellnhuber, 2009), the biogenic C pumping effi-ciency of these blooms is likely to be modified in the comingdecades and centuries. The magnitude and direction of thesechanges remain to be established. Comprehensive and multi-disciplinary studies of C cycling in coccolithophore blooms innatural conditions such as the one reported here is an essential pre-requisite for a robust and credible implementation in mathematicalmodels to allow the projection of a plausible future evolution of
carbon biogeochemistry under global change, in particular inrelation to ocean acidification.
Acknowledgements
The authors are grateful to the officers and crewmembers of theRV Belgica for logistic support during the cruise, Joan Backers, Jean-Pierre De Blauw and Gregory Deschepper of the Unit of the NorthSea Mathematical Models for support in data acquisition during thecruise, to Pascal Joassin for help in the computations of dissolvedprimary production, Tim Smyth, Peter Miller, NERC Earth Observa-tion Data Acquisition and Analysis Service for the AVHRR andMODIS images, Nathalie Roevros and Marc-Vincent Commarieu forlaboratory analysis, and to Christiane Lancelot, John Huthnance,Jonathan Sharples, Michael Bacon (Associate Editor), and twoanonymous reviewers for constructive comments during theelaboration of the manuscript. This study was financed by theBelgian Federal Science Policy Office in the framework of the PEACEproject (contract no. SD/CS/03A/B) and by the Helmholtz Associa-tion (contract no. HZ-NG-102). This work is a contribution to the EUFP6 European Network of Excellence EUR–OCEANS (contract no.511106-2), EU IP CARBOOCEAN (contract no. 511176), and SOLAS.CDB was supported by a PhD grant from the EU FP6 IP CarboOceanproject (contract no. 511176–2), NVO was supported by a PhDgrant from the Institute for the Promotion of Innovation throughScience and Technology in Flanders (IWT-Vlaanderen), AVB and BDare research associates at the F.R.S.-F.N.R.S. First and last authorsequally contributed to data interpretation and manuscript drafting.
References
Baines, S.B., Pace, M.L., 1991. The production of dissolved organic matter byphytoplankton and its importance to bacteria: patterns across marine andfreshwater systems. Limnology and Oceanography 36, 1078–1090.
Balch, W.M., Holligan, P.M., Kilpatrick, K.A., 1992. Calcification, photosynthesis andgrowth of the bloom-forming coccolithophore, Emiliania huxleyi. ContinentalShelf Research 12, 1353–1374.
Balch, W.M., Gordon, H.R., Bowler, B.C., Drapeau, D.T., Booth, E.S., 2005. Calciumcarbonate measurements in the surface global ocean based on moderate-resolution imaging spectroradiometer data. Journal of Geophysical Research110, 1–22.
Balch, W.M., Drapeau, D., Bowler, B., Booth, E., 2007. Prediction of pelagiccalcification rates using satellite measurements. Deep Sea Research Part II 54,478–495.
Balch, W.M., Utgoff, P.E., 2009. Potential interactions among ocean acidification,coccolithophores, and the optical properties of seawater. Oceanography 22,146–159.
Benson, B.B., Krause, D., 1984. The concentration and isotopic fractionation ofoxygen dissolved in freshwater and seawater in equilibrium with the atmo-sphere. Limnology and Oceanography 29, 620–632.
Billard, C., Inouye, I., 2004. What’s new in Coccolithophore Biology?. In: Thierstei,H.R., Youn, J.R. (Eds.), Coccolithophores: From Molecular Processes to GlobalImpact, pp. 11–30.
Borges, A.V., Schiettecatte, L.-S., Abril, G., Delille, B., Gazeau, F., 2006. Carbon dioxidein European coastal waters. Estuarine, Coastal and Shelf Science 70, 375–387.
Borges, A.V., Tilbrook, B., Metzl, N., Lenton, A., Delille, B., 2008. Inter-annualvariability of the carbon dioxide oceanic sink south of Tasmania. Biogeosciences5, 144–155.
Brownlee, C., Nimer, N.A., Dong, L.F., Merrett, M.J., 1994. Cellular regulation duringcalcification in Emiliania huxleyi. In: Green, J.C., Leadbeater, B.S.C. (Eds.),The Haptophyte Algae. Clarendon Press, Oxford, pp. 133–148.
Buitenhuis, E.T., van Bleijswijk, J.D.L., Bakker, D.C.E., Veldhuis, M.J.W., 1996. Trendsin inorganic and organic carbon in a bloom of Emiliania huxleyi in the North Sea.Marine Ecology Progress Series 143, 271–282.
Buitenhuis, E.T., van der Wal, P., de Baar, H.J.W., 2001. Blooms of Emiliania huxleyi aresinks of atmospheric carbon dioxide: A field and mesocosm study derivedsimulation. Global Biogeochemical Cycles 15, 577–587.
Crawford, D.W., Purdie, D.A., 1997. Increase of pCO2 during blooms ofEmiliania huxleyi: Theoretical considerations on the asymmetry betweenacquisition of HCO3
� and respiration of free CO2. Limnology and Oceanography42, 365–372.
De Bodt, C., Harlay, J., Chou, L., 2008. Biocalcification by Emiliania huxleyi in batchculture experiments. Mineralogical Magazine 72, 251–256.
De Bodt, C., Van Oostende, N., Harlay, J., Sabbe, K., Chou, L., 2010. Individual andinteracting effects of pCO2 and temperature on Emiliania huxleyi calcification:
J. Harlay et al. / Deep-Sea Research I 58 (2011) 111–127 125
Author's personal copy
study of the calcite production, the coccolith morphology and the coccospheresize. Biogeosciences 7, 1401–1412.
De La Rocha, C.L., Passow, U., 2007. Factors influencing the sinking of POC and theefficiency of the biological carbon pump. Deep Sea Research Part II 54, 639–658.
Delille, B., Harlay, J., Zondervan, I., Jacquet, S., Chou, L., Wollast, R., Bellerby, R.G.J.,Frankignoulle, M., Borges, A.V., Riebesell, U., Gattuso, J.-P., 2005. Response ofprimary production and calcification to changes of pCO2 during experimentalblooms of the coccolithophorid Emiliania huxleyi. Global Biogeochemical Cycles19, GB2023.
Dong, L.F., Nimer, N.A., Okus, E., Merrett, M.J., 1993. Dissolved inorganic carbonutilization in relation to calcite production in Emiliania huxleyi (Lohmann)Kamptner. New Phytologist 123, 679–684.
Egge, J.K., Aksnes, D.L., 1992. Silica as regulating nutrient in phytoplanktoncompetition. Marine Ecology Progress Series 83, 281–289.
Egge, J.K., Heimdal, B.R., 1994. Blooms of Emiliania huxleyi in mesocosm experiment;effects of nutrient supply in different N:P ratios. Sarsia 79, 333–348.
Engel, A., 2000. The role of transparent exopolymer particles (TEP) in the increase inapparent particle stickiness (alpha) during the decline of a diatom bloom.Journal of Plankton Research 22, 485–497.
Engel, A., Thoms, S., Riebesell, U., Rochelle-Newall, E., Zondervan, I., 2004. Poly-saccharide aggregation as a potential sink of marine dissolved organic carbon.Nature 428, 929–932.
Fernandez, E., Boyd, P.W., Holligan, P.M., Harbour, D.S., 1993. Production of organicand inorganic carbon within a large-scale coccolithophore bloom in the north-east Atlantic Ocean. Marine Ecology Progress Series 97, 271–285.
Fernandez, E., Fritz, J.J., Balch, W.M., 1996. Chemical composition of the coccolitho-phorid Emiliania huxleyi under light-limited steady state growth. Journal ofExperimental Biology and Ecology 207, 149–160.
Franc-ois, R., Honjo, S., Kirshfield, R., Manganini, S.J., 2002. Factors controlling the fluxof organic carbon to the bathypelagic zone of the ocean. Global BiogeochemicalCycles 16, 1–20.
Frankignoulle, M., Canon, C., Gattuso, J.-P., 1994. Marine calcification as a source ofcarbon dioxide: positive feedback of increasing atmospheric CO2. Limnologyand Oceanography 39, 458–462.
Frankignoulle, M., Borges, A.V., 2001. European continental shelf as a significant sinkfor atmospheric carbon dioxide. Global Biogeochemical Cycles 15, 569–576.
Fuhrman, J.A., Azam, F., 1982. Thymidine incorporation as a measure of hetero-trophic bacterioplanktion production in marine surface waters: evaluation andfield results. Marine Biology 66, 109–120.
Garcia-Soto, C., Fernandez, E., Pingree, R.D., Harbour, D.S., 1995. Evolution andstructure of a shelf coccolithophore bloom in the western English channel.Journal of Plankton Research 17, 2011–2036.
Garcia-Soto, C., Pingree, R.D., 2009. Spring and summer blooms of phytoplankton(SeaWiFS/MODIS) along a ferry line in the Bay of Biscay and western Englishchannel. Continental Shelf Research 29, 1111–1122.
Gattuso, J.-P., Frankignoulle, M., Wollast, R., 1998. Carbon and carbonate metabo-lism in coastal aquatic ecosystems. Annual Review of Ecology, Evolution andSystematics 29, 405–434.
Gazeau, F., Middelburg, J.J., Loijens, M., Vanderborght, J.-P., Pizay, M.-D.,Gattuso, J.-P., 2007. Planktonic primary production in estuaries: comparisonof 14C, O2 and 18O methods. AME 46, 95–106.
Grasshoff, K., Ehrhardt, M., Kremling, K., 1983. Methods of Seawater Analysis. VerlagChemie, Weinheim.
GREPMA, 1988. Satellite (AVHRR:NOAA-9) and ship studies of a coccolithophoridbloom in the western English channel. Marine Nature 1, 1–14.
Harlay, J., De Bodt, C., Engel, A., Jansen, S., d’Hoop, Q., Piontek, J., Van Oostende, N.,Groom, S.B., Sabbe, K., Chou, L., 2009. Abundance and size distribution oftransparent exopolymer particles (TEP) in a coccolithophorid bloom in thenorthern Bay of Biscay. Deep Sea Research Part I 56, 1251–1265.
Harlay, J., Borges, A.V., van der Zee, C., Delille, B., Godoi, R.H.M., Schiettecatte, L.-S.,Roevros, N., Aerts, K., Lapernat, P.-E., Rebreanu, L., Groom, S.B., Daro, M.-H., VanGrieken, R., Chou, L., 2010. Biogoechemical study of a coccolithophore bloom inthe northern Bay of Biscay (NE Atlantic Ocean) in June 2004. Progress inOceanography 86, 317–336.
Head, R.N., Crawford, D.W., Egge, J.K., Harris, R.P., Kristiansen, S., Lesley, D.J.,Maranon, E., Pond, D., Purdie, D.A., 1998. The hydrography and biology of abloom of the coccolithophorid Emiliania huxleyi in the northern North Sea.Journal of Sea Research 39, 255–266.
Hofmann, M., Schellnhuber, H.-J., 2009. Oceanic acidification affects marine carbonpump and triggers extended marine oxygen holes. Proceedings of the NationalAcademy of Sciences 106, 3017–3022.
Holligan, P.M., Viollier, M., Harbour, D.S., Camus, P., Champagne-Philippe, M., 1983.Satellite and ship studies of coccolithophore production along a continentalshelf edge. Nature 304, 339–342.
Holligan, P.M., Fernandez, E., Aiken, W., Balch, W.M., Boyd, P.W., Burkill, P.H., Finch,M., Groom, S.B., Malin, G., Muller, K., Purdie, D.A., Robinson, C., Trees, C.C., Turner,S.M., van der Wal, P., 1993. A biogeochemical study of the coccolithophore,Emiliania huxleyi, in the North Atlantic. Global Biogeochemical Cycles 7,879–900.
Huthnance, J.M., Coelho, H., Griffiths, C.R., Knight, P.J., Rees, A.P., Sinha, B.,Vangriesheim, A., White, M., Chatwin, P.G., 2001. Physical structures, advectionand mixing in the region of Goban spur. Deep Sea Research Part II 48,2979–3021.
Hydes, D.J., Le Gall, A.C., Miller, A.E.J., Brockmann, U., Raabe, T., Holley, S., Alvarez-Salgado, X., Antia, A.N., Balzer, W., Chou, L., 2001. Supply and demand ofnutrients and dissolved organic matter at and across the NW European shelf
break in relation to hydrography and biogeochemical activity. Deep SeaResearch Part II 48, 3023–3047.
Joassin, P., Delille, B., Soetaert, K., Borges, A.V., Chou, L., Engel, A., Gattuso, J.-P.,Harlay, J., Riebesell, U., Suykens, K., Gregoire, M., 2008. A mathematicalmodelling of bloom of the coccolithophore Emiliania huxleyi in a mesocosmexperiment. Biogeosciences Discuss 5, 787–840.
Joint, I., Wollast, R., Chou, L., Batten, S., Elskens, M., Edwards, E.S., Hirst, A., Burkill,P.H., Groom, S.B., Gibb, S.W., Miller, A., Hydes, D.J., Dehairs, F., Antia, A.N., Barlow,R., Rees, A., Pomroy, A., Brockmann, U., Cimmings, D., Lampitt, R., Loijens, M.,Mantoura, F., Miller, P., Raabe, T., Alvarez-Salgado, X., Stelfox, C., Woolfenden, J.,2001. Pelagic production at the Celtic Sea shelf break. Deep Sea Research Part II48, 3049–3081.
Kahl, L.A., Vardi, A., Schofield, O., 2008. Effects of phytoplankton physiology onexport flux. Marine Ecology Progress Series 354, 3–19.
Kirchman, D.L., 1992. Incorporation of thymidine and leucine in the subarcticPacific: application to estimating bacterial production. Marine Ecology ProgressSeries 82, 301–309.
Knap, A.H., Michaels, A.E., Close, A., Ducklow, H.W., Dickson, A.G., 1996. Protocols forthe Joint Global Ocean Flux Study (JGOFS) core measurements. Report no 19.Bergen, Norway, UNESCO. JGOFS Report.
Koeve, W., 2005. Magnitude of excess carbon sequestration into the deep ocean andthe possible role of TEP. Marine Ecology Progress Series 291, 53–64.
Lessard, E.J., Merico, A., Tyrrell, T., 2005. Nitrate: phosphate ratios and Emilianiahuxleyi blooms. Limnology and Oceanography. 50, 1020–1024.
Logan, B.E., Passow, U., Alldredge, A.L., Grossart, H.-P., Simon, M., 1995. Rapidformation and sedimentation of large aggregates is predictable from coagula-tion rates (half-lives) of transparent exopolymer particles (TEP). Deep SeaResearch Part II 42, 203–214.
Maranon, E., Gonzalez, N., 1997. Primary production, calcification and macromo-lecular synthesis in a bloom of the coccolithophore Emiliania huxleyi in the NorthSea. Marine Ecology Progress Series 157, 61–77.
Margalef, R. 1997. Our Biosphere, Oldendorf/Luhe, Germany.Marra, J., 2002. Approaches to the measurement of plankton production. In:
Williams, P.J.l.B., Thomas, D.N., Reynolds, C.S. (Eds.), Phytoplankton Productiv-ity: Carbon Assimilation in Marine and Freshwater Ecosystems. Blackwell,Cambridge, pp. 78–108.
Murata, A., Takizawa, T., 2002. Impact of a coccolithophorid bloom on the CO2
system in surface waters of the eastern Bering Sea shelf. Geophysical ResearchLetters 29, 1547.
Nanninga, H.J., Tyrrell, T., 1996. Importance of light for the formation of algal bloomsby Emiliania huxleyi. Marine Ecology Progress Series 136, 195–203.
Nimer, N.A., Brownlee, C., Merrett, M.J., 1994. Carbon dioxide availability, intracel-lular pH and growth rate of the coccolithophore Emiliania huxleyi. MarineEcology Progress Series 109, 257–262.
Orr, J.C., Fabry, V.J., Aumont, O., Bopp, L., Doney, S.C., Feely, R.A., Gnanadesikan, A.,Gruber, N., Ishida, A., Joos, F., Key, R.M., Lindsay, K., Maier-Reimer, E.,Matear, R., Monfray, P., Mouchet, A., Najjar, R.G., Plattner, G.-K., Rodgers, K.B.,Sabine, C.L., Sarmiento, J.L., Schlitzer, R., Slater, R.D., Totterdell, I.J., Weirig, M.-F.,Yamanaka, Y., Yool, A., 2005. Anthropogenic ocean acidification over thetwenty-first century and its impact on calcifying organisms. Nature 437,681–686.
Paasche, E., 1973. Silicon and the ecology of marine plankton diatoms. II. silicate-uptake kinetics in five diatom species. Marine Biology 19, 262–269.
Passow, U., 2002. Transparent exopolymer particles (TEP) in aquatic environments.Progress in Oceanography 55, 287–333.
Pingree, R.D., 1993. Flow of surface waters to the west of the British Isles and in theBay of Biscay. Deep Sea Research Part II 40, 369–388.
Pingree, R.D., Le Cann, B., 1989. Celtic and Armorican shelf and slope residualcurrents. Progress in Oceanography 23, 303–338.
Pingree, R.D., Mardell, G.T., New, A.L., 1986. Propagation of internal tides from theupper slopes of the Bay of Biscay. Nature 321, 154–158.
Pingree, R.D., New, A.L., 1995. Structure, seasonal development and sunglint spatialcoherence of the internal tide on the Celtic and Armorican shelves and in the Bayof Biscay. Deep Sea Research Part I 42, 245–284.
Pingree, R.D., Sinha, B., Griffiths, C.R., 1999. Seasonality of the European slopecurrent (Goban Spur) and ocean margin exchange. Continental Shelf Research19, 929–975.
Purdie, D.A., Finch, M., 1994. The impact of a coccolithophorid bloom ondissolved carbon dioxide in sea water enclosures in a Norwegian Fjord. Sarsia 79,379–387.
Rees, A.P., Woodward, E.M., Robinson, C., Cummings, D.G., Tarran, G.A., Joint, I., 2002.Size-fractionated nitrogen uptake and carbon fixation during a developingcoccolithophore bloom in the North Sea during June 1999. Deep Sea ResearchPart II 49, 2905–2927.
Riebesell, U., Zondervan, I., Rost, B., Tortell, P.D., Zeebe, R.E., Morel, F.M.M., 2000.Reduced calcification of marine plankton in response of increased atmosphericCO2. Nature 407, 364–367.
Riebesell, U., Schulz, K.G., Bellerby, R.G.J., Botros, M., Fritsche, P., Meyerhofer, M.,Neill, C., Nondal, G., Oschlies, A., Wohlers, J., Zollner, E., 2007. Enhancedbiological carbon consumption in a high CO2 ocean. Nature 450, 545–548.
Riegman, R., Stolte, W., Noordeloos, A.A.M., Slezak, D., 2000. Nutrient uptake andalkaline phosphatase (ec 3:1:3:1) activity of Emiliania huxleyi (prymnesiophy-ceae) during growth under N and P limitation in continuous cultures. Journal ofPhycology 36, 87–96.
Robertson, J.E., Robinson, C., Turner, D.R., Holligan, P., Watson, A.J., Boyd, P.W.,Fernandez, E., Finch, M., 1994. The impact of a coccolithophore bloom on oceanic
J. Harlay et al. / Deep-Sea Research I 58 (2011) 111–127126

Author's personal copy
carbon uptake in the northeast Atlantic during summer 1991. Deep Sea ResearchPart I 41, 297–314.
Robinson, C., Widdicombe, C.E., Zubkov, M.V., Tarran, G.A., Miller, A.E.J., Rees, A.P.,2002. Plankton community respiration during a coccolithophore bloom. DeepSea Research Part II 49, 2929–2950.
Rost, B., Riebesell, U., 2004. Coccolithophores and the biological pump: responses toenvironmental changes. In: Thierstein, H.R., Young, J.R. (Eds.), Coccolithophores.From Molecular Processes to Global Impact, pp. 99–127.
Sciandra, A., Harlay, J., Lef�evre, D., Lemee, R., Rimmelin, P., Denis, M., Gattuso, J.-P.,2003. Response of coccolithophorid Emiliania huxleyi to elevated partialpressure of CO2 under nitrogen limitation. Marine Ecology Progress Series 261,111–122.
Sharples, J., Tweddle, J.F., Green, J.A.M., Palmer, M.R., Kim, Y.-N., Hickman, A.E.,Holligan, P.M., Moore, C.M., Rippeth, T.P., Simpson, J.H., Krivtsov, V., 2007.Spring-neap modulation of internal tide mixing and vertical nitrate fluxes at ashelf edge in summer. Limnology and Oceanography 52, 1735–1747.
Sharples, J., Moore, C.M., Hickman, A.E., Holligan, P.M., Tweddle, J.F., Palmer, M.R.,Simpson, J.H., 2009. Internal tidal mixing as a control on continental nmarginecosystems. Geophysical Research Letters 36, L23603.
Smith, W.H., Sandwell, D.T., 1997. Global sea floor topography from satellitealtimetry and ship depth soundings. Science 277, 1956–1962.
Suykens, K., Delille, B., Chou, L., De Bodt, C., Harlay, J., Borges, A.V., 2010a.Dissolved inorganic carbon dynamics and air–sea carbon dioxide fluxes
during coccolithophorid blooms in the Northwest European continentalmargin (northern Bay of Biscay). Global Biogeochemical Cycles 24,GB3022. doi:10.1029/2009GB003730.
Suykens, K., Schmidt, S., Delille, B., Chou, L., De Bodt, C., Harlay, J., Fagel, N., Borges, A.V.
2010b. Benthic remineralization in the northwest European continental margin(northern Bay of Biscay). Continental Shelf Research, Submitted for publication.
Van den Meersche, K., Soetaert, K., Middelburg, J.J., 2008. A Bayesian compositionalestimator for microbial taxonomy based on biomarkers. Limnology and
Oceanography Methods 6, 190–199.
van der Wal, P., Kempers, R.S., Veldhuis, M.J.W., 1995. Production and downwardflux of organic matter and calcite in a North Sea bloom of the coccolithophoreEmiliania huxleyi. Marine Ecology Progress Series 126, 247–265.
Wollast, R., Chou, L., 2001. The carbon cycle at the ocean margin in the northern Gulf
of Biscay. Deep Sea Research Part II 48, 3265–3293.
Wright, S.W., Jeffrey, S.W., 1997. High-resolution HPLC system for chlorophylls andcarotenoids of marine phytoplankton. In: Jeffrey, S.W., Mantoura, R.F.C., Wright,S.W. (Eds.), Phytoplankton pigments in oceanography. UNESCO Publishing, pp.
327–341.
Yentsch, C.S., Menzel, D.W., 1963. A method for the determination of phytoplanktonchlorophyll and phaeophytin by fluorescence. Deep Sea Research and Oceano-graphic Abstracts 10, 221–231.
J. Harlay et al. / Deep-Sea Research I 58 (2011) 111–127 127
Copyright © 2022 FDOKUMEN