Coccolithophore export production during the 1997–1998 El Niño event in Santa Barbara Basin...
19
Coccolithophore export production during the 1997–1998 El Nin ˜o event in Santa Barbara Basin (California) Bianca De Bernardi a,b, T , Patrizia Ziveri b , Elisabetta Erba a , Robert C. Thunell c a Department of Earth Sciences bArdito DesioQ, University of Milan, Via Mangiagalli 34, 20133, Milano, Italy b Department of Paleoecology and Paleoclimatology, Fac. of Earth and Life Sciences, Vrije Universiteit Amsterdam, The Netherlands c Department of Geological Sciences, University of South Carolina, Columbia, South Carolina 29208, USA Received 24 May 2004; received in revised form 18 January 2005; accepted 1 February 2005 Abstract The response of coccolithophore export production to non-El Nin ˜o and El Nin ˜o conditions was monitored during a two year period (26 March 1996–3 April 1998) in the centre of the Santa Barbara Basin (34814V N; 120802V W), California borderland. During the 1997–1998 El Nin ˜o the seasonal cycle of the surface water conditions was altered by the presence of a relatively warm, low-nutrient and low-salinity water mass. Throughout the studied period, the total mass flux is dominated by lithogenic components with terrigenous input being highest during El Nin ˜o period. Although the annual biogenic sediment fluxes were largely dominated by silica, with diatoms as the major contributor to the opal flux, the coccolith flux was high during the entire studied period. During winter 1998 carbonate fluxes were unusually high for this time of the year. Moreover, a strong positive correlation between organic carbon and opal flux indicates that siliceous phytoplankton production is the most important factor controlling organic carbon flux in the Santa Barbara Basin. A positive correlation between carbonate and organic carbon fluxes existed indeed during the final phase of El Nin ˜o, when the correlation between organic carbon and opal fluxes is poor. The sinking coccolithophore assemblage was dominated by Emiliania huxleyi , followed by Florisphaera profunda , Umbilicosphaera sibogae , Gephyrocapsa oceanica , Helicosphaera carteri , Gephyrocapsa muellerae and Calcidiscus leptoporus . The intensification of El Nin ˜ o 1997–1998 conditions altered the typical hydrographic structure of the Santa Barbara Basin weakening the spring upwelling as reflected by reduced diatom fluxes. In contrast, the coccolith flux was relatively high during El Nin ˜o, particularly for the tropical species G. oceanica, that showed a pronounced increase in its flux when the spring upwelling was reduced under El Nin ˜ o conditions. In addition, we have found that this species has a strong correlation with nitrite, phosphate and iron availability in surface water. D 2005 Elsevier B.V. All rights reserved. Keywords: coccolithophores; phytoplankton; sediment trap; Santa Barbara Basin; El Nin ˜o Southern oscillation 0377-8398/$ - see front matter D 2005 Elsevier B.V. All rights reserved. doi:10.1016/j.marmicro.2005.02.003 T Corresponding author. Fax: +39 0250315494. E-mail address: [email protected] (B. De Bernardi). Marine Micropaleontology 55 (2005) 107 – 125 www.elsevier.com/locate/marmicro
Transcript of Coccolithophore export production during the 1997–1998 El Niño event in Santa Barbara Basin...

www.elsevier.com/locate/marmicro
Marine Micropaleontology
Coccolithophore export production during the 1997–1998 El Nino
event in Santa Barbara Basin (California)
Bianca De Bernardia,b,T, Patrizia Ziverib, Elisabetta Erbaa, Robert C. Thunellc
aDepartment of Earth Sciences bArdito DesioQ, University of Milan, Via Mangiagalli 34, 20133, Milano, ItalybDepartment of Paleoecology and Paleoclimatology, Fac. of Earth and Life Sciences, Vrije Universiteit Amsterdam, The Netherlands
cDepartment of Geological Sciences, University of South Carolina, Columbia, South Carolina 29208, USA
Received 24 May 2004; received in revised form 18 January 2005; accepted 1 February 2005
Abstract
The response of coccolithophore export production to non-El Nino and El Nino conditions was monitored during a two
year period (26 March 1996–3 April 1998) in the centre of the Santa Barbara Basin (34814V N; 120802V W), California
borderland. During the 1997–1998 El Nino the seasonal cycle of the surface water conditions was altered by the presence
of a relatively warm, low-nutrient and low-salinity water mass. Throughout the studied period, the total mass flux is
dominated by lithogenic components with terrigenous input being highest during El Nino period. Although the annual
biogenic sediment fluxes were largely dominated by silica, with diatoms as the major contributor to the opal flux, the
coccolith flux was high during the entire studied period. During winter 1998 carbonate fluxes were unusually high for this
time of the year. Moreover, a strong positive correlation between organic carbon and opal flux indicates that siliceous
phytoplankton production is the most important factor controlling organic carbon flux in the Santa Barbara Basin. A
positive correlation between carbonate and organic carbon fluxes existed indeed during the final phase of El Nino, when
the correlation between organic carbon and opal fluxes is poor. The sinking coccolithophore assemblage was dominated by
Emiliania huxleyi, followed by Florisphaera profunda, Umbilicosphaera sibogae, Gephyrocapsa oceanica, Helicosphaera
carteri, Gephyrocapsa muellerae and Calcidiscus leptoporus. The intensification of El Nino 1997–1998 conditions altered
the typical hydrographic structure of the Santa Barbara Basin weakening the spring upwelling as reflected by reduced
diatom fluxes. In contrast, the coccolith flux was relatively high during El Nino, particularly for the tropical species G.
oceanica, that showed a pronounced increase in its flux when the spring upwelling was reduced under El Nino conditions.
In addition, we have found that this species has a strong correlation with nitrite, phosphate and iron availability in surface
water.
D 2005 Elsevier B.V. All rights reserved.
Keywords: coccolithophores; phytoplankton; sediment trap; Santa Barbara Basin; El Nino Southern oscillation
0377-8398/$ - s
doi:10.1016/j.m
T Correspondi
E-mail addr
55 (2005) 107–125
ee front matter D 2005 Elsevier B.V. All rights reserved.
armicro.2005.02.003
ng author. Fax: +39 0250315494.
ess: [email protected] (B. De Bernardi).

B. De Bernardi et al. / Marine Micropaleontology 55 (2005) 107–125108
1. Introduction
Coccolithophores constitute one of the major
groups of marine phytoplankton and are most
abundant in the warm, stratified waters of low
latitude regions (Honjo and Okada, 1974; Cortes et
al., 2001). In coastal upwelling environments, several
studies (Winter, 1985; Ziveri et al., 1995a; Broerse,
2000) have shown that coccolithophores can be
important contributors to the phytoplankton com-
munity. Using a time series of sediment trap samples
collected from the Santa Barbara Basin (SBB) we
monitored the response of the coccolithophores to
seasonal hydrographic changes in this part of the
California Borderlands. During late 1997 and early
1998 the coastal ocean off western North America
was anomalously warm due to one of the strongest
episodes of El Nino (EN) ever recorded (McPhaden,
1999). Previous works in this basin, during this EN
anomaly, have shown a deepening of the thermo-
cline, warming of surface water and reduced nutrient
concentration altering the development of the plank-
ton communities (Lange et al., 1997; Kincaid et al.,
2000; Black et al., 2001).
Fig. 1. Bathymetric map of the SBB showing the locatio
In this paper we will discuss the coccolithophore
export production at 500 m water depth in the SBB
during a two-year period (26 March 1996–3 April
1998) in response to non-EN (1996) and EN (1997–
98) conditions. These fluxes are compared with
concurrent hydrographic data collected at the trap
site. The main hypotheses that we want to test are:
(1) is there a coccolithophore community change
reflecting the EN anomaly? and (2) can coccolith
ecology be used to reconstruct paleo-EN conditions
in this region?
2. Study site
The SBB is the northern-most basin of the
Southern California Borderlands (Fig. 1). Seasonal
changes in the position of the North Pacific High
and the adjacent continental thermal low result in
changes in wind speed and direction, which in turn
control the strength of the California Current. During
the spring and early summer, prevailing northerly
winds cause Ekman-induced strong upwelling (Hen-
dershott and Winant, 1996; Harms and Winant,
n of the sediment trap mooring used in this study.
B. De Bernardi et al. / Marine Micropaleontology 55 (2005) 107–125 109
1998). In our study period (March 1996–April 1998)
the upwelling interval was clearly identified by
isotherms shoaling (Fig. 2). During fall and winter,
the northerly component of the wind weakens,
upwelling is diminished and precipitation and runoff
are typically enhanced (Soutar and Crill, 1977;
Thunell et al., 1995). During EN anomalies the
California Current weakens and warm tropical–sub-
tropical waters propagate northward, along the west-
ern margin of North America.
2.1. ENSO’s indices
The oceanographic conditions of SBB are strongly
seasonal with winds controlling the intensity of the
California Current. Quasi-periodic anomalies to this
pattern are associated with the El Nino Southern
Oscillation (ENSO), the most important coupled
ocean–atmosphere phenomenon to cause global cli-
mate variability at interannual time scale. EN anom-
aly, representing the warm phase of ENSO, is a
disruption of the ocean–atmosphere system in the
tropical Pacific which has important consequences for
global weather patterns. EN conditions are usually
followed by La Nina (LN), a series of colder than
normal ocean waters in the equatorial Pacific.
The 1997–98 EN event represents one of the most
intense EN in the last 120 years, with major climatic
impacts felt around the world (McPhaden, 1999).
There are a number of indices that quantify the
presence and intensity of EN (Wolter and Timlin,
1998). Two indices were used in this study (Fig. 2).
The first one is the Multivariate ENSO Index (MEI)
based on six main variables over the tropical Pacific:
sea level pressure, zonal and meridional components
of the surface wind, sea surface temperature, surface
air temperature and total cloudiness (all values are
normalized for each bimonthly period). Data on MEI
are available at: http://www.cdc.noaa.gov/people/
klaus.wolter/MEI/table.html. Positive values represent
the EN phase of ENSO.
The second index, Northern Oscillation Index
(NOI; Schwing et al., 2002a), is based on the
difference in sea level pressure anomaly at the North
Pacific High (northeast Pacific—358N, 1308W) and
near Darwin (Australia—108S, 1308E). The non-
normalized NOI data are available on line at: http://
www.pfeg.noaa.gov. NOI is negative during EN
conditions and negatively correlated with the MEI.
The strong correlation between these two independent
climatic indices confirms that the atmosphere and the
ocean are strongly coupled during EN and non-EN
conditions in the Northeast Pacific (Schwing et al.,
2002b).
Using the NOI and MEI indices, we have
subdivided the study interval into three main periods
(Fig. 2): I) period A (non-EN conditions), from March
1996 though February 1997; II) period B (transition
phase—rapid growth from neutral to EN), from March
1997 up to July 1997, and III) period C (EN mature
phase), from August 1997 up to April 1998. In this
last period the EN was very strong with a slight
weakening in October–December 1997.
2.2. Climatic and surface hydrographic settings
Surface water temperatures in SBB show a
distinct seasonal pattern (Fig. 2). During spring
upwelling in 1996 the upper 50 m of the water
column recorded temperatures between 15 and 10
8C. In contrast, the stratified surface waters in the
summer reached 19 8C (July–August). During EN
conditions, temperature, salinity and density of the
upper 75 m changed significantly (Shipe and
Brzezinski, 2001). Temperature anomalies were
exceptionally large between spring 1997 and summer
1998. Dever and Winant (2002) observed two peaks
in temperature anomalies (increase up to 4 8C): thefirst one in June 1997 and the second one from the
end of September 1997 to February 1998 (with
maximum in November 1997 through January 1998).
The 1997 spring was characterized by an intense but
short upwelling period (March–May) as shown by
shoaling of isotherms (Fig. 2). The first peak in the
temperature anomaly started in June 1997 with a
delay of about three months from the beginning of
EN as identified by NOI and MEI indices. This
temperature anomaly showed maximum amplitude at
the surface and decreased quickly with depth and
towards the north. The warmest sea surface waters in
this period occurred in October 1997 (21.1 8C; ~48C higher than the previous year) and identify the
mature phase of EN in SBB. The water temperature
decreased rapidly at the end of 1997 and early 1998.
Nutrient levels during the EN 97–98 were unusu-
ally low for this region. In a site near our trap location,
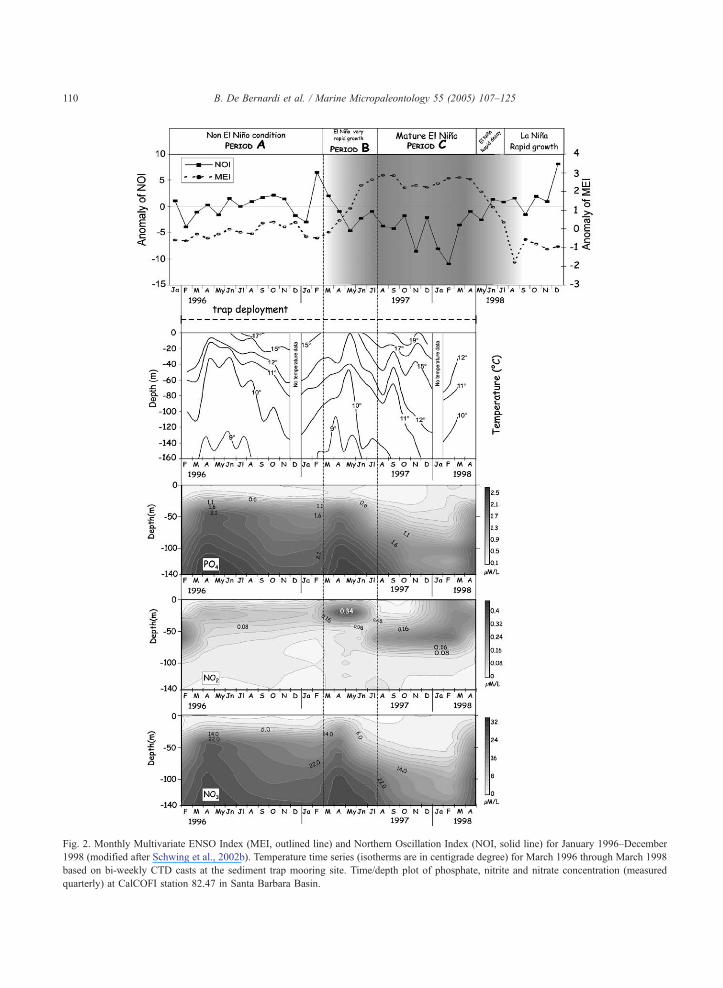
Fig. 2. Monthly Multivariate ENSO Index (MEI, outlined line) and Northern Oscillation Index (NOI, solid line) for January 1996–December
1998 (modified after Schwing et al., 2002b). Temperature time series (isotherms are in centigrade degree) for March 1996 through March 1998
based on bi-weekly CTD casts at the sediment trap mooring site. Time/depth plot of phosphate, nitrite and nitrate concentration (measured
quarterly) at CalCOFI station 82.47 in Santa Barbara Basin.
B. De Bernardi et al. / Marine Micropaleontology 55 (2005) 107–125110

B. De Bernardi et al. / Marine Micropaleontology 55 (2005) 107–125 111
Shipe et al. (2002) observed that nitrate concentrations
from the surface to 75 m depth were b2.0 AM/l in
November 1997, while during the fall–early winter of
the previous year nitrate concentrations ranged
between 10 and 20 AM/l. However, during spring
1997, when the nutrient concentrations were
dnormallyT high, the nitrate concentration was above
average (Fig. 2) and returned below average in August
1997. Between October 1997 and January 1998
dissolved silicon and phosphate concentrations in
the upper 75 m were also below average (b5 AM/l
and b0.45 AM/l, respectively; Shipe et al., 2002).
Moreover, there was an abrupt decrease in density in
June 1997 and an unusually low density and low
salinity water mass remained in the channel until the
spring 1998.
3. Materials and methods
Sediment trap samples were recovered from the
centre of the SBB (34814V N; 120802V W), using a
Mark VI instrument between 26 March 1996 and 8
April 1998. The sediment trap was recovered and
redeployed every 6 months. Two hiatuses (attributed
to clogging to the trap during two different periods)
exist in the data set, one of 19 days between 10 and 23
September 1996 and the other one of 58 days,
between 24 March and 21 May 1997. The mooring
was deployed in 540 m water depth, with the sediment
trap positioned ~50 m above the sea floor. The 52
samples used in this study represent two years of
sedimentation; each sample represents a two-week
collection period except for the interval from 22 May
1997 to 25 June 1997 when the sampling resolution
increased to 7 days. Hydrographic data (temperature,
conductivity and density) were collected at the trap
site with two- to four-week intervals using a Sea Bird
Seacat 19 Profile fitted with an oxygen sensor and a
transmissometer. Nutrient concentrations for CalCOFI
(Scripps Institution of Oceanography) station 82.47 of
cruises 9602, 9604, 9608, 9702, 9704, 9707, 9709,
9802, and 9804 (www.mlrg.ucsd.edu/calcofi.html)
were used to construct Fig. 2. We generated 45-days
by 5 m data matrix from the original CalCOFI data-set
by a linear interpolation algorithm used to preserve
true data points. Prior to trap deployment, in each
sample cup, a buffered sodium acid solution was
placed as poison. Upon recovery, samples were
refrigerated and poisoned with HgCl2. Organic
carbon, calcium carbonate, biogenic silica and litho-
genic particle were determined by the methods
described in Thunell (1998a). For the iron mass
determination in the sediment trap samples, we used a
sample aliquot equal to the one for coccolith flux
quantification (see below). For the sample preparation
and analysis of iron concentration, we followed the
method described for carbonate fine fraction in
Broerse (2000).
For the coccolith analysis, aliquots of each sample
were wet split (1/6400) by a rotary precision splitter
(McLane WSD-10-deviation between aliquot b4%).
Two aliquots for each sample were selected for
coccosphere and coccolith flux quantification. For
coccolith analyses, the organic matter was oxidized
following the procedure described in Bairbakhish et
al. (1999). Each aliquot was then wet sieved under 32
Am mesh and the b32 Am fraction was filtered on
Millipore filter (HTTP 0.45 Am pore size; 47 mm
diameter). For coccosphere analysis we used the un-
oxidized aliquot (1/6400) b32 Am, and used a similar
filtering procedure. A portion of the filter was
mounted on a glass slide and fixed with Canada
balsam. For quantitative analysis of coccolithophores
we used a Leitz Laborlux microscope with parallel
and crossed nicols at �1250 magnification. Cocco-
liths and coccospheres were counted along several
parallel scans from the border to the center of the
filter, on an area of 3 and 14 mm2, respectively. The
numbers of coccoliths and coccospheres counted were
extrapolated for the entire samples using the method
described in Ziveri et al. (1999). The uniformity in the
coccolithophore distribution on the filter surface was
tested on representative samples from different pro-
duction episodes (during non-EN and EN periods) by
counting in various areas of the filter, ranging from
the border to the centre (deviation b6%). To check the
sieving efficiency, the taxonomic composition and to
evaluate coccolith preservation we used scanning
electron microscopy (SEM).
Using temperature, nitrite, nitrate, phosphate and
iron concentrations, we calculated the environmental
variables, in accordance with Legendre and Legendre
(1998). To avoid collinearity, we first used a Principal
Component Analysis (PCA) method on our environ-
mental data, applying Canoco software for Windows
B. De Bernardi et al. / Marine Micropaleontology 55 (2005) 107–125112
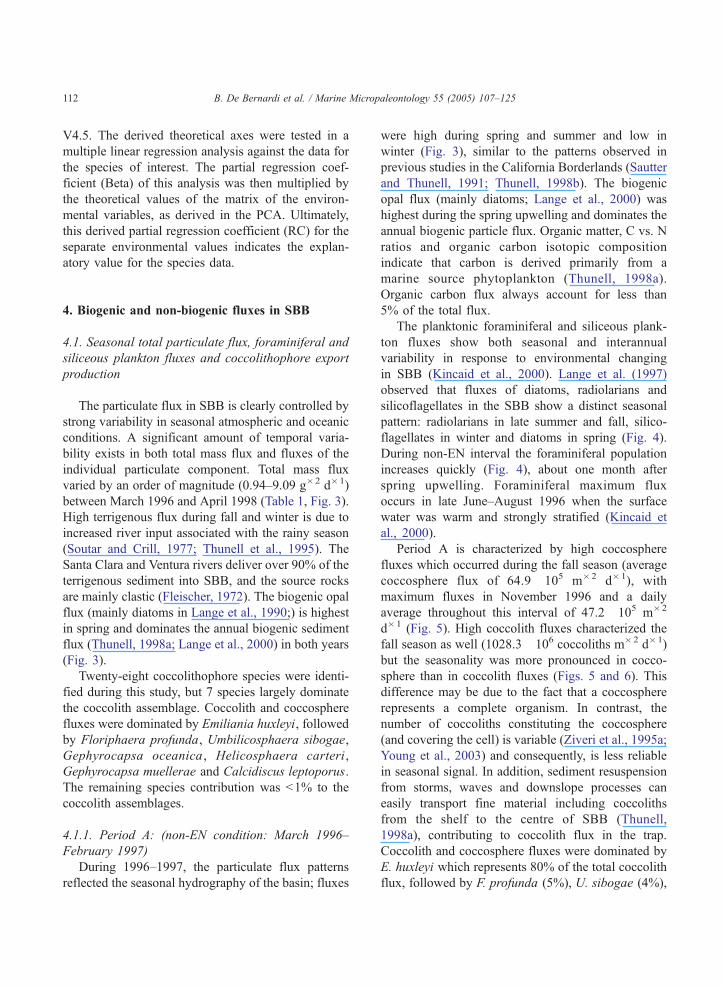
V4.5. The derived theoretical axes were tested in a
multiple linear regression analysis against the data for
the species of interest. The partial regression coef-
ficient (Beta) of this analysis was then multiplied by
the theoretical values of the matrix of the environ-
mental variables, as derived in the PCA. Ultimately,
this derived partial regression coefficient (RC) for the
separate environmental values indicates the explan-
atory value for the species data.
4. Biogenic and non-biogenic fluxes in SBB
4.1. Seasonal total particulate flux, foraminiferal and
siliceous plankton fluxes and coccolithophore export
production
The particulate flux in SBB is clearly controlled by
strong variability in seasonal atmospheric and oceanic
conditions. A significant amount of temporal varia-
bility exists in both total mass flux and fluxes of the
individual particulate component. Total mass flux
varied by an order of magnitude (0.94–9.09 g�2 d�1)
between March 1996 and April 1998 (Table 1, Fig. 3).
High terrigenous flux during fall and winter is due to
increased river input associated with the rainy season
(Soutar and Crill, 1977; Thunell et al., 1995). The
Santa Clara and Ventura rivers deliver over 90% of the
terrigenous sediment into SBB, and the source rocks
are mainly clastic (Fleischer, 1972). The biogenic opal
flux (mainly diatoms in Lange et al., 1990;) is highest
in spring and dominates the annual biogenic sediment
flux (Thunell, 1998a; Lange et al., 2000) in both years
(Fig. 3).
Twenty-eight coccolithophore species were identi-
fied during this study, but 7 species largely dominate
the coccolith assemblage. Coccolith and coccosphere
fluxes were dominated by Emiliania huxleyi, followed
by Floriphaera profunda, Umbilicosphaera sibogae,
Gephyrocapsa oceanica , Helicosphaera carteri ,
Gephyrocapsa muellerae and Calcidiscus leptoporus.
The remaining species contribution was b1% to the
coccolith assemblages.
4.1.1. Period A: (non-EN condition: March 1996–
February 1997)
During 1996–1997, the particulate flux patterns
reflected the seasonal hydrography of the basin; fluxes
were high during spring and summer and low in
winter (Fig. 3), similar to the patterns observed in
previous studies in the California Borderlands (Sautter
and Thunell, 1991; Thunell, 1998b). The biogenic
opal flux (mainly diatoms; Lange et al., 2000) was
highest during the spring upwelling and dominates the
annual biogenic particle flux. Organic matter, C vs. N
ratios and organic carbon isotopic composition
indicate that carbon is derived primarily from a
marine source phytoplankton (Thunell, 1998a).
Organic carbon flux always account for less than
5% of the total flux.
The planktonic foraminiferal and siliceous plank-
ton fluxes show both seasonal and interannual
variability in response to environmental changing
in SBB (Kincaid et al., 2000). Lange et al. (1997)
observed that fluxes of diatoms, radiolarians and
silicoflagellates in the SBB show a distinct seasonal
pattern: radiolarians in late summer and fall, silico-
flagellates in winter and diatoms in spring (Fig. 4).
During non-EN interval the foraminiferal population
increases quickly (Fig. 4), about one month after
spring upwelling. Foraminiferal maximum flux
occurs in late June–August 1996 when the surface
water was warm and strongly stratified (Kincaid et
al., 2000).
Period A is characterized by high coccosphere
fluxes which occurred during the fall season (average
coccosphere flux of 64.9�105 m�2 d�1), with
maximum fluxes in November 1996 and a daily
average throughout this interval of 47.2�105 m�2
d�1 (Fig. 5). High coccolith fluxes characterized the
fall season as well (1028.3�106 coccoliths m�2 d�1)
but the seasonality was more pronounced in cocco-
sphere than in coccolith fluxes (Figs. 5 and 6). This
difference may be due to the fact that a coccosphere
represents a complete organism. In contrast, the
number of coccoliths constituting the coccosphere
(and covering the cell) is variable (Ziveri et al., 1995a;
Young et al., 2003) and consequently, is less reliable
in seasonal signal. In addition, sediment resuspension
from storms, waves and downslope processes can
easily transport fine material including coccoliths
from the shelf to the centre of SBB (Thunell,
1998a), contributing to coccolith flux in the trap.
Coccolith and coccosphere fluxes were dominated by
E. huxleyi which represents 80% of the total coccolith
flux, followed by F. profunda (5%), U. sibogae (4%),
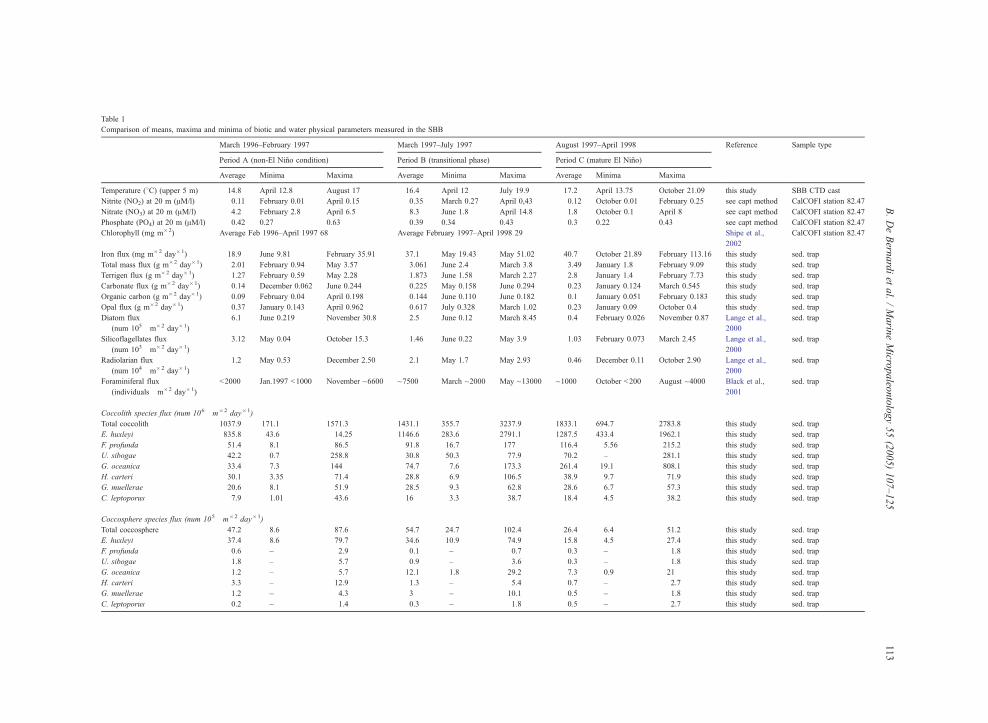
Table 1
Comparison of means, maxima and minima of biotic and water physical parameters measured in the SBB
March 1996–February 1997 March 1997–July 1997 August 1997–April 1998 Reference Sample type
Period A (non-El Nino condition) Period B (transitional phase) Period C (mature El Nino)
Average Minima Maxima Average Minima Maxima Average Minima Maxima
Temperature (8C) (upper 5 m) 14.8 April 12.8 August 17 16.4 April 12 July 19.9 17.2 April 13.75 October 21.09 this study SBB CTD cast
Nitrite (NO2) at 20 m (AM/l) 0.11 February 0.01 April 0.15 0.35 March 0.27 April 0,43 0.12 October 0.01 February 0.25 see capt method CalCOFI station 82.47
Nitrate (NO3) at 20 m (AM/l) 4.2 February 2.8 April 6.5 8.3 June 1.8 April 14.8 1.8 October 0.1 April 8 see capt method CalCOFI station 82.47
Phosphate (PO4) at 20 m (AM/l) 0.42 0.27 0.63 0.39 0.34 0.43 0.3 0.22 0.43 see capt method CalCOFI station 82.47
Chlorophyll (mg m�2) Average Feb 1996–April 1997 68 Average February 1997–April 1998 29 Shipe et al.,
2002
CalCOFI station 82.47
Iron flux (mg m�2 day�1) 18.9 June 9.81 February 35.91 37.1 May 19.43 May 51.02 40.7 October 21.89 February 113.16 this study sed. trap
Total mass flux (g m�2 day�1) 2.01 February 0.94 May 3.57 3.061 June 2.4 March 3.8 3.49 January 1.8 February 9.09 this study sed. trap
Terrigen flux (g m�2 day�1) 1.27 February 0.59 May 2.28 1.873 June 1.58 March 2.27 2.8 January 1.4 February 7.73 this study sed. trap
Carbonate flux (g m�2 day�1) 0.14 December 0.062 June 0.244 0.225 May 0.158 June 0.294 0.23 January 0.124 March 0.545 this study sed. trap
Organic carbon (g m�2 day�1) 0.09 February 0.04 April 0.198 0.144 June 0.110 June 0.182 0.1 January 0.051 February 0.183 this study sed. trap
Opal flux (g m�2 day�1) 0.37 January 0.143 April 0.962 0.617 July 0.328 March 1.02 0.23 January 0.09 October 0.4 this study sed. trap
Diatom flux
(num 105�m�2 day�1)
6.1 June 0.219 November 30.8 2.5 June 0.12 March 8.45 0.4 February 0.026 November 0.87 Lange et al.,
2000
sed. trap
Silicoflagellates flux
(num 103�m�2 day�1)
3.12 May 0.04 October 15.3 1.46 June 0.22 May 3.9 1.03 February 0.073 March 2.45 Lange et al.,
2000
sed. trap
Radiolarian flux
(num 104�m�2 day�1)
1.2 May 0.53 December 2.50 2.1 May 1.7 May 2.93 0.46 December 0.11 October 2.90 Lange et al.,
2000
sed. trap
Foraminiferal flux
(individuals�m�2 day�1)
b2000 Jan.1997 b1000 November ~6600 ~7500 March ~2000 May ~13000 ~1000 October b200 August ~4000 Black et al.,
2001
sed. trap
Coccolith species flux (num 106�m�2 day�1)
Total coccolith 1037.9 171.1 1571.3 1431.1 355.7 3237.9 1833.1 694.7 2783.8 this study sed. trap
E. huxleyi 835.8 43.6 14.25 1146.6 283.6 2791.1 1287.5 433.4 1962.1 this study sed. trap
F. profunda 51.4 8.1 86.5 91.8 16.7 177 116.4 5.56 215.2 this study sed. trap
U. sibogae 42.2 0.7 258.8 30.8 50.3 77.9 70.2 – 281.1 this study sed. trap
G. oceanica 33.4 7.3 144 74.7 7.6 173.3 261.4 19.1 808.1 this study sed. trap
H. carteri 30.1 3.35 71.4 28.8 6.9 106.5 38.9 9.7 71.9 this study sed. trap
G. muellerae 20.6 8.1 51.9 28.5 9.3 62.8 28.6 6.7 57.3 this study sed. trap
C. leptoporus 7.9 1.01 43.6 16 3.3 38.7 18.4 4.5 38.2 this study sed. trap
Coccosphere species flux (num 105�m�2 day�1)
Total coccosphere 47.2 8.6 87.6 54.7 24.7 102.4 26.4 6.4 51.2 this study sed. trap
E. huxleyi 37.4 8.6 79.7 34.6 10.9 74.9 15.8 4.5 27.4 this study sed. trap
F. profunda 0.6 – 2.9 0.1 – 0.7 0.3 – 1.8 this study sed. trap
U. sibogae 1.8 – 5.7 0.9 – 3.6 0.3 – 1.8 this study sed. trap
G. oceanica 1.2 – 5.7 12.1 1.8 29.2 7.3 0.9 21 this study sed. trap
H. carteri 3.3 – 12.9 1.3 – 5.4 0.7 – 2.7 this study sed. trap
G. muellerae 1.2 – 4.3 3 – 10.1 0.5 – 1.8 this study sed. trap
C. leptoporus 0.2 – 1.4 0.3 – 1.8 0.5 – 2.7 this study sed. trap
B.DeBern
ardiet
al./Marin
eMicro
paleo
ntology55(2005)107–125
113
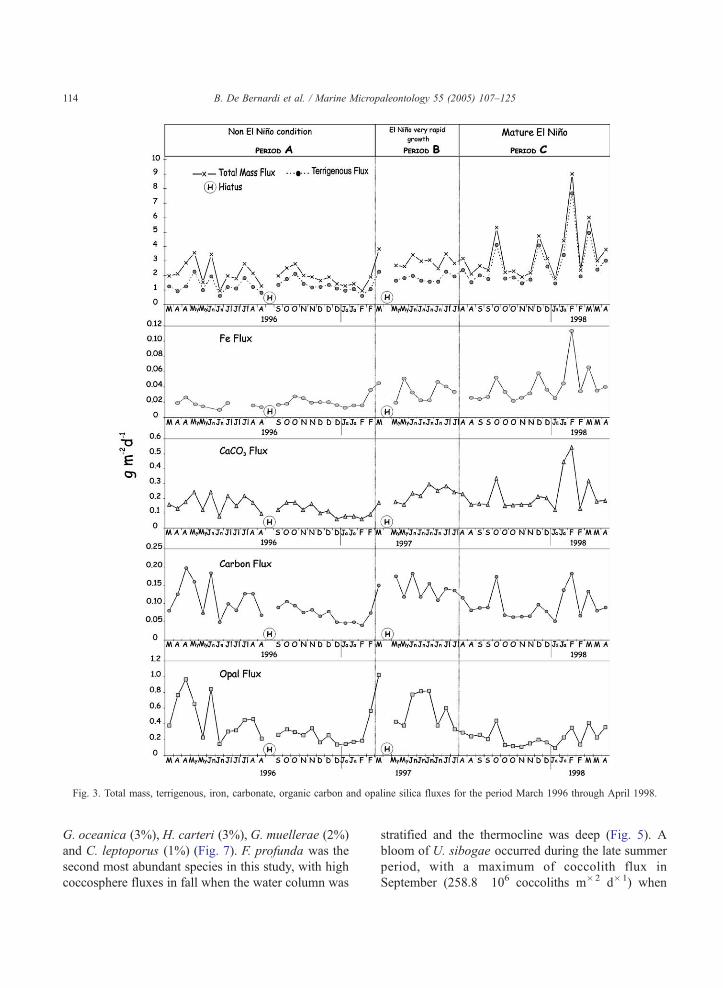
Fig. 3. Total mass, terrigenous, iron, carbonate, organic carbon and opaline silica fluxes for the period March 1996 through April 1998.
B. De Bernardi et al. / Marine Micropaleontology 55 (2005) 107–125114
G. oceanica (3%), H. carteri (3%), G. muellerae (2%)
and C. leptoporus (1%) (Fig. 7). F. profunda was the
second most abundant species in this study, with high
coccosphere fluxes in fall when the water column was
stratified and the thermocline was deep (Fig. 5). A
bloom of U. sibogae occurred during the late summer
period, with a maximum of coccolith flux in
September (258.8�106 coccoliths m�2 d�1) when

Fig. 4. Average daily fluxes of silicoflagellates, radiolarians, diatoms and foraminiferal fluxes from January 1996 to April 1998.
B. De Bernardi et al. / Marine Micropaleontology 55 (2005) 107–125 115
the column water was strongly stratified; the super-
ficial layer was warm (16 8C upper 25 m) and the
other phytoplankton groups were less abundant (Fig.
6). Fluxes of G. oceanica remained relatively low
during period A, with a minor increase in early 1997
(Fig. 5). H. carteri coccosphere and coccolith fluxes
were highest during the spring period of both years
(1996 and 1997), with maximum fluxes in March
1996 (daily average coccoliths 71.4�106 m�2 d�1)
and, February 1997 (daily average 10�105 cocco-
spheres m�2 d�1; Fig. 6) when upwelled waters
entered the basin increasing primary productivity (Fig.

Fig. 5. Coccolith (bars, scale at left) and coccosphere (line, scale at right) fluxes for the total and the major individual species of
coccolithophores in the SBB. The three main ENSO phases are also indicated.
B. De Bernardi et al. / Marine Micropaleontology 55 (2005) 107–125116
6). C. leptoporus shows low fluxes throughout period
A, except for a brief peak in July 1996 (43.6�106
coccoliths m�2 d�1).
4.1.2. Period B: (transitional phase: March 1997–
July 1997)
During this period biogeochemical fluxes increase
more than 50% and are dominated by the lithogenic
components. Starting from March 1997 foraminiferal
total flux increases enormously, reaching a peak
value of nearly 13,000 individuals m�2 d�1 at the
end of May (Fig. 4). At this time the foraminiferal
flux was more than four times greater than values
measured during the 1996 upwelling season (Black
et al., 2001).
During period B (March–June 1997) the average
coccolith flux was 1431.1�106 coccoliths m�2 d�1
and the coccosphere flux was slightly higher than
the previous period (56.1�105 coccospheres m�2
d�1) (Fig. 5). Period B is mainly characterized by
elevated fluxes of G. oceanica coccospheres. This
species shows a pronounced increase in coccosphere
flux after March 1997, with maximum flux recorded
in June 1997 (29.2�105 coccospheres m�2 d�1)
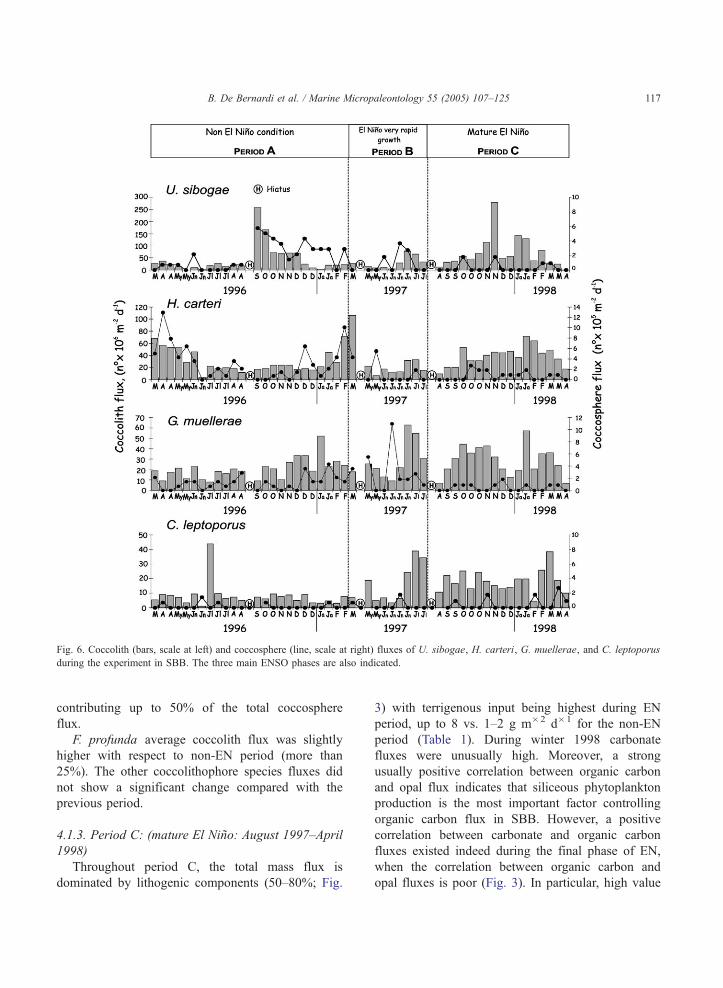
Fig. 6. Coccolith (bars, scale at left) and coccosphere (line, scale at right) fluxes of U. sibogae, H. carteri, G. muellerae, and C. leptoporus
during the experiment in SBB. The three main ENSO phases are also indicated.
B. De Bernardi et al. / Marine Micropaleontology 55 (2005) 107–125 117
contributing up to 50% of the total coccosphere
flux.
F. profunda average coccolith flux was slightly
higher with respect to non-EN period (more than
25%). The other coccolithophore species fluxes did
not show a significant change compared with the
previous period.
4.1.3. Period C: (mature El Nino: August 1997–April
1998)
Throughout period C, the total mass flux is
dominated by lithogenic components (50–80%; Fig.
3) with terrigenous input being highest during EN
period, up to 8 vs. 1–2 g m�2 d�1 for the non-EN
period (Table 1). During winter 1998 carbonate
fluxes were unusually high. Moreover, a strong
usually positive correlation between organic carbon
and opal flux indicates that siliceous phytoplankton
production is the most important factor controlling
organic carbon flux in SBB. However, a positive
correlation between carbonate and organic carbon
fluxes existed indeed during the final phase of EN,
when the correlation between organic carbon and
opal fluxes is poor (Fig. 3). In particular, high value
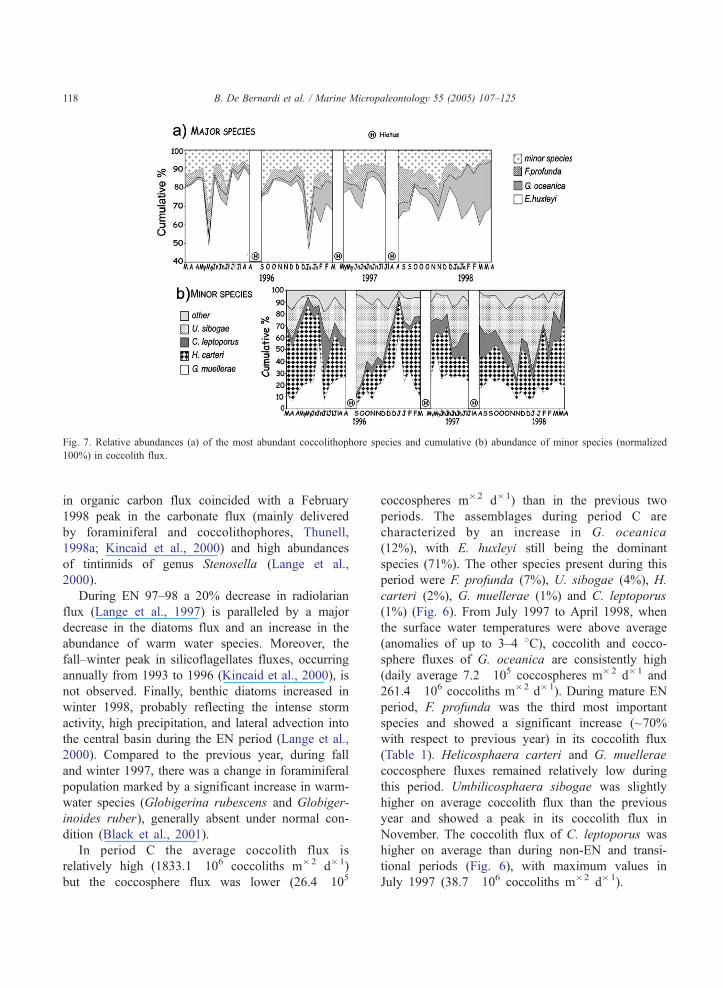
Fig. 7. Relative abundances (a) of the most abundant coccolithophore species and cumulative (b) abundance of minor species (normalized
100%) in coccolith flux.
B. De Bernardi et al. / Marine Micropaleontology 55 (2005) 107–125118
in organic carbon flux coincided with a February
1998 peak in the carbonate flux (mainly delivered
by foraminiferal and coccolithophores, Thunell,
1998a; Kincaid et al., 2000) and high abundances
of tintinnids of genus Stenosella (Lange et al.,
2000).
During EN 97–98 a 20% decrease in radiolarian
flux (Lange et al., 1997) is paralleled by a major
decrease in the diatoms flux and an increase in the
abundance of warm water species. Moreover, the
fall–winter peak in silicoflagellates fluxes, occurring
annually from 1993 to 1996 (Kincaid et al., 2000), is
not observed. Finally, benthic diatoms increased in
winter 1998, probably reflecting the intense storm
activity, high precipitation, and lateral advection into
the central basin during the EN period (Lange et al.,
2000). Compared to the previous year, during fall
and winter 1997, there was a change in foraminiferal
population marked by a significant increase in warm-
water species (Globigerina rubescens and Globiger-
inoides ruber), generally absent under normal con-
dition (Black et al., 2001).
In period C the average coccolith flux is
relatively high (1833.1�106 coccoliths m�2 d�1)
but the coccosphere flux was lower (26.4�105
coccospheres m�2 d�1) than in the previous two
periods. The assemblages during period C are
characterized by an increase in G. oceanica
(12%), with E. huxleyi still being the dominant
species (71%). The other species present during this
period were F. profunda (7%), U. sibogae (4%), H.
carteri (2%), G. muellerae (1%) and C. leptoporus
(1%) (Fig. 6). From July 1997 to April 1998, when
the surface water temperatures were above average
(anomalies of up to 3–4 8C), coccolith and cocco-
sphere fluxes of G. oceanica are consistently high
(daily average 7.2�105 coccospheres m�2 d�1 and
261.4�106 coccoliths m�2 d�1). During mature EN
period, F. profunda was the third most important
species and showed a significant increase (~70%
with respect to previous year) in its coccolith flux
(Table 1). Helicosphaera carteri and G. muellerae
coccosphere fluxes remained relatively low during
this period. Umbilicosphaera sibogae was slightly
higher on average coccolith flux than the previous
year and showed a peak in its coccolith flux in
November. The coccolith flux of C. leptoporus was
higher on average than during non-EN and transi-
tional periods (Fig. 6), with maximum values in
July 1997 (38.7�106 coccoliths m�2 d�1).
B. De Bernardi et al. / Marine Micropaleontology 55 (2005) 107–125 119
4.2. Iron flux
Iron is one of the most abundant elements on Earth
but its concentration in seawater is very low (Johnson
et al., 1997). There is strong evidence that phyto-
plankton growth is limited by iron availability, as
demonstrated in studies in open-ocean waters (Martin
et al., 1994; Coale et al., 2004) and in coastal
upwelling areas (Hutchins and Bruland, 1998; John-
son et al., 1999). In the present study we used the iron
flux in the fine fraction (b20 Am) to observe the
relationship between iron availability and coccolitho-
phore flux. The iron flux was relatively low during
1996 (Table 1; Fig. 2). In early 1997 the iron flux
became significant and remained high for all 1997
(N42% higher than in previous year), reaching a peak
in February 1998 (Fig. 2).
It has been hypothesized that elevated iron
concentration in coastal regions may arise from river
input, resuspended sediment (Johnson et al., 1999) or
atmospheric deposition (Martin and Gordon, 1988). In
this study we found a strong correlation between iron
and lithogenic fluxes (r=0.88), as a result of excep-
tionally intense winter storm activity along the West
Coast (Lynn and Bograd, 2002) in December 1997–
February 1998. This pattern suggests that river input
and runoff from the continent to the basin play an
important role for the iron distribution in this area and
presumably phytoplankton fertilization.
5. Discussion
5.1. Plankton export production response to EN
97–98
The supply of sediments in the SBB is controlled by
seasonal changes in primary productivity and local
climatic changes which control the sedimentation in
the basin. During 1996–1998, the particulate flux
patterns reflected the seasonal hydrography of the
basin. The total mass flux was dominated by lithogenic
components with terrigenous input being three times
greater during EN than in the non-EN period. This
pattern reflects the higher rainfall, runoff, and down-
slope transport into the SBB. Samples collected during
this period contained many pollen grains, plant debris
and estuarine benthic foraminifers, further indicating
that considerable amounts of material were flushed
into the basin (Thunell et al., 1995; Lange et al., 2000).
The biogenic flux and species composition of the
plankton (foraminiferal, coccolithophore and sili-
ceous) community reflect both seasonal and interan-
nual variability in response to environmental changing
in SBB (Thunell et al., 1995; Lange et al., 1997;
Thunell, 1998a; Kincaid et al., 2000).
In non-EN years production maxima of diatoms
occur during spring upwelling, followed by radio-
larians in late summer–fall and, silicoflagellates in
winter. This characteristic seasonal trend was altered
during the EN 97–98 event. In fact, the warm water
incursions into the SBB and the diminished upwelling
are reflected by a decrease in total siliceous flux and a
change in assemblage composition with an increase in
percentage of warm species. In previous sediment trap
experiments in SBB it was found that EN events
reduced biogenic opal export production and
increased siliceous microfossil diversity (Lange et
al., 1997; Kincaid et al., 2000). In other coastal
locations, where the diatoms dominated during
seasonal upwelling such as S. Pedro and Cariaco
Basins, EN events are reflected by a decrease in total
annual silica flux and primary productivity (Sautter
and Thunell, 1991; Tedesco and Thunell, 2003). The
foraminiferal population increases quickly, circa one
month after upwelling period, probably due to
utilization of the diatoms as food (Kincaid et al.,
2000). Maximum foraminiferal fluxes occurred in
August 1996 when surface waters were strongly
stratified and sea surface temperatures were high.
During EN 97–98, relatively warm surface waters
(N20 8C) in the basin are reflected by the increased
fluxes of bwarmer-waterQ foraminifera (G. ruber and
G. rubescens), generally absent during non-EN
conditions (Black et al., 2001). Similar variations in
foraminiferal population during EN anomaly were
found in previous years (Lange et al., 1997; Kincaid et
al., 2000) and in other coastal basins characterized by
seasonal upwelling, such as San Pedro Basin (Sautter
and Thunell, 1991), the Gulf of California (Sancetta,
1995) and the more distant Cariaco Basin (Tedesco
and Thunell, 2003).
When the EN anomaly dominates the hydrographic
conditions of SBB, the annual coccolith flux increases
more than 46% with respect to the previous year. In
fact, the presence of warm water masses and the
B. De Bernardi et al. / Marine Micropaleontology 55 (2005) 107–125120
weakening of the spring upwelling allowed coccoli-
thophores to flourish and to adapt to eutrophic
conditions while outcompeting with diatoms limited
by silica depletion (Ziveri et al., 1995b, 2000).
5.2. Coccolithophore export production in upwelling
regions
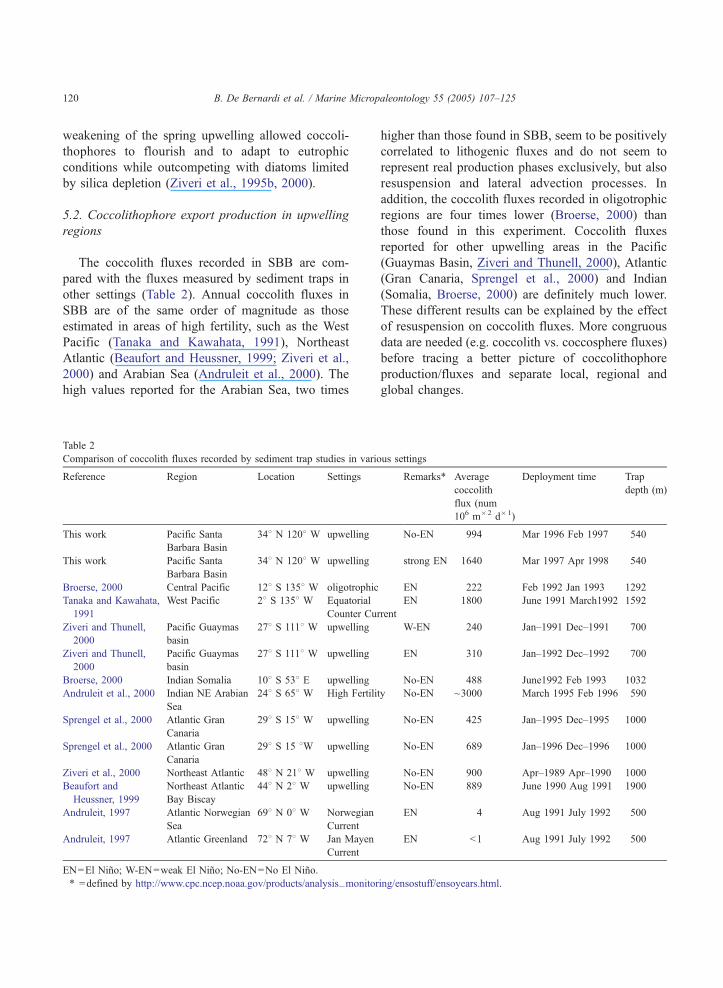
The coccolith fluxes recorded in SBB are com-
pared with the fluxes measured by sediment traps in
other settings (Table 2). Annual coccolith fluxes in
SBB are of the same order of magnitude as those
estimated in areas of high fertility, such as the West
Pacific (Tanaka and Kawahata, 1991), Northeast
Atlantic (Beaufort and Heussner, 1999; Ziveri et al.,
2000) and Arabian Sea (Andruleit et al., 2000). The
high values reported for the Arabian Sea, two times
Table 2
Comparison of coccolith fluxes recorded by sediment trap studies in vari
Reference Region Location Settings
This work Pacific Santa
Barbara Basin
348 N 1208 W upwelling
This work Pacific Santa
Barbara Basin
348 N 1208 W upwelling
Broerse, 2000 Central Pacific 128 S 1358 W oligotrophic
Tanaka and Kawahata,
1991
West Pacific 28 S 1358 W Equatorial
Counter Cu
Ziveri and Thunell,
2000
Pacific Guaymas
basin
278 S 1118 W upwelling
Ziveri and Thunell,
2000
Pacific Guaymas
basin
278 S 1118 W upwelling
Broerse, 2000 Indian Somalia 108 S 538 E upwelling
Andruleit et al., 2000 Indian NE Arabian
Sea
248 S 658 W High Fertili
Sprengel et al., 2000 Atlantic Gran
Canaria
298 S 158 W upwelling
Sprengel et al., 2000 Atlantic Gran
Canaria
298 S 15 8W upwelling
Ziveri et al., 2000 Northeast Atlantic 488 N 218 W upwelling
Beaufort and
Heussner, 1999
Northeast Atlantic
Bay Biscay
448 N 28 W upwelling
Andruleit, 1997 Atlantic Norwegian
Sea
698 N 08 W Norwegian
Current
Andruleit, 1997 Atlantic Greenland 728 N 78 W Jan Mayen
Current
EN=El Nino; W-EN=weak El Nino; No-EN=No El Nino.
T =defined by http://www.cpc.ncep.noaa.gov/products/analysis_monitor
higher than those found in SBB, seem to be positively
correlated to lithogenic fluxes and do not seem to
represent real production phases exclusively, but also
resuspension and lateral advection processes. In
addition, the coccolith fluxes recorded in oligotrophic
regions are four times lower (Broerse, 2000) than
those found in this experiment. Coccolith fluxes
reported for other upwelling areas in the Pacific
(Guaymas Basin, Ziveri and Thunell, 2000), Atlantic
(Gran Canaria, Sprengel et al., 2000) and Indian
(Somalia, Broerse, 2000) are definitely much lower.
These different results can be explained by the effect
of resuspension on coccolith fluxes. More congruous
data are needed (e.g. coccolith vs. coccosphere fluxes)
before tracing a better picture of coccolithophore
production/fluxes and separate local, regional and
global changes.
ous settings
RemarksT Average
coccolith
flux (num�106 m�2 d�1)
Deployment time Trap
depth (m)
No-EN 994 Mar 1996 Feb 1997 540
strong EN 1640 Mar 1997 Apr 1998 540
EN 222 Feb 1992 Jan 1993 1292
rrent
EN 1800 June 1991 March1992 1592
W-EN 240 Jan–1991 Dec–1991 700
EN 310 Jan–1992 Dec–1992 700
No-EN 488 June1992 Feb 1993 1032
ty No-EN ~3000 March 1995 Feb 1996 590
No-EN 425 Jan–1995 Dec–1995 1000
No-EN 689 Jan–1996 Dec–1996 1000
No-EN 900 Apr–1989 Apr–1990 1000
No-EN 889 June 1990 Aug 1991 1900
EN 4 Aug 1991 July 1992 500
EN b1 Aug 1991 July 1992 500
ing/ensostuff/ensoyears.html.
B. De Bernardi et al. / Marine Micropaleontology 55 (2005) 107–125 121
5.3. Coccolithophore ecology in SBB
Both E. huxleyi and G. oceanica may respond
positively to nutrient enrichment, such as in equato-
rial and coastal upwelling areas, and marginal seas
(Okada and Honjo, 1975; Broerse, 2000). G.
oceanica usually dominates in tropical and sub-
tropical regions (McIntyre et al., 1970; Andruleit et
al., 2000, 2003), while E. huxleyi is the most
cosmopolitan coccolithophore species. The relatively
high flux of E. huxleyi during weak LN (period A—
Fig. 5) shows the preference of this species for cool
upwelling conditions. In contrast, the abrupt increase
in G. oceanica coccosphere flux during period B,
and its relative high contribution to the coccolith
assemblage during period C, shows a clear associ-
ation of this species with warm water (up to ~3 8Cduring EN than during non-EN, in the upper 20 m).
Several studies discussed the relationship between
G. oceanica and E. huxleyi, and proposed their ratio
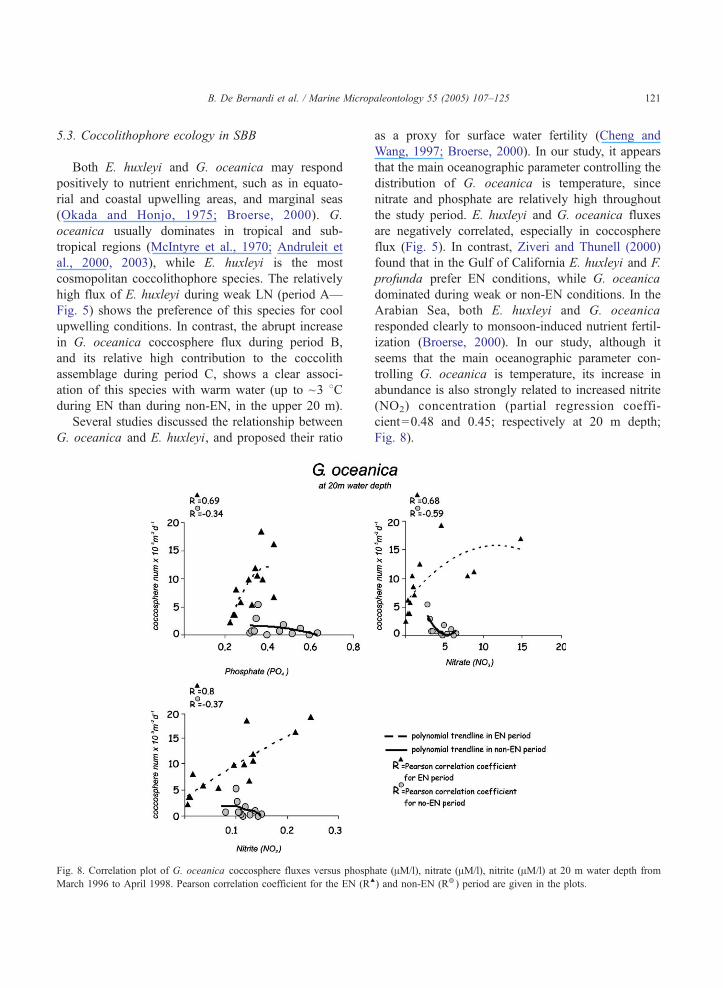
Fig. 8. Correlation plot of G. oceanica coccosphere fluxes versus phosph
March 1996 to April 1998. Pearson correlation coefficient for the EN (RE
as a proxy for surface water fertility (Cheng and
Wang, 1997; Broerse, 2000). In our study, it appears
that the main oceanographic parameter controlling the
distribution of G. oceanica is temperature, since
nitrate and phosphate are relatively high throughout
the study period. E. huxleyi and G. oceanica fluxes
are negatively correlated, especially in coccosphere
flux (Fig. 5). In contrast, Ziveri and Thunell (2000)
found that in the Gulf of California E. huxleyi and F.
profunda prefer EN conditions, while G. oceanica
dominated during weak or non-EN conditions. In the
Arabian Sea, both E. huxleyi and G. oceanica
responded clearly to monsoon-induced nutrient fertil-
ization (Broerse, 2000). In our study, although it
seems that the main oceanographic parameter con-
trolling G. oceanica is temperature, its increase in
abundance is also strongly related to increased nitrite
(NO2) concentration (partial regression coeffi-
cient=0.48 and 0.45; respectively at 20 m depth;
Fig. 8).
ate (AM/l), nitrate (AM/l), nitrite (AM/l) at 20 m water depth from
) and non-EN (R ) period are given in the plots.
B. De Bernardi et al. / Marine Micropaleontology 55 (2005) 107–125122
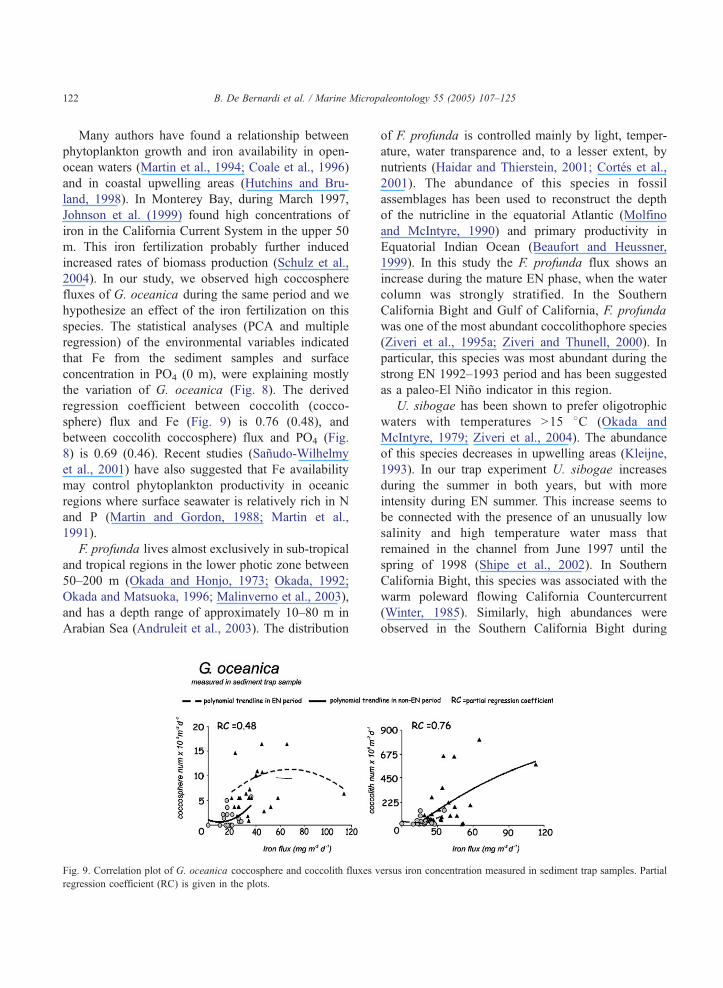
Many authors have found a relationship between
phytoplankton growth and iron availability in open-
ocean waters (Martin et al., 1994; Coale et al., 1996)
and in coastal upwelling areas (Hutchins and Bru-
land, 1998). In Monterey Bay, during March 1997,
Johnson et al. (1999) found high concentrations of
iron in the California Current System in the upper 50
m. This iron fertilization probably further induced
increased rates of biomass production (Schulz et al.,
2004). In our study, we observed high coccosphere
fluxes of G. oceanica during the same period and we
hypothesize an effect of the iron fertilization on this
species. The statistical analyses (PCA and multiple
regression) of the environmental variables indicated
that Fe from the sediment samples and surface
concentration in PO4 (0 m), were explaining mostly
the variation of G. oceanica (Fig. 8). The derived
regression coefficient between coccolith (cocco-
sphere) flux and Fe (Fig. 9) is 0.76 (0.48), and
between coccolith coccosphere) flux and PO4 (Fig.
8) is 0.69 (0.46). Recent studies (Sanudo-Wilhelmy
et al., 2001) have also suggested that Fe availability
may control phytoplankton productivity in oceanic
regions where surface seawater is relatively rich in N
and P (Martin and Gordon, 1988; Martin et al.,
1991).
F. profunda lives almost exclusively in sub-tropical
and tropical regions in the lower photic zone between
50–200 m (Okada and Honjo, 1973; Okada, 1992;
Okada and Matsuoka, 1996; Malinverno et al., 2003),
and has a depth range of approximately 10–80 m in
Arabian Sea (Andruleit et al., 2003). The distribution
Fig. 9. Correlation plot of G. oceanica coccosphere and coccolith fluxes v
regression coefficient (RC) is given in the plots.
of F. profunda is controlled mainly by light, temper-
ature, water transparence and, to a lesser extent, by
nutrients (Haidar and Thierstein, 2001; Cortes et al.,
2001). The abundance of this species in fossil
assemblages has been used to reconstruct the depth
of the nutricline in the equatorial Atlantic (Molfino
and McIntyre, 1990) and primary productivity in
Equatorial Indian Ocean (Beaufort and Heussner,
1999). In this study the F. profunda flux shows an
increase during the mature EN phase, when the water
column was strongly stratified. In the Southern
California Bight and Gulf of California, F. profunda
was one of the most abundant coccolithophore species
(Ziveri et al., 1995a; Ziveri and Thunell, 2000). In
particular, this species was most abundant during the
strong EN 1992–1993 period and has been suggested
as a paleo-El Nino indicator in this region.
U. sibogae has been shown to prefer oligotrophic
waters with temperatures N15 8C (Okada and
McIntyre, 1979; Ziveri et al., 2004). The abundance
of this species decreases in upwelling areas (Kleijne,
1993). In our trap experiment U. sibogae increases
during the summer in both years, but with more
intensity during EN summer. This increase seems to
be connected with the presence of an unusually low
salinity and high temperature water mass that
remained in the channel from June 1997 until the
spring of 1998 (Shipe et al., 2002). In Southern
California Bight, this species was associated with the
warm poleward flowing California Countercurrent
(Winter, 1985). Similarly, high abundances were
observed in the Southern California Bight during
ersus iron concentration measured in sediment trap samples. Partial

B. De Bernardi et al. / Marine Micropaleontology 55 (2005) 107–125 123
EN when the surface waters were warmer and
oligotrophic (Ziveri et al., 1995b). Observations of
coccolithophore distributions in the Atlantic suggest
that H. carteri prefers warm water in the mesotro-
phic eastern equatorial tropical divergence (Ziveri et
al., 2004 and references therein).
6. Conclusions
During a two-year sediment trapping project in
SBB significant changes in planktonic community
(coccolithophore, foraminifera, and siliceous plank-
ton) fluxes occurred in response to changes in
hydrography. Specifically, the flux patterns suggest
that these trends are driven by both annual and
interannual changes in the upper water column
associated with EN. Seasonal coccolith fluxes are
observed, with flux maxima in fall during March 1996
to March 1998.
In the SBB, the EN97–98 is marked by the
presence of a warm low salinity and low nutrient
surface water mass. This is reflected by reduced opal
fluxes and by an increase in total planktonic fora-
miniferal fluxes. Coccolithophore assemblages were
largely dominated by E. huxleyi, followed by F.
profunda, U. sibogae, G. oceanica, H. carteri, G.
muellerae and C. leptoporus. More oligotrophic
conditions resulted in relatively high coccolith fluxes
during EN period. G. oceanica, a subtropical species
often associated with high nutrient conditions, was
present in the SBB during the whole study-period, but
shows a strong increase at the onset of EN event. This
increase was correlated to high temperature of the
upper water column (~3 8C during EN with respect to
non-EN period), to high concentrations of nitrite
(NO2) and phosphate and, to iron fertilization. The
observed increase in abundance of G. oceanica during
strong EN events could be used as a paleo-EN
indicator in the SBB. Moreover, this taxon is
indicative of warm surface waters and fertilization
by iron and NO2. F. profunda was the second most
abundant species, showing an increase in its coccolith
fluxes during the EN condition, when the water
column was strongly stratified and nutrients were
available. U. sibogae prefers oligotrophic conditions.
In fact, it characterizes the summer period in both
years with a better incidence during EN.
Acknowledgements
We are grateful to Babette Boeckel and an
anonymous reviewer for constructive comments on
the manuscript, to Steven Kools and Lothar Kuijper
for helping with statistical analyses. Agostino Rizzi
(CNR-IDPA Milano) and Saskia Kars (Vrije Univer-
siteit, Amsterdam) are thanked for operating the SEM,
and Eric Tappa for sampling. The sediment trapping
program was supported by grants from NSF (OCE-
0117112) and NASA (NAG5-11253) to R. Thunell.
Appendix A. Supplementary materials
Supplementary data associated with this article can
be found, in the online version, at 10.1016/j.marmicro.
2005.02.003.
References
Andruleit, H., 1997. Coccolithophore fluxes in the Norwegian-
Greenland Sea: seasonality and assemblages alteration. Mar.
Micropaleontol. 31, 45–64.
Andruleit, H.A., Rad von, U., Bruns, A., Ittekkot, V., 2000.
Coccolithophore flux from sediment trap in the northeastern
Arabian Sea off Pakistan. Mar. Micropaleontol. 38, 285–308.
Andruleit, H.A., St7ger, S., Rogalla, U., Cepek, P., 2003. Livingcoccolithophore in the northern Arabian Sea: ecological
tolerances and environmental control. Mar. Micropaleontol.
49, 157–181.
Bairbakhish, A.N., Bollmann, J., Sprengel, C., Thierstein, H.R.,
1999. Disintegration of aggregates and coccospheres in sedi-
ment trap samples. Mar. Micropaleontol. 37, 219–223.
Beaufort, L., Heussner, S., 1999. Coccolithophorids on the
continental slope of the Bay of Biscay—production, trans-
port and contribution to mass fluxes. Deep Sea Res. II 46,
2147–2174.
Black, D.E., Thunell, R.C., Tappa, E.J., 2001. Plankton foramini-
feral response to the 1997–1998 El Nino: a sediment-trap record
from the Santa Barbara Basin. Geology 29, 1075–1078.
Broerse, A., 2000. Coccolithophore export production in selected
ocean environments: seasonality, biogeography, carbonate pro-
duction. Ph.D. Thesis, Vrije Universiteit, Amsterdam. 185 pp.
Cheng, X., Wang, P., 1997. Controlling factors of coccolith
distribution in surface sediments of the China sea:
marginal sea nannofossil assemblages. Mar. Micropaleontol.
32, 155–172.
Coale, K.H., Johnson, K.S., Fitzwater, S.E., Gordon, R.M., Tanner,
S.J., Chavez, F., Ferioli, L., Sakamoto, C., Rogers, P., Millero,
F.J., Steinberg, P., Nightingale, P., Cooper, D., Cochlan, W.P.,
Landry, M.R., Constantinou, J., Rollwagen, G., Trasvina, A.,
B. De Bernardi et al. / Marine Micropaleontology 55 (2005) 107–125124
Kudela, R., 1996. A massive phytoplankton bloom induced by
an ecosystem-scale iron fertilization experiment in the equatorial
Pacific Ocean. Nature 383, 495–501.
Coale, H.K., Johnson, K.S., Chavez, F.P., Buesseler, K.O., Barber,
R.T., Brzezinski, M.A., Cochlan, W.P., Millero, F.J., Falkow-
ski, P.G., Bauer, J.E., Wanninkhof, R.H., Kudela, R.M.,
Altabet, M.A., Hales, B.E., Takahashi, T., Landry, M.R.,
Bidigare, R.R., Wang, X., Chase, Z., Strutton, P.G., Friederich,
G.E., Gorbunov, M.Y., Lance, V.P., Hilting, A.K., Hiscock,
M.R., Demarest, M., Hiscock, W.T., Sullivan, K.F., Tannerv,
S.J., Gordon, R.M., Hunter, C.N., Elrod, V.A., Fitzwater, S.E.,
Jones, J.L., Tozzi, S., Koblizek, M., Roberts, A.E., Herndon,
J., Brewster, J., Ladizinsky, N., Smith, G., Cooper, D.,
Timothy, D., Brown, S.L., Selph, K.E., Sheridan, C.C.,
Twining, B.S., Johnson, Z.I., 2004. Southern ocean iron
enrichment experiment: carbon cycling in high- and low-Si
waters. Science 304, 408–414.
Cortes, M.Y., Bollmann, J., Thierstein, H.R., 2001. Coccolithophore
ecology at the HOT station Aloha, Hawaii. Deep Sea Res. II 48,
1957–1981.
Dever, E.P., Winant, C.D., 2002. Devolution and depth structure of
shelf and slope temperature and velocities during the 1997–1998
El Nino near Point Conceptions, California. Prog. Oceanogr. 54,
77–103.
Fleischer, P., 1972. Mineralogy and sedimentation history, Santa
Barbara Basin, California. J. Sediment. Petrol. 42, 49–58.
Haidar, A.T., Thierstein, H.R., 2001. Coccolithophore dynamics off
Bermuda (N. Atlantic). Deep Sea Res. II 48, 1925–1956.
Harms, S., Winant, C.D., 1998. Characteristic patterns of the
circulation in the Santa Barbara Channel. J. Geophys. Res. 103,
3041–3065.
Hendershott, M.C., Winant, C.D., 1996. Surface circulation in the
Santa Barbara Channel. Oceanography 9, 114–121.
Honjo, S., Okada, H., 1974. Community structure of coccolitho-
phore in the photic layer of mid Pacific. Micropaleontology 20,
209–230.
Hutchins, D.A., Bruland, K.W., 1998. Iron-limited diatom growth
and Si:N uptake ratios in a coastal upwelling regime. Nature
393, 561–564.
Johnson, K.S., Chavez, F.P., Friederich, G.E., 1999. Continental-
shelf sediment as primary source of iron for coastal phyto-
plankton. Nature 398, 697–700.
Johnson, K.S., Gordon, R.M., Coale, K.H., 1997. What controls
dissolved iron concentrations in the world ocean? Mar. Chem.
57, 137–161.
Kincaid, E., Thunell, C.R., Lange, C.B., Weinheimer, A.L., Reid,
F.M.H., 2000. Planktonic foraminiferal fluxes in the Santa
Barbara Basin: response to seasonal and interannual hydro-
graphic changes. Deep Sea Res. II. 47, 1157–1176.
Kleijne, A., 1993. Morphology, taxonomy and distribution of extant
coccolithophorids (calcareous nannoplankton). Ph.D. Disserta-
tion, Free University Amsterdam. 321 pp.
Lange, C.B., Burke, S.K., Berger, W.H., 1990. Biological produc-
tion off southern California is linked to climatic change. Clim.
Change 16, 319–329.
Lange, C.B., Weinheimer, A.L., Reid, F.M.H., Thunell, R., 1997.
Temporal sedimentation patterns of diatoms, radiolarians and
silicoflagellates in Santa Barbara Basin, California. CalCOFI 38,
161–170.
Lange, C.B., Weinheimer, A.L., Reid, F.M.H., Tappa, E., Thunell,
R., 2000. Response of the siliceous microplankton from the
Santa Barbara Basin to the 1997–98 El Nino event. CalCOFI 41,
186–193.
Legendre, P., Legendre, L., 1998. Numerical ecology. Elsevier,
Amsterdam. 853 pp.
Lynn, R.J., Bograd, S.J., 2002. Dynamic evolution of the 1997–
1999 El Nino–La Nina cycle in the Southern California current
system. Prog. Oceanogr. 54, 59–75.
Malinverno, E., Ziveri, P., Corselli, C., 2003. Coccolithophorid
distribution in the Ionian Sea and its relationship to eastern
Mediterranean circulation during late fall–early winter. J.
Geophys. Res. 108 (NoC 9), 8115.
Martin, J.H., Gordon, R.M, 1988. Northeast Pacific iron distribution
in relation to phytoplankton productivity. Deep Sea Res. II 35,
177–196.
Martin, J.H., Gordon, R.M., Fitzwater, S.E., 1991. The case for iron.
Limnol. Oceanogr. 36, 1793–1802.
Martin, J.H., Coale, K.H., Johnson, K.S., Fitzwater, S.E., Gordon,
R.M., Tanner, S.J., Hunter, C.N., Elrod, V.A., Nowicki, J.L.,
Coley, T.L., Barber, R.T., Lindley, S., Watson, A.J., Van Scoy,
K., Law, C.S., Liddicoat, M.I., Ling, R., Stanton, T., Stockel, J.,
Collins, C., Anderson, A., Bidigare, R., Ondrusek, M., Latasa,
M., Millero, F.J., Lee, K., Yao, W., Zhang, J.Z., Friederich, G.,
Sakamoto, C., Chavez, F., Buck, K., Kolber, Z., Greene, R.,
Falkowski, P., Chisholm, S.W., Hoge, F., Swift, R., Yungel, J.,
Turner, S., Nightingale, P., Hatton, A., Liss, P., Tindale, N.W.,
1994. Testing the iron hypothesis in ecosystems of the
equatorial Pacific Ocean. Nature 371, 123–129.
McIntyre, A., Be, A.W.H., Roche, M.B., 1970. Modern pacific
coccolithophorida: a paleontological thermometer. Ann. N.Y.
Acad. Sci. 32, 720–731.
McPhaden, M., 1999. Genesis and evolution of the 1997–98 El
Nino. Science 283, 950–954.
Molfino, B., McIntyre, A., 1990. Processional forcing of nutricline
dynamics in the equatorial Atlantic. Science 249, 766–769.
Okada, H., 1992. The biogeography control of modern nannofossil
assemblages in surface sediments of Ise Bay, Mikawa Bay and
Kumano-Nada, off coast of Central Japan. Mem. Ist. Geol.
Mineral. Univ. Padova 43, 431–449.
Okada, H., Honjo, S., 1973. The distribution of oceanic coccoli-
thophore in the Pacific. Deep Sea Res. II 20, 355–374.
Okada, H., Honjo, S., 1975. Distribution of coccolithophorids in
marginal sea along the Western Pacific Ocean. Mar. Biol. 31,
271–285.
Okada, H.,Matsuoka,A., 1996. Lower-photic nannoflora as indicator
of the Late Quaternary monsoonal paleo-record in the tropical
Indian Ocean. In: Moguilevsky, A., Whatley, R. (Eds.), Micro-
fossils and Oceanic Environments. Cambrian Printers.
Okada, H., McIntyre, A., 1979. Seasonal distribution of modern
coccolithophores in the western north Atlantic Ocean. Mar. Biol.
54, 319–328.
Sancetta, C., 1995. Diatoms in the gulf of California: seasonal flux
patterns and the sediment record for the last 15,000 years.
Paleoceanography 10 (1), 67–84.

B. De Bernardi et al. / Marine Micropaleontology 55 (2005) 107–125 125
Sanudo-Wilhelmy, S.A., Kustka, A.B., Gobler, C.J., Hutchins, D.A.,
Yang, M., Lwiza, K., Burns, J., Capone, D.G., Raven, J.A.,
Carpenter, Edward J., 2001. Phosphorus limitation of nitrogen
fixation by Trichodesmium in the central Atlantic Ocean. Nature
411, 66–69.
Sautter, L.R., Thunell, R.C., 1991. Planktonic foraminiferal
response to upwelling and seasonal hydrographic conditions:
sediment trap results from San Pedro Basin, Southern California
Bight. J. Foraminiferal Res. 21, 347–363.
Schulz, K.G., Zondervan, I., Gerringa, L.J.A., Timmermans, K.R.,
Veldhuis, M.J.W., Riebesell, U., 2004. Effect of trace metal
availability on coccolithophorid calcification. Nature 430,
673–676.
Schwing, F.B., Murphree, T., Green, P.M., 2002a. The northern
oscillation index (NOI): a new climate index for the Northeast
Pacific. Prog. Oceanogr. 53, 115–139.
Schwing, F.B., Murphree, T., DeWitt, L., Green, P.M., 2002b. The
evolution of oceanic and atmospheric anomalies in the northeast
Pacific during the El Nino and La Nina events of 1995–2001.
Prog. Oceanogr. 54, 459–491.
Shipe, R.F., Brzezinski, M.A., 2001. A time series study of silica
production and flux in an eastern boundary region: Santa Barbara
Basin, California. Glob. Biogeochem. Cycle 15, 517–531.
Shipe, R.F., Passow, U., Brzezinski,M.A., Graham,W.M., Pak, D.K.,
Siegel, D.A., Alldredge, A.L., 2002. Effect of the 1997–1998 El
Nino on seasonal variations in suspended and sinking particles in
the Santa Barbara Basin. Prog. Oceanogr. 54, 105–127.
Soutar, A., Crill, P.A., 1977. Sedimentation and climatic patterns in
the Santa Barbara basin during the 19th and 20th centuries.
Geol. Soc. Amer. Bull. 88, 1161–1172.
Sprengel, C., Baumann, K.-H., Neuer, S., 2000. Seasonal and
interannual variation of coccolithophore fluxes and species
composition in sediment traps north of Gran Canaria (298 N
158 W).
Tanaka, Y., Kawahata, H., 1991. Seasonal occurrence of coccoliths
in sediment traps from West Caroline Basin, equatorial West
Pacific Ocean. Mar. Micropaleontol. 43, 273–284.
Tedesco, R.C., Thunell, R.C., 2003. Seasonal and interannual
variations in planktonic foraminiferal flux and assemblages
composition in the Cariaco Basin, Venezuela. J. Foraminiferal
Res. 35, 192–210.
Thunell, R.C., 1998a. Particle fluxes in a coastal upwelling zone:
sediment trap results from Santa Barbara Basin, California.
Deep Sea Res. II 45, 1863–1884.
Thunell, R.C., 1998b. Seasonal and annual variability in the particle
fluxes in the Gulf of California: a response to climate forcing.
Deep Sea Res. 45, 2059–2083.
Thunell, R.C., Tappa, E., Anderson, D.M, 1995. Sediment fluxes
and varve formation in Santa Barbara Basin offshore California.
Geology 23 (12), 1083–1086.
Winter, A., 1985. Distribution of living coccolithophores in the
California current system, Southern California borderland. Mar.
Micropaleontol. 9, 385–393.
Wolter, K., Timlin, M.S., 1998. Measuring the strength of ENSO
events: how does 1997/98 rank? Weather 53, 315–324.
Young, J.R., Geisen, M., Cros, L., Kleijne, A., Probert, I., Sprengel,
C., Ostergaard, J.B., 2003. A guide to extant coccolithophore
taxonomy. J. Nannoplankton Res. Special 1. 124 pp.
Ziveri, P., Thunell, R.C., 2000. Coccolithophore export production
in Guaymas Basin, Gulf of California: response to climate
forcing. Deep Sea Res. II 47, 2073–2100.
Ziveri, P., Thunell, R.C., Rio, D., 1995a. Export production of
coccolithophore in an upwelling region: results from San Pedro
Basin, Southern California. Mar. Micropaleontol. 24, 335–358.
Ziveri, P., Thunell, R.C., Rio, D., 1995b. Seasonal changes in
coccolithophore densities in the Southern California Bight during
1991–1992 El Nino event. Deep Sea Res. I 42, 1881–1903.
Ziveri, P., Young, J.R., Van Hinte, J.E., 1999. Coccolithophore
export production and accumulation rates. Deep Sea Res. II 42,
1881–1903.
Ziveri, P., Broerse, A.T.C., van Hinte, J.E., Honjo, S., 2000. The
fate of coccoliths at 488 N 218 W, Northeastern Atlantic. Deep-
Sea Res. II 47 (9–11), 1853–1875.
Ziveri, P., Baumann, K.-H., Bfckel, B., Bollmann, J., Young, J.R.,
2004. Present day coccolithophore-biogeography in the Atlantic
Ocean. In: Thierstein, H.R., Young, J.R. (Eds.), Coccolitho-
phores—From Molecular Processes to Global Impact. Springer,
403–428.