Application of DNDC biogeochemistry model to estimate greenhouse gas emissions from Italian...
11
Agriculture, Ecosystems and Environment 139 (2010) 546–556 Contents lists available at ScienceDirect Agriculture, Ecosystems and Environment journal homepage: www.elsevier.com/locate/agee Application of DNDC biogeochemistry model to estimate greenhouse gas emissions from Italian agricultural areas at high spatial resolution Emanuele Lugato a,∗ , Michel Zuliani b , Giorgio Alberti b , Gemini Delle Vedove b , Beniamino Gioli a , Franco Miglietta a , Alessandro Peressotti b a Istituto di Biometeorologia, Consiglio Nazionale delle Ricerche, via Caproni 8, 50145 Firenze, Italy b Dipartimento di Scienze Agrarie e Ambientali, Università di Udine, viale delle Scienze 208, 33100 Udine, Italy article info Article history: Received 29 May 2010 Received in revised form 10 September 2010 Accepted 24 September 2010 Available online 25 October 2010 Keywords: DNDC model Greenhouse gases emission Spatial simulations Italian agricultural areas N2O-N abstract Agriculture is responsible for 13.5% of total greenhouse gas (GHG) emissions (IPCC, 2007), in particular accounting for more than 80% of global anthropogenic nitrous oxide (N 2 O) emissions. However uncer- tainties in GHG inventories are still high as biogeochemical cycles are strongly influenced by climatic and environmental conditions and also depend on local agricultural practices. In order to improve the GHG balance assessment in cropland, higher order methods (Tier 3) are recommended such as, for example, model applications at spatial level. In the present study, a GIS-model integration was performed with the aim of improving the national GHG inventory in Italy. The de-nitrification decomposition (DNDC) model, chosen due to its ability to simulate carbon (C) and nitrogen (N) cycles, has been tested against measured data coming from eddy-covariance stations and soil flux chambers (for CO 2 and N 2 O fluxes) belonging to Carbo-Italy network. Despite the varying site specific parameters, the results confirmed the ability of the model to represent the real C balance in irrigated maize crop under both conventional and minimum tillage. Modelled N 2 O emissions fitted the measured data well, but the corresponding emission factor from fertilizers was much lower than the IPCC default (0.008 vs 0.0125 kg N 2 O-N kg −1 N, respectively). A platform of simulation was then built to run DNDC for the entire national territory, linking the model with geographical databases. To implement the model, a high spatial resolution grid (1 km × 1 km) was adopted in order to develop a tool that could be used by local administrations and easily upload informa- tion at high spatial resolution (e.g. remote sensed information). A tree management (e.g. a combination of different management and land use) was also built to simulate crops with a ‘business as usual’ (BaU) scenario and with alternative management practices (AMP) and potentially create infinite combinations in each cell simply by varying a relative land use weight. Although the total area under agriculture has not been simulated so far, this platform of simulation appears promising to improve the national GHG inventory and derive C credits from the agricultural sector. © 2010 Elsevier B.V. All rights reserved. 1. Introduction After ratification of the Kyoto protocol (UNFCCC – http://unfccc.int), great efforts are being required from the participating nations to reduce greenhouse gas (GHG) emissions in the first commitment period (2008–2012). For most Annex 1 countries, including those in Europe, agricultural soils are a major source of nitrous oxide (N 2 O) (Lokupitiya and Paustian, 2006). In Italy, the overall agricultural sector is a source of GHGs emitting 6.7% of the total emissions, with an amount of 37.2 Mt of CO 2 equiv. (Romano et al., 2009), of which more than half (21.6 Mt of CO 2 equiv.) is emitted as N 2 O from soils. Although the national ∗ Corresponding author. Tel.: +39 055 3033749; fax: +39 055 308910. E-mail address: [email protected] (E. Lugato). methodology is in accordance with Tier 1 and 2 approaches proposed by the IPCC, still empirical emission factors are used to assess the emission from fertilizer (0.0125 kg N 2 O-N kg −1 N from synthetic fertilizers). Disaggregated data at sub-national level, including models and inventory measurement systems required by higher order methods (i.e. Tier 3), are not available so far in Italy and comparisons with the other two approaches cannot be performed at the moment. Instead, some inventories, based on emission factors and regional regression equations derived from all available measurements, have been carried out at European level (EU 15) (Freibauer, 2003). The Italian arable soils emit between 2 and 6 kg N 2 O-N ha −1 yr −1 corresponding to 23 Mt of CO 2 equiv., a value slightly higher than the national estimate of 19.3 Mt of CO 2 equiv. in 1995 (Romano et al., 2009). Recently, the de-nitrification decomposition (DNDC) model was linked to an economic model to estimate nitrogen and carbon losses 0167-8809/$ – see front matter © 2010 Elsevier B.V. All rights reserved. doi:10.1016/j.agee.2010.09.015
Transcript of Application of DNDC biogeochemistry model to estimate greenhouse gas emissions from Italian...

Ae
EBa
b
a
ARR1AA
KDGSIN
1
hpi1m2eCo
0d
Agriculture, Ecosystems and Environment 139 (2010) 546–556
Contents lists available at ScienceDirect
Agriculture, Ecosystems and Environment
journa l homepage: www.e lsev ier .com/ locate /agee
pplication of DNDC biogeochemistry model to estimate greenhouse gasmissions from Italian agricultural areas at high spatial resolution
manuele Lugatoa,∗, Michel Zulianib, Giorgio Albertib, Gemini Delle Vedoveb,eniamino Gioli a, Franco Migliettaa, Alessandro Peressottib
Istituto di Biometeorologia, Consiglio Nazionale delle Ricerche, via Caproni 8, 50145 Firenze, ItalyDipartimento di Scienze Agrarie e Ambientali, Università di Udine, viale delle Scienze 208, 33100 Udine, Italy
r t i c l e i n f o
rticle history:eceived 29 May 2010eceived in revised form0 September 2010ccepted 24 September 2010vailable online 25 October 2010
eywords:NDC modelreenhouse gases emissionpatial simulationstalian agricultural areas
2O-N
a b s t r a c t
Agriculture is responsible for 13.5% of total greenhouse gas (GHG) emissions (IPCC, 2007), in particularaccounting for more than 80% of global anthropogenic nitrous oxide (N2O) emissions. However uncer-tainties in GHG inventories are still high as biogeochemical cycles are strongly influenced by climatic andenvironmental conditions and also depend on local agricultural practices. In order to improve the GHGbalance assessment in cropland, higher order methods (Tier 3) are recommended such as, for example,model applications at spatial level. In the present study, a GIS-model integration was performed with theaim of improving the national GHG inventory in Italy. The de-nitrification decomposition (DNDC) model,chosen due to its ability to simulate carbon (C) and nitrogen (N) cycles, has been tested against measureddata coming from eddy-covariance stations and soil flux chambers (for CO2 and N2O fluxes) belongingto Carbo-Italy network. Despite the varying site specific parameters, the results confirmed the ability ofthe model to represent the real C balance in irrigated maize crop under both conventional and minimumtillage. Modelled N2O emissions fitted the measured data well, but the corresponding emission factorfrom fertilizers was much lower than the IPCC default (0.008 vs 0.0125 kg N2O-N kg−1 N, respectively).A platform of simulation was then built to run DNDC for the entire national territory, linking the modelwith geographical databases. To implement the model, a high spatial resolution grid (1 km × 1 km) was
adopted in order to develop a tool that could be used by local administrations and easily upload informa-tion at high spatial resolution (e.g. remote sensed information). A tree management (e.g. a combinationof different management and land use) was also built to simulate crops with a ‘business as usual’ (BaU)scenario and with alternative management practices (AMP) and potentially create infinite combinationsin each cell simply by varying a relative land use weight. Although the total area under agriculture hasnot been simulated so far, this platform of simulation appears promising to improve the national GHGedits
inventory and derive C cr. Introduction
After ratification of the Kyoto protocol (UNFCCC –ttp://unfccc.int), great efforts are being required from thearticipating nations to reduce greenhouse gas (GHG) emissions
n the first commitment period (2008–2012). For most Annexcountries, including those in Europe, agricultural soils are aajor source of nitrous oxide (N2O) (Lokupitiya and Paustian,
006). In Italy, the overall agricultural sector is a source of GHGsmitting 6.7% of the total emissions, with an amount of 37.2 Mt ofO2 equiv. (Romano et al., 2009), of which more than half (21.6 Mtf CO2 equiv.) is emitted as N2O from soils. Although the national
∗ Corresponding author. Tel.: +39 055 3033749; fax: +39 055 308910.E-mail address: [email protected] (E. Lugato).
167-8809/$ – see front matter © 2010 Elsevier B.V. All rights reserved.oi:10.1016/j.agee.2010.09.015
from the agricultural sector.© 2010 Elsevier B.V. All rights reserved.
methodology is in accordance with Tier 1 and 2 approachesproposed by the IPCC, still empirical emission factors are used toassess the emission from fertilizer (0.0125 kg N2O-N kg−1 N fromsynthetic fertilizers). Disaggregated data at sub-national level,including models and inventory measurement systems requiredby higher order methods (i.e. Tier 3), are not available so far inItaly and comparisons with the other two approaches cannot beperformed at the moment. Instead, some inventories, based onemission factors and regional regression equations derived fromall available measurements, have been carried out at Europeanlevel (EU 15) (Freibauer, 2003). The Italian arable soils emit
between 2 and 6 kg N2O-N ha−1 yr−1 corresponding to 23 Mt ofCO2 equiv., a value slightly higher than the national estimate of19.3 Mt of CO2 equiv. in 1995 (Romano et al., 2009). Recently,the de-nitrification decomposition (DNDC) model was linkedto an economic model to estimate nitrogen and carbon losses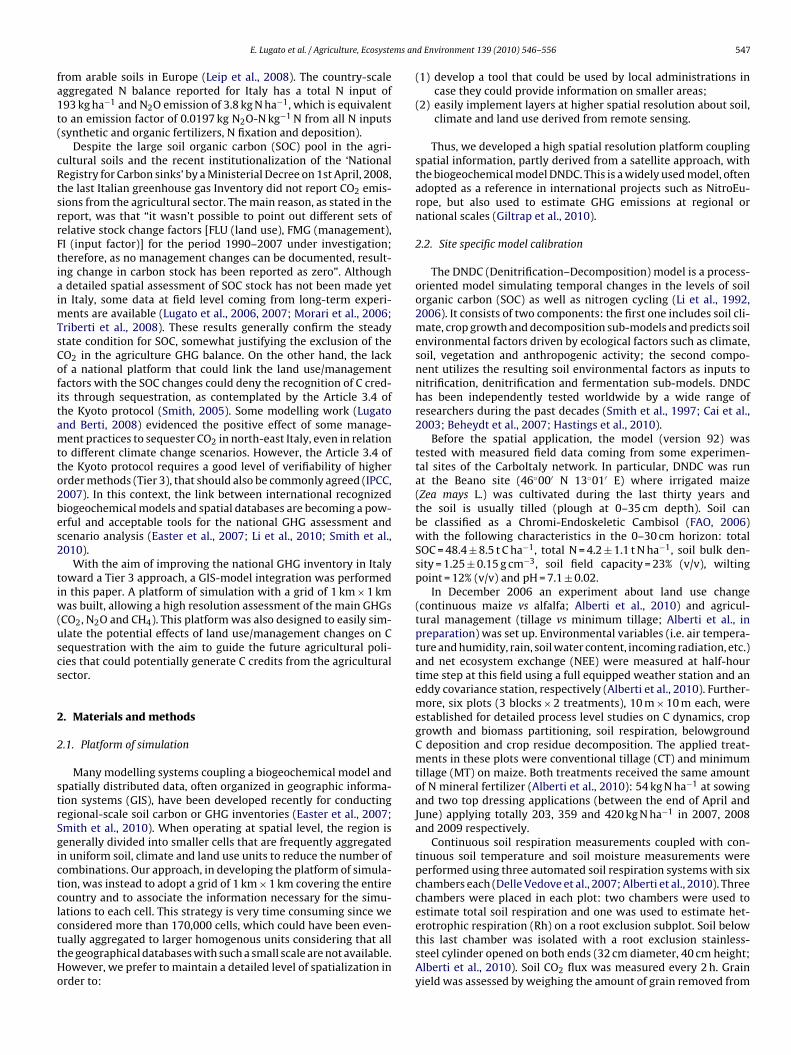
ms an
fa1t(
cRtsrrFtiaimTsCofitamtto2bes2
tiw(uscs
2
2
strSgictclcttHo
E. Lugato et al. / Agriculture, Ecosyste
rom arable soils in Europe (Leip et al., 2008). The country-scaleggregated N balance reported for Italy has a total N input of93 kg ha−1 and N2O emission of 3.8 kg N ha−1, which is equivalento an emission factor of 0.0197 kg N2O-N kg−1 N from all N inputssynthetic and organic fertilizers, N fixation and deposition).
Despite the large soil organic carbon (SOC) pool in the agri-ultural soils and the recent institutionalization of the ‘Nationalegistry for Carbon sinks’ by a Ministerial Decree on 1st April, 2008,he last Italian greenhouse gas Inventory did not report CO2 emis-ions from the agricultural sector. The main reason, as stated in theeport, was that “it wasn’t possible to point out different sets ofelative stock change factors [FLU (land use), FMG (management),I (input factor)] for the period 1990–2007 under investigation;herefore, as no management changes can be documented, result-ng change in carbon stock has been reported as zero”. Althoughdetailed spatial assessment of SOC stock has not been made yet
n Italy, some data at field level coming from long-term experi-ents are available (Lugato et al., 2006, 2007; Morari et al., 2006;
riberti et al., 2008). These results generally confirm the steadytate condition for SOC, somewhat justifying the exclusion of theO2 in the agriculture GHG balance. On the other hand, the lackf a national platform that could link the land use/managementactors with the SOC changes could deny the recognition of C cred-ts through sequestration, as contemplated by the Article 3.4 ofhe Kyoto protocol (Smith, 2005). Some modelling work (Lugatond Berti, 2008) evidenced the positive effect of some manage-ent practices to sequester CO2 in north-east Italy, even in relation
o different climate change scenarios. However, the Article 3.4 ofhe Kyoto protocol requires a good level of verifiability of higherrder methods (Tier 3), that should also be commonly agreed (IPCC,007). In this context, the link between international recognizediogeochemical models and spatial databases are becoming a pow-rful and acceptable tools for the national GHG assessment andcenario analysis (Easter et al., 2007; Li et al., 2010; Smith et al.,010).
With the aim of improving the national GHG inventory in Italyoward a Tier 3 approach, a GIS-model integration was performedn this paper. A platform of simulation with a grid of 1 km × 1 km
as built, allowing a high resolution assessment of the main GHGsCO2, N2O and CH4). This platform was also designed to easily sim-late the potential effects of land use/management changes on Cequestration with the aim to guide the future agricultural poli-ies that could potentially generate C credits from the agriculturalector.
. Materials and methods
.1. Platform of simulation
Many modelling systems coupling a biogeochemical model andpatially distributed data, often organized in geographic informa-ion systems (GIS), have been developed recently for conductingegional-scale soil carbon or GHG inventories (Easter et al., 2007;mith et al., 2010). When operating at spatial level, the region isenerally divided into smaller cells that are frequently aggregatedn uniform soil, climate and land use units to reduce the number ofombinations. Our approach, in developing the platform of simula-ion, was instead to adopt a grid of 1 km × 1 km covering the entireountry and to associate the information necessary for the simu-ations to each cell. This strategy is very time consuming since we
onsidered more than 170,000 cells, which could have been even-ually aggregated to larger homogenous units considering that allhe geographical databases with such a small scale are not available.owever, we prefer to maintain a detailed level of spatialization inrder to:d Environment 139 (2010) 546–556 547
(1) develop a tool that could be used by local administrations incase they could provide information on smaller areas;
(2) easily implement layers at higher spatial resolution about soil,climate and land use derived from remote sensing.
Thus, we developed a high spatial resolution platform couplingspatial information, partly derived from a satellite approach, withthe biogeochemical model DNDC. This is a widely used model, oftenadopted as a reference in international projects such as NitroEu-rope, but also used to estimate GHG emissions at regional ornational scales (Giltrap et al., 2010).
2.2. Site specific model calibration
The DNDC (Denitrification–Decomposition) model is a process-oriented model simulating temporal changes in the levels of soilorganic carbon (SOC) as well as nitrogen cycling (Li et al., 1992,2006). It consists of two components: the first one includes soil cli-mate, crop growth and decomposition sub-models and predicts soilenvironmental factors driven by ecological factors such as climate,soil, vegetation and anthropogenic activity; the second compo-nent utilizes the resulting soil environmental factors as inputs tonitrification, denitrification and fermentation sub-models. DNDChas been independently tested worldwide by a wide range ofresearchers during the past decades (Smith et al., 1997; Cai et al.,2003; Beheydt et al., 2007; Hastings et al., 2010).
Before the spatial application, the model (version 92) wastested with measured field data coming from some experimen-tal sites of the CarboItaly network. In particular, DNDC was runat the Beano site (46◦00′ N 13◦01′ E) where irrigated maize(Zea mays L.) was cultivated during the last thirty years andthe soil is usually tilled (plough at 0–35 cm depth). Soil canbe classified as a Chromi-Endoskeletic Cambisol (FAO, 2006)with the following characteristics in the 0–30 cm horizon: totalSOC = 48.4 ± 8.5 t C ha−1, total N = 4.2 ± 1.1 t N ha−1, soil bulk den-sity = 1.25 ± 0.15 g cm−3, soil field capacity = 23% (v/v), wiltingpoint = 12% (v/v) and pH = 7.1 ± 0.02.
In December 2006 an experiment about land use change(continuous maize vs alfalfa; Alberti et al., 2010) and agricul-tural management (tillage vs minimum tillage; Alberti et al., inpreparation) was set up. Environmental variables (i.e. air tempera-ture and humidity, rain, soil water content, incoming radiation, etc.)and net ecosystem exchange (NEE) were measured at half-hourtime step at this field using a full equipped weather station and aneddy covariance station, respectively (Alberti et al., 2010). Further-more, six plots (3 blocks × 2 treatments), 10 m × 10 m each, wereestablished for detailed process level studies on C dynamics, cropgrowth and biomass partitioning, soil respiration, belowgroundC deposition and crop residue decomposition. The applied treat-ments in these plots were conventional tillage (CT) and minimumtillage (MT) on maize. Both treatments received the same amountof N mineral fertilizer (Alberti et al., 2010): 54 kg N ha−1 at sowingand two top dressing applications (between the end of April andJune) applying totally 203, 359 and 420 kg N ha−1 in 2007, 2008and 2009 respectively.
Continuous soil respiration measurements coupled with con-tinuous soil temperature and soil moisture measurements wereperformed using three automated soil respiration systems with sixchambers each (Delle Vedove et al., 2007; Alberti et al., 2010). Threechambers were placed in each plot: two chambers were used toestimate total soil respiration and one was used to estimate het-
erotrophic respiration (Rh) on a root exclusion subplot. Soil belowthis last chamber was isolated with a root exclusion stainless-steel cylinder opened on both ends (32 cm diameter, 40 cm height;Alberti et al., 2010). Soil CO2 flux was measured every 2 h. Grainyield was assessed by weighing the amount of grain removed from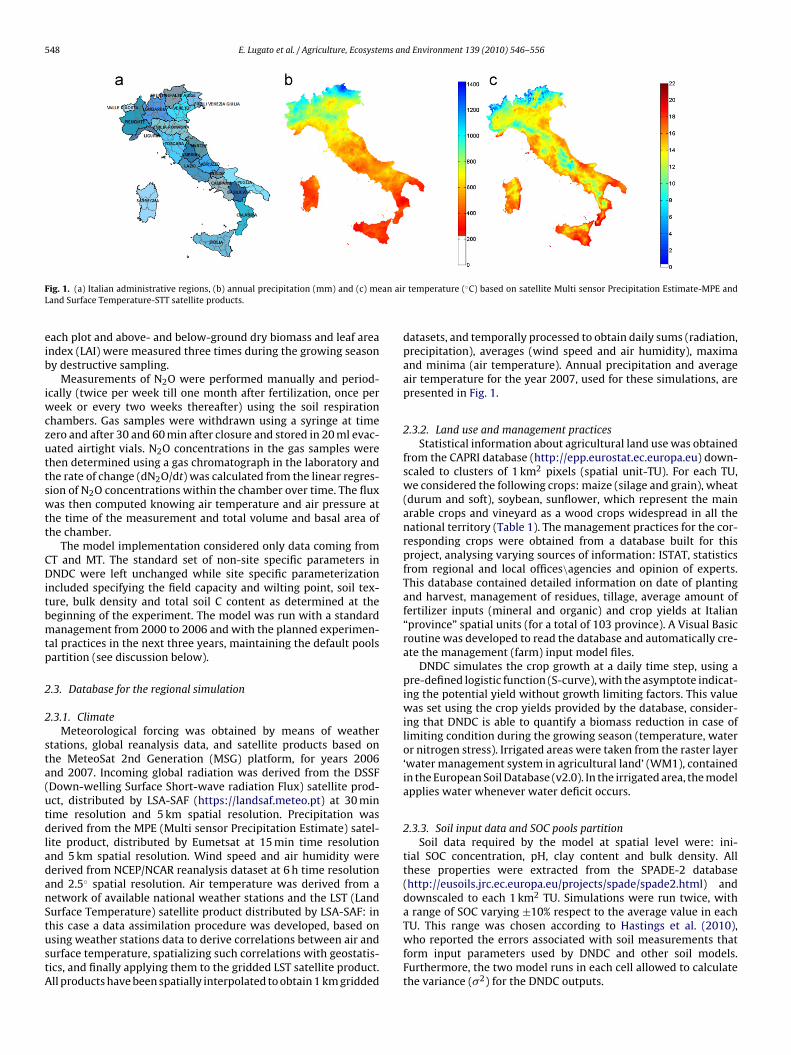
548 E. Lugato et al. / Agriculture, Ecosystems and Environment 139 (2010) 546–556
F an airL
eib
iwczuttswtt
CDitbmtp
2
2
sta(utdladanStustA
ig. 1. (a) Italian administrative regions, (b) annual precipitation (mm) and (c) meand Surface Temperature-STT satellite products.
ach plot and above- and below-ground dry biomass and leaf areandex (LAI) were measured three times during the growing seasony destructive sampling.
Measurements of N2O were performed manually and period-cally (twice per week till one month after fertilization, once per
eek or every two weeks thereafter) using the soil respirationhambers. Gas samples were withdrawn using a syringe at timeero and after 30 and 60 min after closure and stored in 20 ml evac-ated airtight vials. N2O concentrations in the gas samples werehen determined using a gas chromatograph in the laboratory andhe rate of change (dN2O/dt) was calculated from the linear regres-ion of N2O concentrations within the chamber over time. The fluxas then computed knowing air temperature and air pressure at
he time of the measurement and total volume and basal area ofhe chamber.
The model implementation considered only data coming fromT and MT. The standard set of non-site specific parameters inNDC were left unchanged while site specific parameterization
ncluded specifying the field capacity and wilting point, soil tex-ure, bulk density and total soil C content as determined at theeginning of the experiment. The model was run with a standardanagement from 2000 to 2006 and with the planned experimen-
al practices in the next three years, maintaining the default poolsartition (see discussion below).
.3. Database for the regional simulation
.3.1. ClimateMeteorological forcing was obtained by means of weather
tations, global reanalysis data, and satellite products based onhe MeteoSat 2nd Generation (MSG) platform, for years 2006nd 2007. Incoming global radiation was derived from the DSSFDown-welling Surface Short-wave radiation Flux) satellite prod-ct, distributed by LSA-SAF (https://landsaf.meteo.pt) at 30 minime resolution and 5 km spatial resolution. Precipitation waserived from the MPE (Multi sensor Precipitation Estimate) satel-
ite product, distributed by Eumetsat at 15 min time resolutionnd 5 km spatial resolution. Wind speed and air humidity wereerived from NCEP/NCAR reanalysis dataset at 6 h time resolutionnd 2.5◦ spatial resolution. Air temperature was derived from aetwork of available national weather stations and the LST (Landurface Temperature) satellite product distributed by LSA-SAF: in
his case a data assimilation procedure was developed, based onsing weather stations data to derive correlations between air andurface temperature, spatializing such correlations with geostatis-ics, and finally applying them to the gridded LST satellite product.ll products have been spatially interpolated to obtain 1 km griddedtemperature (◦C) based on satellite Multi sensor Precipitation Estimate-MPE and
datasets, and temporally processed to obtain daily sums (radiation,precipitation), averages (wind speed and air humidity), maximaand minima (air temperature). Annual precipitation and averageair temperature for the year 2007, used for these simulations, arepresented in Fig. 1.
2.3.2. Land use and management practicesStatistical information about agricultural land use was obtained
from the CAPRI database (http://epp.eurostat.ec.europa.eu) down-scaled to clusters of 1 km2 pixels (spatial unit-TU). For each TU,we considered the following crops: maize (silage and grain), wheat(durum and soft), soybean, sunflower, which represent the mainarable crops and vineyard as a wood crops widespread in all thenational territory (Table 1). The management practices for the cor-responding crops were obtained from a database built for thisproject, analysing varying sources of information: ISTAT, statisticsfrom regional and local offices\agencies and opinion of experts.This database contained detailed information on date of plantingand harvest, management of residues, tillage, average amount offertilizer inputs (mineral and organic) and crop yields at Italian“province” spatial units (for a total of 103 province). A Visual Basicroutine was developed to read the database and automatically cre-ate the management (farm) input model files.
DNDC simulates the crop growth at a daily time step, using apre-defined logistic function (S-curve), with the asymptote indicat-ing the potential yield without growth limiting factors. This valuewas set using the crop yields provided by the database, consider-ing that DNDC is able to quantify a biomass reduction in case oflimiting condition during the growing season (temperature, wateror nitrogen stress). Irrigated areas were taken from the raster layer‘water management system in agricultural land’ (WM1), containedin the European Soil Database (v2.0). In the irrigated area, the modelapplies water whenever water deficit occurs.
2.3.3. Soil input data and SOC pools partitionSoil data required by the model at spatial level were: ini-
tial SOC concentration, pH, clay content and bulk density. Allthese properties were extracted from the SPADE-2 database(http://eusoils.jrc.ec.europa.eu/projects/spade/spade2.html) anddownscaled to each 1 km2 TU. Simulations were run twice, witha range of SOC varying ±10% respect to the average value in each
TU. This range was chosen according to Hastings et al. (2010),who reported the errors associated with soil measurements thatform input parameters used by DNDC and other soil models.Furthermore, the two model runs in each cell allowed to calculatethe variance (�2) for the DNDC outputs.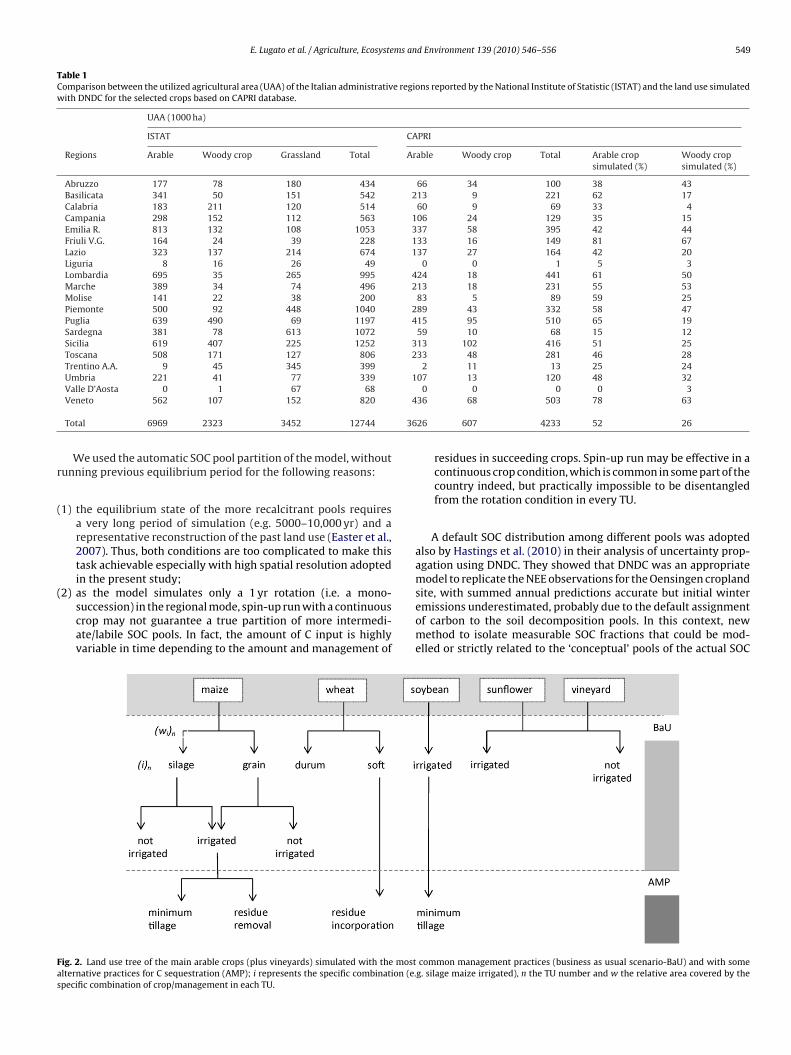
E. Lugato et al. / Agriculture, Ecosystems and Environment 139 (2010) 546–556 549
Table 1Comparison between the utilized agricultural area (UAA) of the Italian administrative regions reported by the National Institute of Statistic (ISTAT) and the land use simulatedwith DNDC for the selected crops based on CAPRI database.
UAA (1000 ha)
ISTAT CAPRI
Regions Arable Woody crop Grassland Total Arable Woody crop Total Arable cropsimulated (%)
Woody cropsimulated (%)
Abruzzo 177 78 180 434 66 34 100 38 43Basilicata 341 50 151 542 213 9 221 62 17Calabria 183 211 120 514 60 9 69 33 4Campania 298 152 112 563 106 24 129 35 15Emilia R. 813 132 108 1053 337 58 395 42 44Friuli V.G. 164 24 39 228 133 16 149 81 67Lazio 323 137 214 674 137 27 164 42 20Liguria 8 16 26 49 0 0 1 5 3Lombardia 695 35 265 995 424 18 441 61 50Marche 389 34 74 496 213 18 231 55 53Molise 141 22 38 200 83 5 89 59 25Piemonte 500 92 448 1040 289 43 332 58 47Puglia 639 490 69 1197 415 95 510 65 19Sardegna 381 78 613 1072 59 10 68 15 12Sicilia 619 407 225 1252 313 102 416 51 25Toscana 508 171 127 806 233 48 281 46 28Trentino A.A. 9 45 345 399 2 11 13 25 24Umbria 221 41 77 339 107 13 120 48 32
4
36
r
(
(
Fas
Valle D’Aosta 0 1 67 68Veneto 562 107 152 820
Total 6969 2323 3452 12744
We used the automatic SOC pool partition of the model, withoutunning previous equilibrium period for the following reasons:
1) the equilibrium state of the more recalcitrant pools requiresa very long period of simulation (e.g. 5000–10,000 yr) and arepresentative reconstruction of the past land use (Easter et al.,2007). Thus, both conditions are too complicated to make thistask achievable especially with high spatial resolution adoptedin the present study;
2) as the model simulates only a 1 yr rotation (i.e. a mono-succession) in the regional mode, spin-up run with a continuouscrop may not guarantee a true partition of more intermedi-ate/labile SOC pools. In fact, the amount of C input is highlyvariable in time depending to the amount and management of
ig. 2. Land use tree of the main arable crops (plus vineyards) simulated with the mostlternative practices for C sequestration (AMP); i represents the specific combination (e.pecific combination of crop/management in each TU.
0 0 0 0 336 68 503 78 63
26 607 4233 52 26
residues in succeeding crops. Spin-up run may be effective in acontinuous crop condition, which is common in some part of thecountry indeed, but practically impossible to be disentangledfrom the rotation condition in every TU.
A default SOC distribution among different pools was adoptedalso by Hastings et al. (2010) in their analysis of uncertainty prop-agation using DNDC. They showed that DNDC was an appropriatemodel to replicate the NEE observations for the Oensingen cropland
site, with summed annual predictions accurate but initial winteremissions underestimated, probably due to the default assignmentof carbon to the soil decomposition pools. In this context, newmethod to isolate measurable SOC fractions that could be mod-elled or strictly related to the ‘conceptual’ pools of the actual SOCcommon management practices (business as usual scenario-BaU) and with someg. silage maize irrigated), n the TU number and w the relative area covered by the
5 ms and Environment 139 (2010) 546–556
ma
2
imuacpianrwc
w
tSc
otOas
ua
�
woiou
C
wt
3
3
ciynafldts(tN2
-200
-150
-100
-50
0
50
100
NE
E (
kg
C h
a-1
)
DNDC Observed
0
100
200
300
400
500
Dec-09Aug-09Apr-09Dec-08Aug-08Apr-08Dec-07Aug-07May-07Jan-07
N2O
Flu
x (g
N h
a-1
)
Date
DNDC Observed
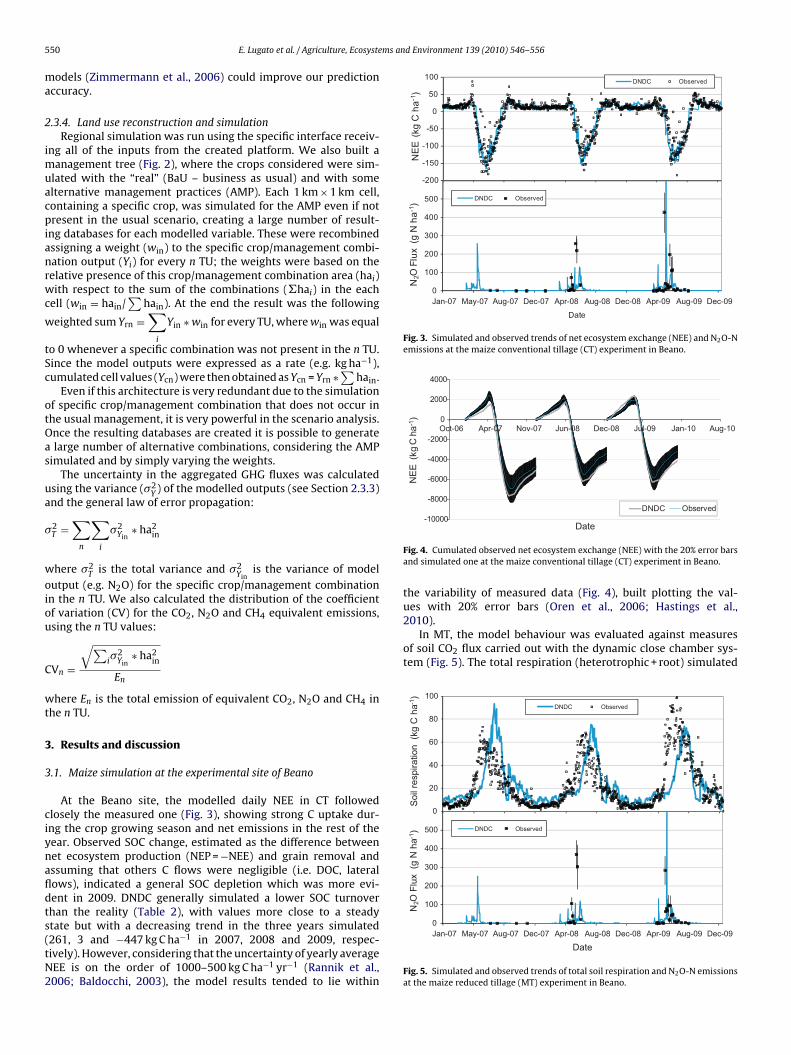
Fig. 3. Simulated and observed trends of net ecosystem exchange (NEE) and N2O-Nemissions at the maize conventional tillage (CT) experiment in Beano.
-10000
-8000
-6000
-4000
-2000
0
2000
4000
Aug-10Jan-10Jul-09Dec-08Jun-08Nov-07Apr-07Oct-06
NE
E (
kg C
ha
-1)
DNDC Observed
2010).In MT, the model behaviour was evaluated against measures
of soil CO2 flux carried out with the dynamic close chamber sys-tem (Fig. 5). The total respiration (heterotrophic + root) simulated
0
20
40
60
80
100
So
il re
sp
ira
tio
n
(kg
C h
a-1
)
DNDC Observed
100
200
300
400
500
N2O
Flu
x (g
N h
a-1
) DNDC Observed
50 E. Lugato et al. / Agriculture, Ecosyste
odels (Zimmermann et al., 2006) could improve our predictionccuracy.
.3.4. Land use reconstruction and simulationRegional simulation was run using the specific interface receiv-
ng all of the inputs from the created platform. We also built aanagement tree (Fig. 2), where the crops considered were sim-
lated with the “real” (BaU – business as usual) and with somelternative management practices (AMP). Each 1 km × 1 km cell,ontaining a specific crop, was simulated for the AMP even if notresent in the usual scenario, creating a large number of result-
ng databases for each modelled variable. These were recombinedssigning a weight (win) to the specific crop/management combi-ation output (Yi) for every n TU; the weights were based on theelative presence of this crop/management combination area (hai)ith respect to the sum of the combinations (�hai) in the each
ell (win = hain/∑
hain). At the end the result was the following
eighted sum Yrn =∑
i
Yin ∗ win for every TU, where win was equal
o 0 whenever a specific combination was not present in the n TU.ince the model outputs were expressed as a rate (e.g. kg ha−1),umulated cell values (Ycn) were then obtained as Ycn = Yrn ∗
∑hain.
Even if this architecture is very redundant due to the simulationf specific crop/management combination that does not occur inhe usual management, it is very powerful in the scenario analysis.nce the resulting databases are created it is possible to generatelarge number of alternative combinations, considering the AMP
imulated and by simply varying the weights.The uncertainty in the aggregated GHG fluxes was calculated
sing the variance (�2Y ) of the modelled outputs (see Section 2.3.3)
nd the general law of error propagation:
2T =
∑n
∑i
�2Yin
∗ ha2in
here �2T is the total variance and �2
Yinis the variance of model
utput (e.g. N2O) for the specific crop/management combinationn the n TU. We also calculated the distribution of the coefficientf variation (CV) for the CO2, N2O and CH4 equivalent emissions,sing the n TU values:
Vn =
√∑i�
2Yin
∗ ha2in
En
here En is the total emission of equivalent CO2, N2O and CH4 inhe n TU.
. Results and discussion
.1. Maize simulation at the experimental site of Beano
At the Beano site, the modelled daily NEE in CT followedlosely the measured one (Fig. 3), showing strong C uptake dur-ng the crop growing season and net emissions in the rest of theear. Observed SOC change, estimated as the difference betweenet ecosystem production (NEP = −NEE) and grain removal andssuming that others C flows were negligible (i.e. DOC, lateralows), indicated a general SOC depletion which was more evi-ent in 2009. DNDC generally simulated a lower SOC turnoverhan the reality (Table 2), with values more close to a steady
tate but with a decreasing trend in the three years simulated261, 3 and −447 kg C ha−1 in 2007, 2008 and 2009, respec-ively). However, considering that the uncertainty of yearly averageEE is on the order of 1000–500 kg C ha−1 yr−1 (Rannik et al.,006; Baldocchi, 2003), the model results tended to lie withinDate
Fig. 4. Cumulated observed net ecosystem exchange (NEE) with the 20% error barsand simulated one at the maize conventional tillage (CT) experiment in Beano.
the variability of measured data (Fig. 4), built plotting the val-ues with 20% error bars (Oren et al., 2006; Hastings et al.,
0
Dec-09Aug-09Apr-09Dec-08Aug-08Apr-08Dec-07Aug-07May-07Jan-07
Date
Fig. 5. Simulated and observed trends of total soil respiration and N2O-N emissionsat the maize reduced tillage (MT) experiment in Beano.
E. Lugato et al. / Agriculture, Ecosystems and Environment 139 (2010) 546–556 551
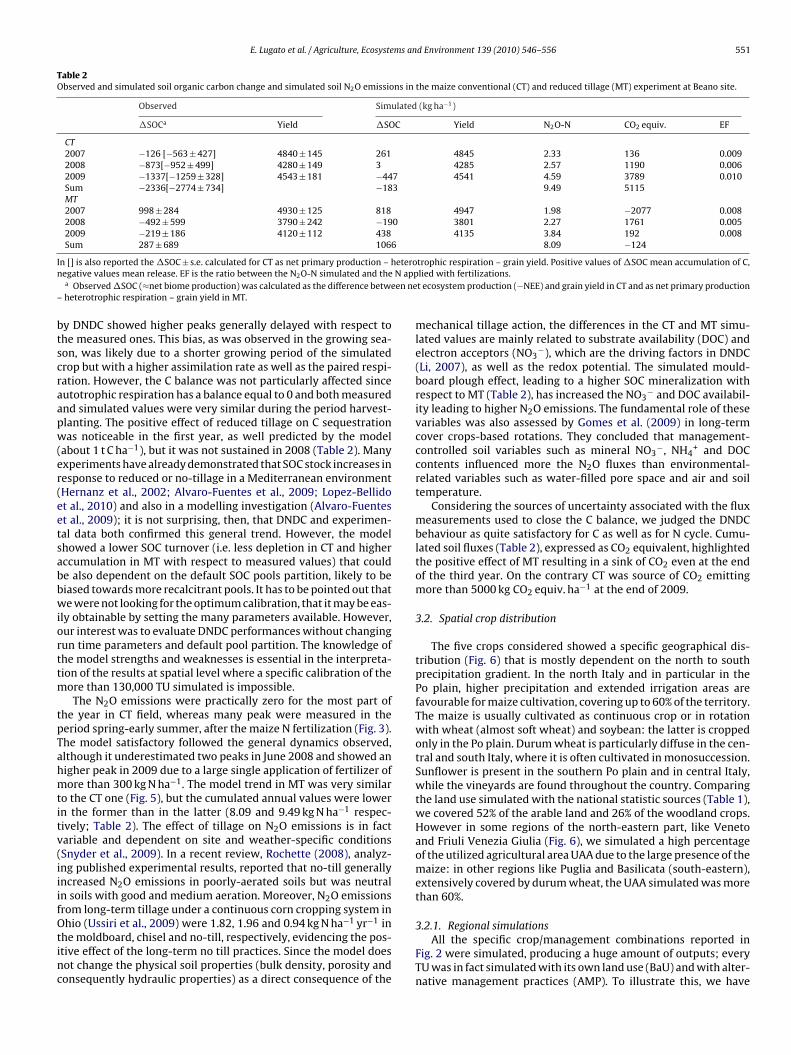
Table 2Observed and simulated soil organic carbon change and simulated soil N2O emissions in the maize conventional (CT) and reduced tillage (MT) experiment at Beano site.
Observed Simulated (kg ha−1)
�SOCa Yield �SOC Yield N2O-N CO2 equiv. EF
CT2007 −126 [−563 ± 427] 4840 ± 145 261 4845 2.33 136 0.0092008 −873[−952 ± 499] 4280 ± 149 3 4285 2.57 1190 0.0062009 −1337[−1259 ± 328] 4543 ± 181 −447 4541 4.59 3789 0.010Sum −2336[−2774 ± 734] −183 9.49 5115MT2007 998 ± 284 4930 ± 125 818 4947 1.98 −2077 0.0082008 −492 ± 599 3790 ± 242 −190 3801 2.27 1761 0.0052009 −219 ± 186 4120 ± 112 438 4135 3.84 192 0.008Sum 287 ± 689 1066 8.09 −124
I eteron N app
en ne–
btscraapw(er(eetsabbwiorttm
tpTahmtitv(iiifOtinc
n [] is also reported the �SOC ± s.e. calculated for CT as net primary production – hegative values mean release. EF is the ratio between the N2O-N simulated and thea Observed �SOC (≈net biome production) was calculated as the difference betweheterotrophic respiration – grain yield in MT.
y DNDC showed higher peaks generally delayed with respect tohe measured ones. This bias, as was observed in the growing sea-on, was likely due to a shorter growing period of the simulatedrop but with a higher assimilation rate as well as the paired respi-ation. However, the C balance was not particularly affected sinceutotrophic respiration has a balance equal to 0 and both measurednd simulated values were very similar during the period harvest-lanting. The positive effect of reduced tillage on C sequestrationas noticeable in the first year, as well predicted by the model
about 1 t C ha−1), but it was not sustained in 2008 (Table 2). Manyxperiments have already demonstrated that SOC stock increases inesponse to reduced or no-tillage in a Mediterranean environmentHernanz et al., 2002; Alvaro-Fuentes et al., 2009; Lopez-Bellidot al., 2010) and also in a modelling investigation (Alvaro-Fuentest al., 2009); it is not surprising, then, that DNDC and experimen-al data both confirmed this general trend. However, the modelhowed a lower SOC turnover (i.e. less depletion in CT and higherccumulation in MT with respect to measured values) that coulde also dependent on the default SOC pools partition, likely to beiased towards more recalcitrant pools. It has to be pointed out thate were not looking for the optimum calibration, that it may be eas-
ly obtainable by setting the many parameters available. However,ur interest was to evaluate DNDC performances without changingun time parameters and default pool partition. The knowledge ofhe model strengths and weaknesses is essential in the interpreta-ion of the results at spatial level where a specific calibration of the
ore than 130,000 TU simulated is impossible.The N2O emissions were practically zero for the most part of
he year in CT field, whereas many peak were measured in theeriod spring-early summer, after the maize N fertilization (Fig. 3).he model satisfactory followed the general dynamics observed,lthough it underestimated two peaks in June 2008 and showed anigher peak in 2009 due to a large single application of fertilizer ofore than 300 kg N ha−1. The model trend in MT was very similar
o the CT one (Fig. 5), but the cumulated annual values were lowern the former than in the latter (8.09 and 9.49 kg N ha−1 respec-ively; Table 2). The effect of tillage on N2O emissions is in factariable and dependent on site and weather-specific conditionsSnyder et al., 2009). In a recent review, Rochette (2008), analyz-ng published experimental results, reported that no-till generallyncreased N2O emissions in poorly-aerated soils but was neutraln soils with good and medium aeration. Moreover, N2O emissionsrom long-term tillage under a continuous corn cropping system in
hio (Ussiri et al., 2009) were 1.82, 1.96 and 0.94 kg N ha−1 yr−1 inhe moldboard, chisel and no-till, respectively, evidencing the pos-tive effect of the long-term no till practices. Since the model doesot change the physical soil properties (bulk density, porosity andonsequently hydraulic properties) as a direct consequence of the
trophic respiration – grain yield. Positive values of �SOC mean accumulation of C,lied with fertilizations.t ecosystem production (−NEE) and grain yield in CT and as net primary production
mechanical tillage action, the differences in the CT and MT simu-lated values are mainly related to substrate availability (DOC) andelectron acceptors (NO3
−), which are the driving factors in DNDC(Li, 2007), as well as the redox potential. The simulated mould-board plough effect, leading to a higher SOC mineralization withrespect to MT (Table 2), has increased the NO3
− and DOC availabil-ity leading to higher N2O emissions. The fundamental role of thesevariables was also assessed by Gomes et al. (2009) in long-termcover crops-based rotations. They concluded that management-controlled soil variables such as mineral NO3
−, NH4+ and DOC
contents influenced more the N2O fluxes than environmental-related variables such as water-filled pore space and air and soiltemperature.
Considering the sources of uncertainty associated with the fluxmeasurements used to close the C balance, we judged the DNDCbehaviour as quite satisfactory for C as well as for N cycle. Cumu-lated soil fluxes (Table 2), expressed as CO2 equivalent, highlightedthe positive effect of MT resulting in a sink of CO2 even at the endof the third year. On the contrary CT was source of CO2 emittingmore than 5000 kg CO2 equiv. ha−1 at the end of 2009.
3.2. Spatial crop distribution
The five crops considered showed a specific geographical dis-tribution (Fig. 6) that is mostly dependent on the north to southprecipitation gradient. In the north Italy and in particular in thePo plain, higher precipitation and extended irrigation areas arefavourable for maize cultivation, covering up to 60% of the territory.The maize is usually cultivated as continuous crop or in rotationwith wheat (almost soft wheat) and soybean: the latter is croppedonly in the Po plain. Durum wheat is particularly diffuse in the cen-tral and south Italy, where it is often cultivated in monosuccession.Sunflower is present in the southern Po plain and in central Italy,while the vineyards are found throughout the country. Comparingthe land use simulated with the national statistic sources (Table 1),we covered 52% of the arable land and 26% of the woodland crops.However in some regions of the north-eastern part, like Venetoand Friuli Venezia Giulia (Fig. 6), we simulated a high percentageof the utilized agricultural area UAA due to the large presence of themaize: in other regions like Puglia and Basilicata (south-eastern),extensively covered by durum wheat, the UAA simulated was morethan 60%.
3.2.1. Regional simulationsAll the specific crop/management combinations reported in
Fig. 2 were simulated, producing a huge amount of outputs; everyTU was in fact simulated with its own land use (BaU) and with alter-native management practices (AMP). To illustrate this, we have

552 E. Lugato et al. / Agriculture, Ecosystems and Environment 139 (2010) 546–556
F = 100a
rvtcnsINdbRwptevh(2oicfer(M
ig. 6. Distribution and area (ha) covered by the crops considered in each TU (TUgricultural area simulated.
eported some results for durum wheat, that is the most culti-ated arable crop in Italy (Fig. 7). Yields were generally lowerhan 2000 kg C ha−1 (about 5200 kg ha−1 of harvested grain) espe-ially in the south Italy, whereas they were higher especially in theorth-east. In this area, the N fertilization was >140 kg N ha−1 toustain crop productivity, decreasing toward the central and southtaly where the average application was 100–120 kg N ha−1. The
2O emissions were in general low (<0.5 kg N ha−1) and were notependent to the spatial distribution of the N fertilization, proba-ly because higher fertilization were offset by the higher uptake.elatively small areas, in which also higher soil CO2 respirationas simulated, showed higher N2O emissions since SOC decom-osition increases the substrate availability (DOC and NO3) forhe biological denitrification. Nevertheless, considering the IPCCmission factor of 0.0125 kg N2O-N/kg N, we would have expectedalues ranging between 1.2 and 1.7 kg ha−1 of N2O-N, substantiallyigher than those simulated. However some recent researchesHalvorson et al., 2008; Del Grosso et al., 2008; Burton et al.,008) reported that emission factors, including the IPCC (2007)nes, over-estimated seasonal N2O emissions, whereas they mayncrease when the N input rate exceeds the crop and soil uptakeapacity (Grant et al., 2006; Halvorson et al., 2008). Moreover
ew studies have investigated the N2O emission in Mediterraneannvironment, where low precipitation (Fig. 1) maintains a highedox potential unfavourable to denitrification. In fact, Meijide et al.2009) reported N2O emission <400 g N ha−1 yr−1 in a non-irrigatedediterranean barley field, under organic and mineral fertilization.
ha). Rectangular areas in the last figure indicates areas with a higher % of utilized
Low emissions (<700 g N–N2O ha−1 yr−1) were also measured in aMediterranean vineyard with and without cover crop (Steenwerthand Belina, 2008).
All the crops simulated (Fig. 8) were combined for their actualland use to assess the total GHG emissions. It has to be emphasizedthat, although the national balance is incomplete, there are someareas (see Section 3.2 and Fig. 6) where simulated crops almostmatched the ‘real’ UAA. In the north-eastern part, the soil was ingeneral a small sink whereas in the south-east it was almost in equi-librium, with values ranging between −500 and 500 kg C ha−1. Thisvariation is in the range of the inter-annual variability under con-stant land use and management and practically undetectable evenwith a higher number of soil samples per hectare (Smith, 2004;Conant and Paustian, 2002). Indeed, these results are in agree-ment with the net biome production (NBP) estimated by Ciais etal. (2010) using the model ORCHIDEE-STICS over European coun-tries. They showed fluxes ranging between 0.1 and 0.3 t C ha−1 yr−1
in the north-eastern Italy and between 0.1 and −0.4 t C ha−1 yr−1
in the south-eastern part. Across the nation some areas showeda SOC decrease greater than 1 t C ha−1, even if this trend could bestrongly dependent on the land use not simulated. In particular,when a large proportion of grassland is present in the TU, the rate
of SOC change could be not representative since grassland sustainshigher SOC level than the only arable crop simulated. Moreover, thenational SOC change value was about −0.139 t C ha−1 for the landuse considered, confirming that croplands are close to an equilib-rium state.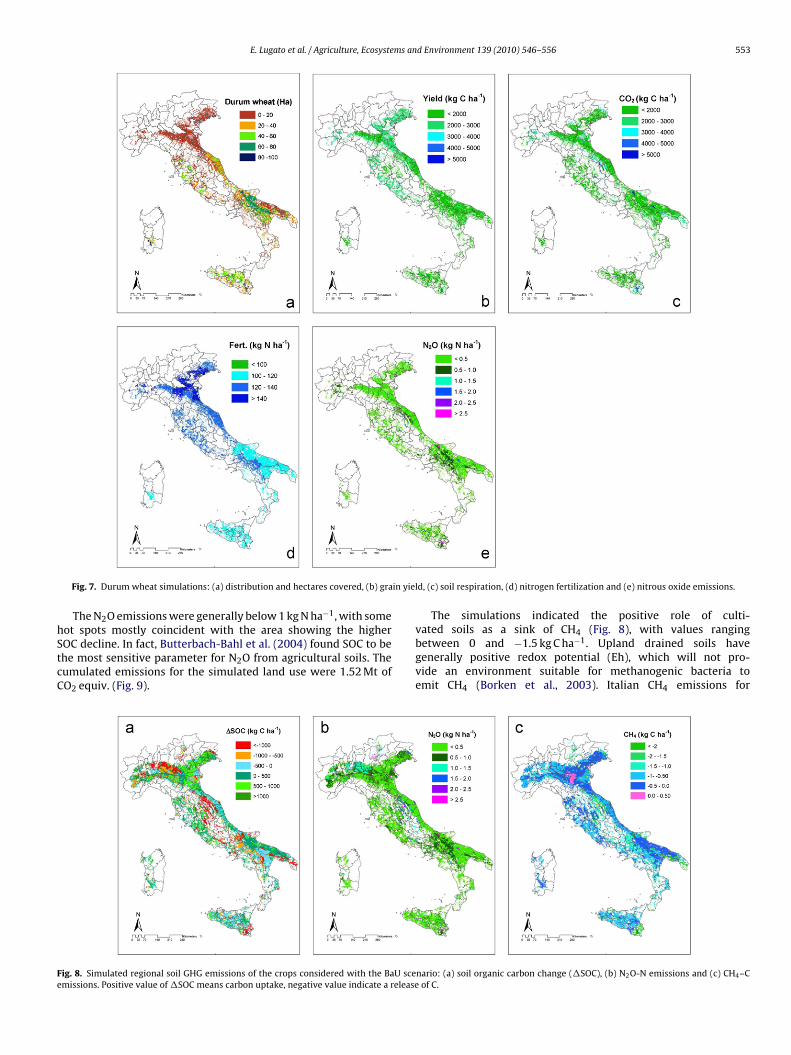
E. Lugato et al. / Agriculture, Ecosystems and Environment 139 (2010) 546–556 553
in yie
hStcC
Fe
Fig. 7. Durum wheat simulations: (a) distribution and hectares covered, (b) gra
The N2O emissions were generally below 1 kg N ha−1, with some
ot spots mostly coincident with the area showing the higherOC decline. In fact, Butterbach-Bahl et al. (2004) found SOC to behe most sensitive parameter for N2O from agricultural soils. Theumulated emissions for the simulated land use were 1.52 Mt ofO2 equiv. (Fig. 9).ig. 8. Simulated regional soil GHG emissions of the crops considered with the BaU scemissions. Positive value of �SOC means carbon uptake, negative value indicate a release
ld, (c) soil respiration, (d) nitrogen fertilization and (e) nitrous oxide emissions.
The simulations indicated the positive role of culti-
vated soils as a sink of CH4 (Fig. 8), with values rangingbetween 0 and −1.5 kg C ha−1. Upland drained soils havegenerally positive redox potential (Eh), which will not pro-vide an environment suitable for methanogenic bacteria toemit CH4 (Borken et al., 2003). Italian CH4 emissions fornario: (a) soil organic carbon change (�SOC), (b) N2O-N emissions and (c) CH4–Cof C.

5 ms an
t(
3
taaliaoftwcdfao
g
FPi
54 E. Lugato et al. / Agriculture, Ecosyste
he simulated crops were equal to −0.08 Mt of CO2 equiv.Fig. 9).
.2.2. Sources of uncertaintyThe accuracy of the spatial simulation is strongly dependent to
he model accuracy and the quality of input data. Experimental sitesllow to test the model performance, calibrate the crop parametersnd assess the level of uncertainty (Hastings et al., 2010). The simu-ations with a SOC range of +/−10%, likely one of the most importantnput parameter in controlling the C and N2O emissions, allowed tossociate a measure of variability to the results. The CV distributionf the CO2 and CH4 equivalent emissions were similar and up to 30%or about 70% of the TUs simulated (Fig. 9), while more than 60% ofhem showed a CV within the 10% for the N2O. When the varianceas propagated by the quadrature method (see Section 2.3.4), the
umulated uncertainty appeared very low for all the fluxes as evi-enced by the small error bars (95% confidence interval) in Fig. 9. Inact this method supposed that errors add randomly thus they have
tendency to offset each other especially with a very high numberf “samples”.Moreover, in order to quantify the error attributable to the geo-raphical input data quality, we also compared the model input
-1.2 -0.8 -0.4 0.0 0.4 0
ABR
BAS
CAL
CAM
EMI
FRI
LAZ
LIG
LOM
MAR
MOL
PIE
PUG
SAR
SIC
TOS
TRE
UMB
VAL
VEN
Total
N2O
CO2
CH4
GHG emissions
N2O
CO2
CH4
ig. 9. Simulated annual GHG emissions (CO2, N2O and CH4) from soil expressed as CO2 eositive value of �SOC means carbon uptake, negative value indicate a release of C. Bars in the graphics inside the box.
d Environment 139 (2010) 546–556
and output at the Beano experimental site and in the TU simu-lated at regional level, containing the site coordinates (Table 3).It is worth to point out that at the Beano, despite the exper-imental activity, the crop was managed by a farmer applyingthe common practices of the area. From the corresponding TU,we selected the maize grain irrigated and conventionally tilledto represent the local condition. As reported in Table 3, somesoil properties implemented from the geographical database werevery similar to those measured (pH, bulk density and clay con-tent). Nevertheless the SOC concentration was 33% lower thanthe measured one, likely leading to a higher SOC accumulationand a lower N2O-N emission. This low value was also affectedby the lower N fertilization rates compared to the local practices.The amount of water applied by DNDC as irrigation (95 mm) wasslightly lower than the farmer application (110 mm). However inthe first case, the water was supplied with high efficiency wheneverrequired, whereas, in the second, many other factors such as irri-gation turn, wind disturbance, evaluation of the crop water stress
and farmer habits make this practice more inefficient. Thus morelikely, irrigation applied by the farmer could have created tempo-rary anaerobic conditions enhancing N2O fluxes, a situation notexpected in the model since it does not apply water exceeding crop.8 1.2 1.6 2.0 2.4
010
20
30
40
50
60
70
80
90
100
11
0120
130
140
150
160
170
180
190
200
CV(%)
0
20
40
60
80
100
Re
lative
Fre
qu
en
cy (
%)
01
02
03
04
05
06
07
08
09
01
00
11
01
20
13
01
40
15
01
60
17
01
80
19
02
00
CV (%)
0
20
40
60
80
100
Rela
tive F
requency (
%)
01
02
03
04
05
06
07
08
09
01
00
11
01
20
13
01
40
15
01
60
17
01
80
19
02
00
CV (%)
0
20
40
60
80
100
Rela
tive F
requency (
%)
N O
CO
CH
(Mt CO2 eq.)
quivalent for the land use simulated and grouped by Italian administrative regions.ndicate the 95% confidence interval. Distribution of CV across TUs was represented
E. Lugato et al. / Agriculture, Ecosystems and Environment 139 (2010) 546–556 555
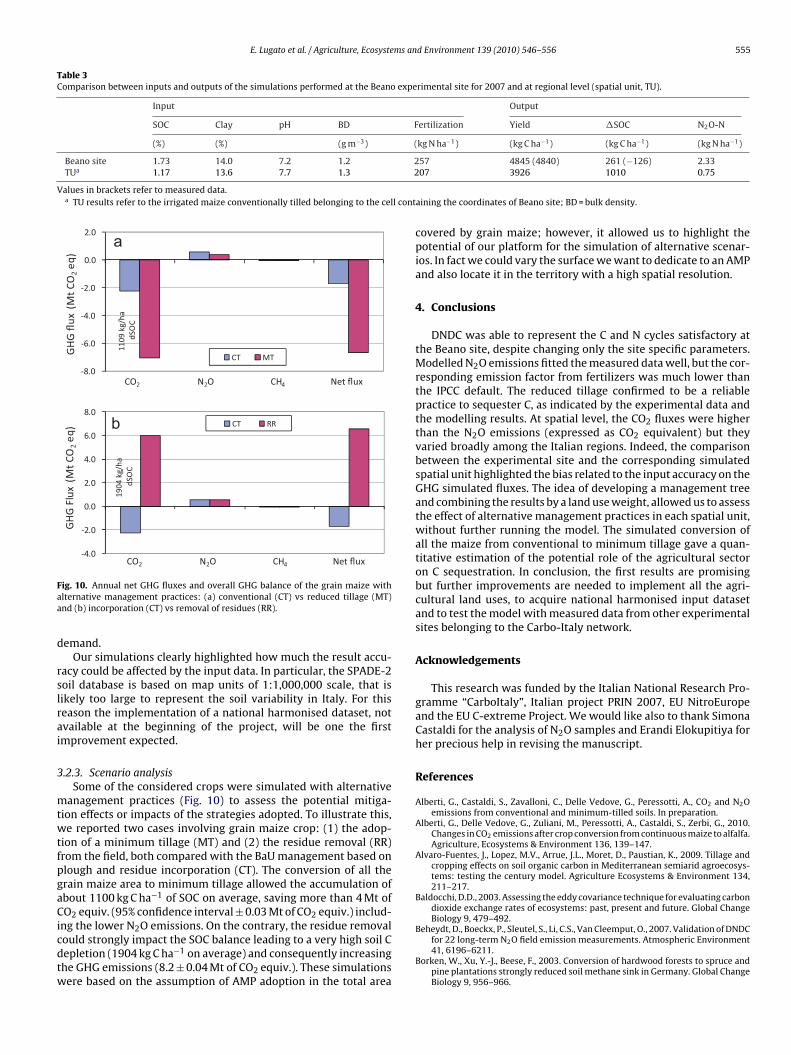
Table 3Comparison between inputs and outputs of the simulations performed at the Beano experimental site for 2007 and at regional level (spatial unit, TU).
Input Output
SOC Clay pH BD Fertilization Yield �SOC N2O-N
(%) (%) (g m−3) (kg N ha−1) (kg C ha−1) (kg C ha−1) (kg N ha−1)
Beano site 1.73 14.0 7.2 1.2 257 4845 (4840) 261 (−126) 2.33TUa 1.17 13.6 7.7 1.3 2
Values in brackets refer to measured data.a TU results refer to the irrigated maize conventionally tilled belonging to the cell cont
a
b
-8.0
-6.0
-4.0
-2.0
0.0
2.0
GH
G fl
ux (
Mt C
O2
eq)
CO2 N2O CH4 Net flux
CT MT
1109
kg/
hadS
OC
-4.0
-2.0
0.0
2.0
4.0
6.0
8.0
GH
G F
lux
(Mt C
O2
eq)
CO2 N2O CH4 Net flux
CT RR
1904
kg/
hadS
OC
Faa
d
rslrai
3
mtwtfpgaCicdtw
ig. 10. Annual net GHG fluxes and overall GHG balance of the grain maize withlternative management practices: (a) conventional (CT) vs reduced tillage (MT)nd (b) incorporation (CT) vs removal of residues (RR).
emand.Our simulations clearly highlighted how much the result accu-
acy could be affected by the input data. In particular, the SPADE-2oil database is based on map units of 1:1,000,000 scale, that isikely too large to represent the soil variability in Italy. For thiseason the implementation of a national harmonised dataset, notvailable at the beginning of the project, will be one the firstmprovement expected.
.2.3. Scenario analysisSome of the considered crops were simulated with alternative
anagement practices (Fig. 10) to assess the potential mitiga-ion effects or impacts of the strategies adopted. To illustrate this,e reported two cases involving grain maize crop: (1) the adop-
ion of a minimum tillage (MT) and (2) the residue removal (RR)rom the field, both compared with the BaU management based onlough and residue incorporation (CT). The conversion of all therain maize area to minimum tillage allowed the accumulation ofbout 1100 kg C ha−1 of SOC on average, saving more than 4 Mt ofO2 equiv. (95% confidence interval ± 0.03 Mt of CO2 equiv.) includ-
ng the lower N O emissions. On the contrary, the residue removal
2ould strongly impact the SOC balance leading to a very high soil Cepletion (1904 kg C ha−1 on average) and consequently increasinghe GHG emissions (8.2 ± 0.04 Mt of CO2 equiv.). These simulationsere based on the assumption of AMP adoption in the total area07 3926 1010 0.75
aining the coordinates of Beano site; BD = bulk density.
covered by grain maize; however, it allowed us to highlight thepotential of our platform for the simulation of alternative scenar-ios. In fact we could vary the surface we want to dedicate to an AMPand also locate it in the territory with a high spatial resolution.
4. Conclusions
DNDC was able to represent the C and N cycles satisfactory atthe Beano site, despite changing only the site specific parameters.Modelled N2O emissions fitted the measured data well, but the cor-responding emission factor from fertilizers was much lower thanthe IPCC default. The reduced tillage confirmed to be a reliablepractice to sequester C, as indicated by the experimental data andthe modelling results. At spatial level, the CO2 fluxes were higherthan the N2O emissions (expressed as CO2 equivalent) but theyvaried broadly among the Italian regions. Indeed, the comparisonbetween the experimental site and the corresponding simulatedspatial unit highlighted the bias related to the input accuracy on theGHG simulated fluxes. The idea of developing a management treeand combining the results by a land use weight, allowed us to assessthe effect of alternative management practices in each spatial unit,without further running the model. The simulated conversion ofall the maize from conventional to minimum tillage gave a quan-titative estimation of the potential role of the agricultural sectoron C sequestration. In conclusion, the first results are promisingbut further improvements are needed to implement all the agri-cultural land uses, to acquire national harmonised input datasetand to test the model with measured data from other experimentalsites belonging to the Carbo-Italy network.
Acknowledgements
This research was funded by the Italian National Research Pro-gramme “CarboItaly”, Italian project PRIN 2007, EU NitroEuropeand the EU C-extreme Project. We would like also to thank SimonaCastaldi for the analysis of N2O samples and Erandi Elokupitiya forher precious help in revising the manuscript.
References
Alberti, G., Castaldi, S., Zavalloni, C., Delle Vedove, G., Peressotti, A., CO2 and N2Oemissions from conventional and minimum-tilled soils. In preparation.
Alberti, G., Delle Vedove, G., Zuliani, M., Peressotti, A., Castaldi, S., Zerbi, G., 2010.Changes in CO2 emissions after crop conversion from continuous maize to alfalfa.Agriculture, Ecosystems & Environment 136, 139–147.
Alvaro-Fuentes, J., Lopez, M.V., Arrue, J.L., Moret, D., Paustian, K., 2009. Tillage andcropping effects on soil organic carbon in Mediterranean semiarid agroecosys-tems: testing the century model. Agriculture Ecosystems & Environment 134,211–217.
Baldocchi, D.D., 2003. Assessing the eddy covariance technique for evaluating carbondioxide exchange rates of ecosystems: past, present and future. Global ChangeBiology 9, 479–492.
Beheydt, D., Boeckx, P., Sleutel, S., Li, C.S., Van Cleemput, O., 2007. Validation of DNDCfor 22 long-term N2O field emission measurements. Atmospheric Environment41, 6196–6211.
Borken, W., Xu, Y.-J., Beese, F., 2003. Conversion of hardwood forests to spruce andpine plantations strongly reduced soil methane sink in Germany. Global ChangeBiology 9, 956–966.

5 ms an
B
B
C
C
C
D
D
E
F
F
G
G
G
H
H
H
I
L
L
L
L
56 E. Lugato et al. / Agriculture, Ecosyste
urton, D.L., Li, X., Grant, C.A., 2008. Influence of fertilizer nitrogen source and man-agement practice on N2O emissions from two black chernozemic soils. CanadianJournal of Soil Science 88, 219–227.
utterbach-Bahl, K., Kesik, M., Miehle, P., Papen, H., Li, C., 2004. Quantifying theregional source strength of N-trace gases across agricultural and forest ecosys-tems with process based models. Plant and Soil 206, 311–329.
ai, Z.C., Sawamoto, T., Li, C.S., Kang, G.D., Boonjawat, J., Mosier, A., Wassmann,R., Tsuruta, H., 2003. Field validation of the DNDC model for greenhouse gasemissions in East Asian cropping systems. Global Biogeochemical Cycles, 17.
iais, P., Wattenbach, M., Vuichard, N., Smith, P., Piao, S.L., Don, A., Luyssaert, S.,Janssens, I.A., Bondeau, A., Dechow, R., Leip, A., Smith, P., Beer, C., Werf, G.R.V.D.,Gervois, S., Oost, K.V., Tomelleri, E., Freibauer, A., Schulze, E.D., 2010. The Euro-pean carbon balance. Part 2: Croplands. Global Change Biology 16, 1409–1428.
onant, R.T., Paustian, K., 2002. Spatial variability of soil organic carbon in grass-lands: implications for detecting change at different scales. EnvironmentalPollution 116, S127–S135.
el Grosso, S.J., Halvorson, A.D., Parton, W.J., 2008. Testing DAYCENT model simu-lations of corn yields and nitrous oxide emissions in irrigated tillage systems inColorado. Journal of Environmental Quality 37, 1383–1389.
elle Vedove, G., Alberti, G., Peressotti, A., Inglima, I., Zuliani, M., Zerbi, G., 2007.Automated monitoring of soil respiration: an improved automatic chambersystem. Italian Journal of Agronomy 4, 377–382.
aster, M., Paustian, K., Killian, K., Williams, S., Feng, T., Al-Adamat, R., Batjes, N.H.,Bernoux, M., Bhattacharyya, T., Cerri, C.C., Cerri, C.E.P., Coleman, K., Falloon, P.,Feller, C., Gicheru, P., Kamoni, P., Milne, E., Pal, D.K., Powlson, D.S., Rawajfih, Z.,Sessay, M., Wokabi, S., 2007. The GEFSOC soil carbon modelling system: a toolfor conducting regional-scale soil carbon inventories and assessing the impactsof land use change on soil carbon. Agriculture Ecosystems & Environment 122,13–25.
AO, 2006. World Reference Base for Soil Resources 2006. World Soil ResourcesReports n. 103. Food and Agricultural Organization, Rome, p. 128.
reibauer, A., 2003. Regionalised inventory of biogenic greenhouse gas emissionsfrom European agriculture. European Journal of Agronomy 19, 135–160.
iltrap, D.L., Li, C., Saggar, S., 2010. DNDC: A process-based model of greenhousegas fluxes from agricultural soils. Agriculture Ecosystems & Environment 136,292–300.
omes, J., Bayer, C., Costa, F.D., Piccolo, M.D., Zanatta, J.A., Vieira, F.C.B., Six, J., 2009.Soil nitrous oxide emissions in long-term cover crops-based rotations undersubtropical climate. Soil & Tillage Research 106, 36–44.
rant, R.F., Pattey, E., Goddard, T.W., Kryzanowski, L.M., Puurveen, H., 2006. Mod-eling the effects of fertilizer application rate on nitrous oxide emissions. SoilScience Society of America Journal 70, 235–248.
alvorson, A.D., Del Grosso, S.J., Reule, C.A., 2008. Nitrogen, tillage, and crop rotationeffects on nitrous oxide emissions from irrigated cropping systems. Journal ofEnvironmental Quality 37, 1337–1344.
astings, A.F, Wattenbach, M., Eugster, W., Li, C.S., Buchmann, N., Smith, P., 2010.Uncertainty propagation in soil greenhouse gas emission models: an experi-ment using the DNDC model and at the Oensingen cropland site. AgricultureEcosystems & Environment 136, 97–110.
ernanz, J.L., Lopez, R., Navarrete, L., Sanchez-Giron, V., 2002. Long-term effectsof tillage systems and rotations on soil structural stability and organic carbonstratification in semiarid central Spain. Soil & Tillage Research 66, 129–141.
PCC, 2007. Summary for policymakers. Climate change 2007: the physical sciencebasis. Contribution of Working Group I to the Fourth Assessment Report of theIntergovernmental Panel on Climate Change. In: Solomon, S., Qin, D., Manning,M., Chen, Z., Marquis, M., Averyt, K.B., Tignor, M., Miller, H.L. (Eds.). CambridgeUniversity Press, Cambridge, United Kingdom and New York, NY, USA.
eip, A., Marchi, G., Koeble, R., Kempen, M., Britz, W., Li, C., 2008. Linking an economicmodel for European agriculture with a mechanistic model to estimate nitrogenand carbon losses from arable soils in Europe. Biogeosciences 5, 73–94.
i, C., 2007. Quantifying greenhouse gas emissions from soils: scientific basis andmodeling approach. Soil Science and Plant Nutrition 53, 344–352.
i, C., Farahbakhshazad, N., Jaynes, D.B., Dinnes, D.L., Salas, W., McLaughlin, D., 2006.Modeling nitrate leaching with a biogeochemical model modified based onobservations in a row-crop field in Iowa. Ecological Modelling 196, 116–130.
i, C., Frolking, S., Frolking, T.A., 1992. A model of nitrous oxide evolution from soildriven by rainfall events. I. Model structure and sensitivity. Journal of Geophys-ical Research 97, 9759–9776.
d Environment 139 (2010) 546–556
Li, H., Qiu, J.J., Wang, L.G., Tang, H.J., Li, C.S., Van Ranst, E., 2010. Modelling impacts ofalternative farming management practices on greenhouse gas emissions from awinter wheat–maize rotation system in China. Agriculture Ecosystems & Envi-ronment 135, 24–33.
Lokupitiya, E., Paustian, K., 2006. Agricultural soil GHG emissions: a review ofnational inventory methods. Journal of Environmental Quality 35, 1413–1427.
Lopez-Bellido, R.J., Fontan, J.M., Lopez-Bellido, F.J., Lopez-Bellido, L., 2010. Carbonsequestration by tillage, rotation, and nitrogen fertilization in a Mediterraneanvertisol. Agronomy Journal 102, 310–318.
Lugato, E., Berti, A., 2008. Potential carbon sequestration in a cultivated soil underdifferent climate change scenarios: a modelling approach for evaluating promis-ing management practices in north-east Italy. Agriculture Ecosystems & amp;Environment 128, 97–103.
Lugato, E., Berti, A., Giardini, L., 2006. Soil organic carbon (SOC) dynamics with andwithout residue incorporation in relation to different nitrogen fertilisation rates.Geoderma 135, 315–321.
Lugato, E., Paustian, K., Giardini, L., 2007. Modelling soil organic carbon dynamicsin two long-term experiments of north-eastern Italy. Agriculture Ecosystems &Environment 120, 423–432.
Meijide, A., Garcia-Torres, L., Arce, A., Vallejo, A., 2009. Nitrogen oxide emissionsaffected by organic fertilization in a non-irrigated Mediterranean barley field.Agriculture Ecosystems & Environment 132, 106–115.
Morari, F., Lugato, E., Berti, A., Giardini, L., 2006. Long-term effects of recommendedmanagement practices on soil carbon changes and sequestration in north-eastern Italy. Soil Use and Management 22, 71–81.
Oren, R., Hsieth, C.I., Stoy, P., Albertson, J., McCarthy, H.R., Harrell, P., Katul, G.G.,2006. Estimating the uncertainty in annual net ecosystem carbon exchange:spatial variation in turbulent fluxes and sampling errors in eddy-covariancemeasurements. Global Change Biology 12, 883–896.
Rannik, U., Kolari, P., Vesala, T., Hari, P., 2006. Uncertainties in measurementand modelling of net ecosystem exchange of a forest. Agricultural and ForestMeterology 138, 244–257.
Rochette, P., 2008. No-till only increases N2O emissions in poorly-aerated soils. Soil& Tillage Research 101, 97–100.
Romano, D., Arcarese, C., Bernetti, A., Caputo, A., Cóndor, R.D., Contaldi, M., De Lau-retis, R., Di Cristofaro, E., Federici, S., Gagna, A., Gonella, B., Liburdi, R., Taurino, E.,Vitullo, M., 2009. Italian Greenhouse Gas Inventory 1990–2007, ISPRA – Institutefor Environmental Protection and Research, Rome.
Smith, P., 2004. How long before a change in soil organic carbon can be detected?Global Change Biology 10, 1878–1883.
Smith, P., 2005. An overview of the permanence of soil organic carbon stocks: influ-ence of direct human-induced, indirect and natural effects. European Journal ofSoil Science 56, 673–680.
Smith, P., Smith, J.U., Powlson, D.S., McGill, W.B., Arah, J.R.M., Chertov, O.G., Coleman,K., Franko, U., Frolking, S., Jenkinson, D.S., Jensen, L.S., Kelly, R.H., Klein-Gunnewiek, H., Komarov, A.S., Li, C., Molina, J.A.E., Mueller, T., Parton, W.J.,Thornley, J.H.M., Whitmore, A.P., 1997. A comparison of the performance of ninesoil organic matter models using datasets from seven long-term experiments.Geoderma 81, 153–225.
Smith, W.N., Grant, B.B., Desjardins, R.L., Worth, D., Li, C., Boles, S.H., Huffman, E.C.,2010. A tool to link agricultural activity data with the DNDC model to estimateGHG emission factors in Canada. Agriculture Ecosystems & Environment 136,301–309.
Snyder, C.S., Bruulsema, T.W., Jensen, T.L., Fixen, P.E., 2009. Review of greenhousegas emissions from crop production systems and fertilizer management effects.Agriculture Ecosystems & Environment 133, 247–266.
Steenwerth, K., Belina, K.M., 2008. Cover crops and cultivation: impacts on soil Ndynamics and microbiological function in a Mediterranean vineyard agroecosys-tem. Applied Soil Ecology 40, 370–380.
Triberti, L., Nastri, A., Giordani, G., Comellini, F., Baldoni, G., Toderi, G., 2008. Canmineral and organic fertilization help sequestrate carbon dioxide in cropland?European Journal of Agronomy 29, 13–20.
Ussiri, D.A.N., Lal, R., Jarecki, M.K., 2009. Nitrous oxide and methane emissions fromlong-term tillage under a continuous corn cropping system in Ohio. Soil & TillageResearch 104, 247–255.
Zimmermann, M., Leifeld, J., Schmidt, M.W.I., Smith, P., Fuhrer, J., 2006. Measured soilorganic matter fractions can be related to pools in the RothC model. EuropeanJournal of Soil Science 58, 658–667.