
International Journal of Greenhouse Gas Control - KSA Climate
Upload
khangminh22Category
view
3download
0
June 2021
2021 Government Greenhouse Gas Conversion Factors for Company Reporting Methodology Paper for Conversion factors Final Report

2
© Crown copyright 2021
This publication is licensed under the terms of the Open Government Licence v3.0 except where otherwise stated. To view this licence, visit www.nationalarchives.gov.uk/doc/open-government-licence/ or write to the Information Policy Team, The National Archives, Kew, London TW9 4DU, or email: [email protected].
Any enquiries regarding this publication should be sent to [email protected].
If you need a version of this document in a more accessible format, please email . Please tell us what format you need. It will help us if you say what assistive technology you use.
This document has been produced by Nikolas Hill, Glen Thistlethwaite, Judith Bates, Eirini Karagianni, Joanna MacCarthy, Paddy Mullen, Alex Kelsall, Sam Hinton, Charles Walker (Ricardo Energy & Environment) and Billy Harris (WRAP) for the Department for Business Energy & Industrial Strategy (BEIS).
2021 Government greenhouse gas conversion factors for company reporting: Methodology paper
3
Contents List of Abbreviations ................................................................................................................. 11
1. General Introduction ......................................................................................................... 14
Overview of changes since the previous update ................................................................. 15
2. Fuel Emission Factors ...................................................................................................... 17
Section summary ................................................................................................................ 17
Summary of changes since the previous update ................................................................ 17
Direct Emissions ................................................................................................................. 18
Indirect/WTT Emissions from Fuels .................................................................................... 18
3. UK Electricity, Heat and Steam Emission Factors ............................................................ 24
Section summary ................................................................................................................ 24
Summary of changes since the previous update ................................................................ 24
Direct Emissions from UK Grid Electricity ........................................................................... 25
Indirect/WTT Emissions from UK Grid Electricity ................................................................ 33
Conversion factors for the Supply of Purchased Heat or Steam ......................................... 36
Summary of Method 1: 1/3: 2/3 Method (DUKES) .............................................................. 37
Calculation of CO2 Emissions Factor for CHP Fuel Input, FuelMixCO2factor ..................... 37
Calculation of Non-CO2 and Indirect/WTT Emissions Factor for Heat and Steam .............. 41
4. Refrigerant and Process Emission Factors ....................................................................... 42
Section summary ................................................................................................................ 42
Summary of changes since the previous update ................................................................ 42
Global Warming Potentials of Greenhouse Gases ............................................................. 42
Greenhouse Gases Listed in the Kyoto Protocol ................................................................ 42
Other Greenhouse Gases ................................................................................................... 42
5. Passenger Land Transport Emission Factors ................................................................... 43
Section summary ................................................................................................................ 43
Summary of changes since the previous update ................................................................ 43
Direct Emissions from Passenger Cars .............................................................................. 44
Conversion factors for Petrol and Diesel Passenger Cars by Engine Size ......................... 44
Hybrid, LPG and CNG Passenger Cars .............................................................................. 50
Plug-in Hybrid Electric and Battery Electric Passenger Cars (xEVs) .................................. 50
Data inputs, sources, and key assumptions ........................................................................ 51
Conversion factors by Passenger Car Market Segments ................................................... 57
2021 Government greenhouse gas conversion factors for company reporting: Methodology paper
4
Direct Emissions from Taxis ............................................................................................... 58
Direct Emissions from Vans/Light Goods Vehicles (LGVs) ................................................. 59
Plug-in Hybrid Electric and Battery Electric Vans (xEVs) .................................................... 61
Direct Emissions from Buses .............................................................................................. 61
Direct Emissions from Motorcycles ..................................................................................... 63
Direct Emissions from Passenger Rail ................................................................................ 65
International Rail (Eurostar) ................................................................................................ 65
National Rail ....................................................................................................................... 66
Light Rail ............................................................................................................................. 66
London Underground .......................................................................................................... 67
Indirect/WTT Emissions from Passenger Land Transport ................................................... 67
Cars, Vans, Motorcycles, Taxis, Buses and Ferries............................................................ 67
Rail ...................................................................................................................................... 67
6. Freight Land Transport Emission Factors ......................................................................... 69
Section summary ................................................................................................................ 69
Summary of changes since the previous update ................................................................ 69
Direct Emissions from Heavy Goods Vehicles (HGVs) ....................................................... 69
Direct Emissions from Vans/Light Goods Vehicles (LGVs) ................................................. 72
Direct Emissions from Rail Freight ...................................................................................... 74
Indirect/WTT Emissions from Freight Land Transport......................................................... 74
Vans and HGVs .................................................................................................................. 74
Rail ...................................................................................................................................... 74
7. Sea Transport Emission Factors ....................................................................................... 75
Section summary ................................................................................................................ 75
Summary of changes since the previous update ................................................................ 75
Direct Emissions from RoPax Ferry Passenger Transport and ........................................... 75
freight .................................................................................................................................. 75
Direct Emissions from Other Marine Freight Transport ....................................................... 76
Indirect/WTT Emissions from Sea Transport ...................................................................... 77
8. Air Transport Emission Factors ......................................................................................... 78
Section summary ................................................................................................................ 78
Summary of changes since the previous update ................................................................ 78
Passenger Air Transport Direct CO2 Emission Factors ....................................................... 78
Allocating flights into short- and long-haul: ......................................................................... 81
Taking Account of Freight ................................................................................................... 83
2021 Government greenhouse gas conversion factors for company reporting: Methodology paper
5
Taking Account of Seating Class Factors ........................................................................... 84
Freight Air Transport Direct CO2 Emission Factors ............................................................. 86
Conversion factors for Dedicated Air Cargo Services ......................................................... 86
Conversion factors for Freight on Passenger Services ....................................................... 88
Average Conversion factors for All Air Freight Services ..................................................... 88
Air Transport Direct Conversion factors for CH4 and N2O ................................................... 89
Emissions of CH4 ................................................................................................................ 89
Emissions of N2O ................................................................................................................ 89
Indirect/WTT Conversion factors from Air Transport ........................................................... 91
Other Factors for the Calculation of GHG Emissions .......................................................... 91
Great Circle Flight Distances .............................................................................................. 91
Indirect effects of non-CO2 emissions ................................................................................. 91
9. Bioenergy and Water ........................................................................................................ 94
Section summary ................................................................................................................ 94
Summary of changes since the previous update ................................................................ 94
General Methodology .......................................................................................................... 95
Water .................................................................................................................................. 95
Biofuels ............................................................................................................................... 95
Other biomass and biogas .................................................................................................. 97
10. Overseas Electricity Emission Factors .............................................................................. 99
Section summary ................................................................................................................ 99
Summary of changes since the previous update ................................................................ 99
Direct Emissions and Emissions resulting from Transmission and Distribution Losses from Overseas Electricity Generation ......................................................................................... 99
Indirect/WTT Emissions from Overseas Electricity Generation ......................................... 100
11. Hotel Stay ....................................................................................................................... 101
Section summary .............................................................................................................. 101
Summary of changes since the previous update .............................................................. 101
Direct emissions from a hotel stay .................................................................................... 101
12. Material Consumption/Use and Waste Disposal ............................................................. 103
Section summary .............................................................................................................. 103
Summary of changes since the previous update .............................................................. 103
Emissions from Material Use and Waste Disposal............................................................ 104
Material Consumption/Use ................................................................................................ 105
Waste Disposal ................................................................................................................. 106
2021 Government greenhouse gas conversion factors for company reporting: Methodology paper
6
13. Fuel Properties ............................................................................................................... 109
Section summary .............................................................................................................. 109
Summary of changes since the previous update .............................................................. 109
General Methodology ........................................................................................................ 109
14. SECR kWh Conversion factors ....................................................................................... 111
Section summary .............................................................................................................. 111
Summary of changes since the previous update .............................................................. 112
General Methodology ........................................................................................................ 112
References ............................................................................................................................. 113
Appendix 1. Additional Methodological Information on the Material Consumption/Use and Waste Disposal Factors ......................................................................................................... 119
1.1 Data Quality Requirements .................................................................................... 119
1.2 Data Sources ......................................................................................................... 120
1.3 Use of data below the set quality standard ............................................................ 120
Wood and Paper data ....................................................................................................... 120
Excluded Materials and Products ..................................................................................... 121
Greenhouse Gas Conversion factors ................................................................................ 125
Appendix 2. Updated full time series – Electricity and Heat and Steam Factors .................... 126
2021 Government greenhouse gas conversion factors for company reporting: Methodology paper
7
Tables Table 1: Related worksheets to the fuel conversion factors ........................................................... 17
Table 2: Liquid biofuels for transport consumption ......................................................................... 19
Table 3: Imports of LNG into the UK as a share of imports and net total natural gas supply .......... 20
Table 4: Basis of the indirect/WTT emissions factors for different fuels ......................................... 21
Table 5: Related worksheets to UK electricity and heat & steam emission factors ......................... 24
Table 6: Base electricity generation emissions data ...................................................................... 27
Table 7: Base electricity generation conversion factors (excluding imported electricity) ................. 29
Table 8: Base electricity generation emissions factors (including imported electricity) ................... 31
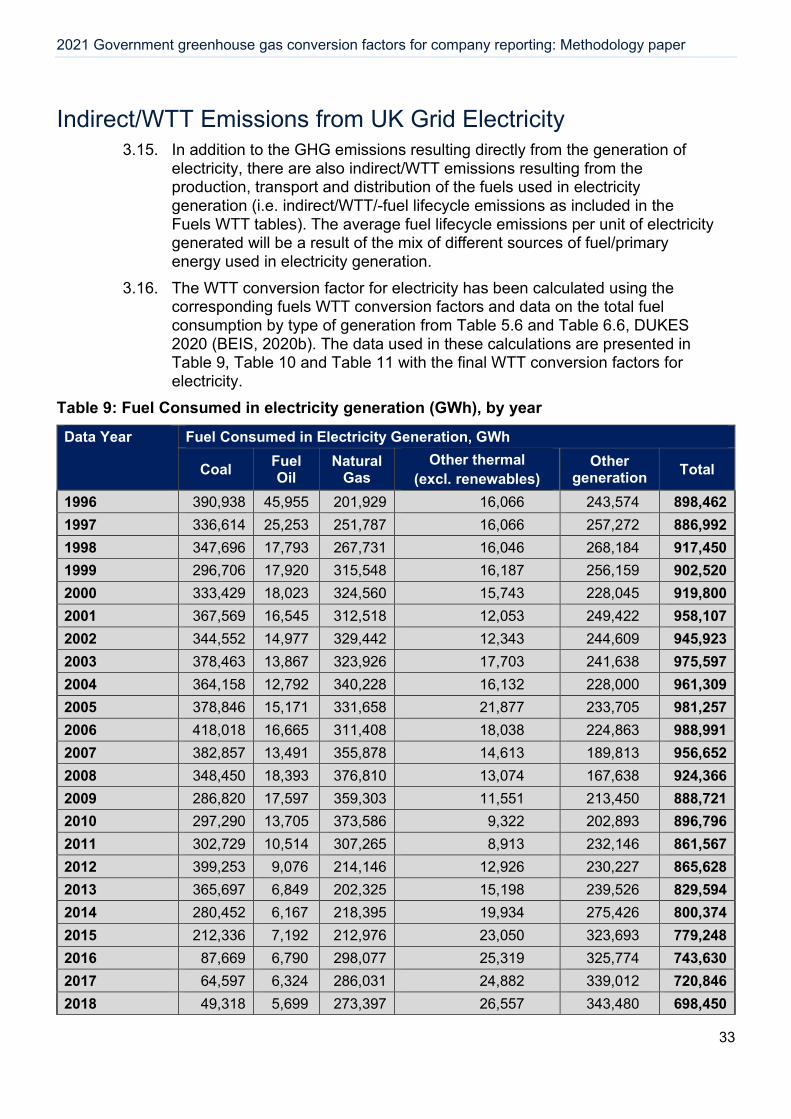
Table 9: Fuel Consumed in electricity generation (GWh), by year ................................................. 33
Table 10: Fuel consumed in electricity generation as a % of the Total, by year ............................. 34
Table 11: Indirect/WTT emissions share for fuels used for electricity generation and the calculated average indirect/WTT emission factor, by year .............................................................. 35
Table 12: Fuel types and associated emissions factors used in the determination of FuelMixCO2factor ...................................................................................................................................... 39
Table 13: Heat/Steam CO2 emission factor for DUKES 1/3 2/3 method. ........................................ 40
Table 14: Related worksheets to passenger land transport emission factors ................................. 43
Table 15: Average CO2 conversion factors and total registrations by engine size for 2004 to 2020 (based on data sourced from SMMT) ........................................................................................ 45
Table 16: Average ‘real-world’ uplift for the UK applied to gCO2/km data ...................................... 46
Table 17: Summary of emissions reporting and tables for electric vehicle emission factors ........... 51
Table 18: xEV car models and their allocation to different market segments ................................. 52
Table 19: Summary of key data elements, sources and key assumptions used in the calculation of GHG conversion factors for electric cars and vans ................................................................. 54
Table 20: Average car CO2 conversion factors and total registrations by market segment for 2004 to 2020 (based on data sourced from SMMT) .................................................................... 57
Table 21: New conversion factors for vans for the 2021 GHG Conversion factors ......................... 60
Table 22: xEV van models and their allocation to different size categories .................................... 61
Table 23: Key assumptions used in the calculation of CO2 emissions from Urea (aka ‘AdBlue’) use62
Table 24: Conversion factors for buses for the 2021 GHG Conversion factors .............................. 63
Table 25: Summary dataset on CO2 emissions from motorcycles based on detailed data provided by Clear (2008) .................................................................................................................. 64
Table 26: GHG emission factors, electricity consumption and passenger km for different tram and light rail services ................................................................................................................... 66
Table 27 Related worksheets to freight land transport emission factors ........................................ 69
Table 28: Change in CO2 emissions caused by +/- 50% change in load from the average loading factor of 50% ........................................................................................................................... 70
Table 29: Typical van freight capacities and estimated average payload ....................................... 72
2021 Government greenhouse gas conversion factors for company reporting: Methodology paper
8
Table 30: Utilisation of vehicle capacity by company-owned LGVs: annual average 2003 – 2005 (proportion of total vehicle kilometres travelled) ............................................................. 73
Table 31: Related worksheets to sea transport emission factors ................................................... 75
Table 32: Assumptions used in the calculation of ferry emission factors ........................................ 76
Table 33: Related worksheets to air transport emission factors ..................................................... 78
Table 34: Assumptions used in the calculation of revised average CO2 conversion factors for passenger flights for 2021 ............................................................................................................... 79
Table 35: Illustrative short- and long- haul flight distances from the UK ......................................... 82
Table 36: CO2 conversion factors for alternative freight allocation options for passenger flights based on 2021 GHG Conversion factors ....................................................................................... 83
Table 37: Final average CO2 conversion factors for passenger flights for 2021 GHG Conversion factors (excluding distance and RF uplifts) ................................................................................ 84
Table 38: CO2 conversion factors by seating class for passenger flights for 2021 GHG Conversion factors (excluding distance and RF uplifts) .................................................................... 85
Table 39: Revised average CO2 conversion factors for dedicated cargo flights for 2021 GHG Conversion factors (excluding distance and RF uplifts) .................................................................... 86
Table 40: Assumptions used in the calculation of average CO2 conversion factors for dedicated cargo flights for the 2021 GHG Conversion factors .................................................................. 87
Table 41: Air freight CO2 conversion factors for alternative freight allocation options for passenger flights for 2021 GHG Conversion factors (excluding distance and RF uplifts) ........................... 88
Table 42: Final average CO2 conversion factors for all air freight for 2021 GHG Conversion factors (excluding distance and RF uplifts) ................................................................................ 89
Table 43: Total emissions of CO2, CH4 and N2O for domestic and international aircraft from the UK GHG inventory for 2018 .......................................................................................................... 89
Table 44: Final average CO2, CH4 and N2O conversion factors for all air passenger transport for 2021 GHG Conversion factors (excluding distance and RF uplifts) ........................................ 90
Table 45: Final average CO2, CH4 and N2O conversion factors for air freight transport for 2021 GHG Conversion factors (excluding distance and RF uplifts).................................................. 90
Table 46: Indirect effects of non-CO2 emissions according to Sausen et al. (2005) ....................... 92
Table 47: Findings of ATTICA project ............................................................................................ 93
Table 48: Related worksheets for bioenergy and water emission factors ....................................... 94
Table 49: Fuel lifecycle GHG Conversion factors for biofuels ........................................................ 96
Table 50: Fuel sources and properties used in the calculation of biomass and biogas emission factors ...................................................................................................................................... 98
Table 51: Distances and transportation types used in EF calculations ......................................... 106
Table 52: Distances used in the calculation of emission factors .................................................. 107
Table 53: Related worksheets to SECR kWh emissions factors .................................................. 111
Table 54: Base electricity generation emissions data – most recent datasets for time series ....... 126
Table 55: Base electricity generation conversion factors (excluding imported electricity) – fully consistent time series dataset ...................................................................................................... 128
Table 56: Base electricity generation emissions factors (including imported electricity) – fully consistent time series dataset ...................................................................................................... 130

2021 Government greenhouse gas conversion factors for company reporting: Methodology paper
9
Table 57: Fully consistent time series for the heat/steam and supplied power carbon factors as calculated using DUKES method ................................................................................. 132
2021 Government greenhouse gas conversion factors for company reporting: Methodology paper
10
Figures Figure 1: Time series of the mix of UK electricity generation by type ............................................. 26 Figure 2: Updated GCF 'Real world' uplift values for the UK based on (ICCT, 2017) ..................... 48 Figure 3: Comparison of 'Real world' uplift values from various sources (ICCT, 2017) .................. 49 Figure 4: Illustration of the relationship of electric range to average electric share of total km for PHEVs
assumed in the calculations ........................................................................................... 56 Figure 5: Boundary of material consumption data sets ................................................................ 105
2021 Government greenhouse gas conversion factors for company reporting: Methodology paper
11
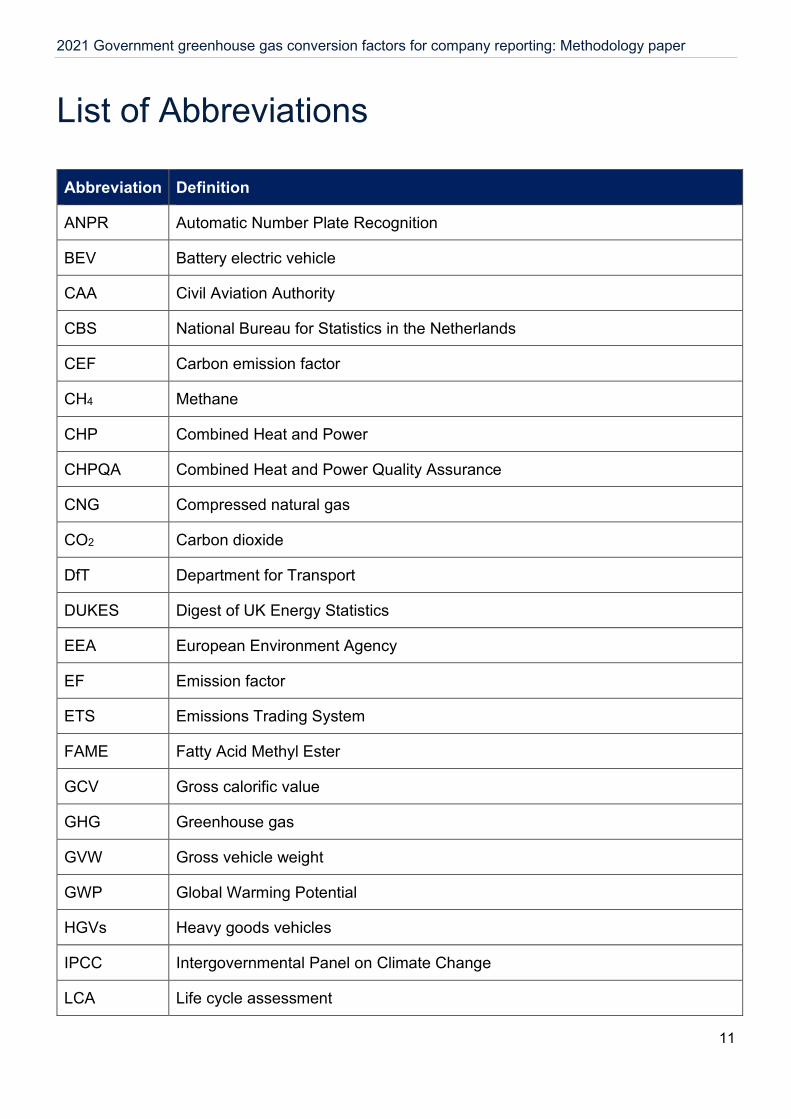
List of Abbreviations
Abbreviation Definition
ANPR Automatic Number Plate Recognition
BEV Battery electric vehicle
CAA Civil Aviation Authority
CBS National Bureau for Statistics in the Netherlands
CEF Carbon emission factor
CH4 Methane
CHP Combined Heat and Power
CHPQA Combined Heat and Power Quality Assurance
CNG Compressed natural gas
CO2 Carbon dioxide
DfT Department for Transport
DUKES Digest of UK Energy Statistics
EEA European Environment Agency
EF Emission factor
ETS Emissions Trading System
FAME Fatty Acid Methyl Ester
GCV Gross calorific value
GHG Greenhouse gas
GVW Gross vehicle weight
GWP Global Warming Potential
HGVs Heavy goods vehicles
IPCC Intergovernmental Panel on Climate Change
LCA Life cycle assessment
2021 Government greenhouse gas conversion factors for company reporting: Methodology paper
12
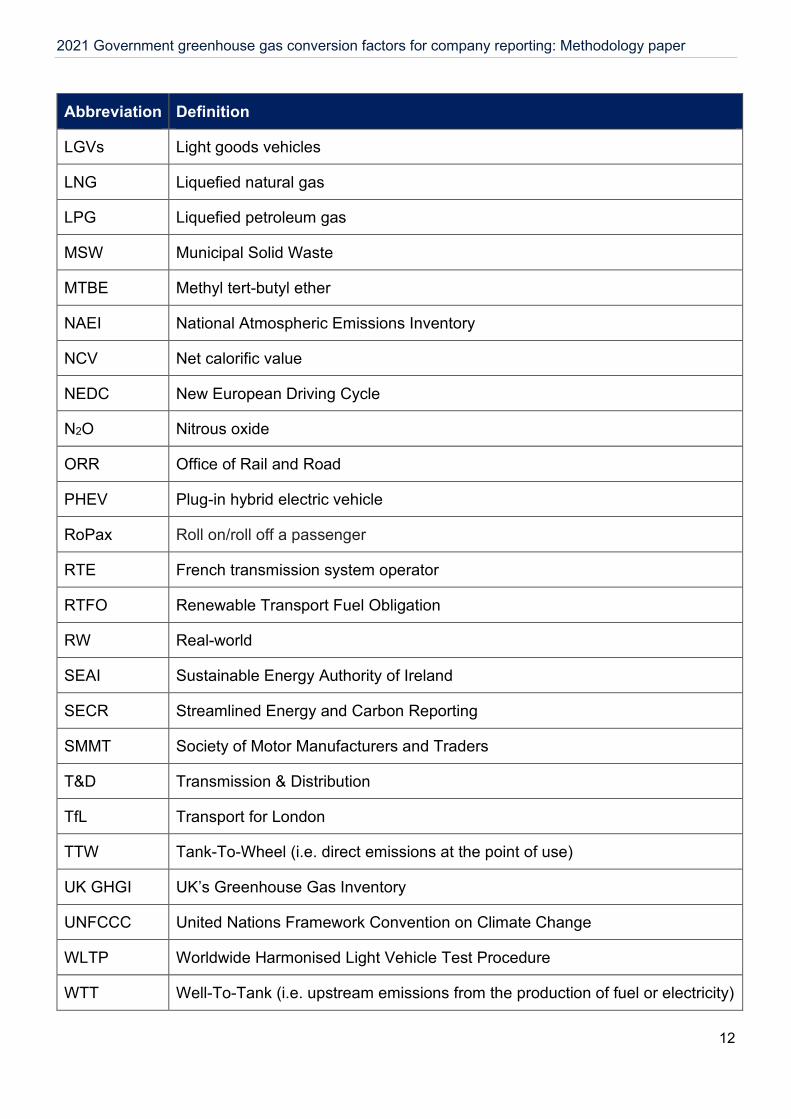
Abbreviation Definition
LGVs Light goods vehicles
LNG Liquefied natural gas
LPG Liquefied petroleum gas
MSW Municipal Solid Waste
MTBE Methyl tert-butyl ether
NAEI National Atmospheric Emissions Inventory
NCV Net calorific value
NEDC New European Driving Cycle
N2O Nitrous oxide
ORR Office of Rail and Road
PHEV Plug-in hybrid electric vehicle
RoPax Roll on/roll off a passenger
RTE French transmission system operator
RTFO Renewable Transport Fuel Obligation
RW Real-world
SEAI Sustainable Energy Authority of Ireland
SECR Streamlined Energy and Carbon Reporting
SMMT Society of Motor Manufacturers and Traders
T&D Transmission & Distribution
TfL Transport for London
TTW Tank-To-Wheel (i.e. direct emissions at the point of use)
UK GHGI UK’s Greenhouse Gas Inventory
UNFCCC United Nations Framework Convention on Climate Change
WLTP Worldwide Harmonised Light Vehicle Test Procedure
WTT Well-To-Tank (i.e. upstream emissions from the production of fuel or electricity)
2021 Government greenhouse gas conversion factors for company reporting: Methodology paper
13
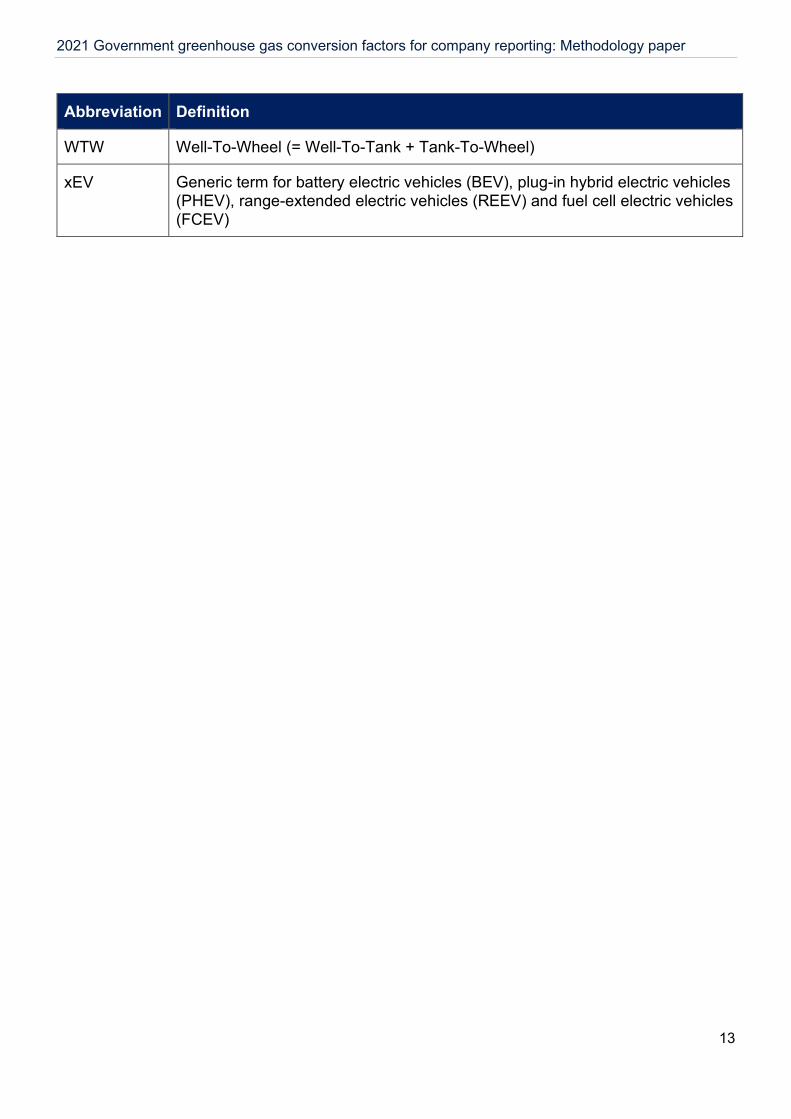
Abbreviation Definition
WTW Well-To-Wheel (= Well-To-Tank + Tank-To-Wheel)
xEV Generic term for battery electric vehicles (BEV), plug-in hybrid electric vehicles (PHEV), range-extended electric vehicles (REEV) and fuel cell electric vehicles (FCEV)
2021 Government greenhouse gas conversion factors for company reporting: Methodology paper
14
1. General Introduction
1.1. Greenhouse gases (GHG) can be measured by recording emissions at source, by continuous emissions monitoring or by estimating the amount emitted using activity data (such as the amount of fuel used) and applying relevant conversion factors (e.g. calorific values, emission factors, etc.).
1.2. These conversion factors allow organisations and individuals to calculate GHG emissions from a range of activities, including energy use, water consumption, waste disposal and recycling, and transport activities. For instance, a conversion factor can be used to calculate the amount of GHG emitted as a result of burning a particular quantity of oil in a heating boiler.
1.3. Chapters 2 to 14 present the conversion factors for a single type of emissions-releasing activity (for example, using electricity or driving a passenger vehicle). These emissions-releasing activities are categorised into three groups known as scopes. Each activity is listed as either Scope 1, Scope 2 or Scope 3.
a) Scope 1 (direct) emissions are those from activities owned or controlled by your organisation. Examples of Scope 1 emissions include emissions from combustion in owned or controlled boilers, furnaces and vehicles; and emissions from chemical production in owned or controlled process equipment.
b) Scope 2 (energy indirect) emissions are those released into the atmosphere that is associated with the consumption of purchased electricity, heat, steam and cooling. These indirect emissions are a consequence of an organisation’s energy use but occur at sources the organisation does not own or control.
c) Scope 3 (other indirect) emissions are a consequence of your actions that occur at sources an organisation does not own or control and are not classed as Scope 2 emissions, sometimes referred to as emissions that are ‘embodied’ in a product or service. Examples of Scope 3 emissions are business travel by means not owned or controlled by an organisation, waste disposal, purchased materials or fuels that an organisation purchase. Deciding if emissions from a vehicle, office or factory that you use are Scope 1 or Scope 3 may depend on how organisations define their operational boundaries. Scope 3 emissions can be from activities that are upstream or downstream of an organisation and are often calculated based on life-cycle assessment (LCA). More information on Scope 3 and other aspects of reporting can be found in the Greenhouse Gas Protocol Corporate Standard.
1.4. The 2021 UK Government Greenhouse Gas Conversion factors for Company Reporting1 (hereafter the 2021 UK GHG Conversion factors) represent the current official set of UK government conversion factors. These factors are also used in a number of different policies.
1.5. The UK GHG Conversion Factors have been developed as part of the NAEI (National Atmospheric Emissions Inventory) contract, managed by Ricardo Energy & Environment, which includes the:
1 Previously known as the ‘Guidelines to Defra/DECC’s GHG Conversion factors for Company Reporting’.
2021 Government greenhouse gas conversion factors for company reporting: Methodology paper
15
a) UK Air Quality Pollutant Inventory (AQPI) b) UK Greenhouse Gas Inventory (GHGI)
1.6. The UK GHGI for 2019 (Ricardo Energy & Environment, 2021) is available at: https://unfccc.int/documents/273439.
1.7. Values for the non-carbon dioxide (CO2) GHGs, such as methane (CH4) and nitrous oxide (N2O), are presented as CO2 equivalents (CO2e), using Global Warming Potential (GWP) factors from the Intergovernmental Panel on Climate Change (IPCC)’s fourth assessment report (GWP for CH4 = 25, GWP for N2O = 298). This is consistent with reporting under the United Nations Framework Convention on Climate Change (UNFCCC) and consistent with the UK GHGI, upon which the 2021 GHG Conversion Factors are based. Although the IPCC has prepared a newer version, the methods have not yet been officially accepted for use under the UNFCCC.
1.8. The 2021 GHG Conversion Factors are for use with activity data that falls entirely or mostly within 2021. The factors will continue to be improved and updated on an annual basis with the next publication in June 2022. Further information about the 2021 GHG Conversion factors together with previous methodology papers is available at: https://www.gov.uk/government/collections/government-conversion-factors-for-company-reporting.
1.9. It is important to note that the primary aim of this methodology paper is to provide information on the methodology used in creating the UK Government GHG Conversion factors for Company Reporting. This report provides the methodological approach, the key data sources and the assumptions used to define the conversion factors provided in the 2021 GHG Conversion factors. The report aims to expand and complement the information already provided in the data tables themselves. However, it is not intended to be an exhaustively detailed explanation of every calculation performed (this is not practical/possible), nor is it intended to provide guidance on the practicalities of reporting for organisations. Rather, the intention is to provide an overview with key information so that the basis of the conversion factors provided can be better understood and assessed.
1.10. Detailed guidance on how the conversion factors provided should be used is contained in the “Introduction” worksheet of the 2021 GHG Conversion factors set. This guidance must be referred to before using the conversion factors and provides important context for the description of the methodologies presented in this report and in the table footnotes.
Overview of changes since the previous update 1.11. Major changes and updates to the methodological approach from the 2020
update are summarised below. All other updates are essentially revisions of the previous year's data based on new/improved data whilst using existing calculation methodologies (i.e. using a similar methodological approach as for the 2020 update):
a) In the 2021 update, factors for biopetrol, renewable petrol, biopropane and biodiesel HVO have been added. Additionally, the water supply and water
2021 Government greenhouse gas conversion factors for company reporting: Methodology paper
16
treatment factors were calculated this year based on the 2020 data from UK water companies Carbon Accounting Workbooks (CAW) whereas previously values were coming from a publication of the UK industry from 2012 that has been discontinued.
b) Amendments to the methodology for the calculation of car emission factors have been implemented in this year’s update. The car emission factors are based upon data from Society of Motor Manufacturers and Traders (SMMT) for regulatory testing average carbon dioxide per kilometre (CO2/km) and corresponding registrations in the UK by vehicle size (or market segment) and fuel type. An uplift factor is then applied to convert the mean CO2/km data to account for the real-world impacts that are not fully captured by regulatory testing. Due to the type-approval transition from the previous New European Driving Cycle (NEDC) to Worldwide Harmonised Light Vehicle Test Procedure (WLTP) protocol, new data was sourced for the real-world uplift factors to apply to the new vehicle registrations with CO2 emissions data based on tests under WLTP that have become available from SMMT this year.
c) Major changes have been implemented in the “Material use” worksheet of the 2021 GHG Conversion Factors set. Glass factors have been completely revised to use an up-to-date and peer reviewed data source. Factors for board have been also revised to include purchased electricity and chemicals used during the board production and recycling processes. Additionally, the electrical good factors have been revised using a new data source; a new category for IT goods has been added this year and the factors for batteries have been also recalculated and disaggregated to account for a wide range of carbon footprints.
d) Similarly, major changes have been implemented in the “Waste disposal” worksheet of the 2021 GHG Conversion Factors set to the landfill factors for batteries, which have been reviewed and brought into line with electrical goods and other non-biodegradable items. Revised factors for compost and anaerobic digestion (AD) now cover the collection of material from the point where organic waste is generated and transport to the composting or AD facility; on site vehicle emissions have been removed as out of scope.
e) The methodology for calculating the indirect/WTT emission factors for natural gas and CNG have been improved to utilise updated DUKES data on leakage and energy use in transmission and distribution.
f) Conversion factors for butane and propane are now provided in the Fuels tab. g) A specific WTT factor has been added for lubricants based on data in (JEC WTW,
2020). This factor is also used for waste oils and processed oils as these are typically reprocessed lubricants. Previously the WTT factor for these factors was based on that for LPG. The WTT factor for fuel oil and marine fuel oil were previously assumed to be the same as that for kerosene, but these fuels are more like diesel and so the WTT factor for these has been updated to that for diesel.
h) The methodology for calculating the indirect/WTT emission factor for UK Electricity has been improved to more appropriately account for the indirect emissions from thermal renewables and other thermal energy sources.
2021 Government greenhouse gas conversion factors for company reporting: Methodology paper
17
2. Fuel Emission Factors
Section summary 2.1. The fuels conversion factors should be used for primary fuel sources
combusted at a site or in an asset owned or controlled by the reporting organisation. Well-to-tank (WTT) factors should be used to account for the upstream Scope 3 emissions associated with extraction, refining and transportation of the raw fuel sources to an organisation’s site (or asset), prior to their combustion.
2.2. The fuel properties can be used to determine the typical calorific values/densities of the most common fuels. The fuel properties should be utilised to change units of energy, mass, volume, etc. into alternative units; this is particularly useful where an organisation is collecting data in units of measure that do not have a fuel conversion factor that can be directly used to determine a carbon emission total.
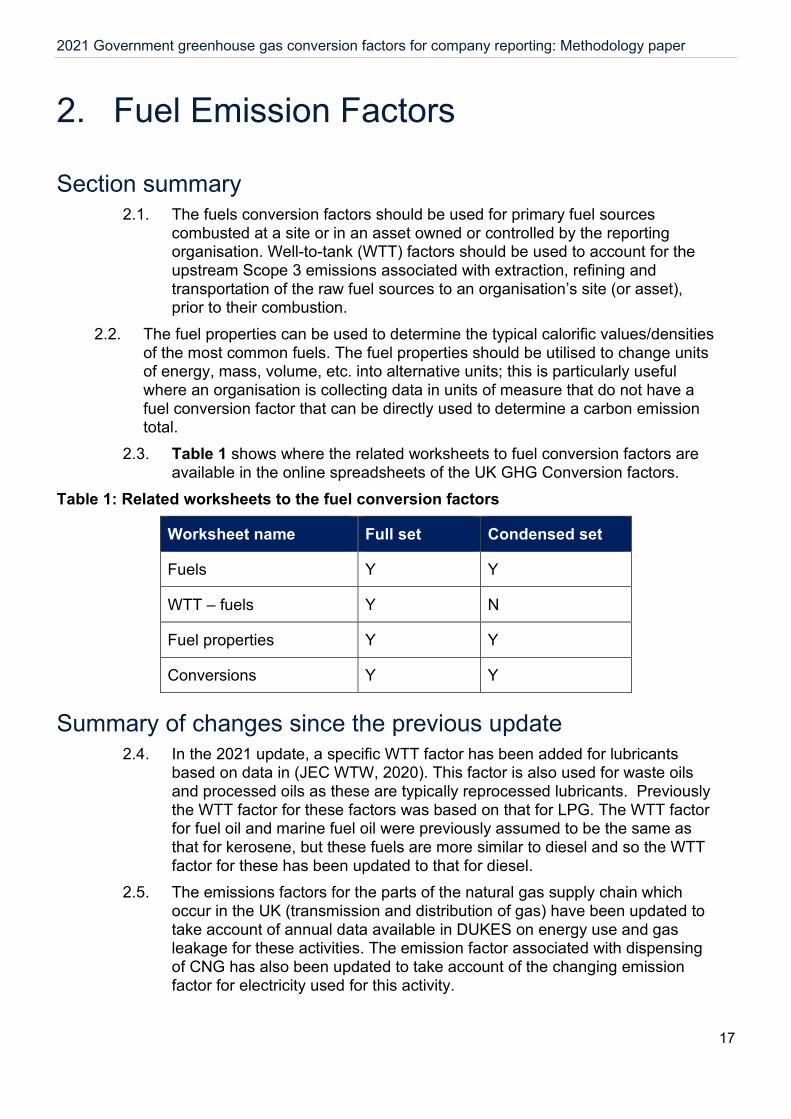
2.3. Table 1 shows where the related worksheets to fuel conversion factors are available in the online spreadsheets of the UK GHG Conversion factors.
Table 1: Related worksheets to the fuel conversion factors
Worksheet name Full set Condensed set
Fuels Y Y
WTT – fuels Y N
Fuel properties Y Y
Conversions Y Y
Summary of changes since the previous update 2.4. In the 2021 update, a specific WTT factor has been added for lubricants
based on data in (JEC WTW, 2020). This factor is also used for waste oils and processed oils as these are typically reprocessed lubricants. Previously the WTT factor for these factors was based on that for LPG. The WTT factor for fuel oil and marine fuel oil were previously assumed to be the same as that for kerosene, but these fuels are more similar to diesel and so the WTT factor for these has been updated to that for diesel.
2.5. The emissions factors for the parts of the natural gas supply chain which occur in the UK (transmission and distribution of gas) have been updated to take account of annual data available in DUKES on energy use and gas leakage for these activities. The emission factor associated with dispensing of CNG has also been updated to take account of the changing emission factor for electricity used for this activity.
2021 Government greenhouse gas conversion factors for company reporting: Methodology paper
18
2.6. Conversion factors for butane and propane have been added as part of the 2021 update.
Direct Emissions 2.7. All the fuel conversion factors for direct emissions presented in the 2021
GHG Conversion factors are based on the conversion factors used in the UK GHGI for 2019 (managed by Ricardo Energy & Environment) (Ricardo Energy & Environment, 2021).
2.8. The CO2 emissions factors are based on the same factors used in the UK GHGI and are essentially independent of application as they assume that all fuel is fully oxidised and combusted. However, emissions of CH4 and N2O can vary to some degree for the same fuel depending on the use (e.g. conversion factors for gas oil used in rail, shipping, non-road mobile machinery or different scales/types of stationary combustion plants can all be different). The figures for fuels in the 2021 GHG Conversion factors are based on an activity-weighted average of all the different CH4 and N2O conversion factors from the GHGI.
2.9. The majority of conversion factors from the GHGI are on a net energy basis (t/TJ), and have been converted into different energy, volume and mass based units using the information on Gross and Net Calorific Values (CV) (see definition of Gross CV and Net CV in the footnote below2) from the GHGI and for some fuels, BEIS’s Digest of UK Energy Statistics (DUKES) (BEIS, 2020b).
2.10. There are three tables in the 2021 GHG Conversion factors, the first of which provides conversion factors for gaseous fuels, the second for liquid fuels and the final table provides the conversion factors for solid fuels.
2.11. When making calculations based on energy use, it is important to check (e.g. with your fuel supplier) whether these values were calculated on a Gross CV or Net CV basis and use the appropriate factor. Natural gas consumption figures quoted in kilowatt hours (kWh) by suppliers in the UK are generally calculated (from the volume of gas used) on a Gross CV basis (National Grid, 2020). Therefore, the emission factor for energy consumption on a Gross CV basis should be used by default for calculation of emissions from natural gas in kWh, unless your supplier specifically states they have used Net CV basis in their calculations instead.
Indirect/WTT Emissions from Fuels 2.12. These fuel lifecycle emissions (also sometimes referred to as ‘Well-To-Tank’,
or simply WTT, emissions usually in the context of transport fuels) are the emissions ‘upstream’ from the point of use of the fuel. They result from the extraction, transport, refining, purification or conversion of primary fuels to
2 Gross CV or higher heating value (HHV) is the CV under laboratory conditions. Net CV or lower heating value (LHV) is the useful calorific value in typical real-world conditions (e.g. boiler plant). The difference is essentially the latent heat of the water vapour produced (which can be recovered in laboratory conditions).
2021 Government greenhouse gas conversion factors for company reporting: Methodology paper
19
fuels for direct use by end-users and the distribution of these fuels. They are classed as Scope 3 according to the GHG Protocol.
2.13. For the upstream conversion factors relating to diesel, petrol, kerosene, natural gas, CNG, and LNG, data are taken from a study by Exergia (Exergia et al., 2015); please refer to Table 4 for definitions of acronyms. As the Exergia report (Exergia et al., 2015) does not estimate upstream emissions for other fuels the JRC Well-To-Wheels study is used for coal, naphtha, LPG, and lubricants; data are taken from (JEC WTW, 2020) as this is the most recent update for this source.
2.14. For fuels covered by the 2021 GHG Conversion factors where no fuel lifecycle emission factor was available in either source, these were estimated based on similar fuels, according to the assumptions in Table 4.
2.15. WTT emissions for petrol, diesel and kerosene in the Exergia study (Exergia et al., 2015), used within the 2021 GHG Conversion factors set, are based on:
a) Detailed modelling of upstream emissions associated with 35 crude oils used in EU refining, which accounted for 88% of imported oil in 2012.
b) Estimates of the emissions associated with the transport of these crude oils to EU refineries by sea and pipeline, based on the location of ports and refineries.
c) Emissions from refining, modelled on a country-by-country basis, based on the specific refinery types in each country. An EU average is then calculated based on the proportion of each crude oil going to each refinery type.
d) An estimate of emissions associated with imported finished products from Russia and the US.
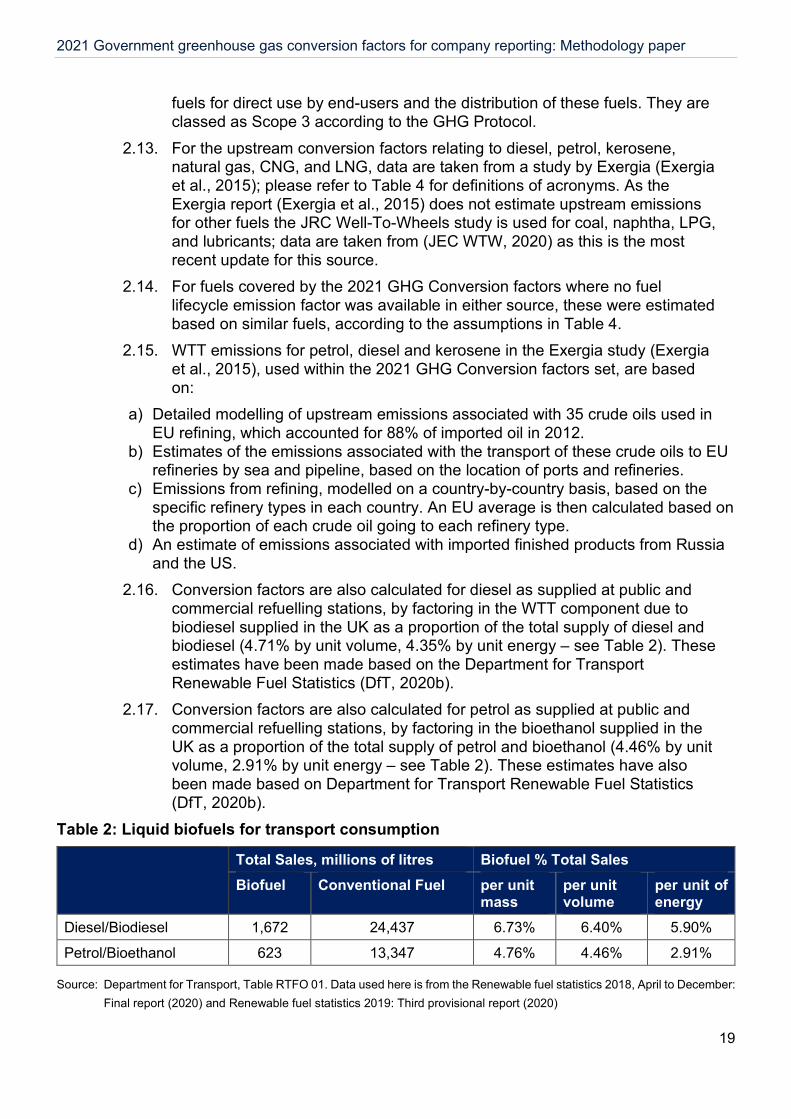
2.16. Conversion factors are also calculated for diesel as supplied at public and commercial refuelling stations, by factoring in the WTT component due to biodiesel supplied in the UK as a proportion of the total supply of diesel and biodiesel (4.71% by unit volume, 4.35% by unit energy – see Table 2). These estimates have been made based on the Department for Transport Renewable Fuel Statistics (DfT, 2020b).
2.17. Conversion factors are also calculated for petrol as supplied at public and commercial refuelling stations, by factoring in the bioethanol supplied in the UK as a proportion of the total supply of petrol and bioethanol (4.46% by unit volume, 2.91% by unit energy – see Table 2). These estimates have also been made based on Department for Transport Renewable Fuel Statistics (DfT, 2020b).
Table 2: Liquid biofuels for transport consumption
Total Sales, millions of litres Biofuel % Total Sales Biofuel Conventional Fuel per unit
mass per unit volume
per unit of energy
Diesel/Biodiesel 1,672 24,437 6.73% 6.40% 5.90%
Petrol/Bioethanol 623 13,347 4.76% 4.46% 2.91%
Source: Department for Transport, Table RTFO 01. Data used here is from the Renewable fuel statistics 2018, April to December: Final report (2020) and Renewable fuel statistics 2019: Third provisional report (2020)
2021 Government greenhouse gas conversion factors for company reporting: Methodology paper
20
2.18. Emissions for natural gas, LNG and CNG, used within the 202a GHG
Conversion factors, are based on (Exergia et al., 2015): a) Estimates of emissions associated with supply in major gas producing countries
supplying the EU. These include both countries supplying piped gas and countries supplying LNG.
b) The pattern of gas supply for each Member State (based on IEA data for natural gas supply in 2012).
c) Combining the information on emissions associated with sources of gas, with the data on the pattern of gas supply for each Member State, including the proportion of LNG that is imported.
d) For parts of the natural gas supply chain which occur in the UK (transmission and distribution and dispensing of CNG), data from DUKES (BEIS, 2020b) is used to update the emissions for these activities estimated in Exergia.
2.19. The methodology developed allows for the value calculated for gas supply in the UK to be updated annually This allows changes in the sources of imported gas, particularly LNG, to be reflected in the emissions value.
2.20. Information on quantities and source of imported gas are available annually from DUKES3 (BEIS, 2020a) and can be used to calculate the proportion of gas in UK supply coming from each source. These can then be combined with the emissions factors for gas from each source from the EU study (Exergia et al., 2015), to calculate a weighted emissions factor for UK supply.
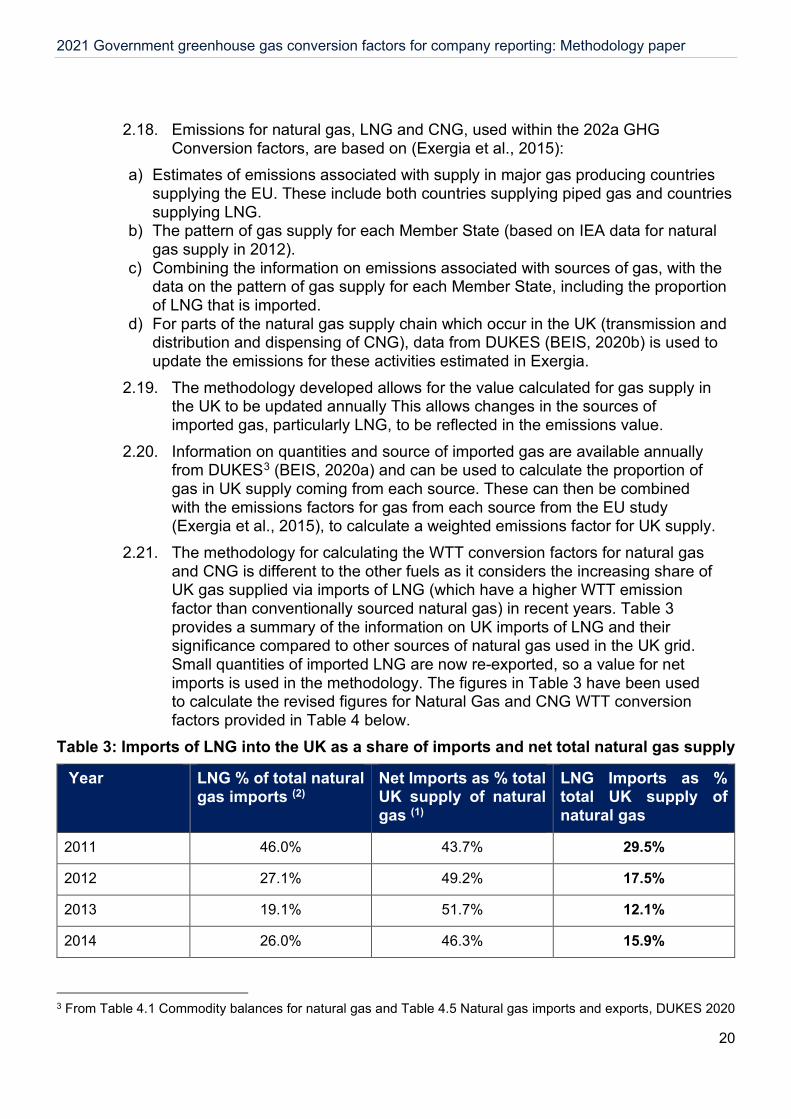
2.21. The methodology for calculating the WTT conversion factors for natural gas and CNG is different to the other fuels as it considers the increasing share of UK gas supplied via imports of LNG (which have a higher WTT emission factor than conventionally sourced natural gas) in recent years. Table 3 provides a summary of the information on UK imports of LNG and their significance compared to other sources of natural gas used in the UK grid. Small quantities of imported LNG are now re-exported, so a value for net imports is used in the methodology. The figures in Table 3 have been used to calculate the revised figures for Natural Gas and CNG WTT conversion factors provided in Table 4 below.
Table 3: Imports of LNG into the UK as a share of imports and net total natural gas supply
Year LNG % of total natural gas imports (2)
Net Imports as % total UK supply of natural gas (1)
LNG Imports as % total UK supply of natural gas
2011 46.0% 43.7% 29.5%
2012 27.1% 49.2% 17.5%
2013 19.1% 51.7% 12.1%
2014 26.0% 46.3% 15.9%
3 From Table 4.1 Commodity balances for natural gas and Table 4.5 Natural gas imports and exports, DUKES 2020

2021 Government greenhouse gas conversion factors for company reporting: Methodology paper
21
Year LNG % of total natural gas imports (2)
Net Imports as % total UK supply of natural gas (1)
LNG Imports as % total UK supply of natural gas
2015 30.2% 43.4% 18.8%
2016 21.4% 48.2% 12.7%
2017 13.5% 46.7% 8.0%
2018 14.8% 48.9% 8.6%
2019 38.7% 49.7% 23.0%
Source: DUKES 2020, (1) Table 4.1 - Commodity balances and (2) Table 4.5 - Natural gas imports and exports; (BEIS, 2020b).
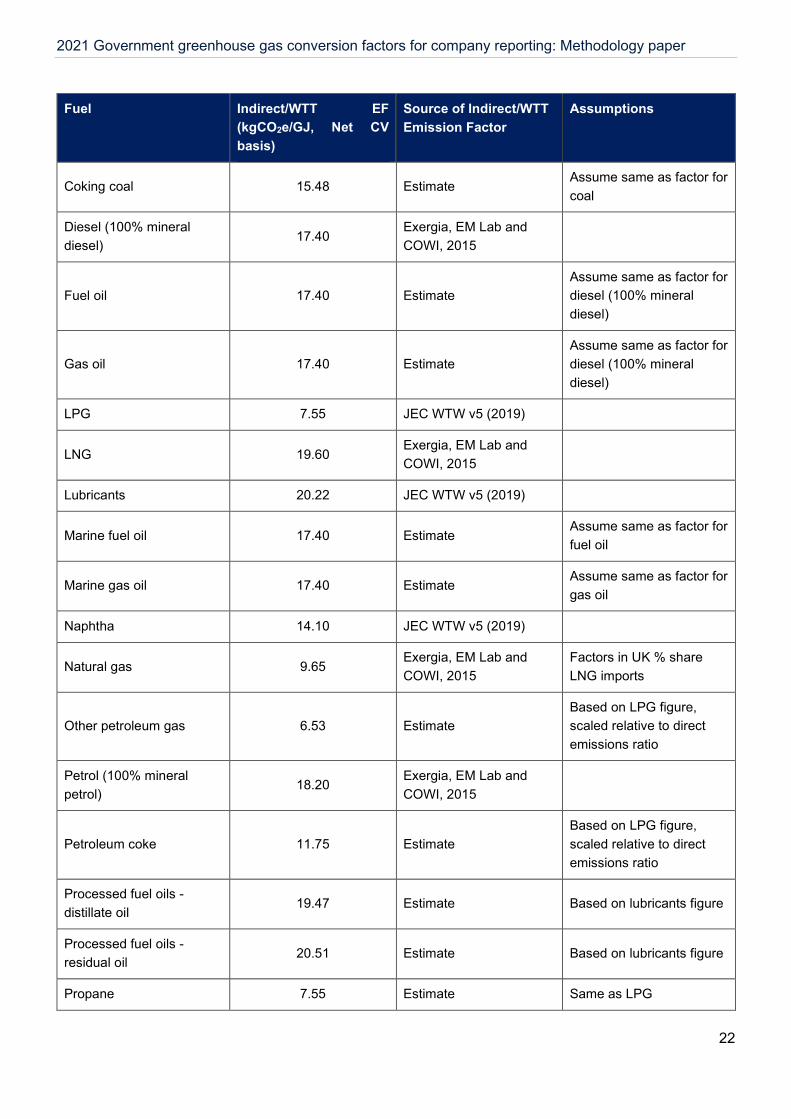
2.22. The final combined conversion factors, presented as kilograms of carbon dioxide equivalents per gigajoule on a net calorific value basis (kgCO2e/GJ, Net CV basis), are listed in Table 4. These include WTT emissions of CO2, N2O and CH4. These are converted into other units of energy (e.g. kWh, Therms) and to units of volume and mass using the default Fuel Properties and Unit Conversion factors also provided in the 2021 GHG Conversion factors alongside the emission factor data tables.
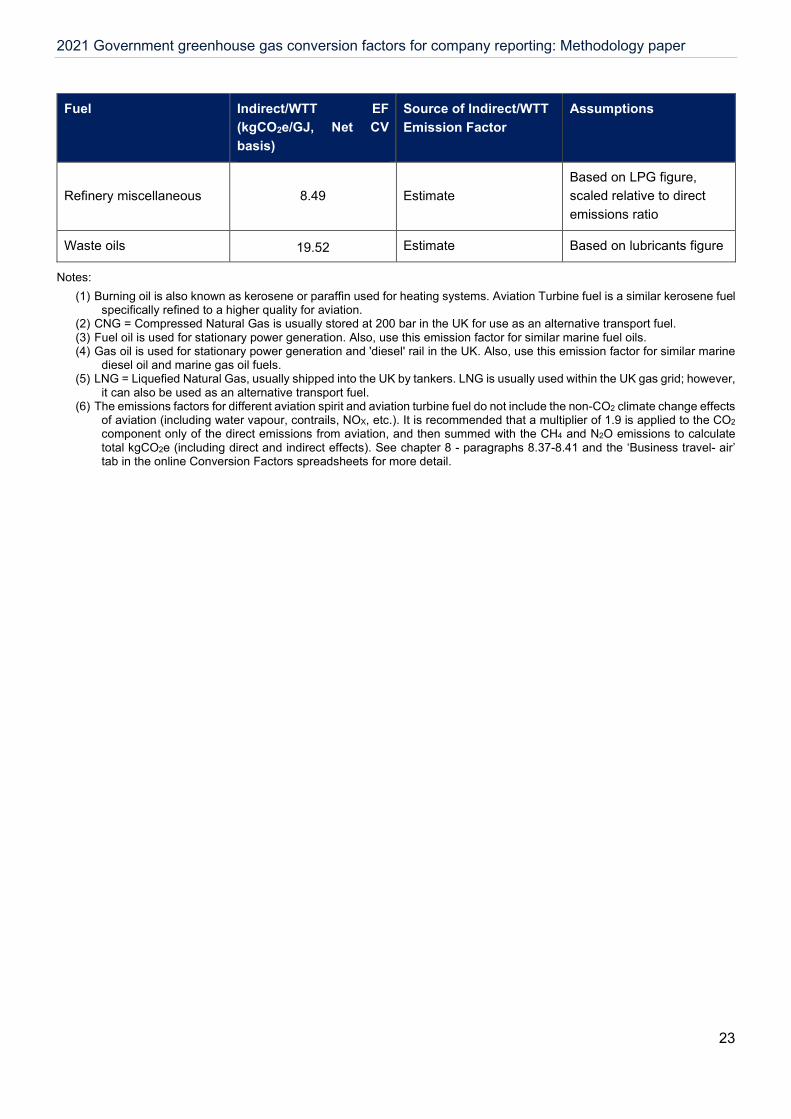
Table 4: Basis of the indirect/WTT emissions factors for different fuels
Fuel Indirect/WTT EF (kgCO2e/GJ, Net CV basis)
Source of Indirect/WTT Emission Factor
Assumptions
Aviation Spirit 18.20 Estimate Similar to petrol
Aviation turbine fuel 15.00 Exergia, EM Lab and COWI, 2015
Emission factor for kerosene
Burning oil 15.00 Estimate Same as Kerosene, as above
Butane 7.55 Estimate Same as LPG
CNG 12.04 Exergia, EM Lab and COWI, 2015
Factors in UK % share LNG imports
Coal (domestic) 15.48 JEC WTW v5 (2019) Emission factor for coal
Coal (electricity generation) 15.48 JEC WTW v5 (2019) Emission factor for coal
Coal (industrial) 15.48 JEC WTW v5 (2019) Emission factor for coal
Coal (electricity generation - home produced coal only) 15.48 JEC WTW v5 (2019) Emission factor for coal
2021 Government greenhouse gas conversion factors for company reporting: Methodology paper
22
Fuel Indirect/WTT EF (kgCO2e/GJ, Net CV basis)
Source of Indirect/WTT Emission Factor
Assumptions
Coking coal 15.48 Estimate Assume same as factor for coal
Diesel (100% mineral diesel) 17.40 Exergia, EM Lab and
COWI, 2015
Fuel oil 17.40 Estimate Assume same as factor for diesel (100% mineral diesel)
Gas oil 17.40 Estimate Assume same as factor for diesel (100% mineral diesel)
LPG 7.55 JEC WTW v5 (2019)
LNG 19.60 Exergia, EM Lab and COWI, 2015
Lubricants 20.22 JEC WTW v5 (2019)
Marine fuel oil 17.40 Estimate Assume same as factor for fuel oil
Marine gas oil 17.40 Estimate Assume same as factor for gas oil
Naphtha 14.10 JEC WTW v5 (2019)
Natural gas 9.65 Exergia, EM Lab and COWI, 2015
Factors in UK % share LNG imports
Other petroleum gas 6.53 Estimate Based on LPG figure, scaled relative to direct emissions ratio
Petrol (100% mineral petrol) 18.20 Exergia, EM Lab and
COWI, 2015
Petroleum coke 11.75 Estimate Based on LPG figure, scaled relative to direct emissions ratio
Processed fuel oils - distillate oil 19.47 Estimate Based on lubricants figure
Processed fuel oils - residual oil 20.51 Estimate Based on lubricants figure
Propane 7.55 Estimate Same as LPG
2021 Government greenhouse gas conversion factors for company reporting: Methodology paper
23
Fuel Indirect/WTT EF (kgCO2e/GJ, Net CV basis)
Source of Indirect/WTT Emission Factor
Assumptions
Refinery miscellaneous 8.49 Estimate Based on LPG figure, scaled relative to direct emissions ratio
Waste oils 19.52 Estimate Based on lubricants figure
Notes: (1) Burning oil is also known as kerosene or paraffin used for heating systems. Aviation Turbine fuel is a similar kerosene fuel
specifically refined to a higher quality for aviation. (2) CNG = Compressed Natural Gas is usually stored at 200 bar in the UK for use as an alternative transport fuel. (3) Fuel oil is used for stationary power generation. Also, use this emission factor for similar marine fuel oils. (4) Gas oil is used for stationary power generation and 'diesel' rail in the UK. Also, use this emission factor for similar marine
diesel oil and marine gas oil fuels. (5) LNG = Liquefied Natural Gas, usually shipped into the UK by tankers. LNG is usually used within the UK gas grid; however,
it can also be used as an alternative transport fuel. (6) The emissions factors for different aviation spirit and aviation turbine fuel do not include the non-CO2 climate change effects
of aviation (including water vapour, contrails, NOX, etc.). It is recommended that a multiplier of 1.9 is applied to the CO2 component only of the direct emissions from aviation, and then summed with the CH4 and N2O emissions to calculate total kgCO2e (including direct and indirect effects). See chapter 8 - paragraphs 8.37-8.41 and the ‘Business travel- air’ tab in the online Conversion Factors spreadsheets for more detail.
2021 Government greenhouse gas conversion factors for company reporting: Methodology paper
24
3. UK Electricity, Heat and Steam Emission Factors
Section summary 3.1. UK electricity conversion factors should be used to report on electricity used
by an organisation at sites owned or controlled by them. This is reported as a Scope 2 (indirect) emission. The conversion factors for electricity are for the electricity supplied to the grid that organisations purchase – i.e. not including the emissions associated with the transmission and distribution of electricity. Conversion factors for transmission and distribution losses (the energy loss that occurs in getting the electricity from the power plant to the organisations that purchase it) are available separately and should be used to report the Scope 3 emissions associated with grid losses. WTT conversion factors for the UK and overseas electricity should be used to report the Scope 3 emissions of extraction, refining and transportation of primary fuels before their use in the generation of electricity.
3.2. Heat and steam conversion factors should be used to report emissions within organisations that purchase heat or steam energy for heating purposes or for the use in specific industrial processes. District heat and steam factors are also available. WTT heat and steam conversion factors should be used to report emissions from the extraction, refinement and transportation of primary fuels that generate the heat and steam organisations purchase.
3.3. Table 5 shows where the related worksheets to UK electricity and heat & steam conversion factors are available in the online spreadsheets of the UK GHG Conversion factors set.
Table 5: Related worksheets to UK electricity and heat & steam emission factors
Worksheet name Full set Condensed set
UK electricity Y Y
Transmission and distribution Y Y
WTT – UK & overseas Electricity Y N
Heat and steam Y N
WTT – heat and steam Y N
Summary of changes since the previous update 3.4. The Combined Heat and Power (CHP) methodologies depend upon the
DUKES CHP fuel mix, which varies from year to year, and CH4 and N2O emission factor data from the UK GHGI, which are also subject to inter-
2021 Government greenhouse gas conversion factors for company reporting: Methodology paper
25
annual variations or revisions to assumptions (see Section 2 of this report). There have not been any method changes for the heat and steam conversion factors described in this chapter.
3.5. The methodology for estimating the UK Electricity WTT factor has been improved to more appropriately account for the indirect emissions from thermal renewables and other thermal sources. This has been done using DUKES Table 6.6 (BEIS, 2020b) which provides fuel used data for bioenergy sources such as plant biomass. These fuels have then been paired with indirect emission factors that represent the fuel as it relates to UK electricity generation. Many of these factors have been sourced from the existing conversion factors created for the Bioenergy and Water section (section 9). The other thermal sources have been disaggregated using non-published data from BEIS regarding autogeneration. The overall impact of this improvement is a 72% increase in the WTT UK Electricity factor for CO2e compared to the 2020 value.
3.6. Additionally, an Outside of scope conversion factor for UK Electricity has been produced for the first time in the 2021 conversion factors (see “Outside of Scopes” and the relevant notes on the page).
Direct Emissions from UK Grid Electricity 3.7. The electricity conversion factors given represent the average CO2 emission
from the UK national grid per kWh of electricity generated, classed as Scope 2 of the GHG Protocol and separately for electricity transmission and distribution losses, classed as Scope 3. The calculations also factor in net imports of electricity via the interconnectors with Ireland, the Netherlands, France, and Belgium. These factors include only direct CO2, CH4 and N2O emissions at UK power stations and from autogenerators, plus those from the proportion of imported electricity. They do not include emissions resulting from production and delivery of fuel to these power stations (i.e. from gas rigs, refineries and collieries, etc.).
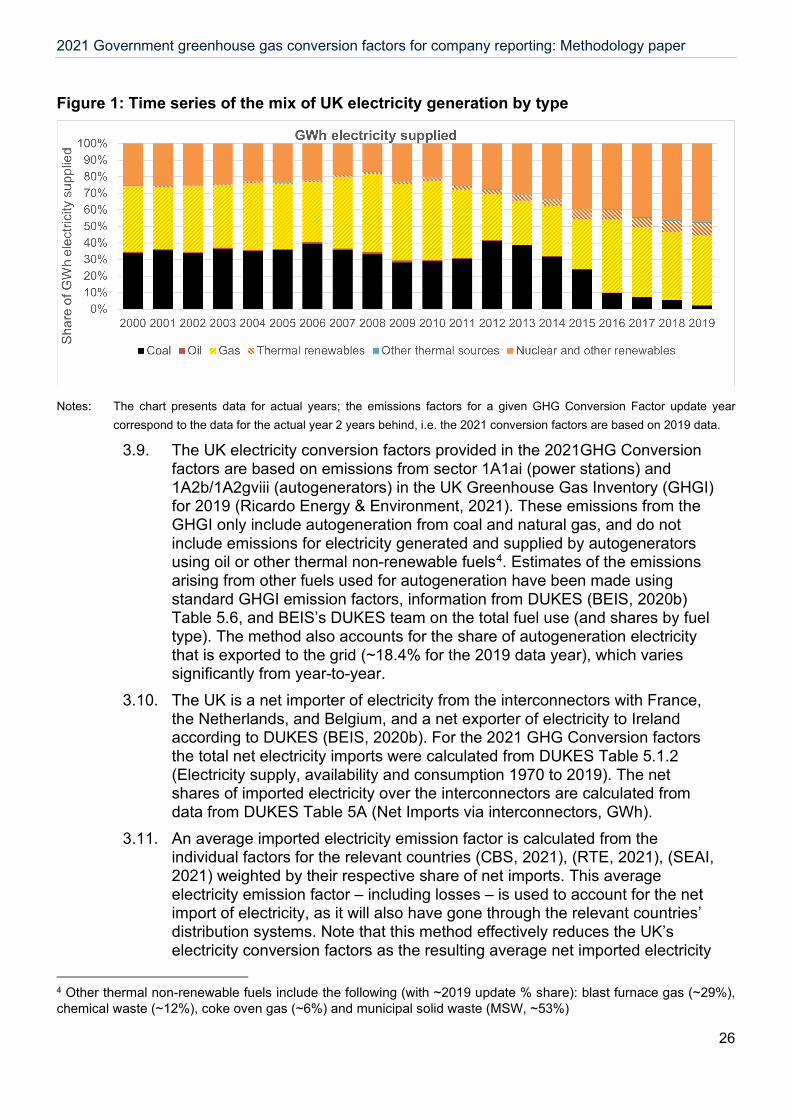
3.8. The UK grid electricity factor changes from year to year as the fuel mix consumed in UK power stations (and autogenerators) changes, and as the proportion of net imported electricity also changes. These annual changes can be large as they depend very heavily on the relative prices of coal and natural gas as well as fluctuations in peak demand and renewables. There has been a sustained decline in the amount of coal used for electricity generation over the past few years, largely driven by the increase in the carbon floor price from £9 per tonne of CO2 to £15 in 2015 (BEIS, 2020b). The annual variability, and the recent trends in coal use, in UK electricity generation mix is illustrated in Figure 1 below.
2021 Government greenhouse gas conversion factors for company reporting: Methodology paper
26
Figure 1: Time series of the mix of UK electricity generation by type
Notes: The chart presents data for actual years; the emissions factors for a given GHG Conversion Factor update year
correspond to the data for the actual year 2 years behind, i.e. the 2021 conversion factors are based on 2019 data.
3.9. The UK electricity conversion factors provided in the 2021GHG Conversion factors are based on emissions from sector 1A1ai (power stations) and 1A2b/1A2gviii (autogenerators) in the UK Greenhouse Gas Inventory (GHGI) for 2019 (Ricardo Energy & Environment, 2021). These emissions from the GHGI only include autogeneration from coal and natural gas, and do not include emissions for electricity generated and supplied by autogenerators using oil or other thermal non-renewable fuels4. Estimates of the emissions arising from other fuels used for autogeneration have been made using standard GHGI emission factors, information from DUKES (BEIS, 2020b) Table 5.6, and BEIS’s DUKES team on the total fuel use (and shares by fuel type). The method also accounts for the share of autogeneration electricity that is exported to the grid (~18.4% for the 2019 data year), which varies significantly from year-to-year.
3.10. The UK is a net importer of electricity from the interconnectors with France, the Netherlands, and Belgium, and a net exporter of electricity to Ireland according to DUKES (BEIS, 2020b). For the 2021 GHG Conversion factors the total net electricity imports were calculated from DUKES Table 5.1.2 (Electricity supply, availability and consumption 1970 to 2019). The net shares of imported electricity over the interconnectors are calculated from data from DUKES Table 5A (Net Imports via interconnectors, GWh).
3.11. An average imported electricity emission factor is calculated from the individual factors for the relevant countries (CBS, 2021), (RTE, 2021), (SEAI, 2021) weighted by their respective share of net imports. This average electricity emission factor – including losses – is used to account for the net import of electricity, as it will also have gone through the relevant countries’ distribution systems. Note that this method effectively reduces the UK’s electricity conversion factors as the resulting average net imported electricity
4 Other thermal non-renewable fuels include the following (with ~2019 update % share): blast furnace gas (~29%), chemical waste (~12%), coke oven gas (~6%) and municipal solid waste (MSW, ~53%)
2021 Government greenhouse gas conversion factors for company reporting: Methodology paper
27
emission factor is lower than that for the UK. This is largely because France’s electricity generation is much less carbon-intensive than that of the UK, and accounts for the largest share of the net imports.
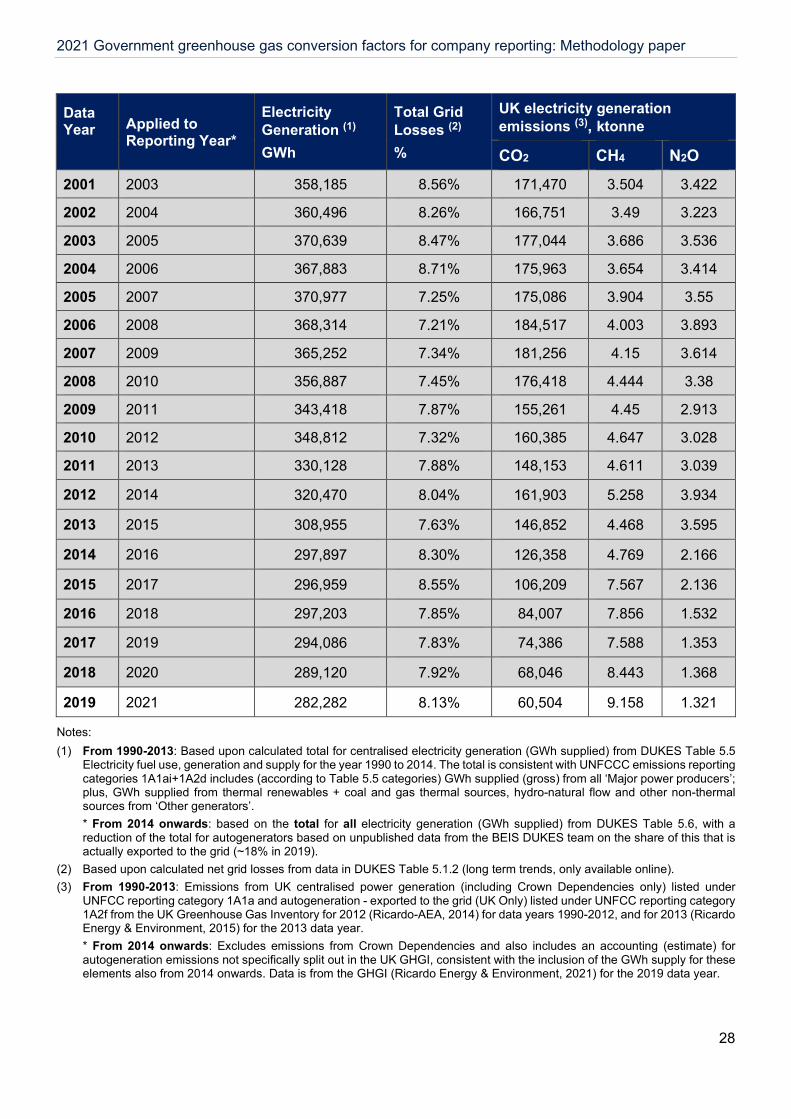
3.12. The source data and calculated emissions factors are summarised in Table 6, Table 7 and Table 8. Time series source data and conversion factors are fixed/locked from the 2020 GHG Conversion Factor update and for earlier years and have been highlighted in light grey. The tables provide the data and conversion factors against the relevant data year. Table 6 also provides a comparison of how the data year reads across to the GHG conversion factors update / reporting year to which the data and conversion factors are applied, which is two years ahead of the data year. For example, the most recent emission factor for the 2021 GHG Conversion factors is based on the data year 2019.
3.13. Earlier years (those prior to the current update) are based on data reported in previous versions of DUKES and following the convention set from 2016 data year, historic time series factors/data have not been updated. Time series data in light grey is locked/fixed for the purposes of company reporting and has not been updated in the database in the 2021 GHG Conversion factors update.
3.14. A full-time series of data using the most recently available GHGI and DUKES datasets for all years is provided in Appendix 2 of this report. This is provided for purposes other than company reporting, where a fully consistent data time series is desirable, e.g. for policy impact analysis. This dataset also reflects the changes in the methodological approach implemented for the 2016 update and is applied across the whole time series.
Table 6: Base electricity generation emissions data
Data Year
Applied to Reporting Year*
Electricity Generation (1) GWh
Total Grid Losses (2) %
UK electricity generation emissions (3), ktonne
CO2 CH4 N2O
1990 1992 290,666 8.08% 204,614 2.671 5.409
1991 1993 293,743 8.27% 201,213 2.499 5.342
1992 1994 291,692 7.55% 189,327 2.426 5.024
1993 1995 294,935 7.17% 172,927 2.496 4.265
1994 1996 299,889 9.57% 168,551 2.658 4.061
1995 1997 310,333 9.07% 165,700 2.781 3.902
1996 1998 324,724 8.40% 164,875 2.812 3.612
1997 1999 324,412 7.79% 152,439 2.754 3.103
1998 2000 335,035 8.40% 157,171 2.978 3.199
1999 2001 340,218 8.25% 149,036 3.037 2.772
2000 2002 349,263 8.38% 160,927 3.254 3.108
2021 Government greenhouse gas conversion factors for company reporting: Methodology paper
28
Data Year
Applied to Reporting Year*
Electricity Generation (1) GWh
Total Grid Losses (2) %
UK electricity generation emissions (3), ktonne
CO2 CH4 N2O
2001 2003 358,185 8.56% 171,470 3.504 3.422
2002 2004 360,496 8.26% 166,751 3.49 3.223
2003 2005 370,639 8.47% 177,044 3.686 3.536
2004 2006 367,883 8.71% 175,963 3.654 3.414
2005 2007 370,977 7.25% 175,086 3.904 3.55
2006 2008 368,314 7.21% 184,517 4.003 3.893
2007 2009 365,252 7.34% 181,256 4.15 3.614
2008 2010 356,887 7.45% 176,418 4.444 3.38
2009 2011 343,418 7.87% 155,261 4.45 2.913
2010 2012 348,812 7.32% 160,385 4.647 3.028
2011 2013 330,128 7.88% 148,153 4.611 3.039
2012 2014 320,470 8.04% 161,903 5.258 3.934
2013 2015 308,955 7.63% 146,852 4.468 3.595
2014 2016 297,897 8.30% 126,358 4.769 2.166
2015 2017 296,959 8.55% 106,209 7.567 2.136
2016 2018 297,203 7.85% 84,007 7.856 1.532
2017 2019 294,086 7.83% 74,386 7.588 1.353
2018 2020 289,120 7.92% 68,046 8.443 1.368
2019 2021 282,282 8.13% 60,504 9.158 1.321
Notes: (1) From 1990-2013: Based upon calculated total for centralised electricity generation (GWh supplied) from DUKES Table 5.5
Electricity fuel use, generation and supply for the year 1990 to 2014. The total is consistent with UNFCCC emissions reporting categories 1A1ai+1A2d includes (according to Table 5.5 categories) GWh supplied (gross) from all ‘Major power producers’; plus, GWh supplied from thermal renewables + coal and gas thermal sources, hydro-natural flow and other non-thermal sources from ‘Other generators’. * From 2014 onwards: based on the total for all electricity generation (GWh supplied) from DUKES Table 5.6, with a reduction of the total for autogenerators based on unpublished data from the BEIS DUKES team on the share of this that is actually exported to the grid (~18% in 2019).
(2) Based upon calculated net grid losses from data in DUKES Table 5.1.2 (long term trends, only available online). (3) From 1990-2013: Emissions from UK centralised power generation (including Crown Dependencies only) listed under
UNFCC reporting category 1A1a and autogeneration - exported to the grid (UK Only) listed under UNFCC reporting category 1A2f from the UK Greenhouse Gas Inventory for 2012 (Ricardo-AEA, 2014) for data years 1990-2012, and for 2013 (Ricardo Energy & Environment, 2015) for the 2013 data year. * From 2014 onwards: Excludes emissions from Crown Dependencies and also includes an accounting (estimate) for autogeneration emissions not specifically split out in the UK GHGI, consistent with the inclusion of the GWh supply for these elements also from 2014 onwards. Data is from the GHGI (Ricardo Energy & Environment, 2021) for the 2019 data year.
2021 Government greenhouse gas conversion factors for company reporting: Methodology paper
29
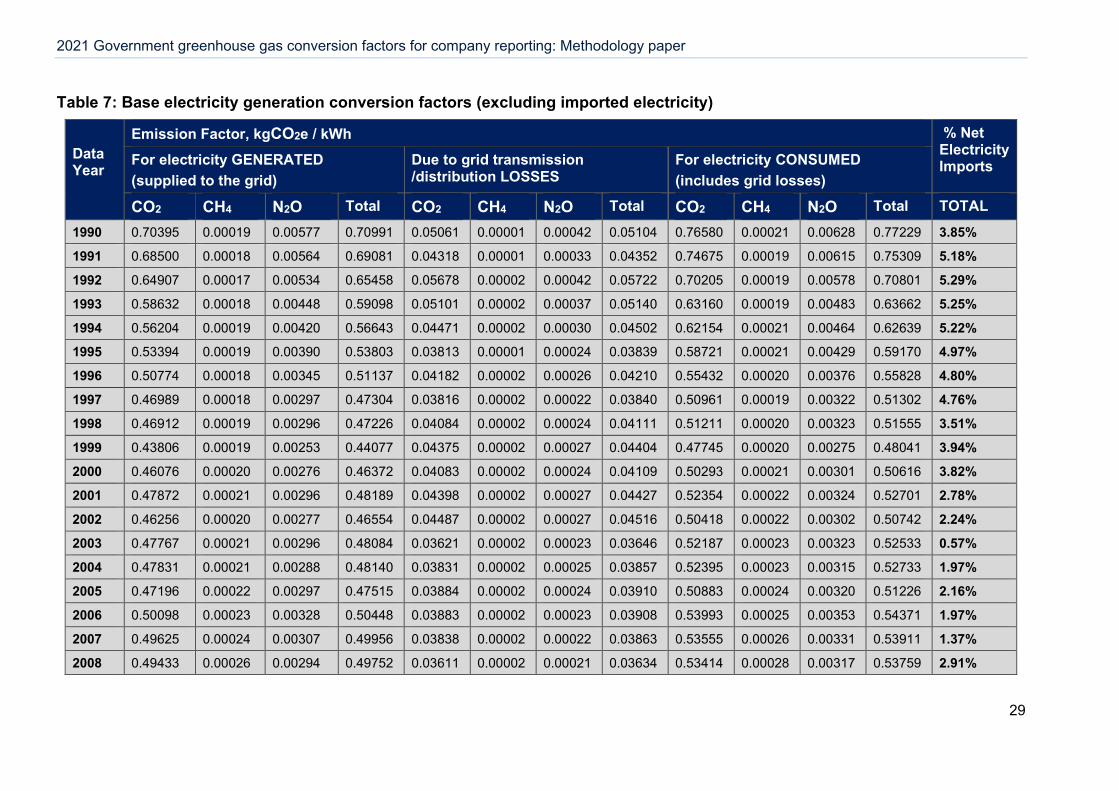
Table 7: Base electricity generation conversion factors (excluding imported electricity)
Data Year
Emission Factor, kgCO2e / kWh % Net Electricity Imports For electricity GENERATED
(supplied to the grid) Due to grid transmission /distribution LOSSES
For electricity CONSUMED (includes grid losses)
CO2 CH4 N2O Total CO2 CH4 N2O Total CO2 CH4 N2O Total TOTAL 1990 0.70395 0.00019 0.00577 0.70991 0.05061 0.00001 0.00042 0.05104 0.76580 0.00021 0.00628 0.77229 3.85%
1991 0.68500 0.00018 0.00564 0.69081 0.04318 0.00001 0.00033 0.04352 0.74675 0.00019 0.00615 0.75309 5.18%
1992 0.64907 0.00017 0.00534 0.65458 0.05678 0.00002 0.00042 0.05722 0.70205 0.00019 0.00578 0.70801 5.29%
1993 0.58632 0.00018 0.00448 0.59098 0.05101 0.00002 0.00037 0.05140 0.63160 0.00019 0.00483 0.63662 5.25%
1994 0.56204 0.00019 0.00420 0.56643 0.04471 0.00002 0.00030 0.04502 0.62154 0.00021 0.00464 0.62639 5.22%
1995 0.53394 0.00019 0.00390 0.53803 0.03813 0.00001 0.00024 0.03839 0.58721 0.00021 0.00429 0.59170 4.97%
1996 0.50774 0.00018 0.00345 0.51137 0.04182 0.00002 0.00026 0.04210 0.55432 0.00020 0.00376 0.55828 4.80%
1997 0.46989 0.00018 0.00297 0.47304 0.03816 0.00002 0.00022 0.03840 0.50961 0.00019 0.00322 0.51302 4.76%
1998 0.46912 0.00019 0.00296 0.47226 0.04084 0.00002 0.00024 0.04111 0.51211 0.00020 0.00323 0.51555 3.51%
1999 0.43806 0.00019 0.00253 0.44077 0.04375 0.00002 0.00027 0.04404 0.47745 0.00020 0.00275 0.48041 3.94%
2000 0.46076 0.00020 0.00276 0.46372 0.04083 0.00002 0.00024 0.04109 0.50293 0.00021 0.00301 0.50616 3.82%
2001 0.47872 0.00021 0.00296 0.48189 0.04398 0.00002 0.00027 0.04427 0.52354 0.00022 0.00324 0.52701 2.78%
2002 0.46256 0.00020 0.00277 0.46554 0.04487 0.00002 0.00027 0.04516 0.50418 0.00022 0.00302 0.50742 2.24%
2003 0.47767 0.00021 0.00296 0.48084 0.03621 0.00002 0.00023 0.03646 0.52187 0.00023 0.00323 0.52533 0.57%
2004 0.47831 0.00021 0.00288 0.48140 0.03831 0.00002 0.00025 0.03857 0.52395 0.00023 0.00315 0.52733 1.97%
2005 0.47196 0.00022 0.00297 0.47515 0.03884 0.00002 0.00024 0.03910 0.50883 0.00024 0.00320 0.51226 2.16%
2006 0.50098 0.00023 0.00328 0.50448 0.03883 0.00002 0.00023 0.03908 0.53993 0.00025 0.00353 0.54371 1.97%
2007 0.49625 0.00024 0.00307 0.49956 0.03838 0.00002 0.00022 0.03863 0.53555 0.00026 0.00331 0.53911 1.37%
2008 0.49433 0.00026 0.00294 0.49752 0.03611 0.00002 0.00021 0.03634 0.53414 0.00028 0.00317 0.53759 2.91%

2021 Government greenhouse gas conversion factors for company reporting: Methodology paper
30
Data Year
Emission Factor, kgCO2e / kWh % Net Electricity Imports For electricity GENERATED
(supplied to the grid) Due to grid transmission /distribution LOSSES
For electricity CONSUMED (includes grid losses)
CO2 CH4 N2O Total CO2 CH4 N2O Total CO2 CH4 N2O Total TOTAL 2009 0.45211 0.00027 0.00263 0.45501 0.03783 0.00002 0.00024 0.03809 0.49074 0.00030 0.00285 0.49389 0.80%
2010 0.45980 0.00028 0.00269 0.46277 0.05061 0.00001 0.00042 0.05104 0.49613 0.00030 0.00290 0.49933 0.73%
2011 0.44877 0.00029 0.00285 0.45192 0.04318 0.00001 0.00033 0.04352 0.48715 0.00032 0.00310 0.49056 1.76%
2012 0.50520 0.00034 0.00381 0.50935 0.04418 0.00003 0.00033 0.04454 0.54938 0.00037 0.00414 0.55389 3.40%
2013 0.47532 0.00036 0.00347 0.47915 0.03925 0.00003 0.00029 0.03956 0.51457 0.00039 0.00375 0.51871 4.10%
2014 0.42417 0.00040 0.00217 0.42673 0.03837 0.00004 0.00020 0.03860 0.46254 0.00044 0.00236 0.46534 6.44%
2015 0.35766 0.00064 0.00214 0.36044 0.03343 0.00006 0.00020 0.03369 0.39108 0.00070 0.00234 0.39412 6.59%
2016 0.28266 0.00066 0.00154 0.28486 0.02409 0.00006 0.00013 0.02428 0.30675 0.00072 0.00167 0.30913 5.57%
2017 0.25294 0.00065 0.00137 0.25496 0.02148 0.00005 0.00012 0.02165 0.27442 0.00070 0.00149 0.27660 4.78%
2018 0.23536 0.00073 0.00141 0.23750 0.02024 0.00006 0.00012 0.02042 0.25559 0.00079 0.00153 0.25792 6.20%
2019 0.21434 0.00081 0.00139 0.21654 0.01897 0.00007 0.00012 0.01917 0.23331 0.00088 0.00152 0.23571 6.98%
Notes: * From 1990-2013 the emission factor used was for French electricity only, and is as published in previous methodology papers. The methodology was updated from 2014 onwards with new data on the contribution of electricity from the other interconnects, hence these figures are based on a weighted average emission factor of the conversion factors for France, the Netherlands and Ireland, based on the % share supplied.
Emission Factor (Electricity CONSUMED) = Emission Factor (Electricity GENERATED) / (1 - %Electricity Total Grid LOSSES)
Emission Factor (Electricity LOSSES) = Emission Factor (Electricity CONSUMED) - Emission Factor (Electricity GENERATED)
⇒ Emission Factor (Electricity CONSUMED) = Emission Factor (Electricity GENERATED) + Emission Factor (Electricity LOSSES),
2021 Government greenhouse gas conversion factors for company reporting: Methodology paper
31
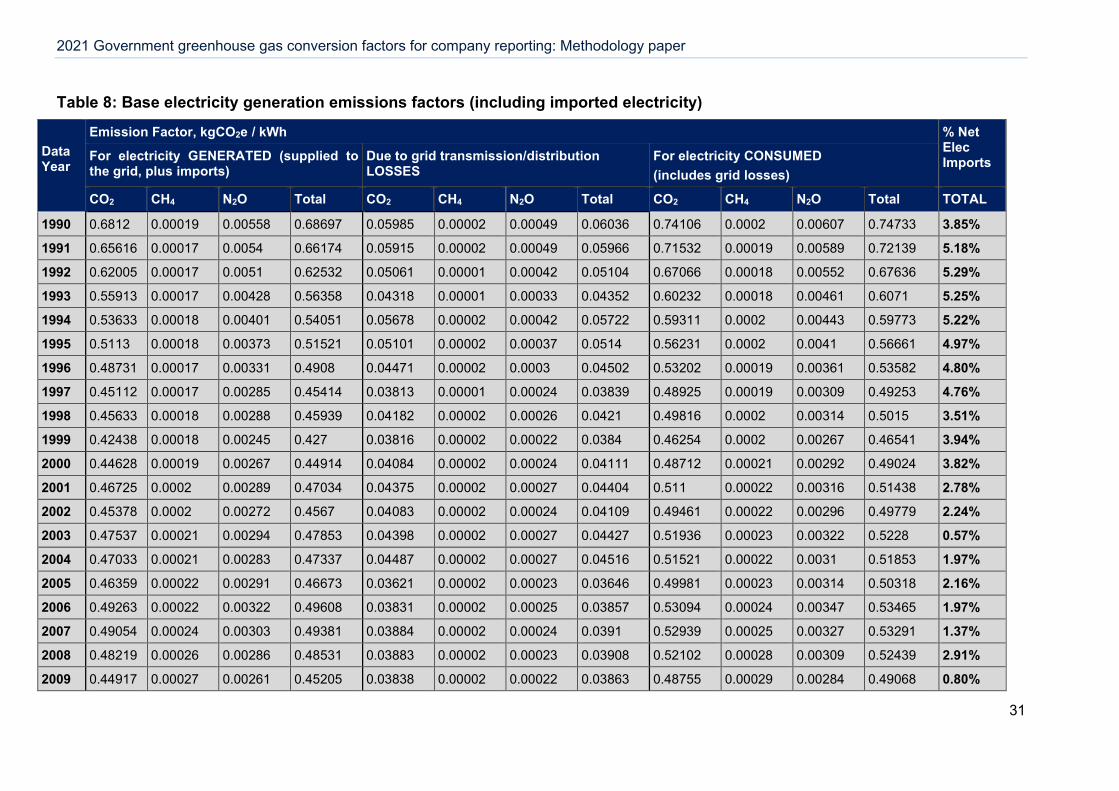
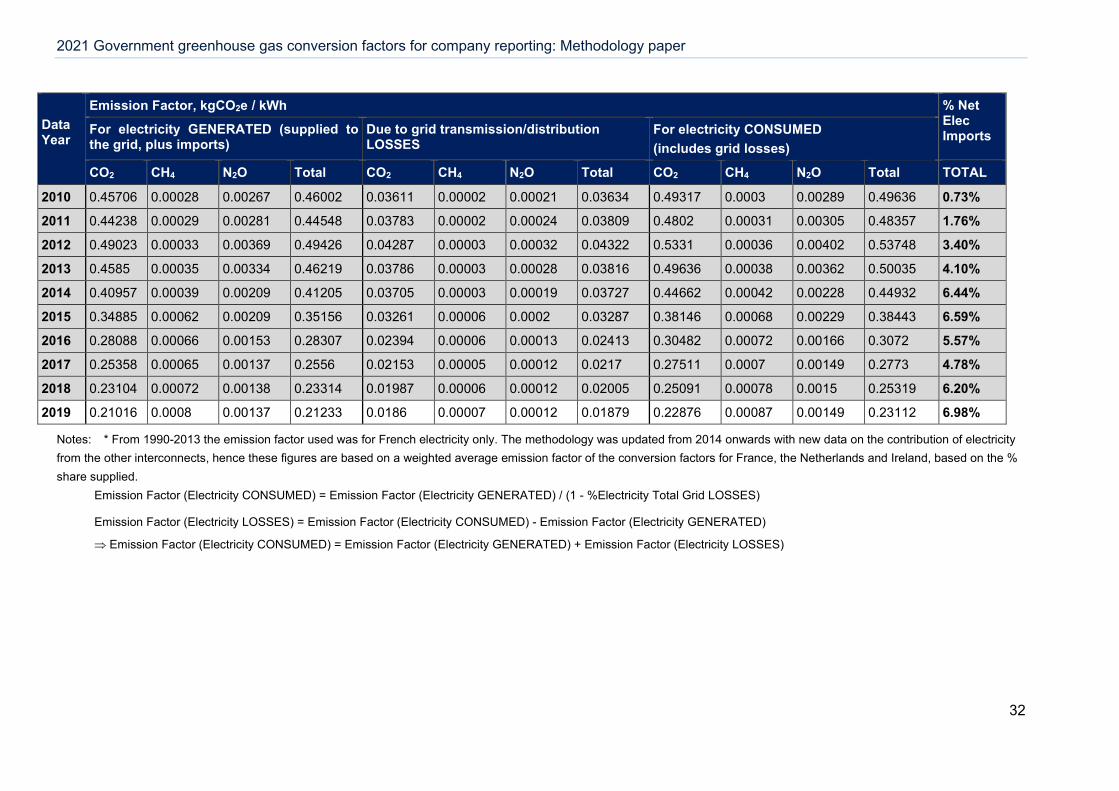
Table 8: Base electricity generation emissions factors (including imported electricity)
Data Year
Emission Factor, kgCO2e / kWh % Net Elec Imports For electricity GENERATED (supplied to
the grid, plus imports) Due to grid transmission/distribution LOSSES
For electricity CONSUMED (includes grid losses)
CO2 CH4 N2O Total CO2 CH4 N2O Total CO2 CH4 N2O Total TOTAL
1990 0.6812 0.00019 0.00558 0.68697 0.05985 0.00002 0.00049 0.06036 0.74106 0.0002 0.00607 0.74733 3.85%
1991 0.65616 0.00017 0.0054 0.66174 0.05915 0.00002 0.00049 0.05966 0.71532 0.00019 0.00589 0.72139 5.18%
1992 0.62005 0.00017 0.0051 0.62532 0.05061 0.00001 0.00042 0.05104 0.67066 0.00018 0.00552 0.67636 5.29%
1993 0.55913 0.00017 0.00428 0.56358 0.04318 0.00001 0.00033 0.04352 0.60232 0.00018 0.00461 0.6071 5.25%
1994 0.53633 0.00018 0.00401 0.54051 0.05678 0.00002 0.00042 0.05722 0.59311 0.0002 0.00443 0.59773 5.22%
1995 0.5113 0.00018 0.00373 0.51521 0.05101 0.00002 0.00037 0.0514 0.56231 0.0002 0.0041 0.56661 4.97%
1996 0.48731 0.00017 0.00331 0.4908 0.04471 0.00002 0.0003 0.04502 0.53202 0.00019 0.00361 0.53582 4.80%
1997 0.45112 0.00017 0.00285 0.45414 0.03813 0.00001 0.00024 0.03839 0.48925 0.00019 0.00309 0.49253 4.76%
1998 0.45633 0.00018 0.00288 0.45939 0.04182 0.00002 0.00026 0.0421 0.49816 0.0002 0.00314 0.5015 3.51%
1999 0.42438 0.00018 0.00245 0.427 0.03816 0.00002 0.00022 0.0384 0.46254 0.0002 0.00267 0.46541 3.94%
2000 0.44628 0.00019 0.00267 0.44914 0.04084 0.00002 0.00024 0.04111 0.48712 0.00021 0.00292 0.49024 3.82%
2001 0.46725 0.0002 0.00289 0.47034 0.04375 0.00002 0.00027 0.04404 0.511 0.00022 0.00316 0.51438 2.78%
2002 0.45378 0.0002 0.00272 0.4567 0.04083 0.00002 0.00024 0.04109 0.49461 0.00022 0.00296 0.49779 2.24%
2003 0.47537 0.00021 0.00294 0.47853 0.04398 0.00002 0.00027 0.04427 0.51936 0.00023 0.00322 0.5228 0.57%
2004 0.47033 0.00021 0.00283 0.47337 0.04487 0.00002 0.00027 0.04516 0.51521 0.00022 0.0031 0.51853 1.97%
2005 0.46359 0.00022 0.00291 0.46673 0.03621 0.00002 0.00023 0.03646 0.49981 0.00023 0.00314 0.50318 2.16%
2006 0.49263 0.00022 0.00322 0.49608 0.03831 0.00002 0.00025 0.03857 0.53094 0.00024 0.00347 0.53465 1.97%
2007 0.49054 0.00024 0.00303 0.49381 0.03884 0.00002 0.00024 0.0391 0.52939 0.00025 0.00327 0.53291 1.37%
2008 0.48219 0.00026 0.00286 0.48531 0.03883 0.00002 0.00023 0.03908 0.52102 0.00028 0.00309 0.52439 2.91%
2009 0.44917 0.00027 0.00261 0.45205 0.03838 0.00002 0.00022 0.03863 0.48755 0.00029 0.00284 0.49068 0.80%
2021 Government greenhouse gas conversion factors for company reporting: Methodology paper
32
Data Year
Emission Factor, kgCO2e / kWh % Net Elec Imports For electricity GENERATED (supplied to
the grid, plus imports) Due to grid transmission/distribution LOSSES
For electricity CONSUMED (includes grid losses)
CO2 CH4 N2O Total CO2 CH4 N2O Total CO2 CH4 N2O Total TOTAL
2010 0.45706 0.00028 0.00267 0.46002 0.03611 0.00002 0.00021 0.03634 0.49317 0.0003 0.00289 0.49636 0.73%
2011 0.44238 0.00029 0.00281 0.44548 0.03783 0.00002 0.00024 0.03809 0.4802 0.00031 0.00305 0.48357 1.76%
2012 0.49023 0.00033 0.00369 0.49426 0.04287 0.00003 0.00032 0.04322 0.5331 0.00036 0.00402 0.53748 3.40%
2013 0.4585 0.00035 0.00334 0.46219 0.03786 0.00003 0.00028 0.03816 0.49636 0.00038 0.00362 0.50035 4.10%
2014 0.40957 0.00039 0.00209 0.41205 0.03705 0.00003 0.00019 0.03727 0.44662 0.00042 0.00228 0.44932 6.44%
2015 0.34885 0.00062 0.00209 0.35156 0.03261 0.00006 0.0002 0.03287 0.38146 0.00068 0.00229 0.38443 6.59%
2016 0.28088 0.00066 0.00153 0.28307 0.02394 0.00006 0.00013 0.02413 0.30482 0.00072 0.00166 0.3072 5.57%
2017 0.25358 0.00065 0.00137 0.2556 0.02153 0.00005 0.00012 0.0217 0.27511 0.0007 0.00149 0.2773 4.78%
2018 0.23104 0.00072 0.00138 0.23314 0.01987 0.00006 0.00012 0.02005 0.25091 0.00078 0.0015 0.25319 6.20%
2019 0.21016 0.0008 0.00137 0.21233 0.0186 0.00007 0.00012 0.01879 0.22876 0.00087 0.00149 0.23112 6.98%
Notes: * From 1990-2013 the emission factor used was for French electricity only. The methodology was updated from 2014 onwards with new data on the contribution of electricity from the other interconnects, hence these figures are based on a weighted average emission factor of the conversion factors for France, the Netherlands and Ireland, based on the % share supplied. Emission Factor (Electricity CONSUMED) = Emission Factor (Electricity GENERATED) / (1 - %Electricity Total Grid LOSSES)
Emission Factor (Electricity LOSSES) = Emission Factor (Electricity CONSUMED) - Emission Factor (Electricity GENERATED)
⇒ Emission Factor (Electricity CONSUMED) = Emission Factor (Electricity GENERATED) + Emission Factor (Electricity LOSSES)
2021 Government greenhouse gas conversion factors for company reporting: Methodology paper
33
Indirect/WTT Emissions from UK Grid Electricity 3.15. In addition to the GHG emissions resulting directly from the generation of
electricity, there are also indirect/WTT emissions resulting from the production, transport and distribution of the fuels used in electricity generation (i.e. indirect/WTT/-fuel lifecycle emissions as included in the Fuels WTT tables). The average fuel lifecycle emissions per unit of electricity generated will be a result of the mix of different sources of fuel/primary energy used in electricity generation.
3.16. The WTT conversion factor for electricity has been calculated using the corresponding fuels WTT conversion factors and data on the total fuel consumption by type of generation from Table 5.6 and Table 6.6, DUKES 2020 (BEIS, 2020b). The data used in these calculations are presented in Table 9, Table 10 and Table 11 with the final WTT conversion factors for electricity.
Table 9: Fuel Consumed in electricity generation (GWh), by year
Data Year Fuel Consumed in Electricity Generation, GWh
Coal Fuel Oil
Natural Gas
Other thermal (excl. renewables)
Other generation Total
1996 390,938 45,955 201,929 16,066 243,574 898,462 1997 336,614 25,253 251,787 16,066 257,272 886,992 1998 347,696 17,793 267,731 16,046 268,184 917,450 1999 296,706 17,920 315,548 16,187 256,159 902,520 2000 333,429 18,023 324,560 15,743 228,045 919,800 2001 367,569 16,545 312,518 12,053 249,422 958,107 2002 344,552 14,977 329,442 12,343 244,609 945,923 2003 378,463 13,867 323,926 17,703 241,638 975,597 2004 364,158 12,792 340,228 16,132 228,000 961,309 2005 378,846 15,171 331,658 21,877 233,705 981,257 2006 418,018 16,665 311,408 18,038 224,863 988,991 2007 382,857 13,491 355,878 14,613 189,813 956,652 2008 348,450 18,393 376,810 13,074 167,638 924,366 2009 286,820 17,597 359,303 11,551 213,450 888,721 2010 297,290 13,705 373,586 9,322 202,893 896,796 2011 302,729 10,514 307,265 8,913 232,146 861,567 2012 399,253 9,076 214,146 12,926 230,227 865,628 2013 365,697 6,849 202,325 15,198 239,526 829,594 2014 280,452 6,167 218,395 19,934 275,426 800,374 2015 212,336 7,192 212,976 23,050 323,693 779,248 2016 87,669 6,790 298,077 25,319 325,774 743,630 2017 64,597 6,324 286,031 24,882 339,012 720,846 2018 49,318 5,699 273,397 26,557 343,480 698,450
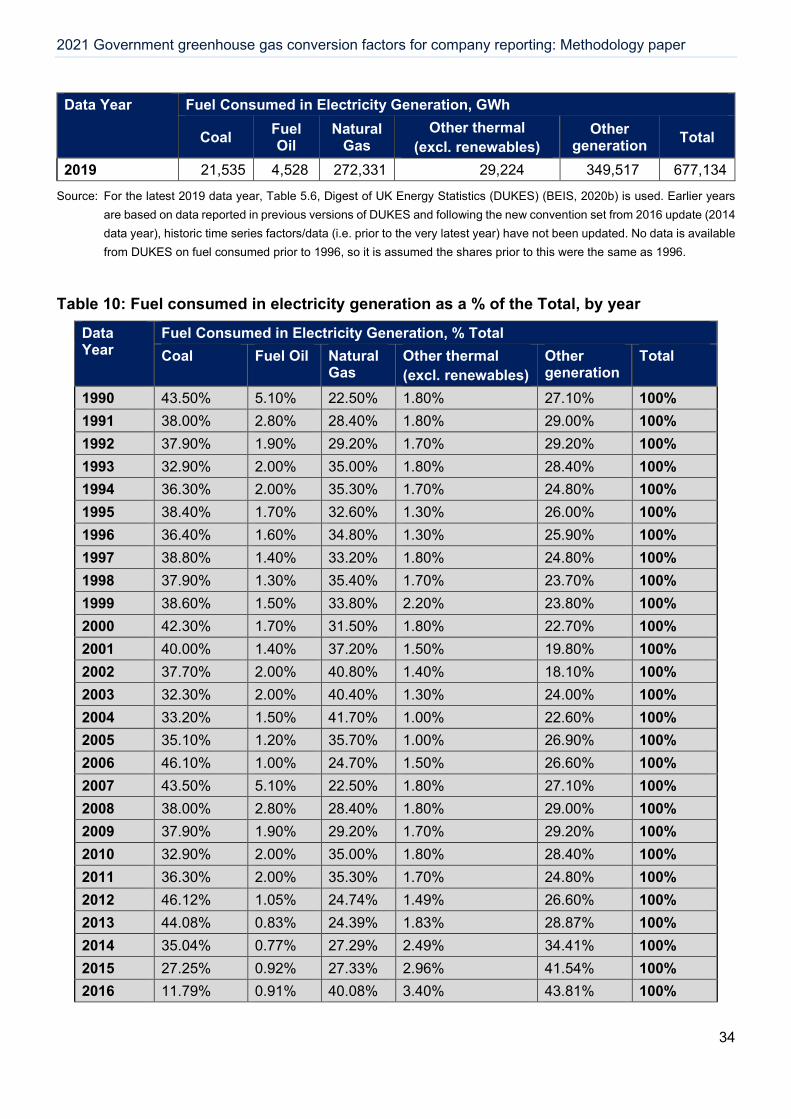
2021 Government greenhouse gas conversion factors for company reporting: Methodology paper
34
Data Year Fuel Consumed in Electricity Generation, GWh
Coal Fuel Oil
Natural Gas
Other thermal (excl. renewables)
Other generation Total
2019 21,535 4,528 272,331 29,224 349,517 677,134
Source: For the latest 2019 data year, Table 5.6, Digest of UK Energy Statistics (DUKES) (BEIS, 2020b) is used. Earlier years are based on data reported in previous versions of DUKES and following the new convention set from 2016 update (2014 data year), historic time series factors/data (i.e. prior to the very latest year) have not been updated. No data is available from DUKES on fuel consumed prior to 1996, so it is assumed the shares prior to this were the same as 1996.
Table 10: Fuel consumed in electricity generation as a % of the Total, by year
Data Year
Fuel Consumed in Electricity Generation, % Total Coal Fuel Oil Natural
Gas Other thermal (excl. renewables)
Other generation
Total
1990 43.50% 5.10% 22.50% 1.80% 27.10% 100% 1991 38.00% 2.80% 28.40% 1.80% 29.00% 100% 1992 37.90% 1.90% 29.20% 1.70% 29.20% 100% 1993 32.90% 2.00% 35.00% 1.80% 28.40% 100% 1994 36.30% 2.00% 35.30% 1.70% 24.80% 100% 1995 38.40% 1.70% 32.60% 1.30% 26.00% 100% 1996 36.40% 1.60% 34.80% 1.30% 25.90% 100% 1997 38.80% 1.40% 33.20% 1.80% 24.80% 100% 1998 37.90% 1.30% 35.40% 1.70% 23.70% 100% 1999 38.60% 1.50% 33.80% 2.20% 23.80% 100% 2000 42.30% 1.70% 31.50% 1.80% 22.70% 100% 2001 40.00% 1.40% 37.20% 1.50% 19.80% 100% 2002 37.70% 2.00% 40.80% 1.40% 18.10% 100% 2003 32.30% 2.00% 40.40% 1.30% 24.00% 100% 2004 33.20% 1.50% 41.70% 1.00% 22.60% 100% 2005 35.10% 1.20% 35.70% 1.00% 26.90% 100% 2006 46.10% 1.00% 24.70% 1.50% 26.60% 100% 2007 43.50% 5.10% 22.50% 1.80% 27.10% 100% 2008 38.00% 2.80% 28.40% 1.80% 29.00% 100% 2009 37.90% 1.90% 29.20% 1.70% 29.20% 100% 2010 32.90% 2.00% 35.00% 1.80% 28.40% 100% 2011 36.30% 2.00% 35.30% 1.70% 24.80% 100% 2012 46.12% 1.05% 24.74% 1.49% 26.60% 100% 2013 44.08% 0.83% 24.39% 1.83% 28.87% 100% 2014 35.04% 0.77% 27.29% 2.49% 34.41% 100% 2015 27.25% 0.92% 27.33% 2.96% 41.54% 100% 2016 11.79% 0.91% 40.08% 3.40% 43.81% 100%
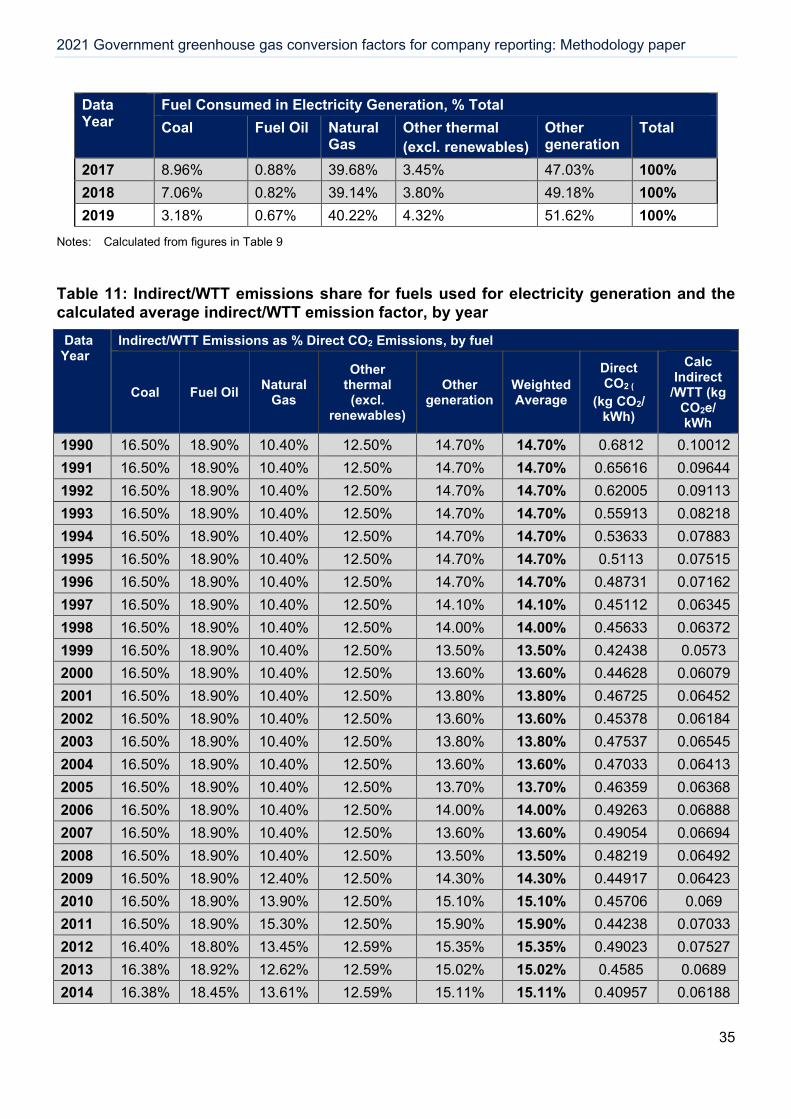
2021 Government greenhouse gas conversion factors for company reporting: Methodology paper
35
Data Year
Fuel Consumed in Electricity Generation, % Total Coal Fuel Oil Natural
Gas Other thermal (excl. renewables)
Other generation
Total
2017 8.96% 0.88% 39.68% 3.45% 47.03% 100% 2018 7.06% 0.82% 39.14% 3.80% 49.18% 100% 2019 3.18% 0.67% 40.22% 4.32% 51.62% 100%
Notes: Calculated from figures in Table 9
Table 11: Indirect/WTT emissions share for fuels used for electricity generation and the calculated average indirect/WTT emission factor, by year Data Year
Indirect/WTT Emissions as % Direct CO2 Emissions, by fuel
Coal Fuel Oil Natural Gas
Other thermal (excl.
renewables)
Other generation
Weighted Average
Direct CO2 (
(kg CO2/ kWh)
Calc Indirect
/WTT (kg CO2e/ kWh
1990 16.50% 18.90% 10.40% 12.50% 14.70% 14.70% 0.6812 0.10012 1991 16.50% 18.90% 10.40% 12.50% 14.70% 14.70% 0.65616 0.09644 1992 16.50% 18.90% 10.40% 12.50% 14.70% 14.70% 0.62005 0.09113 1993 16.50% 18.90% 10.40% 12.50% 14.70% 14.70% 0.55913 0.08218 1994 16.50% 18.90% 10.40% 12.50% 14.70% 14.70% 0.53633 0.07883 1995 16.50% 18.90% 10.40% 12.50% 14.70% 14.70% 0.5113 0.07515 1996 16.50% 18.90% 10.40% 12.50% 14.70% 14.70% 0.48731 0.07162 1997 16.50% 18.90% 10.40% 12.50% 14.10% 14.10% 0.45112 0.06345 1998 16.50% 18.90% 10.40% 12.50% 14.00% 14.00% 0.45633 0.06372 1999 16.50% 18.90% 10.40% 12.50% 13.50% 13.50% 0.42438 0.0573 2000 16.50% 18.90% 10.40% 12.50% 13.60% 13.60% 0.44628 0.06079 2001 16.50% 18.90% 10.40% 12.50% 13.80% 13.80% 0.46725 0.06452 2002 16.50% 18.90% 10.40% 12.50% 13.60% 13.60% 0.45378 0.06184 2003 16.50% 18.90% 10.40% 12.50% 13.80% 13.80% 0.47537 0.06545 2004 16.50% 18.90% 10.40% 12.50% 13.60% 13.60% 0.47033 0.06413 2005 16.50% 18.90% 10.40% 12.50% 13.70% 13.70% 0.46359 0.06368 2006 16.50% 18.90% 10.40% 12.50% 14.00% 14.00% 0.49263 0.06888 2007 16.50% 18.90% 10.40% 12.50% 13.60% 13.60% 0.49054 0.06694 2008 16.50% 18.90% 10.40% 12.50% 13.50% 13.50% 0.48219 0.06492 2009 16.50% 18.90% 12.40% 12.50% 14.30% 14.30% 0.44917 0.06423 2010 16.50% 18.90% 13.90% 12.50% 15.10% 15.10% 0.45706 0.069 2011 16.50% 18.90% 15.30% 12.50% 15.90% 15.90% 0.44238 0.07033 2012 16.40% 18.80% 13.45% 12.59% 15.35% 15.35% 0.49023 0.07527 2013 16.38% 18.92% 12.62% 12.59% 15.02% 15.02% 0.4585 0.0689 2014 16.38% 18.45% 13.61% 12.59% 15.11% 15.11% 0.40957 0.06188
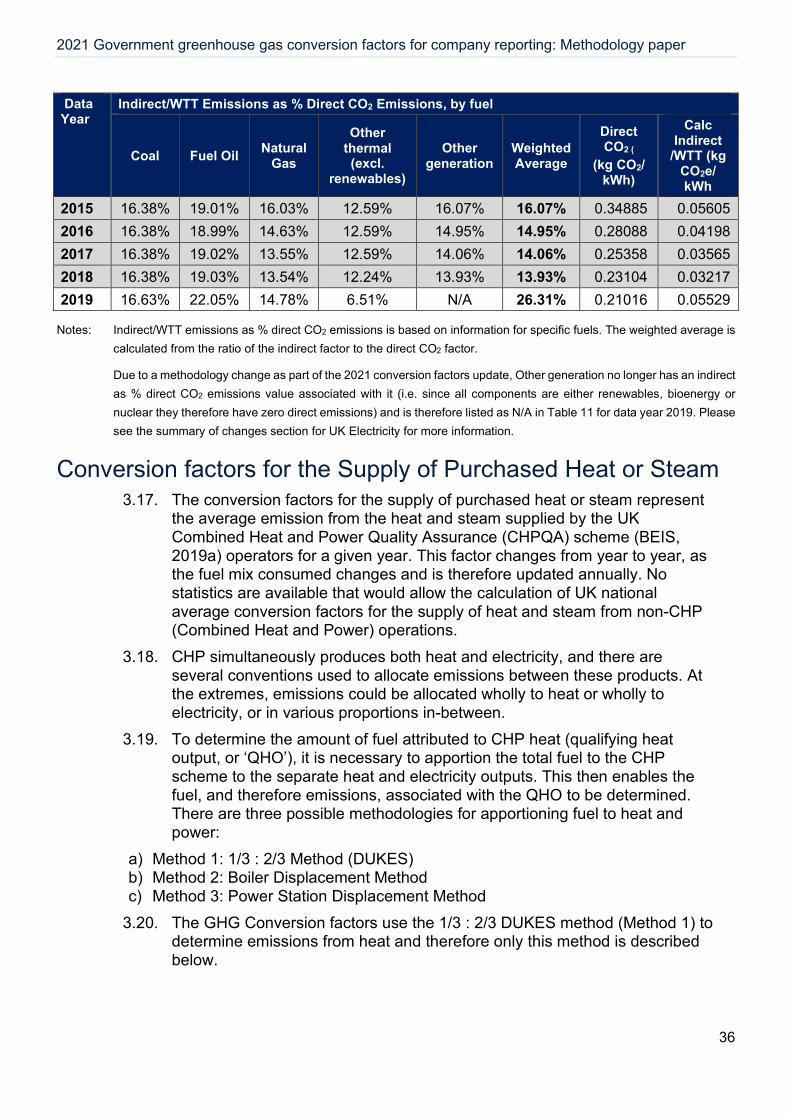
2021 Government greenhouse gas conversion factors for company reporting: Methodology paper
36
Data Year
Indirect/WTT Emissions as % Direct CO2 Emissions, by fuel
Coal Fuel Oil Natural Gas
Other thermal (excl.
renewables)
Other generation
Weighted Average
Direct CO2 (
(kg CO2/ kWh)
Calc Indirect
/WTT (kg CO2e/ kWh
2015 16.38% 19.01% 16.03% 12.59% 16.07% 16.07% 0.34885 0.05605 2016 16.38% 18.99% 14.63% 12.59% 14.95% 14.95% 0.28088 0.04198 2017 16.38% 19.02% 13.55% 12.59% 14.06% 14.06% 0.25358 0.03565 2018 16.38% 19.03% 13.54% 12.24% 13.93% 13.93% 0.23104 0.03217 2019 16.63% 22.05% 14.78% 6.51% N/A 26.31% 0.21016 0.05529
Notes: Indirect/WTT emissions as % direct CO2 emissions is based on information for specific fuels. The weighted average is calculated from the ratio of the indirect factor to the direct CO2 factor.
Due to a methodology change as part of the 2021 conversion factors update, Other generation no longer has an indirect as % direct CO2 emissions value associated with it (i.e. since all components are either renewables, bioenergy or nuclear they therefore have zero direct emissions) and is therefore listed as N/A in Table 11 for data year 2019. Please see the summary of changes section for UK Electricity for more information.
Conversion factors for the Supply of Purchased Heat or Steam 3.17. The conversion factors for the supply of purchased heat or steam represent
the average emission from the heat and steam supplied by the UK Combined Heat and Power Quality Assurance (CHPQA) scheme (BEIS, 2019a) operators for a given year. This factor changes from year to year, as the fuel mix consumed changes and is therefore updated annually. No statistics are available that would allow the calculation of UK national average conversion factors for the supply of heat and steam from non-CHP (Combined Heat and Power) operations.
3.18. CHP simultaneously produces both heat and electricity, and there are several conventions used to allocate emissions between these products. At the extremes, emissions could be allocated wholly to heat or wholly to electricity, or in various proportions in-between.
3.19. To determine the amount of fuel attributed to CHP heat (qualifying heat output, or ‘QHO’), it is necessary to apportion the total fuel to the CHP scheme to the separate heat and electricity outputs. This then enables the fuel, and therefore emissions, associated with the QHO to be determined. There are three possible methodologies for apportioning fuel to heat and power:
a) Method 1: 1/3 : 2/3 Method (DUKES) b) Method 2: Boiler Displacement Method c) Method 3: Power Station Displacement Method
3.20. The GHG Conversion factors use the 1/3 : 2/3 DUKES method (Method 1) to determine emissions from heat and therefore only this method is described below.
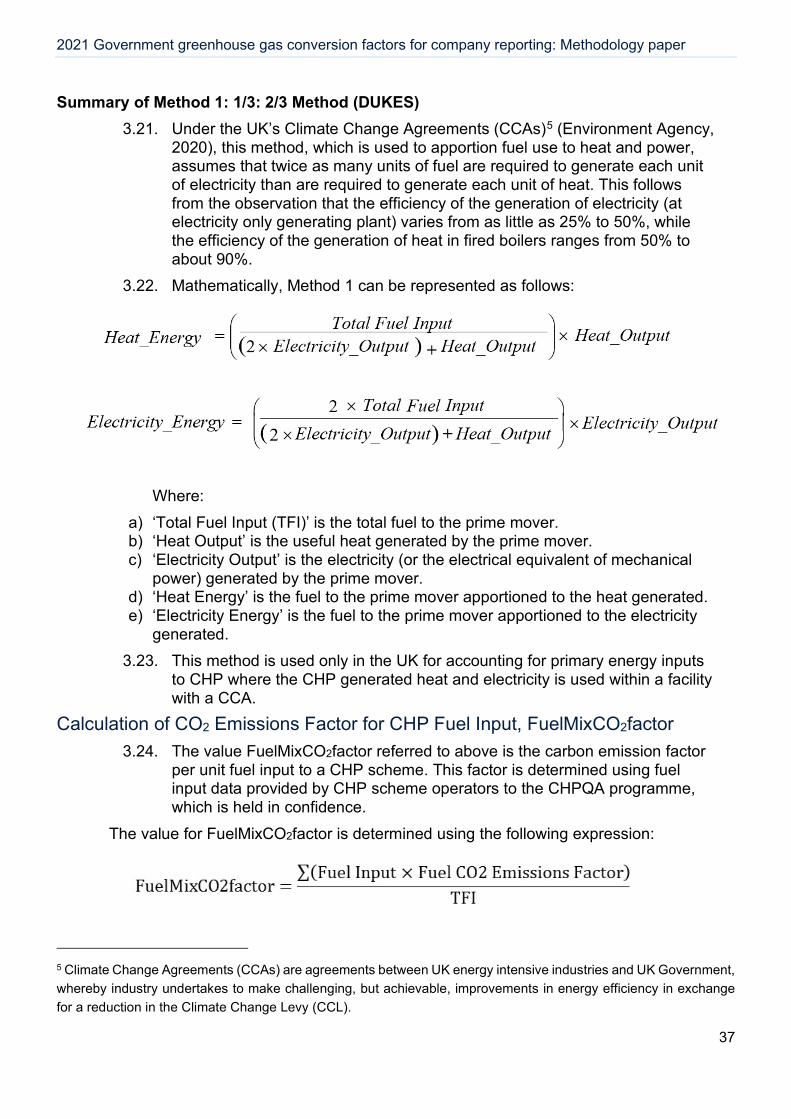
2021 Government greenhouse gas conversion factors for company reporting: Methodology paper
37
Summary of Method 1: 1/3: 2/3 Method (DUKES) 3.21. Under the UK’s Climate Change Agreements (CCAs)5 (Environment Agency,
2020), this method, which is used to apportion fuel use to heat and power, assumes that twice as many units of fuel are required to generate each unit of electricity than are required to generate each unit of heat. This follows from the observation that the efficiency of the generation of electricity (at electricity only generating plant) varies from as little as 25% to 50%, while the efficiency of the generation of heat in fired boilers ranges from 50% to about 90%.
3.22. Mathematically, Method 1 can be represented as follows:
Where:
a) ‘Total Fuel Input (TFI)’ is the total fuel to the prime mover. b) ‘Heat Output’ is the useful heat generated by the prime mover. c) ‘Electricity Output’ is the electricity (or the electrical equivalent of mechanical
power) generated by the prime mover. d) ‘Heat Energy’ is the fuel to the prime mover apportioned to the heat generated. e) ‘Electricity Energy’ is the fuel to the prime mover apportioned to the electricity
generated. 3.23. This method is used only in the UK for accounting for primary energy inputs
to CHP where the CHP generated heat and electricity is used within a facility with a CCA.
Calculation of CO2 Emissions Factor for CHP Fuel Input, FuelMixCO2factor 3.24. The value FuelMixCO2factor referred to above is the carbon emission factor
per unit fuel input to a CHP scheme. This factor is determined using fuel input data provided by CHP scheme operators to the CHPQA programme, which is held in confidence.
The value for FuelMixCO2factor is determined using the following expression:
5 Climate Change Agreements (CCAs) are agreements between UK energy intensive industries and UK Government, whereby industry undertakes to make challenging, but achievable, improvements in energy efficiency in exchange for a reduction in the Climate Change Levy (CCL).

2021 Government greenhouse gas conversion factors for company reporting: Methodology paper
38
Where: a) FuelMixCO2factor is the composite emissions factor (in tCO2/MWh thermal fuel
input) for a scheme b) Fuel Input is the fuel input (in MWh thermal, MWhth) for a single fuel supplied to
the prime mover c) Fuel CO2 Emissions factor is the CO2 emissions factor (in tCO2/MWhth) for the
fuel considered. d) TFI is total fuel input (in MWh thermal) for all fuels supplied to the prime mover.
3.25. Fuel inputs and emissions factors are evaluated on a Gross Calorific Value (Higher Heating Value) basis. The following Table 12 provides the individual fuel types considered under the CHPQA scheme and their associated emissions factors, consistent with other reporting; fuel mix varies every year and thus there are zero entries for specific fuels types.
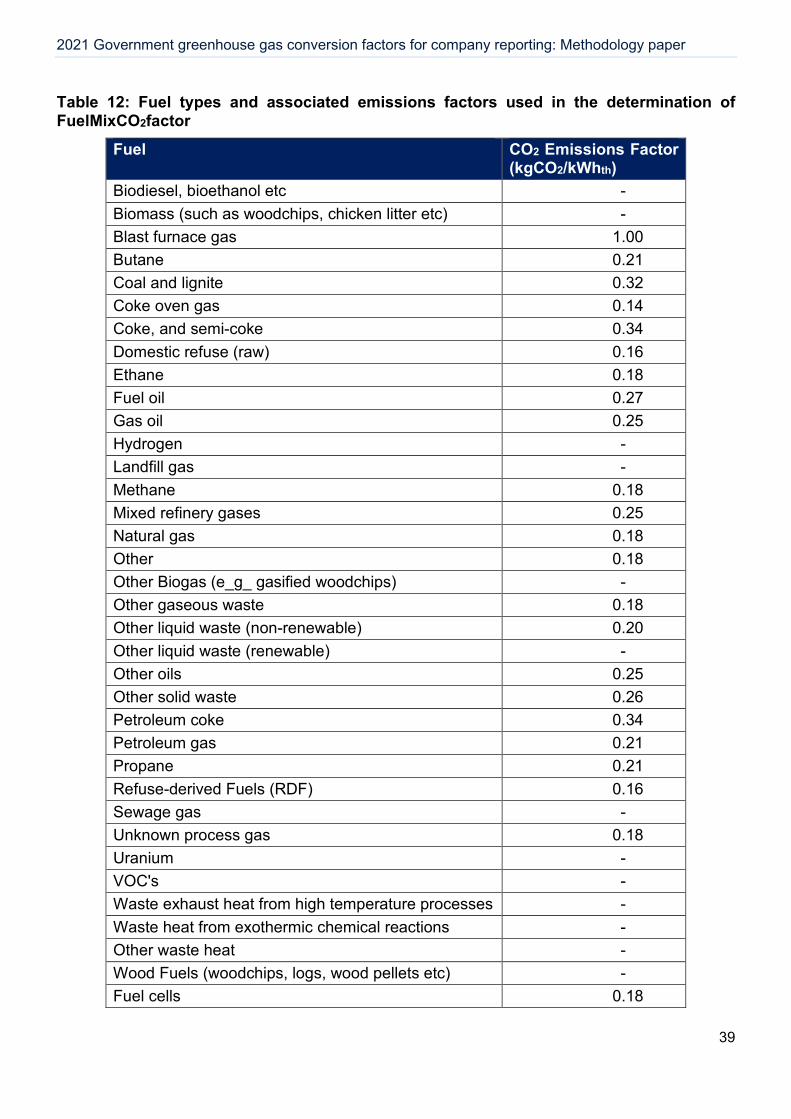
2021 Government greenhouse gas conversion factors for company reporting: Methodology paper
39
Table 12: Fuel types and associated emissions factors used in the determination of FuelMixCO2factor
Fuel CO2 Emissions Factor (kgCO2/kWhth)
Biodiesel, bioethanol etc - Biomass (such as woodchips, chicken litter etc) - Blast furnace gas 1.00 Butane 0.21 Coal and lignite 0.32 Coke oven gas 0.14 Coke, and semi-coke 0.34 Domestic refuse (raw) 0.16 Ethane 0.18 Fuel oil 0.27 Gas oil 0.25 Hydrogen - Landfill gas - Methane 0.18 Mixed refinery gases 0.25 Natural gas 0.18 Other 0.18 Other Biogas (e_g_ gasified woodchips) - Other gaseous waste 0.18 Other liquid waste (non-renewable) 0.20 Other liquid waste (renewable) - Other oils 0.25 Other solid waste 0.26 Petroleum coke 0.34 Petroleum gas 0.21 Propane 0.21 Refuse-derived Fuels (RDF) 0.16 Sewage gas - Unknown process gas 0.18 Uranium - VOC's - Waste exhaust heat from high temperature processes - Waste heat from exothermic chemical reactions - Other waste heat - Wood Fuels (woodchips, logs, wood pellets etc) - Fuel cells 0.18
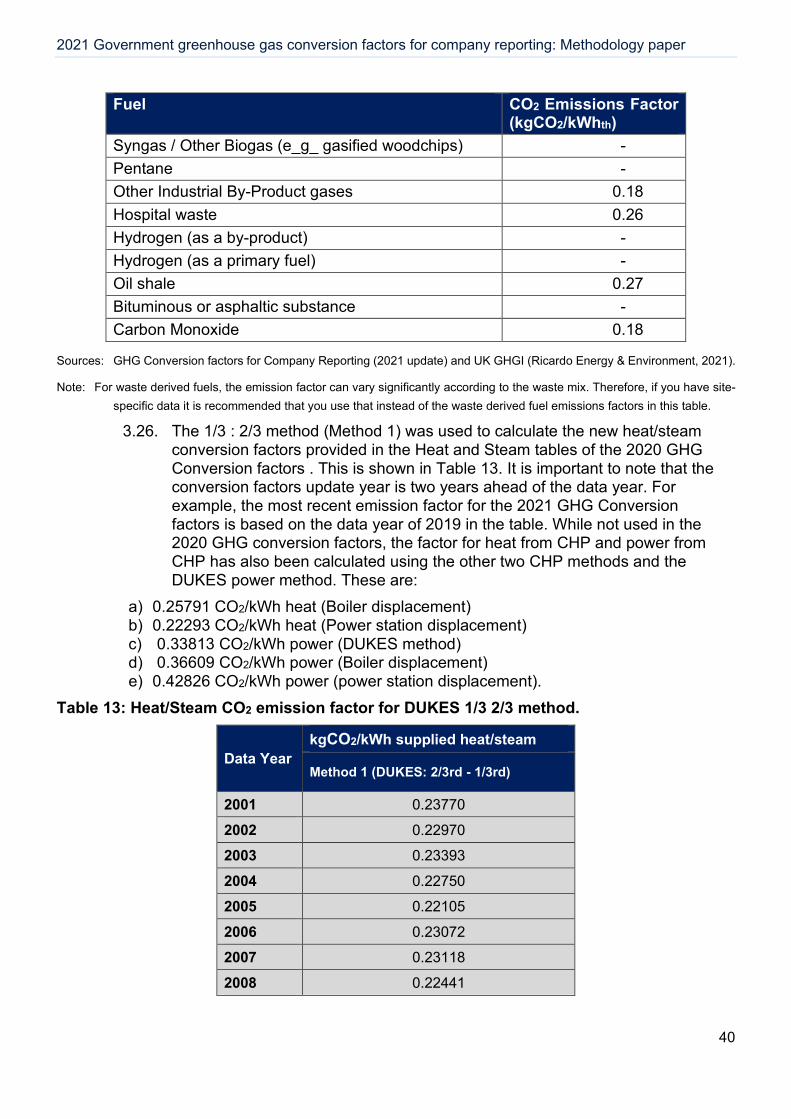
2021 Government greenhouse gas conversion factors for company reporting: Methodology paper
40
Fuel CO2 Emissions Factor (kgCO2/kWhth)
Syngas / Other Biogas (e_g_ gasified woodchips) - Pentane - Other Industrial By-Product gases 0.18 Hospital waste 0.26 Hydrogen (as a by-product) - Hydrogen (as a primary fuel) - Oil shale 0.27 Bituminous or asphaltic substance - Carbon Monoxide 0.18
Sources: GHG Conversion factors for Company Reporting (2021 update) and UK GHGI (Ricardo Energy & Environment, 2021).
Note: For waste derived fuels, the emission factor can vary significantly according to the waste mix. Therefore, if you have site-specific data it is recommended that you use that instead of the waste derived fuel emissions factors in this table.
3.26. The 1/3 : 2/3 method (Method 1) was used to calculate the new heat/steam conversion factors provided in the Heat and Steam tables of the 2020 GHG Conversion factors . This is shown in Table 13. It is important to note that the conversion factors update year is two years ahead of the data year. For example, the most recent emission factor for the 2021 GHG Conversion factors is based on the data year of 2019 in the table. While not used in the 2020 GHG conversion factors, the factor for heat from CHP and power from CHP has also been calculated using the other two CHP methods and the DUKES power method. These are:
a) 0.25791 CO2/kWh heat (Boiler displacement) b) 0.22293 CO2/kWh heat (Power station displacement) c) 0.33813 CO2/kWh power (DUKES method) d) 0.36609 CO2/kWh power (Boiler displacement) e) 0.42826 CO2/kWh power (power station displacement).
Table 13: Heat/Steam CO2 emission factor for DUKES 1/3 2/3 method.
Data Year kgCO2/kWh supplied heat/steam
Method 1 (DUKES: 2/3rd - 1/3rd)
2001 0.23770
2002 0.22970
2003 0.23393
2004 0.22750
2005 0.22105
2006 0.23072
2007 0.23118
2008 0.22441
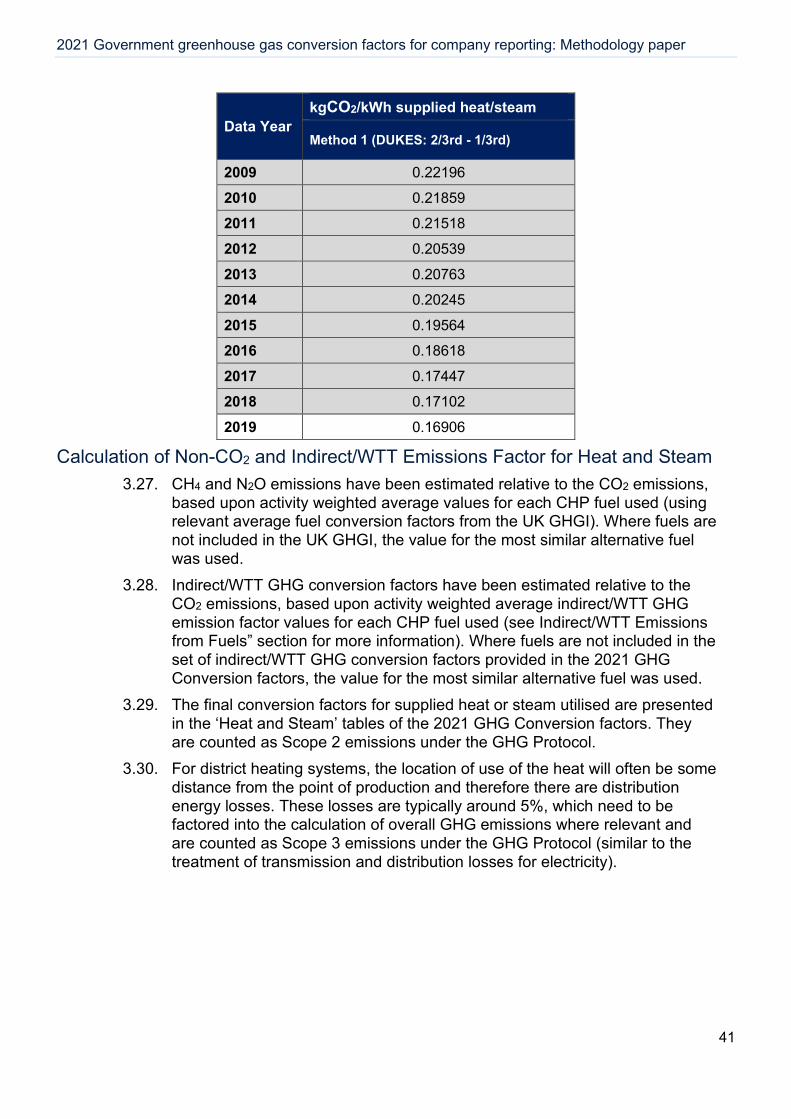
2021 Government greenhouse gas conversion factors for company reporting: Methodology paper
41
Data Year kgCO2/kWh supplied heat/steam
Method 1 (DUKES: 2/3rd - 1/3rd)
2009 0.22196
2010 0.21859
2011 0.21518
2012 0.20539
2013 0.20763
2014 0.20245
2015 0.19564
2016 0.18618
2017 0.17447
2018 0.17102
2019 0.16906
Calculation of Non-CO2 and Indirect/WTT Emissions Factor for Heat and Steam 3.27. CH4 and N2O emissions have been estimated relative to the CO2 emissions,
based upon activity weighted average values for each CHP fuel used (using relevant average fuel conversion factors from the UK GHGI). Where fuels are not included in the UK GHGI, the value for the most similar alternative fuel was used.
3.28. Indirect/WTT GHG conversion factors have been estimated relative to the CO2 emissions, based upon activity weighted average indirect/WTT GHG emission factor values for each CHP fuel used (see Indirect/WTT Emissions from Fuels” section for more information). Where fuels are not included in the set of indirect/WTT GHG conversion factors provided in the 2021 GHG Conversion factors, the value for the most similar alternative fuel was used.
3.29. The final conversion factors for supplied heat or steam utilised are presented in the ‘Heat and Steam’ tables of the 2021 GHG Conversion factors. They are counted as Scope 2 emissions under the GHG Protocol.
3.30. For district heating systems, the location of use of the heat will often be some distance from the point of production and therefore there are distribution energy losses. These losses are typically around 5%, which need to be factored into the calculation of overall GHG emissions where relevant and are counted as Scope 3 emissions under the GHG Protocol (similar to the treatment of transmission and distribution losses for electricity).

2021 Government greenhouse gas conversion factors for company reporting: Methodology paper
42
4. Refrigerant and Process Emission Factors
Section summary 4.1. Refrigerant and process conversion factors should be used for reporting
leakage from air-conditioning and refrigeration units or the release to the atmosphere of other gases that have a global warming potential.
4.2. This section of the methodology paper relates to the “Refrigerant & other” worksheet available in both the full and condensed set of the 2021 UK GHG Conversion factors set.
Summary of changes since the previous update 4.3. There are no major changes for the refrigerant factors in the 2021 update.
Global Warming Potentials of Greenhouse Gases 4.4. Although revised GWP values have since been published by the IPCC in the
Fifth Assessment Report (2014) (IPCC, 2014), the conversion factors in the Refrigerant tables incorporate (GWP) values relevant to reporting under UNFCCC, as published by the IPCC in its Fourth Assessment Report (IPCC, 2007) that is required to be used in inventory reporting.
Greenhouse Gases Listed in the Kyoto Protocol 4.5. Mixed/Blended gases: GWP values for refrigerant blends are calculated on
the basis of the percentage blend composition (e.g. the GWP for R404a that comprises of 44% HFC1256, 52% HFC143a and 4% HFC134a is [3500 x 0.44] + [4470 x 0.52] + [1430x 0.04] = 3922). A limited selection of common blends is presented in the Refrigerant tables.
Other Greenhouse Gases 4.6. CFCs and HCFCs7: Not all refrigerants in use are classified as GHGs for the
purposes of the UNFCCC and Kyoto Protocol (e.g. CFCs, HCFCs). These gases are controlled under the Montreal Protocol and as such GWP values are also listed in the provided tables.
6 HFC: Hydrofluorocarbon 7 CFCs: Chlorofluorocarbons; HCFCs: Hydrochlorofluorocarbons
2021 Government greenhouse gas conversion factors for company reporting: Methodology paper
43
5. Passenger Land Transport Emission Factors
Section summary 5.1. Conversion factors for passenger land transport are included in this section
of the methodology paper. This section includes vehicles owned by the reporting organisation (Scope 1), business travel in other vehicles (e.g. employee’s own car for business use, hire car, public transport (Scope 3)), and electric vehicles (EVs) (Scope 2). Other Scope 3 conversion factors included here are for transmission and distribution losses for electricity used for electric vehicles, WTT for passenger transport (vehicles owned by reporting organisation) and other business travel.
5.2. Note that passenger land transport factors should only be used in the absence of data for fuel or electricity consumption for the vehicles in question.
5.3. Table 14 shows where the related worksheets to the passenger land transport conversion factors are available in the online spreadsheets of the UK GHG Conversion factors.
Table 14: Related worksheets to passenger land transport emission factors
Worksheet name Full set Condensed set
Passenger vehicles Y Y
UK Electricity for Electric Vehicles (EVs) Y Y
UK Electricity T&D for EVs Y Y
Business travel – land* Y Y
WTT – pass vehicles & travel – land* Y N
* cars and motorbikes only
Summary of changes since the previous update 5.4. In the 2021 update, there have been amendments to the methodology for
calculating conversion factors for cars, relating the type-approval transition from the previous New European Driving Cycle (NEDC) to Worldwide Harmonised Light Vehicle Test Procedure (WLTP) protocol, and the real-world (RW) uplift factor applied to regulatory testing values. The car conversion factors are based on data from the Society of Motor Manufacturers and Traders (SMMT) for regulatory testing of average carbon dioxide per kilometre (CO2/km) and corresponding registrations in the UK by vehicle size (or market segment) and fuel type. An uplift factor is then applied
2021 Government greenhouse gas conversion factors for company reporting: Methodology paper
44
to convert the mean CO2/km data to real-world (RW) estimates, which are not fully captured by the regulatory testing. Due to the type-approval transition, we have sourced new data for the RW uplift factor to apply to new vehicle registrations with CO2 emissions data based on tests under WLTP.
5.5. The new uplift factor is significantly lower than previous years' factors which is expected as the regulatory testing WLTP CO2 levels are closer to the real-world driving CO2 levels. As the NEDC and WLTP CO2/km are both uplifted to real-world levels, the impact on the final conversion factors has been small. The results show a general continuation of the year-to-year trends in the improvements in the calculated fleet-wide real-world CO2 conversion factors for cars.
5.6. For motorcycles, there has been a change in method for allocating N2O emissions across the small / medium / large size classes to align it with the methodology for the other GHGs. This produces a large (87%) increase in the Motorbike – small emission factor for N2O.
5.7. Rail passenger-km conversion factors have declined for CO2e, reflecting the decarbonisation of the grid, whilst the factors for CH4 and N2O have increased. The CH4 factor increases are due to the increase in the UK Electricity CH4 factor combined with the decrease in the UK Electricity CO2 factor, as the ratio of the two is used in the calculations. The N2O factor for UK Electricity has decreased but not by the same extent as the CO2 factor, meaning the ratio between the two has increased.
5.8. As with cars and motorcycles, increased penetration of buses satisfying the latest Euro standards causes a decline in CH4 conversion factors in particular, similar to increased bus occupancy rates according to DfT statistics. Conversely, the newer Euro standard vehicles have higher N2O emission factors (resulting from exhaust NOx aftertreatment), meaning that the N2O factors for buses are trending upwards.
Direct Emissions from Passenger Cars Conversion factors for Petrol and Diesel Passenger Cars by Engine Size
5.9. The methodology for calculating average conversion factors for passenger cars is based upon a combination of datasets on the average new vehicle regulatory emissions for vehicles registered in the UK, and an uplift to account for differences between these and real-world driving performance emissions. As mentioned above, the regulatory test cycle/procedures are currently under transition from the previous NEDC to the new WLTP8 which apply to new vehicle registrations with CO2 emissions data based on tests under WLTP. The key objective of the change is to bring the results of tests under regulatory testing conditions closer to those observed in the real-
8 NEDC = New European Driving Cycle, which has been the standard cycle used in the type approval of all new passenger cars and vans historically. From 2017 there has been a phased transition in vehicle testing using the new WLTP (Worldwide Harmonised Light Vehicle Test Procedure); from September 2018 onwards all new cars and vans must have been tested/reported values under WLTP. More information is available on the VCA website: https://www.vehicle-certification-agency.gov.uk/fcb/wltp.asp
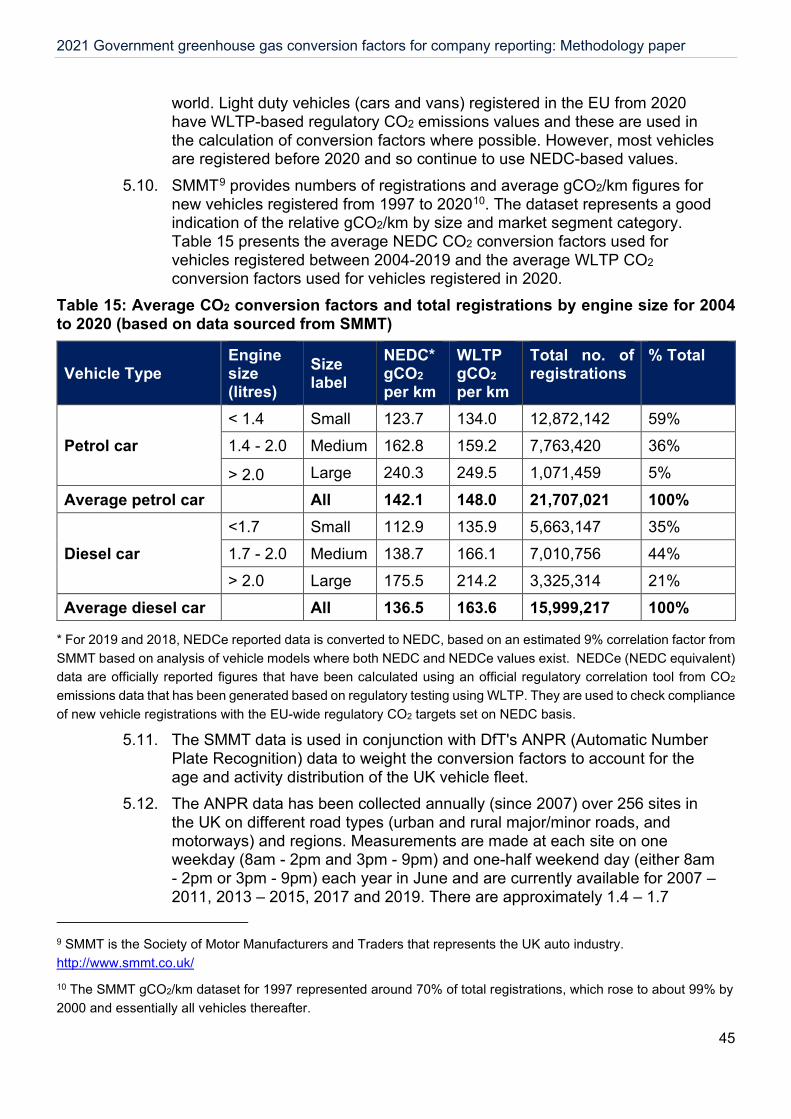
2021 Government greenhouse gas conversion factors for company reporting: Methodology paper
45
world. Light duty vehicles (cars and vans) registered in the EU from 2020 have WLTP-based regulatory CO2 emissions values and these are used in the calculation of conversion factors where possible. However, most vehicles are registered before 2020 and so continue to use NEDC-based values.
5.10. SMMT9 provides numbers of registrations and average gCO2/km figures for new vehicles registered from 1997 to 202010. The dataset represents a good indication of the relative gCO2/km by size and market segment category. Table 15 presents the average NEDC CO2 conversion factors used for vehicles registered between 2004-2019 and the average WLTP CO2 conversion factors used for vehicles registered in 2020.
Table 15: Average CO2 conversion factors and total registrations by engine size for 2004 to 2020 (based on data sourced from SMMT)
Vehicle Type Engine size (litres)
Size label
NEDC* gCO2 per km
WLTP gCO2 per km
Total no. of registrations
% Total
Petrol car < 1.4 Small 123.7 134.0 12,872,142 59% 1.4 - 2.0 Medium 162.8 159.2 7,763,420 36%
> 2.0 Large 240.3 249.5 1,071,459 5% Average petrol car All 142.1 148.0 21,707,021 100%
Diesel car <1.7 Small 112.9 135.9 5,663,147 35% 1.7 - 2.0 Medium 138.7 166.1 7,010,756 44% > 2.0 Large 175.5 214.2 3,325,314 21%
Average diesel car All 136.5 163.6 15,999,217 100%
* For 2019 and 2018, NEDCe reported data is converted to NEDC, based on an estimated 9% correlation factor from SMMT based on analysis of vehicle models where both NEDC and NEDCe values exist. NEDCe (NEDC equivalent) data are officially reported figures that have been calculated using an official regulatory correlation tool from CO2 emissions data that has been generated based on regulatory testing using WLTP. They are used to check compliance of new vehicle registrations with the EU-wide regulatory CO2 targets set on NEDC basis.
5.11. The SMMT data is used in conjunction with DfT's ANPR (Automatic Number Plate Recognition) data to weight the conversion factors to account for the age and activity distribution of the UK vehicle fleet.
5.12. The ANPR data has been collected annually (since 2007) over 256 sites in the UK on different road types (urban and rural major/minor roads, and motorways) and regions. Measurements are made at each site on one weekday (8am - 2pm and 3pm - 9pm) and one-half weekend day (either 8am - 2pm or 3pm - 9pm) each year in June and are currently available for 2007 – 2011, 2013 – 2015, 2017 and 2019. There are approximately 1.4 – 1.7
9 SMMT is the Society of Motor Manufacturers and Traders that represents the UK auto industry. http://www.smmt.co.uk/ 10 The SMMT gCO2/km dataset for 1997 represented around 70% of total registrations, which rose to about 99% by 2000 and essentially all vehicles thereafter.
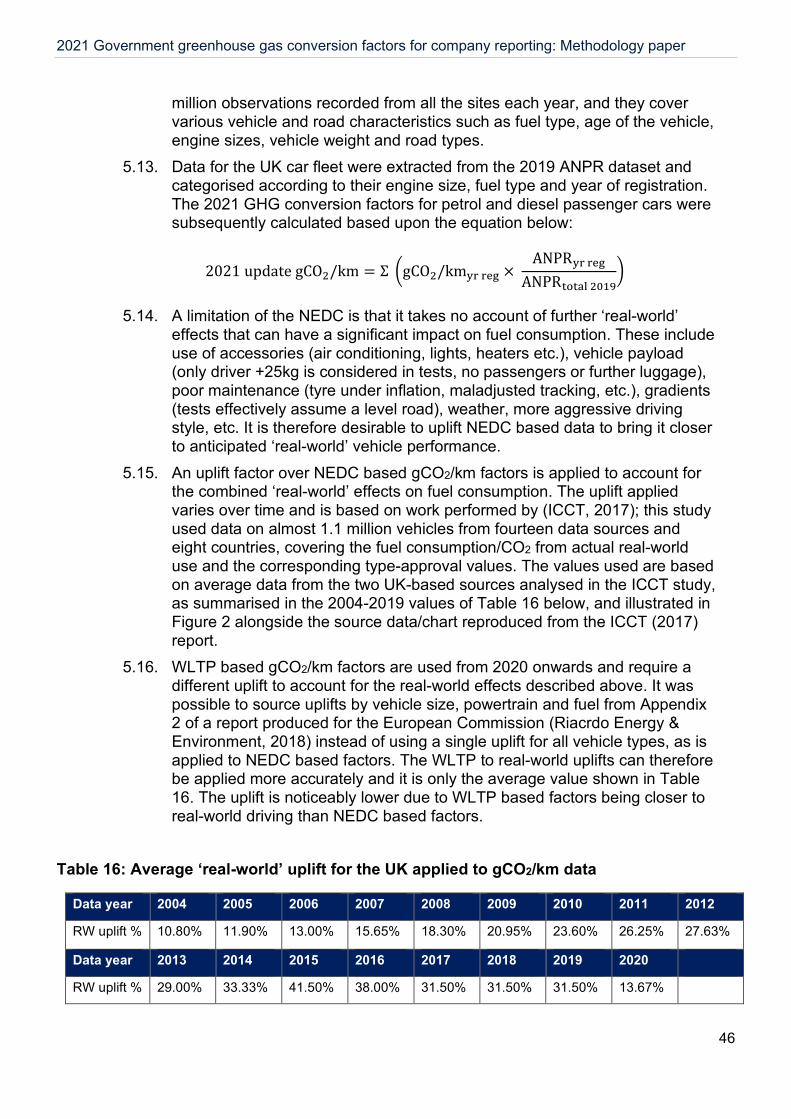
2021 Government greenhouse gas conversion factors for company reporting: Methodology paper
46
million observations recorded from all the sites each year, and they cover various vehicle and road characteristics such as fuel type, age of the vehicle, engine sizes, vehicle weight and road types.
5.13. Data for the UK car fleet were extracted from the 2019 ANPR dataset and categorised according to their engine size, fuel type and year of registration. The 2021 GHG conversion factors for petrol and diesel passenger cars were subsequently calculated based upon the equation below:
2021 update gCO2/km = Σ �gCO2/kmyr reg × ANPRyr reg
ANPRtotal 2019�
5.14. A limitation of the NEDC is that it takes no account of further ‘real-world’ effects that can have a significant impact on fuel consumption. These include use of accessories (air conditioning, lights, heaters etc.), vehicle payload (only driver +25kg is considered in tests, no passengers or further luggage), poor maintenance (tyre under inflation, maladjusted tracking, etc.), gradients (tests effectively assume a level road), weather, more aggressive driving style, etc. It is therefore desirable to uplift NEDC based data to bring it closer to anticipated ‘real-world’ vehicle performance.
5.15. An uplift factor over NEDC based gCO2/km factors is applied to account for the combined ‘real-world’ effects on fuel consumption. The uplift applied varies over time and is based on work performed by (ICCT, 2017); this study used data on almost 1.1 million vehicles from fourteen data sources and eight countries, covering the fuel consumption/CO2 from actual real-world use and the corresponding type-approval values. The values used are based on average data from the two UK-based sources analysed in the ICCT study, as summarised in the 2004-2019 values of Table 16 below, and illustrated in Figure 2 alongside the source data/chart reproduced from the ICCT (2017) report.
5.16. WLTP based gCO2/km factors are used from 2020 onwards and require a different uplift to account for the real-world effects described above. It was possible to source uplifts by vehicle size, powertrain and fuel from Appendix 2 of a report produced for the European Commission (Riacrdo Energy & Environment, 2018) instead of using a single uplift for all vehicle types, as is applied to NEDC based factors. The WLTP to real-world uplifts can therefore be applied more accurately and it is only the average value shown in Table 16. The uplift is noticeably lower due to WLTP based factors being closer to real-world driving than NEDC based factors.
Table 16: Average ‘real-world’ uplift for the UK applied to gCO2/km data
Data year 2004 2005 2006 2007 2008 2009 2010 2011 2012
RW uplift % 10.80% 11.90% 13.00% 15.65% 18.30% 20.95% 23.60% 26.25% 27.63%
Data year 2013 2014 2015 2016 2017 2018 2019 2020
RW uplift % 29.00% 33.33% 41.50% 38.00% 31.50% 31.50% 31.50% 13.67%
2021 Government greenhouse gas conversion factors for company reporting: Methodology paper
47
Notes: 2004-2019 values applied to NEDC based factors. 2020 value is an average of uplifts applied to WLTP based factors.
5.17. The above uplifts have been applied to the ANPR weighted SMMT gCO2/km to give the ‘Real-World’ 2021 GHG Conversion factors. The average car conversion factors were calculated by weighting with the relative mileage of the different categories. This calculation utilised data from the UK GHG Inventory on the relative % total mileage by petrol and diesel cars. Overall, for petrol and diesel, this split in total annual mileage was 51.7% petrol and 48.3% diesel. This can be compared to the respective total registrations of the different vehicle types for 2004-2020, which were 57.6% petrol and 42.4% diesel.
5.18. Conversion factors for CH4 and N2O have been updated for all vehicle classes and are based on the emission factors from the UK GHGI. The emission factors used in the UK GHGI are based on COPERT 4 version 11 (EMISIA, 2019).
5.19. The final 2021 conversion factors for petrol and diesel passenger cars by engine size are presented in the ‘Passenger vehicles’ and ‘Business travel- land’ worksheets of the 2021 GHG Conversion factors set.
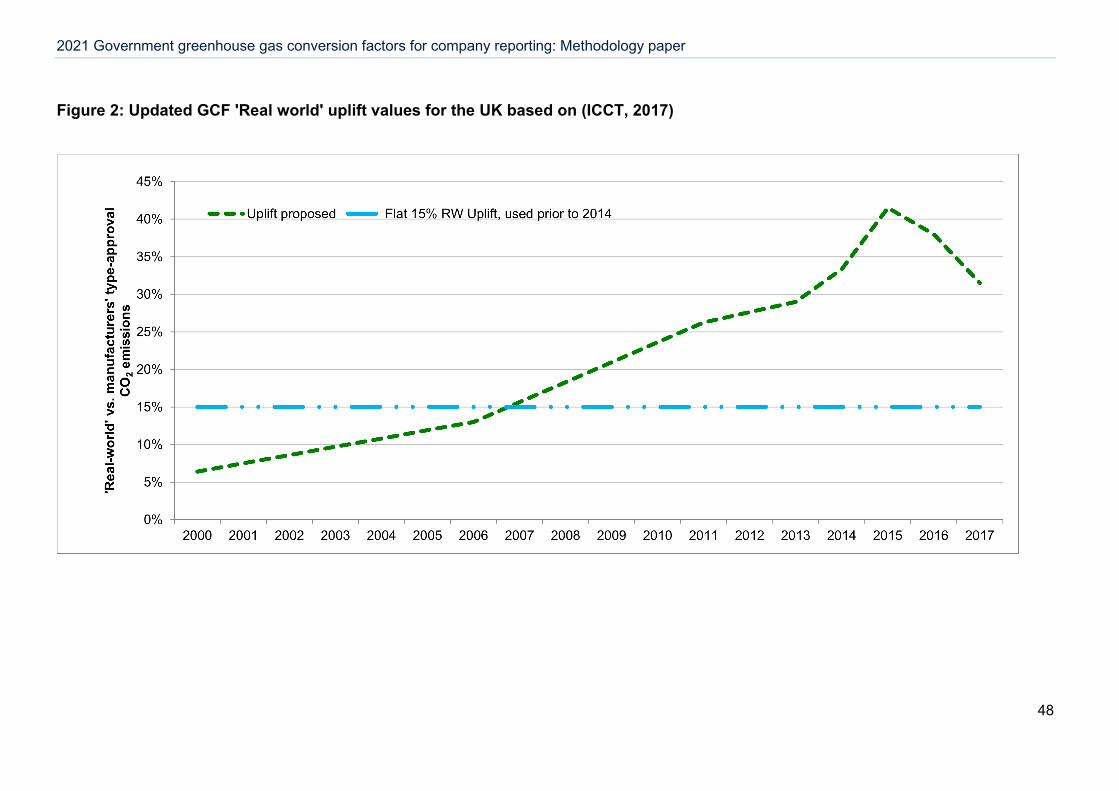
2021 Government greenhouse gas conversion factors for company reporting: Methodology paper
48
Figure 2: Updated GCF 'Real world' uplift values for the UK based on (ICCT, 2017)
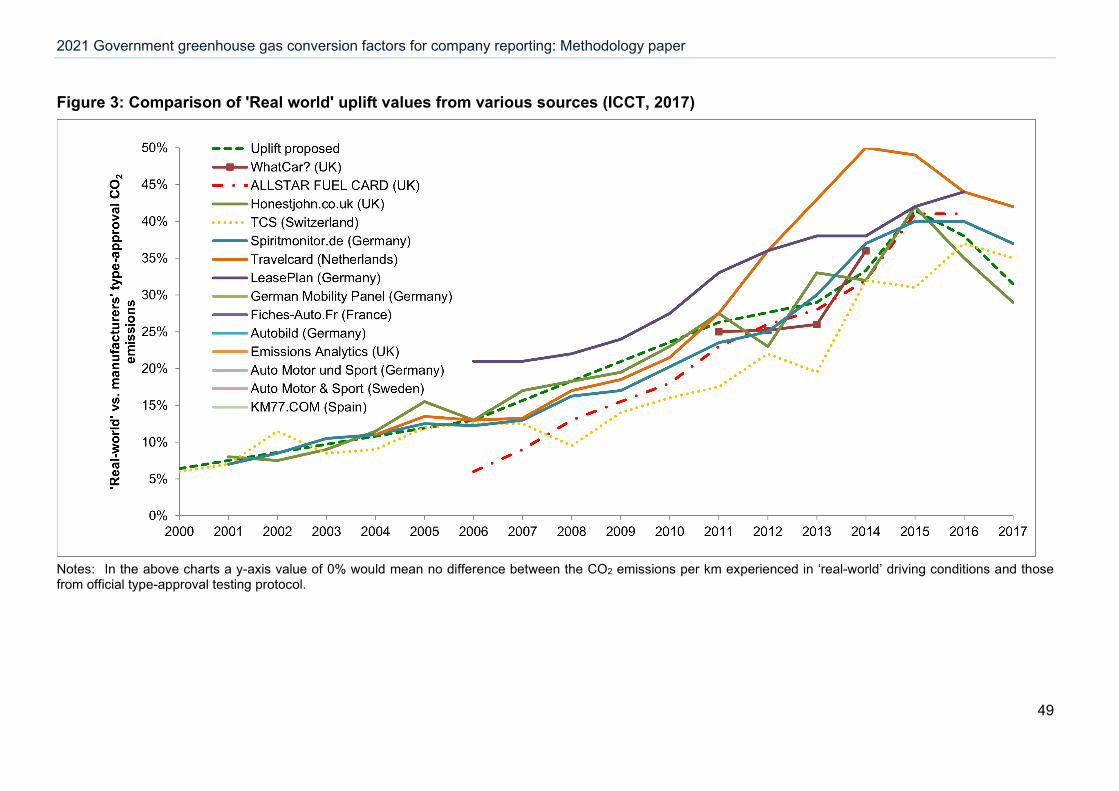
2021 Government greenhouse gas conversion factors for company reporting: Methodology paper
49
Figure 3: Comparison of 'Real world' uplift values from various sources (ICCT, 2017)
Notes: In the above charts a y-axis value of 0% would mean no difference between the CO2 emissions per km experienced in ‘real-world’ driving conditions and those from official type-approval testing protocol.
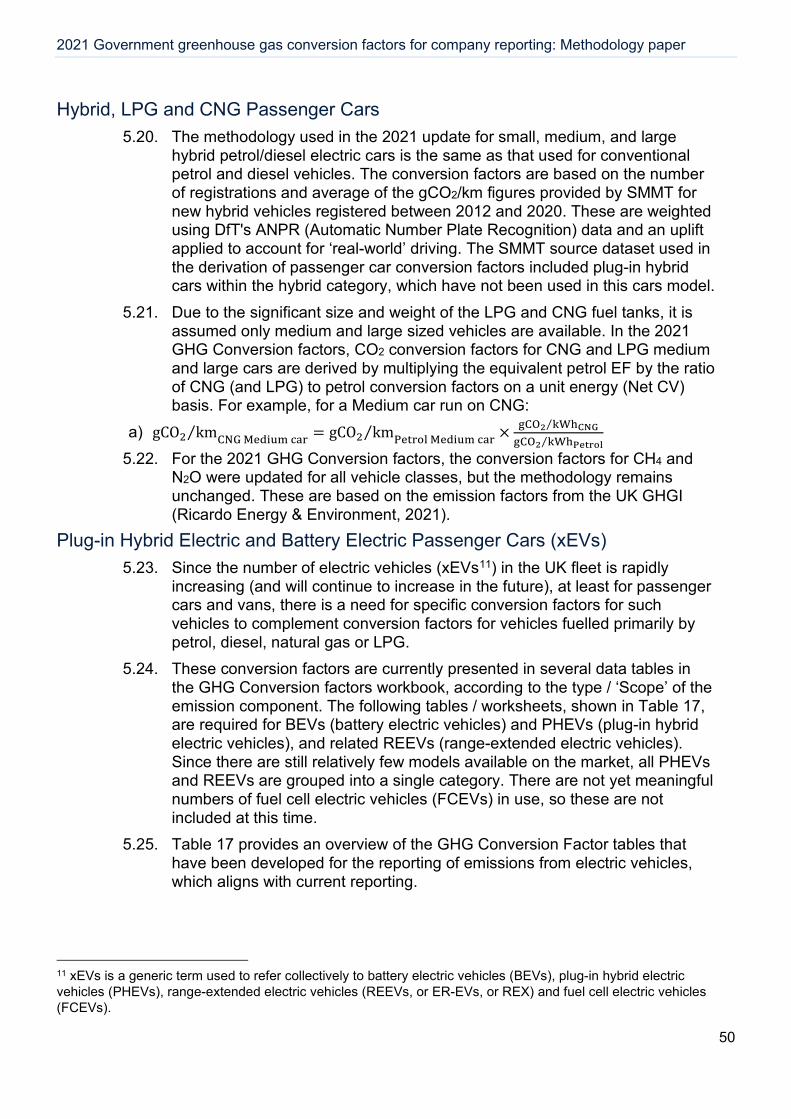
2021 Government greenhouse gas conversion factors for company reporting: Methodology paper
50
Hybrid, LPG and CNG Passenger Cars 5.20. The methodology used in the 2021 update for small, medium, and large
hybrid petrol/diesel electric cars is the same as that used for conventional petrol and diesel vehicles. The conversion factors are based on the number of registrations and average of the gCO2/km figures provided by SMMT for new hybrid vehicles registered between 2012 and 2020. These are weighted using DfT's ANPR (Automatic Number Plate Recognition) data and an uplift applied to account for ‘real-world’ driving. The SMMT source dataset used in the derivation of passenger car conversion factors included plug-in hybrid cars within the hybrid category, which have not been used in this cars model.
5.21. Due to the significant size and weight of the LPG and CNG fuel tanks, it is assumed only medium and large sized vehicles are available. In the 2021 GHG Conversion factors, CO2 conversion factors for CNG and LPG medium and large cars are derived by multiplying the equivalent petrol EF by the ratio of CNG (and LPG) to petrol conversion factors on a unit energy (Net CV) basis. For example, for a Medium car run on CNG:
a) gCO2 km⁄ CNG Medium car = gCO2 km⁄ Petrol Medium car × gCO2 kWhCNG⁄gCO2 kWhPetrol⁄
5.22. For the 2021 GHG Conversion factors, the conversion factors for CH4 and N2O were updated for all vehicle classes, but the methodology remains unchanged. These are based on the emission factors from the UK GHGI (Ricardo Energy & Environment, 2021).
Plug-in Hybrid Electric and Battery Electric Passenger Cars (xEVs) 5.23. Since the number of electric vehicles (xEVs11) in the UK fleet is rapidly
increasing (and will continue to increase in the future), at least for passenger cars and vans, there is a need for specific conversion factors for such vehicles to complement conversion factors for vehicles fuelled primarily by petrol, diesel, natural gas or LPG.
5.24. These conversion factors are currently presented in several data tables in the GHG Conversion factors workbook, according to the type / ‘Scope’ of the emission component. The following tables / worksheets, shown in Table 17, are required for BEVs (battery electric vehicles) and PHEVs (plug-in hybrid electric vehicles), and related REEVs (range-extended electric vehicles). Since there are still relatively few models available on the market, all PHEVs and REEVs are grouped into a single category. There are not yet meaningful numbers of fuel cell electric vehicles (FCEVs) in use, so these are not included at this time.
5.25. Table 17 provides an overview of the GHG Conversion Factor tables that have been developed for the reporting of emissions from electric vehicles, which aligns with current reporting.
11 xEVs is a generic term used to refer collectively to battery electric vehicles (BEVs), plug-in hybrid electric vehicles (PHEVs), range-extended electric vehicles (REEVs, or ER-EVs, or REX) and fuel cell electric vehicles (FCEVs).
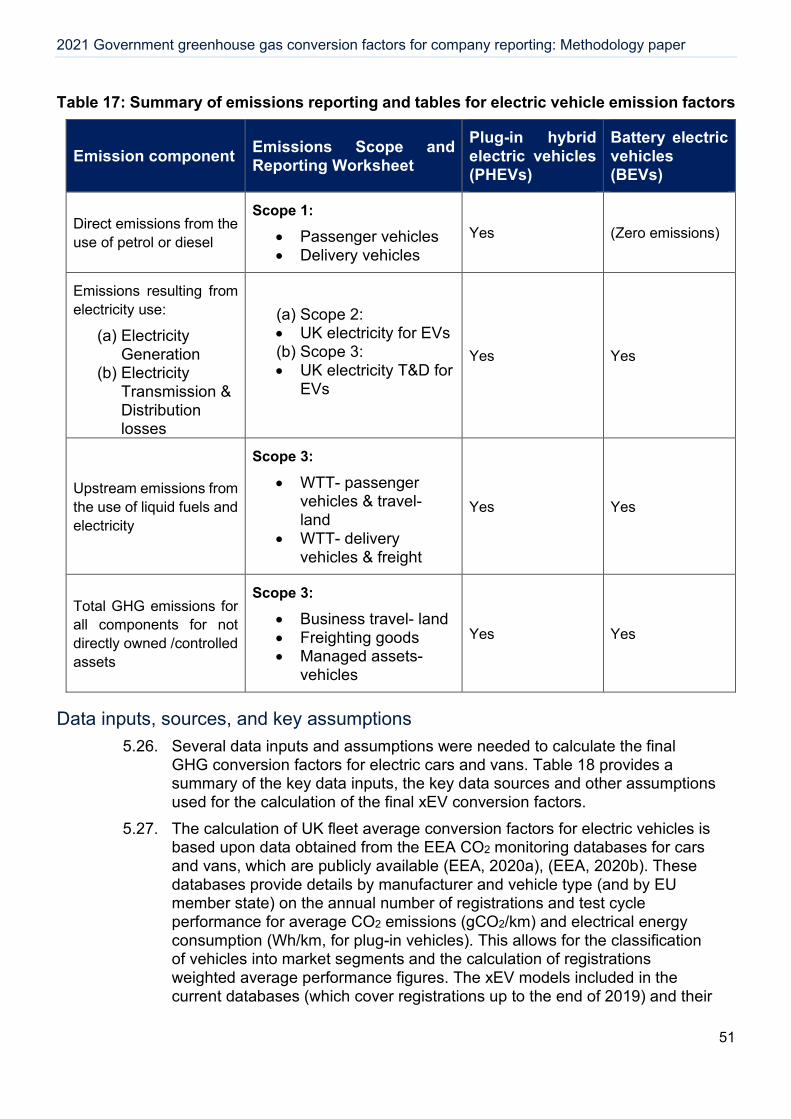
2021 Government greenhouse gas conversion factors for company reporting: Methodology paper
51
Table 17: Summary of emissions reporting and tables for electric vehicle emission factors
Emission component Emissions Scope and Reporting Worksheet
Plug-in hybrid electric vehicles (PHEVs)
Battery electric vehicles (BEVs)
Direct emissions from the use of petrol or diesel
Scope 1:
• Passenger vehicles • Delivery vehicles
Yes (Zero emissions)
Emissions resulting from electricity use:
(a) Electricity Generation
(b) Electricity Transmission & Distribution losses
(a) Scope 2: • UK electricity for EVs (b) Scope 3: • UK electricity T&D for
EVs
Yes Yes
Upstream emissions from the use of liquid fuels and electricity
Scope 3:
• WTT- passenger vehicles & travel- land
• WTT- delivery vehicles & freight
Yes Yes
Total GHG emissions for all components for not directly owned /controlled assets
Scope 3:
• Business travel- land • Freighting goods • Managed assets-
vehicles
Yes Yes
Data inputs, sources, and key assumptions 5.26. Several data inputs and assumptions were needed to calculate the final
GHG conversion factors for electric cars and vans. Table 18 provides a summary of the key data inputs, the key data sources and other assumptions used for the calculation of the final xEV conversion factors.
5.27. The calculation of UK fleet average conversion factors for electric vehicles is based upon data obtained from the EEA CO2 monitoring databases for cars and vans, which are publicly available (EEA, 2020a), (EEA, 2020b). These databases provide details by manufacturer and vehicle type (and by EU member state) on the annual number of registrations and test cycle performance for average CO2 emissions (gCO2/km) and electrical energy consumption (Wh/km, for plug-in vehicles). This allows for the classification of vehicles into market segments and the calculation of registrations weighted average performance figures. The xEV models included in the current databases (which cover registrations up to the end of 2019) and their
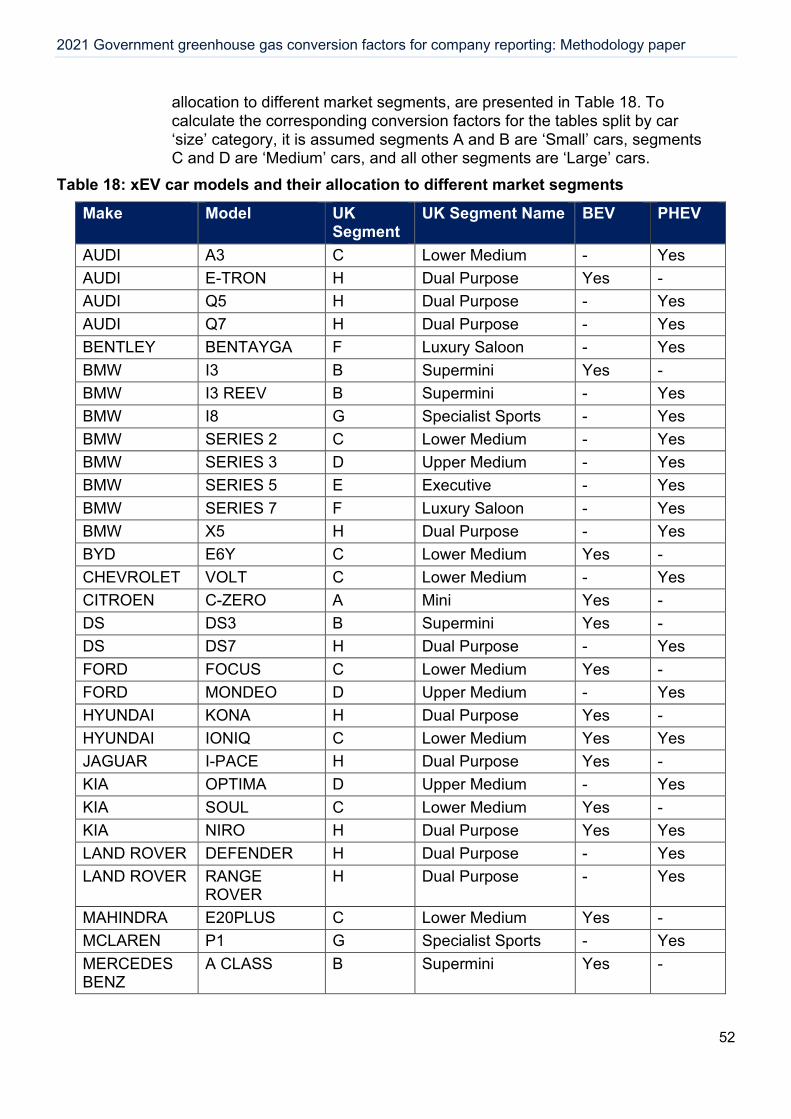
2021 Government greenhouse gas conversion factors for company reporting: Methodology paper
52
allocation to different market segments, are presented in Table 18. To calculate the corresponding conversion factors for the tables split by car ‘size’ category, it is assumed segments A and B are ‘Small’ cars, segments C and D are ‘Medium’ cars, and all other segments are ‘Large’ cars.
Table 18: xEV car models and their allocation to different market segments
Make Model UK Segment
UK Segment Name BEV PHEV
AUDI A3 C Lower Medium - Yes AUDI E-TRON H Dual Purpose Yes - AUDI Q5 H Dual Purpose - Yes AUDI Q7 H Dual Purpose - Yes BENTLEY BENTAYGA F Luxury Saloon - Yes BMW I3 B Supermini Yes - BMW I3 REEV B Supermini - Yes BMW I8 G Specialist Sports - Yes BMW SERIES 2 C Lower Medium - Yes BMW SERIES 3 D Upper Medium - Yes BMW SERIES 5 E Executive - Yes BMW SERIES 7 F Luxury Saloon - Yes BMW X5 H Dual Purpose - Yes BYD E6Y C Lower Medium Yes - CHEVROLET VOLT C Lower Medium - Yes CITROEN C-ZERO A Mini Yes - DS DS3 B Supermini Yes - DS DS7 H Dual Purpose - Yes FORD FOCUS C Lower Medium Yes - FORD MONDEO D Upper Medium - Yes HYUNDAI KONA H Dual Purpose Yes - HYUNDAI IONIQ C Lower Medium Yes Yes JAGUAR I-PACE H Dual Purpose Yes - KIA OPTIMA D Upper Medium - Yes KIA SOUL C Lower Medium Yes - KIA NIRO H Dual Purpose Yes Yes LAND ROVER DEFENDER H Dual Purpose - Yes LAND ROVER RANGE
ROVER H Dual Purpose - Yes
MAHINDRA E20PLUS C Lower Medium Yes - MCLAREN P1 G Specialist Sports - Yes MERCEDES BENZ
A CLASS B Supermini Yes -
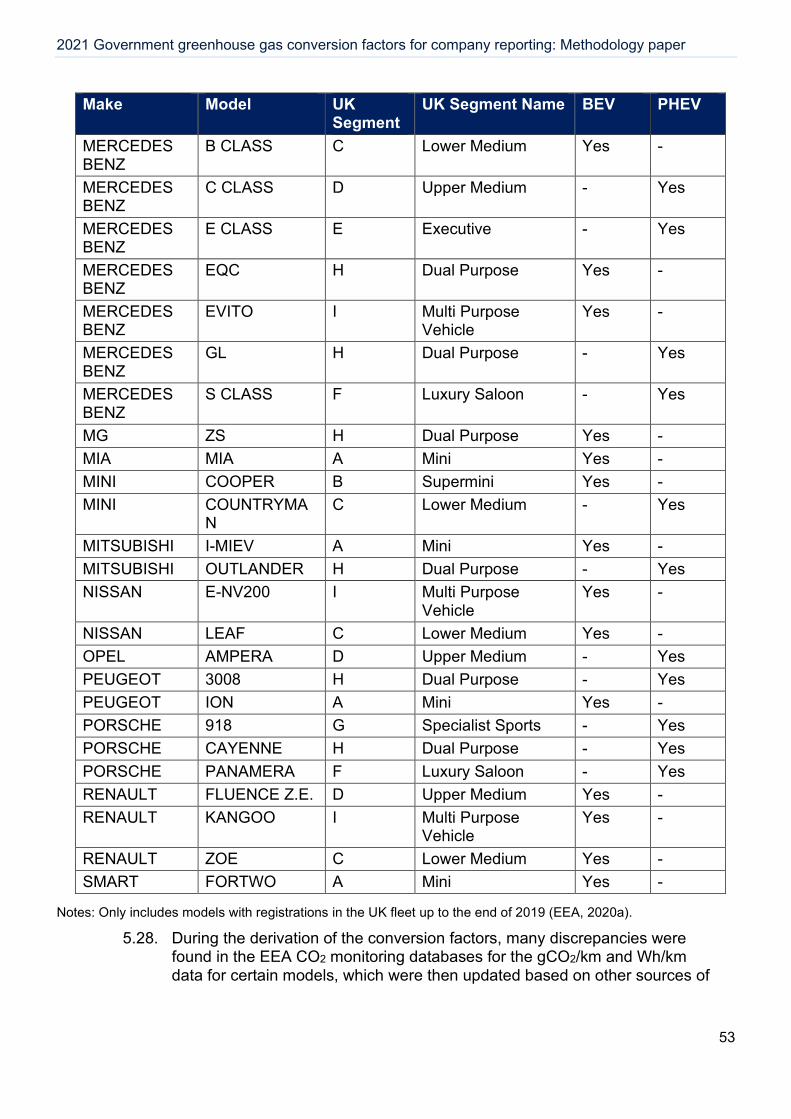
2021 Government greenhouse gas conversion factors for company reporting: Methodology paper
53
Make Model UK Segment
UK Segment Name BEV PHEV
MERCEDES BENZ
B CLASS C Lower Medium Yes -
MERCEDES BENZ
C CLASS D Upper Medium - Yes
MERCEDES BENZ
E CLASS E Executive - Yes
MERCEDES BENZ
EQC H Dual Purpose Yes -
MERCEDES BENZ
EVITO I Multi Purpose Vehicle
Yes -
MERCEDES BENZ
GL H Dual Purpose - Yes
MERCEDES BENZ
S CLASS F Luxury Saloon - Yes
MG ZS H Dual Purpose Yes - MIA MIA A Mini Yes - MINI COOPER B Supermini Yes - MINI COUNTRYMA
N C Lower Medium - Yes
MITSUBISHI I-MIEV A Mini Yes - MITSUBISHI OUTLANDER H Dual Purpose - Yes NISSAN E-NV200 I Multi Purpose
Vehicle Yes -
NISSAN LEAF C Lower Medium Yes - OPEL AMPERA D Upper Medium - Yes PEUGEOT 3008 H Dual Purpose - Yes PEUGEOT ION A Mini Yes - PORSCHE 918 G Specialist Sports - Yes PORSCHE CAYENNE H Dual Purpose - Yes PORSCHE PANAMERA F Luxury Saloon - Yes RENAULT FLUENCE Z.E. D Upper Medium Yes - RENAULT KANGOO I Multi Purpose
Vehicle Yes -
RENAULT ZOE C Lower Medium Yes - SMART FORTWO A Mini Yes -
Notes: Only includes models with registrations in the UK fleet up to the end of 2019 (EEA, 2020a).
5.28. During the derivation of the conversion factors, many discrepancies were found in the EEA CO2 monitoring databases for the gCO2/km and Wh/km data for certain models, which were then updated based on other sources of
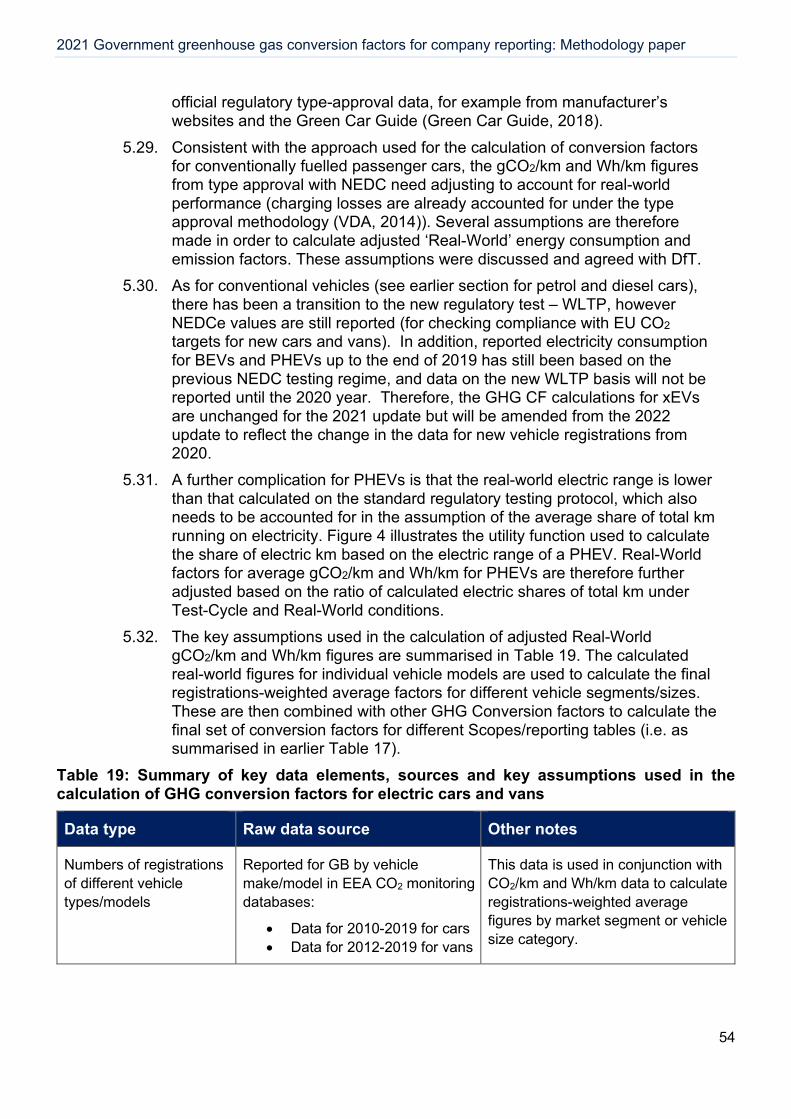
2021 Government greenhouse gas conversion factors for company reporting: Methodology paper
54
official regulatory type-approval data, for example from manufacturer’s websites and the Green Car Guide (Green Car Guide, 2018).
5.29. Consistent with the approach used for the calculation of conversion factors for conventionally fuelled passenger cars, the gCO2/km and Wh/km figures from type approval with NEDC need adjusting to account for real-world performance (charging losses are already accounted for under the type approval methodology (VDA, 2014)). Several assumptions are therefore made in order to calculate adjusted ‘Real-World’ energy consumption and emission factors. These assumptions were discussed and agreed with DfT.
5.30. As for conventional vehicles (see earlier section for petrol and diesel cars), there has been a transition to the new regulatory test – WLTP, however NEDCe values are still reported (for checking compliance with EU CO2 targets for new cars and vans). In addition, reported electricity consumption for BEVs and PHEVs up to the end of 2019 has still been based on the previous NEDC testing regime, and data on the new WLTP basis will not be reported until the 2020 year. Therefore, the GHG CF calculations for xEVs are unchanged for the 2021 update but will be amended from the 2022 update to reflect the change in the data for new vehicle registrations from 2020.
5.31. A further complication for PHEVs is that the real-world electric range is lower than that calculated on the standard regulatory testing protocol, which also needs to be accounted for in the assumption of the average share of total km running on electricity. Figure 4 illustrates the utility function used to calculate the share of electric km based on the electric range of a PHEV. Real-World factors for average gCO2/km and Wh/km for PHEVs are therefore further adjusted based on the ratio of calculated electric shares of total km under Test-Cycle and Real-World conditions.
5.32. The key assumptions used in the calculation of adjusted Real-World gCO2/km and Wh/km figures are summarised in Table 19. The calculated real-world figures for individual vehicle models are used to calculate the final registrations-weighted average factors for different vehicle segments/sizes. These are then combined with other GHG Conversion factors to calculate the final set of conversion factors for different Scopes/reporting tables (i.e. as summarised in earlier Table 17).
Table 19: Summary of key data elements, sources and key assumptions used in the calculation of GHG conversion factors for electric cars and vans
Data type Raw data source Other notes
Numbers of registrations of different vehicle types/models
Reported for GB by vehicle make/model in EEA CO2 monitoring databases:
• Data for 2010-2019 for cars • Data for 2012-2019 for vans
This data is used in conjunction with CO2/km and Wh/km data to calculate registrations-weighted average figures by market segment or vehicle size category.
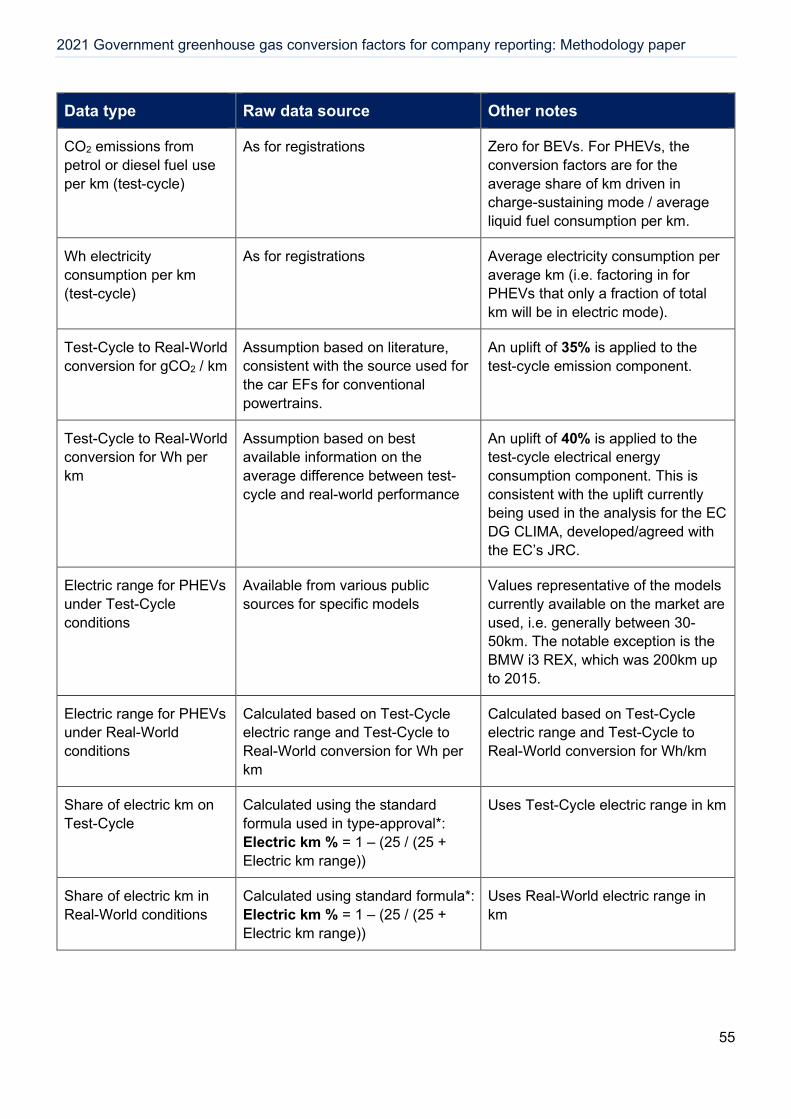
2021 Government greenhouse gas conversion factors for company reporting: Methodology paper
55
Data type Raw data source Other notes
CO2 emissions from petrol or diesel fuel use per km (test-cycle)
As for registrations Zero for BEVs. For PHEVs, the conversion factors are for the average share of km driven in charge-sustaining mode / average liquid fuel consumption per km.
Wh electricity consumption per km (test-cycle)
As for registrations Average electricity consumption per average km (i.e. factoring in for PHEVs that only a fraction of total km will be in electric mode).
Test-Cycle to Real-World conversion for gCO2 / km
Assumption based on literature, consistent with the source used for the car EFs for conventional powertrains.
An uplift of 35% is applied to the test-cycle emission component.
Test-Cycle to Real-World conversion for Wh per km
Assumption based on best available information on the average difference between test-cycle and real-world performance
An uplift of 40% is applied to the test-cycle electrical energy consumption component. This is consistent with the uplift currently being used in the analysis for the EC DG CLIMA, developed/agreed with the EC’s JRC.
Electric range for PHEVs under Test-Cycle conditions
Available from various public sources for specific models
Values representative of the models currently available on the market are used, i.e. generally between 30-50km. The notable exception is the BMW i3 REX, which was 200km up to 2015.
Electric range for PHEVs under Real-World conditions
Calculated based on Test-Cycle electric range and Test-Cycle to Real-World conversion for Wh per km
Calculated based on Test-Cycle electric range and Test-Cycle to Real-World conversion for Wh/km
Share of electric km on Test-Cycle
Calculated using the standard formula used in type-approval*: Electric km % = 1 – (25 / (25 + Electric km range))
Uses Test-Cycle electric range in km
Share of electric km in Real-World conditions
Calculated using standard formula*: Electric km % = 1 – (25 / (25 + Electric km range))
Uses Real-World electric range in km
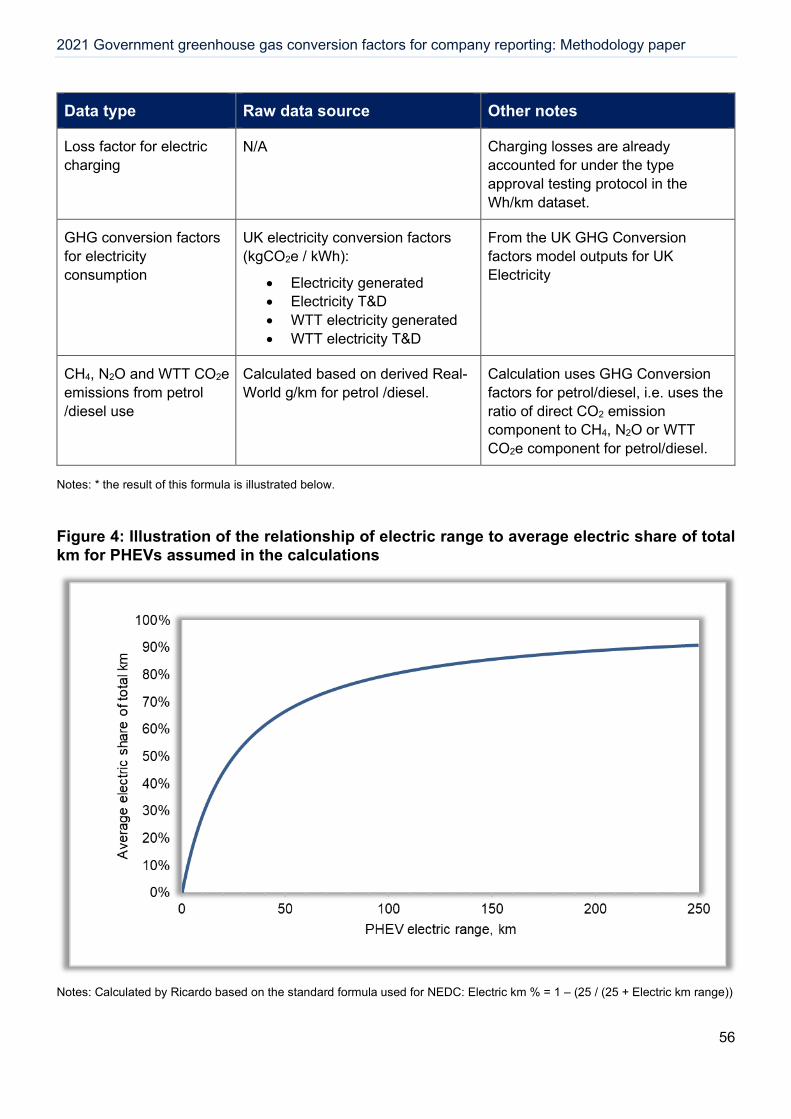
2021 Government greenhouse gas conversion factors for company reporting: Methodology paper
56
Data type Raw data source Other notes
Loss factor for electric charging
N/A Charging losses are already accounted for under the type approval testing protocol in the Wh/km dataset.
GHG conversion factors for electricity consumption
UK electricity conversion factors (kgCO2e / kWh):
• Electricity generated • Electricity T&D • WTT electricity generated • WTT electricity T&D
From the UK GHG Conversion factors model outputs for UK Electricity
CH4, N2O and WTT CO2e emissions from petrol /diesel use
Calculated based on derived Real-World g/km for petrol /diesel.
Calculation uses GHG Conversion factors for petrol/diesel, i.e. uses the ratio of direct CO2 emission component to CH4, N2O or WTT CO2e component for petrol/diesel.
Notes: * the result of this formula is illustrated below.
Figure 4: Illustration of the relationship of electric range to average electric share of total km for PHEVs assumed in the calculations
Notes: Calculated by Ricardo based on the standard formula used for NEDC: Electric km % = 1 – (25 / (25 + Electric km range))
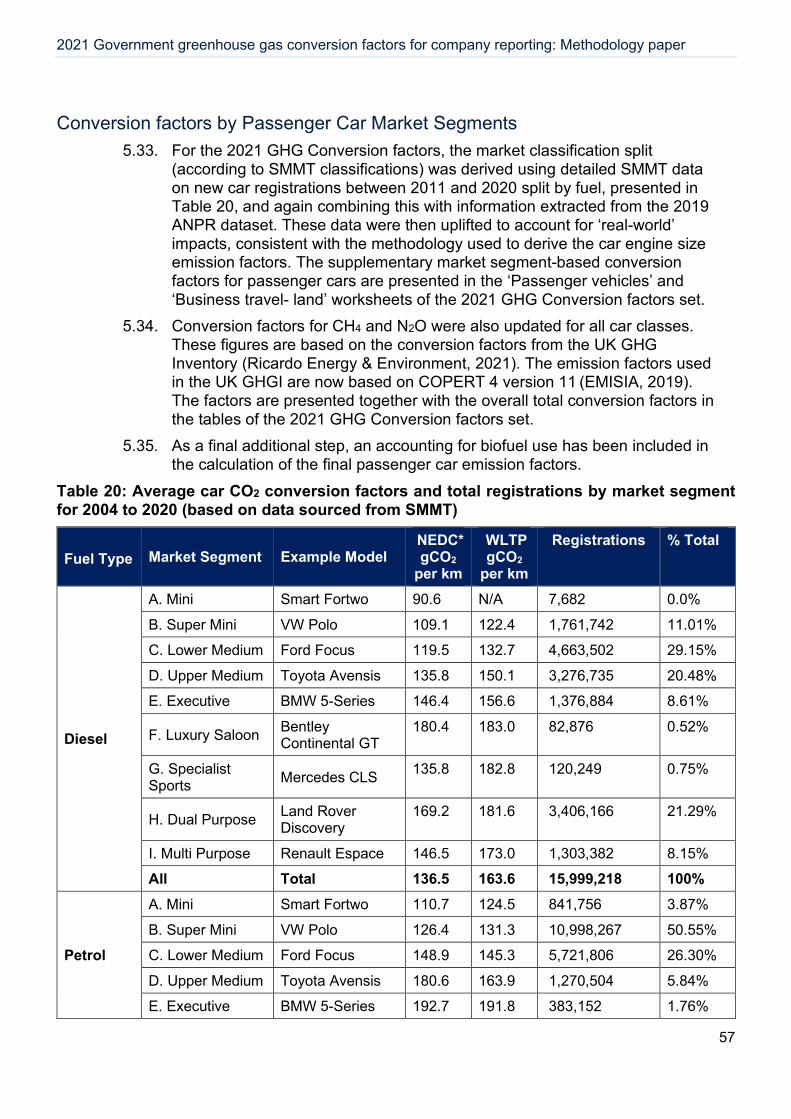
2021 Government greenhouse gas conversion factors for company reporting: Methodology paper
57
Conversion factors by Passenger Car Market Segments 5.33. For the 2021 GHG Conversion factors, the market classification split
(according to SMMT classifications) was derived using detailed SMMT data on new car registrations between 2011 and 2020 split by fuel, presented in Table 20, and again combining this with information extracted from the 2019 ANPR dataset. These data were then uplifted to account for ‘real-world’ impacts, consistent with the methodology used to derive the car engine size emission factors. The supplementary market segment-based conversion factors for passenger cars are presented in the ‘Passenger vehicles’ and ‘Business travel- land’ worksheets of the 2021 GHG Conversion factors set.
5.34. Conversion factors for CH4 and N2O were also updated for all car classes. These figures are based on the conversion factors from the UK GHG Inventory (Ricardo Energy & Environment, 2021). The emission factors used in the UK GHGI are now based on COPERT 4 version 11 (EMISIA, 2019). The factors are presented together with the overall total conversion factors in the tables of the 2021 GHG Conversion factors set.
5.35. As a final additional step, an accounting for biofuel use has been included in the calculation of the final passenger car emission factors.
Table 20: Average car CO2 conversion factors and total registrations by market segment for 2004 to 2020 (based on data sourced from SMMT)
Fuel Type Market Segment Example Model NEDC* gCO2
per km
WLTP gCO2
per km
Registrations % Total
Diesel
A. Mini Smart Fortwo 90.6 N/A 7,682 0.0%
B. Super Mini VW Polo 109.1 122.4 1,761,742 11.01%
C. Lower Medium Ford Focus 119.5 132.7 4,663,502 29.15%
D. Upper Medium Toyota Avensis 135.8 150.1 3,276,735 20.48%
E. Executive BMW 5-Series 146.4 156.6 1,376,884 8.61%
F. Luxury Saloon Bentley Continental GT
180.4 183.0 82,876 0.52%
G. Specialist Sports Mercedes CLS 135.8 182.8 120,249 0.75%
H. Dual Purpose Land Rover Discovery
169.2 181.6 3,406,166 21.29%
I. Multi Purpose Renault Espace 146.5 173.0 1,303,382 8.15%
All Total 136.5 163.6 15,999,218 100%
Petrol
A. Mini Smart Fortwo 110.7 124.5 841,756 3.87%
B. Super Mini VW Polo 126.4 131.3 10,998,267 50.55%
C. Lower Medium Ford Focus 148.9 145.3 5,721,806 26.30%
D. Upper Medium Toyota Avensis 180.6 163.9 1,270,504 5.84%
E. Executive BMW 5-Series 192.7 191.8 383,152 1.76%
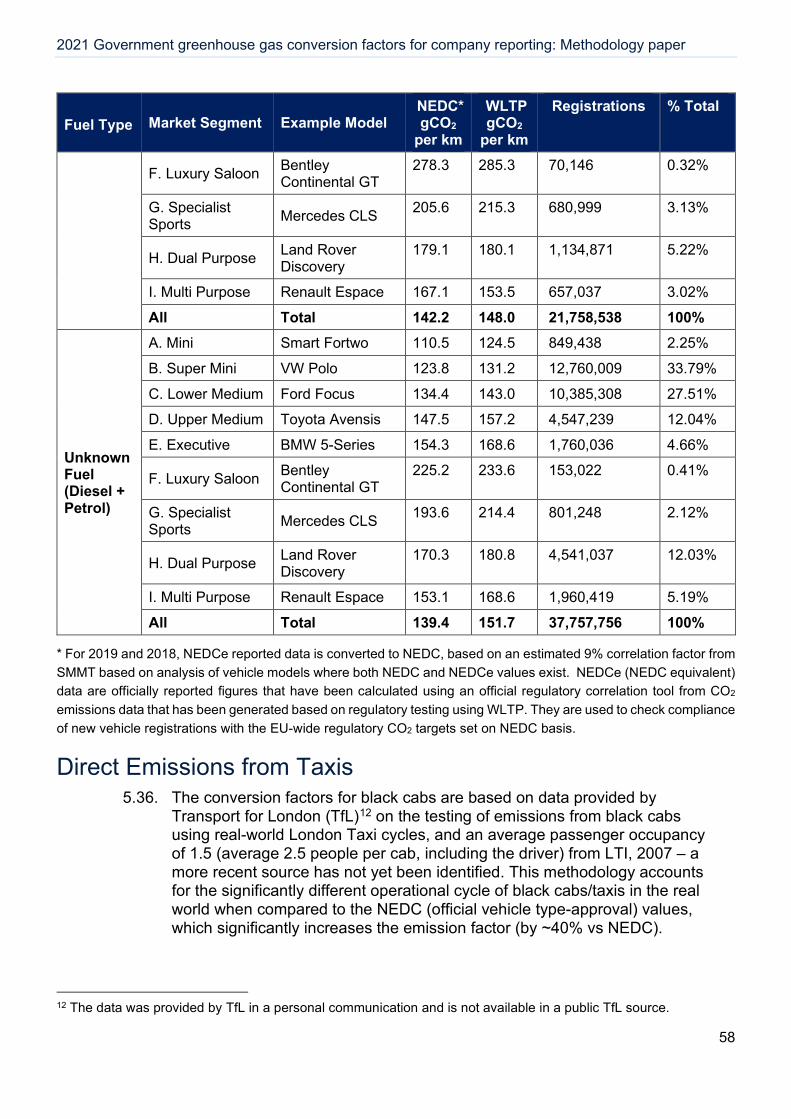
2021 Government greenhouse gas conversion factors for company reporting: Methodology paper
58
Fuel Type Market Segment Example Model NEDC* gCO2
per km
WLTP gCO2
per km
Registrations % Total
F. Luxury Saloon Bentley Continental GT
278.3 285.3 70,146 0.32%
G. Specialist Sports Mercedes CLS 205.6 215.3 680,999 3.13%
H. Dual Purpose Land Rover Discovery
179.1 180.1 1,134,871 5.22%
I. Multi Purpose Renault Espace 167.1 153.5 657,037 3.02%
All Total 142.2 148.0 21,758,538 100%
Unknown Fuel (Diesel + Petrol)
A. Mini Smart Fortwo 110.5 124.5 849,438 2.25%
B. Super Mini VW Polo 123.8 131.2 12,760,009 33.79%
C. Lower Medium Ford Focus 134.4 143.0 10,385,308 27.51%
D. Upper Medium Toyota Avensis 147.5 157.2 4,547,239 12.04%
E. Executive BMW 5-Series 154.3 168.6 1,760,036 4.66%
F. Luxury Saloon Bentley Continental GT
225.2 233.6 153,022 0.41%
G. Specialist Sports Mercedes CLS 193.6 214.4 801,248 2.12%
H. Dual Purpose Land Rover Discovery
170.3 180.8 4,541,037 12.03%
I. Multi Purpose Renault Espace 153.1 168.6 1,960,419 5.19%
All Total 139.4 151.7 37,757,756 100%
* For 2019 and 2018, NEDCe reported data is converted to NEDC, based on an estimated 9% correlation factor from SMMT based on analysis of vehicle models where both NEDC and NEDCe values exist. NEDCe (NEDC equivalent) data are officially reported figures that have been calculated using an official regulatory correlation tool from CO2 emissions data that has been generated based on regulatory testing using WLTP. They are used to check compliance of new vehicle registrations with the EU-wide regulatory CO2 targets set on NEDC basis.
Direct Emissions from Taxis 5.36. The conversion factors for black cabs are based on data provided by
Transport for London (TfL)12 on the testing of emissions from black cabs using real-world London Taxi cycles, and an average passenger occupancy of 1.5 (average 2.5 people per cab, including the driver) from LTI, 2007 – a more recent source has not yet been identified. This methodology accounts for the significantly different operational cycle of black cabs/taxis in the real world when compared to the NEDC (official vehicle type-approval) values, which significantly increases the emission factor (by ~40% vs NEDC).
12 The data was provided by TfL in a personal communication and is not available in a public TfL source.
2021 Government greenhouse gas conversion factors for company reporting: Methodology paper
59
5.37. The conversion factors (per passenger km) for regular taxis were estimated based on the average type-approval CO2 factors for medium and large cars, uplifted by the same factor as for black cabs (i.e. 40%, based on TfL data) to reflect the difference between the type-approval figures and those operating a real-world taxi cycle (i.e. based on different driving conditions to average car use), plus an assumed average passenger occupancy of 1.4 (L.E.K. Consulting, 2002).
5.38. Conversion factors per passenger km for taxis and black cabs are presented in the ‘Business travel- land’ worksheet of the 2021 GHG Conversion factors set. The base conversion factors per vehicle km are also presented in the ‘Business travel- land’ worksheet of the 2021 GHG Conversion factors set.
5.39. Conversion factors for CH4 and N2O have been updated for all taxis for the 2021 update. These figures are based on the conversion factors for diesel cars from the latest UK GHG Inventory (Ricardo Energy & Environment, 2021) and are presented together with the overall total conversion factors in the ‘Business travel- land’ worksheet of the 2021 GHG Conversion factors set.
5.40. It should be noted that the current conversion factors for taxis still do not account for emissions spent from “cruising” for fares. Currently, robust data sources do not exist that could inform such an "empty running" factor. If suitably robust sources are identified in the future, the methodology for taxis may be revisited and revised in a future update to account for this.
Direct Emissions from Vans/Light Goods Vehicles (LGVs) 5.41. Average conversion factors by fuel, for vans/light good vehicles (LGVs: N1
vehicles, vans up to 3.5 tonnes gross vehicle weight - GVW) and by size (Class I, II or III) are presented in Table 21 and in the “Delivery vehicles” worksheet of the 2021 GHG Conversion factors set.
5.42. Conversion factors for petrol and diesel vans/LGVs are based upon emission factors and vehicle km for average sized LGVs from the UK GHGI for 2019. CO2 emissions factors for different size classes are estimated relative to quantitative analysis of (EEA, 2020b) dataset, as outlined below in more detail. These conversion factors are further uplifted by 15% to represent ‘real-world’ emissions (i.e. also factoring in typical vehicle loading versus unloaded test-cycle based results), consistent with the previous approach used for cars, and agreed with DfT in the absence of a similar time-series dataset of ‘real-world’ vs type-approval emissions from vans (see earlier section on passenger cars). In a future update, it is envisaged this uplift will be further reviewed.
5.43. The dataset used to allocate different vehicles to each van class is based on a reference weight (approximately equivalent to kerb weight plus 60kg) provided in the EEA new van CO2 monitoring database (EEA, 2020b). The dataset holds a variety of information about new vans registered between 2012 and 2019 (the most recent year available) and is used to derive the split of petrol and diesel van stock between size classes, as well as the CO2 emissions performance of different petrol/diesel van size categories.
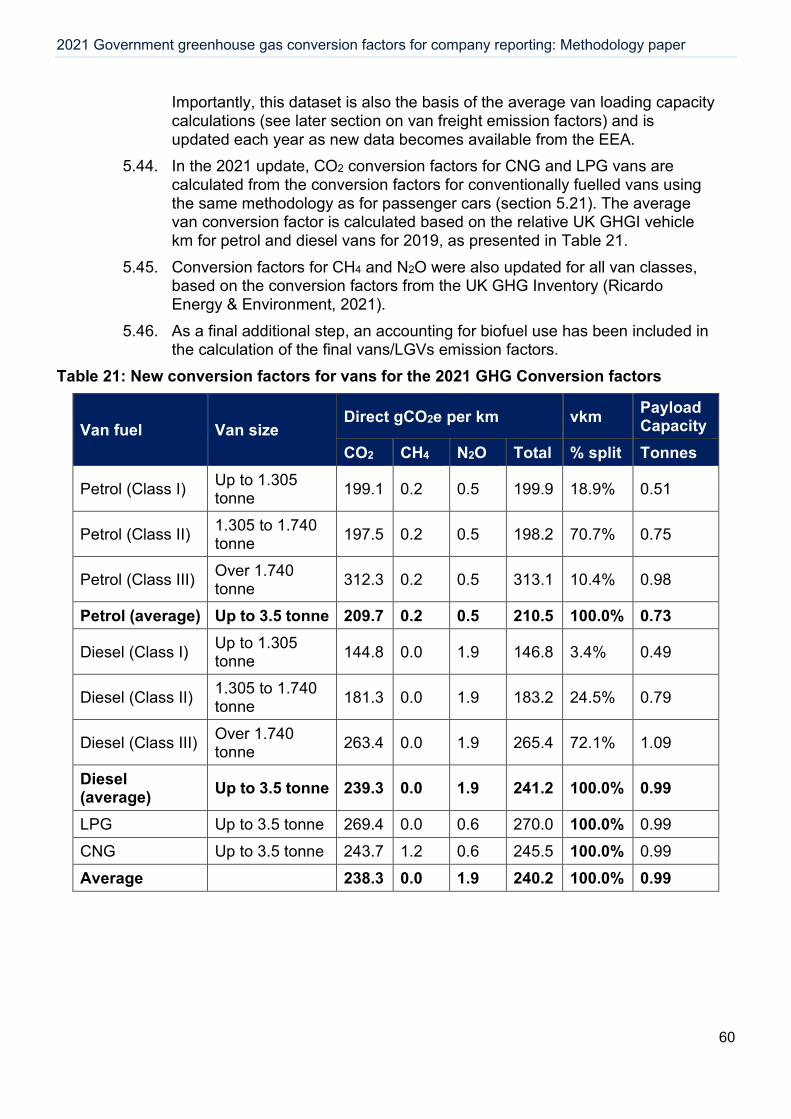
2021 Government greenhouse gas conversion factors for company reporting: Methodology paper
60
Importantly, this dataset is also the basis of the average van loading capacity calculations (see later section on van freight emission factors) and is updated each year as new data becomes available from the EEA.
5.44. In the 2021 update, CO2 conversion factors for CNG and LPG vans are calculated from the conversion factors for conventionally fuelled vans using the same methodology as for passenger cars (section 5.21). The average van conversion factor is calculated based on the relative UK GHGI vehicle km for petrol and diesel vans for 2019, as presented in Table 21.
5.45. Conversion factors for CH4 and N2O were also updated for all van classes, based on the conversion factors from the UK GHG Inventory (Ricardo Energy & Environment, 2021).
5.46. As a final additional step, an accounting for biofuel use has been included in the calculation of the final vans/LGVs emission factors.
Table 21: New conversion factors for vans for the 2021 GHG Conversion factors
Van fuel Van size Direct gCO2e per km vkm Payload
Capacity CO2 CH4 N2O Total % split Tonnes
Petrol (Class I) Up to 1.305 tonne 199.1 0.2 0.5 199.9 18.9% 0.51
Petrol (Class II) 1.305 to 1.740 tonne 197.5 0.2 0.5 198.2 70.7% 0.75
Petrol (Class III) Over 1.740 tonne 312.3 0.2 0.5 313.1 10.4% 0.98
Petrol (average) Up to 3.5 tonne 209.7 0.2 0.5 210.5 100.0% 0.73
Diesel (Class I) Up to 1.305 tonne 144.8 0.0 1.9 146.8 3.4% 0.49
Diesel (Class II) 1.305 to 1.740 tonne 181.3 0.0 1.9 183.2 24.5% 0.79
Diesel (Class III) Over 1.740 tonne 263.4 0.0 1.9 265.4 72.1% 1.09
Diesel (average) Up to 3.5 tonne 239.3 0.0 1.9 241.2 100.0% 0.99
LPG Up to 3.5 tonne 269.4 0.0 0.6 270.0 100.0% 0.99 CNG Up to 3.5 tonne 243.7 1.2 0.6 245.5 100.0% 0.99 Average 238.3 0.0 1.9 240.2 100.0% 0.99
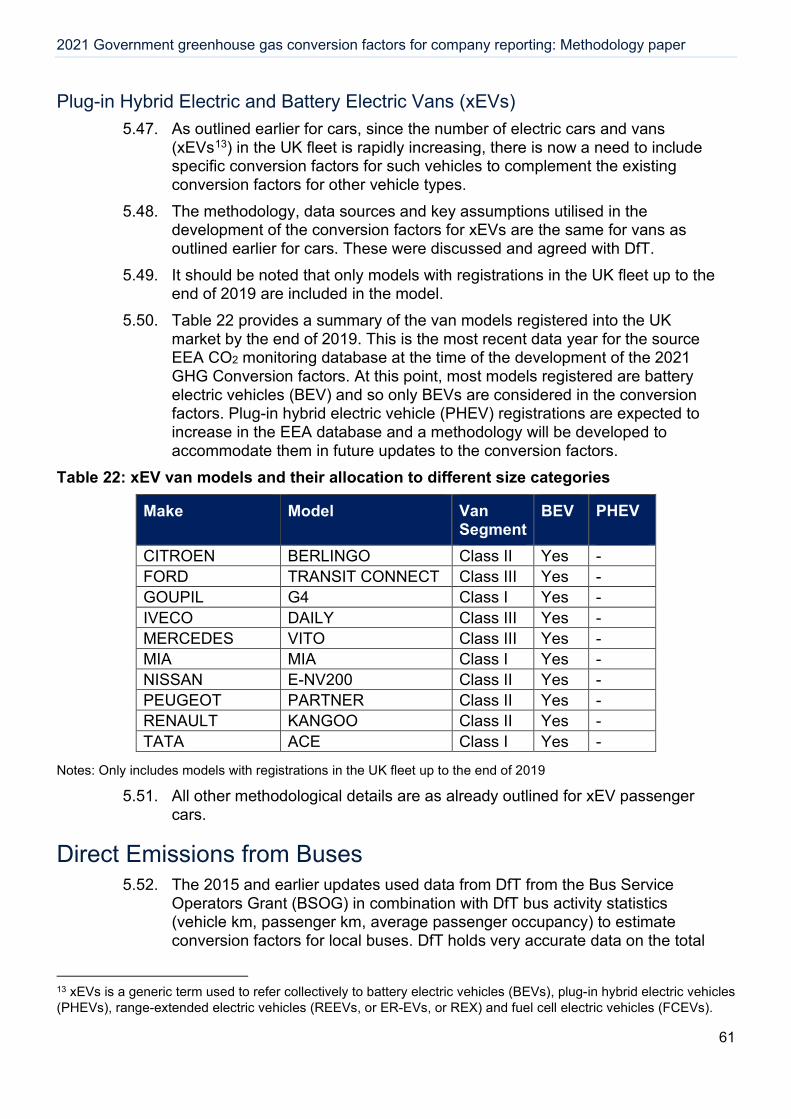
2021 Government greenhouse gas conversion factors for company reporting: Methodology paper
61
Plug-in Hybrid Electric and Battery Electric Vans (xEVs) 5.47. As outlined earlier for cars, since the number of electric cars and vans
(xEVs13) in the UK fleet is rapidly increasing, there is now a need to include specific conversion factors for such vehicles to complement the existing conversion factors for other vehicle types.
5.48. The methodology, data sources and key assumptions utilised in the development of the conversion factors for xEVs are the same for vans as outlined earlier for cars. These were discussed and agreed with DfT.
5.49. It should be noted that only models with registrations in the UK fleet up to the end of 2019 are included in the model.
5.50. Table 22 provides a summary of the van models registered into the UK market by the end of 2019. This is the most recent data year for the source EEA CO2 monitoring database at the time of the development of the 2021 GHG Conversion factors. At this point, most models registered are battery electric vehicles (BEV) and so only BEVs are considered in the conversion factors. Plug-in hybrid electric vehicle (PHEV) registrations are expected to increase in the EEA database and a methodology will be developed to accommodate them in future updates to the conversion factors.
Table 22: xEV van models and their allocation to different size categories
Make Model Van Segment
BEV PHEV
CITROEN BERLINGO Class II Yes - FORD TRANSIT CONNECT Class III Yes - GOUPIL G4 Class I Yes - IVECO DAILY Class III Yes - MERCEDES VITO Class III Yes - MIA MIA Class I Yes - NISSAN E-NV200 Class II Yes - PEUGEOT PARTNER Class II Yes - RENAULT KANGOO Class II Yes - TATA ACE Class I Yes -
Notes: Only includes models with registrations in the UK fleet up to the end of 2019
5.51. All other methodological details are as already outlined for xEV passenger cars.
Direct Emissions from Buses 5.52. The 2015 and earlier updates used data from DfT from the Bus Service
Operators Grant (BSOG) in combination with DfT bus activity statistics (vehicle km, passenger km, average passenger occupancy) to estimate conversion factors for local buses. DfT holds very accurate data on the total
13 xEVs is a generic term used to refer collectively to battery electric vehicles (BEVs), plug-in hybrid electric vehicles (PHEVs), range-extended electric vehicles (REEVs, or ER-EVs, or REX) and fuel cell electric vehicles (FCEVs).

2021 Government greenhouse gas conversion factors for company reporting: Methodology paper
62
amount of money provided to bus service operators under the scheme, which provides a fixed amount of financial support per unit of fuel consumed. Therefore, the total amount of fuel consumed (and hence CO2 emissions) could be calculated from this, which when combined with DfT statistics on total vehicle km, bus occupancy and passenger km allow the calculation of emission factors14.
5.53. From the 2016 update onwards, it was necessary to make some methodological changes to the calculations due to changes in the Scope/coverage of the underlying DfT datasets, which include:
a) BSOG data are now only available for commercial services, and not also for local authority supported services.
b) BSOG data are now only available for England, outside of London. Data are no longer available for London, due to a difference in how funding for the city is managed/provided, nor for other parts of the UK.
5.54. The conversion factors for buses account for additional direct CO2 emissions from the use of selective catalytic reduction (SCR). This technology uses a urea solution (also known as ‘AdBlue’) to effectively remove NOx and NO2 from diesel engines’ exhaust gases; this process occurs over a specially formulated catalyst. The urea solution is injected into the vehicles’ exhaust system before harmful NOx emissions are generated from the tail pipe. When the fuel is burnt, urea solution is injected into the SCR catalyst to convert the NOx into a less harmful mixture of nitrogen and water vapour; small amounts of carbon dioxide are also produced by this reaction. Emissions from the consumption of urea in buses have been included in the estimates for overall CO2 conversion factors for buses. A summary of the key assumptions used in the calculation of emissions from urea is provided in the following Table 23. These are based on assumptions in the EMEP/EEA Emissions Inventory Guidebook (EEA, 2019).
Table 23: Key assumptions used in the calculation of CO2 emissions from Urea (aka ‘AdBlue’) use
CO2 EF for urea consumption (kgCO2
/kg urea solution)1
Percentage of vehicles using urea
Urea consumption rate as a percentage of fuel consumed
by vehicles using urea Euro IV 0.238 75% 4%
Euro V 0.238 75% 6%
Euro VI 0.238 100% 3.5%
Notes: 1Assumes 32.5% (by mass) aqueous solution of urea
5.55. Briefly, the main calculation for local buses can be summarised as follows:
14 The robustness of the BSOG data has reduced over the years because of the changes to the way BSOG is paid to operators and local authorities. Approximations have been made in recent update years where data was not available (based on previous year data) and a revised methodology has commenced from 2016.
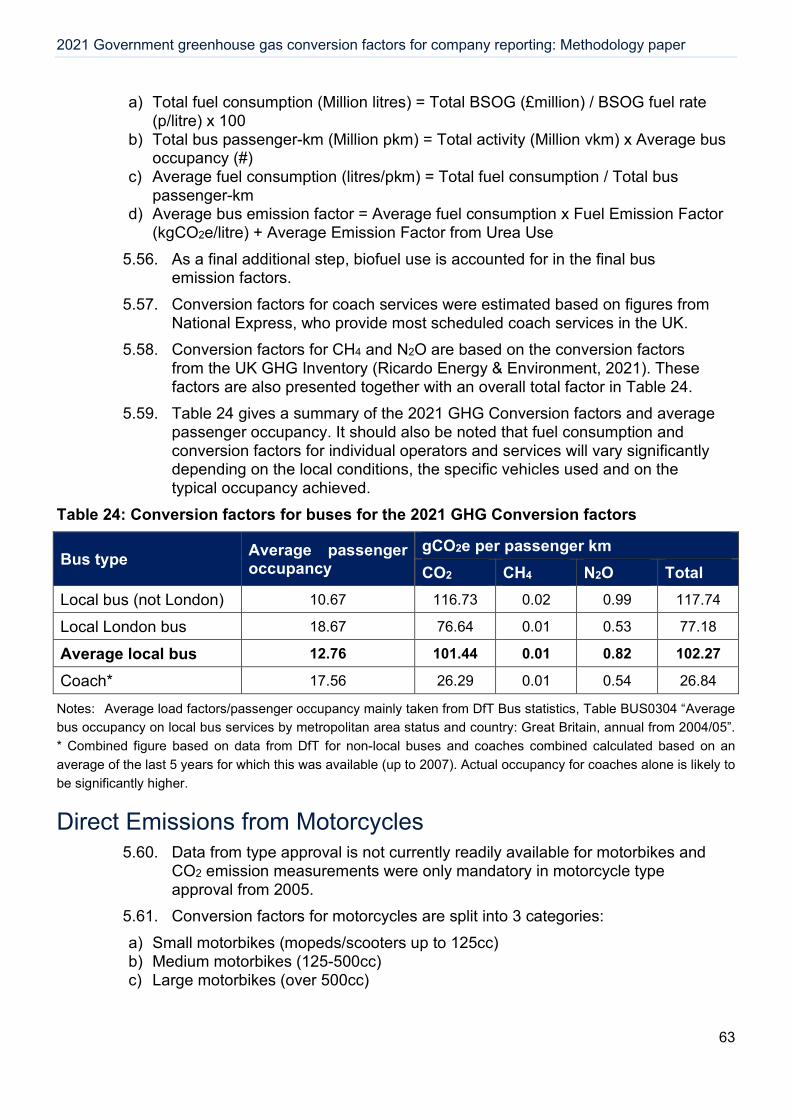
2021 Government greenhouse gas conversion factors for company reporting: Methodology paper
63
a) Total fuel consumption (Million litres) = Total BSOG (£million) / BSOG fuel rate (p/litre) x 100
b) Total bus passenger-km (Million pkm) = Total activity (Million vkm) x Average bus occupancy (#)
c) Average fuel consumption (litres/pkm) = Total fuel consumption / Total bus passenger-km
d) Average bus emission factor = Average fuel consumption x Fuel Emission Factor (kgCO2e/litre) + Average Emission Factor from Urea Use
5.56. As a final additional step, biofuel use is accounted for in the final bus emission factors.
5.57. Conversion factors for coach services were estimated based on figures from National Express, who provide most scheduled coach services in the UK.
5.58. Conversion factors for CH4 and N2O are based on the conversion factors from the UK GHG Inventory (Ricardo Energy & Environment, 2021). These factors are also presented together with an overall total factor in Table 24.
5.59. Table 24 gives a summary of the 2021 GHG Conversion factors and average passenger occupancy. It should also be noted that fuel consumption and conversion factors for individual operators and services will vary significantly depending on the local conditions, the specific vehicles used and on the typical occupancy achieved.
Table 24: Conversion factors for buses for the 2021 GHG Conversion factors
Bus type Average passenger occupancy
gCO2e per passenger km CO2 CH4 N2O Total
Local bus (not London) 10.67 116.73 0.02 0.99 117.74 Local London bus 18.67 76.64 0.01 0.53 77.18 Average local bus 12.76 101.44 0.01 0.82 102.27 Coach* 17.56 26.29 0.01 0.54 26.84 Notes: Average load factors/passenger occupancy mainly taken from DfT Bus statistics, Table BUS0304 “Average bus occupancy on local bus services by metropolitan area status and country: Great Britain, annual from 2004/05”. * Combined figure based on data from DfT for non-local buses and coaches combined calculated based on an average of the last 5 years for which this was available (up to 2007). Actual occupancy for coaches alone is likely to be significantly higher.
Direct Emissions from Motorcycles 5.60. Data from type approval is not currently readily available for motorbikes and
CO2 emission measurements were only mandatory in motorcycle type approval from 2005.
5.61. Conversion factors for motorcycles are split into 3 categories: a) Small motorbikes (mopeds/scooters up to 125cc) b) Medium motorbikes (125-500cc) c) Large motorbikes (over 500cc)
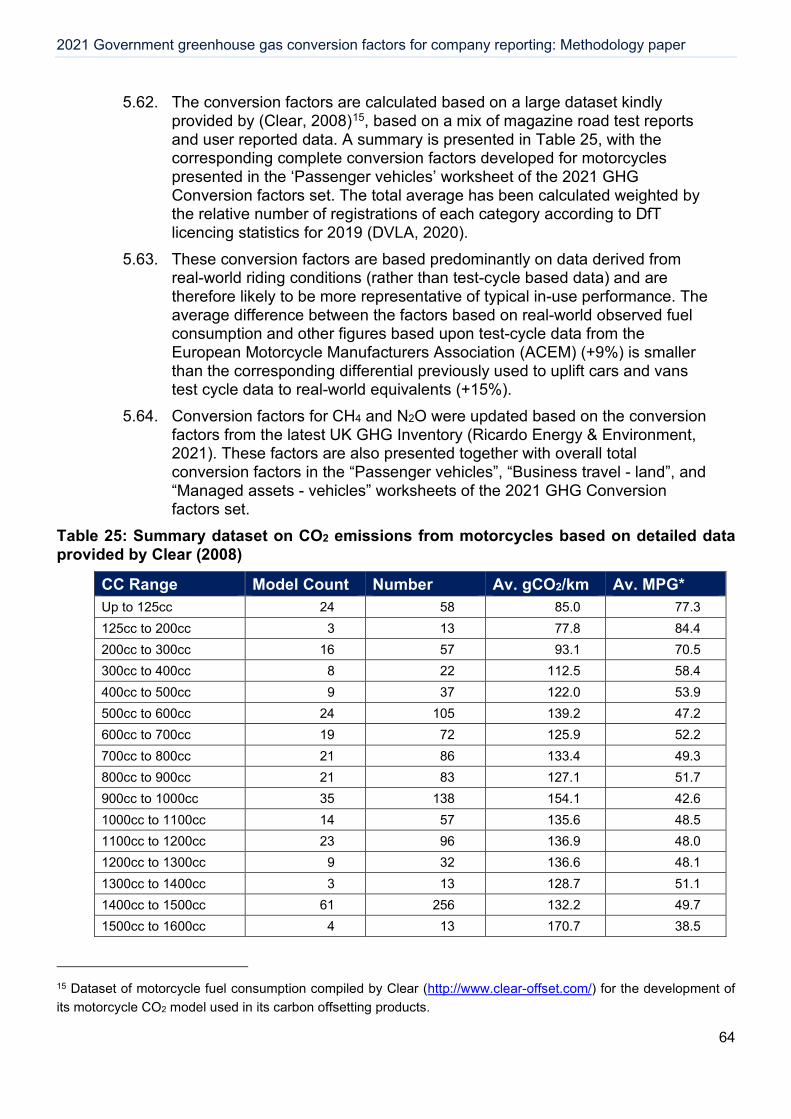
2021 Government greenhouse gas conversion factors for company reporting: Methodology paper
64
5.62. The conversion factors are calculated based on a large dataset kindly provided by (Clear, 2008)15, based on a mix of magazine road test reports and user reported data. A summary is presented in Table 25, with the corresponding complete conversion factors developed for motorcycles presented in the ‘Passenger vehicles’ worksheet of the 2021 GHG Conversion factors set. The total average has been calculated weighted by the relative number of registrations of each category according to DfT licencing statistics for 2019 (DVLA, 2020).
5.63. These conversion factors are based predominantly on data derived from real-world riding conditions (rather than test-cycle based data) and are therefore likely to be more representative of typical in-use performance. The average difference between the factors based on real-world observed fuel consumption and other figures based upon test-cycle data from the European Motorcycle Manufacturers Association (ACEM) (+9%) is smaller than the corresponding differential previously used to uplift cars and vans test cycle data to real-world equivalents (+15%).
5.64. Conversion factors for CH4 and N2O were updated based on the conversion factors from the latest UK GHG Inventory (Ricardo Energy & Environment, 2021). These factors are also presented together with overall total conversion factors in the “Passenger vehicles”, “Business travel - land”, and “Managed assets - vehicles” worksheets of the 2021 GHG Conversion factors set.
Table 25: Summary dataset on CO2 emissions from motorcycles based on detailed data provided by Clear (2008)
CC Range Model Count Number Av. gCO2/km Av. MPG* Up to 125cc 24 58 85.0 77.3 125cc to 200cc 3 13 77.8 84.4 200cc to 300cc 16 57 93.1 70.5 300cc to 400cc 8 22 112.5 58.4 400cc to 500cc 9 37 122.0 53.9 500cc to 600cc 24 105 139.2 47.2 600cc to 700cc 19 72 125.9 52.2 700cc to 800cc 21 86 133.4 49.3 800cc to 900cc 21 83 127.1 51.7 900cc to 1000cc 35 138 154.1 42.6 1000cc to 1100cc 14 57 135.6 48.5 1100cc to 1200cc 23 96 136.9 48.0 1200cc to 1300cc 9 32 136.6 48.1 1300cc to 1400cc 3 13 128.7 51.1 1400cc to 1500cc 61 256 132.2 49.7 1500cc to 1600cc 4 13 170.7 38.5
15 Dataset of motorcycle fuel consumption compiled by Clear (http://www.clear-offset.com/) for the development of its motorcycle CO2 model used in its carbon offsetting products.
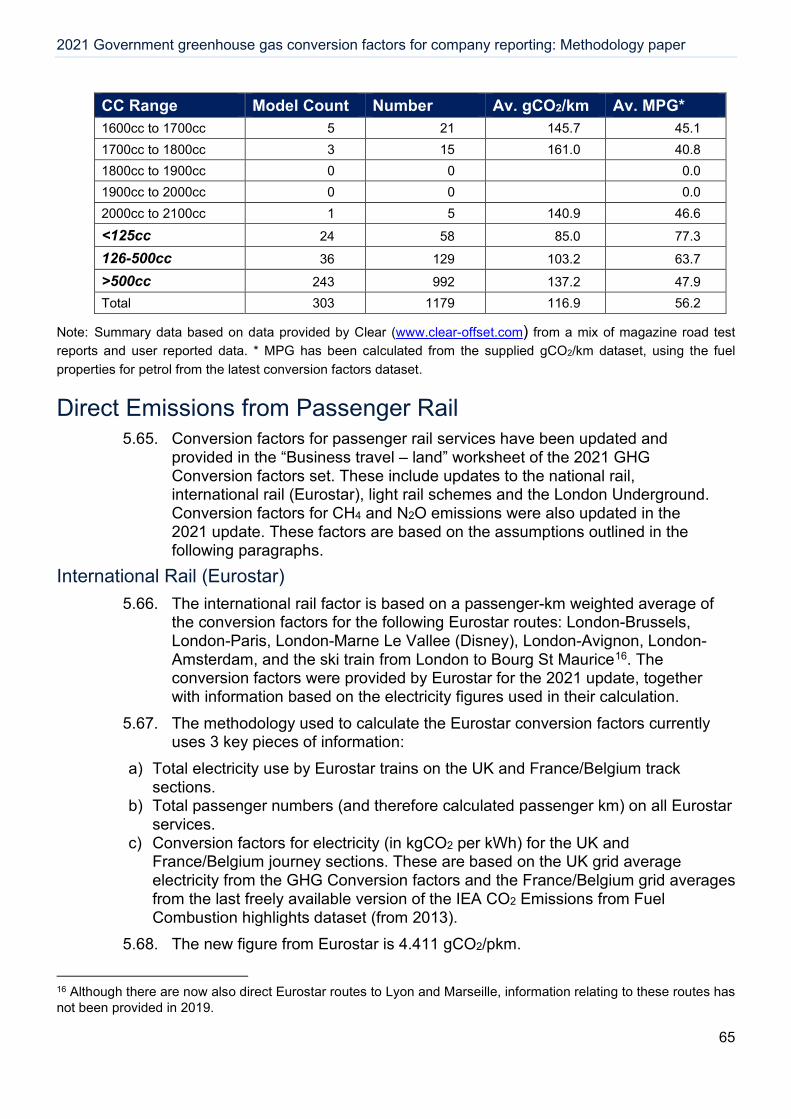
2021 Government greenhouse gas conversion factors for company reporting: Methodology paper
65
CC Range Model Count Number Av. gCO2/km Av. MPG* 1600cc to 1700cc 5 21 145.7 45.1 1700cc to 1800cc 3 15 161.0 40.8 1800cc to 1900cc 0 0 0.0 1900cc to 2000cc 0 0 0.0 2000cc to 2100cc 1 5 140.9 46.6 <125cc 24 58 85.0 77.3 126-500cc 36 129 103.2 63.7 >500cc 243 992 137.2 47.9 Total 303 1179 116.9 56.2
Note: Summary data based on data provided by Clear (www.clear-offset.com) from a mix of magazine road test reports and user reported data. * MPG has been calculated from the supplied gCO2/km dataset, using the fuel properties for petrol from the latest conversion factors dataset.
Direct Emissions from Passenger Rail 5.65. Conversion factors for passenger rail services have been updated and
provided in the “Business travel – land” worksheet of the 2021 GHG Conversion factors set. These include updates to the national rail, international rail (Eurostar), light rail schemes and the London Underground. Conversion factors for CH4 and N2O emissions were also updated in the 2021 update. These factors are based on the assumptions outlined in the following paragraphs.
International Rail (Eurostar) 5.66. The international rail factor is based on a passenger-km weighted average of
the conversion factors for the following Eurostar routes: London-Brussels, London-Paris, London-Marne Le Vallee (Disney), London-Avignon, London-Amsterdam, and the ski train from London to Bourg St Maurice16. The conversion factors were provided by Eurostar for the 2021 update, together with information based on the electricity figures used in their calculation.
5.67. The methodology used to calculate the Eurostar conversion factors currently uses 3 key pieces of information:
a) Total electricity use by Eurostar trains on the UK and France/Belgium track sections.
b) Total passenger numbers (and therefore calculated passenger km) on all Eurostar services.
c) Conversion factors for electricity (in kgCO2 per kWh) for the UK and France/Belgium journey sections. These are based on the UK grid average electricity from the GHG Conversion factors and the France/Belgium grid averages from the last freely available version of the IEA CO2 Emissions from Fuel Combustion highlights dataset (from 2013).
5.68. The new figure from Eurostar is 4.411 gCO2/pkm.
16 Although there are now also direct Eurostar routes to Lyon and Marseille, information relating to these routes has not been provided in 2019.
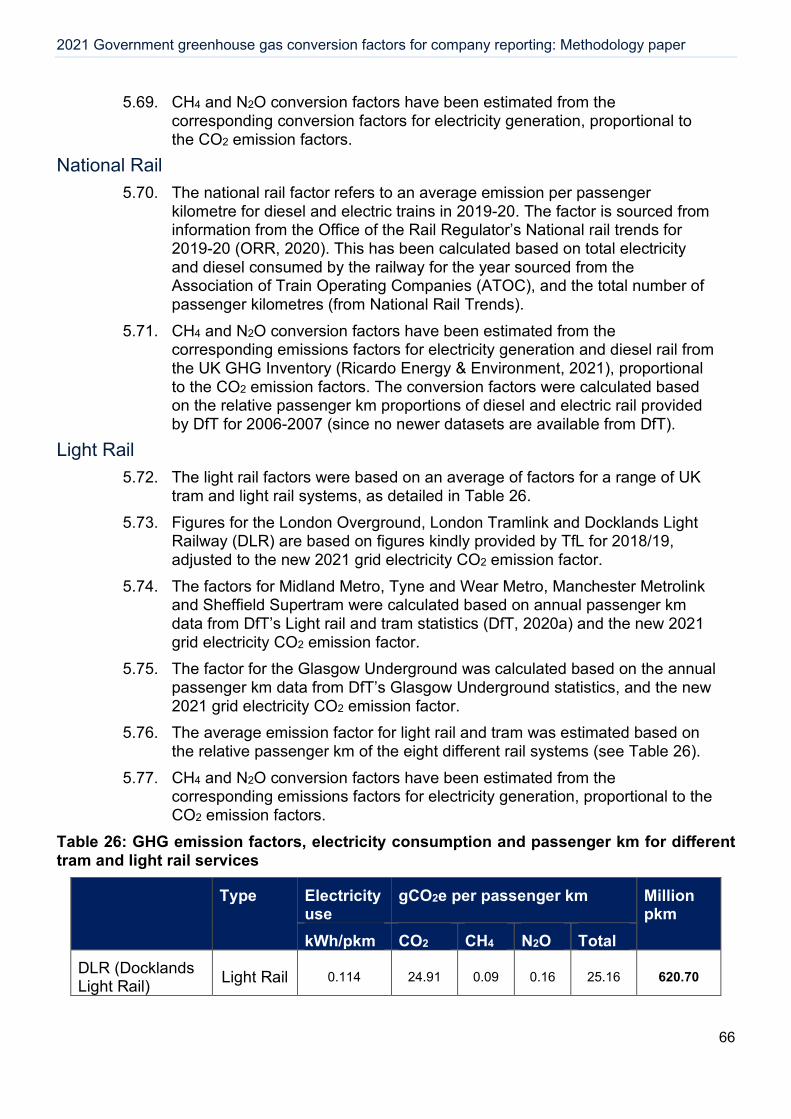
2021 Government greenhouse gas conversion factors for company reporting: Methodology paper
66
5.69. CH4 and N2O conversion factors have been estimated from the corresponding conversion factors for electricity generation, proportional to the CO2 emission factors.
National Rail 5.70. The national rail factor refers to an average emission per passenger
kilometre for diesel and electric trains in 2019-20. The factor is sourced from information from the Office of the Rail Regulator’s National rail trends for 2019-20 (ORR, 2020). This has been calculated based on total electricity and diesel consumed by the railway for the year sourced from the Association of Train Operating Companies (ATOC), and the total number of passenger kilometres (from National Rail Trends).
5.71. CH4 and N2O conversion factors have been estimated from the corresponding emissions factors for electricity generation and diesel rail from the UK GHG Inventory (Ricardo Energy & Environment, 2021), proportional to the CO2 emission factors. The conversion factors were calculated based on the relative passenger km proportions of diesel and electric rail provided by DfT for 2006-2007 (since no newer datasets are available from DfT).
Light Rail 5.72. The light rail factors were based on an average of factors for a range of UK
tram and light rail systems, as detailed in Table 26. 5.73. Figures for the London Overground, London Tramlink and Docklands Light
Railway (DLR) are based on figures kindly provided by TfL for 2018/19, adjusted to the new 2021 grid electricity CO2 emission factor.
5.74. The factors for Midland Metro, Tyne and Wear Metro, Manchester Metrolink and Sheffield Supertram were calculated based on annual passenger km data from DfT’s Light rail and tram statistics (DfT, 2020a) and the new 2021 grid electricity CO2 emission factor.
5.75. The factor for the Glasgow Underground was calculated based on the annual passenger km data from DfT’s Glasgow Underground statistics, and the new 2021 grid electricity CO2 emission factor.
5.76. The average emission factor for light rail and tram was estimated based on the relative passenger km of the eight different rail systems (see Table 26).
5.77. CH4 and N2O conversion factors have been estimated from the corresponding emissions factors for electricity generation, proportional to the CO2 emission factors.
Table 26: GHG emission factors, electricity consumption and passenger km for different tram and light rail services
Type
Electricity use
gCO2e per passenger km Million pkm
kWh/pkm CO2 CH4 N2O Total DLR (Docklands Light Rail) Light Rail 0.114 24.91 0.09 0.16 25.16 620.70
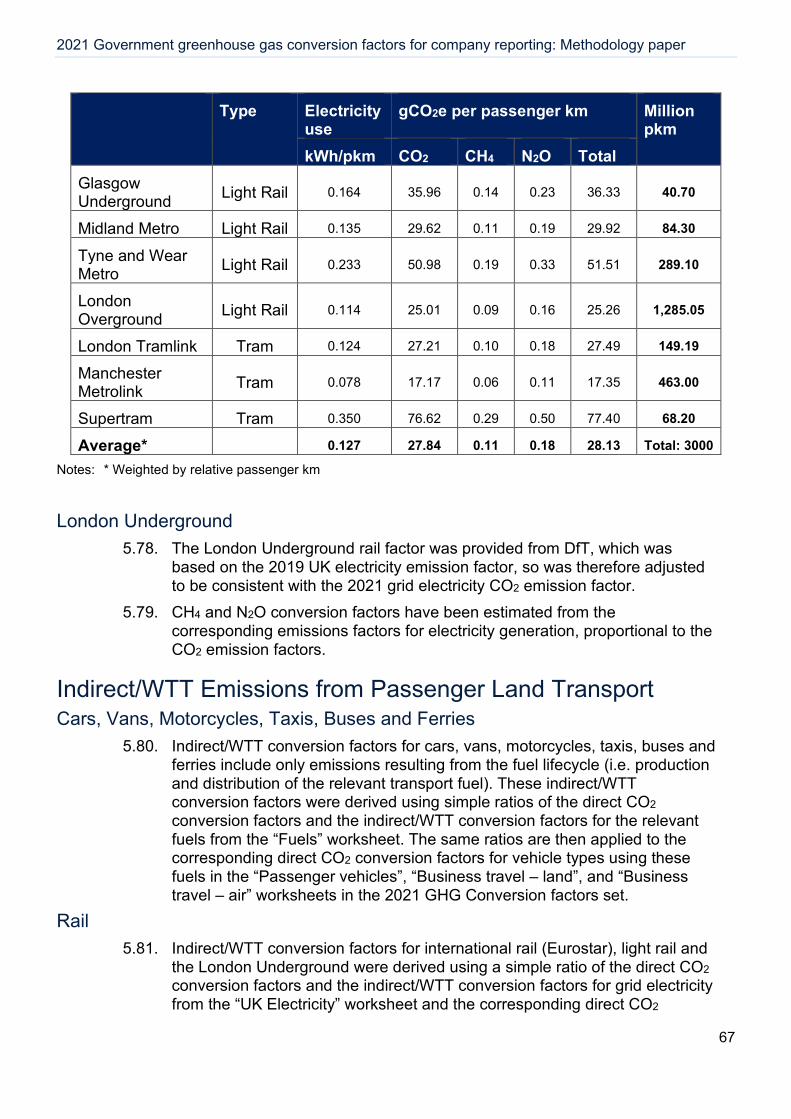
2021 Government greenhouse gas conversion factors for company reporting: Methodology paper
67
Type
Electricity use
gCO2e per passenger km Million pkm
kWh/pkm CO2 CH4 N2O Total Glasgow Underground Light Rail 0.164 35.96 0.14 0.23 36.33 40.70
Midland Metro Light Rail 0.135 29.62 0.11 0.19 29.92 84.30
Tyne and Wear Metro Light Rail 0.233 50.98 0.19 0.33 51.51 289.10
London Overground Light Rail 0.114 25.01 0.09 0.16 25.26 1,285.05
London Tramlink Tram 0.124 27.21 0.10 0.18 27.49 149.19
Manchester Metrolink Tram 0.078 17.17 0.06 0.11 17.35 463.00
Supertram Tram 0.350 76.62 0.29 0.50 77.40 68.20
Average* 0.127 27.84 0.11 0.18 28.13 Total: 3000 Notes: * Weighted by relative passenger km
London Underground 5.78. The London Underground rail factor was provided from DfT, which was
based on the 2019 UK electricity emission factor, so was therefore adjusted to be consistent with the 2021 grid electricity CO2 emission factor.
5.79. CH4 and N2O conversion factors have been estimated from the corresponding emissions factors for electricity generation, proportional to the CO2 emission factors.
Indirect/WTT Emissions from Passenger Land Transport Cars, Vans, Motorcycles, Taxis, Buses and Ferries
5.80. Indirect/WTT conversion factors for cars, vans, motorcycles, taxis, buses and ferries include only emissions resulting from the fuel lifecycle (i.e. production and distribution of the relevant transport fuel). These indirect/WTT conversion factors were derived using simple ratios of the direct CO2 conversion factors and the indirect/WTT conversion factors for the relevant fuels from the “Fuels” worksheet. The same ratios are then applied to the corresponding direct CO2 conversion factors for vehicle types using these fuels in the “Passenger vehicles”, “Business travel – land”, and “Business travel – air” worksheets in the 2021 GHG Conversion factors set.
Rail 5.81. Indirect/WTT conversion factors for international rail (Eurostar), light rail and
the London Underground were derived using a simple ratio of the direct CO2 conversion factors and the indirect/WTT conversion factors for grid electricity from the “UK Electricity” worksheet and the corresponding direct CO2

2021 Government greenhouse gas conversion factors for company reporting: Methodology paper
68
conversion factors for vehicle types in the “Passenger vehicles”, “Business travel – land” and “Business travel – air” worksheets in the GHG Conversion factors set.
5.82. The conversion factors for National rail services are based on a mixture of emissions from diesel and electric rail. Indirect/WTT conversion factors were therefore calculated from corresponding estimates for diesel and electric rail combined using relative passenger km proportions of diesel and electric rail provided by DfT for 2006-7 (no newer similar dataset is available).
2021 Government greenhouse gas conversion factors for company reporting: Methodology paper
69
6. Freight Land Transport Emission Factors
Section summary 6.1. This section describes the calculation of the conversion factors for the
transport of freight on land (road and rail). Scope 1 factors included are for delivery vehicles owned or controlled by the reporting organisation. Scope 3 factors are described for freighting goods over land through a third-party company, including factors for both the whole vehicle’s load of goods or per tonne of goods shipped. WTT factors for both delivery vehicles owned by the reporting organisation and for freighting goods via a third party. Factors for managed assets (vans/LGVs, HGVs) are also detailed in this section.
6.2. Table 27 shows where the related worksheets to the freight land transport conversion factors are available in the online spreadsheets of the UK GHG Conversion factors set.
Table 27 Related worksheets to freight land transport emission factors
Worksheet name Full set Condensed set
Delivery vehicles Y N
Freighting goods* Y Y
WTT – delivery vehicles & freight* Y N
Managed assets – vehicles** Y Y
Notes: * vans, HGVs and rail only; ** vans and HGVs only
Summary of changes since the previous update 6.3. There were no major methodological changes in the 2021 update.
Direct Emissions from Heavy Goods Vehicles (HGVs) 6.4. The HGV factors are based on road freight statistics from the Department for
Transport (DfT, 2020c) for Great Britain (GB), from a survey on different sizes of rigid and articulated HGVs in the fleet in 2019. The statistics on fuel consumption figures (in miles per gallon) have been estimated by DfT from the survey data. For the 2021 update, these are combined with test data from the European ARTEMIS17 project showing how fuel efficiency, and therefore the CO2 emissions, varies with vehicle load.
17 Artemis (Advanced Research & Technology for EMbedded Intelligent Systems) is the association for actors in Embedded Intelligent Systems within Europe, https://artemis-ia.eu/
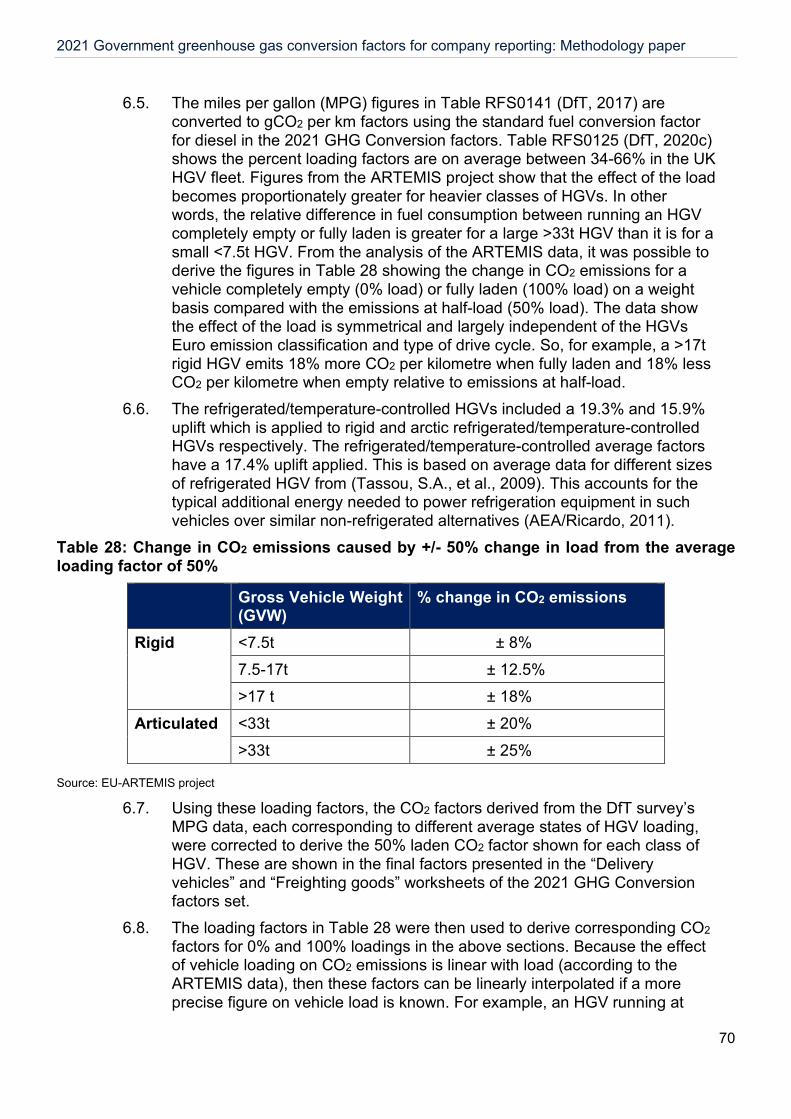
2021 Government greenhouse gas conversion factors for company reporting: Methodology paper
70
6.5. The miles per gallon (MPG) figures in Table RFS0141 (DfT, 2017) are converted to gCO2 per km factors using the standard fuel conversion factor for diesel in the 2021 GHG Conversion factors. Table RFS0125 (DfT, 2020c) shows the percent loading factors are on average between 34-66% in the UK HGV fleet. Figures from the ARTEMIS project show that the effect of the load becomes proportionately greater for heavier classes of HGVs. In other words, the relative difference in fuel consumption between running an HGV completely empty or fully laden is greater for a large >33t HGV than it is for a small <7.5t HGV. From the analysis of the ARTEMIS data, it was possible to derive the figures in Table 28 showing the change in CO2 emissions for a vehicle completely empty (0% load) or fully laden (100% load) on a weight basis compared with the emissions at half-load (50% load). The data show the effect of the load is symmetrical and largely independent of the HGVs Euro emission classification and type of drive cycle. So, for example, a >17t rigid HGV emits 18% more CO2 per kilometre when fully laden and 18% less CO2 per kilometre when empty relative to emissions at half-load.
6.6. The refrigerated/temperature-controlled HGVs included a 19.3% and 15.9% uplift which is applied to rigid and arctic refrigerated/temperature-controlled HGVs respectively. The refrigerated/temperature-controlled average factors have a 17.4% uplift applied. This is based on average data for different sizes of refrigerated HGV from (Tassou, S.A., et al., 2009). This accounts for the typical additional energy needed to power refrigeration equipment in such vehicles over similar non-refrigerated alternatives (AEA/Ricardo, 2011).
Table 28: Change in CO2 emissions caused by +/- 50% change in load from the average loading factor of 50%
Gross Vehicle Weight (GVW)
% change in CO2 emissions
Rigid
<7.5t ± 8% 7.5-17t ± 12.5% >17 t ± 18%
Articulated
<33t ± 20% >33t ± 25%
Source: EU-ARTEMIS project
6.7. Using these loading factors, the CO2 factors derived from the DfT survey’s MPG data, each corresponding to different average states of HGV loading, were corrected to derive the 50% laden CO2 factor shown for each class of HGV. These are shown in the final factors presented in the “Delivery vehicles” and “Freighting goods” worksheets of the 2021 GHG Conversion factors set.
6.8. The loading factors in Table 28 were then used to derive corresponding CO2 factors for 0% and 100% loadings in the above sections. Because the effect of vehicle loading on CO2 emissions is linear with load (according to the ARTEMIS data), then these factors can be linearly interpolated if a more precise figure on vehicle load is known. For example, an HGV running at
2021 Government greenhouse gas conversion factors for company reporting: Methodology paper
71
75% load would have a CO2 factor halfway between the values for 50% and 100% laden factors.
6.9. It might be surprising to see that the CO2 factor for a >17t rigid HGV is greater than for a >33t articulated HGV. However, these factors reflect the estimated MPG figures from DfT statistics that consistently show worse MPG fuel efficiency, on average, for large rigid HGVs than large articulated HGVs once the relative degree of loading is accounted for. This is likely to be a result of the usage pattern for different types of HGVs where large rigid HGVs may spend more time travelling at lower, more congested urban speeds, operating at lower fuel efficiency than articulated HGVs which spend more time travelling under higher speed, free-flowing traffic conditions on motorways where fuel efficiency is closer to optimum. Under the drive cycle conditions more typically experienced by large articulated HGVs, the CO2 factors for large rigid HGVs may be lower than indicated in “Delivery vehicles” and “Freighting goods” worksheets of the 2021 GHG Conversion factors set. Thus, the factors in “Delivery vehicles” and “Freighting goods” worksheets, linked to the DfT statistics (DfT, 2017) on MPG (estimated by DfT from the survey data), reflect each HGV class’s typical usage pattern on the GB road network.
6.10. UK average factors for all rigid and articulated classes of HGVs are also provided in the “Delivery vehicles” and “Freighting goods” worksheets of the 2021 GHG Conversion factors set, if the user requires aggregate factors for these main classes of HGVs, perhaps in case the weight class of the HGV is not known. Again, these factors represent averages for the GB HGV fleet in 2019. These are derived directly from the mpg values for rigid and articulated HGVs in Table RFS0141 (DfT, 2017).
6.11. At a more aggregated level, factors for all HGVs are still representing the average MPG for all rigid and articulated HGV classes in Table RFS0141 (DfT, 2017). This factor should be used if the user has no knowledge of or requirement for different classes of HGVs and may be suitable for analysis of HGV CO2 emissions in, for example, inter-modal freight transport comparisons.
6.12. The conversion factors included in the “Delivery vehicles” worksheet of the 2021 GHG Conversion factors set are provided in distance units to enable CO2 emissions to be calculated from the distance travelled by the HGV in km multiplied by the appropriate conversion factor for the type of HGV and, if known, the extent of loading.
6.13. For comparison with other freight transport modes (e.g. road vs. rail), the user may require CO2 factors in tonne km (tkm) units. The “Freighting goods” worksheet of the 2021 GHG Conversion factors set also provides such factors for each weight class of rigid and articulated HGVs, for all rigid and for all articulated, and aggregated for all HGVs. These are derived from the fleet average gCO2 per vehicle km factors in the “Delivery vehicles” worksheet. The average tonnes of freight lifted figures are derived from the tkm and vehicle km (vkm) figures given for each class of HGVs in Tables RFS0113 and RFS0110, respectively (DfT, 2020c). Dividing the tkm by the vkm figures gives the average tonnes of freight lifted by each HGV class.
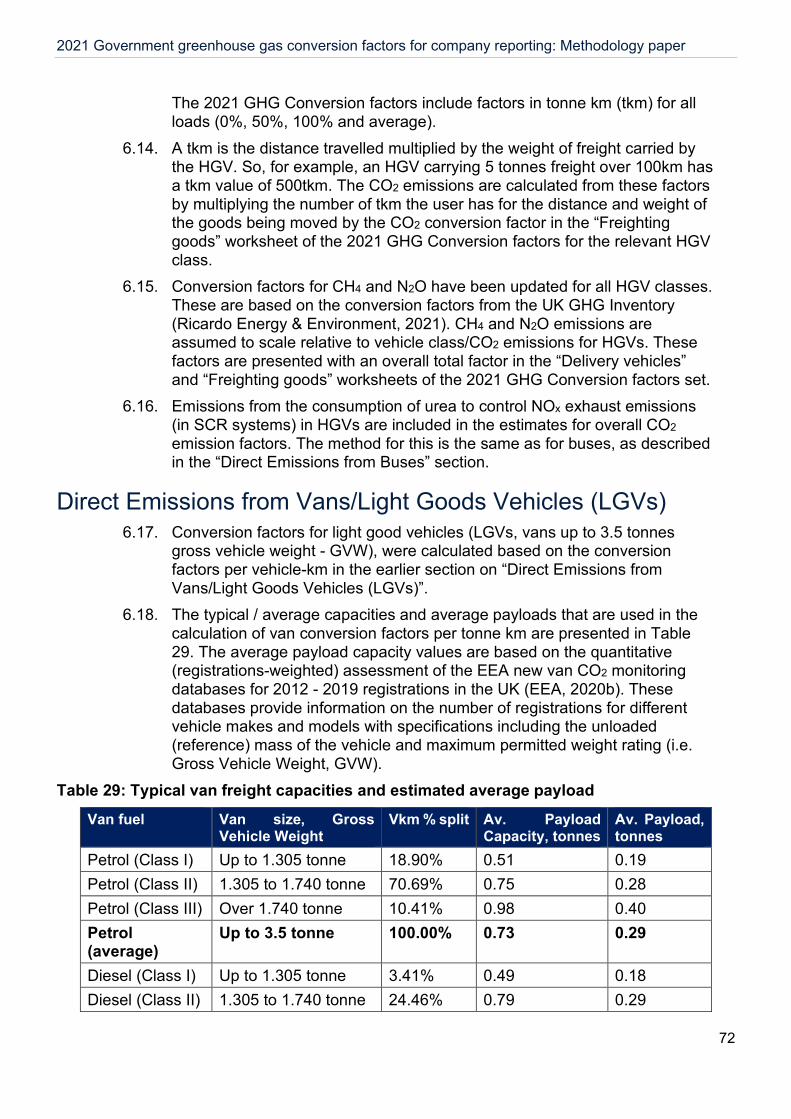
2021 Government greenhouse gas conversion factors for company reporting: Methodology paper
72
The 2021 GHG Conversion factors include factors in tonne km (tkm) for all loads (0%, 50%, 100% and average).
6.14. A tkm is the distance travelled multiplied by the weight of freight carried by the HGV. So, for example, an HGV carrying 5 tonnes freight over 100km has a tkm value of 500tkm. The CO2 emissions are calculated from these factors by multiplying the number of tkm the user has for the distance and weight of the goods being moved by the CO2 conversion factor in the “Freighting goods” worksheet of the 2021 GHG Conversion factors for the relevant HGV class.
6.15. Conversion factors for CH4 and N2O have been updated for all HGV classes. These are based on the conversion factors from the UK GHG Inventory (Ricardo Energy & Environment, 2021). CH4 and N2O emissions are assumed to scale relative to vehicle class/CO2 emissions for HGVs. These factors are presented with an overall total factor in the “Delivery vehicles” and “Freighting goods” worksheets of the 2021 GHG Conversion factors set.
6.16. Emissions from the consumption of urea to control NOx exhaust emissions (in SCR systems) in HGVs are included in the estimates for overall CO2 emission factors. The method for this is the same as for buses, as described in the “Direct Emissions from Buses” section.
Direct Emissions from Vans/Light Goods Vehicles (LGVs) 6.17. Conversion factors for light good vehicles (LGVs, vans up to 3.5 tonnes
gross vehicle weight - GVW), were calculated based on the conversion factors per vehicle-km in the earlier section on “Direct Emissions from Vans/Light Goods Vehicles (LGVs)”.
6.18. The typical / average capacities and average payloads that are used in the calculation of van conversion factors per tonne km are presented in Table 29. The average payload capacity values are based on the quantitative (registrations-weighted) assessment of the EEA new van CO2 monitoring databases for 2012 - 2019 registrations in the UK (EEA, 2020b). These databases provide information on the number of registrations for different vehicle makes and models with specifications including the unloaded (reference) mass of the vehicle and maximum permitted weight rating (i.e. Gross Vehicle Weight, GVW).
Table 29: Typical van freight capacities and estimated average payload Van fuel Van size, Gross
Vehicle Weight Vkm % split Av. Payload
Capacity, tonnes Av. Payload, tonnes
Petrol (Class I) Up to 1.305 tonne 18.90% 0.51 0.19 Petrol (Class II) 1.305 to 1.740 tonne 70.69% 0.75 0.28 Petrol (Class III) Over 1.740 tonne 10.41% 0.98 0.40 Petrol (average)
Up to 3.5 tonne 100.00% 0.73 0.29
Diesel (Class I) Up to 1.305 tonne 3.41% 0.49 0.18 Diesel (Class II) 1.305 to 1.740 tonne 24.46% 0.79 0.29
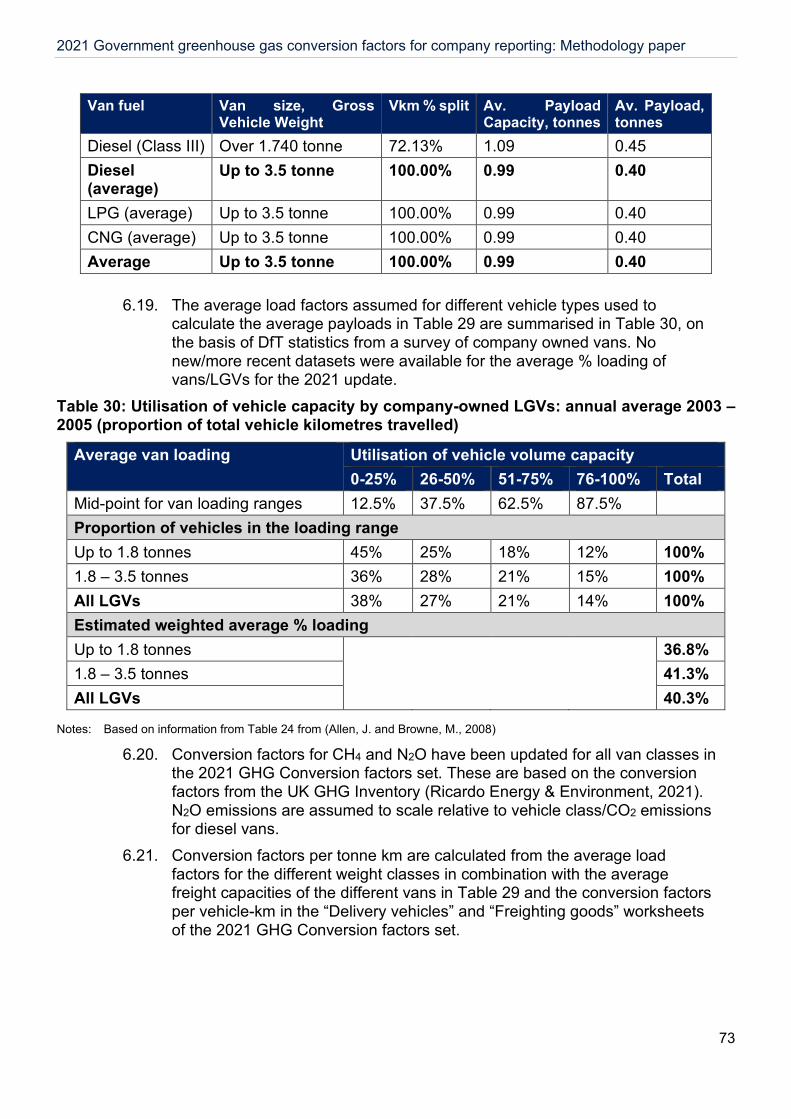
2021 Government greenhouse gas conversion factors for company reporting: Methodology paper
73
Van fuel Van size, Gross Vehicle Weight
Vkm % split Av. Payload Capacity, tonnes
Av. Payload, tonnes
Diesel (Class III) Over 1.740 tonne 72.13% 1.09 0.45 Diesel (average)
Up to 3.5 tonne 100.00% 0.99 0.40
LPG (average) Up to 3.5 tonne 100.00% 0.99 0.40 CNG (average) Up to 3.5 tonne 100.00% 0.99 0.40 Average Up to 3.5 tonne 100.00% 0.99 0.40
6.19. The average load factors assumed for different vehicle types used to calculate the average payloads in Table 29 are summarised in Table 30, on the basis of DfT statistics from a survey of company owned vans. No new/more recent datasets were available for the average % loading of vans/LGVs for the 2021 update.
Table 30: Utilisation of vehicle capacity by company-owned LGVs: annual average 2003 – 2005 (proportion of total vehicle kilometres travelled)
Average van loading Utilisation of vehicle volume capacity 0-25% 26-50% 51-75% 76-100% Total
Mid-point for van loading ranges 12.5% 37.5% 62.5% 87.5% Proportion of vehicles in the loading range Up to 1.8 tonnes 45% 25% 18% 12% 100% 1.8 – 3.5 tonnes 36% 28% 21% 15% 100% All LGVs 38% 27% 21% 14% 100% Estimated weighted average % loading Up to 1.8 tonnes 36.8% 1.8 – 3.5 tonnes 41.3% All LGVs 40.3%
Notes: Based on information from Table 24 from (Allen, J. and Browne, M., 2008)
6.20. Conversion factors for CH4 and N2O have been updated for all van classes in the 2021 GHG Conversion factors set. These are based on the conversion factors from the UK GHG Inventory (Ricardo Energy & Environment, 2021). N2O emissions are assumed to scale relative to vehicle class/CO2 emissions for diesel vans.
6.21. Conversion factors per tonne km are calculated from the average load factors for the different weight classes in combination with the average freight capacities of the different vans in Table 29 and the conversion factors per vehicle-km in the “Delivery vehicles” and “Freighting goods” worksheets of the 2021 GHG Conversion factors set.
2021 Government greenhouse gas conversion factors for company reporting: Methodology paper
74
Direct Emissions from Rail Freight 6.22. The data used to update the rail freight conversion factors for the 2021 GHG
Conversion factors set, was provided by the Office of the Rail Regulator’s (ORR, 2020a). This factor is presented in “Freighting goods” worksheet of the 2020 GHG Conversion factors set.
6.23. The factor can be expected to vary with rail traffic route, speed, and train weight. Freight trains are hauled by electric and diesel locomotives, but most freight is carried by diesel rail and correspondingly CO2 emissions from diesel rail freight are over 96% of the total CO2 from rail freight for 2019-20 (ORR, 2020a).
6.24. Traffic-, route- and freight-specific factors are not currently available, though these would present a more appropriate means of comparing modes (e.g. for bulk aggregates, intermodal, other types of freight). The rail freight CO2 factor will be reviewed and updated if data become available relevant to rail freight movement in the UK.
6.25. CH4 and N2O conversion factors have been estimated from the corresponding emissions for diesel rail from the UK GHG Inventory (Ricardo Energy & Environment, 2021), proportional to the CO2 emissions. The conversion factors were calculated based on the relative passenger km proportions of diesel and electric rail provided by DfT for 2006-7 in the absence of more suitable tonne km data for freight.
Indirect/WTT Emissions from Freight Land Transport Vans and HGVs
6.26. Indirect/WTT conversion factors for Vans and HGVs include only emissions resulting from the fuel lifecycle (i.e. production and distribution of the relevant transport fuel). These indirect/WTT conversion factors were derived using simple ratios of the direct CO2 conversion factors and the indirect/WTT conversion factors for the relevant fuels from the “Fuels” worksheet, then applying the same ratios to the corresponding direct CO2 conversion factors for vehicle types using these fuels.
Rail 6.27. The conversion factors for freight rail services are based on a mixture of
emissions from diesel and electric rail. Indirect/WTT conversion factors were therefore calculated in a similar way to the other freight transport modes, except for combining indirect/WTT conversion factors for diesel and electricity into a weighted average for freight rail using relative CO2 emissions from traction energy for diesel and electric freight rail provided from ORR in “Table 2.100 Estimates of passenger and freight energy consumption and CO2e emissions” (ORR, 2020a).
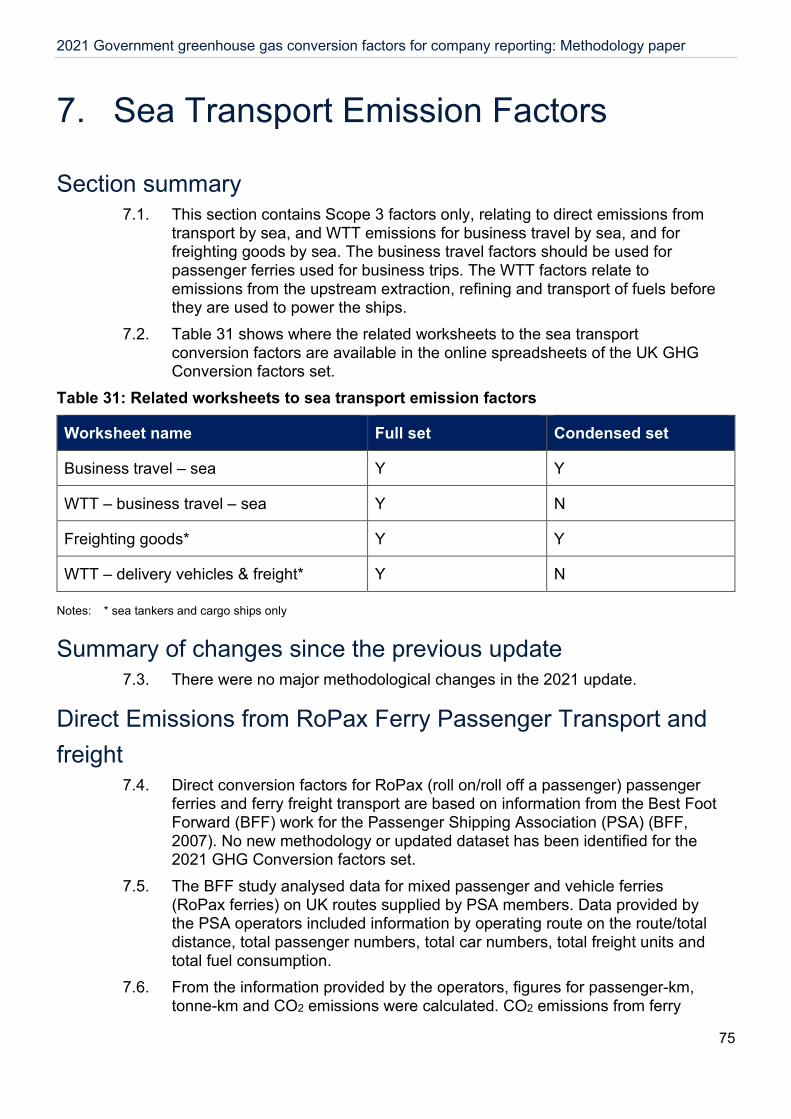
2021 Government greenhouse gas conversion factors for company reporting: Methodology paper
75
7. Sea Transport Emission Factors
Section summary 7.1. This section contains Scope 3 factors only, relating to direct emissions from
transport by sea, and WTT emissions for business travel by sea, and for freighting goods by sea. The business travel factors should be used for passenger ferries used for business trips. The WTT factors relate to emissions from the upstream extraction, refining and transport of fuels before they are used to power the ships.
7.2. Table 31 shows where the related worksheets to the sea transport conversion factors are available in the online spreadsheets of the UK GHG Conversion factors set.
Table 31: Related worksheets to sea transport emission factors
Worksheet name Full set Condensed set
Business travel – sea Y Y
WTT – business travel – sea Y N
Freighting goods* Y Y
WTT – delivery vehicles & freight* Y N
Notes: * sea tankers and cargo ships only
Summary of changes since the previous update 7.3. There were no major methodological changes in the 2021 update.
Direct Emissions from RoPax Ferry Passenger Transport and freight
7.4. Direct conversion factors for RoPax (roll on/roll off a passenger) passenger ferries and ferry freight transport are based on information from the Best Foot Forward (BFF) work for the Passenger Shipping Association (PSA) (BFF, 2007). No new methodology or updated dataset has been identified for the 2021 GHG Conversion factors set.
7.5. The BFF study analysed data for mixed passenger and vehicle ferries (RoPax ferries) on UK routes supplied by PSA members. Data provided by the PSA operators included information by operating route on the route/total distance, total passenger numbers, total car numbers, total freight units and total fuel consumption.
7.6. From the information provided by the operators, figures for passenger-km, tonne-km and CO2 emissions were calculated. CO2 emissions from ferry
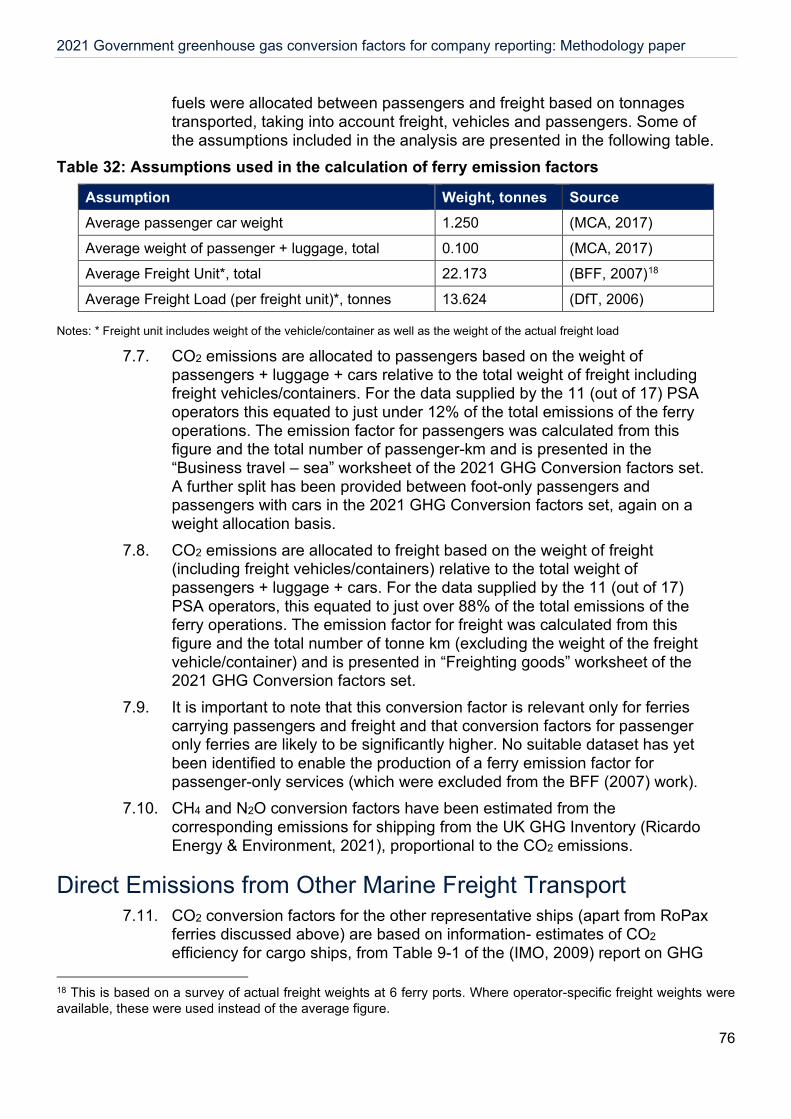
2021 Government greenhouse gas conversion factors for company reporting: Methodology paper
76
fuels were allocated between passengers and freight based on tonnages transported, taking into account freight, vehicles and passengers. Some of the assumptions included in the analysis are presented in the following table.
Table 32: Assumptions used in the calculation of ferry emission factors
Assumption Weight, tonnes Source Average passenger car weight 1.250 (MCA, 2017)
Average weight of passenger + luggage, total 0.100 (MCA, 2017)
Average Freight Unit*, total 22.173 (BFF, 2007)18
Average Freight Load (per freight unit)*, tonnes 13.624 (DfT, 2006)
Notes: * Freight unit includes weight of the vehicle/container as well as the weight of the actual freight load
7.7. CO2 emissions are allocated to passengers based on the weight of passengers + luggage + cars relative to the total weight of freight including freight vehicles/containers. For the data supplied by the 11 (out of 17) PSA operators this equated to just under 12% of the total emissions of the ferry operations. The emission factor for passengers was calculated from this figure and the total number of passenger-km and is presented in the “Business travel – sea” worksheet of the 2021 GHG Conversion factors set. A further split has been provided between foot-only passengers and passengers with cars in the 2021 GHG Conversion factors set, again on a weight allocation basis.
7.8. CO2 emissions are allocated to freight based on the weight of freight (including freight vehicles/containers) relative to the total weight of passengers + luggage + cars. For the data supplied by the 11 (out of 17) PSA operators, this equated to just over 88% of the total emissions of the ferry operations. The emission factor for freight was calculated from this figure and the total number of tonne km (excluding the weight of the freight vehicle/container) and is presented in “Freighting goods” worksheet of the 2021 GHG Conversion factors set.
7.9. It is important to note that this conversion factor is relevant only for ferries carrying passengers and freight and that conversion factors for passenger only ferries are likely to be significantly higher. No suitable dataset has yet been identified to enable the production of a ferry emission factor for passenger-only services (which were excluded from the BFF (2007) work).
7.10. CH4 and N2O conversion factors have been estimated from the corresponding emissions for shipping from the UK GHG Inventory (Ricardo Energy & Environment, 2021), proportional to the CO2 emissions.
Direct Emissions from Other Marine Freight Transport 7.11. CO2 conversion factors for the other representative ships (apart from RoPax
ferries discussed above) are based on information- estimates of CO2 efficiency for cargo ships, from Table 9-1 of the (IMO, 2009) report on GHG
18 This is based on a survey of actual freight weights at 6 ferry ports. Where operator-specific freight weights were available, these were used instead of the average figure.
2021 Government greenhouse gas conversion factors for company reporting: Methodology paper
77
emissions from ships. The figures in the “Freighting goods” worksheet of the 2021 GHG Conversion factors set represent international average data (i.e. including vessel characteristics and typical loading factors), as UK-specific datasets are not available.
7.12. CH4 and N2O conversion factors have been estimated from the corresponding emissions for shipping from the UK GHG Inventory (Ricardo Energy & Environment, 2021), proportional to the CO2 emissions.
Indirect/WTT Emissions from Sea Transport 7.13. Indirect/WTT emissions factors for ferries and ships include only emissions
resulting from the fuel lifecycle (i.e. production and distribution of the relevant transport fuel). These indirect/WTT conversion factors were derived using simple ratios of the direct CO2 conversion factors and the indirect/WTT conversion factors for the relevant fuels and the corresponding direct CO2 conversion factors for ferries and ships using these fuels.
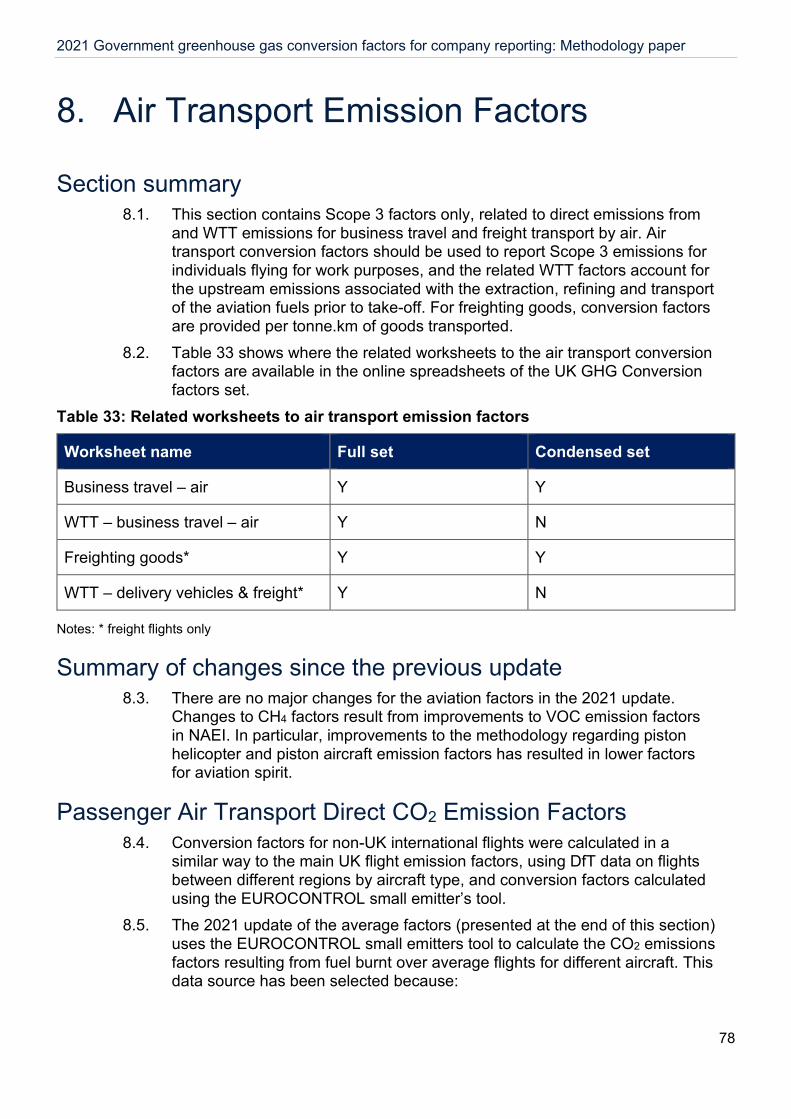
2021 Government greenhouse gas conversion factors for company reporting: Methodology paper
78
8. Air Transport Emission Factors
Section summary 8.1. This section contains Scope 3 factors only, related to direct emissions from
and WTT emissions for business travel and freight transport by air. Air transport conversion factors should be used to report Scope 3 emissions for individuals flying for work purposes, and the related WTT factors account for the upstream emissions associated with the extraction, refining and transport of the aviation fuels prior to take-off. For freighting goods, conversion factors are provided per tonne.km of goods transported.
8.2. Table 33 shows where the related worksheets to the air transport conversion factors are available in the online spreadsheets of the UK GHG Conversion factors set.
Table 33: Related worksheets to air transport emission factors
Worksheet name Full set Condensed set
Business travel – air Y Y
WTT – business travel – air Y N
Freighting goods* Y Y
WTT – delivery vehicles & freight* Y N
Notes: * freight flights only
Summary of changes since the previous update 8.3. There are no major changes for the aviation factors in the 2021 update.
Changes to CH4 factors result from improvements to VOC emission factors in NAEI. In particular, improvements to the methodology regarding piston helicopter and piston aircraft emission factors has resulted in lower factors for aviation spirit.
Passenger Air Transport Direct CO2 Emission Factors 8.4. Conversion factors for non-UK international flights were calculated in a
similar way to the main UK flight emission factors, using DfT data on flights between different regions by aircraft type, and conversion factors calculated using the EUROCONTROL small emitter’s tool.
8.5. The 2021 update of the average factors (presented at the end of this section) uses the EUROCONTROL small emitters tool to calculate the CO2 emissions factors resulting from fuel burnt over average flights for different aircraft. This data source has been selected because:
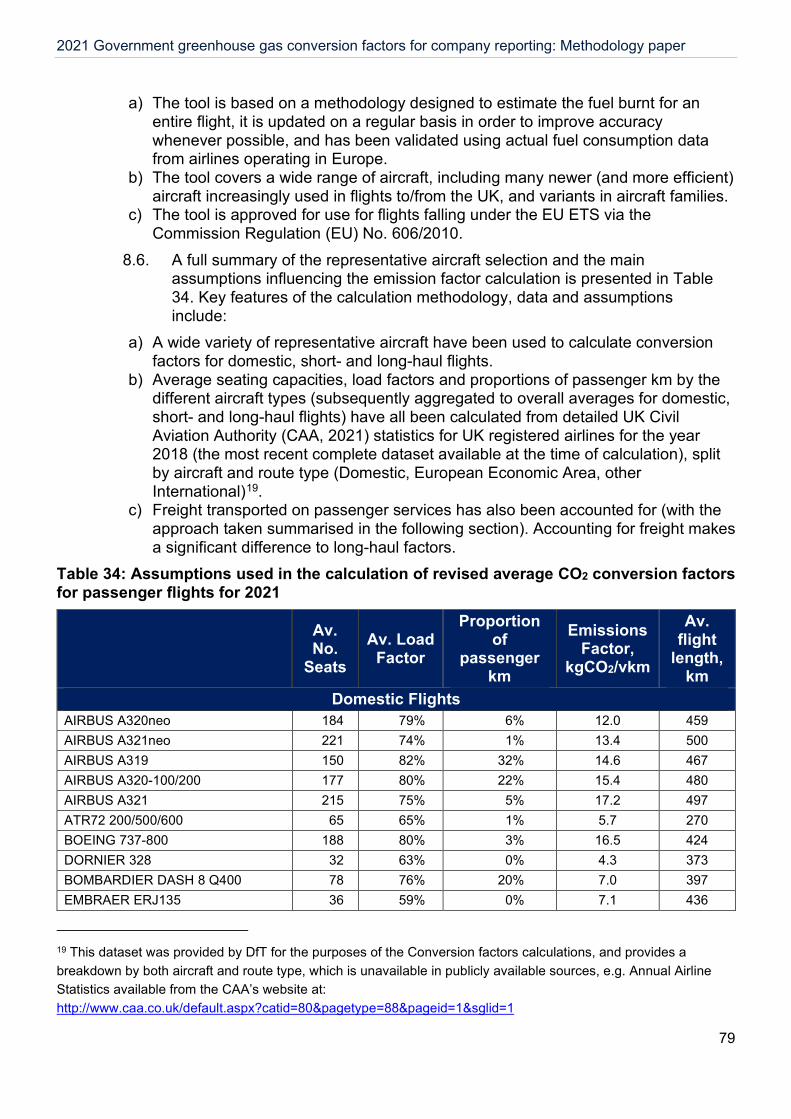
2021 Government greenhouse gas conversion factors for company reporting: Methodology paper
79
a) The tool is based on a methodology designed to estimate the fuel burnt for an entire flight, it is updated on a regular basis in order to improve accuracy whenever possible, and has been validated using actual fuel consumption data from airlines operating in Europe.
b) The tool covers a wide range of aircraft, including many newer (and more efficient) aircraft increasingly used in flights to/from the UK, and variants in aircraft families.
c) The tool is approved for use for flights falling under the EU ETS via the Commission Regulation (EU) No. 606/2010.
8.6. A full summary of the representative aircraft selection and the main assumptions influencing the emission factor calculation is presented in Table 34. Key features of the calculation methodology, data and assumptions include:
a) A wide variety of representative aircraft have been used to calculate conversion factors for domestic, short- and long-haul flights.
b) Average seating capacities, load factors and proportions of passenger km by the different aircraft types (subsequently aggregated to overall averages for domestic, short- and long-haul flights) have all been calculated from detailed UK Civil Aviation Authority (CAA, 2021) statistics for UK registered airlines for the year 2018 (the most recent complete dataset available at the time of calculation), split by aircraft and route type (Domestic, European Economic Area, other International)19.
c) Freight transported on passenger services has also been accounted for (with the approach taken summarised in the following section). Accounting for freight makes a significant difference to long-haul factors.
Table 34: Assumptions used in the calculation of revised average CO2 conversion factors for passenger flights for 2021
Av. No.
Seats Av. Load
Factor
Proportion of
passenger km
Emissions Factor,
kgCO2/vkm
Av. flight
length, km
Domestic Flights AIRBUS A320neo 184 79% 6% 12.0 459 AIRBUS A321neo 221 74% 1% 13.4 500 AIRBUS A319 150 82% 32% 14.6 467 AIRBUS A320-100/200 177 80% 22% 15.4 480 AIRBUS A321 215 75% 5% 17.2 497 ATR72 200/500/600 65 65% 1% 5.7 270 BOEING 737-800 188 80% 3% 16.5 424 DORNIER 328 32 63% 0% 4.3 373 BOMBARDIER DASH 8 Q400 78 76% 20% 7.0 397 EMBRAER ERJ135 36 59% 0% 7.1 436
19 This dataset was provided by DfT for the purposes of the Conversion factors calculations, and provides a breakdown by both aircraft and route type, which is unavailable in publicly available sources, e.g. Annual Airline Statistics available from the CAA’s website at: http://www.caa.co.uk/default.aspx?catid=80&pagetype=88&pageid=1&sglid=1
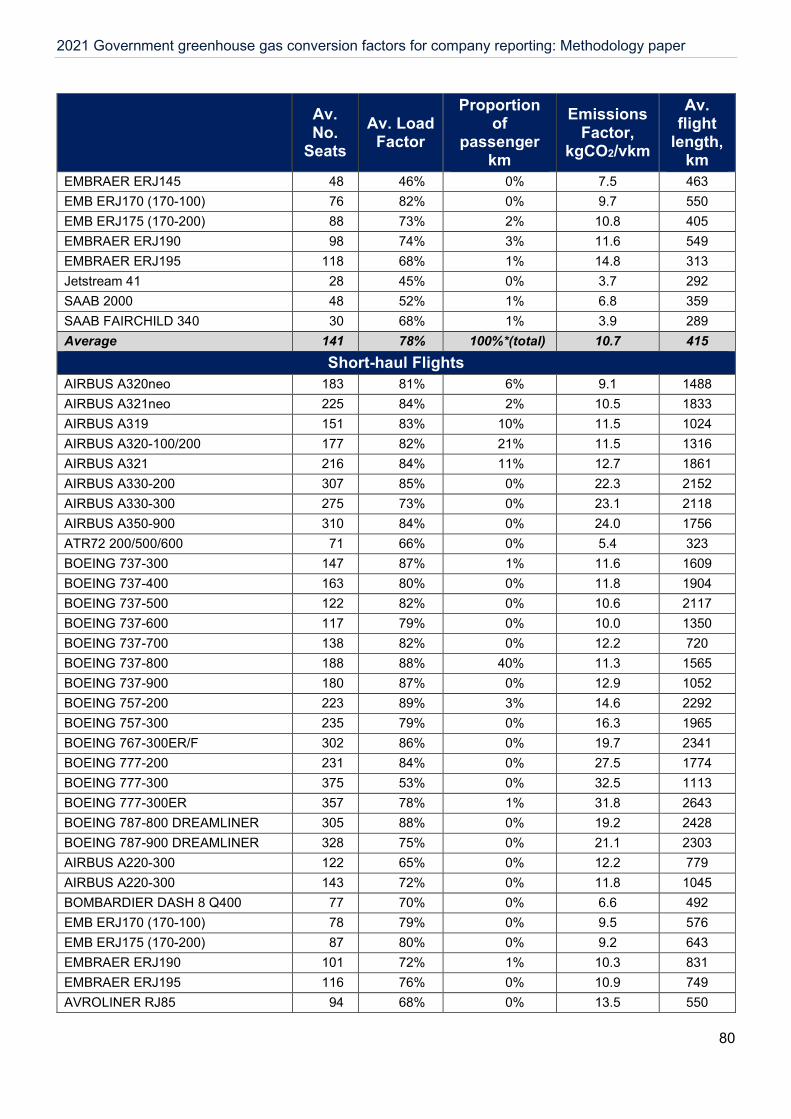
2021 Government greenhouse gas conversion factors for company reporting: Methodology paper
80
Av. No.
Seats Av. Load
Factor
Proportion of
passenger km
Emissions Factor,
kgCO2/vkm
Av. flight
length, km
EMBRAER ERJ145 48 46% 0% 7.5 463 EMB ERJ170 (170-100) 76 82% 0% 9.7 550 EMB ERJ175 (170-200) 88 73% 2% 10.8 405 EMBRAER ERJ190 98 74% 3% 11.6 549 EMBRAER ERJ195 118 68% 1% 14.8 313 Jetstream 41 28 45% 0% 3.7 292 SAAB 2000 48 52% 1% 6.8 359 SAAB FAIRCHILD 340 30 68% 1% 3.9 289 Average 141 78% 100%*(total) 10.7 415
Short-haul Flights AIRBUS A320neo 183 81% 6% 9.1 1488 AIRBUS A321neo 225 84% 2% 10.5 1833 AIRBUS A319 151 83% 10% 11.5 1024 AIRBUS A320-100/200 177 82% 21% 11.5 1316 AIRBUS A321 216 84% 11% 12.7 1861 AIRBUS A330-200 307 85% 0% 22.3 2152 AIRBUS A330-300 275 73% 0% 23.1 2118 AIRBUS A350-900 310 84% 0% 24.0 1756 ATR72 200/500/600 71 66% 0% 5.4 323 BOEING 737-300 147 87% 1% 11.6 1609 BOEING 737-400 163 80% 0% 11.8 1904 BOEING 737-500 122 82% 0% 10.6 2117 BOEING 737-600 117 79% 0% 10.0 1350 BOEING 737-700 138 82% 0% 12.2 720 BOEING 737-800 188 88% 40% 11.3 1565 BOEING 737-900 180 87% 0% 12.9 1052 BOEING 757-200 223 89% 3% 14.6 2292 BOEING 757-300 235 79% 0% 16.3 1965 BOEING 767-300ER/F 302 86% 0% 19.7 2341 BOEING 777-200 231 84% 0% 27.5 1774 BOEING 777-300 375 53% 0% 32.5 1113 BOEING 777-300ER 357 78% 1% 31.8 2643 BOEING 787-800 DREAMLINER 305 88% 0% 19.2 2428 BOEING 787-900 DREAMLINER 328 75% 0% 21.1 2303 AIRBUS A220-300 122 65% 0% 12.2 779 AIRBUS A220-300 143 72% 0% 11.8 1045 BOMBARDIER DASH 8 Q400 77 70% 0% 6.6 492 EMB ERJ170 (170-100) 78 79% 0% 9.5 576 EMB ERJ175 (170-200) 87 80% 0% 9.2 643 EMBRAER ERJ190 101 72% 1% 10.3 831 EMBRAER ERJ195 116 76% 0% 10.9 749 AVROLINER RJ85 94 68% 0% 13.5 550

2021 Government greenhouse gas conversion factors for company reporting: Methodology paper
81
Av. No.
Seats Av. Load
Factor
Proportion of
passenger km
Emissions Factor,
kgCO2/vkm
Av. flight
length, km
Average 187 85% 100%*(total) 11.5 1,316 Long-haul Flights
AIRBUS A320neo 178 87% 0% 8.2 3902 AIRBUS A321neo 211 81% 0% 9.8 4686 AIRBUS A310 250 89% 0% 18.5 5488 AIRBUS A320-100/200 169 86% 0% 10.1 3646 AIRBUS A321 167 83% 0% 11.9 3750 AIRBUS A330-200 276 81% 5% 21.0 6702 AIRBUS A330-300 281 80% 5% 21.8 6362 AIRBUS A340-300 274 85% 0% 25.2 6905 AIRBUS A340-600 305 78% 1% 31.5 5947 BOEING 747-400 329 86% 10% 38.0 6927 BOEING 747-8 (FREIGHTER) 287 74% 0% 36.6 8883 BOEING 757-200 180 85% 1% 14.1 5151 BOEING 757-300 265 26% 0% 15.8 3567 BOEING 767-300ER/F 216 80% 2% 18.8 6027 BOEING 767-400 239 77% 0% 20.7 5648 BOEING 777-200 256 83% 13% 25.4 6814 BOEING 777-300 345 79% 2% 28.3 6759 BOEING 777-F 311 79% 0% 29.6 6040 BOEING 777-300ER 322 83% 15% 30.3 7797 BOEING 787-800 DREAMLINER 245 83% 9% 18.2 7061 BOEING 787-900 DREAMLINER 276 82% 16% 19.8 7561 BOEING 787-1000 DREAMLINER 399 69% 0% 20.1 5730 Average 317 82% 100%*(total) 26.2 6,924
Notes: Figures on seats, load factors, % tkm and av. flight length have been calculated from 2018 CAA statistics for UK registered airlines for the different aircraft types. Figures of kgCO2/vkm were calculated using the average flight lengths in the EUROCONTROL small emitters tool.
* 100% denotes the pkm share of the aircraft included in the assessment - as listed in the table. The aircraft listed in the table above accounts for 100% of domestic pkm, 100% of short-haul pkm and 100% of long-haul pkm.
Allocating flights into short- and long-haul: 8.7. Domestic flights are those that start and end in the United Kingdom
(including the Isle of Man, but excluding the Channel Islands and Gibraltar), which are relatively simple to categorise. However, allocating flights into short- and long-haul is more complicated. In earlier versions of the GHG Conversion factors, it was suggested at a crude level to assign all flights <3700km to short haul and all >3,700km to long-haul (based on the maximum range of a Boeing 737). However, this approach was relatively simplistic, difficult to apply without detailed flight distance calculations, and was not completely consistent with CAA statistical dataset used to define the emission factors.
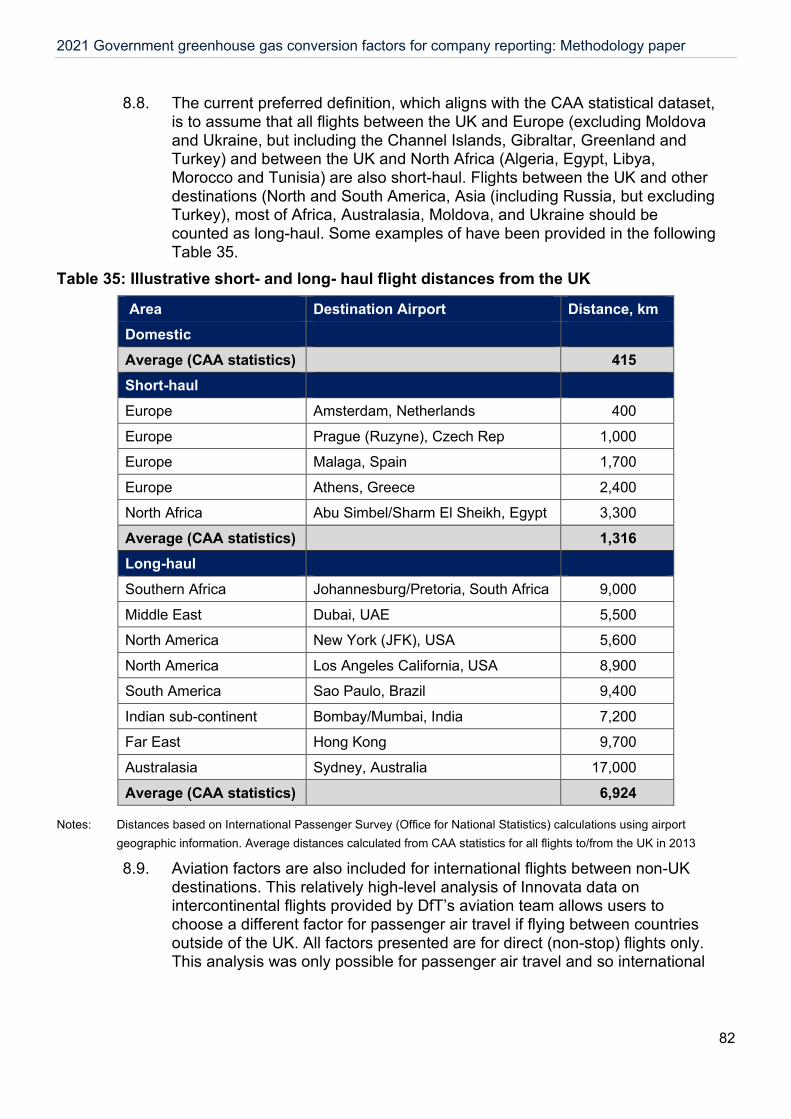
2021 Government greenhouse gas conversion factors for company reporting: Methodology paper
82
8.8. The current preferred definition, which aligns with the CAA statistical dataset, is to assume that all flights between the UK and Europe (excluding Moldova and Ukraine, but including the Channel Islands, Gibraltar, Greenland and Turkey) and between the UK and North Africa (Algeria, Egypt, Libya, Morocco and Tunisia) are also short-haul. Flights between the UK and other destinations (North and South America, Asia (including Russia, but excluding Turkey), most of Africa, Australasia, Moldova, and Ukraine should be counted as long-haul. Some examples of have been provided in the following Table 35.
Table 35: Illustrative short- and long- haul flight distances from the UK
Area Destination Airport Distance, km Domestic Average (CAA statistics) 415 Short-haul
Europe Amsterdam, Netherlands 400 Europe Prague (Ruzyne), Czech Rep 1,000 Europe Malaga, Spain 1,700 Europe Athens, Greece 2,400 North Africa Abu Simbel/Sharm El Sheikh, Egypt 3,300 Average (CAA statistics) 1,316 Long-haul Southern Africa Johannesburg/Pretoria, South Africa 9,000 Middle East Dubai, UAE 5,500 North America New York (JFK), USA 5,600 North America Los Angeles California, USA 8,900 South America Sao Paulo, Brazil 9,400 Indian sub-continent Bombay/Mumbai, India 7,200 Far East Hong Kong 9,700 Australasia Sydney, Australia 17,000 Average (CAA statistics) 6,924
Notes: Distances based on International Passenger Survey (Office for National Statistics) calculations using airport geographic information. Average distances calculated from CAA statistics for all flights to/from the UK in 2013
8.9. Aviation factors are also included for international flights between non-UK destinations. This relatively high-level analysis of Innovata data on intercontinental flights provided by DfT’s aviation team allows users to choose a different factor for passenger air travel if flying between countries outside of the UK. All factors presented are for direct (non-stop) flights only. This analysis was only possible for passenger air travel and so international
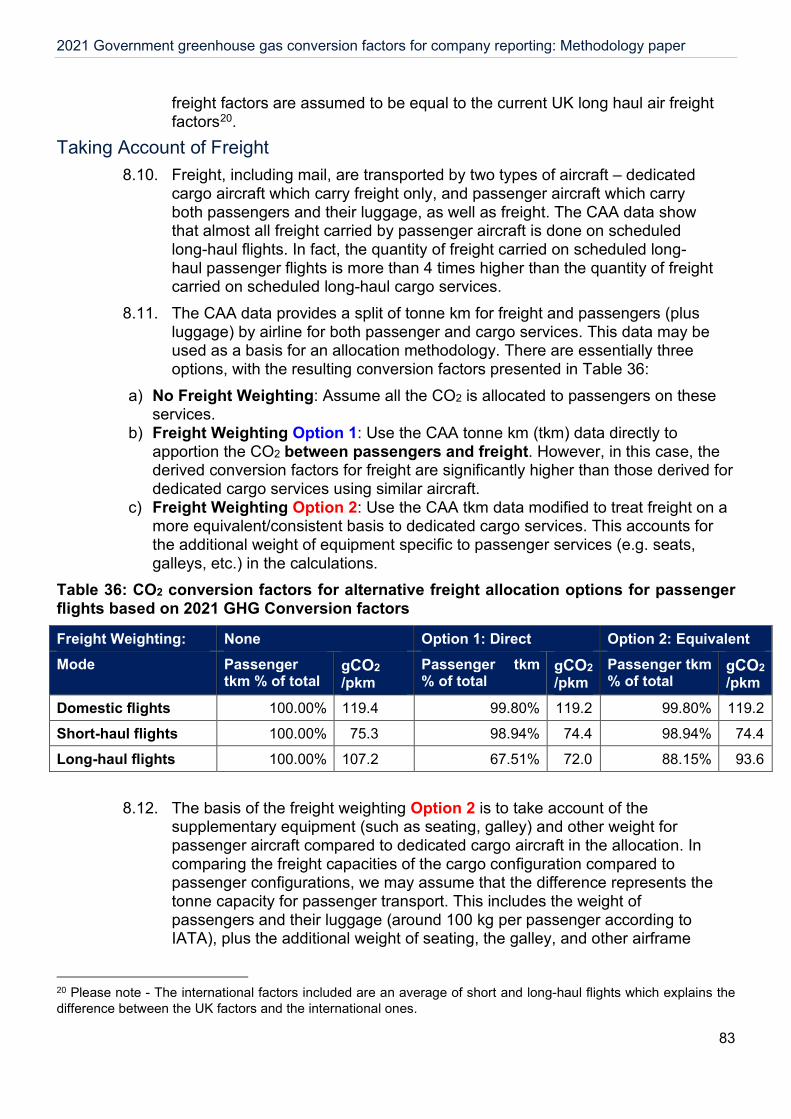
2021 Government greenhouse gas conversion factors for company reporting: Methodology paper
83
freight factors are assumed to be equal to the current UK long haul air freight factors20.
Taking Account of Freight 8.10. Freight, including mail, are transported by two types of aircraft – dedicated
cargo aircraft which carry freight only, and passenger aircraft which carry both passengers and their luggage, as well as freight. The CAA data show that almost all freight carried by passenger aircraft is done on scheduled long-haul flights. In fact, the quantity of freight carried on scheduled long-haul passenger flights is more than 4 times higher than the quantity of freight carried on scheduled long-haul cargo services.
8.11. The CAA data provides a split of tonne km for freight and passengers (plus luggage) by airline for both passenger and cargo services. This data may be used as a basis for an allocation methodology. There are essentially three options, with the resulting conversion factors presented in Table 36:
a) No Freight Weighting: Assume all the CO2 is allocated to passengers on these services.
b) Freight Weighting Option 1: Use the CAA tonne km (tkm) data directly to apportion the CO2 between passengers and freight. However, in this case, the derived conversion factors for freight are significantly higher than those derived for dedicated cargo services using similar aircraft.
c) Freight Weighting Option 2: Use the CAA tkm data modified to treat freight on a more equivalent/consistent basis to dedicated cargo services. This accounts for the additional weight of equipment specific to passenger services (e.g. seats, galleys, etc.) in the calculations.
Table 36: CO2 conversion factors for alternative freight allocation options for passenger flights based on 2021 GHG Conversion factors
Freight Weighting: None Option 1: Direct Option 2: Equivalent Mode Passenger
tkm % of total gCO2 /pkm
Passenger tkm % of total
gCO2 /pkm
Passenger tkm % of total
gCO2 /pkm
Domestic flights 100.00% 119.4 99.80% 119.2 99.80% 119.2
Short-haul flights 100.00% 75.3 98.94% 74.4 98.94% 74.4
Long-haul flights 100.00% 107.2 67.51% 72.0 88.15% 93.6
8.12. The basis of the freight weighting Option 2 is to take account of the supplementary equipment (such as seating, galley) and other weight for passenger aircraft compared to dedicated cargo aircraft in the allocation. In comparing the freight capacities of the cargo configuration compared to passenger configurations, we may assume that the difference represents the tonne capacity for passenger transport. This includes the weight of passengers and their luggage (around 100 kg per passenger according to IATA), plus the additional weight of seating, the galley, and other airframe
20 Please note - The international factors included are an average of short and long-haul flights which explains the difference between the UK factors and the international ones.
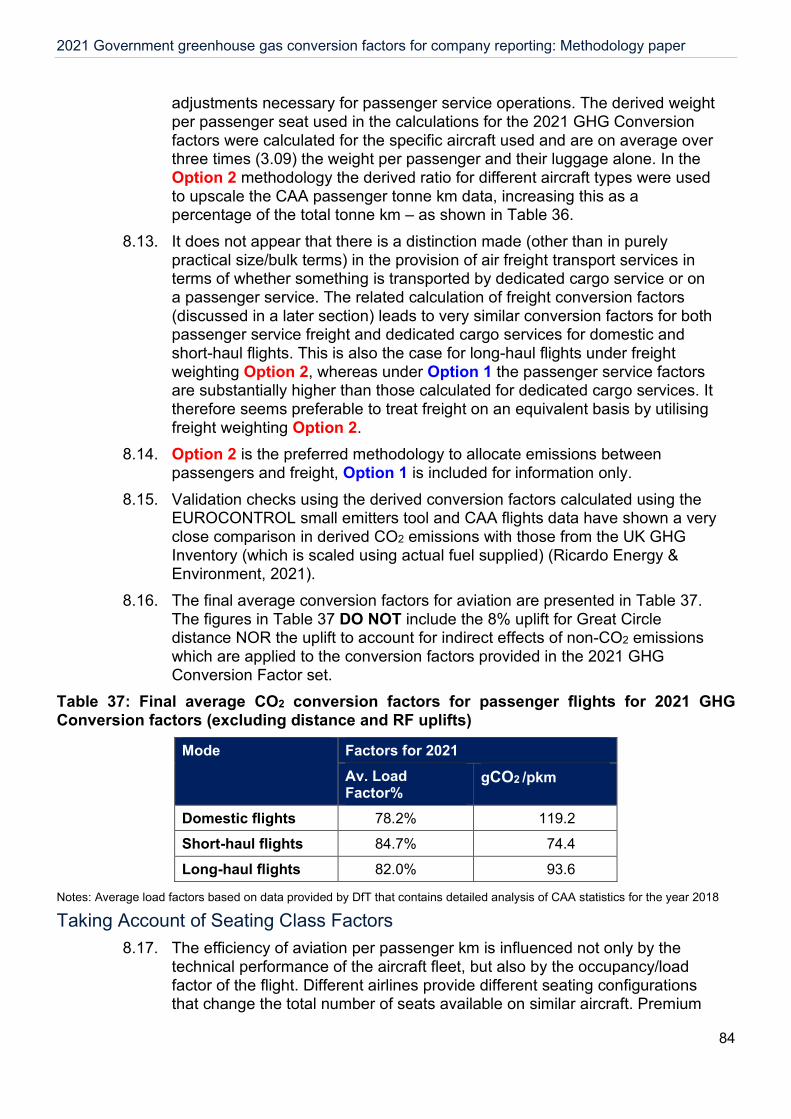
2021 Government greenhouse gas conversion factors for company reporting: Methodology paper
84
adjustments necessary for passenger service operations. The derived weight per passenger seat used in the calculations for the 2021 GHG Conversion factors were calculated for the specific aircraft used and are on average over three times (3.09) the weight per passenger and their luggage alone. In the Option 2 methodology the derived ratio for different aircraft types were used to upscale the CAA passenger tonne km data, increasing this as a percentage of the total tonne km – as shown in Table 36.
8.13. It does not appear that there is a distinction made (other than in purely practical size/bulk terms) in the provision of air freight transport services in terms of whether something is transported by dedicated cargo service or on a passenger service. The related calculation of freight conversion factors (discussed in a later section) leads to very similar conversion factors for both passenger service freight and dedicated cargo services for domestic and short-haul flights. This is also the case for long-haul flights under freight weighting Option 2, whereas under Option 1 the passenger service factors are substantially higher than those calculated for dedicated cargo services. It therefore seems preferable to treat freight on an equivalent basis by utilising freight weighting Option 2.
8.14. Option 2 is the preferred methodology to allocate emissions between passengers and freight, Option 1 is included for information only.
8.15. Validation checks using the derived conversion factors calculated using the EUROCONTROL small emitters tool and CAA flights data have shown a very close comparison in derived CO2 emissions with those from the UK GHG Inventory (which is scaled using actual fuel supplied) (Ricardo Energy & Environment, 2021).
8.16. The final average conversion factors for aviation are presented in Table 37. The figures in Table 37 DO NOT include the 8% uplift for Great Circle distance NOR the uplift to account for indirect effects of non-CO2 emissions which are applied to the conversion factors provided in the 2021 GHG Conversion Factor set.
Table 37: Final average CO2 conversion factors for passenger flights for 2021 GHG Conversion factors (excluding distance and RF uplifts)
Mode Factors for 2021 Av. Load Factor%
gCO2 /pkm
Domestic flights 78.2% 119.2
Short-haul flights 84.7% 74.4
Long-haul flights 82.0% 93.6
Notes: Average load factors based on data provided by DfT that contains detailed analysis of CAA statistics for the year 2018
Taking Account of Seating Class Factors 8.17. The efficiency of aviation per passenger km is influenced not only by the
technical performance of the aircraft fleet, but also by the occupancy/load factor of the flight. Different airlines provide different seating configurations that change the total number of seats available on similar aircraft. Premium
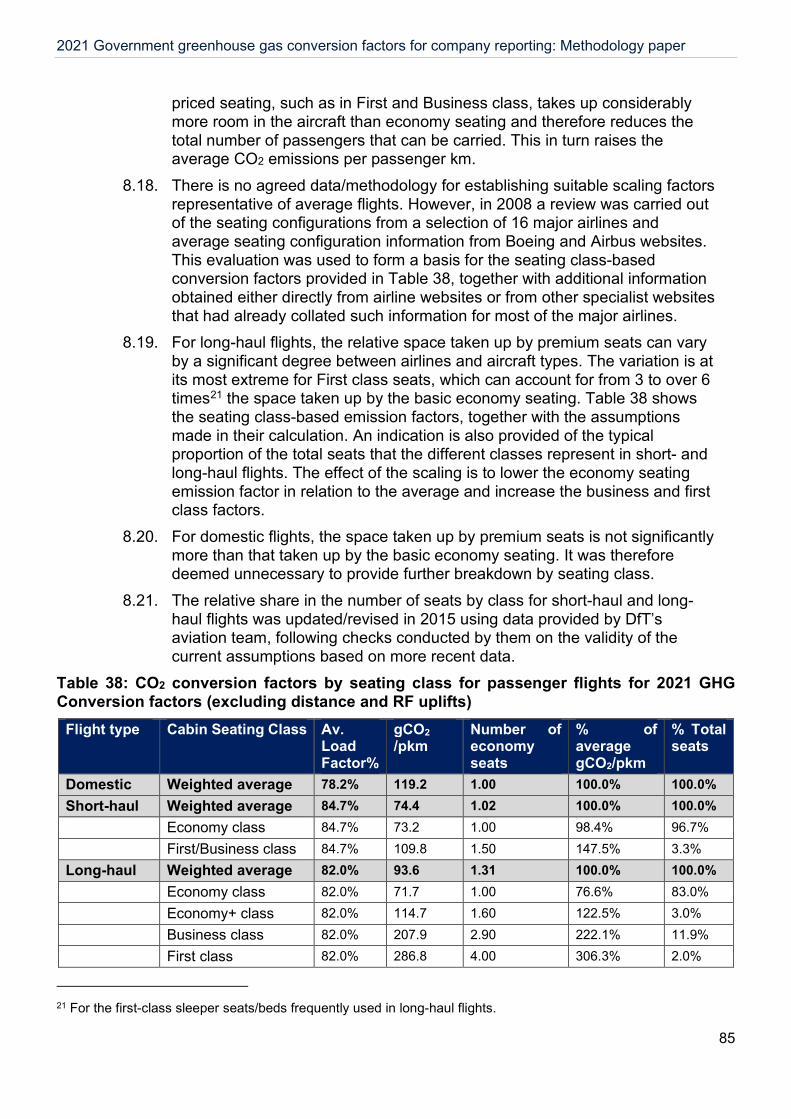
2021 Government greenhouse gas conversion factors for company reporting: Methodology paper
85
priced seating, such as in First and Business class, takes up considerably more room in the aircraft than economy seating and therefore reduces the total number of passengers that can be carried. This in turn raises the average CO2 emissions per passenger km.
8.18. There is no agreed data/methodology for establishing suitable scaling factors representative of average flights. However, in 2008 a review was carried out of the seating configurations from a selection of 16 major airlines and average seating configuration information from Boeing and Airbus websites. This evaluation was used to form a basis for the seating class-based conversion factors provided in Table 38, together with additional information obtained either directly from airline websites or from other specialist websites that had already collated such information for most of the major airlines.
8.19. For long-haul flights, the relative space taken up by premium seats can vary by a significant degree between airlines and aircraft types. The variation is at its most extreme for First class seats, which can account for from 3 to over 6 times21 the space taken up by the basic economy seating. Table 38 shows the seating class-based emission factors, together with the assumptions made in their calculation. An indication is also provided of the typical proportion of the total seats that the different classes represent in short- and long-haul flights. The effect of the scaling is to lower the economy seating emission factor in relation to the average and increase the business and first class factors.
8.20. For domestic flights, the space taken up by premium seats is not significantly more than that taken up by the basic economy seating. It was therefore deemed unnecessary to provide further breakdown by seating class.
8.21. The relative share in the number of seats by class for short-haul and long-haul flights was updated/revised in 2015 using data provided by DfT’s aviation team, following checks conducted by them on the validity of the current assumptions based on more recent data.
Table 38: CO2 conversion factors by seating class for passenger flights for 2021 GHG Conversion factors (excluding distance and RF uplifts)
Flight type Cabin Seating Class Av. Load Factor%
gCO2 /pkm
Number of economy seats
% of average gCO2/pkm
% Total seats
Domestic Weighted average 78.2% 119.2 1.00 100.0% 100.0% Short-haul Weighted average 84.7% 74.4 1.02 100.0% 100.0% Economy class 84.7% 73.2 1.00 98.4% 96.7% First/Business class 84.7% 109.8 1.50 147.5% 3.3% Long-haul Weighted average 82.0% 93.6 1.31 100.0% 100.0% Economy class 82.0% 71.7 1.00 76.6% 83.0% Economy+ class 82.0% 114.7 1.60 122.5% 3.0% Business class 82.0% 207.9 2.90 222.1% 11.9% First class 82.0% 286.8 4.00 306.3% 2.0%
21 For the first-class sleeper seats/beds frequently used in long-haul flights.
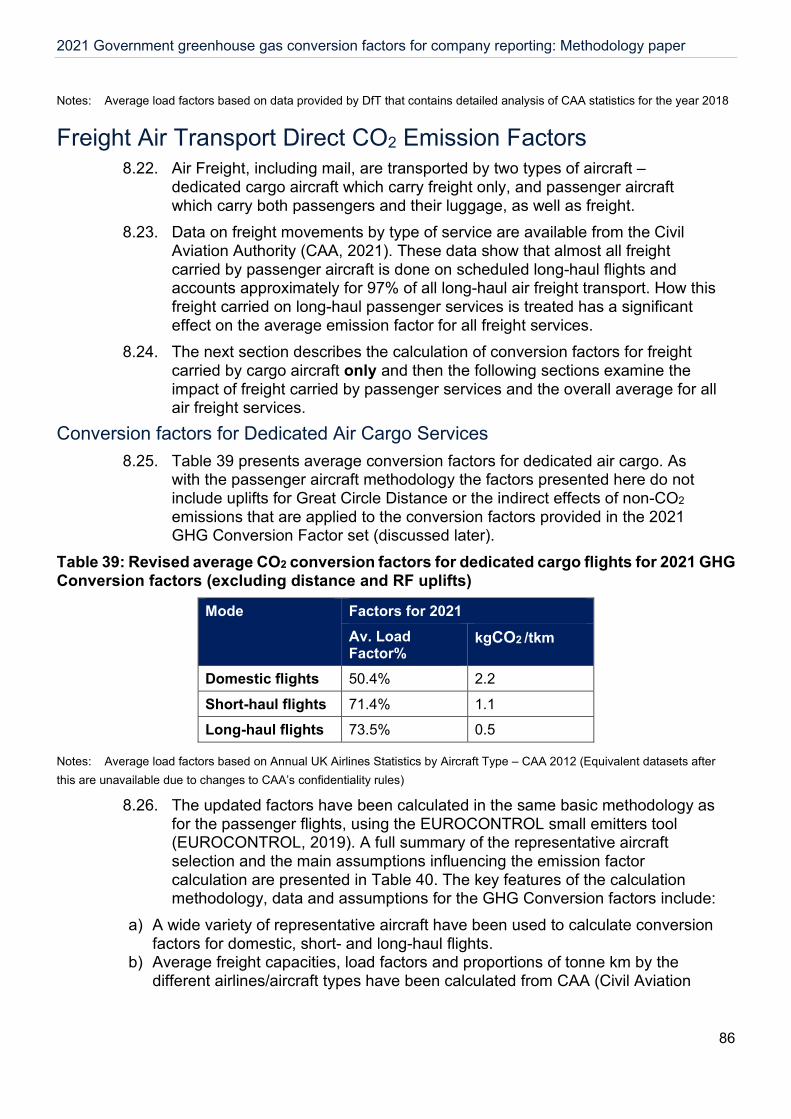
2021 Government greenhouse gas conversion factors for company reporting: Methodology paper
86
Notes: Average load factors based on data provided by DfT that contains detailed analysis of CAA statistics for the year 2018
Freight Air Transport Direct CO2 Emission Factors 8.22. Air Freight, including mail, are transported by two types of aircraft –
dedicated cargo aircraft which carry freight only, and passenger aircraft which carry both passengers and their luggage, as well as freight.
8.23. Data on freight movements by type of service are available from the Civil Aviation Authority (CAA, 2021). These data show that almost all freight carried by passenger aircraft is done on scheduled long-haul flights and accounts approximately for 97% of all long-haul air freight transport. How this freight carried on long-haul passenger services is treated has a significant effect on the average emission factor for all freight services.
8.24. The next section describes the calculation of conversion factors for freight carried by cargo aircraft only and then the following sections examine the impact of freight carried by passenger services and the overall average for all air freight services.
Conversion factors for Dedicated Air Cargo Services 8.25. Table 39 presents average conversion factors for dedicated air cargo. As
with the passenger aircraft methodology the factors presented here do not include uplifts for Great Circle Distance or the indirect effects of non-CO2 emissions that are applied to the conversion factors provided in the 2021 GHG Conversion Factor set (discussed later).
Table 39: Revised average CO2 conversion factors for dedicated cargo flights for 2021 GHG Conversion factors (excluding distance and RF uplifts)
Mode Factors for 2021 Av. Load Factor%
kgCO2 /tkm
Domestic flights 50.4% 2.2
Short-haul flights 71.4% 1.1
Long-haul flights 73.5% 0.5
Notes: Average load factors based on Annual UK Airlines Statistics by Aircraft Type – CAA 2012 (Equivalent datasets after this are unavailable due to changes to CAA’s confidentiality rules)
8.26. The updated factors have been calculated in the same basic methodology as for the passenger flights, using the EUROCONTROL small emitters tool (EUROCONTROL, 2019). A full summary of the representative aircraft selection and the main assumptions influencing the emission factor calculation are presented in Table 40. The key features of the calculation methodology, data and assumptions for the GHG Conversion factors include:
a) A wide variety of representative aircraft have been used to calculate conversion factors for domestic, short- and long-haul flights.
b) Average freight capacities, load factors and proportions of tonne km by the different airlines/aircraft types have been calculated from CAA (Civil Aviation
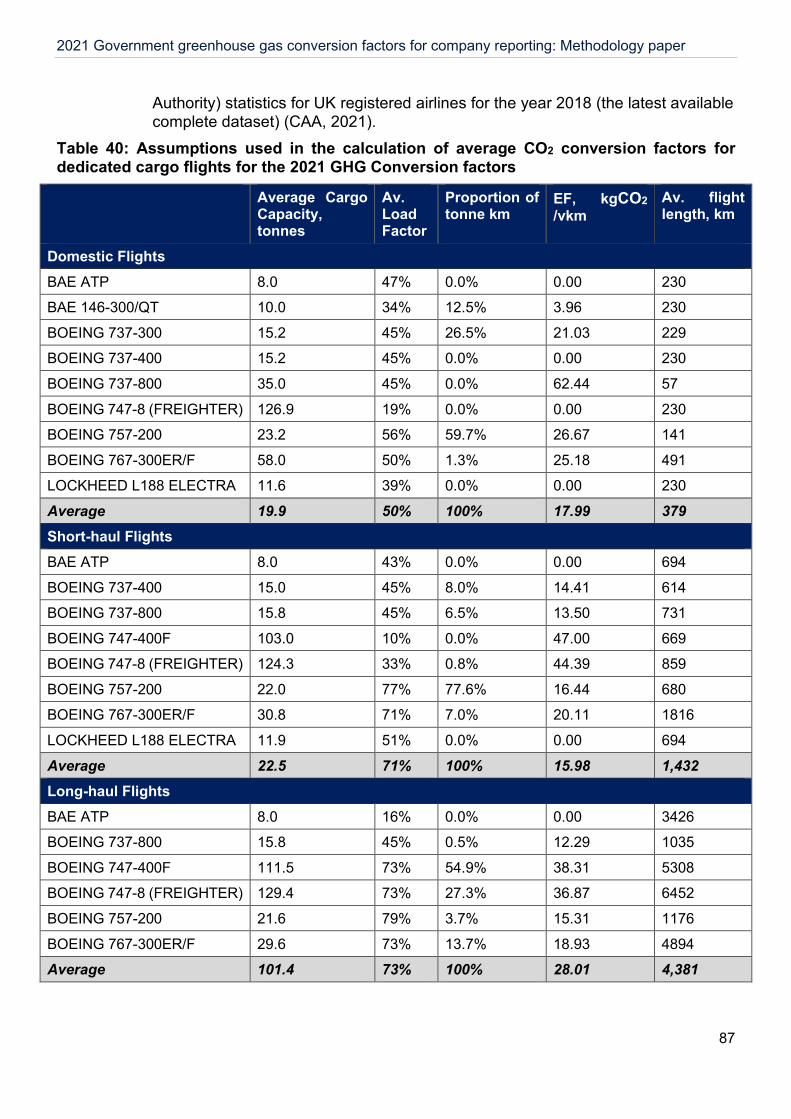
2021 Government greenhouse gas conversion factors for company reporting: Methodology paper
87
Authority) statistics for UK registered airlines for the year 2018 (the latest available complete dataset) (CAA, 2021).
Table 40: Assumptions used in the calculation of average CO2 conversion factors for dedicated cargo flights for the 2021 GHG Conversion factors
Average Cargo Capacity, tonnes
Av. Load Factor
Proportion of tonne km
EF, kgCO2 /vkm
Av. flight length, km
Domestic Flights BAE ATP 8.0 47% 0.0% 0.00 230
BAE 146-300/QT 10.0 34% 12.5% 3.96 230
BOEING 737-300 15.2 45% 26.5% 21.03 229
BOEING 737-400 15.2 45% 0.0% 0.00 230
BOEING 737-800 35.0 45% 0.0% 62.44 57
BOEING 747-8 (FREIGHTER) 126.9 19% 0.0% 0.00 230
BOEING 757-200 23.2 56% 59.7% 26.67 141
BOEING 767-300ER/F 58.0 50% 1.3% 25.18 491
LOCKHEED L188 ELECTRA 11.6 39% 0.0% 0.00 230
Average 19.9 50% 100% 17.99 379 Short-haul Flights BAE ATP 8.0 43% 0.0% 0.00 694
BOEING 737-400 15.0 45% 8.0% 14.41 614
BOEING 737-800 15.8 45% 6.5% 13.50 731
BOEING 747-400F 103.0 10% 0.0% 47.00 669
BOEING 747-8 (FREIGHTER) 124.3 33% 0.8% 44.39 859
BOEING 757-200 22.0 77% 77.6% 16.44 680
BOEING 767-300ER/F 30.8 71% 7.0% 20.11 1816
LOCKHEED L188 ELECTRA 11.9 51% 0.0% 0.00 694
Average 22.5 71% 100% 15.98 1,432 Long-haul Flights BAE ATP 8.0 16% 0.0% 0.00 3426
BOEING 737-800 15.8 45% 0.5% 12.29 1035
BOEING 747-400F 111.5 73% 54.9% 38.31 5308
BOEING 747-8 (FREIGHTER) 129.4 73% 27.3% 36.87 6452
BOEING 757-200 21.6 79% 3.7% 15.31 1176
BOEING 767-300ER/F 29.6 73% 13.7% 18.93 4894
Average 101.4 73% 100% 28.01 4,381
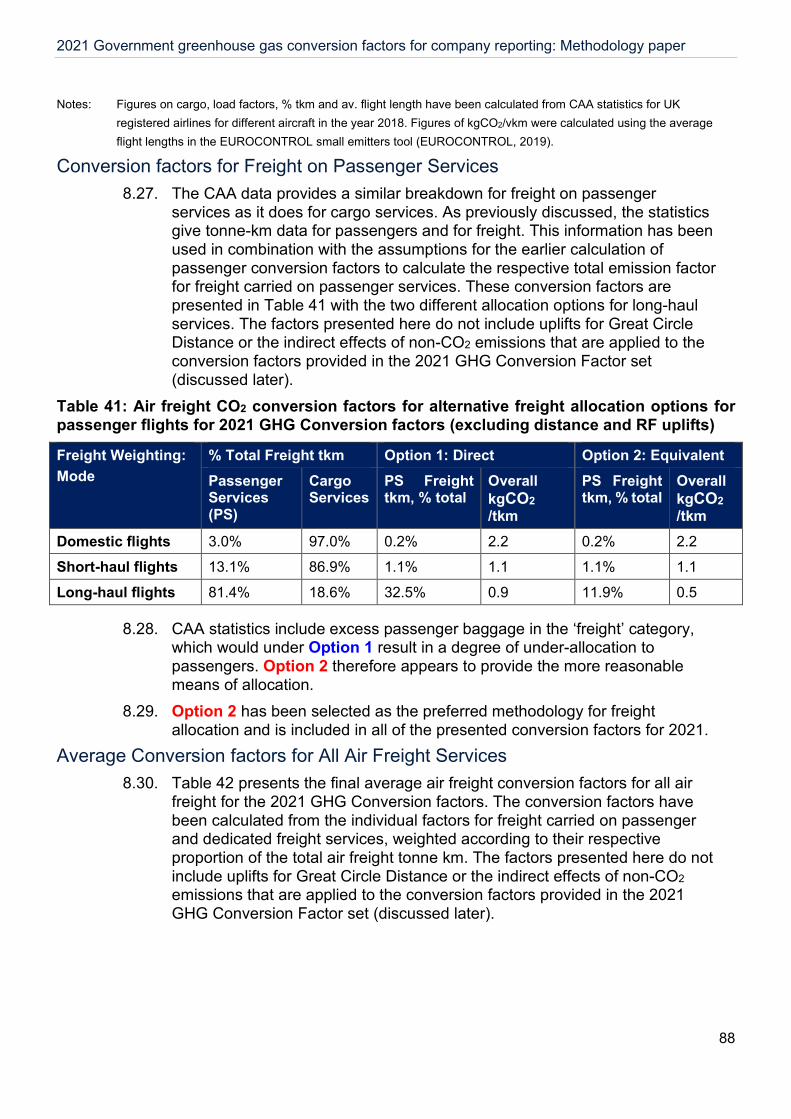
2021 Government greenhouse gas conversion factors for company reporting: Methodology paper
88
Notes: Figures on cargo, load factors, % tkm and av. flight length have been calculated from CAA statistics for UK registered airlines for different aircraft in the year 2018. Figures of kgCO2/vkm were calculated using the average flight lengths in the EUROCONTROL small emitters tool (EUROCONTROL, 2019).
Conversion factors for Freight on Passenger Services 8.27. The CAA data provides a similar breakdown for freight on passenger
services as it does for cargo services. As previously discussed, the statistics give tonne-km data for passengers and for freight. This information has been used in combination with the assumptions for the earlier calculation of passenger conversion factors to calculate the respective total emission factor for freight carried on passenger services. These conversion factors are presented in Table 41 with the two different allocation options for long-haul services. The factors presented here do not include uplifts for Great Circle Distance or the indirect effects of non-CO2 emissions that are applied to the conversion factors provided in the 2021 GHG Conversion Factor set (discussed later).
Table 41: Air freight CO2 conversion factors for alternative freight allocation options for passenger flights for 2021 GHG Conversion factors (excluding distance and RF uplifts)
Freight Weighting: Mode
% Total Freight tkm Option 1: Direct Option 2: Equivalent Passenger Services (PS)
Cargo Services
PS Freight tkm, % total
Overall kgCO2 /tkm
PS Freight tkm, % total
Overall kgCO2 /tkm
Domestic flights 3.0% 97.0% 0.2% 2.2 0.2% 2.2
Short-haul flights 13.1% 86.9% 1.1% 1.1 1.1% 1.1
Long-haul flights 81.4% 18.6% 32.5% 0.9 11.9% 0.5
8.28. CAA statistics include excess passenger baggage in the ‘freight’ category, which would under Option 1 result in a degree of under-allocation to passengers. Option 2 therefore appears to provide the more reasonable means of allocation.
8.29. Option 2 has been selected as the preferred methodology for freight allocation and is included in all of the presented conversion factors for 2021.
Average Conversion factors for All Air Freight Services 8.30. Table 42 presents the final average air freight conversion factors for all air
freight for the 2021 GHG Conversion factors. The conversion factors have been calculated from the individual factors for freight carried on passenger and dedicated freight services, weighted according to their respective proportion of the total air freight tonne km. The factors presented here do not include uplifts for Great Circle Distance or the indirect effects of non-CO2 emissions that are applied to the conversion factors provided in the 2021 GHG Conversion Factor set (discussed later).

2021 Government greenhouse gas conversion factors for company reporting: Methodology paper
89
Table 42: Final average CO2 conversion factors for all air freight for 2021 GHG Conversion factors (excluding distance and RF uplifts)
Mode % Total Air Freight tkm All Air Freight kgCO2/tkm Passenger Services Cargo Services
Domestic flights 3.0% 97.0% 2.2
Short-haul flights 13.1% 86.9% 1.1
Long-haul flights 81.4% 18.6% 0.5
Notes: % Total Air Freight tkm based on CAA statistics for 2018 (T0.1.6 All Services)
Air Transport Direct Conversion factors for CH4 and N2O Emissions of CH4
8.31. Total emissions of CO2, CH4 and N2O are calculated in detail and reported at an aggregate level for aviation as a whole in the UK GHG inventory. The relative proportions of total CO2 and CH4 emissions from the UK GHG inventory for 2018 (Ricardo Energy & Environment, 2021) (see Table 43) were used to calculate the specific CH4 conversion factors per passenger km or tonne-km relative to the corresponding CO2 emission factors. The resulting air transport conversion factors for the 2021 GHG Conversion factors are presented in Table 44 for passengers and Table 45 for freight.
Table 43: Total emissions of CO2, CH4 and N2O for domestic and international aircraft from the UK GHG inventory for 2018
CO2 CH4 N2O
Mt CO2e % Total CO2e
Mt CO2e % Total CO2e
Mt CO2e % Total CO2e
Aircraft - domestic 1.49 98.98% 0.0012 0.08% 0.014 0.94%
Aircraft - international 36.49 99.06% 0.0025 0.01% 0.345 0.94%
Emissions of N2O 8.32. Similar to those for CH4, conversion factors for N2O per passenger-km or
tonne-km were calculated on the basis of the relative proportions of total CO2 and N2O emissions from the UK GHG inventory for 2018 (Ricardo Energy & Environment, 2021) (see Table 43), and the corresponding CO2 emission factors. The resulting air transport conversion factors for the 2021 GHG Conversion factors are presented in Table 44 for passengers and Table 45 for freight. The factors presented here do not include uplifts for Great Circle Distance or the indirect effects of non-CO2 emissions that are applied to the conversion factors provided in the 2021 GHG Conversion Factor set (discussed later).
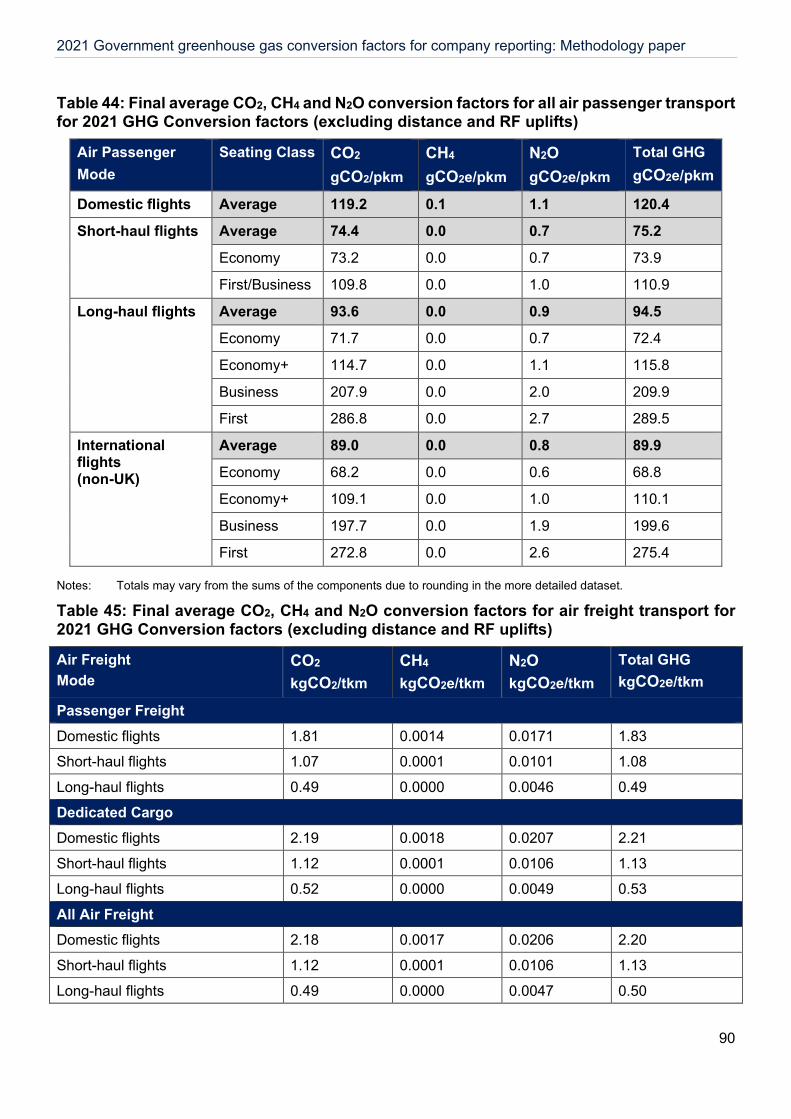
2021 Government greenhouse gas conversion factors for company reporting: Methodology paper
90
Table 44: Final average CO2, CH4 and N2O conversion factors for all air passenger transport for 2021 GHG Conversion factors (excluding distance and RF uplifts)
Air Passenger Mode
Seating Class CO2 gCO2/pkm
CH4 gCO2e/pkm
N2O gCO2e/pkm
Total GHG gCO2e/pkm
Domestic flights Average 119.2 0.1 1.1 120.4
Short-haul flights Average 74.4 0.0 0.7 75.2
Economy 73.2 0.0 0.7 73.9
First/Business 109.8 0.0 1.0 110.9
Long-haul flights Average 93.6 0.0 0.9 94.5
Economy 71.7 0.0 0.7 72.4
Economy+ 114.7 0.0 1.1 115.8
Business 207.9 0.0 2.0 209.9
First 286.8 0.0 2.7 289.5
International flights (non-UK)
Average 89.0 0.0 0.8 89.9
Economy 68.2 0.0 0.6 68.8
Economy+ 109.1 0.0 1.0 110.1
Business 197.7 0.0 1.9 199.6
First 272.8 0.0 2.6 275.4
Notes: Totals may vary from the sums of the components due to rounding in the more detailed dataset.
Table 45: Final average CO2, CH4 and N2O conversion factors for air freight transport for 2021 GHG Conversion factors (excluding distance and RF uplifts)
Air Freight Mode
CO2 kgCO2/tkm
CH4 kgCO2e/tkm
N2O kgCO2e/tkm
Total GHG kgCO2e/tkm
Passenger Freight Domestic flights 1.81 0.0014 0.0171 1.83
Short-haul flights 1.07 0.0001 0.0101 1.08
Long-haul flights 0.49 0.0000 0.0046 0.49
Dedicated Cargo
Domestic flights 2.19 0.0018 0.0207 2.21
Short-haul flights 1.12 0.0001 0.0106 1.13
Long-haul flights 0.52 0.0000 0.0049 0.53
All Air Freight Domestic flights 2.18 0.0017 0.0206 2.20
Short-haul flights 1.12 0.0001 0.0106 1.13
Long-haul flights 0.49 0.0000 0.0047 0.50
2021 Government greenhouse gas conversion factors for company reporting: Methodology paper
91
Notes: Totals may vary from the sums of the components due to rounding in the more detailed dataset.
Indirect/WTT Conversion factors from Air Transport 8.33. Indirect/WTT emissions factors for air passenger and air freight services
include only emissions resulting from the fuel lifecycle (i.e. production and distribution of the relevant transport fuel). These indirect/WTT conversion factors were derived using simple ratios of the direct CO2 conversion factors and the indirect/WTT conversion factors for aviation turbine fuel (kerosene) and the corresponding direct CO2 conversion factors for air passenger and air freight transport in the “Business travel – air” and “Freighting goods” worksheets.
Other Factors for the Calculation of GHG Emissions Great Circle Flight Distances
8.34. We wish to see standardisation in the way that emissions from flights are calculated in terms of the distance travelled and any uplift factors applied to account for circling and delay. However, we acknowledge that a number of methods are currently used.
8.35. An 8% uplift factor is used in the UK Greenhouse Gas Inventory to scale up Great Circle distances (GCD) for flights between airports to account for indirect flight paths and delays, etc. This is lower than the 9-10% suggested by IPCC Aviation and the global atmosphere, but has been agreed with DfT based on recent analysis as more appropriate for flights arriving and departing from the UK. This factor has been used since the 2014 update of both the GHGI, and the GHG Conversion factors set.
8.36. It is not practical to provide a database of origin and destination airports to calculate flight distances in the GHG Conversion factors. However, the principal of adding a factor of 8% to distances calculated on a Great Circle is recommended (for consistency with the existing approach) to take account of indirect flight paths and delays/congestion/circling. This is the methodology recommended to be used with the GHG Conversion factors and is applied already to the conversion factors presented in the 2021 GHG Conversion factors set.
Indirect effects of non-CO2 emissions 8.37. The conversion factors provided in the 2021 GHG Conversion factors
“Business travel – air” and “Freighting goods” worksheets refer to aviation's direct CO2, CH4 and N2O emissions only. There is currently uncertainty over the other non-CO2 climate change effects of aviation (including water vapour, contrails, NOX, etc.) which have been indicatively accounted for by applying a multiplier in some cases.
8.38. Currently there is no suitable climate metric to express the relationship between emissions and climate warming effects from aviation, but this is an active area of research. Nonetheless, aviation imposes other effects on the climate which are greater than that implied from simply considering its CO2 emissions alone.
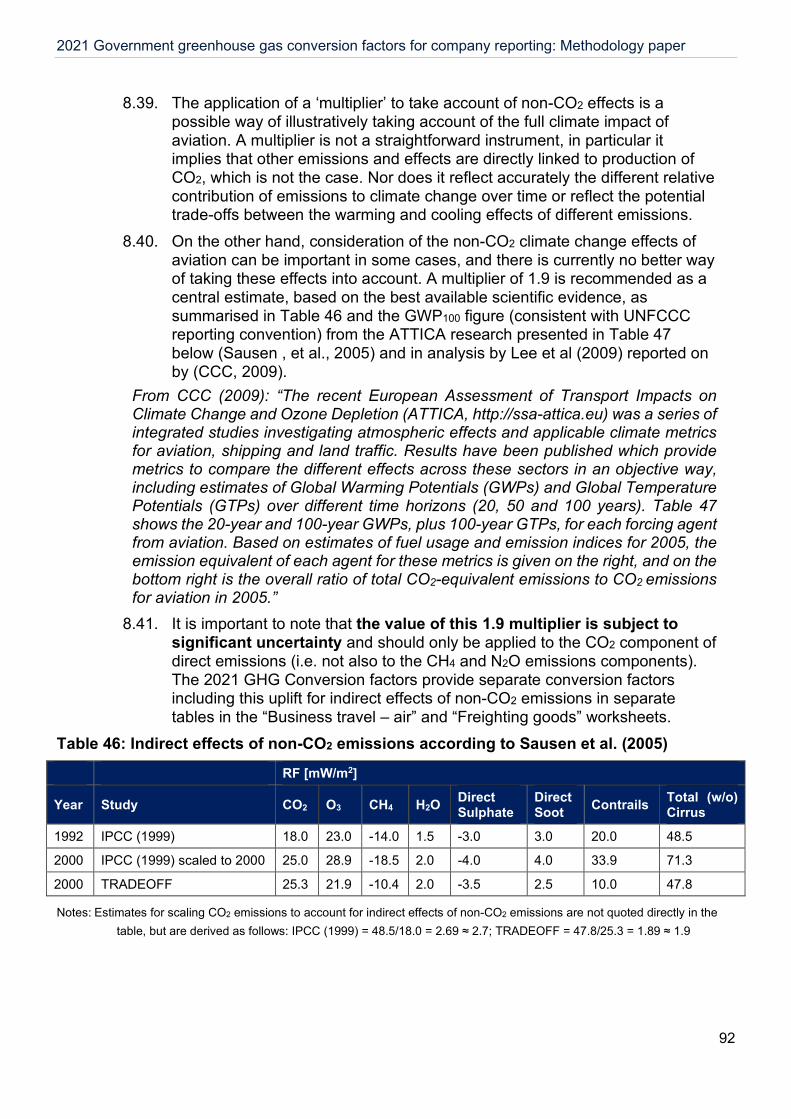
2021 Government greenhouse gas conversion factors for company reporting: Methodology paper
92
8.39. The application of a ‘multiplier’ to take account of non-CO2 effects is a possible way of illustratively taking account of the full climate impact of aviation. A multiplier is not a straightforward instrument, in particular it implies that other emissions and effects are directly linked to production of CO2, which is not the case. Nor does it reflect accurately the different relative contribution of emissions to climate change over time or reflect the potential trade-offs between the warming and cooling effects of different emissions.
8.40. On the other hand, consideration of the non-CO2 climate change effects of aviation can be important in some cases, and there is currently no better way of taking these effects into account. A multiplier of 1.9 is recommended as a central estimate, based on the best available scientific evidence, as summarised in Table 46 and the GWP100 figure (consistent with UNFCCC reporting convention) from the ATTICA research presented in Table 47 below (Sausen , et al., 2005) and in analysis by Lee et al (2009) reported on by (CCC, 2009).
From CCC (2009): “The recent European Assessment of Transport Impacts on Climate Change and Ozone Depletion (ATTICA, http://ssa-attica.eu) was a series of integrated studies investigating atmospheric effects and applicable climate metrics for aviation, shipping and land traffic. Results have been published which provide metrics to compare the different effects across these sectors in an objective way, including estimates of Global Warming Potentials (GWPs) and Global Temperature Potentials (GTPs) over different time horizons (20, 50 and 100 years). Table 47 shows the 20-year and 100-year GWPs, plus 100-year GTPs, for each forcing agent from aviation. Based on estimates of fuel usage and emission indices for 2005, the emission equivalent of each agent for these metrics is given on the right, and on the bottom right is the overall ratio of total CO2-equivalent emissions to CO2 emissions for aviation in 2005.”
8.41. It is important to note that the value of this 1.9 multiplier is subject to significant uncertainty and should only be applied to the CO2 component of direct emissions (i.e. not also to the CH4 and N2O emissions components). The 2021 GHG Conversion factors provide separate conversion factors including this uplift for indirect effects of non-CO2 emissions in separate tables in the “Business travel – air” and “Freighting goods” worksheets.
Table 46: Indirect effects of non-CO2 emissions according to Sausen et al. (2005)
RF [mW/m2]
Year Study CO2 O3 CH4 H2O Direct Sulphate
Direct Soot Contrails Total (w/o)
Cirrus
1992 IPCC (1999) 18.0 23.0 -14.0 1.5 -3.0 3.0 20.0 48.5
2000 IPCC (1999) scaled to 2000 25.0 28.9 -18.5 2.0 -4.0 4.0 33.9 71.3
2000 TRADEOFF 25.3 21.9 -10.4 2.0 -3.5 2.5 10.0 47.8
Notes: Estimates for scaling CO2 emissions to account for indirect effects of non-CO2 emissions are not quoted directly in the table, but are derived as follows: IPCC (1999) = 48.5/18.0 = 2.69 ≈ 2.7; TRADEOFF = 47.8/25.3 = 1.89 ≈ 1.9
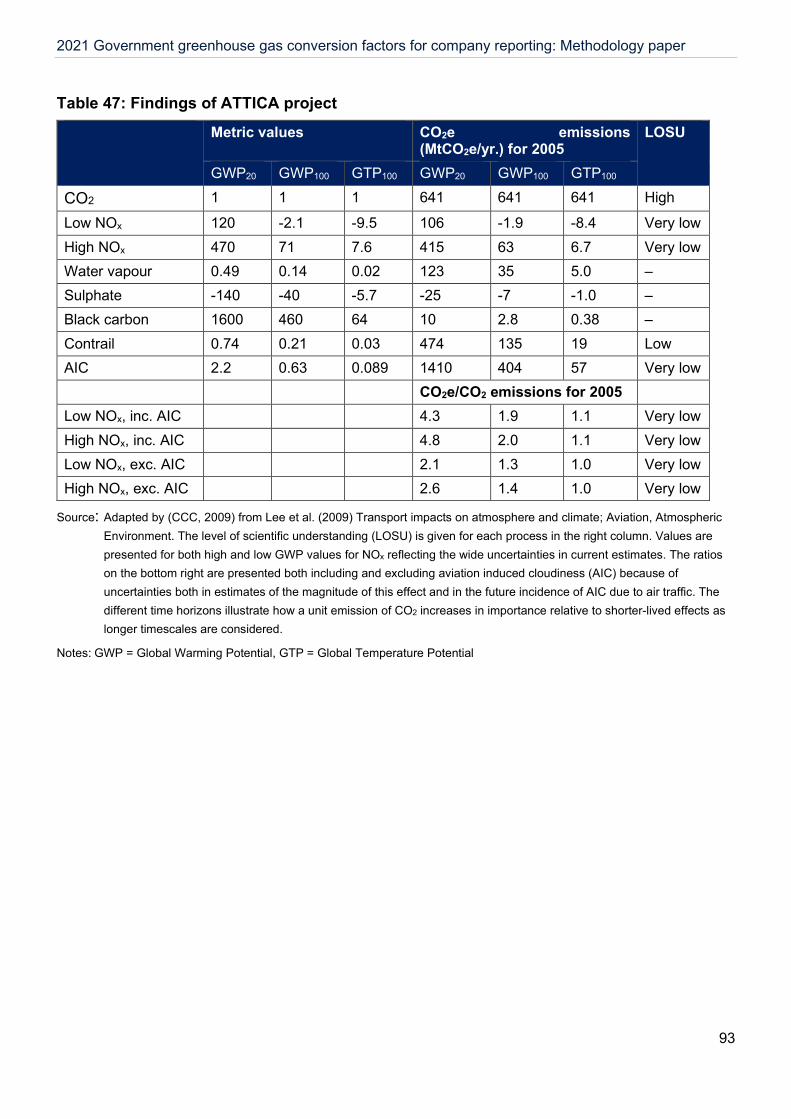
2021 Government greenhouse gas conversion factors for company reporting: Methodology paper
93
Table 47: Findings of ATTICA project
Metric values CO2e emissions (MtCO2e/yr.) for 2005
LOSU
GWP20 GWP100 GTP100 GWP20 GWP100 GTP100 CO2 1 1 1 641 641 641 High
Low NOx 120 -2.1 -9.5 106 -1.9 -8.4 Very low High NOx 470 71 7.6 415 63 6.7 Very low Water vapour 0.49 0.14 0.02 123 35 5.0 – Sulphate -140 -40 -5.7 -25 -7 -1.0 – Black carbon 1600 460 64 10 2.8 0.38 – Contrail 0.74 0.21 0.03 474 135 19 Low AIC 2.2 0.63 0.089 1410 404 57 Very low CO2e/CO2 emissions for 2005 Low NOx, inc. AIC 4.3 1.9 1.1 Very low High NOx, inc. AIC 4.8 2.0 1.1 Very low Low NOx, exc. AIC 2.1 1.3 1.0 Very low High NOx, exc. AIC 2.6 1.4 1.0 Very low
Source: Adapted by (CCC, 2009) from Lee et al. (2009) Transport impacts on atmosphere and climate; Aviation, Atmospheric Environment. The level of scientific understanding (LOSU) is given for each process in the right column. Values are presented for both high and low GWP values for NOx reflecting the wide uncertainties in current estimates. The ratios on the bottom right are presented both including and excluding aviation induced cloudiness (AIC) because of uncertainties both in estimates of the magnitude of this effect and in the future incidence of AIC due to air traffic. The different time horizons illustrate how a unit emission of CO2 increases in importance relative to shorter-lived effects as longer timescales are considered.
Notes: GWP = Global Warming Potential, GTP = Global Temperature Potential
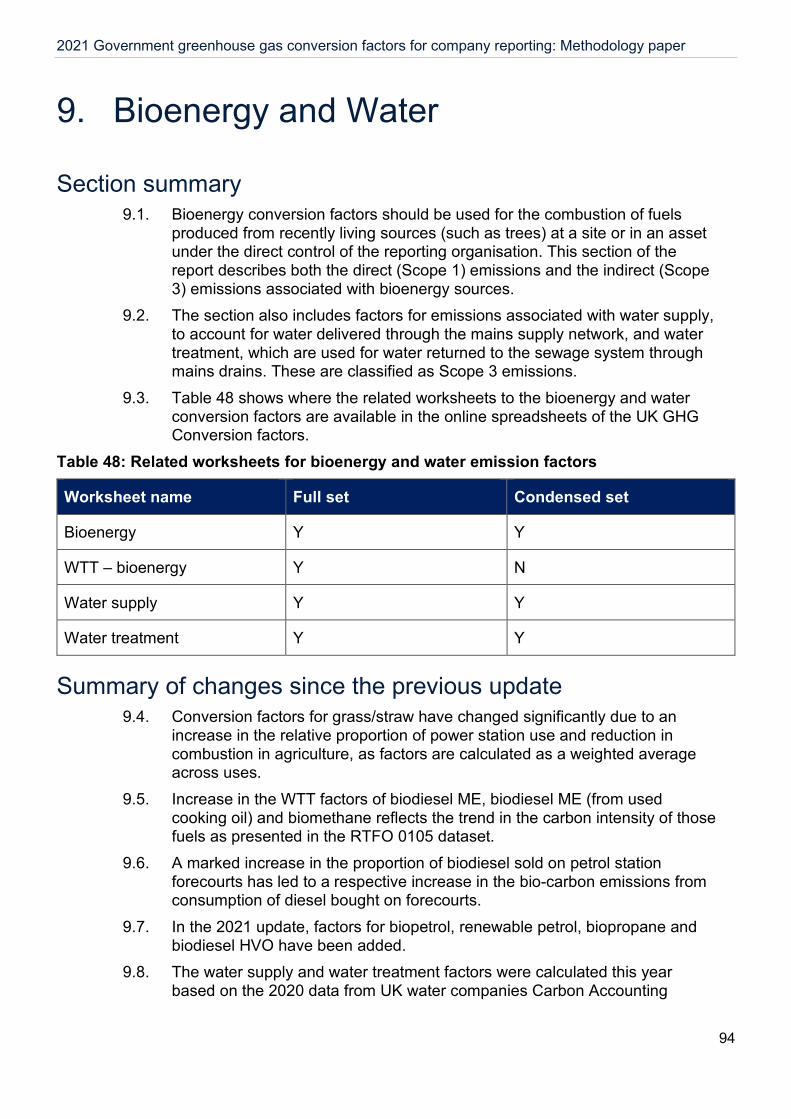
2021 Government greenhouse gas conversion factors for company reporting: Methodology paper
94
9. Bioenergy and Water
Section summary 9.1. Bioenergy conversion factors should be used for the combustion of fuels
produced from recently living sources (such as trees) at a site or in an asset under the direct control of the reporting organisation. This section of the report describes both the direct (Scope 1) emissions and the indirect (Scope 3) emissions associated with bioenergy sources.
9.2. The section also includes factors for emissions associated with water supply, to account for water delivered through the mains supply network, and water treatment, which are used for water returned to the sewage system through mains drains. These are classified as Scope 3 emissions.
9.3. Table 48 shows where the related worksheets to the bioenergy and water conversion factors are available in the online spreadsheets of the UK GHG Conversion factors.
Table 48: Related worksheets for bioenergy and water emission factors
Worksheet name Full set Condensed set
Bioenergy Y Y
WTT – bioenergy Y N
Water supply Y Y
Water treatment Y Y
Summary of changes since the previous update 9.4. Conversion factors for grass/straw have changed significantly due to an
increase in the relative proportion of power station use and reduction in combustion in agriculture, as factors are calculated as a weighted average across uses.
9.5. Increase in the WTT factors of biodiesel ME, biodiesel ME (from used cooking oil) and biomethane reflects the trend in the carbon intensity of those fuels as presented in the RTFO 0105 dataset.
9.6. A marked increase in the proportion of biodiesel sold on petrol station forecourts has led to a respective increase in the bio-carbon emissions from consumption of diesel bought on forecourts.
9.7. In the 2021 update, factors for biopetrol, renewable petrol, biopropane and biodiesel HVO have been added.
9.8. The water supply and water treatment factors were calculated this year based on the 2020 data from UK water companies Carbon Accounting
2021 Government greenhouse gas conversion factors for company reporting: Methodology paper
95
Workbooks (CAW) whereas previously values were coming from a publication of the UK industry from 2012 that has been discontinued.
General Methodology 9.9. The 2021 GHG Conversion factors provide tables of conversion factors for:
water supply and treatment, biofuels, biomass, and biogas. 9.10. The conversion factors for bioenergy cover emissions across the whole life
cycle of the bioenergy fuel and include net CO2, CH4, and N2O emissions from combustion, indirect/WTT emissions from the production and processing of the bioenergy feedstock and CO2 released during combustion of the bioenergy (an 'outside of scope' emission). Note that they do not include emissions resulting from any direct or indirect land use change associated with the production of biofuels. These are presented for biofuels, biomass and biogas.
9.11. The basis of the different conversion factors is discussed in the following sub-sections.
Water 9.12. The conversion factors for water supply and treatment in sections “Water
supply” and “Water treatment” worksheets of the 2021 GHG Conversion factors were calculated based on 2020 data from UK water companies Carbon Accounting Workbooks (CAW). These data are used for reporting to the UK regulator (Ofwat) and all UK water companies use this common approach to reporting these data.22
9.13. The CAW data gives GHG intensity for each water company from water supply and wastewater treatment, accounting for emissions associated with offices and transport. The 2020 dataset did not include a robust metric by which to weight each companies’ intensity to generate a weighted UK average, so in the absence of this, water treatment intensity is weighted by total sewage sludge treated, and the water supply intensity is a uniform weighting (i.e. an average with no different weighting by company). Sewage sludge treated is likely to have a strong correlation with the quantity of water treated, however, the uniform weighting for water supply is much less robust, and therefore subject to significant uncertainty. It should also be noted that the data received from the water industry did not include complete reporting from all water companies, which introduces uncertainty in both water supply and water treatment estimates.
Biofuels 9.14. At the point of use, biofuels are defined as “net carbon zero” or “carbon
neutral” as any CO2 expelled during the burning of the fuel is cancelled out by the CO2 absorbed by the feedstock used to produce the fuel during
22 The data are not published in a suitable format for use for the GHG conversion factors. So, more suitable data were requested from, and provided by a contact at a water company in a personal communication. The individual companies' data are considered confidential, so can only be published as an aggregation.
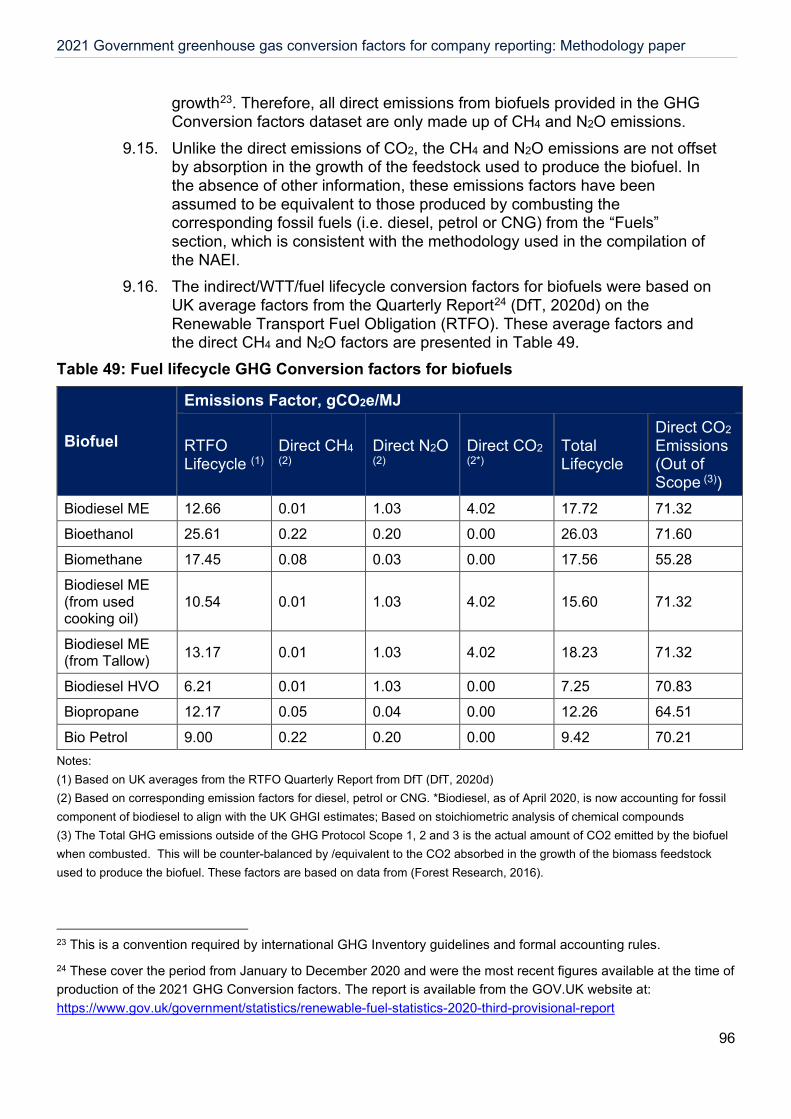
2021 Government greenhouse gas conversion factors for company reporting: Methodology paper
96
growth23. Therefore, all direct emissions from biofuels provided in the GHG Conversion factors dataset are only made up of CH4 and N2O emissions.
9.15. Unlike the direct emissions of CO2, the CH4 and N2O emissions are not offset by absorption in the growth of the feedstock used to produce the biofuel. In the absence of other information, these emissions factors have been assumed to be equivalent to those produced by combusting the corresponding fossil fuels (i.e. diesel, petrol or CNG) from the “Fuels” section, which is consistent with the methodology used in the compilation of the NAEI.
9.16. The indirect/WTT/fuel lifecycle conversion factors for biofuels were based on UK average factors from the Quarterly Report24 (DfT, 2020d) on the Renewable Transport Fuel Obligation (RTFO). These average factors and the direct CH4 and N2O factors are presented in Table 49.
Table 49: Fuel lifecycle GHG Conversion factors for biofuels
Biofuel
Emissions Factor, gCO2e/MJ
RTFO Lifecycle (1)
Direct CH4 (2)
Direct N2O (2)
Direct CO2 (2*)
Total Lifecycle
Direct CO2 Emissions (Out of Scope (3))
Biodiesel ME 12.66 0.01 1.03 4.02 17.72 71.32
Bioethanol 25.61 0.22 0.20 0.00 26.03 71.60
Biomethane 17.45 0.08 0.03 0.00 17.56 55.28
Biodiesel ME (from used cooking oil)
10.54 0.01 1.03 4.02 15.60 71.32
Biodiesel ME (from Tallow) 13.17 0.01 1.03 4.02 18.23 71.32
Biodiesel HVO 6.21 0.01 1.03 0.00 7.25 70.83 Biopropane 12.17 0.05 0.04 0.00 12.26 64.51 Bio Petrol 9.00 0.22 0.20 0.00 9.42 70.21
Notes: (1) Based on UK averages from the RTFO Quarterly Report from DfT (DfT, 2020d) (2) Based on corresponding emission factors for diesel, petrol or CNG. *Biodiesel, as of April 2020, is now accounting for fossil component of biodiesel to align with the UK GHGI estimates; Based on stoichiometric analysis of chemical compounds (3) The Total GHG emissions outside of the GHG Protocol Scope 1, 2 and 3 is the actual amount of CO2 emitted by the biofuel when combusted. This will be counter-balanced by /equivalent to the CO2 absorbed in the growth of the biomass feedstock used to produce the biofuel. These factors are based on data from (Forest Research, 2016).
23 This is a convention required by international GHG Inventory guidelines and formal accounting rules. 24 These cover the period from January to December 2020 and were the most recent figures available at the time of production of the 2021 GHG Conversion factors. The report is available from the GOV.UK website at: https://www.gov.uk/government/statistics/renewable-fuel-statistics-2020-third-provisional-report
2021 Government greenhouse gas conversion factors for company reporting: Methodology paper
97
9.17. The net GHG emissions for biofuels vary significantly depending on the feedstock source and production pathway. Therefore, for accuracy, it is recommended that more detailed/specific figures are used where available. For example, detailed indirect/WTT conversion factors by source/supplier are provided and updated regularly in the Quarterly Reports on the RTFO, available from GOV.UK website at: https://www.gov.uk/government/organisations/department-for-transport/series/biofuels-statistics.
9.18. In addition to the direct and indirect/WTT conversion factors provided in Table 49, conversion factors for the out of scope CO2 emissions have also been provided in the 2021 GHG Conversion factors (see table and the table footnote), based on data sourced from Forest Research, the Forestry Commission’s research agency (previously BEC) (Forest Research, 2016a).
Other biomass and biogas 9.19. Several different biomass types can be used in dedicated biomass heating
systems, including wood logs, chips and pellets, as well as grasses/straw or biogas. Conversion factors produced for these bioenergy sources are presented in the “Bioenergy” worksheet of the 2021 GHG Conversion factors set.
9.20. All indirect/WTT/fuel lifecycle conversion factors here, except for wood logs, are sourced from the Ofgem carbon calculators (Ofgem, 2012), (Ofgem, 2015). These calculators have been developed to support operators determining the GHG emissions associated with the cultivation, processing, and transportation of their biomass fuels.
9.21. Indirect/WTT/fuel lifecycle conversion factors for wood logs, which are not covered by the Ofgem tool, were obtained from the Biomass Environmental Assessment Tool (BEAT2) (Forest Research, 2016a), provided by Defra.
9.22. The direct CH4 and N2O conversion factors presented in the 2021 GHG Conversion factors are based on the conversion factors used in the UK GHG Inventory (GHGI) for 2019 (managed by Ricardo Energy & Environment).
9.23. In some cases, calorific values were required to convert the data into the required units. The most appropriate source was used, and this was either from the Forest Research (Forest Research, 2016), DUKES (Table A.1) or Swedish Gas Technology Centre 2012 (which is also backed up by other data sources). The values used and their associated moisture contents are provided in Table 50.
9.24. In addition to the direct and indirect/WTT conversion factors provided, conversion factors for the out of Scope CO2 emissions are also provided in the 2021 GHG Conversion factors (see “Outside of Scopes” and the relevant notes on the page), also based on data sourced from Forest Research, the Forestry Commission’s research agency (previously BEC) (Forest Research, 2016a).
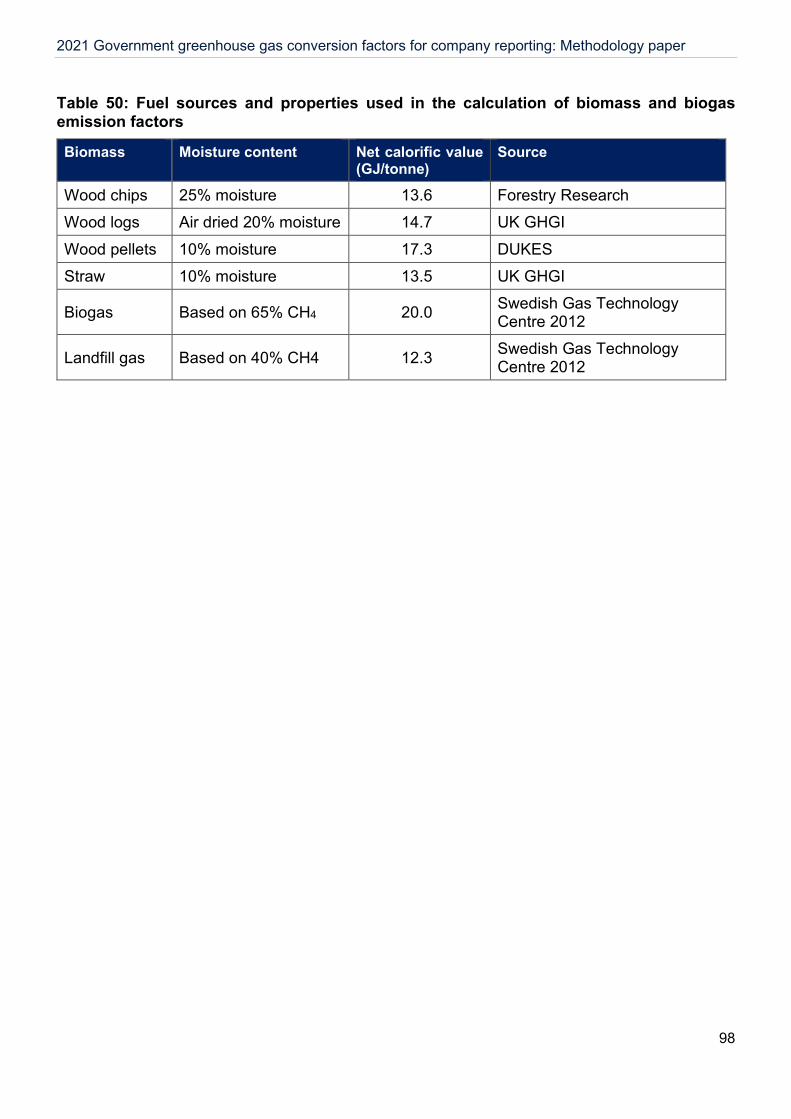
2021 Government greenhouse gas conversion factors for company reporting: Methodology paper
98
Table 50: Fuel sources and properties used in the calculation of biomass and biogas emission factors
Biomass Moisture content Net calorific value (GJ/tonne)
Source
Wood chips 25% moisture 13.6 Forestry Research Wood logs Air dried 20% moisture 14.7 UK GHGI Wood pellets 10% moisture 17.3 DUKES Straw 10% moisture 13.5 UK GHGI
Biogas Based on 65% CH4 20.0 Swedish Gas Technology Centre 2012
Landfill gas Based on 40% CH4 12.3 Swedish Gas Technology Centre 2012
2021 Government greenhouse gas conversion factors for company reporting: Methodology paper
99
10. Overseas Electricity Emission Factors
Section summary 10.1. This section describes the calculation of the Scope 3 upstream well-to-tank
(WTT) conversion factors for electricity generated overseas, as well as for transmission and distribution (T&D) losses associated with the well to tank. These should be used for sites owned or controlled by the reporting organisation in another country. The Scope 2 indirect factors are no longer included within the Conversion factors but are available for sale from the CO2 Emissions from Fuel Combustion online data service at the International Energy Agency (IEA) website.
10.2. The related worksheet for this section is the “WTT – UK & overseas elec”, available only in the full set of the UK GHG Conversion factors.
Summary of changes since the previous update 10.3. There have been no new methodological changes to this section since last
year.
Direct Emissions and Emissions resulting from Transmission and Distribution Losses from Overseas Electricity Generation
10.4. UK companies reporting on their emissions may need to include emissions resulting from overseas activities. Whilst many of the fuel conversion factors are likely to be similar for fuels used in other countries, electricity conversion factors vary considerably due to fuel mix.
10.5. However, the overseas electricity factors have not been provided after the 2015 update due to a change in the licencing conditions for the underlying International Energy Association (IEA) dataset upon which they were based.
10.6. The dataset on electricity conversion factors from the IEA has previously been identified as the best available consistent dataset for electricity emissions factors. These factors are a time series of combined electricity CO2 conversion factors per kWh GENERATED (Scope 2), and corresponding conversion factors for losses in Transmission and Distribution (T&D) (Scope 3). These can be purchased from the IEA website 25.
10.7. Since the 2018 update year, the emissions associated with electricity losses during transmission and distribution of electricity between the power station and an organisation's site(s) are also provided in the IEA dataset, these are also now no longer provided in the UK GHG Conversion factors dataset.
10.8. The conversion factors supplied by the IEA do not include indirect/WTT emissions. These are still available in the 2021 GHG Conversion factors.
25 Available here: http://data.iea.org/
2021 Government greenhouse gas conversion factors for company reporting: Methodology paper
100
Indirect/WTT Emissions from Overseas Electricity Generation 10.9. In addition to the GHG emissions resulting directly from the generation of
electricity, there are also indirect/WTT emissions resulting from the production, transport and distribution of the fuels used in electricity generation (i.e. indirect/WTT/fuel lifecycle emissions are included in the “Fuel” worksheet). The average fuel lifecycle emissions per unit of electricity generated will be a result of the mix of different sources of fuel/primary energy used in electricity generation.
10.10. Average indirect/WTT conversion factors for UK electricity were calculated and included in the “UK electricity” worksheet by using the “Fuels” indirect/WTT conversion factors and data on the total fuel consumption by type of generation for the UK. This information was not available for the overseas conversion factors. As an approximation, therefore, the indirect/WTT (Scope 3) conversion factors for different countries are estimated as being roughly a similar ratio of the direct CO2 conversion factors as for the UK (which is 22.4%), in combination with previous estimates for the emission factors for overseas electricity from the IEA and other sources.
2021 Government greenhouse gas conversion factors for company reporting: Methodology paper
101
11. Hotel Stay
Section summary 11.1. This section describes the calculation of conversion factors for Hotel Stays,
which should be used to report the Scope 3 emissions associated with overnight hotel stays for business travel.
11.2. These factors appear in the “Hotel Stay” worksheet, available only in the full set of the UK GHG Conversion factors set.
Summary of changes since the previous update 11.3. Changes in hotel stay factors are due to 1) changes in emission factors of
purchased electricity in each country, as the majority of a typical hotel’s footprint is from its electricity usage 2) changes in the data set used to generate the median value for each country each year, and 3) changes in weather and occupancy that cause energy load changes in each hotel.
11.4. Due to the changes described above, the values and range of factors available have changed quite significantly. However, the underlying methodological basis of this source is largely unchanged.
Direct emissions from a hotel stay 11.5. All the hotel stay conversion factors presented in the 2021 GHG Conversion
factors are in a CO2e basis. These are taken directly from the Hotel Footprinting Tool, version 2, which is based on Hotel Carbon Measurement Initiative (HCMI) data from the Cornell Hotel Sustainability Benchmarking Index (CHSB) published annually by Greenview and Cornell School of Hospitality Research HCMI is a standard methodology for the measurement of the carbon emission of a hotel stay, developed by the Sustainable Hospitality Alliance and World Travel & Tourism Council . The factors use annual data comprising around twenty international hotel organisations.
11.6. For the 2021 GHG Conversion factors the mean benchmark for each country, for all hotel classes included within the tool, was used.
11.7. The following five steps were carried out in the CHSB study to arrive at the conversion factors included within the 2021 GHG Conversion factors:
a) Harmonising. The data received was converted into the same units and then converting to kg CO2e.
b) Validity tests were carried out to remove outliers or errors from the data sets received.
c) Geographic and climate zone segmentation. The data sets were grouped by location and climate zone.
d) Property segmentation. Hotels were grouped by property segment, applying a revenue-based approach and property-type segmentation used by STR Global (using 2019 global chain scales), the asset class segmentation of full-service and

2021 Government greenhouse gas conversion factors for company reporting: Methodology paper
102
limited-service hotels, and a global data set of star levels for hotels as identified by Expedia.
e) Minimum output thresholds. A minimum threshold of eight hotels per geographical region was required before it was populated within the tool. If there were less than eight hotels, these were excluded from the final outputs.
11.8. It should be noted that there are certain limitations with the CHSB tool used to derive the 2021 GHG Conversion factors. The main limitations are detailed below:
a) The factors are skewed toward large, more upmarket hotels and to branded chains. This is because it was mainly large owners or operators of hotels who submitted the aggregated data sets. Hotels in the lower tier segments are not as strongly represented in these data.
b) The data sets used to derive the factors have not been verified and therefore it cannot be concluded to be 100% accurate.
c) 65% of the benchmarks are within United States geographies. The datasets used are updated each year, therefore it is expected that a wider range of countries will be covered in the future and the tool aims to seek data sets from outside the U.S in future years.
d) The factors do not distinguish a property’s amenities except for outsourced laundry services, which are taken into consideration. The factors are an aggregation of all types of hotels within the revenue-based segmentation and geographic location. Which means it is very difficult to compare two hotels since some may contain distinct attributes, (such as restaurants, fitness centres, swimming pool and spa) while others do not.
e) At present, there is no breakdown of CH4 and N2O emissions, plus there are also no indirect/ WTT factors.
f) For more information about how the factors have been derived, please see (Greenview, 2020), where more granular data is also available by city and segment.
2021 Government greenhouse gas conversion factors for company reporting: Methodology paper
103
12. Material Consumption/Use and Waste Disposal
Section summary 12.1. This section describes conversion factors for material use and waste
disposal. Material use conversion factors should be used only to report on consumption of procured materials based on their origin (that is, comprised of primary material or recycled materials). For primary materials, these factors cover the extraction, primary processing, manufacture, and transportation of materials to the point of sale, not the materials in use. For secondary materials, the factors cover sorting, processing, manufacture, and transportation to the point of sale, not the materials in use. These factors are useful for reporting efficiencies gained through reduced procurement of material or the benefit of procuring items that are the product of a previous recycling process. The factors are not suitable for quantifying the benefits of collecting products or materials for recycling.
12.2. Waste-disposal figures should be used for Greenhouse Gas Protocol reporting of Scope 3 emissions associated with end-of-life disposal of different materials. These figures do not quantify the environmental impact of different waste management options. They are suitable only for Scope 3 reporting of emissions impacts under the Greenhouse Gas Protocol accounting standard.
12.3. These factors appear in the “Material use” and “Waste disposal” worksheets, available in both the full and condensed sets of the UK GHG Conversion factors
12.4. Users wishing to quantify the impact of different waste management options may wish to use WRAP Carbon Waste and Resources Metric (CarbonWARM). Note that CarbonWARM outputs cannot be used for reporting Scope 3 Greenhouse Gas emissions.
Summary of changes since the previous update The following changes have been made to the Material Use factors since the 2020 update.
12.5. Minor update to the steel factor based on obtaining more up to date LCA data from World Steel.
12.6. The factors for corrugated board have been updated to correct a misinterpretation of the scope of the 2019 FeFCO LCA on which the board factors are based. The revised factor now includes the impact of purchased electricity and (where available) chemical and other additives.
12.7. The factors for glass have been completely revised based on the latest data in the ecoinvent database. This was done to replace an out-of-date reference
2021 Government greenhouse gas conversion factors for company reporting: Methodology paper
104
and to improve transparency. This has resulted in a significant increase in the estimated footprint of glass packaging26.
12.8. Factors for electrical goods have been recalculated using ecoinvent data. This has improved transparency and has enabled the introduction of a new category for IT and computer equipment.
12.9. Factors for batteries have been disaggregated to reflect the wide range of carbon footprints, depending on the battery type.
12.10. Minor corrections to the composting and anaerobic digestion (AD) factors. The revised factor covers the collection of material from the point where organic waste is generated and transport to the composting or AD facility. On site vehicle emissions have been removed as out of scope. This has resulted in a slight decrease in the composting and AD factors.
12.11. The landfill disposal factor for batteries has been reviewed and brought into line with electrical goods and other non-biodegradable items. This approach results in a considerable reduction in the factor for landfill disposal of batteries. This revised factor was checked against a value derived from a more recent LCA of batteries (Hamade, 2020), and was found to be broadly consistent with the results.
Emissions from Material Use and Waste Disposal 12.12. Since 2012 the greenhouse gas conversion factors for material consumption
/ use and waste disposal have been aligned with the GHG Protocol Corporate Value Chain (Scope 3) Accounting and Reporting Standard (‘the Scope 3 Standard’)27. This sets down rules on accounting for emissions associated with material consumption and waste management.
12.13. The company sending waste for recycling does not receive any benefit to its carbon account from recycling as the figures for waste disposal no longer include the potential benefits where primary resource extraction is replaced by recycled material. Under this accounting methodology, the organisation using recycled materials will see a reduction in their account where this use is in place of higher impact primary materials.
12.14. Whilst the factors are appropriate for accounting, they are therefore not appropriate for informing decision making on alternative waste management options (i.e. they do not show the impact of waste management options).
12.15. All figures expressed are kilograms of carbon dioxide equivalent (CO2e) per tonne of material. This includes the Kyoto protocol basket of greenhouse
26 Factors were available for average glass production and glass production without cullet. The factor for 100% recycled glass production was derived using these two factors and the proportion of cullet in average glass production. 27 http://www.ghgprotocol.org/standards/Scope-3-standard
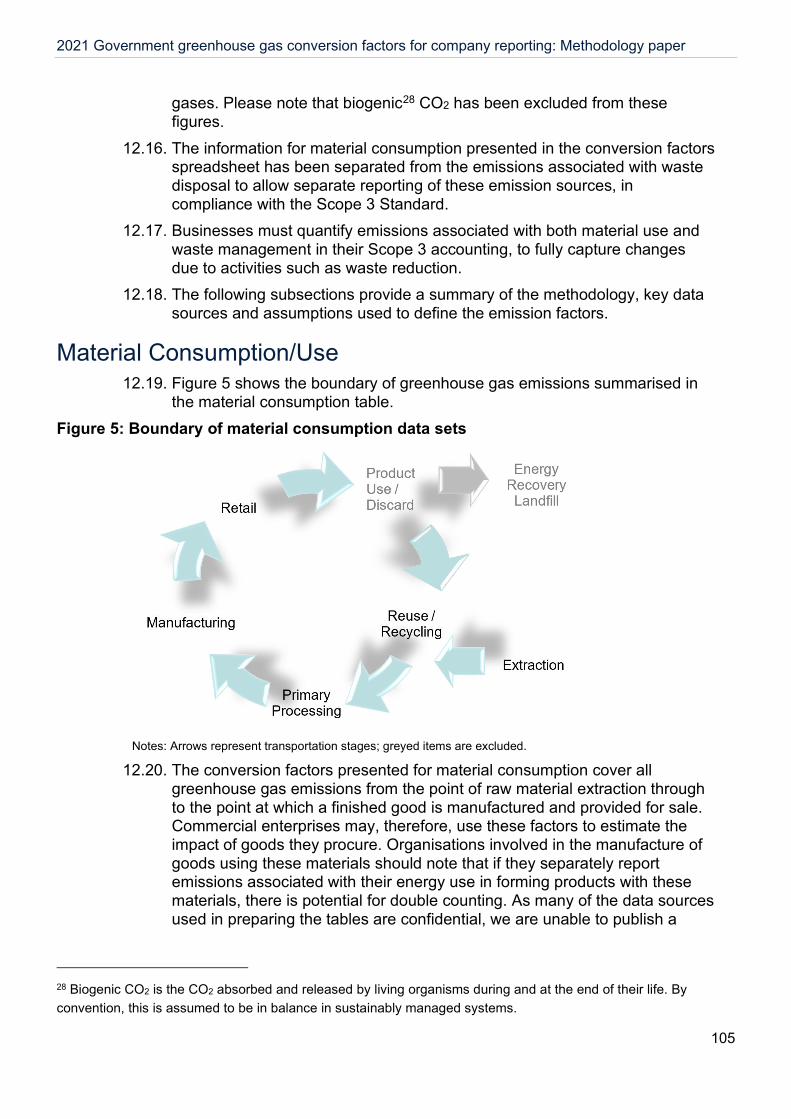
2021 Government greenhouse gas conversion factors for company reporting: Methodology paper
105
gases. Please note that biogenic28 CO2 has been excluded from these figures.
12.16. The information for material consumption presented in the conversion factors spreadsheet has been separated from the emissions associated with waste disposal to allow separate reporting of these emission sources, in compliance with the Scope 3 Standard.
12.17. Businesses must quantify emissions associated with both material use and waste management in their Scope 3 accounting, to fully capture changes due to activities such as waste reduction.
12.18. The following subsections provide a summary of the methodology, key data sources and assumptions used to define the emission factors.
Material Consumption/Use 12.19. Figure 5 shows the boundary of greenhouse gas emissions summarised in
the material consumption table. Figure 5: Boundary of material consumption data sets
Notes: Arrows represent transportation stages; greyed items are excluded.
12.20. The conversion factors presented for material consumption cover all greenhouse gas emissions from the point of raw material extraction through to the point at which a finished good is manufactured and provided for sale. Commercial enterprises may, therefore, use these factors to estimate the impact of goods they procure. Organisations involved in the manufacture of goods using these materials should note that if they separately report emissions associated with their energy use in forming products with these materials, there is potential for double counting. As many of the data sources used in preparing the tables are confidential, we are unable to publish a
28 Biogenic CO2 is the CO2 absorbed and released by living organisms during and at the end of their life. By convention, this is assumed to be in balance in sustainably managed systems.
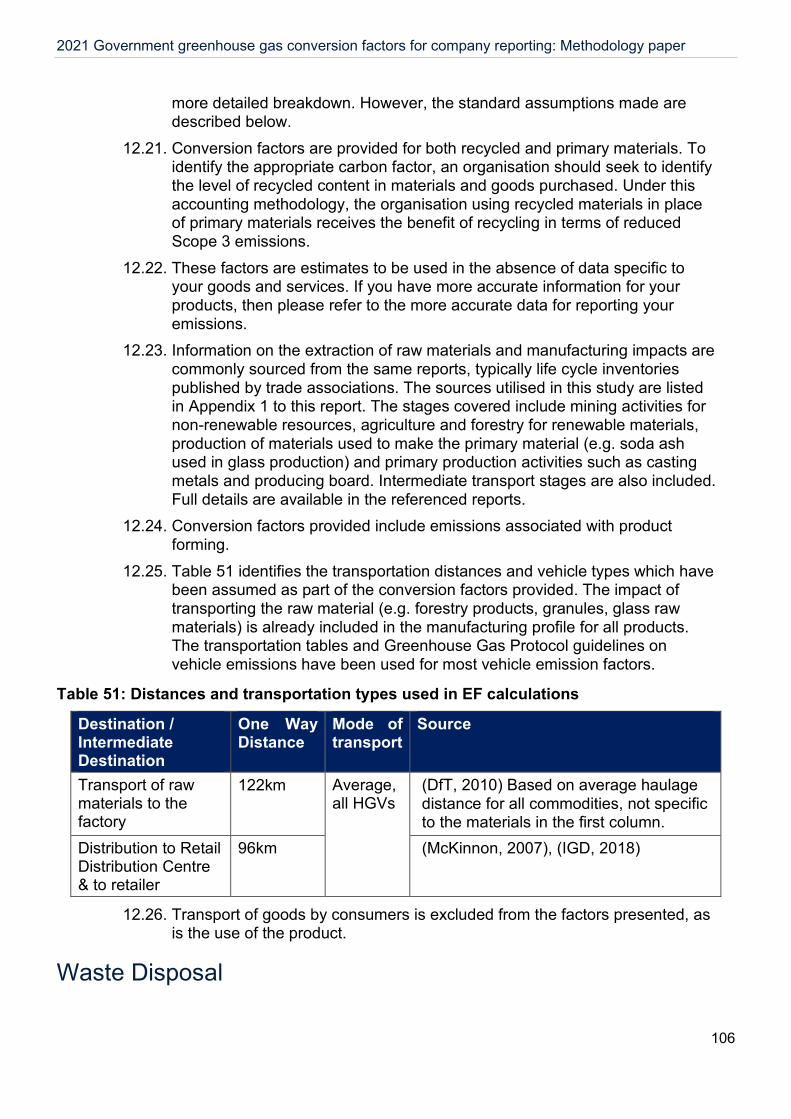
2021 Government greenhouse gas conversion factors for company reporting: Methodology paper
106
more detailed breakdown. However, the standard assumptions made are described below.
12.21. Conversion factors are provided for both recycled and primary materials. To identify the appropriate carbon factor, an organisation should seek to identify the level of recycled content in materials and goods purchased. Under this accounting methodology, the organisation using recycled materials in place of primary materials receives the benefit of recycling in terms of reduced Scope 3 emissions.
12.22. These factors are estimates to be used in the absence of data specific to your goods and services. If you have more accurate information for your products, then please refer to the more accurate data for reporting your emissions.
12.23. Information on the extraction of raw materials and manufacturing impacts are commonly sourced from the same reports, typically life cycle inventories published by trade associations. The sources utilised in this study are listed in Appendix 1 to this report. The stages covered include mining activities for non-renewable resources, agriculture and forestry for renewable materials, production of materials used to make the primary material (e.g. soda ash used in glass production) and primary production activities such as casting metals and producing board. Intermediate transport stages are also included. Full details are available in the referenced reports.
12.24. Conversion factors provided include emissions associated with product forming.
12.25. Table 51 identifies the transportation distances and vehicle types which have been assumed as part of the conversion factors provided. The impact of transporting the raw material (e.g. forestry products, granules, glass raw materials) is already included in the manufacturing profile for all products. The transportation tables and Greenhouse Gas Protocol guidelines on vehicle emissions have been used for most vehicle emission factors.
Table 51: Distances and transportation types used in EF calculations
Destination / Intermediate Destination
One Way Distance
Mode of transport
Source
Transport of raw materials to the factory
122km Average, all HGVs
(DfT, 2010) Based on average haulage distance for all commodities, not specific to the materials in the first column.
Distribution to Retail Distribution Centre & to retailer
96km (McKinnon, 2007), (IGD, 2018)
12.26. Transport of goods by consumers is excluded from the factors presented, as is the use of the product.
Waste Disposal
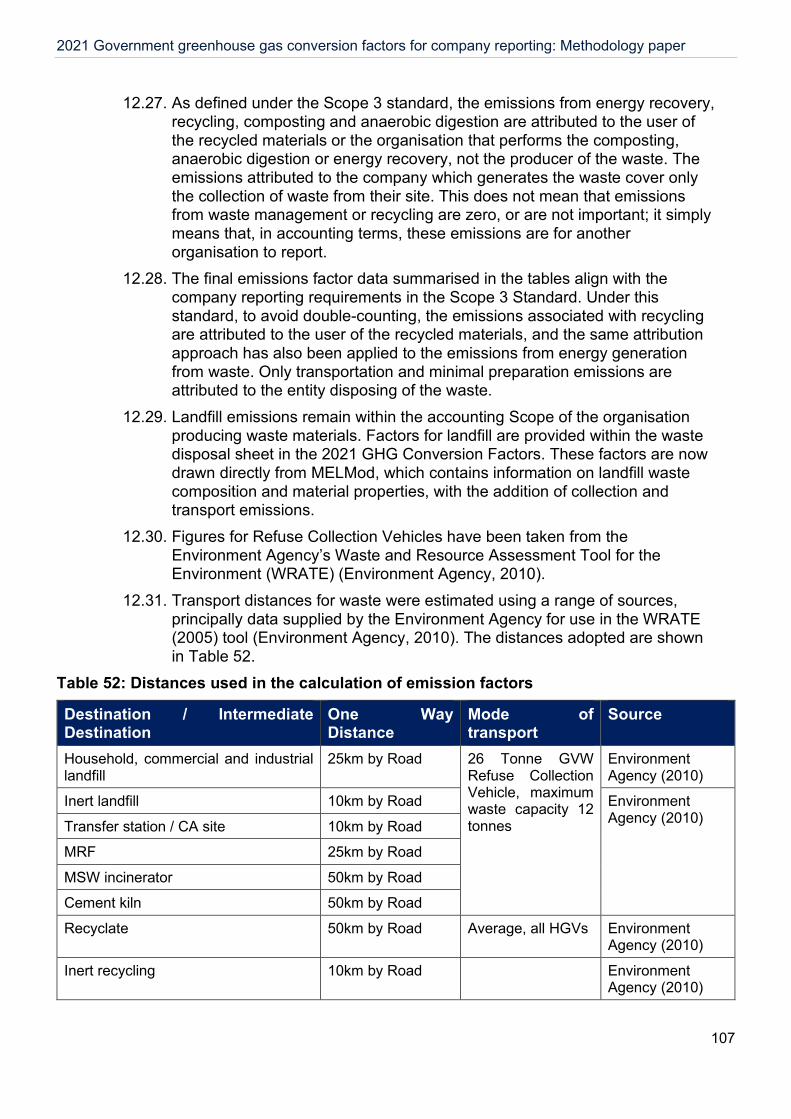
2021 Government greenhouse gas conversion factors for company reporting: Methodology paper
107
12.27. As defined under the Scope 3 standard, the emissions from energy recovery, recycling, composting and anaerobic digestion are attributed to the user of the recycled materials or the organisation that performs the composting, anaerobic digestion or energy recovery, not the producer of the waste. The emissions attributed to the company which generates the waste cover only the collection of waste from their site. This does not mean that emissions from waste management or recycling are zero, or are not important; it simply means that, in accounting terms, these emissions are for another organisation to report.
12.28. The final emissions factor data summarised in the tables align with the company reporting requirements in the Scope 3 Standard. Under this standard, to avoid double-counting, the emissions associated with recycling are attributed to the user of the recycled materials, and the same attribution approach has also been applied to the emissions from energy generation from waste. Only transportation and minimal preparation emissions are attributed to the entity disposing of the waste.
12.29. Landfill emissions remain within the accounting Scope of the organisation producing waste materials. Factors for landfill are provided within the waste disposal sheet in the 2021 GHG Conversion Factors. These factors are now drawn directly from MELMod, which contains information on landfill waste composition and material properties, with the addition of collection and transport emissions.
12.30. Figures for Refuse Collection Vehicles have been taken from the Environment Agency’s Waste and Resource Assessment Tool for the Environment (WRATE) (Environment Agency, 2010).
12.31. Transport distances for waste were estimated using a range of sources, principally data supplied by the Environment Agency for use in the WRATE (2005) tool (Environment Agency, 2010). The distances adopted are shown in Table 52.
Table 52: Distances used in the calculation of emission factors
Destination / Intermediate Destination
One Way Distance
Mode of transport
Source
Household, commercial and industrial landfill
25km by Road 26 Tonne GVW Refuse Collection Vehicle, maximum waste capacity 12 tonnes
Environment Agency (2010)
Inert landfill 10km by Road Environment Agency (2010) Transfer station / CA site 10km by Road
MRF 25km by Road
MSW incinerator 50km by Road
Cement kiln 50km by Road
Recyclate 50km by Road Average, all HGVs Environment Agency (2010)
Inert recycling 10km by Road Environment Agency (2010)

2021 Government greenhouse gas conversion factors for company reporting: Methodology paper
108
12.32. Road vehicles are volume-limited rather than weight limited. For all HGVs, an average loading factor (including return journeys) is used based on the HGV factors provided in the 2020 Conversion factors. Waste vehicles leave a depot empty and return fully laden. A 50% loading assumption reflects the change in load over a collection round which could be expected.
2021 Government greenhouse gas conversion factors for company reporting: Methodology paper
109
13. Fuel Properties
Section summary 13.1. The fuel properties can be used to determine the typical calorific values /
densities of most common fuels. 13.2. These factors appear in the “Fuel properties” worksheet, available in both the
full and condensed sets of the UK GHG Conversion factors set.
Summary of changes since the previous update 13.3. New fuel properties have been added for butane and propane. 13.4. Fuel property data for most fuels has been changed from using BEIS’s
Digest of UK Energy Statistics (BEIS, 2020b) (DUKES) to using data from the UK GHG Inventory (GHGI) (Ricardo Energy & Environment, 2021). The GHGI data is largely based on DUKES, but in some cases deviates, either to use data consistent with the carbon content data source (such as for power stations coal, which uses EU ETS data), or in cases where there are apparent inconsistencies in the time series, as the GHGI must present a consistent time series from 1990. This change will improve consistency between the GHGI and the Conversion Factors.
General Methodology 13.5. The following standard properties for key fuels are provided in the UK GHG
Conversion factors: a) Gross Calorific Value (GCV) in units of GJ/tonne, kWh/kg and kWh/litre b) Net Calorific Value (NCV) in units of GJ/tonne, kWh/kg and kWh/litre c) Density in units of litres/tonne and kg/m3
13.6. The standard conversion factors from the GHGI are now provided on a net energy basis. These are converted into different energy, volume and mass units for the various data tables using the information on these fuel properties (i.e. Gross and Net Calorific Values (CV), and fuel densities in litres/tonne) from UK GHGI data and in some cases data from BEIS’s Digest of UK Energy Statistics (BEIS, 2020b).
13.7. The fuel properties of most biofuels are predominantly based on data from JEC - Joint Research Centre-EUCAR-CONCAWE collaboration, “Well-to-Wheels Analysis of Future Automotive Fuels and Powertrains in the European Context” Version 5, 2020 (Report EUR 30269 EN - 2020) (JEC WTW, 2020). The exception is for methyl-ester based biodiesels and bioethanol, where values for NCV and GCV are taken from the UK GHGI.
13.8. Fuel properties, both density and CV, for wood chips (25% moisture content) come from the Forest Research (previously Biomass Energy Centre (BEC)29.
29 Available at: https://www.forestry.gov.uk/fr/beeh-9ukqcn

2021 Government greenhouse gas conversion factors for company reporting: Methodology paper
110
The density of wood logs (20% moister content), wood chips (25% moister content) and grasses/straw (25% water content) are also sourced from the Forest Research30.
30 Available at: https://www.forestry.gov.uk/fr/beeh-absg5h
2021 Government greenhouse gas conversion factors for company reporting: Methodology paper
111
14. SECR kWh Conversion factors
Section summary 14.1. The new Streamlined Energy and Carbon Reporting (SECR) came into effect
on the 1 April 2019. One of the requirements of the guidance is to report GHG emissions from activities for which the company is responsible. SECR obligations differ between quoted and unquoted organisations covering Scope 1, Scope 2 and some Scope 3 emissions. Most will need to calculate the GHG emissions for the combustion of fuel (including transport fuel) and the operation of any facility, together with the annual emissions from the purchase of electricity, heat, steam, or cooling by the company for its own use. See the Environmental Reporting Guidelines, (BEIS, 2019), for more details.
14.2. The SECR also requires the total energy use that is used to calculate these GHG emissions to be provided in kilowatt hours (kWh).
14.3. When organisations are calculating the GHG emissions associated with fuels (Scope 1), bioenergy (Scope 1), electricity (Scope 2) and heat and steam (Scope 2), they will either already have the kWh values or will be able to convert units such as GJ, litres or tonnes using the fuel properties or conversion data provided at the end of the conversion factors spreadsheet.
14.4. For transport, companies may have two types of data which they can use to calculate vehicles emissions (cars, motorcycles, vans and HGVs owned or controlled by the company):
a) Fuel consumption data in litres or kWh. In the instance of litres, this can easily be converted to kWh using the fuel properties provided at the end of the conversion factors spreadsheet. This is the preferred and more accurate method to use.
b) Journey distance in km or miles. If a company does not have fuel consumption data (option a), they may have a record of the total distance travelled, for example from expense claims. In this instance, the km or miles data will need to be converted into kWh. This will require an additional factor, which is what we have provided in the SECR factors worksheet.
Table 53: Related worksheets to SECR kWh emissions factors
Worksheet name Full set Condensed set
SECR kWh pass & delivery vehs Y Y
SECR kWh UK electricity for EV Y Y
14.5. SECR kWh conversion factors have been calculated for passenger and delivery vehicles including cars, motorcycles, vans, and HGVs.
14.6. The factors are split out between two worksheets: a) “SECR kWh pass & delivery vehs” worksheet contains cars, motorcycles, vans
and HGVs, including electric vehicles (i.e. Plug-in Hybrid Electric Vehicles /
2021 Government greenhouse gas conversion factors for company reporting: Methodology paper
112
Range-Extended Electric Vehicles and Battery Electric Vehicles) where the kWh factors presented only include the conventional fuel use (i.e. petrol or diesel)
b) “SECR kWh UK electricity for EV” worksheet contains only the kWh factors for the electricity consumed by the electric vehicles.
Summary of changes since the previous update 14.7. For the calculation of HGV SECR factors in previous years, the CO2
emissions included emissions due to use of urea (as described in paragraph 6.16) and were divided by the net kWh from fuel that did not include urea. This caused a small differential (less than 1%) for last year’s values and so the effect of adding urea has been removed for this year’s update to improve accuracy.
General Methodology 14.8. The factors are calculated using a two-step approach:
Step 1 - Convert km or miles data into kg CO2 using the appropriate transport GHG conversion factor. These are the factors found within the passenger and delivery vehicles worksheets. Step 2 – Divide the kg CO2 figure, from step 1, by the fuel net kWh conversion factor (e.g. diesel or petrol). These are the figures found within the fuel worksheet.
14.9. The CO2 GHG conversion factor for some vehicle types is calculated using a mixture of fuels, such as hybrid vehicles, or for those where the fuel is unknown. In these instances, the kWh conversion factor used in step 2 is calculated using the appropriate percentage fuel split used in calculating the GHG conversion factors.
14.10. The calculation of the SECR kWh conversion factors is based on using the CO2 (and not the CO2e) factors. This is because the CO2e factor is comprised of the CO2, CH4 and N2O factors and the CH4 and N2O emissions are not directly linked to the energy consumption but they are related to the specific (exhaust) emission after-treatment systems. For different vehicle types, the ratio is different for the same fuel type. Hence the calculation uses the ratio of CO2 with the average fuel conversion factor.
2021 Government greenhouse gas conversion factors for company reporting: Methodology paper
113
References ACEA. (2020). WLTP Facts. Retrieved from https://wltpfacts.eu/ AEA/Ricardo. (2011). Reduction and Testing of Greenhouse Gas (GHG) Emissions from Heavy
Duty Vehicles – Lot 1: Strategy. Ricardo AEA. Retrieved from https://ec.europa.eu/clima/sites/clima/files/transport/vehicles/docs/ec_hdv_ghg_strategy_en.pdf
Allen, J. and Browne, M. (2008). Using official data sources to analyse the light goods vehicle fleet and operations in Britain. University of Westminster . Retrieved from http://www.greenlogistics.org/SiteResources/61debf21-2b93-4082-ab15-84787ab75d26_LGV%20activity%20report%20(final)%20November%202008.pdf
BEIS. (2019). Environmental reporting guidelines: including Streamlined Energy and Carbon Reporting requirements. Retrieved from https://www.gov.uk/government/publications/environmental-reporting-guidelines-including-mandatory-greenhouse-gas-emissions-reporting-guidance
BEIS. (2019a). Combined Heat and Power Quality Assurance (CHPQA) Programme. Retrieved January 3, 2020, from https://www.gov.uk/guidance/combined-heat-power-quality-assurance-programme
BEIS. (2020). Government emission conversion factors for greenhouse gas company reporting. Retrieved June 9, 2020, from https://www.gov.uk/government/collections/government-conversion-factors-for-company-reporting
BEIS. (2020a). Digest of UK Energy Statistics (DUKES): natural gas. Retrieved 2019, from https://www.gov.uk/government/statistics/natural-gas-chapter-4-digest-of-united-kingdom-energy-statistics-dukes
BEIS. (2020b). Digest of UK Energy Statistics (DUKES). Retrieved 2020, from https://www.gov.uk/government/collections/digest-of-uk-energy-statistics-dukes#2020
BFF. (2007). Carbon Emissions of Mixed Passenger and Vehicle Ferries on UK and Domestic Routes. Best Foot Forward for the Passenger Shipping Association (PSA).
Boldrin, Alessio, Karin R. Hartling, Maria Laugen, and Thomas H. Christensen. (2010, October). Environmental Inventory Modelling of the Use of Compost and Peat in Growth Media Preparation. Resources, Conservation and Recycling, 54(12), 1250–60. Retrieved from https://doi.org/10.1016/j.resconrec.2010.04.003
CAA. (2021). Data and Analysis; datasets for 2018 flights from UK airports. Retrieved March 2020, from Civil Aviation Authority: https://www.caa.co.uk/Data-and-analysis/UK-aviation-market/Airlines/Datasets/UK-Airline-data/2018/Airline-data-2018/
CBS. (2021, March 3). Dutch Electricity Factor. Retrieved 2020, from https://www.cbs.nl/nl-nl/maatwerk/2020/08/rendement-en-co2-emissie-elekrtriciteitproductie-2019
CCC. (2009). Meeting the UK aviation target-options for reducing emissions to 2050. Committee on Climate Change.
Clear. (2008). Dataset of motorcycle fuel consumption compiled by Clear for the development of its motorcyle CO2 model used in its carbon offsetting products. Retrieved from https://clear-offset.com/
2021 Government greenhouse gas conversion factors for company reporting: Methodology paper
114
Cornell Center for Hospitality Research. (2020). Hotel Sustainability Benchmarking Index 2020: Carbon, Energy and Water. Retrieved from https://ecommons.cornell.edu/handle/1813/74089
CPI. (2019). The economic value of the UK paper-based industries 2019. Swindon: CPI. Retrieved from https://thecpi.org.uk/library/PDF/Public/Publications/Reports/CPI-Economic-Review-2019.pdf
DfT. (2006). Average of tonnes per load to/from UK derived from Table 2.6, from Road Freight Statistics 2005. Department for Transport .
DfT. (2010). Transport Statistics Bulletin: Road Freight Statistics 2008 National Statistics Table 1.14d. Retrieved from https://data.gov.uk/dataset/7efdee14-8cc9-406f-973e-f32ed8c28b7e/road-freight-statistics
DfT. (2017). Road Freight Statistics: Table RFS0141, July 2017. Retrieved July 13, 2017, from https://www.gov.uk/government/collections/road-freight-domestic-and-international-statistics
DfT. (2019b). Passenger distance travelled (BUS03). Retrieved December 17, 2019, from https://www.gov.uk/government/statistical-data-sets/bus03-passenger-distance-travelled
DfT. (2020a). Light rail and tram statistics. Retrieved December 19, 2019, from https://www.gov.uk/government/collections/light-rail-and-tram-statistics
DfT. (2020b). Department for Transport. Retrieved 2020, from Renewable Fuel Statistics: https://www.gov.uk/government/collections/renewable-fuel-statistics
DfT. (2020c). Road freight statistics. Retrieved January 20, 2021, from https://www.gov.uk/government/statistical-data-sets/rfs01-goods-lifted-and-distance-hauled
DfT. (2020d). Biofuels statistics. Retrieved February 2020, from https://www.gov.uk/government/statistics/renewable-fuel-statistics-2020-third-provisional-report
DVLA. (2020). Vehicle statistics. Department for Transport, Driver and Vehicle Licensing Agency, and Driver and Vehicle Standards Agency. Retrieved 2019, from https://www.gov.uk/government/collections/vehicles-statistics
EC JRC. (2009). Environmental Impact Potentials of Textiles (IMPRO-Textiles). (E. C. Reports, Producer) Retrieved April 10, 2019, from http://susproc.jrc.ec.europa.eu/textiles/docs/120423%20IMPRO%20Textiles_Publication%20draft%20v1.pdf
EEA. (2019). EMEP/EEA air pollutant emission inventory guidebook 2019. Retrieved from https://www.eea.europa.eu/publications/emep-eea-guidebook-2019
EEA. (2020a). Monitoring of CO2 emissions from passenger cars – Regulation (EU) 2019/631. Retrieved February 22, 2021, from https://www.eea.europa.eu/data-and-maps/data/co2-cars-emission-18
EEA. (2020b). Monitoring of CO2 emissions from vans – Regulation 510/2011. Retrieved March 19, 2021, from https://www.eea.europa.eu/data-and-maps/data/vans-14
EMISIA. (2019). COPERT 4. Retrieved April 10, 2019, from https://www.emisia.com/?s=COPERT+4

2021 Government greenhouse gas conversion factors for company reporting: Methodology paper
115
Environment Agency. (2010). Waste and Resources Assessment Tool for the Environment (WRATE). Retrieved from https://webarchive.nationalarchives.gov.uk/20140328085153/http://www2.environment-agency.gov.uk/research/commercial/102922.aspx
Environment Agency. (2020). Climate Change Agreements. Retrieved from https://www.gov.uk/guidance/climate-change-agreements--2
EUROCONTROL. (2019). Small emitters tool. Retrieved from Eurocontrol: https://www.eurocontrol.int/small-emitters-tool
European Commission. (2019). 2011/877/EU: Commission Implementing Decision of 19 December 2011establishing harmonised efficiency reference values for separate production of electricity and heat in application of Directive 2004/8/EC of the European Parliament and of the Council and re. (E. Commission, Producer) Retrieved April 10, 2019, from EUR-Lex: https://eur-lex.europa.eu/legal-content/EN/TXT/?uri=CELEX:32011D0877
Exergia et al. (2015). Study on actual GHG data for diesel, petrol, kerosene and natural gas. A study by Exergia, E3 Modelling and COWI for the European Commission, DG ENER. Retrieved from https://ec.europa.eu/energy/sites/ener/files/documents/Study%20on%20Actual%20GHG%20Data%20Oil%20Gas_Project%20Interim%20Report.pdf
Forest Research. (2016). Carbon emissions of different fuels. Retrieved from http://www.forestry.gov.uk/fr/beeh-abslby
Forest Research. (2016a). Biomass Environmental Assessment Tool, BEAT2. Retrieved from Forest Research: https://www.forestry.gov.uk/fr/beeh-9uynmd
Green Car Guide. (2018). https://www.greencarguide.co.uk/. Retrieved from https://www.greencarguide.co.uk/
Greenhouse Gas Protocol. (2011). Corporate value chain (Scope 3) accounting and reporting standard. World Resources Institute and World Business Council for Sustainable Development.
Greenview. (2020). Hotel Footprinting Tool. Retrieved from https://www.hotelfootprints.org Hamade, R. A. ( 2020). Life Cycle Analysis of AA Alkaline Batteries. Procedia Manufacturing,
43, 415–22. IATA. (2018). January Passenger Demand Growth Slows on Temporary Factors. Retrieved
April 10, 2019, from https://www.iata.org/pressroom/pr/Pages/2018-03-08-01.aspx ICCT. (2017). FROM LABORATORY TO ROAD: A 2017 update of official and 'real-world' fuel
consumption and CO2 values for passenger cars in Europe. International Council for Clean Transportation. Retrieved April 10, 2019, from https://www.theicct.org/sites/default/files/publications/Lab-to-road-2017_ICCT-white%20paper_06112017_vF.pdf
IGD. (2018). UK Food & Grocery Retail Logistics Overview Date. Retrieved from http://www.igd.com/our-expertise/Supply-chain/Logistics/3457/UK-Food--Grocery-Retail-Logistics-Overview/
2021 Government greenhouse gas conversion factors for company reporting: Methodology paper
116
IMO. (2009). PREVENTION OF AIR POLLUTION FROM SHIPS, Second IMO GHG Study 2009, Marine Guidance Note MGN 347 (M), . Retrieved April 10, 2019, from https://www.gov.uk/government/organisations/maritime-and-coastguard-agency
IPCC. (2007). Climate Change 2007: Synthesis Report. Contribution of Working Groups I, II and III to the Fourth Assessment Report of the Intergovernmental Panel on Climate Change. Geneva, Switzerland . Retrieved from https://www.ipcc.ch/site/assets/uploads/2018/02/ar4_syr_full_report.pdf
IPCC. (2014). Climate Change 2014: Synthesis Report. Contribution of Working Groups I, II and III to the Fifth Assessment Report of the Intergovernmental Panel on Climate Change. Geneva, Switzerland. Retrieved from https://www.ipcc.ch/site/assets/uploads/2018/02/SYR_AR5_FINAL_full.pdf
ITP/Greenview. (2020). Hotel Footprinting Tool. Retrieved from https://www.hotelfootprints.org JEC WTW. (2014a). Well-to-Wheels analysis of future automotive fuels and powertrains in the
European context WELLTO-TANK (WTT) Report. By European Commission, JRC-EUCAR-CONCAWE. Edwards, R; Larive, J.F; Rickeard, D; Weindorf , W.
JEC WTW. (2020). WELL-TO-WHEELS ANALYSIS OF FUTURE AUTOMOTIVE FUELS AND POWERTRAINS IN THE EUROPEAN CONTEXT. European Commission JRC Technical Reports. Retrieved from https://ec.europa.eu/jrc/en/publication/eur-scientific-and-technical-research-reports/well-tank-report-version-4a-jec-well-wheels-analysis
L.E.K. Consulting. (2002). Methodology for settlements with <25k population (Appendix 10.5.1). Retrieved 2019, from https://webarchive.nationalarchives.gov.uk/20110304135427/
MCA. (2017). Marine Guidance Note MGN 347 (M). Retrieved from Maritime and Coastguard Agency: http://www.dft.gov.uk/mca/mcga07-home/shipsandcargoes/mcga-shipsregsandguidance/marinenotices/mcga-mnotice.htm?textobjid=82A572A99504695B
McKinnon, A. (2007). Synchronised auditing of truck utilisation and energy efficiency: a review of the British Government's transport KPI programme. In proceedings of the 11th World conference on transport research. Retrieved from http://www.greenlogistics.org/SiteResources/77a765d8-b458-4e5f-b9e0-1827e34f2f1f_Review%20of%20Transport%20KPI%20programme%20(WCTR%202007).pdf
National Grid. (2020). National Grid. Retrieved 2019, from https://www.nationalgridgas.com/data-and-operations/calorific-value-cv
Ofgem. (2012). The UK Bioliqued Carbon Calculator. Retrieved April 10, 2019, from https://www.ofgem.gov.uk/publications-and-updates/uk-bioliquid-carbon-calculator
Ofgem. (2015). The UK Solid and Gaseous Biomass Carbon Calculator. Retrieved April 10, 2019, from https://www.ofgem.gov.uk/publications-and-updates/uk-solid-and-gaseous-biomass-carbon-calculator
ORR. (2020). Official Statistics. Retrieved April 10, 2019, from : http://dataportal.orr.gov.uk/browsereports/9
ORR. (2020a). Estimates of passenger and freight energy consumption and carbon dioxide equivalent (CO2e) emissions - Table 2.101 (p). Retrieved 2019, from Office of the Rail Regulator (ORR): https://dataportal.orr.gov.uk/displayreport/html/html/31212a97-cf7a-42d5-9fe3-a134b5c08b6a

2021 Government greenhouse gas conversion factors for company reporting: Methodology paper
117
Riacrdo Energy & Environment. (2018). Assessing the impacts of selected options for regulating CO2 emissions from new passenger cars and vans after 2020. Retrieved from https://ec.europa.eu/clima/sites/clima/files/transport/vehicles/docs/ldv_post_2020_co2_en.pdf
Ricardo Energy & Environment. (2015). UK Greenhouse Gas Inventory, 1990 to 2013: Annual Report for Submission under the Framework Convention on Climate Change. MacCarthy J, Broomfield M, Brown P, Buys G, Cardenas L, Murrells T, Pang Y, Passant N, Thistlethwaite G, Watterson J. Retrieved from https://uk-air.defra.gov.uk/assets/documents/reports/cat07/1512091113_ukghgi-90-13_Issue_1.pdf
Ricardo Energy & Environment. (2021). UK Greenhouse Gas Inventory, 1990 to 2019: Annual Report for Submission under the Framework Convention on Climate Change. Ricardo Energy & Environment. Brown P, Broomfield M, Cardenas L, Choudrie S, Karagianni E, Mullen P, Passant N, Thistlethwaite G, Thomson A,Turtle L, Wakeling D. Retrieved from https://naei.beis.gov.uk/reports/reports?report_id=998
Ricardo-AEA. (2014). UK Greenhouse Gas Inventory, 1990 to 2012: Annual Report for Submission under the Framework. Webb N, Broomfield M, Brown P, Buys G, Cardenas L,. Retrieved from https://uk-air.defra.gov.uk/assets/documents/reports/cat07/1404251327_1404251304_ukghgi-90-12_Issue1.pdf
RISE. (2019). The carbon footprint of carton packaging 2019. Zurich: Pro Carton. Retrieved from https://www.procarton.com/wp-content/uploads/2020/03/Carbon-Footprint-Report-2019.pdf
RTE. (2021, February 11). French Electricity Factor. Retrieved 2020, from https://www.rte-france.com/fr/eco2mix/eco2mix-telechargement
Sausen , R., Isaksen, I., Grewe, V., Hauglustaine, D., Lee, D., Myhre, G., . . . Zerofos, C. (2005). Aviation radiative forcing in 2000: An update on IPCC (1999). Meteorologische Zeitschrift, 14(4), 555-561.
SEAI. (2021). Irish Electricity Factor. Retrieved March 26, 2020, from https://www.seai.ie/data-and-insights/seai-statistics/key-statistics/electricity/
SMMT. (2019). Web site Homepage. Retrieved April 10, 2019, from https://www.smmt.co.uk/ Solomon, S., D. Qin, M. Manning, Z. Chen, M. Marquis, K.B. Avery, M. Tignor and H.L. Miller.
(2007). Contribution of Working Group I to the Fourth Assessment Report of the Intergovernmental Panel on Climate Change. Cambridge, United Kingdom: Cambridge University Press,. Retrieved from https://www.ipcc.ch/site/assets/uploads/2018/05/ar4_wg1_full_report-1.pdf
Sustainable Hospitality Alliance. (2020). Hotel Carbon Measurement Initiative. Retrieved from https://sustainablehospitalityalliance.org/resource/hotel-carbon-measurement-initiative/
Tassou, S.A., et al. (2009). Food transport refrigeration - Approaches to reduce energy consumption and environmental impacts of road transport. Applied Thermal Engineering, 29(8-9), 1467-1477.
test. (adsd, 3 3). tes. Retrieved from test: Simapro TU Graz. (2011). Reduction and testing of Greenhouse Gas Emissions from Heavy Duty
Vehicles - LOT 2; Development and testing of certification procedure CO2 and fuel consumption of HDV. A report by TU Graz, TNO, VTT, AVL, LAT and TUV Nord for the
2021 Government greenhouse gas conversion factors for company reporting: Methodology paper
118
European Commission, DG Climate Action. Retrieved from https://ec.europa.eu/clima/sites/clima/files/transport/vehicles/heavy/docs/hdv_2011_01_09_en.pdf
University of Westminster. (2008). Using official data sources to analyse the light goods vehicle fleet and operations in Britain. Green Logistics Report, Transport Studies Group, University of Westminster. Allen, J; Browne, M. Retrieved from https://westminsterresearch.westminster.ac.uk/item/91113/using-official-data-sources-to-analyse-the-light-goods-vehicle-fleet-and-operations-in-britain
VDA. (2014). Facts and Arguments about Fuel Consumption. Retrieved April 10, 2019, from www.vda.de/dam/vda/publications/2014/facts-and-arguments-about-fuel-consumption.pdf
WRAP. (2009). Wood Waste Market in the UK. Retrieved April 10, 2019, from http://www.wrap.org.uk/sites/files/wrap/Wood%20waste%20market%20in%20the%20UK.pdf
WRAP. (2010). Environmental benefits of recycling - 2010 update. Retrieved April 10, 2019, from http://www.wrap.org.uk/sites/files/wrap/Executive_summary_Environmental_benefits_of_recycling_-_2010_update.d1af1398.8671.pdf
2021 Government greenhouse gas conversion factors for company reporting: Methodology paper
119
Appendix 1. Additional Methodological Information on the Material Consumption/Use and Waste Disposal Factors This section explains the methodology for the choice of data used in the calculation of carbon emissions used in the “Material use” and “Waste disposal” worksheets. Section 1.1 details the indicators used to assess whether data met the data quality standards required for this project. Section 1.2 states the sources used to collect data. Finally, Section 1.3 explains and justifies the use of data which did not meet the data quality requirements.
1.1 Data Quality Requirements Data used in this methodology should, so far as is possible, meet the data quality indicators described in Table 1.1 below. Table 1.1: Data Quality Indications for the waste management GHG factors
Data Quality Indicator
Requirement Comments
Time-related coverage
Data less than 5 years’ old
Ideally, data should be less than five years old. However, the secondary data in material eco-profiles is only periodically updated. In cases where no reliable data is available from within the five-year period, the most recent data available have been used. In cases where use of data over five years old creates specific issues, these are discussed below under “Use of data below the set quality standard”. All data over five years old has been marked in the references with an asterisk within the 2.0 Data Sources section.
Geographical coverage
Data should be representative of the products placed on the market in the UK
Many datasets reflect European average production.
Technology coverage
Average technology A range of information is available, covering best in class, average and pending technology. Average is considered the most appropriate but may not reflect individual supply chain organisations.
Precision/ variance
No requirement Many datasets used provide average data with no information on the range. It is therefore not possible to identify the variance.
Completeness All datasets must be reviewed to ensure they cover inputs and outputs pertaining to the life cycle stage
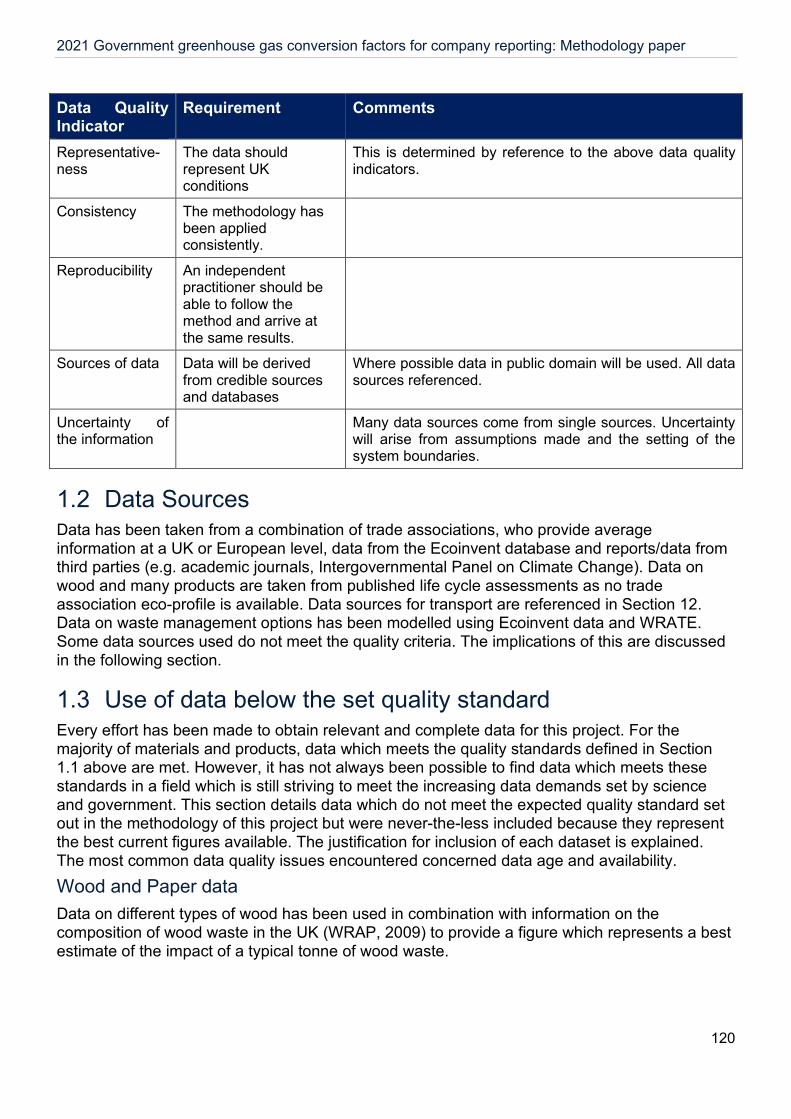
2021 Government greenhouse gas conversion factors for company reporting: Methodology paper
120
Data Quality Indicator
Requirement Comments
Representative-ness
The data should represent UK conditions
This is determined by reference to the above data quality indicators.
Consistency The methodology has been applied consistently.
Reproducibility An independent practitioner should be able to follow the method and arrive at the same results.
Sources of data Data will be derived from credible sources and databases
Where possible data in public domain will be used. All data sources referenced.
Uncertainty of the information
Many data sources come from single sources. Uncertainty will arise from assumptions made and the setting of the system boundaries.
1.2 Data Sources Data has been taken from a combination of trade associations, who provide average information at a UK or European level, data from the Ecoinvent database and reports/data from third parties (e.g. academic journals, Intergovernmental Panel on Climate Change). Data on wood and many products are taken from published life cycle assessments as no trade association eco-profile is available. Data sources for transport are referenced in Section 12. Data on waste management options has been modelled using Ecoinvent data and WRATE. Some data sources used do not meet the quality criteria. The implications of this are discussed in the following section.
1.3 Use of data below the set quality standard Every effort has been made to obtain relevant and complete data for this project. For the majority of materials and products, data which meets the quality standards defined in Section 1.1 above are met. However, it has not always been possible to find data which meets these standards in a field which is still striving to meet the increasing data demands set by science and government. This section details data which do not meet the expected quality standard set out in the methodology of this project but were never-the-less included because they represent the best current figures available. The justification for inclusion of each dataset is explained. The most common data quality issues encountered concerned data age and availability. Wood and Paper data Data on different types of wood has been used in combination with information on the composition of wood waste in the UK (WRAP, 2009) to provide a figure which represents a best estimate of the impact of a typical tonne of wood waste.
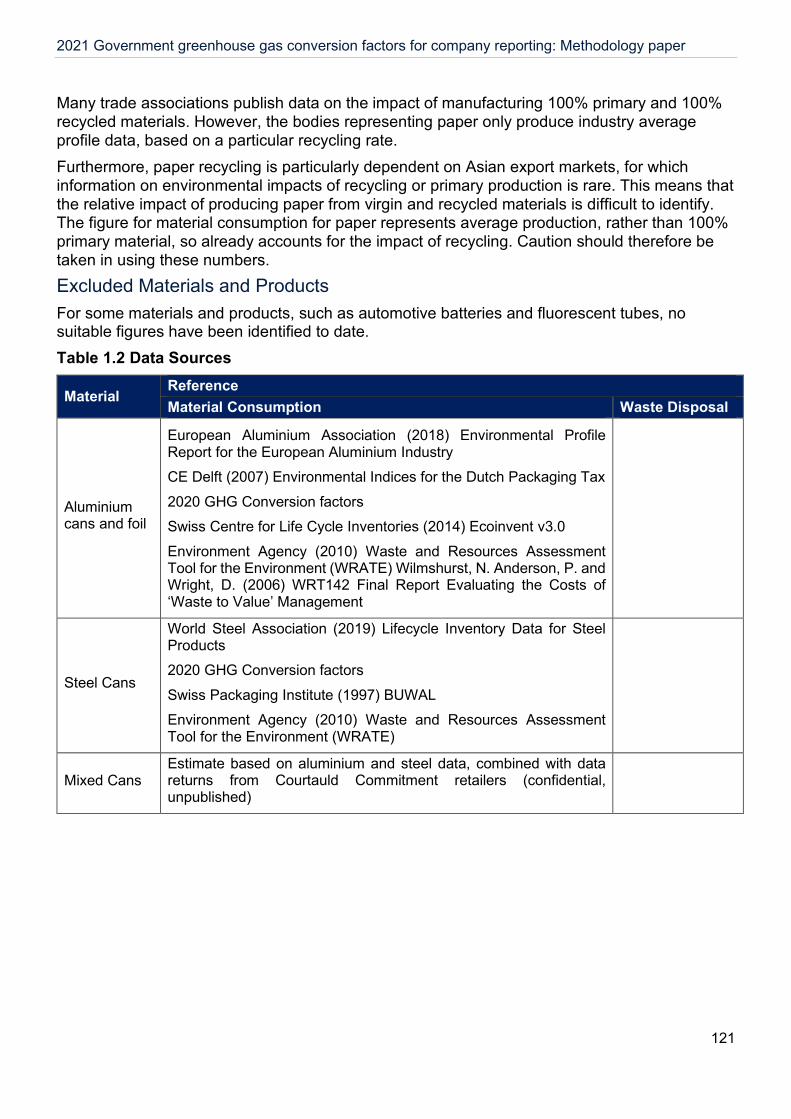
2021 Government greenhouse gas conversion factors for company reporting: Methodology paper
121
Many trade associations publish data on the impact of manufacturing 100% primary and 100% recycled materials. However, the bodies representing paper only produce industry average profile data, based on a particular recycling rate. Furthermore, paper recycling is particularly dependent on Asian export markets, for which information on environmental impacts of recycling or primary production is rare. This means that the relative impact of producing paper from virgin and recycled materials is difficult to identify. The figure for material consumption for paper represents average production, rather than 100% primary material, so already accounts for the impact of recycling. Caution should therefore be taken in using these numbers. Excluded Materials and Products For some materials and products, such as automotive batteries and fluorescent tubes, no suitable figures have been identified to date. Table 1.2 Data Sources
Material Reference Material Consumption Waste Disposal
Aluminium cans and foil
European Aluminium Association (2018) Environmental Profile Report for the European Aluminium Industry CE Delft (2007) Environmental Indices for the Dutch Packaging Tax 2020 GHG Conversion factors Swiss Centre for Life Cycle Inventories (2014) Ecoinvent v3.0 Environment Agency (2010) Waste and Resources Assessment Tool for the Environment (WRATE) Wilmshurst, N. Anderson, P. and Wright, D. (2006) WRT142 Final Report Evaluating the Costs of ‘Waste to Value’ Management
Steel Cans
World Steel Association (2019) Lifecycle Inventory Data for Steel Products 2020 GHG Conversion factors Swiss Packaging Institute (1997) BUWAL Environment Agency (2010) Waste and Resources Assessment Tool for the Environment (WRATE)
Mixed Cans Estimate based on aluminium and steel data, combined with data returns from Courtauld Commitment retailers (confidential, unpublished)

2021 Government greenhouse gas conversion factors for company reporting: Methodology paper
122
Glass
Ecoinvent (2020) Packaging glass production, white Ecoinvent (2020) Packaging glass production, green Ecoinvent (2020) Packaging glass production, brown Ecoinvent (2020) Packaging glass production, white, without cullet Ecoinvent (2020) Packaging glass production, green, without cullet Ecoinvent (2020) Packaging glass production, brown, without cullet Ecoinvent (2020) Market for glass cullet, sorted Ecoinvent (2020) Market for packaging glass, white Ecoinvent (2020) Market for packaging glass, green
Wood
Pöyry Forest Industry Consulting Ltd and Oxford Economics Ltd (2009) Wood Waste Market in UK 2021 GHG Conversion factors Environment Agency (2010) Waste and Resources Assessment Tool for the Environment (WRATE) Wilson, J. (2010) Life-cycle inventory of particleboard in terms of resources, emissions, energy and carbon Ecoinvent v2, sawn timber, softwood, raw, air dried, u=20%, at plant/m3/RER Ecoinvent v2, Particle board, P2 (Standard FPY), production mix, at plant, 7,8% water content Ecoinvent v2, plywood, outdoor use, at plant/m3/RER Ecoinvent v2, medium density fibreboard, at plant/m3/RER Ecoinvent v2, oriented strand board, at plant/m3/RER
Aggregates WRAP (2008) Lifecycle Assessment of Aggregates
Paper and board
2020 GHG Conversion factors FEFCO (2018) European database for Corrugated Board Life Cycle Studies DEFRA (2012) Streamlined LCA of Paper Supply Systems Swiss Centre for Life Cycle Inventories (2014) Ecoinvent v3.0 CEPI (2008) Key Statistics 2007 European Pulp and Paper Industry Environment Agency (2010) Waste and Resources Assessment Tool for the Environment (WRATE) WRAP (2020) Compositional analysis of Local Authority collected and non-Local Authority collected non-household municipal waste (England) Research Institutes of Sweden (RISE) (2019) The carbon footprint of carton packaging 2019 CPI (2019) The economic value of the UK paper-based industries 2019
Books Estimate based on paper
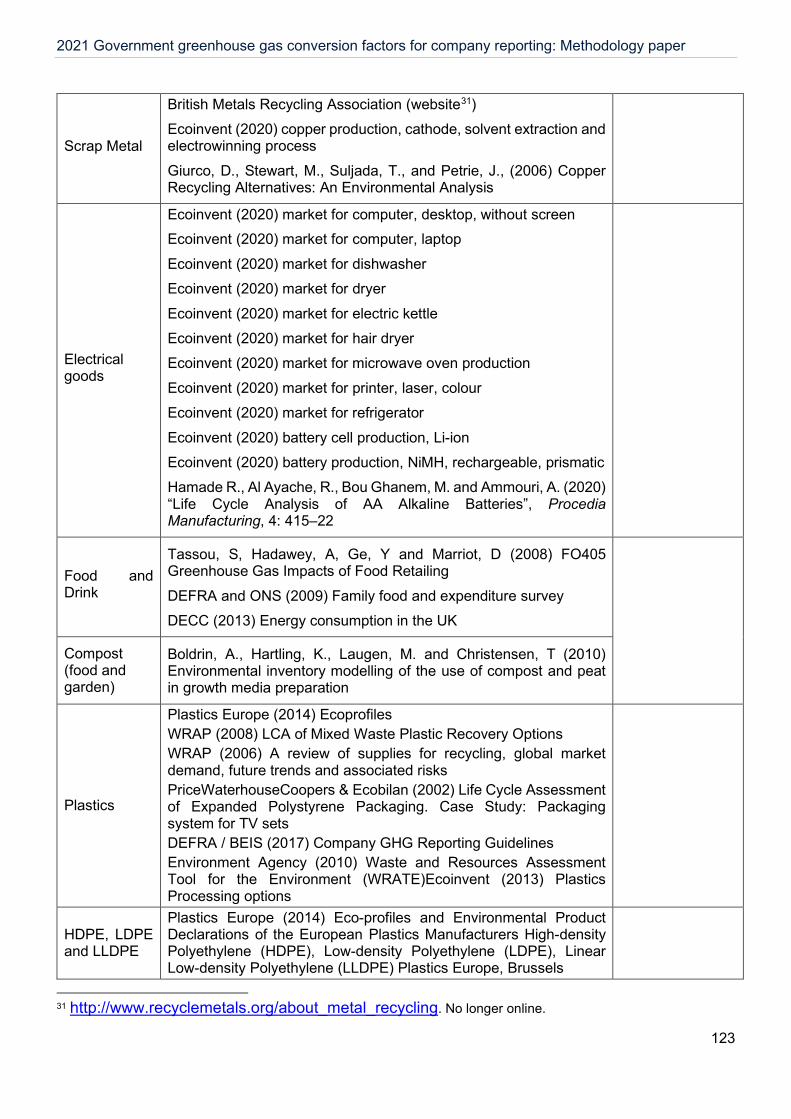
2021 Government greenhouse gas conversion factors for company reporting: Methodology paper
123
Scrap Metal
British Metals Recycling Association (website31) Ecoinvent (2020) copper production, cathode, solvent extraction and electrowinning process Giurco, D., Stewart, M., Suljada, T., and Petrie, J., (2006) Copper Recycling Alternatives: An Environmental Analysis
Electrical goods
Ecoinvent (2020) market for computer, desktop, without screen Ecoinvent (2020) market for computer, laptop Ecoinvent (2020) market for dishwasher Ecoinvent (2020) market for dryer Ecoinvent (2020) market for electric kettle Ecoinvent (2020) market for hair dryer Ecoinvent (2020) market for microwave oven production Ecoinvent (2020) market for printer, laser, colour Ecoinvent (2020) market for refrigerator Ecoinvent (2020) battery cell production, Li-ion Ecoinvent (2020) battery production, NiMH, rechargeable, prismatic Hamade R., Al Ayache, R., Bou Ghanem, M. and Ammouri, A. (2020) “Life Cycle Analysis of AA Alkaline Batteries”, Procedia Manufacturing, 4: 415–22
Food and Drink
Tassou, S, Hadawey, A, Ge, Y and Marriot, D (2008) FO405 Greenhouse Gas Impacts of Food Retailing DEFRA and ONS (2009) Family food and expenditure survey DECC (2013) Energy consumption in the UK
Compost (food and garden)
Boldrin, A., Hartling, K., Laugen, M. and Christensen, T (2010) Environmental inventory modelling of the use of compost and peat in growth media preparation
Plastics
Plastics Europe (2014) Ecoprofiles WRAP (2008) LCA of Mixed Waste Plastic Recovery Options WRAP (2006) A review of supplies for recycling, global market demand, future trends and associated risks PriceWaterhouseCoopers & Ecobilan (2002) Life Cycle Assessment of Expanded Polystyrene Packaging. Case Study: Packaging system for TV sets DEFRA / BEIS (2017) Company GHG Reporting Guidelines Environment Agency (2010) Waste and Resources Assessment Tool for the Environment (WRATE)Ecoinvent (2013) Plastics Processing options
HDPE, LDPE and LLDPE
Plastics Europe (2014) Eco-profiles and Environmental Product Declarations of the European Plastics Manufacturers High-density Polyethylene (HDPE), Low-density Polyethylene (LDPE), Linear Low-density Polyethylene (LLDPE) Plastics Europe, Brussels
31 http://www.recyclemetals.org/about_metal_recycling. No longer online.

2021 Government greenhouse gas conversion factors for company reporting: Methodology paper
124
PP (excel forming)
Plastics Europe (2014) Eco-profiles and Environmental Product Declarations of the European Plastics Manufacturers Polypropylene (PP). Plastics Europe, Brussels
PVC (excel forming)
Boustead (2006) Eco-profiles of the European Plastics Industry Polyvinyl Chloride (PVC) (Suspension). Plastics Europe, Brussels
PS (excel forming)
Plastics Europe (2015) Eco-profiles and Environmental Product Declarations of the European Plastics Manufacturers Polystyrene (High Impact) (HIPS). Plastics Europe, Brussels
PET (excel forming)
Plastics Europe (2010) Eco-profiles and Environmental Product Declarations of the European Plastics Manufacturers Polyethylene Terephthalate (PET). Plastics Europe, Brussels
Average plastic film (inch bags) Based on split in AMA Research (2009) Plastics Recycling Market
UK 2009-2013, UK; Cheltenham Average plastic rigid (inch bottles)
Clothing BIO IS (2009) Environmental Improvement Potentials of Textiles (IMPRO-Textiles), EU Joint Research Commission
Mineral Oil IFEU (2005) Ecological and energetic assessment of re-refining used oils to base oils: Substitution of primarily produced base oils including semi-synthetic and synthetic compounds; GEIR
Plasterboard WRAP (2008) Life Cycle Assessment of Plasterboard, prepared by ERM; WRAP; Banbury
Concrete Hammond, G.P. and Jones (2008) Embodied Energy and Carbon in Construction Materials Prc Instn Civil Eng, WRAP (2008) Life Cycle Assessment of Aggregates WRAP (2008) LCA of Aggregates
Bricks
Environment Agency (2011) Carbon Calculator USEPA (2003) Background Document for Life-Cycle Greenhouse Gas Conversion factors for Clay Brick Reuse and Concrete Recycling Christopher Koroneos, Aris Dompros, Environmental assessment of brick production in Greece, Building and Environment, Volume 42, Issue 5, May 2007, Pages 2114-2123
Asphalt Aggregain (2010) CO2 calculator Mineral Products Association (2011) Sustainable Development Report
Asbestos Swiss Centre for Life Cycle Inventories (2014) Ecoinvent v3.0
Insulation Hammond, G.P. and Jones (2008) Embodied Energy and Carbon in Construction Materials Prc Instn Civil Eng WRAP (2008) Recycling of Mineral Wool Composite Panels into New Raw Materials

2021 Government greenhouse gas conversion factors for company reporting: Methodology paper
125
Greenhouse Gas Conversion factors Industrial
Designation or Common Name
Chemical Formula
Lifetime (years)
Radiative Efficiency (Wm-2
ppb-1)
IPCC Fourth Assessment Report Global Warming Potential with 100 year time
horizon (IPCC Fifth Assessment Report figures shown in brackets)
Possible source of emissions
Carbon dioxide CO2 Variable 1.4 x10⁻⁵ 1 Combustion of fossil fuels
Methane CH4 12 3.7 x 10⁻⁴ 25 (28) Decomposition of biodegradable material, enteric emissions.
Nitrous Oxide N2O 114 3.03 x 10⁻³ 298 (265) N2O arises from Stationary Sources, mobile sources, manure, soil management and agricultural residue burning, sewage, combustion and bunker fuels
Sulphur hexafluoride SF6 3200 0.52 22,800 (23,500) Leakage from electricity substations, magnesium smelters, some consumer goods
HFC 134a (R134a refrigerant)
CH2FCF3 14 0.16 1,430 (1,300) Substitution of ozone depleting substances, refrigerant manufacture / leaks, aerosols, transmission and distribution of electricity.
Dichlorodifluoro-methane CFC 12 (R12 refrigerant)
CCl2F2 100 0.32 10,900 (10,200)
Difluoromono-chloromethane HCFC 22 (R22 refrigerant)
CHClF2 12 0.2 1,810 (1,760)
No single lifetime can be determined for carbon dioxide because of the difference in timescales associated with long and short cycle biogenic carbon. For a calculation of lifetimes and a full list of greenhouse gases and their global warming potentials please see Table 2.14: Lifetimes, radiative efficiencies and direct (except for CH4) global warming potentials (GWP) relative to CO2 .
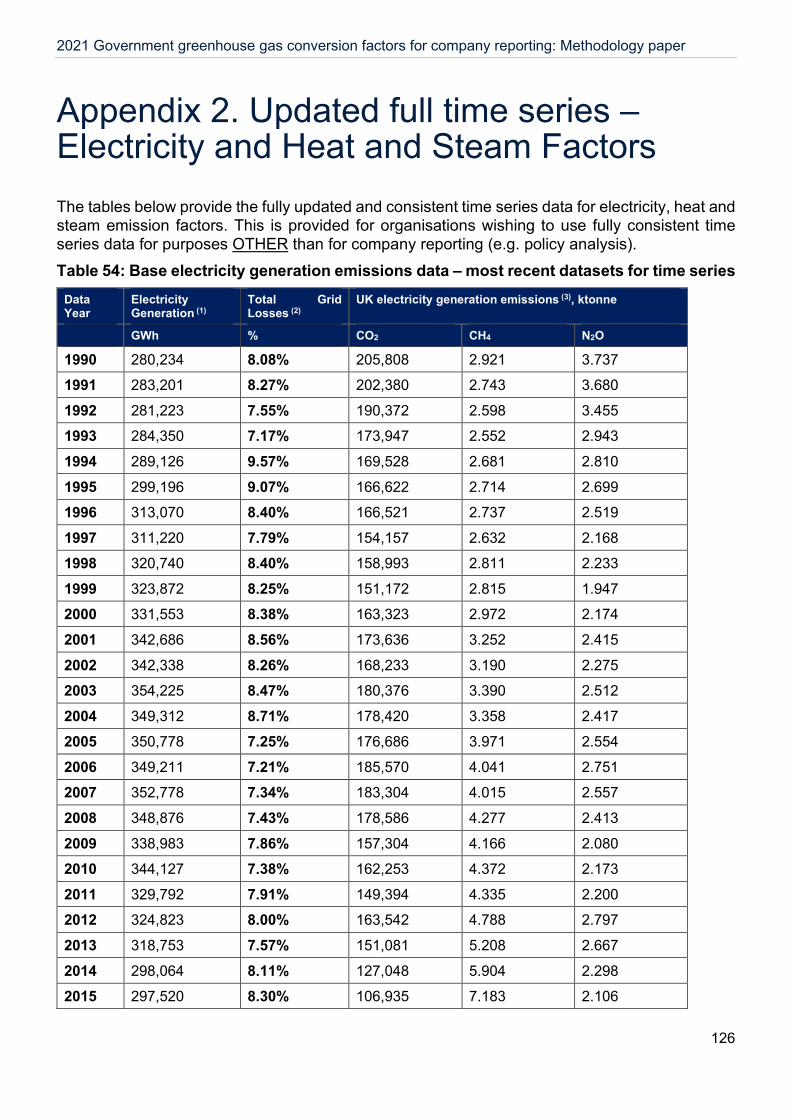
2021 Government greenhouse gas conversion factors for company reporting: Methodology paper
126
Appendix 2. Updated full time series – Electricity and Heat and Steam Factors The tables below provide the fully updated and consistent time series data for electricity, heat and steam emission factors. This is provided for organisations wishing to use fully consistent time series data for purposes OTHER than for company reporting (e.g. policy analysis). Table 54: Base electricity generation emissions data – most recent datasets for time series
Data Year
Electricity Generation (1)
Total Grid Losses (2)
UK electricity generation emissions (3), ktonne
GWh % CO2 CH4 N2O
1990 280,234 8.08% 205,808 2.921 3.737
1991 283,201 8.27% 202,380 2.743 3.680
1992 281,223 7.55% 190,372 2.598 3.455
1993 284,350 7.17% 173,947 2.552 2.943
1994 289,126 9.57% 169,528 2.681 2.810
1995 299,196 9.07% 166,622 2.714 2.699
1996 313,070 8.40% 166,521 2.737 2.519
1997 311,220 7.79% 154,157 2.632 2.168
1998 320,740 8.40% 158,993 2.811 2.233
1999 323,872 8.25% 151,172 2.815 1.947
2000 331,553 8.38% 163,323 2.972 2.174
2001 342,686 8.56% 173,636 3.252 2.415
2002 342,338 8.26% 168,233 3.190 2.275
2003 354,225 8.47% 180,376 3.390 2.512
2004 349,312 8.71% 178,420 3.358 2.417
2005 350,778 7.25% 176,686 3.971 2.554
2006 349,211 7.21% 185,570 4.041 2.751
2007 352,778 7.34% 183,304 4.015 2.557
2008 348,876 7.43% 178,586 4.277 2.413
2009 338,983 7.86% 157,304 4.166 2.080
2010 344,127 7.38% 162,253 4.372 2.173
2011 329,792 7.91% 149,394 4.335 2.200
2012 324,823 8.00% 163,542 4.788 2.797
2013 318,753 7.57% 151,081 5.208 2.667
2014 298,064 8.11% 127,048 5.904 2.298
2015 297,520 8.30% 106,935 7.183 2.106
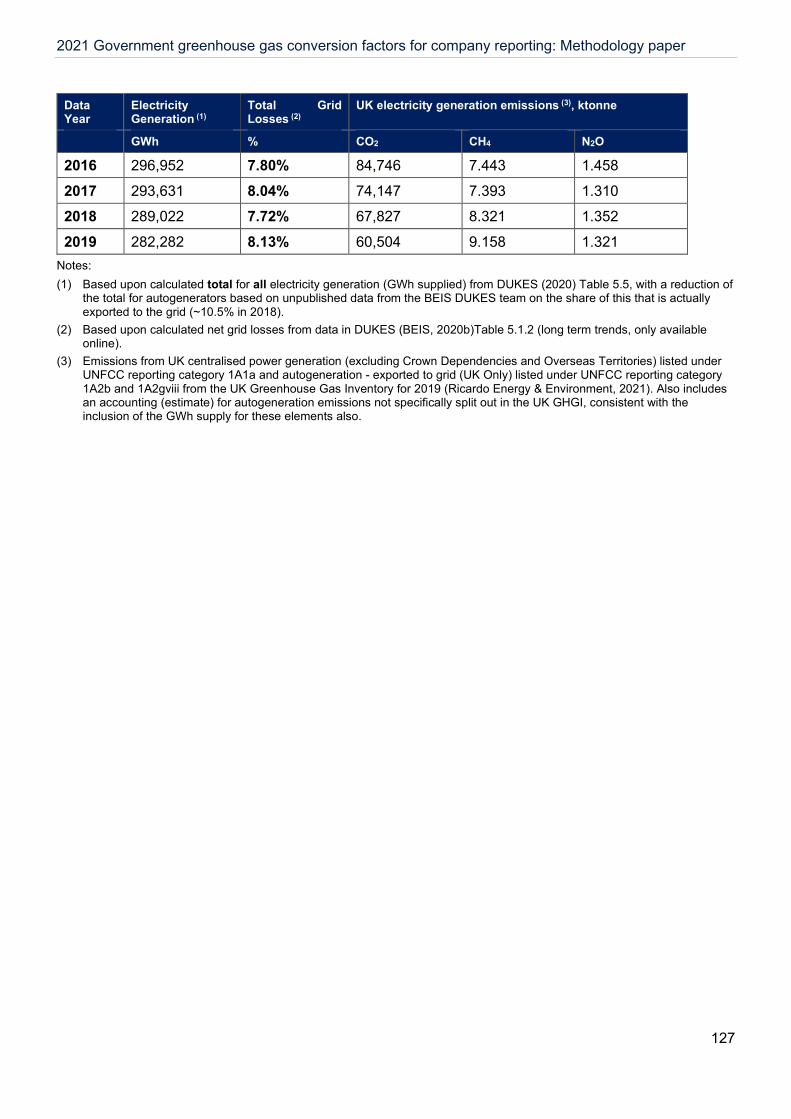
2021 Government greenhouse gas conversion factors for company reporting: Methodology paper
127
Data Year
Electricity Generation (1)
Total Grid Losses (2)
UK electricity generation emissions (3), ktonne
GWh % CO2 CH4 N2O
2016 296,952 7.80% 84,746 7.443 1.458
2017 293,631 8.04% 74,147 7.393 1.310
2018 289,022 7.72% 67,827 8.321 1.352
2019 282,282 8.13% 60,504 9.158 1.321 Notes: (1) Based upon calculated total for all electricity generation (GWh supplied) from DUKES (2020) Table 5.5, with a reduction of
the total for autogenerators based on unpublished data from the BEIS DUKES team on the share of this that is actually exported to the grid (~10.5% in 2018).
(2) Based upon calculated net grid losses from data in DUKES (BEIS, 2020b)Table 5.1.2 (long term trends, only available online).
(3) Emissions from UK centralised power generation (excluding Crown Dependencies and Overseas Territories) listed under UNFCC reporting category 1A1a and autogeneration - exported to grid (UK Only) listed under UNFCC reporting category 1A2b and 1A2gviii from the UK Greenhouse Gas Inventory for 2019 (Ricardo Energy & Environment, 2021). Also includes an accounting (estimate) for autogeneration emissions not specifically split out in the UK GHGI, consistent with the inclusion of the GWh supply for these elements also.

2021 Government greenhouse gas conversion factors for company reporting: Methodology paper
128
Table 55: Base electricity generation conversion factors (excluding imported electricity) – fully consistent time series dataset Data Year Emission Factor, kgCO2e / kWh % Net
Electricity Imports For electricity GENERATED
(supplied to the grid) Due to grid transmission /distribution LOSSES For electricity CONSUMED
(includes grid losses)
CO2 CH4 N2O Total CO2 CH4 N2O Total CO2 CH4 N2O Total TOTAL
1990 0.73442 0.00026 0.00397 0.73865 0.06453 0.00002 0.00035 0.06490 0.79894 0.00028 0.00432 0.80355 4.08% 1991 0.71461 0.00024 0.00387 0.71873 0.06442 0.00002 0.00035 0.06480 0.77904 0.00026 0.00422 0.78352 5.48% 1992 0.67694 0.00023 0.00366 0.68083 0.05526 0.00002 0.00030 0.05557 0.73220 0.00025 0.00396 0.73641 5.60% 1993 0.61173 0.00022 0.00308 0.61504 0.04724 0.00002 0.00024 0.04750 0.65898 0.00024 0.00332 0.66254 5.55% 1994 0.58634 0.00023 0.00290 0.58947 0.06207 0.00002 0.00031 0.06240 0.64842 0.00026 0.00320 0.65188 5.52% 1995 0.55690 0.00023 0.00269 0.55982 0.05556 0.00002 0.00027 0.05585 0.61246 0.00025 0.00296 0.61566 5.26% 1996 0.53190 0.00022 0.00240 0.53451 0.04880 0.00002 0.00022 0.04904 0.58069 0.00024 0.00262 0.58355 5.08% 1997 0.49533 0.00021 0.00208 0.49762 0.04187 0.00002 0.00018 0.04206 0.53720 0.00023 0.00225 0.53968 5.06% 1998 0.49571 0.00022 0.00207 0.49800 0.04543 0.00002 0.00019 0.04564 0.54114 0.00024 0.00226 0.54364 3.74% 1999 0.46676 0.00022 0.00179 0.46877 0.04198 0.00002 0.00016 0.04216 0.50874 0.00024 0.00195 0.51093 4.21% 2000 0.49260 0.00022 0.00195 0.49478 0.04508 0.00002 0.00018 0.04528 0.53768 0.00024 0.00213 0.54006 4.10% 2001 0.50669 0.00024 0.00210 0.50903 0.04744 0.00002 0.00020 0.04766 0.55413 0.00026 0.00230 0.55669 2.95% 2002 0.49143 0.00023 0.00198 0.49364 0.04422 0.00002 0.00018 0.04442 0.53564 0.00025 0.00216 0.53806 2.40% 2003 0.50921 0.00024 0.00211 0.51157 0.04711 0.00002 0.00020 0.04733 0.55633 0.00026 0.00231 0.55890 0.61% 2004 0.51077 0.00024 0.00206 0.51308 0.04873 0.00002 0.00020 0.04895 0.55951 0.00026 0.00226 0.56203 2.10% 2005 0.50370 0.00028 0.00217 0.50615 0.03935 0.00002 0.00017 0.03954 0.54304 0.00031 0.00234 0.54569 2.32% 2006 0.53140 0.00029 0.00235 0.53404 0.04132 0.00002 0.00018 0.04152 0.57272 0.00031 0.00253 0.57556 2.11% 2007 0.51960 0.00028 0.00216 0.52205 0.04115 0.00002 0.00017 0.04134 0.56075 0.00031 0.00233 0.56338 1.46% 2008 0.51189 0.00031 0.00206 0.51426 0.04109 0.00002 0.00017 0.04128 0.55298 0.00033 0.00223 0.55554 3.06% 2009 0.46405 0.00031 0.00183 0.46618 0.03958 0.00003 0.00016 0.03976 0.50363 0.00033 0.00198 0.50594 0.84% 2010 0.47149 0.00032 0.00188 0.47369 0.03756 0.00003 0.00015 0.03773 0.50905 0.00034 0.00203 0.51142 0.77% 2011 0.45300 0.00033 0.00199 0.45531 0.03890 0.00003 0.00017 0.03910 0.49190 0.00036 0.00216 0.49442 1.85%
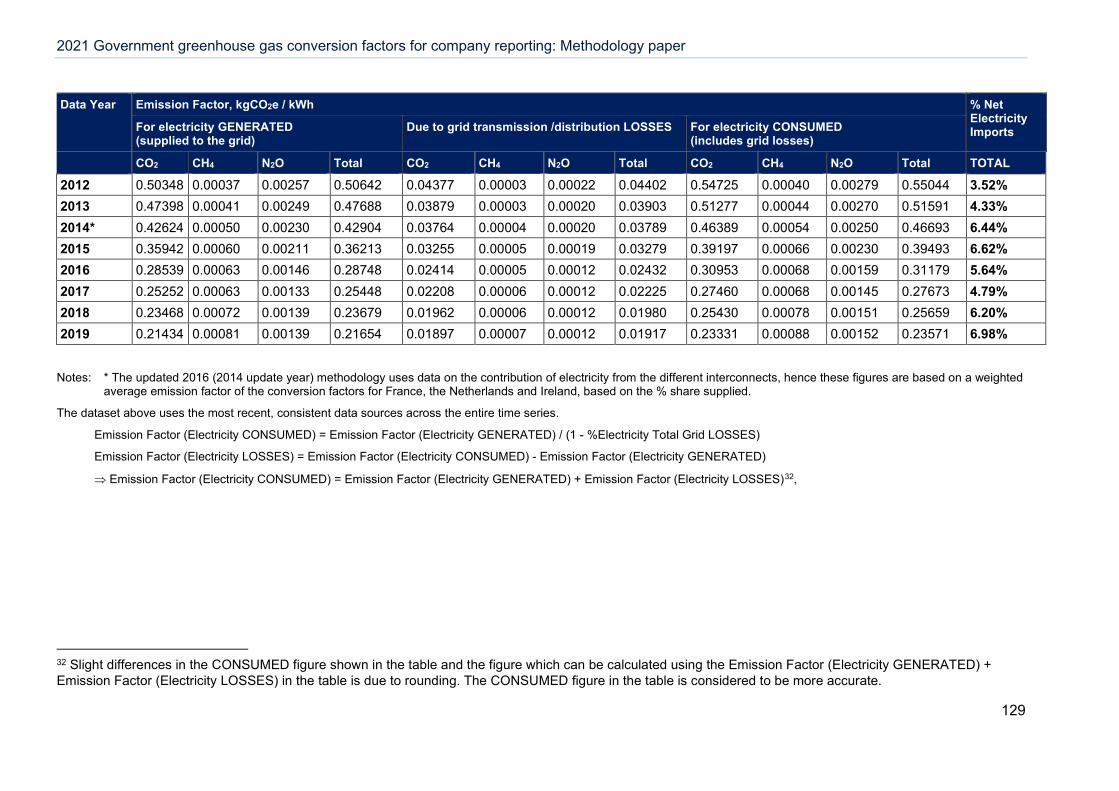
2021 Government greenhouse gas conversion factors for company reporting: Methodology paper
129
Data Year Emission Factor, kgCO2e / kWh % Net Electricity Imports For electricity GENERATED
(supplied to the grid) Due to grid transmission /distribution LOSSES For electricity CONSUMED
(includes grid losses)
CO2 CH4 N2O Total CO2 CH4 N2O Total CO2 CH4 N2O Total TOTAL
2012 0.50348 0.00037 0.00257 0.50642 0.04377 0.00003 0.00022 0.04402 0.54725 0.00040 0.00279 0.55044 3.52% 2013 0.47398 0.00041 0.00249 0.47688 0.03879 0.00003 0.00020 0.03903 0.51277 0.00044 0.00270 0.51591 4.33% 2014* 0.42624 0.00050 0.00230 0.42904 0.03764 0.00004 0.00020 0.03789 0.46389 0.00054 0.00250 0.46693 6.44% 2015 0.35942 0.00060 0.00211 0.36213 0.03255 0.00005 0.00019 0.03279 0.39197 0.00066 0.00230 0.39493 6.62% 2016 0.28539 0.00063 0.00146 0.28748 0.02414 0.00005 0.00012 0.02432 0.30953 0.00068 0.00159 0.31179 5.64% 2017 0.25252 0.00063 0.00133 0.25448 0.02208 0.00006 0.00012 0.02225 0.27460 0.00068 0.00145 0.27673 4.79% 2018 0.23468 0.00072 0.00139 0.23679 0.01962 0.00006 0.00012 0.01980 0.25430 0.00078 0.00151 0.25659 6.20% 2019 0.21434 0.00081 0.00139 0.21654 0.01897 0.00007 0.00012 0.01917 0.23331 0.00088 0.00152 0.23571 6.98%
Notes: * The updated 2016 (2014 update year) methodology uses data on the contribution of electricity from the different interconnects, hence these figures are based on a weighted average emission factor of the conversion factors for France, the Netherlands and Ireland, based on the % share supplied.
The dataset above uses the most recent, consistent data sources across the entire time series.
Emission Factor (Electricity CONSUMED) = Emission Factor (Electricity GENERATED) / (1 - %Electricity Total Grid LOSSES)
Emission Factor (Electricity LOSSES) = Emission Factor (Electricity CONSUMED) - Emission Factor (Electricity GENERATED)
⇒ Emission Factor (Electricity CONSUMED) = Emission Factor (Electricity GENERATED) + Emission Factor (Electricity LOSSES)32,
32 Slight differences in the CONSUMED figure shown in the table and the figure which can be calculated using the Emission Factor (Electricity GENERATED) + Emission Factor (Electricity LOSSES) in the table is due to rounding. The CONSUMED figure in the table is considered to be more accurate.
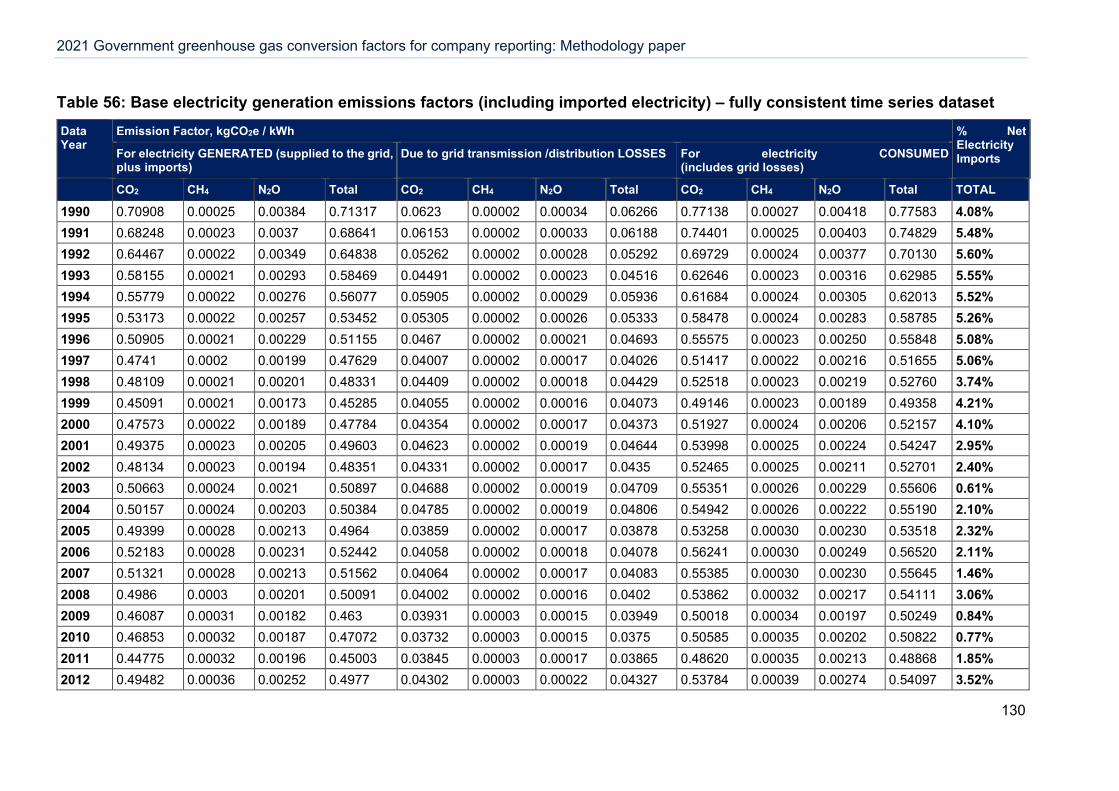
2021 Government greenhouse gas conversion factors for company reporting: Methodology paper
130
Table 56: Base electricity generation emissions factors (including imported electricity) – fully consistent time series dataset Data Year
Emission Factor, kgCO2e / kWh % Net Electricity Imports For electricity GENERATED (supplied to the grid,
plus imports) Due to grid transmission /distribution LOSSES For electricity CONSUMED
(includes grid losses)
CO2 CH4 N2O Total CO2 CH4 N2O Total CO2 CH4 N2O Total TOTAL
1990 0.70908 0.00025 0.00384 0.71317 0.0623 0.00002 0.00034 0.06266 0.77138 0.00027 0.00418 0.77583 4.08% 1991 0.68248 0.00023 0.0037 0.68641 0.06153 0.00002 0.00033 0.06188 0.74401 0.00025 0.00403 0.74829 5.48% 1992 0.64467 0.00022 0.00349 0.64838 0.05262 0.00002 0.00028 0.05292 0.69729 0.00024 0.00377 0.70130 5.60% 1993 0.58155 0.00021 0.00293 0.58469 0.04491 0.00002 0.00023 0.04516 0.62646 0.00023 0.00316 0.62985 5.55% 1994 0.55779 0.00022 0.00276 0.56077 0.05905 0.00002 0.00029 0.05936 0.61684 0.00024 0.00305 0.62013 5.52% 1995 0.53173 0.00022 0.00257 0.53452 0.05305 0.00002 0.00026 0.05333 0.58478 0.00024 0.00283 0.58785 5.26% 1996 0.50905 0.00021 0.00229 0.51155 0.0467 0.00002 0.00021 0.04693 0.55575 0.00023 0.00250 0.55848 5.08% 1997 0.4741 0.0002 0.00199 0.47629 0.04007 0.00002 0.00017 0.04026 0.51417 0.00022 0.00216 0.51655 5.06% 1998 0.48109 0.00021 0.00201 0.48331 0.04409 0.00002 0.00018 0.04429 0.52518 0.00023 0.00219 0.52760 3.74% 1999 0.45091 0.00021 0.00173 0.45285 0.04055 0.00002 0.00016 0.04073 0.49146 0.00023 0.00189 0.49358 4.21% 2000 0.47573 0.00022 0.00189 0.47784 0.04354 0.00002 0.00017 0.04373 0.51927 0.00024 0.00206 0.52157 4.10% 2001 0.49375 0.00023 0.00205 0.49603 0.04623 0.00002 0.00019 0.04644 0.53998 0.00025 0.00224 0.54247 2.95% 2002 0.48134 0.00023 0.00194 0.48351 0.04331 0.00002 0.00017 0.0435 0.52465 0.00025 0.00211 0.52701 2.40% 2003 0.50663 0.00024 0.0021 0.50897 0.04688 0.00002 0.00019 0.04709 0.55351 0.00026 0.00229 0.55606 0.61% 2004 0.50157 0.00024 0.00203 0.50384 0.04785 0.00002 0.00019 0.04806 0.54942 0.00026 0.00222 0.55190 2.10% 2005 0.49399 0.00028 0.00213 0.4964 0.03859 0.00002 0.00017 0.03878 0.53258 0.00030 0.00230 0.53518 2.32% 2006 0.52183 0.00028 0.00231 0.52442 0.04058 0.00002 0.00018 0.04078 0.56241 0.00030 0.00249 0.56520 2.11% 2007 0.51321 0.00028 0.00213 0.51562 0.04064 0.00002 0.00017 0.04083 0.55385 0.00030 0.00230 0.55645 1.46% 2008 0.4986 0.0003 0.00201 0.50091 0.04002 0.00002 0.00016 0.0402 0.53862 0.00032 0.00217 0.54111 3.06% 2009 0.46087 0.00031 0.00182 0.463 0.03931 0.00003 0.00015 0.03949 0.50018 0.00034 0.00197 0.50249 0.84% 2010 0.46853 0.00032 0.00187 0.47072 0.03732 0.00003 0.00015 0.0375 0.50585 0.00035 0.00202 0.50822 0.77% 2011 0.44775 0.00032 0.00196 0.45003 0.03845 0.00003 0.00017 0.03865 0.48620 0.00035 0.00213 0.48868 1.85% 2012 0.49482 0.00036 0.00252 0.4977 0.04302 0.00003 0.00022 0.04327 0.53784 0.00039 0.00274 0.54097 3.52%
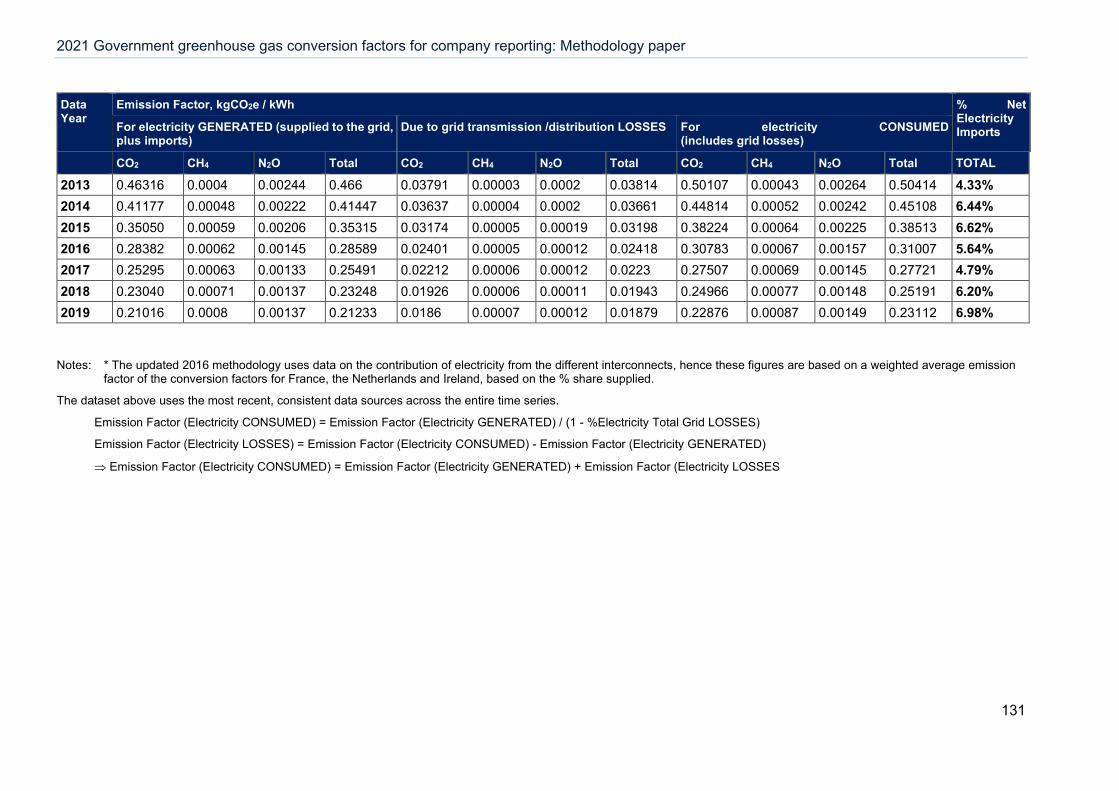
2021 Government greenhouse gas conversion factors for company reporting: Methodology paper
131
Data Year
Emission Factor, kgCO2e / kWh % Net Electricity Imports For electricity GENERATED (supplied to the grid,
plus imports) Due to grid transmission /distribution LOSSES For electricity CONSUMED
(includes grid losses)
CO2 CH4 N2O Total CO2 CH4 N2O Total CO2 CH4 N2O Total TOTAL
2013 0.46316 0.0004 0.00244 0.466 0.03791 0.00003 0.0002 0.03814 0.50107 0.00043 0.00264 0.50414 4.33% 2014 0.41177 0.00048 0.00222 0.41447 0.03637 0.00004 0.0002 0.03661 0.44814 0.00052 0.00242 0.45108 6.44% 2015 0.35050 0.00059 0.00206 0.35315 0.03174 0.00005 0.00019 0.03198 0.38224 0.00064 0.00225 0.38513 6.62% 2016 0.28382 0.00062 0.00145 0.28589 0.02401 0.00005 0.00012 0.02418 0.30783 0.00067 0.00157 0.31007 5.64% 2017 0.25295 0.00063 0.00133 0.25491 0.02212 0.00006 0.00012 0.0223 0.27507 0.00069 0.00145 0.27721 4.79% 2018 0.23040 0.00071 0.00137 0.23248 0.01926 0.00006 0.00011 0.01943 0.24966 0.00077 0.00148 0.25191 6.20% 2019 0.21016 0.0008 0.00137 0.21233 0.0186 0.00007 0.00012 0.01879 0.22876 0.00087 0.00149 0.23112 6.98%
Notes: * The updated 2016 methodology uses data on the contribution of electricity from the different interconnects, hence these figures are based on a weighted average emission
factor of the conversion factors for France, the Netherlands and Ireland, based on the % share supplied.
The dataset above uses the most recent, consistent data sources across the entire time series.
Emission Factor (Electricity CONSUMED) = Emission Factor (Electricity GENERATED) / (1 - %Electricity Total Grid LOSSES)
Emission Factor (Electricity LOSSES) = Emission Factor (Electricity CONSUMED) - Emission Factor (Electricity GENERATED)
⇒ Emission Factor (Electricity CONSUMED) = Emission Factor (Electricity GENERATED) + Emission Factor (Electricity LOSSES
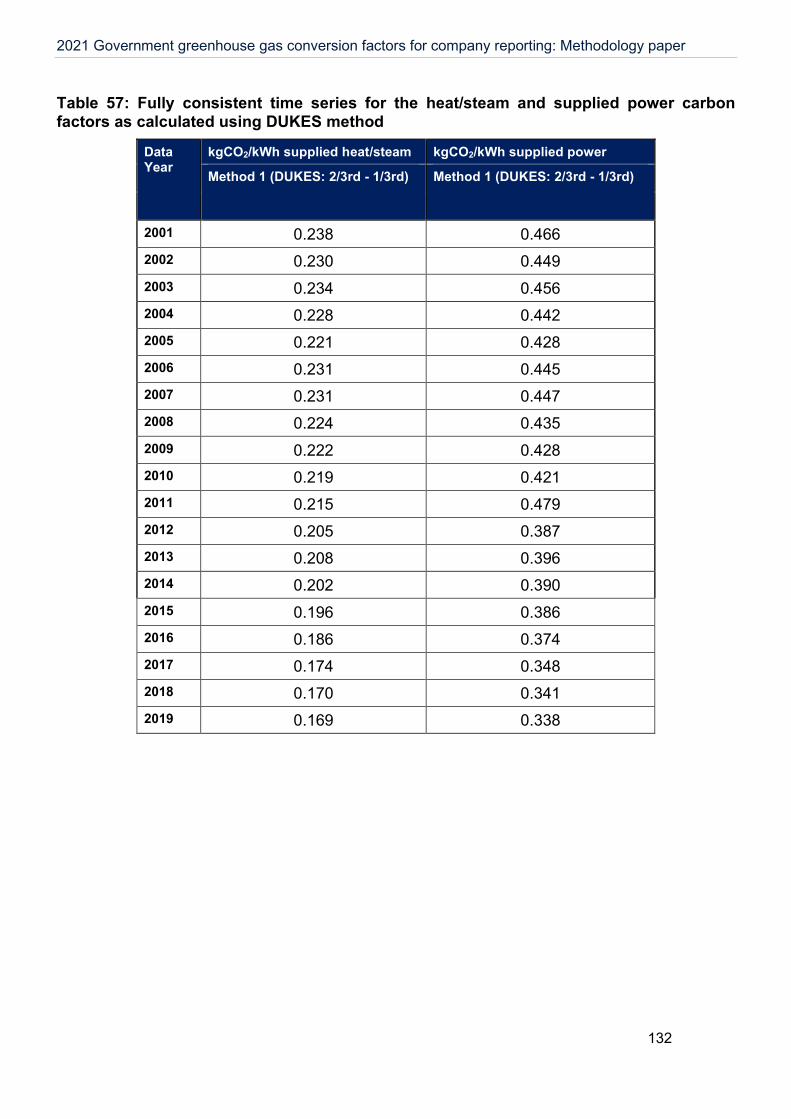
2021 Government greenhouse gas conversion factors for company reporting: Methodology paper
132
Table 57: Fully consistent time series for the heat/steam and supplied power carbon factors as calculated using DUKES method
Data Year
kgCO2/kWh supplied heat/steam kgCO2/kWh supplied power
Method 1 (DUKES: 2/3rd - 1/3rd) Method 1 (DUKES: 2/3rd - 1/3rd)
2001 0.238 0.466 2002 0.230 0.449 2003 0.234 0.456 2004 0.228 0.442 2005 0.221 0.428 2006 0.231 0.445 2007 0.231 0.447 2008 0.224 0.435 2009 0.222 0.428 2010 0.219 0.421 2011 0.215 0.479 2012 0.205 0.387 2013 0.208 0.396 2014 0.202 0.390 2015 0.196 0.386 2016 0.186 0.374 2017 0.174 0.348 2018 0.170 0.341 2019 0.169 0.338

This publication is available from: https://www.gov.uk/government/collections/government-conversion-factors-for-company-reporting
If you need a version of this document in a more accessible format, please email [email protected]. Please tell us what format you need. It will help us if you say what assistive technology you use.
Copyright © 2022 FDOKUMEN