
Effect of Process Parameters on Greenhouse Gas Generation by Wastewater Treatment Plants
11
Effect of Process Parameters on Greenhouse Gas Generation by Wastewater Treatment Plants L. Yerushalmi, M. Bani Shahabadi, F. Haghighat* ABSTRACT: The effect of key process parameters on greenhouse gas (GHG) emission by wastewater treatment plants was evaluated, and the governing parameters that exhibited major effects on the overall on- and off-site GHG emissions were identified. This evaluation used aerobic, anaerobic, and hybrid anaerobic/aerobic treatment systems with food processing industry wastewater. The operating temperature of anaerobic sludge digester was identified to have the highest effect on GHG generation in the aerobic treatment system. The total GHG emissions of 2694 kg CO 2 e/d were increased by 72.5% with the increase of anaerobic sludge digester temperature from 20 to 40*C. The operating temperature of the anaerobic reactor was the dominant controlling parameter in the anaerobic and hybrid treatment systems. Raising the anaerobic reactor's temperature from 25 to 40'C increased the total GHG emissions from 5822 and 6617 kg CO 2 edd by 105.6 and 96.5% in the anaerobic and hybrid treatment systems, respectively. Water Environ. Res., 83, 440 (2011). KEYWORDS: greenhouse gas, on-site and off-site emissions, aerobic, anaerobic, hybrid, wastewater treatment. doi: 10.2175/106143010X12851009156321 Introduction During the past two centuries, the concentration of greenhouse gases (GHGs) has increased, partly as a result of anthropogenic activities, such as fossil fuel production and combustion and agricultural and industrial activities (EI-Fadel and Massoud, 2001). Following the ratification of the Kyoto Protocol, each sector of industry is responsible to calculate its GHG emissions and seek mitigation measures. Wastewater treatment plants (WWTPs) produce three of the most important GHGs-namely carbon dioxide (CO 2 ), methane (CH 4 ), and nitrous oxide (N 2 0)-- during the treatment processes and additionally generate CO 2 and CH4 from the energy demands of the plant. The C0 2 , CH 4 , and N 2 0 have Global Warming Potentials (GWPs) of 1, 21, and 310, respectively, for a 100-year period (European Commission, 200 1). The GHG emissions from WWTPs are divided into on-site and off-site emissions. On-site GHG emissions are produced by liquid and solid treatment processes and biogas and fossil fuel combustion for energy generation. Off-site emissions are generated by the production of electricity for WWTPs, production Department of Building Civil and Environmental Engineering, Concordia University, Montreal, Quebec, Canada. * Department of Building Civil and Environmental Engineering, Con- cordia University, 1455 de Maisonneuve Blvd. West, Montreal, QC, Canada, H3G IM8; e-mail: [email protected]. 440 and transportation of fuel and chemicals for on-site usage, degradation of remaining constituents in the effluent, and transportation and disposal of solids. Tillman et al. (1998) noted that the environmental effects of plant operation using various operational scenarios were more significant than those related to the construction of the plant. Moreover, the operational period of the facility was chosen in this study because it (1) Considers the construction process involved, (2) Is expected to have the longest duration of the plant activities, (3) Demonstrates the opportunity for energy recovery and production (Sahely et al., 2006). Most previous studies of GHG emissions by WWTPs only considered the contribution of carbonaceous biochemical oxygen demand and ignored the effect of nutrient removal on GHG generation (Cakir and Stenstrom, 2005; EI-Fadel and Massoud, 2001; Keller and Hartley, 2003; Monteith et al., 2005; Sahely et al., 2006; Wei et al., 2008). In addition, earlier studies mainly concentrated on on-site GHG emissions from the treatment processes and did not take into account the off-site GHG emissions, particularly the off-site GHG emissions corresponding to the on-site usage of chemicals and fuels (Cakir and Stenstrom, 2005; EI-Fadel and Massoud, 2001; Greenfield and Batstone, 2005; Keller and Hartley, 2003; Monteith et al., 2005; Wei et al., 2008). The present study has addressed these limitations and estimated both on- and off-site GHG emissions using nutrient removal treatment plants as the model. Of course, it should be noted that the type of processes used in these treatment plants and their corresponding kinetics are different. The present study represents GHG emissions from WWTPs using similar processes and kinetic values. In the case of dissimilarities, the GHG emission estimation model developed by Bani Shahabadi et al. (2010) can be modified to address alternative processes. The off-site GHG emissions traditionally are assigned to alternative sectors (e.g., energy or industry) and not to the end- user, which is the WWTP (Sahely et al., 2006). According to the Intergovernmental Panel on Climate Change (IPCC), emissions of CO 2 resulting from biomass and biomass-based wastes, such as decomposition of food, should not be included in GHG emissions estimates (E1-Fadel and Massoud, 2001; IPCC, 2000). Although this assumption is valid for the calculation of national GHG inventories, it cannot be applied to the estimation of GHG generation by a given plant, such as WWTPs. Besides, this assumption is true only if the biomass or renewable fuels are Water Environment Research, Volume 83, Number 5
Transcript of Effect of Process Parameters on Greenhouse Gas Generation by Wastewater Treatment Plants

Effect of Process Parameters onGreenhouse Gas Generation by Wastewater
Treatment PlantsL. Yerushalmi, M. Bani Shahabadi, F. Haghighat*
ABSTRACT: The effect of key process parameters on greenhouse gas(GHG) emission by wastewater treatment plants was evaluated, and thegoverning parameters that exhibited major effects on the overall on- andoff-site GHG emissions were identified. This evaluation used aerobic,anaerobic, and hybrid anaerobic/aerobic treatment systems with foodprocessing industry wastewater. The operating temperature of anaerobicsludge digester was identified to have the highest effect on GHGgeneration in the aerobic treatment system. The total GHG emissions of2694 kg CO2e/d were increased by 72.5% with the increase of anaerobicsludge digester temperature from 20 to 40*C. The operating temperature ofthe anaerobic reactor was the dominant controlling parameter in theanaerobic and hybrid treatment systems. Raising the anaerobic reactor'stemperature from 25 to 40'C increased the total GHG emissions from 5822and 6617 kg CO2edd by 105.6 and 96.5% in the anaerobic and hybridtreatment systems, respectively. Water Environ. Res., 83, 440 (2011).
KEYWORDS: greenhouse gas, on-site and off-site emissions, aerobic,anaerobic, hybrid, wastewater treatment.
doi: 10.2175/106143010X12851009156321
IntroductionDuring the past two centuries, the concentration of greenhouse
gases (GHGs) has increased, partly as a result of anthropogenicactivities, such as fossil fuel production and combustion andagricultural and industrial activities (EI-Fadel and Massoud,2001). Following the ratification of the Kyoto Protocol, eachsector of industry is responsible to calculate its GHG emissionsand seek mitigation measures. Wastewater treatment plants(WWTPs) produce three of the most important GHGs-namelycarbon dioxide (CO2), methane (CH4), and nitrous oxide (N 2 0)--
during the treatment processes and additionally generate CO2 andCH4 from the energy demands of the plant. The C0 2, CH4, andN20 have Global Warming Potentials (GWPs) of 1, 21, and 310,respectively, for a 100-year period (European Commission, 200 1).The GHG emissions from WWTPs are divided into on-site andoff-site emissions. On-site GHG emissions are produced by liquidand solid treatment processes and biogas and fossil fuelcombustion for energy generation. Off-site emissions aregenerated by the production of electricity for WWTPs, production
Department of Building Civil and Environmental Engineering, ConcordiaUniversity, Montreal, Quebec, Canada.* Department of Building Civil and Environmental Engineering, Con-cordia University, 1455 de Maisonneuve Blvd. West, Montreal, QC,Canada, H3G IM8; e-mail: [email protected].
440
and transportation of fuel and chemicals for on-site usage,degradation of remaining constituents in the effluent, andtransportation and disposal of solids.
Tillman et al. (1998) noted that the environmental effects ofplant operation using various operational scenarios were moresignificant than those related to the construction of the plant.Moreover, the operational period of the facility was chosen in thisstudy because it
(1) Considers the construction process involved,(2) Is expected to have the longest duration of the plant activities,(3) Demonstrates the opportunity for energy recovery and
production (Sahely et al., 2006).
Most previous studies of GHG emissions by WWTPs onlyconsidered the contribution of carbonaceous biochemical oxygendemand and ignored the effect of nutrient removal on GHGgeneration (Cakir and Stenstrom, 2005; EI-Fadel and Massoud,2001; Keller and Hartley, 2003; Monteith et al., 2005; Sahely etal., 2006; Wei et al., 2008). In addition, earlier studies mainlyconcentrated on on-site GHG emissions from the treatmentprocesses and did not take into account the off-site GHGemissions, particularly the off-site GHG emissions correspondingto the on-site usage of chemicals and fuels (Cakir and Stenstrom,2005; EI-Fadel and Massoud, 2001; Greenfield and Batstone,2005; Keller and Hartley, 2003; Monteith et al., 2005; Wei et al.,2008). The present study has addressed these limitations andestimated both on- and off-site GHG emissions using nutrientremoval treatment plants as the model. Of course, it should benoted that the type of processes used in these treatment plants andtheir corresponding kinetics are different. The present studyrepresents GHG emissions from WWTPs using similar processesand kinetic values. In the case of dissimilarities, the GHGemission estimation model developed by Bani Shahabadi et al.(2010) can be modified to address alternative processes.
The off-site GHG emissions traditionally are assigned toalternative sectors (e.g., energy or industry) and not to the end-user, which is the WWTP (Sahely et al., 2006). According to theIntergovernmental Panel on Climate Change (IPCC), emissions ofCO 2 resulting from biomass and biomass-based wastes, such asdecomposition of food, should not be included in GHG emissionsestimates (E1-Fadel and Massoud, 2001; IPCC, 2000). Althoughthis assumption is valid for the calculation of national GHGinventories, it cannot be applied to the estimation of GHGgeneration by a given plant, such as WWTPs. Besides, thisassumption is true only if the biomass or renewable fuels are
Water Environment Research, Volume 83, Number 5

Yerushalmi et al.
produced without the contribution of fossil fuels, which rarelyoccurs in reality. Accordingly, GHG emissions from WWTPstraditionally have been underestimated, especially during indus-trial operations that produce wastewaters having high solublebiochemical oxygen demand (BOD) and suspended solidsconcentrations, with the resulting generation of higher amountsof GHG compared with municipal WWTPs.
Wastewater treatment plants are highly vulnerable to theoutcomes of the Kyoto and subsequent protocols, which plan toimpose taxes and penalties on GHG emissions in the near future(Greenfield and Batstone, 2005). Wastewater treatment plantsshould examine abatement strategies to reduce the generation ofGHGs and avoid possible carbon or GHG taxes. This may beachieved by identifying the key process parameters that controlGHG emissions in WWTPs and by operating the plants at theoptimum range of process parameters and operating conditions.The main objective of this study was to identify the controllingprocess parameters in the WWTP of the food processing industryand evaluate their effect on the overall GHG emissions. Theresults enabled the identification of major controlling parameters;leading to recommendations for GHG mitigation strategies inWWTPs.
MethodologyThe on- and off-site GHG emissions by WWTPs were
estimated by using an elaborate mathematical model developedby Bani Shahabadi et al. (2010). The on-site emissions of CO2 andCH4 associated with the treatment processes were estimated fromthe mass balance equations using the pertinent kinetics andstoichiometric relationships. Only on- and off-site CO2 and CH4productions were considered in this study, and N20 emissionswere ignored because of the absence of reliable data on N2 0emissions by WWTPs (Barton and Atwater, 2002). According toMonteith et al. (2005), N20 emissions take place during bothnitrification and denitrification processes, and their generation canbe prevented by complete nitrification and denitrification. TheGHG emissions have been calculated only for the biologicaltreatment processes, and the GHG emissions from sludgecondiiioning and dewatering unit are not considered in this study.In addition, the off-site GHG emissions associated with chemicalmanufacturing for the disinfection of wastewater are notconsidered in this study.
The developed model estimates on- and off-site GHGemissions by biological treatment, energy consumption, chemicalmanufacturing, and solid disposal processes, and addressesalternative designs of treatment plants that include aerobic,anaerobic, and hybrid anaerobic/aerobic processes (Bani Shaha-badi et al., 2009). Energy consumption is calculated by theelectricity input and heating energy need of the plant. Electricityis needed to operate various devices and equipment at theWWTP, while heating is required to elevate the temperature ofinfluent wastewater to the reactor operating temperature and alsoto compensate for the heating losses through the walls, floor, androof of the reactor. The on-site GHG emissions are producedfrom the aerobic and anaerobic reactors and the anaerobicdigester. In aerobic reactors, CO 2 is produced because of BODuse and endogenous respiration of the biomass. Carbon dioxidealso is consumed by the nitrifying bacteria as the carbon sourceduring the nitrification process. In anaerobic reactors, CO2 isproduced during fermentation and methanogenesis reactions and
the decay of biomass. The CH4 is produced in anaerobic reactorsin addition to CO 2 during the methanogenesis process and theendogeneous decay of biomass. The wasted solids in the digesterare stabilized and produce biogas, which contains both CO2 andCHI. In this study, it is assumed that biogas is recovered andreused as a source of energy under all studied conditions. Theamount of produced biogas was calculated, and its recoveredenergy was subtracted from the total estimated energy require-ment of WWTP.
The off-site emissions associated with the generation andtransportation of fuel, chemicals, and electricity and solid wastetransport and disposal were estimated by using the correspondingemission factors. If the heating requirements exceed the biogasenergy, natural gas should be imported to the WWTP to make upfor the energy shortage. This will enhance both on-site GHGemissions as a result of natural gas combustion and off-siteemissions because of the production and transportation of naturalgas to the WWTP. On the other hand, if biogas energy exceeds theheating requirements, then the excess biogas is used in thegenerators to produce electricity. This will reduce GHG emissionsfrom the WWTP related to energy consumption. The biogas-heatconversion and biogas-electricity conversion efficiencies areassumed to be 0.83 and 0.5, respectively (Cakir and Stenstrom,2005). The off-site GHG emissions associated with the manufac-turing and transportation of chemicals were estimated by using theemission factors of 1.74 g CO2 e g-1 alkalinity (Canadian LimeInstitute, 2001) and 1.54 g CO 2e g-1 methanol (Dong andSteinberg, 1997). Alkalinity is used to control liquid pH in thereactors,, while methanol is used as the external carbon source tosupport the denitrification process. The electricity consumptionrates of 0.3 kWh m- 3 WW for the hybrid treatment and0.2 kWh m- 3 WW for the aerobic and anaerobic treatmentsystems were used (Sahely et al., 2006). The electricity demandfor aeration was calculated from the oxygen requirements of theaerobic reactor and an aeration efficiency of 7.2 g 02 kJ-' (Cakirand Stenstrom, 2005).
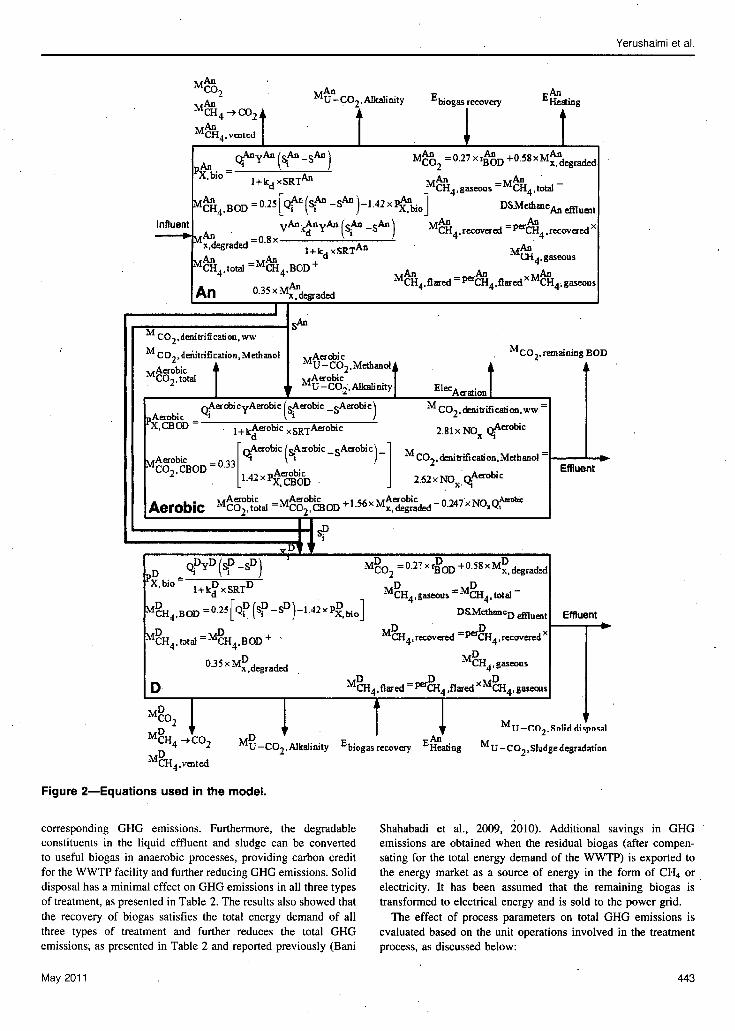
The flow diagrams of the three alternative designs of treatmentplants, used in this study, are shown in Figure 1. The examinedtreatment processes include primary clarification, biologicaltreatment by aerobic and anaerobic processes, and anaerobicsludge digestion. This study considered the anaerobic soliddigester only as a result of the generation of biogas and itssubsequent recovery. If an aerobic digester is used, the overallGHG emissions from ithe WWTP increase drastically, becausethere is no CH4 production in the aerobic digesters to compensatefor the overall produced GHG. Moreover, most WWTPs useanaerobic digesters. It is assumed that solid disposal is carried outby landfilling of biosolids followed by the subsequent recoveryand, reuse of the produced biogas. The dark color represents on-site GHG producing unit operations. The fate of the producedbiogas during anaerobic processes also is illustrated in Figure 1.The mathematical modeling process used liquid flow and massbalances around each unit operation to calculate the biomass andsubstrate concentration throughout the system. Figure 2 illustratessome of the equations used in the model for the hybrid treatmentsystem. A similar flow chaft is used by Cakir and Stenstrom(2005) to present the mathematical relationships used in theestimation of GHG generation. For better understanding of themodel, the reader is encouraged to review Bani Shahabadi et al.(2010).
May 2011 441

Yerushalmi et aL.
AnaerobicReactor
Ef.lznt
Anaerobic Sludge conditioningDigester and dewat.eing
Effluent
CO2 CH4
Leakage
EHIMMe2
Disposal
coý
C0 2
J Bogas I II
d)Sludge conditioning
and dewatenng
Figure 1-Flow diagrams of (a) aerobic, (b) anaerobic,produced biogas.
Food processing wastewater was chosen in this study becauseof the availability of process data at pilot- and full-scaleoperations. Table I presents the major operating and processparameters used in this work.
Results and DiscussionThe BOD removal efficiencies of aerobic, anaerobic, and
hybrid treatment systems were estimated to be 99, 60, and 99%,respectively (Bani Shahabadi et al., 2009). The estimatedgeneration of GHGs by the examined treatment processes ispresented in Table 2. The anaerobic sludge digester produces thehighest amount of GHGs in the aerobic treatment system, whilethe alkalinity needs in the anaerobic reactors produce the highestGHGs in the anaerobic and hybrid treatment systems. This resultsfrom the high consumption of alkalinity in anaerobic processes tocontrol the liquid pH. Alkalinity in the amount of 0.12, 1.95, and2.28 kg CaCO3/m 3 WW was estimated to be used in the aerobic,anaerobic, and hybrid treatment systems, respectively. Withoutthe need for alkalinity, anaerobic treatment produces less GHGemissions than aerobic treatment (2418 kg CO2/d versus 2488 kgCO2/d). The difference between the above values as observed inthe present study is not as extensive as those reported by other
442
and (c) hybrid treatment systems and (d) the fate of
investigators (Cakir and Stenstrom, 2005; Greenfield andBatstone, 2005; Keller and Hartley, 2003; Monteith et al., 2005,Sahely et al., 2006). This is because of the inclusion ofdownstream degradation of the biodegradable constituents ofwastewater effluent in the estimation of GHGs in the presentstudy. Because of the higher treatment efficiency of aerobictreatment compared with anaerobic treatment, the quantity ofbiodegradable carbon is considerably less in the effluent ofWWTPs in aerobic treatment systems. Consequently, less GHGemissions result from the off-site degradation of carbonaceousmaterial in aerobic treatment systems. This diminishes thedifference between GHG production capacities of aerobic andanaerobic treatment systems.
The residual BOD in the liquid and solid effluents of theanaerobic digester, comprised of the remaining BOD in the liquideffluent and the remaining degradable carbon in the treatedsludge, also make a substantial contribution to the generation ofGHGs in all studied systems. This contribution is directed to theoff-site GHG emissions and is equal to 780, 85, and 474 kg C0 2/dby aerobic, anaerobic, and hybrid treatment systems, respectively.Improving the efficiency of treatment will reduce the residualBOD in the liquid and solid effluents, thus reducing the
Water Environment Research, Volume 83, Number 5
a)
CO'tAnox•c/Aerobic
Reactor
b)
EAnaerobic
ReactorPriumayclarfir
c)
Yerushalmi et al.
MAnC2MCH4 -_+CO2 It
MCH4' VCUted/
Influent
Pr46 =VA QnyAn (siAn - SAn)
MAnMU-CO2 Allcalinity Ebiogas recovery.1t IAnHeatingI
ImAn An AnC02 = .2 7 xBOD x degradedAn MAn =MAn
0,.m l+kd xSRTAn MAn MAnMA nU l+ d SR CH 4 ,gaseGUS = CH4 ,toWa
MCH4,BOD=0 2 5[Qe(SAn- yi 4 2 xIn DSeMeAnuent4 bi.] An x
%.,An ' -nQx d CH 4 ,recovered mPerCH 4 recoveredx
" x,degraded . l+kd xSRTAn
MAn =MAn + dCH4 ,total CH 4 ,BCD
An .35x MAnx. degraded
MCO2,denitrificafion,wwI
M C 2, deitrificatiDn,NMethanDl
MAeobictIC02, tz)tal
MAnCH4, gaseous
An An XmAnCH4,fl ared PerCH4 ,flared CH 4 , gaseous
-An
M,Aerobic C2--eho
MAerobicSU_COI. Alkalinityt
AjQAerobi cyAerobi c (sAerobic _sAerobicAerobic Aerobic
-X,CBOD I+kAerobic xSRTAerobic
mAerobic OD =0.33 (S,Aýobic_sAerobic)jl
CO2- CBOD 0.31.4x AerobicCX, l., 2xPCBOD
ElecAerBidIoo
2.81 x NO. Q.e
M C02, denitrifi cation.
2.62 x NOx, 9ýAob c
MAerobic MAerobic Aerobic . kmzbicAerobic -C02 ,totaE = C0 2 ,CB OD +1. 6 xMx,degraded - 0.247 x NO, Q1
MCO2, renaining BOD
ion, wwl
robic
lethanol =
Effluent
,BD..O2 5QDI(SPDSD 1.4 2~B. - PXX. bi
MD D-CH 4 ,bttal=4H4,BOD +
0.35 x x.degraded
D
MD 02xr-D DC0 2 BOD +0.58 x,degrad!d
MD _ D
MCH4 gaseous - CH4 total
D&McthancD effluent
MD _= CCH 4 , recovered 4 recovered
MCH4 , gaseous
MDH
MD IMD IMCH 4 "+CO2
MDCH 4 ,vented
MTI-r.0 2- Rnlidipnmal
6-CO2,Alkalinity Ebiogasrecovery Eý MU -C0 2 , Sludge degradation
Figure 2-Equations used in the model.
corresponding GHG emissions. Furthermore, the degradableconstituents in the liquid effluent and sludge can be convertedto useful biogas in anaerobic processes, providing carbon creditfor the WWTP facility and further reducing GHG emissions. Soliddisposal has a minimal effect on GHG emissions in all three typesof treatment, as presented in Table 2. The results also showed thatthe recovery of biogas satisfies the total energy demand of allthree types of treatment and further reduces the total GHGemissions, as presented in Table 2 and reported previously (Bani
Shahabadi et al., 2009, 2010). Additional savings in GHGemissions are obtained when the residual biogas (after compen-sating for the total energy demand of the WWTP) is exported tothe energy market as a source of energy in the form of CH 4 orelectricity. It has been assumed that the remaining biogas istransformed to electrical energy and is sold to the power grid.
The effect of process parameters on total GHG emissions isevaluated based on the unit operations involved in the treatmentprocess, as discussed below:
May 2011
Effluent
-a
I 1
I
,D SP
443

Yerushalmi et al.
Table 1-Major operating and process parameters of the WWTP of the food processing industry.
Parameter Value Reference
InfluentFlowrate (Q) 1000 m3/d (Xu and Nakhla, 2006)BODý (S,) 2000 g-BOD/m 3
(Xu and Nakhla, 2006)VSS (Xi) 1000 g-VSS/m 3
(Xu and Nakhla, 2006)Temperature (Tincoming WW) 25°C (Xu and Nakhla, 2006)Primary clarifier
VSS removal ratio (Pers) 0.2 (Monteith et al., 2005)BOD removal ratio (PerBpol) 0.3 (Monteith et al., 2005)Underflow rate (QPC) 30 m3/d (Monteith et al., 2005)
Anaerobic reactor
Temperature (TZ,,) 25*C (Metcalf & Eddy)SRT (SR7An) 15 days (Metcalf & Eddy)*Sludge wasting ratio (QJQ) 0.01 (Metcalf & Eddy)
Aerobic reactor
Temperature jrTAer°bic) 200C (Metcalf & Eddy)SRT (SR7Aerabic) 5 days (Metcalf & Eddy)Sludge wasting ratio (Q0/G,) 0.01 (Metcalf & Eddy)
Anaerobic digester
Temperature (TrDeactor) 350C (Metcalf & Eddy)SRT (SRTD) 30 days (Metcalf & Eddy)
Primary Clarifier. Figure 3 presents the dependence of GHG 0.05 to 0.3. The most significant effect on the removal ratio ofemissions on the controlling parameters in the primary clarifier, BOD and the underflow rate was observed in the hybridwhich include the following: treatment system (Figures 3b and 3c). In the hybrid treatment
(1) Removal ratio of volatile suspended solids (VSS), system, GHG emissions increased from 6580 to 6666 kg CO 2e/dwith the increase in the BOD removal ratio from 0.2 to 0.4,(2) Removal ratio of biochemical oxygen demand (BOD), and whlteydcasdfo 676o602kCO/dihtewhile they decreased from 6676 to 6602 kg C02e/d with the
(3) Underflow rate. increase in the underflow rate from 10 to 50 m3/d, followed byThe highest variations in GHG production in response to the an increase from 6602 to 6933 kg CO2e/d with a further
VSS removal ratio is observed in the hybrid treatment system. increase in the underflow rate from 50 to 110 m3 /d. IdenticalIn this system, GHG emissions increased from 6600 to 6607 kg solids and BOD concentrations were considered to exist in theCO 2e/d (by 0.1%) with the increase of VSS removal ratio from underflow streams.
Table 2-GHG emission in different types of treatment systems.
Aerobic treatment Anaerobic treatment Hybrid treatmentProcess (kg-CO2 /d) (kg-CO 2/d) (kg-CO 2/d)
Anaerobic reactorBiological process 957 613Alkalinity usage 3392 3392
Aerobic reactorBiological process 681 492Alkalinity usage 206 579Methanol usage 167
Anaerobic digesterBiological process 1078 745 930Alkalinity usage 0 12 0
BOD in the effluent 781 844 475Solid disposal 6 0.7 4Total energy demand 0 0 0Additional saving because of biogas recovery -58 -128 -34Total 2694 5822 6617Normalized GHG emissions by influent BOD (g CO 2/g BOD) 1.35 2.91 3.31Normalized GHG emissions by influent wastewater (kg C0 2/m3
WW) 2.69 5.82 6.62
Water Environment Research, Volume 83, Number 5444

Yerushalmi et al.
0
U
0
A M.
"W-- il
0#
I-
7000
65006000
5500
50004500
4000
3500
3000
2500
2000
750070006500600055005000450040003500300025002000
0.15 0.2 0.25 0.3 0.35 0.4 0.45
Primary clarifier's B OD removal ratio
--*--A ero bic
-*-Anaerobic--,A,-Hybrid
0 20 40 60 80 100 120Primary clarifiers underfiow(m 3/d)
Figure 3-Effect of process parameters in the primary clarifier on total GHG emissions In aerobic, anaerobic, andhybrid treatment systems: (a) VSS removal ratio, (b) BOD removal ratio, and (c) underflow.
The most effective parameter, in terms of the effect on GHGemission, in all treatment systems was shown to be the primaryclarifier's underflow rate (Figure 3c). Increasing the underflowrate increases the flowrate of untreated wastewater that feeds thedigester. This will produce additional biogas by the anaerobicdigestion of untreated wastewater, leading to higher savings inGHG emissions, as a result of the use of biogas as fuel. On theother hand, a higher underflow rate and a higher wastewaterflowrate to the digester imply more energy demands for theoperation of the digester, with the resulting production ofadditional GHG because of energy needs. Under the examinedoperating conditions of the treatment systems, with the increase ofunderflow rate to values between 30 and 60 m3/d (Figure 3c), thesavings resulting from biogas production offset the additionalGHG productions that result from the energy needs for theoperation of digester, resulting in decreased GHG emissions.However, with the further increase of underflow rate beyond theseoptimum values, the effects of energy demand in the anaerobicdigester become more pronounced, resulting in an increasedgeneration of GHGs.
Biological Treatment of Wastewater. Aerobic Reactor. Theeffect of major process, parameters in the aerobic reactor of theaerobic and hybrid treatment systems on total GHG emissions isdisplayed in Figure 4. These parameters include the following:
(1) Solids retention time (SRT),
(2) Operating temperature, and(3) Wasting ratio.
In the aerobic treatment system, the wasting ratio of the aerobicreactor had a minimal effect on GHG emissions, while theincrease of SRT from 4 to 11 days reduced the GHG emissions by4.7%, from 2723 to 2593 kg CO 2e/d. In the hybrid treatmentsystem, SRT had a negligible effect on GHG emissions, while theincrease of wasting ratio from 0.0025 to 0.025 (0.25 to 2.5%)increased the GHG emissions by a moderate 1.8%, from 6586 to6708 kg CO 2e/d. The selected range of wasting ratio is inaccordance with Monteith et al. (2005). The increase of SRT inthe aerobic reactor, reduces the production of degradable sludgefrom this reactor. This will lower the amount of sludge that feedsthe anaerobic digester. The outcome is a lower demand for heatingenergy to warm up the digester feed accompanied by less biogasproduction from the digester. The heating energy requirementshave a more pronounced effect on GHG emissions compared withbiogas production. Therefore, with the increase of SRT andreduced sludge generation in the aerobic reactor, less GHG isproduced from the industrial WWTP, as presented in Figure 4a.The wasting ratio of the aerobic reactor controls the wastewaterflow into the anaerobic digester. Accordingly, the increase in thewasting ratio enhances the heating demands of anaerobic digesteron the one hand and, on the other hand, increases biogasproduction. These opposite phenomena produce similar effects,
May 2011
± ± .l A
a)
- -- = -- - -
b)
0 0.05 0.1 0.15. 0.2 0.25 0.3 0.35
Primary clarifier's VSS removal ratio
7000650060005500
500045004000
35003000
2500
2000
C)
4 - - -
S. . . . m m
445

Yerushalmi et al.
7665
o 7000
"1 6500
Ja• 5 0 00
5~'500
4000
3500
S 3000
'• 2500
£ 7000
6500
5'50004500
4000
3500Ll 3060
I" 25000 0.01 0.02
Wasting ratio (Q#A)
5
a) 44332
23 5 7 9 11 13
SRT (d)
0.03
Figure 4-Effect of process parameters In the aerobic reactor on total GHG emissions in aerobic and hybrid treatmentsystems: (a) SRT, (b) reactor temperature, and (c) wasting ratio.
and their combined effect does not cause significant changes inGHG emissions, as illustrated in Figure 4c.
The most significant effect was observed with the operatingtemperature of the aerobic reactor, which increased the GHGemissions by 50 and 5.2% in the aerobic and hybrid treatmentsystem, respectively, upon increasing from 10 to 35*C (Fig-ure 4b). Under these conditions, GHG emissions increased from2369 to 3560 kg CO 2e/d in the aerobic treatment system and from6579 to 6923 kg CO 2e/d in the hybrid treatment system. Theincreased operating temperature of the aerobic reactor increasesthe heating energy demands of the plant, which are supplied byfossil fuels, thus increasing the upstream GHG emissions of thetreatment plant.
Anaerobic Reactor. Figure 5 presents the dependence ofGHG emissions on the key process parameters of the anaerobicreactor in the anaerobic and hybrid treatment systems. The keyparameters include the following:
(1) SRT,(2) Operating temperature of reactor, and(3) Wasting ratio.
The effects of SRT and wasting ratio on GHG emissionsshowed a similar trend as those observed in the aerobic reactor.
446
The increase of SRT from 12 to 20 days decreased the GHGemissions by 2.3 and 0.3% in the anaerobic and hybrid treatmentsystems, from 5905 to 5766 kg CO2e/d and from 6631 to 6608 kgCO2e/d, respectively. The increase of wasting ratio from 0.0025 to0.025 (0.25 to 2.5%) also showed little effect and increased theemissions by 1.8 and 1.4% in the anaerobic and hybrid treatmentsystems, from 5794 to 5900 kg CO2eId and from 6594 to 6687 kgCO2e/d, respectively. The most significant effect was observed inthe operating temperature of the anaerobic reactor, whichincreased the emissions by a remarkable 105.6 and 96.5% in theanaerobic and hybrid treatment systems, respectively, uponincreasing from 25 to 40TC. Under these conditions, the GHGemissions increased from 5822 to 11971 kg CO2e/d in theanaerobic treatment system and from 6617 to 13006 kg CO 2e/d inthe hybrid treatment system. Although higher reactor temperaturesincrease the reaction rates of microorganisms and, consequently,the methane generation in the reactor, they severely intensify theheating requirements of the anaerobic reactor and result in higherGHG production, as a result of energy demand, as shown by thevalues reported above.
Anaerobic Sludge Digestion. The effect of major processparameters of the anaerobic sludge digester on total GHGemissions from aerobic, anaerobic, and hybrid treatment systems
Water Environment Research, Volume 83, Number 5
"- -- " I_ • J *1. - -
5 • 15 25 35 45
Reactor's temperature (0C)
#Aerobic1--A-ibrid
Yerushalmi et al.
- I .8. -
c)
00050000050000050000130500000500000
b)A

Yerushalmi et al.
9 bIUUU
q6600
S6400
"* 6200
m 6000
S5600
'" 5600
6800
6600
6400
t6a)
6
10 12 14 16 18 20 22
SRT (d)
I0
10
'0
'0
'0
10
'0
0 .24 26 28 30 32 34 36 38 40 42
Reactors temperature (OC)
Figure 5-Effect of process parameters in the anaerobictreatment systems.
are shown in Figure 6. The pertinent process parameters are asfollows:
(1) SRT, and(2) Operating temperature.
These parameters exhibited a significant effect on GHGemissions in the aerobic treatment system, while producing amoderate effect in the anaerobic and hybrid treatment systems. Asshown in Figure 6, with the increase of SRT from 10 to 45 days,GHG emissions increased by 64.6%, from 1961 to 3227 kg CO2e/din the aerobic treatment system, while they increased by 11.8% inthe hybrid treatment system and only by 1.7% in the anaerobicsystem. The increase of the digester's operating temperature from20 to 40'C exhibited a similar trend and increased GHG emissionsby a remarkable 72.5%, from 1884 to 3252 kg CO2e/d in the aerobictreatment system (Figure 6b). The operating temperature of thedigester exhibited a lower effect on GHG emissions in the anaerobicand hybrid treatment systems and caused a 3.1 and 13.9% increasein GHG emissions, from 5731 to 5912 kg CO2e/d and from 6132 to6982 kg CO 2e/d, respectively. The increase of SRT and temperatureled to higher heating demands by the anaerobic digester .and,consequently, more upstream GHG emissions as a result of thedemand for on-site fossil fuel consumption.
Previous studies of GHG emissions in WWTPs did not carryout a similar parameter impact analysis, making it impossible to
reactor on total GHG emissions in anaerobic and hybrid
compare the results of this study with those reported in theliterature. Most previous studies demonstrated lower GHGproductions from WWVTPs, as reported before (Bani Shahabadiet al., 2010). This was attributed to the fact that those studiesignored nutrient removal with carbonaceous BOD removaloperations, while confining their studies to municipal wastewa-ters, and ignored the contribution of off-site GHG emissions to thetotal GHG generation by WWTPs. For example, Keller andHartley (2003) reported the production of 0.438 kg CO2e/m 3 WWfor aerobic treatment system compared with 0.44 kg CO 2e/m 3
WW obtained in this study using identical values of processparameters. Similarly, Monteith et al. (2005) reported 0.228 to0.245 kg CO 2e/m 3 WW for aerobic systems treating municipalwastewaters, compared with 0.20 kg CO2e/m 3 WW resulting fromthe use of our methodology under similar conditions. For thehybrid treatment system, Keller and Hartley (2003) reported0.35 kg CO 2e/m 3 WW compared with 0.39 kg CO 2e/m 3 Wobtained by our methodology under similar conditions. Theobserved differences demonstrate the significant effect of the typeof operations in the WWTP and the contribution of off-site GHGemissions to the total GHG emissions of WWTPs.
ConclusionThe effects of major process parameters in aerobic, anaerobic,
and hybrid wastewater treatment systems on the overall on- and
May 2011
&��*�t A
0 0.005 0.01 0.015 0.02 0.025 0.03
"Mhsting ratio (0,/Qi)
-.--- Anaerobic
1350-5B_ 1250
E a 1150
eA U 1050%ý 950E 1 850
750
M 650
'- 550
C).
Yerushalmi
et al.
I ....
200
000
800
600
447

Yerushalmi et al.
o 7000
6000
5520004OOM
3500
*- 1500
70001 6500
J450004000
S 200042 1j;M
a)
5 10 15 20 25 30 35 40 45 50
SRT (d)
15 20 25 30 35 40 45Reactorls temperature(C)
Figure 6-Effect of process parameters in the anaerobicsludge digester on total GHG emissions In aerobic,anaerobic, and hybrid treatment systems: (a) SRT and(b) reactor temperature.
off-site GHG emissions were evaluated. This evaluation led toidentification of the most controlling process parameters thatexhibit the highest effect on GHG emissions in WWTPs. The keyprocess parameters were identified as the underflow rate in theprimary clarifier, SRT, and temperature of the aerobic andanaerobic reactors and anaerobic sludge digester. Based on thisstudy, the following strategies are recommended for the reductionof GHG emissions in a WWTP:
(1) Aerobic treatment system-reductions in the operatingtemperatures of aerobic reactor and anaerobic digester anddigester's SRT. Minor GHG reductions can be achieved byreductions in the removal ratio of VSS and increased removalratio of BOD in the primary clarifier, optimization of theprimary clarifier's underflow rate, reduction of wasting ratioand increased SRT in the aerobic reactor.
(2) Anaerobic treatment system-reductions in the temperature ofthe anaerobic reactor and anaerobic digester, reduction of SRTin the anaerobic digester, and increase of SRT in the anaerobicreactor. Minor reductions in GHG emissions will be achievedby reducing VSS and BOD removal ratios of the primaryclarifier, optimizing the primary clarifier's underflow rate, andreducing the wasting ratio of anaerobic reactor.
(3) Hybrid treatment system-reduction of temperature in theaerobic and anaerobic reactors and anaerobic digester. MinorGHG reductions are accomplished by reductions in the VSSand BOD removal ratios of primary clarifier, optimization ofthe primary clarifier's underflow rate, increase of SRT, anddecrease of the wasting ratio of anaerobic reactor, anddecrease of SRT in the anaerobic digester.
448
-- p
p up -
b)
Yerushalmi et al.
•-9--Aertobic
-4--narot I
Clearly, the process parameters of a given WWTP must becontrolled within an optimum range to minimize GHG emissionswithout compromising the efficiency of treatment.
NomenclatureAerobic = Aerobic reactorAn = Anaerobic reactorBOD5 = Five-day biochemical oxygen demand concentration
(kg/M3) .
BODU = Ultimate biochemical oxygen concentration (kg/m 3)D = Digester
DS. Methane = Dissolved CH4 in reactor effluent (kg CH4/d)Ebiogas recovery = Energy saving resulting from biogas recovery(kJ/d)
ElecAeraz,on = Electricity required for aeration (kWh/d)kd = Endogenous decay coefficient for heterotrophic biomass
(day- 1)MCn,, BOD = Mass of CH4 production because of BOD use (kg
CH4/d)McH,,ggaseous = Mass of available CH4 for recovery (kg CH4/d)MCH., c,,overed = Mass of CH4 recovered (kg CI-H4d)McH4, vened = Mass of CH-I4 vented (kg CH-14/d)MCH,_COZ,,jjred = Mass of CO2 production by CH4 combustion
during biogas flaring (kg C0 2/d)McH,-c02, recovered = Mass of CO2 production by CI-14 combustion
during biogas recovery (kg C0 2/d)MC02 = CO 2 production in reactor (kg CO 2/d)MC0 2, CBOD = CO2 production during carbonaceous BOD removal
(kg C0 2/d)Mc02,denitrification, Methanol = CO2 production during denitrification
by methanol (kg C0 2/d)Mco 2,denitrification,iv = CO 2 production during denitrification by
wastewater BOD (kg C0 2/d)Mu-cO2 , elecuticiry = Upstream GHG production resulting from
electricity consumption (kg C0 2/d)Mx,deg,a&d = Amount of biomass decayed endogenously inside
reactor (kg VSS/d)NO. = Concentration of NH 4-N in the influent that is nitrified (kg
N/m 3)Px, bio = Biomass production because of BOD use (kg VSS/d)Px, CBOD = Biomass production from carbonaceous BOD use (kg
VSS/d)PC = Primary clarifierPer,o, = Percent removal of BOD in primary clarifierPerssc = Percent removal of suspended solids in primary clarifierQ = Effluent wastewater flowrate (m3/d)Q= Influent wastewater flowrate (m3id)Q= Waste sludge flowrates (m3id)Qý/Qj = Wasting ratio of reactorS = BOD concentration in the effluent (kg BOD/mr3 )Si = Influent BOD (kg BOD/m 3)SRT = Solids retention time (days)Tincoming ,n = Temperature of the incoming wastewater (°C)Treactor = Temperature of reactor (°C)
Xi= Biomass concentration in the influent (g VSS/m3 )Y = Yield coefficient (kg VSS/kg BOD)
CreditsThe authors express their gratitude to the National Science and
Engineering Research Council Canada (NSERC) (Ottawa, On-
Water Environment Research, Volume 83, Number 5

Yerushalmi et al.
tario, Canada) and Concordia University (Montreal, Quebec,Canada) for their financial support. The authors gratefullyacknowledge the constructive comments of the anonymousreviewers, which improved the quality of this paper.
Submitted for publication May 19, 2010; revised manuscriptsubmitted October 5, 2010; accepted for publication November15, 2010.
ReferencesBani Shahabadi, M.; Yerushalmi, L.; Haghighat, F. (2010) Estimation of
Greenhouse Gas Generation in Wastewater Treatment Plants-ModelDevelopment and Application. Chemosphere, 78, 1085-1092.
Bani Shahabadi, M.; Yerushalmi, L.; Haghighat, F. (2009) Impact ofProcess Design on Greenhouse Gas (GHG) Generation by Wastewa-ter Treatment Plants. Water Res., 43, 2679-2687.
Barton, P. K.; Atwater, J. W. (2002) Nitrous Oxide Emissions and theAnthropogenic Nitrogen in Wastewater and Solid Waste. ASCE J.Environ. Eng., 128, 137-150.
Cakir, F. Y.; Stenstrom, M. K. (2005) Greenhouse Gas Production: AComparison Between Aerobic and Anaerobic Wastewater TreatmentTechnology. Water Res., 39, 4197-4203.
Canadian Lime Institute (2001) Energy Efficiency Opportunity Guide inthe Lime Industry. Office of Energy Efficiency, Natural ResourcesCanada, Ottawa, Ontario, Canada.
Dong, Y.; Steinberg, M. (1997) Hynol-An Economical Process forMethanol Production from Biomass and Natural Gas with ReducedCO2 Emission. Int. J. Hydrogen Energy, 22, 971-977.
E1-Fadel, M.; Massoud, M. (2001) Methane Emissions from WastewaterManagement. Environ. Pollut., 114, 177-185.
European Commission (2001) Environmental Pressure Indicators for theEU, Eurostat, Data 1985-98. Office for Official Publications of theEuropean Communities: Luxembourg.
Greenfield, P. F.; Batstone, D. J. (2005) Anaerobic Digestion: Impact ofFuture Greenhouse Gases Mitigation Policies on Methane Generationand Usage. Water Sci. Technol., 52, 39-47.
Intergovernmental Panel on Climate Change (2000) IPCC Good PracticeGuidance and Uncertainty Management in National Greenhouse GasInventories. United Nations Environmental Programme, Organizationfor Economic Cooperation and Development, International EnergyAgency: Paris, France.
Keller, J.; Hartley, K. (2003) Greenhouse Gas Production in WastewaterTreatment: Process Selection is the Major Factor. Water Sci.Technol., 47, 43-48.
Metcalf & Eddy (2003) Wastewater Engineering: Treatment and Reuse,Tchobanoglous, G., Burton, F. L., Stensel, H. D. (Eds.); McGraw-Hill: New York.
Monteith, H. D.; Sahely, H. R.; MacLean, H. L.; Bagley, D. M. (2005) ARational Procedure for 'Estimation of Greenhouse-Gas Emissionsfrom Municipal Wastewater Treatment Plants. Water Environ. Res.,77, 390-403.
Sahely, H. R.; MacLean, H. L.; Monteith, H. D.; Bagley, D. M. (2006)Comparison of On-Site and Upstream Greenhouse Gas Emissionsfrom Canadian Municipal Wastewater Treatment Facilities. J.Environ. Eng. Sci., 5, 405-415.
Tillman, A.; Svingby, M.; Lundstorm, H. (1998) Life Cycle Assessment ofMunicipal Waste Water Systems. Int. J. Life Cycle Assess., 3, 145-157.
Wei, Y.; Yerushalmi, L.; Haghighat, F. (2008) Estimation of Green-house Gas Emissions by the Wastewater Treatment Plant of aLocomotive Repair Factory in China. Water Environ. Res., 80, 2253-2260.
Xu, Z.; Nakhla, G. (2006) Pilot-Scale Demonstration of Pre-Fermentationfor Enhancement of Food-Processing Wastewater Biodegradability. J.Chem. Technol. Biotechnol., 81, 580-587. "
May 2011 449

COPYRIGHT INFORMATION
Author:
Title:
Source:
ISSN: DOI:
Publisher:
Yerushalmi, L.; Shahabadi, M. Bani; Haghighat, F.
Effect of Process Parameters on Greenhouse Gas Generation by WastewaterTreatment Plants
Water Environ Res 83 no5 My 2011 p. 440-9
1061-4303
10.2175/106143010X12851009156321
Water Environment Federation
601 Wythe Street, Alexandria, Va 22314-1994
The magazine publisher is the copyright holder of this article and it is reproducedwith permission. Further reproduction of this article in violation of the copyright isprohibited.
This article may be used for research, teaching and private study purposes. Any substantial or systematic reproduction, re-distribution, re-selling, loan or sub- licensing, systematic supply or distribution in any form to anyone is expressly forbidden. The publisher does not give any warranty express or implied or make any representation that the contents will be complete or accurate or up to date. The accuracy of any instructions, formulae and drug doses should be independently verified with primary sources. The publisher shall not be liable for any loss, actions, claims, proceedings, demand or costs or damages whatsoever or howsoever caused arising directly or indirectly in connection with or arising out of the use of this material.