Kinetic parameters of biomass growth in a UASB reactor treating wastewater from coffee wet...
16
Ambiente & Água - An Interdisciplinary Journal of Applied Science ISSN 1980-993X – doi:10.4136/1980-993X www.ambi-agua.net E-mail: [email protected] Rev. Ambient. Água vol. 9 n. 4 Taubaté - Oct. / Dec. 2014 Kinetic parameters of biomass growth in a UASB reactor treating wastewater from coffee wet processing (WCWP) doi: 10.4136/ambi-agua.1280 Received: 16 Jan. 2014; Accepted: 15 Sep. 2014 Claudio Milton Montenegro Campos 1 ; Marco Antonio Calil Prado 1 ; Erlon Lopes Pereira 2* 1 Universidade Federal de Lavras (UFLA), Lavras, MG, Brasil 2 Universidade de São Paulo (USP), Lorena, SP, Brasil *Corresponding Author: e-mail: [email protected], [email protected], [email protected] ABSTRACT This study evaluated the treatment of wastewater from coffee wet processing (WCWP) in an anaerobic treatment system at a laboratory scale. The system included an acidification/equalization tank (AET), a heat exchanger, an Upflow Anaerobic Sludge Blanket Reactor (UASB), a gas equalization device and a gas meter. The minimum and maximum flow rates and volumetric organic loadings rate (VOLR) were 0.004 to 0.037 m 3 d -1 and 0.14 to 20.29 kgCOD m -3 d -1 , respectively. The kinetic parameters measured during the anaerobic biodegradation of the WCWP, with a minimal concentration of phenolic compounds of 50 mg L - ¹, were: Y = 0.37 mgTVS (mgCOD removed ) -1 , K d = 0.0075 d -1 , Ks = 1.504mg L -1 , μ max = 0.2 d -1 . The profile of sludge in the reactor showed total solids (TS) values from 22,296 to 55,895 mg L -1 and TVS 11,853 to 41,509 mg L -1 , demonstrating a gradual increase of biomass in the reactor during the treatment, even in the presence of phenolic compounds in the concentration already mentioned. Keywords: agro-industrial waste, bacterial kinetics, pollution control, rural sanitation. Parâmetros cinéticos de crescimento da biomassa em reator UASB tratando água residuária do café (ARC) processado por via úmida RESUMO O presente estudo avaliou o tratamento das águas residuárias do processamento por via úmida do café (ARC) em sistema de tratamento anaeróbio em escala de laboratório. O sistema utilizado foi composto de um tanque de acidificação e equalização (TAE), um trocador de calor, um reator anaeróbio de manta de lodo e fluxo ascendente (UASB), um equalizador de pressão e um gasômetro. Os valores de vazão mínimos e máximos foram: 0,004 a 0,037 m 3 d -1 e os valores da carga orgânica volumétrica (COV) foram 0,14 a 20,29 kgCOD m -3 d -1 , respectivamente. Os parâmetros cinéticos encontrados durante a biodegradação anaeróbia da ARC com concentração mínima de compostos fenólicos de 50 mg L -1 , foram: Y = 0,37 mgSTV (mgCODremoved) -1 ; K d = 0,0075 d -1 ; Ks = 1.504 mg L -1 e μ max = 0,2 d -1 . O perfil de lodo no reator apresentou valores ST de 22.296 a 55.895 mg L -1 e
-
Upload
independent -
Category
Documents
-
view
3 -
download
0
Transcript of Kinetic parameters of biomass growth in a UASB reactor treating wastewater from coffee wet...

Ambiente & Água - An Interdisciplinary Journal of Applied Science
ISSN 1980-993X – doi:10.4136/1980-993X
www.ambi-agua.net
E-mail: [email protected]
Rev. Ambient. Água vol. 9 n. 4 Taubaté - Oct. / Dec. 2014
Kinetic parameters of biomass growth in a UASB reactor treating
wastewater from coffee wet processing (WCWP)
doi: 10.4136/ambi-agua.1280
Received: 16 Jan. 2014; Accepted: 15 Sep. 2014
Claudio Milton Montenegro Campos1; Marco Antonio Calil Prado
1;
Erlon Lopes Pereira2*
1Universidade Federal de Lavras (UFLA), Lavras, MG, Brasil
2Universidade de São Paulo (USP), Lorena, SP, Brasil
*Corresponding Author: e-mail: [email protected],
[email protected], [email protected]
ABSTRACT This study evaluated the treatment of wastewater from coffee wet processing (WCWP) in
an anaerobic treatment system at a laboratory scale. The system included an
acidification/equalization tank (AET), a heat exchanger, an Upflow Anaerobic Sludge Blanket
Reactor (UASB), a gas equalization device and a gas meter. The minimum and maximum
flow rates and volumetric organic loadings rate (VOLR) were 0.004 to 0.037 m3
d-1
and 0.14
to 20.29 kgCOD m-3
d-1
, respectively. The kinetic parameters measured during the anaerobic
biodegradation of the WCWP, with a minimal concentration of phenolic compounds of
50 mg L-¹, were: Y = 0.37 mgTVS (mgCODremoved)
-1, Kd = 0.0075 d
-1, Ks = 1.504mg L
-1,
μmax = 0.2 d-1
. The profile of sludge in the reactor showed total solids (TS) values from 22,296
to 55,895 mg L-1
and TVS 11,853 to 41,509 mg L-1
, demonstrating a gradual increase of
biomass in the reactor during the treatment, even in the presence of phenolic compounds in
the concentration already mentioned.
Keywords: agro-industrial waste, bacterial kinetics, pollution control, rural sanitation.
Parâmetros cinéticos de crescimento da biomassa em reator UASB
tratando água residuária do café (ARC) processado por via úmida
RESUMO O presente estudo avaliou o tratamento das águas residuárias do processamento por via
úmida do café (ARC) em sistema de tratamento anaeróbio em escala de laboratório. O sistema
utilizado foi composto de um tanque de acidificação e equalização (TAE), um trocador de
calor, um reator anaeróbio de manta de lodo e fluxo ascendente (UASB), um equalizador de
pressão e um gasômetro. Os valores de vazão mínimos e máximos foram: 0,004 a
0,037 m3 d
-1 e os valores da carga orgânica volumétrica (COV) foram 0,14 a
20,29 kgCOD m-3
d-1
, respectivamente. Os parâmetros cinéticos encontrados durante a
biodegradação anaeróbia da ARC com concentração mínima de compostos fenólicos de
50 mg L-1
, foram: Y = 0,37 mgSTV (mgCODremoved)-1
; Kd= 0,0075 d-1
; Ks = 1.504 mg L-1
e
µmax = 0,2 d-1
. O perfil de lodo no reator apresentou valores ST de 22.296 a 55.895 mg L-1
e

578 Claudio Milton Montenegro Campos et al.
Rev. Ambient. Água vol. 9 n. 4 Taubaté – Oct. / Dec. 2014
de STV de 11.853 a 41.509 mg L-1
, demonstrando o crescimento gradativo da biomassa no
reator durante o tratamento, mesmo na presença de compostos fenólicos na concentração
anteriormente mencionada.
Palavras-chave: cinética bacteriana, controle de poluição, resíduo agroindustrial, saneamento rural.
1. INTRODUCTION
Coffee is one of the most important products of Brazil because of the enormous income it
generates. The quality of the coffee bean determines its value and the resulting market price
as well as its acceptance international trade. In turn, this quality is determined by inherent
characteristics of the fruit, such as color, appearance, number of defects, aroma and taste
(Borém, 2008).
The coffee bean can be processed by dry or humid methodology. The wet processing of
the coffee Cherry uses water to wash, separate and remove the rind (exocarp) and mucilage
(mesocarp). This increases the amount coffee rind waste as well as the amount of mucilage
removed (Borém, 2008). Post-harvest processing of coffee by the wet method generates solid
waste and liquid effluents in significant quantities, and with a high potential for pollution. The
residual liquid is called “wastewater from wet coffee processing” or “WCWP”.
Campos et al. (2010) analyzed several fresh samples of WCWP and characterized their
physico-chemical and biochemical composition in terms of their potential as polluters and
their environmental quality. The authors showed that the WCWP is rich in sugars, protein,
starch, pectin, soluble oils and greases which result in high concentrations of COD, BOD520°C
,
solids, nitrogen, total phosphorus and phenolic compounds. The high concentrations found
characterized the WCWP as a high-potential polluter liquid that cannot be discharged
untreated.
Based upon the result of such analyses and the high potential for pollution, several
processes for WCWP treatment have been studied with the purpose of removing organic
matter. Jung et al. (2012) and Campos et al. (2013) stated that the liquid has high
concentration of carbohydrates and may therefore be used for bio-energy production in an
anaerobic process.
Jung et al. (2012) used UASB reactors in two stages to treat WCWP for the production of
methane and hydrogen. The first UASB reactor was used for hydrogen production, and was
operated in thermophilic condition with hydraulic detention time varying from 6 to 10 hours.
The WCWP had a carbohydrate concentration of 20 g L-1
and peak productions of hydrogen
of 4.24 L of H2 L-1
h-
1 and 2.57 mol H2 per mol of hexose removed. The second UASB
reactor was used to produce methane and operated in mesophilic condition with hydraulic
detention times varying from 6 to 10 hours with OLR of 3.5 gCOD L-1
d-1
. The first reactor
effluent as WCWP obtained a maximum production of methane of 325 mLCH4 gCOD
removed and 93% of COD removal. Campos et al. (2013) using a UASB reactor to treat
WCWP concluded that the percentage of methane in the biogas ranged from 48.60 to 68.14%,
the superior and inferior calorific value was 25,654 kJ m and 23,777 kJ m, respectively, and
the Wobbe number was 7,851 kcal m-3
, resulting in their interchangeability with natural gas.
Due to the large energy potential of WCWP, many studies have been performed aiming
to achieve anaerobic processes that are highly efficient in removing pollutants and
synergistically consistent with the production of bio-energy. According to Ramakrishnan and
Surampalli (2012) and Fia et al. (2012) the phenolic compounds are inhibitors of concern in
the biological process and can negatively intervene in the anaerobic process performance
during the treatment of WCWP. In addition, it is necessary to know both the performance of
the reactor under various load conditions and the biomass growth kinetic parameters that
579 Kinetic parameters of biomass growth in a UASB reactor …
Rev. Ambient. Água vol. 9 n. 4 Taubaté – Oct. / Dec.. 2014
govern the anaerobic process in order to accurately predict the bioenergy production and
optimize the process to obtain maximum efficiency conditions.
This work therefore evaluated the performance of a UASB reactor operating under
conditions of progressive increase of organic loads during treatment of WCWP and
determined the kinetic parameters of anaerobic biomass growth.
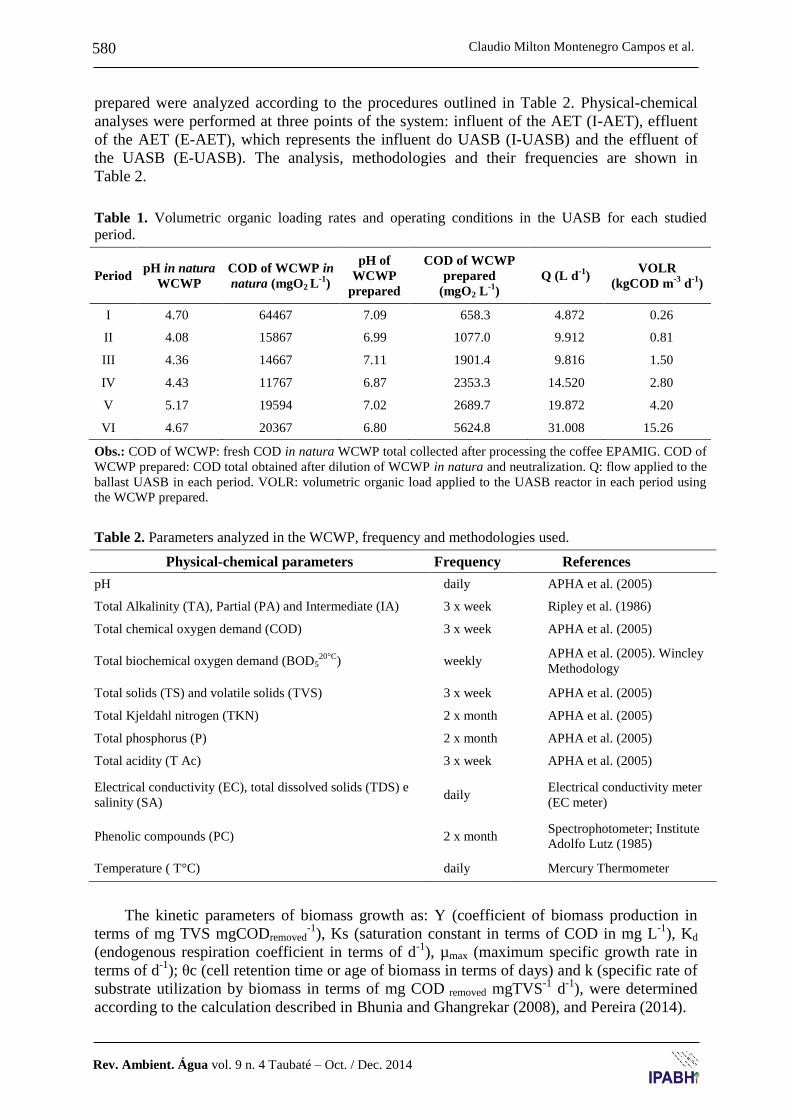
2. MATERIAL AND METHODS
2.1. Experimental apparatus
The experiment was performed at the Laboratory of Water Analysis of the Engineering
Department (LWAED), at the Federal University of Lavras (FUL). The system consisted of a
acidification and equalization tank (AET), an Upflow Anaerobic Sludge Blanket Reactor
(UASB), a gas equalization device (GED), a gas meter (GM), two membrane pumps
(PROMINET), and a thermostatic controlled heating system. The AET was a 45 liter
polyethylene container which contained a positive displacement pump, Prominent brand,
Model Gala 1602 Gamma-LM70, with a maximum pressure 10 bar and maximum flow of
2.1 L h-1
, used to pump the WCWP to UASB reactor at constant flow. The UASB reactor, the
GED and the GM have been constructed with glass 3 mm thick, with volumes of 12.5 L,
2.6 L, and 16.8 L, respectively. The three-phase separator (TPS) of the UASB reactor was
also built of glass and had a pyramidal shape. Pipes in the heating system and in the UASB
had a coating of polystyrene thermal insulation. The GED was used for maintaining the level
of biogas within the TPS. The heating system worked as a heat exchanger using a coiled
copper pipe and had a thermostat for temperature regulation. The WCWP system was fed in
batches in the AET and the effluent was subsequently pumped to the UASB reactor. The
biogas produced in the UASB reactor passed through the TPS, through the gas equalization
device (GED) and then through a gas meter using water-displacement in order to measure and
accumulate.
2.2. Starting up and monitoring the system
The WCWP used in the experiment was provided by the experimental farm of the
agricultural-livestock research company of Minas Gerais (EPAMIG). Due to seasonal
production, the WCWP was generated only during 3 months. Since the experiment was
conducted over seven months, the WCWP was collected and stored refrigerated in 50 L
containers. Fresh samples were collected and analyzed concerning COD and pH. Due to high
concentration of COD, it was necessary to dilute the WCWP to operate the system with the
desired loads. Due to the low pH value, it was necessary to adjust the pH of WCWP after
dilution to achieve the range of neutrality (6.8 ≤ pH ≤ 7.2) using sodium hydroxide solution
with title 10 (10% NaOH). The WCWP was prepared (diluted and pH adjusted) and placed in
the AET and pumped to the UASB reactor. During the seven months of the experiment the
UASB reactor was organicly loaded 6 times; each load represented a period (I to VI) as
shown in Table 1.
Each period’s changes were made with the progressive increase of the VOLR, and just
when the UASB efficiency reached steady-state, in accordance with the concept established
by Metcalf and Eddy (2003). The operational parameters such as hydraulic retention time
(HRT), volumetric organic loading rate (VOLR), hydraulic loading rate (HLR), and biological
organic loading rate (BOLR) were calculated using the equations described in Metcalf and
Eddy (2003). The UASB reactor was inoculated with 5.19 L of biomass from the anaerobic
treatment of wastewater from pig farming with an STV concentration of 12,774 mg L-1
,
totaling 0.6 kg of biomass inside the reactor which provided a BOLR for start-up of about
0.02 kg BOD kgSTV-1
d-1
. Throughout each period, the WCWP in natura and WCWP
580 Claudio Milton Montenegro Campos et al.
Rev. Ambient. Água vol. 9 n. 4 Taubaté – Oct. / Dec. 2014
prepared were analyzed according to the procedures outlined in Table 2. Physical-chemical
analyses were performed at three points of the system: influent of the AET (I-AET), effluent
of the AET (E-AET), which represents the influent do UASB (I-UASB) and the effluent of
the UASB (E-UASB). The analysis, methodologies and their frequencies are shown in
Table 2.
Table 1. Volumetric organic loading rates and operating conditions in the UASB for each studied
period.
Period pH in natura
WCWP
COD of WCWP in
natura (mgO2 L-1
)
pH of
WCWP
prepared
COD of WCWP
prepared
(mgO2 L-1
)
Q (L d-1
) VOLR
(kgCOD m-3
d-1
)
I 4.70 64467 7.09 658.3 4.872 0.26
II 4.08 15867 6.99 1077.0 9.912 0.81
III 4.36 14667 7.11 1901.4 9.816 1.50
IV 4.43 11767 6.87 2353.3 14.520 2.80
V 5.17 19594 7.02 2689.7 19.872 4.20
VI 4.67 20367 6.80 5624.8 31.008 15.26
Obs.: COD of WCWP: fresh COD in natura WCWP total collected after processing the coffee EPAMIG. COD of
WCWP prepared: COD total obtained after dilution of WCWP in natura and neutralization. Q: flow applied to the
ballast UASB in each period. VOLR: volumetric organic load applied to the UASB reactor in each period using
the WCWP prepared.
Table 2. Parameters analyzed in the WCWP, frequency and methodologies used.
Physical-chemical parameters Frequency References
pH daily APHA et al. (2005)
Total Alkalinity (TA), Partial (PA) and Intermediate (IA) 3 x week Ripley et al. (1986)
Total chemical oxygen demand (COD) 3 x week APHA et al. (2005)
Total biochemical oxygen demand (BOD520°C
) weekly APHA et al. (2005). Wincley
Methodology
Total solids (TS) and volatile solids (TVS) 3 x week APHA et al. (2005)
Total Kjeldahl nitrogen (TKN) 2 x month APHA et al. (2005)
Total phosphorus (P) 2 x month APHA et al. (2005)
Total acidity (T Ac) 3 x week APHA et al. (2005)
Electrical conductivity (EC), total dissolved solids (TDS) e
salinity (SA) daily
Electrical conductivity meter
(EC meter)
Phenolic compounds (PC) 2 x month Spectrophotometer; Institute
Adolfo Lutz (1985)
Temperature ( T°C) daily Mercury Thermometer
The kinetic parameters of biomass growth as: Y (coefficient of biomass production in
terms of mg TVS mgCODremoved-1
), Ks (saturation constant in terms of COD in mg L-1
), Kd
(endogenous respiration coefficient in terms of d-1
), µmax (maximum specific growth rate in
terms of d-1
); θc (cell retention time or age of biomass in terms of days) and k (specific rate of
substrate utilization by biomass in terms of mg COD removed mgTVS-1
d-1
), were determined
according to the calculation described in Bhunia and Ghangrekar (2008), and Pereira (2014).

581 Kinetic parameters of biomass growth in a UASB reactor …
Rev. Ambient. Água vol. 9 n. 4 Taubaté – Oct. / Dec.. 2014
3. RESULTS AND DISCUSSION
3.1. Initial characterization of the WCWP in natura
Table 3 presents the physico-chemical properties of coarse WCWP. Very high
concentrations of phenolic compounds reaching up to 1,284 mg L-1
may be observed. In order
to evaluate the susceptibility of the WCWP to biological treatment, biodegradability tests
were performed using the values of COD and BOD520°C
presented. The relationship
COD/BOD520°C
provides information on the biodegradability of the dump and the treatment
process to be employed. Low relations indicate that the biodegradable fraction is high and that
biological treatment is most appropriate. High ratios show that the inert fraction
(non-biodegradable) is high and that chemical treatment is indicated. Campos et al. (2002),
treating wastewater of cherry coffee in a identical system, found an average ratio of
2.1 COD/BOD520°C
observing good biodegradability. The average ratio found for the
WCWP in this work was nearly the same, about 1.82, which is considered low, indicating that
the biodegradable fraction of WCWP is high and that biological treatment was more
appropriate.
Table 3. Characterization of 6 batches of coarse WCWP collected at WCWP EPAMIG.
WCWP pH EC (dS m-1
) SA
(%)
COD
(mgO2 L-1
)
BOD520°C
(mgO2 L-1
) T (
oC)
Phenolic compounds
(mg L-1
)
WCWP 1 4.70 5.7 3.1 64,467 37,600 25.2 -----
WCWP 2 4.08 6.2 3.3 15,867 9,800 27.5 1284
WCWP 3 4.36 3.9 2.0 14,667 9,200 30.7 693
WCWP 4 4.43 3.6 1.8 11,767 8,489 28.4 519
WCWP 5 5.17 5.5 2.9 19,594 7,616 20.1 1063
WCWP 6 4.67 5.3 2.8 20,367 9,950 24.8 1212
3.2. Performance of UASB reactor in treatment of WCWP The Table 4 shows the concentrations of phenolic compounds after each treatment.
Table 4. Concentration of phenolic compounds throughout the system, operational parameters
submitted to UASB reactor and removal efficiency of phenolic compounds in the liquid medium in
each period.
Concentration of phenolic compounds in the liquid
throughout the system (mg L-1
)
Operational parameters and removal of phenolic
compounds from liquid medium in the UASB
reactor
Period I-AET I-UASB E-UASB
HRT (h) VOLR
(kgCOD m-3 d-1) Removal (%)
I 44.42 50.54 24.60 62.2 0.26 51.32
II 69.40 81.41 33.94 30.5 0.81 58.31
III 106.89 73.74 50.42 30.7 1.50 31.62
IV 150.05 84.55 77.37 20.9 2.80 8.50
V 114.18 158.86 104.56 15.2 4.20 34.18
VI 348.74 381.80 128.84 9.9 15.26 66.25

582 Claudio Milton Montenegro Campos et al.
Rev. Ambient. Água vol. 9 n. 4 Taubaté – Oct. / Dec. 2014
Analyzing the influent concentrations of the AET, it is observed that the increase of COD
concentration also increased the VOLR synergistically and caused a progressive concentration
of phenolic compounds applied to the UASB reactor. This demonstrates that the UASB
reactor operated with organic load shocks in terms of COD and phenolic compounds
(Table 4). The same table shows the concentrations of phenolic compounds of WCWP
prepared throughout the treatment system decreasing in all periods studied, indicating the
removal of phenolic compounds from liquid medium.
Ramakrishnan and Surampalli (2012) studied the removal of phenolic compounds in
UASB reactors and Anaerobic Hybrid Reactors (AHR) operating under conditions of organic
shocks. The authors observed that the progressive increase of VOLR of 1.02 to
1.58 gCOD m-3
d-1
synergistically with reducing the HRT from 1.5 d to 0, 33 d, provoked a
drop in efficiency of removal of phenolic compounds from 99% to 77% in the AHR and from
95% to 68% in the UASB reactor, respectively. The authors concluded that the AHR
performed better than the UASB reactor due to the presence of plastic brackets in its interior,
which prevented the sweep of the biomass. However, the decrease in HRT negatively affected
the efficiency of the process in terms of the removal of phenolic compounds due to the toxic
effect.
Table 4 shows that the same phenomenon was observed in the UASB reactor, because
the decrease in HRT from 62,2 h to 15.2 h caused a drop in efficiency of removal of phenolic
compounds of 51.32% to 34.18%, a phenomenon similar to that observed by Ramakrishnan
and Surampalli (2012). However, while decreasing the HRT from 15.2 h to 9.9 h, an increase
in the efficiency of phenolic compounds removal from 34.18% to 66.25% occurred, indicating
a probable adaptation of biomass to the inhibitor compound, decreasing the toxic effect on it,
as described by Zeeuw (1984), Speece (1996) and Chen et al. (2008).
According to Chen et al. (2008) other factors besides the phenolic compounds may
interfere in the inhibition of the anaerobic process, such as COD: N: P, pH, temperature and
buffering conditions. Based on the factors mentioned, it was possible to control the pH value
(Table 1) and influent temperature of UASB. These were, respectively, kept within the range
of neutrality (6.8-7.2) and within the range mesophilic temperature (approx. 30°C) using
thermostatic control heating. However, due to dilution of WCWP in natura for preparation of
the influent of the UASB reactor, it has not been possible to maintain a constant relationship
of COD: N: P; this varied throughout the experiment. The ratio of COD: N: P related to each
period can be seen in Table 5.
Table 5. The values for COD: N: P in
UASB reactor in each studied period.
Period COD:N:P
I 17:0.68:1
II 8:0.25:1
III 15:0.12:1
IV 12:0.10:1
V 11:0.08:1
VI 35:0.09:1
According to Chernicharo (2007), the ideal ratio for COD: N: P in the degradation of
carbohydrates is 350:5:1. Low values for COD and nitrogen in the relationship will cause

583 Kinetic parameters of biomass growth in a UASB reactor …
Rev. Ambient. Água vol. 9 n. 4 Taubaté – Oct. / Dec.. 2014
variations in methane production in the process. According to Pereira et al. (2010), when the
concentration of carbon is higher than nitrogen, the nitrogen compounds are used first and
anaerobic digestion slows. If the carbon concentration is lower than nitrogen, carbon is totally
consumed and digestion ceases.
In Table 6 presents the values of concentrations of organic matter in terms of solids
(TS and TVS), CODT and BOD520°C
throughout the treatment system for each studied period
and the values of UASB reactor efficiency for both parameters, in each period.
Table 6. Concentration of organic matter in terms of solids, CODT e BOD520°C
T in the WCWP
throughout the
system and removal efficiency in the UASB reactor for each period.
Period I-EAT (mg L
-1)
I-UASB (mg L-1
) E-UASB (mg L-1
)
Removal efficiency
TS TVS
TS TVS
TS TVS
TS (%) TVS (%)
I 1217.31 767.66 1041.87 610.81 753.82 319.72 27.65 47.66
II 2285.33 1506.67 1805.00 1113.18 967.01 385.53 46.43 65.37
III 3634.62 2512.08 3240.57 1537.83 2147.64 917.26 33.73 40.35
IV 3837.93 2896.69 2519.68 1669.17 1408.57 730.45 44.10 56.24
V 5295.83 4155.83 7582.50 6158.33 1998.33 966.67 73.65 84.30
VI 5822.2 4087.41 9357.41 6918.52 3517.22 1622.04 62.41 76.56
Period
Concentration of BOD520°C
T
(mgO2 L-1
)
Concentration of CODT
(mgO2 L-1
) Removal efficiency
I-EAT I-UASB E-UASB I-AET I-UASB E-UASB
BOD520°C
(%) COD (%)
I 405.3 379. 3 52. 8 727.0 658.3 173.1 86.1 73.7
II 1049.0 611.7 164. 3 1469.3 1077.0 194.4 73.1 81.9
III 1341.0 1162.5 263. 4 2696.7 1901.4 545.3 77.3 71.3
IV 1884.0 1399. 9 239. 9 3493.9 2353.3 557.4 82.9 76.3
V 1800.3 1524. 8 378. 5 3630.1 2689.7 654.7 75.2 75.7
VI 3414.7 3689. 7 1004.8 5918.8 5624.8 1420.5 72.8 74.7
Selvamurugan et al. (2010) evaluated an anaerobic hybrid reactor (AHR) in the treatment
of WCWP with the aim of removing organic matter in terms of solids, CODT and BOD520°C.
.
The reactor operated under a progressive increase of VOLR and decreasing HDT as
performed in this study. The authors submitted the AHR to HRT values of 24, 18, 12 and 6 h
with VOLR of 7.01; 9.55; 14.23 and 28.41 kg CODT m-3
d-1
obtaining for each condition the
removal of 70%, 61%, 52% and 46% in terms of CODT; 71%, 66%, 59% and 54% in terms of
BOD520°C
and 64%, 58%, 49% and 42% in terms of TS, respectively.
Fia et al. (2012) described the removal of organic matter of WCWP in three fixed bed
reactors filled with different media and operated under progressive increase of organic load.
Reactor 1 was filled with slag of blast furnace cinders and operated with values of HRT 1.19;
1.54; 1.54 d, and VOLR values of 0.81; 1.57; 3.17 kg COD m-3
d-1
, respectively. The response
for each operating condition was 47%, 61% and 64% for COD removal efficiency and 20%,
49% and 47% for removal efficiency of TVS, respectively. Reactor 2 was filled with
polyurethane foam and operated with values of TDH: 1.07; 1.03; 1.06 days, and VOLR values
of 0.98; 2.4; 4.41 kgCODT m-3
d-1
, respectively. The response for each operating condition

584 Claudio Milton Montenegro Campos et al.
Rev. Ambient. Água vol. 9 n. 4 Taubaté – Oct. / Dec. 2014
was 58%, 73% and 80% for COD removal efficiency and 24, 57 and 60% for removal
efficiency of TVS, respectively. Reactor 3 was filled with gravel (crushed stone) and operated
with values of HRT 1.26; 1.58; 1.51 days, and VOLR values of 0.81; 1.67;
3.35 kgCODT m-3
d-1
, respectively. The response for each operating condition was 42, 54 and
72% for efficiency of COD removal and 26, 46 and 55% for removal efficiency of TVS,
respectively.
Tables 7, 8 and 9 present the values of pH, relative to Ripley (IA/PA) and concentrations
of total acidity (TVA), total alkalinity (TA), partial alkalinity (PA), intermediate-alkalinity
(IA), total phosphorus (TP) and total nitrogen Kjeldahl (TKN).
Table 7. Characterization of the AET influent.
Parameters
Period pH TVA PA IA TA IA/PA TP TKN
I 7.09 48.31 146.61 194.65 341.26 1.8 66.33 30.43
II 6.99 61.43 96.03 231.01 327.04 2.5 198.17 24.66
III 7.11 105.95 227.86 549.25 777.11 2.9 427.67 12.23
IV 6.87 155.69 312.08 501.54 813.62 1.7 722.17 21.13
V 7.02 137.45 227.59 603.23 830.82 2.8 116.5 18.41
VI 6.73 192.19 283.39 794.33 1077.72 2.9 181.33 29.09
Note: TVA – Total acidity (mgHCOOH L-¹); PA – Partial alkalinity (mgCaCO3 L
-¹); IA – Intermediate
alkalinity (mgCaCO3 L-¹); TA - Total alkalinity (mgCaCO3 L
-¹); TP - Total phosphorus (mgP L
-¹); TKN -
Total Kjeldahl Nitrogen (mgN L-¹).
Table 8. Characterization of UASB influent.
Parameters
Period pH TVA PA IA TA IA/PA T P TKN
I 7.02 40.9 156.5 193.1 349.6 1.7 38.0 25.68
II 7.08 40.6 150.8 283.4 434.2 2.4 141.0 35.51
III 6.83 103.0 241.7 514.7 756.3 2.5 129.7 15.37
IV 6.93 118.0 431.3 485.9 917.2 1.3 186.2 19.27
V 6.3 101.8 175.3 576.9 752.2 3.6 128.0 18.43
VI 6.5 168.4 340.1 917.4 1257.4 2.7 162.5 14.52
Note: TVA – Total acidity (mgHCOOH L-¹); PA – Partial alkalinity (mgCaCO3 L
-¹); IA – Intermediate
alkalinity (mgCaCO3 L-¹); TA - Total alkalinity (mgCaCO3 L
-¹); TP - Total phosphorus (mgP L
-¹); TKN - Total
Kjeldahl Nitrogen (mgN L-¹).
Values of pH below 6.0 can inhibit the activity of methanogenic archea, negatively
affecting the production of methane. Therefore, in order to maintain the UASB methanogenic
conditions in periods of sharp decline in pH due to high acidity, the medium was buffered
using the NaOH solution in the influent (Chen et al., 2008).
Bruno and Oliveira (2013) using a UASB reactor to treat WCWP, evaluated the behavior
of the pH and TVA concentrations and TA influent and effluent in a UASB reactor operating
585 Kinetic parameters of biomass growth in a UASB reactor …
Rev. Ambient. Água vol. 9 n. 4 Taubaté – Oct. / Dec.. 2014
as the first stage in two operational conditions. In the first condition, the WCWP had pH
values and concentrations of TVA and TA influent of 6.9; 960 mg HCOOH L-1
and
730 mgCaCO3 L-1
, respectively.
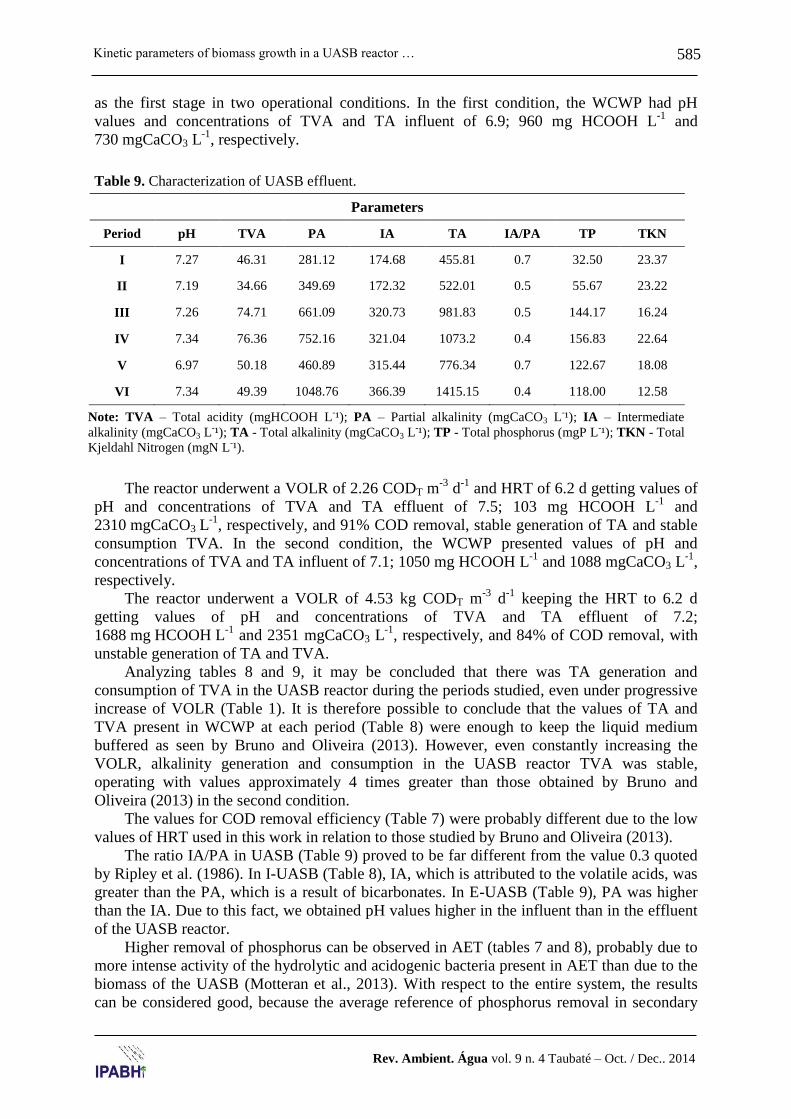
Table 9. Characterization of UASB effluent.
Parameters
Period pH TVA PA IA TA IA/PA TP TKN
I 7.27 46.31 281.12 174.68 455.81 0.7 32.50 23.37
II 7.19 34.66 349.69 172.32 522.01 0.5 55.67 23.22
III 7.26 74.71 661.09 320.73 981.83 0.5 144.17 16.24
IV 7.34 76.36 752.16 321.04 1073.2 0.4 156.83 22.64
V 6.97 50.18 460.89 315.44 776.34 0.7 122.67 18.08
VI 7.34 49.39 1048.76 366.39 1415.15 0.4 118.00 12.58
Note: TVA – Total acidity (mgHCOOH L-¹); PA – Partial alkalinity (mgCaCO3 L
-¹); IA – Intermediate
alkalinity (mgCaCO3 L-¹); TA - Total alkalinity (mgCaCO3 L
-¹); TP - Total phosphorus (mgP L
-¹); TKN - Total
Kjeldahl Nitrogen (mgN L-¹).
The reactor underwent a VOLR of 2.26 CODT m-3
d-1
and HRT of 6.2 d getting values of
pH and concentrations of TVA and TA effluent of 7.5; 103 mg HCOOH L-1
and
2310 mgCaCO3 L-1
, respectively, and 91% COD removal, stable generation of TA and stable
consumption TVA. In the second condition, the WCWP presented values of pH and
concentrations of TVA and TA influent of 7.1; 1050 mg HCOOH L-1
and 1088 mgCaCO3 L-1
,
respectively.
The reactor underwent a VOLR of 4.53 kg CODT m-3
d-1
keeping the HRT to 6.2 d
getting values of pH and concentrations of TVA and TA effluent of 7.2;
1688 mg HCOOH L-1
and 2351 mgCaCO3 L-1
, respectively, and 84% of COD removal, with
unstable generation of TA and TVA.
Analyzing tables 8 and 9, it may be concluded that there was TA generation and
consumption of TVA in the UASB reactor during the periods studied, even under progressive
increase of VOLR (Table 1). It is therefore possible to conclude that the values of TA and
TVA present in WCWP at each period (Table 8) were enough to keep the liquid medium
buffered as seen by Bruno and Oliveira (2013). However, even constantly increasing the
VOLR, alkalinity generation and consumption in the UASB reactor TVA was stable,
operating with values approximately 4 times greater than those obtained by Bruno and
Oliveira (2013) in the second condition.
The values for COD removal efficiency (Table 7) were probably different due to the low
values of HRT used in this work in relation to those studied by Bruno and Oliveira (2013).
The ratio IA/PA in UASB (Table 9) proved to be far different from the value 0.3 quoted
by Ripley et al. (1986). In I-UASB (Table 8), IA, which is attributed to the volatile acids, was
greater than the PA, which is a result of bicarbonates. In E-UASB (Table 9), PA was higher
than the IA. Due to this fact, we obtained pH values higher in the influent than in the effluent
of the UASB reactor.
Higher removal of phosphorus can be observed in AET (tables 7 and 8), probably due to
more intense activity of the hydrolytic and acidogenic bacteria present in AET than due to the
biomass of the UASB (Motteran et al., 2013). With respect to the entire system, the results
can be considered good, because the average reference of phosphorus removal in secondary
586 Claudio Milton Montenegro Campos et al.
Rev. Ambient. Água vol. 9 n. 4 Taubaté – Oct. / Dec. 2014
treatment is about 25% (Metcalf e Eddy, 2003). The nitrogen values were shown to be close
throughout the experiment (Tables 7, 8 and 9). Low levels of nitrogen contribute to the
depression of alkalinity in the medium, because of the formation of ammonium bicarbonate,
which is partly responsible for alkalinity (Pereira et al., 2013).
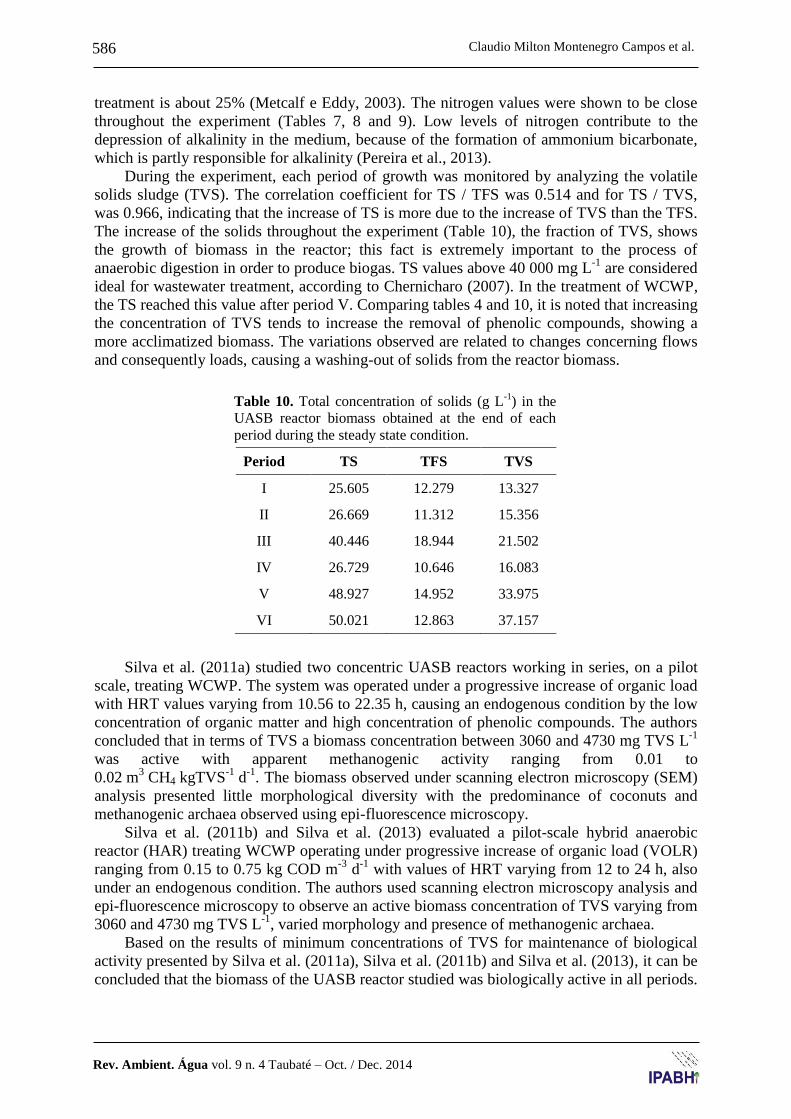
During the experiment, each period of growth was monitored by analyzing the volatile
solids sludge (TVS). The correlation coefficient for TS / TFS was 0.514 and for TS / TVS,
was 0.966, indicating that the increase of TS is more due to the increase of TVS than the TFS.
The increase of the solids throughout the experiment (Table 10), the fraction of TVS, shows
the growth of biomass in the reactor; this fact is extremely important to the process of
anaerobic digestion in order to produce biogas. TS values above 40 000 mg L-1
are considered
ideal for wastewater treatment, according to Chernicharo (2007). In the treatment of WCWP,
the TS reached this value after period V. Comparing tables 4 and 10, it is noted that increasing
the concentration of TVS tends to increase the removal of phenolic compounds, showing a
more acclimatized biomass. The variations observed are related to changes concerning flows
and consequently loads, causing a washing-out of solids from the reactor biomass.
Table 10. Total concentration of solids (g L-1
) in the
UASB reactor biomass obtained at the end of each
period during the steady state condition.
Period TS TFS TVS
I 25.605 12.279 13.327
II 26.669 11.312 15.356
III 40.446 18.944 21.502
IV 26.729 10.646 16.083
V 48.927 14.952 33.975
VI 50.021 12.863 37.157
Silva et al. (2011a) studied two concentric UASB reactors working in series, on a pilot
scale, treating WCWP. The system was operated under a progressive increase of organic load
with HRT values varying from 10.56 to 22.35 h, causing an endogenous condition by the low
concentration of organic matter and high concentration of phenolic compounds. The authors
concluded that in terms of TVS a biomass concentration between 3060 and 4730 mg TVS L-1
was active with apparent methanogenic activity ranging from 0.01 to
0.02 m3 CH4 kgTVS
-1 d
-1. The biomass observed under scanning electron microscopy (SEM)
analysis presented little morphological diversity with the predominance of coconuts and
methanogenic archaea observed using epi-fluorescence microscopy.
Silva et al. (2011b) and Silva et al. (2013) evaluated a pilot-scale hybrid anaerobic
reactor (HAR) treating WCWP operating under progressive increase of organic load (VOLR)
ranging from 0.15 to 0.75 kg COD m-3
d-1
with values of HRT varying from 12 to 24 h, also
under an endogenous condition. The authors used scanning electron microscopy analysis and
epi-fluorescence microscopy to observe an active biomass concentration of TVS varying from
3060 and 4730 mg TVS L-1
, varied morphology and presence of methanogenic archaea.
Based on the results of minimum concentrations of TVS for maintenance of biological
activity presented by Silva et al. (2011a), Silva et al. (2011b) and Silva et al. (2013), it can be
concluded that the biomass of the UASB reactor studied was biologically active in all periods.

587 Kinetic parameters of biomass growth in a UASB reactor …
Rev. Ambient. Água vol. 9 n. 4 Taubaté – Oct. / Dec.. 2014
In addition, the increase in concentration of TVS showed that the biomass grew even under
organic shocks and a high concentration of phenolic compounds, as shown in Table 4.
The biological growth was determined through the analysis of kinetic parameters
described in item 3.2.
3.3. Kinetics of growth and decay
The Volumetric Organic Loading Rate (VOLR) presented above the recommended
maximum value for domestic wastewater, which is 15kg COD m-3
d-1
, and above the values of
the treatment of WCWP obtained by Campos et al. (2002), which were 0.17 to
0.31kg COD m-3
d-1
, demonstrating the capacity of the UASB to withstand high organic and
hydraulic loadings (Table 11).
Table 11. Flow, HLR and VOLR in the periods.
Period Q
(L h-1
)
Q
(m3 d
-1)
HLR
(m³ m-³d-¹)
VOLR
(kgBOD520°C
m3 d
-1)
VOLR
(kgCOD m3d
-1)
I 0.203 0.0049 0.3858 0.14 0.26
II 0.413 0.0099 0.7869 0.41 0.81
III 0.409 0.0098 0.7818 0.69 1.50
IV 0.605 0.0145 1.1483 1.57 2.80
V 0.828 0.0199 1.5789 2.29 4.20
VI 1.292 0.0310 2.4242 7.11 15.26
The TVS in the reactor, obtained through analysis of the profile of the sludge, showed
values from 18 257 to 23 852 mg L-1
. It was observed that, except in the period IV, increasing
the Biological Organic Loading Rate (BOLR) increased the concentration of TVS. The
average values of the parameters TS, TVS and BOLR in the reactor during the periods, are
shown in Table 12.
Table 12. Concentration of TVS and values BOLR in periods I through VI.
Period TS
(mg L-1
)
TVS
(mg L-1
)
BOLR
(kg COD kg TVS-1
d-1
)
BOLR
(kg BOD520°C
kgTVS-1
d-1
)
I 25,605 13,326 0.05 0.03
II 26,669 15,356 0.13 0.07
III 40,446 21,502 0.17 0.08
IV 30,554 19,939 0.34 0.19
V 47,360 33,069 0.33 0.18
VI 50,021 37,157 1.06 0.49

588 Claudio Milton Montenegro Campos et al.
Rev. Ambient. Água vol. 9 n. 4 Taubaté – Oct. / Dec. 2014
The kinetic parameters were determined for quantification of the coefficients Y, Kd, Ks
and μmax using the average values found in the six periods studied.
To construct the model, we used the average values presented in Tables 9 and 10. Using
Table 13, linear regressions were performed to construct the graph shown in Figure 1, and
after generating the linear model y = ax + b, the values of the parameters Y and Kd were
obtained. The equation for a=2.722 b=0.0205, resulted in Y = 0.37 mg TVS
(mg COD removed)-1
and Kd=0.0075 d-1
.
Table 13. Data used for calculating the kinetic parameters: Y and Kd.
Period HRT (h) Vr (L) Q
(L d-1
)
Co
(mg L-¹)
C
(mg L-¹)
Q*
(Co-C)/Xr*Vr θC (d)
I 62.2 5.2 4.872 658.3 173.1 0.01513 100.2652
II 30.5 5.2 9.912 1077.0 194.4 0.04860 47.0962
III 30.7 5.2 9.816 1901.4 545.3 0.05282 27.9885
IV 20.9 5.2 14.52 2353.3 557.4 0.11158 22.0330
V 15.2 5.2 19.872 2689.7 654.7 0.10434 20.1757
VI 9.9 5.2 31.008 5624.8 1420.5 0.29936 8.6583
Legend: Co – COD influent; C – COD effluent; Xr - TVS of biomass; Vr – reactor volume; θC - cell retention
time.
Figure 1. Graph to obtain the parameters Y and Kd.
Using the Table 14, linear regressions were performed to construct the graph shown in
Figure 2, after which the linear model y = ax + b was generated. The values of parameters Ks
and μmax were obtained through the following calculation:
. The equation
resulted in a = 7681.5 and b = 5.1085, Ks = 1504 mg L-1
and μmax = 0.2 d-1
.
1/ θC (d-1
)

589 Kinetic parameters of biomass growth in a UASB reactor …
Rev. Ambient. Água vol. 9 n. 4 Taubaté – Oct. / Dec.. 2014
Table 14. Survey of kinetic parameters Ks and μmax.
Period θC (d) 1/ θC 1/C 1/(1/θC +Kd)
I 100.265 0.0099 0.205 57.1272
II 47.096 0.0212 0.100 34.7652
III 27.988 0.0350 0.101 23.1159
IV 22.033 0.0453 0.068 18.8972
V 20.176 0.0495 0.050 17.5144
VI 8.658 0.1154 0.032 8.1283
Legend: C – COD effluent; θC - cell retention time; Kd: endogenous coefficient (decay).
Figure 2. Graph to obtain the kinetic coeficients: Ks and µmax.
Using the values of Y and µmax presented in tables 13 and 14, it was possible to
determine the specific rate of substrate utilization by biomass
k= 0.54 mgCODremoved mgTVS-1 d-1
4. CONCLUSIONS
Under a gradual increase of loading rates, the UASB reactor has shown a high efficiency
in removing phenolic compounds and organic matter during the treatment of WCWP, even
while operating with high values of VOLR, above those recommended by the literature.
The kinetic parameters found during the anaerobic biodegradation of phenolic
compounds with minimal concentration of 50 mg L-¹, were: Y= 0.37mgTVS
(mgCOD removed)-1
, Kd = 0.0075 d-1
, Ks = 1504 mg L-1
, μmax = 0.2 d-1
and
k = 0.54 mgCODremoved mgTVS-1
d-1
, demonstrating that the saturation constant (Ks) is quite
high due to the presence of phenols, showing little affinity between the substrate (WCWP)
and the micro-organisms responsible for biological degradation.
590 Claudio Milton Montenegro Campos et al.
Rev. Ambient. Água vol. 9 n. 4 Taubaté – Oct. / Dec. 2014
5. ACKNOWLEDGEMENTS
The research group would like to acknowledge all undergraduate and postgraduate
students who assisted in the development of this research. The group is also grateful to
CAPES, CNPq and FAPEMIG, the organizations that provided the funding for the project and
scholarships.
6. REFERENCES
AMERICAN PUBLIC HEALTH ASSOCIATION – APHA; WATER WORKS
ASSOCIATION – WWA; WATER ENVIROMENT FEDERATION - WEF. Standard
methods for the examination of water and wastewater. Washington, 2005.
BHUNIA, P.; GHANGREKAR, M. M. Analysis, evaluation, and optimization of kinetic
parametersfor performance appraisal and design of UASB reactors. Bioresource
Technology, v. 99, p. 2132–2140, 2008.
http://dx.doi.org/10.1016/j.biortech.2007.05.053
BORÉM, F. M. Pós colheita do café. In: BORÉM, F. M. Processamento do café. Lavras:
UFLA, 2008. p. 127-158.
BRUNO, M.; OLIVEIRA, R. A. Performance of UASB reactors in two stages followed by
post-treatment with activated sludge in wastewater batch of wet-processed coffee.
Engenharia Agrícola, v. 33, p. 808-819, 2013. http://dx.doi.org/10.1590/S0100-
69162013000400020
CAMPOS, C. M. M.; CARMO, A. C. do; LUIZ, F. A. R. Impacto ambiental causado pela
poluição hídrica proveniente do processamento úmido do café. Revista Cafeicultura, v.
1, n. 4, p. 28-30, 2002.
CAMPOS, C. M. M.; PRADO, M. A. C.; PEREIRA, E. L. Anaerobic digestion of wastewater
from coffee and chemical analysis of biogas produced using gas chromatography:
quantification of methane, and potential energy gas exchanger. Bioscience Journal, v.
29, n. 3, p. 570-581, 2013.
CAMPOS, C. M. M.; PRADO, M. A. C.; PEREIRA, E. L. Physical-Chemical, Biochemical
and Energetic characterization of wastewater originated from wet coffee processing.
Bioscience Journal, v. 26, n. 4, p. 514-524, 2010. http://www.seer.ufu.br/index.
php/biosciencejournal/article/viewFile/7129/5123
CHEN, Y.; CHENG, J. J.; CREAMER, K. S. Inhibition of anaerobic digestion process: A
review. Bioresource Technology, v. 99, p. 4044-4064, 2008.
http://dx.doi.org/10.1016/j.biortech.2007.01.057
CHERNICHARO, C. A. L. Reatores anaeróbios: princípios do tratamento biológico de
águas residuárias. Belo Horizonte: Polytécnica, 2007. 379 p.
FIA, F. R. L.; MATOS, A. T.; BORGES, A. C.; FIA, R.; CECON, P. R. Treatment of
wastewater from coffee bean processing in anaerobic fixed bed reactors with different
support materials: performance and kinetic modeling. Journal of Environmental
Management, v. 108, p. 14-21, 2012. http://dx.doi.org/10.1016/j.jenvman.2012.04.033
INSTITUTO ADOLFO LUTZ. Normas analíticas do Instituto Adolfo Lutz. 3. ed. São
Paulo: IAL, 1985. v. 1.
591 Kinetic parameters of biomass growth in a UASB reactor …
Rev. Ambient. Água vol. 9 n. 4 Taubaté – Oct. / Dec.. 2014
JUNG, K. W.; KIM, D. H.; LEE, M. Y.; SHIN, H. S. Two-stage UASB reactor converting
coffee drink manufacturing wastewater to hydrogen and methane. International
Journal of Hydrogen Energy, v. 37, p. 7473 – 7481, 2012.
http://dx.doi.org/10.1016/j.ijhydene.2012.01.150
METCALF; EDDY. Wasterwater engineering: treatment, disposal and reuse. New York:
McGraw-Hill, 2003. 1334 p.
MOTTERAN, F.; PEREIRA, E. L.; CAMPOS, C. M. M. Characterization of an acidification
and equalization tank (AET) operating as a primary treatment of swine liquid effluent.
Brazilian Archives of Biology and Technology, v. 56, n. 3, p. 485-494. 2013.
http://dx.doi.org/10.1590/S1516-89132013000300017
PEREIRA, E. L.; CAMPOS, C. M. M.; MOTERANI, F. Avaliação do desempenho físico-
químico de um reator UASB construído em escala piloto na remoção de poluentes de
efluentes de suinocultura. Revista Ambiente & Agua, v. 5, n. 1, p. 79-88, 2010.
http://dx.doi.org/10.4136/ambi.agua.121
PEREIRA, E. L.; CAMPOS, C. M. M.; MOTTERAN, F. Physical-chemical study of pH,
alkalinity and total acidity in a system composed of Anaerobic Baffled Reactor in series
with Upflow Anaerobic Sludge Blanket reactor in the treatment of pig farming
wastewater. Acta Scientiarum Technology, v. 35, p. 477-483, 2013.
PEREIRA, E. L. Treatment of slaughterhouse wastewater using a system consisting of
reactors with biofilm. 2013. 214 p. Dissertation (Master of Science) – Escola de
Engenharia de Lorena, Universidade de São Paulo, Lorena, 2014.
RAMAKRISHNAN, A.; SURAMPALLI, R. Y. Comparative performance of UASB and
anaerobic hybrid reactors for the treatment of complex phenolic wastewater.
Bioresource Technology, v. 123, p. 352–359, 2012.
http://dx.doi.org/10.1016/j.biortech.2012.07.072
RIPLEY, L. E.; BOYLE, W. C.; CONVERSE, J.C. Improved alkalimetric monitoring for
anaerobic digestion of high- strength wastes. Journal Water Pollution Control
Federation, v. 58, n. 5, p. 406-411, 1986. http://www.jstor.org/stable/25042933
SELVAMURUGAN, M.; DORAISAMY, P.; MAHESWARI, M.; An integrated treatment
system for coffee processing wastewater using anaerobic and aerobic process.
Ecological Engineering, v. 36, p. 1686–1690, 2010.
http://dx.doi.org/10.1016/j.ecoleng.2010.07.013
SILVA, J. F.; CAMPOS, C. M. M.; PEREIRA, E. L.; SILVA, V. G. Avaliação microscópica
da endogenia microbiana em reatores UASB concêntricos, tratando água residuária do
processamento dos frutos do cafeeiro por via úmida. Acta Scientiarum. Technology, v.
33, n. 2, p. 129-135, 2011a.
SILVA, V. G.; CAMPOS, C. M. M.; PEREIRA, E. L.; SILVA, J. F. Characterization of the
biomass of a anaerobic hybrid reactor (AHR) with two types of support material during
the treatment of the coffee wastewater. Brazilian Archives of Biology and
Technology, v. 56, n. 3, p. 495-504, 2013. http://dx.doi.org/10.1590/S1516-
89132013000300018
592 Claudio Milton Montenegro Campos et al.
Rev. Ambient. Água vol. 9 n. 4 Taubaté – Oct. / Dec. 2014
SILVA, V. G.; CAMPOS, C. M. M.; PEREIRA, E. L.; SILVA, J. F. Start-up and steady-state
conditions of an Anaerobic Hybrid Reactor (AHR) using mini-filters composed with
two types of support medium operating under low loading rates. Brazilian Archives of
Biology and Technology, v. 54, n. 5, p. 973-982, 2011b.
http://dx.doi.org/10.1590/S1516-89132011000500015
SPEECE, R. E. Anaerobic biotechnology for industrial wastewaters. Vanderbilt
University: Archae Pr., 1996. 389p.
ZEEUW, W. J. D. Acclimatization of Anaerobic Sludge for UASB-reactor Start-up.
Editora: Agricultural University of Wageningen, 1984. 156p.