CHARACTERIZATION OF WET STORAGE IMPACTS ON ...
352
The Pennsylvania State University The Graduate School Intercollege Graduate Degree Program in Agricultural and Biological Engineering CHARACTERIZATION OF WET STORAGE IMPACTS ON BIOPROCESSING OF CORN STOVER TO BIOFUELS A Dissertation in Agricultural and Biological Engineering by Irene Dzidzor Darku © 2013 Irene Dzidzor Darku Submitted in Partial Fulfillment of the Requirements for the Degree of Doctor of Philosophy December 2013
-
Upload
khangminh22 -
Category
Documents
-
view
11 -
download
0
Transcript of CHARACTERIZATION OF WET STORAGE IMPACTS ON ...

The Pennsylvania State University
The Graduate School
Intercollege Graduate Degree Program in Agricultural and Biological Engineering
CHARACTERIZATION OF WET STORAGE IMPACTS ON
BIOPROCESSING OF CORN STOVER TO BIOFUELS
A Dissertation in
Agricultural and Biological Engineering
by
Irene Dzidzor Darku
© 2013 Irene Dzidzor Darku
Submitted in Partial Fulfillment
of the Requirements
for the Degree of
Doctor of Philosophy
December 2013

ii
The dissertation of Irene D. Darku was reviewed and approved* by the following:
Thomas L. Richard
Professor of Agricultural and Biological Engineering
Dissertation Advisor
Chair of Committee
Evelyn Thomchick
Associate Professor of Supply Chain Management
Jude Liu
Associate Professor of Agricultural and Biological Engineering
Paul Heinemann
Professor of Agricultural and Biological Engineering
Head of the Department of Agricultural and Biological Engineering
*Signatures are on file in the Graduate School

iii
Abstract
Narrow harvest windows and contamination concerns with field drying suggest that wet storage
will likely be the preferred storage method for biofuel feedstocks in humid regions of the U.S.
There are, however, at least two major setbacks to the adoption of this storage method. The first
relates to the impact of wet storage on biomass quality, biofuel yield, and biorefinery system
performance. The second relates to the impact of wet storage system on supply chain
management and logistics. These impacts have not been well addressed in prior wet storage
studies, and several logistic models have overlooked the wet storage option entirely. Feedstock
suppliers and feedstock buyers, therefore, have no prior expectation of how wet storage
outcomes compares with conventional dry storage, hence making the adoption of this storage
option a high risk venture.
One of the ways in which wet storage is anticipated to affect downstream processes, especially
biological processes like fermentation, is through the organic acids produced during storage.
These organic acids have the potential to alter the feedstock structure and provide partial
pretreatment, but can also inhibit subsequent biofuel fermentation. Pretreatment is necessary for
lignocellulosic feedstocks since it allows plant cell wall degrading enzymes to have access to
structural sugars (cellulose and hemicelluloses) and convert them to glucose and other simple
sugars that can be fermented to ethanol. Inhibition results in reduced specific biofuel productivity
(the amount of biofuel produced from the feedstock within a given time), when using biological
route of conversion. The contradictory functionality of organic acids generated during wet
storage made the impact of organic acids a major focus of this study.
To address these concerns, a series of experiments were performed to characterize the impact of
a wet storage system on biofuel production and elucidate how this storage option compares with
conversional dry storage systems. The most familiar wet storage process applicable to biofuel
production is ensilage, which has been practiced for centuries in the animal feed industry. The
feedstock is stored under anaerobic conditions, typically at moisture contents of 55 - 75% wet
basis (w.b.), and these conditions result in the production of organic acids by natural acidogenic
microorganisms. In this study, moisture levels outside these conventional ensilage levels were
investigated in order to define the full range of suitable levels for the storage of industrial
biomass destined for cellulosic biofuels. The feedstock used in this wet storage study was corn

iv
stover, which is an agricultural residue and includes the above ground biomass after corn grain is
harvested. Corn stover at seven different moisture contents (15-75%) was incubated under
anaerobic and aerobic conditions at two temperature levels (23oC and 37
oC) for 0, 21, 90 and
220 days.
The impact of wet storage was evaluated through its effect on dry matter loss; feedstock
composition; reactivity of corn stover fibers, after wet storage, to enzymes; and production of
ethanol, which was used as a model fuel. The impact of organic acids was examined specifically
through their effect on fiber reactivity; their interaction with subsequent liquid hot water
pretreatment process; and interference with ethanol fermentation, when Saccharomyces
cerevisiae is used as the fermenting microbe. A process cost model was developed, using results
from this study, to explore the cost implications of wet storage and effect on ethanol production.
Results from this study show that the most influential factor with respect to change in feedstock
composition during anaerobic wet storage is storage duration. Generally, there were no
significant differences in feedstock composition and in feedstock response to subsequent
downstream processes when corn stover was stored at moisture levels of 35% to 65%. Although
maximum dry matter loss observed under anaerobic storage was approximately 9%, the average
loss at 220-day storage period was less than 3%. Total organic acid content after wet storage was
up to 9.1%. Hemicellulose degradation during wet storage, which is an indication of the
pretreatment capability of organic acids, ranged from ~6% to ~30%.
Some key findings from this study are: (1) the extent of organic acid pretreatment during storage
was not adequate to serve as sole pretreatment, implying post storage pretreatment would still be
necessary; (2) the organic acid profile that develops during storage is considerably changed
during subsequent pretreatment. The amounts and types of acid after pretreatment depends on
whether feedstock was dried after storage, washed before pretreatment, or used “as is”, that is
without any processing before pretreatment; (3) acetic acid amounts greater than 6% g/g dry
basis can inhibit ethanol fermentation if butyric acid is also present. But these high
concentrations are observed only in 75% moisture feedstock; (4) if samples stored at 75% are
excluded, the organic acids produced during wet storage had no inhibitory effect on ethanol
fermentation and in fact enhanced the yield by a mean factor of ~1.11; (5) modeling output

v
showed that at moisture levels ≤ 35%, the minimum delivery cost of wet storage feedstock was
lower than cost of dry storage at 25% moisture. (6) A well preserved dry biomass storage system
is likely less expensive than high moisture (≥ 45%) wet storage systems in terms of feedstock
delivery cost. Considering findings 5) and 6), the optimum wet storage system for biomass is
likely to be approximately 35 - 40% moisture, which is lower than for animal feed. This lower
optimum is primarily driven by transportation costs of the additional water at higher moisture
levels, and will vary with the distance biomass needs to move to a biorefinery.
This study is useful in providing feedstock suppliers and feedstock buyers with a good
understanding of wet storage systems and their impact on feedstock composition, feedstock
logistics and downstream processing outcomes. Several major concerns about the
appropriateness of wet storage systems for the biofuel industry have been addressed. The
information and model from this study provides a basis for comparison of wet storage and
conventional dry storage systems and will facilitate the cost effective adoption of wet storage for
biofuel production where appropriate. In addition, the results from this study can be used in
developing quality indices to facilitate fair trade between feedstock suppliers and buyers.

vi
Table of contents
List of figures .................................................................................................................................. x
List of tables ................................................................................................................................. xiii
Acknowledgements ...................................................................................................................... xvi
Chapter 1 ......................................................................................................................................... 1
Introduction ..................................................................................................................................... 1
1.1 Background ......................................................................................................................................... 1
1.2 Research hypotheses and goals .......................................................................................................... 4
1.3 Organization and overview of chapters .............................................................................................. 5
1.4 Significance of research ...................................................................................................................... 5
1.5 References .......................................................................................................................................... 7
Chapter 2 ......................................................................................................................................... 9
Literature review ............................................................................................................................. 9
2.1 Wet storage ......................................................................................................................................... 9
2.1.1 Ensilage: wet storage of forage crops for animal feed .............................................................. 11
2.1.2 The Ritter process: wet storage of bagasse for the pulp and paper industry ........................... 16
2.2 Adapting a wet storage system for biofuel production of agricultural residue................................ 16
2.3 Investigations into ensilage for biofuel production .......................................................................... 19
2.4 The challenge of maintaining crop value consistency across the board .......................................... 27
2.5 Defining feedstock value and quality and the need for quality index .............................................. 29
2.6 Conventional pretreatment and possible pretreatment mechanisms during ensilage ................... 31
2.6.1 Some linkages within cell wall matrix and response to various reactions................................. 33
2.6.2 Pretreatment mechanism of ensilage ........................................................................................ 37
2.7 Modeling wet storage processes and logistics ................................................................................. 39
2.8 Summary of state of the art .............................................................................................................. 40
2.9 References ........................................................................................................................................ 42
Chapter 3 ....................................................................................................................................... 54
Corn stover evaluation after wet storage: relating storage conditions to storage outcomes ......... 54
3.1 Introduction ...................................................................................................................................... 55
3.2 Methodology ..................................................................................................................................... 58
3.2.1 Stover description and storage .................................................................................................. 58
3.2.2 Dry matter loss (DML) ................................................................................................................ 59
3.2.3 Organic acid profile and pH........................................................................................................ 60

vii
3.2.4 Corn stover compositional analysis ........................................................................................... 61
3.2.4 Data analysis .............................................................................................................................. 62
3.3 Results and Discussion ...................................................................................................................... 62
3.3.1 Anaerobic indicator strips .......................................................................................................... 62
3.3.2 Dry matter loss ........................................................................................................................... 63
3.3.3 pH of storage and control samples ............................................................................................ 75
3.3.4 Organic acid profiles during anaerobic storage ......................................................................... 79
3.3.5 Corn stover composition before and after storage ................................................................... 84
3.4 Conclusions ....................................................................................................................................... 91
3.5 References ........................................................................................................................................ 92
Chapter 4 ....................................................................................................................................... 97
Corn stover reactivity to cellulolytic enzymes after wet storage .................................................. 97
4.1 Introduction ...................................................................................................................................... 98
4.2 Materials and Methodology ........................................................................................................... 100
4.2.1 Stover description and storage ................................................................................................ 100
4.2.2 Corn stover compositional analysis ......................................................................................... 101
4.2.3 Organic acids and fiber reactivity test ..................................................................................... 101
4.2.4 Data analysis ............................................................................................................................ 104
4.3 Results and Discussion .................................................................................................................... 105
4.3.1 Organic acid profile and cluster analysis .................................................................................. 105
4.3.2 Fiber reactivity of pretreated washed PA stover ..................................................................... 109
4.3.3 Fiber reactivity of corn stover without pretreatment ............................................................. 112
4.3.4 Fiber reactivity of dry stover without pretreatment as affected by storage duration ............ 115
4.3.5 Relating organic acid cluster with fiber reactivity cluster ........................................................ 117
4.4 Conclusions ..................................................................................................................................... 121
4.5 References ...................................................................................................................................... 122
Chapter 5 ..................................................................................................................................... 125
Impact of the organic acids produced during wet biomass storage on pretreatment and
bioconversion of corn stover to ethanol ...................................................................................... 125
5.1 Introduction .................................................................................................................................... 125
5.2 Materials and methods ................................................................................................................... 128
5.2.1 Stover description and storage ................................................................................................ 128
5.2.2 Organic acid measurements and pretreatment ...................................................................... 129

viii
5.2.3 Simultaneous fermentation and saccharification .................................................................... 132
5.2.4 Data analysis ............................................................................................................................ 133
5.3 Results and discussion .................................................................................................................... 133
5.3.1 Pretreatment pH ...................................................................................................................... 133
5.3.2 Glucan and xylan removal ........................................................................................................ 135
5.3.3 Organic acids and inhibitors from pretreatment ..................................................................... 137
5.3.4 Fermentation ........................................................................................................................... 145
5.4 Conclusions ..................................................................................................................................... 156
5.6 References ...................................................................................................................................... 157
Chapter 6 ..................................................................................................................................... 161
Post storage handling and processing of wet stored stover: effects of drying ............................ 161
6.1 Introduction .................................................................................................................................... 161
6.2 Materials and methodology ............................................................................................................ 164
6.2.1 Corn stover description and storage ........................................................................................ 164
6.2.2 Organic acids, pretreatment, inhibitors and sugar removal .................................................... 165
6.2.3 Fermentation ........................................................................................................................... 165
6.2.4 Data Analysis ............................................................................................................................ 166
6.3 Results and discussion .................................................................................................................... 166
6.3.1 Pretreatment pH ...................................................................................................................... 166
6.3.2 Organic acids, HMF and Furfural .............................................................................................. 169
6.3.3 Sugar removal .......................................................................................................................... 177
6.3.4 Ethanol yield ............................................................................................................................ 181
6.4 Conclusions ..................................................................................................................................... 185
6.5 References ...................................................................................................................................... 186
Chapter 7 ..................................................................................................................................... 188
Quality indices and model: predicting biofuel yield and cost based on storage conditions ....... 188
7.1 Introduction .................................................................................................................................... 188
7.2 Methodology ................................................................................................................................... 192
7.2.1 Classification for quality index or indices................................................................................. 192
7.2.2 Modeling Approach.................................................................................................................. 192
7.2.3 Notes on some model process components ............................................................................ 198
7.3 Results ............................................................................................................................................. 202

ix
7.3.1 Quality index ............................................................................................................................ 202
7.3.2 Process cost model – field to farm gate outputs ..................................................................... 203
7.3.3 Ethanol prediction and cost model – biorefinery outputs ....................................................... 205
7.3.4 Model validation ...................................................................................................................... 207
7.3.5 Sensitivity analysis ................................................................................................................... 213
7.3.6 Comparison with other observations and predictions from literature ................................... 214
7.4 Conclusions ..................................................................................................................................... 220
7.5 References ...................................................................................................................................... 220
Chapter 8 ..................................................................................................................................... 226
Conclusions ................................................................................................................................. 226
8.1 Overview ......................................................................................................................................... 226
8.2 Experimental approach ................................................................................................................... 227
8.3 Key findings ..................................................................................................................................... 228
8.4 Potential applications ..................................................................................................................... 230
8.5 Recommendations or direction for future research ....................................................................... 230
APPENDIX A: General overview of research ............................................................................ 232
APPENDIX B: Corn stover - relating storage conditions to outcomes ...................................... 235
APPENDIX C: Corn stover reactivity to cellulolytic enzymes .................................................. 247
APPENDIX D: Impact of wet storage organic acids on pretreatment and bioconversion of corn
stover to ethanol .......................................................................................................................... 280
APPENDIX E: Post storage handling and processing of wet stored stover ............................... 300
APPENDIX F: Quality indices and model ................................................................................. 316

x
List of figures
Figure 2.1: Moisture content and recommended silo system ....................................................... 12
Figure 2.2: Some silage organic acids with corresponding chain length, pKa (numeric values in
boxes) and inhibitory capability.................................................................................................... 14
Figure 2.3: Diagrammatic representations of generalized Lignin-carbohydrate linkages and
susceptibility to oxidative, alkaline and hydrothermal treatment. ................................................ 34
Figure 2.4: Effect of pH on some structural components and linkages of plant cell wall ............ 36
Figure 2. 5: TEM (Transmission Electron Microscopy) micrographs comparing unensiled,
ensiled and dilute acid pretreated .................................................................................................. 38
Figure 2.6 Microscopic images comparing unensiled and ensiled corn ....................................... 38
Figure 3.1: Dry matter loss from aerobic wet storage. ................................................................. 64
Figure 3.3: Comparing Monod (red squares) and Droop (green triangles) models to gravimetric
dry matter loss data ....................................................................................................................... 74
Figure3.4: pH values for different aerobic storage durations and across moisture levels ............ 75
Figure 3.5: pH values for different anaerobic storage durations and across moisture levels ....... 79
Figure 4.1: Organic acid profile showing means of IA and PA stover at different moisture levels
..................................................................................................................................................... 107
Figure 4.2: Xylan and glucan removal during LHW pretreatment of ensiled (day 220) and
unensiled (day 0) PA stover ........................................................................................................ 110
Figure 4.3: Mean glucose yield ( % theoretical) of pretreated washed PA corn stover fiber at
different enzyme loadings ........................................................................................................... 111
Figure 4.5: Glucose yield of fiber reactivity test, with 15 FPU/g glucan cellulose enzyme
loading, without pretreatment. .................................................................................................... 114
Figure 5.1: Main pretreatment acids in the extracts of unwashed stover at the various
pretreatment retention times ....................................................................................................... 138
Figure 5.2: The dominant three acids in the pretreatment extract from various storage moisture
levels ........................................................................................................................................... 140
Figure 5.3: Change in amounts of organic acids from unwashed wet stored samples and total
amount of acids in pretreatment extracts .................................................................................... 141
Figure 5.5: Comparing means ethanol yields of dry ground stover ............................................ 155
Figure 6.2: Organic acid profile of “as is” (top) and dried (below) Day 0 and Day 220 samples
before pretreatment ..................................................................................................................... 170
Figure 6.3: Furfural and HMF generated during LHW pretreatment. ........................................ 176
Figure 6.4: Glucan and Xylan removal, as % of initial amount present, across moisture during
LHW pretreatment. ..................................................................................................................... 178
Figure 6.5: Lumped comparison of ethanol yield of unwashed samples and washed “as is” and
dried stover.................................................................................................................................. 182
Figure 7.3: Qualitative relationship between organic acids from wet storage of corn stover, dry
matter loss, glucose and ethanol yields ....................................................................................... 203

xi
Figure7.4: Sample output window of process cost model (part 1). ............................................ 204
Figure 7.5: Sample output window of ethanol prediction model (part 2). .................................. 207
Figure 7.6: Comparison of predicted and observed values of acetic acid (top) and isobutyric acid
concentration after wet storage. .................................................................................................. 209
Figure 7.7: Comparison of predicted and observed values of dry matter loss after aerobic and
wet anaerobic storage .................................................................................................................. 210
Figure 7.8: Comparison of predicted and observed values of ethanol yield. ............................. 211
Figure 7.9: Sensitivity analysis showing effect of various parameters on minimum feedstock
delivery cost of some wet and dry storage systems. ................................................................... 218
Figure 7.10: Sensitivity analysis showing effect of various storage systems on ethanol
profitability. ................................................................................................................................ 219
Figure A1: Schematic overview of research ............................................................................... 233
Figure A2: Detailed flow chart of research showing number of samples analyzed at each stage
..................................................................................................................................................... 234
Figure B1: Process Chart and experimental plan for studying effect of storage conditions on
storage outcome .......................................................................................................................... 235
Figure B2: Storage samples showing aerobic filter lids, anaerobic indicator, data logger and
molding ....................................................................................................................................... 236
Figure B3: Some physical changes in aerobic samples during storage ...................................... 236
Figure B4: Some precautions taken to minimize errors in dry matter determination ................. 237
Figure B5: Relating Lactic acid and acetic acid to moisture content ......................................... 243
Figure C1: Microscopic images comparing unensiled and ensiled corn stover .......................... 247
Figure C2: TEM (Transmission Electron Microscopy) micrographs comparing unensiled, ensiled
and dilute acid pretreated stover ................................................................................................. 248
Figure C3: Process Chart and experimental plan for fiber reactivity test and correlation with
organic acid. ................................................................................................................................ 249
Figure C5: Sample of “as is” corn stover after washing (A) for fiber reaction compared to
unwashed “as is” stover (B) ........................................................................................................ 251
Figure C6: Washed corn stover in centrifuge tubes for hydrolysis at 15% solid loading .......... 251
Figure C7: Relating hemicellulose degradation during storage and hydrolytic glucose yield ... 252
Figure C8: Ward cluster (using squared Euclidean distance) grouping of PA using mean values
of glucose yields at 2, 5, 15 FPU/g glucan ................................................................................. 263
Figure C9: Relationship between organic acids grouping and fiber reactivity grouping of PA corn
stover without pretreatment and grouped using glucose yield from four different enzyme
loadings ....................................................................................................................................... 264
Figure C10: Relating glucose from fiber reactivity grouping of PA corn stover without
pretreatment with lactic acid ....................................................................................................... 265
Figure C11: Relationship between organic acids grouping and fiber reactivity grouping of PA
and IA corn stover without pretreatment and grouped using actual values of glucose yields .... 266
Figure C12: Verifying YSI reliability of quantification ............................................................. 268

xii
Figure C13: Variation in total organic acids and relationship with storage moisture ................ 269
Figure D1: Flowchart of sample processing and analysis for determining effect of storage
organic acids on ethanol fermentation process ........................................................................... 280
Figure D2: Regression relationships between ethanol yield and concentration of potential
inhibitors in the fermentation broth of unensiled stover ............................................................. 298
Figure D3: Regression relationships between ethanol yield and concentration of potential
inhibitors in the fermentation broth of ensiled stover ................................................................. 299
Figure E1: Experimental design and analysis for examining impact of drying on ethanol yield 301
Figure E2: Ethanol dependency on main organic acids generated during pretreatment of
unwashed “as is” samples. .......................................................................................................... 314
Figure E3: Ethanol dependency on main organic acids generated during pretreatment of
unwashed dried samples ............................................................................................................. 315
Figure F1: Model input interface (Part 1. Process cost modeling ending with feedstock delivery
cost) ............................................................................................................................................. 320
Figure F2: Model input interface – truncated. (Part 2. Ethanol prediction and cost modeling
ending with ethanol production cost) .......................................................................................... 321

xiii
List of tables
Table 2.1: Various investigations into ensilage for biofuel production: conditions and outcomes
....................................................................................................................................................... 26
Table 3.1: Regression fits for anaerobic wet storage at different temperature and durations ...... 67
Table 3.2: Estimated parameters and R-square values from fitting Monod and Droop models to
dry matter loss data ....................................................................................................................... 73
Table 3.3: Differences in organic acids in anaerobic storage across stover types, moisture levels,
durations and temperatures ........................................................................................................... 83
Table 3.4: Composition (% dry basis) of IA stover before and after anaerobic storage ............... 89
Table 3.5: Comparing average percentage change, on mass basis, in anaerobic storage samples
by groups with reference to Day 0 ................................................................................................ 90
Table 4.1: Differences in organic acids levels across moisture levels and stover type .............. 108
Table 4.2: Fiber reactivity results (glucose yield as percentage of theoretical) of dry stover for
other storage conditions .............................................................................................................. 116
Table 4.3: Differences in the three organic acid groupings and correlation of individual acids
with glucose ................................................................................................................................ 120
Table 5.1 Relating hydrogen ion concentration to acetyl hydrolysis during pretreatment ......... 135
Table 5.2: Furfural and HMF generated during liquid hot water pretreatment of unwashed corn
stover ........................................................................................................................................... 144
Table 5.3*: Fermentation yields, on percent theoretical basis, at the different pretreatment
retention times ............................................................................................................................. 150
Table 6.1: pH of “as is” and dried stover at different pretreatment retention times ................... 169
Table 6.2: Organic acid profile of Day 220 stover after pretreatment with acids listed by
decreasing inhibitory potential .................................................................................................... 173
Table 6.3: Xylan and glucan removal (% of amounts initially present) at different pretreatment
retention time .............................................................................................................................. 180
Table 6.4: Lumped summary profile of dried and “as is” samples after LHW pretreatment ..... 183
Table 7.1: Comparison of some model outputs of six storage configurations ............................ 205
Table 7.2: Comparing corn stover dry matter loss prediction of model to other studies after 7
months of storage ........................................................................................................................ 216
Table 7.3: Delivery cost comparison of model estimates and other studies ............................... 217
Table F1: Null hypotheses tested in this research ....................................................................... 232
Table B1: Moisture content and dry matter losses in Fall Harvested, IA, stover ....................... 238
Table B2: Moisture content and dry matter losses in Spring Harvested, PA, stover .................. 240
Table B3: pH values of moisture adjusted corn stover before and after storage ........................ 241
Table B4: Stoichiometry of some silage fermentation reactions ................................................ 244
Table C1: Xylan removal in pretreated PA stover assuming no xylan degradation during storage
and 5% xylan degradation during storage ................................................................................... 253
Table C2: Glucose yield of non-pretreated corn stover after fiber reactivity test ...................... 254
Table C3: Glucose and total organic acid - amount, ranking and cluster group ......................... 255

xiv
Table C4: pH data of storage (Day 220) and control (day 0) samples ....................................... 256
Table C5: Cluster grouping based on organic acid content of individual IA and PA storage
samples ........................................................................................................................................ 257
Table C6: Cluster grouping based on glucose yield of individual IA and PA samples hydrolyzed
at cellulase enzyme loadings of 0 and 15 FPU /g glucan ........................................................... 259
Table C7: Another variant of cluster grouping based on percentage glucose yield of individual IA
and PA samples ........................................................................................................................... 261
Table C8: Cluster grouping based on mean glucose yield of PA samples hydrolyzed at cellulase
enzyme loadings of 0, 2, 5 and 15 FPU/g glucan. ...................................................................... 262
Table C9: Properties of organic acids identified in ensiled corn stover ..................................... 267
Table D1: Experimental design for examining effect of organic acids on fermentation ........... 281
Table D2: Sugar removal and inhibitors generated during pretreatment of unwashed and washed
37oC samples .............................................................................................................................. 283
Table D3: Sugar removal and inhibitors generated during pretreatment of unwashed 23oC
samples ........................................................................................................................................ 284
Table D4: Organic acids and pH after pretreatment of unwashed 23oC samples ....................... 285
Table D5: Organic acids and pH after pretreatment of unwashed and washed 37oC samples .. 287
Table D6: Concentration of potential inhibitors in pretreatment extract of unwashed samples
stored at 23oC ............................................................................................................................. 288
Table D7: Concentration of potential inhibitors in pretreatment extract of unwashed and washed
samples stored at 37oC ................................................................................................................ 289
Table D8: Summary stats on concentration of potential inhibitors in unwashed samples stored at
23oC............................................................................................................................................. 290
Table D9: Differences in pH before and after pretreatment. ...................................................... 291
Table D10: Ethanol yield and inhibitor concentrations† in pretreated unwashed stover fermented
with pretreatment extract ............................................................................................................ 292
Table D11: Ethanol yield and inhibitor concentrations† in pretreated unwashed stover stored at
37oC fermented with pretreatment extract .................................................................................. 293
Table D12: Ethanol yield from pretreated unwashed and washed stover fermented without
pretreatment extract and potential ethanol lost with extract ....................................................... 294
Table D13: Correlation between Ethanol yield (% theoretical) and potential inhibitors generated
during pretreatment of unwashed unensiled stover .................................................................... 296
Table D14: Correlation between Ethanol yield (% theoretical) and potential inhibitors generated
during pretreatment of unwashed ensiled stover stored for 220 days ......................................... 297
Table E1: pH of corn stover before and after liquid hot water pretreatment at 190oC .............. 302
Table E2: Organic acid profile of dried and “as is” stover before pretreatment ......................... 303
Table E3: Organic acid profile of unwashed Day 220 samples after pretreatment .................... 304
Table E4: Organic acid profiled of unwashed Day 0 samples after pretreatment ...................... 305
Table E5: Organic acid profile of washed “as is” samples after pretreatment ........................... 306

xv
Table E6: Organic acid profile of Day 0 stover after pretreatment with acids listed by decreasing
inhibitory potential ...................................................................................................................... 307
Table E7: Amounts of Furfural and HMF generated in LHW pretreatment of dried and “as is”
stover ........................................................................................................................................... 308
Table E8: Glucan removal (as % of initial amount present) after pretreatment of dried and “as is”
stover ........................................................................................................................................... 309
Table E9: Xylan removal (as % of initial amount present) after pretreatment of dried and “as is”
stover ........................................................................................................................................... 310
Table E10: Pretreatment products of washed dried stover at 15 minutes retention time ........... 311
Table E11: Pretreatment product and fermentation yield of dried ground “as received” stover 312
Table E12: Ethanol yields (percentage of theoretical) of dried and “as is” stover ..................... 313
Table F1: Ethanol yield classification using pretreatment acids and storage acids .................... 316
Table F2: Comparing pretreatment acids of dry and “as is” sample used in ethanol yield
classification. .............................................................................................................................. 317
Table F3: Dry matter loss grouping using storage organic acids................................................ 317
Table F4: Glucose yield, grouping based on storage organic acids ............................................ 318
Table F5: General observation in amounts of organic acids after pretreatment of “As is”
samples* and corresponding storage acids ................................................................................. 319
Table F6: Dry matter loss relationship for dry storage used in the model .................................. 322
Table F7: Dry matter loss relationship for wet storage used in the model ................................. 323
Table F8: Regression equations developed from Chapter 3 and from literature used in process
cost estimation ............................................................................................................................ 324
Table F9: Regression equations developed from this study and used ethanol cost and prediction
model........................................................................................................................................... 326
Table F10: Field operation custom rates and losses used in model ............................................ 328
Table F11: Breakdown of project investment cost used in model .............................................. 329
Table F12: Breakdown of project operating cost used in model ................................................ 330
Table F13: Evaluating test error by comparing with a prediction error of zero using the t-test . 331
Table F14:Predicted and observed ethanol yield values of “as is” stover with corresponding test
errors ........................................................................................................................................... 331
Table F15: Predicted and observed ethanol yield values of dried stover with corresponding test
errors ........................................................................................................................................... 333

xvi
Acknowledgements
Except the LORD had helped me, I would have toiled in vain – Psalm 127: 1
I committed to the LORD everything I did, and all my plans succeeded – Proverb 16:3
I am especially grateful to Dr. Tom Richard, my advisor, for his support and guidance
throughout my program and research at Penn State. I want to thank him for giving me the
opportunity to work with him. It has been a long time at Penn State but with his assistance, I had
all the resources I needed to do my research in a stress-free environment. It was refreshing to
have an advisor, whose in-depth knowledge of this field of study, informed as well as provided
valuable input, critique and feedback that shaped the onset and outcome of this research.
I also want to express my gratitude to Dr. Megan Marshall for her support and friendship; for
helping me get acquainted with most of the laboratory techniques and for the valuable feedbacks
she gave during the formulation of ideas for this research. I also want to thank her for the
sleepless night we spent together in lab setting up the storage experiments, at the beginning of
this research.
To my committee members, Dr. Evelyn Thomchick, Dr. Jude Liu and Dr. Paul Heinemann, I
also owe lots of gratitude. I want to especially thank them for their understanding, patience and
support. I want to thank them for taking time to go through my work and for their valuable
feedback.
My thanks to former and current members of the Bioenergy Research group in Richard’s lab for
their help whenever needed. Thanks to Kay Dimarco for assisting with some of the lab work; to
Senorpe Asem-Hiable and Grace Darabor, fellow graduate students who gave their time to help
at some critical times. I want to also extend my thanks to the undergraduates who have assisted
at various stages of this research: Rosa, Jimmy, Eric, Kelly, Grace and Sadie. I want to thank
Roderick Thomas for assisting with the ASE temperature test and data collection; and Randall
Bock for letting me se his mechanical press for my fiber reactivity experiments and for general
lab assistance. Thanks to Brain Macafee of the Farm Operations unit and to Travis Edwards of
the Dairy Research & Education Center for their assistance in getting the PA stover used in this
research and for the chopping service.
To my parents and siblings, I say a big “thank you” for their love and support. Another big
thanks to my husband, Kwame Essien, for his patience and support and my daughter, Esi-
Gyapeaba, for her understanding and for always praying that “God help my mama to complete
her dissertation and finish school soon.”
Finally, I want to thank the Idaho National Laboratory of the U.S. Department of Energy for
funding this research work.

xvii
But I devoted myself to knowledge and study; I was determined to find wisdom and
the answers to my questions, and to learn how wicked and foolish stupidity is.
Ecclesiastes 7:25 (GNT)
You will become wise, and your knowledge will give you pleasure. Your insight and
understanding will protect you and prevent you from doing the wrong thing.
Proverbs 2:10-22 (GNT)

1
Chapter 1
Introduction
1.1 Background
An ideal biomass storage system for biofuel production is expected to conserve both the quantity
and quality of the feedstock stored. An even better option would be an improvement in feedstock
quality. Wet storage has the potential capability to enhance feedstock quality under the right
storage conditions. Part of the purpose for the series of experimental investigations in this current
study, and documented in Chapters 3 to 7, was to determine the biomass storage conditions that
meets the expectation of maximum biofuel yield at minimum cost. Although wet storage has
gained recognition as a biofuel storage option, it is not readily embraced by feedstock buyers or
even suppliers. All currently operating cellulosic ethanol demonstration facilities depend on dry
feedstock. This is because the impacts of wet storage systems on supply chain management and
biorefinery output have not been well understood or documented. Biorefineries need to be
assured that wet storage feedstocks will be tolerated in their conversion process, and understand
how such feedstocks compare with biomass from conventional dry storage. At present this
information is missing in literature. One of the benefits of this research is to document and share
this information, helping both feedstock suppliers and buyers make informed decisions on the
use of wet storage for biofuel production.
Wet storage is the storage of materials, in this case plant biomass, at high moisture levels and
under conditions that slow down or inhibit active microbial activities or reactions. One attractive
strategy for wet storage is the ensilage process, an anaerobic process where natural acidogenic
microorganisms convert small amounts of residual sugars to organic acids to effect preservation
by lowering pH.
A compelling factor in studying the impacts of wet storage of corn stover on subsequent
bioconversion to biofuel is the conflicting potential that wet storage systems hold. On the one
hand, the organic acids produced during storage under anaerobic conditions have the potential to
improve feedstock quality by altering the plant cell wall structure so that enzymes can have

2
access to structural sugars (cellulose and hemicelluloses) and convert them to simple sugars that
can be fermented to biofuel. On the other hand, these same acids can inhibit the microbial
processes responsible for biofuel production, thereby reducing the amount of biofuel that can be
produced from the feedstock. The interest in understanding the implications and feasibility of
wet storage for biofuel production is not only of theoretical value but has practical significance,
especially with respect to the commercialization and sustainability of cellulosic biofuel
production. Cellulosic biofuel is biofuel from non-food plant resources. Cellulosic biofuel
production is expected to play a significant role in the United States’ journey to energy security.
The Energy Independence and Security Act of 2007 proposed a progressively increasing target
for cellulosic biofuel, up to 16 billion gallons by the year 2022. The Department of Energy
predicts a potential for up to 60 billion gallons by 2030 based on potentially available feedstock
from the billion ton study (Perlack et al., 2005; EERE, 2008). Accounting for an estimated
60% increase in energy consumption by 2030, this target would constitute 30% of the United
States’ transportation fuel needs.
The high rise in the cost of transportation fuels, in spring of 2008 into the summer and autumn of
the same year not only raised global concerns but reinforced the importance of the goal of energy
independence. The simultaneous global recession reinforced economic and political connections
with energy. The impression of the ‘crisis’ on the everyday life of Americans was critical
enough that for a while alternative energy pathways to U.S. energy independence became the
focus of the presidential campaigns and in fact was defined as a national priority by Obama, and
proposed as a backbone for economic stimulus and recovery.
Renewable energy accounted for about 8% of U.S total energy supply in 2009, of which biomass
energy accounted for 50% and was therefore less than 4% of the total U. S. energy supply (EIA,
2010). Current biomass energy resources consist mainly of wood and wood waste, municipal
waste, sludge waste and alcohol fuels. The main form of biomass energy utilization is for
electricity (biopower) and thermal applications (bioheat) with less than 1% from alcohol fuel and
biodiesel (EIA, 2009). Although this statistic suggests a small contribution of biofuels in meeting
U.S. energy demands, the strategic importance of biofuels springs from its ability to satisfy a
particular and challenging niche: the transportation sector. Energy consumption in the

3
transportation industry, which is ~ 97% dependent on petroleum, accounts for two-thirds of
petroleum demand and a fourth of the total energy consumption in the U.S., and has always been
the underpinning element of fuel crises experienced in the U.S (Wyman, 1999, EIA, 2007).
Biofuel production in the U.S. is currently dominated by ethanol from corn grain and has been
subjected to serious debates over issues of food security and environmental and ecological
sustainability. Cellulosic biofuels, which are the preferred alternatives, are still not operational at
full commercial scale. As noted by Hess et al. (2007), long term sustainability and economic
competitiveness of the cellulosic biofuel industry can only be possible if techno-economic issues
surrounding feedstock acquisition are addressed. These issues are categorized as supply chain
management or biomass logistics and they encompass harvesting, collection, storage, and
transportation of biomass feedstocks from the widely distributed farms and forests where they
are produced to the large and centralized biorefineries that are expected to be necessary to
achieve economies of scale.
This research addresses several aspects of biomass logistics related to storage. The series of
experiments described and discussed in Chapters 3 to 7 provide both characterization of the wet
storage process and an evaluation of the impacts of wet storage on the bioconversion of corn
stover to ethanol, which is used as a model biofuel.
Wet storage has a number of advantages over dry storage as a biofuel feedstock storage system.
It is suitable for the humid climates that are typical of the major U.S. agricultural zones. This
climatic condition often restricts the number of days harvesting is possible, can prolong field
drying, and may result in material deterioration before the biomass reaches a state that is dry
enough for storage. The Southeastern climate, which is warm in addition to being humid, can
accelerate these risks of microbial deterioration. Furthermore, field drying is associated with
extensive soil contamination (often 2% to 5%, and can exceed 10% on a dry basis), which is
undesirable and could interfere with subsequent downstream processing of feedstock by either
biological or thermochemical means, and thus increase total biofuel production cost. Biological
conversion is more compatible with wet storage than thermochemical processes, and thus will be
the focus of downstream impacts in this investigation. For biological conversion, downstream
processes typically include pretreatment, hydrolysis and fermentation. Pretreatment is the

4
alteration of the lignocellulosic structure so plant cell wall degrading enzymes can have access to
structural sugars (mainly cellulose and hemicelluloses); hydrolysis is the conversion of these
structural sugars to simple sugars, and fermentation is conversion of the simple sugars to ethanol,
other alcohols such as butanol, or hydrocarbon biofuels. An example of the effect of
contaminants on downstream process would be evident during dilute acid pretreatment of
biomass; the pretreatment would be less effective because the contaminants neutralize the acid.
The additional time and resources needed to assure a proper pretreatment outcome, together with
the larger size equipment needed to accommodate the contaminants, all translate to increases in
overall production cost. A one-pass harvesting system is expected to address the issue of
contamination, but in humid regions would not be compatible with dry storage during most of
the year. In addition, wet storage may have the potential to provide some pretreatment
functionality, which is a necessary step in lignocellulosic feedstock processing.
1.2 Research hypotheses and goals
The working hypothesis for this research was that wet storage under different conditions alters
feedstock structure and composition in different ways and to different degrees but generally has a
significant and positive net effect on downstream processes. The ways and degrees to which
feedstock composition and structure are altered will determine the quality and hence the value of
the feedstock to the biorefinery. (See Appendix A for specific null hypotheses tested.)
The main goals of this research were to (1) Investigate and characterize the impacts of wet
storage of corn stover on downstream processes like pretreatment, hydrolysis and biofuel
fermentation (2) Develop quality indices that can be used in predicting feedstock composition
and quality of ensiled corn stover under various storage conditions (3) Develop a model to
predict ethanol yield and cost. (4) Provide a basis for comparing wet and dry storage systems.
These goals were achieved for the most part, and new directions were identified for additional
research. Feedstock was characterized based on fiber reactivity, its response to hydrolytic
enzymes, and ethanol yields. This characterization was focused mainly on impacts of storage
acids. A numerical index was not developed in this research, but classifications that can inform
decisions on feedstock quality are provided. A model was developed to predict storage losses,

5
feedstock delivery cost, ethanol yield and minimum ethanol selling price (MESP). This model
also provides a platform for comparing wet and dry storage outcomes.
1.3 Organization and overview of chapters
In examining the impacts of wet storage on the bioconversion process, the research was carried
out in four phases. See Appendix A for the overall research plan and an outline of the
experimental design. The first phase, documented in Chapter 3, involved setting up the storage
units and collection/analysis of storage data, including dry matter losses, the organic acid profiles
associated with various wet storage conditions, and feedstock composition. The second phase
(Chapter 4) investigates and characterizes the effect of the silage organic acid profile on
feedstock structure through a fiber reactivity assay. Feedstock fibers after wet storage were tested
to see how reactive they were to hydrolytic enzymes with and without pretreatment. The
outcome of this test was glucose yield, and this yield was compared both among the various
treatments and to corresponding controls that were subjected to the same assay. Chapters 5 and 6
document the third phase, which involved conversion of feedstock to ethanol, used as a model
biofuel. Chapter 5 focuses on the potential of silage organic acids to enhance or inhibit
fermentation through washing of feedstock and fermentation with and without pretreatment
extracts. Chapter 6 focuses on the effect of drying silage before further downstream processing.
Regression relationships developed from the results from these three phases were used in the
development of the two part model described in Chapter 7. This modeling process constitutes the
fourth phase. The model offers several storage options and can be used in predicting feedstock
delivery cost, predict the biofuel yield and economic viability of the various storage types and
configurations analyzed. Chapter 8 summarizes the main findings from this research and
provides recommendations for future investigations.
1.4 Significance of research
From the time of harvest, fresh biomass begins to undergo undesirable changes that impact its
preservation and subsequent processing, even while transported in wagons or left wilting and
then drying in the field. Differences in exposure to sun, wind, and soil increase the heterogeneity
of the biomass and affect downstream availability. A storage system should ideally minimize

6
these undesirable changes, especially dry matter loss and increased biomass heterogeneity, while
supporting downstream processing. The compositional or chemical changes that result from wet
or dry storage methods have not been characterized, and will likely indicate important
distinctions between dry and wet storage systems. While it is expected that wet storage systems
will initially be adopted in humid regions, if wet storage is eventually also considered for drier
climates a characterization of these tradeoffs will be important there as well.
This research provides such a characterization across a gradient of moisture conditions,
specifically assessing the effect of organic acids on feedstock composition and quality as well as
sugar and biofuel yields. By addressing some of the key biomass logistic issues relating to
storage, this research also provides technical and economic data and knowledge that can help
facilitate the commercialization and sustainability of the emerging cellulosic biofuel industry. In
addition, this research provides a simple and quick predictive tool that relates storage conditions
and organic acid profiles to the dry matter loss resulting from different storage conditions and to
ethanol yield and production cost. This research also provides a system to classify storage
outcomes that could lay the foundation for the development of a feedstock quality predictive
tool. Such a tool would provide a basis for feedstock suppliers and buyers (both of whom are key
players, with critical roles in the commercial viability of lignocellulosic biofuel production) to
predict feedstock quality, and as a result, create fair and efficient markets for this new renewable
energy commodity. This concern for fairness is reflected in the Energy Policy Act of 2005,
section 942(e)(3), that states funding priority would be given to projects that fairly reward
feedstock suppliers. The sensitivity of biomass quality to feedstock and storage conditions
makes it difficult to predict the value for any given feedstock after storage, thus constituting a
common concern for both suppliers and buyers. A tool like this would bring both parties to a
shared appreciation of the value of the feedstock.
The Energy Policy Act of 2005 also stipulates, in section 942(a)(4) and (e)(2), that funding
priority would be given to projects in which the small feedstock producers are full participants or
equity partners in the development of the cellulosic biofuel industry. Another important section
of the Act is 946(a)(1) in which grants would be offered to agricultural producers who can
demonstrate cost effective cellulosic biomass innovations in the preprocessing of feedstock,

7
including chemical or biochemical treatments to add value and lower the cost of subsequent
processing at the biorefinery. Wet storage presents a perfect platform for achieving these goals
by providing opportunities for manipulation of some storage factors or the use of additives that
can facilitate pretreatment or preprocessing of biomass to enhance its value at the refinery. This
value-added processing can be performed at the farm level by feedstock producers, many of
whom may already be familiar with the basics of ensilage, providing a simple but effective
technology that can be adopted quickly at the scale needed for rapid growth of a large scale
biofuel industry.
1.5 References
EERE. 2008. Biomass Program 2007 Accomplishments Report. Available at
http://www1.eere.energy.gov/biomass/pdfs/program_accomplishments_introduction_fina
l.pdf Accessed 22 July 2009.
EIA. 2007. History of Energy in the United States: 1635-2000. Annual Energy Review (AER).
DOE Energy Information Administration. Available at
http://www.eia.doe.gov/emeu/aer/eh/frame.html Accessed 7 February 2009
EIA. 2009. Renewable Energy Consumption and Electricity Preliminary Statistics 2008.
Available at
http://www.eia.doe.gov/cneaf/alternate/page/renew_energy_consump/rea_prereport.html
Accessed 14 August 2009.
EIA. 2010. Renewable Energy Consumption and Electricity Preliminary Statistics 2009.
Available at
http://www.eia.gov/cneaf/alternate/page/renew_energy_consump/pretrends09.pdf
Accessed 14 October 2010.
Energy Policy Act of 2005. 2005. One Hundred Tenth Congress of the United States of America
Available at http://frwebgate.access.gpo.gov/cgi-
bin/getdoc.cgi?dbname=109_cong_bills&docid=f:h6enr.txt.pdf Accessed 2 February
2009.
Energy Policy Act of 2007. 2007. One Hundred Ninth Congress of the United States of America
Available at http://frwebgate.access.gpo.gov/cgi-
bin/getdoc.cgi?dbname=110_cong_bills&docid=f:h6enr.txt.pdf Accessed 02 February
2009.

8
Hess, J. R., C. T. Wright, and K. L. Kenney. 2007. Cellulosic biomass feedstocks and logistics
for ethanol production. Biofuels, Bioprod. Bioref. 1:181–190
Perlack, R.D., L.L. Wright, A.F. Turhollow, R.L. Graham, D.J. Stokes, and D. C. Erbach. 2005.
Biomass as feedstock for bioenergy and bioproducts industry: the technical feasibility of
a billion-ton annual supply. Oak Ridge National Laboratory DOE/GO-102995-2135,
ORNL/TM-2006/66. Available at
http://feedstockreview.ornl.gov/pdf/billion_ton_vision.pdf
Wyman, C. 1999. Biomass ethanol: technical progress, opportunities, and commercial
challenges. Annu. Rev. Energy Environ. 24:189–226 Available at
http://www.wilsoncenter.org/news/docs/Biomass%20ethanol.pdf Accessed 02 February
2009.

9
Chapter 2
Literature review
2.1 Wet storage
For purposes of biofuel production, wet storage of cellulosic biomass would occur at moisture
levels that are normally conducive to active microbial growth. In contrast, dry storage occurs at
or below the moisture levels where the low water activity inhibits microbial activity and prevents
deterioration of the material. For some foods and feedstocks the boundary between dry
(preserved) and wet (microbially active) zones is well defined and documented, although the
gravimetric moisture content of this boundary can vary considerably between different materials.
That is because these moisture levels have a theoretical basis in water activity, which correlates
to relative humidity and is also related to matrix potential, and indicates the energy necessary to
extract water from the surrounding environment. Usually for grains, storing at moisture contents
greater than 15 - 18% would be termed wet, as opposed to 13 -15% which is typically required
for long term dry storage. For agricultural residues in bales, dry storage typically requires
moisture content less than or equal to 20 - 25% (Atchison and Hettenhaus, 2004; Shinners et al.,
2007); where possible, 15 to 16 % is recommended for large round or big square bales and 17 to
18% for small square bales (Hancock, 2009). When biomass feedstock is stored at moisture
content greater than or equal to 25%, it can generally be classified as wet storage. At these
moisture levels the actions of microbes on the biomass have great potential to affect the integrity
of the material, through decomposition or oxidation, thereby reducing the quality and shelf life.
Wet storage from this perspective would look like an undesirable system, but various
mechanisms and strategies are available to prevent deterioration and maintain biomass quality. If
well designed, biomass degradation would not only be prevented, but quality and shelf life can
be enhanced.
Wet storage for biofuel production is worth considering for several reasons. Agricultural residues
could have moisture contents as high as 70% at the time of grain harvest, depending on the
harvest date. In humid climates, a wet storage option can provide harvest scheduling flexibility
by reducing or eliminating the need for field drying. Sometimes, as in the case of winter energy

10
double crops, it may be desirable to harvest before the lignification stage; this would imply
harvesting at higher moisture. In such cases, a storage system for feedstocks received at moisture
levels greater than 25% would be desirable, and could save time, energy and other resources.
Different forms of wet storage practices have been adopted for various industries and
applications. These include but are not limited to: (1) Ensilage, (2) Sprinkling systems, (3) the
Ritter process, and (4) the FERLAB self-ventilating process. Although all these processes are
briefly discussed below, ensilage and the Ritter process will be discussed in more detail in
subsequent sections since they are the most established wet storage systems for non-woody
biomass.
Ensilage of fresh fodder is the wet storage method that is most familiar to both farmers and the
public. It has been practiced at least as far back as early 19th century in Europe and later in the
U.S. (Bailey, 1911), and is the animal feed version of acid fermenting food preservation methods
for pickles, yoghurt, and kimchi that date back thousands of years. This method is traditionally
used to preserve the freshness and improve the nutritional value of green forage crops stored
through non-growing seasons for animal feed. In the forestry industry, wet storage is also a
common practice in many European and western countries. This involves continuous sprinkling
of water with differing intensities as deemed appropriate, or climate-adapted sprinkling in which
sprinkling is controlled based on the environmental conditions and evaporation dynamics of the
forest resource. The idea is to maintain moisture contents above 50% in order to preserve the
freshness of the wood as well as protect it from microbial or biological attack; this is
accomplished through creating anaerobic or oxygen deficient conditions through the formation
of a protective water film on the wood surface (oxygen diffuses 10,000 times slower in water
than in air) and the slower reaction rate due to the latent and evaporative cooling effects
associated with sprinkling (Jonsson, 2004). In Sweden, 84% of sawmills depend on wet storage
for preservation of the original quality of pulpwood and timber, which could be stored several
years before usage (Jonsson, 2004). This form of wet storage was found most useful in the U.S.
in the aftermath of hurricane Katrina, when 19 billion board feet (~ 45 million m3) of timber
spread over five million acres in Mississippi, Louisiana and Alabama were destroyed (Alt, 2005).
This resulted in a drastic reduction in timber prices due to abundant supply on the market, as well

11
as deterioration of the forest biomass due to the logistics involved in getting the resource to
manufacturing and markets, which was not timely enough. This single storm event thus
necessitated the establishment of additional twenty-six wet storage yards to preserve the
materials for up to two years (Alt, 2005; MBJ, 2006, Cooper, 2007). Another area where wet
storage is a common and successfully applied practice is the storage of baggase for the pulping
industry. This process can sometimes be prone to rapid deterioration due to the high residual
sugar content and large exposed area of the pile. The Ritter process (Atchison and Hettenhaus,
2004) is a modified wet storage system for baggase, and is most probably an adaptation of the
wet storage of woody biomass described above to non woody biomass. The feedstock is
saturated to its water holding capacity for storage and is maintained through the storage period
by recirculation of water through the pile (Atchison and Hettenhaus, 2004). Another storage
method for bagasse is the FERLAB wet storage (Grozdits, 1997), which is a biologically treated,
self-ventilating pile of wet baled bagasse. Size reduction of wet bagasse collected after sugar
extraction is followed by treatment with a proprietary mixture of thermophilic microbes, then
baled and stacked with ventilation channels between bales. The microorganisms quickly ferment
the residual sugar, stabilizing the pile and reducing long term fermentation losses as well as
preventing deterioration while the self-ventilation process dries up the material. By the mid of
the fifth month, moisture content is reduced from 55% to 25% ensuring long time storage. This
storage system supposedly addresses the rapid deterioration or losses that routinely occur in
bagasse before field drying can accomplished, due to the high moisture and sugar content.
Although FERLAB starts out as a wet storage system in the long run it is a dry storage system.
2.1.1 Ensilage: wet storage of forage crops for animal feed
Ensilage is the most commonly practiced wet storage system and usually requires some form of
enclosure to create anaerobic conditions. The anaerobic conditions limit the types and population
of microorganisms present and the metabolic pathways expressed, hence reducing energy
extraction from the material. The success of ensilage is hinged on the production of lactic acid
from readily fermentable sugars present in the feedstock or from supplemental sugars provided
as an additive or through enzymatic activities. The lactic acid reduces the pH to levels that
eradicate most spoilage organisms. Lactic acid dominance is expected within seven days of

12
ensilage and by twenty-one days silage stability is ensured. Ensilage compares favorably to dry
storage because of lower harvest and associated field losses, lower dry matter loss during
storage, a potential increase in nutritional yield and value and the overall forage quality. These
advantages, however, depend on proper management (Jones et al., 2004; Knicky, 2005).
Recommended moisture contents for forage crops in horizontal silos (bunkers), vertical silos
(conventional tower silos), limited oxygen silos and silo bags are 65-70%, 63-68%, 55-60% and
65% respectively (Jones et al., 2004). Figure 2.1 illustrates these moisture content ranges
recommended for various silo types. Depending on the silage facility available, moisture content
may have to be controlled through delayed harvest or prewilting (Egget et al., 1993; Jones et al.,
2004).
Figure 2.1: Moisture content and recommended silo system (Schroeder, 2004)

13
Silage organic acids: biofuel fermentation stimulant or inhibitor
Organic acids from both in-situ and external fermentations have long been used in the food
industry as preservatives due to their antimicrobial or inhibitory effects (Lund and Eklund,
2000). This suggests that the acidic conditions in silages could also serve as potential
impediment to the biofuel fermentation process. The inhibitory or antimicrobial effects are
mainly consequences of changes in internal pH due to assimilation and accumulation of organic
acids in the cytoplasm. This is made possible as a result of the lipophilic nature of organic acids
and the fact that lipids constitute a major part of the cell membrane and the cell wall. The
decrease in internal pH has the potential to denature or inactivate enzymes responsible for
various metabolic functions, and can also lead to reduction in growth rate or impairment of
mechanisms required to produce various microbial products, whether undesirable or of interest to
humans. In some cases, and depending on the acid concentration, cell death is inevitable.
The modes of inhibitory actions of various organic acids are different, and their impacts on
various microorganisms are also different (Lund and Eklund, 2000). The inhibitory capacity of
organic acids primarily depends on the level of dissociation. The lipid bilayer, which envelopes
the cell, acts as a barrier and does not allow the passage of ions across the cell membrane, so the
dissociated forms of organic acid have little impact. Thus the inhibitory capacity of an organic
acid is almost solely due to the concentration of the undissociated form of the acid. The
undissociated form of organic acid increases exponentially with decrease in pH, and vice-versa,
within a fairly narrow range around the pKa of that acid (Palmqvist et al., 1996; Branen, 2000).
Although the pH of the fermentation medium is a critical factor in organic acid inhibition, it is
not the sole criterion (Branen, 2002). This is evident by the more inhibitory nature of organic
acids as compared to strong mineral acids; the later cannot be assimilated into the cell because of
their non-lipophilic nature (Lund and Eklund, 2000). Generally, bacteria are more susceptible to
effects of organic acids at low pH than yeast or mold (Lund and Eklund, 2000). In addition to the
level of dissociation, the organic acid chain length can also affect their inhibitory capacity.
Ronnau et al. (1989) observed in an experiment with guinea pigs that the absorption rate of the
undissociated form of an acid across the distal colon (part of the descending section of the large
intestine) increases with chain length of short chain fatty acids. Branen (2002) noted that acids

14
with chain lengths less than or equal to seven carbons are more effective inhibitors at lower pH,
while chain lengths from nine to twelve are more inhibitory at neutral or higher pH. This implies
the longer chain acids have higher undissociated fractions and may not need a decrease in pH to
maintain this form, consistent with Ronnau et al.’s (1989) observation. However, this conclusion
is undercut by Branen’s (2002) comparison of the levels of inhibition of carbon chains less than
seven; this comparison showed that the levels of inhibition of the organic acids in question were
more aligned with their respective pKa value than chain length (see Figure 2.2).
Figure 2.2: Some silage organic acids with corresponding chain length, pKa (numeric values in
boxes) and inhibitory capability.
As mentioned earlier, different microorganisms will respond differently to different acids at
different concentrations and different conditions. For instance, the inhibitory effect of organic
acids on some microbes may depend on the concentration of metal ions present and on factors
like concentration of sugars, the amounts and types of nutrients, inoculum size or initial
microbial population (Lund and Eklund, 2000; Palmqvist and Hahn-Hagerdal, 2000; Stenberg et
al., 2000). Palmqvist et al. (1996) observed that the inhibitory effect of acetic acid on willow

15
fermentation for ethanol production was not significant except in the presence of sugars from the
pretreatment extract. There are a number of other studies (Palmqvist et al., 1996; Taherzadeh et
al. 1997; Koegel et al., 1997; Zaldivar and Ingram, 1999; Palmqvist and Hahn-Hägerdal , 2000;
Klinke at al., 2004; Knauf and Kraus, 2006) on the effects of organic acids especially with
reference to Saccharomyces cerevisiae (yeast) – which is the most common microbe used for
ethanol fermentation. Most of these studies have focused on the organic acids produced during
pretreatment of lignocellulosic feedstocks.
Depending on the feedstock and the pretreatment method, different acids could be produced.
Some of these acids include acetic, lactic, formic, levulinic, glycolic, cinnamic, 4-
hydroxybenzoic. It is generally recognized that these acids have the potential to inhibit microbial
activity; however, at lower concentrations their effects could also be positive. Observations by
Taherzadeh et al. (1997) and Thomas et al. (2002) indicate that low concentrations of acetic acid
could act as an ethanol stimulant during fermentation, increasing yield by up to 20% if
concentrations were lower than 0.05% (w/v) at pH 4.5, while these same concentrations will
inhibit growth at pH of 2.5. At intracellular pH of 3 to 4, intracellular concentrations of acetic
acid greater than 0.05% (w/v) will inhibit ethanol production, microbial growth, or both, while
lactic acid greater than 0.8% could lead to cell death depending on type of yeast (Ingledew,
2003). Zaldivar and Ingram (1999) showed that a lower concentration of acetic acid will result in
100% inhibition of E. coli and Z. mobilis. Lactic acid, on the other hand, resulted in microbial
growth but did not improve ethanol yield (Thomas et al., 2002). A similar ethanol stimulating
effect was reported by Torija et al. (2003) who observed that organic acids commonly present in
grapes were responsible for the completion of the fermentation process as well as enhanced
ethanol yields. None of the controls (i.e. without organic acid of any sort) were able to ferment
all the sugars, and fermentation was suspended after 21 days. Among the acids tested – tartaric,
citric, malic and succinic – with a Saccharomyces cerevisiae wine strain, all but succinic acid
helped complete the fermentation (Torija et al., 2003). Zaldivar and Ingram (1999), Thomas et
al. (2002) and Torija et al. (2003) studies showed the effect of organic acid on ethanol production
is dependent on the fermentation conditions especially initial pH, extracellular-intracellular pH
gradient, temperature, other chemicals present, the type and amount of organic acid present – in
both dissociated and undissociated forms. The minimum inhibitory concentrations (MIC), which

16
is the concentration at which growth is completely inhibited, of the various organic acids are
different for different microorganisms and under different conditions.
2.1.2 The Ritter process: wet storage of bagasse for the pulp and paper industry
The Ritter method of storage is an established storage method that was first commercialized in
1950 (Atchison and Hettenhaus, 2004) and specifically designed for storage of baggase for the
pulp and paper industry. This method could have a potential application for the storage of other
types of biomass and in particular, stover for biofuel production (Atchison and Hettenhaus,
2004). The Ritter process is an open-pile with typical storage capacity of about 250,000 dry tons
per pile and densities of about 200 - 225 Kg/m3. The feedstock is washed to remove dirt and
foreign materials, shredded, slurried to about 3% solids and distributed through a pipe to the
storage pad. The material is thus saturated beyond its water holding capacity and drains to about
75 -80% moisture where it stabilizes. The water from the drain is continuously recirculated
through the pile, maintaining the high moisture content which serves to control microbiological
activities within the pile (Hunter, 2007). Pile height is usually between 20 m - 40 m. At this
height, the pile becomes very compacted by the weight of its own overburden, preventing
oxygen penetration beyond one meter from the surface. Anaerobic conditions are thus created
beneath the surface, and the pH drops to about pH 4 or lower. Dry matter loss remains a
contentious issue (Liese and Walter, 1978; Young and Akhtar, 1998) but is usually claimed to be
less than 5% (Atchison and Hettenhaus, 2004). Although Liese and Walter (1978) and Young
and Akhtar (1998) admit the core of the pile is very well preserved in conventional Ritter
process, they argue that large losses occur due to the residue sugar content, large exposed
surface, and air infiltration to a depth of up to 3 m as opposed to the 1 m suggested by Atchison
and Hettenhaus (2004). Part of this discrepancy may result from transport of dissolved oxygen
associated with the recirculating water, which may accumulate oxygen at the surface of the pile.
2.2 Adapting a wet storage system for biofuel production of agricultural residue
The encouraging results from different wet storage systems in other industries interested in the
preservation and enhancement of cellulosic end product quality make it an option to be
considered for the biofuel industry. Because of the low bulk density, the wet storage systems that

17
are most applicable to the herbaceous biofuel industry are the Ritter process and Ensilage. There
are many attractions for the adoption of wet storage as opposed to dry storage for biofuel
production. For example, wet storage might be a better option for warm, humid climates where it
is difficult to achieve drying rates that are timely enough to prevent deterioration of the feedstock
before and during storage. High dry matter loss due to inadequate drying or moisture adsorption
is one of the main disadvantages of dry storage, and is particularly problematic in humid
climates. Second, field drying, which is often required for dry storage, is associated with
appreciable soil contamination since the feedstocks are usually left on the field, turned and
mixed with surface material, and may sometimes become muddy before getting dry
(Schechinger, 2008). Soil contamination could interfere with eventual processing of the
feedstock to fuels; it can increase handling and transportation cost, increase the cost of
processing equipment, reduce process efficiency and facilitate wear of equipment as well as
create a disposal problem (Schechinger, 2008). Third, there are increased risks of fire outbreak
with dry storage either through spontaneous combustion or through accidental contact with an
igniter. And fourth, dry storage is likely to take up more space, up to ten times what is required
for wet storage (Kram, 2008) depending on the storage design and compaction density; dry
storage requires ventilation alleys and a limited stacking height to allow heat to dissipate and
prevent spontaneous combustion. Richard et al. (2001) proposed the adaptation of the ensilage as
a storage method to reduce the risk of fire outbreaks associated with dry storage of biomass,
while minimizing loss of the carbohydrate content of the biomass. In addition to preventing fire
outbreaks, ensilage may serve as an avenue for in situ pretreatment of the biomass to enhance
downstream biofuel fermentation processes (Linden et al., 1987; Richard et al., 2001). In contrast
to ensilage, which requires some form of enclosure, the Ritter method is an exposed or opened
system yet internally anaerobic with an overall dry matter loss that could be similar to ensilage.
The Ritter process might, therefore, save cost in terms of holding structures but would cost more
in terms of operational facilities.
Although the Ritter process has been a great success for the storage of baggase for the pulp and
paper industry, that success may not be transferable to the storage of corn stover for the biofuel
industry without modification of the process. One relevant concern is whether the desirable
qualities for the pulp and paper industry are similar to those of the biofuel industry. The pre-

18
storage processing requirement of the Ritter process, which includes shredding with hammer mill
and vigorous washing, could reduce the water soluble carbohydrate in corn stover to levels that
may not promote lactic acid fermentation and rapid reduction in pH for feedstock preservation.
Water soluble carbohydrate (WSC) levels in corn stover are lower than that of bagasse and are
not likely to exceed 5% if harvested after grain is matured (Ren, 2006; Pordesimo et al., 2007;
Chen, 2009); even at 3.3% it is not likely for lactic acid to dominate (Ren, 2006). However, the
presumed necessity of adequate initial water soluble carbohydrates for achieving low pH and dry
matter loss through lactic acid fermentation is brought into question by the Ritter process.
Analysis of Ritter piles showed no lactic acid producing microbes nor was there any lactic acid
detected (Atchison and Hettenhaus, 2004), yet pH values and dry matter loss were similar to and
within recommended range of well designed ensilage. The organic acid profile of the Ritter
process is dominated by acetic, propionic and butyric acids, contrasting with conventional
knowledge about the importance of lactic acid in ensilage. Richard et al. (2001) and Ren (2006)
showed that preservation of ensiled corn stover could still be possible with acetic acid dominant
silage, or even without lactic acid, consistent with the results of Atchison and Hetterhaus (2004)
for the Ritter process. Although washing in the Ritter process may not affect the preservation of
the feedstock, the ‘water solubles’, which are mainly sugars, are washed out. These water
solubles accounts for up to 10% storage loss, in addition to the up to 5% fiber loss in the Ritter
process (Atchison and Hettenhaus, 2004), and could thus constitute a significant loss in the
biofuel industry depending on the feedstock. Nadeau et al. (1996) observed that rinsing ensiled
samples could result in up to 8% loss of cellulose and up to 15% loss of hemicelluloses.
Although, the preceding discussion does not suggest strong technical advantages for a ‘biofuel
Ritter process’, the process has been demonstrated on corn stover with success for a storage
duration exceeding two years (Kram, 2008). This success is primarily with respect to feedstock
preservation, without consideration for the impact on downstream processes, and economic costs
need to be factored in as well. The conflicting standards of quality and indicators of successful
storage from the Ritter and ensilage process have a number of implications: (1) the chemistry
underlying the successes of wet storage is still not well understood; (2) the unique structural and
chemical composition of different biomass feedstocks could dictate that different microbial
populations would out compete the rest and stabilize the pile, resulting in different results even at

19
same moisture content and pH; (3) an end use goal is necessary to clearly define what conditions
constitute good practice; and (4) the conventional criteria that determine quality of feedstock for
the animal or paper & pulp industry are not necessarily appropriate to designing a wet storage
system for corn stover as a feedstock for biofuel production
2.3 Investigations into ensilage for biofuel production
Table 2.1 describes prior investigations into the potential of silage as a biofuel feedstock,
including using various feedstocks and additives. The following are relevant findings from a
number of these studies.
Hydrolytic capacity of silage and effect of endogenous sugars
Linden et al. (1987) showed that ensilage could serve as a low severity pretreatment method if
extended over a long period of time. They investigated the effect of microbially-treated ensiled
and unensiled sweet sorghum on fiber reactivity, quantified using hydrolytic yield. The sorghum
had been pressed and wilted prior to storage, which was up to 155 days. The post-storage
processes included sodium hydroxide (NaOH) extraction as pretreatment, enzymatic hydrolysis,
pasteurization and fermentation. Although endogenous sugars were higher for day zero samples
compared to ensiled samples, without pretreatment, subsequent hydrolysis of ensiled samples
resulted in up to 69% more sugars compared to day zero samples. The authors, however, noted
that hydrolytic yield decreased for silage samples that were beyond thirty-two (32) days of
storage.
A similar but contrasting observation of quality degradation with time was made by Ren (2006)
who investigated the use of ensiled material for production of particle boards. Although the
ensiled material generally improved the mechanical properties and dimensional stability of the
manufactured particleboards relative to boards made from unensiled stover, this improvement
was lower at 189 days of ensilage compared to 21 days. Specific quality indicators including
modulus of rupture (MOR), modulus of elasticity (MOE), and internal bond (IB) were lower at
189 days, while thickness swell (TS) and water adsorption measurements were higher. The
former group could imply that the fiber became softer or more degradable over time, and the
latter measurements imply that the ensiled feedstock may allow better absorption and access for

20
enzymes, and more effective interaction with other elements of biochemical reactions. These
expectations lead to the contrast between Linden et al. (1987) and Ren’s (2006)
recommendations, since it would be expected that softer, easily degradable, better absorbing
fibers should yield more hydrolytic or fermentable products, but be less useful for use in
structural composites.
The relationship between hydrolytic yield in Linden et al. (1987), which was up to 42% of
theoretical yield, and silage duration was not linearly proportional. This 42% is higher than what
is typical in non-pretreated materials, which typically yield less than 20% of the theoretical yield
(Lynd, 1996; Mosier et al., 2005a; Zheng et al., 2009). Overall sugar yield (endogenous sugar
combined with hydrolytic sugars) indicated that in some cases, day zero material contained more
sugars compared to ensiled material.
After Linden et al.’s (1987) pressed sorghum samples were pretreated using NaOH, the
unensiled samples released more sugars (P < 0.005), but wilted sorghum showed no significant
difference (P = 0.135) over the ensilage period. Although Linden et al.’s (1987) results were not
consistent over the entire ensilage duration, they resulted in four observations. The first supports
the inhibitory nature of endogenous sugar. Second, the contribution of soluble carbohydrates to
the overall sugar yield could be significant, resulting in up to 17% more sugars depending on
ensilage duration, and the relative contribution of endogenous sugar is substrate dependent. For
instance, sweet sorghum has readily fermentable (endogenous) sugars comprising 40% of the dry
weight (Henk and Linden, 1994), while most lignocellulose biomass contains less than 5%
fermentable sugar. Third, without conventional pretreatment, hydrolysis of ensilage yielded less
than 45% of the sugar present in the feedstock. Finally, the results support the notion that the
acidic condition in silage could serve as pretreatment. This was evident from the percentage of
holocellulose (hemicelluloses and cellulose content) hydrolyzed without pretreatment compared
to unensiled samples. The difficulties in drawing inference from Linden et al.’s (1987) results
include (1) silage samples for each period had no replicates, hence it is not certain whether the
inconsistency in sugar yield with time is due to errors or is an actual reflection of the silage
process, and (2) the fermentation results, 0.37g ethanol/g available carbohydrate, disregarded

21
sorghum treatment (pressed or wilted) as well as ensilage period, which might suggest ethanol
yield is independent of these factors.
Enzyme addition, pretreatment and fiber digestibility
In another investigation using sweet sorghum, Henk and Linden (1994) showed that ensilage
could increase the reactivity of the feedstock to hydrolysis. Samples were inoculated with
Lactobacillus plantarum and Streptococcus faecium and then treated with enzymes (5IU/g DM)
before ensiling at 20oC for 60 days. Henk and Linden (1994) observed that although more
glucose was produced during ensilage in enzyme-treated samples compared to the controls
(silage without enzyme addition), the lignocellulosic fibers of control silage were more
responsive to post-silage or conventional hydrolytic reactions compared to enzyme-treated silage
and unensiled samples. Enzyme-treated samples had about 65% more glucose from in-situ silage
reaction than control samples but had about 41% less glucose during subsequent convention
hydrolysis. The post-storage response of enzyme treated samples to further degradation is
consistent with findings of Sheperd et al. (1995) and Nadeau et al. (1996) in which biomass
showed increased fiber degradation during ensilage, but experienced decreased in vitro
digestibility compared to control silage; enzyme treated samples still maintained an overall
higher degradation level as in the Linden et al. (1994) studies. The reduction in subsequent
degradation or hydrolysis is supported by a model developed by Chesson (1993), which showed
preferential hydrolysis of exposed polysaccharide and eventual build-up of lignin-carbohydrate
complexes left from the secondary cell wall, together with those of the primary cell wall. This
build-up occurred at the surface and is extremely resistant to biological attacks, thus altering the
chemical nature of the cell wall surface and reducing the hydrolytic effect of enzymes (Chesson,
1993). Conventional hydrolytic reactions show similar reductions in reactivity, but this is
normally attributed to reduced enzyme activity. Decreased enzyme activity, however, is not a
suitable explanation of reduced reactivity in subsequent hydrolysis after ensilage, since the
feedstock is being exposed to ‘new’ enzymes.
In another study, Ren (2006) showed enzyme treatment of corn stover silage resulted in more
cellulose degradation, evening out the degradation of the two structural carbohydrates (cellulose
and hemicelluloses) of the silage and increasing the WSC. In typical silage, there is preferential

22
degradation of hemicelluloses over cellulose. Hemicellulose degradation from enzyme-treated
samples were not that different from samples with no enzyme addition. The removal of
hemicelluloses facilitated hydrolysis and increase in hydrolytic yields in a similar manner for
both control and enzyme-treated samples, suggesting the positive results were not necessarily
influenced by enzyme treatment but rather the outcome of the naturally occurring
saccharification process during ensilage (Ren, 2006).
Chemically aided silage for ethanol production
Digman et al. (2007) studied ensiled switchgrass and reed canary grass by exploring some
chemically manipulated pretreatment opportunities the ensilage process could potentially
support. Their hypothesis was that the comparatively high severity of conventional pretreatment
methods, requiring very short reaction times, could be replaced by very low severity
pretreatment over a longer storage period. This is the same assumption that prompted the
investigations and suggestions by Linden et al. (1987) and Richard et al. (2001) that ensilage
could serve the dual purpose of storage and pretreatment. Digman et al.’s (2007) investigation
did not rely on the potential pretreatment capability of natural ensilage but instead applied, as
additive before ensilage, chemicals like sulfuric acid (H2SO4) and calcium hydroxide (Ca(OH)2)
that are known to improve forage digestibility. Digman et al. (2007) also employed conventional
pretreatment methods after ensiled storage. Their results showed that the controls, which had no
chemical additives, had cellulose yields of 33% and 15% for reed canary grass and switchgrass
respectively, while the acid and alkaline pretreated samples had cellulose yields of 54-79% for
reed canary grass and 24-42% for switchgrass. However, to get yields above 70% requires high
chemical loadings. For example, reed canary grass would require greater than 9% H2SO4 wt/wt
dry basis or about 15% Ca(OH)2 to achieve high yields. These loading rates are extremely high
compared to conventional pretreatment that occurs at elevated temperatures. For example,
typical conditions for dilute acid pretreatment are H2SO4 of ≤ 1% at 120 - 200oC for a few
minutes to up to 1 hour. The 33% recovery of cellulose from reed canary grass without chemical
addition or subsequent hydrolysis shows ensilage does have an impact on the feedstock structure.
The results also serve to buttress evidence of the success of pretreatment as applied to different
feedstocks. This success has been observed in spite of the challenge of feedstock variability, a

23
challenge that would no doubt impact on the applicability of wet storage as a natural alternative
pretreatment medium for biofuel applications.
Variations in using different feedstocks
An investigation into the use of five different residual feedstocks (Triticale hay, triticale straw,
cotton stalks, wheat straw and barley) for ethanol production (Chen at al. 2007) provides
additional evidence that silage effects and the impact on biofuel yield is dependent on the type
and composition of feedstock. The feedstocks were ensiled for 96 days with and without enzyme
additive. The enzyme additive was composed of fungal and bacterial alpha-amylase together
with hemicellulases and cellulases. Results indicated that four of the feedstocks (excluding
triticale hay) showed no significant differences in hydrolytic responses among samples.
However, these feedstocks all showed significant differences in hydrolytic yields of ensiled and
unensiled samples, with the former having about 6% more yield. On the other hand, hydrolytic
sugar yields of enzyme-treated ensiled triticale hay were not significantly different from those of
unensiled samples, indicating no impact of ensilage with this feedstock. A possible explanation
for the unique behavior of triticale hay could be due to its composition. Hay is less lignified due
to the comparatively early harvest date, and hence contains more non-structural carbohydrates.
The other feedstocks (straws) that are harvested after seed maturity are more lignified and
fibrous, and hence more recalcitrant (Chen et al., 2007).
Comparing chemical pretreatment and silage pretreatment effects
In a similar investigation conducted by Chen et al. (2007a), hydrolysis and ethanol yields from
chemical pretreatment of various feedstocks were compared to those obtained from enzyme-
treated ensiled feedstocks. Although subsequent chemical pretreatment gave hydrolytic yields of
~25 -37%, which seems higher than results from ensiled samples (21 -30%), statistical tests
indicate these values are not significantly different (P = 0.291). The feedstocks used in this study
included pearl millet hay, sweet sorghum hay, triticale/wheat hay and triticale/wheat straw.
Ethanol yields were 41% - 56% of theoretical yield based on hydrolyzed sugar content and also
showed no significant difference between chemically pretreated samples and enzyme-treated
silages. These parallel results of ensilage and chemically treated feedstock, although low in

24
absolute yield, is impressive as it suggests that ensilage had similar impact on the feedstock as
did the chemical treatment, hence supporting the concept that ensilage can serve as pretreatment.
It could also suggest there is an opportunity for ensilage to be competitive with conventional
pretreatment methods for some feedstocks and conditions. The question, therefore, of how silage
can be modified or controlled to achieve maximum efficiency becomes relevant.
Ensilage makes pretreatment more effective
Thomsen et al. (2008) investigated whole-crop maize silage without additives for ethanol
production. Although these results failed to support the efficacy of ensilage as a stand-alone
pretreatment, they showed that pretreatment yields as well as ethanol yield were remarkably
improved as a result of ensilage. Their results showed that hydrolyzing ensiled samples without
pretreatment resulted in very low glucose and hemicelluloses yields, each being recovered at less
than 20% of the total sugar in the silage. This result contrasts with that of Linden et al. (1987)
and may be the result of the different feedstocks used, which could affect the ensilability and the
organic acid profile. Another factor that could have influenced the sugar yield is the post silage
processing; in Thomsen et al.’s (2008) studies, the silage was dried and ground before further
processing; this was not the case with Linden et al. (1987). Thomsen et al.’s (2008) results from
pretreated ensiled samples using wet oxidation and hydrothermal treatments were, however, very
positive. The results indicated that hydrothermal pretreatment at 185oC for 15 minutes yielded
the best results, with close to 100% glucan yield and up to 89% hemicelluloses. The
hydrothermal pretreatment condition in essence is liquid hot water pretreatment. No significant
levels of inhibitors were present. The results suggest that ensilage could provide opportunities to
eliminate conventional hydrolysis before fermentation, with most of the sugars still being
released. Ethanol yield was reported to be 98% of theoretical yield after pretreatment. It is not
certain whether the very high yields obtained were unique to ensiled material, since Thomsen et
al. (2008) did not provide any data on unensiled whole corn as a control under the same
pretreatment conditions. One of the drawbacks to this experiment is that the use of whole-crop
silage is not very representative of pure lignocellulosic material since the weight of the grains,
mainly starch, constituent up to 50% of the whole plant on dry basis (Shinners et al., 2003). It is
also not likely that whole-crop corn would be used as feedstock for lignocellulosic ethanol since

25
this would ignite the food-fuel debates. Considering the high composition of starch in whole-
crop maize silage (~16%) and the relatively low lignin content due to early harvest, Thomsen et
al.’s (2008) low sugar yield from non-pretreated silage does not present an optimistic view of the
potential of ensilage to act as a pretreatment tool. However, their assertion that ensilage
significantly enhances pretreatment is shared by Chen (2009), who observed xylose removal was
55-65% for unensiled stover and 65-80% for ensiled stover after a reduced severity dilute acid
pretreatment (0.8%w/w H2SO4 at 121oC for 30 minutes).

26
Table 2.1: Silage feedstock, conditions and outcomes
Table 2.1: Various investigations into ensilage for biofuel production: conditions and outcomes

27
2.4 The challenge of maintaining crop value consistency across the board
One of the challenges of using cellulosic feedstock for biofuel production is the varying response
of different feedstocks to the processes involved, from storage to final product. This could be
partly attributed to the heterogeneity of the initial feedstocks, which even for a single crop
consist of different plant parts varying in relative proportion as well as structural and chemical
composition, and changing dynamically as the plant grows and senesces. Many different species
and varieties of feedstocks exist, which also result in varying structural and chemical
composition. Varieties may differ in growth conditions, time of maturity, dry matter content, and
nutrient and dry matter distribution. Pordesimo et al. (2005) argue that the main cause of
heterogeneity and variation in feedstock quality and energy content is not so much affected by
the variety as it is by the proportion of anatomical fractions collected, which could have
distinctly different chemical composition (Sheehan et al., 2001), and the time of harvest. This
notion was supported by a study by Muck et al. (2008) on ensilage of different corn stover
cultivars, in which the differences in ethanol potential were not of practical significance. Sluiter
et al. (2000), however, showed stover varieties differing in structural carbohydrate composition
over a very wide range of ~ 45 – 69%, which in turn is expected to affect the feedstock quality
and process economics, changing the minimum ethanol selling price (MESP) by $0.018/gal for
every 1% difference in carbohydrate content (Mark et al., 2003).
There is a general agreement that the time and method of harvest, collection and storage affects
the chemical and structural composition (Sheehan et al. 2001; DoKyoung et al., 2007). The
buffering capacity (ability to resist change in pH or acidobasic reactions), of plants is affected by
the time of harvest and increases with maturity (Knicky, 2005; Raclavská et al., 2007). This is
because as the plant advances in age, components that influence the buffering capacity like water
and WSC decrease and buffering compounds like lignin, ash, organic acids increase. Chen
(2009) found great disparity between corn stover of the same variety harvested in two successive
years harvested around the same time period. In the first year, moisture content was between 18-
46%, WSC was 3-5% and dry matter loss was 3-12% whereas in the second year moisture
content was between 22 -58%, WSC was 1.6 -2.5% and dry matter loss was less than 4%. The
high dry matter loss in the first year silage was attributed to the absence of cobs, hence

28
supporting Pordesimo et al.’s (2005) claim that anatomical fractions account for most feedstock
quality variability.
Plants are also sensitive to variation in environmental and weather conditions during growing
and harvest seasons, as well as the chemical or nutritional composition of the soil on which they
are grown; these factors can affect the plant composition or the relative proportions of the
various parts of the plant. In some cases and depending on the plant, these factors could result in
accumulation of chemical (or toxins) in the plants or certain parts of the plant (Kallenbach et al.
2001; Proven and Pitt, 2003; Hartwig, 2005). Nitrates are converted to nitrites and then ammonia
during anaerobic digestion or fermentation. Nitrate does not affect the degree of digestion but
affects the rate negatively. Nitrite inhibits microbial growth, with particularly severe effects on
cellulolytic and xylanolytic microbes (Marias et al., 1988) and similar impacst on cellulase and
xylanase activities. From an animal feed perspective, when nitrate accumulation occurs, and for
that matter other chemical accumulations, ensilage is recommended since it can break down the
chemicals and reduce their toxic effect by 30 -90% depending on the silage moisture content
(Hartwig, 2005; Min and Leep, 2007; Mickan, 2008). The advantage that ensilage presents then
is that the inhibitory effect of these contaminants during ethanol fermentation is minimized or
altogether eliminated, although other inhibitors like acetic acid accumulate during ensilage.
Another pre-storage process that might account for variation in storage outcomes for similar or
different feedstock is the cutting height and the length of cut. In cropping practices for livestock
feed, different cutting heights may be used with different forage crop, and are an important in
determining the possibility or ease of regrowth. In addition, depending on the harvest date, the
height of cut may affect the quality or composition (MDC, 2009; Kimbrough, 2009) and the
relative proportion of plant components present in the feedstock. For instance, the normal cutting
height for corn silage is 101-152 mm. But when increased to 254 – 505 mm the composition is
substantially different, with the latter having lower lignin and higher starch and energy content
(Jones et al., 2004). Since the moisture gradient and any accumulated chemical gradient is
usually formed axially along the stem, it becomes apparent that the height of cut might affect
post harvest processes. There is also the possibility of height of cut affecting microbial
population. When the crop is harvested from the ground or cut at heights close to the ground,

29
there is higher potential of increased microbial contamination through soil inoculation (Norell et
al., 2007).
In general, there are lots of factors that can cause plants of the same variety to differ in quality.
Some of these factors can be controlled while others cannot. For agricultural residues the stage at
which the plant is harvested cannot be fully controlled, since it would depend on the maturity
and harvest of the desirable food part. The time of harvest of residue may also be beyond the
farmer’s or collector’s control since this may depend on the weather and on the availability of
harvesting equipment or labor, and sometimes on other farm operations of higher priority. Also
associated with time of harvest is weather variation, which, cannot be controlled either.
Flooding could increase spoilage microbial population in the crop, a killing frost could affect the
drying mode, while rain and snow could alter the proportion of bound and free water. Given all
the other sources of variability, restriction of the crop varieties that can be grown may not be a
practical idea, and uniformity of soil fertility across farms is not likely to be achievable. This
implies there will always be variation in crop composition, even within the same variety, that
will affect feedstock composition. However, practices that are within human control (e.g. crop
species, harvest and storage method) could be managed so that although the feedstock undergoes
changes, the desirable components or compositions are maintained or consistent.
2.5 Defining feedstock value and quality and the need for quality index
Evaluation by industrial requirements
In the preceding section, crop related factors that could lead to variations in process outcome
were discussed. However, when considering wet storage in particular, additional sources of
variation can be expected. The nature of the raw material, storage conditions, as well as the
silage treatment could determine the ability of feedstocks to successfully complete the silage
process (Knicky, 2005). In addition, during ensilage, the feedstock might be constantly
undergoing changes through microbial or chemical reactions. Although microbial stability and
hence silage stability is expected at some point during silage (normally within 21 days), chemical
reactions are expected throughout the storage period, however mild or slow. Based on reasons
given in an earlier section, outcomes can be very different as a result.

30
Although ensiled feedstocks could have similar total digestible fiber, in actuality, the silage
fermentation characteristics and end product may have a modifying effect on the degree of
digestibility (Rook and Gill, 1990; Steen et al. 1998). For example, Muck et al. (2008) observed
a negative correlation between structural carbohydrates and simultaneous saccharification and
catabolism (SSC) values of some ensiled stover, indicating the presence or conservation of
sugars does not necessary result in accessibility or fermentability. There is also the possibility of
the silo losing its integrity hence, allowing some degree of air infiltration that might lead to
unexpected outcomes if not noticed or corrected on time. Another important reason why silage
presents more challenges than dry storage in terms of value or quality expectation is that there
are so many different types of additives that could be used during the process, and they could
result in different outcomes. In the forage industry, silage process quality indicators include pH,
dry matter loss and fermentation acid profile (Jones et al., 2004). Silage product or outcome
quality indicators include aerobic stability, crude protein content, Acid detergent Fiber (ADF)
and Neutral Detergent Fiber (NDF), fiber digestibility and intake potential. All of these
parameters are relevant to the biofuel industry except intake potential; however the acceptable
silage acid profile and level of dry matter loss tolerance might differ for both industries. Some of
the parameters that define feedstock quality in the forage industry can be combined into a single
index. Two of these indices are Relative Feed Value (RFV) and Relative Forage Quality (RFQ),
both of which compare forage qualities and can be used in ranking forages based on digestibility
after silage (Jeranyama and Garcia, 2004). The former evaluates feedstock quality based on the
overall amount of digestible fibers present, while the later evaluates quality based on the
digestibility of the digestible fibers present. A similar index, using appropriate criteria, would be
necessary for the biofuel industry.
The importance of a quality index is seen at two fronts. First, section 942(e)(2) &(3) of the
Energy Policy Act (2005) requires a strategic agreement be in place to fairly reward feedstock
suppliers. Second, feedstock sellers and their biorefinery customers must get their money’s worth
for feedstock marketed, so quality is a mutual concern. Strategic agreements and purchase
contracts between the two parties would be facilitated by a common understanding of what
constitutes the ‘merchandize’; is it the dry weight of whatever feedstock in question, digestible
fibers, any kind of fiber, potential sugars, fermentable sugars, etc. Since it is possible that only

31
certain components of the feedstock would be desirable, it would be necessary to monitor
process outcomes and develop a quantitative and qualitative index that can be appreciated by
both parties. For instance, enzyme additives could reduce fiber response to subsequent
hydrolysis, so if feedstock preservation during ensilage or aerobic stability after storage is not
assured, then the value of such feedstock might be lower. This is because the readily available
sugars derived from in-situ silage hydrolysis may be degraded, and so the overall sugar yield
from enzyme-treated sample may be considerably less, annulling the benefits of the treatment
and affecting the profitability of downstream ethanol production. Another example could be the
acid profile of the silage and its effect on downstream processes. As discussed earlier, there are
advantages to ensilage that could reduce some downstream (pretreatment) cost which would be
beneficial to the purchaser. On the other hand if neutralization of organic acids and/or inhibitors
present in silage is required before fermentation, this will add to process cost. Determination of
silage quality using tradition methods could be both time and money consuming. A predictive
system or model that takes into account the factors affecting quality variability would facilitate
fair transactions between feedstock suppliers and buyers. Developing a feedstock quality index is
almost a necessity for wet storage systems, which are more sensitive to storage conditions, than
it is for conventional under-the-shed dry storage.
2.6 Conventional pretreatment and possible pretreatment mechanisms during ensilage
Mechanisms of conventional pretreatment methods are still not well understood, and neither are
the pretreatment mechanisms of ensilage, which is still at an exploratory stage. The purpose of
pretreatment is to remove barriers to effective hydrolysis (chemical or enzymatic) of cellulose or
enable easy access to structural sugars in the feedstock by enzymes. This can be achieved by
altering the structure of the material or by removing some or all of the structural components that
may obstruct the process. Conventional pretreatment methods account for about a third of
processing cost (Wyman, 1999). There are a number of pretreatment technologies in existence,
broadly classified into physical or mechanical, biological, chemical and thermo- or physio-
chemical methods. Some of these have tens of variants depending on the reagents used or the
level and conditions at which they are applied. Leading pretreatment technologies include (1)
dilute acid (2) flowthrough (3) controlled pH hot water (4) Ammonia Fiber Explosion, AFEX (5)

32
Ammonia Recycle Pretreatment, ARP and (6) Lime (Wyman et al., 2003). In the past, dilute
acid pretreatment was the most studied and the most favored, however, the AFEX process is
currently gaining considerable attention. This is mainly due to the lower temperature
requirement, comparatively high yield, the potential for high solid loading, the absence of
inhibitors, the ease of recovery of reagent, and the elimination of a detoxification step after
pretreatment (Wyman et al., 2003). The controlled pH hot water method is also very appealing as
it does not require addition of any reagent and does not produce significant fermentation
inhibitors. However, controlled pH hot water has the lowest hydrolytic sugar yield of all the six
leading pretreatment technologies. While reduced sugar yield is a disadvantage, the ethanol
yields for all six leading technologies are high, ranging from 73 -98% (Wyman et al., 2003). The
absence of inhibitors is very important since the purpose of creating access to cellulose would be
defeated if the microorganisms required to aid subsequent processes cannot survive the
conditions created through pretreatment.
One of the challenges in the pretreatment of lignocellulosic feedstock is that there is not one
single pretreatment method that is robust enough to be consistently effective for all feedstock.
Optimum pretreatment conditions for any specific technology as well as outcomes may vary with
feedstock. For instance AFEX pretreatment resulted in ~98% hydrolytic sugars when used on
corn stover but in just over 50% when used on poplar at the same enzyme loading and a
residence time of three days (Wyman, 2008). Another example is dilute acid pretreatment:
conditions that are suitable for corn stover are usually ineffective for alfalfa pretreatment because
of its higher buffering capacity to acid; alfalfa therefore would require more acid, while the
comparatively high sugar content of alfalfa leads to production of furans that inhibit subsequent
ethanol fermentation (NAFA, 2007). The difficulty in achieving a robust pretreatment could be
partly attributed to the lack of fundamental understanding of the chemistry at work in
pretreatment and the impacts of reactor design and material on process outcome (NREL, 2008).
More recently, there have been claims that ionic liquid pretreatment and SPROL (Sulfite
Pretreatment to overcome Recalcitrance Of Lignocelluloses) technologies are just as effective
and more robust than leading conventional pretreatment methods, and are applicable to hard
woods, soft woods and agricultural residues alike (Pan et al., 2009). These processes may need to
be evaluated on techno-economic level to determine their industrial feasibility.

33
2.6.1 Some linkages within cell wall matrix and response to various reactions
Although the mechanisms of lignocellulosic bonds and of pretreatments are not well understood,
there are some ideas of structural formulations that suggest potential reactions and inform
expectations from various chemical or biological processes. For example, it is supposed that
lignin is covalently linked to cell wall matrix polysaccharides through ether bonds and ester
bonds, which are the most evident (Chesson, 1993; White et al., 1993) and through glycosidic
bonds. They are also linked through hydroxycinnamic or cinnamic acid bridges, methyl, acetyl
and phenolic acids and substances, or with uronic acid residues (Nevins, 1993; Theander and
Westerlund, 1993; White et al., 1993). Ester linkages are alkali-cleavable and alkali-labile; they
connect hydroxycinnamic acids (ferulyl or p-coumaryl residues) to polysaccharides (usually
pentoses, galacturonic acid residues, glucoronoarabinoxylan), while phenyl glycosidic linkages
associated with pentoses, glucose, and benzyl ether bonds are alkali-stable (Chesson, 1993;
Theander and Westerlund, 1993). Figure 2.3 shows a diagrammatic representation of lignin-
carbohydrate linkages. In herbaceous plants, Lignin-Carbohydrate Complexes (LCC) in primary
cell walls are almost absent and are alkali-resistant, while LCC in secondary cell walls can be
completely disrupted by NaOH. The alkali-stable linkages in herbaceous crops are in higher
proportion than the alkali-labile linkages (Chesson, 1993). Alkali can also influence uronosyl
constituents of hemicelluloses and β-elimination of acidic sugars (Nevins, 1993). However,
gycosidic bonds, including those in LCC, though not cleavable by alkali are acid-labile and can
also be affected by hydrothermal treatments (Chesson, 1993; Theander and Westerlund, 1993).
Acid hydrolysis results in partial hydrolysis of glycosidic bonds, and can result in degradation of
lignin at temperatures above 180oC (Chesson, 1993). To achieve a greater degree of hydrolysis,
strong concentrated acid is required. However, the disadvantage of concentrated acid is that it
degrades all sugars (Lowe, 1937) so there is a tendency to lose already present monosaccharides.
The reactivity of aqueous acid with cellulose (hydrolysis) is random, unlike alkali which is
systematic. Alkali attacks glycosidic ether bonds between anhydroglucose units of cellulose,
although this is often limited to the last unit of the chain due to resistivity of cellulose to alkali
treatments (Tímár-Balázsy and Eastop, 1998). Acids permeate the amorphous regions of
cellulose where hydrolysis begins. Depending on the temperature, duration, type and
concentration of acid, the reaction may proceed to crystalline region. At ambient temperatures,

34
acid hydrolysis is limited to the amorphous region (Tímár-Balázsy and Eastop, 1998). The
mechanism of acid hydrolysis is dependent on release and concentration of hydrogen ions (H+)
from the acid, which combines with water to break the carbon-1-oxygen glycosidic ether bond,
the rate depending on the H+ concentration, moisture content, temperature and accessibility of
cleaving sites (Tímár-Balázsy and Eastop, 1998). Hemicellulose hydrolysis is also facilitated by
lower pH or higher concentration of H+, although a rapid drop in pH could reduce enzymatic
hydrolysis of hemicelluloses (Muck, 1996). Figure 2.4 show some effects of pH on some cell
structures and linkages. It is noteworthy that pH is not the only factor that influences the rate or
extent of degradation of cell wall matrices.
Figure 2.3: Diagrammatic representations of generalized Lignin-carbohydrate linkages and
susceptibility to oxidative, alkaline and hydrothermal treatment. Solid lines represent glycosidic
linkages, dash lines represent alkali-labile (ester) linkages and dotted lines indicate ether bonding
(Chesson, 1993)
Another bond of interest in cell wall analysis is the hydrogen bond (H-bond). Hydrogen bonds
are pervasive in cell walls and play a critical role through water in keeping structures together in
complexes (Stoddart, 1983; Ayers, 2009). They can be found in structural water (water molecule
acting as a bridge between other molecules), between amino acids, between proteins and lignin,
between proteins and polysaccharides, between cellulosic and non- cellulosic polysaccharides,

35
and within cellulosic matrices. The intra- and intermolecular hydrogen bonds are responsible for
regular crystalline arrangements of glucan chains (Nevins, 1993). In addition, hydrogen bonds
help enzymes bind to their substrate (Kimball, 2003). Hydrogen bonds can be broken at elevated
temperatures or with Alkali, and the H-bonds between cellulose and strongly associated
hemicelluloses can be effectively broken by Alkali (Nevins, 1993; Theander and Westerlund,
1993).
The knowledge of the various linkages and their response to acidic and alkali reactions, though
limited, should inform any pretreatment strategy in protecting or maintaining structural integrity
of all sugars by breaking the bonds rather than degrading the sugars. Chesson (1993) suggests
that the least effective way in manipulating cell wall degradation is the disruption of lignin-
carbohydrate complex by hydrolysis of glycosidic linkages, which not only exist between lignin
and carbohydrates or between two carbohydrates but also within the carbohydrates. Acid
pretreatment of high severity could therefore be undesirable. In addition, breaking bonds that
release monomers might call for concern since the simple sugars released are more likely to be
degraded, especially if the feedstock would undergo subsequent chemical processes before
fermentation. Ensilage could provide a mild condition for pretreatment of lignocellulosic
feedstocks instead of the comparatively fast and severe conversional methods. If proven effective
and could also provide an avenue for manipulation of cell wall degradation.

36
Figure 2.4: Effect of pH on some structural components and linkages of plant cell wall
* (Stoddart, 2007) Rhamnogalacturonan II (RG-II) is the only boron containing polysaccharide of biological origin.
It contains unsual gylcosyl groups (~30) and O-acetyl substituent and is found mainly in primary cell wall as part of
pectin material (Aman, 1993; Nevins, 1993; O’Neil et al., 1996) and constituent about 4% of the primary cell wall
(Anonymous, 2009?). Pectins are responsible for adhesion between cell walls, and have similar degradation pattern
as hemicelluloses (Stoddart, 1983; White et al., 1993).
** (O’Neil et al. 1996) Borate esters cross-link pectic polysaccharide rhamnogalacturonan II (RG-II) within
homogalacturonan chains.
*** (Chesson, 1993; White et al., 1993) Gylcosidic bonds between different polysaccharides, between
polysaccharides and lignin or in different parts of the cell wall could be different/behave differently hence response
to acid treatment, extent and rate of degradation will also differ. The degree of degradation is also dependent on the
strength of acid, which would dictate the hydrogen concentration, the resident time and temperature. For instance
glycosidic bonds in neutral sugar side chains are very sensitive to hydrolysis than in main chain (Voragen et al.,
1995) and weak acids do not have any appreciable effect on monosaccharides e.g. glucose, fructose, dextrose, and
hydrolytic action on disaccharides is slow (Lowe, 1937).

37
2.6.2 Pretreatment mechanism of ensilage
Ensilage as a pretreatment tool has not been extensively investigated, however, it can be inferred
from discussions in earlier sections that clearly defining the mechanism or impact of ensilage
could be complex. Like conventional pretreatment methods, it is not likely that ensilage will
have the same effect on every feedstock.
A number of studies (McDonald et al. 1991; Muck, 1996; Richard et al., 2001; Ren et al. 2006)
have shown that the acidic condition of ensilage degrades the hemicellulose component of
biomass. The removal of hemicelluloses is comparable to the pretreatment mechanisms of
conventional acid or liquid hot water pretreatment in which the effectiveness of the process is
associated with the amount of hemicelluloses removed (Wyman, 1999; Sun and Cheng, 2002;
Mosier et al. 2005a). The degradation of hemicelluloses increases the surface area and allows
enzymes access to other structural components through the openings created by their removal.
Levels of hemicellulose degradation in silages can range from 0.5% or less (Muck, 1996) to as
high as 54% depending on the crop type and storage conditions (Ren, 2006). These
inconsistencies in degradation not only reflect the heterogeneity of biomass feedstocks, but also
the sensitivity of wet storage to different conditions, and perhaps also the complexity it presents
as a storage system.
The acidic conditions in silages, which are comparatively mild, are advantageous in preserving
sugar monomers while disrupting glycosidic bonds, and impact on other structural bonds as well
(see Figure 2.4). A microscopic investigation of ensiled feedstock by Donohoe et al. (2009)
showed some alteration in cell wall structure of the feedstock, although not as extensive as in
dilute acid pretreatment. Comparison with field-dried, senesced feedstock showed ensiled
feedstock had a looser cell wall structure (see Figures 2.5 and 2.6).

38
Figure 2. 5: TEM (Transmission Electron Microscopy) micrographs comparing unensiled,
ensiled and dilute acid pretreated (Adapted from Donohoe et al. 2009).
Figure 2.6 Microscopic images comparing unensiled and ensiled corn at x100 (left) and x300
(right) magnifications. (Adapted from Oleskowicz-Popiel et al. 2010).

39
It is almost indisputable that endogenous acid productions in silages have some effect on
feedstock structure. However, the practical significance of the effect needs to be characterized
and quantified.
Observations from various studies
(Chen, 2009) observed that although there were no significant changes in lignin content during
ensilage, polysaccharide content was progressively changing with a corresponding increase in
WSC denoting possible hydrolytic reactions in enzyme-ensiled samples. Ren (2006) observed
cellulose and hemicelluloses decomposition of 2-6% and 7-17% respectively in silage controls
(without enzymes) suggesting that plain silage has some pretreatment and hydrolytic potential.
Also in support of the hydrolytic potential of ensilage are Linden et al. (1987) Hen and Linden
(1994), Sheperd et al. (1995), Nadeau et al. (1996), Richard et al. (2001), and Digman et al.
(2007). Nadeau et al. (1996) showed that lignin was solubilized during rumen digestion of
ensiled forage, and this solubilization was possibly caused by modification of the ligno-
hemicellulose complex during silage hydrolysis of cellulose.
2.7 Modeling wet storage processes and logistics
A number of ensilage (wet storage) process models have been developed to simulate the
biochemical and microbial processes and changes taking place during storage. These models
(Pitt et al., 1985; Pitt, 1986, Mani et al., 2006; Ren, 2006; Chen, 2009) look at dynamic behavior
of silage microbes, dynamics of pH and water soluble carbohydrates, the effect of air infiltration
on dry matter losses, rate of dry matter loss, hydrolysis of feed stock when enzymes are used as
additives and the prediction of silage quality based on microbial population and silage acids.
These models are useful in elucidating the wet storage process and define general expectation of
the storage process. However, a greater concern is the impact of wet storage on biomass logistics
process. Logistics is a greater concern because wet storage for biofuel production has been
proposed as a value enhancing storage option. The transportation of low value water over long
distances to a biorefinery, however presents justifiable economic concerns.
A number of biomass supply studies, projects and logistics models have been developed to
elucidate and in some cases address biomass supply chain challenges. Most of these models are

40
prescriptive in nature suggesting or recommending the nature of expected collaborative
relationship and task distribution/coordination among players in the lignocellulosic biofuel
industry. These models also predict potential scenarios that would make techno-economic sense
in the production of ethanol. Generally, the whole logistics chain is considered, from harvest to
delivery at the biorefinery. These models usually embrace multiple farms and storage units
required to meet biorefinery annual feedstock demands. Some models place emphasis on
particular section of the supply chain, e.g. Ebadian et al. (2013) focus on analyzing storage
systems and their impact on cost incurred by various actors in the supply chain. Most models
assume farmer ownership of specialized harvesting equipment, which in farms less than 500
acres, may not be economically advisable (Brechbill and Wallace, 2008). One limitation in
current logistics models is the focus on dry storage systems. Also, in cases where moisture
content or dry matter loss inputs/parameters are required, most models use a single value.
Logistics model output estimates in the literature include: biomass delivery cost (Sokhansanj et
al., 2006; Kumar and Ileleji, 2009; Morey et al., 2010); Farm-gate or storage to biorefinery truck
traffic (Kumar and Ileleji, 2009); cost effectiveness of different feedstock types and formats
(Kumar and Ileleji, 2009; Ebadian et al., 2011); energy input and carbon/GHG emissions
(Sokhansanj et al., 2006; Morey et al., 2010); dry matter loss and feedstock moisture
(Sokhansanj et al., 2006); duration of logistics operations (Sokhansanj et al., 2006; Ebadian et
al., 2011); optimum number and optimum locations of storage systems, optimum radius of
supply or optimum locations and capacity of the biorefinery (Judd et al., 2010; Marvin et al.,
2011; Brownell and Liu, 2012; Cundiff and Grisso, 2012).
2.8 Summary of state of the art
Cellulosic biofuel research has been in progress for over 35 years. However, not until the last
decade and half has the research focus shifted from overcoming the recalcitrant nature of
feedstock to other issues necessary for the sustainability and techno-economic feasibility
required to facilitate industrial commercialization. One of the areas that have received
considerable attention in the last 8 to 10 years is feedstock acquisition and logistics, which has
exposed the immense challenges that collection, storage and transportation of feedstock present.
One of the ways in which these challenges can be addressed is through the adaptation of wet

41
storage systems, traditionally known as ensilage. Some of the major attractions of wet storage are
the prevention of potential fires associated with dry storage, the natural pretreatment ability of
silage, and the possibilities it holds for manipulation of feedstock to enhance downstream
processing – especially through very low severity pretreatment over the storage period.
Only a few studies have investigated silage application in the biofuel industry both as storage
and as a value enhancing pretreatment tool for ethanol production. These few studies show
ensilage has the ability to reduce dry matter losses, loosen cell wall structures, hydrolyze
cellulose and hemicelluloses and increase fiber reactivity. Some of the research findings thus far
indicate the possibility of obtaining up to 42% sugar yield for ensiled feedstock without
subsequent pretreatment. However, the interactions of silage products like organic acids with
downstream processes have not been characterized. Structural images show ensilage probably
affects feedstock in a similar manner to dilute acid pretreatment, although to a lesser extent.
More detailed quantitative investigations to fully characterize the impact on solid fractions and
downstream processes are needed. Previous studies all suggest that it would rarely be possible
for silage systems to be manipulated so that subsequent pretreatment and hydrolysis would not
be necessary. There is some promise, though, that ensilage could enhance the impact of
conventional pretreatment of feedstock and perhaps even eradicate the need for subsequent
hydrolysis (Thomsen et al., 2008).
Although, ensilage has great potential as a value-enhancing storage system, results have not
always been consistent. This is particularly seen in the differences in response of different
feedstocks to ensilage. This is not surprising, considering the highly heterogeneous composition
within and among feedstocks, which makes even the more familiar conventional material
handling and pretreatment processes a challenge. These different responses raise the question of
silage quality and fairness in transaction between producers and buyers. Some issues that might
still need to be addressed to establish the potential of silage include: (1) What are the optimum
conditions at which ensilage could serve as effective pretreatment tool, and can yields
comparable to conventional pretreatment methods be realized? (2) Do the products of ensilage
enhance or inhibit downstream processes and to what extent? How are the effects exhibited and
at what stage of the downstream process: reduced hydrolytic yields, delayed fermentation or

42
reduced fermentation yields? (4) What are the possibilities of modifying ensilage so that
subsequent pretreatment or hydrolysis is no longer required? (5) Are there are any consistencies
within the inconsistencies presented by various feedstock, handling methods, process and
environmental factors? (6) How can these inconsistencies be eliminated or managed to reduce
upstream process challenges and ensure more predictable downstream process outcomes (7)
What is the right post storage processing to complement the partial pretreatment or hydrolysis
achieved through ensilage, so as to maximize the cost saving potential of silage altered
feedstock? (8) How can we evaluate quality of ensilage and accurately predict ethanol yield (9)
What is an appropriate and robust standard or quality indicator that can facilitate fair transaction
between producers and buyers.
This dissertation intends to address some of these issues by investigating how wet storage, in
particular organic acid production in unamended silages, affects downstream processing and how
that can translate to cost savings or other benefits. Although fresh feedstock is ideally the best for
bioprocessing, it is not a practical option for seasonal feedstocks. There is, however, the
possibility that ensilage can attain values superior to the original fresh crop in the future
(Charmley, 2000) if systematically designed.
2.9 References
Alt, B.C. 2005. Restoration after recent hurricanes and other natural disasters:
Federal role in recovery after catastrophic events affecting forest lands. Available at:
http://republicans.resourcescommittee.house.gov/archives/ii00/archives/109/testimony/20
05/brucealt.htm Accessed 30 January 2009.
Aman, P. 1993. Composition and structure of cell wall polysaccharides in forages. In Forage
Cell Wall and Digestibility, 347-376. H.G. Jung, D.R. Buxton, R.D. Hatfield and J. Ralph
(ed.). Madison, WI.: ASA-CSSA-SSSA.
Amaral-Phillips, D. M. 2009. Important Steps When Harvesting Corn Silage. University of
Kentucky Factsheet. Available at
http://www.uky.edu/Ag/AnimalSciences/dairy/extension/nut00114.pdf Accessed 08
October 2008.
Anonymous. 2009? Plant cell walls and their role in growth and development: An introductory
lecture. Available at

43
http://www.mnstate.edu/biotech/Microsoft%20Word_Plant%20cell%20walls%20and%2
0their%20role%20in%20growth%20and%20development.pdf Accessed 10 August 2009.
ASABE.
Atchison, J. E. and J. R. Hettenhaus. 2004. Innovative Methods for Corn Stover Collecting,
Handling, Storing and Transporting. Available at
http://www.nrel.gov/docs/fy04osti/33893.pdf Accessed 27 August 2008.
Ayers, A. 2009. Hydrogen Bonds Form Biological Structures. Available at
http://biochemistry.suite101.com/article.cfm/hydrogen_bonds_form_biological_structure
s Accessed 31 July, 2009.
Bailey, L. H. 1911. Cyclopedia of American agriculture: vol. II—crops. 3rd
e.d. New York:
Macmillan
Brechbill S. C. and T. E. Wallace. 2008. The economics of biomass collection, transportation,
and supply to indiana cellulosic and electric utility facilities. Department of Agricultural
Economics, Purdue University. Available at
http://ageconsearch.umn.edu/bitstream/6148/2/wp080003.pdf Accessed 10 June, 2013
Charmley, E.2000. Towards Improved Silage Quality – A Review. Available at
http://www1.foragebeef.ca/$foragebeef/frgebeef.nsf/all/frg68/$FILE/improved_silage.pdf
Accessed 19 July 2009.
Chen, C., R. Sharma-Shivappa, Y. Chen, D. Wichman and D. Johnson. 2007. Potential of annual
cereal crops to serve as fuel ethanol feedstock and livestock feed. Issues in New Crops
and New Uses: 47-55. Available at
http://www.hort.purdue.edu/newcrop/ncnu07/pdfs/chen47-55.pdf Accessed 8 March
2009.
Chen, Q. 2009. Ensiling corn stover with enzymes as a feedstock preservation method for
bioconversion. PhD Dissertation. University Park, Pennsylvania: The Pennsylvania State
University, Department of Agricultural and Biological Engineering.
Chen, Y., R. R. Sharma-Shivappa and C. Chen. 2007. Ensiling Agricultural Residues for
Bioethanol Production. Appl Biochem Biotechnol 143:80–92
Chesson, A. 1993. Chapter 14: Mechanistic models of forage cell wall degradation. In Forage
Cell Wall and Digestibility, 347-376. H.G. Jung, D.R. Buxton, R.D. Hatfield and J. Ralph
(ed.). Madison, WI.: ASA-CSSA-SSSA.
Cooper, A. 2007. Katrina still impacts state’s forest industry. Available at:
http://msucares.com/news/print/fwnews/fw07/070830.html Accessed 30 January 2009.

44
Cundiff, J. S. , and R. D. Grisso. 2012. In-field operations to deliver biomass to a biorefinery .
Agricultural Engineering International: CIGR Journal 14(4): 115 – 122
Dhuyvetter, K. C., T. L. Kastens, and M. Boland. 2005. The U.S. Ethanol Industry: Where will it
be located in the future? Agricultural Issues Center, University of California. Available at
http://www.agmrc.org/media/cms/ethanolcalifornia_32FC25414B89D.pdf Accessed on
02 February 2009.
Digman, M.F., K J. Shinners, B. S. Dien, R. D. Hatfield, X. Li, R. E. Muck, P. J. Weimer. 2007.
On-farm Pretreatment Technologies for Improving Enzymatic Degradability of Cellulose
and Hemicellulose Present in Perennial Grass. ASABE Paper No. 071021. St. Joseph,
Mich.: ASABE.
DOE. 2008. Energy timeline. DOE History –timeline. Available at
http://www.energy.gov/about/timeline1971-1980.htm Accessed 30 January 2009.
DoKyoung, L., V. N. Owens, A. Boe and P. Jeranyama. 2007. Composition of Herbaceous
Biomass Feedstocks. North Central Sun Grant Center SGINC1-07.
Donohoe, B., T. Haas, N. Wiess, S. Ding, N. Nagle, and M. Himmel. 2009. Evaluation of plant
cell wall structure of ensiled corn stover by correlative microscopy. NREL/PO-270-
44906. Poster presentation at the 31st Symposium on Biotechnology for Fuels and
Chemicals, May 3-6, 2009. San Francisco, CA.
Ebadian, M., T. Sowlati, S. Sokhansanj, M. Stumborg and L. Townley-Smith. 2011. A new
simulation model for multi-agricultural biomass logistics system in bioenergy
production. Biosystems Engineering 110(3): 280-290.
Elander, R. T., C. E. Wyman, B. E. Dale, M. T. Holtzapple, M. R. Ladisch, Y. Y. Lee, and T.
Eggeman,. 2005. Initial comparative process economics of leading pretreatment
technologies. Available at http://www.eri.ucr.edu/ISAFXVCD/ISAFXVPP/InCPELB.pdf
Accessed 27 August 2008.
Energy Policy Act of 2005. 2005. One Hundred Ninth Congress of the United States of America
Available at http://frwebgate.access.gpo.gov/cgi-
bin/getdoc.cgi?dbname=109_cong_bills&docid=f:h6enr.txt.pdf Accessed 2 February
2009.
Grozdits, G. A. 1997. Biological treatment and storage method for wet bagasse for year-round
biomass supply. Newsletter of the International Cane Energy Network. Available at
http://www.scribd.com/doc/7027056/Bagasse-as-Alternate-Fuel Accessed 11 November
2008.

45
Hancock, D. 2009. Harvesting and curing high-quality hay. Available at
http://www.progressivedairy.com/hg/features/2009/0309/0309_hancock.html Accessed
10 August 2009
Hartwig, N. R. 2005. Nitrate Toxicity. Available at
http://www.extension.iastate.edu/ag/drought/NitrateToxicity.pdf Accessed 22 July 2009.
Henk L. L. and J. C. Linden. 1996. Solid-state production of ethanol from sorghum. Applied
Biochemistry and Biotechnology. 57/58: 489 -501
Henk, L. L. and J.C. Linden. 1994. Silage processing of forage biomass to alcohol fuel, in
Enzymatic conversion of biomass for fuels production. Himmel, M. E., J. O. Baker and R.
P. Overend. ACS symposium series 556: 391 – 410.
Hess, J. R., C. T. Wright, and K. L. Kenney. 2007. Cellulosic biomass feedstocks and logistics
for ethanol production. Biofuels, Bioprod. Bioref. 1:181–190
Independent. 2007. Fire Destroys Reinhardt’s Barn In Rural Red Bud. Monroe County
Independent E-News letter- June 22, 2007. Available at
http://www.mocountyillinois.com/newsletters/2007%20ENewsletters/06_June%202007/2
0070622.htm Accessed 09 July 2009.
Ingledew, W.M. (2003). Chapter 24: Water Reuse in Fuel Alcohol Plants: Effect on
Fermentation: Is a “Zero Discharge” Concept Attainable? In The Alcohol Textbook. 4th
Edition. 343 – 354. Jacques, K.A.; Lyons, T.P.; Kelsall, D.R. (Eds.): Nottingham
University Press, Thrumpton,
Jeranyama, P. and A. D. Garcia. 2004. Understanding Relative Feed Value (RFV) and Relative
Forage Quality (RFQ). Extention Extra. South Dakota State University. Available at
http://agbiopubs.sdstate.edu/articles/ExEx8149.pdf Accessed 17 January 2009
Jones, C. M., A. J. Heinrichs, G. W. Roth, and V. A. Ishler. 2004. From harvest to feed:
understanding silage management. Agricultural Research and Cooperative Extension.
The Pennsylvania State University
Jonsson, M. 2004. Wet Storage of roundwood – Effects on wood properties and treatment of run-
off water. PhD dissertation. Acta Universitatis agriculturae Sueciae. Silvestria vol. 319.
Department of Forest Products and Markets, SLU.
Judd, J. D., S. C. Sarin, J. S. Cundiff and R. D. Grisso. 2010. An optimal storage and
transportation system for a cellulosic ethanol bio-energy plant. ASABE Paper No.
1009413. St. Joseph, Mich.: ASABE.
Kallenbach, R., C. Roberts, and G. Bishop-Hurley. 2001. Warm-Season Annual Forage Crops.
MU extension, University of Missouri-Columbia Available at

46
http://extension.missouri.edu/explorepdf/agguides/crops/g04661.pdf Accessed 20 July
2009.
Kimball, J. W. 2003. Hydrogen bonds. Available at
http://users.rcn.com/jkimball.ma.ultranet/BiologyPages/H/HydrogenBonds.html
Accessed 10 August 2009.
Kimbrough, L. 2009. Forage Quality Grazing and Hay. Available at
http://msucares.com/pubs/infosheets/is1012.htm Accessed 23 July 2009.
Klinke H. B., A. B. Thomsen and B. K. Ahring. 2004.Inhibition of ethanol-producing yeast and
bacteria by degradation products produced during pre-treatment of biomass. Appl
Microbiol Biotechnol 66: 10–26
Knauf, M. and K. Kraus. 2006. Specific yeasts developed for modern ethanol production.
Spezielle Hefen für die Ethanolgewinnung 131: 753-758
Knicky, M. 2005. Possibilities to improve silage conservation - effects of crop, ensiling
technology and additives. Doctoral thesis. Swedish University of Agricultural Sciences,
Uppsala
Koegel, R. G., H. K. Sreenath and R.J. Straub. 1997. Liquid Hot Water (LHW) Pretreatment of
Alfalfa Fiber Destined for Ethanol Production. Available at
http://www.dfrc.wisc.edu/RS97_pdfs/FH5.pdf Accessed 17 September 2008
Kram, J.W. 2008. In Search Of Biomass Storage Solutions. Available at
http://www.ethanolproducer.com/article.jsp?article_id=3623 Accessed 01 August 2009.
Kumar, P. K. and K. E. Ileleji. 2009. Techno-economic analysis of the transportation, storage
and handling requirements for supplying lignocellulosic biomass feedstocks for ethanol
production. ASABE Paper No. 097427. St. Joseph, Mich.: ASABE.
Liese, W. and K. Walter. 1978. Deterioration of bagasse during storage and its prevention.
IUFRO – Meeting: Actual trends of wood preservation research in tropical America.
Subject group S.5.03 Wood Protection. Available at
http://ojs.c3sl.ufpr.br/ojs2/index.php/floresta/article/viewFile/6229/4444 Accessed 7
February 2009.
Linden, J. C., L. L. Henk, V. G. Murphy, D. H. Smith, B. C. Gabrielsen, R. P. Tengerdy and L.
Czako. 1987. Preservation of Potential Fermentables in Sweet Sorghum by Ensiling.
Biotechnology and Bioengineering 30:860-867.
Liska, A. J., H. S. Yang, V. R. Bremer, T. J. Klopfenstein, D. T. Walters, G. E. Erickson, and K.
G. Cassman. 2009. Improvements in life cycle energy efficiency and greenhouse gas

47
emissions of corn-ethanol. Journal of Industrial Ecology 13(1): 58-74. Available at
http://www3.interscience.wiley.com/cgi-bin/fulltext/121647166/PDFSTART Accessed
14 February 2009.
Lowe, B. 1937. Effect of acid upon sugars and hydrolysis of sugars. Available at
http://chestofbooks.com/food/science/Experimental-Cookery/Effect-Of-Acid-Upon-
Sugars-And-Hydrolysis-Of-Sugars.html Accessed 13 August 2009.
Lund, B. M and T. Eklund. 2000. Control of pH and use of organic acids. In The microbiological
safety and quality of food, Volume 1; Part 1: Principles and Applications of Food
Preservation Techniques 175-199. Lund, B. M, T. C. Baird-Parker, G.W. Gould. Aspen
publishers, Inc.
Lynd, L.R. 1996. Overview and evaluation of fuel ethanol from cellulosic biomass: technology,
economics, the environment, and policy. Annual Reviews of Energy Environments 21:
403-465.
Mani, S., J. Patterson, X. Bi. 2006. Modeling of the wet storage of biomass. ASABE Paper No.
061014. St. Joseph, Mich.: ASABE.
Marais J. P., J. J. Therion, R.I. Mackie, A. Kistner, and C. Dennison. 1988. Effect of nitrate and
its reduction products on the growth and activity of the rumen microbial population.
British Journal of Nutrition 59: 301-313.
Mark, F. R. and S. R. Thomas. 2003. The Effect of Corn Stover Composition on Ethanol Process
Economics. National Renewable Energy Laboratory. Available at
http://www1.eere.energy.gov/biomass/pdfs/34040.pdf Accessed 13 June 2008.
Marvin, A. W., L. D.Schmidt, S. Benjaafar, D. G. Tiffany and P. Daoutidis. 2012. Economic
optimization of a lignocellulosic biomass-to-ethanol supply chain. Chemical Engineering
Science 67(1): 68-79
MBJ. 2006. Post-Katrina timber? $1.1 billion in costs, lost dreams. Available at
http://goliath.ecnext.com/coms2/gi_0199-5505201/Post-Katrina-timber-1-1.html
Accessed 30 January 2009.
McDonald, P. A. R. Henderson, and S. J. E. Heron. 1991. The Biochemistry of Silage, 2nd ed.
Marlow, Bucks, UK: Chalcobe Publications.
MDC (Missouri Department of Conservation) 2009. Grasslands:managing Missouri's hay
prairies. Available at http://mdc.mo.gov/landown/grass/hay/ Accessed 23 July 2009.

48
Mickan, F. 2008. Tricks for ensiling forage sorghums. Available at
http://www.afia.org.au/information/technical_notes/Tricks%20for%20ensiling%20forage
%20sorghums%2017%2009%2008.pdf Accessed on 19 July 2009.
Miles, M. 1895. Silos, ensilage and silage: a practical treatise on the ensilage of fodder corn.
New York: Orange Judd Company.
Min, D. and R. Leep. 2007. Nitrate Toxicity in Drought-Stressed Forage Crops. Available at
http://web1.msue.msu.edu/fis/extension_documents/nitrate%20toxicity%20in%20drough
t%20stressed%20forages%20(August,%2007).doc. Accessed 20 July 2009.
Montgomery, E.G. 1913. The corn crops. The Rural Test Book Series. L.H. Bailey. New York:
The Macmillan Company.
Mosier, N., C. Wyman, B. Dale, R. Elander, Y.Y. Lee, M. Holtzapple, and M. Ladisch. 2005a.
Features of promising technologies for pretreatment of lignocellulosic biomass.
Bioresource Technology 96: 673–686. Available at http://i-
farmtools.org/ref/Mosier_et_al_2005.pdf Accessed 13 August 2009.
Mosier, N., R.Hendrickson, N. Ho and M. Ladisch. 2005b. Optimization of pH controlled liquid
hot water pretreatment of corn stover. Bioresource Technology 96: 1986–1993.
Muck, R. 1996. Inoculation of silage and its effects on silage quality. Available at
http://www.dfrc.wisc.edu/Research_Summaries/ind_meet/dfrc7.pdf Accessed 28 July
2009.
Muck, R.E., J.G. Coors, T. L. Richard, and M.P. Scott. 2008. Effect of treatment and cultivar on
the ensiling of corn stover. ASABE paper No. 085001. St. Joseph, Mich.:
Mukunda, A., K. E. Ileleji and H. Wan. 2006. Simulation of corn stover logistics from on-farm
storage to an ethanol plant. ASABE Paper No. 066177. St. Joseph, Mich.: ASABE
Nadeau, E.M.G., D.R. Buxton, E. Lindgren, and P. Lingvall. 1996. Kinetics of cell wall
digestion of orchard grass and alfalfa silages treated with cellulase and formic acid. J.
Dairy Sci.79: 2207-2216. Available at http://jds.fass.org/cgi/reprint/79/12/2207 Accessed
25 July 2009.
NAFA (National Alfalfa and Forage Alliance). 2007. Initiative to develop alfalfa as a feedstock
for bioenergy and bioproducts production. Available at
http://www.alfalfa.org/pdf/2007SGWhitepaper.pdf Accessed 20 July 2009.
Nevins, D. J. 1993. Analysis of forage cell wall polysaccharides. In Forage Cell Wall and
Digestibility, 347-376. H.G. Jung, D.R. Buxton, R.D. Hatfield and J. Ralph (ed.).
Madison, WI.: ASA-CSSA-SSSA.

49
Newark Advaocate. 2009. Fire in Washington Twp. barn caused by spontaneous combustion.
Available at http://www.newarkadvocate.com/article/20090709/NEWS01/907090367/-
1/NEWS/Fire-in-Washington-Twp.-barn-caused-by-spontaneous-combustion Accessed
09 July 2009.
Norell, R. J, M. Chahine, and P. Bread. 2007. Ensiling fresh beet pulp. University of Idaho
Extension .
NREL, 2008. Biochemical Conversion Technologies – Projects. Available at
http://www.nrel.gov/biomass/proj_biochemical_conversion.html Accessed 24 July 2009.
O’Neill, M. A., D. Warrenfeltz, K. Kates, P. Pellerin, T. Doco, A. G. Darvill, and P. Albersheim.
1996. Rhamnogalacturonan-II, a pectic polysaccharide in the walls of growing plant cell,
forms a dimer that is covalently cross-linked by a borate ester. The Journal of Biological
Chemistry 271(37): 22923 -22930. Available at
http://www.jbc.org/cgi/reprint/271/37/22923 Accessed 13 August 2009.
Palmqvist, E. and B. Hahn-Hägerdal. 2000. Fermentation of lignocellulosic hydrolysates. II:
inhibition and detoxification. Bioresource Technology 74(1): 25-33
Palmqvist, E., B. Hahn- Hägerdal, M. Galbe, and G. Zacchi. 1996. The effect of water-soluble
inhibitors from steam-pretreated willow on enzymatic hydrolysis and ethanol
fermentation. Enzyme and Microbial Technology 19:470-476
Pan, X., L. Shuai, Q. Yang and J.Y. Zhu. 2009. SPORL: an Effective and Robust Pretreatment
Technology of Woody Biomass for Ethanol Production. Poster presentation at the 31st
Symposium on Biotechnology for Fuels and Chemicals. San Franscisco. May 3-6, 2009
Perlack R.D., L.L. Wright, T.F. Anthony, R.L. Graham, B.J. Stokes, D.C. Erbach. 2005. Biomass
as feedstock for a bioenergy and bioproduct industry: the technical feasibility of a billion-
ton annual supply. Report DOE/GO-102005-2135, Oak Ridge National Laboratory.
Pitt R. E, Muck R. E, Leibensperger R. Y. 1985. A quantitative model of the ensilage process in
lactate silage. Grass and Forage Science 40: 279-303
Pitt, R. E. 1986. Dry matter losses due to oxygen infiltration in silos. Journal of Agricultural
Engineering Research 35(3):193-205
Provin, T.L. and J.L. Pitt. 2003. Nitrates and Prussic Acid in Forages. Texas cooperative
extention. Available at http://forages.tamu.edu/PDF/Nitrate.pdf Accessed 21 July 2009.
Raclavská, H., D. Juchelková, and V. Roubíček. 2007. Utilization of Biomass and Mixtures for
the Gas Production. International Conference on Engineering Education, Coimbra,

50
Portugal. September 3 -7, 2007. Available at
http://icee2007.dei.uc.pt/proceedings/papers/659.pdf Accessed 24 July 2009.
Ren, H. 2006. Effect of cell wall degrading enzymes and chemicals on corn stover preservation
and pretreatment during ensilage processing. PhD Dissertation. University Park,
Pennsylvania: The Pennsylvania State University, Department of Agricultural and
Biological Engineering.
Richard, T. L. S. Proulx, K. J. Moore, and S. Shouse. 2001. Ensilage technology for biomass pre-
treatment and storage. ASAE paper No. 016019. St. Joseph, Mich.: ASAE.
Ronnau K., D. Guth and W. V. Engelhardt. 1989. Absorption of dissociated and undissociated
short-chain fatty acids across the colonic epithelium of guinea-pig. Quarterly Journal of
Experimental Physiology 74: 511-519
Rook, A.J. and M. Gill. 1990. Prediction of the voluntary intake of grass silages by beef cattle 1.
Linear regression analyses. Anim. Prod. 50: 425–438.
Russell, J.R., N.A. Irlbeck, A.R. Hallauer, and D.R. Buxton. 1992. Nutritive value and ensiling
characteristics of maize herbage as influenced by agronomic factors. Anim. Feed Sci.
Technol. 38:11-24.
Sakai, S., Y. Tsuchida, S. Okino, O. Ichihashi, H. Kawaguchi, T. Watanabe, M. Inui and H.
Yukawa. 2007. Effect of lignocellulose-derived inhibitors on growth of and ethanol
production by growth-arrested Corynebacterium glutamicum R. Applied and
Environmental Microbiology, 73(7): 2349–2353
Schechinger, T. 2008. Corn Stover Collection Methods - Present and Future. Available at
http://www.p2pays.org/ref/38/37710.pdf Accessed 8 October 2008.
Schroeder, J. W. 2004. Haylage and Other Fermented Forages. North Dakota State University:.
AS-1252. Available at http://www.ag.ndsu.edu/pubs/ansci/dairy/as1252w.htm
Accessed 15 August 2009.
Sheehan, J., S. Thomas, J. McMillan, B. Hames, D. Templeton. 2001. Corn stover—what do we
know about what makes a good feedstock? Available at
bioenergy.ornl.gov/02workshop/sheehan.ppt Accessed 10 August2009.
Sheperd, A. C., M. Maslanka, D. Quinn and L. Kung. 1995. Nutrition, feeding, and calves:
additives containing bacteria and enzymes for alfalfa silage. J Dairy Sci 78 (10):565-572.
Available at http://www.dairy-science.org/cgi/reprint/78/3/565.pdf Accessed 24 July
2009.

51
Shinners, K. J., B. N. Binversie, and P. Savoie. 2003. Harvest and storage of wet and dry corn
stover as a biomass feedstock. ASAE paper No. 036088. Las Vegas, NV: ASAE.
Shinners, K.J. B. N. Binversie, R.E. Muck and P.J. Weimer. 2007. Comparison of wet and dry
corn stover harvest and storage. Biomass and Bioenergy 31: 211-221.
Sluiter, A.D., T.K. Hayward, C.K. Jurich, M.M. Newman, D.W. Templeton, M.F. Ruth, K.W.
Evans, B.R. Hames and S.R. Thomas. 2000. Compositional variability among corn stover
samples. National Renewable Energy Laboratory, Colorado.
Sokhansanj, S., A., Kumar and A. F. Turhollow. 2006. Development and implementation of
integrated biomass supply analysis and logistics model (IBSAL).Biomass and
Bioenergy 30(10): 838-847
Spoelstra, S. F. 1983. Inhibition of clostridial growth by nitrate during the early phase of silage
fermentation. Journal of the Science of Food and Agriculture 34 (2): 145 -152.
Steen, R.W.J., F.J. Gordon , L.E.R. Dawson , R.S. Park, C.S. Mayne, R.E. Agnew, D.J.
Kilpatrick, and M.G. Porter. 1998. Factors affecting the intake of grass silage by cattle
and prediction of silage intake. Anim. Sci. 66: 115-127.
Stenberg, K., M. Galbe and G. Zacchi. The influence of lactic acid formation on the
simultaneous saccharification and fermentation (SSF) of softwood to ethanol. Enzyme
and Microbial Technology 26 : 71–79
Stoddart, B. 2007. The structures of plant tissues and the effects of drying and fluid preservation
upon them. NatSCA News 11: 38-43. Available at
http://www.nhm.ac.uk/hosted_sites/natSCA/training/seminars/BS1.pdf Accessed on 23
July 2009.
Sun, Y., and J. Cheng. 2002. Hydrolysis of lignocellulosic materials for ethanol production: a
review. Bioresource Technology 83: 1-11.
Taherzadeh, M. J., C. Niklasson and G. Liden. 1997. Acetic acid friend or foe in anaerobic batch
conversion of glucose to ethanol by Saccharom yces cerevisiae? Chemical Engineering
Science, 52 (15): 2653 - 2659
Theander, O. and E. Westerlund. 1993. Quantitative analysis of cell wall components. In Forage
Cell Wall and Digestibility, 347-376. H.G. Jung, D.R. Buxton, R.D. Hatfield and J.
Ralph. Madison, WI.: ASA-CSSA-SSSA.
Thomas, K. C., S. H. Hynes, and W. M. Ingledew. 2002. Influence of Medium Buffering
Capacity on Inhibition of Saccharomyces cerevisiae Growth by Acetic and Lactic Acids.
Applied and Environmental Microbiology, 68(4): 1616–1623

52
Thomas. S. R. 2005. Corn stover variability. Available at
http://feedstockreview.ornl.gov/pdf/thomas/session3_thomas.pdf Accessed 11 November
2008.
Tímár-Balázsy, Á., and D. Eastop. 1998. Chemical principles of textile conservation.
Butterworth-Heinemann series in conservation and museology. Wosbon, MA. Elsevier
Science Ltd.
Torija, M. J., G. Beltran, M. Novo, M. Poblet, N. Rozes, A. Mas, and J. M. Guillamon. 2003.
Effect of organic acids and nitrogen source on alcoholic fermentation: study of their
buffering capacity. J. Agric. Food Chem. 51(4): 916–922
van Zyl, W. H., L. R. Lynd, R. den Haan, J. E. McBride. 2007. Consolidated bioprocessing for
bioethanol production using Saccharomyces cerevisiae. Adv Biochem Engin/Biotechnol
108: 205–235
Voragen, A.G.J., W. Pilnik, J. Thibault, M.A.V. Axelos, and C.M.G.C. Renard. 1995. Pectin. In
Food Polysaccharides and their Applications, 287 -341. A.M. Stephen ed. New York:
Marcel Dekker Inc.
White, B. A., R.I. Mackie, and K.C. Doerner. 1993. Enzymatic hydrolysis of forage cell walls. In
Forage Cell Wall and Digestibility, 347-376. H.G. Jung, D.R. Buxton, R.D. Hatfield and
J. Ralph (ed.). Madison, WI.: ASA-CSSA-SSSA.
Wittgreve, R . 2009. Sweet sorghum FAQs. National Sweet Sorghum Producers and Processors
Association. Available at http://www.ca.uky.edu/NSSPPA/sorghumfaqs.html Accessed
18 July 2009.
Wyman C. E., Y. Y. Lee, B. E. Dale, T. Eggeman, R. T. Elander, M. R. Ladisch, and M. T.
Holtzapple. 2003. Comparative data from application of leading pretreatment
technologies to corn stover. Available at
http://www1.eere.energy.gov/biomass/pdfs/34861.pdf Accessed 27 August 2008.
Wyman, C. 1999. Biomass ethanol: technical progress, opportunities, and commercial
challenges. Annu. Rev. Energy Environ. 24:189–226 Available at
http://www.wilsoncenter.org/news/docs/Biomass%20ethanol.pdf Accessed 02 February
2009.
Wyman, C. E. 2008. Pretreatment strategies for cellulose biomass. Penn State Cellulosic
Biomass Short Course. 9 June 2008. Philadelphia
Young, R. A. and M. Akhtar. 1998. Environmentally friendly technologies for the pulp and
paper industry. John Wiley and Sons.

53
Zaldivar, J. and L. O. Ingram. 1999. Effect of organic acids on the growth and fermentation of
ethanologenic Escherichia coli LY01. Biotechnology and Bioengineering 66(4): 203 -210
Zheng, Y., Z. Pan and R. Zhang. 2009. Overview of biomass pretreatment for cellulosic ethanol
production. Int J Agric & Biol Eng 2(3): 51- 68

54
Chapter 3
Corn stover evaluation after wet storage: relating storage conditions to
storage outcomes
Abstract
As interest in wet storage of biomass feedstock for biofuel production increases, so do concerns
about feedstock quality under various storage conditions. Of particular concern is the impact of
different storage moisture levels on dry matter loss and biomass composition. Challenges in
meeting quality requirements could discourage farmers’ participation in supply chains and
impact biofuel feedstock cost and supply. This would potentially affect the commercial viability
of the industry. A major question is whether farmers have to control the moisture of biomass
going into storage as well as storage conditions in order to achieve desired feedstock quality.
This is important as it would define the harvesting and collection window, since harvesting at the
proper moisture is less costly than trying to change biomass moisture after harvest by either
drying or wetting. This paper addresses this question and a broader logistic concern by
examining corn stover under different wet storage conditions. The results shows anaerobic wet
storage (e.g. ensilage) offers farmers more flexibility than aerobic dry storage (e.g. hay), since
feedstock compositional changes under anaerobic conditions are more consistent under a wider
range of moisture levels and storage conditions, and dry matter loss is generally less. Since
transportation cost is likely to increase with moisture and quality of feedstock is likely to remain
the same, the restrictions on moisture in anaerobic storage systems will be influenced by
economic tradeoffs [of transportation] rather than feedstock quality. Under a decentralized on-
farm biofuel processing system, storage moisture would be of little significance both in terms of
quality and economics. Such a decentralized system is currently not techno-economically
feasible.
Key words: Corn stover, ensilage, wet storage, dry matter loss, hemicelluloses, biofuels, organic
acids

55
3.1 Introduction
Corn stover is a lignocelluosic feedstock abundantly accessible in the U.S. Stover is the above
ground residue after the grains are harvested from corn plants, and it constitutes about a fourth of
the total agricultural residue produced in the U.S. Lignocellulosic feedstocks are non-food, plant-
based resources, and compare favorably relative to corn grain in most environmental
sustainability analyses of biofuel production (Farrel et al., 2006; Edwards et al., 2008; Fagione et
al., 2008; Searchinger et al., 2008; Liska et al., 2009). These lignocellulosic sources include
agricultural residues, forest products/residues, and energy crops. Lignocellulosic fuels are
expected to play a key role in U.S. energy security by reducing dependence on foreign oil in the
future. Until the last decade, most lignocellulosic biofuel research has focused primarily on
enzyme prospecting and manipulation, pretreatment options and fermentation technologies, all
aimed at economically maximizing biofuel output from the highly recalcitrant lignocellulosic
feedstocks. Implicit to this prioritization was the assumption that large supplies of feedstock
would be inexpensive and readily available whenever the technical challenges of conversion
technologies were solved. This assumption overlooked logistics and supply chain management
issues, which embraces techno-economic challenges of production, harvesting, collection,
storage, and transportation to the refinery. The critical influences of these factors are seen in
estimates of feedstock cost, which constitutes the largest cost component, 35-50% of total
production cost (Lynd, 1996; Hess et al. 2007). More recent estimates, for 2010, estimated
feedstock cost as 27% of ethanol selling price and projected its share to be 34% in 2012
(Humbird et al., 2011). These issues must be addressed to ensure long time sustainability of
lignocellulosic biofuels, economic competitiveness and the rate at which the industry grows
(Hess et al. 2007; Murano, 2007; Bevill, 2011; DOE/EERE, 2012).
This study, therefore, focuses on aspects of logistics related to wet storage, and its impacts on
feedstock composition and variability. Wet storage systems from several other industries (e.g.
livestock, pulp & paper, timber) have demonstrated effective preservation and enhanced end
product quality, and suggest strategies that should be considered for the biofuel industry.
Because of the low bulk density, the wet storage systems that are most applicable to the
herbaceous biofuel industry are the Ritter process and ensilage. Wet storage offers flexibility in
harvest times under different field moistures and is compatible with narrow harvest windows.

56
Richard et al. (2001) proposed the adaptation of ensilage as a wet storage method to reduce the
risk of fire outbreaks associated with dry storage of biomass and to minimize loss in
carbohydrate content of the biomass. In addition, wet storage can potentially alter feedstock
structure to enhance downstream processes. For instance, particleboard manufactured from
ensiled stover stored for 21 days showed improvements over unensiled stover with respect to
mechanical properties and dimensional stability measured by ANSI standards. However, at 189
days of storage, mechanical strength decreased and water absorption increased (Ren et al., 2006).
These outcomes at longer duration, while problematic for the particleboard industry, may be
desirable in the biofuel industry by facilitating hydrolytic reactions and requiring less severe
pretreatment downstream. Furthermore, the space requirements for wet storage could be up to
ten times less than dry storage, depending on the storage design and compaction density (Kram,
2008).
Ensilage has been used in the animal feed industry for preservation and feed enhancement for
centuries. Recommended moisture levels for ensiled storage range from 40 – 70%, depend on the
storage structure (Jones et al., 2004). Feedstock is compressed, either mechanically or by gravity
and covered to ensure anaerobic condition. Specific guidelines on cut height, chop length, filling
rate, density, moisture, additives, etc. have been developed to maintain and improve feedstock
quality and digestibility (Jones et al., 2004). Studies specific to the biofuel industry have also
suggested, indirectly, that structural changes occur during ensilage that are or may be beneficial
to subsequent processing (Linden et al., 1987; Ren, 2006; Thomsen et al., 2008; Chen, 2009). In
this study, these supposed changes are examined directly and evaluated for their significance.
The Ritter process, traditionally used for baggase storage for the pulp and paper industry, has
also been explored as an option for the biofuel industry (Atchison and Hettenhaus, 2004). This
process involves stacking water-saturated biomass in large open piles that are maintained
through recirculating of water through the pile. Anaerobic conditions are created through water
saturation recirculations, as water has a very low diffusion coefficient for oxygen. The surface of
the pile, however, is exposed to some level of aerobic activity that can result in degradation/ dry
matter loss. Applying the Ritter process to corn stover showed that some of the assumptions for

57
feedstock quality in the pulp and paper as well as livestock industry may not necessary apply to
biofuel. For instance, lactic acid dominance is recognized as necessary for well-preserved
feedstock in the livestock industry (Piltz and Kaiser, 2003). However, analysis of Ritter piles
showed there were no lactic acid producing microbes nor was there any lactic acid detected
(Atchison and Hettenhaus, 2004), yet pH values and dry matter loss were similar to and within
recommended range of well designed ensilage. Ren (2006) also observed results in which no
lactic acid was produced in plain corn stover silages. However, Ren’s (2006) pH values (5.02 -
5.23) obtained for ensiled corn stover were higher than those obtained in Atchison and
Hettenhaus’s (2004) corn stover Ritter pile (pH of 3.50 – 4.00). Fermentation products of the
corn stover Ritter process were acetic, propionic and butyric acids. Another difference related to
end use is that water soluble constituents, including soluble sugars, are undesirable in the pulp
and paper industry but essential intermediates in ethanol fermentation. The implications are: (1)
the end use goal should define what conditions constitute good practice, and (2) an appropriate
wet storage condition or outcome for biofuel production may not fit the conventional criteria that
determine quality of feedstock for the animal or paper & pulp industry.
Two main issues arise when considering wet storage options for biofuels. First, should there be
standardized conditions of storage to meet quality requirements for biofuel? Second, can wet
storage for biofuel purposes successfully embrace moisture levels outside what is typical to
accommodate the varied conditions at different regions, different cropping seasons, and different
harvest times or field moistures? The more restricted storage conditions are, the more the
demand on farmers’ attention and time for monitoring and management. This could also result in
higher cost, therefore making wet storage less attractive.
In this study, corn stover was analyzed after wet storage to determine how different storage
conditions affected dry matter loss, organic acid profiles and feedstock composition. These
outcomes can be used in defining feedstock quality with respect to biochemical biofuel
production. Of particular interest is the effect of moisture, which varies widely with location and
harvest time, and which in the livestock industry is noted to affect storage outcomes. Storage
moisture levels covering this wide range of potential harvest conditions were examined to
account for variations across different regions and fields. These includes levels outside the

58
typical 55 to 70% moisture for traditional silage process (Jones et al., 2004), in order to
determine the degree of variability in storage outcome and suitability for biofuel industry.
Experimental plans and experimental data are available in Appendix B.
3.2 Methodology
3.2.1 Stover description and storage
Corn stover was obtained in 2008 from the US Department of Energy’s Idaho National Lab (IA
(Iowa) stover) and the Penn State Dairy farm (PA (Pennsylvania) stover). The IA stover, Pioneer
brand 34A20, was conventionally harvested in fall of 2007 from the Boyd plot near Boone, IA
and field-dried for about 3 -5 days. It was raked, baled, transported to Idaho and stored indoors
with a tarp cover to prevent dust accumulation. Particle size reduction to 1 inch minus (less or
equal to 25.4 mm) was carried out in the early summer of 2008. The PA stover, Dekalb DKC54-
46, was left in the field after grain harvest in the fall of 2007 where it was exposed to weather
through the winter of 2007, and was then harvested in spring of 2008.
For both stover sources the particle size distribution was analyzed using the Penn State Forage
Particle Separator. The IA stover had ~26 % of particles greater than 19 mm, 26 % were
between 8 and 19 mm, 31 % were between 1.18 and 8 mm and 17 % were less than 1.18 mm.
The PA stover had a similar distribution; ~26 % of particles greater than 19 mm, 26 % were
between 8 and 19 mm, 37 % were between 1.18 and 8 mm and 11 % were less than 1.18 mm. A
description of this particle size separation method can be found in Heinrichs and Kononoff
(2002).
The initial moisture contents of the IA-fall harvested and PA-spring harvester stovers, ~7% and
~30% respectively, were adjusted to seven moisture levels, from 15% to 75%, in increments of
10%. All moisture measurements are reported on a wet basis (mass water/(mass of water plus dry
biomass). Moisture adjustment was accomplished by spraying with appropriate amount of water,
mixing and leaving overnight to be well absorbed into fibers. For PA 25% moisture, the stover as
received was dried and rewetted to achieve the desired moisture. The moisture adjustments were
within ±2 percentage units of the target moisture levels at the start of the storage experiments.
Corn stover was packed at a density of about 159 dry Kg/m3 in 1 pint (0.00047 m
3) glass canning

59
jars that were tightly sealed with a metal lid to create anaerobic conditions or covered with
Whatman No.1 paper held in place with a metal ring to create aerobic conditions. BBLTM
Anaerobic indicator strips (Becton, Dickenson & Co., Sparks, MD) were placed at the bottom
and near the top of a third of the storage jars, to check the aerobic conditions of storage. Storage
durations investigated were 0, 21, 90 and 220 days at 37oC and ambient room temperature (~23 ±
1oC). Aerobic samples were stored for up to 90 days and anaerobic for up to 220 days, although
only IA stover had 90-day anaerobic storage and at 37oC. PA samples did not include the 15%
moisture condition. Each storage condition was stored in triplicate, making a total of 519
samples. After storage, samples were analyzed for changes in organic acids and pH. Samples
were then dried to constant weight in a HotPack convection oven at 55oC, ground using a 2 mm
screen on a Wiley Mill (Model 4, Thomas Scientific, Swedesboro, NJ) and stored at room
temperature in sterile airtight Whirl-Pak bags (Nasco, Fort Atkinson, Wisc.) prior to
compositional analysis.
3.2.2 Dry matter loss (DML)
Dry matter loss was determined gravimetrically and was also estimated from the organic acids
produced during anaerobic wet storage. For the gravimetric method, weight and moisture content
of each sample was taken before and after storage. Moisture content was determined by drying in
a HotPack convection oven at 55oC to constant weight. Dried samples were placed in Nalgene
®
desiccator cabinet for moisture free cooling before weighing. This was to reduce possible errors
in weighing due to relative humidity/ moisture absorption from atmosphere. The percentage dry
matter loss was calculated using Equation 1. Initial weight and moisture fraction refers to day 0.
(1)
Dry matter loss was also estimated from organic acids using Equation 2. Dry matter loss in this
case is associated mainly with carbon dioxide evolution during acid fermentation and to a lesser
extent through hydrogen and water produced in some silage fermentation processes. The

60
fermentation reaction stoichiometries were used to measure the amounts of carbon dioxide,
hydrogen and water liberated for every mass of acid produced. This method would be referred to
as stoichio-gasometric method. See Appendix B for more details on this method, potential
microbial reactions and the selected stoichiometries used in dry matter loss calculation.
∑ ( (
)) ∑ ( (
)) ∑ ( (
))
(2)
Where W=Mass of acid in silage; OA = individual organic acid; m = no. of moles; MM = molar mass; DM = dry
matter
3.2.3 Organic acid profile and pH
The organic acid profile represents the types and amounts of water extractable acids present in
feedstock. Soluble extracts for pH and organic acid measurements were collected before and
after storage, before samples were dried and ground as required for compositional analysis of
other constituents. Stover samples were thoroughly mixed before sub-sampling, and deionized
water was added at a ratio of 1:10, wet basis. The mixtures were shaken for 30 minutes at 200
rpm using a Barnstead SHKA 2000 open air platform shaker (Barnstead International, Dubuque,
IA) after which the extracts were filtered through Whatman No.1 paper. The pH of extracts was
determine using SevenEasy S20 pH meter (Mettler-Toledo International Inc, Columbus, OH)
and calibrated with standard buffers 2, 4 and 7 for anaerobic samples and 4, 7 and 10 for aerobic
samples. The collected extracts were filtered again using 0.2 m PTFE filters, diluted 20-fold
and analyzed using Dionex ICS 3000 ion exclusion chromatography (Thermo Fisher Scientific
Inc., Dionex ICS 3000, Sunnyvale, CA) for types and amount of organic acids. Separation was
performed at 30oC using IonPac ICE-AS1 guard (4 x 50 mm) and analytical (4 x 250 mm)
columns with 100 mM methanesulfonic acid eluent at a flow rate of 0.16 mL/min. Organic acids
were detected with a photodiode array detector (Thermo Fisher Scientific Inc., Dionex UVD
340U, Sunnyvale, CA) at a wavelength of 210 nm. Thirteen different potential acids (lactic,
acetic, butyric, pyruvate, isobutyric, valeric, isovaleric, propionic, tartaric, malic, formic, citric,
succinic) were used as standards.

61
3.2.4 Corn stover compositional analysis
Corn stover composition before and after storage was determined by quantitative saccharification
using adapted biomass analytical methods from the U.S. National Renewable Energy Laboratory
(NREL). These methods can be found at
http://www.nrel.gov/biomass/analytical_procedures.html and include: preparation of samples for
compositional analysis (Hames et al. 2008); determination of extractives in biomass (Sluiter et
al., 2008a); determination of structural carbohydrates and lignin in biomass (Sluiter et al.,
2008b); and determination of ash in biomass (Sluiter et al., 2008c). Samples were dried at 55oC
instead of the recommended 45oC. Water and ethanol extractions were accomplished using
Dionex Accelerated Solvent Extraction 350 (ASE 350) (Thermo Fisher Scientific Inc., Dionex
ASE 350, Sunnyvale, CA) system. Extracts were dried to sludge using BUCHI multivapor p-12
system (BUCHI Labortechnik AG, Switzerland) before placing in SHEL LAB vacuum oven
(Sheldon manufacturing Inc. Cornelius, OR) at 45oC, 25 in Hg, for at least 24 hours to complete
the drying. Sugar composition was analyzed using Dionex IC 3000 Ion Exclusion
Chromatography (ICE). Sugars were separated by high pH anion exchange at 30oC using
CarboPac PA20 guard (3 x 30 mm) and analytical (3 x 150 mm) columns with 2 mM sodium
hydroxide (NaOH) at a flow rate of 0.5 ml/min. Monosaccharides were detected by pulsed
amperometric [electrochemical] detection at gold working electrodes, using quadruple
waveform.
Each individual component of biomass composition was calculated as a percentage of the whole
biomass on a dry basis (0% moisture). The percentage change from day zero was calculated as
follows (Equation 3):
(Mass basis)
( )
(3)

62
3.2.4 Data analysis
Results were analyzed using statistical tools including analysis of variance (ANOVA), Tukey's
multiple comparison test and regression. All statistical tests were assessed using a significance
level, α, of 0.05. Statistical software used for these analyses was Minitab 14 (Minitab Inc., State
College, PA). Graphs were generated in Microsoft Excel 2010.
3.3 Results and Discussion
3.3.1 Anaerobic indicator strips
The anaerobic indicator strips were originally blue under aerobic conditions and turn white under
anaerobic conditions. These colors could readily be seen through the glass walls of the storage
jars. Observation of the strips showed that anaerobic conditions were maintained for all
anaerobic storage samples except for one replicate of the day 21, 45% moisture PA sample
stored at 37oC. Although anaerobic conditions existed at the beginning for this sample, the strips
turned bluish by the end of two weeks indicating air infiltration had occurred. On the other hand,
aerobic samples did not all maintain the blue color. The 25% moisture samples were consistently
blue both top and bottom. The 35% samples maintained aerobic conditions throughout the jar for
the first week, after which the bottom indicator started showing variations, with some indicators
pale blue or whitish blue. For 45 – 75% moisture, by the fourth day of storage, both top and
bottom indicators where turning whitish. This result is consistent with rapid degradation under
these moisture contents, which in turn would have consumed oxygen more quickly than it could
diffuse into the vessel through the Whatman filter paper in the lid. In some cases, the bottom
indicators were partly blue and partly white indicating degradation rates, oxygen diffusion and/or
distribution through the jar was not uniform. By the second week of storage, almost all indicators
both bottom and near top for the high moisture aerobic samples were white indicating anaerobic
conditions during the aerobic storage. The exceptions were some PA samples of 45% moisture,
which maintained some pale blue color. At the end of storage duration some of the white strips
had turn blue again, which could be a result of slower degradation, or of moisture loss
contributing to increased porosity and greater permeability for air movement.

63
3.3.2 Dry matter loss
Wet aerobic storage
Generally, dry matter loss (DML) under aerobic conditions increased with moisture (p < 0.0001)
and duration (p < 0.0001), as illustrated in Figure 1. The average dry matter loss was ~ 15 % and
23% dry basis at day 21 and day 90 respectively. The maximum dry matter loss was ~43% at
day 90. At 23oC, dry matter losses were not significantly different for IA and PA stover types (p:
0.225 for day 21 and 0.395 for day 90), however, at 37oC, losses in IA stover were significantly
higher than PA stover (p: 0.009 for day 21 and 0.019 for day 90). Within stover type, however,
there were no significant differences in dry matter loss for each storage duration at the two
temperatures (23oC and 37
oC) (p > 0.05). For both IA stover stored at 37
oC_90 days and PA
stover stored at 23oC_90 days, dry matter losses at each storage moisture level were all
significantly different from each other (p: both IA and PA < 0.0001). At other storage
temperatures and durations, the IA and PA stover samples that were not significantly different
generally clustered into the following moisture groupings: 15 - 25%; 35% (sometimes including
45%), 45 - 65% (sometimes including 75%), and 75%. These groupings were defined using a one
way ANOVA in conjunction with Tukey test to find means that are significantly different. The
values in brackets have confidence intervals that embrace at least two other samples that have
significantly different means. These results suggest that DML can be generally categorized into
three groups: low DML for the driest (15% -25% moisture) aerobic storage conditions, higher
DML for a moderate moisture aerobic storage condition (35%), and very high DML for medium
and high moisture (45%) aerobic conditions. Moisture is the most influential determinant of
DML, accounting for ~55% of the variability in lumped analysis of DML for both IA and PA
stover, and combined with duration this accounts for ~ 69% of variability. These two factors
overshadow the effect of temperature. Lines of best fit (Figure 1) show that at day 21, very high
moisture samples generally had lower DML, possibly due to anaerobic conditions created by
rapid initial degradation and excess water restricting oxygen diffusion. However, by day 90,
degradation would have slowed and much of the moisture would have been lost due to gas
exchange in these aerobic jars, creating a more aerobic condition and leading to more DML.

64
Figure 3.1: Dry matter loss from aerobic wet storage. Purple = day 21; Brown = day 90; Plain
=23oC; diagonal wall =37
oC
Temperature Duration (days) Best Fit Dry matter loss = R2
23oC 90 Linear 0.7127 x Moisture - 9.2045 0.93
37oC 90 Linear 0.6778 x Moisture - 8.956 0.98
23oC 21 Poly -0.0135 x Moisture 2 + 1.4983 x Moisture - 22.106 0.87
37oC 21 Linear 0.4948 x Moisture - 5.0892 0.93
Temperature Duration (days) Best Fit Dry matter loss = R2
23oC 90 Linear 0.7439 x Moisture - 14.313 0.98
37oC 90 Linear 0.4458 x Moisture - 5.8426 0.91
23oC 21 Poly -0.0095 x Moisture
2 + 1.2328 x Moisture - 23.209 0.98
37oC 21 Poly -0.0098 x Moisture 2 + 1.2340 x Moisture - 21.211 0.93
0
10
20
30
40
50
15 25 35 45 55 65 75
Dry m
atte
r los
s (%
dry
bas
is)
Nominal storage moisture (%)
0
10
20
30
40
50
15 25 35 45 55 65 75
Dry m
atte
r los
s (%
dry
bas
is)
Norminal storage moisture (%)
Spring harvested, PA stover
Fall harvested, IA stover

65
Anaerobic storage
Under anaerobic conditions, gravimetric dry matter loss was generally not significantly different
(p = 0.102) for fall harvested (IA) stover and spring harvested (PA) stover, with average dry
matter losses of 1.6% and 2.3% respectively. Gravimetric measurements of dry matter loss at
these low levels is quite difficult due to the heterogeneous moisture content of samples before
and after storage. Estimates using the stoichio-gasometric method were 1.3% and 1.8%
respectively, and with greater consistency among replicates, the DML from the latter biomass
type (spring harvested PA stover) was significantly higher than the fall harvested IA stover (p <
0.0001). Moisture content of feedstock at the end of storage was within ±1 – 2 percentage points
from starting moisture (see Appendix B). With respect to temperature, there were no significant
differences (p = 0.870) at the two levels tested (23oC and 37
oC), both within and across stover
types. Storage duration was a significant factor, with dry matter losses at 220 days higher than
losses at 21 days (p < 0.0001). On average, gravimetric dry matter loss at 220 days of storage
was less than 3%, compared to less than 1% at 21 days of storage. The maximum dry matter loss
measured gravimetrically was about 9% at day 220 (23oC_ 45%, PA stover). The more
consistent and replicable stoichio-gasometric losses averaged just slightly more than 1% on day
21, and were still less than 2% at day 220. Using this method, maximum dry matter loss was ~
4% at day 220 (23oC_ 35%, IA stover).
The effect of storage moisture on dry matter losses of the IA stover was significant for samples
stored for 21 days (both temperatures) and samples stored for 220 days at 37oC. However, there
was no significant difference in dry matter loss across moisture for the samples stored at 23oC for
220 days (p = 0.472). At 23oC_ 21 days, dry matter loss was not significantly different for all
moisture levels except at the 65% level (p = 0.032). At 37oC, for both day 21 and day 220, dry
matter losses at the various moisture levels overlap but can be generally grouped as: 15-25%
(sometimes including 35%); 35-65% (sometimes including 75%); and 75% (p = 0.006 for day
21and 0.003 for day 220). For PA stover, there were no significant differences in dry matter
losses across the different moisture contents for each storage temperature and duration, except
for storage at 37oC for 220 days. Even at this temperature and duration, there was no significant
difference in losses at 35 – 65% (and sometimes 75%) moisture levels, similar to what was

66
observed with the IA stover. As with aerobic samples, these groupings were defined using a one
way ANOVA in conjunction with Tukey test to find means that are significantly different. The
values in bracket have confidence intervals that embrace at least two other samples that have
significantly different means. Table 1 shows regression relationships at the various storage
conditions as well as dry matter loss groupings.

67
Temperature Duration (days) Best Fit Dry matter loss = R2Dry matter loss groupings
23oC 220 Poly -0.2054 x Moisture2 + 1.8567 x Moisture - 1.4962 0.86 (15%), (25 (65-75)%), (35 (45-55)%), (45-75%)
37oC 220 Poly -0.1338 x Moisture2 + 1.3862 x Moisture - 1.3329 0.80 (15%, (25, 45, (65-75)%), (25-75%)
23oC 21 Poly -0.1381 x Moisture2 + 1.3223 x Moisture - 1.2148 0.79 (15 - 25%), (35-75%)
37oC 21 Poly -0.0690 x Moisture2 + 0.6603 x Moisture - 0.5291 0.60 (15 -75%)
23oC 220 Poly "-0.1869 x Moisture2 + 1.6236 x Moisture - 0.701 0.41 (15 - 75%)
37oC 220 Linear 0.9698 x Moisture - 2.0843 0.75 (15-25 (35)%), (35-65 (75)%), (75%)
23oC 21 Poly -0.1187 x Moisture2 + 1.2359 x Moisture - 2.0828 0.30 (15-55 (75)%), (65%)
37oC 21 Linear 1.0779 x Moisture - 3.386 0.83 (15-25 (35)%), (35-65 (75)%), (75%)
23oC 220 Poly -0.1215 x Moisture2 + 1.1620 x Moisture - 0.2288 0.48 (25, 45, (65-75)%), (35-75%)
37oC 220 Poly -0.0749 x Moisture2 + 0.7033 x Moisture + 0.2373 0.23 (25-75%)
23oC 21 Poly - 0.1373 x Moisture2 + 1.943 x Moisture -0.6146 0.63 (25, (55-75)%), (35, (45-65)%), (55-75%)
37oC 21 Poly - 0.0554 x Moisture2 + 0.4815 x Moisture + 0.7592 0.21 (25-75%)
23oC 220 Poly -0.2484 x Moisture2 + 2.229 x Moisture - 0.8691 0.37 (25-75%)
37oC 220 Linear 0.9463 x Moisture - 0.6571 0.84 (25%), (35-65 (75)%), (75%)
23oC 21 Poly 0.1504 x Moisture2 - 0.8574 x Moisture+ 1.5457 0.25 (25-75%)
37oC 21 Poly 0.0234 x Moisture2 - 0.1109 x Moisture + 0.4852 0.07 (25-75%)
IA stover
PA stover
Stoichio-
gasometric
Gravimetric
Stoichio-
gasometric
Gravimetric
Table 3.1: Regression fits for anaerobic wet storage at different temperature and durations*
* The dry matter losses in the table are grouped by storage moisture. The grouping is based on analysis using one way
ANOVA in conjunction with Tukey test to find means that are significantly different. The values in brackets are not
significantly different from preceding values but are also not significantly different from at least one other value, whose mean
dry matter loss is significantly different from that of the preceding value.
The dry matter loss equations were derived from regressions of the mean dry matter losses.

68
Unlike the aerobic samples, gravimetric dry matter losses under anaerobic conditions were more
variable but generally low (Figure 2). Stoichio-gasometric dry matter losses were reasonable,
less variable and generally lower than amounts obtained through gravimetric methods. The
higher values in the latter may be due to potential losses of organic acids during drying which
would decrease the mass of feedstock. In butyric acid fermentation, additional losses from
protein degradation are expected and could be accounted for through the loss of ammonia or
CO2. Such protein losses were not taken into account in this Stoichio-gasometric estimation.

69
Figure 3.2: Dry matter loss from anaerobic wet storage. Stoichio-gasometric dry matter loss is
indicated with black error bars: Purple = day 21; Orange = day 220; Plain colors indicate 23oC;
diagonal patterns indicate 37oC. Empty bars with red dots emphasizing their mean values
indicate gravimetric dry matter losses.

70
Wide variations in dry matter loss within samples stored at the same moisture and same duration
were also observed by Chen (2009). Chen’s estimates of DML ranged from less than 2% to 12%
for stover stored at 60% moisture for 21 days. Some of Chen’s stover were harvested at different
dates, and the wide range of dry matter losses are indicative of variability not fully accounted for
by storage moisture. The results, as with this current study, shows moisture and temperature are
not good predictors of dry matter loss under anaerobic conditions. Some samples had negative
dry matter losses, which could be due to variability and/or inaccuracies in moisture values during
attempt to select lumped representative samples from Day 0, when compared to what the actual
moisture of each sample in storage would have been at Day 0. This variability could be as a
result of the heterogeneous nature of feedstock. Measured moisture contents were within ± 2% of
target moisture, and a representative sample that deviates even with such a small margin from the
actual sample, could easily lead to inaccuracies in calculations of dry matter losses especially for
the higher moisture treatments.
Dry matter loss regression fit
Linear regression of dry matter loss against moisture content for aerobic samples indicated that
the relationship between these two variables was significant for each stover type (IA stover and
PA stover) and each storage condition: 23oC for 21 days; 23
oC for 90 days; 37
oC for 21 days;
37oC for 90 days (p < 0.001). Moisture accounted for 49 to 98% and 66 to 98% of the variation
in dry matter loss for IA and PA stover respectively. Although a linear model is significant, from
Figure 1, it can be observed that a 2nd
order polynomial model presents a better fit for 21 days of
aerobic storage, with dry matter loss peaking around 55% moisture. Coefficients of
determination at this storage duration for a linear model were about 52% at 23oC for IA stover,
while for PA stover they were 71% at 23oC and 79% at 37
oC; for the same storage duration with
a polynomial fit the coefficients of determination were 87% at 23oC for IA stover, while for PA
stover they were 93% at 23oC and 98% at 37
oC. The stable dry matter loss at 65% and 75%
moisture predicted by the polynomial model fits the data well, and is much lower than predicted
by the linear model at these higher moisture levels. Relatively constant dry matter loss at higher
moisture levels is and indication that moisture is no longer limiting, and any decreases from the
maximum dry matter loss could be due to prolonged anoxic conditions created by the high

71
moisture and the very slow diffusion of oxygen through water (approximately four orders of
magnitude slower than through air). By day 220, a number of factors could extend the oxygen
front from top to bottom and allow fully aerobic conditions. These could include natural loss of
moisture over time, increased for the higher storage temperature of 37oC, as that water loss
creates more pore space for air movement. A lumped analysis, disregarding stover type, storage
temperature and duration, showed a significant linear estimation of dry matter loss (p < 0.0001)
although moisture accounted for only 50% of the variation. Equation 4 shows the lumped
relation between dry matter loss and moisture under aerobic storage.
(4)
Although the differences in dry matter loss across moisture levels were almost non-existent for
anaerobic samples due to variability within samples, linear regression of the means gave
reasonable coefficients of determination (R2: ~75 -83%) for storage at 37
oC. The polynomial
model gave R2 values that were 1-2 % higher than those of the linear model. The lines of best fit
were generally worse at 23oC compared to 37
oC. Table 1 shows only the best fit equations. A
lumped analysis showed that under anaerobic conditions moisture accounted for about only 9%
of the variation in dry matter loss, while duration accounted for ~16% and temperature’s role
was not significant.
Fitting a Monod and Droop curve to DML data
The dry matter loss polynomial fit suggests that at higher moisture content, dry matter loss
decreases. This is not in conformity with general expectation that DML increases with storage
moisture, although this is not necessarily a linear relation (McGechan , 1990; Buckmaster, 1992;
Emery and Mosier 2012). To address this possibility, an asymptotic fit is evaluated that would
allow dry matter loss to plateau above a certain moisture level. The Monod and Droop models
were fitted to the dry matter loss data and the model parameters were estimated using the least
squares method. Two constraints applied were (1) 0 ≤ dry matter loss ≤ 100, and (2) 0 ≤ moisture
≤ 75. Generally, the Droop model fit the data better than the Monod model, although both
models were poor fit for the anaerobic results. Dry matter loss under aerobic conditions gave

72
better R-square values for these two models compared to the corresponding regressions for
anaerobic samples. Table 2 shows the estimated parameters for the Monod and Droop models
and Figure 3 compares the estimated DML for some conditions with actual gravimetric
measurements.
The Monod and Droop models each have two estimated parameters. The best fit equations for
each model are provided in Table 2. The Monod “K”, which is a parameter representing the
moisture level at which maximum dry matter loss is halved, was 75% for almost all aerobic and
anaerobic conditions. The maximum dry matter loss (DMLmax) is the second estimated parameter
of the Monod equation. The implication of having a Monod “K” of 75%, as suggested by the
Monod model assumptions, is that when moisture levels are lower than 75% moisture, dry matter
loss can be estimated using a linear relationship with DMLmax/K as the slope. The DMLmax
estimate from the Monod equation for aerobic storage was up to 70% for IA stover and 63% for
PA stover, compared to the actual 43% and 39% maximum observed for IA and PA stover
respectively. These maximum values were observed at 75% moisture levels at day 90 and are
more than half the predicted maximum. The Monod model therefore generally underestimates
dry matter loss but suggest the possibility of higher losses. The Monod “K” also suggests that as
long as moisture is ≤ 75%, the possibility of dry matter losses greater than 43% is very low.
The Droop “K”, which is a parameter representing the moisture content at which dry matter loss
is zero, also gave reasonable values under aerobic conditions, indicating that at moisture levels of
less than 15 to 24% dry matter loss is expected to be zero. The other parameter estimated for the
Droop model was DMLmax which is also maximum dry matter loss. Applied to microbial growth
functions, the Monod DMLmax and the Droop DMLmax are different, with the former defined by
external substrates while the latter defined by internal nutrients/substrates. In this analysis we are
using the form of these curves rather than attempting to describe microbial growth rate
mechanisms, so this parameter can be assumed to represent the same thing, maximum dry matter
loss. The maximum dry matter losses estimated from the Droop model were lower than those
estimated from Monod and also closer to values observed in this study.
For anaerobic, ensiled storage, fitting the Monod and Droop model to dry matter loss estimated
by the stoichio-gasometric method gave better results than for the gravimetric estimates of DML

73
for IA stover. Droop R-square was above 53% for 21 and 220–day storage at 23oC and
approximately 49% for 220-day storage at 37oC. The R-square values for PA stover were all
below 19%. Both models gave maximum dry matter loss under anaerobic conditions to be less
than 5%. Droop’s “K”, that is moisture content at which dry matter loss is zero, was less than
16%.
Table 3.2: Estimated parameters and R-square values from fitting Monod and Droop models to
dry matter loss data
* K value means difference things for the different models. Monod = moisture content at which maximum dry
matter loss (DMLmax) is halved; Droop = moisture content at which dry matter loss is 0.
** Aerobic samples were stored for 21 and 90 days not 220 days
Monod Droop Monod Droop Monod Droop Monod Droop
IA 1.73 1.46 4.03 2.70 3.04 3.92 6.16 4.93
PA 3.47 1.83 0.59 0.59 3.59 3.59 9.77 7.06
IA 75.0 22.8 75.0 26.2 18.1 8.2 75.0 21.8
PA 75.0 12.1 0.0 0.1 0.0 0.0 75.0 20.8
IA 56.52 53.27 142.63 104.61 80.27 80.18 102.99 72.70
PA 102.03 104.51 39.49 39.49 74.22 74.22 55.52 48.81
IA 0.06 0.12 0.17 0.39 0.04 0.04 0.30 0.50
PA 0.03 0.01 0.00 0.00 0.00 0.00 0.37 0.44
IA 3.27 2.29 1.69 1.30 3.43 2.98 4.48 2.80
PA 1.69 1.70 1.69 1.72 2.78 2.72 1.93 1.91
IA 58.41 14.59 43.87 13.31 33.49 13.29 75.00 15.45
PA 2.98 2.98 1.19 1.85 12.06 8.47 6.95 5.50
IA 8.25 6.27 12.27 11.83 11.72 8.34 15.09 12.33
PA 4.87 4.87 3.64 3.63 4.65 4.37 6.45 6.41
IA 0.38 0.53 0.11 0.14 0.36 0.55 0.38 0.49
PA 0.01 0.01 0.00 0.01 0.13 0.18 0.02 0.03
IA 37.29 23.69 51.92 33.14 69.95 45.62 65.86 42.48
PA 32.21 24.51 34.45 24.32 63.12 52.15 44.62 34.91
IA 75.00 15.98 75.00 16.50 75.00 17.08 75.00 16.88
PA 75.00 21.96 75.00 19.96 75.00 24.13 75.00 22.73
IA 649.89 454.52 536.93 326.01 1278.24 747.20 981.91 652.56
PA 239.32 82.04 168.07 66.03 1091.78 145.42 417.33 76.19
IA 0.53 0.67 0.76 0.85 0.72 0.84 0.75 0.83
PA 0.61 0.86 0.64 0.87 0.66 0.95 0.66 0.94
Gravimetric Aerobic**
DMLmax
K*
Sum of
squared
R2
Stoichio-gasometric Anaerobic
DMLmax
K*
Sum of
squared
R2
Gravimetric Anaerobic
DMLmax
K*
Sum of
squared
R2
Day 21_23oC Day 21_37oC Day 220_23oC Day 220_37oC
𝑀𝑜𝑛𝑜𝑑: 𝐷𝑀𝐿 𝐷𝑀𝐿𝑚𝑎𝑥
𝑀𝑜𝑖𝑠𝑡𝑢𝑟𝑒 𝑐𝑜𝑛𝑡𝑒𝑛𝑡
𝐾 𝑀𝑜𝑖𝑠𝑡𝑢𝑟𝑒 𝑐𝑜𝑛𝑡𝑒𝑛𝑡 𝐷𝑟𝑜𝑜𝑝: 𝐷𝑀𝐿 𝐷𝑀𝐿𝑚𝑎𝑥 (
𝐾
𝑀𝑜𝑖𝑠𝑡𝑢𝑟𝑒 𝑐𝑜𝑛𝑡𝑒𝑛𝑡)

74
-4
-2
0
2
4
6
8
10
0 20 40 60 80
Dry
ma
tte
r lo
ss (
%)
Norminal storage moisture content (%)
21D_22C
-4
-2
0
2
4
6
8
10
0 20 40 60 80
Dry
ma
tte
r lo
ss (
%)
Norminal storage moisture content (%)
220D_22C
-4
-2
0
2
4
6
8
10
0 20 40 60 80D
ry m
att
er
loss
(%
)
Norminal storage moisture content (%)
21D_37C
-4
-2
0
2
4
6
8
10
0 20 40 60 80
Dry
ma
tte
r lo
ss (
%)
Norminal storage moisture content (%)
220D_37C
0
5
10
15
20
25
30
35
40
45
0 20 40 60 80
Dry
ma
tte
r lo
ss (
%)
Norminal storage moisture content (%)
21D_22C
0
5
10
15
20
25
30
35
40
45
0 20 40 60 80
Dry
ma
tte
r lo
ss (
%)
Norminal storage moisture content (%)
90D_22C
0
5
10
15
20
25
30
35
40
45
0 20 40 60 80
Dry
ma
tte
r lo
ss (
%)
Norminal storage moisture content (%)
21D_37C
0
5
10
15
20
25
30
35
40
45
0 20 40 60 80
Dry
ma
tte
r lo
ss (
%)
Norminal storage moisture content (%)
90D_37C
Spring Harvested, PA stover. AEROBIC STORAGE
Fall Harvested, IA stover. ANAEROBIC STORAGE
Figure 3.3: Comparing Monod (red squares) and Droop (green triangles) models to gravimetric dry matter loss data (blue circles)

75
3.3.3 pH of storage and control samples
pH of aerobic samples
Both IA and PA samples stored under aerobic conditions had alkaline pH values, which were
significantly higher than pH of Day 0 samples (p < 0.0001). The high pH (> 7) shown in Figure 4
indicates the absence of organic acids.
Figure3.4: pH values for different aerobic storage durations and across moisture levels for PA
stover (left) and IA stover (right)
Triangles = 22oC; circles =37
oC; orange = day zero; blue =day 21; brown= day 90. Samples
grouped together are not significantly different.
Typically, it could be expected that under aerobic condition, water soluble, readily available
sugars that are the primary initial substrate for aerobic and anaerobic microbes, would be
oxidized completely to carbon-dioxide. Sugar metabolism is neutral with respect to hydrogen
and hydroxyl ions, so should not result in a more alkaline pH. However, by the first sampling
period on Day 21 there are two reactions that would likely initiate within the first few days to
increase alkalinity: (1) the decomposition of protein compounds, leading to the formation of
ammonia or (2) conversion of organic acids or salts of organic acids to carbonates or
bicarbonates by alkali-forming bacteria (Ayers and Rupp, 1918). The first reaction, resulting in
ammonia alkalinity, is well recognized in composting systems and commonly drives up the pH
to 8.5 or 9.0 (Tiquia et al., 2002; Richard, 2003; Richard, 2004). For the second reaction, there
are at least three routes through which organic acids can be produced in wet aerobic storage.
5.5
6.0
6.5
7.0
7.5
8.0
8.5
9.0
9.5
5 15 25 35 45 55 65 75
pH
Storage moisture (%)
p = 0.004
p <0.0001
p <0.0001
p <0.0001
5.5
6.0
6.5
7.0
7.5
8.0
8.5
9.0
9.5
5 15 25 35 45 55 65 75
pH
Storage moisture (%)
p <0.0001
p <0.0001
p <0.0001
p <0.0001

76
First, organic acids can be produced under aerobic conditions through oxidative fermentation of
sugars (Hugh and Leifson, 1953). All microbes found on harvested crops or forage and which
form the natural microflora of silage are facultative aerobes or anaerobes except for Clostridium
species, which are generally obligate anaerobes and Acetobacter, which are obligate aerobes.
Acetobacter, a genus of acetic acid forming bacteria, are notable for converting ethanol to acetic
acid, however some species utilize sugars as substrate for acetic acid production. All lactic acid
bacteria can engage in oxidative fermentation to produce acids. Heterolactic species of the
genera Leuconostoc and Streptococcus will produce acetic acid instead of lactic or instead of
alcohol or other volatile acids whereas homolactic species like Lactobacillus plantarum will
produce lactates in high sugar environments and acetate when glucose level decreases (Condon,
1987). Other microbes with this oxidative fermentation capability and which can be potentially
found on harvested crops include Escherichia coli, Aerobacter aerogenes (Enterobacter
aerogenes) and some paracolon bacillus (Hugh and Leifson, 1953). Second, some Alkali-
forming bacteria (e.g. mostly belonging to the family Bacillaceae and Enterobacteriaceae) are
capable of sugar fermentation as well. The reaction of the acids produced from sugars and
ammonia produced from protein results in the formation of salts of organic acids, which are then
converted to alkali (Ayers and Rupp, 1918). Third, high moisture aerobic storage will behave
like a composting system, which goes through a series of pH changes due to decomposition and
varying metabolic activities as oxygen status changes within rapidly degrading particles (Richard
2004) and as successions of new microbial communities evolve that are better adapted to the new
conditions created (Battcock and Azam-Ali, 1998; Brinton, 1998; Richard, 2004). In most cases,
this starts with rapid oxygen consumption and anaerobic conditions within particles that
encourage acid formation, and then a decomposition of the acid by emergent fungi communities,
which result in alkali reactions. Based on observations of the anaerobic indicators at day 21 when
pH was first measured during aerobic storage, most aerobic samples had recently been or were
still partially in an anaerobic state. This weakens the argument for oxidative fermentation and
may favor the compost theory, where the high moisture forms pockets of anaerobic micro-
environments (Richard 2004).

77
Generally, IA samples had higher pH than the PA samples (p < 0.0001). The average pH for day
21 across the two storage temperatures was 8.3 for IA sample and 7.5 for PA samples. The
average pH for both stover types decreased significantly during aerobic storage to 7.9 (p = 0.028)
and 7.2 (p = 0.007) respectively by day 90. This decrease in pH could be due to the self-adjusting
pH observed in composting systems, where pH eventually levels off to a more neutral pH over
time (Brinton, 1998). The general trend suggests higher moistures had higher pH. With respect to
the two temperature conditions, the pH of samples stored at 23oC were significantly higher than
those stored at 37oC (p = 0.028 for IA stover and < 0.0001 for PA stover).
pH of anaerobic samples
The pH values on day 0 were 6.01 ± 0.08 and 6.07 ± 0.34 for IA and PA stover respectively, and
dropped significantly (p < 0.0001) to 4.01 ± 0.68 and 4.60 ± 0.36 by day 21 (Figure 5). Average
pH values after 220 days of anaerobic storage were 4.40 ± 0.31 for IA stover and 4.40 ± 0.58 for
PA stover. At day 220, there was no significant difference in the pH of IA and PA stover (p =
0.770) in contrast to day 0 and 21 where the pH of IA stovers were higher (p < 0.0001). The
slightly lower initial pH of the PA stover at Day 0 compared to IA stover pH at Day 0 could be
due to the more moist nature of the PA feedstock prior to adjusting moisture for the storage
experiments, ~30% moisture compared to ~7% in the IA stover. At 30% moisture the PA stover
could have been experiencing low levels of acidogenic fermentations, while the very dry
conditions of the IA stover could have resulted in loss of any organic acids previously formed. In
addition to having a slightly lower pH, PA stover showed a decrease in pH with increasing
moisture level on Day 0 after moisture was adjusted for storage. This trend was not observed in
the IA stover, which had similar pH across moisture for Day 0 samples, with exception of 65%
moisture which was significantly lower (p < 0.0001). Also for IA stover, pH values at the three
storage durations (day 21, 90 and 220) were not significantly different (p = 0.210), whereas in
PA stover, pH increased at day 220 above day 21 (p < 0.0001). The increase in pH of PA stover
after day 21 is possibly due to a compromise in storage integrity; although observing this
increase across-the-board makes this doubtful as the glass jars and metal lids appeared to be
sealed well, and separate containers were used for each storage duration so the long term samples
were not opened at the earlier sampling dates. This increase in pH for the PA stover did not

78
however affect the lactic acid concentration of the day 220 samples stored at 23oC, although at
37oC the lactic acid concentrations were generally lower than observed in the IA stover. For
each storage temperature (23oC and 37
oC), the pH at day 21 was not significantly different from
the pH at day 220. This was true across the full range of moisture levels for both IA and PA
stovers (p: IA = 0.916 and 0.456; PA = 0.384 and 0.300 for day 21 and 220 respectively).
In general the impact of storage moisture on pH was not striking. For PA stover, there was no
difference in pH across moisture at day 220, while at day 21, the only difference in pH was at
25% moisture, which was slightly higher. This was true even though there was evidence of
Clostridium fermentation in some of the high moisture samples, as seen from levels of butyric
acid above 0.5% of dry matter, which normally results from lactic acid degradation and causes
an increase in pH (McDonald et al. 1991; Jones et al., 2004). IA stover, while it showed no
significant difference in pH for 45% – 65% moisture levels for days 21, 90 and 220, had a higher
pH at moisture levels outside this range (15% - 35% and 75%). These more extreme moisture
samples of IA stover were not significantly different from each other except at Days 21 and 90,
when the pH at 15% and 25% was higher.
The pH values in this study are generally comparable to values for whole corn silage (grain and
stover) whose pH range is typically 3.5 – 4.5 when ensiled at 60 to 75% moisture (Jones et al.,
2004), and are somewhat lower than some prior observations for corn stover silage (Richard et
al., 2001; Shinners et al., 2007) indicating that the silage process in these experiments was
robust.

79
Figure 3.5: pH values for different anaerobic storage durations and across moisture levels for PA
stover (left) and IA stover (right)
Triangles = 22oC; circles =37
oC; orange = day zero; blue =day 21; brown= day 90; green = day
220. Samples grouped together are not significantly different.
3.3.4 Organic acid profiles during anaerobic storage
The organic acids identified in the ensiled storage samples included lactic, acetic, butyric,
isobutyric and propionic acids (see Figure 6 and Table 3). Low levels of tartaric and malic acids
were also identified in a number of samples, but were difficult to quantify due to their short
retention times near the elution of the system void volume and hence were not used in the current
analysis. Generally, total acids increased with moisture and duration (p < 0.0001) and were not
significantly different at the two storage temperatures of 23oC and 37
oC (p = 0.454). Organic
acids were virtually absent in the unensiled (Day 0) control samples of fall harvested (IA) stover.
As can be observed from Figure 6, these IA unensiled control samples had only two acid types;
lactic and traces of isobutyric acid, with means totaling ~0.1% (all acid results are reported on a
stover dry matter basis). The unensiled (Day 0) control samples of PA stover had some lactic and
acetic acid, with means totaling ~0.3%. Organic acids at 15% moisture for both Day 21 and Day
220 were similar to those of the control samples (Day 0). Lactic and acetic acids were present in
all wet storage samples with the exception of some Day 220 samples stored at 75% moisture,
where lactic acid is absent in both stover types (IA or PA). This was likely due to secondary
3.0
3.5
4.0
4.5
5.0
5.5
6.0
6.5
7.0
7.5
5 15 25 35 45 55 65 75
pH
Storage moisture (%)
P<0.0001
P=0.340
P<0.0001
3.0
3.5
4.0
4.5
5.0
5.5
6.0
6.5
7.0
7.5
5 15 25 35 45 55 65 75
pH
Storage moisture (%)
P<0.0001
P<0.0001
P<0.0001

80
fermentations by clostridia, common in high moisture silages (McDonald et al. 1991; Jones et al.,
2004). Butyric and propionic acids were present only in high moisture silage samples and
increased with storage duration. Even in these high moisture conditions the propionic acids
concentration was less than 1% for all samples. Traces of isobutyric were present at all moisture
levels in IA stover and were significantly higher (p < 0.0001) at higher moisture levels,
exceeding 2% in some of the Day 220 75% moisture samples. Figure 6 shows the organic acid
distribution at the different storage durations and moisture levels. At moisture levels of 25% –
45%, there were generally no significant differences in the amounts of the different acids among
stover types and across temperature (See Table 3). At moisture levels outside the 25% -45%
range, there were a few observations in which concentrations of organic acids were significantly
different across temperature. For the high moisture samples (55 -75%), those stored at 37oC had
relatively more volatile fatty acids (acetic, isobutyric and butyric) and less lactic acid. At 37oC,
acetic and butyric acid metabolisms are favored above lactic acid metabolism because most
lactic acid bacteria have optimum temperature of 18 – 22oC. Analysis of variance showed the
mean values of the various organic acids at the different moisture levels were all not equal. Table
3 shows the effect of the various storage factors on organic acid content. All factors had
significant effect on lactic acid for both IA and PA stovers, but there was no significant
interaction between temperature and moisture or duration for IA stover and no interaction among
the three factors for PA stover. The difference in lactic acid across moisture was mainly at the
extreme moisture levels, and the difference across duration was observed mainly at 37oC. For
acetic acid, although all storage factors had a significant effect on the amount of acetic acid in
PA stover, only moisture and duration had an effect in the IA stover. There was a distinctly non-
linear relationship of lactic acid concentrations with moisture, while this relationship for acetic
acid was more linear. See Appendix B, Figure B5 for an illustration of the graphical relationship
between these two acids and moisture.
Total amount of organic acids in samples stored at 55% to 65% moisture (i.e. the typical
moisture levels for conventional silage) were somewhat lower (~2.5% to 9.1% on a dry weight
basis) than the amounts in whole-crop corn silage, which are typically around 5 -10% (Kung,
2008), but within range found in other corn stover silage studies. In previous studies on naturally

81
ensiled corn stover silage acetic acid was dominant, up to 2.5% - 3.0% (Richard et al., 2001;
Ren, 2006). This was not the case in current study, where lactic acid was generally dominant; up
to ~4.9% for IA stover and up to ~3.5% for PA stover. Lactic acid concentrations, at moisture
levels of 25% – 45% for PA samples ranged from 57 – 94% of total acids. For higher moisture
PA stover at longer duration (day 220), the lactic acid concentrations were generally less than
50% of the total acid. For the IA stover, lactic acid concentrations after storage were generally
greater than 50% and up to 85% of total acid, which was consistent across storage durations for
moisture levels of 25 -65%. At 75% moisture, acetic and butyric acids were equally dominant in
IA stover at day 220, 37oC., while for PA stover at day 220 acetic acid was dominant at 37
oC
and butyric acid was dominant at 23oC storage temperature.
The inhibitory effect of these acids on microbial degradation during storage and on downstream
biofuel fermentation depends on a number of factors such as substrate concentration,
fermentation pH and temperature. These factors determine both the overall acid concentration
and the relative amount of undissociated acids. The inhibitory effect of organic acids also
depends on the composition of the fermentation broth including factors like concentrations of
metal ions, sugars, amounts and types of nutrients, and inoculum size or initial microbial
population (Lund and Eklund, 2000; Palmqvist and Hahn-Hagerdal, 2000; Stenberg et al., 2000).
Microbial intracellular pH as well as nutrient up-take rate is also crucial (Zaldivar and Ingram,
1999; Thomas et al., 2002; Torija et al., 2003)
Assuming a 30% solids loading rate, the concentration of total acids for the maximum values
observed in this study will be just above 2%. Assuming lactic acid dominates at 50% of total
acids, at a fermentation pH of 4.5 only ~ 18% of this lactic acid will be undissociated and
potentially inhibitory. This is equivalent to a concentration of 0.18%, and when considering the
higher pKa of the other acids would sum to a much lower concentration than the 0.8%
intracellular accumulation noted by Knauf and Kraus (2006) to possibly cause cell death in yeast.
Thus it can be assumed then that the organic acids concentrations in silage are not likely to
inhibit or constitute any significant inhibition in downstream processes.

82
Figure 3.6: Organic acid profile of IA and PA stovers at various anaerobic storage conditions.
0
1
2
3
4
5
6
7
8
0 0 0 0 0 0
21
21
21
21
21
21
22
0
22
0
22
0
22
0
22
0
22
0 0 0 0 0 0 0
21
21
21
21
21
21
22
0
22
0
22
0
22
0
22
0
22
0
25 35 45 55 65 75 25 35 45 55 65 75 25 35 45 55 65 75 25 35 45 55 65 75 25 35 45 55 65 75 25 35 45 55 65 75
Lactic Acetic Propionic Isobutyric Butyric
Spring Harvested, PA Stover
0
1
2
3
4
5
6
7
8
0 0 0 0 0 0
21
21
21
21
21
21
22
0
22
0
22
0
22
0
22
0
22
0 0 0 0 0 0 0
21
21
21
21
21
21
22
0
22
0
22
0
22
0
22
0
22
0
25 35 45 55 65 75 25 35 45 55 65 75 25 35 45 55 65 75 25 35 45 55 65 75 25 35 45 55 65 75 25 35 45 55 65 75
Lactic Acetic Propionic Isobutyric Butyric
37C
Fall Harvested, IA Stover 23C

83
23oC 37oC 23oC 37oC 23oC 37oC 23oC 37oC 23oC 37oC
IA-25 0.27 ± 0.23 0.11 ± 0.19 0.00 ± 0.00 0.00 ± 0.00 0.00 ± 0.00 0.00 ± 0.00 0.06 + 0.06 0.03 ± 0.05 0.00 ± 0.00 0.00 ± 0.00
PA-25 0.75 ± 0.15 1.15 ± 0.36 0.26 ± 0.06 0.25 ± 0.09 0.00 ± 0.00 0.00 ± 0.00 0.00 + 0.00 0.06 ± 0.11 0.00 ± 0.00 0.00 ± 0.00
IA-35 1.76 ± 0.46 0.7 ± 0.66 0.74 ± 0.63 0.23 ± 0.2 0.00 ± 0.00 0.00 ± 0.00 0.13 + 0.08 0.03 ± 0.06 0.00 ± 0.00 0.00 ± 0.00
PA-35 2.05 ± 0.4 1.75 ± 0.43 0.42 ± 0.10 0.36 ± 0.06 0.00 ± 0.00 0.00 ± 0.00 0.00 + 0.00 0.00 ± 0.00 0.00 ± 0.00 0.00 ± 0.00
IA-45 2.03 ± 0.65 2 ± 0.67 0.46 ± 0.18 0.53 ± 0.34 0.00 ± 0.00 0.00 ± 0.00 0.03 + 0.05 0.13 ± 0.13 0.00 ± 0.00 0.00 ± 0.00
PA-45 2.42 ± 0.24 1.78 ± 0.56 0.54 ± 0.07 0.37 ± 0.16 0.00 ± 0.00 0.00 ± 0.00 0.00 + 0.00 0.00 ± 0.00 0.00 ± 0.00 0.00 ± 0.00
IA-55 2.34 ± 0.37 1.36 ± 1.29 0.61 ± 0.13 0.34 ± 0.3 0.00 ± 0.00 0.00 ± 0.00 0.06 + 0.05 0.04 ± 0.06 0.00 ± 0.00 0.00 ± 0.00
PA-55 2.16 ± 0.76 1.41 ± 0.13 0.60 ± 0.33 1.56 ± 0.17 0.00 ± 0.00 0.00 ± 0.00 0.00 + 0.00 1.9 ± 0.21 0.00 ± 0.00 0.00 ± 0.00
IA-65 2.6 ± 0.07* 0.9 ± 1.56 0.79 ± 0.04 0.44 ± 0.76 0.00 ± 0.00 0.00 ± 0.00 0.05 + 0.09 0.05 ± 0.08 0.00 ± 0.00 0.00 ± 0.00
PA-65 2.77 ± 0.47* 1.6 ± 0.36 0.69 ± 0.12 0.67 ± 0.18 0.00 ± 0.00 0.00 ± 0.00 0.00 + 0.00 0.82 ± 0.29 0.00 ± 0.00 0.00 ± 0.00
IA-75 2.2 ± 0.38 2.03 ± 1.78 0.83 ± 0.12 0.61 ± 0.57 0.00 ± 0.00 0.00 ± 0.00 1.03 + 0.14 0.00 ± 0.00 0.10 ± 0.18 0.00 ± 0.00
PA-75 2.33 ± 0.66 0.00 ± 0.00 0.76 ± 0.19 1.6 ± 0.05 0.00 ± 0.00 0.30 ± 0.51 0.25 + 0.08 3.22 ± 0.83 0.09 ± 0.16 1.03 ± 0.72
IA-25 0.8 ± 0.27 0.26 ± 0.46 0.37 ± 0.07 0.14 ± 0.24 0.00 ± 0.00 0.00 ± 0.00 0.05 + 0.09 0.04 ± 0.07 0.00 ± 0.00 0.00 ± 0.00
PA-25 1.14 ± 0.45 0.99 ± 0.23 0.21 ± 0.19 0.25 ± 0.16 0.00 ± 0.00 0.00 ± 0.00 0.11 + 0.1 0.13 ± 0.04 0.00 ± 0.00 0.00 ± 0.00
IA-35 2.52 ± 0.38 1.94 ± 0.13 0.91 ± 0.37 0.63 ± 0.02 0.00 ± 0.00 0.00 ± 0.00 0.11 + 0.01 0.2 ± 0.02 0.00 ± 0.00 0.00 ± 0.00
PA-35 2.57 ± 0.26 1.68 ± 0.32 0.58 ± 0.13 0.77 ± 0.12 0.00 ± 0.00 0.00 ± 0.00 0.16 + 0.14 0.18 ± 0.03 0.00 ± 0.00 0.00 ± 0.00
IA-45 2.79 ± 0.44 2.9 ± 0.16 0.86 ± 0.15 0.75 ± 0.06 0.00 ± 0.00 0.00 ± 0.00 0.11 + 0.01 0.27 ± 0.01 0.00 ± 0.00 0.00 ± 0.00
PA-45 2.59 ± 0.09 1.31 ± 1.13 0.3 ± 0.13 0.17 ± 0.15 0.00 ± 0.00 0.00 ± 0.00 0.11 + 0.1 0.11 ± 0.1 0.00 ± 0.00 0.00 ± 0.00
IA-55 3.2 ± 0.47* 2.95 ± 0.4 1.35 ± 0.42 1.14 ± 0.19 0.00 ± 0.00 0.00 ± 0.00 0.08 + 0.07 0.34 ± 0.22 0.00 ± 0.00 0.00 ± 0.00
PA-55 3.17 ± 0.48* 1.36 ± 0.1 1.78 ± 0.24 2.2 ± 0.32 0.00 ± 0.00 0.00 ± 0.00 0.9 + 0.62 2.16 ± 0.4 0.00 ± 0.00 0.1 ± 0.17
IA-65 2.9 ± 0.57* 3.03 ± 1.76 1.02 ± 0.89 1.24 ± 0.21 0.00 ± 0.00 0.00 ± 0.00 0.73 + 0.1 0.16 ± 0.27 0.00 ± 0.00 0.00 ± 0.00
PA-65 2.25 ± 0.11 0.21 ± 0.37 1.45 ± 0.46 2.51 ± 1.45 0.00 ± 0.00 0.36 ± 0.09 1.46 + 0.48 1.21 ± 1.19 0.49 ± 0.13 1.01 ± 1.01
IA-75 2.9 ± 0.8* 0.00 ± 0.00 1.86 ± 0.2 2.74 ± 0.73 0.10 ± 0.18 0.00 ± 0.00 1.19 + 0.06 1.28 ± 1.06 0.00 ± 0.00 2.57 ± 0.58
PA-75 0.00 ± 0.00 0.00 ± 0.00 1.9 ± 0.07 2.73 ± 0.59 0.59 ± 1.02 0.34 ± 0.07 0.54 + 0.07 1.81 ± 0.02 3.50 ± 0.31 1.18 ± 0.35Across
samples<0.0001 <0.0001 <0.0001 <0.0001 0.499 <0.0001 <0.0001 <0.0001 <0.0001 <0.0001
By moisture
(%)<0.0001 0.001 <0.0001 <0.0001 0.261 0.002 <0.0001 <0.0001 <0.0001 <0.0001
By type 0.242 0.064 0.820 0.016 0.419 0.003 0.906 <0.0001 0.013 0.607Moisture x
type0.017 0.046 0.634 0.103 0.654 0.002 0.003 <0.0001 0.001 0.681
By duration 0.081 0.511 <0.0001 <0.0001 0.236 0.293 <0.0001 0.466 0.021 0.002Moisture x
duration0.017 0.305 <0.0001 0.001 0.225 0.500 <0.0001 0.994 0.003 <0.0001
⁰ P-values by acid names are values when comparing storage acids by temperature.
*These samples are not significantly differnt from each other even though the color coding may indicate otherwise.
Sample with same color within each column are not significantly different from each other. Color gradient: intensity proportional to amount of acid.
Within acid types, in cases where there are significant differences across temperature, the sample with the relatively high acid content is distinquished with red font.
P-values in bold imply not significantly different
21
220
P-values
Organic acids (% dry matter)
Duration
(Days)
Moisture
(%)
Lactic (P < 0.0001) Acetic (P < 0.0001) Propionic (P = 0.483) Isobutyric (P < 0.0001) Butyric (P < 0.0001)
Table 3.3: Differences in organic acids in anaerobic storage across stover types, moisture levels, durations and temperatures

84
3.3.5 Corn stover composition before and after storage
Compositional analysis was completed for the IA stover only, with results from before and after
anaerobic wet storage presented in Table 4. Eleven components were analyzed with a mass closure
of 95 - 101%. Mannan was absent in all samples, so is not shown in Table 4. Although some
variations exist across moisture at Day 0, the percentages of each structural and non-structural
component of the feedstock were not significantly different after the initial moisture adjustment. For
storage samples (day 21 and day 220), significant compositional changes across moisture were
observed, especially at 23oC and 220 days of storage (see Table 4). There were no significant
differences in the percentage compositions of glucan, lignin, acetyl and ethanol extractives across
moisture for each storage duration and at the two storage temperatures.
From Table 5, it can be observed generally that the amounts of structural sugars decreased
significantly during storage with the exception of glucan. This was as expected since hemicelluloses
(a structural heteropolymer composed mainly of xylan as backbone and arabinan, galactan, glucan
side chains among others) are more reactive to acids than cellulose (a glucan polymer).
Hemicelluloses’ high reactivity to acid is partially due to its branched and amorphous nature in
contrast to cellulose, which is unbranched and substantially crystalline. Hemicellulose can be
depolymerized or degraded by hydrolysis of glycosidic linkages and acetyl groups. As much as 70%
of xylan is acetylated in hardwood (Timell, 1967), with the acetyl group constituting from 3 to17%
of the the hemicelluloses (Sun et al., 2004). In IA stover, on average, acetyl constituted 3.8 to 5% of
the stover composition and between 12 -15% of hemicelluloses, if glucose (a minor component of
hemicellulose) is ignored. Acetyl degradation of up to ~55% was observed during wet storage, and
only 7 samples out of 48 showed an increase rather than a decrease in acetyl content. There was
significant evidence of a temperature effect on the degradation of acetyl (p < 0.0001) but no
evidence of the effect of storage duration (p = 0.062) nor moisture (p = 0.07). There was also no
interaction between temperature, duration and moisture. Generally, acetyl degradation was ~7% at
23oC and averaged 37% at 37
oC.
While storage temperature was important for acetyl degradation, the reverse was the case for xylan.
There was no significant evidence of a temperature effect on xylan degradation (p = 0.518) but there

85
was evidence that duration and moisture had influence on xylan degradation (p < 0.0001 in both
cases). Although both duration and moisture had significant impact on xylan degradation, there was
no interaction between these two factors, but there was a significant interaction between duration
and temperature (p < 0.0001) as well as moisture and temperature (p = 0.013). These statistically
significant interactions indicate that the effects of both duration and moisture vary across the two
temperatures.
In contrast to the lumped analysis described above, observations within specific storage groups
(Day 21 at 23oC, Day 21 at 37
oC, Day 220 at 23
oC and Day 220 at 37
oC) indicated that the effect of
moisture was inconsistent and was not always significant. For instance at Day 21, 23oC the change
in xylan was not significantly different at all moisture levels except for 25% moisture, which was
slightly higher than the change at 45% and 75% moisture. Similarly at Day 220, 23oC the change in
xylan at all moisture levels was not significantly different except at 25% moisture, where xylan
degradation was slightly higher than the change at the 35%, 65% and 75% moisture levels.. Storage
moisture content did not result in significant differences in xylan degradation at Day 21, 37oC but at
Day 220, 37oC, the change in xylan at 45% was lower than the change at 25% and 55%. At Day 21,
xylan degradation increased with temperature, whereas at Day 220 it decreased with temperature.
Across all moisture levels and temperatures, xylan degradation at Day 21 averaged ~18% but by
Day 220 only averaged about 5%.
If degradation of hemicellulose is considered as a whole (xylan + arabinan + galactan + acetyl),
temperature, moisture and duration were each observed to have a significant effect (p = 0.011, 0.001
and < 0.0001 respectively). Although there was not evidence of a 3-way interaction among
temperature, moisture and duration, there was a significant 2-way interaction between temperature
and duration. Hemicellulose degradation ranged from 6% to 30%, with higher values obtained at
37oC_21 days. At day 21, hemicellulose degradation increased with temperature (~16% at 23
oC and
~ 25% at 37oC) but showed no significant difference across temperature at day 220 (~ 10% loss at
both temperatures). A regression analysis showed that temperature accounted for less than 3% of
the variation in hemicelluloses, while duration accounted for 43% and both combined accounted for
47%. Although hemicellulose is the most thermally reactive structural component, wood
hemicelluloses have good physical, structural and chemical stability up to 100oC (Fengel and
Wegener, 1984) and are quite similar to herbaceous hemicelluloses. Other factors like moisture can

86
influence the thermal response of structural components, but observations are also usually at above 100oC
(Fengel and Wegener, 1984). Since wet storage is at a much lower temperature, it seems unlikely to expect a
singular impact of temperature in the sense described in this literature. The higher degradation at 37oC is
more likely due to the increased rate of reaction of acids produced during storage, which would result
from the temperature increase. Previous studies ((McDonald et al. 1991; Muck, 1996) have always
attributed the change in hemicelluloses content to low pH and acid hydrolysis. Moreover, the
behavior of hemicelluloses seems to be strongly influenced by its major component, xylan, for
which a temperature effect can only be observed with duration and moisture.
Hemicellulose degradation by acids, whether during storage or thermochemical pretreatment, can
result in shorter chain polymers, oligomers, corresponding mono and disaccharides, sugar acids,
acetic acid and phenolic acids. At low temperatures, the acetyl group is the most susceptible to
degradation, resulting in acetic acid formation. The non-polymeric sugars and acid components
contribute to the soluble fraction of the stover, as indicated by the increase in the water extractive
component after storage. Water extractive components are non-structural compounds that can
dissolve in or be extracted by water. Generally, there was a significant increase in water extractives,
as percentage of dry matter, from ~5% on day 0 to ~ 10% after storage (p < 0.0001). Water
extractives were significantly higher at day 21 compared to day 220, with a mean increase of
~105% and 62% respectively on mass basis when compared to the extractive amounts at Day 0 (p =
0.009). The decrease in water extractives at day 220 could be due to consumption of sugars by
surviving microbes or chemical degradation. There were no significant temperature effects on the
amount of water extractives. With respect to moisture, there were no significant differences in the
amounts of water extractives except for the 25% moisture samples, where the amounts were smaller
than at 55%. Overall, the change in hemicelluloses has a negative correlation with the change in
water extractives, although not strongly (r = - 0.476, p = 0.001). However, looking at the individual
constituents of hemicelluloses across all treatments, only the change in xylan showed some
correlation (again negative) with the change in water extractives (r = - 0.466, p = 0.001). This may
be due to the relatively higher mass of xylan compared to other components. Alternatively, it could
suggest that acetyl [acetic acid] removal from xylan is a more important contributer to the total
amount of extractives than degraded sugars from hemicellulose. The amount of acetyl as a
percentage dry matter was higher than the amounts of galactan and arabinan, both of which are also

87
sugar components of hemicellulose. In contrast to this lumped analysis, when xylan’s association
with water extractives was considered within individual storage groups (day 21 at 23oC, day 21 at
37oC, day 220 at 23
oC and day 220 at 37
oC), no correlation was found. This was because each
group had a narrow range of xylan degradation, with virtually no significant change across
moisture. However, across groups the means were significantly different (day 21 at 37oC > day 21
at 23oC > 220 at 23
oC >220 at 37
oC), and had a wide change in extractives.
The glucan composition of Day 0 samples was not significantly different from that of Day 220, but
was lower than the glucan composition at Day 21. The percentage of glucan increased up to 2% at
day 21 relative to the initial glucan content, translating into the percentage mass changes as shown
in Table 5. A mass increase in glucan content of corn stover after wet storage seems unusual, but
similar result was reported by Richard et al. (2001) while Ren (2006) observed there was no
degradation of cellulose in plain stover silage. Other forage silage studies showed both mass
increase (Danley and Vetter, 1973) and mass decrease (Yahaya et al., 2002) in cellulose content
after ensilage. This increase in glucan concentration may be an artifact resulting from substantial
losses in other components, so that the total dry matter basis from which the concentration is
calculated is reduced. This result may also be due to the heterogeneous nature of the feedstock,
which introduces variability in moisture measurements and thus dry mass calculations. If this result
is real, a decrease in glucan concentration on Day 220 relative to Day 21 could result from partial
degradation of hemicelluloses, in which the glucan component is degraded and removed with the
water extractives. This is, however contentious since hemicellulose degradation was apparently less
at Day 220 compared to Day 21. The change in glucan content was significantly affected by
duration (p <0.0001) and moisture (p =0.002) but not temperature (p =0.100). In this lumped
analysis, although effect of moisture is significant, the difference was only for samples at 25%
moisture on Day 21 (23oC), which had significantly higher glucan than samples at 45% moisture on
Day 220 (23oC). However, within each storage group there was no significant change in the mass of
glucan across moisture for all storage durations.
With respect to other structural sugars, both arabinan and galactan degradation were significant (p <
0.0001 for each) and ranged from ~9% to 38% and ~ 12% to 50% of the initial arabinan and
galactan content respectively. Temperature and moisture effects on arabinan composition were not

88
significant, but the effect of storage duration was significant. For galactan, the effect of moisture
was also not significant (p = 0.997) but temperature and duration were both significant (p < 0.0001)
with evidence of interaction among temperature and duration (p < 0.0001). Across all storage
moisture conditions, average degradation of arabinan at Day 21 at 23oC = Day 21 at 37
oC > Day
220 at 23oC = Day 220 at 37
oC. Degradation of galactan at Day 21 at 23
oC = Day 21 at 23
oC > Day
220 at 23oC > Day 220 at 37
oC. Lignin content, as in the case of glucan, showed significant changes
only at 21 days of storage, with a mean decrease of up to 4.1% relative to initial lignin
concentration. Across all storage conditions, temperature had no significant effect on lignin
degradation (p = 0.407) while the effect of moisture was only observed for the 25% moisture
samples, which were lower than for 65% moisture (p = 0.021). Non-structural inorganics, most
likely soil and/or soil minerals, appeared to decrease at 21 days while structural inorganics [ash]
showed no significant difference for all storage groups even though changes across groups were
varied.
Overall dry matter loss was lower in wet storage than in dry storage, indicating that wet storage is
usually a more effective storage option if biomass preservation is an important goal. For the aerobic
25% moisture condition used as an analogue for dry storage, dry matter loss was between 2.66%
and 3.56%, and this loss was much higher for higher moisture contents. Even this low level for
aerobic storage at 25% moisture is high compared to many anaerobic wet storage conditions, where
losses are generally well under 4% even at very high moisture levels. And there is always risk of
compromise in dry storage, especially in open or semi-sheltered systems, where infiltration of water
even to the 35% moisture level would dramatically increase the dry matter losses (Figure 1).
Anaerobic wet storage can also risk significant degradation if silage containment is compromised
and air infiltration occurs, but in properly compacted silage such infiltration will typically not
penetrate deeply, and dry matter losses and compositional changes are not as dramatic.

89
Table 3.4: Composition (% dry basis) of IA stover before and after anaerobic storage
Duration
0
21 36.19 ± 1.42 33.91 ± 1.01 35.72 ± 1.52 34.99 ± 0.50 34.20 ± 0.29 33.97 ± 1.42 34.33 ± 0.57 36.79 ± 0.21 35.78 ± 1.55 36.83 ± 1.36 34.50 ± 1.24 36.35 ± 1.97 0.469 0.151
220 35.67 ± 0.67 33.98 ± 0.89 32.66 ± 3.29 35.18 ± 1.26 33.34 ± 0.69 33.29 ± 1.65 32.73 ± 0.30 35.10 ± 0.42 32.96 ± 0.03 34.39 ± 0.37 31.92 ± 0.59 35.06 ± 1.39 0.282 0.518
0
21 19.90 ± 0.65 17.09 ± 0.54 19.62 ± 0.64 17.39 ± 1.1 18.40 ± 0.53 17.16 ± 0.57 18.93 ± 0.27 18.37 ± 0.05 19.96 ± 0.75 19.04 ± 0.64 18.39 ± 0.09 18.61 ± 1.60 0.075 0.259
220 23.10 ± 0.43 23.14 ± 0.15 19.64 ± 0.62 22.92 ± 0.88 21.66 ± 1.43 21.16 ± 0.36 20.31 ± 0.70 22.85 ± 0.76 20.98 ± 0.16 23.02 ± 0.63 19.89 ± 0.39 22.99 ± 1.17 0.024 0.198
0
21 1.00 ± 0.02 0.81 ± 0.18 0.88 ± 0.05 0.67 ± 0.02 0.82 ± 0.04 0.75 ± 0.04 0.87 ± 0.01 0.81 ± 0.01 0.86 ± 0.06 0.88 ± 0.07 0.76 ± 0.00 0.75 ± 0.04 0.012 0.288
220 1.19 ± 0.06 0.91 ± 0.04 0.97 ± 0.06 0.85 ± 0.00 1.07 ± 0.01 0.82 ± 0.06 1.07 ± 0.01 0.91 ± 0.02 1.13 ± 0.09 0.90 ± 0.04 1.02 ± 0.00 1.00 ± 0.02 0.052 0.059
0
21 2.91 ± 0.14 2.64 ± 0.36 2.65 ± 0.13 2.38 ± 0.19 2.54 ± 0.01 2.49 ± 0.04 2.68 ± 0.12 2.78 ± 0.25 2.60 ± 0.08 2.67 ± 0.2 2.52 ± 0.08 2.75 ± 0.11 0.071 0.480
220 3.38 ± 0.14 3.20 ± 0.27 2.80 ± 0.04 3.05 ± 0.13 2.97 ± 0.01 2.99 ± 0.18 3.02 ± 0.06 3.13 ± 0.12 3.09 ± 0.16 2.99 ± 0.14 2.87 ± 0.01 3.60 ± 0.02 0.008 0.028
0
21 14.93 ± 0.58 15.25 ± 0.23 14.80 ± 0.02 14.94 ± 0.07 14.62 ± 1.02 14.87 ± 0.23 15.20 ± 0.62 15.20 ± 0.36 15.55 ± 0.24 15.23 ± 0.37 15.47 ± 0.16 14.97 ± 0.47 0.530 0.733
220 15.31 ± 0.29 15.59 ± 0.06 15.29 ± 0.23 15.63 ± 0.13 16.76 ± 0.06 17.63 ± 0.3 15.01 ± 0.19 16.26 ± 1.67 16.31 ± 1.78 15.18 ± 0.17 15.76 ± 0.24 16.84 ± 0.19 0.287 0.084
0
21 3.49 ± 1.05 3.02 ± 0.06 4.42 ± 0.57 2.62 ± 0.57 3.82 ± 1.73 3.12 ± 0.09 4.18 ± 1.7 2.98 ± 0.11 3.39 ± 1.00 3.22 ± 0.09 5.36 ± 0.14 3.10 ± 0.10 0.604 0.338
220 4.37 ± 0.49 2.44 ± 0.03 4.33 ± 0.02 2.51 ± 0.16 4.16 ± 0.65 2.59 ± 0.07 3.72 ± 0.04 2.49 ± 0.06 3.66 ± 0.16 2.52 ± 0.17 3.68 ± 0.04 2.64 ± 0.24 0.218 0.781
0
21 9.40 ± 0.02 10.18 ± 1.2 12.18 ± 0.53 11.21 ± 0.16 11.86 ± 0.88 10.8 ± 0.32 12.23 ± 1.15 10.37 ± 0.15 10.97 ± 0.79 10.12 ± 0.71 9.13 ± 0.50 8.83 ± 0.12 0.016 0.070
220 5.47 ± 1.53 8.22 ± 0.22 9.85 ± 0.21 10.79 ± 0.39 10.27 ± 0.18 8.45 ± 2.43 8.80 ± 0.14 9.66 ± 1.70 6.99 ± 0.18 10.89 ± 0.14 7.09 ± 0.83 5.03 ± 1.75 0.003 0.043
0
21 2.67 ± 1.17 2.93 ± 0.08 2.55 ± 0.78 2.95 ± 0.09 2.84 ± 0.87 3.02 ± 0.05 2.66 ± 1.01 2.83 ± 0.01 2.46 ± 0.37 2.54 ± 0.43 2.56 ± 0.90 2.97 ± 0.18 0.998 0.302
220 3.92 ± 0.31 3.16 ± 0.12 3.75 ± 0.13 2.70 ± 0.06 2.17 ± 0.01 1.51 ± 0.82 3.71 ± 0.11 2.37 ± 0.73 3.65 ± 3.48 3.14 ± 0.04 3.74 ± 0.13 2.81 ± 0.18 0.074 0.074
0
21 2.21 ± 0.08 1.33 ± 0.95 1.34 ± 0.74 2.49 ± 0.14 2.11 ± 0.74 2.61 ± 0.08 1.44 ± 0.83 2.00 ± 0.17 2.15 ± 0.86 2.08 ± 0.71 2.36 ± 0.82 2.87 ± 0.13 0.639 0.154
220 2.17 ± 0.25 3.85 ± 0.02 2.73 ± 0.22 2.61 ± 0.23 2.24 ± 0.32 3.48 ± 0.37 2.57 ± 0.08 2.27 ± 0.24 3.40 ± 0.18 2.70 ± 0.28 3.12 ± 0.33 3.43 ± 1.16 0.013 0.127
0
21 4.54 ± 0.04 5.28 ± 0.44 4.07 ± 0.27 4.68 ± 0.03 4.62 ± 0.36 4.57 ± 0.17 4.94 ± 0.62 4.30 ± 0.16 4.97 ± 0.36 5.66 ± 1.05 5.53 ± 0.08 5.60 ± 0.11 0.059 0.115
220 4.20 ± 0.13 4.52 ± 0.10 4.43 ± 0.01 3.97 ± 0.31 4.71 ± 0.34 4.06 ± 0.24 4.69 ± 0.14 4.35 ± 0.06 5.12 ± 0.19 4.88 ± 0.14 6.06 ± 0.27 6.39 ± 0.96 0.001 0.010
3.82 ± 1.30 0.525
Values in red are for s torage at 37oC. P-va lues are for comparison across moisture
Structural inorganics
2.50 ± 0.59 2.23 ± 1.74 2.58 ± 0.65 2.62 ± 0.73 2.47 ± 0.95
2.20 ± 1.05 0.719
Non Structural
inorganics
4.51 ± 0.62 5.12 ± 2.04 5.10 ± 0.75 4.17 ± 0.75 5.22 ± 0.90 5.84 ± 0.85 0.531
Ethanol extractives
2.92 ± 0.22 2.58 ± 0.62 2.73 ± 0.92 2.90 ± 0.21 2.35 ± 0.83
4.20 ± 1.56 0.817
Water extractives
6.09 ± 2.09 4.96 ± 2.08 4.32 ± 4.12 7.32 ± 1.99 3.73 ± 2.84 4.40 ± 2.88 0.584
Acetyl
4.28 ± 1.18 5.00± 1.39 4.62 ± 1.18 3.81 ± 0.94 4.22 ± 0.61
3.81 ± 0.06 0.995
Lignin
15.02 ± 0.23 15.55 ± 0.57 15.96 ± 0.92 14.77 ± 0.20 15.90 ± 1.77 15.50 ± 1.25 0.574
Arabinan
3.81 ± 0.11 3.9 ± 0.27 3.80 ± 0.47 3.85 ± 0.08 3.84 ± 0.27
23.01 ± 2.73 0.921
Galactan
1.29 ± 0.08 1.35 ± 0.07 1.32 ± 0.11 1.24 ± 0.10 1.31 ± 0.11 1.37 ± 0.14 0.674
Xylan
22.05 ± 2.55 22.68 ± 1.84 22.28 ± 2.12 21.41 ± 1.28 22.92 ± 1.73
p-value
Glucan
33.02 ± 1.69 33.61 ± 1.43 33.43 ± 3.03 32.92 ± 1.04 33.64 ± 1.43 33.12 ± 1.71 0.991
Storage Moisture (%)
25 35 45 55 65 75
Significantly different samples
Xylan (23oC-220D): 25% moisture content different from 35%; 35% -75% not significantly different
Galactan (23oC-21D): All not significantly different except for 25%, which was different from 45% and 75%
Arabinan (23oC-220D): 25% and 65% not significantly different; 35% -75% not significantly different
Arabinan (37oC-220D): 25% not significantly different from all other moistures; 35%, 45% and 55% significantly different from 75 but not from each other
Water Extractable (23oC-220D): 25%, 65% and 75% not significantly different; 35% -55% not significantly different
Water Extractable (23oC-21D): All not significantly different except for 25% significantly different from 35% and 55%
Water Extractable (37oC-220D): All moisture not significantly different except for 75% MC, which is lower
Non-structural inorganic (23oC-220D): 25% - 55% not significantly different; 35% - 75% not significantly different; 45% different from 65%
Structural inorganic (23oC-220D): 25% -55% not significantly different; 35% - 65% not significantly different; all levels different from 75%
Structural inorganic (37oC-220D): All moisture not significantly different except for 75% moisture, which is higher

90
Table 3.5: Comparing average percentage change, on mass basis, in anaerobic storage samples by groups with reference to Day 0
23oC 4.9% 0.001 14.8% < 0.0001 34.9% < 0.0001 31.5% < 0.0001 6.0% 0.469 3.3% 0.031 5.5% 0.195 29.2% 0.008 113.1% < 0.0001 1.3% 0.888
37oC 5.1% 0.005 21.0% < 0.0001 41.8% < 0.0001 32.9% < 0.0001 31.8% < 0.0001 4.1% 0.009 1.6% 0.695 19.2% 0.048 97.7% < 0.0001 9.8% 0.081
23oC 2.3% 0.147 8.6% < 0.0001 20.1% < 0.0001 23.1% < 0.0001 10.3% 0.026 0.8% 0.686 5.2% 0.493 2.5% 0.771 54.8% 0.001 32.6% 0.011
37oC 1.3% 0.368 1.0% 0.488 33.3% < 0.0001 19.8% < 0.0001 43.1% < 0.0001 1.9% 0.379 9.0% 0.081 10.1% 0.303 68.9% < 0.0001 1.3% 0.885
Day 220
Lignin Structural Inorganics
Non-structural
Inorganics Water Extractives
Ethanol
Extractives
Day 21
Glucan Xylan Galactan Arabinan Acetyl
Note: a significant difference for any of the components does not imply differences at all moisture level rather that there is an increase or decrease in at least one moisture level
Values to the left = percentage change in component (lumped means) with reference to day 0; values to right = p-value; p-values in red imply not significantly different from day 0
Arrows
Pointing up = increase in composition above day 0 by the percentage indicated
Pointing down = decrease in composition by percentage indicated
Horizontal arrows: Pointing left = average value is less than Day zero’s but not significantly different; Right = greater than Day 0 but not significantly different from Day zero
Arrow thickness reflects the relative proportion of each component, on day 0, as a percent of total mass (comparison across row)
Arrow height reflects the relative gain or loss in mass. That is, shows the relative change among group for each particular component. The height does not reflect proportional
changes across components

91
3.4 Conclusions
Anaerobic storage was shown to work well at a wide range of moisture contents, providing
farmers with more flexibility in scheduling the harvest of their biomass feedstock. Although
some variability exists, in general the dry matter loss, organic acid profile and stover
composition were similar for most moisture levels for a given anaerobic storage duration. Wet
storage at 35% [low] moisture is therefore just as effective as storage at 65% [high] moisture,
with outcomes that are generally not significantly different. The relative responses of each stover
type to the varying effect of storage factors (temperature, moisture and duration) in both aerobic
and anaerobic conditions were similar, although in some cases the magnitudes differ
significantly with stover type. Under anaerobic conditions, significant differences in dry matter
loss were observed mainly at 37oC, and even then with no significant difference in 35- 65%
moisture samples. The results also indicated that moisture and temperature were not good
predictors of dry matter loss under anaerobic conditions, whereas under aerobic storage
conditions moisture was the major predictor and the effect of temperature was significant. For
the anaerobic storage samples with their generally lower dry matter losses, there was wide
variability in gravimetric dry matter loss determination for both total dry matter and several
individual constituents.
With respect to organic acids, differences across stover types were observed mainly at 37oC and
at high moistures. The relative proportion of each acid in the portfolio differed, but the total
amount of organic acids did not vary significantly. Although there was some evidence of
secondary butyric acid fermentations, the effect was small and impacts of acid inhibition in
downstream processes do not seem likely. This is important to a robust storage process, as
secondary fermentations can be a major problem for the livestock industry by decreasing silage
palatability. Although stover type had an effect on pH, generally, there was no significant
difference across storage duration for the 45% - 65% moisture samples.
Within the anaerobic storage treatments, the most influential storage factor with respect to stover
composition was storage duration. Storage duration impacted Arabinan, galactan, glucan, lignin,
water extractives and xylan compositions. On the other hand, temperature was influential only
for acetyl and galactan degradation and the storage moisture content was significant only for

92
lignin, water extractives and xylan. With respect to the various components of hemicelluloses,
the least degraded component as a percentage of its initial composition was xylan. For most
stover constituents, changes over the storage period were not linear and in the long run were
generally not significantly different from Day 0.
In general, once extreme moisture levels are avoided, quality in terms of feedstock composition
is not significantly different for biomass stored anaerobically. The determining factor, therefore,
for storage conditions would not be compositional issues but rather the economics of
transportation of high moisture biomass to a refinery, which is likely to draw from a large area so
transportation distances may be great. Compared to dry storage, wet storage could present an
additional advantage (besides issues with narrow harvest windows and reduced soil
contamination) if water soluble extractives can be conserved to avoid degradation of simple
sugars during subsequent processes. Furthermore, it can be assumed that freshly harvested
feedstock will give a more positive result than the rewetted dry corn stover feedstock used in this
study.
3.5 References
Atchison, J. E. and J. R. Hettenhaus. 2004. Innovative methods for corn stover collecting,
handling, storing and transporting. Available at
http://www.nrel.gov/docs/fy04osti/33893.pdf Accessed 27 August, 2008.
Ayers S. H. and P. Rupp. 1918. Simultaneous acid and alkaline bacterial fermentations from
dextrose and the salts of organic acids. The Journal of Infectious Diseases 23 (2): 188-
216.
Battcock, M and S. Azam-Ali. 1998. Fermented fruits and vegetables—a global perspective.
FAO Agricultural Services Bulletin, no. 134. FAO, Rome, pp. 7 – 12.
Bevill, K. 2011. Funding better biomass: USDA, DOE seek collaborative projects. Available at
http://www.ethanolproducer.com/articles/7771/funding-better-biomass Accessed on 09
July, 2013.
Brinton, W.F. 1998. Volatile organic acids in compost: production and odorant aspects. Compost
Science and Utilization 6 (1): 75–82.

93
Buckmaster D. R. 1992. Indoor hay storage: dry matter loss and quality changes. Extension
education: PM102. Pennsylvania State University.
Chen, Q. 2009. Ensiling corn stover with enzymes as a feedstock preservation method for
bioconversion. PhD Dissertation. University Park, Pennsylvania: The Pennsylvania State
University, Department of Agricultural and Biological Engineering.
Condon, S.1987. Responses of lactic acid bacteria to oxygen. FEMS Microbiological Reviews 46
(3): 269 – 280.
Danley, M.M., and R.L. Vetter. 1973. Changes in carbohydrate and nitrogen fractions and
digestibility of forages: maturity and ensiling. Journal of Animal Sciences 37: 994–999
DOE/EERE. 2012. 2011 Platform review report: an independent evaluation of platform activities
for FY 2010 and FY 2011. Department of Energy DOE/EE-0656. Available at
http://www1.eere.energy.gov/bioenergy/pdfs/2011_feedstock_review.pdf Accessed on
09 July, 2013.
Edwards, R., S. Szekeres, F. Neuwahl and V. Mahieu. 2008. Biofuels in the European context:
facts and uncertainties. G. De Santi; EU Joint Research Centre. Available at
http://ec.europa.eu/dgs/jrc/downloads/jrc_biofuels_report.pdf Acessed on 15 February
2009.
Emery I R and N. S. Mosier. 2012. The impact of dry matter loss during herbaceous biomass
storage on net greenhouse gas emissions from biofuels production. Biomass and
Bioenergy 39: 237-246.
Fargione, J., J. Hill, D. Tilman, S. Polasky and P.Hawthorne. 2008. Land clearing and the biofuel
carbon debt. Science 319 (5867): 1235-1238.
Farrell, A. E., R. J. Plevin, B. T. Turner, A. D. Jones, M. O’Hare, D. M. Kammen. 2006. Ethanol
can contribute to energy and environmental goals. Science 311 (5760):506 – 508.
Fengel, D., and G. Wegener. 1984. Wood chemistry, ultrastructure, reactions. Berlin, Germany.
Walter de Gruyter & Co.
Hames B, R Ruiz, C Scarlata, A Sluiter, J Sluiter, D Templeton. 2008. Preparation of Samples
for Compositional Analysis. Laboratory Analytical Procedure (LAP) NREL/TP-510-
42620. Golden, CO : National Renewable Energy Laboratory.
Heinrichs, J. and P. Kononoff. 2002. Evaluating particle size of forages and TMRs using the new
Penn State Forage Particle Separator. Pennsylvania State University, College of
Agricultural Sciences, Cooperative Extension DAS 02-42.

94
Hugh R., and E. Leifson. 1953. The taxonomic significance of fermentative versus oxidative
metabolism of carbohydrates by various gram-negative rods. Journal of
Bacteriology 66:24–26.
Humbird, D., R. Davis, L. Tao, C. Kinchin, D. Hsu, A. Aden, P. Schoen, J. Lukas, B. Olthof, M.
Worley, D. Sexton, and D. Dudgeon. 2011. Process design and economics for
biochemical conversion of lignocellulosic biomass to ethanol. NREL/TP-5100-47764.
Jones, C. M., A. J. Heinrichs, G. W. Roth, and V. A. Ishler. 2004. From harvest to feed:
understanding silage management. Agricultural Research and Cooperative Extension.
The Pennsylvania State University.
Knauf, M. and K. Kraus. 2006. Specific yeasts developed for modern ethanol production.
Spezielle Hefen für die Ethanolgewinnung 131: 753-758.
Koser, S. A. 1923. Utilization of the salts of organic acids by the colon-aerogenes group. Journal
of Bacteriology 8(5): 493–520.
Kram, J.W. 2008. In Search of biomass storage solutions. Available at
http://www.ethanolproducer.com/article.jsp?article_id=3623 Accessed 01 August 2009.
Kung,Jr. L. 2008. Silage fermentation end products and microbial populations: their relationships
to silage quality and animal productivity. Proc. Annual Conference of the American
Association of Bovine Practitioners, Sept 25-27, Charlotte, NC.
Linden, J. C., L. L. Henk, V. G. Murphy, D. H. Smith, B. C. Gabrielsen, R. P. Tengerdy and L.
Czako. 1987. Preservation of Potential Fermentables in Sweet Sorghum by Ensiling.
Biotechnology and Bioengineering 30:860-867.
Liska, A. J., H. S. Yang, V. R. Bremer, T. J. Klopfenstein, D. T. Walters, G. E. Erickson, and K.
G. Cassman. 2009. Improvements in life cycle energy efficiency and greenhouse gas
emissions of corn-ethanol. Journal of Industrial Ecology 13(1): 58-74.
Lund, B. M and T. Eklund. 2000. Control of pH and use of organic acids. In The microbiological
safety and quality of food, Volume 1; Part 1: Principles and Applications of Food
Preservation Techniques 175-199. Lund, B. M, T. C. Baird-Parker, G.W. Gould. Aspen
publishers, Inc.
McDonald, P. A. R. Henderson, and S. J. E. Heron. 1991. The Biochemistry of Silage, 2nd ed.
Marlow, Bucks, UK: Chalcobe Publications.
McGechan M.B. 1990. A review of losses arising during conservation of grass forage: part 2.
Storage losses. Journal of Agricultural Engineering Research 45: 1 - 30.

95
Muck, R. 1996. Inoculation of silage and its effects on silage quality. Available at
http://www.dfrc.wisc.edu/Research_Summaries/ind_meet/dfrc7.pdf Accessed 28 July
2009.
Palmqvist, E. and B. Hahn-Hägerdal. 2000. Fermentation of lignocellulosic hydrolysates. II:
inhibition and detoxification. Bioresource Technology 74(1): 25-33.
Piltz, J.W. and A.G. Kaiser. 2003. Chapter 2: Principles of silage preservation. In Successful
silage. 24 -56. Kaiser, A.G., J.W. Piltz, , H.M. Burns, and N.W. Griffi ths, (Eds). New
South Wales. NSW Agriculture, Dairy Research and Development Corporation.
Ren, H. 2006. Effect of cell wall degrading enzymes and chemicals on corn stover preservation
and pretreatment during ensilage processing. PhD Dissertation. University Park,
Pennsylvania: The Pennsylvania State University, Department of Agricultural and
Biological Engineering.
Ren, H., T. L. Richard, Z. Chen, M. Kuo, Y. Bian, K. J. Moore and P. Patrick. 2006. Ensiling
corn stover: effect of feedstock preservation on particleboard performance. Biotechnology
progress 22(1): 78-85.
Richard, T.L. 2003. Gas phase kinetics. pp 431-435. In: The Encyclopedia of Agricultural,
Food and Biological Engineering. D.R. Heldman (Editor). Marcel Dekker, Inc., New
York.
Richard, T.L. 2004. Fundamental parameters of aerobic solid-state bioconversion processes.
Pages 262-277 in: Organic solid waste management: from waste disposal to resource
recovery. P. Lens, H.V.M. Hamelers, H. Hoitink and W. Bidlingmeier (eds.). IWA,
London.
Richard, T. L. S. Proulx, K. J. Moore, and S. Shouse. 2001. Ensilage technology for biomass pre-
treatment and storage. ASAE paper No. 016019. St. Joseph, Mich.: ASAE.
Searchinger, T., R. Heimlich, R. A. Houghton, F. Dong, A. Elobeid, J. Fabiosa, S. Tokgoz, D.
Hayes, and T.-H. Yu. 2008. Use of U.S. croplands for biofuels increases greenhouse
gases emissions through land-use change. Science 319 (5867): 1238–1240.
Sluiter A, R Ruiz, C Scarlata, J Sluiter, and D Templeton. 2008a. Determination of extractives
in biomass. Laboratory Analytical Procedure (LAP) NREL/TP-510-42619. Golden, CO :
National Renewable Energy Laboratory.
Sluiter A, B H ames, R Ruiz, C Scarlata, J Sluiter, D Templeton, D Crocker.
2008b. Determination of structural carbohydrates and lignin in biomass. Laboratory

96
Analytical Procedure (LAP) NREL/TP-510-42618. Golden, CO: National Renewable
Energy Laboratory.
Sluiter, A., B. Hames, , R. Ruiz, C.Scarlata, , Sluiter, J., Templeton, D. 2008c. Determination of
ash in biomass. Laboratory Analytical Procedure (LAP) NREL/TP-510-42622. Golden,
CO: National Renewable Energy Laboratory.
Shinners, K. J., B. N. Binversie, R. E. Muck, and P. J. Weimer. 2007. Comparison of wet and dry
corn stover harvest and storage. Biomass and Bioenergy 31(4): 211‐221.
Stenberg, K., M. Galbe and G. Zacchi. 2000. The influence of lactic acid formation on the
simultaneous saccharification and fermentation (SSF) of softwood to ethanol. Enzyme
and Microbial Technology 26: 71–79.
Sun, R. C., X. F. Sun, and J. Tomkinson. 2004. Hemicelluloses and their derivatives. American
Chemical Society (ACS) Symposium Series 864: 2–22.
Thomas, K. C., S. H. Hynes, and W. M. Ingledew. 2002. Influence of Medium Buffering
Capacity on Inhibition of Saccharomyces cerevisiae Growth by Acetic and Lactic Acids.
Applied and Environmental Microbiology, 68(4): 1616–1623.
Thomsen, M. H., J. B. Holm-Nielsen, P. Oleskowicz-Popiel and A. B. Thomsen. 2008.
Pretreatment of whole-crop harvested, ensiled maize for ethanol production. Applied
Biochemistry & Biotechnology 148:23–33.
Timell, T E .1967. Recent progress in the chemistry of wood hemicelluloses. Wood Science
Technology 1:45-70.
Tiquia, S.M., T.L. Richard and M.S. Honeyman. 2002. Carbon, nutrient and mass loss during
composting. Nutrient Cycling in Agricultural Ecosystems. 62(1):15-24.
Torija, M. J., G. Beltran, M. Novo, M. Poblet, N. Rozes, A. Mas, and J. M. Guillamon. 2003.
Effect of organic acids and nitrogen source on alcoholic fermentation: study of their
buffering capacity. J. Agric. Food Chem. 51(4): 916–922.
Yahaya, M. S., M. Kawai, J. Takahashi and S. Matsuoka. 2002. The effects of different moisture
and ensiling time on silo degradation of structural carbohydrates of orchardgrass. Asian-
Australasian Journal of Animal Sciences 15(2): 213-217.
Zaldivar, J. and L. O. Ingram. 1999. Effect of organic acids on the growth and fermentation of
ethanologenic Escherichia coli LY01. Biotechnology and Bioengineering 66(4): 203 -
210.

97
Chapter 4
Corn stover reactivity to cellulolytic enzymes after wet storage
Abstract
Wet storage, synonymous to ensilage, has gained attention as an alternative biomass storage
method for biofuels since 2001, although ensilage been used to preserve forage for livestock feed
for millennia. In this natural process organic acids are produced by anaerobic microbial
degradation of a small fraction of the biomass, and these acids reduce the pH to levels that
minimize further microbial activity and can preserve the biomass for years if anaerobic
conditions are maintained. The interest in this storage method is reinforced by the potential
capability of the organic acids that make this an effective storage strategy to also serve as a mild
pretreatment to enhance downstream conversion processes. The degree and significance of this
natural pretreatment capability of wet storage on downstream processes has, however, not been
verified. Several studies have shown that hemicelluloses are degraded during wet storage, but
there remain questions about whether this degradation is adequate to serve as the sole
pretreatment or reduce the required severity of subsequent pretreatment. In this study, the degree
of pretreatment was investigated by measuring the reactivity of corn stover fiber to cellulolytic
enzymes. Although the results indicated significant improvement in hydrolytic outcomes after
wet storage, saccharification of cellulose to sugar monomers was still limited. The implication of
these results is that post storage pretreatment would still be necessary. The results also show that
dominance of lactic acid in the ensilage process is key to wet storage pretreatment effectiveness.
This is because of the lower pKa of lactic acid compared to pKa of other silage acids. Lactic acid
pka is lower than typical silage pH, giving lactic acid the advantage of having more dissociated
form, hence making protons relatively more available to facilitate the hydrolytic pretreatment
process.
Key words: Ensilage, pretreatment, organic acid, wet storage, corn stover, hydrolysis, glucose,
cluster analysis

98
4.1 Introduction
Two main attractions of wet storage under anaerobic conditions are (1) minimizing dry matter
loss, and (2) enhancing downstream pretreatment and conversion processes. In the first case, it is
well established that the production of organic acids and associated reduction of pH have
bacteriostatic or bactericidal effects on most spoilage microbes, and the outcome is a well
preserved feedstock with reduced dry matter loss. For the second case, previous studies have
suggested the potential of the organic acids produced during storage to break some structural
bonds or alter cell wall structure, thereby serving as a pretreatment mechanism. The idea of
ensilage serving as an avenue for in situ pretreatment of the biomass to enhance the downstream
ethanol fermentation process was suggested by Linden et al. (1987) and Richard et al. (2001).
Several more recent studies have documented promising effects (Chen et al., 2007; Digman et
al., 2007; Ren et al., 2007; Thomsen et al., 2008; Oleskowicz-Popiel et al. 2010; Pakarinen et al.,
2011), although the range of silage conditions and their impacts have not been fully explored.
The pretreatment mechanism of organic acids during wet storage is hypothesized to be similar to
that of dilute hydrochloric, sulfuric, or phosphoric acid, as these inorganic acids have been
extensively explored for the pretreatment of lignocellulosic feedstocks. However, there are
important difference between wet storage and pretreatment in terms of both temperature and
time. In the case of inorganic acid pretreatment, the acid-amended biomass is exposed to high
pressures and temperatures (typically 120oC to 200
oC) for a period of minutes, whereas in wet
storage the temperatures would be much lower (20oC to 40
oC) but the duration much longer on
the order of months to years. The purpose of pretreatment is to allow more effective enzymatic
hydrolysis of sugar polymers into sugar monomers, as those sugar monomers can serve as a
reactive intermediate for fermentations that produce biochemicals and biofuels. The two main
polysaccharides of interest in lignocellulosic feedstocks are cellulose and hemicelluloses. The
reactivity of acids with biomass is random and targeted mainly at glycosidic bonds, which are
found between and within the polysaccharide chains. Dilute acid hydrolysis results in partial
hydrolysis of glycosidic bonds, and can also result in degradation of lignin if temperatures are
above 180oC (Chesson, 1993). At ambient temperatures, which would be typical of most wet
storage systems for biofuel production, acid hydrolysis is slow and limited to the amorphous

99
regions where the hydrolytic reaction is initiated (Tímár-Balázsy and Eastop, 1998; Stoddart,
2007). Amorphous cellulose constitutes anything from 10% to 50% of total wood cellulose,
depending on the feedstock (Jacobson and Wyman, 2000). Cellulose is less susceptible to acid
pretreatment because of its highly crystalline nature. In contrast, hemicellulose has a
comparatively lower degree of polymerization and a highly branched, heterogeneous and fully
amorphous structure that makes it more susceptible to acid reactions. Another factor contributing
to hemicellulose’s susceptibility is the presence of α-glycosidic bonds in the side chains, which
are less stable than the β-bonds found in cellulose and the main chain of hemicellulose. The
pretreatment capability of organic acids, produced under wet storage conditions, is therefore
achieved mainly through hemicellulose hydrolysis.
A number of studies (McDonald et al. 1991; Muck, 1996; Richard et al., 2001; Ren et al. 2006)
have shown the preferential degradation of hemicelluloses over cellulose during ensilage. The
hydrolysis of hemicelluloses is an important pretreatment outcome of conventional acid or liquid
hot water pretreatment, and the effectiveness of these pretreatment processes is associated with
the amount of hemicelluloses removed (Wyman, 1999; Sun and Cheng, 2002; Mosier et al.
2005). Conventional dilute acid pretreatment can result in up to 90% removal of xylose (the
major constituent of hemicellulose), while liquid hot water pretreatment can remove up to 51%
(Elander et al., 2005; Zheng et al., 2009). Since the structural sugars are bound or linked
together throughout the plant cell wall, it can be expected that the degradation of hemicellulose
will increase the surface area and allow enzymes access to other structural components through
the openings created by their removal. Levels of hemicellulose degradation in silages can range
from 0.5% or less (Muck, 1996) to as high as 54% depending on the crop type, storage
conditions and storage additives (Ren, 2006). These variations in hemicellulose degradation not
only reflect the heterogeneity of biomass feedstocks, but also the sensitivity of wet storage to
different conditions, and thus pose a potential challenge to wet storage as a complement to other
pretreatment systems.
In addition to measures of hemicellulose degradation during wet storage, electron micrographs
show evidence that the structure of ensiled corn stover differs from that of unensiled stover

100
(Donohoe et al. 2009; Oleskowicz-Popiel et al. 2010). Several of these images are reproduced for
comparison in Appendix C, Figures C1 and C2. However, the significance of these impacts has
not been verified. Investigations (Linden et al., 1987; Henk and Linden, 1994; Chen et al., 2007;
Digman et.al., 2007) into downstream processing of ensilage usually involve enhanced silage,
which is ensilage with some form of additive. The controls, silage without additives, were not
consistently better or similar to unensiled samples with respect to hydrolytic and fermentation
yields. These studies have implicitly attributed the effectiveness of silage as a pretreatment or
hydrolytic tool to these silage additives, and overlooked the potential of the plain, unamended
ensilage process.
The specific objective of this study was to determine the fiber reactivity of plain silage based on
storage conditions and relate this to the corresponding organic acid profile. For reporting
purposes, the organic acid profile relates to the types, amount and relative proportion of each
acid present during storage. The fiber reactivity concept was adapted from Henk and Linden
(1994) and refers to how easily the fiber can be converted to sugar through enzymatic reaction.
The essence of the fiber reactivity test is to determine if organic acids produced during ensilage
have any significant pretreatment effect on fiber structure. The response to enzymatic reaction
would be an indication of the degree of pretreatment that has occurred during storage, and can be
used in defining the pretreatment capability of wet storage.
4.2 Materials and Methodology
4.2.1 Stover description and storage
Corn stover from Iowa (IA stover) was obtained in 2008 from US Department of Energy’s Idaho
National Lab while stover from Pennsylvania (PA stover) was obtained from the Penn State
Dairy farm. The IA stover, planted from Pioneer brand 34A20 seed, was conventionally
harvested after the grain harvest in fall of 2007 from the Boyd plot near Boone, IA. After field-
drying for 3 to 5 days it was raked, baled, transported to Idaho and stored indoors with a tarp
cover to prevent dust accumulation. Particle size reduction to 1 inch minus (less or equal to 25.4
mm) was carried out in the early summer of 2008. The PA stover, planted from Dekalb DKC54-

101
46 seed, was left standing in the field through the winter of 2007 and harvested and chopped in
spring of 2008.
The particle size distribution was analyzed using the Penn State Forage Particle Separator. The
PA stover had approximately 26 % of particles greater than 19 mm, 26 % were between 19 and
8 mm, 37 % were between 8 and 1.18 mm and 11 % were less than 1.18 mm. The IA stover had
a similar distribution; 26 % of particles greater than 19 mm, 26 % were between 19 and 8 mm,
31 % were between 8 and 1.18 mm and 17 % were less than 1.18 mm. A description of this
particle size separation method can be found in Heinrichs and Kononoff (2002).
Corn stovers from these two origins were presumed to have different compositional quality. The
initial moisture contents of the IA and PA stovers, approximately 7% and 30% respectively, were
adjusted to six various moisture levels (25, 35, 45, 55, 65, and 75% wet basis). Moisture
adjustment was as described in Chapter 3 and was within ±2 percentage units of the target
moisture. Corn stover was packed at a density of about 159 dry Kg/m3 in 1 pint (0.00047 m
3)
glass canning jars that were tightly sealed to create anaerobic conditions and stored for 220 days
at 37oC. Experiments were performed in triplicate. After storage, samples were stored in the
freezer at -20oC until further analysis. See Appendix C, Figures C3 and C4, for process chart and
experimental plan.
4.2.2 Corn stover compositional analysis
Glucan and xylan composition of the IA stover were determined using the methods described in
Chapter 3. The composition of the PA stover was only determined for day 0, again using the
methods described in Chapter 3. Glucan and Xylan degradation in PA stover, during storage, was
assumed to be similar to IA stover and deducted accordingly to obtain composition for day 220.
4.2.3 Organic acids and fiber reactivity test
Soluble extracts were collected before and after storage for organic acid measurements. Stover
samples were mixed with deionized water at a ratio of 1:10, wet stover weight: water. The
mixtures were shaken for 30 minutes at 200 rpm using a Barnstead SHKA 2000 open air
platform shaker (Barnstead International, Dubuque, IA) after which the extracts were filtered

102
through Whatman No.1 paper. The collected extracts were filtered again using 0.2 m PTFE
filters, diluted 20-fold and analyzed using Dionex ICS 3000 ion exclusion chromatography
(Thermo Fisher Scientific Inc., Dionex ICS 3000, Sunnyvale, CA) for types and amount of
organic acids. Separation was performed at 30oC using IonPac ICE-AS1 guard (4 x 50 mm) and
analytical (4 x 250 mm) columns with 100 mM methanesulfonic acid at a flowrate of 0.16
mL/min. Organic acids were detected with a photodiode array detector (Dionex UVD 340U) at a
wavelength of 210 nm. Thirteen different potential acids (lactic, acetic, butyric, pyruvate,
isobutyric, valeric, isovaleric, propionic, tartaric, malic, formic, citric, succinic) were used as
standards.
Fiber reactivity across moisture levels
For the fiber reactivity assay, replicates of wet stored samples, “as is” were combined then
washed so that the organic acids and background sugar level were negligible and did not
interfere with the assay either by inhibiting enzyme activity or inflating hydrolytic yields. Also,
the removal of all extracts provided a better basis for directly testing the fibers. Samples “as is”
refer to silage without any post storage processing like drying or further size reduction. Washing
the “as is” silage was accomplished in multiple steps, starting with a Waring laboratory blender
with a 1: 10 dry stover: water ratio on low speed for 15 seconds followed by high speed for 10
seconds. The liquid was drained with a sieve, rinsed with water and transferred to plastic
centrifuge bottles. Water was added to obtain a 1:50 dry stover: to water ratio and shaken at 120
rpm for 30 minutes in a Barnstead Max Q5000 SHKE 5000-7 floor shaker (Barnstead
International, Dubuque, IA). The liquid was drained and the washing was repeated. After
washing, samples were drained with a sieve and compressed with a mechanical press to get rid of
excess free water. Water was added to the solids at a 1:00 dry stover: to water ratio and shaken at
120 rpm for 30 minutes, after which supernatants were collected to analyze for residual sugar.
The residual sugars in the washed samples were less than or about 0.01% on a dry matter basis.
The moisture content of washed samples was estimated using the microwave method (Jones et
al., 2004) as a guide to how much wet material was required to achieve the target dry weight for
the fiber reactivity test. Fiber reactivity was measured by how much glucose was released after
three days of enzymatic hydrolysis without pretreatment. For the PA stover samples, washed

103
samples were hydrolyzed at 15% solid loading using a commercial cellulase (Spezyme CP,
Genencor, Rochester, NY) at 0, 2, 5 and 15 FPU/g initial glucan and a commercial β-glucosidase
(Novozyme 188, Novozymes A/S, Bagsvaerd, Denmark) at 0, 8, 20 and 60 CBU/g initial glucan.
The different enzyme application levels were used on the PA stover samples to explore the
sensitivity of ensiled and unensiled feedstock to these enzyme loading rates. Hydrolysis was
carried out in 50 ml centrifuge tubes with approximately 1 dry gram of stover and in triplicates.
Tetracycline was added at a final concentration of 40 μg/mL to prevent microbial growth during
hydrolysis, and citric acid buffer (pH 4.5) was added to obtain a final concentration of 0.05 M to
maintain the pH in the optimum range for enzyme activity. Samples were vortexed for
approximately 5 seconds before placing in a Barnstead Max Q5000 SHKE 5000-7 floor shaker/
incubator (Barnstead International, Dubuque, IA) at 50oC, 120 rpm for hydrolysis. A HOBO
®
U12-011H temperature data logger (Onset Computer Corp., Cape Cod, MA) was placed in
incubator to monitor temperature over the 3-day hydrolytic period. Control samples included
substrate blanks, enzyme blanks and unensiled feedstock as negative controls and Avicel (α-
cellulose, which is pure insoluble cellulose) as a positive control. Fiber reactivity across a range
of moisture contents was performed in two batches. The PA samples constituted the first batch of
the reactivity test, and were tested with the full range of enzyme loading rates described above.
After that PA stover batch was completed, a single cellulase enzyme loading rate of 15 FPU/ g
glucan with corresponding β-glucosidase loading rate of 60 CBU/g glucan was chosen for the IA
stover batch.
Fiber reactivity after pretreatment
The purpose of the pretreated samples was to determine if fiber reactivity of wet storage samples
would be more pronounced or effective after pretreatment. Pretreated washed PA samples were
also included in the first batch for hydrolysis. The pretreatment process employed was a liquid
hot water (LHW) method using the Dionex Accelerated Solvent Extraction 350 (ASE 350)
(Thermo Fisher Scientific Inc., Dionex ASE 350, Sunnyvale, CA) system at 190oC, with one
static cycle of 15 minutes and 0% flush. This temperature and time have been found to be the
optimum condition for controlled pH LHW pretreatment of corn stover (Mosier et al., 2005).
Hydrolysis was performed on the pretreated solids only (without the pretreatment liquid extract)

104
in order to directly test the stover fiber without interference from extracted solubles, which may
contain sugars, acids and other inhibitors.
Fiber reactivity based on wet storage duration
Another variant to the fiber reactivity investigation was to explore reactivity based on storage
duration as opposed to reactivity across different moisture levels described earlier. Storage
durations investigated were 0, 21, 90 and 220 days at 23oC and 37
oC. Based on results obtained
from preceding investigations, two moisture levels (35% and 65%) with favorable outcome in
terms of fiber reactivity were chosen for Both IA and PA stover. However, unlike the previous
reactivity test, samples were dried and ground before testing. Drying was carried out in a
HotPack convection oven at 55oC to constant weight and grinding on a Wiley Mill (Model 4,
Thomas Scientific, Swedesboro, NJ) using a 2 mm screen. The dry ground samples were washed
using the ASE 350 system at 40oC, with three static cycles of 10 minutes each and 100% flush.
The same types of controls used in fiber reactivity across moisture were used for reactivity based
on duration. In addition, samples representing dry storage (i.e. at recommended moisture of
15%) and “as received” with a moisture content of approximately 7% were also tested. Also
included were corresponding aerobic samples. Correlating fiber reactivity with storage time
could be beneficial in determination of an effective minimum storage duration as well as the
predictability of downstream outcome for longer storage durations.
In all cases, after hydrolysis 20 ml of deionized water was added to each sample to facilitate
sampling due to the high solids loading. The samples were vortexed to mix and then centrifuged
to collect supernatant for sugar analysis. Supernatant from each sample was placed in a hot water
bath at 95oC for 10 minutes to prevent any further enzymatic reaction. The supernatants were
then filtered using a 0.2 μm nylon filters and stored at -20oC until analyzed for sugars.
4.2.4 Data analysis
Filtered samples were diluted 5-fold and the amount of glucose released during hydrolysis was
measured using a YSI 2700 SELECTTM
biochemical analyzer (YSI Inc., Yellow Springs, OH)
with 2% precision. Glucose yields from substrate and enzyme blanks, if any, were subtracted
from sample yield to get actual glucose resulting from hydrolysis. For pretreated samples, glucan

105
removed during pretreatment was subtracted from initial amount. Results were analyzed using
statistical tools such as principal component analysis (PCA), clustering analysis and analysis of
variance (ANOVA). To analyze the effect of organic acids on fiber reactivity, Principal
Component Analysis (PCA) was first performed on raw data to see if storage samples could
naturally be grouped into categories based on their organic acid profiles and to estimate the
number of categories to specify for the cluster analysis. Ward’s hierarchical clustering method
was then used to group the samples into the appropriate number of clusters. Two other cluster
analyses were performed using hydrolytic yields. One involved hydrolytic yields from the four
cellulase enzyme loadings (0, 2, 5 and 15 FPU/g glucan) for the PA samples as variables for
grouping and the other combined the IA and PA samples with two cellulase enzyme loadings (0
and 15 FPU /g glucan) for grouping. All correlation analyses were carried out using the Pearson
Method. This gives the Pearson correlation coefficient, r, which is a dimensionless index that
ranges from -1.0 to 1.0 and measures the degree of linear relationship between two data sets. The
initial assumption of linearity is rejected if “r” is 0 or the p-value is greater than 0.05. All
statistical tests were conducted at a significance level, α, of 0.05. Statistical software used for
these analyses are The Unscrambler® X 10.0 (CAMO Software Inc., Woodbridge, NJ) and
Minitab 14 (Minitab Inc., State College, PA).
4.3 Results and Discussion
4.3.1 Organic acid profile and cluster analysis
Organic acid profile
The organic acids identified in the wet stored stover samples included lactic, acetic, butyric,
isobutyric and propionic acids. Low levels of tartaric and malic acids were also identified in a
number of samples but were difficult to quantify due to their short retention times near the
elution of the system void volume and hence were not used in the current analysis. The results
indicated that IA control (day 0) samples had essentially no organic acids (see Figure 4.1). All
acids are reported on a dry matter basis. PA control (Day 0) samples had only lactic and acetic
acids, both of which constituted ≤ 0.6% dry mass of stover. These two acids were also present in
all wet stored IA and PA samples, except for samples stored at 75% moisture, which had no
lactic acid likely due to clostridia secondary fermentations (Jones et al., 2004). Lactic acid

106
concentration was up to 4.9% and 2.2% in IA and PA stover respectively while acetic acid was
up to 3.5% and 4.2 % respectively. Isobutyric acid was also present in all storage samples.
Propionic and butyric acids were present only in high moisture storage samples. Figure 1 shows
the complete organic acid profile of IA and PA stover at the two storage durations and different
moisture levels. The lower acid content of 45% PA stover could be due to a compromise in
anaerobic condition as reflected in high mean pH (5.12) compared to other storage samples (4.00
– 4.93) in Table C4, Appendix C. In general total acid content increased linearly with moisture
content. The variation in total acids and a regression plot is provided in Appendix C, Figure C13.
The correlation between total acids and moisture content was 0.813 and 0.819 for IA and PA
samples respectively, both with p-value of < 0.0001. In terms of individual acids, all acids were
significantly correlated with moisture except lactic acid (lactic (r = -0.145, p = 0.398), acetic (r =
0.807, p < 0.001), propionic (r = 0.508, p = 0.002), isobutyric (r = 0.586, p < 0.0001), and
butyric (r = 0.651, p < 0.0001)). Analysis of variance showed the mean value of the various
organic acids at the different moisture levels are all not equal (lactic (p = 0.003), acetic (p <
0.001), propionic (p = 0.010), isobutyric (p = 0.001), and butyric (p < 0.001)). The ANOVA
results comparing the means at the various moisture levels can be found at Appendix C,
Statistical analysis (A). Table 4.1 shows the differences in organic acid across moisture levels
and stover type.

107
Figure 4.1: Organic acid profile showing means of IA and PA stover at different moisture levels. Lighter bars are IA samples and
darker bars to the right are PA samples. Error bars are standard deviations of mean
25 25 25 25 35 35 35 35 45 45 45 45 55 55 55 55 65 65 65 65 75 75 75 75
0 0 220 220 0 0 220 220 0 0 220 220 0 0 220 220 0 0 220 220 0 0 220 220
Butyric ,% 0.00 0.00 0.00 0.00 0.00 0.00 0.00 0.00 0.00 0.00 0.00 0.00 0.00 0.00 0.00 0.10 0.00 0.00 0.00 1.01 0.00 0.00 2.57 1.18
Isobutyric ,% 0.00 0.00 0.04 0.13 0.00 0.00 0.20 0.18 0.00 0.00 0.27 0.11 0.00 0.00 0.34 2.16 0.00 0.00 0.16 1.21 0.00 0.00 1.28 1.81
Propionic ,% 0.00 0.00 0.00 0.00 0.00 0.00 0.00 0.00 0.00 0.00 0.00 0.00 0.00 0.00 0.00 0.00 0.00 0.00 0.00 0.36 0.00 0.00 0.00 0.34
Acetic ,% 0.00 0.00 0.14 0.25 0.00 0.08 0.63 0.77 0.05 0.09 0.74 0.17 0.00 0.22 1.14 2.20 0.00 0.24 1.24 2.51 0.00 0.11 2.74 2.73
Lactic ,% 0.00 0.00 0.26 0.99 0.00 0.24 1.94 1.68 0.00 0.21 2.85 1.31 0.00 0.16 2.95 1.36 0.00 0.26 3.03 0.21 0.00 0.18 0.00 0.00
0.00
1.00
2.00
3.00
4.00
5.00
6.00
7.00
8.00
Org
anic
aci
d (%
dry
mat
ter)
Duration (days)
Moisture (%)
IA
IA
IA
IA
IA
IA
IA IA IA IA IA IAPA
PA
PA
PA
PA
PA
PA
PAPA
PAPA
PA

108
Table 4.1: Differences in organic acids levels across moisture levels and stover type
Cluster analysis
For PA organic acids, the first two principal components accounted for ~82% of total variability.
Approximately 41% of the samples were significantly associated with the first component, and
about 53% were associated with the second component. Acetic, propionic, isobutyric and butyric
acids, i.e. volatile fatty acids, were the major contributors to component 1, while lactic acid was
the main contributor, ~ 86%, to component 2. This is also true for PCA of the combined PA and
IA samples. These PCA results were supported by the strong correlation acetic acid has with
isobutyric acid (0.912, p < 0.0001), propionic acid (0.643, p = 0.001) and butyric acid (0.770, p <
0.0001), all of which were strongly correlated with each other. No significant correlations exist
between lactic acid and the other acids. However, when considering only 220-day samples, there
were some negative correlations between lactic and isobutyric (-0.446, p = 0.006), propionic (-
0.360. p = 0.031) and butyric acids (-0.552, p < 0.0001) but still no correlation with acetic (-

109
0.297, p = 0.079). Based on the PCA result, three categories were chosen for Ward’s clustering
analysis. The three categories resulting from the clustering analysis of PA samples were: (1) a
high amount of acids (5 to <10%) associated with high moisture wet stored samples (55-75%
moisture), (2) a moderate amount of acids (2 to <5%) associated with low moisture wet stored
samples (35 and 45% moisture) and (3) a low amount of acids (<2%) associated with day zero
and 25% moisture anaerobic (wet stored) samples. These groupings were maintained when
combined with the IA samples, which had a slightly different pattern. The IA groupings were:
(1) High amount of acids: wet stored samples with 75% moisture, (2) moderate amount of acids:
wet stored sample with 35 – 65% moisture and (3) low amount of acids: day zero and 25%
moisture anaerobic (wet stored) samples.
4.3.2 Fiber reactivity of pretreated washed PA stover
To evaluate the impact of pretreatment, xylan and glucan removal as well as hydrolytic sugar
yields were measured by enzymatic hydrolysis. Xylan removal was used as an indicator of liquid
hot water (LHW) effectiveness. When taking into account the amount of xylan degraded during
storage, xylan removals in the Day 220 samples were significantly higher (55.0% ± 7.2) than
Day 0 samples (47.2% ± 6.1) (p < 0.0001) as shown in Figure 4.2. Xylan degradation during
storage was not determined for PA samples, so to calculate the actual amount of xylan removed
during enzymatic hydrolysis, the average value for IA stover (5% - see Chapter 3) was assumed.
Disregarding amount of xylan degraded during storage, xylan removal by enzymatic hydrolysis
at Day 0 and Day 220 were not significantly different. See Table C1 in Appendix C. This
suggests that the percentage xylan removal had approached the limit of removal under LHW
conditions or could be close to xylan removal under optimum pretreatment conditions. The idea
of a limit to xylan removal in liquid hot water pretreatment is also based on results from Elander
et al. (2005) and Zheng et al. (2009), in which xylan removal was less than 55%. Xylan removals
for Day 220 samples were more variable than Day 0 and not significantly different across
moisture (p = 0.915). For Day 0, there were no significant differences among the different
moisture treatments except for the 35% moisture condition, which was lower than 65% moisture
(p = 0.031). See Figure 4.2.

110
Also, as shown in Figure 4.2, the glucan removed during enzymatic hydrolysis was generally
less than 4% for both day 0 and day 220. Less glucan was present in day 220 samples as a result
of a net 1% loss in glucan during storage (See Chapter 3), and Day 0 samples had significantly
higher glucan removal during pretreatment (P < 0.0001). The relatively low glucan removed
from wet storage samples could be a result of some glucan degradation during storage, hence a
lesser amount of readily degradable glucan was available for removal. For glucan removal there
was no significant difference across moisture for Day 0 samples (p = 0.545). Glucan removal at
Day 220 was also not significantly different across moisture levels except for 25% moisture (p =
0.030), which was similar only to 35% moisture samples. See Figure 4.2.
Figure 4.2: Xylan and glucan removal during LHW pretreatment of ensiled (day 220) and
unensiled (day 0) PA stover. Error bars are standard deviations of mean
Glucose yields, as percent theoretical, were calculated with reference to the mean glucan
composition for each moisture level. The glucan content of the initial biomass prior to the
storage trials ranged from 33.50% to 35.63% for both IA stover and PA stover. Grams glucan
0.0
2.0
4.0
6.0
8.0
10.0
12.0
14.0
16.0
18.0
20.0
0
10
20
30
40
50
60
70
80
15 25 35 45 55 65 75 85
Xyl
an r
emo
ved
, %
Storage moisture, %
Xylan - day 220 Xylan - day 0 Glucan - day 220 Glucan - day 0
Glu
can
rem
ova
l, %

111
were converted to glucose using a factor of 1.111. Glucan removed during pretreatment was
subtracted from this original amount to determine the appropriate amount of enzymes to add and
for calculation of theoretical yields. As expected, glucose yields increased significantly with
enzyme loading (p < 0.001) (see Figure 4.3). For the PA stover, these values were 28.79% ±
4.33, 47.18% ± 3.45 and 84.18% ± 6.65 for 2, 5 and 15 FPU/g glucan respectively. The results
indicated that the glucose yields of Day 220 and Day 0 samples were not significantly different
at the various enzyme loadings, p = 0.586 (Figure 4.3). Furthermore, glucose yields at various
moisture levels for each enzyme loading were not significantly different for both Day 0 (p =
0.994) and Day 220 (p = 0.990). The implication is that xylan removal did not serve as a good
indicator for downstream glucan hydrolysis. This is understandable since conditions used for
pretreatment were the optimum time and temperature for raw feedstock. Given the differences in
xylan removal, it is possible that at a lower pretreatment severity (less time and/or a lower
temperature), there might be significant differences in glucose yield between wet storage
samples and Day 0 samples.
Enzyme Loading (FPU/g glucan)
Glu
co
se
yie
ld (
% t
he
ore
tica
l)
1510520
90
80
70
60
50
40
30
20
10
0
1510520
Day 0 Day 220
Moisture
65
75
25
35
45
55
Figure 4.3: Mean glucose yield ( % theoretical) of pretreated washed PA corn stover fiber at
different enzyme loadings

112
4.3.3 Fiber reactivity of corn stover without pretreatment
Fiber reactivity results showed the glucose hydrolysis yields for both stover types to be generally
poor, less than 30% of theoretical. See Figure 4.4. The glucose yields after hydrolysis were
calculated using mean glucan composition for each moisture level as was done for pretreated
samples. As expected, sugar yield increased with increased enzyme loading. At 15 FPU cellulase
enzyme loading, the glucose yields of Day 220 samples of both IA and PA stover were
significantly higher (p < 0.0001) than corresponding Day 0 samples. Average yields for Day 220
were ~23.61% ± 3.16 and 15.54% ± 5.71 respectively in contrast to 14.30% ± 4.83 and 11.05% ±
3.51 for Day 0. At 5 FPU cellulase enzyme loading, glucose yields of PA stover at Day 220
(12.56% ± 3.41) were significantly higher than yields at Day 0 (9.60% ± 3.85) (p = 0.022).
However, at 2 FPU there were no significant differences as a result of wet storage, 8.83% ± 2.80
vs 6.93% ± 3.20 for Day 220 and day 0 respectively (p = 0.065). Compared to yields obtained
from Avicel hydrolysis (~ 58% for 2 FPU, 65% for 5 FPU and 83% for 15 FPU), enzymatic
access to stover cellulose was still limited after wet storage. This could be due to the low level of
hemicellulose degradation during storage as compared to conventional pretreatment. On average
10% of hemicelluloses in IA stover was degraded during storage, in contrast to ~55% removal
during LHW pretreatment [of PA stover]. In theory, the pretreatment capability of wet storage
derives from hemicelluloses degradation as a result of organic acid interaction.
In this study there was no significant difference in storage (Day 220) hemicellulose degradation
across the tested range of storage moisture contents (p = 0.083) and no correlation between
hemicellulose degradation and glucose yields (p = 0.90).. However, if day 0 samples are also
considered in addition to the Day 220 samples, in the correlation analysis, then the correlation
between hemicellulose degradation and glucose yield is 0.62 (p = 0.001). See Appendix C,
Figure C7 for graphical relationship between glucose yield and hemicellulose degradation during
storage. For Day 220, the IA samples had statistically significant groups of ((25-45%) 65%), (55,
65%) and (55, 75%) in decreasing glucose yields (p <0.0001). The overlaps defined using the
Tukey test suggest glucose yields at all moisture levels were not that different except for 75%
moisture, which is similar to 55% percent moisture but significantly differs from the remaining
moisture contents. For the PA samples at an enzyme loading of 15 FPU, the groups were (25%,

113
75%), (35%, 65%) and (45% -65%) (p <0.0001). See Appendix C, statistical analysis (B) for
Tukey results used for glucose groupings. Yields from the 25% and 75% moisture samples were
the lowest among this set. Thus when these extreme moisture levels are avoided, a similar
glucose yield could be expected from wet storage across a wide range of moisture contents. On
the other hand Day 0 samples did not show any significant difference in glucose yields across
moisture for both stover types (p = 0.346 for IA stover and p = 0.073 for PA stover). See Figure
4.5 for glucose yields across moisture.
Figure 4.4: Variation in glucose yields for different enzyme loadings and means values for the
different moisture levels. Big black circles are lumped means for each enzyme loading.

114
Figure 4.5: Glucose yield of fiber reactivity test, with 15 FPU/g glucan cellulose enzyme
loading, without pretreatment.
Cluster analysis was performed on glucose yields of the fiber reactivity test, initially assuming
the same number of groups (three) as was determined for the organic acid cluster analysis (see
Appendix C, Tables C3 and C5). PA samples were clustered based on yields from the four
cellulase enzyme loadings: 0, 2, 5 and 15 FPU /g glucan (see Appendix C, Table C8 and Figures
C8 and C9). The result was slightly different from the combined IA-PA set, which was based on
6.90
23.25
16.07 17.38
18.40
11.22
7.38
13.88 13.62
8.31
10.93 12.21
0
5
10
15
20
25
30
25 35 45 55 65 75
Glu
cose
yie
ld (
% t
he
ore
tica
l)
Storage moisture (%) PA
27.53
24.70 25.56
20.98
23.88
18.99
18.09
11.76 12.60 11.16
17.72
14.48
0
5
10
15
20
25
30
25 35 45 55 65 75
Glu
cose
yie
ld (
% t
he
ore
tica
l)
Storage moisture (%)
Wet stored (Day 220) Control (Day 0)IA

115
two enzyme loadings (0 and 15 FPU/g glucan) (see Appendix C, Table C6). The three PA stover
glucose clusters consisted of (1) high glucose yield: wet storage (Day 220) 35 -65% moisture
samples, (2) moderate glucose yield: all Day 0 samples excluding 25% moisture, as well as 25%
and 75% wet stored (Day 220) samples; and (3) low glucose yield: Day 0 25% moisture. The
combined IA-PA analysis yielded: (1) high glucose yield: wet storage with 25 -65% moisture for
IA; 35% for PA, (2) moderate glucose yield: wet storage moisture of 75% for IA; 45 - 65% for
PA and (3) low glucose yield: Day 0 samples including PA wet stored samples of 25 and 75%
moisture. The cluster outcome also showed that for each stover type, two groups could be
sufficient, defined as wet stored samples and day zero samples. In general, IA samples had
higher glucose yields than PA samples (p > 0.0001). Wet stored IA samples were clustered as
relatively high yielding while wet stored PA samples fall mainly under moderate glucose yield.
This lower outcome for PA stover compared to IA stover could be due to the lower pH of the
former and the presence of more volatile acids which have higher pKa. The implication is that
the PA stover had comparatively fewer protons available during storage for the catalysis of
hydrolytic pretreatment.
4.3.4 Fiber reactivity of dry stover without pretreatment as affected by storage duration
The glucose yield after various storage durations was evaluated for dry ground samples without
pretreatment. Glucose yields were also generally poor, less than 30% of theoretical yield (see
Table 4.2) as in the case of fiber reactivity across moisture and without pretreatment. There was
no significant difference in yields across duration except for Day 0 samples, which were
generally lower (p = 0.001). Glucose yields from “as received” samples, 1-inch minus dry stover,
were similar to samples stored anaerobically at 35% and 65% moisture, and were higher than
samples stored anaerobically at 15% moisture (p = 0.001). Although there was no significant
difference in total organic acids present in samples stored at 23oC and 37
oC (p: PA = 0.917; IA
=0.454), mean glucose yields were generally higher at 37oC (22.45% of theoretical) than 23
oC
(19.8%) (p = 0.004). In the previous discussion on organic acids, lactic and acetic acid were not
correlated hence qualifying the two acids as potential predictors, if multicollinearity is to be
avoided. These two acids are therefore the ones considered here in defining relationship between
storage acid and glucose yield. Lactic acid levels in PA samples were generally higher for 23oC

116
compared to 37oC (p = 0.001). Acetic acid on the other hand was not different at these
temperature levels (p = 0.212). Aerobic samples had no organic acids. However, for the IA
stover samples neither of these two acids were significantly different across these two
temperature levels, (p =0.080 and 0.943 for lactic and acetic acid respectively.) Aerobic samples
had low glucose yield, which may be an indication that much of the readily hydrolyzed glucose
was already degraded during storage, since cellulase and other hydrolytic enzymes are produced
by aerobic microbes. Microbial contamination during hydrolysis evident through molds present
in these samples, may also explain these low glucose yields after aerobic storage. The same
amounts of antibiotics were added to these aerobic samples, but this was not effective in
presenting these microbial growths. Although samples were dried after storage and well
preserved, the low drying temperature (55oC) may only have inactivated and not killed the
spoilage microbes present. Spores and other microbial structures can tolerate dessication and
may have been carried over from storage, and some may have been resistant to the effect of
antimicrobial agents.
Table 4.2: Fiber reactivity results (glucose yield as percentage of theoretical) of dry stover for
other storage conditions
Moisture
(%)
Temperature
(oC) Day 0 Day 2 1 Day 9 0 Day 22 0 Day 2 1 Day 9 0
As received
(7.5%)25.2 ± 0.57
15 37 22.43 ± 1.87 15.18 ± 4.42 16.51 ± 8.53
22 20.37 ± 1.55 21.57 ± 0.31 22.77 ± 1.06 15.12 ± 1.83 13.18 ± 0.38
37 21.81 ± 2.04 24.54 ± 0.23 26.62 ± 1.52 10.65 ± 2.21 15.52 ± 1.44
22 13.62 ± 3.33 14.57 ± 0.37 20.59 ± 0.27 0.09 ± 0.08 0.05 ± 0.09
37 22.33 ± 0.27 26.27 ± 1.12 24.31 ± 0.45 0.01 ± 0.02 0.17 ± 0.29
22 18.02 ± 2.69 22.1 ± 0.77 22.69 ± 0.24 14.59 ± 1.05 8.51 ± 4.37
37 23.19 ± 0.18 24.73 ± 0.34 14.56 ± 2.17 10.38 ± 4.4
22 5.86 ± 1.48 19.47 ± 0.37 18.21 ± 0.48 1.11 ± 1.16 0
37 19.63 ± 1.01 22.55 ± 2.01 0.91 ± 0.09 0
PA
stover
35
65
Anaerobic Aerobic
IA stover 35
65

117
4.3.5 Relating organic acid cluster with fiber reactivity cluster
The relationship between the clusters of similar organic acid portfolios with clusters of similar
glucose yields was examined using results from the fiber reactivity assay across different
moisture contents for non-pretreated, anaerobically stored samples. For the PA stover clusters,
high glucose yields were associated with high acid levels (excluding the 75% moisture sample)
and moderate acid levels. Moderate glucose yields were associated with Day 0 samples
(excluding the 25% moisture sample) as well as Day 220 25% and 75% moisture wet stored
samples. Low glucose was associated with 25% moisture Day 0 samples. The relationships
between the organic acid and fiber reactivity clusters of the combined IA and PA samples are
shown in Figure 4.6. The pattern in Figure 4.6 suggests some reasonably distinct range of
glucose yields and associations with organic acid levels and also corroborates the advantage of
anaerobic storage at moisture levels of 35 -65%. Glucose yields across this full population of
stored and unstored samples were correlated with the total organic acids (r = 0.349, p = 0.002)
with significant differences in the glucose yields of the various group (p < 0.0001). In general,
high glucose yields were associated with moderate organic acid levels; moderate glucose yields
were associated with high organic acid levels; and low glucose yield with little or no organic
acids. Two exceptions were the PA and IA stover samples stored anaerobically at 25% moisture.
Interestingly, although both clusters in the low range for organic acid concentrations, the IA
stover produced a high glucose yield while the PA stover had a low glucose yield. This suggests
an important effect of biomass harvest conditions and structural composition on subsequent
hydrolysis. Across this full population of initial (Day 0) and wet storage (Day 220) samples, only
lactic acid showed a significant correlation with glucose yield (r = 0.518, p < 0.0001).

118
Figure 4.6: Relationship between organic acids grouping and fiber reactivity grouping of PA and
IA corn stover (without pretreatment) and grouped using mean glucose yields from cellulase
enzyme loading of 15 FPU /g glucan.
Chart plotted using ranks of glucose and total acids. Diamonds represent day 0 samples and circles represent day 220 samples.
Numbers following IA and PA represent storage moisture content on a percent wet basis. See Appendix C, Figure C11 for
alternate graph using actual glucose and acid amounts.
When considering only stored samples (Day 220), glucose was not correlated to total acids (-
0.142, p = 0.409). The contrary effects associated with low acid concentrations in the 25%
moisture IA and PA samples were partially responsible, as were the moderate and low glucose
yields for the highest acid concentrations. Moderate acid concentrations were associated with
high glucose yields, suggesting an optimum level of total acids. Glucose yields showed some
significant correlations with some individual acids; positively with lactic acid (0.366, p = 0.028)
and negatively with propionic (-0.345, p = 0.039) and isobutyric (-0.340, p = 0.043). There was
no correlation with neither acetic nor butyric acids (each: 0.299, p =0.180). In Table 4.3, it can

119
be observed that this overall relationship does not necessary hold within the cluster groups.
Organic acids, specifically lactic and acetic acids were significantly and positively correlated to
glucose yields in Group 2 (samples with moderate acid levels), even though lactic acid
dominates. In Group 1 (samples with high acid levels), all acids were present, however none of
them was correlated with the glucose yields. Acetic acid is dominant in this group, and even
assuming the correlation p-values gave a false negative (e.g., that relationships with p-values
>0.05 were in fact correlated), acetic acid showed a very weak correlation compared to other
acids. Glucose yields from Group 3 (samples with low acid levels) were also not affected by
individual organic acids, but this was understandable since acids levels were negligible.
Although glucose yields from Group 1 and 3 had no correlations with individual organic acids,
Group 1 had significantly higher glucose yields than Group 3 when excluding the sole storage
condition with high glucose yield in Group 3 (IA stover, 25% moisture at day 220) ( p = 0.006).
Otherwise there was no significant difference in the glucose yields of the two groups (p = 0.090).

120
Table 4.3: Differences in the three organic acid groupings and correlation of individual acids
with glucose
Group 1
(Relatively high acid level)
Group 2
(Moderate acid level)
Group 3
(Low acid level)
Storage duration Day 220 Day 220 Mainly Day 0*
Moisture 55 -75% 35 - 45%⁰ 25 -75%
Total organic acids (OA) 5 < OA < 10% 2 < OA < 5% < 2%
pH 4.07 - 4.78 4.00 - 5.12 4.31 - 6.83
Lactic0 -1.42 %
(0.218, P = 0.497)
1.33 - 4.95%
(0.534, P = 0.013)
0 - 1.16%
(-0.142 P= 0.409)
Acetic1.49 - 4.17 %
(-0.066, P = 0.839)
0.2- 1.37 %
(0.612, P = 0.003)
0 - 0.42%
( -0.243, p = 0.154)
Propionic0 - 0.46%
(-0.431, P = 0.162)0 (*) 0 (*)
Isobutyric0 - 2.41%
(0.239, P = 0.455)
0 - 0.59%
(0.226, P = 0.324)0 (*)
Butyric0 - 3.14%
(0.090, P = 078) 0 (*) 0 (*)
Lactic acid as % of total acids < 30% 57 - 84% 0 - 100%
Lactic: acetic ratio 0 - 0.7 1.5 - 9.8 0 - 9.0
Distinguished byHigh acetic acid levels and
all acids presentHigh lactic acid levels Little or no acid
Glucose yield
(% theoretical)
Moderate
55%: 17.38 ± 4.33
65%: 18.40 ± 0.87
75%: 15.11 ± 4.60
High
35%: 23.97 ± 1.05
45%: 21.88 ± 5.28
55%: 20.98 ± 2.19
65%:23.88 ± 0.13
Low
25%: 14.97 ± 9.25
35%: 12.82 ± 2.96
45%: 13.45 ± 4.33
55%: 9.73 ± 3.36
65%: 14.33 ± 5.86
75%: 13.35 ± 1.6
For glucose yield, percent before values is storage moisture
Highlighted cells indicate main acid under group
⁰ For IA stover, 55% and 65% moisture fall under group 2
*IA and PA Day 220 samples with 25% moisture fall under this group
(*) Independent variable (organic acid) is zero hence no basis for correlation
Values in bracket represent correlation coefficient with glucose yield from fiber reactivity test and corresponding p-values)
Lactic: acetic ratio used because no correlation between the two; in addition, acetic correlated to all the other acids

121
Although Group 1 has a high total acid concentration, the relatively low yields compared to
Group 2 cannot be attributed to the potential inhibitory nature of the acids since the samples were
thoroughly washed before hydrolysis. The pH values during storage (4.07 – 4.78), and the acid
profile of the high acid samples (in which volatile acids dominate with pKa of 4.76 – 4.88, see
Appendix C, Table C9) suggest that the effect of the Group 1 acids on fiber structure could be
negligible. This is because the level of dissociated acids, and hence protons to facilitate cleavage
of bonds, were lower in Group 1 than in Group 2. On the other hand, for the cluster of samples
with moderate total acid concentrations (Group 2), lactic acid with a pKa of 3.86 is dominant. In
this cluster the high pH relative to this pKa leads to a relatively high dissociation of lactic acid,
resulting in more hydrogen ions being available for the hydrolytic reaction that alters the
feedstock structure. This also may explain why lactic acid was the only acid correlated to glucose
yields. In addition, this explains why the IA stover, which produced more lactic acid during wet
storage, had higher glucose yields than the PA stover. The overall affect of these pKa – pH
relationships increases the natural pretreatment effect of the lactic acid dominated treatments in
Group 2, while a much lower effect is observed with the higher pKa acids that dominate in
Group 1. Although high concentrations of these volatile acids are present in Group 1, their
impact on glucose yield is minimal, with results similar to Group 3 which had little or no acid.
4.4 Conclusions
There is evidence from the fiber reactivity test conducted in this study that wet storage, without
any form of biological or chemical additives, does indeed have pretreatment capability. Although
cellulose accessibility was limited, due to the low hemicellulose degradation during storage, the
feedstock structure was altered enough to improve glucose yields over day 0 samples by a factor
of ~1.5 to 2.4. However, relative to conventional pretreatment and theoretical glucose yields,
these yields were low, indicating that wet storage of corn stover biomass would still require post
storage pretreatment to achieve desirable hydrolytic yields. The glucose yield after enzymatic
hydrolysis of wet stored samples was comparable across moisture except for the extreme
moisture levels tested (25% and 75%). Generally, storage at 75% moisture had the lowest
glucose yield. In the moderate moisture range from 35% to 65%, this similarity in yields also
minimizes the expected complexity and questions about quality given the varied moisture
conditions under which different farmers may harvest and store their biomass feedstock.

122
Cluster analysis comparisons indicated that moderate [total] acid levels corresponded with high
glucose yields and vice-versa, with significant but not very strong correlations. For wet storage
pretreatment to proceed, organic acids must dissociate to provide protons that will catalyze the
cleavage of bonds. Generally, samples with high total acid levels are high moisture samples (55 -
75%) with comparatively lower lactic acid amount, while samples with moderate acid levels had
comparatively higher lactic acid concentration. Lactic acid was found to be the most influential
acid because of its low pKa, which allows more dissociation at the relatively high pH typical of
corn stover silages.
With respect to post storage pretreatment, there was no significant difference between day 220
and day 0 samples likely due to the pretreatment conditions employed. It is probable that less
severe conditions would favor wet storage samples over day 0 samples. Also using fresh stover
instead of rewetted dry stover could present different outcome in favor of the former. The lack of
difference at lower enzyme loadings could be more of low reaction rate rather than maximum
yield that could be obtained from the two durations. For reactivity across duration without
pretreatment, yield after 21 days of storage were comparable. Aerobic samples at similar
moisture levels were more prone to microbial contamination that resulted in lower yields.
4.5 References
Chen, Y., R. R. Sharma-Shivappa and C. Chen. 2007. Ensiling agricultural residues for
bioethanol production. Appl Biochem Biotechnol 143:80–92.
Chesson, A. 1993. Chapter 14: Mechanistic models of forage cell wall degradation. In Forage
Cell Wall and Digestibility, 347-376. H.G. Jung, D.R. Buxton, R.D. Hatfield and J. Ralph
(ed.). Madison, WI.: ASA-CSSA-SSSA.
Digman, M.F., K J. Shinners, B. S. Dien, R. D. Hatfield, X. Li, R. E. Muck, P. J. Weimer. 2007.
On-farm Pretreatment Technologies for Improving Enzymatic Degradability of Cellulose
and Hemicellulose Present in Perennial Grass. ASABE Paper No. 071021. St. Joseph,
Mich.: ASABE.
Donohoe, B., T. Haas, N. Wiess, S. Ding, N. Nagle, and M. Himmel. 2009. Evaluation of plant
cell wall structure of ensiled corn stover by correlative microscopy. NREL/PO-270-
44906. Poster presentation at the 31st Symposium on Biotechnology for Fuels and
Chemicals, May 3-6, 2009. San Francisco, CA.

123
Elander, R. T., C. E. Wyman, B. E. Dale, M. T. Holtzapple, M. R. Ladisch, Y. Y. Lee, and T.
Eggeman,. 2005. Initial comparative process economics of leading pretreatment
technologies. Available at http://www.eri.ucr.edu/ISAFXVCD/ISAFXVPP/InCPELB.pdf
Accessed 27 August 2008.
Henk, L. L. and J.C. Linden. 1994. Silage processing of forage biomass to alcohol fuel, in
Enzymatic conversion of biomass for fuels production. Himmel, M. E., J. O. Baker and R.
P. Overend. ACS symposium series 556: 391 – 410.
Heinrichs, J. and P. Kononoff. 2002. Evaluating particle size of forages and TMRs using the new
Penn State Forage Particle Separator. Pennsylvania State University, College of
Agricultural Sciences, Cooperative Extension DAS 02-42.
Jacobsen, S.E. and C.E., Wyman. 2000. Hemicellulose and cellulose hydrolysis models for
application to current and novel pretreatment processes. Applied Biochemistry and
Biotechnology (84–86):81–96.
Linden, J. C., L. L. Henk, V. G. Murphy, D. H. Smith, B. C. Gabrielsen, R. P. Tengerdy and L.
Czako. 1987. Preservation of potential fermentables in sweet sorghum by Ensiling.
Biotechnology and Bioengineering 30:860-867.
McDonald, P. A. R. Henderson, and S. J. E. Heron. 1991. The Biochemistry of Silage, 2nd ed.
Marlow, Bucks, UK: Chalcobe Publications.
Mosier, N., C. Wyman, B. Dale, R. Elander, Y.Y. Lee, M. Holtzapple, and M. Ladisch. 2004.
Features of promising technologies for pretreatment of lignocellulosic biomass.
Bioresource Technology 96: 673–686. Available at http://i-
farmtools.org/ref/Mosier_et_al_2005.pdf Accessed 13 August 2009.
Mosier, N., R. Hendrickson, N. Ho, M. Sedlak, M.R. Ladisch. 2005. Optimization of pH
controlled liquid hot water pretreatment of corn stover. Bioresource Technology
(96):1986-1993
Muck, R. 1996. Inoculation of silage and its effects on silage quality. Available at
http://www.dfrc.wisc.edu/Research_Summaries/ind_meet/dfrc7.pdf Accessed 28 July
2009.
Oleskowicz-Popiel P., T. M. Lehtinen, J. E. Schmidt, A. B. Thomsen. 2010. Silage pretreatment
of corn stover to produce bioethanol. Journal of Industrial Microbiology &
Biotechnology: 1-16. Manuscript Number: JIMB-D-10-00268.

124
Pakarinen, A., P. Maijala, S. Jaakkola, F. L. Stoddard, M. Kymäläinen and L. Viikari. 2011.
Evaluation of preservation methods for improving biogas production and enzymatic
conversion yields of annual crops. Biotechnology for Biofuels 4(20):1-13.
Ren, H. 2006. Effect of cell wall degrading enzymes and chemicals on corn stover preservation
and pretreatment during ensilage processing. PhD Dissertation. University Park,
Pennsylvania: The Pennsylvania State University, Department of Agricultural and
Biological Engineering.
Ren, H., T. L. Richard and K. J. Moore. 2007. The impact of enzyme characteristics on corn
stover fiber degradation and acid production during ensiled storage. Applied Biochemistry
and Biotechnology 136-140: 221-238.
Richard, T. L. S. Proulx, K. J. Moore, and S. Shouse. 2001. Ensilage technology for biomass pre-
treatment and storage. ASAE paper No. 016019. St. Joseph, Mich.: ASAE.
Stoddart, B. 2007. The structures of plant tissues and the effects of drying and fluid preservation
upon them. NatSCA News 11: 38-43. Available at
http://www.nhm.ac.uk/hosted_sites/natSCA/training/seminars/BS1.pdf Accessed on 23
July 2009.
Sun, Y., and J. Cheng. 2002. Hydrolysis of lignocellulosic materials for ethanol production: a
review. Bioresource Technology 83: 1-11.
Thomsen, M. H., J. B. Holm-Nielsen, P. Oleskowicz-Popiel and A. B. Thomsen. 2008.
Pretreatment of whole-crop harvested, ensiled maize for ethanol production. Applied
biochemistry and biotechnology 148(1-3): 23-33.
Tímár-Balázsy, Á., and D. Eastop. 1998. Chemical principles of textile conservation.
Butterworth-Heinemann series in conservation and museology. Wosbon, MA. Elsevier
Science Ltd.
Wyman, C. 1999. Biomass ethanol: technical progress, opportunities, and commercial
challenges. Annu. Rev. Energy Environ. 24:189–226 Available at
http://www.wilsoncenter.org/news/docs/Biomass%20ethanol.pdf Accessed 02
February 2009.
Zheng, Y., Z. Pan and R. Zhang. 2009. Overview of biomass pretreatment for cellulosic ethanol
production. Int J Agric & Biol Eng 2(3): 51- 68.

125
Chapter 5
Impact of the organic acids produced during wet biomass storage on
pretreatment and bioconversion of corn stover to ethanol
Abstract
Organic acids produced during wet storage are recognized to be potentially beneficial at the
storage level, both for biomass preservation and to aid pretreatment. There are major concerns,
however, as to their impact on downstream processes especially microbial fermentation. This is
because organic acids have the capability to inhibit microbial metabolism or growth, which in
turn can affect biofuel productivity or yield. This study investigated the interaction of organic
acids produced during wet storage with subsequent pretreatment, as well as the potential for
interference with ethanol fermentation process. Interaction with pretreatment was observed by
measuring xylan and glucan removal and the formation of inhibitors. The results indicated that
organic acids generally do not impede downstream processes and in fact can be beneficial.
Levels of organic acids were generally below inhibitory levels, with a clear change in the acid
profile after pretreatment that showed inverse relationships in amounts of individual storage and
pretreatment acids. Whereas unensiled corn stover required 15 minutes of pretreatment to
optimize sugar release, ensiled corn stover could be treated equally effectively at either 15
minutes or at a lower pretreatment duration of 10 minutes. Furthermore, the different organic
acid profiles that accumulate at various storage moisture levels generally do not differ
significantly in their impact on downstream ethanol fermentation. Biorefineries, therefore, do not
need to be concerned with process adjustments to accommodate any supposed changes that
might result from different storage moisture conditions.
Key words: Acetic acid, biofuel, corn stover, ethanol, fermentation, hydrothermal treatment,
inhibitors, Liquid hot water pretreatment, wet storage, ensilage
5.1 Introduction
Wet storage, synonymous with ensilage, is the storage of biomass materials under anaerobic
conditions at moisture levels that permit acidogenic microorganisms to grow and produce

126
sufficient quantities of organic acids to reduce pH to levels that inhibit microbial biodegradation
and allow long term biomass preservation. Wet storage thus contrasts with dry storage. In dry
storage moisture levels must be kept low enough to slow down and inhibit active microbial
activities/reactions. Traditional dry storage of biomass feedstocks in bales and other formats is
low cost and can be effective if the materials are kept dry, but carries the risk of spontaneous fire
outbreaks, narrows harvest windows (especially in humid climates), and can result in extensive
soil contamination during field drying operations. Wet storage systems can reduce these
concerns, and as indicated in the previous chapter can serve as an avenue for in situ pretreatment
of the biomass to enhance downstream biofuel fermentation processes (Linden et al., 1987;
Richard et al., 2001). With a mechanism similar to dilute acid pretreatment, organic acids
produced during wet storage could serve as long-term, mildly acidic, low temperature
pretreatment. Pretreatment of cellulosic feedstock is a major cost component of biofuel
production, so any reduction in this requirement is likely to have commercial value.
Previous studies on wet storage have either shown unfavorable impact, no impact, or had a
favorable impact on downstream processing with reference to the controls (Linden et al., 1987;
Henk and Linden, 1994; Chen et al., 2007; Digman et.al., 2007). However, in most prior studies
the biomass samples were microbially, enzymatically or chemically treated to enhance storage,
and few have looked at the natural ensilage process. In one study without additives, Thomsen et
al. (2008) investigated wet storage of whole-crop maize silage for ethanol production. Although
their results failed to demonstrate a pretreatment effect from ensilage, they did show that
subsequent pretreatment sugar yields as well as ethanol yield were remarkably improved as a
result of the ensilage process. However, the widespread applicability of this result could be
confounded by the high starch content of the whole crop (grain and stover) maize feedstock. The
differences among wet storage outcomes may be dependent on the feedstock type, and very few
studies have involved corn stover, which is the most abundant agricultural residue in the US.
Most importantly, none of these previous studies explicitly targeted the impact of storage organic
acids, or any modifications of these storage acids during pretreatment and fermentation. In a
number of these studies, the feedstocks were washed before subsequent processing, perhaps to
prevent interference of the acids with the downstream process. The cost of such washing and the
associated wastewater treatment would be hard to justify at a large commercial scale.

127
Although wet storage of biomass has potential benefits for downstream processing to biofuels, it
is also known that most storage acids like lactic acid and acetic acid can inhibit microbial
activities (Lund and Eklund, 2000; Branen, 2002; Deublien and Steinhauser, 2008) and hence
negatively affect biofuel fermentations. Although no prior investigations were found on the
impacts of silage organic acids on biofuel production, their function in ensilage is to inhibit
microbial degradation, and there are ample examples in the food industry of organic acids
preserving food through organic acid inhibition or other antimicrobial effects (Lund and Eklund,
2000). Natural acid fermentations are used to preserve sauerkraut, pickles, yogurt and silage, but
unlike foods which will be digested in a mammalian gut, when silage is used as a biofuel
feedstock this acidic condition could serve as a potential impediment to downstream
fermentations to ethanol and other biofuels and biochemicals. There are a number of reports on
negative effects of organic acids with specific reference to ethanol-producing microbes
(Palmqvist et al., 1996; Koegel et al., 1997; Zaldivar and Ingram, 1999; Palmqvist and Hahn-
Hägerdal, 2000; Klinke at al., 2004; Knauf and Kraus, 2006). Several of these studies focus on
the yeast Saccharomyces cerevisiae, which is the most common microbe used in ethanol
fermentation. These studies showed the inhibitory effect of organic acid on ethanol-producing
microbes is dependent on the fermentation conditions, especially initial pH, extracellular-
intracellular pH gradient, temperature, the presence of other chemicals, and the type and amount
of organic acid present in both dissociated and undissociated forms. Importantly, Taherzadeh et
al. (1997), Thomas et al. (2002) and Torija et al. (2003) observed that the effect of organic acids
at low levels can sometimes be positive, stimulating growth of fermentative microbes and
ethanol production, and may be necessary for fermentation to proceed. For instance Taherzadeh
et al. (1997) observed that acetic acid could stimulate ethanol production during fermentation if
concentrations were lower than 0.05% (w/v) at pH 4.5. Torija et al. (2003) also observed that
organic acids commonly present in grapes were responsible for the completion of the
fermentation process as well as enhanced ethanol yields; none of the controls (i.e. without
organic acid of any sort) were able to ferment all the sugars within 21 days.
The main aim of this study was to directly and indirectly investigate the counteractive effects of
the organic acids produced during wet storage of corn stover; to understand how these acids
interact with the pretreatment process and the potential for reduced severity pretreatment as well

128
as their effect on ethanol yields. Any observed potential for reduced severity pretreatment after
wet storage would be an indirect measure of the upstream pretreatment capability of ensilage
(interaction of organic acid produced during storage with structural bonds in feedstock in
storage). The potential for reduced severity could also result from the interaction of these organic
acids, acting as catalyst, with structural bonds in subsequent pretreatment process. Wet storage
could thus enhance downstream pretreatment. Acetic acid and other organic acids generated
during hydrothermal pretreatment are recognized as catalyzing agents in enhancing water
ionization and cleavage of acetyl/hydrolysis of hemicellulose (Mosier et al., 2005a; Mohammad,
2008; Zheng et al., 2009). Organic acids, when compared to dilute inorganic acids (as used in
“dilute acid pretreatment”), can minimize degradation of hydrolyzed sugars to inhibitors that can
impact on subsequent ethanol yield. This has motivated investigations into the use of organic
acids (e.g. acetic, lactic, formic, and maleic) as catalysts in hydrothermal pretreatment (Kootstra
et al., 2009; Xu et al., 2009; Marzialetti et al., 2011). Organic acid interactions with post-storage
pretreatment could therefore be positive.
However, as noted earlier in this introduction, these acids can interfere with the fermentation
process. The downstream effects of these acids will also be directly determined by examining the
inhibitory nature of organic acids on ethanol fermentation. The use of unensiled, washed and
unwashed silage with and without liquid hot water (LHW) pretreatment extracts will provide
evidence of the transformation dynamics of these organic acids during common biofuel unit
operations, as well as the direct effect of the acids on ethanol fermentation.
5.2 Materials and methods
5.2.1 Stover description and storage
Corn stover, Pioneer brand 34A20, was obtained in 2008 from Idaho national Lab. The stover
was harvested in 2007 from the Boyd plot near Boone, IA and field-dried for about 3 -5 days,
raked, baled, transported to Idaho and stored indoors with a tarp cover to prevent dust
accumulation. Particular size was reduced to 1” minus (less or equal to 25.4 mm) in the early
summer of 2008. The particle size distribution was analyzed using the Penn State Forage Particle
Separator, as described in Heinrichs and Kononoff (2002). About 26% of particles were greater
than 19 mm, 26% were between 8 and 19 mm, 31% were between 1.18 and 8 mm and 17% were

129
less than 1.18 mm. This biomass feedstock was referred to in previous chapters of this
dissertation as the IA stover.
The corn stover had an initial moisture content of about 7% and was adjusted to six different
moisture levels, 25% to 75%, to initiate these wet storage experiments. Moisture adjustment was
accomplished by spraying with appropriate amount of water and leaving the samples overnight
to be thoroughly absorbed into the fibers. The moisture adjustment was within ±2 percentage
units of the target moisture level. Corn stover was stored at a bulk density of about 159 dry
Kg/m3 in 1 pint (0.00047 m
3) glass canning jars that were tightly sealed to create anaerobic
conditions. Storage duration was 220 days at 37oC and ambient temperature, which was
approximately 23 ± 1oC. Experiments were performed in triplicates. After storage, samples were
dried in a HotPack convection oven at 55oC, ground using a 2 mm screen on a Wiley Mill
(Model 4, Thomas Scientific, Swedesboro, NJ) and stored at room temperature in sterile airtight
Whirl-Pak bags (Nasco, Fort Atkinson, Wisc.) prior to pretreatment. Composition of the
feedstock before and after storage was in accordance with the NREL standard protocols and as
determined in Chapter 3.
5.2.2 Organic acid measurements and pretreatment
Collection of soluble extracts and measurements of pH and organic acids in the feedstock after
storage were performed in accordance with the methods described in Chapter 3. The pH of
pretreatment extracts was also determined using SevenEasy S20 pH meter (Mettler-Toledo
International Inc, Columbus, OH).
The impact of organic acids on liquid hot water (LHW) pretreatment requirements was
investigated using washed and unwashed samples of dry ground ensiled (Day 220) and unensiled
(Day 0) corn stover. Ensiled samples are the moisture adjusted stover stored under anaerobic
conditions, in this case for 220 days, while the unensiled samples are the corresponding day zero
samples. Washed samples were washed with deionized water using the Dionex Accelerated
Solvent Extraction 350 (ASE 350) (Thermo Fisher Scientific Inc., Dionex ASE 350, Sunnyvale,
CA) system set at 40oC with three static cycles of 10 minutes, 100% flush, and a purge time of
200 seconds for 66 ml cells. The purpose of washing was to remove all organic acids produced

130
during storage in order to prevent any involvement or interaction with the pretreatment
procedure. In this way, the washed samples served as control against which unwashed samples
were compared to assess the impact of organic acids on the pretreatment process. Washed
samples would also indicate whether any change in pretreatment outcome is as a result of acid
interaction during storage or acid interaction during pretreatment when compared to unwashed
samples of unensiled and ensiled stover respectively. Only 37oC samples were washed for
comparison. See Appendix D, Figure D1 and Table D1, for a flowchart of sample processing and
analysis and an overview of the experimental design.
Liquid hot water (LHW) pretreatment of samples was also accomplished using the ASE 350
equipment, with each sample replicated four times. LHW pretreatment is a well established and
effective strategy that involves heating water-saturated or moist feedstock at high temperatures
(160 -220oC) under high pressure to maintain the liquid state for a couple of minutes without any
chemical additives. Optimum conditions reported by Mosier et al. (2005b) for controlled pH
LHW pretreatment were 190oC for 15 minutes, and these conditions were used as the benchmark
for reduced severity comparisons. This standard pretreatment condition with the ASE was
defined as 190oC, 1 static cycle of 15 minutes, 0% flush volume and a purge time of 120 seconds
for 10 ml cells, using deionized water. Each 10 ml ASE cell was filled with 1.5 dry gram of
sample. Solid loading was 14 – 20% and 13 – 15% for unwashed and washed samples
respectively. The solid loading is the percentage of dry solids to total liquids after pretreatment.
The variability in solid loading is subject to the amount of water added by the ASE 350 during
the filling and heating stage. The potential for reduced severity pretreatment was investigated by
comparing shorter retention times (5 and 10 minutes) with the standard 15 minutes at 190oC.
Pretreatment extracts, 500 μl each, were diluted 30-fold and filtered through 0.2 μm PTFE
syringe filters prior to analyzing for inhibitors (5 -Hydroxymethyl furfural (HMF) and furfural)
and organic acids using Ion Exclusion Chromatography (ICE) (Thermo Fisher Scientific Inc.,
Dionex ICS 3000, Sunnyvale, CA). Separation was performed at 30oC using IonPac ICE-AS1
guard (4 x 50 mm) and analytical (4 x 250 mm) columns with 100 mM methanesulfonic acid
eluent at a flowrate of 0.16 ml/min. Inhibitors and organic acids were detected with a photodiode

131
array detector (Thermo Fisher Scientific Inc., Dionex UVD 340U, Sunnyvale, CA) at
wavelengths of 270 nm and 210 nm respectively.
In addition to inhibitors and organic acids, xylan and glucan removal during pretreatment was
also determined. Xylan removal, a proxy for hemicellulose hydrolysis, was used as a
comparative indicator of the relative effectiveness of the different pretreatment conditions. To
measure the removal of these sugar polymers, the pH of the extracts was first measured using a
pH meter (Mettler-Toledo International Inc, SevenEasy S20, Columbus, OH).
Based on the pH range, 52.3 μl of 72% w/w sulfuric acid (Sigma–Aldrich, St. Louis, MO) was
added to 1.5 ml of each extract to obtain a final concentration of 4% sulfuric acid in 10-ml
autoclave safe bottles. The pretreatment extracts had pH levels greater than 3.5 but less than 5.
For this pH range, the hydrogen ion concentrations had significant digits at the 4th or 5th
decimal place. As a result, volume of acid was practically the same. See Appendix D, Equation
D1 for formula used in calculating amount of acid to add. Bottles were tightly covered using
rubber stoppers with crimped aluminum seals and placed in autoclave, together with sugar
recovery standards, at 121oC liquid setting for 1 hour. The acid-hydrolyzed extracts were filtered
through 0.2 μm PTFE filters and diluted 400-fold. Monosaccharide composition was determined
using Dionex ICS 3000 Ion Exclusion Chromatography. Separation was by high pH anion
exchange at 30oC using CarboPac PA20 guard (3 x 30 mm) and analytical (3 x 150 mm)
columns with 2 mM sodium hydroxide (NaOH) eluent at a flow rate of 0.5 ml/min. Detection of
the monosaccharides was by pulsed amperometric [electrochemical] detection at gold working
electrodes, using a quadruple waveform. Xylan and glucan removal were calculated from xylose
and glucose concentrations, using conversion factors of 0.88 and 0.90 respectively. Equation
5.1 was used in calculating xylan removal. For glucan removal, the various xylan components
were replaced by glucan.
( )
5.1
Where
= Mass of xylose in pretreatment extract (g)

132
= Xylose degraded during storage (% dry matter)
XDM = Original xylan content of corn stover before storage (% dry matter)
DM = Dry mass of corn stover that was pretreated (g)
5.2.3 Simultaneous fermentation and saccharification
After pretreatment the solids content of each pretreatment cell was directly transferred to a 50-ml
centrifuge tube for fermentation. Pretreatment extracts were collected separately during the
extraction process. For each storage condition investigated, two replicates were fermented with
pretreatment extract and two without extract. The pretreatment extract contains most of the
inhibitory compounds, which are soluble. Thus there were two steps in the overall process when
inhibitors could be separated, first when washing samples after wet storage but before
pretreatment, and second when extracting liquids after pretreatment. These two separations (or
their absence, for the “unwashed” storage samples and “with extract” fermentation treatments)
make it possible to determine the impact of organic acids and other inhibitors formed during
storage and/or pretreatment separately with respect their contribution to fermentation inhibition.
Although the wet storage organic acid profile may transform during pretreatment, the new post-
pretreatment organic acid profile is assumed to be influenced by (or a product of) the acids
produced during storage.
Simultaneous fermentation and saccharification (SSF) was carried out in tightly sealed 50-ml
centrifuge tubes. Samples fermented with pretreatment extract had a solids loading of 8.4% ±
0.1%, while washed and unwashed samples fermented without extract had a solids loading of
5.2% ± 0.1%. The solid loading was calculated as the ratio of dry mass of feedstock used in
fermentation to the mass of total fermentation liquids. For samples without extract, some solids
were lost in the pretreatment extract resulting in the lower solid loading. The fermentation broth
contained the following components prepared in a cocktail before addition: Penicillin-
Streptomycin at a final concentration of 30 μg/mL (0.1% v/v) to prevent microbial growth; citric
acid buffer (pH 4.5) at 0.05M to maintain a pH of 4.8, which is in the optimum range for enzyme
activity; Yeast peptone (YP) as a microbial nutrient at 1% broth volume; commercial cellulase
(Spezyme CP, Genencor, Rochester, NY) at 15 filter paper units (FPU)/g glucan complemented

133
with a commercial β-glucosidase (Novozyme 188, Novozymes A/S, Bagsvaerd, Denmark) at 60
cellobiase units (CBU)/g glucan. The microorganism used for fermentation, Saccharomyces
cerevisiae NRRL Y-2034, was obtained from the USDA ARS culture [NRRL] collection.
Saccharomyces cerevisiae Y-2034 is a wild type 6-carbon sugar fermenting yeast. The yeast was
grown in YPD media (10 g/L yeast extract, 20 g/L peptone, and 50 g/L dextrose) for about 24
hours after which the cells were centrifuged at 4200 rpm for 5 minutes. The supernatant was
discarded and the cells were washed in 1× PBS (Phosphate Buffer Solution: 138 mM sodium
chloride, 2.7 mM potassium chloride, 12 mM sodium and potassium phosphates, pH 7.4). After
washing, cells were resuspended in PBS and used as fermentation inoculant. Each tube was
inoculated with appropriate volume of inoculant to obtain an initial OD600 of 0.5. Fermentation
tubes were vortexed for ~ 5 seconds to mix contents before incubation for 72 hours. The
fermentation temperature and agitation, 35oC and 110 rpm, were achieved using a lateral motion
hot water bath. However, the vertical placement of tubes in the bath did not provide the complete
mixing intended by the agitation. Tubes were therefore removed twice (every 24 hrs) within the
fermenting period and inverted couple of times to mix contents. Control samples included
enzyme-yeast blanks and Avicel (α-cellulose). At the end of the fermentation period, samples
were centrifuged and the supernatant collected in appropriately labeled micro-centrifuge tubes.
The supernatant from each fermentation broth was diluted 9-fold and analyzed for ethanol using
the YSI 2700 SELECTTM
biochemical analyzer (YSI Inc., Yellow Springs, OH) with 2%
precision.
5.2.4 Data analysis
Results were analyzed using statistical tools such as analysis of variance (ANOVA) and
regression analysis. All statistical tests were conducted using Minitab 14 (Minitab Inc., State
College, PA) at a significance level, α, of 0.05.
5.3 Results and discussion
5.3.1 Pretreatment pH
After pretreatment the pH of the biomass feedstock generally decreased relative to the pH before
pretreatment (Appendix D, Table D9). This result was expected, and could be attributed to

134
deacetylation of xylan at high temperatures leading to the formation of acetic acid. This acid in
turn interacts with the pretreatment process by serving as hydrolytic catalyst, providing free
protons. This change in pH can thus indirectly indicate LHW pretreatment activity. Compared to
unensiled stover, smaller differences were observed between pH after wet storage and
subsequent pretreatment pH of unwashed ensiled feedstock. The average difference for unensiled
feedstock was 2.2 pH units while feedstock ensiled at 23oC and 37
oC had average differences of
0.08 and 0.18 pH units respectively. See Appendix D, Table D9.Two factors – hemicellulose
degradation during storage and the buffering capacity of organic acids – are likely responsible
for the smaller differences in ensiled feedstock. From Chapter 3, it was observed that on
average, 10% of hemicelluloses were degraded after 220 days of storage. The acetyl groups
constitute 3.8 -5% of the stover, and are the most susceptible components to the low temperature
acid hydrolysis that occurs during ensilage. This was evident from the large amount degraded, up
to 55% reported in Chapter 3. This implies that fewer acetyl groups would be available for
conversion to acetic acid during pretreatment. Alternatively, organic acids present in ensiled
samples, up to 9.1% compared to less than 0.5% for unensiled samples, could serve as buffering
agents in resisting pH change. This second factor is marginally supported by the relatively larger
pH change in washed ensiled samples compared to unwashed samples. Without storage organic
acid interfering with pretreatment, the decrease in storage pH of 0.34 mean pH units during
pretreatment of washed samples was still smaller than that of unensiled feedstock indicating a pH
limit in the vicinity of pH 4. The pH of washed samples were generally lower (~4.08) than
unwashed samples (~4.24) (p = 0.001).
Although the pH of unensiled samples decreased more dramatically during pretreatment, mean
resultant pH values were still generally higher (4.44 ± 0.17) than for the ensiled samples (4.26 ±
0.16) (p < 0.0001). From Table 5.1, it can be inferred that this drastic decrease in pH was a result
of more acetyl in the unensiled feedstock, which was then available for hydrolysis to acetic acid
during pretreatment. Generally, pH decreased with increased pretreatment time. For unensiled
samples the pH at all three time levels (5, 10, 15 minutes) were significantly different from each
other (4.64 ± 0.09, 4.42 ± 0.08, 4.27 ± 0.06 respectively; p < 0.0001) and feedstock moisture had
no significant impact. For ensiled samples, there was no significant difference between 10 and
15 minutes (4.23 ± 0.10 and 4.18 ± 0.16), both of which were lower than 5 minutes (4.37 ±0.14)

135
(p < 0.0001). With respect to storage moisture, there was no significant difference in pH at all
moisture levels except for 25% moisture, which was higher from 45% and 55% moisture (p <
0.0001). There was also no significant impact of storage temperature on pretreatment pH.
Generally, the pH values were moderate and conducive for both enzymatic hydrolysis and
ethanol fermentation.
Table 5.1 Relating hydrogen ion concentration to acetyl hydrolysis during pretreatment
Before Pretreatment After Pretreatment Hydrogen ions from pretreatment
([H+]after - [H+]before)
pH [H+] pH [H+]
Ensile 4.38 4.16869E-05 4.26 5.49541E-05 1.32671E-05
Unensile 6.67 2.13796E-07 4.44 3.63078E-05 3.6094E-05
Ratio ([H+]Unensiled /[H+]Ensiled)
2.72
Acetyl content* Unensiled has 122% more acetyl than ensiled stover
100% would implies twice the hydrogen ions compared to ensiled
stover, if all acetyl is removed during pretreatment of unensiled stover
22% would imply 0.44
Expected ratio ** ([H+]Unensiled /[H+]Ensiled)
2.44
The actual ratio of 2.72 is greater than the expected 2.44
This is reasonable since acetyl is not the only component in hemicellulose that is hydrolyzed to acids
Hemicellulose degradation during storage implies less of the other acid types too
* Up to 55% acetyl was degraded during storage (Chapter 3). This upper limit is used in calculation ** Expected ratio assuming all of hydrogen ions produced during pretreatment were from acetyl (from hemicellulose) hydrolysis to acetic acid
5.3.2 Glucan and xylan removal
Glucan removal during pretreatment in unensiled stover was ~58% higher than ensiled (4.49% ±
0.65 vs 2.84% ± 0.56; p <0.0001) and storage temperature had no significant impact on amount
removed (p = 0.157). See Tables D2 and D3 in Appendix D for data on glucan and xylan

136
removal at 23oC and 37
oC. These removal values are based on percentage of the total glucan (or
xylan) polymer in the feedstock and were calculated using Equation 5.1. Pretreatment time also
had no significant impact on glucan removal (p = 0.742 ensiled, 0.525 unensiled). Similarly,
xylan removal from ensiled stover was not significantly different for the various pretreatment
times (p = 0.210), with the results indicating 5 minutes (27.67% ± 3.29) was just as effective as
15 minutes (28.68% ± 2.08). This result may have important commercial implication if the
assumption that xylan removal reflects the extent of pretreatment is valid. In contrast, xylan
removal from unensiled stover was significantly lower after 5 minutes of pretreatment (22.23% ±
2.06) compared to 10 (26.62% ± 2.31) and 15 minutes (27.30% ± 1.12) of pretreatment (p <
0.001). At the longest retention time of 15 minutes, xylan removals for ensiled and unensiled
stovers were not significantly different from each other. This result suggests as retention time or
pretreatment severity increases wet storage effects on pretreatment are masked, as previously
observed in Chapter 4. Ensiled stover had significantly higher xylan removal, about 28% on
average, compared to 25% for unensiled samples (p < 0.0001). The minimum xylan removed
was 17% and maximum was 34%.
When considering the effect of storage moisture content on glucan removal, the results indicated
samples ensiled at 45 - 75% moisture and subsequently pretreated were not significantly
different from each other but lower than samples ensiled at 25% and 35% moisture. For
unensiled samples, pretreatment of samples in the range of 25% - 55% moisture did not
experience significantly different glucan removal. With respect to xylan removal, the effect of
moisture was only observed in the ensiled samples. At 23oC, xylan removal was highest at 35%
moisture (30.84% ± 2.48) although this difference was only significant relative to the 25% and
65% moisture samples, and both of these treatment conditions were not significantly different
from other moisture levels (p = 0.007). At 37oC, xylan removal at 45% and 55% moisture was
only significantly higher than the 35% moisture treatment. These results showed storage
temperature had some effect on xylan removal and revealed a significant interaction with storage
moisture (p < 0.0001). Generally, samples stored at 23oC experienced more xylan removal
during pretreatment than samples stored at 37oC (27.58% ± 3.17 vs 25.05% ± 3.21; p = 0.001).
The lower average xylan removal rate after ensilage at 37oC could be biased by a few samples at

137
the extremes of the storage moisture range, which had no lactic acid or lower lactic acid at 37oC
compared to 23oC.
Washing ensiled samples appeared to increase xylan removal. For example, during pretreatment
for 15 minutes the washed ensiled samples experienced more xylan removal than the unwashed
ensiled samples, 36.36% ± 4.56 and 23.89% ± 2.73 respectively (p < 0.0001). Since washed
samples do not contain organic acids, the implication is that contribution of organic acids to
pretreatment is primarily during the storage process, rather than during the subsequent
conventional pretreatment process. Although organic acids accelerate xylan removal, they may
also interfere with and limit xylan removal during conventional pretreatment. This acceleration
and limitation was observed in data on the amount of xylan removed in 5 minutes compared to
15 minutes. Under these circumstances xylan removal did not increase with time, although
removal from the washed samples indicated more xylan was potentially available. Despite this
apparent interference, xylan removal in wet storage samples was still better [at shorter retention
time] or comparable [at longer retention time] to unensiled samples as previously discussed.
5.3.3 Organic acids and inhibitors from pretreatment
Organic acids
The main acids identified in the pretreatment extracts of unwashed corn stover feedstock were
lactic (≤ 4.2% DM), acetic (≤ 2.2% DM), and isobutyric (≤ 3.9% DM) acids (see Figures 5.1 and
5.2). Individually, none of these acids exceeded 0.6% mass per pretreated volume. Low levels of
tartaric, malic, formic, pyruvic were also detected. Wet storage and pretreatment conditions
affected which acids were dominant, and these were different for different conditions. Lactic
acid was the dominant acid in wet stored and pretreated feedstock (2.94% ± 0.81 [Day 220] vs
0.14% ± 0.31 [Day 0]) while acetic acid was dominant in Day 0 samples (1.06 ± 0.31 [Day 0] vs
0.64 ± 0.33 [Day 220]). Isobutyric was equally dominant after pretreatment in before and after
storage samples (1.61 ± 0.91 [Day 220] vs 1.42 ± 0.75 [Day 0]).

138
Figure 5.1: Main pretreatment acids in the extracts of unwashed stover at the various
pretreatment retention times. Solid circle = Mean; open circle = Individual values; ˟ = Outliers;
Rectangle = Range box
As shown in Figure 5.3, the amount of lactic acid generally increased during pretreatment while
acetic acid amount decreased. Samples with lower lactic acid (0.0 to < 1.50%) prior to
pretreatment generated more lactic acid (up to 4.22%) and samples with higher lactic acid (1.94
to 3.20%) generated less (< 1.40%). Lactic acid could have been produced through hydrothermal
deamination and hydroxylation of amino acids, or in small amounts via hydrothermal
degradation of polysaccharides (Quitain et al., 2002; He at al., 2007). Another potential source of
lactic acid generation may be a reaction of acetic acid formed during storage with formaldehyde
produced during pretreatment (see Equation 5.2).
5.2
Org
an
ic a
cid
(%
dry
ma
tte
r)
Storage
Prt time
Isobutyric Acetic Lactic
UnensiledEnsiledUnensiledEnsiledUnensiledEnsiled
151051510515105151051510515105
4
3
2
1
0
Acetic acid + Formaldehyde → Lactic acid

139
At standard conditions, this reaction is spontaneous. This pathway is conjectured based on the
disappearance during pretreatment of some of the acetic acid present after wet storage after
pretreatment. Also, compared to washed samples with no storage acids, hence no acetic acid, the
amount of lactic acid generated during pretreatment was less than the amount produced during
storage, which was washed out before pretreatment. In effect, there was a decrease in lactic acid
during pretreatment, not an increase as in unwashed samples. Lactic acid in the pretreatment
extract of washed samples was in general less than 0.5%. Formaldehyde, assumed in Equation
5.2 as reacting with acetic acid, can be produced from thermohydrolytic degradation of xylose
(Schafer and Roffael, 2000; Roffael and Huster, 2012).
About half of the unwashed wet storage samples with acetic acid lower than 1% (dry basis, d.b.)
[generally in samples from 25 – 45% moisture] showed a percentage point decrease (up to 0.9%
d.b.) in the original amount after pretreatment and the other half showed an increase (up to 0.8%
d.b.) above the wet storage amount. In contrast, wet storage samples with acetic acid
concentrations greater than 1% to 2.8% [55 – 75% moisture] decreased up to 2.3% (d.b.).
Isobutyric acid in pretreatment extracts was high, and was not significantly different for both
Day 0 and Day 220 samples. Generally there was an increase above the initial wet storage
amount (up to 3.1% d.b.) except for the retention time of 5 minutes, where 65% and 75%
moisture samples showed a decrease in isobutyric acid.
In the pretreatment extracts from washed samples, malic acid was dominant (2.11% ± 1.73 DM),
far more than acetic and lactic acids which averaged ≤1% and ≤0.51% respectively. Formic acid
amounts were comparable to lactic acid. Traces of succinic acid were observed in the 75%
moisture samples. No isobutyric acid was present in pretreatment extracts from any washed
samples. This lack of detection of isobutyric acid in washed samples contrasts with the relatively
high levels of isobutyric acid in the unwashed samples after pretreatment. The increase in the
isobutyric acid concentration of unwashed samples could thus be due to interactions of organic
acids or other extractives washed out of the feedstock. Unlike acetic and lactic acids, isobutyric
acid is usually not reported in studies of hydrothermal processing of lignocellulosic materials,
and a specific abiotic reaction that could occur during pretreatment has not been elucidated.

140
Figure 5.2: The dominant three acids in the pretreatment extract from various storage moisture levels, unwashed, and subjected to
three pretreatment retention times (See Appendix D, Tables D4 and D5, for other acids present in pretreatment extract)

141
Figure 5.3: Change in amounts of organic acids from unwashed wet stored samples and total amount of acids in pretreatment extracts
Changes in organic acid profile are percentage point difference represented by ‘acids present in pretreatment extract (%) - storage acids (%)’, using mean values,
all on a dry matter basis. Negative values indicate the amount of acid after pretreatment was less than the amount in the wet storage sample prior to pretreatment.
Total acids are also read from the same axis and include other minor acids present in the pretreatment extract.
-4
-2
0
2
4
6
8
25 35 45 55 65 75 25 35 45 55 65 75 25 35 45 55 65 75 25 35 45 55 65 75 25 35 45 55 65 75 25 35 45 55 65 75 25 35 45 55 65 75 25 35 45 55 65 75 25 35 45 55 65 75
Chan
ge in
org
anic
acid
pro
file
afte
r pre
trea
tmen
t (%
)
Storage moisture (%)
ΔLactic ΔAcetic Δisobutyric Total pretreatment acid
5 minutes 10 minutes 15 minutes
Day 220 (Ensiled)Day 0 (Unensiled)
5 minutes 10 minutes 15 minutes 5 minutes 10 minutes 15 minutes
23C 37C

142
Total organic acid in pretreatment extracts were not significantly different at the various
pretreatment retention times (p = 0.353) and various storage moisture levels (p = 0.306).
However, wet storage did have an impact. As observed in Chapter 3, organic acids were
virtually absent in control (Day 0) samples. These unwashed Day 0 samples behaved similarly
to the washed wet stored samples, generating more acids during pretreatment than unwashed wet
stored samples. On average, however, total acids from pretreated unwashed wet stored feedstock
were still higher (~ 6.54% DM) than for unwashed Day 0 samples (~ 4.46% DM) (p < 0.0001).
The unwashed samples also showed the apparent changes in the organic acid profile after
pretreatment. Butyric acid, present in a number of unwashed high moisture samples in amounts
greater than 1% DM, disappeared completely. Individually, amount of lactic acid and acetic acid
in ensiled samples were not significantly different at the various pretreatment times (p = 0.405
and 0.118 respectively). For Day 0 samples, the lactic acid concentration was not different for
the various pretreatment times (p = 0.642). However, the acetic acid concentration at 15 minutes
was significantly higher than at 5 and 10 minutes (p < 0.0001). With respect to temperature,
samples stored at 23oC generally had lower lactic acid (p = 0.001) but more acetic (p = 0.002)
than 37oC samples after pretreatment. Based on the amount of storage acetic and lactic acids at
23oC and 37
oC (Chapter 3), a similar inverse relation as describes in earlier paragraph was
observed, in which samples with relatively lower initial [storage] acids had higher amounts
generated during pretreatment than samples with higher initial [storage] acids and vice-versa.
Inhibitors
In addition to organic acids, two sugar degradation products 5-(Hydroxymethyl) furfural (HMF)
and furfural were measured in pretreatment extracts. The former derives from hexoses and the
later from pentoses, and both are known to inhibit many ethanologens including yeast.
Generally, both of these inhibitors were higher in ensiled samples compared to unensiled
samples and both were not affected by storage temperature (p > 0.5). On average, HMF
concentrations were less than 0.05% (0.039% ± 0.018) on a dry matter basis (d.b.) and furfural
concentrations were less than 0.5% (d.b.) (0.47% ± 0.27) in unwashed ensiled samples. These
HMF and furfural concentrations were about 30% and 75% more respectively than the amounts
in unensiled samples. The ratio of xylan removed to glucan removed was approximately the

143
same as the ratio of furfural to HMF produced, and this ratio was on the order of ~10. On a per
[pretreated] volume basis, concentration of HMF and furfural were 0.03 ± 0.05 g/L extract and
0.48 ± 0.32 g/L extract respectively. Tables D6 and D7 in Appendix D show the concentrations
at various moisture and pretreatment times.
In contrast to unwashed samples, washed samples had no HMF in the pretreatment extracts, but
far higher furfural concentrations than were observed in the unwashed samples, averaging 1.12%
± 0.26 (d.b.) or 1.5 g/L extract at 15 minutes retention time. See Appendix D, Table D2. Glucan
removal during pretreatment from washed samples was higher than that from unwashed samples
(3.28% DM ± 0.38% vs 2.81% DM ± 0.43%, p = 0.017). This higher glucan removal was
expected to result in larger amounts of HMF in the pretreatment extracts from the washed
samples, but this was not the case. This suggests that HMF was produced from degradation of
preexisting glucose in the water soluble components of corn stover or glucose hydrolyzed during
wet storage rather than from the glucose produced from structural degradation during the
pretreatment process. This result thus supports the hypothesis that decomposing valuable
feedstock components to simpler, more bioavailable forms during wet storage increases their risk
of being degraded in subsequent processing to less valuable forms. Alternatively, it is possible
that other water soluble compounds in the stover or produced during ensilage may catalyze
glucose degradation or serve as reaction partners in the formation of HMF in unwashed samples.
Their absence in the washed samples would therefore hinder the formation of HMF. The higher
furfural could be attributed to the higher xylan removal from washed samples (p < 0.0001). At 15
minutes pretreatment retention time xylan removal was ~36% and ~24% of theoretical for
washed and unwashed samples respectively. Furfural generated from the pretreated washed
samples previously stored under the extreme moisture conditions (25% and 75%) were lower [<
1%] than amounts produced during pretreatment of washed samples from the mid-range 35% -
65% moisture wet storage samples, which were not significantly different from each other.
The amounts of both the HMF and furfural inhibitors increased with pretreatment time as
expected. For unensiled feedstock, amounts of HMF and furfural generated at each pretreatment
retention time were significantly different from each other (p < 0.05) (See Table 5.2 and Figure
5.4). In wet stored stover, HMF generated during 5 and 10 minutes of pretreatment were not

144
significantly different and were lower than the amount generated in 15 minutes. Furfural,
however, was different for all pretreatment times. For the unensiled versus wet stored stover,
there was more than a 100% and a 60% increase in furfural respectively, for every 5 minutes
increase in pretreatment time. Furfural produced during pretreatment was not significantly
different for the various storage moistures. HMF was also not significantly different except for
45% moisture ensiled stover samples (which had higher amounts than observed for the 65%
samples) and 35% moisture (which had higher amounts than observed for the 75% moisture
samples of unensiled stover).
Table 5.2: Furfural and HMF generated during liquid hot water pretreatment of unwashed corn
stover
Pretreatment
time (minutes)
Furfural (% dry matter) HMF (% dry matter)
Ensiled Unensiled Ensiled Unensiled
0 0† 0
† 0
† 0
†
5 0.229 ± 0.124 0.079 ± 0.019 0.027 ± 0.016 0.015 ± 0.006
10 0.414 ± 0.080 0.236 ± 0.027 0.036 ± 0.010 0.028 ± 0.007
15 0.670 ± 0.287 0.490 ± 0.062 0.052 ± 0.019 0.046 ± 0.013
p-value < 0.0001 < 0.001 0.001 < 0.001
Regression *
R2 ~ 0.84 ~ 0.86 ~0.63 ~0.72
* All intercepts set to zero. R2 was similar in zeroed and actual intercept except for unensiled furfural in which the
actual equation [(0.0411 x pretreatment time) - 0.1426] had an R2 of ~95%.
† Analysis of water soluble extracts collected before pretreatment showed there was no furfural or HMF present in
the feedstock before pretreatment.

145
Figure 5.4: Variation in Furfural and HMF with moisture and pretreatment time
5.3.4 Fermentation
Ensiled versus Unensiled
Generally, there was no significant difference in fermentation yields of unensiled (Day 0) and
ensiled (Day 220) unwashed stover. This was true whether the stover samples were fermented
with or without their pretreatment extracts (p: with extract = 0.745, without extract = 0.235) (see
Table 5.3). However, the pretreatment response of samples with or without wet storage was
different in terms of the dominate acids and inhibitors produced and xylan removed at shorter
retention times. Organic acids, furfural and HMF were higher in ensiled samples, and so was
xylan removal. The first group can adversely affect fermentation yields depending on their
concentrations and the pH of the fermentation broth, while xylan removal can favor ethanol
yields, for typical hexose fermenting yeast as were used in this assay. Ranges of the dominant
acids in the fermentation broths, on mass per fermentation volume basis, were 0.00 – 2.17 g/L,
0
0.2
0.4
0.6
0.8
1
1.2
25 35 45 55 65 75 25 35 45 55 65 75 25 35 45 55 65 75
5 5 5 5 5 5 10 10 10 10 10 10 15 15 15 15 15 15
Inh
ibit
or
gen
era
ted
(%
dry
mat
ter)
Ensiled HMF Ensiled Furfural Unensiled Furfural Unensiled HMF

146
0.00 – 1.07 g/L and 0.00 - 2.69 g/L for isobutyric, acetic and lactic acids respectively. Acetic
acid was dominant in unensiled feedstock while lactic was dominant in ensiled feedstock.
Acetic acid levels above 0.50 g/L lead to intracellular accumulation that could affect cell growth,
ethanol production or both, while lactic acid concentrations greater than 8.0 g/L could lead to
cell death depending on type of yeast and intracellular pH (Narendranath et al., 2001; Ingledew ,
2003). Although lactic acid concentrations in the present study were much lower than this 8 g/L
level, 92% of unensiled samples in this study had acetic acid concentrations greater than 0.50
g/L. The fermentation pH of 4.8 in this study is, however, higher than the pH, 3.0 to 4.0, in
Narendranath et al. (2001) and Ingledew (2003). Thus the effect of these acids on fermentation
microbes in the present study is expected to be less than in these prior studies, due to the lower
amount of undissociated acids. A more recent study conducted by Xu et al. (2010) found that
acetic acid, which is more inhibitory than lactic acid, only inhibited ethanol yields when the
concentration used in LHW pretreatment reached or exceeded 10% g acetic acid/g feedstock. In
addition, 0.51g/L furfural and 0.07 g/L HMF present in fermentation broth when 6% g acetic
acid/g corn stover was used during pretreatment, did not have any inhibitory effect on
fermentation yields. Ethanol yield was similar to that of control samples without acetic acid.
When acetic acid was less than 6%, concentrations of ethanol were higher than the control (up to
8.63 g/L compare to 7.63 g/L in the control) with maximum ethanol yield obtained at 1.0% -
3.0% g acetic acid/g corn stover, equivalent to 1.5 g - 2.5 g acetic acid/L fermentation broth. Xu
et al. (2010) observed that the amount of acetic acid increased above the amount used in
catalyzing pretreatment and the concentration in pretreatment liquor, when a maximum of 40% g
acetic acid/g feedstock was used, was about 23 g/L. Under these severe conditions, maximum
furfural and HMF concentrations were 1.74 g/L and 0.23 g/L respectively. Pretreatment liquors
were fermented directly without dilution and ethanol yield was about 0.50 g/L, about 93% less
than amount in the control. This level of inhibition was attributed mainly to the high acetic acid
concentration. Palmqvist et al. (1999) observed that acetic acid and furfural individually, at pH
of 5.5, stimulated ethanol yield when concentration was 0 -10 g/L and 0 -2 g/L respectively.
When both are present in the fermentation broth, there was an interactive effect that could be
negative depending on the concentration of each compound. For instance, when acetic acid was 8
g/L and furfural was 0.6 g/L, volumetric productivity and ethanol yield both increased by about

147
20% above the controls without acid and furfural. When acetic acid was 2 g/L and furfural was
2.4 g/L, volumetric productivity decreased by 70% but final ethanol yield was still 20% more
than the control. However, at acetic acid concentrations of 8 g/L and furfural at 2.4 g/L,
volumetric productivity decreased by 80% and final ethanol yield also decreased by 50%.
Larsson et al. (1999) also observed that at pH of 5.5, acetic acid up to 6 g/L increased ethanol
yield even in presence of more inhibitory acids like formic and levulinic acids. At a
concentration of 4.8 g/L, varying furfural concentration from 1.5 g/L to 2.5 g/L did not affect
final ethanol yield, although volumetric productivity was reduced with increasing concentrations.
In the present study, acetic acid, after pretreatment of unwashed samples, was generally less than
2% of the dry mass of corn stover. The maximum concentration in g/L fermentation volume was
1.1, which was observed for 75% moisture unensiled stover pretreated for 15 minutes. Only 8%
of the unensiled samples, which had higher acetic acid concentration than ensiled samples, had
acetic acid concentrations exceeding 1 g/L (at 65% and 75% moisture). Furfural and HMF
concentrations in unwashed samples were 0.346 g/L ± 0.03 and 0.028 g/L ± 0.002 respectively.
Although about 10% of the unwashed samples in this study had furfural levels exceeding 0.51
g/L, the maximum HMF was below 0.06 g/L. Maximum furfural concentration in unwashed
samples was 0.73 g/L for 55% moisture ensiled stover pretreated for 15 minutes. The implication
is that none of the potential inhibitors produced during pretreatment affected fermentation yield.
If a 30% solid loading (e.g. 30 g dry stover in 100 g liquid) is assumed during pretreatment and
is fermented directly without dilution, the concentrations of lactic, acetic and furfural would be
expected to increase by a factor of 1.5 to 2.3, since solid loading in this study was 13 to 20%.
Applying a 2.3 factor to maximum values in Table D8, in Appendix D, would imply maximum
concentrations of 12.03 g/L (at 55% moisture, ensiled, pretreated 5 mins) 6.03 g/L (at 75%
moisture, unensiled, pretreated 10 mins) and 2.90 g/L (at 55% moisture, ensiled, pretreated 15
mins) for lactic, acetic and furfural respectively.
Even at this higher solid loading, these concentrations in themselves may not contribute to
significant inhibition. Graves et al. (2006) observed that with 25% solids in corn ethanol
fermentation, Saccharomyces cerevisiae could tolerate 30 g/L of lactic acid. At 30% solids,
ethanol yield was still not affected when pH was 5 but dropped by about 13% at pH 4. Acetic

148
acid at 2 g/L increased ethanol production even with 30% solids and this was not affected by pH.
However, with 20% solids and pH of 4, a 4 g/L acetic acid concentration reduced ethanol
production by 50%. In contrast, when pH was increased to 5.5, ethanol production did not seem
to be affected by 8 g/L acetic acid. There are several factors that complicate the predictability of
the effects of these organic acids or furfural on ethanol yield under high solid loading. At high
solid loading, there are several other factors that could lead to lower ethanol yields, especially
when solid concentrations exceed 20%. These include osmotic stress due to higher sugar
concentrations (Darku and Richard, 2011); lower enzyme adsorption rates (Kristensen et al.,
2009); mass transfer limitations (Varga et al., 2004; Kristensen et al., 2009; Zhang et al., 2009);
and ethanol inhibition from higher ethanol concentration (Mohagheghi et al., 1992).
Disregarding these high solids limitations and applying a factor of 2.3 to values in Table D6
(Appendix D), similar yields can be expected from both ensiled and unensiled stover based on
the previously discussed observations by Palmqvist et al. (1999) and Larsson et al. (1999). This
is because although ensiled samples have high furfural, only 14% of these samples at 30% solid
loading would contain furfural greater than 2.4 g/L (39% would be less than 1 g/L) and
maximum acetic acid would be less than 4 g/L (51% were ≤ 2 g/L). At these concentrations, a
stimulating effect on ethanol yield would be expected. For unensiled samples, acetic acid levels
were higher than in ensiled samples. Yet even then, at a hypothetical 30% solids loading, while
89% of the samples would have concentrations greater than 2 g/L, only 4% would exceed 4.8
g/L. In contrast, furfural concentrations were lower than in ensiled samples; at 30% solids the
maximum concentration would be less than 2 g/L and 33% of the samples would have
concentrations less than 1 g/L. With limited understanding of the complex interactions of
inhibitors in fermentation broth coupled with the pH effect, it is possible that with higher solids,
ensiled and unensiled feedstock could respond differently, with one having better outcomes over
the other in terms of ethanol yield. While ethanol productivity will most certainly be affected by
15 minutes of pretreatment at higher solid loading, final yields may not be affected. Based on the
current analysis, the ethanol fermentation outcomes of ensiled and unensiled samples at high
solids would be balanced by lower acetic in the former and lower furfural in the later, likely
resulting in similar yields.

149
Since wide type Saccharomyces cerevisiae is exclusively a 6-carbon fermenting yeast, the
similarity in glucan composition of ensiled and unensiled samples also accounted for the
similarity in ethanol yields. The assumption here is that there was no glucose degradation after
structural decomposition during pretreatment. This assumption is based on the negligible
amounts of HMF generated during pretreatment. At high temperature, under acidic conditions,
glucans are degraded to HMF. In addition, washed samples did not have any HMF suggesting
that HMF was likely from free water extractable glucose, which in the case of washed samples
were washed out. The similarities in yields also suggest that although, statistically, xylan
removal was significantly higher in ensiled feedstock, it was not of practical significance.
Alternatively, it may be possible that glucan was more accessible in ensiled samples, but its
utilization was hindered by inhibitors leading to coincidental similarities in yields with the
unensiled samples. The following section, discussing fermentation yields with and without the
pretreatment liquids, should help evaluate this question.

150
Table 5.3*: Fermentation yields, on percent theoretical basis, at the different pretreatment retention times
Day 0 Day 220
Pretreatment time (min)
5 10 15 p-value 5 10 15 p-value
Unwashed
With Extract (23oC)
46.65 ± 1.91a 50.46 ± 2.10b 55.27 ± 1.60c <0.0001 44.00 ± 2.91a 49.43 ± 3.65b 57.59 ± 6.41c <0.0001
No Extract (23oC)
40.07 ± 1.82a 45.45 ± 3.59b 49.11 ± 3.71c <0.0001 41.29 ± 8.84a 48.11 ± 1.86b 50.31 ± 4.89b 0.002
With Extract (37oC)
38.58 ± 2.28a 41.91 ± 3.16ab 46.86 ± 11.29bc 0.021
Washed
With Extract (37oC)
33.25 ± 2.75a 43.13 ± 5.37b 41.56 ± 6.21b <0.0001
No Extract (37oC)
45.65 ± 6.62
P-value (down) <0.0001 0.001 <0.0001 <0.0001 <0.0001 <0.0001
*Same letter across indicate not significantly different; same color down indicates not significantly different

151
Fermented with pretreatment extract versus without extract
Ethanol yields for unwashed samples fermented with pretreatment extracts were significantly
higher than samples fermented without extract (p = 0.041) (see Table 5.3). For samples without
pretreatment extract, glucan removed during pretreatment was accounted for. If glucan removal
was unaccounted for, the yields from samples without extract would have been much lower. See
Appendix D, Table D12 for the amount of potential ethanol lost if extracts are discarded. This
may seem negligible from a mass perspective. Glucan removal was low during pretreatment and
on average and could theoretically have yielded 0.0073 g ± 0.0002 of ethanol or ~0.59 g/L ± 0.04
g ethanol/ L fermentation volume. In terms of theoretical ethanol yield, this could potentially be
up to 5% of the total ethanol that could be derived from the fermentation, if the extracts were
fermented too (see Appendix D, Table D12 and Equation D3). Yields of samples fermented with
and without extract were 50.57% ± 5.79 and 45.72% ± 6.01 or on a mass ethanol per
fermentation volume basis, 6.68 g/L ± 0.09 and 5.78 g/L ± 0.11 respectively. The lower yields of
samples without extract could be due to the absence of organic acids, which have been reported
by Taherzadeh et al. (1997), Larsson et al. (1999), Palmqvist et al. (1999), Thomas et al. (2002)
and Torija et al. (2003) to have a stimulating effect at low concentrations on ethanol fermentation
thereby increasing yields. Correlation and regression analysis (Appendix D: Tables D13 and
D14, Figures D2 and D3) show that acetic acid has a positive correlation and significant
regression relationship with ethanol yield in unensiled samples, but not with ensiled samples.
This lack of correlation may be a result of the lower acetic acid levels in the ensiled samples,
suggesting that there may be a lower limit below which acetic acid has no stimulating effect, just
as there is an upper limit as observed in other studies. Tables D13 and D14 also show that
furfural and HMF, at the concentrations found in unwashed stover in this study, were positively
and strongly correlated with ethanol yield. The regression equations for unensiled stover are
reasonable as they show that without furfural or HMF, ethanol yield was similar to the mean
yield in samples fermented without pretreatment extract, hence had no furfural or HMF. This
result supports the observation by Palmqvist et al. (1999) that furfural serves as an ethanol
stimulant when concentrations are ≤ 2 g/L. As noted in the previous paragraph, the organic acids,
HMF and furfural in the pretreatment extract were not likely to exert any inhibition to

152
fermentation and were responsible for the higher yield in samples fermented with pretreatment
extracts.
Storage at 23oC versus Storage at 37
oC
This section compares the ethanol yields of unwashed ensiled samples fermented with
pretreatment extract at different storage temperatures. Samples stored at 23oC had better yields
(as a percentage of theoretical ethanol yield) than samples stored at 37oC (50.34% ± 7.20 vs.
42.45% ± 7.53; p < 0.001). The difference, however, was due mainly to differences in yields at
the extreme moisture levels, 25% and 75% (see appendix D, Tables D10 and D11). At these
respective storage moistures, yields were 47.99% ± 5.72 vs 41.33% ± 3.76 and 49.12% ± 5.46 vs
32.88% ± 6.56 for 23oC versus 37
oC respectively. Although glucan composition before
pretreatment and glucan removal during pretreatment were similar for samples ensiled at these
two temperatures, xylan removal was significantly higher in samples stored at 23oC. In addition,
samples stored at 23oC had higher acetic acid and lower lactic acid content in the pretreatment
extracts than samples stored at 37oC. Thomas et al. (2002) observed that while both acetic acid
and lactic acid at low concentrations could enhance ethanol yields, given appropriate pH, acetic
acid was a better stimulant and resulted in more ethanol production while lactic acid resulted in
more cell growth than ethanol. At pH 4.5, increasing acetic acid concentration to 16 g/L did not
have much inhibitory effect on yields (Thomas et al., 2002). Acetic acid levels in this study were
lower and the pH of the fermentation media was approximately 4.8, so it is possible that this
stimulating effect of acetic acid was responsible for the difference in yields.
Washed versus unwashed samples
Samples stored at 37oC were analyzed for the effect of washing versus not washing before
pretreatment. Although unwashed samples fermented with the pretreatment extract had higher
percentage theoretical ethanol yields (42.45% ± 7.53) than washed samples (39.31% ± 6.55),
there was no significant difference between the two. This was in spite of the higher xylan
removed in the washed samples (~36%) compared to unwashed samples (~24%). The organic
acid profiles of these two groups were also very different, with the washed samples dominated
by malic acid which is less inhibitory than the isobutyric, lactic and acetic acids that were
dominant in the unwashed samples. However, washed samples contained more than twice the

153
amount of furfural found in unwashed samples. On a furfural mass per fermentation volume
basis, washed samples had 0.82g/L ± 0.19 furfural while unwashed had 0.35g/L ± 0.18 at a
pretreatment retention time of 15 minutes. The furfural concentrations in the washed samples
were not expected to inhibit ethanol production from discussion under fermentation of ensiled
and unensiled stover. It is, however, possible that higher levels beyond 0.51 g/L (Xu et al., 2010)
or 0.6 g/L (Palmqvist et al., 1999) could, in the presence of other compounds present in the
pretreatment extract. In one study, the growth rate of S. cerevisiae was not affected at furfural
concentrations ≤ 1 g/L and specific ethanol productivity (gram ethanol per gram feedstock per
hour, g/g/h) was not affected at 1.5 g/L. Even at a furfural concentration of 2g/L, while specific
ethanol productivity was significantly reduced the final ethanol yield was not (Boyer et al.,
1992). In the present study, fermentation was not allowed to proceed to completion, and that
could have partially masked any inhibitory effect of borderline inhibitory concentrations of
furfural, which are assumed to be responsible for the lower trending (but not significantly lower)
yields of washed samples. The inhibitory effect of these compounds is dependent on several
factors including pH, inoculation rate, substrate concentration, and the presence of other
compounds.
Comparing washed samples fermented with extract to those fermented without extract, it was
observed that although the yields of the latter were on average higher (45.65 % ± 6.62 vs 41.56%
± 6.21 at 15 minutes pretreatment time), the difference was also not significant (p = 0.132). For
the same pretreatment duration, washed samples without extract were also not significantly
different from unwashed samples fermented with extract (46.86% ± 11.29). The implication is
that although furfural may have some effect on fermentation at a concentration of 0.82g/L, this
effect is not pronounced.
Effect of storage moisture and pretreatment retention time
With respect to the main processing alternatives investigated in this study, storage moisture had
no significant influence on ethanol yield among all the samples of unwashed stover, both
unensiled and ensiled at 23oC, whether fermented with or without their pretreatment extracts.
Ethanol yields for washed stover, fermented with and without pretreatment extracts, were also
not significantly different for unensiled samples or ensiled storage at either temperature across

154
all storage moisture conditions (see Figure 5.5). However, for samples ensiled at 37oC and not
washed before pretreatment, there was a storage moisture effect. Although yields for 75%
moisture samples [unwashed with extract] was not significantly different from 25% moisture,
they were lower than yields from all other moisture, averaging 37% of theoretical ethanol yield
compared to yields >43% of theoretical for samples in the intermediate moisture range (p =
0.008). At 37oC, samples at 75% moisture had high butyric acid, which disappeared during
pretreatment and could not have been responsible for the low yields. These samples were also
high in acetic acid and had no lactic acid prior to pretreatment, but the acetic acid was reduced
and the lactic acid generated during pretreatment. The only marked differences between the 75%
moisture samples and other samples were the presence of high storage butyric acid and the lack
of lactic acid. This suggests that lactic acid produced during storage, which was in a more
dissociated form than the other organic acids due to storage pH, could have favorably impacted
feedstock structure at other moisture levels. Although lactic acid at low concentrations can
stimulate fermentation, these results as well as observations from previous paragraph suggest
that lactic acid generated during storage is of more value than lactic acid generated by
pretreatment. As was also observed in Chapter 4, if extreme storage moistures are avoided, the
impacts of moisture on subsequent process outcomes are not significant.
In contrast to storage moisture, pretreatment retention time frequently had a significant impact on
ethanol yields. Generally, ethanol yields increased with pretreatment time. For unensiled
samples, with and without their pretreatment extracts, yields at the various pretreatment times
were significantly different from each other. Importantly, for ensiled samples, yields from the 10
minute pretreatment duration was not significantly different from 15 minutes, except for the
23oC unwashed samples fermented with extract. This suggests that ensilage may permit a
reduction of pretreatment severity without sacrificing yield, potentially reducing conversion
costs. These pretreatment time comparisons are detailed in Table 5.3.

155
Figure 5.5: Comparing means ethanol yields of dry ground stover
156
Top two charts represent samples stored at 23oC; bottom chart represent samples stored at 37
oC and fermented with
pretreatment extracts. Time = pretreatment retention times
5.4 Conclusions
The results presented in this chapter indicate that the organic acids produced during wet storage
and/or pretreatment generally do not inhibit ethanol fermentation and in fact can enhance the
fermentation yield. These effects of organic acid can be observed at two levels: (1) at the storage
level, they potentially alter feedstock structure, resulting in more xylan removal or weaker
linkages between components of the plant cell wall matrix, and (2) during subsequent
pretreatment, when organic acids can accelerate as well as limit xylan removal depending on the
acids involved. Generally, these contributions of organic acids to the bioconversion of corn
stover feedstock to ethanol are greater at storage level, and the partial pretreatment benefits are
more pronounced during storage than in subsequent thermochemical pretreatment processing. It
is not likely that the organic acids produced during wet storage will exceed the minimum
inhibitory concentration for S. cerevisiae. However, an important observation of this study is that
the acid profile was changed during pretreatment. Lactic acid, which is less inhibitory than some
other organic acids, was dominant in ensiled samples and its low pKa means more of it was in
the dissociated form. Higher levels of dissociated acids mean more hydrogen ions that can
interact favorably with structural bonds. When these effects occur at the storage level the
disassociated acids cannot be easily assimilated into microbes even if retained in subsequent
processes, and are thus less likely to inhibit microbial growth or ethanol production. In addition,
when lactic acid is dominant during storage there is the potential for a shift in reaction towards
production of acetic acid during LHW pretreatment. This results in relatively more acetic acid
production during pretreatment, which is a better ethanol stimulant than lactic acid. As with the
livestock industry, lactic acid dominated silage has the best outcomes during both storage and in
subsequent bioconversion. From an engineering design perspective, it would be useful to develop
coupled ensilage/pretreatment systems that encourage more lactic acid production during storage
and more acetic acid in subsequent pretreatment processing, as long as those acid concentrations
are less than 5% DM.

157
Using both xylan removal and ethanol yield as proxies for pretreatment effectiveness, these
results also provide evidence that pretreatment of ensiled stover could be carried out at a shorter
pretreatment time and thus lower severity than unensiled stover, and still be as effective. There
was evidence from the xylan removal results that wet storage resulted in changes that rendered
the feedstock more responsive to subsequent pretreatment process. Fermentation results also
indicated ensiled stover could achieve similar ethanol yields with shortened pretreatment times.
However, as pretreatment severity increases, the benefits derived from ensilage decrease. Xylan
removal rates by themselves were not always predictive, providing an indication of pretreatment
severity and perhaps pretreatment effectiveness, but not necessarily fermentation outcomes,
perhaps due to the presence of other compounds generated during storage or pretreatment.
In Chapter 3, it was observed that storage moisture content had minimal or no effect on
feedstock composition except at extreme levels. A similar observation was made in this chapter
with respect to ethanol yields. This is good news for biorefineries, which thus do not have to be
overly concerned with process adjustments to accommodate changes that might result from
different storage conditions, as these changes are not significant. Finally, these results confirm
that washing ensiled biomass to get rid of silage organic acids before subsequent processing does
not serve any benefit.
5.6 References
Boyer L. J., J . L. Vega, K. T. Klassone, E. C. Clausen and J. L. Gaddy. 1992. The effects of
furfural on ethanol production by Saccharomyces cerevisiae in batch culture. Biomass
and Bioenergy 3(1): 41-48
Chen, Y., R. R. Sharma-Shivappa and C. Chen. 2007. Ensiling Agricultural Residues for
Bioethanol Production. Appl Biochem Biotechnol 143:80–92
Darku, I. D; and T. L. Richard. 2011. Biofuels: ethanol producers. In: eLS, John Wiley & Sons,
Ltd: Chichester.
Deublein, D. and A. Steinhauser. 2008. Biogas from waste and renewable resources: An
introduction, 93 -127. Weinheim: Wiley-VCH Verlag GmbH & Co. KGaA
Digman, M.F., K J. Shinners, B. S. Dien, R. D. Hatfield, X. Li, R. E. Muck, P. J. Weimer. 2007.
On-farm Pretreatment Technologies for Improving Enzymatic Degradability of Cellulose

158
and Hemicellulose Present in Perennial Grass. ASABE Paper No. 071021. St. Joseph,
Mich.: ASABE.
Graves, T., N. V. Narendranath, K. Dawson and R. Power. 2006. Effect of pH and lactic or
acetic acid on ethanol productivity by Saccharomyces cerevisiae in corn mash. Journal of
Industrial Microbiology and Biotechnology 33(6): 469-474.
He W., G. Li, L. Kong, H. Wang, J. Huang, and J. Xu. 2008. Application of hydrothermal
reaction in resource recovery of organic wastes. Resources, Conservation and Recycling
52(5): 691-699
Henk, L. L. and J.C. Linden. 1994. Silage processing of forage biomass to alcohol fuel, in
Enzymatic conversion of biomass for fuels production. Himmel, M. E., J. O. Baker and R.
P. Overend. ACS symposium series 556: 391 – 410.
Ingledew, W. M. 2003. Chapter 24: Water reuse in fuel alcohol plants: effect on fermentation, is
a ‘zero discharge’ concept attainable? In: The alcohol textbook, 343–354. K. A. Jacques,
T. P. Lyons and D. R. Kelsall, Eds., Nottingham University Press: Nottingham, UK.
Knauf, M. and K. Kraus. 2006. Specific yeasts developed for modern ethanol production.
Spezielle Hefen für die Ethanolgewinnung 131: 753-758
Kootstra, A. M. J., H. H. Beeftink, E. L. Scott and J. P. Sanders. 2009. Comparison of dilute
mineral and organic acid pretreatment for enzymatic hydrolysis of wheat
straw. Biochemical Engineering Journal 46(2): 126-131.
Kristensen, J. B., C. Felby and H. Jørgensen. 2009. Yield-determining factors in high-solids
enzymatic hydrolysis of lignocellulose. Biotechnology for Biofuels 2(1): 11.
Larsson, S., E. Palmqvist, B. Hahn-Hägerdal, C. Tengborg, K. Stenberg, G. Zacchi and N.O.
Nilvebrant. 1999. The generation of fermentation inhibitors during dilute acid hydrolysis
of softwood. Enzyme Microbiology and Technology 24:151–159.
Linden, J. C., L. L. Henk, V. G. Murphy, D. H. Smith, B. C. Gabrielsen, R. P. Tengerdy and L.
Czako. 1987. Preservation of Potential Fermentables in Sweet Sorghum by Ensiling.
Biotechnology and Bioengineering 30:860-867.
Marzialetti, T.., S. J. Miller, C. W. Jones and P. K. Agrawal. 2011. Switchgrass pretreatment and
hydrolysis using low concentrations of formic acid. Journal of Chemical Technology and
Biotechnology 86(5): 706-713.
Mohagheghi, A., M. Tucker, K. Grohmann and C. Wyman. 1992. High Solids Simultaneous
Saccharification and Fermentation of Pretreated Wheat Straw to Ethanol. Applied
Biochemistry and Biotechnology 33:67-81.

159
Mohammad, A. 2008. Recovery of Hemicelluloses from Wood Hydrolysates by Membrane
Filtration.MS thesis. Finland: Lappeenranta University of Technology, Department of
Chemical and Process Engineering.
Mosier, N., C. Wyman, B. Dale, R. Elander, Y. Y. Lee, M. Holtzapple and M. Ladisch. 2005a.
Features of promising technologies for pretreatment of lignocellulosic
biomass. Bioresource technology 96(6): 673-686
Mosier, N., R. Hendrickson, N. Ho, M. Sedlak, M.R. Ladisch. 2005b. Optimization of pH
controlled liquid hot water pretreatment of corn stover. Bioresource Technology
(96):1986-1993.
Narendranath, N.V., K.C. Thomas and W.M. Ingledew. 2001. Effects of acetic acid and lactic
acid on the growth of Saccharomyces cerevisiae in a minimal medium. Journal of
Industrial Microbiology and Biotechnology 26:171-177.
Palmqvist, E., H. Grage, N. Q. Meinander and B. Hahn-Hägerdal. 1999. Main and interaction
effects of acetic acid, furfural and p-hydroxybenzoic acid on growth and ethanol
productivity of yeasts. Biotechnology and Bioengineering 63(1):46–55.
Roffael, E. and H. G. Hüster. 2012. Complex chemical interactions on thermo hydrolytic
degradation of urea formaldehyde resins (UF-resins) in recycling UF-bonded boards.
European Journal of Wood and Wood Products 70(4): 401-405
Schäfer, M, and E. Roffael. 2000. On the formaldehyde release of wood. Holz Roh Werkstoff.
58:259–264.
Taherzadeh, M. J., C. Niklasson and G. Liden. 1997. Acetic acid friend or foe in anaerobic batch
conversion of glucose to ethanol by Saccharomyces cerevisiae? Chemical Engineering
Science, 52 (15): 2653 - 2659
Thomas, K. C., S. H. Hynes, and W. M. Ingledew. 2002. Influence of medium buffering
capacity on inhibition of Saccharomyces cerevisiae growth by acetic and lactic acids.
Applied and Environmental Microbiology, 68(4): 1616–1623
Thomsen, M. H., J. B. Holm-Nielsen, P. Oleskowicz-Popiel and A. B. Thomsen. 2008.
Pretreatment of whole-crop harvested, ensiled maize for ethanol production. Applied
Biochemistry & Biotechnology 148:23–33
Torija, M. J., G. Beltran, M. Novo, M. Poblet, N. Rozes, A. Mas, and J. M. Guillamon. 2003.
Effect of organic acids and nitrogen source on alcoholic fermentation: study of their
buffering capacity. J. Agric. Food Chem. 51(4): 916–922

160
Xu J, M. H Thomsen, and A. B Thomsen. 2010. Investigation of acetic acid- catalyzed
hydrothermal pretreatment on corn stover," Applied Microbiology & Biotechnology
86(2): 509-516
Quitain A. T., M. Faisal, K. Kang, H. Daimon and K. Fujie. 2002. Low-molecular-weight
carboxylic acids produced from hydrothermal treatment of organic wastes. Journal of
Hazardous Materials 93(2):209-220.
Varga, E., H. B. Klinke, K. Reczey and A. B. Thomsen. 2004. High solid simultaneous
saccharification and fermentation of wet oxidized corn stover to ethanol. Biotechnology
and Bioengineering 88:567-574.
Xu, J.., M. H. Thomsen and A. B. Thomsen. 2009. Enzymatic hydrolysis and fermentability of
corn stover pretreated by lactic acid and/or acetic acid. Journal of biotechnology 139(4):
300-305.
Zhang, J., X. Shao and L. R. Lynd. 2009. Simultaneous saccharification and co‐fermentation of
paper sludge to ethanol by Saccharomyces cerevisiae RWB222. Part II: Investigation of
discrepancies between predicted and observed performance at high solids
concentration. Biotechnology and bioengineering 104(5): 932-938.
Zheng, Y., Z. Pan and R. Zhang. 2009. Overview of biomass pretreatment for cellulosic ethanol
production. International Journal of Agricultural and Biological Engineering 2(3): 51-68

161
Chapter 6
Post storage handling and processing of wet stored stover: effects of drying
Abstract
Biorefineries are projected to handle a wide variety of feedstocks to guarantee supply and sustain
continuous operation as well as optimize production of a wide spectrum of bio-based end-
products in addition to fuels. The goal is to improve environmental performance, accommodate
diversity in the agricultural industry, maximize economic benefits, and ensure the long term
sustainability of the bioenergy industry. One question that arises, when considering the
transportation aspects of biomass logistics, is whether or not wet storage (ensiled) feedstock
should be transported wet to the biorefinery. A uniform feedstock format has been suggested as a
reliable and perhaps necessary option for biorefineries utilizing multiple feedstocks to minimize
equipment redundancy and down time and improve overall performance. Most uniform
feedstock strategies would require drying of feedstocks that had been in wet storage. This
chapter examines the impact of drying ensiled feedstock by evaluating pretreatment outcomes
and ethanol fermentation. The results indicate that indicators of effective LHW pretreatment,
including higher xylan removal and minimum levels of inhibitors, favored “as is” moist silage
over dried silage. Ethanol yields were also higher for “as is” samples by factors of 1.3 and 1.6 for
unwashed and washed samples respectively. In addition, the results suggest that the impacts of
organic acids on feedstock during storage had a significant pretreatment effect. This effect is
enough to weaken the pore structure in plant cell walls, which collapsed during drying and
resulted in the low ethanol yields for dried silage.
Key words: corn stover, wet storage, ensiled, drying, logistics, pretreatment, organic acids,
ethanol, furfural, fermentation, xylan removal
6.1 Introduction
Wet storage (ensilage) of biomass for biofuel could address several logistical issues related to
harvest and storage. Harvest can be accomplished in a single pass, reducing the potential for soil
compaction due to traffic and the operational costs associated with the multi-pass system

162
required by conventional harvesting methods. Wet storage can also eliminate the challenge of
reducing high moisture levels of feedstocks at the time of harvest, as well as contamination
concerns of field drying. However, wet storage may not necessary contribute positively to
transportation logistics. Dry storage is expected to have an advantage over wet storage with
respect to the ease and cost of transportation, eliminating the additional economic burden of
moving water over long distances to biorefineries. However, the low bulk density of dry
feedstock presents its own challenges, with volume rather than weight limits a constraint to truck
hauling capacity, and the resulting impact on transportation economics. One strategy for
handling wet storage feedstock is transportation through pipelines to a refinery, but the economic
viability of pipeline slurry systems is only achieved at a very large scale (Kumar et al., 2005).
Another possibility is to reduce the feedstock moisture content before transporting to a
biorefinery. Three practical options are available to reduce the moisture of wet storage biomass:
(1) reduce the moisture content prior to ensilage, initiating wet storage at low moisture levels,
probably near 35%; (2) reduce the water mass and/or increase dry bulk density by compression
(use a press to squeeze out the water and/or make pellets or briquettes); and (3) dry the feedstock
before transporting. This list is not exhaustive; for example, Grozdits (1997) describes a
biologically treated, self-ventilating system, using a proprietary mixture of thermophilic
microbes. But pre-storage drying, dewatering by densification, and post-storage drying, are
moisture reduction approaches that have been demonstrated for other food and biological
materials. The first option, drying biomass before storage, is well understood for hay production
systems, and would produce materials comparable to the 25% and 35% moisture wet storage
treatments described in previous chapters. The second option, densification or biomass into
pellets or briquettes works best for most materials at feedstock moisture of 15% - 20% (Kaliya
and Morey, 2009). The silage juice or effluent produced by densifying wetter materials
constitutes a disposal problem as well as potential loss of fermentable constituents. In theory this
effluent could be collected and fermented, but the relatively low sugar content may not make it
cost-effective, especially if densification is decentralized and away from the main biorefinery.
The third option, drying of silage after storage, is uncommon and there is currently no evidence
of such in the literature.

163
Either densification or drying of post-storage silage would involve additional costs, and may not
have any economic advantage over transporting water depending on the methods or tools used.
However, some form of moisture reduction may be required to achieve the vision of a uniform-
format feedstock supply system designed to address the non-uniformity of the wide variety of
herbaceous/lignocellulosic feedstocks (Hess et al., 2009). At the advanced level, the uniform-
format supply chain concept does not provide for separate wet and dry delivery lines to the
refining site. Instead, all feedstock are formatted into high density dry products. Understanding
the effects of post-storage drying on biomass characteristics is therefore necessary to evaluate
whether wet storage is compatible with a uniform format supply chain, and how such drying
would affect biomass quality characteristics and potential biofuel yield.
If drying is to be accomplished post-storage, air drying seems unlikely due to the large surface
area required, the potential for contamination if surfaces are not clean, and because the silage is
likely to be compromised by aerobic degradation during a slow drying process. Aerobic stability
is the ability of the silage to maintain its integrity and resist spoilage or deterioration when
exposed to aerobic conditions, and lasts only a few days before the same organic acids that
provided preservation benefits in anaerobic conditions become high energy substrates for aerobic
microbes. Aerobic instability is a major concern in the livestock industry, and during feed out
from large silage piles can account for dry matter losses of up to 15% to 25% (Holmes and
Muck, 2000; Dow, 2008). Although aerobic stability can be enhanced using silage additives,
plain silage can maintain stability for up to 65 hours (Danner et al., 2003). This may allow for air
drying in arid regions, but is a short window of time in more humid climates, especially for a
large scale industrial process that would require high throughput throughout the year.
Understanding the impacts of high throughput densification or rapid drying methods are
therefore required if wet storage materials are going to enter a uniform format process or another
type of dry materials handling supply chain. This study will focus on rapid drying and its impacts
on biomass characteristics and subsequent processing. Although rapid drying times can be
accomplished by vacuum or freeze drying, high temperature drying is by far the most common
strategy for high volume bulk organic materials. Drying temperatures of up to 100oC have been
shown to have no significant impact on the sugar content of corn stover and wheat (Houghton et

164
al., 2009). However, this result may not apply to pretreated materials. There are currently no
known studies investigating the interaction of silage acids with heated drying processes, and
whether or not this interaction contributes to pretreatment of feedstock during drying or
subsequent hydrothermal pretreatment.
In this chapter, the effect of drying of wet storage (ensiled) feedstock on subsequent processes
was investigated to see if it is an option worth pursuing. Even with structurally intact fresh
biomass, drying can reduce the available fiber surface area by collapsing pore spaces in plant cell
walls (Esteghlalian et al., 2001). Pretreating biomass before drying, even air drying, will result in
extensive and permanent collapse of the pores (Dowe and McMillan, 2001; Selig et al., 2008).
The collapse of pore spaces may negatively impact the amount of sugars that can be hydrolyzed
enzymatically, and hence reduce the biofuel yield that can be obtained from the feedstock.
Previous chapters in this dissertation have shown that the organic acids produced during ensilage
can result in partial pretreatment during storage. This biological pretreatment process parallels
some of the mechanisms effective in conventional inorganic acid pretreatment, but is not as
severe. This study investigates the significance of this pretreatment effect and the impacts of
subsequent drying on biomass characteristics and ethanol yield.
6.2 Materials and methodology
6.2.1 Corn stover description and storage
Field dried corn stover, Pioneer brand 34A20, with particle size distribution of less or equal to
25.4 mm was rewetted to adjust the moisture level form an initial level of ~7% to six different
levels (25%, 35%, 45%, 55%, 65%, 75%). The moisture adjusted materials were stored under
anaerobic conditions at bulk densities of about 159 dry Kg/m3 in glass canning jars at 37
oC for
220 days. Storage was in triplicates.
After storage, triplicate samples were thoroughly mixed and divided in twos. The half portions
were dried in a HotPack convection oven at 55oC until constant weight, then ground using a 2
mm screen on a Wiley Mill (Model 4, Thomas Scientific, Swedesboro, NJ) and stored at room
temperature in sterile airtight Whirl-Pak bags (Nasco, Fort Atkinson, Wisc.) prior to
pretreatment. The other halves were stored “as is” – that is not dried nor ground after storage – in

165
Ziploc®
bags at -20oC prior to pretreatment. Some “as received” stover was also stored at room
temperature for downstream analysis. “As received” stover is dry stover without moisture
adjustment.
6.2.2 Organic acids, pretreatment, inhibitors and sugar removal
Organic acid measurements before and after storage were as described in Chapter 3. Prior to
liquid hot water pretreatment using ASE 350 (accelerated solvent extraction), part of the “as is”
samples and part of the dried samples were washed to prevent interference of organic acid with
the pretreatment process. Washing of “as is” samples was as described in Chapter 4 and washing
of dried samples and pretreatment conditions was as described in Chapter 5. Based on the
maximum amount of sample that can fill the ASE cell without impeding smooth flow of fluid
through the cell, cells were loaded with 1.5 dry grams of dried silage samples and approximately
1 dry gram of “as is” samples. Solid loading for pretreatment was~15.9% and ~9.5% for
unwashed dried and “as is” samples respectively and ~13.7% and ~8.4% for respective washed
samples. Pretreatment retention times were 5, 10 and 15 minutes.
Pretreatment extracts were analyzed for organic acids, HMF and furfural, xylan and glucan
removal and pH following methods describes in Chapter 5.
6.2.3 Fermentation
Pretreated solids and separately collected pretreatment extracts were combined in a 50-ml
centrifuge tube for simultaneous saccharification and fermentation. The fermentation broth
contained the following components prepared in a cocktail before addition: Penicillin-
Streptomycin at a final concentration of 30 μg/mL (1% v/v) to prevent microbial growth; citric
acid buffer (pH 4.5) at a final concentration of 0.05M in the fermentation broth to maintain the
pH at 4.8, in the optimum range for enzyme activity; Yeast peptone (YP) as microbial nutrient at
1% broth volume; commercial cellulase (Spezyme CP, Genencor, Rochester, NY) at 15 filter
paper units (FPU)/g initial complemented with a commercial β-glucosidase (Novozyme 188,
Novozymes A/S, Bagsvaerd, Denmark) at 60 cellobiase units (CBU)/g glucan. The ethanol
fermenting microbe, Saccharomyces cerevisiae NRRL Y-2034, was obtained from the USDA
ARS culture [NRRL] collection. The centrifuge tubes were tightly sealed and placed in a 110

166
rpm lateral motion hot water bath at 35oC for 72 hours. Supernatants, collected after
fermentation, were analyzed for ethanol using YSI 2700 SELECTTM
biochemical analyzer (YSI
Inc., Yellow Springs, OH). See Chapter 5 for more details on fermentation.
6.2.4 Data Analysis
Results were analyzed using statistical tools such as analysis of variance (ANOVA) and
covariates (ANCOVA) as well as regression. All statistical tests were conducted using Minitab
14 (Minitab Inc., State College, PA) or XLSTAT (Addinsoft, New York, NY) at a significance
level, α, of 0.05.
6.3 Results and discussion
6.3.1 Pretreatment pH
Generally, pH of pretreatment extracts was lower than storage pH and decreased with
pretreatment time. On average, Day 0 samples decreased by more than 2 pH units while Day 220
samples decreased by 0.18 – 0.34 units. See Appendix E, Table E1. Although pH at Day 0
decreased drastically during pretreatment, it was still higher than pH at Day 220 (p < 0.0001).
Figure 6.1 shows pH across moisture at the different pretreatments times. Unwashed dried silage
had relatively higher pH (4.25 ± 0.21) than “as is” silage (4.14 ± 0.34) (p = 0.001) but there was
no significant difference in pH of dried and “as is” when samples were washed before
pretreatment (Dried = 4.08 ± 0.18, “as is” = 4.08 ± 0.16; p = 0.989). Figure 6.1 also shows a
second order polynomial best describes the relationship between pH and storage moisture
content. The coefficient of determination shows that pH can be reasonably predicted by
moisture. Using 5-minute pretreatment as a reference, graphs of “as is” samples are roughly
translated vertically down (lower pH) and horizontally to the right (higher moisture) with
increase in pretreatment time. This suggests the lowest pH, when “as is” samples were pretreated
for 10 and 15 minutes, was generally realized in samples stored at relatively higher moisture and
is more comparable at these two pretreatments times than at 5 minutes. In contrast, the unwashed
dried samples seemed to have shifted horizontally to the left, suggesting that the lowest pH was
achieved in samples stored at relatively lower moisture levels. Those lowest pH values for these
unwashed dried samples were higher than those of “as is” samples. Appendix E, Table E2 shows

167
the vertices of the various graphs and in general indicating lowest pretreatment pH values
attained and the corresponding moisture level at which these were or can be achieved. The
exceptions are unwashed unensiled “as is” samples with convex parabolas, whose vertices depict
maximum pH. The results suggest that for the wide range of moisture in this study, covering all
possible practical storage moistures levels, pH is not likely to drop to 3. The lower the pH, the
higher the potential for inhibition further downstream. Washed samples generally had lower pH
than unwashed samples. Although pH generally decreased with pretreatment time, for “as
received” stover (not shown in Figure 6.1), there was no significant difference across
pretreatment time (p = 0.318). Average pH for “as received” stover was 4.13 ± 0.16.
The pH of pretreated samples is important for at least three reasons: (1) it may be an indication
of how much deacetylation or degradation takes place during pretreatment leading to release of
acetic acid or other organic acids. Organic acids interact with the LHW pretreatment process, in
a kind of mild acid hydrolysis of linkages in hemicelluloses, in a manner similar to dilute acid
pretreatment. Using pH as a tool for measuring pretreatment activity is not very reliable when
comparing different feedstock since the buffering capacities could prevent changes in pH that
could result from more acid release. Also, the presence of other acids prior to pretreatment may
interfere with this pretreatment indicator (2) pH is a crucial parameter that determines enzymatic
and microbial activities. For some micro-organisms, the pH determines what products can be
formed. Saccharomyces cerevisiae, which is the most common microbe used for ethanol
fermentation, is very robust and can survive wide pH range, 2.5 – 8.5 or even 10.0 depending on
the medium composition. Optimum pH for growth is however between 4.0 and 6.0 and optimum
pH for ethanol production is approximately 4.0 to 4.5 (Buzas et al., 1989; Joosten and Peeters,
2010). The ethanol metabolic pathway from sugars is not greatly affected by the pH, although
production rate and product amounts can be affected. However, when growth or metabolite
inhibitors are present in the fermentation broth, pH becomes critical as it determines the
microbial tolerance or sensitivity to the inhibitors. (3) pH can affect process cost. This is
particularly true for acid and alkali pretreatment, in which feedstock must be neutralized or
adjusted before fermentation. The pH values of pretreatment extracts in this study were mainly
within the range conducive for subsequent enzymatic and fermentation processes.

168
Figure 6.1: pH of pretreatment extracts of “as is” and dried stover at different retention times

169
Table 6.1: pH of “as is” and dried stover at different pretreatment retention times
6.3.2 Organic acids, HMF and Furfural
Organic acids
In Figure 6.2, it can be observed that the organic acid profile of corn stover changed drastically
as a result of drying the feedstock prior to pretreatment. Drying resulted in more acids in Day 0
samples and the disappearance of lactic and acetic acids in Day 220. Lactic and acetic acids,
which are common and dominant in corn stover silages, were replaced by more inhibitory
isobutyric acid. Isobutyric acid was almost the sole acid in high moisture samples. Tartaric,
pyruvic and malic acids can be difficult to quantify due to their short retention times near the
elution of the system void volume, however, the high amounts detected in the samples facilitated
their quantifications.
A number of studies (Porter and Murray, 2001; Weißbach and Strubelt, 2008; Kreuger et al.,
2011) have shown that 55% - 89% of volatile organic acids (acetic, butyric, isobutyric,
propionic) and 9% - 53% of lactic acid in ensiled feedstock were lost [volatilized] during drying
at temperatures of 60oC – 105
oC. However, there were no indications of any increase or
transformation in acid content. For unensiled stover there were essentially no acids before
drying. It is possible that other volatile compounds were degraded and interacted with each other
5 10 15 p-value
Wash 4.22 ± 0.15a 4.07 ± 0.10b 3.94 ± 0.08c <0.0001
Unwash 4.23 ± 0.15a
4.12 ± 0.09ab
4.05 ± 0.08b 0.001
Wash 4.28 ± 0.11a
4.04 ± 0.07b
3.92 ± 0.06c <0.0001
Unwash 4.40 ± 0.18a
4.25 ± 0.16bab
4.09 ± 0.17b <0.0001
"As is" Unwash 4.60 ± 0.14a
4.40 ± 0.13b
4.28 ± 0.13b <0.0001
Dry Unwash 4.64 ± 0.04a
4.42 ± 0.06b
4.27 ± 0.03c <0.0001
Day 0
Pretreatment retention time (min)
Day 220
"As is"
Dry

170
and together with the “grinding effect” produced the transformations observed in acid content
after drying.
Figure 6.2: Organic acid profile of “as is” (top) and dried (below) Day 0 and Day 220 samples
before pretreatment
0
1
2
3
4
5
6
7
8
15 25 35 45 55 65 75 15 25 35 45 55 65 75
0 0 0 0 0 0 0 220 220 220 220 220 220 220
Org
anic
aci
d (%
dry
mat
ter)
Butyric (% DM)
Isobutyric (% DM)
Acetic (% DM)
Lactic (% DM)
Moisture,(%)
Duration (days)
0
1
2
3
4
5
6
7
8
15 25 35 45 55 65 75 15 25 35 45 55 65 75
0 0 0 0 0 0 0 220 220 220 220 220 220 220
Org
anic
aci
d (%
dry
mat
ter)
Pyruvic (% DM)
isobutyric (% DM)
acetic (% DM)
malic (% DM)
tartaric (% DM)
Duration (days)
Moisture (%)
“AS IS”
DRY

171
After pretreatment, organic acid types in unwashed “as is” and unwashed dried Day 220 stover
were similar although amounts in “as is” samples were generally higher than amounts in dried
samples. The same acid types were also present in the corresponding Day 0 samples. Eight acid
types were identified in unwashed samples (see Table 6.2). Dried unensiled stover generated
formic and lactic acids in addition to the four acids initially present before pretreatment and dried
ensiled stover generated four to six more acids, whereas “as is” samples generated formic,
pyruvic and malic acids in addition to acid types initially present before pretreatment. The
difference between “as is” and dried acid types, however, was the presence of tartaric acid in the
dried samples versus butyric and propionic acids in the “as is” samples, each of which was
absent in the other type of sample. Butyric and propionic acids were present only in the 75%
moisture samples. The main acids (> 0.5% of the dry matter, DM) in the unwashed “as is”
samples were acetic (2.6% ± 1.73), isobutyric (2.17% ± 1.3), lactic (0.82% ± 1.44) and formic
(0.50% ± 0.38). In the unwashed dried samples, the main acids were isobutyric (1.47% ± 0.82),
lactic (1.6% ± 1.46), acetic (0.82% ± 0.44), tartaric (0.54% ± 0.85). Generally, there was a
decrease in lactic acid from storage amount and an increase in acetic and isobutyric acids after
pretreatment in “as is” samples, while dried samples showed an increase in lactic and acetic but
a drastic decrease in isobutyric acid.
In washed samples, both “as is” and dried, fewer acids were generated during pretreatment and
these few acids were each present in lower concentration compared to unwashed samples. The
lower concentration of organic acid generated were observed in both ensiled and unensiled
washed samples. The former may result from degradation occurring during storage resulting in
organic acids that were washed out and lesser LHW hydrolysable components. The unensiled “as
is” samples had little or no acid and both dried and “as is” had no structural degradation during
“storage” to account for the lower concentration of organic acid generated during pretreatment.
An alternative explanation of the lower organic acid concentration will be that the water
extractable components of the stover, up to 7% (see Chapter 3), could also be major contributors
to organic acid generated during pretreatment or could aid in catalyzing the reaction. Water
extractable components may include non-structural sugars, some alcohols, inorganic ions and
organic acids.

172
Only four acid types were identified in washed “as is” stover and of these, only acetic and formic
were common to unwashed “as is” samples. Acetic acid was the dominant acid in washed “as is”
samples. Formic acid amounts were not significantly different for washed and unwashed
samples. Isobutyric, butyric and lactic acids, washed out before pretreatment, were not
regenerated during pretreatment of washed samples; malic, pyruvic and formic acids were
generated instead. These acids together were less than 1% DM (0.07% ± 0.35).
For washed dried stover, lactic acid was present in addition to the four acids present in washed
“as is” samples but malic acid dominated, in contrast to acetic acid dominance in washed “as is”
samples and in contrast to unwashed dries samples in which lactic acid dominated. Acetic acid
amounts were higher in washed dried silage (0.87% ± 0.06) compared to unwashed dried stover
(0.64% ± 0.33) but lower than amounts in washed “as is” stover.

173
Table 6.2: Organic acid profile of Day 220 stover after pretreatment with acids listed by decreasing inhibitory potential.
ₒ Showing mean values
Dried samples were dried at 55oC before pretreatment; Washed samples were washed before pretreatment. See text for detailed protocol
* Lactic acid can be metabolized by most fungi
? Pyruvic provides energy for most living cells and is a key intermediate for most metabolic processes. Like most things, excess pyruvic could have negative impact.
Pyruvic inhibitors are usually derivatives compounds
√ √ Higher antimicrobial activity relative to other microbial group
x not measured
See Appendix E, Table E7, for data on Day 0 (unensiled controls)
Generally same types of acids were present in corresponding Day 0 samples but at relatively lower amounts
High (15.4% DM) Low (1.1% DM)High (8.2% DM) Low (0.1% DM)
25 35 45 55 65 75 25 35 45 55 65 75 25 35 45 55 65 75 25 35 45 55 65 75
√ √√ 5 0.00 0.00 0.00 0.00 0.00 0.15 0.0 0.0 0.0 0.0 0.0 0.0 0.0 0.0 0.0 0.0 0.0 0.0 ₓ ₓ ₓ ₓ ₓ ₓ
10 0.00 0.00 0.00 0.00 0.00 0.18 0.0 0.0 0.0 0.0 0.0 0.0 0.0 0.0 0.0 0.0 0.0 0.0 ₓ ₓ ₓ ₓ ₓ ₓ
15 0.00 0.00 0.00 0.00 0.00 0.00 0.0 0.0 0.0 0.0 0.0 0.0 0.0 0.0 0.0 0.0 0.0 0.0 0.0 0.0 0.0 0.0 0.0 0.0
√√ √ 5 0.32 0.33 0.31 0.23 0.24 0.31 0.18 0.22 0.14 0.25 0.35 0.33 0.21 0.12 0.21 0.14 0.11 0.15 ₓ ₓ ₓ ₓ ₓ ₓ
10 0.50 0.35 0.52 0.38 0.40 0.47 0.40 0.29 0.31 0.33 0.28 0.30 0.21 0.25 0.27 0.18 0.10 0.29 ₓ ₓ ₓ ₓ ₓ ₓ
15 0.54 0.62 1.33 0.65 0.42 0.56 0.65 0.59 0.47 0.55 0.61 0.56 0.28 0.21 0.24 0.20 0.22 0.31 0.4 0.3 0.4 0.3 0.3 0.3
√ √ 5 0.00 0.00 0.00 0.00 0.00 4.55 0.0 0.0 0.0 0.0 0.0 0.0 0.0 0.0 0.0 0.0 0.0 0.0 ₓ ₓ ₓ ₓ ₓ ₓ
10 0.00 0.00 0.00 0.00 0.00 4.22 0.0 0.0 0.0 0.0 0.0 0.0 0.0 0.0 0.0 0.0 0.0 0.0 ₓ ₓ ₓ ₓ ₓ ₓ
15 0.00 0.00 0.00 0.00 0.00 0.00 0.0 0.0 0.0 0.0 0.0 0.0 0.0 0.0 0.0 0.0 0.0 0.0 0.0 0.0 0.0 0.0 0.0 0.0
√ √ 5 1.39 2.44 2.69 2.05 1.87 0.00 0.0 0.0 0.0 0.0 0.0 0.0 1.22 0.80 1.60 1.13 0.00 0.00 ₓ ₓ ₓ ₓ ₓ ₓ
10 2.45 2.58 4.10 2.90 2.76 0.00 0.0 0.0 0.0 0.0 0.0 0.0 1.29 1.65 1.89 1.42 1.46 2.15 ₓ ₓ ₓ ₓ ₓ ₓ
15 2.91 4.99 4.24 5.02 2.80 2.58 0.0 0.0 0.0 0.0 0.0 0.0 1.88 1.31 1.96 1.66 0.86 1.32 0.0 0.0 0.0 0.0 0.0 0.0
√√ √ 5 1.50 1.92 2.38 2.98 2.93 7.11 0.69 0.79 0.77 0.64 0.66 0.76 0.71 0.44 0.65 0.23 0.40 0.53 ₓ ₓ ₓ ₓ ₓ ₓ
10 1.84 1.53 3.75 3.55 3.35 8.13 0.99 1.06 0.93 1.04 1.24 1.10 0.40 0.74 0.53 0.37 0.55 0.78 ₓ ₓ ₓ ₓ ₓ ₓ
15 1.40 2.84 3.19 4.16 2.82 2.52 1.41 1.55 1.28 1.43 1.62 1.63 0.87 0.40 0.66 0.43 0.59 0.87 0.8 0.9 0.9 0.9 0.8 0.9
√ * 5 1.36 0.96 2.68 1.61 1.79 0.00 0.0 0.0 0.0 0.0 0.0 0.0 1.73 2.27 3.08 3.80 2.89 3.45 ₓ ₓ ₓ ₓ ₓ ₓ
10 1.49 0.34 5.61 3.25 2.03 0.00 0.0 0.0 0.0 0.0 0.0 0.0 1.91 2.83 3.52 3.77 2.96 3.61 ₓ ₓ ₓ ₓ ₓ ₓ
15 0.88 0.86 0.00 0.00 2.91 0.49 0.0 0.0 0.0 0.0 0.0 0.0 1.63 2.16 2.72 3.60 3.05 3.50 0.3 0.4 0.4 0.3 0.4 0.2
√ √√ 5 0.1 0.3 0.2 0.1 0.1 0.0 0.13 0.12 0.15 0.12 0.17 0.12 0.15 0.16 1.79 1.18 0.04 0.09 ₓ ₓ ₓ ₓ ₓ ₓ
10 0.22 0.24 0.28 0.19 0.15 0.15 0.18 0.15 0.14 0.16 0.19 0.18 0.14 0.19 0.39 1.33 1.07 0.62 ₓ ₓ ₓ ₓ ₓ ₓ
15 0.23 0.31 2.38 0.33 0.21 0.17 0.45 0.43 0.43 0.42 1.07 0.31 0.21 0.29 0.68 0.75 0.29 0.69 1.8 1.9 2.4 2.9 3.4 0.4
√ 5 0.0 0.0 0.0 0.0 0.0 0.0 0.0 0.0 0.0 0.0 0.0 0.0 0.85 0.26 0.16 0.09 0.01 0.04 ₓ ₓ ₓ ₓ ₓ ₓ
10 0.0 0.0 0.0 0.0 0.0 0.0 0.0 0.0 0.0 0.0 0.0 0.0 0.27 0.27 0.20 0.00 0.01 0.01 ₓ ₓ ₓ ₓ ₓ ₓ
15 0.0 0.0 0.0 0.0 0.0 0.0 0.0 0.0 0.0 0.0 0.0 0.0 0.22 0.13 0.30 0.10 0.01 0.00 0.0 0.0 0.0 0.0 0.0 0.0
? ? 5 0.12 0.23 0.22 0.19 0.23 0.05 0.09 0.18 0.08 0.09 0.11 0.12 0.23 0.20 0.33 0.30 0.12 0.14 ₓ ₓ ₓ ₓ ₓ ₓ
10 0.19 0.18 1.11 0.25 0.28 0.67 0.13 0.11 0.10 0.11 0.23 0.10 0.22 0.22 0.24 0.35 0.26 0.15 ₓ ₓ ₓ ₓ ₓ ₓ
15 0.22 0.28 0.69 0.29 0.25 0.34 0.20 0.14 0.13 0.14 0.19 0.14 0.23 0.19 0.17 0.18 0.16 0.18 0.2 0.2 0.1 0.2 0.3 0.1
5 4.79 6.15 8.49 7.16 7.14 12.18 1.09 1.31 1.14 1.10 1.29 1.33 5.10 4.25 7.82 6.87 3.57 4.40 ₓ ₓ ₓ ₓ ₓ ₓ
10 6.69 5.22 15.37 10.52 8.97 13.82 1.70 1.61 1.48 1.64 1.94 1.68 4.44 6.15 7.04 7.42 6.41 7.61 ₓ ₓ ₓ ₓ ₓ ₓ
15 6.18 9.90 11.83 10.45 9.41 6.66 2.71 2.71 2.31 2.54 3.49 2.64 5.32 4.69 6.73 6.92 5.18 6.87 3.51 3.74 4.13 4.67 5.14 1.90
Pretreatment
organic acids Bac
teri
a
Yeas
t &
mo
uld Pretreatment
time (min)
Inh
ibit
ory
po
ten
tial
Total acids
Average total acids
Lactic (%)
Malic (%)
"As is", washed Dried, unwashed Dried, washed"As is", unwashed
Propionic (%)
Formic (%)
Butyric (%)
Isobutyric (%)
Acetic (%)
Tartaric
Pyruvic (%)
5.93 3.858.94 1.87

174
The dominant pretreatment acid in unwashed dried stover was lactic acid. The dominant acid in
“as is” stover – both washed and unwashed – was acetic acid although amounts in unwashed
ensiled stover (3.22% DM ± 1.81) was more than twice the amount in the washed ensiled (1.09%
± 0.36) and unensiled samples (1.52% DM ± 1.11, washed and unwashed lumped). Acetic acid
generated in washed ensiled (1.09% DM ± 0.36) and washed unensiled (1.07% DM ± 0.35)
samples were not significantly different (p = 0.80) and did not vary with storage moisture but
were both lower than amounts in unwashed unensiled samples (1.97% DM ± 1.4). For unwashed
samples – ensiled and unensiled – there were no differences in amount of acetic acid generated
across moisture except for 75% moisture samples, which had higher amounts, up to 8%.
Dominant acids as well as the total acids in unwashed samples, of both ensiled and unensiled
samples of “as is” and dried stover, were not significantly different at the various pretreatment
times except for isobutyric, for which amounts in 15 minutes were higher than amounts in 10 and
5 minutes. Although there was an increase in amount of total acids in unwashed samples during
pretreatment over storage amounts, the presence of initial acid [regardless of the type] in
unwashed samples seems to dampen the effect of pretreatment time on acid yields. For washed
samples, dominant acids and total acids increased with pretreatment time and were different for
all time levels. The total acids after pretreatment of ensiled stover were on average
approximately 9% and 6% for unwashed “as is” and unwashed dried samples respectively and
2% and 4% for corresponding washed samples (see Table 6.2). Appendix E, Tables E4 to E7, has
details of organic acids generated at the various pretreatment times.
In “as received” stover (dry stover without moisture adjustment), six acid types were identified
after pretreatment and the dominant acids were acetic, isobutyric and tartaric acids. Similar to
washed “as is” samples, no lactic acid was detected in both washed and unwashed “as received”
stover. Compared to the dominant acids in unwashed and washed dried samples, there was no
significant difference in isobutyric amounts but acetic acid was higher in “as received” stover.
There was, however, no significant difference in amounts of acetic and isobutyric when
compared to unwashed “as is” samples.

175
Inhibitors
Amounts of furfural generated in unwashed dried silage samples (Day 220) were generally more
than twice the amounts generated in “as is” silage samples (0.376% DM ± 0.215 vs 0.156% DM
± 0.109) while HMF amounts were about seven times more (0.034% DM ± 0.018 vs 0.005%
DM ± 0.003). See Figure 6.3. At 15 minutes pretreatment retention time, where more inhibitors
were expected, washed dried silage had no HMF present, however, furfural was more than ten
times as much in washed dried silage as it was in washed “as is” silage (1.125% DM ± 0.258 vs
0.105% DM ± 0.048). At this retention time, amount of furfural in washed dried samples was
about twice the amount in unwashed dried samples. The opposite was the case for “as is”
samples, in which washed samples had about half the amounts generated in unwashed samples.
As with dried Day 220 samples, dried Day 0 samples had higher amounts of both furfural and
HMF compared to “as is” samples. HMF although negligible, was about ten times as much when
compared to “as is” samples, while furfural was about thrice as much.
Furfural and HMF amounts in pretreated ensiled (Day 220) samples were generally higher than
amounts in unensiled (Day 0) samples. Furfural in dried silage and “as is” silage were more than
amounts in corresponding unensiled sample by a factor of 1.5 and 2.0 respectively (p < 0.05).
Amounts in dried Day 0 and “as is” Day 0 samples were 0.255% DM ± 0.166 and 0.078% DM ±
0.051 respectively. HMF amounts in dried silage (0.034% DM ± 0.018) and dried unensiled
sample (0.028% DM ± 0.015) were not significantly different. Although HMF in “as is” silage
was about 1.9 times more than amount in unensiled “as is” samples (p < 0.0001), these amounts
were negligible (0.005% DM ± 0.003 vs 0.003% DM ± 0.002). For “as received” samples,
furfural generated was similar to amounts generated in dried samples (0.350 ± 0.255) but HMF
levels were higher (0.075 ± 0.045). Furfural amounts at 5 minutes were lower than amounts at 10
and 15 minutes in dried stover (p = 0.002). In contrast, furfural amounts in “as is” samples were
different at all time levels (p < 0.0001).

176
Figure 6.3: Furfural and HMF generated during LHW pretreatment. Filled rectangles = Day 220;
Empty rectangles = Day 0; Brown =HMF

177
6.3.3 Sugar removal
Generally, glucan removal was up to 7.7% in “as is” samples and up to 5.9% in dried samples.
Xylan removal was up to 57.7% in “as is” samples and up to 43.4% in dried samples. See Figure
6.4. On average, amount of glucan removed in “as is” silage [i.e. Day 220] was about 0.5%
points higher than amount removed in dried silage (p = 0.011) while xylan removed was about
6.1% points higher (p < 0.0001). Glucan removal in “as is” and dried Day 0 samples on the other
hand was not significantly different (p = 0.505). However, xylan removal in Day 0 samples was
higher in “as is” samples, about 4.6% points above dried samples (p = 0.001). Washing “as is”
silage before pretreatment resulted in approximately 14.0% point increase in xylan removal over
unwashed samples (p < 0.001) while washed Day 0 samples had only about 5.0% point increase
over corresponding unwashed samples. Glucan removal, however, was not significantly different
in washed and unwashed samples. For washed dried silage although xylan removal was about
11.5% points higher than corresponding unwashed sample, it was about 6.4% point lower than
washed “as is” silage.
Figure 6.4 shows glucan and xylan removal across moisture. Generally, there were no significant
differences in amount of glucan removed in feedstock at the various moisture levels except for
the washed samples, where the 25% moisture samples had more glucan removed. Xylan removal
was also not affected very much by storage moisture. There were no significant differences
across moisture in all Day 0 samples. For Day 220, dried samples at 35% moisture levels had
less xylan removed than dried 45% and 55% moisture samples (p = 0.006). Also, for “as is”
samples, xylan removal in 45% moisture samples was more than removal in 65% and 75%
moisture samples (p = 0.005).

178
Figure 6.4: Glucan and Xylan removal, as % of initial amount present, across moisture during
LHW pretreatment.
It can be observed in Table 6.3 that glucan removals were generally not different at the various
pretreatment retention times. In addition, glucan removals in unwashed stover were quite similar
0
1
2
3
4
5
6
7
8
25 35 45 55 65 75 25 35 45 55 65 75
Glu
can
rem
ove
d (%
)
Nominal moisture content (%)
Unwashed, Dry
Unwashed, "as is"
Washed, "as is"
0
10
20
30
40
50
60
25 35 45 55 65 75 25 35 45 55 65 75
Xyl
an r
em
ove
d (%
)
Nominal moisture content (%)
Unwashed, Dry
Unwashed, "as is"
Washed, "as is"
XYLAN
Day 220 Day 0
GLUCAN
Day 220 Day 0

179
for dried and “as is” samples. In contrast, Xylan removals, showed significant difference with
pretreatment time although there was generally no difference between amounts removed in 5 and
15 minutes for Day 220 and amounts removed in 10 and 15 minutes for Day 0. At 5 minutes
retention time, there was no significant difference in xylan removal in unwashed dried and “as
is” samples. However, at higher retention times, xylan removals in “as is” samples were
significantly higher than removals in dried samples.

180
Table 6.3: Xylan and glucan removal (% of amounts initially present) at different pretreatment retention time
Same letter (across) implies not significantly different
Same font color (down) implies not significantly different
(See Appendix E, Tables E9 and E10, for full data on glucan and xylan removal by moisture at the various pretreatment times)
5 10 15 p-value 5 10 15 p-value
Unwashed, Dry 24.61 26.64 23.89 0.091 2.96 3.03 2.81 0.517
Unwashed, "as is" 27.95 33.51 31.88 0.040 3.25 3.25 3.70 0.425
Washed, "as is" 44.22 49.19 41.86 < 0.0001 3.33 3.98 3.74 0.110
<0.0001 <0.0001 <0.0001 0.427 0.005 0.016
Unwashed, Dry 21.94 27.23 27.10 < 0.0001 4.26 4.61 4.59 0.318
Unwashed, "as is" 22.60 33.65 33.95 < 0.0001 3.96 4.95 5.05 0.094
Washed, "as is" 29.05 37.44 38.73 < 0.0001 3.25 3.78 4.36 0.009
0.003 <0.0001 <0.0001 0.077 0.002 0.256p-value down
p-value down
Day 220
Day 0
Xylan removed (%) Glucan removed (%)
Pretreatment time (min) Pretreatment time (min)
a a a
abba
aba
a b b
a b b
a b b
a a a
a a a
a a a
a a a
a a a
a ab b

181
6.3.4 Ethanol yield
Generally, ethanol yields, on percentage theoretical basis, from wet storage “as is” samples were
higher than yields from corresponding dried silage samples (see Figure 6.5). Mean yields for
washed and unwashed samples were 61.8% ± 10.5 vs 37.6% ± 6.3 and 54.4% ± 12.2 vs 40.6% ±
7.2 respectively for “as is” vs dried silage (p < 0.0001). For “as is” samples, yields from washed
samples were significantly higher than yields from unwashed samples (p = 0.008), whereas for
dried samples, there was no significant difference between the two (p = 0.064). Compared to Day
0 samples (unensiled, controls), Day 220 “as is” samples that were washed had higher yields
61.8% ± 10.5 vs 53.19% ± 6.53 (p < 0.0001), however there was no significant difference in
yields for unwashed samples 54.4% ± 12.2 vs 54.6% ± 10.1 (p = 0.944). In contrast, unwashed
dried samples showed higher yields at Day 0 (48.2% ± 3.8) compared to Day 220 (40.6% ± 7.2)
(p < 0.0001). The higher yields of “as is” Day 0 samples over dried Day 0 samples supports the
theory that drying could collapse pore spaces making hydrolysis less effective. Also the higher
yield of dried Day 0 samples over dried Day 220 samples further suggest that the partial
pretreatment capability of silage was effective enough to weaken the pore structure in plant cell
walls, compounding pore collapse during drying and reducing enzyme access to structural
sugars.
Compared to dry ground “as received” samples, ethanol yields from unwashed “as is” samples
(both Day 0 and Day 220) and Day 0 washed “as is” samples were not significantly different.
However, yields from Day 220 washed “as is” samples were significantly higher than yields
from washed “as received” samples. In contrast, yields from dried Day 220 silage were
significantly lower than yields from “as received” samples but there were no significant
differences when compared to dried Day 0 samples. Again, this result suggest that drying ensiled
feedstock could lead to collapsed pore space due to the mild acid pretreatment effected on the
material during storage (See Appendix E, Table E12 for data on “as received” stover). When “as
received” samples were pretreated and fermented without size reduction (grinding), the ethanol
yields were generally low, less than 20% theoretical.

182
Figure 6.5: Lumped comparison of ethanol yield of unwashed samples and washed “as is” and
dried stover. Grey/black =Day 0 (controls); Pink/red = Day 220. Open circles = individual
values; solid circles = mean values; * = outliers (See Appendix E, Table E13 for yield by
moisture and pretreatment time)
UNWASH
WASH

183
Table 6.4 shows lumped summary of pretreatment outcome and ethanol yields of “as is” and
dried samples. Although, on average amounts of total acids in unwashed “as is” silage were
higher than amounts in dried silage by a factor of 1.5, these high acid levels generally did not
affect ethanol yield of “as is” samples. In calculating ethanol yield, it was assumed that liquid hot
water hydrolyzed structural sugars were not further degraded to non-sugar products. The
theoretical ethanol yield was therefore based on amount of sugar present before pretreatment,
some of which were in the solids and some in the pretreatment extract. This assumption was
based on the negligible amounts of furfural and HMF measured in the pretreatment extracts. If
sugars were degraded to furans and or then to acids, then sugars present after pretreatment would
be reduced and yield based on a percentage of the new lower theoretical amount would be much
higher in the “as is” samples. Therefore, besides making an assumption for conservation of
sugars, the significance of using amount of sugar present before pretreatment is that the ethanol
yield as percentage of the theoretical yield factors in losses incurred through degradation.
Table 6.4: Lumped summary profile of dried and “as is” samples after LHW pretreatment
For “as is” samples, acetic and isobutyric acids, which were dominant in unwashed samples had
negative (r = -0.594; p < 0.0001) and positive (r = 0.502; p < 0.0001) correlation with ethanol,
respectively. It can however be observed from data that this negative effect of acetic acid was
pH
Mean total
acids
(% DM) Dominant acid
Glucan
removed
(%)
Xylan removed
(%)
Maximum
Furfural
(% DM)
Ethanol (%
theoretical)
"As is" washed 4.08 ± 0.16 1.87 Acetic 3.68 ± 0.76 45.09 ± 5.04 0.17 61.76 ± 10.49
"As is" unwashed 4.13 ± 0.13 8.94 Acetic/Isobutyric 3.40 ± 0.96 31.11 ± 5.63 0.42 54.42 ± 12.19
Dry unwashed 4.24 ± 0.21 5.93 Lactic/Isobutyric 2.93 ± 0.46 25.05 ± 3.22 0.85 40.56 ± 7.20
"As is" washed 4.27 ± 0.16 1.67 Acetic 3.79 ± 0.92 35.07 ± 6.46 0.12 54.60 ± 10.08
"As is" unwashed 4.43 ± 0.19 5.35 Acetic/Isobutyric 4.65 ± 1.37 30.06 ± 7.00 0.18 53.19 ± 6.53
Dry unwashed 4.44 ± 0.15 5.29 Isobutyric/Acetic 4.49 ± 0.63 25.42 ± 3.37 0.54 48.21 ± 3.81
Washed 4.29 ± 0.16 5.10 Acetic/Isobutyric/Tartaric 4.84 ± 0.25 27.45 ± 3.44 0.75 47.16 ± 3.13
Unwashed 4.32 ± 0.17 6.81 Acetic/Isobutyric/Tartaric 4.68 ± 1.16 30.27 ± 1.95 0.70 46.39 ± 6.04
Day 220
Day 0
"As received"

184
only when concentrations were greater than 6% dry mass of sample ( ≥ 4.0 g/L fermentation
volume) and occurred only in 75% moisture samples. In addition, samples with very high acetic
acids were also high in butyric acids (≥ 4% DM; up to 3.1 g/L fermentation volume). Xu et al.
(2010) observed that up to 10% DM did not inhibit ethanol production. This amount is higher
than observed in this study. The combine effects of acetic and butyric could, therefore, be
responsible for the lower yields. Furthermore, most of these high acids in high moisture samples
were at 5 minute pretreatment retention time. Pretreated samples containing butyric acids had no
isobutyric acid. At longer pretreatment retention time, butyric acid was about half the amount at
10 minutes (lumped mean) and disappeared by 15 minutes. Butyric acid was possibly converted
to isobutyric acid, which increased with pretreatment time. Isobutyric acid concentration of up to
4.3 g/L, which was the maximum in this study, did not have any negative impact on ethanol
yield. Lactic acid after pretreatment was not correlated to ethanol yields. See Figure E2 in
Appendix E.
In dried samples, where acetic acid levels were less than 3% DM, acetic acid a positive but weak
correlation with ethanol (r = 0.376; p = 0.001) and serve to enhance ethanol yield. Generally,
dried Day 0 (unensiled) samples had higher levels of acetic acid and better yields than dried Day
220 (ensiled) samples. See Appendix E, Figure E3. Isobutyric acid also had positive correlation
with ethanol (r = 0.446; p < 0.0001) while lactic had a negative correlation. Although lactic acid
was dominant in Day 220 samples, amounts were generally comparable to amounts in “as is”
samples, which generally had good ethanol yields. In addition, lactic acid is less inhibitory than
acetic acid, which at higher concentration did not affect ethanol yields. Furthermore, the lactic
acid concentration (2.0 g/L ± 0.5) is not expected to inhibit ethanol production. At pH of 5,
Saccharomyces cerevisiae could tolerate 30 g/L of lactic acid (Graves et al., 2006). Although this
pH of 5 is slightly higher than pH of 4.8 used in this study, it shows that lactic acid concentration
in the dried samples were too low to singularly affect ethanol yields.
Dried Day 0 and Day 220 samples were similar in many ways, with respect to pretreatment
outcome (Table 6.4), differing only in glucan removal, pH and dominant acid. This presuming
lower yield in the Day 220 samples associated with relatively higher lactic acid could be a false
correlation, considering the lack of correlation between lactic and ethanol in “as is” samples.

185
This false correlation could have been influenced by unmeasured parameters like pore space or
simply a result of complex interaction with other acids or compounds.
Xylan removal was significantly but weakly correlated to ethanol. For “as is” samples the
correlation was 0.400 (p = 0.001) and for dried sample, the correlation was 0.319 (p = 0.006).
When storage duration was controlled, xylan removal was not significantly associated with
ethanol in Day 220 (ensiled) “as is” samples.
6.4 Conclusions
Dried and “as is” stover differ in many ways. When pretreated, ensiled samples of the latter had
more xylan removed, more acids generated and were dominant in acetic and isobutyric acids.
Contrary to expectations that more acids would adversely impact ethanol yields, “as is” samples
had significantly higher yields than dried samples. In dried silage samples, lactic and isobutyric
acids were dominant, while dried unensiled samples had more isobutyric and acetic acids.
Although organic acids were generally high in “as is” samples, adverse effects on ethanol yield
were only observed when the acetic acid concentration was greater than 4 g/L of fermentation
volume and was also interacting with butyric acid in the fermentation broth.
The results show that drying adversely affected the amount of ethanol obtained. The ethanol
yields of Day 0 “as is” samples were about 10% more than yields from dried Day 0 samples. In
addition, the results suggest that low yields of dried silage was a result of partial acid
pretreatment during wet storage that resulted in pore collapse that restricted enzyme activity.
Ethanol yield of unwashed “as is” silage was about 34% more than yield from dried silage.
Fermentation was not allowed to proceed to completion, but it is doubtful that even if allowed,
yields of dried silage would be comparable to “as is” silage. Dried silage could maintain
structural composition after drying, but if there is restricted access to these sugars it could result
in significant loss of revenue. That revenue loss may not justify conversion of silage to a uniform
format through drying. Unground “as received” stover had very poor ethanol yields, perhaps due
to the large particle size. Although dried stover is more convenient for particle size reduction,
wet storage stover can be processed as is, using relatively large particles with good results, and
so can save size reduction cost.

186
6.5 References
Budas Z., K. Dallmann, and B. Szajani. 1989. Influence of pH on the growth and ethanol
production of free and immobilized Saccharomyces cerevisiae cells. Biotechnology and
Bioenginerring 34: 882–884.
Danner, H., M. Holzer, E. Mayrhuber, and R. Braun. 2003. Acetic acid increases stability of
silage under aerobic conditions. Applied and Environmental Microbiology 69(1): 562–
567.
Dow. 2008. Assessing on-farm dry matter losses in silage making. Available at
http://msdssearch.dow.com/PublishedLiteratureDOWCOM/dh_012a/0901b8038012a40f.
pdf?filepath=silage/pdfs/noreg//003-09101.pdf&fromPage=GetDoc Accessed on 15
January, 2013.
Dowe N and J, McMillan. 2008. SSF experimental protocols: lignocellulosic biomass hydrolysis
and fermentation. Tech. Report NREL/TP-510-42630. Available at
http://www.nrel.gov/biomass/pdfs/42630.pdf National Renewable Energy Laboratory.
Esteghlalian, A. R., M. Bilodeau, S. D. Mansfield, and J. N. Saddler. 2001. Do enzymatic
hydrolyzability and Simons' stain reflect the changes in the accessibility of
lignocellulosic substrates to cellulose enzymes? Biotechnology Progress 17(6):1049-
1054.
Graves, T., N. V. Narendranath, K. Dawson and R. Power. 2006. Effect of pH and lactic or
acetic acid on ethanol productivity by Saccharomyces cerevisiae in corn mash. Journal of
Industrial Microbiology and Biotechnology 33(6): 469-474.
Grozdits, G. A. 1997. Biological treatment and storage method for wet bagasse for year-round
biomass supply. Newsletter of the International Cane Energy Network. Available at
http://www.scribd.com/doc/7027056/Bagasse-as-Alternate-Fuel Accessed 11 November
2008.
Hess, J. R., K. L. Kenney, L. P. Ovard, E. M. Searcy and C. T. Wright. 2009. Uniform-format
solid feedstock supply system: a commodity-scale design to produce an infrastructure-
compatible bulk solid from herbaceous lignocellulosic biomass. INL/EXT-09-17527.
Idaho National Laboratory (INL).
Holmes, B.J. and R.E. Muck. 2000. Preventing silage storage losses. University of Wisconsin-
Madison. Available at http://www.uwex.edu/ces/crops/uwforage/prevent-silage-
storage7.PDF Accessed on 5 May 2013.

187
Houghton, T. P., D. M. Stevens, P. A. Pryfogle, C. T. Wright, and C. W. Radtke. 2009. The
effect of drying temperature on the composition of biomass. Applied biochemistry and
biotechnology 153: 4-10.
Joosten, M. and M. Peeters. 2010. Yeast and fermentation: the optimal pH level. Available at
http://www.pieternieuwland.nl/Menu_Items/Projecten/Symposium/symposium2009-
2010/PVH/reports/PVH1_Maja_Myrthe_R.doc Accessed on 5 May 2013.
Kaliyan, N. and R.V. Morey, 2009. Densification characteristics of corn stover and switchgrass.
Trans. ASABE 52 (3), 907–920.
Kreuger, E., I. A. Nges and L. Björnsson. 2011. Ensiling of crops for biogas production: effects
on methane yield and total solids determination. Biotechnology for biofuels 4(1): 1-8
Kumar, A., J. Cameron, and P. Flynn. 2005. Pipeline transport and simultaneous saccharification
of corn stover. Bioresource Technology 96:819-829.
Porter, M. G. and R. S. Murray. 2001. The volatility of components of grass silage on oven
drying and the inter‐relationship between dry‐matter content estimated by different
analytical methods. Grass and Forage Science 56(4): 405-411
Richard, T. L. S. Proulx, K. J. Moore, and S. Shouse. 2001. Ensilage technology for biomass pre-
treatment and storage. ASAE paper No. 016019. St. Joseph, Mich.: ASAE.
Selig, M., N. Weiss and Y. Ji. 2008. Enzymatic saccharification of lignocellulosic biomass:
Laboratory analytical procedure. Tech. Report NREL/TP-510-42629 (LAP). Golden,
Colo.: National Renewable Energy Laboratory.
Weißbach, F. and C. Strubelt. 2008. Correcting the dry matter content of grass silages as a
substrate for biogas production. Ref. No. LT 08421 Available at
http://www.nawaro.ag/87 Accessed 21 May, 2013
Xu J, M. H Thomsen, and A. B Thomsen. 2010. Investigation of acetic acid- catalyzed
hydrothermal pretreatment on corn stover," Applied Microbiology & Biotechnology
86(2): 509-516

188
Chapter 7
Quality indices and model: predicting biofuel yield and cost based on storage
conditions
Abstract
Although wet storage has been recognized as a potential storage option, its geographical
coordination and its impact on supply chain management or biofuel output has not been well
addressed. Several logistics models have been developed over the past two decades. However,
most of these models are limited as they focus exclusively on dry storage systems and ignore the
wide range of dry matter losses that are likely to occur in a compromised wet or dry storage
system. Dry matter loss may have other implications that may negatively impact biofuel
production. This chapter describes a process cost and ethanol prediction model, which was
developed using relationships derived from studies in Chapters 3, 5 and 6. The model
accommodates 5 dry storage and 5 wet storage configurations. The model gave reasonable
results and showed that low moisture wet storage feedstocks (<45% moisture) had lower
feedstock delivery cost and better ethanol yield compared to corresponding dry storage
feedstock. Dry feedstocks that are kept dry had economic advantages over the high moisture
silage system at ≥45% moisture. For long storage durations, any compromising event in a dry
storage system that increases moisture content above 30% can be very prohibitive in terms of
ethanol production.
Key words: Logistics, delivery cost, ethanol, biofuel, wet storage, dry storage,
7.1 Introduction
As advances are made in the utilization of lignocellulosic materials for biofuel and possible
commercialization, two key players and their roles in the sustainability of lignocellulosic biofuel
production are recognized. These two players, the farming industry (responsible for supply of the
lignocellulosic material) and the biorefining industry (who would convert this material into fuel)
may have a common concern – determination of the true value of the feedstock. Since most
biomass resources like agricultural residues are seasonal, storage becomes critical and an

189
important determinant of feedstock value. This value can be evaluated from two perspectives: (1)
Dry matter loss and feedstock composition, which will determine the amount of convertible
sugars present and (2) cost of post-storage processing due to storage impacts on feedstock
quality. The value determined upstream during storage could be directly correlated with the
downstream value in terms of biofuel quantities, costs, and conversion efficiency.
The concept of quantifying feedstock quality or value from an end user perspective is not new. In
the livestock industry, two main indices – the Relative Feed Value (RFV) and Relative Forage
Quality (RFQ) – were developed to measure and define the quality of forages. RFV has been
used for decades and may eventually be replaced by RFQ (Peterson, 2002; Jeranyama and
Garcia, 2004), but both systems are similar in that they use a range of numerical values that
categorize feedstocks into grades. These values are determined from calculations that in the case
of RFV involve potential dry matter (feedstock) intake and digestible dry matter and in the case
of RFQ, total digestible nutrients. The RFV has been useful to both livestock farmers (end users)
and feedstock sellers (forage producers) as a tool for pricing feedstock, comparing different
forages, and predicting animal performance (Jeranyama and Garcia, 2004). A similar index to
ensure fair pricing of feedstock and predict biofuel yield is needed for the biofuel industry. Such
a tool may be of particular interest to those embracing wet storage systems. From Chapters 3, 4,
5 and 6, it can be assumed that the key variables informing this index would be dry matter loss
and the organic acid profile. It would be helpful and reassuring for biorefineries to have a prior
expectation of how wet storage outcomes compares with conventional dry storage, but this
information is missing from the literature at present.
In the livestock industry, silage (feedstock from wet storage) generally reaches a stable state
(anaerobic and pH <4.5) within a few days. Although this is mainly related to microbial
dynamics and fermentative stability, it is expected that there is continuation in chemical reactions
throughout the ensilage process, as organic acids interact with the feedstock. These chemical
reactions are very slow. Traditionally, the goal of wet storage is to conserve the quantity and
quality of the ensiled feedstock. For biofuel production, previous chapters have shown an
additional benefit is the enhancement of feedstock quality through interactions of these acids
with structural components that contribute to better downstream outcomes. The in-situ wet

190
storage pretreatment that may result in reduced severity for subsequent post storage pretreatment,
could translate to significant cost saving benefits. In Chapter 5, pretreatment of wet stored
feedstock was just as effective at 5 minutes as it was at 15 minutes. The minimum retention time
at which corresponding unensiled samples gave a comparable outcome was 10 minutes. Because
pretreatment capital as well as operating costs are estimated at roughly one third the cost of
biofuel conversion, doubling the throughput of this process could substantially reduce the costs
of fuel.
Feedstock quality and expected outcome, however, is only one side of the coin. The other side is
the logistics of getting the feedstock to the biorefinery. Both conventional dry storage and
emerging wet storage methods have several configurations that can affect the supply and
delivery cost of the feedstock. Biomass feedstock supply and logistics have become important
foci of biomass engineering research and analysis after decades of a focus on conversion:
tackling and seeking access to the abundant yet recalcitrantly embedded sugars in lignocellulosic
feedstock.
A number of biomass supply studies, projects and logistics models have been developed to
elucidate and in some cases address biomass supply chain challenges. Most of these models are
prescriptive, suggesting or recommending the nature of expected collaborative relationships and
efficient task distribution/coordination among players in the lignocellulosic biofuel industry.
Some of these models explore specific geographical or spatial systems configurations of ‘farms –
storage locations – refinery’ to facilitate the planning, assignment and coordination of feedstock
supply, as well as integration of activities from harvest to end product. Geographical system
configurations are based on assumptions of central or satellite storage systems, and the models
developed are used to determine the optimum number and optimum locations of these storage
systems, optimal radius of supply or optimal locations and capacity of the biorefinery (Judd et
al., 2010; Marvin et al., 2011; Brownell and Liu, 2012; Cundiff and Grisso, 2012). Usually, the
whole logistics chain is considered, embracing multiple farms and (conventional dry) storage
units required to meet a biorefinery annual feedstock demands (Mukunda et al., 2006; Cundiff et
al., 2009; Morey et al., 2010).

191
Ebadian et al. (2013) developed a combined optimization and simulation model that gave similar
outputs described above, prescribing the optimal number and locations of farms and storage
units, supply radii, etc. In addition, they focused on analyzing storage systems and their impacts
on the costs incurred by various actors in the supply chain. But again, the storage systems
analyzed were dry storage units, either open or enclosed. Generally, the logistics of wet storage
systems have not been elaborated in existing models, especially as they compare with dry
storage. A rare study that provides a basis to compare the logistics of wet and dry storage is that
of Turhollow and Sokhansanj (2007), who estimated the harvest, storage and delivery cost from
bunker and large pile wet storage systems. They found that feedstock moisture up to 55% had no
impact on transport cost when rail is used and to have reasonable transport cost when truck is
used, feedstock moisture has to be less than 70%.
There are, however, a number of non-logistics studies that compare wet and dry storage. These
studies have compared wet and dry storage focusing on: harvesting efficiency and capacity, as
well as dry matter loss during storage (Shinners et al., 2007); greenhouse gas emissions due to
dry mass losses in storage (Emery and Mosier, 2012); micro-structural changes in feedstock
(Donohoe et al., 2009; Oleskowicz-Popiel et al., 2010; Liu et al., 2013); in situ silage
pretreatment effects on ethanol yield without post storage pretreatment (Oleskowicz-Popiel et al.,
2010); and responses to post storage pretreatment and/or hydrolysis (Chen et al., 2007; Liu et al.,
2013). Most of these studies analyzed wet storage at only one moisture level.
The aim of this study is three-fold, to: (1) classify experiment data to lay the foundation for
development of a wet storage quality index; (2) present a simple model that looks at corn stover
logistics and ethanol production cost mainly through field losses, cost of storage, storage losses,
delivery cost, compositional changes, and ethanol yield, and ultimately estimates a minimum
ethanol selling price (MESP); and (3) provide a basis to evaluate the comparative logistics and
ethanol profitability of different dry and wet storage systems/configurations.
One limitation in existing logistics models is the focus on dry storage systems. Also, in cases
where moisture content or dry matter loss inputs/parameters are required, most models use a
single value. This model analyses both wet and dry storage biomass logistics supply chains and
allows for a wide range of moisture contents. In addition, this model predicts and incorporates a

192
wide range of dry matter losses based on moisture content, storage duration and storage
type/configuration.
7.2 Methodology
7.2.1 Classification for quality index or indices
Part of the purpose for the series of experimental investigations in this current study, documented
in Chapters 3 to 6, was to determine the conditions of storage that meet the goal of maximum
biofuel yield at minimum cost. Besides the natural pretreatment capability of wet storage
systems, wet storage presents an avenue for low cost, low severity upstream pretreatment
through the use of additives. This study, however, focuses on plain (unamended) silages. Four
main outputs were investigated in Chapter 3 (Dry matter loss and feedstock composition),
Chapter 4 (response of feedstock to hydrolytic enzymes, measured in sugar yield), and Chapters
5 and 6 (ethanol yield). To examine the pattern and relationship between these variables and
organic acids, Agglomerative Hierarchical Clustering (AHC) analysis was performed using
XLSTAT (Addinsoft, New York, NY), a Microsoft Excel add-in. This analysis provides a basis
for defining a more precise relation to define feedstock quality.
7.2.2 Modeling Approach
The model presented in this chapter is structured in two parts. Figure 7.1 gives the general idea
behind the model. The first part, a “farm-to-refinery-gate” process cost model, provides options
of harvest and storage conditions that can impact feedstock delivery cost through dry matter
losses. This first part estimates dry matter losses in the field and during storage as well as the
minimum feedstock delivery cost required to break even. The assumption is that the farmer is
responsible for collection and storage of the feedstock, as well as delivery to the biorefinery. The
model user can choose [or enter] harvest date, harvesting operations, storage type/configuration,
storage duration and distance to the biorefinery. The user can choose from 5 wet storage
configurations and 5 dry storage configurations. The storage systems can be analyzed at
moistures levels of up to 85% wet basis. Four different stacking options are also available for
bale storage. Stacking method can affect the storage space requirement. The input options are
provided as direct input (i.e. user enters value using keyboard), through drop-down menus and

193
check boxes. Figure 7.2 shows the inputs and outputs of the model. Appendix F, Figure F1
shows the model input interface for the process cost model. Dry matter loss is calculated based
on storage moisture, storage duration and storage configuration. Feedstock delivery cost is also
affected by these factors as well as dry matter losses (incurred during harvesting and collection
operations and during storage) and distance to the refinery.
The second part of the model is an ethanol yield prediction model. Ethanol yield is estimated as
percentage of theoretical yield based on organic acid content of feedstock after liquid hot water
(LHW) pretreatment. Three organic acids (acetic, butyric and isobutyric) that showed significant
correlation with ethanol are used in the yield estimation. Although there was a good direct
regression relation between storage moisture content and these pretreatment acids, pretreatment
acid was estimated from storage acid so as to account for acid variability with storage moisture
and duration. Regression equations were developed using acetic and isobutyric acid to predict
ethanol conversion as percentage of theoretical. Since butyric acids were generated in only some
of the 75% moisture samples pretreated at 5 and 10 minutes, the “RANDBETWEEN” function
in Microsoft Excel is used to factor in this chance. The amount of sugar present in the feedstock
and used in calculating the theoretical yield is a function of storage method, storage moisture
content and storage duration. Currently, the model assumes all dry storage systems undergo the
same compositional changes during storage. Similarly, all wet storage systems also undergo the
same compositional changes. Compositional changes in dry storage systems are different from
those of wet storage systems and are defined using relationships developed in this study (see
Appendix F, Table F8). Yield factors are then applied to the yield to correct for the following
preprocessing options when applicable: drying feedstock effect, drying silage effect, particle size
effect and washing effect. See Appendix F, Table F9, for yield factor equations and all other
equations used in the model development. References for equations and various parameters are
also provided in Appendix F. The pretreatment times are limited to times tested in this study – 5,
10 and 15 minutes. The user has the option to estimate sugar (glucan and xylan) composition and
dry matter loss if feedstock pre-production contract exist between farmer and biorefinery or
allow model estimate these parameters. The model uses the Microsoft Excel platform in selecting
and combining various processes/operations, in performing calculations and for graphical
presentation of outputs.

194
Figure 7.1: Relationship between various parameters informing the model output. (1 and 2 are
the two parts of the models. The first draws on dry matter loss and moisture change data
developed in this study and the second draws on compositional changes and organic acid effect
on downstream processes)
Most of the relationships used in this model were derived from Chapter 3, 5 and 6. See Appendix
F, Tables F8 and F9. In Chapters 3, 5 and 6, experiments were performed to determine the
relationships between storage conditions and effect on dry matter loss, feedstock composition,
response to pretreatment and ethanol yield. Two feedstock types were used in these experiments.
From empirical data obtained from these experiments, regression equations were developed
using mean data from one feedstock type. Data from other feedstock was used in model
validation. These regression equations together with cost data from the literature were
formulated into a process model that estimates the delivery cost of feedstock to a biorefinery or
the cost of ethanol production. For ethanol costing, fixed cost and operating cost data were
mainly from the NREL (2010) Ethanol Production Process Engineering Analysis spreadsheet

195
and a few estimations from Hofstrand (2009). Pretreatment equipment from the NREL
spreadsheet was for the dilute acid process. To estimate equipment cost for the liquid hot water
process, all equipment costs directly related to handling sulfuric acid were subtracted. Tables
F11 and F12 in Appendix F contain the capital cost components and operating cost components
used in the model.
In Chapter 3, three storage variables – moisture, temperature and duration - were investigated for
both aerobic and anaerobic conditions. Temperature effects on dry matter loss were found to be
insignificant. In addition, a number of studies in real silo systems have shown that although there
were changes in storage temperature from time of ensiling until the time of removal, these
changes did not affect silage quality in any appreciable way (Bechdel, 1918). These studies
measured wall and center temperatures during ensilage. Temperature variation over time and at
the different locations within the silo ranged from less than 10oC to 60
oC and in one case, up to
73oC. Temperatures above 38
oC were usually near-top temperatures or cases with some
allowance for air infiltration. Kung (2008) also noted that normal silage temperature could be as
high as 35oC in large piles and up to 54
oC at shallow surface locations or when loosely packed.
Silage temperatures exceeding 43 - 49oC should be indicative of active aerobic deterioration, as
it is only under aerobic conditions that significant heat can be generated (Kung, 2008). Samples
used in this study were placed in controlled environments, and core temperatures were not
measured. Aerobic indicators showed that active aerobic deterioration in was virtually absent
under our anaerobic ensiled storage conditions, hence the effects of temperature were ignored in
the model.
Most of the assumptions regarding field moisture and cost of field operations used in the study
are based on Pennsylvania farming systems. The model does not go into details of harvest
equipment and the various factors that affect performance and cost. Rather it uses custom rates
for the various operations. That is, the farmer does not own the equipment but outsources the
required services. This is based on average farm size in Pennsylvania (~231 acres), which is
smaller than the size that makes economic sense to own many types of equipment (Brechbill and
Wallace, 2008). The PA custom rates used in the model were from Pike (2013). This model does
not address the logistics of how many trucks are required to deliver feedstock, optimization of

196
packing arrangement, the rate of delivery, feasibility of delivering daily refinery targets, traffic
congestion or delays that could lead to further loss in dry matter or other intangible cost during
transportation, queuing or handling.

197
Figure 7.2: Inputs and outputs of process cost and ethanol prediction model. Model equations and provided parameters are in
Appendix F, Tables F6 to F10.
Inputs Outputs Inputs Outputs
Farm size From first part of model Plant nameplate capacity (gal/yr.)
Stover yield (dry tons) Amount of stover required (dry tons)
Percentage harvested Amount of stover supplied (dry tons)
Moisture content at Harvest (% w.b) From what storage configuration
Amount of feedstock harvested (tons) Feedstock cost ($)
Amount feedstock collected (tons) Operating capacity of plant (gal/yr.)
Cost of field operations ($) Fixed Nameplate capacity (Ethanol, gals/yr.) Ethanol production cost ($/ton)
Amount of feedstock lost on field (tons) but Biorefinery fixed cost components Feedstock cost ($/ gal)
Storage duration (days) can be changed Biorefinery operating cost components Feedstock cost ($/ ton)
Storage configuration Cost of feedstock as percent of production cost (%)
Amount of feedstock going into storage (tons) Choose Who oversees off-site storage (Farmer or Biorefinery) Theoretical ethanol yield (gals)
Number of bales Preprocessing options Theoretical ethanol yield (gals/ton)
Moisture content at start of storage (% w.b) Pretreatment time Actual ethanol yield (gal)
Cost of storage structure ($) Fermentation capability: C6 or C6&C5 sugars Actual ethanol yield (gal/ton)
Amount of feedstock lost in storage, mean (tons) Actual ethanol yield as percentage of theoretical
Amount of feedstock lost in storage, lower l imit Model estimation Percentage glucan and xylan Effect of storage loss on production cost
Amount of feedstock lost in storage, upper limit tools (Estimate from storage type and moisture at start of storage) Net Present Value (NPV)
Cost of storing feedstock Amount of feedstock required to meet nameplate capacity Minimum Ethanol Selling Price ($/gal)
Moisture at end of storage period (%) (Estimate from nameplate capacity and % sugar in feedstock) Ethanol production cost ($/gal)
Distance to biorefinery (miles) Number of farms to required to supply feedstock
Cost of transportation to biorefinery (Estimate from feedstock required and amount produced per farm)
Amount of feedstock reaching refinery Amount of ethanol produced Graphical output
Total cost (Harvest to delivery) (Estimate from feedstock supplied and sugar composition; Ethanol yield (gals/yr.)
Total cost per ton of feedstock collected from percentage theoretical amount estimated using organic acids Ethanol cost ($/gal)
Total cost per ton of feedstock leaving storage produced during pretreatment, and pretreatment time) Feedstock cost (% of total cost)
Percentage dry matter loss in storage Cost of producing ethanol Internal Rate of Return (IRR)
Minimum delivery cost (break even) ($/ton) Minimum Ethanol Selling Price (MESP) Dry matter loss (Chosen system vs. wet storage)
Potential monetary loss ($) (That is when Net Present Value (NPV) = 0) Transportation cost
Comparison of various cost component
Feedstock delivery cost estimation model Ethanol cost prediction model
Feedstock supply frameworkFarm size
Crop yieldHarvest cut height
Predict field moisture Estimate percentage harvested
Harvesting and collection Operations
Custom rates of operationEstimate field losses
Estimate cost of operations
Storage Storage type, moisture,
duration, stacking configurationMass of feedstock storedEstimate structural cost
Estimate moisture changeEstimate dry matter loss
TransportationTransportation distance
Estimate mass of feedstock transported
Estimate transportation cost
Storage durationStorage configuration
Moisture at start and end of storageAmount of feedstock reaching refineryMinimum delivery cost
Harvest to delivery

198
7.2.3 Notes on some model process components
7.2.3.1 Harvesting and collection
Wide variations in harvesting and collecting efficiencies have been reported ranging from about
30% to 95% (Lang, 2002; Sokhansanj and Turhollow, 2002; Shinners et al., 2003; Prewitt et al.,
2007). The machine type, the cutting blades, the types and sequence of operation and the
moisture content of the feedstock are some of the factors that affect the amount of feedstock that
can be collected. Moisture content can affect collection at various levels but generally, collection
is better at higher moisture. Gathering and pick-up losses, as well as shatter losses are lesser at
higher moisture. The implication is that silage harvest and collecting efficiencies are usually
higher than that of dry bales, with up to 41% more yield (Shinners et al., 2003). Modeling the
factors that impact on efficiencies can be complex, especially when interactions among the
factors are considered. This model uses a simplified scenario where the amount collected is
based on harvesting operations chosen with the assumption that machine configuration and
parameterization are adequate. The percentage of feedstock harvested is determined from the
harvest cutting height using the equation derived by Wilhelm et al. (2011), Equation 7.1.
Moisture content regression is based on the model of Igathinathane et al. (2006) using non-
dimensional height and “days after sowing grain”, and was remodeled using derived variables of
percentage harvested and “days after grain harvest”. This new regression, Equation 7.2, is used
in determining moisture content at time of harvest. Alternatively, if “days after grain harvest” is
unknown but harvest date is known, a simple linear regression equation developed from data in
the Penn State Biomass Conversion Laboratory (The Richard lab) (Equation 7.3) is used to
calculate moisture. The Richard lab is where the research reported in Chapters 3, 4, 5, and 6 was
conducted.
7.1
Where (
), is to account for variability in plant
height

199
7. 2
Where H = Percentage stover harvested
D = Days after grain harvest
7.3
7.2.3.2 Storage
The storage method determines the harvest operations and dry matter losses both on field and in
storage. Storage is therefore critical in determining feedstock cost. During storage, especially dry
storage, there are varieties of interactions that can influence dry matter losses. These include the
mechanical damage during harvesting/collection, cardinal direction of the storage structure, the
spatial arrangement of bales, environmental conditions, initial feedstock quality, moisture and
density. Dry matter losses determined in this research are assumed to be representative of indoor
storage systems and vertical silo system for dry and wet storage systems respectively.
Drawing rough relationships from the dry matter losses reported by Huhnke (2003) and Saxe
(2007), the model estimates dry storage losses using the relational assumptions in Appendix F,
Tables F6 and F7. These dry matter loss factors are the ratio of mean values obtained for indoor
storage to the mean values of other configurations in Huhnke (2003) and Saxe (2007). It is
assumed that these values take into account weather variations, especially rainfall. Losses due to
lodging from wind and rain storms are ignored. Rough relationships were also drawn for wet
storage using dry matter losses in Bickert et al. (2000). Dry matter loss, to which the dry matter
loss factors are applied, is estimated from Equations 7.4 and 7.5, developed from this research.
The upper and lower 95% confidence limits for dry matter loss were also calculated. In addition
to dry matter loss, equations representing change in moisture content during storage were also
developed (see Equations 7.6 and 7.7).

200
{
⁄
7. 4
{
⁄
7.5
{
7.6
{
7.7
Dry storage structural cost are estimated using cost ($) per square foot values in Wilkerson
(2012). The area used for storage is dependent on the stacking configuration. Four stacking
configurations options in the model are (1) pyramid pattern for round bales; (2) overlapping,
alternating placement for square bales; (3) End stacking – vertically and (4) End stacking –
horizontally. Wet storage structural costs are estimated using relationships in Equations 7.8 and
7.9 developed from data from Reilly (2011).
7. 8

201
7.9
7.2.3.2 Transportation
Custom rates existing for transportation are usually for short distances within farm or from farm
to storage. The 2008 Nebraska farm custom rate (Jose and Bek, 2008) gave an average of ~$3.41
per loaded mile and a most common rate of $4 per loaded mile, for bales up to an average 21.5
ton-load. For silage, the average rate was $3.28/ton and a most common rate of $2.75/ton.
However, when mileage exceeded 2.75, an additional $5 was charged per ton. In 2012 custom
rates, round bales maintained the common rate of $4, for up to an average 18 tons, but square
bales had a lower rate of $2. For silage, the most common rate per ton increased to $3 but the
additional charge when mileage exceeded 2.14 was on average $0.23. Iowa 2013 custom rate
survey gave average cost per bale as $2.85 and $3.55 for large round and square bale
respectively (Edwards et al., 2013). Most logistics economic models use assumed transportation
rates. These rates are varied and reported in various units like $/ton, $/mile or loaded mile,
$/mile/truck, $/day/truck, $/truck and $/ton-mile. In addition, there is a general suggestion that
transportation cost increases with mileage (Gallagher and Johnson, 1999; Schechinger and
Hettenhaus, 1999; Perlack and Turhollow, 2002) although Petrolia (2008) assumes it decreases
with mileage. This model estimates transportation cost using cost per [up to 125] miles
relationship in Schechinger and Hettenhaus (1999), which was based on dry tons and adjusted it
using a $2.33/ton rate for within 25 mile (Gallagher and Baumes, 2012) to get a conversion ratio
for more current cost based on wet tons. The following relationship in Equation 7.10 was
developed for transportation cost:
7.10
The $/ton-mile cost from this relationship was 0.16 for 0 - 5 miles to 0.32 for 125 miles.
Estimates from Petrolia (2008) were 0.26 for 25 miles or less to 0.18 for greater than 99 miles.
Gallagher and Baumes, (2012) estimated $/ton-mile to be 0.14 for up to 25 miles.

202
7.3 Results
7.3.1 Quality index
Dry matter loss data (Chapter 3), glucose yield from fiber reactivity test (Chapter 4) and ethanol
yield (Chapters 5 and 6) were classified into three groups, each with an associated organic acid
profile (see Appendix F, Tables F1 to F5). A simple and quick predictive tool that relates storage
conditions or organic acid profiles and dry matter loss resulting from different storage conditions
to feedstock composition and ethanol yield would be ideal. This would save feedstock suppliers
and buyers the time and money that is required by traditional analytical methods that are
laborious. In addition, it would provide a basis for feedstock suppliers and buyers (both of whom
are key players, with critical roles in the commercial viability of lignocellulosic biofuel
production) to predict feedstock quality, and as a result, create fair and efficient markets for this
new renewable energy commodity.
The wide variability in dry matter losses and organic acid profile resulting in overlapping
outcomes requires a stochastic approach that factors in the randomness of experimental results.
Working with mean values of classification outcome, a qualitative matrix is presented in Figure
7.3. The use of low, high and moderate terms in this classification scheme are relative. Organic
acid in this matrix represents the complete portfolio of storage acids. See Appendix F, Tables F1
and F5 to see how storage and pretreatment acid are related. The qualitative matrix suggests that
lactic acid silage is generally more desirable in biofuel wet storage systems, similar to the
livestock industry. High lactic is associated with high glucose yield during fiber reactivity test
and high ethanol yield when silage post-storage processes are carried out without first drying the
feedstock. On the contrary, high acetic acid is associated with low ethanol yields. For acetic and
Isobutyric acids, “low” and “high” levels in most cases reflect few extreme samples, with respect
to impact on ethanol yield. However, these extreme samples drastically reduce ethanol yield
resulting in the overall negative correlation.

203
Organic acids: Low = < 1% DM; Moderate = 1 - 2% DM; High = >2% DM
For dry matter loss, glucose and ethanol, high, moderate, low are relative to each other. See Appendix F, Tables F1 to F4 for quantification
Pattern fill represents relative difference in each acid type (defined vertically by low, moderate or high) within a particular rectangle that relates it to dry matter loss, glucose or ethanol. For example, acetic acid amount is low for both high and moderate yield of glucose. However, amount corresponding to high glucose yield is closer to 1%, while amount corresponding to moderate glucose yield is closer to 0%., hence differentiated by their pattern fill. Relatively, high moderate low
Arrows in same direction indicate proportional relationship; opposite direction indicate inverse relationship. Dotted arrows indicate probable relationship
#: There are 28 possible combinations of acid levels, however in this study, only the 9 combinations listed show some relationship with dry matter loss, glucose or ethanol.
Figure 7.3: Qualitative relationship between organic acids from wet storage of corn stover, dry
matter loss, glucose and ethanol yields.
7.3.2 Process cost model – field to farm gate outputs
The Output for the process cost model (part 1) gives a graphical comparison of dry matter loss in
any chosen storage system against wet storage at moistures of 25% to 85%. Figure 7.4 is an
Dry matter
loss
Glucose yield
without
pretreatment
# Lactic Acetic Isobutyric Silage "As is" Dried silage
1 Low High Moderate High low
2 High Low Low Moderate
3 Moderate Low Low low
4 High Low Low High Moderate
5 Low Low Low Moderate
6 Low High Moderate Low Low
7 Moderate Moderate Low Moderate
8 Moderate Low Low High
9 High Low High High
Independent variables Dependent variables
Storage organic acids
Ethanol yield (%
theoretical)

204
example of the output window. Other graphical comparisons are delivery cost per ton and
different cost components of the logistics supply chain.
Figure7.4: Sample output window of process cost model (part 1). The output displayed here
compares indoor dry storage at 35% moisture to wet storage, particularly, 35% and 65%
moisture. Values in red are losses.
The results depicted in Figure 7.4 show indoor dry storage at 35% moisture has an advantage
over ensilaged feedstock in a tower silo of the same moisture, but this advantage is only for
storage and transportation cost. The high dry matter loss associated with this storage system
resulted in higher delivery cost. Comparisons of indoor dry storage and wet storage at 25%
moisture (not shown) indicate that the wet storage system had slightly lower delivery cost than
dry storage of same moisture level. The delivery cost of the latter was comparable to that of wet
You chose Dry storage System for Analysis
Farm size 500
Stover yield (dry tons) 1722
Percentage harvested 90.0
Moisture content at Harvest (%) 57.3
Storage duration (days) 360
Storage configuration Under roof, enclosed barn
Distance to biorefinery (miles) 25
Dry ton $ $/ dry ton
Amount of feedstock harvested 1,549.8
Amount feedstock collected 1,217.6
Cost of field operations 27,064.95 22.23
Amount of feedstock lost on field 332.2 4,668.00
Amount of feedstock going into storage 1,215.9
Number of bales 439
Moisture content at start of storage (%) 35.0
Cost of storage structure 17,922.00
Cost of storing feedstock 4,516.34 2.41
Amount of feedstock lost in storage, mean 345.16 8,505.74 24.64
Amount of feedstock lost in storage,lower limit* 319.73 7,879.09 24.64
Amount of feedstock lost in storage, upper limit* 370.65 9,134.06 24.64
Moisture at end of storage period (%) 5.0
Cost of transportation to biorefinery 5,394.45 6.18
Cost per wet ton = 5.87
Amount of feedstock reaching refinery 872.4
Total cost (Harvest to delivery) 36,975.74
Total cost per ton of feedstock collected 30.37
Total cost per ton of feedstock leaving storage 42.38
Min Mean Max
Percentage dry matter loss in storage 26.26 28.35 30.44
Minimum delivery cost (break even) ($/ton) 41.18 42.38 43.66
Potential monetary loss ($) 16,683.33 17,033.55 17,405.83
* Based on 95% confidence interval
Back to inputs
DRY MATTER LOST and DELIVERY COST ESTIMATION
-50.00
0.00
50.00
100.00
150.00
200.00
250.00
300.00
350.00
400.00
5 15 25 35 45 55 65 75 85
Dry
mat
ter
loss
(to
ns)
Moisture content (%)
DMLmean
DML upper confidence limit
DML lower confidence limit
Your mean storage loss
Your minimum storage loss
Your maximum storage loss
Wet storage in vertical siloFarm size = same as yoursPercentage harvested = same as yoursStorage duration = same as yours
0.00
10.00
20.00
30.00
40.00
50.00
60.00
70.00
80.00
90.00
5 15 25 35 45 55 65 75 85
De
live
ry c
ost
($
/to
n)
Moisture content (%)
Min delivery cost
Mean delivery cost
Max delivery cost
Your mean delivery price
Your min delivery cost
Your max delivery cost
Wet storage in vertical siloFarm size = same as yoursPercentage harvested = same as yoursStorage duration = same as yours
COMPARATIVE CHARTS
0.00
10.00
20.00
30.00
40.00
50.00
60.00
Fieldoperation
Storage Transportto
Biorefinery
per tonfeedstock
collected
Deliverycost
Co
st (
$)
Your storage
35% Wet storage
65% Wet storage

205
storage at 35% moisture. Dry storage typically should be at moisture levels of 25% or less, in
which case dry storage would have a lower delivery cost when compared to wet storage at higher
moistures. What this model shows is that dry stover presents a delivery cost advantage over wet
storage only if feedstock is properly stored at the right moisture and protected from moisture
absorption from rainfall events. This advantage also holds when compared to high moisture
(>35%) wet storage. Comparison of delivery cost estimates for some storage configurations are
shown in Table7.1.
Table 7.1: Comparison of some model outputs of six storage configurations
Storage moisture = 35%
Storage duration = 180 days
Dry matter loss (%)
in storage
Minimum feedstock delivery cost ($)*
Ethanol (% theoretical)
Ethanol production
cost ($)
Feedstock cost (% of total cost)
MESP ($)†
On-field dry storage (uncovered) 78.24 108.33 58.3 2.5 66.2 2.69
Enclosed dry (barn) storage 17.39 37.58 58.3 1.4 40.5 2.56
On-field dry storage (covered) 26.08 36.25 58.3 1.4 39.6 2.56
Wrapped silage (Baleage) 1.30 21.76 72.0 1.0 27.6 2.61
Vertical silo 0.65 30.72 72.0 1.1 35.0 2.62
Bunker silo 1.82 22.71 72.0 1.0 28.5 2.61
* The delivery cost includes cost of harvesting and collection operations, cost of storage and eventual
transportation to the refinery and accounts for feedstock losses at the various logistics units; does not
include growers payment or payment for nutrient removed from field.
† MESP = Minimum Ethanol Selling Price, calculated when net present value is zero, however the
internal rate of return for the different configurations are different: 5%, 27%, 28%, 44%, 41%, 44%
respectively as listed in table)
7.3.3 Ethanol prediction and cost model – biorefinery outputs
Figure 7.5 is a sample output from the ethanol prediction model. Enclosed dry storage at 35%
moisture is compared to wet storage at 35% and 65% moisture. Although the production cost per

206
gallon ethanol from dry storage was higher than wet storage at these conditions, feedstock cost as
a percentage of total cost and MESP was lower. Conventional dry storage is however
recommended at moisture levels less than 25% and at most 25%. Using the model, the net
present value (NPV) if feedstock is sourced from an enclosed dry storage facility is about $435
million with an internal rate of return of 31%, if initial [starting] storage moisture is 25%. If
feedstock is sourced from a wet storage facility of 35% and 65% moistures, the NPVs would be
about $994 million and $493 million with IRR of 61% and 34% respectively. The results indicate
that wet storage at 35% moisture is preferable to dry storage at 25% moisture. These calculations
are based on the following scenario: an initial capital investment cost of more than $199 million;
half the capital cost is borrowed and payback period is 10 years at an interest rate of 8.5%, which
is also used as the discounted rate; and a 20-year time frame.
For field storage that is uncovered, when moisture content exceeds 31% at duration greater than
314 days, MESP cannot be determined because cash flow was always negative over the life of
the plant. Also NPV is negative when storage duration exceeds 270 days. These indeterminate
and negative values are a result of the very high dry matter loss under this storage configuration.
NPV remains negative even when future values are not discounted. For enclosed dry storage,
when moisture content is 48% at durations greater than 240 days, NPV becomes negative and at
durations greater than 339 days, cash flows become constantly negative and determination of
MESP becomes impossible. For indoor storage, at 48% moisture with 339-day storage, the cost
of production of ethanol was about $3.1/gal compared to $1.3/gal at 25% moisture. The
feedstock delivery cost at this 48% moisture level range from about $73/ton to $81/ton.

207
Figure 7.5: Sample output window of ethanol prediction model (part 2). The output displayed
here compares indoor dry storage at 25% moisture to wet storage at 35% and 65% moisture.
Values in red are losses.
7.3.4 Model validation
The process cost model and ethanol prediction model were validated mainly in three ways: (1)
by checking the predictive performance of different key components of the model, (2) through
sensitivity analysis and (3) comparison with other observations and predictions from literature.
Additional evaluation methods include calculation of the mean prediction error, root mean
square error (RMSE), mean absolute error (MAE) and the statistical significance of the
You chose Dry storage System for Analysis
Plant nameplate capacity (gal/yr) 70,000,000
Amount of stover required (dry tons) 694,140
Amount of stover supplied (dry tons) 606,654
Feedstock cost ($) 19,676,078
Form what storage configuration Under roof, enclosed barn
Operating capacity of plant (gal/yr) 42,319,069
Preprocessing
2.57
1.3
89.89
0.46
32.4
36.1
Ethanol, market price ($) 2.97
Theoretical ethanol yield (gals) 43,529,188.5
Theoretical ethanol yield (gals/ton) 71.8
Actual ethanol yield (gal) 42,319,068.75
Actual ethanol yield (gal/ton) 69.76
Actual ethanol yield as percentage of theoretical 97.2
Effect of storage loss on production cost
Initial investment ($) 199,099,234.1
Operational cost/year ($) 54,533,681.5
Net Present Value (NPV) ($198,297,281.69)
Feedstock cost ($/ ton)
Cost of feedstock as percent of production cost (%)
Back to inputs
Minimum Ethanol Selling Price ($/gal)
Ethanol production cost ($/gal)
Ethanol production cost ($/ton)
Feedstock cost ($/ gal)
Fermentation of C5 and C6 sugars
ETHANOL YIELD and PRODUCTION COST
0%
10%
20%
30%
40%
50%
60%
70%
Operatingcapacity for
suppliedfeedstock
Nameplatecapacity, for
suppliedfeedstock
Silage at 35%,no
preprocessing
Silage at 65%,no
preprocessing
IRR
1.29
0.970.87
1.25
2.572.71 2.71 2.69
0.00
0.50
1.00
1.50
2.00
2.50
3.00
Operatingcapacity for
suppliedfeedstock
Nameplatecapacity, for
suppliedfeedstock
Silage at 35%, nopreprocessing
Silage at 65%, nopreprocessing
Eth
ano
l ($
/Gal
)
Ethanol Productioncost($/gal)
Minimum Ethanol SellingPrice (MESP)
COMPARATIVE CHARTS
0.00
10,000,000.00
20,000,000.00
30,000,000.00
40,000,000.00
50,000,000.00
60,000,000.00
70,000,000.00
80,000,000.00Et
han
ol
(Gal
lon
s)
Operating capacity forsupplied feedstock
Nameplate capacity, forsupplied feedstock
Silage at 35%, nopreprocessing
Silage at 65%, nopreprocessing
36.1
48.0
42.2
58.0
0
10
20
30
40
50
60
70
Operatingcapacity for
suppliedfeedstock
Nameplatecapacity, for
suppliedfeedstock
Silage at 35%, nopreprocessing
Silage at 65%, nopreprocessing
Pe
rce
nta
geo
f to
tal c
ost
(%
)
Feedstock cost (% of total)
Operating capacity for suppliedfeedstock
Nameplate capacity, for suppliedfeedstock
Silage at 35%, no preprocessing
Silage at 65%, no preprocessing

208
prediction error using a t-test. The process cost model and ethanol prediction model both consist
of multiple regression models that form the different components of the model. Two corn stover
feedstock types (IA and PA) and different storage conditions and outcomes from Chapter 3, 5, 6
were used in informing relationships used in this model. In developing regression equations, data
from one feedstock type or treatment condition was used and tested against the other feedstock
type or other conditions in model validation. That is, model validation by the predictive
performance method was performed by applying real, observed data not included in developing
the regression equation. Validation was performed on these key components: storage organic
acid (predicted from storage moisture and duration), storage dry matter loss (predicted from
storage moisture and duration) and ethanol yield predictions (predicted from organic acids from
pretreated and corrected using yield factors). Figures 7.6, 7.7 and 7.8 compare predicted and
observed values for acetic and isobutyric acids, dry matter loss and ethanol yields.
Acetic and isobutyric acid regression equations were developed using data from IA stover
(Chapter 3) and validated with data from PA stover as observed values. Considering the
heterogeneous nature of biomass feedstock that results in variability and uncertainty in physical
and biochemical responses, the acetic and isobutyric acid prediction models are reasonable
(Figure 7.6).
Dry matter losses for aerobic conditions were predicted using regression equations developed
from dry matter loss in PA stover and validated with dry matter losses in IA stover. For
anaerobic conditions, the regression equation was developed from losses in IA stover and
validated with losses in PA stover. The respective stover selected for developing the regression
equation was based on which gave a better regression fit. Predictions under aerobic conditions
were quite reasonable (Figure 7.7). Under anaerobic conditions, more variability is seen and
predictions showed good correlation only at 37oC. However the range of dry matter loss values at
23oC were within range that are typical in wet storage systems.
Ethanol yield was predicted using organic acid generated in “as is”, day 220 IA stover at 15
minute pretreatment time. For conditions other than this 220-day “as is” silage the ethanol
prediction model applies yield factors to correct for the “unensiled” effect and pre-processing
effects such as drying and washing. The predictive validity was tested against “as is”, day 220 IA

209
stover at other pretreatment retention times (5 and 10 minutes) (Figure 7.8, top); against day 0
samples of “as is”, with and without yield factors (Figure 7.8, middle); and against dried day 0
feedstock and dried silage (day 220) (Figure 7.8, bottom).
Figure 7.6: Comparison of predicted and observed values of acetic acid (top) and isobutyric acid
concentration after wet storage. See Appendix F for other acid types.
R² = 0.5969
0
0.2
0.4
0.6
0.8
1
1.2
1.4
1.6
1.8
2
2.2
0 0.5 1 1.5 2 2.5
Pre
dic
ted
(A
ceti
c ac
id (
%))
Observed (Acetic acid (%))
Acetic
R² = 0.5113
0
0.2
0.4
0.6
0.8
1
1.2
1.4
1.6
1.8
0 0.5 1 1.5 2
Pre
dic
ted
(Is
ob
uty
ric
acid
(%
))
Observed (Isobutyric acid (%))
Isobutyric

210
Figure 7.7: Comparison of predicted and observed values of dry matter loss after aerobic and
wet anaerobic storage. A= aerobic storage; B= anaerobic storage

211
Figure 7.8: Comparison of predicted and observed values of ethanol yield.
Model was developed using “as is” day 220 samples pretreated for 15 minutes. Top: model compared to
“as is” samples pretreated at 5 min. and 10 min. Middle: model compared to unensiled “as is” feedstock
not controlling for pretreatment time. Bottom: model applied to dried silage and dried unensiled samples.

212
Yield factors are ratios of yields from ensiled “as is” stover (Day 220) to yields from other
treatments. Applying these yield factors did not improve the predictions of ethanol for the “as is”
samples. Table F14, Appendix F, shows that the percentage of samples with underestimated
yields when yield factors were applied was as high (33%) as the number of samples with
overestimated yield when these yield factors were not applied. A t-test of the difference between
predicted and observed values of “as is” samples, without applying the yield factor to the
unensiled samples, was not significant when compared to a test mean of 0 (i.e. model with no
prediction error). However, when yield factors where applied using mean values for each
pretreatment time or equations accounting for effect of moisture (see Table F13, Appendix F),
the prediction errors were significant. Based on these results yield factors are not needed for
unensiled “as is” stover, and in general the model gave a good prediction of yields. The mean
test error for “as is” stover is 0.80. Test error refers to prediction error from independent samples
not used in model development. Using the model for dried feedstock gave higher estimates of
ethanol yield than actually observed. The t-test for dried samples was significant both without
yield factors and with yield factors, regardless of whether the yield factor was applied using the
yield factor equations or as means of each pretreatment time. Yield factors are however
necessary because without their applications, predicted yields were higher than observed yields
by a factor of 1.02 to 2.24.
A yield factor regression to predict pre-processing effects is attractive, as this regression
accounts for feedstock moisture variation. However, the randomness of the outcomes based on
moisture also leads to huge potentials for overestimation at high moistures. Using the mean yield
factor as a yield correcting coefficient addresses these huge overestimations. Applying the mean
yield factors to dried samples, therefore, halved the root mean squared error and the mean
absolute error relative to using the yield factor equations (see Appendix F, Table 15). The mean
test error for dried stover is 1.79, about twice that of “as is” stover. However, the root mean
squared error, which is analogous to standard deviation, and the mean absolute error, are slightly
lower for dried stover. The mean predicted yield and RMSE are 55.35 and 7.99 for “as is” stover
and 44.83 and 6.79 for dried stover.

213
7.3.5 Sensitivity analysis
Feedstock delivery cost
Sensitivity analysis was carried out using SensIt®
1.45 (TreePlan Software, San Francisco, CA), a
Microsoft Excel add-in to examine the effect of some input parameters on feedstock delivery
cost and ethanol profitability. Two extreme case scenarios and a base scenario were defined for
each analysis. For both wet and dry storage, the base scenario was defined by 45% moisture and
the extremes by 25% and 65% moisture levels, resulting in a ±20% point variation about the base
case. The analysis was performed for a 500 acre farm with 360-day storage duration. Figure 7.9
shows the impact and ranking of various factors on feedstock delivery cost. The most influential
parameter on delivery cost of wet storage feedstock was moisture content. The impact of
moisture content on feedstock price has the highest relative variance of 49%, varying feedstock
delivery cost by up to 65% from base case delivery cost. The variance is calculated as the square
of the output range divided by the sum of squares of range for all factors used in the sensitivity
analysis. Transportation cost, which was suspected to be a major bottle neck for wet feedstock
has a variance of less than 6%., and varied feedstock delivery cost up to 22% from base case
cost. For the two wet storage system (vertical silo and wrapped silage) analyzed, the three most
influential parameters were consistent in their impact hence ranking. The lowest impact factor is
dry matter loss and storage cost for vertical silo and wrapped silage systems respectively. In
contrast to the sensitivity outcome of wet storage, the most important parameter affecting the
delivery cost of the dry storage systems analyzed (dry enclosed and on-field without cover) was
dry matter loss in storage. This impact is measured by the highest relative variance of 48 and
44% and storage loss impact on feedstock delivery cost showed variation by a factor of up to 5
and 1 compared to the base case for the dry enclosed and on-field without cover respectively.
Ethanol profitability
For ethanol profitability, the same extremes and base case scenarios were applied to an ethanol
production facility with 70 million gallons per year nameplate capacity. Profitability was
calculated by subtracting production cost from revenue generated from selling ethanol at
$2.97/gal ethanol produced. Figure 7.10 shows the impact of various factors on ethanol

214
profitability. For dry storage, only two factors had impact on profits, the amount of feedstock
required to meet the nameplate production capacity and the cost of feedstock, with measured
impact of more than 80% and 13% variance respectively. The sensitivity analysis shows huge
losses incurred at the extreme scenarios of high moisture levels, which greatly impact dry matter
loss and delivery cost (Figure 7.9). Moisture levels above 25% are not practical for effective dry
storage systems and are not recommended. For wet storage systems, all 7 variables had some
impact on ethanol profitability, but the most influential factor is ethanol conversion efficiency,
with a variance of about 58%.
7.3.6 Comparison with other observations and predictions from literature
Table 7.2 compares farm-scale dry matter loss observations from Shinners (2003) and Shinners
(2009) with predictions from the model developed in this study. These comparisons confirm that
the dry matter loss predictions from the model developed in this study were within a reasonable
range. The predictions for on-field storage were generally higher than observations from the
Shinners’ studies. However, the model also predicts confidence intervals, and these measured
on-farm field losses were generally within those confidence errors. Dry matter losses in
uncovered on-field storage are the most variable, as they are subject to various weather
conditions and microbial degradation processes that can affect the degree and rate of loss. As an
example, at a moisture level of 27.5%, Shinners (2004) observed dry matter loss of 17.7% and
36.1% in 2002 and 2003 respectively, and this latter value is higher than 20.6%, the value
predicted by the model in this study. A switchgrass predictive model developed for outdoor on-
field storage (Mooney et al., 2012) estimated dry matter loss to be above 40% at 7 months of
storage and up to 90.8% after 16 months of storage.
Various delivery cost estimates are presented in Table 7.3. Analyses leading to these estimates
are based on several varying factors that can make cost comparisons on the surface problematic.
Some of these factors like cropping systems and practices are not obvious cost determinants,
while others are regionally influenced. However, rough comparisons show that the estimates of
delivery cost from the model in this study is reasonable and similar to estimates from Gallagher
and Baumes (2012), and Perlack and Turhollow (2002) but higher than Tyndall (2007) when

215
nutrient cost is not considered. These model estimates may compare well with other estimates in
Table 7.3, if those other intangible costs and opportunity costs could be factored in.
The ethanol production costs in this model are also reasonable. In 2005, the National Renewable
Energy Lab (NREL) production cost of ethanol was $2.25/gal with an anticipated decrease to
$1.07 by 2012 with improvement in yield from 65 gals/ton to 90 gals/ton (Pacheco, 2006). In
2009, POET cellulosic pilot plant using corn cobs was producing ethanol at $2.35/gal (Green Car
Congress, 2009) and this dropped to $2.20 (Helman, 2013). The cost of production of cellulosic
ethanol in 2012 at the National Renewable Energy Lab (NREL) pilot plant was $2.15 (Pezzullo,
2013). While this value is not as low as forecasted in 2006, the $1.07 is still a target that is
achievable. In this current study, ethanol production cost was estimated at $1.80/gal and
$1.50/gal at stover feedstock moisture of 25% and 20% respectively with corresponding ethanol
yields of 73 gals/ton and 86 gals/ton. This lower cost is partly due to the higher yield per ton and
also the LHW pretreatment method as opposed to the dilute acid pretreatment method used by
the POET and NREL. Dilute acid pretreatment would require acid corrosion resistance leading to
more expensive equipment, increasing the capital cost as well as requiring a neutralization unit.
The acid and neutralization chemicals also increase the operating cost. Several other factors,
some of which were not documented in the referenced studies, could also affect cost. These
could include facility size, plant financing/interest rate, plant operating life used in cost
calculation, feedstock location, type and cost, etc.

216
Table 7.2: Comparing corn stover dry matter loss prediction of model to other studies after 7
months of storage
Storage configuration
Storage moisture (%)
Shinners et al. (2003, 2009)
Model prediction from this study
Enclosed 25.9 4.9 4.69
23.9 4.8 4.53
On-field, uncovered (on ground)
22.2 10.7 18.21
24.4 14.3 21.04
32.0 29.1 46.20
On-field, uncovered (on pallets)
22.3 7.0 13.45
23.0 11.4 14.11
27.5 17.7 20.56
Silo bag 41.7 1.4 1.41
42.7 6.0 1.56
55.4 3.8 2.77
Wrapped silage (Baleage)
29.4 1.2 0.50
44.3 2.9 3.43

217
Table 7.3: Delivery cost comparison of estimates from this model and other studies
Estimated delivery cost of
stover ($/ton)* Comment Reference
37.50 – 40.50 TP: 25 miles Gallagher and Baumes (2012)
51.00 – 165.00
Accounts for opportunity cost of land: up to 60%.
Include crop land rent at farm-gate (Wide cost
range due to regional location and different agro-
practices)
Khanna and Huang (2012)
64.85, 79.34†
TP: 50 miles; Moisture: 15%; on-field storage,
elevated from ground and covered with tarp.
Include nutrient replacement cost ($19.07/ton).
Thompson and Tyner (2012)
60.00 – 100.00
Actual market price. Also include nutrient
[replacement] cost?(Cost expected to drop to $45 -
$75ᵟ)
University of Missouri
extension (2012)
87.00
TP: 50 miles; Moisture: 16 -20%; Growers cost: $22;
Harvest: estimated assuming an 8% IRR; Storage:
6% IRR profit
Gonzalez et al. (2011)
31.40
Include nutrient replacement cost. Iowa farmers
willing to supply stover at minimum average cost
of $50.47 = 61% profit
Tyndall (2007)
43.10 – 51.60
Payments to farmer ($10/dry ton compensation for
nutrient removed and profit). Cost differ with
Biorefinery size, which determines transportation
radiusᴽ
Perlack and Turhollow (2002)
30.69 – 32.60 TP: 25 miles; Moisture: 15 - 20%; indoor storage This studyᴼ
28.33 – 30.06TP: 25 miles; Moisture: 15 - 20%; on-field storage,
elevated from ground and covered with tarp. This studyᴼ
29.48 – 35.40TP: 25 miles; Moisture: 15 - 20%; on-field storage,
elevated from ground and uncovered. This studyᴼ
* Most of these studies are theoretical estimations based on various assumptions of amount harvested/collected, losses and
cost. The estimates are mainly break-even cost that includes harvesting, collection, storage and transportation cost. TP =
transportation distance
† 64.85 from a continuous corn rotation and 79.34 from corn-soybean rotation. Transportation include backhaul (return trip);
most transportation estimates are on loaded mile basis as is in the model developed in this study.
ᴽ Minimum facil ity size = 500 dry tons/day with average loaded transport distance of 22 miles but up to 64 mi. The average
distance to the largest facil ity of 4000 drt tons/day is 62 miles but up to 181 mi.
ᴼ Storage duration of 12 months. No nutrient removal or farmer's payment cost. Also assume no moisture increase over
storage period due to rainfall event
ᵟ The $60/ton -$100/ton, which includes farmer's profit, is said to be due to the 2012 drought and hence expected to come
down. At this expected price drop without nutrient, this cost is comparible to that predicted by model

218
Figure 7.9: Sensitivity analysis showing effect of various parameters on minimum feedstock delivery cost of some wet and dry storage
systems. Base case (Vertical line) = 45% moisture

219
Figure 7.10: Sensitivity analysis showing effect of various storage systems on ethanol profitability. Base case (Vertical line) = 45%
moisture

220
7.4 Conclusions
A process cost and ethanol prediction model was developed to evaluate biomass supply chain
logistics that include wet storage systems, and to provide a basis for comparison of different
storage types and configurations. Ten storage configurations are presented in the model as well
as four stacking configuration for bales. Dry matter and yield prediction components were
developed from research presented in Chapters 3, 5 and 6. Equipment cost and dry matter loss
factors for storage systems not experimentally investigated in this study were developed from
literature. The results show that at low moisture levels ≤ 40%, wet storage had a lower delivery
cost than conventional dry storage. Although wet storage at higher moisture may cost more when
compared to a well preserved dry storage system, this cost disadvantage is not extreme and may
disappear with low cost bunker storage systems. However, when moisture levels exceed 48% in
dry storage systems, the cost of ethanol production can be prohibitive due to the very high dry
matter losses. This condition is possible, especially in on-field, uncovered storage configuration.
Although a number of values were assumed in process costing, the model generally gave
reasonable outputs. Sensitivity analysis show that moisture content of wet storage feedstock had
the most influence on feedstock delivery cost. Dry matter loss, on the other hand, was the most
influential parameter under dry storage conditions.
7.5 References
Allen, J., M. Browne, A. Hunter, J. Boyd and H. Palmer. 1998. Logistics management and costs
of biomass fuel supply. International Journal of Physical Distribution & Logistics
Management 28(6): 463-477.
Bechdel, S. I. 1918. Studies in the preservation of corn silage. In Annual report of the
Pennsylvania agricultural experiment station. Pennsylvania State College. Pp. 318 – 348.
Available at http://books.google.com/books?id=KPkaAAAAYAAJ Accessed 04 June,
2013.
Bickert, W. G., B. Holmes, K. Janni, D. Kammel, R. Stowell and J. Zulovich. 2000. Dairy
Freestall Housing and Equipment (MWPS-7). Midwest Plan Service, Ames, IA.
Brechbill S. C. and T. E. Wallace. 2008. The economics of biomass collection, transportation,
and supply to indiana cellulosic and electric utility facilities. Department of Agricultural

221
Economics, Purdue University. Available at
http://ageconsearch.umn.edu/bitstream/6148/2/wp080003.pdf Accessed 10 June, 2013.
Brownell, D., J. Liu. 2012. Managing biomass feedstocks: selection of satellite storage locations
for different harvesting systems. Agricultural Engineering International: CIGR Journal
14(1): 74-81.
Cundiff, J.S., R. D. Grisso and J. Judd. 2009. Operations at satellite storage locations (SSLs) to
deliver round bales to a biorefinery plant. ASABE Paper No. 95896. St. Joseph, Mich.:
ASABE.
Cundiff, J. S., and R. D. Grisso. 2012. In-field operations to deliver biomass to a biorefinery .
Agricultural Engineering International: CIGR Journal 14(4): 115 – 122.
Donohoe, B., T. Haas, N. Wiess, S. Ding, N. Nagle, and M. Himmel. 2009. Evaluation of plant
cell wall structure of ensiled corn stover by correlative microscopy. NREL/PO-270-
44906. Poster presentation at the 31st Symposium on Biotechnology for Fuels and
Chemicals, May 3-6, 2009. San Francisco, CA.
Ebadian, M., T. Sowlati, S. Sokhansanj, L. Townley-Smith and M. Stumborg. 2012. Modeling
and analysing storage systems in agricultural biomass supply chain for cellulosic ethanol
production. Applied Energy 102: 840–849.
Edwards, W., A. Johanns and A. Chamra. 2013. 2013 Iowa farm custom rate survey. Available
at http://www.extension.iastate.edu/publications/fm1698.pdf Accessed on 13 June, 2013.
Gallagher, P. and D. L. Johnson. 1999. Some new ethanol technology: cost competition and
adoption effects in the petroleum market. The Energy Journal 20:89-120.
Gallagher, P. W. and H. Baumes. 2012. Biomass supply from corn residues: estimates and
critical review of procedures. USDA Agricultural Economic Report Number 847.
Available at
http://www.usda.gov/oce/reports/energy/Biomass%20Supply%20From%20Corn%20Resi
dues-Nov-2012.pdf Accessed on 20 June, 2013.
Gonzalez, R. W., R. Phillips, H. Jameel, R. Abt, A. Pirraglia, D. Saloni, and J. Wright. 2011.
Biomass to energy in the southern United States: supply chain and delivered
cost. BioResources 6(3): 2954-2976.
Green Car Congress. 2009. POET reduces cellulosic ethanol production cost from $4.13 to
$2.35/gallon in first year of pilot operation; <$2.00/gallon target for commercial start.
Available at http://www.greencarcongress.com/2009/11/poet-20091118.html Accessed
on 11 November 2013.

222
Helman, C. 2013. Same moonshine, different name: welcome to the age of cellulosic ethanol.
Available at http://www.forbes.com/sites/christopherhelman/2013/09/04/same-
moonshine-different-name-welcome-to-the-age-of-cellulosic-ethanol/ Accessed on 11
November 2013.
Hess J.R., C.T. Wright and K.L. Kenney.2007.Cellulosic biomass feedstocks and logistics for
ethanol production. Biofuels, Bioproducts and Biorefining. 1:181-190.
Hofstrand, D. 2009. Ethanol profitability. Ag. Decision Maker D1-10. Iowa State University
Extension.
Huhn, A. 2011. Make it while the sun shines and keep it under cover: a quick guide to tarping
hay. Available at http://todaysfarmermagazine.com/mag/63-feature/358-hay-tarps-
save.html Accessed 16 June, 2013.
Huhnke , R. L. 2003. Round Bale Hay Storage. Oklahoma Cooperative Extension Fact Sheets, F-
1716. Division of Agricultural Sciences and Natural Resources, Oklahoma State
University. Available at http://pods.dasnr.okstate.edu/docushare/dsweb/Get/Rendition-
5034/unknown Accessed 12 October, 2009.
Igathinathane, C., A. R. Womac, S. Sokhansanj and L. O. Pordesimo. 2006. Mass and moisture
distribution in aboveground components of standing corn plants. Transactions of the
ASABE, 49(1), 97-106.
Jeranyama, P. and A. D. Garcia. 2004. Understanding Relative Feed Value (RFV) and Relative
Forage Quality (RFQ). College of Agricultural and Biological Sciences, ExEx8149.
South Dakota State University, Available at
http://www.sdstate.edu/vs/obl/loader.cfm?csModule=security/getfile&PageID=658712
Accessed 25 January, 2010.
Jose, H. D. and P. Bek. 2008. 2008 Nebraska farm custom rates- Part II. Available at
http://nlcs1.nlc.state.ne.us/epubs/U2250/H001.0826-2008.pdf Accessed on 13 June,
2013.
Judd, J. D., S. C. Sarin, J. S. Cundiff and R. D. Grisso. 2010. An optimal storage and
transportation system for a cellulosic ethanol bio-energy plant. ASABE Paper No.
1009413. St. Joseph, Mich.: ASABE.
Khanna, M. and H. Huang. 2010. The breakeven costs of producing alternative feedstocks for
cellulosic biofuels. Energy Biosciences Institute, University of Illnois, Urbana-
Champaign. Available at
http://miscanthus.ebi.berkeley.edu/biofuel/documents/Feedstock Production Cost.pdf
Accessed on 21 September, 2013.

223
Kung, L. 2008. Silage Temperatures: How Hot is Too Hot? Available at
http://www.qualitysilage.com/silage-troubleshooting/PDF/SilageTemps-How-Hot-is-
Too-Hot.pdf Accessed 14 October, 2011.
Lang, B. 2002. Estimating the nutrient value in corn and soybean stover. Iowa State University
Extension Fact Sheet BL-112.
Liu, Z. H., L. Qin, M. J. Jin, F. Pang, B. Z. Li, Y. Kang, B. E. Dale and Y. J. Yuan. 2013.
Evaluation of storage methods for the conversion of corn stover biomass to sugars based
on steam explosion pretreatment. Bioresource technology 132: 5-15.
Marvin, A. W., L. D.Schmidt, S. Benjaafar, D. G. Tiffany and P. Daoutidis. 2012. Economic
optimization of a lignocellulosic biomass-to-ethanol supply chain. Chemical Engineering
Science 67(1): 68-79.
Mcnaull, R. P. 2010. Design and evaluation of variable rate stover collection control system for a
single pass dual stream biomass harvester system. MS Thesis. Ames, Iowa. Iowa State
University, Department of Agricultural Engineering.
Mickan, F. J and J.W. Piltz. 2003. Chapter 8: Harvesting silage. In Successful silage. 198 -215.
Kaiser, A.G., J.W. Piltz, , H.M. Burns, and N.W. Griffi ths, (Eds). New South Wales.
NSW Agriculture, Dairy Research and Development Corporation.
Mooney, D. F., J. A. Larson, B. C. English and D. D. Tyler. 2012. Effect of dry matter loss on
profitability of outdoor storage of switchgrass. Biomass and Bioenergy 44: 33-41.
Morey, R. V., N. Kaliyan, D. G. Tiffany, and D. R. Schmidt. 2010. A corn stover supply logistics
system. Applied Engineering in Agriculture 26(3): 455‐461
Emery, I. R. and N. S. Mosier. 2012. The impact of dry matter loss during herbaceous
biomass storage on net greenhouse gas emissions from biofuels production. Biomass and
Bioenergy 39: 237-246.
Mukunda, A., K. E. Ileleji and H. Wan. 2006. Simulation of corn stover logistics from on-farm
storage to an ethanol plant. ASABE Paper No. 066177. St. Joseph, Mich.: ASABE.
NREL. 2010. Ethanol production process engineering analysis (spreadsheet): Corn Stover
Design Report Case: 2010 plant start-up. Available at
www.nrel.gov/extranet/biorefinery/aspen_models/.../bw0401a_simp.xls Accessed on 24
August, 2009.
Oleskowicz-Popiel P., T. M. Lehtinen, J. E. Schmidt, A. B. Thomsen. 2010. Silage pretreatment
of corn stover to produce bioethanol. Journal of Industrial Microbiology &
Biotechnology:1-16.

224
Pacheco, M. 2006. U.S. Senate full commitee hearing - renewable fuel standards (National
Renewable Energy Laboratory, National Bioenergy Center, 19 June 2006). Available at
http://www.energy.senate.gov/public/index.cfm/hearings-and-business-
meetings?Id=93dd3004-fc19-42d6-86d8-ede80db687eb&Statement_id=36814f13-7b00-
4122-b945-0e7b7c04e1d8&IsLowBandwidth=NO. Accessed on 21 September, 2013.
Perlack R. D. and A.F. Turhollow. 2002. Assessment of options for the collection, handling, and
transportation of corn stover .Oak Ridge National Laboratory. ORNL/TM-2002/44.
Perlack, R. D. and A. F. Turhollow. 2003. Feedstock cost analysis of corn stover residues for
further processing. Energy 28(14): 1395-1403
Peterson P. R. 2002. The Relative Forage Quality (RFQ) Index Replaces RFV. Available at
http://agronomy.cfans.umn.edu/prod/groups/cfans/@pub/@cfans/@agronomy/documents
/asset/cfans_asset_289561.pdf Accessed 25 January, 2010.
Petrolia, D. R. 2008. The economics of harvesting and transporting corn stover for conversion to
fuel ethanol: A case study for Minnesota. Biomass and Bioenergy, 32(7), 603-612.
Pezzullo, L. 2013. On the path to low cost renewable fuels, an important breakthrough. Available
at http://energy.gov/articles/path-low-cost-renewable-fuels-important-breakthrough
Accessed on 11 November 2013.
Pike, A. W. 2013. Pennsylvania’s 2013 machinery custom rates. USDA National Agricultural
Statistics Service. Available at
http://www.nass.usda.gov/Statistics_by_State/Pennsylvania/Publications/Machinery_Cus
tom_Rates/2013%20CustomRates.pdf Accessed 12 June 2013.
Reilly, B. G. (2011). Comparing both horizontal and vertical storage. International Silo
Association. Available at: http://www.silo.org/horizontalverticalstorage.htm Accessed
06 June, 2013.
Saxe, C. 2007. Big Bale Storage Losses; how different options stack up. Focus on Forage 9(1):
1-3.
Schechinger, T. M. and J. Hettenhaus. 1999. Corn stover Harvest: Grower, custom operator, and
processes issues and answers. Available at
http://www.ornl.gov/info/reports/2004/3445605458705.pdf Accessed 23 October, 2009.
Shinners, K.J., B.N. Binversie, and P. Savoie. 2003. Harvest and storage of wet and dry corn
stover as a biomass feedstock. ASAE Paper No. 036088. St. Joseph, Mich.: ASAE.
Shinners, K.J. and B.N. Binversie. 2004. Harvest and storage of wet corn stover biomass. ASAE
Paper No. 041159. St. Joseph, Mich.: ASAE.

225
Shinners, K. J., B. N. Binversie, R. E. Muck, and P. J. Weimer. 2007. Comparison of wet and dry
corn stover harvest and storage. Biomass and Bioenergy 31(4): 211‐221.
Shinners, K. J., A. D. Wepner, R. E. Muck and P. J. Weimer. 2009. Aerobic and anaerobic
storage of single-pass, chopped corn stover. ASABE Paper No. 095654. St. Joseph,
Mich.: ASABE.
Thompson, J. and E. T. Wallace. 2011. Corn Stover for Bioenergy Production: Cost Estimates
and Farmer Supply Response. Renewable Energy RE-3W. Purdue extension. Available at
http://www.extension.purdue.edu/extmedia/EC/RE-3-W.pdf Accessed on 21 September,
2013.
Turhollow, A. F. and S. Sokhansanj. 2007. Costs of harvesting, storing in a large pile, and
transporting corn stover in a wet form. Applied Engineering in Agriculture 23(4): 439-
448.
Tyndall, J. 2007. Corn Stover as a Biofuel Feedstock in Iowa: Characterizing Farmer Interest to
Supply. Available at
http://www.bioeconomyconference.org/07%20Sessions/approved07sessions/Tyndall,%2
0John.pdf Accessed on 21 September, 2013.
University of Missouri extension. 2012. Corn Stover in Missouri Frequently Asked Questions.
Available at http://www.dairy.missouri.edu/drought/StoverFAQ.pdf Accessed on 21
September, 2013.
Wilhelm, W. W., J. M. Johnson, D. T. Lightle, D. L. Karlen, J. M. Novak, N. W. Barbour, D. A.
Laird, J. Baker, T. E. Ochsner, A. D. Halvorson, D. W. Archer and F. Arriaga. 2011.
Vertical distribution of corn stover dry mass grown at several US locations. BioEnergy
Research, 4(1), 11-21.
Wilkerson, E. G. (2012) Planning and Building Hay Barns that Work. Available at
http://www.caes.uga.edu/commodities/fieldcrops/forages/events/SHC11/Proceedings-
Wilkerson.pdf Accessed 20 June, 2013.
Wilson, R. K. and S. Overturf. 2012. 2012 Nebraska farm custom rates- Part II. Available at
http://www.ianrpubs.unl.edu/live/ec826/build/ec826.pdf Accessed on 13 June, 2013.

226
Chapter 8
Conclusions
8.1 Overview
A series of experiments, in four phases, were performed to characterize the impact of wet storage
systems on biofuel production and elucidate how this storage option compares with conversional
dry storage systems. Wet storage simulates ensilage, which is used in the livestock industry and
which has been practiced for centuries. Feedstock preservation – quality and quantity – in wet
storage systems depends on naturally produced organic acids, which reduce the pH to levels that
eradicate most spoilage organisms. The presence of organic acid and the high moisture content
associated with wet storage present major concerns and defines the delay in the readiness to
adopt wet storage, even though it is recognized as an option for the biofuel industry.
The concern posed by wet storage acids is the perception that the microorganisms required to aid
subsequent processes cannot survive due to the inhibitory nature of organic acids. The impact of
organic acids, in particular, was therefore a major focus of this study. The other concern of high
moisture has to with transportation logistics. In this case wet storage is presumed to have higher
transportation cost that could make it economically less competitive than dry feedstock. A model
was developed to access this concern.
Using rewetted dry corn stover, this study explored feedstock quality issues as well as tested
assumptions about the pretreatment capability of organic acids produced during wet storage. The
model developed was used to explore the cost implications of wet storage and effect on ethanol
production, comparing it to dry storage systems. The results show wet storage is a suitable
storage option for ethanol production, with downstream outcomes that are similar for moisture
levels of 35% to 65%. In addition, modeling output showed that at moisture levels ≤ 35%, the
minimum delivery cost of wet storage feedstock was lower than cost of dry storage at 25%
moisture. The delivery cost factors in all costs incurred from harvesting and collection
operations, storage and eventual transportation to the refinery, accounting for feedstock losses at
the various logistic units.

227
8.2 Experimental approach
The present study was intended to address several questions about wet storage systems. These
include (1) what effect storage conditions have on feedstock composition or quality; (2) how
effective is the pretreatment capability of organic acids produced in plain silage; (3) how organic
acids produced during storage interact with subsequent downstream processes like pretreatment
and fermentation; (4) how wet storage system outcomes compare with dry storage systems and
(5) whether wet storage can be economically competitive with dry storage.
The research was carried out in four phases. Phase 1 addresses the first question in Chapter 3.
Phase 2 addresses the second question in Chapter 4. Phase 3 addresses the third question in
Chapters 5 and 6 and Phase 4 addresses the fourth and fifth questions in Chapter 7. The initial
experimental set-up included 519 (aerobic and anaerobic) storage units of 15% to 75% moisture
levels. Two temperatures were investigated (23oC ± 1
oC and 37
oC). Storage durations were 0, 21,
90 and 220 days.
To examine the effect of storage conditions on feedstock composition (Phase 1), a quantitative
saccharification method was used in structural compositional analysis. The difference in
feedstock composition indicated the change that occurred during storage. Other feedstock
changes were examined through dry matter loss, organic acids produced and pH.
In Phase two, the pretreatment capability was examined by thoroughly washing the wet stored
feedstock (day 220, ensiled) and corresponding controls (day 0, unensiled). The goal of washing
was to get rid of sugars and acids that could interfere with the reactivity assay. These feedstocks
were treated with hydrolytic enzymes and incubated at 50oC for 3 days. Glucose yield was used
as a quantitative measure of how reactive the fibers were to the enzymes.
In Phase 3, dried ground silage was tested against “as is” silage (i.e. silage with no post-storage
processing). Half the samples of the dry silage and “as is” silage together with corresponding
controls were washed. Both washed and unwashed samples were pretreated using liquid hot
water method. The pretreatment extracts, which contain the acids and inhibitors generated during
pretreatment, were collected separately. Fermentation was then carried out with and without
pretreatment extracts. Organic acid interaction with the pretreatment process was examined by

228
comparing washed and unwashed samples. The impact of acids and inhibitors on the
fermentation process was examined by comparing samples fermented with extract to those
fermented without extracts. Wet storage effect was examined by comparing wet storage samples
to control samples (day 0). Drying effect was examined by comparing dry silage to “as is” silage.
A model was developed in Phase 4 that draws on the data from aerobic storage in phase one to
inform the behavior of dry storage at moistures greater than 25%. The model uses relationships
derived from Phases 1 -3 and cost data from the literature to determine minimum feedstock
delivery cost, ethanol yield and ethanol production cost. The minimum ethanol selling price was
also determined for each scenario. The model present a simple tool for comparing different
storage conditions as well as storage types/configurations. This model uses and Microsoft Excel
platform and accepts inputs through direct keyboard entering, selection from drop-down menus
and check boxes.
8.3 Key findings
Ensilage was effective at preserving corn stover even at low moisture levels of 25%
Generally, there was little or no moisture change during anaerobic wet storage.
The most influential factor with respect to change in feedstock composition during anaerobic wet
storage is storage duration
Hemicellulose degradation ranged from 6% to 30% during wet storage at moisture levels of 25%
to 75%
Storage at moisture levels of 35% – 65% was similarly consistent in its impact on the biofuel
production process. Hence storing at 35% is just as effective as 65%. Feedstock suppliers can
enjoy the benefits of silage at this low moisture and the benefit of lesser transportation cost.
Although there were some variations in silage outcome due to the different storage moistures,
these variations did not have any significant impact on upstream process (pretreatment and
fermentation) outcomes, if extreme moisture levels (25% and 75%) are avoided.
Of the two extreme moistures (25% and 75%) studied, 75% had consistently poorer outcomes
and should be avoided if possible. Compared to the alternate (dry storage), if drying rates are
slow, wet storage could still be a better option

229
There is evidence that wet storage, without biological and chemical additives, has pretreatment
capability which was attributed to lactic acid dominance. However, for corn stover the extent of
this effect is not adequate to serve as sole pretreatment; post storage pretreatment would
therefore still be necessary.
Effect of organic acids can be observed at two levels (1) at the storage level potentially altering
feedstock structure by degrading hemicellulose and making the feedstock more susceptible to
subsequent pretreatment. This can be observed when organic acid is not interfering with the
pretreatment process as in washed samples; (2) during subsequent pretreatment which
accelerates as well as limits xylan removal (when organic acid is interacting with the
pretreatment process).
Total organic acids produced during wet storage (<1% DM to 9.1%DM) were generally below
levels that constitute any form of ethanol fermentation inhibition. The levels of these acids were
altered in downstream processes leading to fermentation. During liquid hot water pretreatment, it
is possible to generate acids higher than the amounts initially present during storage. Again,
these amounts were usually not at levels to cause concern, except in some 75% moisture samples
where high levels of butyric acid (>3.7%) interacted with high levels acetic acid (>6.0% DM) to
inhibit ethanol production, as evident in lower yields. Even at a projected 30% solid loading,
organic acids were not at levels to present any significant inhibition.
If samples stored at 75% are excluded, organic acid had no inhibitory effect on ethanol
fermentation and in fact enhanced the yield by a mean factor of about 1.11
Pretreatment of ensiled stover could be carried out at lower severity [shorter retention time],
compared to unensiled stover, and still be as effective. However, as pretreatment severity
increases, the benefits derived from ensilage decreases.
Fermentation with pretreatment extract showed organic acids, furfural and HMF generally had
no inhibitory effect on ethanol production. The amount of furfural generated during pretreatment
was about 10x the amount of 5-HMF. On average, furfural was less than 0.5% DM. The
exception is 75% moisture sample, which could generate high acetic and butyric acids.
Drying wet stored feedstock significantly reduced ethanol yield by a factor of 0.6 to 0.8,
probably due to the in-situ storage pretreatment that results in permanent collapse of cell wall
during the drying process.

230
Modeling result indicated that low moisture wet storage feedstocks (≤ 35%) had lower feedstock
delivery cost and better ethanol yield compared to dry storage feedstock at 25% to 35% moisture.
Delivery cost of wet storage at any particular moisture level was always lower than the costs at
the corresponding dry storage supply chain at the same moisture.
A sensitivity analysis of model parameters showed the most influential factor on feedstock
delivery cost was moisture content and storage losses for wet and dry storage respectively.
8.4 Potential applications
The most important outcome of this study is the elucidation of the effects and cost of wet storage
systems at multiple levels from storage to end use. The results presented in this study address
several concerns about wet storage systems relating to their effect on subsequent processes and
the logistics of transporting water. This study shows wet storage can be effective even at low
moisture. In addition, this study will provide feedstock suppliers and feedstock buyers with a
good understanding of wet storage systems that can facilitate its adoption for biofuel production.
This is particularly useful for high humid regions, where drying rates are slow and could result in
extensive field losses and contamination. With a prior knowledge on what to expect from wet
storage systems, the risk associated with adopting this alternate storage strategy is minimized and
suppliers are encouraged to participate.
The study also illustrates a strategy to classify wet storage outcomes that can be used in
developing quality indices for the biofuel market to ensure fair trade between suppliers and
buyers. In the absence of a biofuel specific index or classification system, this study shows that
quality standards in the livestock industry apply well to the biofuel industry. Wet storage for
biofuel production, however, covers a wider range of moisture.
Finally, the model developed in this study provides a simple tool for comparing various storage
configurations and ultimately their impact on biofuel production cost. This can serve as a handy
decision tool. Using a Microsoft Excel platform means it can be accessed freely by many.
8.5 Recommendations or direction for future research
Results from this research suggest that where options exist regarding storage moisture, low
moisture silage (<45%) is recommended over high moisture silage, since downstream processing

231
outcomes are similar but with lower transportation costs. At this moisture level, feedstock
delivery cost is similar to that of well-preserved dry feedstock.
This research has covered many aspects of wet storage but not much on the transportation and
handling aspects. Silage, from bunker, piles or unloaded from a tower silo, will likely be
transported and handled uncovered from storage to biorefinery. There is a need to expand our
knowledge about wet storage transportation, handling and queuing systems in terms of physical
losses and aerobic deterioration. From this perspective, wrapped silage or silage bags might be
recommended for biofuel system where multiple storage or staging area are required. Current
logistic models and demonstration programs should be expanded to address these logistics
concerns.
The model developed in this research can also be improved in many ways: (1) incorporate
aerobic deterioration data when silage is exposed during transportation. (2) include nutrient
removal/cost (3) include sustainability constrains that suggest sustainable harvest/collection
based on requirement to meet nutrient, soil carbon and soil moisture and erosion concerns (4)
incorporate timeliness of operation and effect on losses and cost, especially when custom rates
are charged per hour.
If a uniform feedstock format that includes downstream drying is to be adopted, further research
would be needed in characterizing full impact of drying on silage material, response to varying
drying temperatures, interactions of silage organic acids with drying process, causes of/
transformation of silage acids during drying, degree of pore space collapse and impacts of
decomposition and acids on quantitative saccharification.
Finally, although the model can be used in estimating feedstock quality based on ethanol output,
there will be a need to develop a quality index that provides a common basis for pricing
feedstock. This research has laid the foundation for such an index or indices. A fiber reactivity
index, ethanol yield factor and dry matter loss are some parameters that could be considered. All
of these parameters could be related to organic acids, which could be predicted by silage
moisture.

232
APPENDIX A: General overview of research
(Chapter 1)
Table F1: Null hypotheses tested in this research
(Ho): Feedstock composition after storage = Function (Dry matter loss)
(Ha): Feedstock composition after storage ≠ Function (Dry matter loss) ?
(Ho): μ hydrolytic yield, ensiled feedstock = μ hydrolytic yield, unensiled feedstock
(Ha): μ hydrolytic yield, ensiled feedstock > μ hydrolytic yield, unensiled feedstock
(Ho): μ pretreatment severity, ensiled feedstock = μ pretreatment severity, unensiled feedstock
(Ha): μ pretreatment severity, ensiled feedstock < μ pretreatment severity, unensiled feedstock
(Ho): μ biofuel yield, with silage organic acid = μ biofuel yield, no organic acid (unensiled/washed silage)
(Ha): μ biofuel yield,with silage organic acid ≠ μ biofuel yield, no organic acid (unensiled/washed silage)
(Ho): μ process cost ensiled feedstock = μ process cost unensiled feedstock
(Ha): μ process cost ensiled feedstock < μ process cost unensiled feedstock
(Ho) = Null hypothesis (Ha) = Alternative hypothesis μ = mean value
Ensiled = wet storage feedstock; Unensiled = corresponding day 0 (control samples)
= null hypothesis rejected after research
= null hypothesis rejected after research but alternative not always true
? = Dry matter loss affects feedstock composition but there was no correlation between the
two

233
Figure A1: Schematic overview of research

234
Figure A2: Detailed flow chart of research showing number of samples analyzed at each stage
Bold = measurements taken
Bold red= yet to be taken
Temperature
(oC)
0 3 reps 3 reps 3 reps 3 reps 3 reps 3 reps 3 reps
21 3 reps 3 reps 3 reps 3 reps 3 reps 3 reps 3 reps
90 3 reps 3 reps 3 reps 3 reps 3 reps 3 reps 3 reps Washed Unwashed Washed Unwashed
0 3 reps 3 reps 3 reps 3 reps 3 reps 3 reps 3 reps *Moisture content 273 273
21 3 reps 3 reps 3 reps 3 reps 3 reps 3 reps 3 reps * Organic acids 273 1365
90 3 reps 3 reps 3 reps 3 reps 3 reps 3 reps 3 reps * pH 273 273
0 3 reps 3 reps 3 reps 3 reps 3 reps 3 reps 3 reps *DML 273 273
21 3 reps 3 reps 3 reps 3 reps 3 reps 3 reps 3 reps * Composition ?
220 3 reps 3 reps 3 reps 3 reps 3 reps 3 reps 3 reps
0 3 reps 3 reps 3 reps 3 reps 3 reps 3 reps 3 reps
21 3 reps 3 reps 3 reps 3 reps 3 reps 3 reps 3 reps
90 2 reps 2 reps 2 reps 2 reps 2 reps 2 reps 2 reps
220 3 reps 3 reps 3 reps 3 reps 3 reps 3 reps 3 reps
372
744
Temperature 912
(oC) 1488 Fermentation controls
0 3 reps 3 reps 3 reps 3 reps 3 reps 3 reps 3720 Enzyme-yeast blanks 21
21 3 reps 3 reps 3 reps 3 reps 3 reps 3 reps 456 As received stover 24
90 3 reps 3 reps 3 reps 3 reps 3 reps 3 reps 8 random Avicel 12
0 3 reps 3 reps 3 reps 3 reps 3 reps 3 reps *Moisture content 234 234 204 12 random
21 3 reps 3 reps 3 reps 3 reps 3 reps 3 reps * Organic acids 234 1170 7712 Ethanol 372
90 3 reps 3 reps 3 reps 3 reps 3 reps 3 reps * pH 234 273 429
0 3 reps 3 reps 3 reps 3 reps 3 reps 3 reps *DML 234 273
21 3 reps 3 reps 3 reps 3 reps 3 reps 3 reps *Composition ? Total
220 3 reps 3 reps 3 reps 3 reps 3 reps 3 reps 24
0 3 reps 3 reps 3 reps 3 reps 3 reps 3 reps Moisture content (after washing, 2 per moisture) 12
21 3 reps 3 reps 3 reps 3 reps 3 reps 3 reps Controls Batch 1 Batch 2
90 2 reps 2 reps 2 reps 2 reps 2 reps 2 reps 2FPU 5FPU 15FPU 2FPU 5FPU 15FPU Enzyme blanks 9 9 18
220 3 reps 3 reps 3 reps 3 reps 3 reps 3 reps Substrate blanks 36 36 72
Avicel 3 3 6
216
216
18 18 18 18 18 18
18 18 18 18 18 18
72 72 72
36 36 36 108 108 108 996
Xylan removal
Glucan removal
Glucose yields Total mass b4 rnx/Crude density of reagents
Dry fiber after hydrolysis
Moisture
NO
22
Fiber reactivity test Residual sugars/organic acid
37
Washed
Non-pretreated Pretreated
65 75Glucan removal
HMF & Furfural
YES
22
Organic acids
Volume of prt extract
Solids removal
37
Aeration
Ensilage
time
(days)
25 35 45 55
Ethanol yield
Experimental plan for storage of PA corn stover. PA stover was obtained from PA dairy. Additional sample information: was left standing
in the field all winter, up till mid-April, before being harvested and baled. Initial mositure content was ~30.6% at time of collection.
Moisture was adjusted to the various moisture indicted in plan by drying and/or rewetting
pH
Independent variables Moisture content (% wet basis) Xylan removal
NO
22
Fiber reactivity test
37
Washed
Non-pretreated
15 FPU
Glucose yields
45 55 65 75
YES
22
37
WET STORAGE INVESTIGATION FOR BIOFUEL PRODUCTION
Experimental plan for storage of IAcorn stover. IA corn stover was obtained from Idaho National Lab although originally from [grown and
air-dried in] Iowa. It was stored in dry bales indoors for 6 months before size reduction. Additional sample information: Initial mositure
content was ~7.5% at time of arrival in PA. Moisture was adjusted to the various moisture indicted in plan by rewetting. DRY GOUND
Independent variables Moisture content (% wet basis)
Aeration Ensilage
time (days) 15 25 35
Test in triplicates (Batch 3)
These samples are 12 because assume day zero samples of 22C samples should be
applicable to these samplesDRY GROUND
Storage replicates combined
Storage replicates combined
Storage replicates combined
Storage replicates combined
Individually sampled
Individually sampled
151051510515105 15
DRY STOVER AS IS
Pretreatment time (mins):
15105
15105
Unwashed
Ferment with extracts
Ferment without
extracts
Ferment without
extracts
Ferment with extracts
Ferment with extracts
Ferment with extracts
@190o C
Organic acidsHMF and furfural
HMF and
Sugars washed outResidual sugars
Residual sugars
Storage replicates combined
Storage replicates combined
Moisture content Sugars washed outOrganic acids out
pH extractResidual sugarsResidual acids
Tota
l n
o.
of
sam
ple
s
Dat
a p
oin
ts
Tota
l n
o.
of
sam
ple
s
(3 for each enzyme loading)
Total no. of samples = 6
Total no. of samples = 6
Total no. of samples = 6
Total no. of samples = 6
Total no. of samples, Day 0 :
Total no. of samples, Day 220:
Total data points:
Xylan and glucan data points (measured in duplicates):
Total no. of samples = 28 (in duplicates)Total data points = 140 (acids)
56 (HMF and furfural)
Total no. of samples = 14
Total no. of samples = 12
Total no. of samples = 14 Total data points = 28 (in duplicates)
= 14 (residual)
Samples = 14Data points 28
Samples = 14Data points = 14
242424242424121212 12 121212 121212
242424 242424
Total no. of samples:
Data points:
Test in triplicates (Batch 1:no pretreat; Batch 2: pretreat)
Test in triplicates (Batch 4)
(3 for each moisture levelfor both day 0 and day 220)
Total no. of samples = 23
Total no. of samples = 18(Did not include Day 90 anarobic
samples)
Total data pts = 78= 258 (Dry)
Dat
a p
oin
ts
Washed
Same types of contols as in Batch 1& 2. in addtition, Batch 4 has As received
stover ( dry ground) as part of control
42
42
42
42
18
18
Total data pts (moisture)= 12
AS RECEIVED AS IS (not ground)
Batch 3 Batch 2Batch 1 Batch 4
Batch 5
15105 15105
Chapter 3 Chapter 4
Chapter 5 & 6

235
APPENDIX B: Corn stover - relating storage conditions to outcomes
(Chapter 3)
Figure B1: Process Chart and experimental plan for studying effect of storage conditions on
storage outcome
Bef
ore
sto
rageAdjust moisture: 15-75%
Storage temperature: 23OC , 37O C
Aerobic/anaerobic
Independent variables Dependent variables of interest
Aft
er s
tora
ge
pH
Moisture content
Feedstock composition
Dry matter loss
Organic acid profile
Storage duration: 0, 21, 90, 220 days
Dry
stover
at 5
5oC
Wet chemistry
Grind with Wiley mills to 2 mmW
eigh s
tover
Extr
acti
on
of
wat
er
solu
ble
s
Wet Storage
ofstover
Independent variables Moisture content (% wet basis)
Aeration
Temperature
(oC)
Ensilage
time
(days)
15 25 35 45 55 65 75
IA PA IA PA IA PA IA PA IA PA IA PA IA PA
YES
22
0 3 reps * 3 reps 3 reps 3 reps 3 reps 3 reps 3 reps 3 reps 3 reps 3 reps 3 reps 3 reps 3 reps
21 3 reps * 3 reps 3 reps 3 reps 3 reps 3 reps 3 reps 3 reps 3 reps 3 reps 3 reps 3 reps 3 reps
90 3 reps * 3 reps 3 reps 3 reps 3 reps 3 reps 3 reps 3 reps 3 reps 3 reps 3 reps 3 reps 3 reps
37
0 3 reps * 3 reps 3 reps 3 reps 3 reps 3 reps 3 reps 3 reps 3 reps 3 reps 3 reps 3 reps 3 reps
21 3 reps * 3 reps 3 reps 3 reps 3 reps 3 reps 3 reps 3 reps 3 reps 3 reps 3 reps 3 reps 3 reps
90 3 reps * 3 reps 3 reps 3 reps 3 reps 3 reps 3 reps 3 reps 3 reps 3 reps 3 reps 3 reps 3 reps
NO
22
0 3 reps * 3 reps 3 reps 3 reps 3 reps 3 reps 3 reps 3 reps 3 reps 3 reps 3 reps 3 reps 3 reps
21 3 reps * 3 reps 3 reps 3 reps 3 reps 3 reps 3 reps 3 reps 3 reps 3 reps 3 reps 3 reps 3 reps
220 3 reps * 3 reps 3 reps 3 reps 3 reps 3 reps 3 reps 3 reps 3 reps 3 reps 3 reps 3 reps 3 reps
37
0 3 reps * 3 reps 3 reps 3 reps 3 reps 3 reps 3 reps 3 reps 3 reps 3 reps 3 reps 3 reps 3 reps
21 3 reps * 3 reps 3 reps 3 reps 3 reps 3 reps 3 reps 3 reps 3 reps 3 reps 3 reps 3 reps 3 reps
90 3 reps * 3 reps * 3 reps * 3 reps * 3 reps * 3 reps * 3 reps *
220 3 reps * 3 reps 3 reps 3 reps 3 reps 3 reps 3 reps 3 reps 3 reps 3 reps 3 reps 3 reps 3 reps

236
Figure B2: Storage samples showing aerobic filter lids, anaerobic indicator, data logger and
molding
Figure B3: Some physical changes in aerobic samples during storage

237
Figure B4: Some precautions taken to minimize errors in dry matter determination
(Samples placed in dry desiccator so samples can cool down without moisture absorption (right)
and scale covered during weighing to prevent unstable/fluctuating reading due to air movement
(left))

238
Table B1: Moisture content and dry matter losses in Fall Harvested, IA, stover
Storage
Temperature
(oC)
Storage
duration
(days)
Target
Moisture
content (%)
Actual Moisture
content before
storage (%)
Moisture
content after
storage (%)
Change in Moisture
(percentage points
difference)
Percentage
change in
moisture
Dry matter loss
(% dry basis)
22 21 15 14.91 ± 0.55 14.67 ± 1.05 0.23 ± 0.80 1.58 ± 5.34 -0.23 ± 1.07
22 21 25 25.13 ± 0.43 24.29 ± 0.22 0.84 ± 0.53 3.33 ± 2.03 -1.16 ± 0.77
22 21 35 33.47 ± 1.02 33.76 ± 0.29 -0.29 ± 0.81 -0.91 ± 2.49 0.57 ± 1.25
22 21 45 43.33 ± 0.23 43.83 ± 0.25 -0.50 ± 0.48 -1.16 ± 1.12 1.17 ± 0.92
22 21 55 54.89 ± 1.16 54.83 ± 0.42 0.06 ± 0.75 0.10 ± 1.38 0.23 ± 1.80
22 21 65 64.44 ± 0.76 65.48 ± 0.70 -1.05 ± 0.47 -1.63 ± 0.75 3.18 ± 1.27
22 21 75 74.87 ± 0.10 74.7 ± 0.37 0.18 ± 0.43 0.23 ± 0.57 -0.34 ± 1.88
22 220 15 14.91 ± 0.55 15.7 ± 0.17 -0.79 ± 0.71 -5.44 ± 5.01 1.53 ± 0.93
22 220 25 25.13 ± 0.43 25.09 ± 0.17 0.04 ± 0.51 0.12 ± 2.02 0.81 ± 0.89
22 220 35 33.47 ± 1.02 34.09 ± 0.66 -0.62 ± 1.29 -1.92 ± 3.96 1.54 ± 1.99
22 220 45 43.33 ± 0.23 45.22 ± 0.29 -1.89 ± 0.31 -4.37 ± 0.74 4.12 ± 0.58
22 220 55 54.89 ± 1.16 55.78 ± 0.22 -0.88 ± 1.35 -1.64 ± 2.52 2.48 ± 2.88
22 220 65 64.69 ± 0.57 65.54 ± 0.29 -0.85 ± 0.77 -1.32 ± 1.21 2.88 ± 2.10
22 220 75 74.93 ± 0.70 75.04 ± 0.35 -0.11 ± 0.82 -0.16 ± 1.10 1.04 ± 3.26
37 21 15 15.61 ± 0.30 14.39 ± 0.31 1.22 ± 0.33 7.80 ± 2.05 -1.6 ± 0.33
37 21 25 25.05 ± 0.78 23.81 ± 0.31 1.24 ± 1.07 4.88 ± 4.10 -1.67 ± 1.45
37 21 35 34.21 ± 0.69 33.36 ± 0.58 0.86 ± 1.07 2.47 ± 3.11 -1.22 ± 1.62
37 21 45 43.12 ± 0.41 44.38 ± 0.41 -1.26 ± 0.76 -2.94 ± 1.78 2.43 ± 1.27
37 21 55 53.29 ± 1.32 53.49 ± 0.59 -0.19 ± 1.66 -0.41 ± 3.13 0.55 ± 3.54
37 21 65 64.32 ± 0.64 65.56 ± 0.32 -1.25 ± 0.94 -1.94 ± 1.48 3.67 ± 2.59
37 21 75 75.34 ± 0.73 76.35 ± 0.63 -1.01 ± 0.41 -1.34 ± 0.55 4.32 ± 1.32
37 90 15 15.30 ± 0.08 13.56 ± 0.41 1.75 ± 0.40 11.41 ± 2.61 -0.02 ± 1.38
37 90 25 24.05 ± 0.24 22.65 ± 0.30 1.40 ± 0.49 5.79 ± 1.96 -1.30 ± 0.76
37 90 35 32.63 ± 0.18 31.68 ± 0.32 0.96 ± 0.49 2.92 ± 1.49 -0.92 ± 0.58
37 90 45 42.70 ± 0.10 44.73 ± 0.44 -2.02 ± 0.53 -4.73 ± 1.24 4.02 ± 0.96
37 90 55 55.51 ± 0.03 54.51 ± 0.05 1.00 ± 0.04 1.79 ± 0.06 -1.50 ± 0.38
37 90 65 64.62 ± 0.07 64.49 ± 0.64 0.14 ± 0.58 0.21 ± 0.90 0.53 ± 1.56
37 90 75 74.81 ± 0.15 75.58 ± 0.39 -0.77 ± 0.25 -1.03 ± 0.33 4.52 ± 0.17
37 220 15 15.61 ± 0.29 14.44 ± 0.39 1.18 ± 0.19 7.55 ± 1.25 -1.47 ± 0.36
37 220 25 25.05 ± 0.78 24.64 ± 0.14 0.40 ± 0.68 1.56 ± 2.66 0.06 ± 0.87
37 220 35 34.21 ± 0.69 33.23 ± 0.51 0.98 ± 0.92 2.83 ± 2.68 -0.67 ± 1.44
37 220 45 43.12 ± 0.41 44.65 ± 0.30 -1.53 ± 0.18 -3.54 ± 0.45 3.49 ± 0.36
37 220 55 53.29 ± 1.32 55.00 ± 0.92 -1.71 ± 1.66 -3.25 ± 3.14 4.23 ± 3.48
37 220 65 64.69 ± 0.64 65.55 ± 0.77 -0.86 ± 0.73 -1.34 ± 1.12 2.85 ± 2.11
37 220 75 75.70 ± 0.64 76.36 ± 0.58 -0.65 ± 0.28 -0.86 ± 0.37 4.08 ± 1.10
Anaerobic storage

239
Table B1 cont:
Note: For moisture data, positive values imply decrease in moisture content with reference to before storage values,
while negative values imply an increase. Moisture before storage were obtained from same batch used for storage
but not the exact sample stored hence the difference in before and after measurements may not be real but a result of
heterogeneous nature of feedstock. Differences could also be due to error [using different weighing scales, several
people taking measurement, relative humidity of weighing environment potentially resulting in hygroscopic
moisture absorption]
Positive value for dry matter loss indicates a reduction in dry matter while a negative value shows dry matter
accumulation. Dry matter accumulation could be a result of inaccuracy in moisture determination
Storage
Temperature
(oC)
Storage
duration
(days)
Target
Moisture
content (%)
Actual Moisture
content before
storage (%)
Moisture
content after
storage (%)
Change in Moisture
(percentage points
difference)
Percentage
change in
moisture
Dry matter loss
(% dry basis)
22 21 15 14.83 ± 0.24 9.47 ± 0.21 5.36 ± 0.43 36.11 ± 2.32 0.37 ± 0.50
22 21 25 24.03 ± 0.65 15.32 ± 0.41 8.71 ± 0.81 36.2 ± 2.54 2.99 ± 0.50
22 21 35 33.34 ± 0.19 27.72 ± 0.57 5.63 ± 0.66 16.87 ± 1.93 10.61 ± 1.16
22 21 45 42.68 ± 1.04 42.58 ± 0.34 0.10 ± 1.07 0.20 ± 2.51 22.2 ± 2.04
22 21 55 55.16 ± 0.89 54.07 ± 0.17 1.09 ± 1.02 1.95 ± 1.83 20.1 ± 1.85
22 21 65 65.64 ± 0.44 65.63 ± 0.28 0.01 ± 0.51 0.01 ± 0.78 19.01 ± 1.02
22 21 75 75.68 ± 1.64 74.22 ± 0.56 1.46 ± 1.22 1.91 ± 1.57 13.17 ± 4.72
22 90 15 14.83 ± 0.24 6.83 ± 0.16 8.00 ± 0.29 53.91 ± 1.28 0.20 ± 0.57
22 90 25 24.03 ± 0.65 7.19 ± 0.41 16.84 ± 0.84 70.05 ± 2.01 3.98 ± 1.06
22 90 35 33.34 ± 0.19 9.91 ± 0.60 23.44 ± 0.67 70.29 ± 1.86 17.03 ± 0.62
22 90 45 42.68 ± 1.04 22.89 ± 1.50 19.79 ± 0.58 46.4 ± 2.28 30.44 ± 0.32
22 90 55 55.16 ± 0.89 41.41 ± 2.99 13.74 ± 3.84 24.85 ± 6.60 32.43 ± 3.94
22 90 65 65.64 ± 0.44 59.27 ± 1.24 6.37 ± 1.05 9.70 ± 1.62 35.27 ± 1.84
22 90 75 75.68 ± 1.64 74.22 ± 1.23 1.45 ± 1.22 1.91 ± 1.57 40.73 ± 2.60
37 21 15 14.76 ± 0.36 6.03 ± 0.84 8.74 ± 0.52 59.23 ± 4.72 0.96 ± 0.76
37 21 25 24.95 ± 0.76 7.34 ± 0.46 17.61 ± 0.36 70.58 ± 1.05 4.60 ± 0.63
37 21 35 33.49 ± 0.49 18.45 ± 0.28 15.04 ± 0.77 44.9 ± 1.64 13.15 ± 1.37
37 21 45 44.76 ± 0.57 35.86 ± 0.77 8.90 ± 0.21 19.9 ± 0.70 21.93 ± 0.36
37 21 55 54.36 ± 0.38 48.46 ± 0.73 5.90 ± 1.09 10.85 ± 1.94 23.77 ± 0.62
37 21 65 65.04 ± 1.07 63.00 ± 1.53 2.04 ± 1.79 3.13 ± 2.75 27.47 ± 3.74
37 21 75 75.19 ± 0.77 74.48 ± 0.99 0.71 ± 0.26 0.95 ± 0.35 28.36 ± 0.67
37 90 15 14.76 ± 0.36 3.15 ± 0.15 11.61 ± 0.48 78.63 ± 1.42 0.84 ± 0.14
37 90 25 24.95 ± 0.76 3.30 ± 0.33 21.65 ± 0.70 86.78 ± 1.22 5.37 ± 1.70
37 90 35 33.49 ± 0.49 3.55 ± 0.16 29.94 ± 0.40 89.39 ± 0.37 16.17 ± 0.76
37 90 45 44.76 ± 0.57 3.54 ± 0.21 41.23 ± 0.69 92.09 ± 0.53 23.60 ± 1.28
37 90 55 54.36 ± 0.38 2.83 ± 0.23 51.53 ± 0.16 94.79 ± 0.38 29.83 ± 1.47
37 90 65 65.04 ± 1.07 8.12 ± 1.98 56.93 ± 3.05 87.48 ± 3.25 35.58 ± 1.03
37 90 75 75.19 ± 0.77 38.59 ± 7.93 36.60 ± 7.18 48.75 ± 10.09 39.41 ± 1.24
Aerobic storage

240
Table B2: Moisture content and dry matter losses in Spring Harvested, PA, stover
Notes for Table B1 applies
Storage
Tempera
ture (oC)
Storage
duration
(days)
Target
Moisture
content
(%)
Actual Moisture
content before
storage (%)
Moisture
content after
storage (%)
Change in
Moisture
(percentage
points
difference)
Percentage
change in
moisture
Dry matter loss (%
dry basis)
22 21 25 23.89 ± -0.65 24.54 ± 0.55 -0.65 ± 1.42 -2.76 ± 4.08 0.98 ± 0.64
22 21 35 33.57 ± -0.35 33.92 ± 1.98 -0.35 ± 0.58 -1.09 ± 1.26 0.84 ± 1.64
22 21 45 44.49 ± -1.33 45.81 ± 2.37 -1.33 ± 4.08 -3.18 ± 5.73 2.63 ± 0.29
22 21 55 58.14 ± 0.57 57.57 ± 0.27 0.57 ± 0.83 0.98 ± 0.65 -1.23 ± 0.34
22 21 65 66.06 ± -0.02 66.08 ± 0.37 -0.02 ± 1.4 -0.03 ± 0.77 0.25 ± 0.21
22 21 75 77.02 ± 0.67 76.35 ± 0.18 0.67 ± 1.51 0.87 ± 0.68 4.40 ± 0.63
22 220 25 23.89 ± -2.63 26.53 ± 0.55 -2.63 ± 1.07 -11.03 ± 1.16 4.52 ± 0.74
22 220 35 33.57 ± -1.41 34.98 ± 1.98 -1.41 ± 2.36 -4.39 ± 5.26 2.67 ± 0.74
22 220 45 44.49 ± -1.91 46.4 ± 2.37 -1.91 ± 3.11 -4.46 ± 4.71 5.56 ± 0.67
22 220 55 58.14 ± -0.73 58.88 ± 0.27 -0.73 ± 1.67 -1.27 ± 1.15 2.49 ± 0.52
22 220 65 66.06 ± -0.76 66.82 ± 0.37 -0.76 ± 1.22 -1.15 ± 0.65 2.95 ± 0.27
22 220 75 77.02 ± -0.55 77.57 ± 0.18 -0.55 ± 2.37 -0.72 ± 0.77 3.37 ± 0.41
37 21 25 25.03 ± -0.22 25.25 ± 1.03 -0.22 ± 2.08 -1.05 ± 5.89 0.68 ± 0.47
37 21 35 33.25 ± -0.16 33.42 ± 1.52 -0.16 ± 2.68 -0.65 ± 5.16 0.52 ± 0.40
37 21 45 44.74 ± -0.37 45.11 ± 0.17 -0.37 ± 0.22 -0.84 ± 0.29 1.26 ± 0.30
37 21 55 57.65 ± 0.25 57.4 ± 0.26 0.25 ± 0.32 0.44 ± 0.26 -0.19 ± 0.36
37 21 65 66.26 ± 0.16 66.11 ± 0.28 0.16 ± 1.41 0.24 ± 0.71 -0.30 ± 0.29
37 21 75 76.49 ± -0.23 76.72 ± 0.19 -0.23 ± 1.34 -0.3 ± 0.44 1.60 ± 0.15
37 220 25 25.03 ± -0.33 25.36 ± 1.03 -0.33 ± 1.07 -1.35 ± 2.18 1.56 ± 0.62
37 220 35 33.25 ± -1.20 34.45 ± 1.52 -1.20 ± 2.63 -3.78 ± 6.02 2.63 ± 0.38
37 220 45 44.74 ± -1.61 46.35 ± 0.17 -1.61 ± 0.44 -3.63 ± 7.68 1.77 ± 3.24
37 220 55 57.65 ± -1.89 59.54 ± 0.26 -1.89 ± 2.15 -3.28 ± 1.65 5.56 ± 0.73
37 220 65 66.26 ± -0.91 67.17 ± 0.28 -0.91 ± 1.57 -1.37 ± 0.98 4.46 ± 0.42
37 220 75 76.49 ± -1.08 77.57 ± 0.19 -1.08 ± 0.92 -1.41 ± 0.28 5.92 ± 0.08
22 21 25 24.09 ± 7.09 17.00 ± 0.40 7.09 ± 0.68 29.42 ± 1.43 1.19 ± 0.26
22 21 35 34.21 ± 5.67 28.54 ± 1.65 5.67 ± 1.43 16.43 ± 4.50 8.77 ± 0.26
22 21 45 47.35 ± 2.57 44.78 ± 0.44 2.57 ± 2.74 5.43 ± 2.36 14.1 ± 1.28
22 21 55 57.28 ± 2.50 54.79 ± 0.46 2.5 ± 4.7 4.34 ± 4.28 15.31 ± 2.06
22 21 65 66.15 ± 1.41 64.74 ± 0.51 1.41 ± 1.01 2.14 ± 0.61 15.9 ± 0.90
22 21 75 76.37 ± 0.37 76.00 ± 0.10 0.37 ± 0.63 0.49 ± 0.39 16.66 ± 0.27
22 90 25 24.09 ± 16.23 7.86 ± 0.40 16.23 ± 1.82 67.38 ± 0.91 1.87 ± 0.13
22 90 35 34.21 ± 23.61 10.6 ± 1.65 23.61 ± 2.15 68.95 ± 2.30 12.75 ± 0.54
22 90 45 47.35 ± 22.55 24.79 ± 0.44 22.55 ± 1.77 47.64 ± 2.40 19.78 ± 1.17
22 90 55 57.28 ± 20.42 36.87 ± 0.46 20.42 ± 1.88 35.63 ± 1.66 29.62 ± 0.66
22 90 65 66.15 ± 8.62 57.53 ± 0.51 8.62 ± 1.89 13.02 ± 1.49 34.10 ± 0.55
22 90 75 76.37 ± 2.48 73.89 ± 0.10 2.48 ± 0.35 3.25 ± 1.22 39.17 ± 0.84
37 21 25 24.52 ± 20.02 4.50 ± 0.23 20.02 ± 0.23 81.67 ± 1.01 2.16 ± 0.25
37 21 35 33.19 ± 21.11 12.09 ± 2.06 21.11 ± 0.92 63.73 ± 3.73 12.11 ± 1.92
37 21 45 45.37 ± 16.74 28.63 ± 0.76 16.74 ± 1.09 36.91 ± 1.52 14.98 ± 1.08
37 21 55 57.67 ± 14.04 43.64 ± 0.05 14.04 ± 2.24 24.34 ± 4.25 15.39 ± 2.45
37 21 65 66.67 ± 8.76 57.90 ± 0.99 8.76 ± 0.66 13.14 ± 1.27 16.66 ± 0.59
37 21 75 76.44 ± 5.40 71.03 ± 0.38 5.40 ± 1.96 7.07 ± 0.68 16.87 ± 0.30
37 90 25 24.52 ± 23.53 0.99 ± 0.23 23.53 ± 1.13 95.97 ± 5.57 1.50 ± 1.37
37 90 35 33.19 ± 30.81 2.38 ± 2.06 30.81 ± 3.00 92.85 ± 0.62 11.86 ± 0.32
37 90 45 45.37 ± 43.42 1.95 ± 0.76 43.42 ± 1.01 95.71 ± 0.31 16.75 ± 0.14
37 90 55 57.67 ± 55.25 2.42 ± 0.05 55.25 ± 2.42 95.80 ± 0.71 20.72 ± 0.41
37 90 65 66.67 ± 62.73 3.94 ± 0.99 62.73 ± 1.16 94.08 ± 1.13 22.08 ± 0.74
37 90 75 76.44 ± 41.67 34.77 ± 0.38 41.67 ± 4.03 54.51 ± 4.53 25.79 ± 3.51
Anaerobic storage
Aerobic storage

241
Table B3: pH values of moisture adjusted corn stover before and after storage
Day 0 Day 21 Day 90 Day 21 Day 90 Day 220
15 6.69 ± 0.08 6.81 ± 0.22 6.77 ± 0.02 6.18 ± 0.55 * 6.53 ± 0.21
25 6.69 ± 0.02 8.58 ± 0.03 8.42 ± 0.02 6.12 ± 0.12 * 4.95 ± 0.05
35 6.69 ± 0.11 8.42 ± 0.19 8.38 ± 0.02 4.67 ± 0.03 * 4.41 ± 0.03
45 6.65 ± 0.02 8.37 ± 0.07 8.11 ± 0.10 4.30 ± 0.02 * 4.18 ± 0.02
55 6.71 ± 0.03 8.41 ± 0.27 8.46 ± 0.12 4.10 ± 0.05 * 4.05 ± 0.03
65 6.54 ± 0.08 8.49 ± 0.11 8.83 ± 0.15 4.16 ± 0.02 * 4.23 ± 0.03
75 6.73 ± 0.05 8.39 ± 0.08 9.09 ± 0.03 4.32 ± 0.09 * 4.24 ± 0.01
15 * * * * * *
25 6.55 ± 0.07 7.23 ± 0.04 6.89 ± 0.05 4.96 ± 0.18 * 4.97 ± 0.91
35 6.46 ± 0.03 7.28 ± 0.08 7.08 ± 0.05 3.94 ± 0.05 * 4.07 ± 0.01
45 6.14 ± 0.04 7.23 ± 0.47 7.40 ± 0.19 3.77 ± 0.06 * 4.16 ± 0.11
55 5.73 ± 0.09 7.71 ± 0.34 7.41 ± 0.17 3.73 ± 0.03 * 4.00 ± 0.09
65 5.90 ± 0.10 7.89 ± 0.26 7.80 ± 0.07 3.71 ± 0.02 * 4.09 ± 0.04
75 5.69 ± 0.07 8.15 ± 0.08 7.87 ± 0.06 3.92 ± 0.12 * 4.58 ± 0.02
15 6.71 ± 0.10 6.91 ± 0.19 6.68 ± 0.03 6.56 ± 0.03 7.70 ± 0.89 6.26 ± 0.66
25 6.71 ± 0.03 8.29 ± 0.27 7.95 ± 0.04 5.92 ± 0.12 5.48 ± 0.03 4.90 ± 0.05
35 6.69 ± 0.02 8.29 ± 0.18 7.97 ± 0.01 4.73 ± 0.03 4.61 ± 0.07 4.46 ± 0.03
45 6.69 ± 0.06 8.40 ± 0.18 7.35 ± 0.09 4.33 ± 0.01 4.34 ± 0.01 4.24 ± 0.02
55 6.66 ± 0.01 8.66 ± 0.14 7.45 ± 0.26 4.12 ± 0.01 4.19 ± 0.03 4.11 ± 0.02
65 6.56 ± 0.10 8.75 ± 0.10 7.79 ± 0.08 4.17 ± 0.01 4.57 ± 0.46 4.08 ± 0.01
75 6.76 ± 0.07 8.77 ± 0.23 7.99 ± 0.07 4.25 ± 0.02 4.86 ± 0.08 4.75 ± 0.03
15 * * * * * *
25 6.50 ± 0.06 7.04 ± 0.05 6.84 ± 0.08 4.26 ± 0.04 * 4.40 ± 0.12
35 6.49 ± 0.07 7.07 ± 0.06 6.85 ± 0.06 4.01 ± 0.04 * 4.10 ± 0.09
45 6.19 ± 0.12 7.27 ± 0.19 6.95 ± 0.10 3.87 ± 0.02 * 4.16 ± 0.14
55 5.69 ± 0.05 7.07 ± 0.07 6.86 ± 0.05 4.08 ± 0.04 * 4.39 ± 0.24
65 5.81 ± 0.05 7.49 ± 0.05 7.10 ± 0.03 3.92 ± 0.03 * 4.50 ± 0.24
75 5.79 ± 0.13 7.86 ± 0.05 7.27 ± 0.06 4.53 ± 0.08 * 4.59 ± 0.01
23oC
37oC
IA
PA
IA
PA
pHStorage
Temperature
Stover
type
Storage
moisture
(%)Aerobic Storage Anaerobic Storage

242
Box 1: More about dry matter determination from organic acids (Stoichio-gasometric method)
Dry matter loss was estimated based on the organic acid content of silage, assuming that these acids
are a measureable and perhaps significant part of that dry matter loss. The goal was to assess a
mechanistic explanation for the wide variability within replicates as determined through gravimetric
methods, which included many suspicious results indicating dry matter accumulation rather than loss.
Dry matter losses under anaerobic conditions are usually termed fermentation losses and are a result of
microbial action. Fermentation of water soluble sugars to organic acids is necessary to reduce the pH
to the levels required for proper preservation of the larger bulk of the feedstock, which generally
requires pH below 5.0. These losses are therefore in part unavoidable. The organic acids produced
could potentially degrade structural bonds leading to release of more soluble sugars from the
hemicellulose in the cell wall, and these sugars could be degraded if the anaerobic condition is
compromised. If the pH is not sufficiently low, there can also be losses from secondary fermentations
such as butyric acid with higher associated losses of CO2. Either of these circumstances can increase
dry matter loss (DML) above what would be anticipated in an idealized ensiled storage system.
Different microbial communities have been identified in silage and the extent of DML would depend
on the community that dominates. In Table B4 are stoichiometries of some silage fermentation
reactions. From these reactions, it can be observed that acetic acid is usually a by-product or co-
product of other fermentation reactions. Most acetic acid formed in silage are formed by heterolactic
Lactobacillus sp so accounting for CO2 from acetic acid production will be double accounting for the
same dry matter loss. Depending on the substrate concentration (glucose) and species of
microorganism, different product outcomes are expected as shown in Table B4. The highlighted
equations were used in the calculation of DML. These choices of equations were in part based on
experimental observations in which there was a slight increase in moisture content of most samples
after storage, the presence of isobutyric acid and the absence of succinic acid. In addition these
equations give higher DML, assuming a bias to higher dry matter losses is more acceptable. In butyric
acid fermentation, when lactic is absent, the assumption is sugars are first converted to lactic before
butyric resulting in an additional mole of CO2. Carbon dioxide and hydrogen are lost as gases.
Although water may increase the wet weight, it is lost during drying. Contributions of hydrogen and
water to DML are usually very little.

243
Lactic vs Moisture: Best fit Regression R2 Acetic vs Moisture: Best fit Regression R2
Lactic220 = -0.0024 x Moisture2 + 0.2486 x Moisture- 3.5731 0.91 Acetic220 = 0.0326 x Moisture- 0.5382 0.88
Lactic21 = -0.0008 x Moisture2 + 0.104 x Moisture- 1.5137 0.90 Acetic21 = 0.0117 x Moisture - 0.1242 0.83
Lactic0 = -4E-05 x Moisture2 + 0.0015 x Moisture+ 0.1115 0.59 Acetic0 = 0.0038 0.00
Lactic220 = -0.0027 x Moisture2 + 0.2441 x Moisture - 3.3406 0.95 Acetic220 = 0.046 x Moisture - 1.0642 0.80
Lactic21 = -0.0016 x Moisture2 + 0.1664 x Moisture- 2.1227 0.79 Acetic21 = 0.0175 x Moisture - 0.2027 0.74
Lactic0 = -0.0002 x Moisture2 + 0.0252 x Moisture - 0.4466 0.61 Acetic0 = -0.0002 x Moisture2 + 0.0193 x Moisture - 0.3917 0.92
PA
IA
Figure B5: Relating Lactic acid and acetic acid to moisture content

244
Table B4: Stoichiometry of some silage fermentation reactionsₒ
Reactions Reference Main Acid Mols of CO2 per mol acid
g CO2 per gram acid
Acid production by lactic acid bacteria (LAB)
Lactobacillus sp
Lactic 0 0
Glucose → Lactic McGechan, 1990
Lactic 1 0.4885
Glucose→ Lactic + Ethanol McGechan, 1990
Glucose→ Lactic + Acetic
Lactic 1 0.4885
Glucose → Lactic + Acetic + Butyric
Lactic & Isobutyric
3 & 2 1.4654 & 0.9988
Glucose → Lactic + Acetic + Isobutyric Suzzi et al., 1990*
Lactic 1 0.4885
Fructose or glucose → Lactic + Acetic + Mannitol McGechan, 1990
Lactic 0 0
[Pentose] → Lactic + Acetic McGechan, 1990
Acetic 2 1.4654
Lactic Acetic + 1,2 Propandiol + Ethanol Oude Elferink et al., 2001
Lactic Acetic + 1,2 Propandiol Oude Elferink et al., 2001
Streptococcus sp
Glucose → Lactic + Acetic + Formic + Ethanol Moat et al., 2003*
Acid production by Clostridium sp
Butyric 2 0.9988
Glucose → Butyric Hungate, 1966

245
Butyric 8/3 1.3317
Glucose → Butyric + Acetic Moat et al., 2003*
Butyric 2 0.9988
Glucose → Butyric + Lactic + Acetic
Butyric 2 0.9988
Lactic → Butyric McGechan, 1990
Acid production by Propionibacterium sp
Propionic 1 0.5940
Glucose → Propionic
Propionic 0 0
Glucose → Propionic Hungate, 1966
Propionic 3 1.1879 Glucose → Propionic
Propionic 1 0.5940
Glucose → Propionic + Acetic
Propionic 1/2 0.2970
Glucose → Propionic + Acetic Moat et al., 2003
Propionic 1 0.5940
Glucose → Propionic + Acetic + Succinic Papoutsakis and Meyer, 1985*
Propionic 1/2 0.2970
Lactic → Propionic + Acetic Todar, 2008*
Acetic Acid production
Acetic 1 0.7327
Glucose → Acetic Hungate, 1966
Glucose → Acetic + Ethanol (E. coli)
Yeast fermentation
ₒ There are many other reactions not listed here especially the metabolism of protein/amino acids
* These references gave main products. So there were additions of hydrogen, carbon-dioxide or water to balance equation
Reactions that are not referenced were deduced from combination of ideas from literature cited.

246
References for stoichiometric reactions
Hungate, R. E. 1966. The rumen and its microbes. New York, Academic Press.
Moat, A. G., J. W. Foster and M. P. Spector. 2003. Microbial physiology. 4th edition. New York:
Wiley-Liss Inc. (Chapter 11: Fermentation Pathways, 412-433)
McGechan M.B. 1990. A review of losses arising during conservation of grass forage: part 2.
Storage losses. Journal of Agricultural Engineering Research 45: 1 - 30.
Oude Elferink S. J. W. H., J. Krooneman, J. C. Gottschal, S. F. Spoelstra, F. Faber, and F.
Driehuis. 2001. Anaerobic conversion of lactic acid to acetic acid and 1,2-propanediol
by Lactobacillus buchneri. Applied Environmental Microbiology 67:125-132
Papoutsakis E.T. and C.L. Meyer. 1985. Fermentation equations for propionic- acid bacteria and
for production of assorted oxychemicals from various sugars. Biotechnology and
Bioengineering 27: 67-80
Suzzi G., L. Grazia and G. Ferri. 1990. Studies on isobutyric acid-producing bacteria in silage.
Letters in Applied Microbiology 10: 69-72
Todar, K. 2008. Diversity of metabolism in procaryotes. Available at
http://textbookofbacteriology.net/metabolism_3.html Accessed 09 May 2013.

247
APPENDIX C: Corn stover reactivity to cellulolytic enzymes
(Chapter 4)
This appendix contains supplementary materials to Chapter 4. These include micrographic
images from other studies, process charts for the fiber reactivity study, some pictures relating to
the hydrolytic process, experimental data on organic acids, glucose yields from both pretreatment
and hydrolysis, graphs of organic acid relationship with moisture and statistical results.
Figure C1: Microscopic images comparing unensiled and ensiled corn stover (Adapted from
Oleskowicz-Popiel et al. 2010).The microbial additive used was Biomax Si (CHR Hansen,
Denmark) containing lactic acid.

248
Figure C2: TEM (Transmission Electron Microscopy) micrographs comparing unensiled, ensiled
and dilute acid pretreated stover (Adapted from Donohoe et al. 2009).

249
Figure C3: Process Chart and experimental plan for fiber reactivity test and correlation with
organic acid. Each cellulase enzyme loading has a corresponding β-glucosidase loading as
described under methodology.

250
Figure C4: Process Chart and experimental plan for fiber reactivity test and correlation with
organic acid. Cellulase enzyme loading has a corresponding β-glucosidase loading as described
under methodology.

251
Figure C5: Sample of “as is” corn stover after washing (A) for fiber reaction compared to
unwashed “as is” stover (B)
Figure C6: Washed corn stover in centrifuge tubes for hydrolysis at 15% solid loading in a
Barnstead Max Q5000 SHKE 5000-7 floor shaker/ incubator (Barnstead International, Dubuque,
IA).
A B

252
Figure C7: Relating hemicellulose degradation during storage and hydrolytic glucose yield
* Percentage theoretical from washed IA stover without pretreatment. Data label shows storage
moisture or adjusted moisture for day 0 samples in red.
0
5
10
15
20
25
30
-5 0 5 10 15 20
Hyd
rlo
ytic
glu
cose
yie
ld *
% Hemicellulose degradation during storage
Glucose(Day 220) day 0
IA-45
IA-25
IA-55
IA-35
IA-65
IA-75
IA-55
IA-35
IA-45
IA-75
IA-65
IA-25

253
Table C1: Xylan removal in pretreated PA stover assuming no xylan degradation during storage
and 5% xylan degradation during storage
Storage
moisture Storage
% Xylan removed
(with 0%
degradation
during storage)
% Xylan removed
(with 5%
degradation
during storage)
25 Ensiled 46.7 50.0
35 Ensiled 52.3 56.0
45 Ensiled 54.1 57.5
55 Ensiled 53.7 57.5
65 Ensiled 52.0 55.5
75 Ensiled 50.3 53.5
25 Unensiled 51.3 51.0
35 Unensiled 40.6 40.5
45 Unensiled 41.8 41.5
55 Unensiled n.m n.m
65 Unensiled 54.4 54.0
75 Unensiled 49.1 49.0
0.023* 0.135p-value (ensile vs unensiled):
* Significant difference in ensiled and unensiled samples was found for
samples at 35% and 55% moisture levels. See Figure 2 of main text.

254
Table C2: Glucose yield of non-pretreated corn stover after fiber reactivity test
IA
0 2 5 15 15
Wet storage (Day 220) 25 0 ± 0 6.88 ± 1.59 7.8 ± 3.01 6.9 ± 1.64 27.53 ± 1.03
Wet storage (Day 220) 35 0 ± 0 13.62 ± 1.75 17.05 ± 0.54 23.25 ± 0.81 24.7 ± 0.73
Wet storage (Day 220) 45 0 ± 0 9.31 ± 1.17 14.15 ± 0.89 16.07 ± 0.53 25.56 ± 2.23
Wet storage (Day 220) 55 0 ± 0 7.39 ± 0.84 10.66 ± 1.34 17.38 ± 4.34 20.98 ± 2.19
Wet storage (Day 220) 65 0 ± 0 9.15 ± 2.66 14.27 ± 3.18 18.4 ± 0.88 23.88 ± 0.13
Wet storage (Day 220) 75 0 ± 0 6.65 ± 0.92 8.76 ± 1.79 11.22 ± 2.71 18.99 ± 0.64
Control (Day 0) 25 0 ± 0 0.67 ± 0.52 2.81 ± 2.53 7.38 ± 1.62 18.09 ± 5.4
Control (Day 0) 35 0 ± 0 6.51 ± 2.08 12.31 ± 2.3 13.88 ± 4.05 11.76 ± 1.5
Control (Day 0) 45 0 ± 0 8.59 ± 0.3 11.28 ± 2.68 13.62 ± 4.22 12.6 ± 5.93
Control (Day 0) 55 0 ± 0 7.66 ± 0.9 9.9 ± 2.62 8.31 ± 1.48 11.16 ± 4.48
Control (Day 0) 65 0 ± 0 9.05 ± 1.69 11.74 ± 2.59 10.93 ± 3.02 17.72 ± 6.49
Control (Day 0) 75 0 ± 0 9.07 ± 1.21 9.58 ± 1.48 12.22 ± 1.04 14.48 ± 1.23
Stover type PA
StorageMoisture
(%)
Cellulase enzyme loading (FPU/ g glucan)

255
Table C3: Glucose and total organic acid - amount, ranking and cluster group*
* Cluster analysis for glucose was performed using yields from two cellulose enzyme loading rates (0 and
15 FPU/g glucan) with corresponding β-glucosidase.
Stover
type
Storage
Duration
Moisture
content
(%)
Glucose (%
theoretical)
Total acids (%
dry matter)
Glucose
yield
ranking
Total
organic
acids,
ranking
Glucose,
cluster group
Total acid,
cluster
group
IA 220 75 18.99 ± 0.63 6.59 ± 2.36 18 24 Moderate High
PA 220 55 17.38 ± 4.33 5.82 ± 0.72 14 22 Moderate High
PA 220 65 18.4 ± 0.87 5.31 ± 1.28 17 21 Moderate High
PA 220 75 11.22 ± 2.71 6.05 ± 1.03 6 23 Low High
IA 0 25 18.08 ± 5.4 0 ± 0 16 3.5 Moderate Low
IA 0 35 11.77 ± 1.5 0 ± 0 7 3.5 Low Low
IA 0 45 12.6 ± 5.93 0.05 ± 0.09 9 7 Low Low
IA 0 55 11.16 ± 4.48 0 ± 0 5 3.5 Low Low
IA 0 65 17.73 ± 6.49 0 ± 0 15 3.5 Moderate Low
IA 0 75 14.48 ± 1.23 0 ± 0 12 3.5 Low Low
PA 0 25 7.38 ± 1.62 0 ± 0 2 3.5 Low Low
PA 0 35 13.88 ± 4.05 0.32 ± 0.12 11 10 Low Low
PA 0 45 13.62 ± 4.21 0.3 ± 0.18 10 9 Low Low
PA 0 55 8.31 ± 1.48 0.38 ± 0.08 3 11 Low Low
PA 0 65 10.93 ± 3.02 0.5 ± 0.3 4 13 Low Low
PA 0 75 12.21 ± 1.04 0.3 ± 0.3 8 8 Low Low
IA 220 25 27.53 ± 1.03 0.44 ± 0.76 24 12 High Low
PA 220 25 6.9 ± 1.64 1.36 ± 0.37 1 14 Low Low
PA 220 45 16.07 ± 0.53 1.58 ± 1.37 13 15 Moderate Low
IA 220 35 24.7 ± 0.73 2.77 ± 0.15 22 17 High Moderate
IA 220 45 25.56 ± 2.23 3.92 ± 0.24 23 18 High Moderate
IA 220 55 20.98 ± 2.19 4.43 ± 0.78 19 20 High Moderate
IA 220 65 23.88 ± 0.13 4.43 ± 2.16 21 19 High Moderate
PA 220 35 23.25 ± 0.81 2.63 ± 0.26 20 16 High Moderate

256
Table C4: pH data of storage (Day 220) and control (day 0) samples*
IA stover PA stover
Moisture
(%) Day 220 Day 0 Day 220 Day 0
25 4.92 6.67 4.31 6.49
25 4.93 6.73 4.36 6.56
25 4.84 6.73 4.53 6.45
35 4.48 6.69 4.17 6.47
35 4.43 6.67 4.12 6.57
35 4.48 6.70 4.00 6.44
45 4.25 6.64 4.26 6.30
45 4.25 6.75 7.04 6.22
45 4.21 6.67 4.06 6.06
55 4.12 6.66 4.67 5.73
55 4.11 6.67 4.23 5.64
55 4.09 6.66 4.28 5.71
65 4.08 6.57 4.22 5.80
65 4.08 6.65 4.64 5.76
65 4.07 6.45 4.64 5.86
75 4.74 6.83 4.59 5.65
75 4.78 6.69 4.58 5.91
75 4.73 6.77 4.60 5.81
Each sample has three replicates hence the three values for each moisture level. All three
replicates were mixed together for the fiber reactivity test. pH of 45% moisture, PA stover, is
highlighted to show the odd pH that raises the mean pH to 5.12.

257
Table C5: Cluster grouping based on organic acid content of individual IA and PA storage samples
Moisture
content (%) Storage Stover type
Moisture
content (%)
Lactic (%
DM)
Ac (%
DM)etic (%
DM)
Propionic
(% DM)
Isobutyric
(% DM)
Butyric (%
DM)
Total aids
(% DM)
Cluster
group Classification
75 Ensiled IA 75 0.00 2.72 0.00 1.13 2.59 6.44 0 High
75 Ensiled IA 75 0.00 3.48 0.00 2.41 3.14 9.03 0 High
75 Ensiled IA 75 0.00 2.03 0.00 0.30 1.98 4.31 0 High
75 Ensiled PA 75 0.00 2.40 0.28 1.81 0.99 5.48 0 High
75 Ensiled PA 75 0.00 3.41 0.42 1.83 1.58 7.24 0 High
75 Ensiled PA 75 0.00 2.38 0.31 1.79 0.96 5.44 0 High
65 Ensiled PA 65 0.64 4.17 0.46 0.00 0.00 5.27 0 High
65 Ensiled PA 65 0.00 1.88 0.33 2.38 2.01 6.60 0 High
65 Ensiled PA 65 0.00 1.49 0.28 1.25 1.03 4.05 0 High
55 Ensiled PA 55 1.41 1.90 0.00 1.69 0.00 5.00 0 High
55 Ensiled PA 55 1.42 2.54 0.00 2.37 0.00 6.33 0 High
55 Ensiled PA 55 1.25 2.17 0.00 2.41 0.29 6.12 0 High
35 Ensiled IA 35 2.07 0.64 0.00 0.21 0.00 2.92 1 Moderate
35 Ensiled IA 35 1.82 0.63 0.00 0.18 0.00 2.63 1 Moderate
35 Ensiled IA 35 1.94 0.61 0.00 0.21 0.00 2.76 1 Moderate
45 Ensiled IA 45 2.71 0.68 0.00 0.26 0.00 3.65 1 Moderate
45 Ensiled IA 45 2.99 0.79 0.00 0.28 0.00 4.06 1 Moderate
45 Ensiled IA 45 2.99 0.79 0.00 0.28 0.00 4.06 1 Moderate
55 Ensiled IA 55 2.97 1.15 0.00 0.22 0.00 4.34 1 Moderate
55 Ensiled IA 55 3.34 1.33 0.00 0.59 0.00 5.26 1 Moderate
55 Ensiled IA 55 2.55 0.95 0.00 0.20 0.00 3.70 1 Moderate
65 Ensiled IA 65 2.66 1.37 0.00 0.00 0.00 4.03 1 Moderate
65 Ensiled IA 65 1.49 1.00 0.00 0.00 0.00 2.49 1 Moderate
65 Ensiled IA 65 4.95 1.34 0.00 0.47 0.00 6.76 1 Moderate
45 Ensiled PA 45 1.95 0.20 0.00 0.18 0.00 2.33 1 Moderate
45 Ensiled PA 45 1.97 0.30 0.00 0.15 0.00 2.42 1 Moderate
35 Ensiled PA 35 1.96 0.63 0.00 0.17 0.00 2.76 1 Moderate
35 Ensiled PA 35 1.75 0.83 0.00 0.22 0.00 2.80 1 Moderate
35 Ensiled PA 35 1.33 0.84 0.00 0.16 0.00 2.33 1 Moderate

258
Table C5 cont.: Cluster grouping based on organic acid content of individual IA and PA storage samples
Moisture
content (%) Storage Stover type
Moisture
content (%)
Lactic (%
DM)
Ac (%
DM)etic (%
DM)
Propionic
(% DM)
Isobutyric
(% DM)
Butyric (%
DM)
Total aids
(% DM)
Cluster
group Classification
25 Unensiled IA 25 0.00 0.00 0.00 0.00 0.00 0.00 2 Low
25 Unensiled IA 25 0.00 0.00 0.00 0.00 0.00 0.00 2 Low
25 Unensiled IA 25 0.00 0.00 0.00 0.00 0.00 0.00 2 Low
35 Unensiled IA 35 0.00 0.00 0.00 0.00 0.00 0.00 2 Low
35 Unensiled IA 35 0.00 0.00 0.00 0.00 0.00 0.00 2 Low
35 Unensiled IA 35 0.00 0.00 0.00 0.00 0.00 0.00 2 Low
45 Unensiled IA 45 0.00 0.00 0.00 0.00 0.00 0.00 2 Low
45 Unensiled IA 45 0.00 0.00 0.00 0.00 0.00 0.00 2 Low
45 Unensiled IA 45 0.00 0.16 0.00 0.00 0.00 0.16 2 Low
55 Unensiled IA 55 0.00 0.00 0.00 0.00 0.00 0.00 2 Low
55 Unensiled IA 55 0.00 0.00 0.00 0.00 0.00 0.00 2 Low
55 Unensiled IA 55 0.00 0.00 0.00 0.00 0.00 0.00 2 Low
65 Unensiled IA 65 0.00 0.00 0.00 0.00 0.00 0.00 2 Low
65 Unensiled IA 65 0.00 0.00 0.00 0.00 0.00 0.00 2 Low
65 Unensiled IA 65 0.00 0.00 0.00 0.00 0.00 0.00 2 Low
75 Unensiled IA 75 0.00 0.00 0.00 0.00 0.00 0.00 2 Low
75 Unensiled IA 75 0.00 0.00 0.00 0.00 0.00 0.00 2 Low
75 Unensiled IA 75 0.00 0.00 0.00 0.00 0.00 0.00 2 Low
25 Ensiled IA 25 0.00 0.00 0.00 0.00 0.00 0.00 2 Low
25 Ensiled IA 25 0.00 0.00 0.00 0.00 0.00 0.00 2 Low
25 Ensiled IA 25 0.79 0.41 0.00 0.12 0.00 1.32 2 Low
75 Unensiled PA 75 0.00 0.00 0.00 0.00 0.00 0.00 2 Low
75 Unensiled PA 75 0.25 0.34 0.00 0.00 0.00 0.59 2 Low
75 Unensiled PA 75 0.30 0.00 0.00 0.00 0.00 0.30 2 Low
65 Unensiled PA 65 0.26 0.25 0.00 0.00 0.00 0.51 2 Low
65 Unensiled PA 65 0.00 0.19 0.00 0.00 0.00 0.19 2 Low
65 Unensiled PA 65 0.51 0.28 0.00 0.00 0.00 0.79 2 Low
55 Unensiled PA 55 0.13 0.16 0.00 0.00 0.00 0.29 2 Low
55 Unensiled PA 55 0.17 0.26 0.00 0.00 0.00 0.43 2 Low
55 Unensiled PA 55 0.19 0.24 0.00 0.00 0.00 0.43 2 Low
45 Unensiled PA 45 0.13 0.17 0.00 0.00 0.00 0.30 2 Low
45 Unensiled PA 45 0.13 0.00 0.00 0.00 0.00 0.13 2 Low
45 Unensiled PA 45 0.38 0.10 0.00 0.00 0.00 0.48 2 Low
35 Unensiled PA 35 0.08 0.11 0.00 0.00 0.00 0.19 2 Low
35 Unensiled PA 35 0.31 0.12 0.00 0.00 0.00 0.43 2 Low
35 Unensiled PA 35 0.33 0.00 0.00 0.00 0.00 0.33 2 Low
25 Unensiled PA 25 0.00 0.00 0.00 0.00 0.00 0.00 2 Low
25 Unensiled PA 25 0.00 0.00 0.00 0.00 0.00 0.00 2 Low
25 Unensiled PA 25 0.00 0.00 0.00 0.00 0.00 0.00 2 Low
45 Ensiled PA 45 0.00 0.00 0.00 0.00 0.00 0.00 2 Low
25 Ensiled PA 25 1.16 0.42 0.00 0.15 0.00 1.73 2 Low
25 Ensiled PA 25 0.72 0.20 0.00 0.08 0.00 1.00 2 Low
25 Ensiled PA 25 1.08 0.12 0.00 0.15 0.00 1.35 2 Low

259
Table C6: Cluster grouping based on glucose yield of individual IA and PA samples hydrolyzed
at cellulase enzyme loadings of 0 and 15 FPU /g glucan. Glucose yield is reported as a percent of
theoretical yield based on the glucan content of the biomass.
Moisture
content (%) Replicate Storage Stover type
Glucose
yield @ 0
FPU
Glucose
yield @15
FPU
Cluster
group Classification
25 I Ensiled IA 0 28.65 1 High
25 II Ensiled IA 0 27.33 1 High
25 III Ensiled IA 0 26.61 1 High
35 I Ensiled IA 0 25.32 1 High
35 II Ensiled IA 0 23.90 1 High
35 III Ensiled IA 0 24.88 1 High
45 I Ensiled IA 0 23.48 1 High
45 II Ensiled IA 0 27.91 1 High
45 III Ensiled IA 0 25.30 1 High
55 I Ensiled IA 0 22.84 1 High
55 III Ensiled IA 0 21.54 1 High
65 I Ensiled IA 0 24.03 1 High
65 II Ensiled IA 0 23.82 1 High
65 III Ensiled IA 0 23.79 1 High
25 II Unensiled IA 0 23.18 1 High
65 I Unensiled IA 0 23.98 1 High
35 I Ensiled PA 0 23.58 1 High
35 II Ensiled PA 0 22.33 1 High
35 III Ensiled PA 0 23.85 1 High
55 II Ensiled IA 0 18.56 2 Moderate
75 I Ensiled IA 0 18.61 2 Moderate
75 II Ensiled IA 0 19.72 2 Moderate
75 III Ensiled IA 0 18.63 2 Moderate
25 I Unensiled IA 0 18.65 2 Moderate
45 II Unensiled IA 0 18.72 2 Moderate
55 II Unensiled IA 0 15.53 2 Moderate
65 III Unensiled IA 0 18.17 2 Moderate
75 I Unensiled IA 0 15.74 2 Moderate
45 I Ensiled PA 0 16.24 2 Moderate
45 II Ensiled PA 0 16.49 2 Moderate
45 III Ensiled PA 0 15.48 2 Moderate
55 I Ensiled PA 0 19.80 2 Moderate
55 II Ensiled PA 0 19.96 2 Moderate
65 I Ensiled PA 0 18.59 2 Moderate
65 II Ensiled PA 0 17.44 2 Moderate
65 III Ensiled PA 0 19.16 2 Moderate
35 I Unensiled PA 0 18.53 2 Moderate
45 I Unensiled PA 0 15.55 2 Moderate
45 II Unensiled PA 0 16.52 2 Moderate

260
Table C6 cont.
Moisture
content (%) Replicate Storage Stover type
Glucose
yield @ 0
FPU
Glucose
yield @15
FPU
Cluster
group Classification
25 III Unensiled IA 0 12.43 0 low
35 I Unensiled IA 0 10.09 0 low
35 II Unensiled IA 0 12.23 0 low
35 III Unensiled IA 0 12.97 0 low
45 I Unensiled IA 0 12.22 0 low
45 III Unensiled IA 0 6.87 0 low
55 I Unensiled IA 0 11.37 0 low
55 III Unensiled IA 0 6.57 0 low
65 II Unensiled IA 0 11.02 0 low
75 II Unensiled IA 0 14.41 0 low
75 III Unensiled IA 0 13.28 0 low
25 I Ensiled PA 0 7.68 0 low
25 II Ensiled PA 0 5.02 0 low
25 III Ensiled PA 0 8.01 0 low
55 III Ensiled PA 0 12.37 0 low
75 I Ensiled PA 0 14.29 0 low
75 II Ensiled PA 0 10.24 0 low
75 III Ensiled PA 0 9.14 0 low
25 I Unensiled PA 0 5.87 0 low
25 II Unensiled PA 0 9.09 0 low
25 III Unensiled PA 0 7.18 0 low
35 II Unensiled PA 0 11.96 0 low
35 III Unensiled PA 0 11.14 0 low
45 III Unensiled PA 0 8.78 0 low
55 I Unensiled PA 0 7.75 0 low
55 II Unensiled PA 0 7.19 0 low
55 III Unensiled PA 0 9.99 0 low
65 I Unensiled PA 0 9.11 0 low
65 II Unensiled PA 0 9.26 0 low
65 III Unensiled PA 0 14.41 0 low
75 I Unensiled PA 0 11.44 0 low
75 II Unensiled PA 0 13.40 0 low
75 III Unensiled PA 0 11.81 0 low

261
Table C7: Another variant of cluster grouping based on percentage glucose yield of individual IA
and PA samples (treated as though yields from IA and PA stover are properties of feedstock at
particular moisture and storage duration).
Moisture
content
(%) Storage Replicate 0 FPU
Glucose
yield, IA
stover
(15FPU)
Glucose
yield, PA
stover
(15FPU)
Cluster
group Classification
35 Ensiled I 0 25.32 23.58 1 High
35 Ensiled II 0 23.90 22.33 1 High
35 Ensiled III 0 24.88 23.85 1 High
45 Ensiled I 0 23.48 16.24 1 High
45 Ensiled II 0 27.91 16.49 1 High
45 Ensiled III 0 25.30 15.48 1 High
55 Ensiled I 0 22.84 19.80 1 High
65 Ensiled I 0 24.03 18.59 1 High
65 Ensiled II 0 23.82 17.44 1 High
65 Ensiled III 0 23.79 19.16 1 High
25 Ensiled I 0 28.65 7.68 2 Moderate
25 Ensiled II 0 27.33 5.02 2 Moderate
25 Ensiled III 0 26.61 8.01 2 Moderate
55 Ensiled III 0 21.54 12.37 2 Moderate
75 Ensiled II 0 19.72 10.24 2 Moderate
75 Ensiled III 0 18.63 9.14 2 Moderate
25 Unensiled I 0 18.65 5.87 2 Moderate
25 Unensiled II 0 23.18 9.09 2 Moderate
55 Unensiled II 0 15.53 7.19 2 Moderate
65 Unensiled I 0 23.98 9.11 2 Moderate
55 Ensiled II 0 18.56 19.96 0 Low
75 Ensiled I 0 18.61 14.29 0 Low
25 Unensiled III 0 12.43 7.18 0 Low
35 Unensiled I 0 10.09 18.53 0 Low
35 Unensiled II 0 12.23 11.96 0 Low
35 Unensiled III 0 12.97 11.14 0 Low
45 Unensiled I 0 12.22 15.55 0 Low
45 Unensiled II 0 18.72 16.52 0 Low
45 Unensiled III 0 6.87 8.78 0 Low
55 Unensiled I 0 11.37 7.75 0 Low
55 Unensiled III 0 6.57 9.99 0 Low
65 Unensiled II 0 11.02 9.26 0 Low
65 Unensiled III 0 18.17 14.41 0 Low
75 Unensiled I 0 15.74 11.44 0 Low
75 Unensiled II 0 14.41 13.40 0 Low
75 Unensiled III 0 13.28 11.81 0 Low

262
Table C8: Cluster grouping based on mean glucose yield of PA samples hydrolyzed at cellulase enzyme loadings of 0, 2, 5 and 15
FPU/g glucan. Glucose yield is reported as a percent of theoretical yield based on the glucan content of the biomass.
Moisture
content
(%) Storage
Glucose
yield @
0 FPU
Glucose
yield @
2 FPU
Glucose
yield @
5 FPU
Glucose
yield @
15 FPU
Cluster
group Classification
35 Ensiled 0 13.62 17.05 23.25 1 High
45 Ensiled 0 9.31 14.15 16.07 1 High
55 Ensiled 0 7.39 10.66 17.38 1 High
65 Ensiled 0 9.15 14.27 18.40 1 High
25 Ensiled 0 6.88 7.80 6.90 3 Moderate
75 Ensiled 0 6.65 8.76 11.22 3 Moderate
35 Unensiled 0 6.51 12.31 13.88 3 Moderate
45 Unensiled 0 8.59 11.28 13.62 3 Moderate
55 Unensiled 0 7.66 9.90 8.31 3 Moderate
65 Unensiled 0 9.05 11.74 10.93 3 Moderate
75 Unensiled 0 9.07 9.58 12.21 3 Moderate
25 Unensiled 0 0.67 4.23 7.38 2 Low

263
Figure C8: Ward cluster (using squared Euclidean distance) grouping of PA using mean values of glucose yields at 2, 5, 15 FPU/g
glucan

264
Figure C9: Relationship between organic acids grouping and fiber reactivity grouping of PA corn
stover without pretreatment and grouped using glucose yield from four different enzyme
loadings

265
Figure C10: Relating glucose from fiber reactivity grouping of PA corn stover without
pretreatment with lactic acid. Data for lactic acid is a wider set that includes data of corn stover
feedstock not used in the fiber reactivity test
R² = 0.61
R² = 0.95
0.0
0.5
1.0
1.5
2.0
2.5
3.0
3.5
5 15 25 35 45 55 65 75
Lact
ic A
cid
(% D
ry M
atte
r)
Moisture Content (%)
day 0 day 220
High Glucose Average yield at 15 FPU = 19%
Moderate Glucose Average yield at 15 FPU = 11%
Low Glucose Average yield at 15 FPU = 7 %
Ensiled, 25%
Ensiled, 35%
Ensiled, 45%
Ensiled, 55%
Ensiled, 65%
Unesiled, 65%
Ensiled, 75%
Unensiled,75%Unensiled, 55%
Unensiled, 45%Unensiled, 35%
Unensiled, 25%
Lactic (day 220) = -0.0027 x Moisture2 + 0.2441 x Moisture - 3.3406; R² = 0.9504
Lactic (day 0) = -0.0002 x Moisture2 + 0.0212 x Moisture- 0.3711; R² = 0.6021

266
Figure C11: Relationship between organic acids grouping and fiber reactivity grouping of PA
and IA corn stover without pretreatment and grouped using actual values of glucose yields (from
15 FPU/g enzyme loadings) and actual amount of organic acids as percentage of dry matter.
Filled circles = Day 220; Opened, unlabeled circles =Day 0. Data labels for Day 0 not included
because congested.
0
5
10
15
20
25
30
-2 0 2 4 6 8 10
Glu
cose
Yie
ld (
% T
he
ore
tica
l)
Total Organic Acid (% DM)
IA-25
IA-55
IA-65
IA-45 IA-35
PA-35
PA-75
IA-75
PA-55
PA-65
PA-25
PA-45

267
Table C9: Properties of organic acids identified in ensiled corn stover
Compound Molecular Formula
Boiling point °C
pKa Molar mass g/mol
Density g/cm3
Lactic acid (2-Hydroxypropionic acid; 2-hydroxypropanoic acid; 1-hydroxyethane 1-carboxylic acid)
C3H6O3 122oC @12 mmHg
3.85 90.08 1.21
Acetic acid (Ethanoic acid) C2H4O2 118.1oC 4.76 60.05 1.05
Butyric acid (Butanoic acid) C4H8O2 163.5 °C 4.82 88.11 0.96
Isobutyric (2-Methylpropionic acid; Valerianic acid)
C4H8O2 155 °C 4.84 88.11 0.97
Propionic acid (propanoic acid; ethane carboxylic acid)
C3H6O2 141 °C 4.88 74.08 0.99

268
Figure C12: Verifying YSI reliability of quantification (a) Before fiber reactivity sample
measurements (b) Measurements within and after fiber reactivity sample measurements. For the
verification process, known concentrations of glucose were prepared and analyzed. Actual fiber
reactivity samples were diluted so that concentrations were within YSI calibration range, less
than 2.5 g/L.
y = 1.0297x R² = 0.9999
0.0
0.5
1.0
1.5
2.0
2.5
0.0 0.5 1.0 1.5 2.0 2.5
Act
ual
glu
cose
co
nce
ntr
atio
n (
g/L)
YSI quantification (g/L)
y = 1.0059x R² = 0.9989
0.0
0.5
1.0
1.5
2.0
2.5
0.0 0.5 1.0 1.5 2.0 2.5
Act
ual
glu
cose
co
nce
ntr
atio
n (
g/L)
YSI quantification (g/L)
b
a

269
Figure C13: Variation in total organic acids and relationship with storage moisture. Total acid
data reflect lumped IA and PA acids. Regression line is fitted to means of total acid at the
different moisture levels.
Storage moisture (%)
To
ta
l a
cid
s (
% d
ry
ba
sis
)
756555453525
9
8
7
6
5
4
3
2
1
0
Total acids = - 1.384 + 0.1030 x 'Storage moisture'
S 0.621401
R-Sq 92.3%
R-Sq (adj) 90.4%

270
STATISTICAL ANALYSIS (A)
ANOVA results showing differences in organic acids (IA and PA combined) across
moisture
One-way ANOVA: Lactic acid versus Moisture Source DF SS MS F P
Moisture1 5 22.67 4.53 4.51 0.003
Error 30 30.16 1.01
Total 35 52.83
S = 1.003 R-Sq = 42.91% R-Sq(adj) = 33.40%
Individual 95% CIs For Mean Based on
Pooled StDev
Level N Mean StDev --------+---------+---------+---------+-
25 6 0.625 0.512 (-------*--------)
35 6 1.812 0.261 (-------*-------)
45 6 2.055 1.093 (--------*-------)
55 6 2.157 0.910 (--------*-------)
65 6 1.623 1.918 (-------*--------)
75 6 0.000 0.000 (-------*-------)
--------+---------+---------+---------+-
0.0 1.0 2.0 3.0
Pooled StDev = 1.003
Tukey 95% Simultaneous Confidence Intervals
All Pairwise Comparisons among Levels of Moisture1
Individual confidence level = 99.51%
Moisture1 = 25 subtracted from:
Moisture1 Lower Center Upper +---------+---------+---------+---------
35 -0.573 1.187 2.947 (--------*--------)
45 -0.330 1.430 3.190 (--------*--------)
55 -0.228 1.532 3.292 (--------*-------)
65 -0.762 0.998 2.758 (--------*--------)
75 -2.385 -0.625 1.135 (--------*--------)
+---------+---------+---------+---------
-4.0 -2.0 0.0 2.0
Moisture1 = 35 subtracted from:
Moisture1 Lower Center Upper +---------+---------+---------+---------
45 -1.517 0.243 2.003 (--------*--------)
55 -1.415 0.345 2.105 (--------*--------)
65 -1.948 -0.188 1.572 (--------*--------)
75 -3.572 -1.812 -0.052 (--------*--------)
+---------+---------+---------+---------

271
-4.0 -2.0 0.0 2.0
Moisture1 = 45 subtracted from:
Moisture1 Lower Center Upper +---------+---------+---------+---------
55 -1.658 0.102 1.862 (--------*-------)
65 -2.192 -0.432 1.328 (--------*--------)
75 -3.815 -2.055 -0.295 (--------*--------)
+---------+---------+---------+---------
-4.0 -2.0 0.0 2.0
Moisture1 = 55 subtracted from:
Moisture1 Lower Center Upper +---------+---------+---------+---------
65 -2.293 -0.533 1.227 (-------*--------)
75 -3.917 -2.157 -0.397 (--------*--------)
+---------+---------+---------+---------
-4.0 -2.0 0.0 2.0
Moisture1 = 65 subtracted from:
Moisture1 Lower Center Upper +---------+---------+---------+---------
75 -3.383 -1.623 0.137 (--------*--------)
+---------+---------+---------+---------
-4.0 -2.0 0.0 2.0
One-way ANOVA: Acetic acid versus Moisture Source DF SS MS F P
Moisture1 5 29.145 5.829 15.64 0.000
Error 30 11.177 0.373
Total 35 40.322
S = 0.6104 R-Sq = 72.28% R-Sq(adj) = 67.66%
Individual 95% CIs For Mean Based on
Pooled StDev
Level N Mean StDev ---+---------+---------+---------+------
25 6 0.1917 0.1889 (----*----)
35 6 0.6967 0.1076 (----*----)
45 6 0.4417 0.3189 (----*-----)
55 6 1.6733 0.6268 (----*----)
65 6 1.8750 1.1595 (----*----)
75 6 2.7367 0.5910 (----*----)
---+---------+---------+---------+------
0.0 1.0 2.0 3.0
Pooled StDev = 0.6104
Tukey 95% Simultaneous Confidence Intervals
All Pairwise Comparisons among Levels of Moisture1
Individual confidence level = 99.51%
Moisture1 = 25 subtracted from:

272
Moisture1 Lower Center Upper -------+---------+---------+---------+--
35 -0.5665 0.5050 1.5765 (-----*----)
45 -0.8215 0.2500 1.3215 (----*-----)
55 0.4101 1.4817 2.5532 (----*-----)
65 0.6118 1.6833 2.7549 (----*-----)
75 1.4735 2.5450 3.6165 (-----*----)
-------+---------+---------+---------+--
-2.0 0.0 2.0 4.0
Moisture1 = 35 subtracted from:
Moisture1 Lower Center Upper -------+---------+---------+---------+--
45 -1.3265 -0.2550 0.8165 (-----*----)
55 -0.0949 0.9767 2.0482 (----*----)
65 0.1068 1.1783 2.2499 (----*----)
75 0.9685 2.0400 3.1115 (----*-----)
-------+---------+---------+---------+--
-2.0 0.0 2.0 4.0
Moisture1 = 45 subtracted from:
Moisture1 Lower Center Upper -------+---------+---------+---------+--
55 0.1601 1.2317 2.3032 (----*-----)
65 0.3618 1.4333 2.5049 (----*-----)
75 1.2235 2.2950 3.3665 (----*-----)
-------+---------+---------+---------+--
-2.0 0.0 2.0 4.0
Moisture1 = 55 subtracted from:
Moisture1 Lower Center Upper -------+---------+---------+---------+--
65 -0.8699 0.2017 1.2732 (----*----)
75 -0.0082 1.0633 2.1349 (----*-----)
-------+---------+---------+---------+--
-2.0 0.0 2.0 4.0
Moisture1 = 65 subtracted from:
Moisture1 Lower Center Upper -------+---------+---------+---------+--
75 -0.2099 0.8617 1.9332 (----*-----)
-------+---------+---------+---------+--
-2.0 0.0 2.0 4.0
One-way ANOVA: Propionic acid versus Moisture Source DF SS MS F P
Moisture1 5 0.2407 0.0481 3.71 0.010
Error 30 0.3890 0.0130
Total 35 0.6296
S = 0.1139 R-Sq = 38.22% R-Sq(adj) = 27.93%
Individual 95% CIs For Mean Based on
Pooled StDev
Level N Mean StDev ---------+---------+---------+---------+

273
25 6 0.0000 0.0000 (--------*--------)
35 6 0.0000 0.0000 (--------*--------)
45 6 0.0000 0.0000 (--------*--------)
55 6 0.0000 0.0000 (--------*--------)
65 6 0.1783 0.2040 (---------*--------)
75 6 0.1683 0.1902 (---------*--------)
---------+---------+---------+---------+
0.00 0.10 0.20 0.30
Pooled StDev = 0.1139
Tukey 95% Simultaneous Confidence Intervals
All Pairwise Comparisons among Levels of Moisture1
Individual confidence level = 99.51%
Moisture1 = 25 subtracted from:
Moisture1 Lower Center Upper ---------+---------+---------+---------+
35 -0.1999 0.0000 0.1999 (---------*---------)
45 -0.1999 0.0000 0.1999 (---------*---------)
55 -0.1999 0.0000 0.1999 (---------*---------)
65 -0.0216 0.1783 0.3782 (---------*---------)
75 -0.0316 0.1683 0.3682 (---------*---------)
---------+---------+---------+---------+
-0.20 0.00 0.20 0.40
Moisture1 = 35 subtracted from:
Moisture1 Lower Center Upper ---------+---------+---------+---------+
45 -0.1999 0.0000 0.1999 (---------*---------)
55 -0.1999 0.0000 0.1999 (---------*---------)
65 -0.0216 0.1783 0.3782 (---------*---------)
75 -0.0316 0.1683 0.3682 (---------*---------)
---------+---------+---------+---------+
-0.20 0.00 0.20 0.40
Moisture1 = 45 subtracted from:
Moisture1 Lower Center Upper ---------+---------+---------+---------+
55 -0.1999 0.0000 0.1999 (---------*---------)
65 -0.0216 0.1783 0.3782 (---------*---------)
75 -0.0316 0.1683 0.3682 (---------*---------)
---------+---------+---------+---------+
-0.20 0.00 0.20 0.40
Moisture1 = 55 subtracted from:
Moisture1 Lower Center Upper ---------+---------+---------+---------+
65 -0.0216 0.1783 0.3782 (---------*---------)
75 -0.0316 0.1683 0.3682 (---------*---------)
---------+---------+---------+---------+
-0.20 0.00 0.20 0.40
Moisture1 = 65 subtracted from:

274
Moisture1 Lower Center Upper ---------+---------+---------+---------+
75 -0.2099 -0.0100 0.1899 (---------*--------)
---------+---------+---------+---------+
-0.20 0.00 0.20 0.40
One-way ANOVA: Isobutyric acid versus Moisture Source DF SS MS F P
Moisture1 5 11.413 2.283 5.35 0.001
Error 30 12.804 0.427
Total 35 24.217
S = 0.6533 R-Sq = 47.13% R-Sq(adj) = 38.32%
Individual 95% CIs For Mean Based on
Pooled StDev
Level N Mean StDev -------+---------+---------+---------+--
25 6 0.0833 0.0695 (-------*-------)
35 6 0.1917 0.0248 (-------*-------)
45 6 0.1883 0.1055 (-------*------)
55 6 1.2467 1.0385 (-------*-------)
65 6 0.6833 0.9640 (-------*-------)
75 6 1.5450 0.7324 (-------*-------)
-------+---------+---------+---------+--
0.00 0.70 1.40 2.10
Pooled StDev = 0.6533
Tukey 95% Simultaneous Confidence Intervals
All Pairwise Comparisons among Levels of Moisture1
Individual confidence level = 99.51%
Moisture1 = 25 subtracted from:
Moisture1 Lower Center Upper -------+---------+---------+---------+--
35 -1.0385 0.1083 1.2552 (-------*------)
45 -1.0418 0.1050 1.2518 (-------*------)
55 0.0165 1.1633 2.3102 (-------*------)
65 -0.5468 0.6000 1.7468 (-------*-------)
75 0.3148 1.4617 2.6085 (-------*------)
-------+---------+---------+---------+--
-1.5 0.0 1.5 3.0
Moisture1 = 35 subtracted from:
Moisture1 Lower Center Upper -------+---------+---------+---------+--
45 -1.1502 -0.0033 1.1435 (-------*-------)
55 -0.0918 1.0550 2.2018 (-------*-------)
65 -0.6552 0.4917 1.6385 (------*-------)
75 0.2065 1.3533 2.5002 (-------*-------)
-------+---------+---------+---------+--
-1.5 0.0 1.5 3.0
Moisture1 = 45 subtracted from:

275
Moisture1 Lower Center Upper -------+---------+---------+---------+--
55 -0.0885 1.0583 2.2052 (-------*-------)
65 -0.6518 0.4950 1.6418 (------*-------)
75 0.2098 1.3567 2.5035 (-------*-------)
-------+---------+---------+---------+--
-1.5 0.0 1.5 3.0
Moisture1 = 55 subtracted from:
Moisture1 Lower Center Upper -------+---------+---------+---------+--
65 -1.7102 -0.5633 0.5835 (------*-------)
75 -0.8485 0.2983 1.4452 (-------*-------)
-------+---------+---------+---------+--
-1.5 0.0 1.5 3.0
Moisture1 = 65 subtracted from:
Moisture1 Lower Center Upper -------+---------+---------+---------+--
75 -0.2852 0.8617 2.0085 (-------*------)
-------+---------+---------+---------+--
-1.5 0.0 1.5 3.0
One-way ANOVA: Butyric acid versus Moisture Source DF SS MS F P
Moisture1 5 16.714 3.343 13.44 0.000
Error 30 7.461 0.249
Total 35 24.174
S = 0.4987 R-Sq = 69.14% R-Sq(adj) = 63.99%
Individual 95% CIs For Mean Based on
Pooled StDev
Level N Mean StDev ------+---------+---------+---------+---
25 6 0.0000 0.0000 (-----*-----)
35 6 0.0000 0.0000 (-----*-----)
45 6 0.0000 0.0000 (-----*-----)
55 6 0.0483 0.1184 (-----*-----)
65 6 0.5067 0.8439 (-----*-----)
75 6 1.8733 0.8752 (-----*-----)
------+---------+---------+---------+---
0.00 0.70 1.40 2.10
Pooled StDev = 0.4987
Tukey 95% Simultaneous Confidence Intervals
All Pairwise Comparisons among Levels of Moisture1
Individual confidence level = 99.51%
Moisture1 = 25 subtracted from:
Moisture1 Lower Center Upper --------+---------+---------+---------+-
35 -0.8754 0.0000 0.8754 (-----*-----)
45 -0.8754 0.0000 0.8754 (-----*-----)
55 -0.8271 0.0483 0.9238 (-----*-----)

276
65 -0.3688 0.5067 1.3821 (----*-----)
75 0.9979 1.8733 2.7488 (----*-----)
--------+---------+---------+---------+-
-1.5 0.0 1.5 3.0
Moisture1 = 35 subtracted from:
Moisture1 Lower Center Upper --------+---------+---------+---------+-
45 -0.8754 0.0000 0.8754 (-----*-----)
55 -0.8271 0.0483 0.9238 (-----*-----)
65 -0.3688 0.5067 1.3821 (----*-----)
75 0.9979 1.8733 2.7488 (----*-----)
--------+---------+---------+---------+-
-1.5 0.0 1.5 3.0
Moisture1 = 45 subtracted from:
Moisture1 Lower Center Upper --------+---------+---------+---------+-
55 -0.8271 0.0483 0.9238 (-----*-----)
65 -0.3688 0.5067 1.3821 (----*-----)
75 0.9979 1.8733 2.7488 (----*-----)
--------+---------+---------+---------+-
-1.5 0.0 1.5 3.0
Moisture1 = 55 subtracted from:
Moisture1 Lower Center Upper --------+---------+---------+---------+-
65 -0.4171 0.4583 1.3338 (-----*-----)
75 0.9496 1.8250 2.7004 (-----*-----)
--------+---------+---------+---------+-
-1.5 0.0 1.5 3.0
Moisture1 = 65 subtracted from:
Moisture1 Lower Center Upper --------+---------+---------+---------+-
75 0.4912 1.3667 2.2421 (-----*-----)
--------+---------+---------+---------+-
-1.5 0.0 1.5 3.0

277
STATRISTICAL ANALYSIS (B)
ANOVA results showing differences in glucose yields across moisture
One-way ANOVA: IA glucose yield (% theoretical, at cellulase enzyme loading of 15FPU/g
glucan) versus moisture
Source DF SS MS F P
Moisture 5 146.11 29.22 14.88 0.000
Error 12 23.57 1.96
Total 17 169.68
S = 1.402 R-Sq = 86.11% R-Sq(adj) = 80.32%
Individual 95% CIs For Mean Based on
Pooled StDev
Level N Mean StDev -+---------+---------+---------+--------
25 3 27.530 1.034 (----*----)
35 3 24.696 0.728 (----*----)
45 3 25.563 2.226 (----*----)
55 3 20.980 2.194 (----*----)
65 3 23.883 0.130 (----*----)
75 3 18.989 0.635 (----*----)
-+---------+---------+---------+--------
17.5 21.0 24.5 28.0
Pooled StDev = 1.402
Tukey 95% Simultaneous Confidence Intervals
All Pairwise Comparisons among Levels of Moisture
Individual confidence level = 99.43%
Moisture = 25 subtracted from:
Moisture Lower Center Upper -+---------+---------+---------+--------
35 -6.677 -2.834 1.010 (-----*------)
45 -5.810 -1.967 1.877 (------*-----)
55 -10.393 -6.550 -2.706 (-----*-----)
65 -7.490 -3.647 0.197 (-----*-----)
75 -12.384 -8.541 -4.697 (------*-----)
-+---------+---------+---------+--------
-12.0 -6.0 0.0 6.0
Moisture = 35 subtracted from:
Moisture Lower Center Upper -+---------+---------+---------+--------
45 -2.977 0.867 4.710 (-----*------)
55 -7.560 -3.716 0.127 (------*-----)
65 -4.657 -0.813 3.030 (------*-----)
75 -9.551 -5.707 -1.864 (-----*------)
-+---------+---------+---------+--------
-12.0 -6.0 0.0 6.0

278
Moisture = 45 subtracted from:
Moisture Lower Center Upper -+---------+---------+---------+--------
55 -8.427 -4.583 -0.739 (-----*------)
65 -5.523 -1.680 2.164 (-----*------)
75 -10.417 -6.574 -2.730 (-----*-----)
-+---------+---------+---------+--------
-12.0 -6.0 0.0 6.0
Moisture = 55 subtracted from:
Moisture Lower Center Upper -+---------+---------+---------+--------
65 -0.940 2.903 6.747 (------*-----)
75 -5.834 -1.991 1.853 (------*-----)
-+---------+---------+---------+--------
-12.0 -6.0 0.0 6.0
Moisture = 65 subtracted from:
Moisture Lower Center Upper -+---------+---------+---------+--------
75 -8.738 -4.894 -1.051 (------*-----)
-+---------+---------+---------+--------
-12.0 -6.0 0.0 6.0
One-way ANOVA: PA glucose yield (% theoretical, at cellulase enzyme loading of
15FPU/g glucan) versus moisture
Source DF SS MS F P
Moisture 5 493.70 98.74 19.41 0.000
Error 12 61.06 5.09
Total 17 554.75
S = 2.256 R-Sq = 88.99% R-Sq(adj) = 84.41%
Individual 95% CIs For Mean Based on
Pooled StDev
Level N Mean StDev ---+---------+---------+---------+------
25 3 6.902 1.641 (----*---)
35 3 23.254 0.814 (----*---)
45 3 16.070 0.526 (----*----)
55 3 17.377 4.335 (----*----)
65 3 18.396 0.872 (----*---)
75 3 11.222 2.710 (----*---)
---+---------+---------+---------+------
6.0 12.0 18.0 24.0
Pooled StDev = 2.256
Tukey 95% Simultaneous Confidence Intervals
All Pairwise Comparisons among Levels of Moisture
Individual confidence level = 99.43%

279
Moisture = 25 subtracted from:
Moisture Lower Center Upper -----+---------+---------+---------+----
35 10.165 16.351 22.537 (-----*----)
45 2.982 9.168 15.354 (-----*----)
55 4.288 10.474 16.660 (----*----)
65 5.308 11.494 17.680 (-----*----)
75 -1.867 4.319 10.505 (-----*----)
-----+---------+---------+---------+----
-12 0 12 24
Moisture = 35 subtracted from:
Moisture Lower Center Upper -----+---------+---------+---------+----
45 -13.369 -7.183 -0.997 (----*----)
55 -12.063 -5.877 0.309 (----*----)
65 -11.044 -4.858 1.328 (----*----)
75 -18.218 -12.032 -5.846 (----*----)
-----+---------+---------+---------+----
-12 0 12 24
Moisture = 45 subtracted from:
Moisture Lower Center Upper -----+---------+---------+---------+----
55 -4.880 1.306 7.492 (----*----)
65 -3.860 2.326 8.512 (----*----)
75 -11.035 -4.849 1.337 (----*----)
-----+---------+---------+---------+----
-12 0 12 24
Moisture = 55 subtracted from:
Moisture Lower Center Upper -----+---------+---------+---------+----
65 -5.167 1.019 7.205 (----*----)
75 -12.341 -6.155 0.031 (----*----)
-----+---------+---------+---------+----
-12 0 12 24
Moisture = 65 subtracted from:
Moisture Lower Center Upper -----+---------+---------+---------+----
75 -13.360 -7.174 -0.988 (----*----)
-----+---------+---------+---------+----
-12 0 12 24

280
APPENDIX D: Impact of wet storage organic acids on pretreatment and
bioconversion of corn stover to ethanol
(Chapter 5)
This appendix contains supplementary materials to Chapter 5. This includes a flowchart of
sample processing and analysis, the experimental design, experimental data on pretreatment (pH,
organic acids, 5-HMF and furfural, glucan and xylan removal) as well as ethanol yields from
fermentation.
Figure D1: Flowchart of sample processing and analysis for determining effect of storage
organic acids on ethanol fermentation process

281
Table D1: Experimental design for examining effect of organic acids on fermentation
Dependent Variable: GLUCOSE YIELD
Independent Factors
Storage
Duration
(Days)
Nominal Moisture ContentNegative
Control
Positive
Control
25% 35% 45% 55% 65% 75%No
Feedstock
(Blanks)
Alpha-
cellulose
(Avicel)
Fermentation
Pretreatment
retention time
(min)
23oC 37oC 23oC 37oC 23oC 37oC 23oC 37oC 23oC 37oC 23oC 37oC
Corn stover
not washed
before
pretreatment
With
pretreatment
extract
50 2 reps 2 reps 2 reps 2 reps 2 reps 2 reps 2 reps 2 reps 2 reps 2 reps 2 reps 2 reps
2 reps 2 reps
220 2 reps 2 reps 2 reps 2 reps 2 reps 2 reps 2 reps 2 reps 2 reps 2 reps 2 reps 2 reps
100 2 reps 2 reps 2 reps 2 reps 2 reps 2 reps 2 reps 2 reps 2 reps 2 reps 2 reps 2 reps
220 2 reps 2 reps 2 reps 2 reps 2 reps 2 reps 2 reps 2 reps 2 reps 2 reps 2 reps 2 reps
150 2 reps 2 reps 2 reps 2 reps 2 reps 2 reps 2 reps 2 reps 2 reps 2 reps 2 reps 2 reps
220 2 reps 2 reps 2 reps 2 reps 2 reps 2 reps 2 reps 2 reps 2 reps 2 reps 2 reps 2 reps
Without
pretreatment
extract
50 2 reps * 2 reps * 2 reps * 2 reps * 2 reps * 2 reps *
2 reps 2 reps
220 2 reps * 2 reps * 2 reps * 2 reps * 2 reps * 2 reps *
100 2 reps * 2 reps * 2 reps * 2 reps * 2 reps * 2 reps *
220 2 reps * 2 reps * 2 reps * 2 reps * 2 reps * 2 reps *
150 2 reps * 2 reps * 2 reps * 2 reps * 2 reps * 2 reps *
220 2 reps * 2 reps * 2 reps * 2 reps * 2 reps * 2 reps *
Corn stover
Washed
before
pretreatment
With
pretreatment
extract
5 220 * 2 reps * 2 reps * 2 reps * 2 reps * 2 reps * 2 reps
2 reps 2 reps10 220 * 2 reps * 2 reps * 2 reps * 2 reps * 2 reps * 2 reps
15 220 * 2 reps * 2 reps * 2 reps * 2 reps * 2 reps * 2 reps
Without
pretreatment
extract
15 220 * 2 reps * 2 reps * 2 reps * 2 reps * 2 reps * 2 reps 2 reps 2 reps

282
Equation D1*:
(
)
Where: V72% = volume of concentrated sulfuric acid to add (mL)
C72% = concentration of 72% (w/w) sulfuric acid (1173.6 g/L)
C4% = concentration of 4% (w/w) sulfuric acid (41 g/L)
Vi = initial volume of sample (mL)
[H+] = concentration of hydrogen ions in sample = 10-pH
(moles/L)
98.08 = molar mass of sulfuric acid (H2SO4)
2 = number of moles of H+ in 1 mole of sulfuric acid
* Sluiter, A., Hames, B., Ruiz, R., Scarlata, C., Sluiter, J., and Templeton, D. (2008). "Determination of sugars,
byproducts, and degradation products in liquid fraction process samples." National Renewable Energy Laboratory,
Tech. Report NREL/TP-510-42623. http://www.nrel.gov/biomass/pdfs/42623.pdf

283
Table D2: Sugar removal and inhibitors generated during pretreatment of unwashed and washed
37oC samples†
Storage Duration
Pretreatment retention time (min)
Nominal storage
moisture (%)
Glucan removed (%)
Xylan removed (%)
Furfural generated (%)
HMF generated (%)
Day 220
5 25 3.76 ± 0.50 23.94 ± 2.74 0.31 ± 0.31 0.03 ± 0.03
5 35 3.08 ± 0.61 22.75 ± 2.64 0.16 ± 0.04 0.03 ± 0.01
5 45 3.18 ± 0.20 30.15 ± 2.86 0.32 ± 0.13 0.05 ± 0.02
5 55 3.02 ± 0.07 27.63 ± 0.72 0.22 ± 0.12 0.03 ± 0.01
5 65 2.68 ± 0.14 24.37 ± 1.19 0.12 ± 0.01 0.01 ± 0.00
5 75 2.07 ± 0.21 18.86 ± 1.25 0.19 ± 0.04 0.02 ± 0.01
10 25 3.71 ± 0.04 27.14 ± 0.33 0.33 ± 0.04 0.03 ± 0.00
10 35 2.94 ± 0.20 23.36 ± 0.95 0.41 ± 0.01 0.05 ± 0.01
10 45 2.88 ± 0.15 29.03 ± 1.42 0.54 ± 0.16 0.06 ± 0.01
10 55 2.96 ± 0.01 28.09 ± 0.83 0.38 ± 0.21 0.03 ± 0.01
10 65 2.88 ± 0.33 25.24 ± 1.85 0.33 ± 0.01 0.02 ± 0.00
10 75 2.81 ± 0.20 27.01 ± 1.39 0.41 ± 0.11 0.03 ± 0.01
15 25 2.74 ± 1.23 21.93 ± 5.78 0.60 ± 0.12 0.05 ± 0.01
15 35 2.80 ± 0.04 22.74 ± 1.54 0.35 ± 0.40 0.04 ± 0.03
15 45 2.89 ± 0.04 24.81 ± 1.57 0.78 ± 0.01 0.06 ± 0.00
15 55 3.18 ± 0.16 26.96 ± 1.01 0.54 ± 0.44 0.05 ± 0.04
15 65 2.74 ± 0.01 23.62 ± 2.34 0.30 ± 0.23 0.02 ± 0.01
15 75 2.53 ± 0.18 23.28 ± 2.35 0.50 ± 0.20 0.04 ± 0.01
WASHED
15 25 3.43 ± 0.55 31.75 ± 1.95 0.93 ± 0.05 ND*
15 35 3.41 ± 0.52 38.62 ± 6.75 1.20 ± 0.10 ND
15 45 3.32 ± 0.34 39.60 ± 5.13 1.33 ± 0.06 ND
15 55 3.24 ± 0.37 36.97 ± 2.72 1.41 ± 0.02 ND
15 65 2.67 ± 0.14 32.77 ± 0.88 1.19 ± 0.06 ND
15 75 2.74 ± 0.41 32.85 ± 1.53 0.69 ± 0.01 ND
† Washed data are for samples fermented without extract. The data for washed samples fermented with extract at 5,
10 and 15 minutes was missing. Glucan and xylan removal are percentage of the total glucan (or xylan) polymer in
the feedstock before pretreatment. Furfural and HMF generated are percentage of dry matter. Same definitions apply
to Table D3.
*ND = Not detected
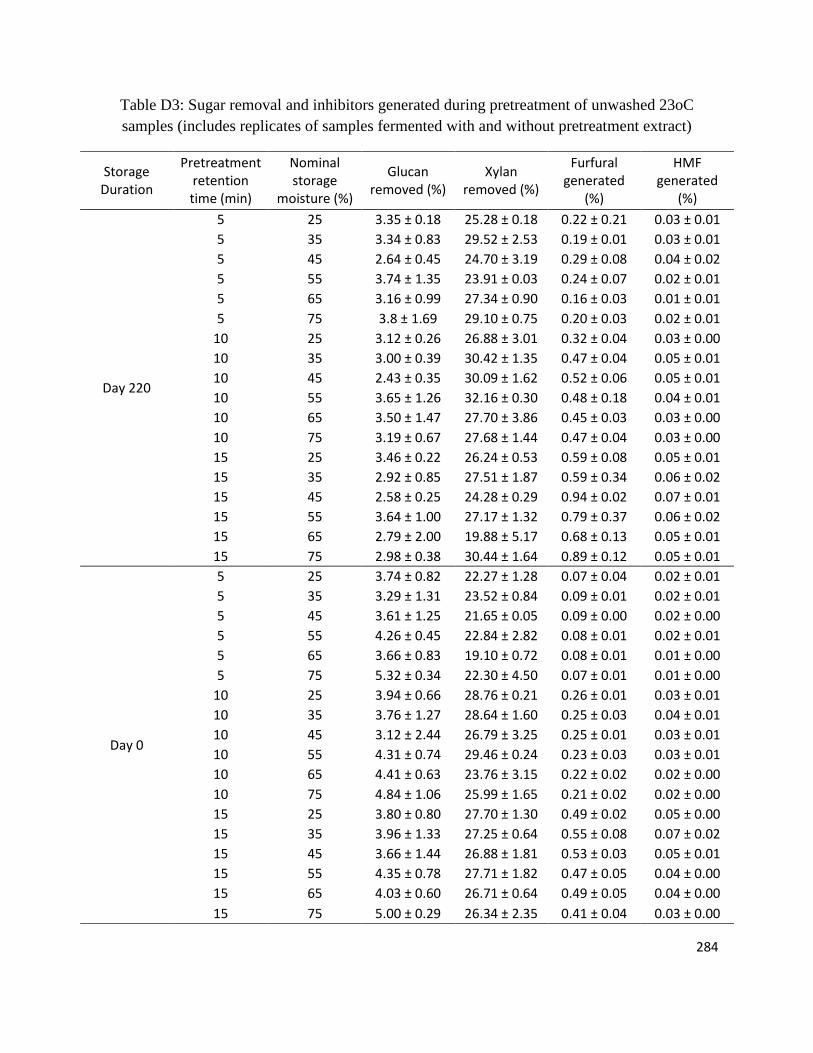
284
Table D3: Sugar removal and inhibitors generated during pretreatment of unwashed 23oC
samples (includes replicates of samples fermented with and without pretreatment extract)
Storage Duration
Pretreatment retention time (min)
Nominal storage
moisture (%)
Glucan removed (%)
Xylan removed (%)
Furfural generated
(%)
HMF generated
(%)
Day 220
5 25 3.35 ± 0.18 25.28 ± 0.18 0.22 ± 0.21 0.03 ± 0.01
5 35 3.34 ± 0.83 29.52 ± 2.53 0.19 ± 0.01 0.03 ± 0.01
5 45 2.64 ± 0.45 24.70 ± 3.19 0.29 ± 0.08 0.04 ± 0.02
5 55 3.74 ± 1.35 23.91 ± 0.03 0.24 ± 0.07 0.02 ± 0.01
5 65 3.16 ± 0.99 27.34 ± 0.90 0.16 ± 0.03 0.01 ± 0.01
5 75 3.8 ± 1.69 29.10 ± 0.75 0.20 ± 0.03 0.02 ± 0.01
10 25 3.12 ± 0.26 26.88 ± 3.01 0.32 ± 0.04 0.03 ± 0.00
10 35 3.00 ± 0.39 30.42 ± 1.35 0.47 ± 0.04 0.05 ± 0.01
10 45 2.43 ± 0.35 30.09 ± 1.62 0.52 ± 0.06 0.05 ± 0.01
10 55 3.65 ± 1.26 32.16 ± 0.30 0.48 ± 0.18 0.04 ± 0.01
10 65 3.50 ± 1.47 27.70 ± 3.86 0.45 ± 0.03 0.03 ± 0.00
10 75 3.19 ± 0.67 27.68 ± 1.44 0.47 ± 0.04 0.03 ± 0.00
15 25 3.46 ± 0.22 26.24 ± 0.53 0.59 ± 0.08 0.05 ± 0.01
15 35 2.92 ± 0.85 27.51 ± 1.87 0.59 ± 0.34 0.06 ± 0.02
15 45 2.58 ± 0.25 24.28 ± 0.29 0.94 ± 0.02 0.07 ± 0.01
15 55 3.64 ± 1.00 27.17 ± 1.32 0.79 ± 0.37 0.06 ± 0.02
15 65 2.79 ± 2.00 19.88 ± 5.17 0.68 ± 0.13 0.05 ± 0.01
15 75 2.98 ± 0.38 30.44 ± 1.64 0.89 ± 0.12 0.05 ± 0.01
Day 0
5 25 3.74 ± 0.82 22.27 ± 1.28 0.07 ± 0.04 0.02 ± 0.01
5 35 3.29 ± 1.31 23.52 ± 0.84 0.09 ± 0.01 0.02 ± 0.01
5 45 3.61 ± 1.25 21.65 ± 0.05 0.09 ± 0.00 0.02 ± 0.00
5 55 4.26 ± 0.45 22.84 ± 2.82 0.08 ± 0.01 0.02 ± 0.01
5 65 3.66 ± 0.83 19.10 ± 0.72 0.08 ± 0.01 0.01 ± 0.00
5 75 5.32 ± 0.34 22.30 ± 4.50 0.07 ± 0.01 0.01 ± 0.00
10 25 3.94 ± 0.66 28.76 ± 0.21 0.26 ± 0.01 0.03 ± 0.01
10 35 3.76 ± 1.27 28.64 ± 1.60 0.25 ± 0.03 0.04 ± 0.01
10 45 3.12 ± 2.44 26.79 ± 3.25 0.25 ± 0.01 0.03 ± 0.01
10 55 4.31 ± 0.74 29.46 ± 0.24 0.23 ± 0.03 0.03 ± 0.01
10 65 4.41 ± 0.63 23.76 ± 3.15 0.22 ± 0.02 0.02 ± 0.00
10 75 4.84 ± 1.06 25.99 ± 1.65 0.21 ± 0.02 0.02 ± 0.00
15 25 3.80 ± 0.80 27.70 ± 1.30 0.49 ± 0.02 0.05 ± 0.00
15 35 3.96 ± 1.33 27.25 ± 0.64 0.55 ± 0.08 0.07 ± 0.02
15 45 3.66 ± 1.44 26.88 ± 1.81 0.53 ± 0.03 0.05 ± 0.01
15 55 4.35 ± 0.78 27.71 ± 1.82 0.47 ± 0.05 0.04 ± 0.00
15 65 4.03 ± 0.60 26.71 ± 0.64 0.49 ± 0.05 0.04 ± 0.00
15 75 5.00 ± 0.29 26.34 ± 2.35 0.41 ± 0.04 0.03 ± 0.00

285
Table D4: Organic acids and pH after pretreatment of unwashed 23oC samples
Storage duration
Pretreatment retention time (min)
Nominal storage
moisture (%) pH
Acetic acid
(% DM) Lactic acid
(% DM)
Isobutyric acid
(% DM)
Formic acid
(% DM) Malic acid
(% DM)
Pyruvic acid
(% DM)
Tartaric acid
(% DM) Total acids
(% DM)
Day 220
5 25 4.52 ± 0.19 0.69 ± 0.18 1.68 ± 0.15 1.15 ± 0.57 0.2 ± 0.08 0.12 ± 0.09 0.22 ± 0.11 0.72 ± 0.69 4.78 ± 0.84
5 35 4.44 ± 0.07 0.53 ± 0.14 2.38 ± 0.58 1.1 ± 0.37 0.17 ± 0.06 0.23 ± 0.06 0.24 ± 0.06 0.31 ± 0.09 4.94 ± 0.80
5 45 4.24 ± 0.07 0.55 ± 0.23 3.15 ± 0.26 1.46 ± 0.41 0.18 ± 0.06 0.93 ± 1.66 0.26 ± 0.14 0.26 ± 0.17 6.78 ± 2.30
5 55 4.21 ± 0.09 0.35 ± 0.25 3.60 ± 0.17 1.18 ± 0.15 0.15 ± 0.02 0.67 ± 1.11 0.23 ± 0.14 0.18 ± 0.16 6.36 ± 0.74
5 65 4.43 ± 0.06 0.48 ± 0.02 3.41 ± 0.24 0.00 ± 0.00 0.13 ± 0.01 0.05 ± 0.01 0.14 ± 0.00 0.01 ± 0.01 4.20 ± 0.23
5 75 4.37 ± 0.03 0.53 ± 0.05 3.46 ± 0.05 0.00 ± 0.00 0.14 ± 0.01 0.08 ± 0.01 0.14 ± 0.01 0.03 ± 0.01 4.40 ± 0.03
10 25 4.36 ± 0.05 0.55 ± 0.36 1.76 ± 0.19 1.30 ± 0.06 0.21 ± 0.01 0.14 ± 0.02 0.21 ± 0.05 0.39 ± 0.26 4.55 ± 0.19
10 35 4.28 ± 0.05 0.79 ± 0.07 2.87 ± 0.36 1.77 ± 0.09 0.26 ± 0.03 0.19 ± 0.04 0.23 ± 0.05 0.35 ± 0.10 6.46 ± 0.49
10 45 4.15 ± 0.05 0.46 ± 0.54 3.12 ± 0.09 2.08 ± 0.51 0.17 ± 0.11 1.16 ± 1.53 0.28 ± 0.15 0.09 ± 0.11 7.36 ± 2.12
10 55 4.15 ± 0.12 0.39 ± 0.39 3.52 ± 0.21 1.59 ± 0.41 0.19 ± 0.05 0.78 ± 0.81 0.40 ± 0.17 0.00 ± 0.00 6.88 ± 1.18
10 65 4.26 ± 0.07 0.46 ± 0.33 2.14 ± 1.54 1.20 ± 0.99 1.1 ± 0.99 1.86 ± 1.92 0.10 ± 0.11 0.8 ± 1.45 7.66 ± 1.44
10 75 4.19 ± 0.10 0.86 ± 0.03 3.46 ± 0.30 2.52 ± 0.19 0.29 ± 0.05 0.31 ± 0.21 0.16 ± 0.01 0.03 ± 0.01 7.63 ± 0.45
15 25 4.35 ± 0.17 0.87 ± 0.06 1.71 ± 0.25 1.83 ± 0.35 0.27 ± 0.05 0.23 ± 0.03 0.23 ± 0.04 0.34 ± 0.18 5.47 ± 0.47
15 35 4.21 ± 0.21 0.88 ± 0.61 2.50 ± 0.40 2.30 ± 1.13 0.34 ± 0.13 0.36 ± 0.25 0.25 ± 0.03 0.20 ± 0.10 6.83 ± 2.40
15 45 4.11 ± 0.07 0.62 ± 0.31 3.29 ± 0.07 2.29 ± 0.30 0.29 ± 0.04 0.58 ± 0.48 0.2 ± 0.020 0.35 ± 0.15 7.61 ± 0.96
15 55 4.11 ± 0.16 0.50 ± 0.46 3.79 ± 0.11 2.20 ± 0.79 0.26 ± 0.09 1.68 ± 1.51 0.28 ± 0.17 0.05 ± 0.10 8.76 ± 2.19
15 65 4.14 ± 0.15 1.00 ± 0.11 3.59 ± 0.23 2.26 ± 0.61 0.36 ± 0.06 0.67 ± 0.32 0.20 ± 0.02 0.01 ± 0.01 8.08 ± 0.86
15 75 4.18 ± 0.18 1.04 ± 0.08 3.61 ± 0.20 2.93 ± 0.79 0.36 ± 0.03 1.00 ± 0.52 0.19 ± 0.01 0.00 ± 0.00 9.15 ± 0.92

286
Table D4 cont:
Storage duration
Pretreatment retention time (min)
Nominal storage
moisture (%) pH
Acetic acid
(% DM) Lactic acid
(% DM)
Isobutyric acid
(% DM)
Formic acid
(% DM) Malic acid
(% DM)
Pyruvic acid
(% DM)
Tartaric acid
(% DM) Total acids
(% DM)
Day 0
5 25 4.64 ± 0.06 0.76 ± 0.22 0.00 ± 0.00 0.61 ± 0.19 0.13 ± 0.08 0.12 ± 0.06 0.20 ± 0.28 0.58 ± 0.96 2.40 ± 1.61
5 35 4.61 ± 0.09 0.83 ± 0.21 0.00 ± 0.00 0.49 ± 0.07 0.16 ± 0.03 0.13 ± 0.04 0.48 ± 0.03 0.83 ± 0.12 2.91 ± 0.37
5 45 4.62 ± 0.09 0.86 ± 0.14 0.35 ± 0.49 0.77 ± 0.34 0.17 ± 0.02 0.19 ± 0.02 0.35 ± 0.13 0.75 ± 0.88 3.43 ± 1.12
5 55 4.64 ± 0.08 0.91 ± 0.12 0.27 ± 0.35 0.74 ± 0.17 0.15 ± 0.02 0.1 ± 0.03 0.36 ± 0.10 1.08 ± 0.31 3.60 ± 0.71
5 65 4.61 ± 0.15 0.79 ± 0.39 0.00 ± 0.00 0.74 ± 0.12 0.12 ± 0.08 0.07 ± 0.02 1.46 ± 0.80 2.76 ± 0.73 5.93 ± 1.37
5 75 4.71 ± 0.03 1.21 ± 0.33 0.00 ± 0.01 0.82 ± 0.11 0.32 ± 0.33 0.07 ± 0.03 0.79 ± 0.43 1.67 ± 1.84 4.88 ± 2.78
10 25 4.43 ± 0.07 0.99 ± 0.13 0.00 ± 0.02 1.18 ± 0.23 0.26 ± 0.02 0.22 ± 0.03 0.50 ± 0.22 0.33 ± 0.43 3.47 ± 0.53
10 35 4.37 ± 0.07 0.95 ± 0.05 0.28 ± 0.55 1.24 ± 0.4 0.23 ± 0.04 0.19 ± 0.07 0.43 ± 0.11 0.75 ± 0.26 4.07 ± 0.85
10 45 4.39 ± 0.08 1.02 ± 0.17 0.21 ± 0.33 1.28 ± 0.41 0.27 ± 0.03 0.31 ± 0.15 0.31 ± 0.07 0.06 ± 0.07 3.44 ± 0.49
10 55 4.44 ± 0.07 0.98 ± 0.12 0.34 ± 0.40 1.31 ± 0.25 0.24 ± 0.03 0.2 ± 0.08 0.35 ± 0.09 0.16 ± 0.23 3.57 ± 0.36
10 65 4.4 ± 0.12 0.82 ± 0.37 0.00 ± 0.00 1.88 ± 1.35 0.83 ± 0.91 0.94 ± 1.56 1.49 ± 1.04 0.88 ± 1.59 6.84 ± 4.42
10 75 4.5 ± 0.06 1.41 ± 0.50 0.00 ± 0.01 1.32 ± 0.39 0.55 ± 0.58 0.82 ± 1.4 0.49 ± 0.59 0.18 ± 0.22 4.76 ± 3.20
15 25 4.26 ± 0.05 1.22 ± 0.20 0.00 ± 0.02 2.06 ± 0.15 0.28 ± 0.13 0.28 ± 0.04 0.37 ± 0.05 0.56 ± 0.47 4.76 ± 0.32
15 35 4.26 ± 0.09 1.19 ± 0.15 0.56 ± 0.65 2.14 ± 0.57 0.36 ± 0.11 0.35 ± 0.09 0.42 ± 0.15 0.62 ± 0.17 5.63 ± 1.44
15 45 4.23 ± 0.08 1.30 ± 0.27 0.28 ± 0.36 2.44 ± 0.34 0.31 ± 0.05 0.45 ± 0.29 0.37 ± 0.02 0.42 ± 0.22 5.58 ± 0.93
15 55 4.28 ± 0.05 1.29 ± 0.19 0.30 ± 0.34 2.04 ± 0.29 0.34 ± 0.03 0.25 ± 0.05 0.29 ± 0.06 0.58 ± 0.1 5.09 ± 0.87
15 65 4.28 ± 0.02 1.20 ± 0.57 0.00 ± 0.00 2.30 ± 0.24 0.40 ± 0.03 0.22 ± 0.04 0.15 ± 0.17 0.61 ± 0.04 4.86 ± 0.44
15 75 4.30 ± 0.03 1.39 ± 0.14 0.00 ± 0.01 2.29 ± 0.23 0.38 ± 0.02 0.22 ± 0.04 0.23 ± 0.03 0.56 ± 0.05 5.08 ± 0.32

287
Table D5: Organic acids and pH after pretreatment of unwashed and washed 37oC samples (ND = Not detected)
Storage duration
Pretreatment retention time (min)
Nominal storage
moisture (%) pH
Acetic acid
(% DM) Lactic acid
(% DM)
Isobutyric acid
(% DM)
Formic acid
(% DM) Malic acid
(% DM)
Pyruvic acid
(% DM)
Tartaric acid
(% DM) Total acids
(% DM)
Day 220
5 25 4.50 ± 0.05 0.71 ± 0.33 1.73 ± 0.28 1.22 ± 0.99 0.21 ± 0.14 0.15 ± 0.14 0.23 ± 0.01 0.85 ± 0.83 5.11 ± 1.05
5 35 4.45 ± 0.06 0.44 ± 0.02 2.27 ± 0.72 0.80 ± 0.17 0.12 ± 0.02 0.16 ± 0.01 0.20 ± 0.01 0.26 ± 0.02 4.24 ± 0.86
5 45 4.30 ± 0.09 0.65 ± 0.38 3.08 ± 0.15 1.60 ± 0.72 0.21 ± 0.10 1.79 ± 2.42 0.33 ± 0.20 0.16 ± 0.22 7.82 ± 3.74
5 55 4.28 ± 0.01 0.23 ± 0.32 3.80 ± 0.53 1.13 ± 0.28 0.14 ± 0.04 1.18 ± 1.48 0.30 ± 0.17 0.09 ± 0.13 6.88 ± 0.35
5 65 4.16 ± 0.01 0.40 ± 0.04 2.89 ± 0.06 0.00 ± 0.00 0.11 ± 0.01 0.04 ± 0.00 0.12 ± 0.00 0.01 ± 0.01 3.56 ± 0.00
5 75 4.69 ± 0.03 0.53 ± 0.11 3.45 ± 0.48 0.00 ± 0.01 0.15 ± 0.04 0.09 ± 0.01 0.14 ± 0.05 0.04 ± 0.03 4.40 ± 0.72
10 25 4.34 ± 0.03 0.40 ± 0.57 1.91 ± 0.26 1.29 ± 0.01 0.21 ± 0.00 0.14 ± 0.03 0.22 ± 0.06 0.27 ± 0.38 4.46 ± 0.34
10 35 4.30 ± 0.01 0.74 ± 0.16 2.83 ± 0.59 1.65 ± 0.22 0.25 ± 0.05 0.19 ± 0.04 0.22 ± 0.03 0.27 ± 0.09 6.15 ± 0.94
10 45 4.18 ± 0.00 0.53 ± 0.74 3.52 ± 0.61 1.89 ± 0.48 0.27 ± 0.09 0.39 ± 0.12 0.24 ± 0.01 0.20 ± 0.01 7.04 ± 1.82
10 55 4.15 ± 0.04 0.37 ± 0.52 3.77 ± 0.14 1.42 ± 0.59 0.18 ± 0.09 1.33 ± 1.49 0.35 ± 0.28 0.00 ± 0.00 7.42 ± 3.12
10 65 4.03 ± 0.02 0.55 ± 0.08 2.96 ± 0.09 1.46 ± 0.07 0.10 ± 0.14 1.07 ± 1.18 0.26 ± 0.21 0.01 ± 0.01 6.41 ± 1.78
10 75 4.51 ± 0.03 0.78 ± 0.26 3.61 ± 0.86 2.15 ± 0.64 0.29 ± 0.16 0.62 ± 0.40 0.15 ± 0.03 0.01 ± 0.02 7.62 ± 1.56
15 25 4.23 ± 0.08 0.87 ± 0.06 1.63 ± 0.35 1.88 ± 0.39 0.28 ± 0.05 0.21 ± 0.02 0.23 ± 0.05 0.22 ± 0.21 5.32 ± 0.72
15 35 4.09 ± 0.01 0.40 ± 0.56 2.16 ± 0.50 1.31 ± 1.08 0.21 ± 0.13 0.29 ± 0.34 0.19 ± 0.02 0.13 ± 0.12 4.67 ± 2.75
15 45 3.96 ± 0.00 0.66 ± 0.10 2.72 ± 0.03 1.96 ± 0.07 0.24 ± 0.00 0.68 ± 0.53 0.17 ± 0.01 0.30 ± 0.19 6.72 ± 0.92
15 55 4.01 ± 0.01 0.43 ± 0.61 3.60 ± 0.20 1.66 ± 1.01 0.20 ± 0.13 0.75 ± 0.42 0.18 ± 0.05 0.10 ± 0.14 6.93 ± 1.73
15 65 3.90 ± 0.03 0.59 ± 0.21 3.05 ± 0.51 0.86 ± 1.22 0.22 ± 0.12 0.29 ± 0.17 0.16 ± 0.01 0.01 ± 0.01 5.18 ± 1.19
15 75 4.37 ± 0.08 0.87 ± 0.23 3.50 ± 0.28 1.32 ± 1.87 0.31 ± 0.02 0.69 ± 0.63 0.18 ± 0.03 0.00 ± 0.00 6.87 ± 2.49
WASHED
Day 220
15 25 4.00 ± 0.01 0.83 ± 0.08 0.29 ± 0.01 ND 0.38 ± 0.02 1.78 ± 2.10 0.23 ± 0.15 ND 3.51 ± 2.14
15 35 3.96 ± 0.01 0.89 ± 0.00 0.37 ± 0.09 ND 0.34 ± 0.01 1.93 ± 2.23 0.22 ± 0.17 ND 3.74 ± 2.51
15 45 3.95 ± 0.06 0.87 ± 0.01 0.38 ± 0.09 ND 0.38 ± 0.04 2.42 ± 2.83 0.08 ± 0.04 ND 4.13 ± 2.93
15 55 3.86 ± 0.01 0.91 ± 0.02 0.32 ± 0.01 ND 0.31 ± 0.00 2.90 ± 2.23 0.23 ± 0.11 ND 4.67 ± 2.31
15 65 3.82 ± 0.02 0.79 ± 0.04 0.41 ± 0.14 ND 0.28 ± 0.03 3.26 ± 0.10 0.30 ± 0.02 ND 5.04 ± 0.02
15 75 3.96 ± 0.00 0.93 ± 0.06 0.17 ± 0.07 ND 0.34 ± 0.03 0.37 ± 0.01 0.09 ± 0.00 ND 2 .00 ±0.10

288
Table D6: Concentration of potential inhibitors in pretreatment extract of unwashed samples
stored at 23oC†
† Includes data from replicates to be fermented with and without the pretreatment extract
Storage
duration
Pretreat
ment
retention
time
(min)
Nominal
storage
moisture
(%)
Lactic acid
(g/L)
Acetic acid
(g/L)
Isobutyric
acid (g/L) HMF (g/L) Furfural (g/L)
5 25 2.12 + 0.22 0.87 + 0.22 1.44 + 0.73 0.04 + 0.02 0.28 + 0.26
5 35 2.74 + 0.51 0.61 + 0.06 1.30 + 0.53 0.04 + 0.01 0.23 + 0.02
5 45 3.99 + 0.25 0.68 + 0.25 1.84 + 0.42 0.05 + 0.02 0.36 + 0.07
5 55 4.86 + 0.40 0.50 + 0.37 1.61 + 0.38 0.03 + 0.01 0.34 + 0.13
5 65 4.15 + 0.06 0.58 + 0.05 0.00 + 0.00 0.02 + 0.01 0.20 + 0.03
5 75 4.27 + 0.14 0.65 + 0.09 0.00 + 0.00 0.02 + 0.00 0.24 + 0.04
10 25 2.23 + 0.41 0.71 + 0.48 1.63 + 0.07 0.04 + 0.00 0.40 + 0.03
10 35 3.54 + 0.70 0.98 + 0.16 2.17 + 0.25 0.06 + 0.01 0.58 + 0.03
10 45 3.95 + 0.43 0.62 + 0.72 2.61 + 0.56 0.06 + 0.01 0.66 + 0.10
10 55 4.38 + 0.32 0.51 + 0.50 1.99 + 0.54 0.05 + 0.01 0.60 + 0.22
10 65 2.67 + 1.92 0.58 + 0.41 1.51 + 1.22 0.04 + 0.00 0.56 + 0.01
10 75 4.73 + 0.31 1.18 + 0.09 3.44 + 0.35 0.04 + 0.01 0.63 + 0.05
15 25 2.12 + 0.21 1.08 + 0.06 2.28 + 0.44 0.07 + 0.01 0.73 + 0.08
15 35 3.14 + 0.48 1.12 + 0.78 2.92 + 1.46 0.07 + 0.03 0.75 + 0.43
15 45 3.94 + 0.10 0.74 + 0.38 2.74 + 0.34 0.09 + 0.01 1.13 + 0.03
15 55 4.41 + 0.14 0.58 + 0.54 2.58 + 0.95 0.07 + 0.03 0.93 + 0.44
15 65 4.70 + 0.16 1.31 + 0.19 3.00 + 0.95 0.06 + 0.01 0.90 + 0.21
15 75 4.32 + 0.21 1.25 + 0.15 3.52 + 0.96 0.07 + 0.01 1.07 + 0.12
5 25 0.00 + 0.00 0.91 + 0.24 0.73 + 0.21 0.02 + 0.01 0.07 + 0.05
5 35 0.00 + 0.00 0.97 + 0.25 0.56 + 0.07 0.03 + 0.01 0.11 + 0.01
5 45 0.45 + 0.64 1.05 + 0.16 0.94 + 0.44 0.02 + 0.01 0.11 + 0.01
5 55 0.32 + 0.43 1.08 + 0.16 0.90 + 0.22 0.02 + 0.01 0.10 + 0.01
5 65 0.00 + 0.00 1.00 + 0.53 0.92 + 0.18 0.01 + 0.00 0.09 + 0.00
5 75 0.00 + 0.00 1.46 + 0.45 0.98 + 0.15 0.01 + 0.00 0.08 + 0.01
10 25 0.00 + 0.00 1.20 + 0.15 1.44 + 0.34 0.04 + 0.01 0.31 + 0.01
10 35 0.33 + 0.66 1.16 + 0.05 1.52 + 0.45 0.04 + 0.01 0.31 + 0.03
10 45 0.28 + 0.45 1.26 + 0.16 1.61 + 0.63 0.04 + 0.01 0.31 + 0.02
10 55 0.41 + 0.47 1.24 + 0.14 1.64 + 0.25 0.03 + 0.00 0.29 + 0.02
10 65 0.00 + 0.00 1.09 + 0.48 2.59 + 1.96 0.03 + 0.00 0.30 + 0.02
10 75 0.00 + 0.00 1.74 + 0.60 1.64 + 0.56 0.02 + 0.01 0.26 + 0.03
15 25 0.00 + 0.00 1.49 + 0.27 2.52 + 0.15 0.06 + 0.00 0.60 + 0.01
15 35 0.68 + 0.79 1.43 + 0.20 2.59 + 0.76 0.08 + 0.03 0.66 + 0.11
15 45 0.34 + 0.43 1.66 + 0.43 3.09 + 0.56 0.07 + 0.01 0.67 + 0.05
15 55 0.36 + 0.41 1.62 + 0.27 2.55 + 0.23 0.05 + 0.00 0.58 + 0.03
15 65 0.00 + 0.00 1.54 + 0.77 2.91 + 0.19 0.06 + 0.01 0.62 + 0.03
15 75 0.00 + 0.00 1.73 + 0.27 2.84 + 0.29 0.04 + 0.01 0.52 + 0.03
Day 220
Day 0

289
Table D7: Concentration of potential inhibitors in pretreatment extract of unwashed and washed
samples stored at 37oC
Storage
duration
Pretreat
ment
retention
time
(min)
Nominal
storage
moisture
(%)
Lactic acid
(g/L)
Acetic acid
(g/L)
Isobutyric
acid (g/L) HMF (g/L) Furfural (g/L)
5 25 2.28 + 0.25 0.93 + 0.38 1.58 + 1.22 0.04 + 0.03 0.40 + 0.40
5 35 2.93 + 0.66 0.58 + 0.08 1.04 + 0.12 0.03 + 0.00 0.21 + 0.04
5 45 3.79 + 0.20 0.78 + 0.38 1.93 + 0.68 0.06 + 0.02 0.39 + 0.12
5 55 4.53 + 0.65 0.28 + 0.39 1.35 + 0.34 0.03 + 0.00 0.26 + 0.13
5 65 4.03 + 0.00 0.56 + 0.06 0.00 + 0.00 0.02 + 0.01 0.17 + 0.03
5 75 4.46 + 0.26 0.68 + 0.08 0.00 + 0.00 0.02 + 0.00 0.24 + 0.03
10 25 2.55 + 0.52 0.56 + 0.79 1.71 + 0.11 0.04 + 0.00 0.43 + 0.01
10 35 3.90 + 0.78 1.03 + 0.22 2.28 + 0.29 0.07 + 0.01 0.58 + 0.02
10 45 4.17 + 0.69 0.62 + 0.88 2.24 + 0.56 0.07 + 0.01 0.64 + 0.18
10 55 4.49 + 0.30 0.45 + 0.63 1.71 + 0.76 0.04 + 0.01 0.46 + 0.27
10 65 4.32 + 0.51 0.81 + 0.19 2.13 + 0.28 0.03 + 0.00 0.48 + 0.04
10 75 4.61 + 0.78 0.99 + 0.27 2.74 + 0.64 0.04 + 0.01 0.52 + 0.11
15 25 2.09 + 0.28 1.13 + 0.02 2.42 + 0.31 0.07 + 0.01 0.76 + 0.10
15 35 3.13 + 0.83 0.59 + 0.83 1.91 + 1.63 0.06 + 0.04 0.52 + 0.59
15 45 3.73 + 0.04 0.90 + 0.13 2.68 + 0.08 0.09 + 0.01 1.07 + 0.01
15 55 4.31 + 0.20 0.52 + 0.73 1.99 + 1.20 0.06 + 0.04 0.64 + 0.52
15 65 4.34 + 0.43 0.86 + 0.35 1.29 + 1.82 0.04 + 0.02 0.44 + 0.36
15 75 4.39 + 0.07 1.11 + 0.36 1.74 + 2.45 0.05 + 0.02 0.64 + 0.29
Lactic acid
(g/L)
Acetic acid
(g/L)
Malic acid
(g/L) HMF (g/L) Furfural (g/L)
15 25 0.33 + 0.01 0.95 + 0.10 2.02 + 2.38 ND 1.06 + 0.07
15 35 0.42 + 0.10 1.01 + 0.01 2.17 + 2.51 ND 1.36 + 0.10
15 45 0.44 + 0.10 0.99 + 0.01 2.78 + 3.25 ND 1.53 + 0.06
15 55 0.36 + 0.02 1.03 + 0.02 3.30 + 2.54 ND 1.60 + 0.02
15 65 0.48 + 0.16 0.92 + 0.05 3.81 + 0.13 ND 1.39 + 0.07
15 75 0.20 + 0.08 1.08 + 0.05 0.43 + 0.00 ND 0.80 + 0.02
Day 220
WASHED

290
Table D8: Summary stats on concentration of potential inhibitors in unwashed samples stored at
23oC
Concentration of potential inhibitors
Storage Mean StDev Minimum Maximum
Lactic acid, g/L Ensiled 3.68 1.04 1.00 5.25
Unensiled 0.18 0.39 0.00 1.47
Acetic acid, g/L Ensiled 0.81 0.42 0.00 1.69
Unensiled 1.31 0.41 0.27 2.62
HMF, g/L Ensiled 0.05 0.02 0.01 0.10
Unensiled 0.04 0.02 0.00 0.11
Furfural, g/L Ensiled 0.59 0.33 0.10 1.26
Unensiled 0.33 0.22 0.00 0.76

291
Table D9: Differences in pH before and after pretreatment.
Pretreatment
time (mins)
Storage
moisture
content
pH before
pretreatment
pH after
pretreatment
(Unwashed)
pH before -
pH after
(Unwashed)
pH before
pretreatment
(Storage pH)
pH after
pretreatment
(Unwashed)
pH after
pretreatment
(Washed*)
storage pH -
Pretreatment
pH
(Unwashed)
storage pH -
Pretreatment
pH (Washed)
pH before
pretreatment
(Storage pH)
pH after
pretreatment
(Unwashed)
pH after
pretreatment
(Washed*)
storage pH -
Pretreatment
pH
(Unwashed)
storage pH -
Pretreatment
pH (Washed)
5 25 6.69 ± 0.02 4.64 ± 0.01 2.05 ± 0.01 4.95 ± 0.05 4.50 ± 0.05 4.41 ± 0.05 0.41 ± 0.05 0.50 ± 0.05 4.90 ± 0.05 4.50 ± 0.05 4.41 ± 0.05 0.41 ± 0.05 0.50 ± 0.05
5 35 6.69 ± 0.11 4.62 ± 0.01 2.08 ± 0.01 4.41 ± 0.03 4.45 ± 0.06 4.35 ± 0.04 0.01 ± 0.06 0.12 ± 0.04 4.46 ± 0.03 4.45 ± 0.06 4.35 ± 0.04 0.01 ± 0.06 0.12 ± 0.04
5 45 6.65 ± 0.02 4.62 ± 0.04 2.04 ± 0.04 4.18 ± 0.02 4.30 ± 0.09 4.24 ± 0.01 -0.06 ± 0.09 0.00 ± 0.01 4.24 ± 0.02 4.3 ± 0.09 4.24 ± 0.01 -0.06 ± 0.09 0.00 ± 0.01
5 55 6.71 ± 0.03 4.64 ± 0.03 2.07 ± 0.03 4.05 ± 0.03 4.28 ± 0.01 4.20 ± 0.01 -0.17 ± 0.01 -0.09 ± 0.01 4.11 ± 0.02 4.28 ± 0.01 4.2 ± 0.01 -0.17 ± 0.01 -0.09 ± 0.01
5 65 6.54 ± 0.08 4.62 ± 0.05 1.93 ± 0.05 4.23 ± 0.03 4.16 ± 0.01 4.11 ± 0.02 -0.08 ± 0.01 -0.03 ± 0.02 4.08 ± 0.01 4.16 ± 0.01 4.11 ± 0.02 -0.08 ± 0.01 -0.03 ± 0.02
5 75 6.73 ± 0.05 4.72 ± 0.02 2.02 ± 0.02 4.24 ± 0.01 4.69 ± 0.03 4.36 ± 0.06 0.06 ± 0.03 0.39 ± 0.06 4.75 ± 0.03 4.69 ± 0.03 4.36 ± 0.06 0.06 ± 0.03 0.39 ± 0.06
10 25 6.69 ± 0.02 4.43 ± 0.05 2.27 ± 0.05 4.95 ± 0.05 4.34 ± 0.03 4.15 ± 0.02 0.56 ± 0.03 0.76 ± 0.02 4.90 ± 0.05 4.34 ± 0.03 4.15 ± 0.02 0.56 ± 0.03 0.76 ± 0.02
10 35 6.69 ± 0.11 4.37 ± 0.06 2.32 ± 0.06 4.41 ± 0.03 4.30 ± 0.01 4.08 ± 0.04 0.16 ± 0.01 0.39 ± 0.04 4.46 ± 0.03 4.30 ± 0.01 4.08 ± 0.04 0.16 ± 0.01 0.39 ± 0.04
10 45 6.65 ± 0.02 4.40 ± 0.04 2.26 ± 0.04 4.18 ± 0.02 4.18 ± 0.00 4.05 ± 0.00 0.06 ± 0.00 0.19 ± 0.00 4.24 ± 0.02 4.18 ± 0.00 4.05 ± 0.00 0.06 ± 0.00 0.19 ± 0.00
10 55 6.71 ± 0.03 4.44 ± 0.02 2.28 ± 0.02 4.05 ± 0.03 4.15 ± 0.04 3.98 ± 0.02 -0.04 ± 0.04 0.14 ± 0.02 4.11 ± 0.02 4.15 ± 0.04 3.98 ± 0.02 -0.04 ± 0.04 0.14 ± 0.02
10 65 6.54 ± 0.08 4.41 ± 0.06 2.14 ± 0.06 4.23 ± 0.03 4.03 ± 0.02 3.95 ± 0.02 0.06 ± 0.02 0.14 ± 0.02 4.08 ± 0.01 4.03 ± 0.02 3.95 ± 0.02 0.06 ± 0.02 0.14 ± 0.02
10 75 6.73 ± 0.05 4.51 ± 0.02 2.23 ± 0.02 4.24 ± 0.01 4.51 ± 0.03 4.09 ± 0.05 0.24 ± 0.03 0.67 ± 0.05 4.75 ± 0.03 4.51 ± 0.03 4.09 ± 0.05 0.24 ± 0.03 0.67 ± 0.05
15 25 6.69 ± 0.02 4.26 ± 0.01 2.43 ± 0.01 4.95 ± 0.05 4.23 ± 0.08 4.00 ± 0.01 0.67 ± 0.08 0.91 ± 0.01 4.90 ± 0.05 4.23 ± 0.08 4.00 ± 0.01 0.67 ± 0.08 0.91 ± 0.01
15 35 6.69 ± 0.11 4.26 ± 0.01 2.43 ± 0.01 4.41 ± 0.03 4.09 ± 0.01 3.96 ± 0.01 0.38 ± 0.01 0.51 ± 0.01 4.46 ± 0.03 4.09 ± 0.01 3.96 ± 0.01 0.38 ± 0.01 0.51 ± 0.01
15 45 6.65 ± 0.02 4.24 ± 0.01 2.42 ± 0.01 4.18 ± 0.02 3.96 ± 0.00 3.95 ± 0.06 0.28 ± 0.00 0.30 ± 0.06 4.24 ± 0.02 3.96 ± 0.00 3.95 ± 0.06 0.28 ± 0.00 0.30 ± 0.06
15 55 6.71 ± 0.03 4.29 ± 0.05 2.43 ± 0.05 4.05 ± 0.03 4.01 ± 0.01 3.86 ± 0.01 0.10 ± 0.01 0.26 ± 0.01 4.11 ± 0.02 4.01 ± 0.01 3.86 ± 0.01 0.10 ± 0.01 0.26 ± 0.01
15 65 6.54 ± 0.08 4.28 ± 0.00 2.26 ± 0.00 4.23 ± 0.03 3.90 ± 0.03 3.82 ± 0.02 0.18 ± 0.03 0.27 ± 0.02 4.08 ± 0.01 3.90 ± 0.03 3.82 ± 0.02 0.18 ± 0.03 0.27 ± 0.02
15 75 6.73 ± 0.05 4.30 ± 0.03 2.43 ± 0.03 4.24 ± 0.01 4.37 ± 0.08 3.96 ± 0.00 0.39 ± 0.08 0.79 ± 0.00 4.75 ± 0.03 4.37 ± 0.08 3.96 ± 0.00 0.39 ± 0.08 0.79 ± 0.00
Unensiled (Day 0) Ensiled (Day 220 at 23oC) Ensiled (Day 220 at 37oC)
* Washed samples were washed before pretreatment to get rid of storage organic acids

292
Table D10: Ethanol yield and inhibitor concentrations† in pretreated unwashed stover fermented with pretreatment extract
† Concentrations are grams per Liter of fermentation broth Since ethanol yields are calculated on percentage theoretical basis (Equation D2), based on amount
of glucose present in feedstock at the time of fermentation, these yields can be fairly compared with fermentation without extract. The amount of glucose for
samples fermented with extract includes glucose in the pretreatment solid and in the extract.
5 25 41.36 ± 1.53 0.46 ± 0.00 1.21 ± 0.17 0.85 ± 0.68 0.09 ± 0.00 0.02 ± 0.00 48.73 ± 1.46 0.48 ± 0.16 0.00 ± 0.00 0.32 ± 0.10 0.06 ± 0.00 0.01 ± 0.00
5 35 47.80 ± 5.54 0.32 ± 0.02 1.97 ± 0.04 0.70 ± 0.06 0.13 ± 0.00 0.02 ± 0.00 46.35 ± 1.20 0.45 ± 0.02 0.00 ± 0.00 0.34 ± 0.07 0.07 ± 0.00 0.02 ± 0.00
5 45 43.61 ± 0.70 0.30 ± 0.01 2.14 ± 0.04 1.10 ± 0.43 0.17 ± 0.02 0.02 ± 0.00 44.64 ± 0.11 0.66 ± 0.01 0.48 ± 0.33 0.54 ± 0.26 0.06 ± 0.00 0.01 ± 0.00
5 55 45.81 ± 0.37 0.34 ± 0.08 2.51 ± 0.06 0.74 ± 0.10 0.20 ± 0.02 0.02 ± 0.00 49.05 ± 1.03 0.65 ± 0.06 0.36 ± 0.21 0.40 ± 0.03 0.06 ± 0.00 0.01 ± 0.00
5 65 42.03 ± 0.38 0.33 ± 0.01 2.27 ± 0.25 0.00 ± 0.00 0.12 ± 0.01 0.01 ± 0.00 45.64 ± 0.93 0.61 ± 0.05 0.00 ± 0.00 0.43 ± 0.06 0.05 ± 0.00 0.01 ± 0.00
5 75 43.43 ± 1.26 0.34 ± 0.03 2.34 ± 0.02 0.00 ± 0.00 0.12 ± 0.03 0.01 ± 0.00 45.50 ± 1.22 0.63 ± 0.06 0.00 ± 0.00 0.50 ± 0.04 0.05 ± 0.01 0.01 ± 0.00
10 25 49.05 ± 0.61 0.49 ± 0.01 1.30 ± 0.08 0.88 ± 0.07 0.21 ± 0.01 0.02 ± 0.00 50.13 ± 2.45 0.68 ± 0.09 0.00 ± 0.00 0.78 ± 0.22 0.18 ± 0.00 0.02 ± 0.00
10 35 51.86 ± 1.63 0.52 ± 0.05 2.15 ± 0.18 1.26 ± 0.01 0.32 ± 0.01 0.03 ± 0.00 49.87 ± 1.18 0.65 ± 0.05 0.38 ± 0.53 0.62 ± 0.04 0.19 ± 0.02 0.03 ± 0.00
10 45 50.52 ± 0.91 0.36 ± 0.51 2.15 ± 0.10 1.14 ± 0.04 0.39 ± 0.04 0.03 ± 0.00 51.75 ± 1.53 0.66 ± 0.01 0.28 ± 0.26 0.82 ± 0.18 0.17 ± 0.01 0.02 ± 0.00
10 55 53.26 ± 0.09 0.33 ± 0.33 2.42 ± 0.23 0.89 ± 0.26 0.42 ± 0.02 0.03 ± 0.00 52.93 ± 0.81 0.69 ± 0.12 0.47 ± 0.00 0.74 ± 0.02 0.16 ± 0.02 0.02 ± 0.00
10 65 43.43 ± 4.97 0.51 ± 0.08 0.55 ± 0.02 0.24 ± 0.15 0.31 ± 0.04 0.02 ± 0.00 47.92 ± 2.81 0.69 ± 0.07 0.00 ± 0.00 0.73 ± 0.02 0.15 ± 0.02 0.01 ± 0.00
10 75 48.48 ± 0.68 0.59 ± 0.02 2.43 ± 0.33 1.67 ± 0.04 0.34 ± 0.01 0.02 ± 0.00 50.15 ± 0.83 0.78 ± 0.03 0.00 ± 0.00 0.69 ± 0.13 0.15 ± 0.00 0.01 ± 0.00
15 25 53.57 ± 2.99 0.59 ± 0.04 1.14 ± 0.26 1.32 ± 0.29 0.40 ± 0.00 0.04 ± 0.00 55.53 ± 4.21 0.89 ± 0.02 0.00 ± 0.00 1.35 ± 0.05 0.34 ± 0.01 0.03 ± 0.00
15 35 53.09 ± 10.32 0.88 ± 0.07 1.79 ± 0.43 1.09 ± 0.91 0.52 ± 0.05 0.05 ± 0.01 54.27 ± 1.97 0.75 ± 0.03 0.77 ± 0.09 1.18 ± 0.15 0.43 ± 0.01 0.06 ± 0.01
15 45 60.05 ± 5.37 0.30 ± 0.26 2.28 ± 0.06 1.64 ± 0.08 0.64 ± 0.00 0.05 ± 0.00 55.44 ± 0.98 0.81 ± 0.01 0.38 ± 0.20 1.49 ± 0.20 0.36 ± 0.03 0.04 ± 0.00
15 55 63.79 ± 11.19 0.37 ± 0.33 2.63 ± 0.08 1.21 ± 0.71 0.70 ± 0.04 0.05 ± 0.00 55.58 ± 0.56 0.80 ± 0.09 0.40 ± 0.01 1.23 ± 0.11 0.34 ± 0.01 0.03 ± 0.00
15 65 59.67 ± 0.57 0.73 ± 0.02 2.56 ± 0.15 1.21 ± 0.18 0.53 ± 0.05 0.03 ± 0.00 54.61 ± 0.35 1.04 ± 0.03 0.00 ± 0.00 1.47 ± 0.18 0.36 ± 0.00 0.03 ± 0.00
15 75 55.42 ± 1.48 0.70 ± 0.04 2.52 ± 0.14 1.70 ± 0.67 0.61 ± 0.11 0.04 ± 0.00 56.18 ± 0.39 0.96 ± 0.17 0.00 ± 0.00 1.44 ± 0.08 0.31 ± 0.02 0.02 ± 0.00
HMF
( g/L)
Isobutyric
( g/L)
Furfural
( g/L)
Nominal
storage
moisture
(%)
Day 220, 23oC Day 0
Ethanol (%
theoretical)
Acetic acid
( g/L)
Lactic acid
( g/L)
Isobutyric
( g/L)
Furfural
( g/L)
HMF
( g/L)
Pretreatment
retention
time (min)
Ethanol (%
theoretical)
Acetic acid
( g/L)
Lactic acid
( g/L)

293
Table D11: Ethanol yield and inhibitor concentrations† in pretreated unwashed stover stored at 37oC fermented with pretreatment
extract
† Concentrations are grams per Liter of fermentation broth
*Data missing
5 25 37.52 ± 0.54 0.50 ± 0.23 1.21 ± 0.19 0.85 ± 0.69 0.22 ± 0.22 0.02 ± 0.02 31.33 ± 1.89 * * * * *
5 35 40.46 ± 0.92 0.30 ± 0.01 1.56 ± 0.50 0.55 ± 0.12 0.11 ± 0.03 0.02 ± 0.00 34.02 ± 1.34 * * * * *
5 45 39.30 ± 0.18 0.45 ± 0.26 2.13 ± 0.11 1.11 ± 0.50 0.22 ± 0.09 0.03 ± 0.01 36.43 ± 2.53 * * * * *
5 55 39.97 ± 4.66 0.16 ± 0.22 2.61 ± 0.37 0.78 ± 0.20 0.15 ± 0.08 0.02 ± 0.00 32.82 ± 1.02 * * * * *
5 65 38.54 ± 0.03 0.27 ± 0.03 1.99 ± 0.04 0.00 ± 0.00 0.08 ± 0.01 0.01 ± 0.00 35.55 ± 0.36 * * * * *
5 75 35.72 ± 1.97 0.36 ± 0.08 2.35 ± 0.34 0.00 ± 0.00 0.13 ± 0.03 0.01 ± 0.00 29.38 ± 0.93 * * * * *
10 25 41.85 ± 1.74 0.28 ± 0.40 1.35 ± 0.18 0.91 ± 0.01 0.23 ± 0.02 0.02 ± 0.00 50.19 ± 0.81 * * * * *
10 35 40.33 ± 3.97 0.51 ± 0.11 1.96 ± 0.39 1.14 ± 0.14 0.29 ± 0.01 0.03 ± 0.00 41.31 ± 1.17 * * * * *
10 45 45.38 ± 3.07 0.36 ± 0.52 2.43 ± 0.43 1.31 ± 0.34 0.37 ± 0.11 0.04 ± 0.00 43.48 ± 5.37 * * * * *
10 55 42.19 ± 3.95 0.25 ± 0.36 2.59 ± 0.10 0.98 ± 0.41 0.26 ± 0.15 0.02 ± 0.01 44.61 ± 1.48 * * * * *
10 65 43.68 ± 0.49 0.38 ± 0.06 2.05 ± 0.07 1.01 ± 0.05 0.23 ± 0.00 0.02 ± 0.00 45.14 ± 1.00 * * * * *
10 75 38.06 ± 0.93 0.53 ± 0.18 2.47 ± 0.59 1.48 ± 0.44 0.28 ± 0.07 0.02 ± 0.01 34.09 ± 0.08 * * * * *
15 25 44.62 ± 4.01 0.61 ± 0.03 1.14 ± 0.24 1.32 ± 0.26 0.42 ± 0.08 0.03 ± 0.01 42.76 ± 3.79 0.58 ± 0.06 0.20 ± 0.01 1.24 ± 1.47 0.68 ± 0.05 ND
15 35 50.24 ± 0.91 0.28 ± 0.39 1.50 ± 0.35 0.91 ± 0.75 0.24 ± 0.28 0.03 ± 0.02 44.29 ± 1.29 0.62 ± 0.00 0.26 ± 0.06 1.34 ± 1.55 0.87 ± 0.07 ND
15 45 57.91 ± 4.46 0.46 ± 0.07 1.89 ± 0.03 1.36 ± 0.05 0.54 ± 0.01 0.04 ± 0.00 49.33 ± 1.06 0.60 ± 0.01 0.26 ± 0.06 1.68 ± 1.97 0.97 ± 0.04 ND
15 55 52.30 ± 2.83 0.30 ± 0.42 2.45 ± 0.19 1.14 ± 0.71 0.37 ± 0.30 0.03 ± 0.02 32.46 ± 1.96 0.62 ± 0.02 0.22 ± 0.01 1.95 ± 1.48 1.02 ± 0.01 ND
15 65 51.22 ± 1.90 0.41 ± 0.14 2.11 ± 0.35 0.60 ± 0.84 0.21 ± 0.16 0.02 ± 0.01 41.08 ± 8.79 0.55 ± 0.03 0.29 ± 0.09 2.25 ± 0.07 0.86 ± 0.04 ND
15 75 24.86 ± 3.47 0.60 ± 0.16 2.40 ± 0.19 0.91 ± 1.28 0.34 ± 0.14 0.03 ± 0.01 39.44 ± 3.49 0.64 ± 0.04 0.12 ± 0.05 0.25 ± 0.00 0.50 ± 0.00 ND
HMF
(% g/L)
HMF
(% g/L)
Day 220, Washed
Ethanol (%
theoretical)
Acetic acid
(% g/L)
Lactic acid
(% g/L)
Malic (%
g/L)
Furfural
(% g/L)
Ethanol (%
theoretical)
Acetic acid
(% g/L)
Lactic acid
(% g/L)
Isobutyric
(% g/L)
Furfural
(% g/L)
Pretreatment
retention
time (min)
Nominal
storage
moisture
(%)
Day 220, Unwashed

294
Table D12: Ethanol yield from pretreated unwashed and washed stover fermented without pretreatment extract and potential ethanol
lost with extract†
† Ethanol yield for samples fermented without extract was calculated after accounting for glucan removed in the liquid extract during pretreatment. That is
amount of glucose used in calculating expected or theoretical yield includes glucose in the pretreatment solid fraction only.
Potential ethanol calculated from this extract provides an estimate of the increase in theoretical ethanol possible in a commercial facility where the extract would
likely be included. See Equation D3 used in calculating potential ethanol as percentage of broth total, that is theoretical ethanol yield if pretreatment solids and
extracts were used. *Not part of experimental design
5 25 46.57 ± 9.09 0.02 ± 0.00 0.01 ± 0.00 3.45 ± 0.17 38.52 ± 1.70 0.02 ± 0.00 0.01 ± 0.00 4.42 ± 0.04 * * * *
5 35 40.67 ± 0.98 0.01 ± 0.00 0.01 ± 0.00 3.06 ± 0.4 40.50 ± 1.77 0.02 ± 0.00 0.01 ± 0.00 4.30 ± 0.03 * * * *
5 45 49.12 ± 5.69 0.01 ± 0.00 0.01 ± 0.00 2.15 ± 0.03 38.95 ± 0.05 0.02 ± 0.00 0.01 ± 0.00 4.25 ± 0.46 * * * *
5 55 43.34 ± 0.06 0.01 ± 0.00 0.01 ± 0.00 2.12 ± 0.04 41.29 ± 0.96 0.02 ± 0.00 0.01 ± 0.00 3.95 ± 0.50 * * * *
5 65 37.77 ± 1.60 0.01 ± 0.00 0.01 ± 0.00 2.33 ± 0.11 38.62 ± 0.83 0.02 ± 0.00 0.01 ± 0.00 3.15 ± 0.46 * * * *
5 75 30.31 ± 16.98 0.01 ± 0.00 0.01 ± 0.00 2.53 ± 0.07 42.55 ± 1.25 0.02 ± 0.00 0.01 ± 0.00 5.01 ± 0.41 * * * *
10 25 47.09 ± 1.01 0.02 ± 0.00 0.01 ± 0.00 3.12 ± 0.37 43.62 ± 1.64 0.02 ± 0.00 0.01 ± 0.00 4.63 ± 0.01 * * * *
10 35 49.65 ± 2.86 0.02 ± 0.00 0.01 ± 0.00 3.17 ± 0.14 46.44 ± 2.56 0.02 ± 0.00 0.01 ± 0.00 4.87 ± 0.38 * * * *
10 45 49.55 ± 0.35 0.01 ± 0.00 0.01 ± 0.00 2.80 ± 0.23 47.01 ± 2.60 0.02 ± 0.00 0.01 ± 0.00 4.63 ± 0.74 * * * *
10 55 47.06 ± 2.13 0.01 ± 0.00 0.01 ± 0.00 2.75 ± 0.08 41.86 ± 8.64 0.02 ± 0.00 0.01 ± 0.00 4.35 ± 0.22 * * * *
10 65 47.13 ± 0.50 0.01 ± 0.00 0.01 ± 0.00 2.24 ± 0.42 47.47 ± 1.40 0.02 ± 0.00 0.01 ± 0.00 3.69 ± 0.19 * * * *
10 75 48.17 ± 2.95 0.01 ± 0.00 0.01 ± 0.00 2.41 ± 0.11 46.33 ± 0.48 0.02 ± 0.00 0.01 ± 0.00 4.96 ± 0.31 * * * *
15 25 51.71 ± 0.88 0.02 ± 0.00 0.01 ± 0.00 3.40 ± 0.17 48.89 ± 1.85 0.02 ± 0.00 0.01 ± 0.00 4.53 ± 0.97 45.52 ± 4.72 0.02 ± 0.00 0.01 ± 0.00 3.63 ± 0.30
15 35 50.30 ± 7.00 0.02 ± 0.00 0.01 ± 0.00 3.29 ± 0.30 50.17 ± 1.82 0.02 ± 0.00 0.01 ± 0.00 4.78 ± 0.01 50.55 ± 2.89 0.01 ± 0.00 0.01 ± 0.00 2.94 ± 0.49
15 45 51.68 ± 4.27 0.01 ± 0.00 0.01 ± 0.00 2.61 ± 0.04 51.53 ± 0.73 0.02 ± 0.00 0.01 ± 0.00 4.70 ± 0.36 42.79 ± 13.56 0.02 ± 0.00 0.01 ± 0.00 3.53 ± 0.06
15 55 46.44 ± 5.64 0.01 ± 0.00 0.01 ± 0.00 2.59 ± 0.13 50.03 ± 0.91 0.02 ± 0.00 0.01 ± 0.00 3.89 ± 0.25 50.18 ± 3.05 0.02 ± 0.00 0.01 ± 0.00 3.62 ± 0.15
15 65 48.50 ± 9.69 0.01 ± 0.01 0.01 ± 0.01 1.13 ± 1.37 44.21 ± 8.36 0.02 ± 0.00 0.01 ± 0.00 4.04 ± 0.78 44.12 ± 9.97 0.02 ± 0.00 0.01 ± 0.00 3.61 ± 0.37
15 75 53.22 ± 2.79 0.01 ± 0.00 0.01 ± 0.00 2.81 ± 0.09 49.82 ± 3.02 0.02 ± 0.00 0.02 ± 0.01 5.08 ± 0.93 40.76 ± 1.05 0.02 ± 0.00 0.01 ± 0.00 3.90 ± 0.02
Day 220, 37oC (Washed)Day 0
Ethanol (%
theoretical)
Glucan in
extract (g)
potential
ethanol from
extract (%
broth total)
Ethanol (%
theoretical)
potential
ethanol from
extract (%
broth total)
potential
ethanol from
extract (g)
Glucan in
extract (g)
potential
ethanol from
extract (g)
potential
ethanol from
extract (%
broth total)
Ethanol (%
theoretical)
Glucan in
extract (g)
potential
ethanol from
extract (g)
Pretreatment
retention
time (min)
Nominal
storage
moisture
(%)
Day 220, 23oC

295
Equation D2:
Where: EtOHactual = actual amount of ethanol in fermentation broth as measured using the YSI
2700 SELECT (g)
Gextract = Amount of glucan in pretreatment extract (g)
(When samples are fermented without extract, Gextract = 0)
Gsolid = Amount of glucan in pretreated dry matter that is fermented (g)
= [(% glucan before pretreatment ×dry mass of feedstock before
pretreatment (g)) - Amount of glucan in pretreatment extract (g)]
0.9 = (molar mass of glucan/molar mass of glucose) is to convert glucan to glucose
0.51 = conversion factor of 1 gram of glucose to ethanol from stoichiometric (used as
basis for theoretical yield)
Equation D3:
Where: Gextract and Gsolid are defined as in Equation D2

296
Table D13: Correlation between Ethanol yield (% theoretical) and potential inhibitors generated
during pretreatment of unwashed unensiled stover†
Ethanol (%) Furfural, g/L HMF, g/L Acetic, g/L
Lactic, g/L
Furfural, g/L 0.852
0.000
HMF, g/L 0.657 0.871
0.000 0.000
Acetic, g/L 0.659 0.726 0.432
0.000 0.000 0.009
Lactic, g/L 0.163 0.293 0.511 -0.008
0.341 0.082 0.001 0.965
Isobutyric, g/L 0.826 0.916 0.680 0.824
0.164
0.000 0.000 0.000 0.000
0.340
Cell Contents: Pearson correlation
P-Value
† Concentration of potential inhibitors is grams per liter of fermentation broth

297
Table D14: Correlation between Ethanol yield (% theoretical) and potential inhibitors generated
during pretreatment of unwashed ensiled stover stored for 220 days†
Ethanol (%) Furfural, g/L HMF, g/L Acetic,
g/L Lactic, g/L
Furfural, g/L 0.826
0.000
HMF, g/L 0.750 0.904
0.000 0.000
Acetic, g/L 0.247 0.343 0.339
0.146 0.040 0.043
Lactic, g/L 0.330 0.315 0.195 -0.115
0.049 0.062 0.255 0.505
Isobutyric, g/L 0.399 0.562 0.627 0.208
0.271
0.016 0.000 0.000 0.223
0.110
Cell Contents: Pearson correlation
P-Value
† Concentration of potential inhibitors is grams per liter of fermentation broth

298
Figure D2: Regression relationships between ethanol yield and concentration of potential inhibitors in the fermentation broth of
unensiled stover. Showing only potential inhibitors fromTable D12 with some correlation with ethanol.

299
Figure D3: Regression relationships between ethanol yield and concentration of potential inhibitors in the fermentation broth of
ensiled stover. Showing only potential inhibitors from Table D13 with some correlation with ethanol.

300
APPENDIX E: Post storage handling and processing of wet stored stover
(Chapter 6)
This appendix contains supplementary materials to Chapter 6. This includes an experimental
design and analytical process diagram, experimental data on pretreatment outcomes (organic
acids, pH, glucan and xylan removal, and inhibitors) as well as ethanol yields.

301
Figure E1: Experimental design and analysis for examining impact of drying on ethanol yield

302
Table E1: pH of corn stover before and after liquid hot water pretreatment at 190oC
Pretreatment
time (min) Moisture content Storage pH
Dry, Unwashed
Dry, Washed
"As is", Unwashed
"As is", Washed
Day 220
5 25 4.90 ± 0.05 4.50 ± 0.05 4.41 ± 0.05 4.47 ± 0.04 4.45 ± 0.17
5 35 4.46 ± 0.03 4.45 ± 0.06 4.35 ± 0.04 4.34 ± 0.00 4.23 ± 0.02
5 45 4.24 ± 0.02 4.30 ± 0.09 4.24 ± 0.01 4.24 ± 0.00 4.29 ± 0.18
5 55 4.11 ± 0.02 4.28 ± 0.01 4.20 ± 0.01 4.15 ± 0.06 4.14 ± 0.01
5 65 4.08 ± 0.01 4.16 ± 0.01 4.11 ± 0.02 4.06 ± 0.12 4.06 ± 0.03
5 75 4.75 ± 0.03 4.69 ± 0.03 4.36 ± 0.06 4.18 ± 0.01 4.18 ± 0.01
10 25 4.90 ± 0.05 4.34 ± 0.03 4.15 ± 0.02 4.28 ± 0.05 4.24 ± 0.10
10 35 4.46 ± 0.03 4.30 ± 0.01 4.08 ± 0.04 4.2 ± 0.01 4.05 ± 0.00
10 45 4.24 ± 0.02 4.18 ± 0.00 4.05 ± 0.00 4.13 ± 0.01 4.13 ± 0.07
10 55 4.11 ± 0.02 4.15 ± 0.04 3.98 ± 0.02 4.06 ± 0.02 4.01 ± 0.02
10 65 4.08 ± 0.01 4.03 ± 0.02 3.95 ± 0.02 4.05 ± 0.01 4.01 ± 0.02
10 75 4.75 ± 0.03 4.51 ± 0.03 4.09 ± 0.05 4.03 ± 0.01 4.05 ± 0.06
15 25 4.90 ± 0.05 4.23 ± 0.08 4.00 ± 0.01 4.13 ± 0.06 4.08 ± 0.08
15 35 4.46 ± 0.03 4.09 ± 0.01 3.96 ± 0.01 4.07 ± 0.00 3.94 ± 0.01
15 45 4.24 ± 0.02 3.96 ± 0.00 3.95 ± 0.06 4.08 ± 0.06 3.98 ± 0.08
15 55 4.11 ± 0.02 4.01 ± 0.01 3.86 ± 0.01 3.95 ± 0.00 3.90 ± 0.01
15 65 4.08 ± 0.01 3.90 ± 0.03 3.82 ± 0.02 3.96 ± 0.04 3.85 ± 0.01
15 75 4.75 ± 0.03 4.37 ± 0.08 3.96 ± 0.00 4.08 ± 0.03 3.93 ± 0.00
Day 0
5 25 6.69 ± 0.02 4.64 ± 0.01 ˣ 4.58 ± 0.05 4.62 ± 0.17
5 35 6.69 ± 0.11 4.62 ± 0.01 ˣ 4.59 ± 0.00 4.44 ± 0.01
5 45 6.65 ± 0.02 4.62 ± 0.04 ˣ 4.66 ± 0.28 4.50 ± 0.11
5 55 6.71 ± 0.03 4.64 ± 0.03 ˣ 4.76 ± 0.11 4.38 ± 0.04
5 65 6.54 ± 0.08 4.62 ± 0.05 ˣ 4.65 ± 0.08 4.35 ± 0.01
5 75 6.73 ± 0.05 4.72 ± 0.02 ˣ 4.40 ± 0.04 4.44 ± 0.06
10 25 6.69 ± 0.02 4.43 ± 0.05 ˣ 4.41 ± 0.01 4.41 ± 0.16
10 35 6.69 ± 0.11 4.37 ± 0.06 ˣ 4.37 ± 0.06 4.22 ± 0.04
10 45 6.65 ± 0.02 4.40 ± 0.04 ˣ 4.41 ± 0.23 4.25 ± 0.06
10 55 6.71 ± 0.03 4.44 ± 0.02 ˣ 4.53 ± 0.08 4.22 ± 0.01
10 65 6.54 ± 0.08 4.41 ± 0.06 ˣ 4.50 ± 0.04 4.18 ± 0.01
10 75 6.73 ± 0.05 4.51 ± 0.02 ˣ 4.20 ± 0.01 4.19 ± 0.03
15 25 6.69 ± 0.02 4.26 ± 0.01 ˣ 4.27 ± 0.04 4.25 ± 0.08
15 35 6.69 ± 0.11 4.26 ± 0.01 ˣ 4.28 ± 0.06 4.12 ± 0.01
15 45 6.65 ± 0.02 4.24 ± 0.01 ˣ 4.25 ± 0.21 4.11 ± 0.01
15 55 6.71 ± 0.03 4.29 ± 0.05 ˣ 4.41 ± 0.06 4.15 ± 0.04
15 65 6.54 ± 0.08 4.28 ± 0.00 ˣ 4.36 ± 0.11 4.06 ± 0.03
15 75 6.73 ± 0.05 4.30 ± 0.03 ˣ 4.11 ± 0.02 4.12 ± 0.03

303
Table E2: Organic acid profile of dried and “as is” stover before pretreatment
Lactic
(% DM)
Acetic
(% DM)
Isobutyric
(% DM)
Butyric
(% DM)
Tartaric
(% DM)
Malic
(% DM)
Pyruvic
(% DM)
Lactic
(% DM)
Acetic
(% DM)
Isobutyric
(% DM)
Butyric
(% DM)
Tartaric
(% DM)
Malic
(% DM)
Pyruvic
(% DM)
15 0.00 ± 0.00 0.00 ± 0.00 1.72 ± 0.22 0.00 ± 0.00 0.98 ± 0.01 0.91 ± 0.01 2.20 ± 0.03 0.00 ± 0.00 0.00 ± 0.00 1.80 ± 0.22 0.00 ± 0.00 0.86 ± 0.13 1.11 ± 0.23 2.21 ± 0.07
25 0.00 ± 0.00 0.00 ± 0.00 0.82 ± 0.05 0.00 ± 0.00 0.41 ± 0.02 0.00 ± 0.00 0.62 ± 0.62 0.00 ± 0.00 0.00 ± 0.00 0.79 ± 0.35 0.00 ± 0.00 1.88 ± 0.34 0.05 ± 0.05 2.8 ± 0.55
35 0.00 ± 0.00 0.00 ± 0.00 0.80 ± 0.03 0.00 ± 0.00 0.16 ± 0.02 0.30 ± 0.04 0.16 ± 0.16 0.00 ± 0.00 0.00 ± 0.00 0.93 ± 0.31 0.00 ± 0.00 2.54 ± 0.65 0.05 ± 0.05 2.35 ± 0.21
45 0.00 ± 0.00 0.00 ± 0.00 1.03 ± 0.08 0.00 ± 0.00 0.00 ± 0.00 0.38 ± 0.04 0.31 ± 0.31 0.00 ± 0.00 0.00 ± 0.00 0.63 ± 0.01 0.00 ± 0.00 1.73 ± 0.05 0.05 ± 0.05 2.11 ± 0.01
55 0.00 ± 0.00 0.00 ± 0.00 2.95 ± 2.14 0.00 ± 0.00 0.00 ± 0.00 0.00 ± 0.00 0.00 ± 0.00 0.00 ± 0.00 0.00 ± 0.00 0.57 ± 0.18 0.00 ± 0.00 1.13 ± 0.76 0.00 ± 0.00 1.99 ± 0.11
65 0.00 ± 0.00 0.00 ± 0.00 5.15 ± 0.47 0.00 ± 0.00 0.00 ± 0.00 0.00 ± 0.00 0.00 ± 0.00 0.00 ± 0.00 2.61 ± 2.61 0.23 ± 0.23 0.00 ± 0.00 0.74 ± 0.64 0.00 ± 0.00 1.03 ± 0.24
75 0.00 ± 0.00 0.00 ± 0.00 6.83 ± 0.44 0.00 ± 0.00 0.00 ± 0.00 0.00 ± 0.00 0.03 ± 0.00 0.00 ± 0.00 0.62 ± 0.14 0.16 ± 0.16 0.00 ± 0.00 0.08 ± 0.08 0.00 ± 0.00 0.80 ± 0.40
15 0.00 ± 0.00 0.00 ± 0.00 0.02 ± 0.03 0.00 ± 0.00 0.00 ± 0.00 0.00 ± 0.00 0.00 ± 0.00 0.05 ± 0.05 0.00 ± 0.00 0.00 ± 0.00 0.00 ± 0.00 0.00 ± 0.00 0.00 ± 0.00 0.00 ± 0.00
25 0.26 ± 0.46 0.14 ± 0.24 0.04 ± 0.07 0.00 ± 0.00 0.00 ± 0.00 0.00 ± 0.00 0.00 ± 0.00 0.00 ± 0.00 0.00 ± 0.00 0.00 ± 0.00 0.00 ± 0.00 0.00 ± 0.00 0.00 ± 0.00 0.00 ± 0.00
35 1.94 ± 0.13 0.63 ± 0.02 0.2 ± 0.02 0.00 ± 0.00 0.00 ± 0.00 0.00 ± 0.00 0.00 ± 0.00 0.00 ± 0.00 0.00 ± 0.00 0.00 ± 0.00 0.00 ± 0.00 0.00 ± 0.00 0.00 ± 0.00 0.00 ± 0.00
45 2.9 ± 0.16 0.75 ± 0.06 0.27 ± 0.01 0.00 ± 0.00 0.00 ± 0.00 0.00 ± 0.00 0.00 ± 0.00 0.00 ± 0.00 0.05 ± 0.09 0.00 ± 0.00 0.00 ± 0.00 0.00 ± 0.00 0.00 ± 0.00 0.00 ± 0.00
55 2.95 ± 0.4 1.14 ± 0.19 0.34 ± 0.22 0.00 ± 0.00 0.00 ± 0.00 0.00 ± 0.00 0.00 ± 0.00 0.00 ± 0.00 0.00 ± 0.00 0.00 ± 0.00 0.00 ± 0.00 0.00 ± 0.00 0.00 ± 0.00 0.00 ± 0.00
65 3.03 ± 1.76 1.24 ± 0.21 0.16 ± 0.27 0.00 ± 0.00 0.00 ± 0.00 0.00 ± 0.00 0.00 ± 0.00 0.00 ± 0.00 0.00 ± 0.00 0.00 ± 0.00 0.00 ± 0.00 0.00 ± 0.00 0.00 ± 0.00 0.00 ± 0.00
75 0.00 ± 0.00 2.74 ± 0.73 1.28 ± 1.06 2.57 ± 0.58 0.00 ± 0.00 0.00 ± 0.00 0.00 ± 0.00 0.00 ± 0.00 0.00 ± 0.00 0.00 ± 0.00 0.00 ± 0.00 0.00 ± 0.00 0.00 ± 0.00 0.00 ± 0.00
Day 220 Day 0
Dried
"As is"
Moisture
content
(%)

304
Table E3: Organic acid profile of unwashed Day 220 samples after pretreatment
Pretreatment
time (min)
Storage
Moisture
(%)
Tartaric
(% DM)
Malic
(% DM)
Lactic
(% DM)
Acetic
(% DM)
Formic
(% DM)
Propionic
(% DM)
Isobutyric
(% DM)
Butyric
(% DM)
Pyruvic
(% DM)
5 25 0.85 ± 0.83 0.15 ± 0.14 1.73 ± 0.28 0.71 ± 0.33 0.21 ± 0.14 n.d 1.22 ± 0.99 n.d 0.23 ± 0.01
5 35 0.26 ± 0.02 0.16 ± 0.01 2.27 ± 0.72 0.44 ± 0.02 0.12 ± 0.02 n.d 0.80 ± 0.17 n.d 0.20 ± 0.01
5 45 0.16 ± 0.22 1.79 ± 2.42 3.08 ± 0.15 0.65 ± 0.38 0.21 ± 0.10 n.d 1.60 ± 0.72 n.d 0.33 ± 0.20
5 55 0.09 ± 0.13 1.18 ± 1.48 3.8 ± 0.53 0.23 ± 0.32 0.14 ± 0.04 n.d 1.13 ± 0.28 n.d 0.30 ± 0.17
5 65 0.01 ± 0.01 0.04 ± 0.00 2.89 ± 0.06 0.40 ± 0.04 0.11 ± 0.01 n.d n.d n.d 0.12 ± 0.00
5 75 0.04 ± 0.03 0.09 ± 0.01 3.45 ± 0.48 0.53 ± 0.11 0.15 ± 0.04 n.d n.d n.d 0.14 ± 0.05
10 25 0.27 ± 0.38 0.14 ± 0.03 1.91 ± 0.26 0.40 ± 0.57 0.21 ± 0.00 n.d 1.29 ± 0.01 n.d 0.22 ± 0.06
10 35 0.27 ± 0.09 0.19 ± 0.04 2.83 ± 0.59 0.74 ± 0.16 0.25 ± 0.05 n.d 1.65 ± 0.22 n.d 0.22 ± 0.03
10 45 0.20 ± 0.01 0.39 ± 0.12 3.52 ± 0.61 0.53 ± 0.74 0.27 ± 0.09 n.d 1.89 ± 0.48 n.d 0.24 ± 0.01
10 55 n.d 1.33 ± 1.49 3.77 ± 0.14 0.37 ± 0.52 0.18 ± 0.09 n.d 1.42 ± 0.59 n.d 0.35 ± 0.28
10 65 0.01 ± 0.01 1.07 ± 1.18 2.96 ± 0.09 0.55 ± 0.08 0.10 ± 0.14 n.d 1.46 ± 0.07 n.d 0.26 ± 0.21
10 75 0.01 ± 0.02 0.62 ± 0.40 3.61 ± 0.86 0.78 ± 0.26 0.29 ± 0.16 n.d 2.15 ± 0.64 n.d 0.15 ± 0.03
15 25 0.22 ± 0.21 0.21 ± 0.02 1.63 ± 0.35 0.87 ± 0.06 0.28 ± 0.05 n.d 1.88 ± 0.39 n.d 0.23 ± 0.05
15 35 0.13 ± 0.12 0.29 ± 0.34 2.16 ± 0.5 0.40 ± 0.56 0.21 ± 0.13 n.d 1.31 ± 1.08 n.d 0.19 ± 0.02
15 45 0.30 ± 0.19 0.68 ± 0.53 2.72 ± 0.03 0.66 ± 0.10 0.24 ± 0.00 n.d 1.96 ± 0.07 n.d 0.17 ± 0.01
15 55 0.10 ± 0.14 0.75 ± 0.42 3.60 ± 0.20 0.43 ± 0.61 0.20 ± 0.13 n.d 1.66 ± 1.01 n.d 0.18 ± 0.05
15 65 0.01 ± 0.01 0.29 ± 0.17 3.05 ± 0.51 0.59 ± 0.21 0.22 ± 0.12 n.d 0.86 ± 1.22 n.d 0.16 ± 0.01
15 75 n.d 0.69 ± 0.63 3.5 ± 0.28 0.87 ± 0.23 0.31 ± 0.02 n.d 1.32 ± 1.87 n.d 0.18 ± 0.03
5 25 n.d 0.10 ± 0.01 1.36 ± 0.14 1.50 ± 0.09 0.32 ± 0.02 n.d 1.39 ± 0.02 n.d 0.12 ± 0.01
5 35 n.d 0.27 ± 0.00 0.96 ± 1.36 1.92 ± 0.04 0.33 ± 0.00 n.d 2.44 ± 0.12 n.d 0.23 ± 0.03
5 45 n.d 0.21 ± 0.15 2.68 ± 0.40 2.38 ± 0.27 0.31 ± 0.01 n.d 2.69 ± 0.25 n.d 0.22 ± 0.05
5 55 n.d 0.10 ± 0.02 1.61 ± 2.28 2.98 ± 0.05 0.23 ± 0.01 n.d 2.05 ± 0.19 n.d 0.19 ± 0.00
5 65 n.d 0.08 ± 0.01 1.79 ± 2.53 2.93 ± 0.08 0.24 ± 0.01 n.d 1.87 ± 0.12 n.d 0.23 ± 0.00
5 75 n.d 0.01 ± 0.02 n.d 7.11 ± 0.03 0.31 ± 0.02 0.15 ± 0.04 n.d 4.55 ± 0.08 0.05 ± 0.06
10 25 n.d 0.22 ± 0.07 1.49 ± 0.18 1.84 ± 0.38 0.50 ± 0.02 n.d 2.45 ± 0.03 n.d 0.19 ± 0.01
10 35 n.d 0.24 ± 0.25 0.34 ± 0.48 1.53 ± 1.05 0.35 ± 0.23 n.d 2.58 ± 1.95 n.d 0.18 ± 0.14
10 45 n.d 0.28 ± 0.04 5.61 ± 3.10 3.75 ± 0.36 0.52 ± 0.10 n.d 4.10 ± 0.53 n.d 1.11 ± 1.19
10 55 n.d 0.19 ± 0.01 3.25 ± 0.04 3.55 ± 0.14 0.38 ± 0.05 n.d 2.90 ± 0.27 n.d 0.25 ± 0.01
10 65 n.d 0.15 ± 0.04 2.03 ± 2.87 3.35 ± 0.17 0.40 ± 0.01 n.d 2.76 ± 0.27 n.d 0.28 ± 0.01
10 75 n.d 0.15 ± 0.01 n.d 8.13 ± 0.03 0.47 ± 0.04 0.18 ± 0.07 n.d 4.22 ± 0.33 0.67 ± 0.72
15 25 n.d 0.23 ± 0.00 0.88 ± 1.24 1.4 ± 1.36 0.54 ± 0.18 n.d 2.91 ± 1.29 n.d 0.22 ± 0.01
15 35 n.d 0.31 ± 0.13 0.86 ± 1.22 2.84 ± 0.38 0.62 ± 0.17 n.d 4.99 ± 1.71 n.d 0.28 ± 0.05
15 45 n.d 2.38 ± 2.32 n.d 3.19 ± 0.08 1.33 ± 0.91 n.d 4.24 ± 2.31 n.d 0.69 ± 0.45
15 55 n.d 0.33 ± 0.01 n.d 4.16 ± 0.09 0.65 ± 0.01 n.d 5.02 ± 0.02 n.d 0.29 ± 0.00
15 65 n.d 0.21 ± 0.12 2.91 ± 1.26 2.82 ± 1.17 0.42 ± 0.19 n.d 2.80 ± 1.21 n.d 0.25 ± 0.13
15 75 n.d 0.17 ± 0.04 0.49 ± 0.47 2.52 ± 0.12 0.56 ± 0.06 n.d 2.58 ± 0.26 n.d 0.34 ± 0.03
Dried
"As is"

305
Table E4: Organic acid profiled of unwashed Day 0 samples after pretreatment
Pretreatment
time (min)
Storage
Moisture
(%)
Tartaric
(% DM)
Malic
(% DM)
Lactic
(% DM)
Acetic
(% DM)
Formic
(% DM)
Propionic
(% DM)
Isobutyric
(% DM)
Butyric
(% DM)
Pyruvic
(% DM)
5 25 1.09 ± 1.30 0.18 ± 0.01 n.d 0.82 ± 0.27 0.17 ± 0.00 n.d 0.75 ± 0.08 n.d 0.30 ± 0.42
5 35 0.92 ± 0.08 0.17 ± 0.01 n.d 1.00 ± 0.08 0.18 ± 0.00 n.d 0.48 ± 0.06 n.d 0.46 ± 0.01
5 45 0.12 ± 0.03 0.21 ± 0.01 0.70 ± 0.48 0.75 ± 0.10 0.19 ± 0.01 n.d 0.74 ± 0.43 n.d 0.30 ± 0.04
5 55 1.35 ± 0.04 0.12 ± 0.01 0.53 ± 0.31 0.85 ± 0.14 0.17 ± 0.01 n.d 0.89 ± 0.01 n.d 0.31 ± 0.09
5 65 3.20 ± 0.37 0.06 ± 0.01 n.d 0.68 ± 0.64 0.16 ± 0.01 n.d 0.83 ± 0.00 n.d 1.93 ± 0.17
5 75 3.27 ± 0.15 0.06 ± 0.01 n.d 1.49 ± 0.11 0.49 ± 0.45 n.d 0.91 ± 0.05 n.d 1.05 ± 0.04
10 25 0.56 ± 0.59 0.23 ± 0.01 n.d 0.99 ± 0.19 0.26 ± 0.00 n.d 1.21 ± 0.23 n.d 0.47 ± 0.14
10 35 0.68 ± 0.40 0.25 ± 0.03 0.55 ± 0.78 0.95 ± 0.02 0.26 ± 0.01 n.d 1.59 ± 0.12 n.d 0.47 ± 0.06
10 45 0.06 ± 0.08 0.22 ± 0.08 0.42 ± 0.39 1.07 ± 0.28 0.29 ± 0.01 n.d 1.34 ± 0.64 n.d 0.28 ± 0.04
10 55 n.d 0.19 ± 0.01 0.69 ± 0.01 0.94 ± 0.08 0.27 ± 0.01 n.d 1.53 ± 0.06 n.d 0.27 ± 0.01
10 65 1.67 ± 2.27 1.69 ± 2.26 n.d 0.64 ± 0.52 1.39 ± 1.09 n.d 2.71 ± 1.64 n.d 2.36 ± 0.37
10 75 0.29 ± 0.30 1.53 ± 1.96 n.d 1.68 ± 0.68 0.86 ± 0.78 n.d 1.63 ± 0.13 n.d 0.77 ± 0.85
15 25 0.68 ± 0.77 0.32 ± 0.01 n.d 1.11 ± 0.27 0.22 ± 0.18 n.d 2.14 ± 0.21 n.d 0.41 ± 0.01
15 35 0.54 ± 0.17 0.41 ± 0.02 1.12 ± 0.13 1.29 ± 0.16 0.45 ± 0.04 n.d 2.59 ± 0.39 n.d 0.50 ± 0.20
15 45 0.31 ± 0.26 0.64 ± 0.33 0.55 ± 0.28 1.43 ± 0.40 0.28 ± 0.02 n.d 2.70± 0.06 n.d 0.38 ± 0.00
15 55 0.60 ± 0.00 0.29 ± 0.01 0.59 ± 0.01 1.40 ± 0.20 0.37 ± 0.01 n.d 2.28 ± 0.04 n.d 0.3 ± 0.00
15 65 0.63 ± 0.01 0.19 ± 0.01 n.d 0.87 ± 0.74 0.40 ± 0.01 n.d 2.46 ± 0.06 n.d 0.29 ± 0.01
15 75 0.59 ± 0.01 0.20 ± 0.01 n.d 1.38 ± 0.03 0.4 ± 0.00 n.d 2.48 ± 0.04 n.d 0.24 ± 0.01
5 25 n.d 0.11 ± 0.01 0.67 ± 0.95 0.83 ± 1.17 0.33 ± 0.11 n.d 1.51 ± 0.16 n.d 0.14 ± 0.03
5 35 n.d 0.10 ± 0.01 n.d 0.11 ± 0.15 0.24 ± 0.02 n.d 1.04 ± 0.46 n.d 0.44 ± 0.39
5 45 n.d 0.58 ± 0.66 1.32 ± 1.87 1.98 ± 0.68 0.29 ± 0.06 n.d 1.94 ± 1.13 n.d 0.27 ± 0.12
5 55 n.d n.d 0.16 ± 0.23 1.40 ± 0.13 0.26 ± 0.07 n.d 1.05 ± 0.58 n.d 0.08 ± 0.03
5 65 n.d 0.05 ± 0.00 n.d 1.22 ± 0.00 0.17 ± 0.01 n.d 0.71 ± 0.05 n.d 0.11 ± 0.01
5 75 n.d n.d n.d 6.71 ± 0.68 0.31 ± 0.05 0.16 ± 0.00 n.d 4.36 ± 0.24 0.18 ± 0.13
10 25 n.d 0.15 ± 0.04 n.d 1.1 ± 0.09 0.37 ± 0.07 n.d 1.80 ± 0.04 n.d 0.20 ± 0.01
10 35 n.d 0.18 ± 0.09 n.d 1.27 ± 0.13 0.92 ± 0.48 n.d 2.08 ± 0.24 n.d 0.55 ± 0.34
10 45 n.d 1.42 ± 0.78 n.d 2.53 ± 0.91 1.04 ± 0.97 n.d 1.44 ± 0.02 n.d 0.59 ± 0.44
10 55 n.d 0.88 ± 0.15 n.d 1.78 ± 0.05 0.32 ± 0.01 n.d 1.42 ± 0.01 n.d 0.33 ± 0.03
10 65 n.d 0.31 ± 0.34 n.d 1.43 ± 0.09 0.26 ± 0 n.d 1.07 ± 0.03 n.d 0.19 ± 0.03
10 75 n.d 1.56 ± 1.87 0.04 ± 0.05 2.84 ± 0.77 1.28 ± 0.78 n.d 1.69 ± 0.23 n.d 0.81 ± 0.36
15 25 n.d 0.28 ± 0.02 n.d 1.43 ± 0.10 0.42 ± 0.13 n.d 2.61 ± 0.50 n.d 0.30 ± 0.05
15 35 n.d 0.26 ± 0.07 0.56 ± 0.79 1.60 ± 0.16 0.52 ± 0.02 n.d 2.99 ± 0.14 n.d 0.34 ± 0.04
15 45 n.d 0.88 ± 0.94 0.16 ± 0.23 2.36 ± 0.37 0.92 ± 0.63 n.d 2.52 ± 0.62 n.d 0.66 ± 0.53
15 55 n.d 0.1 ± 0.14 0.32 ± 0.01 2.48 ± 0.66 1.15 ± 0.91 n.d 2.63 ± 0.10 n.d n.d
15 65 n.d 0.11 ± 0.03 n.d 1.81 ± 0.40 0.36 ± 0 n.d 1.73 ± 0.13 n.d 0.24 ± 0.02
15 75 n.d 0.18 ± 0.01 n.d 2.64 ± 0.14 0.53 ± 0.01 n.d 2.29 ± 0.13 n.d 0.18 ± 0.25
Dried
"As is"

306
Table E5: Organic acid profile of washed “as is” samples after pretreatment
Storage
duration
(days)
Pretreatment
time (min)
Storage
Moisture
(%)
Tartaric
(% DM)
Malic
(% DM)
Lactic
(% DM)
Acetic
(% DM)
Formic
(% DM)
Propionic
(% DM)
Isobutyric
(% DM)
Butyric
(% DM)
Pyruvic
(% DM)
5 25 n.d 0.13 ± 0.08 n.d 0.69 ± 0.11 0.18 ± 0.04 n.d n.d n.d 0.09 ± 0.02
5 35 n.d 0.12 ± 0.09 n.d 0.79 ± 0.16 0.22 ± 0.14 n.d n.d n.d 0.18 ± 0.13
5 45 n.d 0.15 ± 0.03 n.d 0.77 ± 0.26 0.14 ± 0.02 n.d n.d n.d 0.08 ± 0.00
5 55 n.d 0.12 ± 0.03 n.d 0.64 ± 0.02 0.25 ± 0.04 n.d n.d n.d 0.09 ± 0.00
5 65 n.d 0.17 ± 0.04 n.d 0.66 ± 0.04 0.35 ± 0.01 n.d n.d n.d 0.11 ± 0.02
5 75 n.d 0.12 ± 0.03 n.d 0.76 ± 0.05 0.33 ± 0.05 n.d n.d n.d 0.12 ± 0.02
10 25 n.d 0.18 ± 0.01 n.d 0.99 ± 0.16 0.40 ± 0.15 n.d n.d n.d 0.13 ± 0.04
10 35 n.d 0.15 ± 0.08 n.d 1.06 ± 0.15 0.29 ± 0.25 n.d n.d n.d 0.11 ± 0.04
10 45 n.d 0.14 ± 0.11 n.d 0.93 ± 0.06 0.31 ± 0.11 n.d n.d n.d 0.10 ± 0.02
10 55 n.d 0.16 ± 0.12 n.d 1.04 ± 0.03 0.33 ± 0.13 n.d n.d n.d 0.11 ± 0.01
10 65 n.d 0.19 ± 0.05 n.d 1.24 ± 0.36 0.28 ± 0.17 n.d n.d n.d 0.23 ± 0.17
10 75 n.d 0.18 ± 0.19 n.d 1.10 ± 0.62 0.30 ± 0.28 n.d n.d n.d 0.10 ± 0.05
15 25 n.d 0.45 ± 0.11 n.d 1.41 ± 0.15 0.65 ± 0.17 n.d n.d n.d 0.20 ± 0.05
15 35 n.d 0.43 ± 0.01 n.d 1.55 ± 0.07 0.59 ± 0.01 n.d n.d n.d 0.14 ± 0.02
15 45 n.d 0.43 ± 0.00 n.d 1.28 ± 0.00 0.47 ± 0.00 n.d n.d n.d 0.13 ± 0.00
15 55 n.d 0.42 ± 0.02 n.d 1.43 ± 0.07 0.55 ± 0.07 n.d n.d n.d 0.14 ± 0.01
15 65 n.d 1.07 ± 0.10 n.d 1.62 ± 0.02 0.61 ± 0.09 n.d n.d n.d 0.19 ± 0.03
15 75 n.d 0.31 ± 0.13 n.d 1.63 ± 0.16 0.56 ± 0.14 n.d n.d n.d 0.14 ± 0.03
5 25 n.d 0.06 ± 0.02 n.d 0.74 ± 0.13 0.11 ± 0.01 n.d n.d n.d 0.11 ± 0.06
5 35 n.d 0.09 ± 0.00 n.d 0.70 ± 0.12 0.16 ± 0.09 n.d n.d n.d 0.08 ± 0.01
5 45 n.d 0.08 ± 0.02 n.d 0.69 ± 0.21 0.23 ± 0.05 n.d n.d n.d 0.18 ± 0.12
5 55 n.d 0.10 ± 0.06 n.d 0.88 ± 0.15 0.22 ± 0.03 n.d n.d n.d 0.08 ± 0.01
5 65 n.d 0.12 ± 0.05 n.d 0.99 ± 0.05 0.25 ± 0.05 n.d n.d n.d 0.10 ± 0.02
5 75 n.d 0.07 ± 0.02 n.d 0.81 ± 0.10 0.27 ± 0.03 n.d n.d n.d 0.09 ± 0.00
10 25 n.d 0.12 ± 0.06 n.d 1.04 ± 0.06 0.32 ± 0.06 n.d n.d n.d 0.14 ± 0.04
10 35 n.d 0.16 ± 0.09 n.d 0.99 ± 0.32 0.41 ± 0.00 n.d n.d n.d 0.13 ± 0.02
10 45 n.d 0.10 ± 0.00 n.d 0.92 ± 0.39 0.31 ± 0.11 n.d n.d n.d 0.11 ± 0.03
10 55 n.d 0.11 ± 0.02 n.d 0.93 ± 0.52 0.31 ± 0.09 n.d n.d n.d 0.12 ± 0.01
10 65 n.d 0.06 ± 0.01 n.d 0.82 ± 0.35 0.26 ± 0.03 n.d n.d n.d 0.10 ± 0.04
10 75 n.d 0.10 ± 0.03 n.d 1.10 ± 0.48 0.27 ± 0.15 n.d n.d n.d 0.12 ± 0.00
15 25 n.d 0.16 ± 0.05 n.d 1.12 ± 0.16 0.40 ± 0.14 n.d n.d n.d 0.25 ± 0.22
15 35 n.d 0.25 ± 0.06 n.d 1.53 ± 0.01 0.52 ± 0.04 n.d n.d n.d 0.14 ± 0.02
15 45 n.d 0.23 ± 0.03 n.d 1.61 ± 0.12 0.50 ± 0.08 n.d n.d n.d 0.12 ± 0.02
15 55 n.d 0.20 ± 0.02 n.d 1.38 ± 0.22 0.51 ± 0.15 n.d n.d n.d 0.14 ± 0.03
15 65 n.d 0.23 ± 0.01 n.d 1.54 ± 0.04 0.52 ± 0.03 n.d n.d n.d 0.13 ± 0.01
15 75 n.d 0.20 ± 0.01 n.d 1.43 ± 0.06 0.50 ± 0.08 n.d n.d n.d 0.21 ± 0.11
Day 220
Day 0

307
Table E6: Organic acid profile of Day 0 stover after pretreatment with acids listed by decreasing inhibitory potentialₒ
ₒ Sowing mean values
Dry samples were dried at 55oC before pretreatment; Washed samples were washed before pretreatment. See text for detailed
Protocol * lactic acid can be metabolized by most fungi
? Pyruvic acid provides energy for most living cells and is a key intermediate for most metabolic processes. Like most things,
excess pyruvic acid could have negative impact. Pyruvic acid inhibitors are usually derivative compounds
√ √ Higher antimicrobial activity relative to other microbial group
High (11.7% DM) Low (1.0% DM)High (6.7% DM) Low (0.1% DM)
25 35 45 55 65 75 25 35 45 55 65 75 25 35 45 55 65 75
√ √√ 5 0.00 0.00 0.00 0.00 0.00 0.16 0.0 0.0 0.0 0.0 0.0 0.0 0.0 0.0 0.0 0.0 0.0 0.0
10 0.00 0.00 0.00 0.00 0.00 0.00 0.0 0.0 0.0 0.0 0.0 0.0 0.0 0.0 0.0 0.0 0.0 0.0
15 0.00 0.00 0.00 0.00 0.00 0.00 0.0 0.0 0.0 0.0 0.0 0.0 0.0 0.0 0.0 0.0 0.0 0.0
√√ √ 5 0.33 0.24 0.29 0.26 0.17 0.31 0.11 0.16 0.23 0.22 0.25 0.27 0.17 0.18 0.19 0.17 0.16 0.49
10 0.37 0.92 1.04 0.32 0.26 1.28 0.32 0.41 0.31 0.31 0.26 0.27 0.26 0.26 0.29 0.27 1.39 0.86
15 0.42 0.52 0.92 1.15 0.36 0.53 0.40 0.52 0.50 0.51 0.52 0.50 0.22 0.45 0.28 0.37 0.40 0.40
√ √ 5 0.00 0.00 0.00 0.00 0.00 4.36 0.0 0.0 0.0 0.0 0.0 0.0 0.0 0.0 0.0 0.0 0.0 0.0
10 0.00 0.00 0.00 0.00 0.00 0.00 0.0 0.0 0.0 0.0 0.0 0.0 0.0 0.0 0.0 0.0 0.0 0.0
15 0.00 0.00 0.00 0.00 0.00 0.00 0.0 0.0 0.0 0.0 0.0 0.0 0.0 0.0 0.0 0.0 0.0 0.0
√ √ 5 1.51 1.04 1.94 1.05 0.71 0.00 0.0 0.0 0.0 0.0 0.0 0.0 0.75 0.48 0.74 0.89 0.83 0.91
10 1.80 2.08 1.44 1.42 1.07 1.69 0.0 0.0 0.0 0.0 0.0 0.0 1.21 1.59 1.34 1.53 2.71 1.63
15 2.61 2.99 2.52 2.63 1.73 2.29 0.0 0.0 0.0 0.0 0.0 0.0 2.14 2.59 2.70 2.28 2.46 2.48
√√ √ 5 0.83 0.11 1.98 1.40 1.22 6.71 0.74 0.70 0.69 0.88 0.99 0.81 0.82 1.00 0.75 0.85 0.68 1.49
10 1.10 1.27 2.53 1.78 1.43 2.84 1.04 0.99 0.92 0.93 0.82 1.10 0.99 0.95 1.07 0.94 0.64 1.68
15 1.43 1.60 2.36 2.48 1.81 2.64 1.12 1.53 1.61 1.38 1.54 1.43 1.11 1.29 1.43 1.40 0.87 1.38
√ * 5 0.67 0.00 1.32 0.16 0.00 0.00 0.0 0.0 0.0 0.0 0.0 0.0 0.00 0.00 0.70 0.53 0.00 0.00
10 0.00 0.00 0.00 0.00 0.00 0.04 0.0 0.0 0.0 0.0 0.0 0.0 0.00 0.55 0.42 0.69 0.00 0.00
15 0.00 0.56 0.16 0.32 0.00 0.00 0.0 0.0 0.0 0.0 0.0 0.0 0.00 1.12 0.55 0.59 0.00 0.00
√ √√ 5 0.11 0.10 0.58 0.00 0.05 0.00 0.06 0.09 0.08 0.10 0.12 0.07 0.18 0.17 0.21 0.12 0.06 0.06
10 0.15 0.18 1.42 0.88 0.31 1.56 0.12 0.16 0.10 0.11 0.06 0.10 0.23 0.25 0.22 0.19 1.69 1.53
15 0.28 0.26 0.88 0.10 0.11 0.18 0.16 0.25 0.23 0.20 0.23 0.20 0.32 0.41 0.64 0.29 0.19 0.20
√ 5 0.0 0.0 0.0 0.0 0.0 0.0 0.0 0.0 0.0 0.0 0.0 0.0 1.09 0.92 0.12 1.35 3.20 3.27
10 0.0 0.0 0.0 0.0 0.0 0.0 0.0 0.0 0.0 0.0 0.0 0.0 0.56 0.68 0.06 0.00 1.67 0.29
15 0.0 0.0 0.0 0.0 0.0 0.0 0.0 0.0 0.0 0.0 0.0 0.0 0.68 0.54 0.31 0.60 0.63 0.59
? ? 5 0.14 0.44 0.27 0.08 0.11 0.18 0.11 0.08 0.18 0.08 0.10 0.09 0.30 0.46 0.30 0.31 1.93 1.05
10 0.20 0.55 0.59 0.33 0.19 0.81 0.14 0.13 0.11 0.12 0.10 0.12 0.47 0.47 0.28 0.27 2.36 0.77
15 0.30 0.34 0.66 0.00 0.24 0.18 0.25 0.14 0.12 0.14 0.13 0.21 0.41 0.50 0.38 0.30 0.29 0.24
5 3.59 1.93 6.38 2.95 2.26 11.72 1.02 1.03 1.18 1.28 1.46 1.24 3.31 3.21 3.01 4.22 6.86 7.27
10 3.62 5.00 7.02 4.73 3.26 8.22 1.62 1.69 1.44 1.47 1.24 1.59 3.72 4.75 3.68 3.89 10.46 6.76
15 5.04 6.27 7.50 6.68 4.25 5.82 1.93 2.44 2.46 2.23 2.42 2.34 4.88 6.90 6.29 5.83 4.84 5.29
Pretreatment
organic acids Bact
eria
Yeas
t &
mou
ld Pretreatment
time (min)
Average total acids
"As is", washed Dried, unwashed
Propionic (%)
Formic (%)
Butyric (%)
Isobutyric (%)
Acetic (%)
Lactic (%)
"As is", unwashed
Malic (%)
Tartaric
Pyruvic (%)
Total acids
Inhi
bito
ry p
oten
tial
5.35 1.67 5.29

308
Table E7: Amounts of Furfural and HMF generated in LHW pretreatment of dried and “as is”
stover
Storage
Duration
(days)
Pretreatment
time (min)
Storage
Moisture
(%)
HMF
(% DM)
Furfural
(% DM)
HMF
(% DM)
Furfural
(% DM)
HMF
(% DM)
Furfural
(% DM)
5 25 0.030 ±0.028 0.310 ±0.311 0.002 ±0.000 0.040 ±0.000 0.002 ±0.000 0.019 ±0.008
5 35 0.025 ±0.007 0.160 ±0.042 0.005 ±0.000 0.070 ±0.000 0.002 ±0.000 0.034 ±0.001
5 45 0.045 ±0.021 0.320 ±0.127 0.004 ±0.000 0.080 ±0.014 0.002 ±0.000 0.035 ±0.007
5 55 0.025 ±0.007 0.215 ±0.120 0.003 ±0.000 0.085 ±0.007 0.002 ±0.000 0.037 ±0.007
5 65 0.010 ±0.000 0.120 ±0.014 0.003 ±0.000 0.105 ±0.007 0.003 ±0.000 0.040 ±0.003
5 75 0.015 ±0.007 0.185 ±0.035 0.001 ±0.000 0.020 ±0.000 0.002 ±0.000 0.034 ±0.001
10 25 0.030 ±0.000 0.325 ±0.035 0.006 ±0.001 0.110 ±0.000 0.004 ±0.001 0.059 ±0.027
10 35 0.045 ±0.007 0.410 ±0.014 0.005 ±0.003 0.110 ±0.085 0.004 ±0.000 0.089 ±0.029
10 45 0.055 ±0.007 0.540 ±0.156 0.007 ±0.001 0.195 ±0.021 0.004 ±0.000 0.093 ±0.011
10 55 0.030 ±0.014 0.380 ±0.212 0.006 ±0.000 0.200 ±0.014 0.005 ±0.000 0.103 ±0.035
10 65 0.020 ±0.000 0.325 ±0.007 0.005 ±0.000 0.200 ±0.042 0.004 ±0.001 0.065 ±0.017
10 75 0.030 ±0.014 0.405 ±0.106 0.002 ±0.000 0.065 ±0.007 0.005 ±0.002 0.116 ±0.007
15 25 0.050 ±0.014 0.595 ±0.120 0.006 ±0.002 0.175 ±0.049 0.007 ±0.002 0.087 ±0.030
15 35 0.040 ±0.028 0.350 ±0.396 0.010 ±0.002 0.270 ±0.071 0.008 ±0.002 0.109 ±0.020
15 45 0.060 ±0.000 0.780 ±0.014 0.007 ±0.004 0.260 ±0.170 0.005 ±0.007 0.065 ±0.091
15 55 0.045 ±0.035 0.540 ±0.438 0.009 ±0.000 0.415 ±0.007 0.009 ±0.000 0.127 ±0.013
15 65 0.020 ±0.014 0.300 ±0.226 0.006 ±0.003 0.255 ±0.148 0.011 ±0.001 0.169 ±0.007
15 75 0.040 ±0.014 0.500 ±0.198 0.004 ±0.001 0.155 ±0.035 0.006 ±0.000 0.072 ±0.007
5 25 0.015 ±0.01 0.065 ±0.044 0.002 ±0.001 0.040 ±0.014 0.000 ±0.000 0.000 ±0.000
5 35 0.020 ±0.008 0.093 ±0.010 0.001 ±0.000 0.025 ±0.007 0.001 ±0.000 0.011 ±0.001
5 45 0.020 ±0.000 0.090 ±0.000 0.002 ±0.002 0.050 ±0.057 0.001 ±0.000 0.012 ±0.002
5 55 0.015 ±0.006 0.083 ±0.010 0.001 ±0.000 0.015 ±0.007 0.001 ±0.000 0.013 ±0.004
5 65 0.010 ±0.000 0.075 ±0.006 0.000 ±0.000 0.010 ±0.000 0.001 ±0.000 0.017 ±0.003
5 75 0.010 ±0.000 0.070 ±0.008 0.001 ±0.000 0.020 ±0.000 0.001 ±0.000 0.022 ±0.010
10 25 0.033 ±0.005 0.255 ±0.010 0.004 ±0.001 0.090 ±0.028 0.002 ±0.000 0.027 ±0.001
10 35 0.035 ±0.006 0.253 ±0.034 0.004 ±0.001 0.080 ±0.014 0.003 ±0.000 0.043 ±0.010
10 45 0.033 ±0.005 0.253 ±0.010 0.002 ±0.000 0.060 ±0.014 0.003 ±0.000 0.052 ±0.019
10 55 0.025 ±0.006 0.228 ±0.029 0.002 ±0.001 0.060 ±0.014 0.003 ±0.000 0.044 ±0.012
10 65 0.020 ±0.000 0.223 ±0.022 0.001 ±0.000 0.050 ±0.000 0.005 ±0.002 0.096 ±0.040
10 75 0.020 ±0.000 0.208 ±0.015 0.002 ±0.001 0.095 ±0.007 0.003 ±0.001 0.053 ±0.001
15 25 0.050 ±0.000 0.493 ±0.017 0.005 ±0.001 0.140 ±0.014 0.004 ±0.000 0.044 ±0.004
15 35 0.065 ±0.019 0.550 ±0.077 0.006 ±0.001 0.175 ±0.007 0.005 ±0.000 0.069 ±0.002
15 45 0.053 ±0.005 0.533 ±0.025 0.004 ±0.001 0.135 ±0.049 0.007 ±0.001 0.086 ±0.028
15 55 0.040 ±0.000 0.465 ±0.053 0.003 ±0.000 0.115 ±0.007 0.005 ±0.001 0.066 ±0.009
15 65 0.040 ±0.000 0.490 ±0.050 0.003 ±0.001 0.100 ±0.028 0.006 ±0.001 0.082 ±0.005
15 75 0.030 ±0.000 0.413 ±0.041 0.003 ±0.000 0.140 ±0.014 0.006 ±0.000 0.096 ±0.032
Day 220
Day 0
Unwashed, Dried Unwashed, "As is" Washed, "As is"

309
Table E8: Glucan removal (as % of initial amount present) after pretreatment of dried and “as is”
stover
Day 220 Day 0
Pretreatment
time (min)
Nominal
moisture
content
(%)
Dried,
Unwashed
"As is",
Unwashed
"As is",
Washed
Dried,
Unwashed
"As is",
Unwashed
"As is",
Washed
5 25 3.75 ± 0.50 3.81 ± 0.12 4.50 ± 0.16 4.50 ± 0.04 5.02 ± 1.00 2.79 ± 0.13
5 35 3.08 ± 0.61 4.11 ± 0.44 3.29 ± 0.01 4.38 ± 0.03 4.60 ± 1.45 3.67 ± 1.36
5 45 3.18 ± 0.20 3.26 ± 1.16 2.90 ± 0.19 4.33 ± 0.47 5.35 ± 2.51 3.53 ± 0.33
5 55 3.02 ± 0.07 3.48 ± 0.98 3.16 ± 0.10 4.02 ± 0.51 3.44 ± 0.20 3.17 ± 1.02
5 65 2.68 ± 0.14 2.61 ± 0.49 3.68 ± 0.11 3.21 ± 0.47 3.61 ± 0.11 3.93 ± 0.16
5 75 2.07 ± 0.21 2.24 ± 0.18 2.47 ± 0.44 5.11 ± 0.42 1.75 ± 0.38 2.41 ± 0.63
10 25 3.71 ± 0.05 3.81 ± 0.54 5.71 ± 0.50 4.72 ± 0.01 5.24 ± 1.14 2.66 ± 0.42
10 35 2.94 ± 0.20 3.11 ± 0.57 3.54 ± 0.04 4.97 ± 0.39 5.58 ± 0.04 3.70 ± 0.76
10 45 2.88 ± 0.14 3.75 ± 1.12 3.43 ± 0.23 4.71 ± 0.76 4.41 ± 0.56 4.04 ± 0.58
10 55 2.95 ± 0.01 3.37 ± 0.03 3.34 ± 0.39 4.43 ± 0.22 5.64 ± 0.63 3.92 ± 0.58
10 65 2.88 ± 0.33 3.16 ± 0.90 3.86 ± 0.16 3.76 ± 0.20 3.46 ± 0.19 4.48 ± 0.41
10 75 2.81 ± 0.20 2.31 ± 0.33 3.98 ± 0.03 5.06 ± 0.31 5.41 ± 0.86 3.88 ± 0.10
15 25 2.74 ± 1.23 4.86 ± 2.63 4.91 ± 0.45 4.62 ± 0.99 4.45 ± 0.57 3.87 ± 0.04
15 35 2.80 ± 0.03 3.75 ± 1.17 3.37 ± 0.41 4.87 ± 0.01 6.90 ± 1.16 5.52 ± 1.87
15 45 2.89 ± 0.04 4.11 ± 0.59 3.47 ± 0.30 4.79 ± 0.36 4.55 ± 2.28 4.54 ± 0.45
15 55 3.17 ± 0.16 2.81 ± 0.41 3.20 ± 0.06 3.96 ± 0.25 5.64 ± 1.04 3.65 ± 0.46
15 65 2.74 ± 0.01 2.53 ± 0.16 3.82 ± 0.17 4.11 ± 0.80 4.14 ± 0.95 4.82 ± 0.86
15 75 2.53 ± 0.18 4.15 ± 0.35 3.66 ± 0.38 5.18 ± 0.95 4.64 ± 0.17 3.76 ± 0.20

310
Table E9: Xylan removal (as % of initial amount present) after pretreatment of dried and “as is”
stover
Day 220 Day 0
Pretreatment
time (min)
Nominal
moisture
content
(%)
Dried,
Unwashed
"As is",
Unwashed
"As is",
Washed
Dried,
Unwashed
"As is",
Unwashed
"As is",
Washed
5 25 23.94 ± 2.75 22.33 ± 5.63 37.92 ± 5.70 22.27 ± 1.57 29.35 ± 2.80 25.93 ± 2.23
5 35 22.75 ± 2.65 30.62 ± 3.11 44.76 ± 1.09 23.51 ± 1.03 20.47 ± 0.62 26.62 ± 3.81
5 45 30.14 ± 2.86 34.61 ± 2.18 48.00 ± 3.13 21.64 ± 0.06 25.69 ± 14.65 30.76 ± 3.30
5 55 27.63 ± 0.73 33.31 ± 2.5 47.00 ± 0.47 22.84 ± 3.45 20.48 ± 1.04 30.56 ± 9.15
5 65 24.37 ± 1.18 26.64 ± 2.53 47.29 ± 2.94 19.10 ± 0.88 20.70 ± 3.42 37.37 ± 0.30
5 75 18.86 ± 1.25 20.17 ± 1.43 40.34 ± 2.89 22.29 ± 5.51 18.90 ± 2.56 23.07 ± 5.70
10 25 27.14 ± 0.33 32.86 ± 1.05 47.83 ± 0.53 28.76 ± 0.26 35.30 ± 0.58 28.54 ± 3.05
10 35 23.36 ± 0.95 33.83 ± 7.22 47.15 ± 0.85 28.64 ± 1.96 34.17 ± 5.11 35.18 ± 3.82
10 45 29.03 ± 1.42 39.69 ± 3.94 49.76 ± 1.64 26.79 ± 3.98 32.14 ± 2.65 39.67 ± 4.99
10 55 28.09 ± 0.84 34.59 ± 1.37 45.24 ± 4.55 29.46 ± 0.30 35.04 ± 1.12 41.45 ± 1.41
10 65 25.24 ± 1.85 31.07 ± 0.42 48.08 ± 1.86 23.76 ± 3.86 30.06 ± 1.23 41.16 ± 0.20
10 75 27.01 ± 1.39 29.04 ± 1.04 57.09 ± 0.82 25.99 ± 2.02 35.16 ± 3.34 38.63 ± 0.18
15 25 21.92 ± 5.78 34.89 ± 4.18 39.84 ± 4.17 27.69 ± 1.59 32.06 ± 6.20 33.89 ± 3.64
15 35 22.74 ± 1.54 33.24 ± 7.16 42.77 ± 6.11 27.25 ± 0.78 37.04 ± 3.10 38.83 ± 2.66
15 45 24.81 ± 1.57 37.37 ± 3.17 43.85 ± 3.63 26.88 ± 2.22 39.28 ± 3.46 40.59 ± 2.29
15 55 26.95 ± 1.01 30.3 ± 1.89 40.24 ± 0.66 27.71 ± 2.24 33.72 ± 4.15 41.22 ± 2.26
15 65 23.61 ± 2.34 24.22 ± 1.48 41.10 ± 2.16 26.71 ± 0.78 29.08 ± 1.05 40.42 ± 0.68
15 75 23.27 ± 2.36 31.26 ± 3.08 43.36 ± 4.19 26.34 ± 2.88 32.52 ± 0.51 37.41 ± 0.26

311
Table E10: Pretreatment products of washed dried stover at 15 minutes retention time
Moisture
content
(%)
Glucan
removed*
(%)
Xylan
removed*
(%)
Malic
(% DM)
Lactic
(% DM)
Acetic
(% DM)
Formic
(% DM)
Pyruvic
(% DM)
HMF
(% DM)
Furfural
(% DM)
25 3.43 ± 0.55 31.75 ± 1.95 1.78 ± 2.10 0.29 ± 0.01 0.83 ± 0.08 0.38 ± 0.02 0.23 ± 0.15 n.d 0.93 ± 0.05
35 3.41 ± 0.52 38.62 ± 6.75 1.93 ± 2.23 0.37 ± 0.09 0.89 ± 0.00 0.34 ± 0.01 0.22 ± 0.17 n.d 1.2 ± 0.100
45 3.32 ± 0.34 39.60 ± 5.13 2.42 ± 2.83 0.38 ± 0.09 0.87 ± 0.01 0.38 ± 0.04 0.08 ± 0.04 n.d 1.33 ± 0.06
55 3.24 ± 0.37 36.97 ± 2.72 2.90 ± 2.23 0.32 ± 0.01 0.91 ± 0.02 0.31 ± 0.00 0.23 ± 0.11 n.d 1.41 ± 0.02
65 2.67 ± 0.14 32.77 ± 0.88 3.26 ± 0.10 0.41 ± 0.14 0.79 ± 0.04 0.28 ± 0.03 0.30 ± 0.02 n.d 1.19 ± 0.06
75 2.74 ± 0.41 32.85 ± 1.53 0.37 ± 0.01 0.17 ± 0.07 0.93 ± 0.06 0.34 ± 0.03 0.09 ± 0.00 n.d 0.69 ± 0.01
* Glucan and xylan removed are percentage of original amount before pretreatment
n.d = not detected

312
Table E11: Pretreatment product and fermentation yield of dried ground “as received” stover*
* “As received” stover is stover that has not been adjusted for moisture and not ensiled. Moisture content is about 7%
Glucan and xylan removed are percentage of original amount before pretreatment
Glucan removal was not significantly different for unwashed (4.68 ± 1.16) and washed (4.84 ± 0.28) “as received” samples, p = 0.754
Xylan removal was also not significantly different: Unwashed = 30.27 ± 1.95, washed = 27.45 ± 3.44, p = 0.124
Glucan and xylan removal not significantly different across pretreatment times
pH and organic acids not significantly different for unwashed and washed “as received” samples
No significant difference in ethanol yield of unwashed (47.16 ± 3.13) and washed (46.39 ± 6.06) samples, p =0.787.
Ethanol yield at 5 minute retention time was significantly lower than 10 and 15 minutes (p = 0.02), both of which were not significantly different
from each other.
Pretreat-
ment
time
(min)
pH after
pretreatment
Glucan
removed
(%)
Xylan
removed
(%)
Tartaric
(% DM)
Malic
(% DM)
Acetic
(% DM)
Formic
(% DM)
Isobutyric
(% DM)
Pyruvic
(% DM)
5-HMF
(% DM)
Furfural
(% DM)
Ethanol
(%
theoretical)
5 4.52 ± 0.09 5.6 ± 0.35 31.57 ± 0.94 2.24 ± 0.05 0.32 ± 0.17 1.50 ± 0.18 0.35 ± 0.18 2.06 ± 1.65 0.44 ± 0.01 0.08 ± 0.06 0.29 ± 0.20 43.64 ± 0.74
10 4.30 ± 0.01 4.66 ± 0.38 26.09 ± 5.17 1.78 ± 0.91 0.32 ± 0.05 1.85 ± 0.27 0.33 ± 0.01 1.95 ± 0.25 0.27 ± 0.27 0.07 ± 0.00 0.36 ± 0.01 49.43 ± 1.30
15 4.15 ± 0.01 3.49 ± 1.34 29.79 ± 3.24 0.45 ± 0.49 0.54 ± 0.09 2.34 ± 0.08 0.46 ± 0.02 2.90 ± 0.45 0.37 ± 0.04 0.14 ± 0.01 0.69 ± 0.01 48.42 ± 2.90
5 4.30 ± 0.30 4.92 ± 0.21 30.51 ± 1.77 1.48 ± 0.91 0.43 ± 0.26 2.01 ± 0.63 0.37 ± 0.19 2.18 ± 1.94 0.43 ± 0.06 0.09 ± 0.06 0.44 ± 0.45 39.23 ± 1.34
10 4.26 ± 0.01 4.97 ± 0.32 29.46 ± 1.6 0.10 ± 0.01 0.30 ± 0.11 1.08 ± 1.52 0.23 ± 0.18 1.02 ± 1.27 0.17 ± 0.24 0.05 ± 0.05 0.20 ± 0.28 47.62 ± 1.34
15 4.33 ± 0.21 4.95 ± 0.11 25.76 ± 1.13 2.54 ± 0.62 0.24 ± 0.02 1.46 ± 0.08 0.21 ± 0.03 0.72 ± 0.03 0.38 ± 0.13 0.04 ± 0.01 0.13 ± 0.03 52.31 ± 1.73
Unwashed
Washed

313
Table E12: Ethanol yields (percentage of theoretical) of dried and “as is” stover
Day 220 Day 0
Pretreatment time
(min)
Moisture
content (%)
Dry,
Unwashed
Dry,
Washed
"As is",
Unwashed
"As is",
Washed
Dry,
Unwashed
"As is",
Unwashed
"As is",
Washed
5 25 35.85 ± 0.52 29.94 ± 1.80 65.67 ± 2.70 53.97 ± 1.41 46.26 ± 1.39 55.75 ± 0.72 43.84 ± 0.83
5 35 38.66 ± 0.88 32.50 ± 1.28 58.80 ± 0.94 61.02 ± 0.62 44.00 ± 1.13 52.66 ± 8.60 47.87 ± 10.66
5 45 37.55 ± 0.16 34.81 ± 2.42 56.58 ± 2.62 48.11 ± 7.50 42.38 ± 0.11 53.14 ± 1.78 50.45 ± 0.57
5 55 38.19 ± 4.45 31.36 ± 0.97 55.99 ± 5.35 55.68 ± 0.09 46.57 ± 0.98 45.90 ± 8.41 49.74 ± 3.50
5 65 36.82 ± 0.03 33.97 ± 0.35 47.29 ± 0.08 58.71 ± 5.18 43.33 ± 0.88 56.80 ± 1.65 56.37 ± 2.71
5 75 34.13 ± 1.87 28.07 ± 0.89 47.45 ± 9.22 55.58 ± 10.72 43.20 ± 1.15 26.28 ± 12.81 47.64 ± 5.60
10 25 39.99 ± 1.66 47.96 ± 0.77 53.55 ± 6.01 62.98 ± 4.84 47.59 ± 2.32 62.73 ± 7.04 44.38 ± 1.31
10 35 38.53 ± 3.79 39.47 ± 1.12 62.54 ± 2.64 67.56 ± 2.72 47.34 ± 1.12 54.57 ± 1.19 51.54 ± 4.02
10 45 43.36 ± 2.93 41.54 ± 5.13 57.73 ± 4.19 67.28 ± 9.04 49.14 ± 1.45 59.31 ± 8.79 50.32 ± 9.24
10 55 40.31 ± 3.78 42.63 ± 1.42 54.64 ± 4.06 63.01 ± 1.86 50.25 ± 0.77 53.67 ± 13.52 54.40 ± 3.97
10 65 41.73 ± 0.47 43.13 ± 0.96 56.36 ± 2.50 68.14 ± 2.11 45.49 ± 2.67 53.02 ± 0.26 58.43 ± 3.25
10 75 36.36 ± 0.88 32.57 ± 0.07 11.91 ± 1.05 59.40 ± 7.03 47.61 ± 0.79 64.74 ± 11.02 55.71 ± 1.66
15 25 42.63 ± 3.83 40.86 ± 3.63 59.07 ± 1.35 68.05 ± 1.15 52.72 ± 4.00 55.04 ± 13.67 48.98 ± 2.33
15 35 48.01 ± 0.87 42.31 ± 1.23 63.34 ± 2.84 68.75 ± 0.98 51.52 ± 1.87 60.05 ± 5.49 59.39 ± 1.51
15 45 55.33 ± 4.26 47.14 ± 1.01 66.82 ± 7.21 70.45 ± 3.09 52.63 ± 0.92 66.56 ± 4.58 63.98 ± 3.32
15 55 49.97 ± 2.70 31.01 ± 1.87 58.54 ± 2.99 68.92 ± 2.28 52.76 ± 0.54 52.67 ± 4.55 54.93 ± 1.72
15 65 48.94 ± 1.82 39.25 ± 8.39 55.47 ± 0.06 70.64 ± 1.84 51.85 ± 0.33 52.80 ± 1.77 60.04 ± 5.79
15 75 23.75 ± 3.32 37.68 ± 3.33 47.78 ± 2.07 43.43 ± 36.18 53.34 ± 0.38 57.14 ± 1.57 59.54 ± 4.00

314
Figure E2: Ethanol dependency on main organic acids generated during pretreatment of
unwashed “as is” samples. Top = yield distinguished by storage; Bottom = yield distinguished by
pretreatment time
Lactic (% DM)
Eth
an
ol (%
th
eo
reti
cal)
840
80
70
60
50
40
30
20
10
Acetic (% DM)
840
Isobutyric (% DM)
5.02.50.0
Butyric (% DM)
420
pretreat
time
5
10
15
Lactic (% DM)
Eth
an
ol (%
th
eo
reti
ca
l)
840
80
70
60
50
40
30
20
10
Acetic (% DM)
840
Isobutyric (% DM)
5.02.50.0
Butyric (% DM)
420
Storage
Ensiled
Unensiled

315
Figure E3: Ethanol dependency on main organic acids generated during pretreatment of
unwashed dried samples. Top = yield distinguished by storage; Bottom = yield distinguished by
pretreatment time
Lactic (% DM)
Eth
an
ol (%
th
eo
reti
ca
l)
420
60
50
40
30
20
Acetic (% DM)
210
Isobutyric (% DM)
420
PRT
time
5
10
15
Lactic (% DM)
Eth
an
ol (%
th
ere
tica
l)
420
60
50
40
30
20
Acetic (% DM)
210
Isobutyric (% DM)
420
store
Ensiled
Unensiled

316
APPENDIX F: Quality indices and model
(Chapter 7)
Tables F1 to F4 were used in defining the qualitative matrix relating organic acid to dry matter
loss, glucose yield and ethanol yields.
Table F1: Ethanol yield classification using pretreatment acids and storage acids
Pretreatment acids Storage acids
Lactic
(% DM)
Acetic
(% DM)
Isobutyric
(% DM)
EtoH
Yield
EtoH
Yield
Lactic
(% DM)
Acetic
(% DM)
Isobutyric
(% DM)
Butyric
(% DM)
MeanGrp1 0.90 2.40 3.25 62.87 61.09 1.97 0.66 0.20 0.00
MeanGrp2 1.94 3.26 2.53 53.23 50.95 1.94 1.51 0.51 0.73
MeanGrp3 0.00 8.13 0.00 11.90 11.90 0.00 2.74 1.28 2.57
Stand. Dev. Grp1 1.24 1.11 1.74 3.66 3.85 1.10 0.37 0.11 0.00
Stand. Dev. Grp2 1.96 1.46 1.13 4.85 4.37 1.46 0.86 0.51 1.20
Stand. Dev. Grp3 0.00 0.03 0.00 1.06 1.06 0.00 0.00 0.00 0.00
Minimum1 0.00 0.44 1.20 59.46 56.42 0.26 0.14 0.04 0.00
Minimum2 0.00 1.57 0.00 40.93 40.93 0.00 0.14 0.04 0.00
Minimum3 0.00 8.11 0.00 11.16 11.16 0.00 2.74 1.28 2.57
Maximum1 3.42 4.23 6.20 71.92 71.92 3.03 1.24 0.34 0.00
Maximum2 7.80 7.13 5.03 58.43 55.51 3.03 2.74 1.28 2.57
Maximum3 0.00 8.15 0.00 12.65 12.65 0.00 2.74 1.28 2.57

317
Table F2: Comparing pretreatment acids of dry and “as is” sample used in ethanol yield
classification.
Dry "As is"
Lactic (%DM)
Acetic (%DM)
Isobutyric (% DM)
EtOH yield, %
theoretical
EtOH yield, %
theoretical Lactic
(%DM) Acetic
(%DM) Isobutyric
(% DM)
MeanGrp1 2.89 0.56 1.20 38.37 19.09 0.00 7.42 0.00
MeanGrp2 1.00 0.84 1.23 47.84 53.19 1.00 2.34 2.06
MeanGrp3 0.89 1.09 2.13 54.82 64.19 0.58 2.24 2.85
Stand. Dev. Grp1 0.81 0.30 0.81 4.88 11.13 0.00 0.91 0.00
Stand. Dev. Grp2 1.37 0.48 0.77 2.28 4.70 1.61 1.41 0.99
Stand. Dev. Grp3 1.14 0.35 0.51 2.24 3.88 1.06 0.98 1.51
Minimum1 1.38 0.00 0.00 22.40 11.16 0.00 6.24 0.00
Minimum2 0.00 0.00 0.00 44.03 39.95 0.00 0.00 0.00
Minimum3 0.00 0.35 0.89 51.86 59.46 0.00 0.44 1.20
Maximum1 4.22 1.03 2.64 43.33 35.33 0.00 8.15 0.00
Maximum2 3.95 2.16 3.87 50.88 58.74 7.80 7.13 5.03
Maximum3 3.75 1.71 2.86 61.06 72.53 3.42 4.23 6.20
Table F3: Dry matter loss grouping using storage organic acids
Dry matter loss (%)
Lactic (% DM)
Acetic (% DM)
Isobutyric (% DM)
Butyric (% DM)
MeanGrp1 0.24 1.49 0.51 0.26 0.00
MeanGrp2 3.32 2.47 0.86 0.27 0.03
MeanGrp3 4.16 0.26 2.28 1.70 1.57
Stand. Dev. Grp1 0.95 0.78 0.44 0.49 0.02
Stand. Dev. Grp2 0.99 0.65 0.40 0.37 0.11
Stand. Dev. Grp3 1.57 0.54 0.46 0.92 1.24
Minimum1 -1.67 0.11 0.00 0.00 0.00
Minimum2 1.54 0.90 0.21 0.00 0.00
Minimum3 1.60 0.00 1.60 0.54 0.10
Maximum1 1.77 2.90 1.86 1.90 0.10
Maximum2 5.56 3.20 1.78 1.46 0.49
Maximum3 5.92 1.36 2.74 3.22 3.51

318
Table F4: Glucose yield, grouping based on storage organic acids
Glucose (%
theoretical) Lactic
(% DM) Acetic
(% DM) Isobutyric
(% DM) Butyric (% DM)
MeanGrp1 16.50 0.39 2.55 1.61 1.21
MeanGrp2 22.82 2.44 0.83 0.22 0.00
MeanGrp3 16.97 0.54 0.16 0.07 0.00
Stand. Dev. Grp1 3.93 0.61 0.78 0.81 1.06
Stand. Dev. Grp2 3.09 0.87 0.34 0.14 0.00
Stand. Dev. Grp3 10.39 0.52 0.19 0.07 0.00
Minimum1 9.14 0.00 1.49 0.00 0.00
Minimum2 16.24 1.33 0.20 0.00 0.00
Minimum3 5.02 0.00 0.00 0.00 0.00
Maximum1 19.96 1.42 4.17 2.41 3.14
Maximum2 27.91 4.95 1.37 0.59 0.00
Maximum3 28.65 1.16 0.42 0.15 0.00

319
Table F5: General observation in amounts of organic acids after pretreatment of “As is”
samples* and corresponding storage acids
Percent point Difference (Pretreatment acids –
storage acids) Storage acid amount (% DM) Storage Moisture (%) proportion of samples
Lactic
(-3.03) – (-0.02)a 1.94 - 3.03 35 -65% (Ensiled) 0.22
0.00 0.00 25 – 75% (Unensiled), 75%
(Ensiled)b 0.44
0.07 – 1.00 0, 2.90 – 3.03c Mostly 55% and 75%d 0.21
1.02 – 4.90
Most (78% of samples) have less than 0.30% lactic. 22% of
samples have 2.90 – 3.03% lactic
Mostly 25% 0.13
Acetice
≤ 1%f Mixed (0.00 – 2.74) 25, 35, 65 and 75 0.11
1.00 – 1.99 0 ≤ 1.24; about 51% of
samples have 0.00% acetic Mostly 25%, 35% and 55% 0.49
2.00 – 2.99 0 ≤ 1.24; about 32% of
samples have 0.00% acetic Mostly 45% and 55% 0.26
3.00 - 7.00 50% samples have > 1.20% acetic; 50% have < 1.20%
Mostly 75% 0.14
Isobutyric
(-1.28) - 0.00g 1.28 – 0.00 75% (mostly ensiled) 0.08
0.00 ≤ 2.00 0.00– 1.28; 62% of samples
have 0.00% isobutyric Mainly 55% and 25% (but 25
-75%) 0.46
2.00 – 6.00% 0.00 – 0.34; 33% of samples
have 0.00% isobutyric Mainly 35% and 45% 0.46
*”As is” samples are samples that were not processed (either by drying or size reduction) before pretreatment. Negative
values imply a decrease in storage amount after pretreatment. a Generally, lactic acid was not detected in about 60% of pretreated samples. Within this group, lactic acid was not
detected except in 5 samples. Lactic acid disappearance was observed in only ensiled samples. About half of the ensiled
samples were within this group and where associated with high storage lactic. 75% ensiled samples generally had no
lactic acid. Less than half the samples showed an increase in acid over storage amount. Of these, some had high storage
lactic and these samples generally had lesser increase of storage amount.
b This does not include all unensiled samples although all moisture levels are embraced c Few samples with no lactic acid during storage generated lactic acid during pretreatment (almost half the samples in
this group had 0%). Generally, lactic acid in these samples was generated at 15 minutes pretreatment retention time.
Two samples at 5 minutes also generated lactic acid d Two samples had moisture of 45% and two had 65% e Found in all pretreated samples; All 0 percent acetic during storage = unensiled samples f Only two samples decreased in acetic acid content ( i.e. are negative: -0.14 and -0.31) g Within this group, no isobutyric was detected in pretreated sample. And in fact the only samples without any isobutyric
in all pretreated samples

320
Figure F1: Model input interface (Part 1. Process cost modeling ending with feedstock delivery
cost)
And impact on Feedstock delivery cost
Farm size 500 Acres Corn yield 123 Bushels/acre
Storage type Dry storage
Harvest time (month/day; up
to mid December) 11/2or
Days after grain
Harvest 0Up to 35 days
Or specifyheight below
Height of cut 2 Plant height 140
Harvesting and collection operations (tick all that apply)
TRUE
TRUE
TRUE
TRUE
TRUE 3
TRUE Large round bale
TRUEChoose this option only if contract
is for complete harvest FALSE Choose forage harvester type blower
TRUE 1 1
FALSE
FALSEChoose if contract is for complete
wet storage harvest TRUE
Moisture content entering into storage (%) 30
Storage structures/configurations
All bales are assumed to be tied with twine or wire
Dry storage Wet storage
Structure 1 1
Under roof, enclosed barn Vertical si lo (Tower)
Wrapping 1 If no wrapping, leave blank. Under roof, enclosed barn does not require wrapping
Wrapping materials 3 If using "under roof, enclosed barn", leave this option blank
Also for "On field, covered with plastic or tarp", wrapping material, if applicable should be net
Base 3 If using "under roof, enclosed barn", leave this option blank. But must select an option if using on-field storage
Stacking 2
End stacking - vertically
Bale diameter/width (inches) 50 Bale length (inches) 30
Bale density (lbs/cu ft) 25 Silage density (lbs/cu ft)
Storage duration (days) 180
Transportation to biorefinery
Transportation distance
(up to 125 miles) 25 Transportation mode Road
Container size
Go to Outputs
Mower conditioner
Windrowing
Baling
Rakng
Shredding
Hauling
Use forage harvester (Silage)
Staking bales
Chopping (Silage)
Cutting, raking, baling, hauling, and stacking
Hauling (Silage)
Chopping, Hauling and filling silo
DRY MATTER LOSSES UNDER VARIOUS STORAGE SYSTEMS

321
Figure F2: Model input interface – truncated. (Part 2. Ethanol prediction and cost modeling
ending with ethanol production cost)
Storage type Dry storage
Storage configuration Under roof, enclosed barn
Storage starting moisture (%) 30
Moisture of feedstock delivered (%) 5
Storage duration (days) 180
Tons delivered 1086
Feedstock purchase price ($/ton) 34.51
Feedstock composition 1 Enter estimates Glucan: 34 %
Use my estimates Xylan: 21 %
%
%
Storage overseen by 2
Biorefinery
Estimate process Dry matter loss (%) 10
Number of farmers contracted 600
Preprocesing
FALSE No washing
FALSE No drying
TRUE Ground 6 mm
0.2362206
Fermentation 2
Glucose and Xylose
LHW Pretreatment time (min) 10
Go to output
Nameplate Capacity 70,000,000 gal./yr. Construction Cost
CAPITAL COST Total
Equipments Equity
Feed Handling 7,500,000.00 $ Debt
Pretreatment 18,900,000.00 $ Per Gallon Nameplate Cap.
Neutralization/Conditioning [7800000] $ Per Gallon Operating Cap.
Saccharification & Fermentation 9,400,000.00 $ Per Bushel Operating Cap.
Distil lation and Solids Recovery 21,800,000.00 $ Depreciation
Wastewater Treatment 3,300,000.00 $ Ethanol Production
Storage 2,000,000.00 $ Nameplate Capacity
Boiler/Turbogenerator 38,300,000.00 $ Operating Capacity
Util ities 4,700,000.00 $
Total Equipment cost 105,900,000.00 $ Corn stover Usage
Warehouse 1,588,500.00 $ Natural Gas Usage
Site Development 5,893,751.75 $ Electricity Usage
Total Installed Cost (TIC) 113,382,251.75 $ Electricity Cost
Indirect Costs Water Usage
Field Expenses 22,676,450.35 $ Water Cost
Home Office & Construction Fee 28,345,562.94 $ Number of Employees
Project Contingency 3,401,467.55 $ Labor & Management Cost
Total Capital Investment (TCI) 167,805,732.59 $ Interest Cost
Other Costs Cellulolytic enzymes
(Startup, Permits, etc.) 16,780,573.26 $ Fermenting microbe (Yeasts)
Working Capital 14,512,928.22 $ Chemical: process & antibiotics
$ Chemical: waste treatment
Total Project Investment 199,099,234.07 $ Boiler cooling tower
per year
70,000,000 gallons per year
26,777,265 gallons per year
$9,954,961.70
Inputs Internal Output
Facility Construction Annual Production and Resource Usage
$7.44
$99,549,617
$99,549,617
Reduction size
$8,212,843
77
$199,099,234
$2.84
$4.93
619,123
24,100
$120,498
$2,054,000
Economic Model of an Ethanol Production Facility
You can change the contents of input category below if you have data fitting your system
per year
per year
per year
803,318
$10,711
$64,265
$2,704,504
937,204
$602,488
$3,280
bushels per year
1,000 cubic feet/year
per year
per year
per year
per year
$669,432
employees
per year
kilowatt hours/year
gallons per year
Washing
Drying
Size reduction (grinding)
ETHANOL YIELD and PRODUCTION COST

322
Table F6: Dry matter loss relationship for dry storage used in the model
Storage condition
Under roof, enclosed Relationship from this study
Under roof, open sides, elevated = 1.75 x “Under roof, enclosed”
Under roof, open sides, on ground=1.38 x “Under roof, open
sides, elevated”= 2.40 x “Under roof, enclosed”
Under roof, open sides, net wrap, elevated= 0.47 x “Under roof, open
sides, on ground”= 1.13 x “Under roof, enclosed”
Under roof, open sides, net wrap, on ground= 0.65 x “Under roof, open
sides, on ground”= 1.56 x “Under roof, enclosed”
Under roof, open sides, plastic wrap, elevated= 0.35 x “Under roof, open
sides, net wrap, elevated”= 0.40 x “Under roof, enclosed”
Under roof, open sides, plastic wrap, on ground
= 0.35 x “Under roof, open
sides, net wrap, on
ground”
= 0.55 x “Under roof, enclosed”
On field, covered with plastic or tarp, on ground= 2.0 x “Under roof, open
sides”=3.5 x “Under roof, enclosed”
On field, uncovered, on ground
= 2 x “On field, covered
with plastic or tarp, on
ground”
= 7.0 x “Under roof, enclosed”
On field, covered with plastic or tarp, elevated = 1.5 x “Under roof, enclosed”
On field, uncovered, elevated= 3 x “On field, covered,
elevated”= 4.5 x “Under roof, enclosed”
= 0.72 x “On field, covered,
on ground”
On field, covered with plastic or tarp, net wrap, on
ground
0.65 x “On field, covered
with plastic or tarp, on
ground”
=2.28 x “Under roof, enclosed”
On field, covered with plastic or tarp, net wrap,
elevated
0.47 x “On field, covered
with plastic or tarp, on
ground”
=1.65 x “Under roof, enclosed”
On field, uncovered, net wrap, elevated= 0.47 x “On field,
uncovered, on ground”=3.30 x “Under roof, enclosed”
On field, uncovered, net wrap, on ground=0.65 x “On field,
uncovered, on ground”=4.55 x “Under roof, enclosed”
On field, uncovered, plastic wrap, elevated
= 0.35 x “On field,
uncovered, net wrap,
elevated”
=1.20 x “Under roof, enclosed”
On field, uncovered, plastic wrap, on ground
= 0.35 x “On field,
uncovered, net wrap, on
ground”
=1.60 x “Under roof, enclosed”
Dry matter loss (factor)

323
Table F7: Dry matter loss relationship for wet storage used in the model
Storage structure Dry matter loss (factor)
Vertical (tower) silo Relationship from this study
Silage bags (tubes) = same as Vertical silo Relationship from this study
Silage bags (tubes), (Moisture level > 70%) =1.3 x “Silage bags (tubes)” =1.3 x loss in vertical silo
Wrapped silage (baleage) = 2 x “Silage bags (tubes)” =2 x loss in vertical silo
Wrapped silage (baleage), (Moisture level > 70%) =2 x loss in vertical silo
Horizontal (bunker) silo= 1.4 x “Wrapped silage
(baleage)” =2.8 x loss in vertical silo
Horizontal (bunker) silo, (Moisture level > 70%) =2.8 x loss in vertical silo
[Drive over] Pile= “Horizontal (bunker)
silo”=2.8 x loss in vertical silo

324
Table F8: Regression equations developed from Chapter 3 and from literature used in process cost estimation
Parameter Equation R-sq Comment Source
Stover yield (dry tons/acre)[corn yield (bushels/acre)*56 pounds/bushel]/2000
pounds/tonDry weight basis
Relative stover biomass remaining in
the field1.08*Relative cutting height + 4.51 0.93
Relative height and biomass to normalize
data. Cutting height up to 70cm? At
physiological maturity, plant height ranged
from 185 cm to 276 cm at study sites.
Wilhelm et al., 2011.
Moisture content at time of Harvest
3.63676 + 0.19474*H -0.29771*D+ 0.00446*H^2 +
0.01043*D^2 - 0.011365*H*D; (where H = percentage
harvested; D = days after grain harvest)
0.93Remodelled using derived vaiables. See main
chapter
Igathinathane et al.
(2006)
Moisture content at time of Harvest -0.5798*date of harvest + 24147 0.87Using date of harvest. Not considering
propoertion harvestedRichard lab data
Dry matter loss
Aerobic (Dry storage) 21 days 0.2856*Moisture - 2.292 0.79 Using mean PA values Chapter 3
Aerobic (Dry storage) 21 days, LCL 0.2843*Moisture - 4.336 0.89 Using mean PA values Chapter 3
Aerobic (Dry storage) 21 days, UCL 0.2869*Moisture - 0.2444 0.62 Using mean PA values Chapter 3
Aerobic (Dry storage) 90 days 0.7439*Moisture - 14.313 0.98 Using mean PA values Chapter 3
Anaerobic (Wet storage) 21 days 0.1078*Moisture - 3.9251 0.83 Using mean IA values Chapter 3
Anaerobic (Wet storage) 21 days, LCL 0.0789*Moisture - 4.5811 0.46 Using mean IA values Chapter 3
Anaerobic (Wet storage) 21 days, UCL 0.1369*Moisture - 3.2779 0.93 Using mean IA values Chapter 3
Anaerobic (Wet storage) 220 days 0.097*Moisture - 2.5692 0.75 Using mean IA values Chapter 3
Chapter 3
Aerobic (Dry storage) less than or
equal to 21 days, meanDuration*(0.2856*Moisture - 2.293)/21 Chapter 3
Aerobic (Dry storage) less than or
equal to 21 days, Lower Confidence levelDuration*(0.2843*Moisture - 4.336)/21 Chapter 3
Aerobic (Dry storage) less than or
equal to 21 days Upper Confidence levelDuration*(0.2869*Moisture - 0.2444)/21 Chapter 3
Anaerobic (wet storage) less than or
equal to 21 days, meanDuration*(0.1078*Moisture - 3.9251)/21 Chapter 3
Anaerobic (wet storage) less than or
equal to 21 days Lower Confidence levelDuration*(0.0789*Moisture - 4.5811)/21 Chapter 3
Anaerobic (wet storage) less than or
equal to 21 days Upper Confidence levelDuration*(0.1369*Moisture - 3.2779)/21 Chapter 3
Aerobic (Dry storage) greater than 21
days, mean
= (0.2843*Moisture - 4.336)+ (0.0065*Moisture -
0.1666)*(Duration-21)Chapter 3
Aerobic (Dry storage) greater than 21
days, LCL
= (0.2856*Moisture - 2.293)+ (0.0065*Moisture -
0.1666)*(Duration-21)Chapter 3
Aerobic (Dry storage) greater than 21
days, UCL
= (0.2869*Moisture - 0.2444)+ (0.0065*Moisture -
0.1666)*(Duration-21)Chapter 3
Anaerobic (wet storage) greater than
21 days
=(0.1078*Moisture - 3.9251)+ (-0.00005*Moisture +
0.0068)*(Duration-21)Chapter 3
Anaerobic (wet storage) greater than
21 days
=(0.0789*Moisture - 4.5811)+ (-0.00005*Moisture +
0.0068)*(Duration-21)Chapter 3
Anaerobic (wet storage) greater than
21 days
=(0.1369*Moisture - 3.2779)+ (-0.00005*Moisture +
0.0068)*(Duration-21)Chapter 3

325
Table F8 cont:
Change in moisture after storage
Anaerobic (wet storage) less than or
equal to 21 days=(-0.0022*Moisture + 0.0947)*Duration 0.73 Chapter 3
Anaerobic (wet storage) greater than
21 days= (6E-06*Moisture^2 - 0.0007*Moisture + 0.016)*Duration 0.67 Chapter 3
Aerobic (Dry storage) less than or
equal to 21 days=(-0.0063*Moisture + 0.4716)*Duration 0.93 Chapter 3
Aerobic (Dry storage) greater than 21
days
=(-0.0002*Moisture^2 + 0.0183*Moisture -
0.1266)*Duration0.94 Chapter 3
Transportation ($/ton) = 2.0493*ln(distance to refinery (miles)) - 2.2822 From literature
Silo cost
Vertical silo cost, structural =31.216*Capacity + 17054 ISA
Vertical silo operating cost/year =(145.68*Capacity + 335919)/20
Bunker silo cost, structural =12.603*Capacity + 14576 ISA
Bunker silo operating cost/year '= (236.24*Capacity + 422811)/20
Stoichiometry
Glucose to ethanol C6H12O6 = 2C2H5OH + 2CO2 ≡ 0.511 kg of Ethanol/Kg glucose General knowledge
Xylose to ethanol 3C5H1oO5 = 5C2H5OH + 5CO2 ≡ 0.511 kg of Ethanol/Kg xylose General knowledge
Structural sugar (Anaerobic)
Glucan (%) = 0.0009*Moisture^2- 0.1099*Moisture + 36.825 0.69 Chapter 3
Glucan by duration (%)
=(0.0009*Moisture^2 - 0.1099*Moisture +
36.826)+(0.000003*Moisture^2 - 0.0004*Moisture +
0.0079)*Duration
0.67 Chapter 3
xylan (%) = 0.0014*Moisture^2 - 0.1526*Moisture + 25.66 0.51 Chapter 3
Xylan by duration (%)
= (0.0014*Moisture^2 - 0.1526*Moisture +
25.67)+(0.000003*Moisture^2 - 0.0004*Moisture +
0.0079)*Duration
0.50 Chapter 3
Structural sugar (Aerobic)
Glucan (%)≤ 21days =(-0.0727*Moisture + 35.723)-( -0.0039*Moisture + 0.1624)*(21-duration)0.94 Chapter 3
Glucan (%)> 21days (<35% MC)= (-0.0727*Moisture + 35.724)+(0.0013*Moisture -
0.028)*(Duration-21)Chapter 3
Glucan (%)> 21days (>35% MC)=(-0.0727*Moisture + 35.723)+( -0.0039*Moisture +
0.1624)*(Duration-21)Chapter 3
xylan (%) ≤ 21days
=(-0.0545*Moisture+ 21.754)-(-0.0024*Moisture +
0.0906)*(21-duration)0.92 Chapter 3
Xylan (%)> 21days= (-0.0545*Moisture + 21.755)+(-0.0024*Moisture +
0.0906)*(Duration-21)0.89 Chapter 3
Storage acid
Lactic ≤ 21 days =(-0.0012*Moisture^2 + 0.155*Moisture - 2.7767)/21 0.88 Using mean IA values Chapter 3
Lactic > 21 days=(-0.0012*Moisture^2 + 0.155*Moisture - 2.7767)+(-1E-
05*Moisture^2 + 0.001*Moisture - 0.0177)*(Duration-21)0.74 Using mean IA values Chapter 3
Acetic ≤ 21 days =( -0.0002*Moisture^2 + 0.0364*Moisture - 0.6546)/21 0.82 Using mean IA values Chapter 3
Acetic > 21 days= (-0.0002*Moisture^2 + 0.0364*Moisture - 0.6546)+(4E-
06*Moisture^2 - 0.0003*Moisture + 0.0056)*(Duration -21)0.82 Using mean IA values Chapter 3
Isobutyric ≤ 21 days =( 0.0004*Moisture^2 - 0.0323*Moisture + 0.6745)/21 0.73 Using mean IA values Chapter 3
Isobutyric > 21 days=( 0.0004*Moisture^2 - 0.0323*Moisture + 0.6745)+(2E-
06*Moisture^2 - 0.0001*Moisture+ 0.002)*(Duration-21)0.98 Using mean IA values Chapter 3

326
Table F9: Regression equations developed from this study and used ethanol cost and prediction model
Parameter Equation R-sq Comment Source
Pretreatment acid (unensiled feedstock)-direct estimation from storage moisture
Acetic at 5 mins = 0.0041*Moisture^2 - 0.316*Moisture + 6.4542 0.75 Chapters 5 & 6
Acetic at 10 mins = -4E-05*Moisture^2 + 0.0284*Moisture + 0.524 0.41 Chapters 5 & 6
Acetic at 15 mins = -0.0004*Moisture^2 + 0.0633*Moisture + 0.1127 0.58 Chapters 5 & 6
Isobutyric at 5 mins = -0.0011*Moisture^2 + 0.084*Moisture - 0.0647 0.77 Chapters 5 & 6
Isobutyric at 10 mins = 0.0005*Moisture^2 - 0.0618*Moisture + 3.2344 0.46 Chapters 5 & 6
Isobutyric at 15 mins = -0.0002*Moisture^2 - 9E-06*Moisture + 2.8808 0.45 Chapters 5 & 6
Pretreatment acid (Ensiled feedstock)-direct estimation from storage moisture
Acetic at 5 mins = 0.003*Moisture^2 - 0.209*Moisture + 5.2296 0.86 Chapters 5 & 6
Acetic at 10 mins = 0.0028*Moisture^2 - 0.1767*Moisture + 4.6637 0.80 Chapters 5 & 6
Acetic at 15 mins = -0.0028*Moisture^2 + 0.2947*Moisture - 4.2078 0.85 Chapters 5 & 6
Isobutyric at 5 mins = -0.0029*Moisture^2 + 0.2649*Moisture - 3.3722 0.95 Chapters 5 & 6
Isobutyric at 10 mins = -0.0038*Moisture^2 + 0.3391*Moisture - 3.9929 0.85 Chapters 5 & 6
Isobutyric at 15 mins '= -0.0031*Moisture^2 + 0.2888*Moisture - 2.0295 0.69 Chapters 5 & 6
Ratio of pretreatment acid: storage acid (Ensiled feedstock) used in predicting pretreatment acid from storage acid
Acetic at 5 mins = 0.0068*Moisture^2 - 0.8048*Moisture + 25.326 0.82 Chapters 5 & 6
Acetic at 10 mins = 0.0077*Moisture^2 - 0.914*Moisture + 29.213 0.71 Chapters 5 & 6
Acetic at 15 mins = 0.0029*Moisture^2 - 0.4405*Moisture + 18.198 0.88 Chapters 5 & 6
Isobutyric at 5 mins = 0.0153*Moisture^2 - 2.0394*Moisture + 71.717 0.78 Chapters 5 & 6
Isobutyric at 10 mins = 0.0324*Moisture^2 - 4.1013*Moisture + 133.71 0.73 Chapters 5 & 6
Isobutyric at 15 mins = 0.0374*Moisture^2 - 4.8185*Moisture + 161.07 0.83 Chapters 5 & 6
Ethanol yield from Organic acid =58.6 + 3.21*Isobutyric -3.94*Acetic 0.67 Chapters 5 & 6
Yield correction factor, unensile
At 5 mins pretreatment time = 0.0007*Moisture^2 - 0.0614*Moisture + 2.3649 0.50 Asis_220day/Asis_0day Chapters 5 & 6
At 10 mins pretreatment time = -0.0009*Moisture^2 + 0.0789*Moisture - 0.5861 0.77 Asis_220day/Asis_0day Chapters 5 & 6
At 15 mins pretreatment time = -0.0002*Moisture^2 + 0.0151*Moisture + 0.7752 0.62 Asis_220day/Asis_0day Chapters 5 & 6
Drying impact factor
At 5 mins pretreatment time = -0.0004*Moisture^2 + 0.0328*Moisture + 0.5344 0.55 Asis_day0/ dry_day0 Chapters 5 & 6
At 10 mins pretreatment time = 0.0003*Moisture^2 - 0.0331*Moisture + 1.8736 0.78 Asis_day0/ dry_day0 Chapters 5 & 6
At 15 mins pretreatment time = -0.0001*Moisture^2 + 0.0096*Moisture + 0.8692 0.19 Asis_day0/ dry_day0 Chapters 5 & 6
Drying silage impact
At 5 mins pretreatment time = -0.0001*Moisture^2 + 0.0127*Moisture + 0.5537 0.60 EnsiledDry_220day/UnensiledDry_0day Chapters 5 & 6
At 10 mins pretreatment time = -8E-05*Moisture^2 + 0.0076*Moisture + 0.6764 0.17 EnsiledDry_220day/UnensiledDry_0day Chapters 5 & 6
At 15 mins pretreatment time '= -0.0006*Moisture^2 + 0.0585*Moisture - 0.2937 0.89 EnsiledDry_220day/UnensiledDry_0day Chapters 5 & 6
Washing impact
At 5 mins pretreatment time = 5E-05*Moisture^2 + 0.0017*Moisture + 0.7832 0.64 AsisWash_220day/AsisUnwash_220day Chapters 5 & 6
At 10 mins pretreatment time = 0.0034*Moisture^2 - 0.2885*Moisture + 6.6158 0.80 AsisWash_220day/AsisUnwash_220day Chapters 5 & 6
At 15 mins pretreatment time = -0.0002*Moisture^2 + 0.016*Moisture + 0.7976 0.20 AsisWash_220day/AsisUnwash_220day Chapters 5 & 6

327
Table F9 cont:
Parameter Equation R-sq Comment Source
Aerobic storage PH Chapters 3
At less or equal to 21 days = 0.0007*Moisture^2 - 0.0578*Moisture + 9.4244 0.91 Chapters 3
At >21 days storage = -0.0009*Moisture^2 + 0.0949*Moisture + 6.1017 0.64 Chapters 3
Pretreatment pH "As is" -unwashed, unensiled
At 5 min = -0.0004*Moisture^2 + 0.0343*Moisture + 3.8987 0.75 Chapters 5 & 6
At 10 min = -0.0003*Moisture^2 + 0.0267*Moisture + 3.8574 0.50 Chapters 5 & 6
At 15 min = -0.0002*Moisture^2 + 0.0235*Moisture + 3.7929 0.47 Chapters 5 & 6
Relating pH to acid content after pretreatment
Acetic at 5 mins = 92.471*pH^2 - 859.94*pH + 2000.1 0.89 for pH between 4.0 and 4.8 (regression range) Chapters 5 & 6
Acetic at 10 mins = 21.595*pH^2 - 191.85*pH + 427.62 0.47 for pH between 4.0 and 4.8 (regression range) Chapters 5 & 6
Acetic at 15 mins = 33.526*pH^2 - 286.83*pH + 615.24 0.59 for pH between 4.0 and 4.8 (regression range) Chapters 5 & 6
Isobutyric at 5 mins = -21.631*pH^2 + 201.09*pH - 466.01 0.60 for pH between 4.0 and 4.8 (regression range) Chapters 5 & 6
Isobutyric at 10 mins = -13.355*pH^2 + 114.94*pH - 245.43 0.52 for pH between 4.0 and 4.8 (regression range) Chapters 5 & 6
Isobutyric at 15 mins = -12.023*pH^2 + 102.21*pH - 214.65 0.10 for pH between 4.0 and 4.8 (regression range) Chapters 5 & 6

328
Table F10: Field operation custom rates and losses used in model
Operation Mean Range Unit SourceHarvesting Source
Mower conditioner 17.4 12.00 - 22.00 $/acre Pike (2013)
Willowing $/acre Pike (2013)
shredding 16.6 8:00 - 23:00 $/acre Pike (2013)
Raking 9.55 5.75 - 14.75 $/acre Pike (2013)
Pick up/Baling
Type of bale
Small: Square with wire 0.91 0.45 - 2.00 $/bale Twete et al. (2009)
Square with Twine 0.92 0.45 - 2.00 $/bale Twete et al. (2009)
Large: Round (under 1500 lbs.) Without net 10.45 6.00 - 19.00 $/bale Twete et al. (2009)
Round (under 1500 lbs.) with net 10.71 7.00 - 16.00 $/bale Twete et al. (2009)
Round (over 1500 lbs.) Without net 10.56 7.00 - 17.00 $/bale Twete et al. (2009)
Round (over 1500 lbs.) with net 10.86 7.00 - 20.00 $/bale Twete et al. (2009)
Square (approx. 1 ton) 13.58 7.00 - 25.00 $/bale Twete et al. (2009)
Small Square 0.92 0.45 - 1.75 $/bale Pike (2013)
Large Round 7.7 5.50 - 10.00 $/bale Pike (2013)
Large Square 8.35 6.50 - 11.00 $/bale Pike (2013)
Wrapping bales 6.85 4.25 - 9.25 $/bale Pike (2013)
Hauling
Small bales 0.84 0.20 - 2.50 $/bale Twete et al. (2009)
Large bales 4.35 1.00 - 15.00 $/bale Twete et al. (2009)
Stacking 58.33 35.00 - 80.00 $/stack Twete et al. (2008)
Entire Process contracted: cutting,
conditioning, raking, baling,
hauling, and stacking
Small bales 1.77 0.65 - 2.25 $/bale Twete et al. (2009)
Large bales 19.1 11.00 - 28.00 $/bale Twete et al. (2009)
Use forage harvester (Silage)
Pull type chopper and tractor 1.9 acres/hr 92 70.00 - 100.00 $/hour Pike (2013)
(Schnitkey and Lattz, 2008)
Self-propelled chopper 4.5 acres/hr 247 150.00 - 350.00 $/hour Pike (2013)
(Schnitkey and Lattz, 2008)
self-propelled for bunker 50 tons/hr 371 $/hour
Blower 100 tons/hr
1 man, 2 wagons, 1 tractor (CSI, 2013) 80.6 45.00 - 100.00 $/hour Pike (2013)
2 men, 2 wagons, 2 tractors 134 85.00 - 168.00 $/hour Pike (2013)
1 man, 1 truck 74.7 57.90 - 80.00 $/hour Pike (2013)
Chopping, hauling and filling silo 7.39 4.50 - 17.00 $/ton Twete et al. (2009)
Chopping only 4.68 1.50 - 7.00 $/ton Twete et al. (2009)
Hauling only 2.18 0.20 - 4.50 $/ton Twete et al. (2009)
Chopping and hauling 6.54 4.80 - 8.50 $/ton Twete et al. (2009)
Bagging silage
< 9.0 ft 1 ton/ft 4.55 2.00 -7.50 $/foot Pike (2013)
(R.B. Family Farms, 2007)
≥ 9.0 ft 1.5 ton/ft 5.15 4.00 -7.51 $/foot Pike (2013)
(R.B. Family Farms, 2007)
Wrapping
Twine 0.54 per ton Brechbill & Wallace (2008)
Net wrap 1.97 per ton Brechbill & Wallace (2008)
Twine and plastic wrap 2.75 per ton Brechbill & Wallace (2008)
Losses
Harvest method Amount harvested (%)Baler chamber [&
ejection]losses1.60% Shinners et al. (1996)
Shredding and raking 80 Lang (2002)Pick-up losses
(Small bale)0.40% Shinners et al. (1996)
Raking only 65 Lang (2002) (Large bale) 2.60% Shinners et al. (1996)
Combine windrow only 50 Lang (2002)
Drift losses 3 0.50 - 5.00 % Mickan and Piltz (2003)

329
Table F11: Breakdown of project investment cost used in model
Equipment Cost
Feed Handling $7,500,000.00
Pretreatment $18,900,000.00
Saccharification & Fermentation $9,400,000.00
Distillation and Solids Recovery $21,800,000.00
Wastewater Treatment $3,300,000.00
Storage $2,000,000.00
Boiler/Turbogenerator $38,300,000.00
Utilities $4,700,000.00
Total Equipment cost $105,900,000.00
Warehouse $1,588,500.00
Site Development $5,893,751.75
Total Installed Cost (TIC) $113,382,251.75
Indirect Costs Field Expenses $22,676,450.35
Home Office & Construction Fee $28,345,562.94
Project Contingency $3,401,467.55
Total Capital Investment (TCI) $167,805,732.59
Other Costs (Startup, Permits, etc.) $16,780,573.26
Working Capital $14,512,928.22
Total Project Investment $199,099,234.07

330
Table F12: Breakdown of project operating cost used in model
Fixed Operating Cost
Labor & Management Number Salary
Plant Manager 1 $80,000.00
Plant Engineer 1 $65,000.00
Maintenance Supr 1 $60,000.00
Lab Manager 1 $50,000.00
Shift Supervisor 5 $37,000.00
Lab Technician 2 $25,000.00
Maintenance Tech 8 $28,000.00
Shift Operators 20 $25,000.00
Yard Employees 32 $20,000.00
General Manager 1 $100,000.00
Clerks & Secretaries 5 $20,000.00
Total Salaries 77 $2,054,000.00
Overhead/Maintenance 1,232,400.00
Maintenance 2,118,000.00
Insurance & Taxes 17,007,337.76
Total fix operating cost 22,411,737.76
Variable Operating Cost
Prices
Electricity 5.00 c/KwH
Water 0.35 ¢/gal.
Bioreagents/chemicals Cellulolytic enzymes 10.10 ¢/gal.
Fermenting microbe (Yeasts) 2.50 ¢/gal.
Chemical: process & antibiotics 2.25 ¢/gal.
Chemical: waste treatment 0.24 ¢/gal.
Boiler cooling tower 0.04 ¢/gal.
Denaturants 5.55 ¢/gal.
Other Direct Costs Repairs & Maintenance 1.50 ¢/gal.
Transportation 0.75 ¢/gal.
Other 2.00 ¢/gal.

331
Table F13: Evaluating test error by comparing with a prediction error of zero using the t-test
Table F14:Predicted and observed ethanol yield values of “as is” stover with corresponding test
errors (predicted –observed)
N Mean StDev SE Mean 95% Confidence interval T P
Without yield factors 72 0.844 7.588 0.894 (-0.939438, 2.626660) 0.94 0.349
With yield factors* 72 -3.161 9.880 1.164 (-5.48231, -0.83907) -2.71 0.008
Mean yield factorˣ 72 -3.744 8.449 0.996 (-5.72968, -1.75893) -3.76 0.000
Without yield factors 72 13.465 7.244 0.854 (11.7627, 15.1673) 15.77 0.000
With yield factors 72 10.385 9.404 1.108 (8.1747, 12.5945) 9.37 0.000
Mean yield factorsˣ 72 -1.791 6.597 0.778 (-3.34155, -0.24095) -2.30 0.024
* Yield factors applied only to unensiled
ˣ Using mean yield factors instead of yield factor equation, which accounts for moisture content
"As is"
Dried
feedstock
Storage
duration
pretreat
time
(min)
Storage
moisture
content
(%) Observed Predicted
With
yield
factor
Apply
mean
yield
factor
Without
yield
factor
With
yield
factor
with mean
yield factor
Without
yield
factor
With
yield
factor
with
mean
yield
factor
63.76 56.83 56.83 56.83 -6.93 -6.93 -6.93 TRUE TRUE TRUE
67.58 57.42 57.42 57.42 -10.15 -10.15 -10.15 TRUE TRUE TRUE
58.13 58.67 58.67 58.67 0.54 0.54 0.54 FALSE FALSE FALSE
59.46 59.01 59.01 59.01 -0.46 -0.46 -0.46 TRUE TRUE TRUE
54.73 58.05 58.05 58.05 3.32 3.32 3.32 FALSE FALSE FALSE
58.43 57.64 57.64 57.64 -0.79 -0.79 -0.79 TRUE TRUE TRUE
59.77 53.13 53.13 53.13 -6.64 -6.64 -6.64 TRUE TRUE TRUE
52.21 53.71 53.71 53.71 1.49 1.49 1.49 FALSE FALSE FALSE
47.34 53.01 53.01 53.01 5.68 5.68 5.68 FALSE FALSE FALSE
47.23 53.12 53.12 53.12 5.89 5.89 5.89 FALSE FALSE FALSE
40.93 30.65 30.65 30.65 -10.28 -10.28 -10.28 TRUE TRUE TRUE
53.97 30.50 30.50 30.50 -23.47 -23.47 -23.47 TRUE TRUE TRUE
57.80 58.12 58.12 58.12 0.33 0.33 0.33 FALSE FALSE FALSE
49.30 60.34 60.34 60.34 11.04 11.04 11.04 FALSE FALSE FALSE
60.67 59.33 59.33 59.33 -1.34 -1.34 -1.34 TRUE TRUE TRUE
64.40 62.35 62.35 62.35 -2.05 -2.05 -2.05 TRUE TRUE TRUE
60.69 54.78 54.78 54.78 -5.92 -5.92 -5.92 TRUE TRUE TRUE
54.76 59.19 59.19 59.19 4.43 4.43 4.43 FALSE FALSE FALSE
57.51 53.72 53.72 53.72 -3.79 -3.79 -3.79 TRUE TRUE TRUE
51.77 54.11 54.11 54.11 2.34 2.34 2.34 FALSE FALSE FALSE
54.59 54.08 54.08 54.08 -0.51 -0.51 -0.51 TRUE TRUE TRUE
58.12 54.40 54.40 54.40 -3.72 -3.72 -3.72 TRUE TRUE TRUE
11.16 26.63 26.63 26.63 15.48 15.48 15.48 FALSE FALSE FALSE
12.65 26.48 26.48 26.48 13.83 13.83 13.83 FALSE FALSE FALSE
65
75
10
25
35
45
55
55
65
75
Day 220
5
25
35
45
Ethanol yield Predicted yield - Observed yield Predicted > Observed

332
Table F14 cont.
Storage
duration
pretreat
time
(min)
Storage
moisture
content
(%) Observed Predicted
With
yield
factor
Apply
mean
yield
factor
Without
yield
factor
With
yield
factor
with mean
yield factor
Without
yield
factor
With
yield
factor
with
mean
yield
factor
56.26 63.07 49.77 52.35 6.81 -6.49 -3.91 FALSE TRUE TRUE
55.24 57.27 45.19 47.54 2.04 -10.05 -7.70 FALSE TRUE TRUE
46.58 60.87 56.71 50.52 14.29 10.13 3.94 FALSE FALSE FALSE
58.74 62.12 57.87 51.56 3.38 -0.87 -7.18 FALSE TRUE TRUE
54.40 56.36 55.29 46.78 1.96 0.88 -7.62 FALSE FALSE TRUE
51.88 57.68 56.58 47.87 5.80 4.70 -4.01 FALSE FALSE TRUE
51.84 55.50 50.21 46.07 3.66 -1.63 -5.77 FALSE TRUE TRUE
39.95 56.01 50.67 46.49 16.06 10.72 6.54 FALSE FALSE FALSE
55.63 56.19 50.84 46.64 0.57 -4.79 -8.98 FALSE TRUE TRUE
57.96 57.43 51.96 47.67 -0.53 -6.01 -10.30 TRUE TRUE TRUE
35.33 34.03 20.05 28.24 -1.30 -15.28 -7.08 TRUE TRUE TRUE
17.22 30.27 17.83 25.12 13.05 0.61 7.90 FALSE FALSE FALSE
67.71 59.71 47.12 49.56 -7.99 -20.59 -18.15 TRUE TRUE TRUE
57.75 60.37 47.63 50.11 2.62 -10.12 -7.64 FALSE TRUE TRUE
53.73 60.09 55.98 49.87 6.36 2.25 -3.86 FALSE FALSE TRUE
55.41 60.44 56.31 50.17 5.03 0.90 -5.24 FALSE FALSE TRUE
53.09 55.77 54.71 46.29 2.69 1.62 -6.80 FALSE FALSE TRUE
65.52 50.77 49.81 42.14 -14.75 -15.72 -23.38 TRUE TRUE TRUE
44.11 56.05 50.71 46.52 11.94 6.60 2.41 FALSE FALSE FALSE
63.23 56.71 51.30 47.07 -6.52 -11.93 -16.16 TRUE TRUE TRUE
52.84 55.96 50.63 46.45 3.12 -2.21 -6.39 FALSE TRUE TRUE
53.20 56.29 50.92 46.72 3.08 -2.28 -6.49 FALSE TRUE TRUE
72.53 54.46 32.08 45.20 -18.07 -40.44 -27.33 TRUE TRUE TRUE
56.95 51.24 30.19 42.53 -5.72 -26.77 -14.43 TRUE TRUE TRUE
45.37 60.50 47.74 51.43 15.13 2.37 6.06 FALSE FALSE FALSE
64.70 62.18 49.06 52.85 -2.52 -15.64 -11.85 TRUE TRUE TRUE
63.93 61.12 56.94 51.95 -2.81 -6.99 -11.97 TRUE TRUE TRUE
56.17 62.67 58.39 53.27 6.51 2.22 -2.89 FALSE FALSE TRUE
63.32 57.01 55.92 48.46 -6.32 -7.40 -14.87 TRUE TRUE TRUE
69.80 57.75 56.65 49.08 -12.06 -13.15 -20.72 TRUE TRUE TRUE
55.88 57.82 52.31 49.15 1.94 -3.57 -6.73 FALSE TRUE TRUE
49.45 56.22 50.86 47.78 6.77 1.41 -1.66 FALSE FALSE TRUE
51.55 55.20 49.93 46.92 3.65 -1.61 -4.63 FALSE TRUE TRUE
54.05 59.31 53.66 50.42 5.26 -0.40 -3.64 FALSE TRUE TRUE
58.25 54.87 32.32 46.64 -3.38 -25.93 -11.61 TRUE TRUE TRUE
56.03 56.22 33.12 47.79 0.20 -22.90 -8.24 FALSE TRUE TRUE
55.35 55.35 51.35 50.76 0.80 3.16 3.74
7.99 11.06 9.80
6.07 7.63 7.74
65
75
Mean
Root mean squared error
Maximum absolute error
15
25
35
45
55
55
65
75
75
10
25
35
45
45
55
65
Day 0
5
25
35
Ethanol yield Predicted yield - Observed yield Predicted > Observed

333
Table F15: Predicted and observed ethanol yield values of dried stover with corresponding test
errors (predicted –observed)
Storage
duration
pretreat
time
(min)
Storage
moisture
content
(%) Observed Predicted
With
yield
factor
Apply
mean
yield
factor
Without
yield
factor
With
yield
factor
with mean
yield factor
Without
yield
factor
With
yield
factor
with
mean
yield
factor
37.90 61.06 44.71 41.06 23.16 6.81 3.16 FALSE FALSE FALSE
37.14 58.37 42.74 39.25 21.23 5.60 2.11 FALSE FALSE FALSE
39.81 59.00 43.33 39.67 19.19 3.52 -0.14 FALSE FALSE TRUE
41.11 59.88 43.97 40.26 18.77 2.86 -0.85 FALSE FALSE TRUE
39.42 61.77 47.48 41.53 22.35 8.06 2.11 FALSE FALSE FALSE
39.17 60.60 46.58 40.75 21.43 7.41 1.58 FALSE FALSE FALSE
36.67 61.60 51.84 41.42 24.93 15.17 4.75 FALSE FALSE FALSE
43.26 61.07 51.40 41.07 17.81 8.14 -2.19 FALSE FALSE TRUE
38.52 56.94 55.79 38.28 18.42 17.27 -0.24 FALSE FALSE TRUE
38.56 57.14 55.98 38.42 18.58 17.42 -0.14 FALSE FALSE TRUE
37.11 56.83 72.05 38.21 19.72 34.94 1.10 FALSE FALSE FALSE
34.33 56.22 71.27 37.80 21.89 36.94 3.47 FALSE FALSE FALSE
40.62 59.53 38.31 44.63 18.91 -2.31 4.01 FALSE TRUE FALSE
43.08 62.77 40.39 47.06 19.69 -2.69 3.98 FALSE TRUE FALSE
43.13 61.03 57.43 45.75 17.90 14.30 2.62 FALSE FALSE FALSE
37.52 60.92 57.33 45.68 23.40 19.81 8.16 FALSE FALSE FALSE
47.55 61.60 69.81 46.18 14.05 22.26 -1.37 FALSE FALSE TRUE
43.21 63.57 72.05 47.66 20.36 28.84 4.45 FALSE FALSE FALSE
44.98 61.83 71.37 46.35 16.85 26.39 1.37 FALSE FALSE FALSE
39.39 61.61 71.12 46.19 22.22 31.73 6.80 FALSE FALSE FALSE
43.33 61.20 60.22 45.88 17.87 16.89 2.55 FALSE FALSE FALSE
44.03 61.04 60.07 45.76 17.01 16.04 1.73 FALSE FALSE FALSE
38.71 61.72 41.13 46.28 23.01 2.42 7.57 FALSE FALSE FALSE
37.40 63.17 42.10 47.36 25.77 4.70 9.96 FALSE FALSE FALSE
47.45 61.95 52.94 45.47 14.50 5.49 -1.98 FALSE FALSE TRUE
41.78 60.49 51.69 44.40 18.71 9.91 2.62 FALSE FALSE FALSE
50.88 60.35 55.17 44.30 9.47 4.29 -6.58 FALSE FALSE TRUE
49.60 62.09 56.77 45.58 12.49 7.17 -4.02 FALSE FALSE TRUE
61.06 62.17 58.50 45.63 1.11 -2.56 -15.43 FALSE TRUE TRUE
54.75 62.41 58.73 45.81 7.66 3.98 -8.94 FALSE FALSE TRUE
50.30 61.64 57.52 45.24 11.34 7.22 -5.06 FALSE FALSE TRUE
54.30 62.84 58.63 46.12 8.54 4.33 -8.18 FALSE FALSE TRUE
49.87 56.83 50.65 41.72 6.96 0.78 -8.15 FALSE FALSE TRUE
52.56 61.22 54.56 44.94 8.66 2.00 -7.62 FALSE FALSE TRUE
22.40 55.80 45.63 40.96 33.40 23.23 18.56 FALSE FALSE FALSE
27.31 63.01 51.52 46.25 35.70 24.21 18.94 FALSE FALSE FALSE75
35
45
55
65
65
75
15
25
10
25
35
45
55
45
55
65
75
Predicted > Observed
Day 220
5
25
35
Ethanol yield Predicted yield - Observed yield

334
Table F15 cont.
Storage
duration
pretreat
time
(min)
Storage
moisture
content
(%) Observed Predicted
With
yield
factor
Apply
mean
yield
factor
Without
yield
factor
With
yield
factor
with mean
yield factor
Without
yield
factor
With
yield
factor
with
mean
yield
factor
49.76 58.33 52.82 40.79 8.57 3.06 -8.97 FALSE FALSE TRUE
47.70 57.22 51.81 40.01 9.52 4.11 -7.69 FALSE FALSE TRUE
47.19 56.28 47.20 39.35 9.09 0.01 -7.84 FALSE FALSE TRUE
45.50 56.09 47.04 39.23 10.59 1.54 -6.27 FALSE FALSE TRUE
44.71 58.71 48.91 41.05 14.00 4.20 -3.66 FALSE FALSE TRUE
44.56 57.30 47.74 40.07 12.74 3.18 -4.49 FALSE FALSE TRUE
48.32 58.53 51.87 40.93 10.21 3.55 -7.39 FALSE FALSE TRUE
49.78 57.68 51.12 40.34 7.90 1.34 -9.44 FALSE FALSE TRUE
46.30 56.81 58.19 39.73 10.51 11.89 -6.57 FALSE FALSE TRUE
44.98 60.36 61.82 42.21 15.38 16.84 -2.77 FALSE FALSE TRUE
46.36 55.25 74.22 38.63 8.89 27.86 -7.73 FALSE FALSE TRUE
44.64 56.06 75.31 39.20 11.42 30.67 -5.44 FALSE FALSE TRUE
48.40 57.53 46.63 49.17 9.13 -1.77 0.77 FALSE TRUE FALSE
51.86 59.65 48.35 50.98 7.79 -3.51 -0.88 FALSE TRUE TRUE
50.70 59.63 55.08 50.97 8.93 4.38 0.27 FALSE FALSE FALSE
49.03 60.30 55.70 51.54 11.27 6.67 2.51 FALSE FALSE FALSE
50.67 60.92 61.43 52.07 10.25 10.76 1.40 FALSE FALSE FALSE
52.83 56.49 56.97 48.28 3.66 4.14 -4.55 FALSE FALSE TRUE
53.50 59.41 61.85 50.78 5.91 8.35 -2.72 FALSE FALSE TRUE
52.36 60.17 62.64 51.43 7.81 10.28 -0.93 FALSE FALSE TRUE
45.93 59.64 60.26 50.97 13.71 14.33 5.04 FALSE FALSE FALSE
49.91 69.96 70.69 59.79 20.05 20.78 9.88 FALSE FALSE FALSE
50.74 55.03 51.02 47.04 4.29 0.28 -3.70 FALSE FALSE TRUE
49.56 59.39 55.07 50.76 9.83 5.51 1.20 FALSE FALSE FALSE
52.55 59.87 62.66 45.70 7.32 10.11 -6.85 FALSE FALSE TRUE
58.51 62.29 65.20 47.55 3.78 6.69 -10.96 FALSE FALSE TRUE
55.66 60.50 65.50 46.18 4.84 9.84 -9.48 FALSE FALSE TRUE
52.88 63.17 68.40 48.22 10.29 15.52 -4.66 FALSE FALSE TRUE
54.75 62.58 68.75 47.77 7.83 14.00 -6.98 FALSE FALSE TRUE
56.13 60.66 66.64 46.30 4.53 10.51 -9.83 FALSE FALSE TRUE
55.18 60.86 66.62 46.46 5.68 11.44 -8.72 FALSE FALSE TRUE
55.97 59.92 65.59 45.74 3.95 9.62 -10.23 FALSE FALSE TRUE
54.36 60.86 65.16 46.46 6.50 10.80 -7.90 FALSE FALSE TRUE
54.86 65.25 69.86 49.81 10.39 15.00 -5.05 FALSE FALSE TRUE
56.45 61.11 62.74 46.65 4.66 6.29 -9.80 FALSE FALSE TRUE
55.90 61.11 62.74 46.65 5.21 6.84 -9.25 FALSE FALSE TRUE
50.79 60.09 57.01 46.08 13.46 10.38 1.79
15.27 13.97 6.79
13.46 10.74 5.48
Mean
Root mean squared error
Maximum absolute error
35
45
55
65
75
65
75
15
25
10
25
35
45
55
45
55
65
75
Day 0
5
25
35
Predicted > ObservedEthanol yield Predicted yield - Observed yield

IRENE DZIDZOR DARKU
571 723 6879
Email: [email protected]
EDUCATION
2007 – 2013 PhD, Agricultural and Biological Engineering, Pennsylvania State University, USA
2003 – 2004 MPhil in Engineering for Sustainable Development, University of Cambridge, UK
1998 – 2002 B.Sc. in Agricultural Engineering with First-Class Honors, Kwame Nkrumah University
of Science & Technology (KNUST), Ghana
1989 – 1994 Senior School Certificate (S.S.C), United Faith Tabernacle College. Jarawan-Kogi,
Plateau State, Nigeria
PUBLICATIONS
Darku, I. D and T. L. Richard. Biofuels: ethanol producers. 2011. Encyclopedia of life sciences. John
Wiley & Sons, Ltd. Chichester. Available at http://www.els.net/WileyCDA/ElsArticle/refId-
a0020373.html
Darku, I. D, M. N. Marshall and T. L. Richard. 2010. Implications of organic acids in wet storage and
bioconversion of corn stover to ethanol. ASABE Paper No. 1008748. St. Joseph, Mich.: ASABE
Schwartz J. L., I. D. Darku, T. L. Smith, M. N. Marshall, T. L. Richard. 2010. From fields to fuels: A
student workshop on conversion of biomass to ethanol. ASABE Paper No. 1008874. St. Joseph, Mich.:
ASABE
Darku, I. D and K. Essien. 2009. Book review: Oil, Democracy, and the Promise of True Federalism in
Nigeria. African and Asian Studies, Vol. 8 (3): 338-340
Darku, I.D. 2005. Exploring the potential of oil palm fiber as a clean solid fuel to meet local energy
needs in Ghana. In Hunger without Frontiers; Proceedings of the 2nd West Africa Society of Agricultural
Engineering International Conference on Agricultural Engineering: 447 – 461. E.Y.H. Bobobee and A.
Bart-Plange, eds. Design Press: KNUST, Ghana
MANUSCRIPT REVIEW
BioResources Journal - Enzymatic hydrolysis of switchgrass and coastal bermuda grass pretreated using
different chemical methods
ORAL AND POSTER PRESENTATIONS
“Implications of organic acids in wet storage and bioconversion of corn stover to ethanol.” Oral
presentation at the ASABE Int'l Meeting, June 20 -23, 2010. Pittsburgh, PA.
"Effect of wet storage on the value of corn stover as a biofuel feedstock." Poster presentation at the 31st
Symposium on Biotechnology for Fuels and Chemicals, May 3 - 6, 2009, San Francisco, CA.
“Lignocellulosic feedstock value after wet storage: correlating dry matter loss, structural composition,
and environmental variables.” Poster presentation at the Northeast Renewable Energy Conference,
August 25-28, 2008, State College, PA.
“Exploring the Potential of Oil Palm Fiber as a Clean Solid Fuel to Meet Local Energy Needs in Ghana.”
Oral presentation at the International Conference on Agricultural Engineering, September 20 -24, 2004,
Kumasi, Ghana.
“Small scale irrigation projects in Ghana -evaluating sustainability principles.” Poster presentation at the
Center for Sustainable Development, February, 2004, University of Cambridge, UK.