Thin-Walled Cylindrical Shell Storage Tank under Blast Impacts
24
materials Article Thin-Walled Cylindrical Shell Storage Tank under Blast Impacts: Finite Element Analysis Ahmad Mahamad Al-Yacouby 1, * , Lo Jia Hao 1 , M. S. Liew 1 , R. M. Chandima Ratnayake 2 and Samindi M. K. Samarakoon 2 Citation: Al-Yacouby, A.M.; Hao, L.J.; Liew, M.S.; Ratnayake, R.M.C.; Samarakoon, S.M.K. Thin-Walled Cylindrical Shell Storage Tank under Blast Impacts: Finite Element Analysis. Materials 2021, 14, 7100. https://doi.org/10.3390/ma14227100 Received: 25 September 2021 Accepted: 12 November 2021 Published: 22 November 2021 Publisher’s Note: MDPI stays neutral with regard to jurisdictional claims in published maps and institutional affil- iations. Copyright: © 2021 by the authors. Licensee MDPI, Basel, Switzerland. This article is an open access article distributed under the terms and conditions of the Creative Commons Attribution (CC BY) license (https:// creativecommons.org/licenses/by/ 4.0/). 1 Civil and Environmental Engineering Department, Universiti Teknologi PETRONAS, Seri Iskandar 32610, Perak, Malaysia; [email protected] (L.J.H.); [email protected] (M.S.L.) 2 Department of Mechanical and Structural Engineering and Materials Science, University of Stavanger, 4021 Stavanger, Norway; [email protected] (R.M.C.R.); [email protected] (S.M.K.S.) * Correspondence: [email protected]; Tel.: +60-53-687-368 Abstract: Thin-walled cylindrical shell storage tanks are pressure vessels in which the walls of the vessel have a thickness that is much smaller than the overall size of the vessel. These types of structures have global applications in various industries, including oil refineries and petrochemical plants. However, these storage tanks are vulnerable to fire and explosions. Therefore, a parametric study using numerical simulation was carried out, considering the internal liquid level, wall thickness, material yield strength, constraint conditions, and blast intensity, with a diameter of 100 m and height of 22.5 m under different blast loads using the finite element analysis method. The thickness of the tank wall is varied as 10 mm, 20 mm, 30 mm, and 40 mm, while the fill level of internal fluid is varied as 25, 50, 75, and 100%. The blast simulation was conducted using LS-DYNA software. The numerical results are then compared with analytical results. The effects of blast intensity, standoff distance, wall thickness, and fill level of internal fluid on the structural behaviour of the storage tank were investigated and discussed. Keywords: thin-walled cylindrical shell; storage tank; blast impacts 1. Introduction Thin-walled cylindrical shell storage tanks are found in many commercial and indus- trial applications. These tanks are important facilities in the oil and gas and petrochemical industries, for they store large volumes of flammable, explosive, toxic, and harmful mate- rials. With the rapid development of the global economy and the strategic demand and production demand of energy, the volume and quantity of storage tanks are increasing, and consequently, the scale of tank farms is expanding, showing characteristics of large-scale integration and coexistence of multiple tanks [1–3]. These storage tanks are subjected to internal pressure, which subjects the tanks to a uniform loading, considering that the tanks have an inner-radius-to-wall-thickness ratio of 10 or more [4]. In the last few decades, a number of major industrial accidents have occurred around the world [5,6]. Blast loading to the exterior of a cylindrical shell pressure vessels imposes severe consequences [7]. Despite the high risk of explosions in the oil and gas industry, little related research can be found in the literature, especially on the effect of tank dimensions and standoff distance from blast on the behaviours of thin-walled cylindrical shells. The explosions happen when the stored hydrocarbon-air mixtures present above the liquid state are exposed to adequate amounts of energy [8]. Because of these devastating explosions, a few researchers have carried out studies and reviews to investigate the main causes of storage tank accidents. According to Chang and Lin [9], among 242 tank accidents from 1960–2003, 74% happened in petroleum refineries, oil terminals, and storage. In total, 33% of the cases were caused by lightning, and another 30% were caused by human error. A review of the literature shows that hydrocarbon explosions caused 70% of the accidents Materials 2021, 14, 7100. https://doi.org/10.3390/ma14227100 https://www.mdpi.com/journal/materials
-
Upload
khangminh22 -
Category
Documents
-
view
6 -
download
0
Transcript of Thin-Walled Cylindrical Shell Storage Tank under Blast Impacts

materials
Article
Thin-Walled Cylindrical Shell Storage Tank under BlastImpacts: Finite Element Analysis
Ahmad Mahamad Al-Yacouby 1,* , Lo Jia Hao 1, M. S. Liew 1, R. M. Chandima Ratnayake 2
and Samindi M. K. Samarakoon 2
�����������������
Citation: Al-Yacouby, A.M.; Hao,
L.J.; Liew, M.S.; Ratnayake, R.M.C.;
Samarakoon, S.M.K. Thin-Walled
Cylindrical Shell Storage Tank under
Blast Impacts: Finite Element
Analysis. Materials 2021, 14, 7100.
https://doi.org/10.3390/ma14227100
Received: 25 September 2021
Accepted: 12 November 2021
Published: 22 November 2021
Publisher’s Note: MDPI stays neutral
with regard to jurisdictional claims in
published maps and institutional affil-
iations.
Copyright: © 2021 by the authors.
Licensee MDPI, Basel, Switzerland.
This article is an open access article
distributed under the terms and
conditions of the Creative Commons
Attribution (CC BY) license (https://
creativecommons.org/licenses/by/
4.0/).
1 Civil and Environmental Engineering Department, Universiti Teknologi PETRONAS,Seri Iskandar 32610, Perak, Malaysia; [email protected] (L.J.H.); [email protected] (M.S.L.)
2 Department of Mechanical and Structural Engineering and Materials Science, University of Stavanger,4021 Stavanger, Norway; [email protected] (R.M.C.R.); [email protected] (S.M.K.S.)
* Correspondence: [email protected]; Tel.: +60-53-687-368
Abstract: Thin-walled cylindrical shell storage tanks are pressure vessels in which the walls of thevessel have a thickness that is much smaller than the overall size of the vessel. These types ofstructures have global applications in various industries, including oil refineries and petrochemicalplants. However, these storage tanks are vulnerable to fire and explosions. Therefore, a parametricstudy using numerical simulation was carried out, considering the internal liquid level, wall thickness,material yield strength, constraint conditions, and blast intensity, with a diameter of 100 m and heightof 22.5 m under different blast loads using the finite element analysis method. The thickness of thetank wall is varied as 10 mm, 20 mm, 30 mm, and 40 mm, while the fill level of internal fluid isvaried as 25, 50, 75, and 100%. The blast simulation was conducted using LS-DYNA software. Thenumerical results are then compared with analytical results. The effects of blast intensity, standoffdistance, wall thickness, and fill level of internal fluid on the structural behaviour of the storage tankwere investigated and discussed.
Keywords: thin-walled cylindrical shell; storage tank; blast impacts
1. Introduction
Thin-walled cylindrical shell storage tanks are found in many commercial and indus-trial applications. These tanks are important facilities in the oil and gas and petrochemicalindustries, for they store large volumes of flammable, explosive, toxic, and harmful mate-rials. With the rapid development of the global economy and the strategic demand andproduction demand of energy, the volume and quantity of storage tanks are increasing, andconsequently, the scale of tank farms is expanding, showing characteristics of large-scaleintegration and coexistence of multiple tanks [1–3]. These storage tanks are subjected tointernal pressure, which subjects the tanks to a uniform loading, considering that the tankshave an inner-radius-to-wall-thickness ratio of 10 or more [4]. In the last few decades, anumber of major industrial accidents have occurred around the world [5,6]. Blast loading tothe exterior of a cylindrical shell pressure vessels imposes severe consequences [7]. Despitethe high risk of explosions in the oil and gas industry, little related research can be found inthe literature, especially on the effect of tank dimensions and standoff distance from blaston the behaviours of thin-walled cylindrical shells.
The explosions happen when the stored hydrocarbon-air mixtures present above theliquid state are exposed to adequate amounts of energy [8]. Because of these devastatingexplosions, a few researchers have carried out studies and reviews to investigate the maincauses of storage tank accidents. According to Chang and Lin [9], among 242 tank accidentsfrom 1960–2003, 74% happened in petroleum refineries, oil terminals, and storage. In total,33% of the cases were caused by lightning, and another 30% were caused by human error.A review of the literature shows that hydrocarbon explosions caused 70% of the accidents
Materials 2021, 14, 7100. https://doi.org/10.3390/ma14227100 https://www.mdpi.com/journal/materials

Materials 2021, 14, 7100 2 of 24
in offshore installations as well. Accidents are prone to happening during maintenance,repair, and loading or unloading. Other research found that 27% of the accidents weredue to human error, including operations and maintenance [10]. Thus, understandinghow these types of thin-walled structures respond to relevant loading conditions is im-portant for the design of safe and economical liquid-containment shell storage tanks [2].However, hardly any progress has been made in understanding the dynamic responseof liquid storage tanks under blast loading [11]. A review of the literature shows thatseveral researchers [6,12–14] have investigated the influence of blast intensity, tank fillconditions, and tank bottom constraints on tanks’ failure mode, resultant displacementand deformation, structural energy, circumferential strain, and longitudinal strain. More-over, small-scale model experiments have been mostly conducted to study the response ofthin-wall cylindrical tanks subjected to blast load [3,6], and the findings have been verifiedusing numerical simulations. However, in order to study the dynamic response of largethin-walled cylindrical tanks, the applicability of numerical simulations has been widelydiscussed. Hence, recent advances in numerical simulation have provided a powerful toolto examine increasingly complex problems involving explosive blast loading [15–17].
Mittel et al. [11] carried out a parametric study by varying the dimensions of the smallthin-walled cylindrical tank height-to-radius ratio (0.5 to 2.6), percentage liquid filling (50%to 100%), thickness of tank wall (1 mm to 10 mm), and scaled distance of the explosivematerial (0.5 to 2.5 m/kg1/3). The numerical simulations of the study show that there isa significant influence of the thickness of the tank wall and the height-to-radius ratio onplastic yielding. The study demonstrated the importance of studying the influence of thedimensions of the tank on the overall performance of the tank. In addition, there are veryfew studies in the literature on the use of numerical simulations to study the dynamicresponse of large thin-walled cylindrical tanks where the diameter of the tank is greaterthan the height of the tank. For example, Lu et al. [6] have discussed the applicability ofnumerical simulations for a thin-walled cylindrical tank which has diameter of 100 m andheight of 22.5 m. Authors [6] have studied the structural response by varying the internalliquid level, constraint conditions, and blast intensity while maintaining constant tank wallthickness, height, and diameter. For more comprehensive reviews and the latest studies onthin-walled pressure vessels, the reader can refer to [18–20]. However, the literature doesnot report clear and exact statements regarding the influence of a tank’s dimensions andthe distance from the blast on the overall performance of a thin-walled cylindrical shellstorage tank under blast loading. Thus, the aim of the present investigation is to study thebehaviour of a thin-walled cylindrical shell storage tank with a diameter of 100 m and aheight of 22.5 m under different blast loads using the finite element analysis method. Thethickness of the tank wall is varied as 10 mm, 20 mm, 30 mm, and 40 mm, while the fill levelof the internal fluid is varied as 25, 50, 75, and 100%. The outline of the remaining sectionsis: Section 2 provides the theoretical background of the analytical approach; Section 3introduces the materials and methods adopted in this study; Section 4 presents the resultsand discussion; and the conclusion is presented in Section 5.
2. Theoretical Background
Cylindrical pressure vessels are commonly used in the oil and gas industry to carryboth liquid and gases under pressure. When the vessels are exposed to this pressure, thematerials comprising the vessels will be subjected to longitudinal and hoop stress. Theimportant assumptions to be considered in deriving the equations of hoop and longitudinalstress are:
• Plane sections remain plane.• Radius-to-thickness ratio greater than or equal to 10 with uniform and constant
wall thickness.• Linear elastic, isotropic, and homogeneous material.• Uniform stress distribution throughout the wall thickness.• Negligible fluid weight.

Materials 2021, 14, 7100 3 of 24
The circumferential stress in a thin-walled cylindrical shell storage tank can be deter-mined using the following Equation (1):
σh =Prt
(1)
where P is internal pressure, r is mean radius of the cylinder, and t is wall thickness.The longitudinal stress in a pressurised thin-walled cylindrical shell storage tank can
be expressed using the following Equation (2):
σL =Pr2t
(2)
The equivalent tensile stress known as Von Mises stress can be computed usingEquation (3). This stress can be used to estimate the yielding of materials under complexloadings. The Von Mises failure criterion is one of the most-used failure criteria for ductilematerials such as structural steel.
σv =√
σh2 + σL2 − σhσL (3)
where δh and δL are the hoop stress and the longitudinal stress, respectively.
3. Materials and Methods
The research methodology adopted in this study is discussed in the following sections.
3.1. Storage Tank Geometry
The main parameters influencing the structural behaviour of a thin-walled cylindricalstorage tank are namely the height of the tank, the outer diameter, the wall thickness, andthe yield strength of material. The material of the tank has a density of 7850 kg/m3 and aPoisson ratio of 0.28. The additional modelling parameters for the thin-walled storage tank,provided by an oil and gas company operating in Malaysia, are presented in Table 1. Themodel with all the different parameters was subjected to internal pressure resulting fromhydrocarbon product with a density of 800 kg/m3. In this study, a storage tank with highercapacities was selected for modelling, as there is a global trend in storage capacities greaterthan 20 × 104 m3 and diameters greater than 100 m in the oil and gas industry [21,22].
Table 1. Design parameters for the thin-walled cylindrical storage tank.
Tank Height 22.5 m
Outer Diameter 100 m
Wall Thickness 10 mm 20 mm 30 mm 40 mm
Material YieldStrength, fy 235 MPa 275 MPa 355 MPa 440 MPa
Young’sModulus, E 206 GPa
Density, ρ 7850 kg/m3
Poisson Ratio 0.28
Constraints Fixed bottom plate and free at top
3.2. Numerical Modelling
The numerical simulation for the selected parameters consists of three stages, namelypre-processing, simulation, and post-processing. During the pre-processing stage, ANSYSWorkbench 2019 R19.1 software from ANSYS, Inc. (Washington County, PA, USA) was usedfor developing the geometry, assigning the material properties, loading, and finalising theboundary conditions of the model. The definitions of all properties and design parameters

Materials 2021, 14, 7100 4 of 24
must be precise and accurate to ensure the case study is correctly simulated in the software.The model geometry was then meshed into smaller elements connected by nodes to performthe finite element analysis (FEA). Generally, the sensitivity analysis shows that a smallermesh will produce results with higher accuracy, but consequently, it will lead to higherprocessing time and cost. Hence, as the wall thicknesses of the tank are much smallerthan the other geometric parameters, the tank was meshed using shell elements [17]. Themodel is a simplified representation of the storage tank, with the tank wall and base platemodelled as SHELL181 elements to increase the analysis accuracy and the efficiency ofthe simulation. The SHELL181 element has four nodes with three translational and threerotational degrees of freedom at each node, and linear interpolation is used within theelement [23]. In explicit dynamics, by default, coarse relevance centre, high smoothing,and slow transition were selected. The elements should have a uniform size to ensure themeshing quality. To ensure accuracy of the results, convergence and mesh independenceanalysis was conducted first. The optimum set of element sizes was adopted when themaximum displacement of the tank had insignificant influence when coarser elementsizes were tested in the numerical model. As a result, the maximum element size in thenumerical simulation was 13 mm × 20 mm, considering a maximum number of 128 K-nodes/elements. The thicknesses of the shell elements were defined as of 10 mm, 20 mm,30 mm, and 40 mm, respectively, based on the specifications in API 650 [22]. Once thegeometry, meshing, load assignment, and boundary conditions were found satisfactory,the analysis was done to solve the model using the governing equations. The outputssuch as forces, stresses, and deformations of the model were generated based on differentloading cases. The post-processing is the stage where the output from the simulation isreviewed. The results in different forms, such as contour, graphs, and tables, will providethe necessary information on the model properties. In this study, more emphasis wasplaced on the resultant deformation and Von Mises stress of the cylindrical storage tank.The proposed tank and meshing details are presented in Figure 1.
Materials 2021, 14, x FOR PEER REVIEW 4 of 25
The numerical simulation for the selected parameters consists of three stages, namely
pre-processing, simulation, and post-processing. During the pre-processing stage, ANSYS
Workbench 2019 R19.1 software from ANSYS, Inc was used for developing the geometry,
assigning the material properties, loading, and finalising the boundary conditions of the
model. The definitions of all properties and design parameters must be precise and accu-
rate to ensure the case study is correctly simulated in the software. The model geometry
was then meshed into smaller elements connected by nodes to perform the finite element
analysis (FEA). Generally, the sensitivity analysis shows that a smaller mesh will produce
results with higher accuracy, but consequently, it will lead to higher processing time and
cost. Hence, as the wall thicknesses of the tank are much smaller than the other geometric
parameters, the tank was meshed using shell elements [17]. The model is a simplified rep-
resentation of the storage tank, with the tank wall and base plate modelled as SHELL181
elements to increase the analysis accuracy and the efficiency of the simulation. The
SHELL181 element has four nodes with three translational and three rotational degrees of
freedom at each node, and linear interpolation is used within the element [23]. In explicit
dynamics, by default, coarse relevance centre, high smoothing, and slow transition were
selected. The elements should have a uniform size to ensure the meshing quality. To en-
sure accuracy of the results, convergence and mesh independence analysis was conducted
first. The optimum set of element sizes was adopted when the maximum displacement of
the tank had insignificant influence when coarser element sizes were tested in the numer-
ical model. As a result, the maximum element size in the numerical simulation was 13 mm
x 20 mm, considering a maximum number of 128 K-nodes/elements. The thicknesses of
the shell elements were defined as of 10 mm, 20 mm, 30 mm, and 40 mm, respectively,
based on the specifications in API 650 [22]. Once the geometry, meshing, load assignment,
and boundary conditions were found satisfactory, the analysis was done to solve the
model using the governing equations. The outputs such as forces, stresses, and defor-
mations of the model were generated based on different loading cases. The post-pro-
cessing is the stage where the output from the simulation is reviewed. The results in dif-
ferent forms, such as contour, graphs, and tables, will provide the necessary information
on the model properties. In this study, more emphasis was placed on the resultant defor-
mation and Von Mises stress of the cylindrical storage tank. The proposed tank and mesh-
ing details are presented in Figure 1.
(a)
Figure 1. Cont.

Materials 2021, 14, 7100 5 of 24Materials 2021, 14, x FOR PEER REVIEW 5 of 25
Figure 1. (a) Proposed model of thin-walled storage tank. (b) Meshing details.
3.3. Blast Modelling
Using the parametric study presented in the previous section, the optimum thin-
walled pressure vessel design was determined. The optimum model was then subjected
to blast loading with different intensities from different distances. Ansys LS-DYNA 2019
R19.1 software from ANSYS, Inc was used in the blast simulation, as the high impact ve-
locity of the blast causes higher stress, strain rate, local deformation, and pressure in a
short duration. The detonation was modelled using the Lagrange approach, as this ap-
proach normally requires a lesser mesh count as compared to the Eulerian approach and
has a much shorter computational time. The material assigned will be embedded within
the mesh and move along with the mesh. The blast loading in the finite element model of
this study is modelled using Load Blast Enhanced (LBE), which is a fully Lagrangian ap-
proach used for air blast loads from conventional explosives. The air blast pressure was
simulated empirically based on experimental data from The conventional weapons effects
blast loading model (ConWep), converted into polynomials through classical scaling laws
as reported in [24], and then applied to the nodes of a Lagrangian structure. The cylindri-
cal steel tank was modelled using a material of Mat Piecewise Linear Plasticity keywords,
where the strain rate parameters C and P of Cowper – Symonds relation are set to 40 and
5, respectively, to take the plastic deformation and the strain rates into consideration. The
termination time was set to 0.25 s with a timestep of 0.0005 s to capture the effect of blast
load [25]. The waveform of the blast is described using the Friedlander waveform, where
the pressure of the blast wave is described as a function of time as presented in Equation
(4) [26].
P(t) = 𝑃𝑠𝑒−𝑡
𝑡∗ (1 −𝑡
𝑡∗) (4)
where Ps is the overpressure (pressure above ambient pressure) and t* is the duration
of the positive phase, when the pressure is higher than the ambient pressure.
The flammable gas volumes adopted in this study were 15600 m3 and 4000 m3. These
volumes had blast intensities of 1500 kg and 380 kg of Trinitrotoluene (TNT), respectively.
The proposed standoff distances of the blast from the storage tank were 12.5 m and 25 m,
respectively, at a three-meter height, assuming an explosion from gas leakage, and the
(b)
Figure 1. (a) Proposed model of thin-walled storage tank. (b) Meshing details.
3.3. Blast Modelling
Using the parametric study presented in the previous section, the optimum thin-walled pressure vessel design was determined. The optimum model was then subjected toblast loading with different intensities from different distances. Ansys LS-DYNA 2019 R19.1software from ANSYS, Inc. was used in the blast simulation, as the high impact velocity ofthe blast causes higher stress, strain rate, local deformation, and pressure in a short duration.The detonation was modelled using the Lagrange approach, as this approach normallyrequires a lesser mesh count as compared to the Eulerian approach and has a much shortercomputational time. The material assigned will be embedded within the mesh and movealong with the mesh. The blast loading in the finite element model of this study is modelledusing Load Blast Enhanced (LBE), which is a fully Lagrangian approach used for air blastloads from conventional explosives. The air blast pressure was simulated empiricallybased on experimental data from The conventional weapons effects blast loading model(ConWep), converted into polynomials through classical scaling laws as reported in [24],and then applied to the nodes of a Lagrangian structure. The cylindrical steel tank wasmodelled using a material of Mat Piecewise Linear Plasticity keywords, where the strainrate parameters C and P of Cowper – Symonds relation are set to 40 and 5, respectively,to take the plastic deformation and the strain rates into consideration. The terminationtime was set to 0.25 s with a timestep of 0.0005 s to capture the effect of blast load [25]. Thewaveform of the blast is described using the Friedlander waveform, where the pressure ofthe blast wave is described as a function of time as presented in Equation (4) [26].
P(t) = Pse−t
t∗
(1− t
t∗
)(4)
where Ps is the overpressure (pressure above ambient pressure) and t* is the duration ofthe positive phase, when the pressure is higher than the ambient pressure.
The flammable gas volumes adopted in this study were 15,600 m3 and 4000 m3. Thesevolumes had blast intensities of 1500 kg and 380 kg of Trinitrotoluene (TNT), respectively.The proposed standoff distances of the blast from the storage tank were 12.5 m and 25 m,respectively, at a three-meter height, assuming an explosion from gas leakage, and the
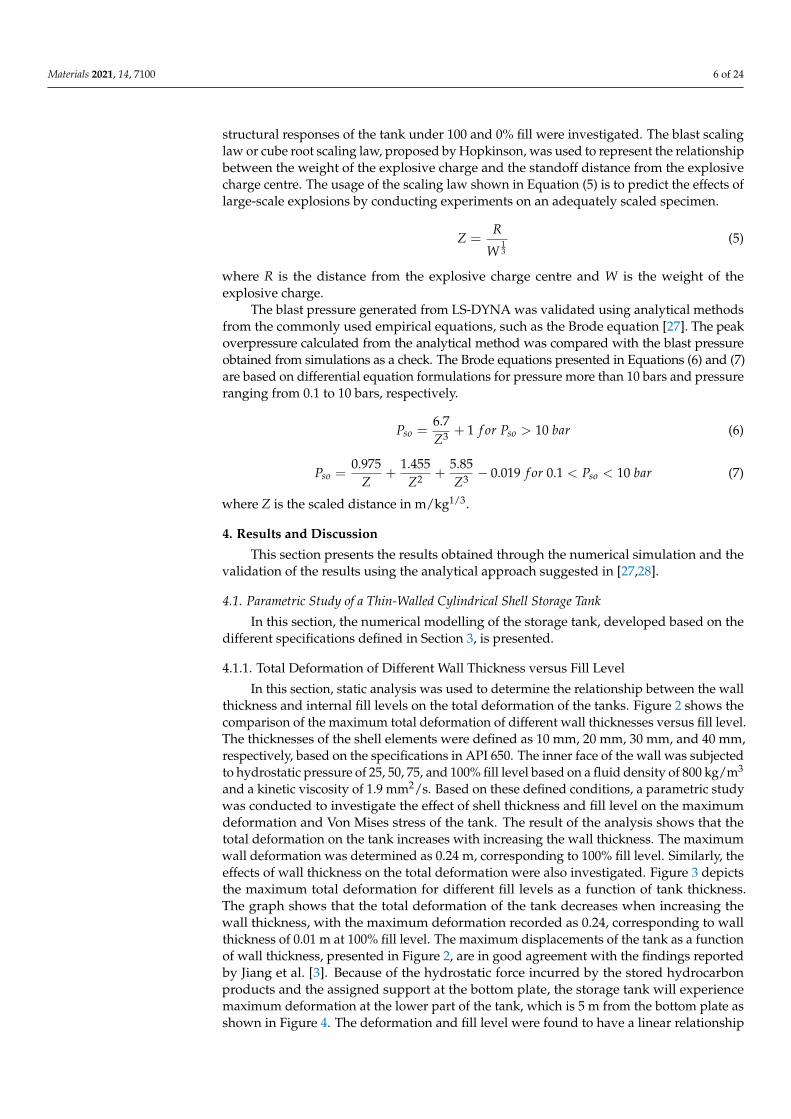
Materials 2021, 14, 7100 6 of 24
structural responses of the tank under 100 and 0% fill were investigated. The blast scalinglaw or cube root scaling law, proposed by Hopkinson, was used to represent the relationshipbetween the weight of the explosive charge and the standoff distance from the explosivecharge centre. The usage of the scaling law shown in Equation (5) is to predict the effects oflarge-scale explosions by conducting experiments on an adequately scaled specimen.
Z =R
W13
(5)
where R is the distance from the explosive charge centre and W is the weight of theexplosive charge.
The blast pressure generated from LS-DYNA was validated using analytical methodsfrom the commonly used empirical equations, such as the Brode equation [27]. The peakoverpressure calculated from the analytical method was compared with the blast pressureobtained from simulations as a check. The Brode equations presented in Equations (6) and (7)are based on differential equation formulations for pressure more than 10 bars and pressureranging from 0.1 to 10 bars, respectively.
Pso =6.7Z3 + 1 f or Pso > 10 bar (6)
Pso =0.975
Z+
1.455Z2 +
5.85Z3 − 0.019 f or 0.1 < Pso < 10 bar (7)
where Z is the scaled distance in m/kg1/3.
4. Results and Discussion
This section presents the results obtained through the numerical simulation and thevalidation of the results using the analytical approach suggested in [27,28].
4.1. Parametric Study of a Thin-Walled Cylindrical Shell Storage Tank
In this section, the numerical modelling of the storage tank, developed based on thedifferent specifications defined in Section 3, is presented.
4.1.1. Total Deformation of Different Wall Thickness versus Fill Level
In this section, static analysis was used to determine the relationship between the wallthickness and internal fill levels on the total deformation of the tanks. Figure 2 shows thecomparison of the maximum total deformation of different wall thicknesses versus fill level.The thicknesses of the shell elements were defined as 10 mm, 20 mm, 30 mm, and 40 mm,respectively, based on the specifications in API 650. The inner face of the wall was subjectedto hydrostatic pressure of 25, 50, 75, and 100% fill level based on a fluid density of 800 kg/m3
and a kinetic viscosity of 1.9 mm2/s. Based on these defined conditions, a parametric studywas conducted to investigate the effect of shell thickness and fill level on the maximumdeformation and Von Mises stress of the tank. The result of the analysis shows that thetotal deformation on the tank increases with increasing the wall thickness. The maximumwall deformation was determined as 0.24 m, corresponding to 100% fill level. Similarly, theeffects of wall thickness on the total deformation were also investigated. Figure 3 depictsthe maximum total deformation for different fill levels as a function of tank thickness.The graph shows that the total deformation of the tank decreases when increasing thewall thickness, with the maximum deformation recorded as 0.24, corresponding to wallthickness of 0.01 m at 100% fill level. The maximum displacements of the tank as a functionof wall thickness, presented in Figure 2, are in good agreement with the findings reportedby Jiang et al. [3]. Because of the hydrostatic force incurred by the stored hydrocarbonproducts and the assigned support at the bottom plate, the storage tank will experiencemaximum deformation at the lower part of the tank, which is 5 m from the bottom plate asshown in Figure 4. The deformation and fill level were found to have a linear relationship

Materials 2021, 14, 7100 7 of 24
in every shell thickness defined. The thinner the wall of the tank, the steeper the gradient ofthe graph, indicating that the deformation of tanks with a lower thickness is more sensitiveto the changes of fill level. It can be seen that the tank will deform the most when it is 100%filled as compared to other partial fill levels. As expected, the deformation increases withhigher fill levels and decreases with thicker tank walls. However, the deformations are veryminimal and do not impact the serviceability and structural integrity of the tank. Thus,more focus is given to the equivalent stress known as the Von Mises stress and its variation,with respect to the yielding stress of the storage tank, as discussed in the following section.
Materials 2021, 14, x FOR PEER REVIEW 7 of 25
from the bottom plate as shown in Figure 4. The deformation and fill level were found to
have a linear relationship in every shell thickness defined. The thinner the wall of the tank,
the steeper the gradient of the graph, indicating that the deformation of tanks with a lower
thickness is more sensitive to the changes of fill level. It can be seen that the tank will
deform the most when it is 100% filled as compared to other partial fill levels. As expected,
the deformation increases with higher fill levels and decreases with thicker tank walls.
However, the deformations are very minimal and do not impact the serviceability and
structural integrity of the tank. Thus, more focus is given to the equivalent stress known
as the Von Mises stress and its variation, with respect to the yielding stress of the storage
tank, as discussed in the following section.
Figure 2. Variation of maximum total deformation of different wall thicknesses versus fill level.
Figure 3. Variation of maximum total deformation of different fill levels versus tank thickness.
0
0.05
0.1
0.15
0.2
0.25
25% 50% 75% 100%
Def
orm
atio
n (
m)
Fill Level
Total Deformation (10 mm) Total Deformation (20 mm)
Total Deformation (30 mm) Total Deformation (40 mm)
Linear (Total Deformation (10 mm)) Linear (Total Deformation (20 mm))
Linear (Total Deformation (30 mm)) Linear (Total Deformation (40 mm))
0
0.05
0.1
0.15
0.2
0.25
0.01 0.02 0.03 0.04
Def
orm
atio
n (
m)
Tank Thickness (m)
Total Deformation (25% Fill) Total Deformation (50% Fill)
Total Deformation (75% Fill) Total Deformation (100% Fill)
Figure 2. Variation of maximum total deformation of different wall thicknesses versus fill level.
Materials 2021, 14, x FOR PEER REVIEW 7 of 25
from the bottom plate as shown in Figure 4. The deformation and fill level were found to
have a linear relationship in every shell thickness defined. The thinner the wall of the tank,
the steeper the gradient of the graph, indicating that the deformation of tanks with a lower
thickness is more sensitive to the changes of fill level. It can be seen that the tank will
deform the most when it is 100% filled as compared to other partial fill levels. As expected,
the deformation increases with higher fill levels and decreases with thicker tank walls.
However, the deformations are very minimal and do not impact the serviceability and
structural integrity of the tank. Thus, more focus is given to the equivalent stress known
as the Von Mises stress and its variation, with respect to the yielding stress of the storage
tank, as discussed in the following section.
Figure 2. Variation of maximum total deformation of different wall thicknesses versus fill level.
Figure 3. Variation of maximum total deformation of different fill levels versus tank thickness.
0
0.05
0.1
0.15
0.2
0.25
25% 50% 75% 100%
Def
orm
atio
n (
m)
Fill Level
Total Deformation (10 mm) Total Deformation (20 mm)
Total Deformation (30 mm) Total Deformation (40 mm)
Linear (Total Deformation (10 mm)) Linear (Total Deformation (20 mm))
Linear (Total Deformation (30 mm)) Linear (Total Deformation (40 mm))
0
0.05
0.1
0.15
0.2
0.25
0.01 0.02 0.03 0.04
Def
orm
atio
n (
m)
Tank Thickness (m)
Total Deformation (25% Fill) Total Deformation (50% Fill)
Total Deformation (75% Fill) Total Deformation (100% Fill)
Figure 3. Variation of maximum total deformation of different fill levels versus tank thickness.

Materials 2021, 14, 7100 8 of 24Materials 2021, 14, x FOR PEER REVIEW 8 of 25
Figure 4. Location of maximum deformation of the tank.
4.1.2. Von Mises Stress versus Fill Level of Different Tank Thicknesses
The variations of Von Mises stress versus the fill level of different tank thicknesses
and various wall thicknesses are presented in Figures 5 and 6, respectively. The compari-
son of the Von Mises stress between an analytical approach and numerical modelling is
focused on a storage tank with 100% fill level, as the usage of simplified equations as-
sumed a uniform stress distribution throughout the surface of the tank. Based on the com-
parison between the analytical method and the numerical results, it was found that the
results are generally in good agreement with each other, having similar values and having
almost the same trend for the different tank thicknesses. The highest percentage difference
between the numerical results and the analytical value of equivalent stress was observed
to be 17%, when the shell thickness is 10 mm and the fill level is 100%. As the shell thick-
ness of the tank increases, the difference between the numerical and analytical values re-
duces. The efficiency of each steel grade is also evaluated based on the Von Mises stress
at 100% fill level to ensure the storage tank will not yield under normal usage. For a large-
scale storage tank, the yield strengths of S235 steel and S275 steel are easily exceeded with
a tank thickness of less than 20 mm. This is in accordance with API 650′s specification for
EN 10025 S 355 J0, J2, and K2 structural steel plates, with the minimum yield strength
being 355 MPa. The S450 structural steel will permit the usage of 20-mm-, 30-mm-, and
40-mm-thick plates, while S355 permits 30 mm and 40 mm plate thicknesses. By using the
higher steel grade of S450, adequate structural capacity will be achieved even with 20-mm
wall thickness. The response of the finite element model with the 20-mm tank wall and
base plate made of S450 structural steel subjected to blast load will be discussed in the
following section.
Figure 4. Location of maximum deformation of the tank.
4.1.2. Von Mises Stress versus Fill Level of Different Tank Thicknesses
The variations of Von Mises stress versus the fill level of different tank thicknesses andvarious wall thicknesses are presented in Figures 5 and 6, respectively. The comparison ofthe Von Mises stress between an analytical approach and numerical modelling is focusedon a storage tank with 100% fill level, as the usage of simplified equations assumed auniform stress distribution throughout the surface of the tank. Based on the comparisonbetween the analytical method and the numerical results, it was found that the results aregenerally in good agreement with each other, having similar values and having almost thesame trend for the different tank thicknesses. The highest percentage difference betweenthe numerical results and the analytical value of equivalent stress was observed to be17%, when the shell thickness is 10 mm and the fill level is 100%. As the shell thicknessof the tank increases, the difference between the numerical and analytical values reduces.The efficiency of each steel grade is also evaluated based on the Von Mises stress at 100%fill level to ensure the storage tank will not yield under normal usage. For a large-scalestorage tank, the yield strengths of S235 steel and S275 steel are easily exceeded with atank thickness of less than 20 mm. This is in accordance with API 650′s specification forEN 10025 S 355 J0, J2, and K2 structural steel plates, with the minimum yield strengthbeing 355 MPa. The S450 structural steel will permit the usage of 20-mm-, 30-mm-, and40-mm-thick plates, while S355 permits 30 mm and 40 mm plate thicknesses. By using thehigher steel grade of S450, adequate structural capacity will be achieved even with 20-mmwall thickness. The response of the finite element model with the 20-mm tank wall andbase plate made of S450 structural steel subjected to blast load will be discussed in thefollowing section.

Materials 2021, 14, 7100 9 of 24Materials 2021, 14, x FOR PEER REVIEW 9 of 25
Figure 5. Variation of Von Mises stress versus fill level of different tank thicknesses.
Figure 6. Variation of Von Mises stress versus tank thickness of different fill levels.
4.2. Validation of Blast Modelling using Analytical Equations
Blast simulations of an S450 storage tank with 20-mm wall thickness were carried out
for each case defined in Section 3 with a run of 0.25 s and with a time step of 0.005 s. Time
history of the incident pressure is measured from the selected tank segment facing the
blast, centred 4.69 m from the bottom plate. The incident pressures of each blast case were
then compared with the value obtained from the analytical method for validation pur-
poses. A typical segment of a tank with the meshing details used is shown in Figure 7.
0.00E+00
2.00E+08
4.00E+08
6.00E+08
8.00E+08
1.00E+09
25% 50% 75% 100%
Vo
n M
ises
Str
ess
(Pa)
Fill Level (%)
Analytical (10mm thk) Numerical (10mm thk)Analytical (20mm thk) Numerical (20mm thk)Analytical (40mm thk) Numerical (40mm thk)Analytical (30mm thk) Numerical (30mm thk)S235 S275S355 S450
0.00E+00
2.00E+08
4.00E+08
6.00E+08
8.00E+08
1.00E+09
0.01 0.02 0.03 0.04
Vo
n M
ises
Str
ess
(Pa)
Tank Thickness (m)
Analytical (25% fill) Numerical (25% Fill)Analytical (50% Fill) Numerical (50% Fill)Analytical (75% Fill) Numerical (75% Fill)Analytical (100 % Fill) Numerical (100 % Fill)S235 S275S355 S450
Figure 5. Variation of Von Mises stress versus fill level of different tank thicknesses.
Materials 2021, 14, x FOR PEER REVIEW 9 of 25
Figure 5. Variation of Von Mises stress versus fill level of different tank thicknesses.
Figure 6. Variation of Von Mises stress versus tank thickness of different fill levels.
4.2. Validation of Blast Modelling using Analytical Equations
Blast simulations of an S450 storage tank with 20-mm wall thickness were carried out
for each case defined in Section 3 with a run of 0.25 s and with a time step of 0.005 s. Time
history of the incident pressure is measured from the selected tank segment facing the
blast, centred 4.69 m from the bottom plate. The incident pressures of each blast case were
then compared with the value obtained from the analytical method for validation pur-
poses. A typical segment of a tank with the meshing details used is shown in Figure 7.
0.00E+00
2.00E+08
4.00E+08
6.00E+08
8.00E+08
1.00E+09
25% 50% 75% 100%
Vo
n M
ises
Str
ess
(Pa)
Fill Level (%)
Analytical (10mm thk) Numerical (10mm thk)Analytical (20mm thk) Numerical (20mm thk)Analytical (40mm thk) Numerical (40mm thk)Analytical (30mm thk) Numerical (30mm thk)S235 S275S355 S450
0.00E+00
2.00E+08
4.00E+08
6.00E+08
8.00E+08
1.00E+09
0.01 0.02 0.03 0.04
Vo
n M
ises
Str
ess
(Pa)
Tank Thickness (m)
Analytical (25% fill) Numerical (25% Fill)Analytical (50% Fill) Numerical (50% Fill)Analytical (75% Fill) Numerical (75% Fill)Analytical (100 % Fill) Numerical (100 % Fill)S235 S275S355 S450
Figure 6. Variation of Von Mises stress versus tank thickness of different fill levels.
4.2. Validation of Blast Modelling Using Analytical Equations
Blast simulations of an S450 storage tank with 20-mm wall thickness were carriedout for each case defined in Section 3 with a run of 0.25 s and with a time step of 0.005 s.Time history of the incident pressure is measured from the selected tank segment facingthe blast, centred 4.69 m from the bottom plate. The incident pressures of each blast casewere then compared with the value obtained from the analytical method for validationpurposes. A typical segment of a tank with the meshing details used is shown in Figure 7.
Materials 2021, 14, 7100 10 of 24Materials 2021, 14, x FOR PEER REVIEW 10 of 25
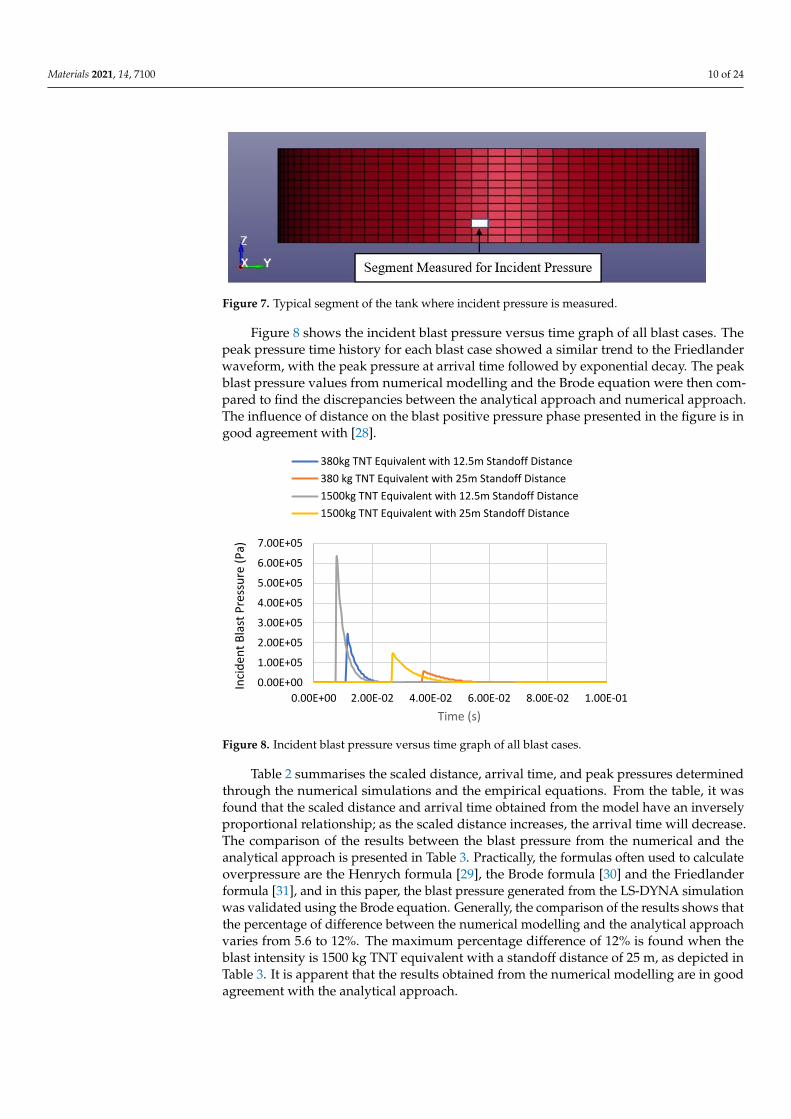
Figure 7. Typical segment of the tank where incident pressure is measured.
Figure 8 shows the incident blast pressure versus time graph of all blast cases. The
peak pressure time history for each blast case showed a similar trend to the Friedlander
waveform, with the peak pressure at arrival time followed by exponential decay. The peak
blast pressure values from numerical modelling and the Brode equation were then com-
pared to find the discrepancies between the analytical approach and numerical approach.
The influence of distance on the blast positive pressure phase presented in the figure is in
good agreement with [28].
Figure 8. Incident blast pressure versus time graph of all blast cases.
Table 2 summarises the scaled distance, arrival time, and peak pressures determined
through the numerical simulations and the empirical equations. From the table, it was
found that the scaled distance and arrival time obtained from the model have an inversely
proportional relationship; as the scaled distance increases, the arrival time will decrease.
The comparison of the results between the blast pressure from the numerical and the an-
alytical approach is presented in Table 3. Practically, the formulas often used to calculate
overpressure are the Henrych formula [29], the Brode formula [30] and the Friedlander
formula [31], and in this paper, the blast pressure generated from the LS-DYNA simula-
tion was validated using the Brode equation. Generally, the comparison of the results
shows that the percentage of difference between the numerical modelling and the analyt-
ical approach varies from 5.6 to 12%. The maximum percentage difference of 12% is found
when the blast intensity is 1500 kg TNT equivalent with a standoff distance of 25 m, as
depicted in Table 3. It is apparent that the results obtained from the numerical modelling
are in good agreement with the analytical approach.
0.00E+00
1.00E+05
2.00E+05
3.00E+05
4.00E+05
5.00E+05
6.00E+05
7.00E+05
0.00E+00 2.00E-02 4.00E-02 6.00E-02 8.00E-02 1.00E-01
Inci
den
t B
last
Pre
ssu
re (
Pa)
Time (s)
380kg TNT Equivalent with 12.5m Standoff Distance
380 kg TNT Equivalent with 25m Standoff Distance
1500kg TNT Equivalent with 12.5m Standoff Distance
1500kg TNT Equivalent with 25m Standoff Distance
Figure 7. Typical segment of the tank where incident pressure is measured.
Figure 8 shows the incident blast pressure versus time graph of all blast cases. Thepeak pressure time history for each blast case showed a similar trend to the Friedlanderwaveform, with the peak pressure at arrival time followed by exponential decay. The peakblast pressure values from numerical modelling and the Brode equation were then com-pared to find the discrepancies between the analytical approach and numerical approach.The influence of distance on the blast positive pressure phase presented in the figure is ingood agreement with [28].
Materials 2021, 14, x FOR PEER REVIEW 10 of 25
Figure 7. Typical segment of the tank where incident pressure is measured.
Figure 8 shows the incident blast pressure versus time graph of all blast cases. The
peak pressure time history for each blast case showed a similar trend to the Friedlander
waveform, with the peak pressure at arrival time followed by exponential decay. The peak
blast pressure values from numerical modelling and the Brode equation were then com-
pared to find the discrepancies between the analytical approach and numerical approach.
The influence of distance on the blast positive pressure phase presented in the figure is in
good agreement with [28].
Figure 8. Incident blast pressure versus time graph of all blast cases.
Table 2 summarises the scaled distance, arrival time, and peak pressures determined
through the numerical simulations and the empirical equations. From the table, it was
found that the scaled distance and arrival time obtained from the model have an inversely
proportional relationship; as the scaled distance increases, the arrival time will decrease.
The comparison of the results between the blast pressure from the numerical and the an-
alytical approach is presented in Table 3. Practically, the formulas often used to calculate
overpressure are the Henrych formula [29], the Brode formula [30] and the Friedlander
formula [31], and in this paper, the blast pressure generated from the LS-DYNA simula-
tion was validated using the Brode equation. Generally, the comparison of the results
shows that the percentage of difference between the numerical modelling and the analyt-
ical approach varies from 5.6 to 12%. The maximum percentage difference of 12% is found
when the blast intensity is 1500 kg TNT equivalent with a standoff distance of 25 m, as
depicted in Table 3. It is apparent that the results obtained from the numerical modelling
are in good agreement with the analytical approach.
0.00E+00
1.00E+05
2.00E+05
3.00E+05
4.00E+05
5.00E+05
6.00E+05
7.00E+05
0.00E+00 2.00E-02 4.00E-02 6.00E-02 8.00E-02 1.00E-01
Inci
den
t B
last
Pre
ssu
re (
Pa)
Time (s)
380kg TNT Equivalent with 12.5m Standoff Distance
380 kg TNT Equivalent with 25m Standoff Distance
1500kg TNT Equivalent with 12.5m Standoff Distance
1500kg TNT Equivalent with 25m Standoff Distance
Figure 8. Incident blast pressure versus time graph of all blast cases.
Table 2 summarises the scaled distance, arrival time, and peak pressures determinedthrough the numerical simulations and the empirical equations. From the table, it wasfound that the scaled distance and arrival time obtained from the model have an inverselyproportional relationship; as the scaled distance increases, the arrival time will decrease.The comparison of the results between the blast pressure from the numerical and theanalytical approach is presented in Table 3. Practically, the formulas often used to calculateoverpressure are the Henrych formula [29], the Brode formula [30] and the Friedlanderformula [31], and in this paper, the blast pressure generated from the LS-DYNA simulationwas validated using the Brode equation. Generally, the comparison of the results shows thatthe percentage of difference between the numerical modelling and the analytical approachvaries from 5.6 to 12%. The maximum percentage difference of 12% is found when theblast intensity is 1500 kg TNT equivalent with a standoff distance of 25 m, as depicted inTable 3. It is apparent that the results obtained from the numerical modelling are in goodagreement with the analytical approach.

Materials 2021, 14, 7100 11 of 24
Table 2. Scaled distance and arrival time of the analysis carried out.
Blast Intensity ofTNT Equivalent (kg)
Standoff Distance(m)
Scaled Distance(m/kg1/3) Arrival Time (s)
380 12.5 1.7258 0.0115
380 25 3.4515 0.0374
1500 12.5 1.0920 0.0079
1500 25 2.1840 0.0270
Table 3. Comparison between blast pressures from numerical and analytical approaches.
Blast Intensityof TNT
Equivalent (kg)
StandoffDistance (m)
Peak Pressurefrom Numerical
Modelling,(N/m2)
Peak Pressurefrom BrodeEquation,
(N/m2)
PercentageDifference with
NumericalModelling
380 12.5 240,102 217,268 9.5%
380 25 57,695 52,789 8.5%
1500 12.5 623,599 658,689 5.6%
1500 25 147,095 129,409 12%
4.3. Tank Deformation after the Blast Impact
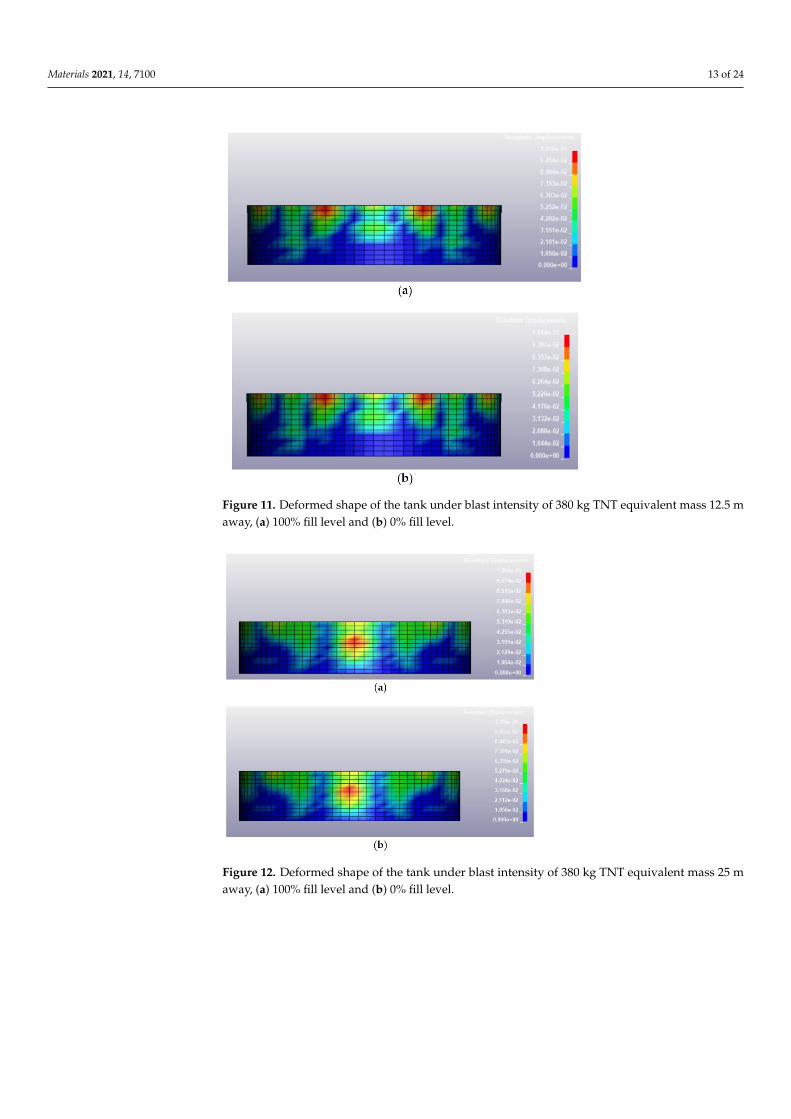
Once the validation of the blast pressure of the model was conducted successfully,the finite element model described in the previous section was loaded under various blastconditions, including a blast intensity of 1500 kg TNT equivalent at blast distances of 12.5 mand 25 m for fill levels of 100 and 0%, respectively. The deformed shapes of the tanks at0.25 s after the blast for different blast conditions are illustrated in Figures 9–12. Generally,the storage tank showed almost the same pattern of displacement with different fill levelsdespite the existing difference in the magnitudes. In Figure 9, the deformed shapes ofthe storage tank at both fill levels subjected to 1500 kg TNT equivalent blast load from adistance of 12.5 m are found to have the maximum concave deformation at the lower partof the tank. However, in Figure 10, when the distance from the blast was increased to 25 m,the maximum deformation was found to be at the upper part of the tanks. For a blast loadof 380 kg TNT equivalent, the maximum deformations when the blast distance was 12.5 mwere found to be located at the upper side of the tank as shown in Figure 11, while for theloading case with a blast distance of 25 m, the tank deformation was at its middle panelas shown in Figure 12, which faced the explosion source. The difference in the location ofmaximum deformation is because of the different propagation of blast waves cause by thevarying blast distance and blast intensity.
Based on the summary of tank displacement at 0.25 s, which is the termination time ofthe analysis presented in Table 4, the tank structure will experience greater displacement ata higher blast intensity and shorter distance from the blast. The maximum displacementobserved on the tank was 443.5 mm, corresponding to a blast loading of 1500 kg TNTequivalent and a standoff distance of 12.5 m. The variation of fill level didn’t affect themaximum displacement much, as the highest percentage difference of deformation between100% fill and 0% fill is merely 0.85%. This is because the density of 800 kg/m3 is relativelylow and does not affect the displacement significantly. The summary of the maximumtank displacements based on simulations is presented in Table 4. The deformation processand stress and strain distribution of the cylindrical shell are similar to that in the studyof Paul et al. [32] and Jian et al. [3], in which the resistance of a thin-walled cylindricalshell with fixed ends is attributed to the axial tension and dynamic pulse buckling of theloaded surface.

Materials 2021, 14, 7100 12 of 24Materials 2021, 14, x FOR PEER REVIEW 12 of 25
Figure 9. Deformed shape of the tank under blast intensity of 1500 kg TNT equivalent mass 12.5 m
away, (a) 100% fill level and (b) 0% fill level.
Figure 10. Deformed shape of the tank under blast intensity of 1500 kg TNT equivalent mass
25 m away, (a) 100% fill level and (b) 0% fill level.
Figure 9. Deformed shape of the tank under blast intensity of 1500 kg TNT equivalent mass 12.5 maway, (a) 100% fill level and (b) 0% fill level.
Materials 2021, 14, x FOR PEER REVIEW 12 of 25
Figure 9. Deformed shape of the tank under blast intensity of 1500 kg TNT equivalent mass 12.5 m
away, (a) 100% fill level and (b) 0% fill level.
Figure 10. Deformed shape of the tank under blast intensity of 1500 kg TNT equivalent mass
25 m away, (a) 100% fill level and (b) 0% fill level.
Figure 10. Deformed shape of the tank under blast intensity of 1500 kg TNT equivalent mass 25 maway, (a) 100% fill level and (b) 0% fill level.
Materials 2021, 14, 7100 13 of 24Materials 2021, 14, x FOR PEER REVIEW 13 of 25
Figure 11. Deformed shape of the tank under blast intensity of 380 kg TNT equivalent mass
12.5 m away, (a) 100% fill level and (b) 0% fill level.
Figure 12. Deformed shape of the tank under blast intensity of 380 kg TNT equivalent mass
25 m away, (a) 100% fill level and (b) 0% fill level.
Based on the summary of tank displacement at 0.25 s, which is the termination time
of the analysis presented in Table 4, the tank structure will experience greater displace-
ment at a higher blast intensity and shorter distance from the blast. The maximum dis-
placement observed on the tank was 443.5 mm, corresponding to a blast loading of 1500kg
TNT equivalent and a standoff distance of 12.5 m. The variation of fill level didn’t affect
the maximum displacement much, as the highest percentage difference of deformation
between 100% fill and 0% fill is merely 0.85%. This is because the density of 800 kg/m3 is
relatively low and does not affect the displacement significantly. The summary of the
Figure 11. Deformed shape of the tank under blast intensity of 380 kg TNT equivalent mass 12.5 maway, (a) 100% fill level and (b) 0% fill level.
Materials 2021, 14, x FOR PEER REVIEW 13 of 25
Figure 11. Deformed shape of the tank under blast intensity of 380 kg TNT equivalent mass
12.5 m away, (a) 100% fill level and (b) 0% fill level.
Figure 12. Deformed shape of the tank under blast intensity of 380 kg TNT equivalent mass
25 m away, (a) 100% fill level and (b) 0% fill level.
Based on the summary of tank displacement at 0.25 s, which is the termination time
of the analysis presented in Table 4, the tank structure will experience greater displace-
ment at a higher blast intensity and shorter distance from the blast. The maximum dis-
placement observed on the tank was 443.5 mm, corresponding to a blast loading of 1500kg
TNT equivalent and a standoff distance of 12.5 m. The variation of fill level didn’t affect
the maximum displacement much, as the highest percentage difference of deformation
between 100% fill and 0% fill is merely 0.85%. This is because the density of 800 kg/m3 is
relatively low and does not affect the displacement significantly. The summary of the
Figure 12. Deformed shape of the tank under blast intensity of 380 kg TNT equivalent mass 25 maway, (a) 100% fill level and (b) 0% fill level.

Materials 2021, 14, 7100 14 of 24
Table 4. Summary of maximum tank displacement at 0.25 s.
Blast Conditions Standoff Distance (m) Fill Level(%)
MaximumDisplacement (mm)
1500 kg TNT Equivalent 12.5 100 443.5
1500 kg TNT Equivalent 12.5 0 439.7
1500 kg TNT Equivalent 25 100 195.8
1500 kg TNT Equivalent 25 0 194.7
380 kg TNT Equivalent 12.5 100 105.0
380 kg TNT Equivalent 12.5 0 104.4
380 kg TNT Equivalent 25 100 106.4
380 kg TNT Equivalent 25 0 105.6
4.4. Tank Resultant Displacement under Blast Impacts
Besides studying the tank deformation after the blast, the resultant displacement ofthe tank summated from different displacement vectors throughout the explosion wasalso measured and analysed. The resultant displacement throughout the whole analysisof 0.25 s is measured at seven measuring points, namely S1–S7, at the tank surface facingthe blast loading. The locations of the measuring points are shown in Figure 13, while thecorresponding coordinates of each reference point are shown in Table 5.
Materials 2021, 14, x FOR PEER REVIEW 14 of 25
maximum tank displacements based on simulations is presented in Table 4. The defor-
mation process and stress and strain distribution of the cylindrical shell are similar to that
in the study of Paul et al. [32] and Jian et al. [3], in which the resistance of a thin-walled
cylindrical shell with fixed ends is attributed to the axial tension and dynamic pulse buck-
ling of the loaded surface.
Table 4. Summary of maximum tank displacement at 0.25s.
Blast Conditions Standoff Dis-
tance (m)
Fill Level
(%)
Maximum Displacement
(mm)
1500 kg TNT Equivalent 12.5 100 443.5
1500 kg TNT Equivalent 12.5 0 439.7
1500 kg TNT Equivalent 25 100 195.8
1500 kg TNT Equivalent 25 0 194.7
380 kg TNT Equivalent 12.5 100 105.0
380 kg TNT Equivalent 12.5 0 104.4
380 kg TNT Equivalent 25 100 106.4
380 kg TNT Equivalent 25 0 105.6
4.4. Tank Resultant Displacement under Blast Impacts
Besides studying the tank deformation after the blast, the resultant displacement of
the tank summated from different displacement vectors throughout the explosion was
also measured and analysed. The resultant displacement throughout the whole analysis
of 0.25 s is measured at seven measuring points, namely S1–S7, at the tank surface facing
the blast loading. The locations of the measuring points are shown in Figure 13, while the
corresponding coordinates of each reference point are shown in Table 5.
Figure 13. Location of measuring points.
Table 5. Z-coordinates of measuring points.
Measuring Points Z-coordinate (m)
S1 0
S2 3.75
S3 7.5
S4 11.25
S5 15
S6 18.75
S7 22.5
The resultant displacement versus time functions under blast intensities for different
TNT equivalent masses at various fill levels and from various distances are presented in
Figures 14–17. Generally, one can observe that the resultant deformation for the different
loading cases started with zero (as the blast wave had not reached the structure), and then
it increased and fluctuated when the blast wave hit the structure. In general, the location
Figure 13. Location of measuring points.
Table 5. Z-coordinates of measuring points.
Measuring Points Z-Coordinate (m)
S1 0
S2 3.75
S3 7.5
S4 11.25
S5 15
S6 18.75
S7 22.5
The resultant displacement versus time functions under blast intensities for differentTNT equivalent masses at various fill levels and from various distances are presented inFigures 14–17. Generally, one can observe that the resultant deformation for the differentloading cases started with zero (as the blast wave had not reached the structure), and thenit increased and fluctuated when the blast wave hit the structure. In general, the location ofmaximum displacement was always found to be at S7, which is at the top of the tank, as itis the furthest point from the support, which is at the base of the tank. Similar observationswere also reported in [3]. The only exceptional case was when the blast intensity was1500 kg TNT equivalent with a standoff distance of 12.5 m (Figure 14), in which the highestdeformation was experienced at S3, located at a 7.5-m height, approximately at one-third of

Materials 2021, 14, 7100 15 of 24
the total tank height. Generally, it was found that at higher-scaled distances, the maximumresultant displacement occurred at the top of the tank wall, while the lower part of the tankwas subjected to greater displacement mostly in the case of low-scaled distances. The blastintensity and standoff distance have a great influence on the storage tank’s displacement,as presented in Figures 14–17. The displacement of the tank wall increases at a lowerstandoff distance of the same blast intensity as compared to a greater distance. In addition,the results show that under the same standoff distance, the tank wall will deform withgreater intensity if a higher blast intensity is applied. Further, the simulation results showsthat the fill level has comparatively negligible effects on the overall deformation becausethe hydrocarbon product contained by the tank has a density of 800 kg/m3, which isrelatively low.
Materials 2021, 14, x FOR PEER REVIEW 15 of 25
of maximum displacement was always found to be at S7, which is at the top of the tank,
as it is the furthest point from the support, which is at the base of the tank. Similar obser-
vations were also reported in [3]. The only exceptional case was when the blast intensity
was 1500 kg TNT equivalent with a standoff distance of 12.5 m (Figure 14), in which the
highest deformation was experienced at S3, located at a 7.5-m height, approximately at
one-third of the total tank height. Generally, it was found that at higher-scaled distances,
the maximum resultant displacement occurred at the top of the tank wall, while the lower
part of the tank was subjected to greater displacement mostly in the case of low-scaled
distances. The blast intensity and standoff distance have a great influence on the storage
tank’s displacement, as presented in Figures 14–17. The displacement of the tank wall in-
creases at a lower standoff distance of the same blast intensity as compared to a greater
distance. In addition, the results show that under the same standoff distance, the tank wall
will deform with greater intensity if a higher blast intensity is applied. Further, the simu-
lation results shows that the fill level has comparatively negligible effects on the overall
deformation because the hydrocarbon product contained by the tank has a density of 800
kg/m3, which is relatively low.
Figure 14. Resultant displacement versus time under blast intensity of 1500 kg TNT equivalent
mass 12.5 m away, (a) 100% fill and (b) 0% fill. Figure 14. Resultant displacement versus time under blast intensity of 1500 kg TNT equivalent mass12.5 m away, (a) 100% fill and (b) 0% fill.

Materials 2021, 14, 7100 16 of 24Materials 2021, 14, x FOR PEER REVIEW 16 of 25
Figure 15. Resultant displacement versus time under blast intensity of 1500 kg TNT equivalent
mass 25 m away, (a) 100% fill and (b) 0% fill.
Figure 15. Resultant displacement versus time under blast intensity of 1500 kg TNT equivalent mass25 m away, (a) 100% fill and (b) 0% fill.

Materials 2021, 14, 7100 17 of 24Materials 2021, 14, x FOR PEER REVIEW 17 of 25
Figure 16. Resultant displacement versus time under blast intensity of 380 kg TNT equivalent
mass 12.5 m away, (a) 100% fill and (b) 0% fill.
Figure 16. Resultant displacement versus time under blast intensity of 380 kg TNT equivalent mass12.5 m away, (a) 100% fill and (b) 0% fill.

Materials 2021, 14, 7100 18 of 24Materials 2021, 14, x FOR PEER REVIEW 18 of 25
Figure 17. Resultant displacement versus time under blast intensity of 380 kg TNT equivalent
mass 25 m away, (a) 100% fill and (b) 0% fill.
4.5. Tank Equivalent Stress under Blast Impacts
This section discusses equivalent stress under blast loading. The equivalent stress of
the tank was measured and compared with the yielding stress of the tank wall for S450
steel, with a yield stress of 440 MPa. The time history of Von Mises stresses on the tank
wall throughout the analysis period of 0.25 s was measured at six elements, namely E1–
E6, at the tank surface facing the blast loading. The locations of the measuring elements
are shown in Figure 18, while the coordinates of the elements along the Z-axis are pre-
sented in Table 6.
Figure 18. Location of the elements measured for equivalent stress.
Figure 17. Resultant displacement versus time under blast intensity of 380 kg TNT equivalent mass25 m away, (a) 100% fill and (b) 0% fill.
4.5. Tank Equivalent Stress under Blast Impacts
This section discusses equivalent stress under blast loading. The equivalent stressof the tank was measured and compared with the yielding stress of the tank wall forS450 steel, with a yield stress of 440 MPa. The time history of Von Mises stresses on thetank wall throughout the analysis period of 0.25 s was measured at six elements, namelyE1–E6, at the tank surface facing the blast loading. The locations of the measuring elementsare shown in Figure 18, while the coordinates of the elements along the Z-axis are presentedin Table 6.
Materials 2021, 14, x FOR PEER REVIEW 18 of 25
Figure 17. Resultant displacement versus time under blast intensity of 380 kg TNT equivalent
mass 25 m away, (a) 100% fill and (b) 0% fill.
4.5. Tank Equivalent Stress under Blast Impacts
This section discusses equivalent stress under blast loading. The equivalent stress of
the tank was measured and compared with the yielding stress of the tank wall for S450
steel, with a yield stress of 440 MPa. The time history of Von Mises stresses on the tank
wall throughout the analysis period of 0.25 s was measured at six elements, namely E1–
E6, at the tank surface facing the blast loading. The locations of the measuring elements
are shown in Figure 18, while the coordinates of the elements along the Z-axis are pre-
sented in Table 6.
Figure 18. Location of the elements measured for equivalent stress.
Figure 18. Location of the elements measured for equivalent stress.
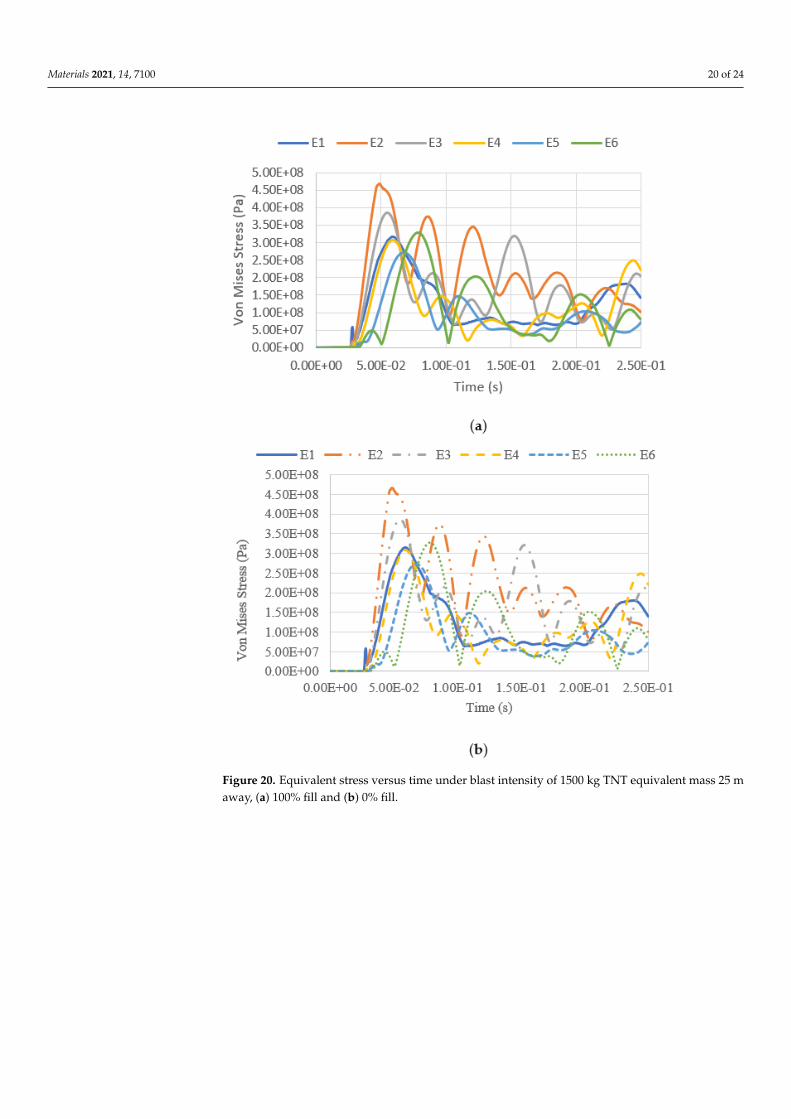
The variation of equivalent stress versus time for a blast intensity of 1500 kg TNTequivalent mass at standoff distances of 12.5 m and 25 m for different fill levels are presentedin Figures 19–22. The graphs indicate that the highest Von Mises stresses for the differentloading cases are always observed at element E2, as it is closer to the charge of the blast.The first surface that will be loaded from the blast wave is the building’s front façade. Thisobservation is in good agreement with the findings report by [28], as the first surface thatwill be loaded from the blast wave is the front façade of the structure. Therefore, this region

Materials 2021, 14, 7100 19 of 24
should be given extra attention. It was found that the fill level has minimal influence onthe Von Mises stress as well, as the pressure from the low-density hydrocarbon productcontained is insignificant compared to the blast pressure. The maximum equivalent stressof each pressure was compared with the yield strength of S450, which is 440 MPa. Thegraphs show that the tank was unyielding under the lower blast intensity of 380 kg TNTequivalent mass at the standoff distances of 12.5 m and 25 m. However, when the tank wassubjected to a blast with an intensity of 1500 kg TNT equivalent mass, the Von Mises stressexceeded the yield stress of the material. The summary of the maximum equivalent stressof the storage tank under various blast loadings is shown in Table 7.
Materials 2021, 14, x FOR PEER REVIEW 20 of 25
Figure 19. Equivalent stress versus time under blast intensity of 1500 kg TNT equivalent mass 12.5
m away, (a) 100% fill and (b) 0% fill.
Figure 19. Equivalent stress versus time under blast intensity of 1500 kg TNT equivalent mass 12.5 maway, (a) 100% fill and (b) 0% fill.
Materials 2021, 14, 7100 20 of 24Materials 2021, 14, x FOR PEER REVIEW 21 of 25
Figure 20. Equivalent stress versus time under blast intensity of 1500 kg TNT equivalent mass 25
m away, (a) 100% fill and (b) 0% fill.
Figure 20. Equivalent stress versus time under blast intensity of 1500 kg TNT equivalent mass 25 maway, (a) 100% fill and (b) 0% fill.

Materials 2021, 14, 7100 21 of 24Materials 2021, 14, x FOR PEER REVIEW 22 of 25
Figure 21. Equivalent stress versus time under blast intensity of 380 kg TNT equivalent mass 12.5
m away, (a) 100% fill and (b) 0% fill.
Figure 21. Equivalent stress versus time under blast intensity of 380 kg TNT equivalent mass 12.5 maway, (a) 100% fill and (b) 0% fill.

Materials 2021, 14, 7100 22 of 24Materials 2021, 14, x FOR PEER REVIEW 23 of 25
Figure 22. Equivalent stress versus time under blast intensity of 380 kg TNT equivalent mass
25 m away, (a) 100% fill and (b) 0% fill.
Table 7. Table summary of maximum equivalent stress of the storage tank under blast loadings.
Blast Intensity
of TNT Equiva-
lent (kg)
Standoff
Distance
(m)
Fill
Level
(%)
Maximum
Equivalent
Stress (MPa)
Location of
Maximum
Equivalent
Stress
Time (s)
1500 12.5 100 516.57 E2 0.0189
1500 12.5 0 516.56 E2 0.0189
1500 25 100 467.27 E2 0.0484
1500 25 0 467.15 E2 0.0484
380 12.5 100 387.21 E2 0.0354
380 12.5 0 386.16 E2 0.0354
380 25 100 188.47 E2 0.0639
380 25 0 188.49 E2 0.0639
5. Conclusions
This paper explored the behaviour of thin-walled cylindrical shell storage tanks sub-
jected to blast loading using finite element methods. First, to better understand the me-
chanical behaviour of a thin-walled cylindrical tank, a parametric study was carried out
on the storage tanks considering different material grades as well as various wall thick-
ness and fill levels. The thicknesses of the shell elements were defined as 10, 20, 30, and
40mm, respectively, based on the specifications in API 650. The inner face of the wall was
subjected to hydrostatic pressure of 25, 50, 75, and 100% fill level based on a fluid density
of 800 kg/m3 and kinetic viscosity of 1.9 mm²/s. Next, the parametric study was validated
Figure 22. Equivalent stress versus time under blast intensity of 380 kg TNT equivalent mass 25 maway, (a) 100% fill and (b) 0% fill.
Table 6. Z-coordinates of the elements.
Elements Z-Coordinate (m)
E1 0–1.875
E2 3.75–5.625
E3 7.5–9.375
E4 11.25–13.125
E5 15–16.875
E6 18.75–20.625
Table 7. Table summary of maximum equivalent stress of the storage tank under blast loadings.
Blast Intensity ofTNT Equivalent (kg)
StandoffDistance
(m)
FillLevel(%)
MaximumEquivalent Stress
(MPa)
Location ofMaximum
Equivalent StressTime (s)
1500 12.5 100 516.57 E2 0.0189
1500 12.5 0 516.56 E2 0.0189
1500 25 100 467.27 E2 0.0484
1500 25 0 467.15 E2 0.0484
380 12.5 100 387.21 E2 0.0354
380 12.5 0 386.16 E2 0.0354
380 25 100 188.47 E2 0.0639
380 25 0 188.49 E2 0.0639

Materials 2021, 14, 7100 23 of 24
5. Conclusions
This paper explored the behaviour of thin-walled cylindrical shell storage tankssubjected to blast loading using finite element methods. First, to better understand themechanical behaviour of a thin-walled cylindrical tank, a parametric study was carriedout on the storage tanks considering different material grades as well as various wallthickness and fill levels. The thicknesses of the shell elements were defined as 10, 20, 30,and 40 mm, respectively, based on the specifications in API 650. The inner face of the wallwas subjected to hydrostatic pressure of 25, 50, 75, and 100% fill level based on a fluiddensity of 800 kg/m3 and kinetic viscosity of 1.9 mm2/s. Next, the parametric study wasvalidated using simplified empirical equations of the thin-walled cylindrical storage tank.The numerical simulation was conducted using LS-DYNA, where the structural behavioursof the storage tank, such as blast pressure, deformed shape, resultant displacement, andequivalent stress, were obtained. The outcomes of the results show that the deformation ofthe tank increases with higher blast intensity, and it reduces with a greater blast standoffdistance. Generally, the maximum displacement of the tank occurs at the top of the tank.The results show that Von Mises stress on the tank increased at higher blast intensity andlower standoff distance. The study also suggests that the thin-walled storage tank willyield under the blast condition of a 1500-kg TNT equivalent mass explosion at standoffdistances of 12.5 m and 25 m. The results also show that the fill level has comparativelyminimal influence on the displacement and the equivalent stresses of the tank, as thefluid contained has a comparatively low density. The material grade of S450 with a wallthickness of 20 mm was found to be the most efficient under the blast loads effects.
Author Contributions: Conceptualization and methodology, A.M.A.-Y.; validation, L.J.H.; formalanalysis, A.M.A.-Y.; investigation, M.S.L. and A.M.A.-Y.; resources and supervision, M.S.L.; originaldraft preparation, A.M.A.-Y., S.M.K.S. and R.M.C.R.; writing—review and editing, A.M.A.-Y., S.M.K.S.and R.M.C.R. All authors have read and agreed to the published version of the manuscript.
Funding: This research was funded by Yayasan UTP, grant number 015LC0-313.
Institutional Review Board Statement: Not applicable.
Informed Consent Statement: Not applicable.
Data Availability Statement: Not applicable.
Acknowledgments: The authors would like to acknowledge the continued support by UniversitiTeknologi PETRONAS (UTP).
Conflicts of Interest: The authors declare no conflict of interest, and the funders had no role inthe design of the study; in the collection, analyses, or interpretation of data; in the writing of themanuscript; or in the decision to publish the results.
References1. Guo, X.; Ji, J.; Khan, F.; Ding, L.; Yang, Y. WITHDRAWN: Fuzzy Bayesian network based on an improved similarity aggregation
method for risk assessment of storage tank accident. Process. Saf. Environ. Prot. 2020, 144, 242–252. [CrossRef]2. Zingoni, A. Liquid-containment shells of revolution: A review of recent studies on strength, stability and dynamics. Thin-Walled
Struct. 2015, 87, 102–114. [CrossRef]3. Jiang, Y.; Zhang, B.; Wei, J.; Wang, W. Study on the dynamic response of polyurea coated steel tank subjected to blast loadings.
J. Loss Prev. Process. Ind. 2020, 67, 104234. [CrossRef]4. Hibbeler, R.C.; Sekar, V. Mechanics of Materials, 10th ed.; Pearson Education: Upper Saddle River, NJ, USA, 2013; Chapter 8.5. Chen, A.; Louca, L.A.; Elghazouli, A.Y. Behaviour of cylindrical steel drums under blast loading conditions. Int. J. Impact Eng.
2016, 88, 39–53. [CrossRef]6. Lu, S.; Wang, W.; Chen, W.; Ma, J.; Shi, Y.; Xu, C. Behaviors of Thin-Walled Cylindrical Shell Storage Tank under Blast Impacts.
Shock. Vib. 2019, 2019, 1–21. [CrossRef]7. Clubley, S.K. Non-linear long duration blast loading of cylindrical shell structures. Eng. Struct. 2014, 59, 113–126. [CrossRef]8. Taveau, J. Explosion of fixed roof atmospheric storage tanks, part 1: Background and review of case histories. Process. Saf. Prog.
2011, 30, 381–392. [CrossRef]9. Chang, J.I.; Lin, C.-C. A study of storage tank accidents. J. Loss Prev. Process. Ind. 2006, 19, 51–59. [CrossRef]10. Zhou, Y.; Zhao, X.; Zhao, J.; Chen, D. Research on fire and explosion accidents of oil depots. Chem. Eng. Trans. 2016, 51, 163–168.

Materials 2021, 14, 7100 24 of 24
11. Mittal, V.; Chakraborty, T.; Matsagar, V. Dynamic analysis of liquid storage tank under blast using coupled Euler–Lagrangeformulation. Thin-Walled Struct. 2014, 84, 91–111. [CrossRef]
12. Duong, D.; Hanus, J.; Bouazaoui, L.; Pennetier, O.; Moriceau, J.; Prod’Homme, G.; Reimeringer, M. Response of a tank under blastloading—part I: Experimental characterisation of blast loading arising from a gas explosion. Eur. J. Environ. Civ. Eng. 2012, 16,1023–1041. [CrossRef]
13. Duong, D.; Hanus, J.; Bouazaoui, L.; Régal, X.; Prod’Homme, G.; Noret, E.; Yalamas, T.; Reimeringer, M.; Bailly, P.; Pennetier, O.Response of a tank under blast loading—part II: Experimental structural response and simplified analytical approach. Eur. J.Environ. Civ. Eng. 2012, 16, 1042–1057. [CrossRef]
14. Zhang, B.; Li, H.; Wang, W. Numerical study of dynamic response and failure analysis of spherical storage tanks under externalblast loading. J. Loss Prev. Process. Ind. 2015, 34, 209–217. [CrossRef]
15. Mougeotte, C.; Carlucci, P.; Recchia, S.; Ji, H. Novel Approach to Conducting Blast Load Analyses using Abaqus/Explicit-CEL. InProceedings of the 2010 Simulia Customer Conference, Providence, RI, USA, 25–27 May 2010.
16. Carlucci, P.; Mougeotte, C.; Huidi, J. Validation of Abaqus Explicit–CEL for Classes of Problems of Interest to the US Army. InProceedings of the 2010 Simulia Customer Conference, Providence, RI, USA, 25–27 May 2010.
17. Hu, K.; Chen, G.; Zhou, C.; Reniers, G.; Qi, S.; Zhou, Z. Dynamic response of a large vertical tank impacted by blast fragmentsfrom chemical equipment. Saf. Sci. 2020, 130, 104863. [CrossRef]
18. Lai, E.; Zhao, J.; Li, X.; Hu, K.; Chen, G. Dynamic responses and damage of storage tanks under the coupling effect of blast waveand fragment impact. J. Loss Prev. Process. Ind. 2021, 73, 104617. [CrossRef]
19. Kus, J.; Wałach, S. Analysis of steel tank shell deformation and its impact on further utilisation. Int. J. Press. Vessel. Pip. 2021,193, 104453. [CrossRef]
20. Ha, N.S.; Lu, G. Thin-walled corrugated structures: A review of crashworthiness designs and energy absorption characteristics.Thin-Walled Struct. 2020, 157, 106995. [CrossRef]
21. Zhang, Q.; Zhou, G.; Hu, Y.; Wang, S.; Sun, B.; Yin, W.; Guo, F. Risk evaluation and analysis of a gas tank explosion based on avapor cloud explosion model: A case study. Eng. Fail. Anal. 2019, 101, 22–35. [CrossRef]
22. American Petroleum Instutute. Welded Tanks for Oil Storage; API Publishing Services: Washington, DC, USA, 2013; p. 195.23. Banerjee, B.; Chen, Z.; Das, R.; Kathirgamanathan, A. Comparison of ANSYS Elements SHELL181 and SOLSH190; Indusrtial
Research Limited: Lower Hutt, New Zeland, 2011.24. Tabatabaei, Z.S.; Volz, J.S. A comparison between three different blast methods in LS-DYNA: LBE, MM-ALE, Coupling of LBE
and MM-ALE. In Proceedings of the 12th International LS-DYNA® Users Conference, Darborn, MI, USA, 3–5 June 2012.25. Kalawadwala, S.; Rigby, S. Setting up Load Blast Enhanced in LS-DYNA; Department of Civil and Structural Engineering, University
of Sheffield: Sheffield, UK, 2016.26. Dewey, J.M. The Friedlander Equations. In Blast Effects. Shock Wave and High Pressure Phenomena, 1st ed.; Springer: Cham,
Switzerland, 2018; pp. 37–55.27. Shirbhate, P.A.; Goel, M.D. A Critical Review of Blast Wave Parameters and Approaches for Blast Load Mitigation. Arch. Comput.
Methods Eng. 2021, 28, 1713–1730. [CrossRef]28. Karlos, V.; Solomos, G. Calculation of Blast Loads for Application to Structural Components; Publications Office of the European Union:
Luxembourg, 2013; ISBN 978-92-79-35158-7.29. Henrych, J.; Major, R. The dynamics of explosion and its use. Earthq. Eng. Struct. Dyn. 1979, 569. [CrossRef]30. Brode, H.L. Numerical Solutions of Spherical Blast Waves. J. Appl. Phys. 1955, 26, 766. [CrossRef]31. Baker, W.E. Explosions in Air; University of Texas Press: Texas, TX, USA, 1973; Volume 1, ISBN 10:0292720033.32. Gefken, P.R.; Kirkpatrick, S.W.; Holmes, B.S. Response of impulsively loaded cylindrical shells. Int. J. Impact Eng. 1988, 7, 213–227.
[CrossRef]