Single Technology Appraisal Pemigatinib for treating relapsed ...
Upload
khangminh22Category
view
1download
0
Version 1 1
CONFIDENTIAL UNTIL PUBLISHED
Evidence Review Group Report commissioned by the
NIHR HTA Programme on behalf of NICE
Ocrelizumab for treating relapsing multiple sclerosis
Produced by Southampton Health Technology Assessments Centre (SHTAC)
Authors Professor Joanne Lord (Health Economics)
Mr Olu Onyimadu, Research Fellow (Health Economics)
Ms Petra Harris, Research Fellow
Dr Jonathan Shepherd, Principal Research Fellow
Dr Geoff Frampton, Senior Research Fellow
Correspondence to Dr Geoff Frampton
Southampton Health Technology Assessments Centre
University of Southampton
First Floor, Epsilon House
Enterprise Road, Southampton Science Park
Southampton SO16 7NS
Date completed 6th February 2018
Copyright belongs to Southampton University (for specific exceptions see acknowledgements)
Copyright 2018 Queen's Printer and Controller of HMSO. All rights reserved.

Version 1 2
Acknowledgements
We thank the following for providing clinical advice and comments on the draft report: Professor
Olga Ciccarelli, Professor of Neurology, Department of Neuroinflammation, Institute of
Neurology, UCL, London; Dr Julian Furby, Consultant Neurologist, Wessex Neurological Centre,
University Hospital Southampton NHS Foundation Trust; Dr Christopher Halfpenny, Consultant
Neurologist, Wessex Neurological Centre, University Hospital Southampton NHS Foundation
Trust; Dr Joanna Kitley, Consultant Neurologist, Wessex Neurological Centre, University
Hospital Southampton NHS Foundation Trust. We also thank Karen Welch, Information
Scientist, SHTAC, for appraising the literature search strategies in the company’s submission
and Jo Picot, Senior Research Fellow, SHTAC, for acting as an internal editor for the ERG
report.
Copyright is retained by Roche for Tables 26, 27, 28, 35, 36, 37, 40, 44, 49, 51, 57, 67, 71, and
Figures 2, 3, 4, 5, 6, 24. Copyright is retained by NICE for Figure 1.
Declared competing interests of the authors and clinical advisors
None from the authors. Dr Furby received financial support from Teva UK (manufacturer of
glatiramer acetate) to attend the ECTRIMS 2017 conference (Paris). Dr Kitley received financial
support for scientific meetings and speaker honoraria from Biogen Idec (manufacturer of
daclizumab, dimethyl fumarate, interferon beta 1a, natalizumab, peginterferon beta 1a) and
financial support for scientific meetings from Merck (manufacturer of interferon beta 1a). Dr
Halfpenny received financial support from Biogen Idec to chair a meeting on daclizumab
(Southampton). Professor Ciccarelli received research funding from the MS Society of Great
Britain and Northern Ireland, National MS Society, Progressive MS Alliance, Biotechnology and
Biological Sciences Research Council (BBSRC), Engineering and Physical Sciences
Research Council (EPSRC), Wings for Life Spinal Cord Research, International Spinal
Research Trust, Wellcome Trust, National Institute for Health Research (NIHR) University
College London Hospitals (UCLH) Biomedical Research Centre (BRC), ECTRIMS, MAGNIMS,
MS International Federation, EU H2020, and Rosetrees Trust; she co-directs the MS trial Unit,
UCL Institute of Neurology, which is currently running trials funded by NIHR-HTA, Bioclinica and
GE Neuro, Biogen Inc (manufacturer of interferon beta 1a), and Novartis (manufacturer of
fingolimod and interferon beta 1b); she served as a consultant to Novartis, Roche (manufacturer
of ocrelizumab), Genzyme (manufacturer of alemtumumab and teriflunomide), and Teva UK
(manufacturer of glatiramer acetate).
Copyright 2018 Queen's Printer and Controller of HMSO. All rights reserved.

Version 1 3
Rider on responsibility for report
The views expressed in this report are those of the authors and not necessarily those of the
NIHR HTA Programme. Any errors are the responsibility of the authors.
This report should be referenced as follows:
Lord, J., Onyimadu, O., Harris, P., Shepherd, J., Frampton, G. Ocrelizumab for treating
relapsing multiple sclerosis: A Single Technology Appraisal. Southampton Health Technology
Assessments Centre (SHTAC), 2018.
Contributions of authors
Joanne Lord and Olu Onyimadu critically appraised the health economic review, critically
appraised the economic evaluation, and drafted the report; Petra Harris, Jonathan Shepherd
and Geoff Frampton critically appraised the clinical effectiveness review and drafted the report;
Geoff Frampton project managed the ERG assessment and is the project guarantor.
Word count:
62,300
Academic in confidence information is underlined and highlighted in yellow
Commercial in confidence information is underlined and highlighted in blue
Copyright 2018 Queen's Printer and Controller of HMSO. All rights reserved.

Version 1 4
TABLE OF CONTENTS
1 INTRODUCTION ...............................................................................................................24
2 BACKGROUND .................................................................................................................24
2.1 Critique of the company’s description of the underlying health problem .....................24
2.2 Critique of the company’s overview of current service provision ................................26
2.3 Critique of the company’s definition of the decision problem ......................................31
3 CLINICAL EFFECTIVENESS .............................................................................................37
3.1 Critique of the company’s approach to systematic review ..........................................37
3.2 Summary statement of the company’s approach .......................................................83
3.3 Summary of the submitted evidence ..........................................................................84
4 COST EFFECTIVENESS ................................................................................................. 111
4.1 Overview of the company’s economic evaluation ..................................................... 111
4.2 Company’s review of published economic evaluations ............................................ 111
4.3 Summary and critique of the company’s model ........................................................ 113
4.4 Cost effectiveness results ........................................................................................ 149
4.5 ERG additional analysis ........................................................................................... 155
5 Innovation ........................................................................................................................ 165
6 DISCUSSION .................................................................................................................. 166
6.1 Summary of clinical effectiveness issues ................................................................. 166
6.2 Summary of cost effectiveness issues ..................................................................... 167
7 REFERENCES ................................................................................................................ 170
8 APPENDICES .................................................................................................................. 178
LIST OF TABLES
Table 1 Company ITT base case (OCR PAS; list prices for comparators) .................................18
Table 2 Base case HA subgroup, deterministic: Adapted from CS Table 67 .............................19
Table 3 Base case RES subgroup, deterministic: Adapted from CS Table 71 ...........................19
Table 4 ERG base case, non-HA/RES (PAS ocrelizumab; list prices for comparators) .............22
Table 5 ERG HA subgroup (OCR PAS, list prices for comparators) ..........................................23
Table 6 ERG RES subgroup (OCR PAS, list prices for comparators) ........................................23
Table 7 Revised 2010 McDonald Criteria for diagnosis of MS ...................................................27
Table 8 ABN categories of DMTs based on efficacy6 ................................................................28
Table 9 Comparators included the NICE scope and the company’s decision problem ..............34
Table 10 Characteristics of the ocrelizumab RCTs ....................................................................45
Copyright 2018 Queen's Printer and Controller of HMSO. All rights reserved.

Version 1 5
Table 11 Baseline demographic and disease characteristics of included trials ..........................48
Table 12 Baseline characteristics of disease activity subgroups in the OPERA trials ................50
Table 13 Number (%) of missing observations (relative to ITT) for secondary and exploratory
outcomes in the OPERA trials ...................................................................................................57
Table 14 HA and RES subgroup analysis population definitions ...............................................58
Table 15 Number of treatments and trials included in MTC networks ........................................65
Table 16 ERG’s quality assessment of the CS review (CRD criteria) ........................................83
Table 17 Annualised relapse rate at 96 weeks ..........................................................................85
Table 18 Annualised relapse rate in disease activity subgroups at 96 weeks (pooled OPERA
trials analysis) ...........................................................................................................................87
Table 19 Proportion of patients with 12-week confirmed disability progression (CDP-12) at 96
weeks .......................................................................................................................................88
Table 20 Proportion of patients with 24-week confirmed disability progression (CDP-24) at 96
weeks .......................................................................................................................................88
Table 21 CDP-12 and CDP-24 in disease activity subgroups at 96 weeks (pooled OPERA trials
analysis)....................................................................................................................................90
Table 22 CDP-12 in treatment naïve/experienced subgroups at 96 weeks ................................91
Table 23 CDP-24 in treatment naïve/experienced subgroups at 96 weeks ................................91
Table 24 Proportion of patients with 12-week confirmed disability improvement (CDI-12) at 96
weeks .......................................................................................................................................92
Table 25 Proportion of patients with 24-week confirmed disability improvement (CDI-24) at 96
weeks .......................................................................................................................................92
Table 26 Proportion of patients with no evidence of disease activity (NEDA) by week 96 .........96
Table 27 All-cause discontinuation in the pooled OPERA trials .................................................97
Table 28 MTC analysis results for ITT populations ....................................................................99
Table 29 Summary of adverse events in the OPERA trials ..................................................... 103
Table 30 Adverse events reported in ≥ 5% of patients up to 96 weeks in the OPERA trials .... 104
Table 31 Summary of adverse events up to 48 weeks in the phase II trial .............................. 108
Table 32 Overall adverse event rates up to 96 weeks in the phase II trial ............................... 109
Table 33 NICE reference case requirements .......................................................................... 114
Table 34 Treatments included in company economic analysis ................................................ 118
Table 35 Baseline patient characteristics: adapted from CS Table 26 and model ................... 125
Table 36 CS Key differences between natural history datasets: CS Table 27 ......................... 126
Table 37 Disability transition matrix (British Columbia): CS Table 28 ...................................... 127
Copyright 2018 Queen's Printer and Controller of HMSO. All rights reserved.

Version 1 6
Table 38 Annual probability of conversion to SPMS (London Ontario): CS Table 31 ............... 127
Table 39 ARR by EDSS state and subgroup: CS Tables 35 and 36 ........................................ 129
Table 40 MS mortality multipliers by EDSS: CS Table 37 ....................................................... 129
Table 41 Treatment effects on relapse rates: relative risk vs. placebo ARR ............................ 130
Table 42 Treatment effects CDP at 12 and 24 weeks: HR vs placebo .................................... 132
Table 43 Discontinuation: OR vs ocrelizumab and annual probabilities: from CS Table 38 and
economic model ...................................................................................................................... 133
Table 44 Health state utility values used in model: CS Table 43 ............................................. 135
Table 45 Caregiver disutility by EDSS state ............................................................................ 136
Table 46 Summary of drug treatment costs (adapted from CS Table 49) ................................ 137
Table 47 Health state cost estimates ...................................................................................... 140
Table 48 Summary of annual health state costs by EDSS: Adapted from CS Table 51 ........... 141
Table 49 Adverse event rates (%) used in economic model .................................................... 142
Table 50 QALY loss and costs for included adverse events .................................................... 144
Table 51 Summary and critique of model assumptions ........................................................... 146
Table 52 Company ITT base case (OCR PAS; list prices for comparators) ............................. 149
Table 53 Company scenario analyses (ocrelizumab PAS, list prices for comparators) ............ 153
Table 54 Base case HA subgroup, deterministic: adapted from CS Table 67 .......................... 154
Table 55 Base case RES subgroup, deterministic: adapted from CS Table 71 ....................... 154
Table 56 Company base case ITT (PAS ocrelizumab; list prices for comparators) .................. 155
Table 57 ERG scenario analysis, company ITT base case (OCR PAS, list prices for
comparators) ........................................................................................................................... 158
Table 58 ERG scenario analysis, company HA subgroup analysis (OCR PAS; list prices for
comparators) ........................................................................................................................... 159
Table 59 ERG scenario analysis, company RES subgroup analysis (OCR PAS; list prices for
comparators) ........................................................................................................................... 159
Table 60: Assumptions and parameter changes in ERG base case analysis .......................... 160
Table 61 ERG base case, non-HA/RES (PAS ocrelizumab; list prices for comparators) ......... 161
Table 62 Scenario analyses, ERG base case non-HA/RES (ocrelizumab PAS, list prices for
comparators) ........................................................................................................................... 162
Table 63 ERG HA subgroup (OCR PAS, list prices for comparators) ...................................... 163
Table 64 Scenario analyses, ERG HA subgroup (OCR PAS, list prices for comparators) ....... 163
Table 65 ERG RES subgroup (OCR PAS, list prices for comparators) .................................... 164
Table 66 Scenario analyses, ERG RES subgroup (OCR PAS, list prices for comparators) ..... 164
Copyright 2018 Queen's Printer and Controller of HMSO. All rights reserved.

Version 1 7
LIST OF FIGURES
Figure 1 Current management of RRMS ...................................................................................30
Figure 2 Hierarchical order of testing effectiveness outcomes in the OPERA trials (from CS
Figure 3) ...................................................................................................................................55
Figure 3 Example MTC network diagram for ARR ITT (CS Figure 7) ........................................68
Figure 4 Disposition of OPERA participants by subgroup ........................................................ 116
Figure 5 Illustration of model structure (copied from CS Figure 24) ......................................... 120
Figure 6 Consistency of EDSS-dependent utility values: CS Figure 25 ................................... 135
Figure 7 Tornado diagram: company ITT base case ocrelziumab vs alemtuzumab (PAS price for
ocrelizumab) ........................................................................................................................... 156
Figure 8 Tornado diagram: company ITT base case ocrelizumab vs IFNβ-1a (Rebif) ............. 156
Copyright 2018 Queen's Printer and Controller of HMSO. All rights reserved.

Version 1 8
ABBREVIATIONS
ABN Association of British Neurologists
AE Adverse event(s)
AIC Akaike information criterion
ALEM alemtuzumab
ALT Alanine aminotransferase
ARR Annualised relapse rate
AST Aspartate aminotransferase
BCMS British Columbia Multiple Sclerosis
BNF British National Formulary
BSC Best supportive care
CADTH Canadian Agency for Drugs and Technologies in Health
CDP Confirmed disability progression
CDP-12 12-week confirmed disability progression
CDP-24 24-week confirmed disability progression
CDI Confirmed disability improvement
CDI-12 12-week confirmed disability improvement
CDI-24 24-week confirmed disability improvement
CDSR Cochrane Database of Systematic Reviews
CEAC Cost-effectiveness acceptability curve
CHMP Committee for Medicinal Products for Human Use
CI Confidence interval
CIS Clinically isolated syndrome
CLAD Cladribine
CNS Central nervous system
CrI Credible interval
CS Company submission
CSF Cerebrospinal fluid
CSR Clinical study report
DAC Daclizumab
DIC Deviance information criterion
DMF Dimethyl fumarate
DMT Disease-modifying therapy(s)
DSU Decision Support Unit
EDSS Expanded Disability Status Scale
EMA European Medicines Agency
EPAR European Public Assessment Report
EQ-5D EuroQol 5-dimensions quality of life questionnaire
ERG Evidence review group
FDA Food and Drug Administration
FINGO Fingolimod
GA Glatiramer acetate
HA Highly active
HBV Hepatitis B virus
HCC Half cycle correction
HR Hazard ratio
HRQoL Health-related quality of life
ICER Incremental cost-effectiveness ratio
IFNβ-1a Interferon β-1a
Copyright 2018 Queen's Printer and Controller of HMSO. All rights reserved.

Version 1 9
IFNβ-1b Interferon β-1b
IM Intramuscular
ITT Intention to treat
IV Intravenous
JC virus John Cunningham virus
K-M Kaplan-Meier
LY Life year(s)
LYG Life year(s) gained
MRI Magnetic resonance imaging
MS Multiple sclerosis
MTC Mixed treatment comparison
NAT Natalizumab
NEDA No evidence of disease activity
NHS National Health Service
NICE National Institute for Health and Care Excellence
NMA Network meta-analysis
OCR Ocrelizumab
ONS Office for National Statistics
OR Odds ratio
PAS Patient access scheme
PEGβ -1a Pegylated interferon β-1a
PH Proportional hazards
PML Progressive multifocal leukoencephalopathy
PPMS Primary progressive multiple sclerosis
PSA Probabilistic sensitivity analysis
PSS Personal social services
PSSRU Personal Social Services Research Unit
QALY/QALYs Quality-adjusted life year/years
RCT/RCTs Randomised controlled trial/trials
RES Rapidly-evolving severe (multiple sclerosis)
RRMS Relapsing-remitting multiple sclerosis
SAE Serious adverse event(s)
RSS UK MS Risk Sharing Scheme (RSS)
SC Subcutaneous
SD Standard deviation
SE Standard error
SF-36 36-item Short Form Survey
SLR Systematic literature review
SmPC Summary of Product Characteristics
SPMS Secondary progressive multiple sclerosis
STA Single technology appraisal
TERI Teriflunomide
Copyright 2018 Queen's Printer and Controller of HMSO. All rights reserved.

Version 1 10
SUMMARY Scope of the company submission The company submission (CS) provides evidence on the clinical effectiveness and cost
effectiveness of ocrelizumab, 600 mg intravenous infusion, administered once every 6 months,
compared to other disease-modifying therapies (DMTs) for treating patients with relapsing forms
of multiple sclerosis (MS).
The scope of the CS is generally consistent with the NICE scope for this technology appraisal,
with some exceptions:
The NICE scope specifies the population is people with relapsing forms of MS. This
would include patients who have relapsing-remitting MS (RRMS) and those sho have
secondary-progressive MS (SPMS) which is accompanied by relapses. The company’s
submission focuses on patints with RRMS since this reflects the population in the pivotal
clinical trials (these included primarily patients with RRMS and a small, unquantified,
number of patients with SPMS).
The company’s decision problem includes all the comparators specified in the NICE
scope, but there are some differences in which patient subgroups these comparators are
applied to (discussed in more detail in this report).
Several outcomes specified in the NICE scope are not reported in the CS: severity of
relapse (this was not measured in the ocrelizumab trials and so its exclusion from the
company’s decision problem is appropriate); EDSS scores, EQ-5D scores and fatigue
scores (these have been obtained and are summarised by the ERG).
Summary of submitted clinical effectiveness evidence
Identification of evidence
The company conducted a systematic literature review (SLR) for clinical effectiveness evidence
of DMTs in relapsing MS. The review was restricted to randomised controlled trials (RCTs) and
included 46 trials. The ERG checked and updated the company’s searches and did not find any
further RCTs that should have been included.
Copyright 2018 Queen's Printer and Controller of HMSO. All rights reserved.

Version 1 11
The company did not specifically search for studies on ocrelizumab safety (which might have
required non-randomised studies). However, it does not appear that the company has missed
any key safety evidence in their submission.
Three of the 46 trials identified in the SLR provided direct comparisons of ocrelizumab against
interferon β-1a. All 46 trials were considered by the company for inclusion in mixed treatment
comparisons (MTCs) to enable effects of ocrelizumab to be estimated relative to those of the
other DMTs in the NICE scope (details of the MTCs methods and results are summarised
below).
Direct comparison of ocrelizumab versus interferon β-1a: Methods
Of the 46 RCTs identified, 3 included direct head-to-head comparisons of ocrelizumab against
interferon β-1a in patients with RRMS aged 18-55 years:
Phase III OPERA I and OPERA II trials: Two identical trials in which ocrelizumab was
compared against interferon β-1a (Rebif) over 96 weeks, with a sample size of 410 to
418 patients randomised per arm;
Phase II trial: A 24-week randomised comparison of ocrelizumab against interferon β-1a
(Avonex) and placebo (this also included a futher hgh-dose ocrelizumab arm which is
outside the scope of this appraisal and not considered by the company or ERG).
The company’s direct comparison of the clinical effectiveness of ocrelizumab versus other
DMTs is based entirely on the two OPERA trials, which is appropriate as these form the key
evidence base. The phase II trial was used only as a source of information on advese events.
Limited supporting data on clinical effectiveness and safety from an open-label extension study
to the OPERA trials is also provided by the company.
The OPERA trials were double-blind double-dummy RCTs that were judged by the ERG overall
to be at low risk of bias. Outcomes were assessed over a 96-week randomised treatment
comparison period. The primary outcome was the annualised relapse rate (ARR), with key
secondary outcomes including the proportion of patients experiencing confirmed disability
progression, confirmed disability improvement, and numbers of lesions on MRI outcomes (see
further details below).
Copyright 2018 Queen's Printer and Controller of HMSO. All rights reserved.

Version 1 12
Direct comparison of ocrelizumab versus interferon β-1a: Results
In both OPERA trials, ocrelizumab reduced the annualised relapse rate (ARR) over 96 weeks in
the intention-to-treat (ITT) population (the primary outcome) by 46% compared to interferon β-
1a (the rate ratio in the pooled analysis across both trials was 0.54; 95% CI 0.44 to 0.66). The
effectiveness of ocrelizumab was also demonstrated in subgroup analyses on patients with
highly active (HA) and rapidly evolving severe (RES) forms of RRMS (pre-specified and post-
hoc respectively): rate ratios for the ARR in these subgroups (0.32 and 0.38 respectively) were
lower than those seen in the ITT population. Post-hoc subgroup analyses according to patients’
treatment history indicated that ocrelizumab effectively reduced the ARR compared to interferon
β-1a both for treatment-naïve and for treatment-experienced patients (the company intends that
ocrelizumab would be used either as a first-line or second-line therapy).
Secondary outcomes in the OPERA trials assessed at 96 weeks were:
proportion of patients with disability progression (defined according to changes in
Expanded Disability Status Scale [EDSS] scores), confirmed over 12 weeks (CDP-12)
and confirmed over 24 weeks (CDP-24);
proportion with disability improvement confirmed over 12 weeks (CDI-12);
proportion with no evidence of disease activity (NEDA) – a compsite outcome based on
the absence of relapses, disability progression and lesions on MRI imaging;
magnetic resonance imaging (MRI outcomes): numbers of enhancing lesions on T1 MRI
scans (indicating sites of active CNS inflammation); numbers of new or enlarged
hyperintense lesions on T2 MRI scans (indicating sites of active and previous
inflammation); numbers of hypointense lesions on T1 MRI scans (indicating areas of
chronic irreversible CNS damage); changes in brain volume (indicating extensive
structural damage; measured from 24 to 96 weeks to exclude transient initial effects of
therapy);
SF-36 Physical Component Summary (PCS) scores;
Multiple Sclerosis Functional Composite (MSFC) scores (a patient-reported outcome
measure that captures upper limb function, ambulatory fnction and cognitive
impairment).
The secondary outcomes were tested in a pre-specified fixed hierarchical sequence to control
the type I error rate. Following this process, the CDP-12, CDP-24, CDI-12, and MRI lesion
outcomes demonstrated statistically significant effects favouring ocrelizumab over interferon β-
Copyright 2018 Queen's Printer and Controller of HMSO. All rights reserved.

Version 1 13
1a (in both OPERA trials and/or in pooled analyses), whilst in accordance with the protocol the
remaining outcomes (NEDA, MSFC score, SF-36 PCS score, and change in brain volume) had
to be interpreted as providing descriptive information only.
In the ITT population, ocrelizumab reduced the risk of CDP-12 by 40% compared to interferon
β-1a (hazard ratio [HR] 0.60; 95% CI 0.45 to 0.81) and also reduced the risk of CDP-24 by 40%
(HR 0.60; 95% CI 0.43 to 0.84). Ocrelizumab also reduced the risk of CDP-12 and CDP 24 in
the HA and RES subgroups of patients but the effect was statistically significant only for CDP-12
assessed in the HA subgroup (HR 0.47; 95% CI 0.23 to 0.95). Post-hoc subgroup analyses
according to patients’ treatment history indicated that ocrelizumab reduced the risk of CDP-12
compared to interferon β-1a both for treatment-naïve patients (HR 0.60; 95% CI 0.42 to 0.85)
and for treatment-experienced patients (HR 0.61; 95% CI 0.35 to 1.06). However, the reduction
in risk of CDP-24 was statistically significant only for the treatment-naïve subgroup (HR 0.57;
95% CI 0.38 to 0.85).
For disability improvement, the proportion of patients with CDI-12 was assessed only in a
subgroup of patients (pooled across both OPERA trials) who had a baseline EDSS score ≥2.0
(the company does not provide a rationale for this subgroup). The risk of CDI was significantly
increased by ocrelizumab compared to interferon β-1a (risk ratio 1.33; 95% CI 1.05 to 1.68).
All three MRI lesion outcomes were statistically significantly improved by ocrelizumab compared
to interferon β-1a. The rate ratios (95% CI) were 0.058 (0.032 to 0.104) for enhancing T1
lesions; 0.229 (0.174 to 0.300) for new and/or enlarged hyperintense T2 lesions; and 0.428
(0.328 to 0.557) for hypointense T1 lesions (all differences p<0.0001).
Further exploratory outcomes assessed in the OPERA trials which are relevant to the NICE
scope but are not reported in the CS include EQ-5D scores and patient-reported fatigue scores.
These are provided briefly in the current report as contextual information.
Direct comparison of ocrelizumab versus interferon β-1a: limitations
The secondary MRI outcomes, NEDA, MSFC score and SF-36 PCS score outcomes have more
data missing from the interferon β-1a arm than from the ocrelizumab arm in both OPERA trials.
The CDI-12 and NEDA outcomes were analysed in a subgroup (pooled across the trials) who
had an EDSS score ≥2.0 at baseline but a rationale for this is not provided. However, these are
Copyright 2018 Queen's Printer and Controller of HMSO. All rights reserved.

Version 1 14
not critical outcomes for the company’s economic analysis. The OPERA trials included patients
aged 18 to 55 years, but clinical experts advising the ERG suggested that some patients older
than this (up to age 65) would likely receive strong DMTs including ocrelizumab.
MTC analyses: methods
The company conducted MTC analyses on four outcomes which inform the company’s
economic analysis: ARR, CDP-12, CDP-24, and all-cause discontinuation. MTCs were
performend on the ITT population and, for the ARR, CDP-12 and CDP-24 outcomes, also on the
HA and RES disease activity subgroups. Sensitivity analyses investigated the
inclusion/exclusion of several comparators which the company considered not to be relevant to
the NICE scope (referred to as ‘restricted networks’) and a meta-regression was conducted to
investigate whether MTC outcomes were influenced by variation in the duration of the trials. A
further sensitivity analysis to test inclusion/exclusion of a specific trial was also conducted. In
total, these analyses resulted in the company conducting 23 MTC analyses.
As noted above, the company’s systematic review of clinical effectiveness evidence included 46
trials (the two OPERA trials and the ocrelizumab phase II trial, plus 43 RCTs on comparators).
Of these, the company excluded 13 trials from MTC analyses, mainly because they had a short
duration of randomised treatment comparison (<48 weeks), and/or ineligible dosing regimens.
The two OPERA RCTs were included in MTC analyses but the ocrelizumab phase II trial, due to
its short duration (randomised phase 24 weeks) was excluded. The ERG agrees broadly with
the company’s study selection process for the MTC analyses, and that it was appropriate to
exclude the ocrelizumab phase II trial.
The statistical approach employed for the MTC analyses was a standard Bayesian analysis
based on random-effects models, consistent with NICE guidance. Sensitivity analyses using
fixed-effects models and alternative prior distributions confirmed appropriateness of the
approach. Assumptions of similarity, heterogeneity and consistency were tested in the MTCs
and although no concerns were raised regarding heterogeneity and consistency, the ERG is
uncertain whether the similarity assumption is supported (see MTC analyses: limitations below).
Copyright 2018 Queen's Printer and Controller of HMSO. All rights reserved.

Version 1 15
MTC analyses: results:
In total, 33 RCTs informed the company’s MTC analyses, ranging from 21 to 30 RCTs for the
ITT analyses and 4 to 9 RCTs for the HA and RES subgroup analyses. The number of DMTs
included in each analysis ranged from 15 to 17 for the ITT analyses and 5 to 10 for the HA and
RES subgroup analyses.
In ITT analyses ocrelizumab was compared against 16 DMTs and against placebo (these
included several different types of interferon β and some DMTs that are not in the NICE scope).
In these 17 comparisons, ocrelizumab **************************************compared to 11 DMTs
and placebo; *****************************************compared to 9 DMTs and placebo;
*************************************************************************************************************
***************** compared to 2 DMTs (but not placebo). Ocrelizumab was most effective at
reducing ARR, CDP-12 and CDP-24 when compared against
*************************************************************************************************************
*************************************************************************************************************
****************.
Summary of submitted cost effectiveness evidence The CS includes:
A review of published cost-effectiveness studies that presented economic data in the
treatment of relapsing multiple sclerosis
An economic evaluation undertaken for the NICE STA process, comparing ocrelizumab
with the following comparators in patients with RRMS: IFNβ-1a (Avonex, Rebif), IFNβ-
1b, PEGβ-1a, glatiramer acetate, teriflunomide, dimethyl fumarate, fingolimod,
alemtuzumab, natalizumab and daclizumab.
The company conducted a systematic search to identify economic evaluations of DMTs for
multiple sclerosis. This broad review was conducted to inform economic modelling and HTA
across multiple countries. It identified one relevant analysis conducted by the Institute for
Clinical and Economic Review, which modelled the cost-effectiveness of DMTs for MS including
ocrelizumab.
Copyright 2018 Queen's Printer and Controller of HMSO. All rights reserved.

Version 1 16
The company developed an economic model building on assumptions and data sources from
previous submissions, which are in line with the established model structure and natural history
of RRMS. This model is a cohort health state transition model of a Markov type. It uses a one-
year cycle, updating the distribution of the cohort between health states, costs and outcomes
annually over a 50-year time horizon, taking the cohort from an initial age of 37 years up to 87
years. The model comprises 31 health states, including death. The health states are defined
based on disease type (RRMS/SPMS), treatment status (DMT or best supportive care) and
level of disability (EDSS 0 to 9).
Each year, members of the cohort may make one of the following transitions:
• Disability progression: The base case model uses transition probabilities between
EDSS states estimated from natural history data. Due to the progressive nature of
MS, disability tends to increase over time, although it can sometimes improve: thus
the base case model allows transitions to higher or lower EDSS states. EDSS can
change by more than one level in a year, but large jumps are unlikely. The same
probabilities are assumed for transitions between EDSS states within SPMS as
within RRMS. A different set of probabilities is used for the RES and HA subgroups,
reflecting the more rapid progression of disability in these groups. Treatment
modifies the probabilities of EDSS progression in accordance with CDP effects from
the mixed treatment comparison (ITT, RES and HA groups). In their base case, the
company uses CDP-12 as the measure of progression, but CDP-24 is used in
sensitivity analysis. By assumption, treatment does not affect rates of disability
regression.
• Treatment discontinuation: Patients on DMT may stop treatment for various reasons,
including intolerance and inadequate response. The model assumes a constant
annual probability of withdrawal for each drug in each subgroup (ITT, HA and RES),
estimated by MTC of all-cause discontinuation. In addition, treatment is assumed to
stop when patients progress beyond EDSS 6 or after conversion to SPMS. These
stopping rules are based on NHS England policy and ABN guidelines.(2, 58) After
discontinuation, patients are assumed to receive only BSC, with no lasting effects of
DMT.
• Conversion to SPMS: Each year, there is a chance that patients with RRMS may
convert to SPMS, estimated from natural history data. The probability of conversion
is higher for patients with worse disability (higher EDSS). The conversion
Copyright 2018 Queen's Printer and Controller of HMSO. All rights reserved.

Version 1 17
probabilities by EDSS state are assumed constant over time and do not differ for the
HA and RES subgroups. Treatment is assumed to modify the probability of
conversion to SPMS by 50% of the effect on disability progression. By assumption,
conversion to SPMS is accompanied by a one-point increase in EDSS and cessation
of any DMT. SPMS is defined as a chronic state, so transition back to RRMS is not
allowed.
• Mortality: Death can occur from any health state. For patients without disability
(EDSS 0), mortality rates are the same as in the general population (by age and
sex), but increase with EDSS. The relative risks of mortality by EDSS level are the
same for RRMS (ITT, HA and RES) and SPMS. Treatment does not have a direct
effect on mortality, although there is an indirect effect through delay in disability
progression.
In addition to state transitions, the model includes two other important outcomes:
• Relapse rates: Each health state is associated with a mean number of relapses per
year, the ARR, estimated from natural history data. ARR tends to decrease with time
since diagnosis and hence with increasing EDSS. The ARR is higher for people with
more active forms of RRMS, including RES and HA, and lower in SPMS. Treatment
modifies the relapse rate, reducing the mean ARR at each level of EDSS. Estimates
of the relative reductions in ARR for each DMT and subgroup come from the MTC.
• Adverse events: The types and incidences of AEs vary between DMT drugs. The
model incorporates AEs with an occurrence of 5% or more in either arm of the
pooled OPERA I and II trial data. This includes infusion-related reactions and
injection site pain, a range of infections, musculoskeletal symptoms, depression,
fatigue, headache and insomnia. In addition, PML was included because of its high
cost and patient impact. Each of the included AEs is associated with an annual
incidence for each DMT, which is assumed constant over time. Estimates of AE
rates come from the pooled analysis of the OPERA data and a previous submission
to NICE (Daclizumab).
The results of the economic model are presented as incremental cost per quality-adjusted life-
year (QALY) as well as pair-wise ICERs of ocrelizumab versus the comparators. The company’s
base case results for the ITT analysis, the HA subgroup and the RES subgroup are presented in
the tables below.
Copyright 2018 Queen's Printer and Controller of HMSO. All rights reserved.

Version 1 18
We note that the PAS price for ocrelizumab and the list prices for all comparators were used in
the estimation of cost-effectiveness. These results are not informative for comparators with a
PAS (dimethyl fumerate, fingolimod, daclizumab and teriflunomide) because they do not reflect
prices paid in the NHS. We report results based on all available PAS prices in Addendum 1 to
this report.
Table 1 indicates that under the company’s base case for the ITT population: alemtuzumab
dominates ocrelizumab; but if alemtuzumab is not an option for some patients, ocrelizumab has
an ICER of £26,435 compared with blended ABCR (CS Table 59). The ICER for ocrelizumab
varies between individual ABCR comparators, with a range from £22,841 compared with IFNβ-
1a (Avonex) to £35,028 compared with Pegβ-1a (CS Appendix J.1.2 Table 63). The company
results for the HA and RES subgroup analyses in Table 2 and Table 3 suggest that ocrelizumab
is cost-effective in these subgroups. However, these tables exclude alemtuzumab, because
results are not available from the subgroup MTC analysis for the outcome of CDP-12 that the
company used. As in the ITT analysis, daclizumab is excluded because of the EMA safety
warning. The CS also reports one-way sensitivity analysis, scenario analyses and probabilistic
analysis, which are reproduced and discussed in this ERG report.
Table 1 Company ITT base case (OCR PAS; list prices for comparators) Adapted from CS Table 57
Technologies
Total costs
(£)
Total
LYG
Total
QALYs
ICER (£/QALY)
Ocrelizumab vs.
comparator c
incrementa
l
Blended ABCRs ******* ***** **** 26,435 -
Alemtuzumab ******* ***** ***** OCR dominated 8,296
Teriflunomide b ******* ***** **** 9,832 Dominated
Ocrelizumab ******* ***** **** - Dominated
Dimethyl fumarate b
******* ***** **** OCR dominant Dominated
Fingolimod a b ******* ***** **** OCR dominant Dominated
Natalizumab a ******* ***** **** OCR dominant Dominated
Key: ICER, incremental cost-effectiveness ratio; LYG, life years gained; QALYs, quality-adjusted life years. a Comparator not in scope for ‘ITT’ population; b PAS available but not included in this analysis; c pairwise ICERs for ocrelizumab vs. comparators calculated by ERG from company model.
Copyright 2018 Queen's Printer and Controller of HMSO. All rights reserved.

Version 1 19
Table 2 Base case HA subgroup, deterministic: Adapted from CS Table 67 (ocrelizumab PAS; list prices for comparators)
Technologies Total costs
(£)
Total LYG
Total QALYs
ICER vs baseline (£/QALY)
ICER incremental
(£/QALY)
Ocrelizumab ******* ***** ***** - -
Fingolimod ******* ***** **** Dominated Dominated
Table 3 Base case RES subgroup, deterministic: Adapted from CS Table 71 (ocrelizumab PAS; list prices for comparators)
Technologies Total costs
(£)
Total LYG
Total QALYs
ICER vs baseline (£/QALY)
ICER incremental
(£/QALY)
Ocrelizumab ******* ***** **** - -
Natalizumab ******* **** ***** 1,065,854 1,065,854
Commentary on the robustness of submitted evidence Strengths
The OPERA trials providing direct evidence on ocrelizumab effectiveness were well-
conducted and considered to be at low risk of bias by the ERG.
The company conducted sensitivity analyses that suggested MTC outcomes are not
sensitive to the duration of trials, to the inclusion/exclusion of specific comparators that
are considered not relevant to the NICE scope, to the definitions of ARR or CDP, or to
the methods of adjustment of ARR for baseline covariates. A caveat is that sensitivity
analyses on definitions of ARR did not cover the full range of definitions used in the
trials.
The company assessed heterogeneity and consistency in their MTC analyses and
demontrated that these assumptions appear to have been satisfied.
The model structure and choice of data sources is generally appropriate and consistent
with previous NICE appraisals of DMTs for MS.
It also includes a number of assumptions employed in previous appraisals that are
appropriate, including:
o stopping rules for DMTs: EDSS>=7 or conversion to SPMS;
o no impact of treatment on severity or duration of relapses;
o treatment reduces disability progression but not regression;
Copyright 2018 Queen's Printer and Controller of HMSO. All rights reserved.

Version 1 20
o rates of withdrawal from treatment and adverse effects are constant over time;
and
o DMT does not directly affect mortality.
The model is also well implemented. We did not identify any coding errors or important
discrepancies between data sources and model parameters.
Weaknesses and Areas of uncertainty
The MTC analyses of CDP-12 and CDP-24 assume proportional hazards. The company
provided evidence to suggest that this assumption is supported for the comparison of
ocrelizumab against interferon β-1a, but it is unclear whether the assumption would be
supported for comparisons among other DMTs.
To enable MTC networks to be formed for HA and RES disease severity subgroups, the
company utilised ITT data from trials of ‘ABCR’ comparators (types of interferon β and
glatiramer acetate). The underlying assumption is that, for these treatments, the
treatment effect observed in the ITT population would be the same as the treatment
effects in the subgroup populations. However, the company has not clearly justified that
this assumption is supported. Overall, given the limitations of the subgroup analyses,
including that they are post-hoc and potentially at risk of selection bias, both the
company and ERG consider the MTC results for these subgroups to be unreliable.
There are marked differences between trials included in the MTCs in the proportions of
patients who were treatment-naïve and treatment-experienced, and also in the time
since onset of symptoms. The the ERG is therefore uncertain whether the consistency
assumption of MTC analysis is supported.
There is uncertainty around some individual input data for the MTCs. (i) An independent
MTC which the company used to provide ITT CDP-12 outcomes for some comparisons
against alemtuzumab, obtained by the company from the ‘HAS Reimbursement dossier’
has not been critiqued by the company and the ERG is unable to locate the dossier to
check it. (ii) It is unclear whether the placebo arm in the Calbrese 2012 trial was included
in MTC analysis. (iii) The company does not adequately justify why the Etemadefir 2006
trial was excluded from MTC analyses of ARR.
The company did not conduct any sensitivity analyses to investigate whether MTC
outcomes were sensitive to the inclusion of trials that were judged to be at high risk of
bias.
Copyright 2018 Queen's Printer and Controller of HMSO. All rights reserved.

Version 1 21
In the OPERA trials there are unbalanced missing data for some secondary outcomes
(though these outcomes do not inform the economic analysis).
Model results were most sensitive to parameters relating to treatment effects on
disability progression. Varying these parameters between lower and upper 95%
confidence limits led to changes in cost-effectiveness. Inconsistencies between the
company MTC results for CDP and other published estimates suggest some additional
uncertainty that is not reflected in the model.
The company used the 12 week measure of CDP effectiveness in their base case
model. We believe that CDP-24 is a more robust measure, less likely to be confounded
by longer-lasting temporary relapses.
In their base case, the company assumed that DMTs reduce the rate of conversion from
RRMS to SPMS by 50% of the relative effect on CDP. This assumption is not based on
evidence.
In addition, the company assumes that conversion from RRMS to SPMS is accompanied
by a one-point increase in EDSS, which does not reflect clinical opinion from experts
consulted by the ERG.
The company model uses the same transition matrix (British Columbia) for RRMS and
SPMS, which includes reductions in EDSS as well as increases. We have been advised
that this is unrealistic for SPMS.
The company base case model assumes no waning of treatment effects over time. This
is inconsistent with assumptions in previous NICE appraisals. We favour the more
conservative approach of assuming reduced effects over time.
Rates of retreatment for alemtuzumab in the company base case model assume that
13% of patients are retreated after year 5. This is unrealistic in current UK practice.
Summary of additional work undertaken by the ERG
The ERG analysis consists of three parts:
A rerun of the company’s model after minor corrections, but essentially maintaining the
company’s base case assumptions. Out of scope comparators are excluded from results
of this analysis.
Copyright 2018 Queen's Printer and Controller of HMSO. All rights reserved.

Version 1 22
A base case analysis based on alternative assumptions that the ERG found more
plausible following consultations with experts and after consideration of available
evidence. The ERG also explores additional scenarios for individual parameters.
A PAS analysis reported in Addendum 1 to this ERG report. As previously stated, cost-
effectiveness results reported by the company do not reflect prices paid in the NHS,
since the PAS price for ocrelizumab is compared to the list prices of comparators.
The rationale for our base case assumptions are stated and compared with the company’s base
case assumptions in section 4.5.1 of the ERG report. In Table 4 below, we present our base
case results for the non-HA or RES population, based on the PAS price for ocrelizumab and list
prices for comparators. Our findings show that ocrelizumab is dominated by alemtuzumab under
our preferred assumptions. While ocrelizumab dominates daclizumab and DMF in Table 4, it is
less cost-effective in the PAS analysis. The ICER for ocrelizumab compared with ABCR is
£43,772 per QALY gained.
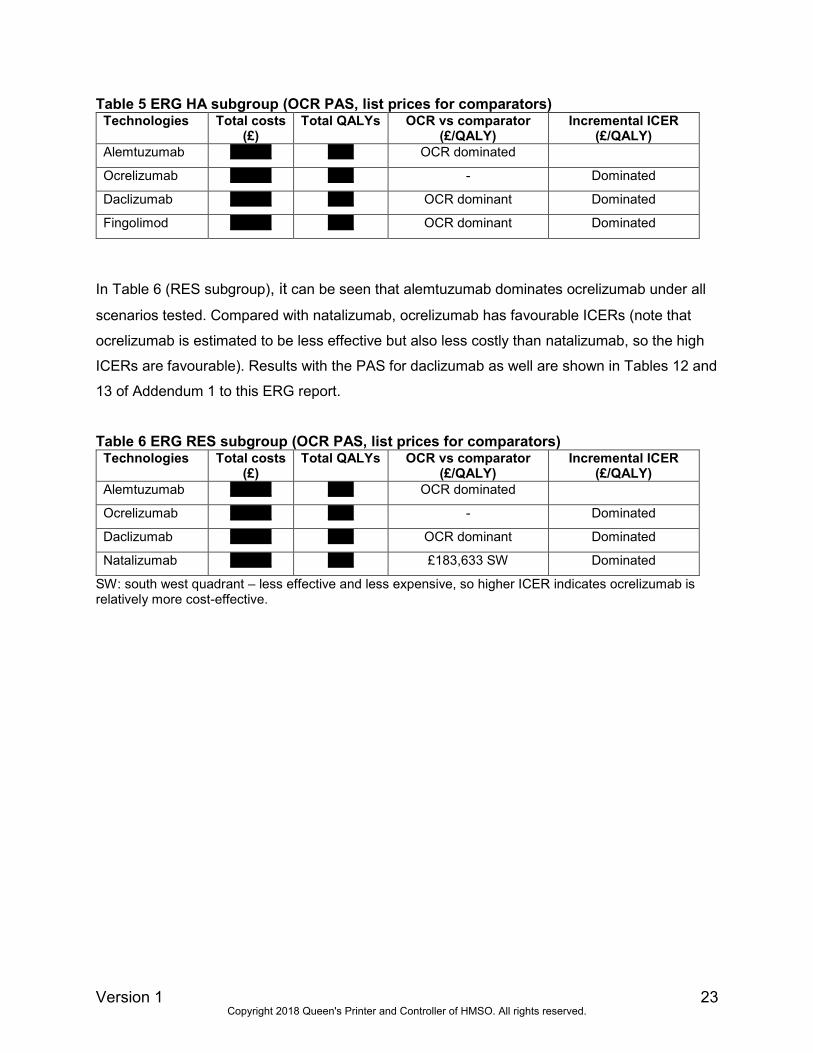
The results for the ERG base case analysis in the HA subgroup in Table 5 show that
ocrelizumab is dominated by alemtuzumab under ERG preferred assumptions. The ICERs for
ocrelizumab versus fingolimod are subject to uncertainty in the all-PAS analyses.
Table 4 ERG base case, non-HA/RES (PAS ocrelizumab; list prices for comparators)
Technologies
Total costs
(£)
Total
QALYs
ICER (£/QALY)
Ocrelizumab vs.
comparator Incremental
Blended ABCRs ******** **** £43,772
Alemtuzumab ******** ***** OCR dominated £1,992
Teriflunomide ******** **** £10,302 Dominated
Ocrelizumab ******** **** - Dominated
Daclizumab ******** **** OCR dominant Dominated
Dimethyl fumarate ******** **** OCR dominant Dominated
Key: ICER, incremental cost-effectiveness ratio; LYG, life years gained; QALYs, quality-adjusted life years. a PAS available but not included in this analysis
Copyright 2018 Queen's Printer and Controller of HMSO. All rights reserved.
Version 1 23
Table 5 ERG HA subgroup (OCR PAS, list prices for comparators) Technologies Total costs
(£) Total QALYs OCR vs comparator
(£/QALY) Incremental ICER
(£/QALY)
Alemtuzumab ******** ***** OCR dominated
Ocrelizumab ******** ***** - Dominated
Daclizumab ******** ***** OCR dominant Dominated
Fingolimod ******** ***** OCR dominant Dominated
In Table 6 (RES subgroup), it can be seen that alemtuzumab dominates ocrelizumab under all
scenarios tested. Compared with natalizumab, ocrelizumab has favourable ICERs (note that
ocrelizumab is estimated to be less effective but also less costly than natalizumab, so the high
ICERs are favourable). Results with the PAS for daclizumab as well are shown in Tables 12 and
13 of Addendum 1 to this ERG report.
Table 6 ERG RES subgroup (OCR PAS, list prices for comparators) Technologies Total costs
(£) Total QALYs OCR vs comparator
(£/QALY) Incremental ICER
(£/QALY)
Alemtuzumab ******** ***** OCR dominated
Ocrelizumab ******** ***** - Dominated
Daclizumab ******** ***** OCR dominant Dominated
Natalizumab ******** ***** £183,633 SW Dominated
SW: south west quadrant – less effective and less expensive, so higher ICER indicates ocrelizumab is relatively more cost-effective.
Copyright 2018 Queen's Printer and Controller of HMSO. All rights reserved.

Version 1 24
1 INTRODUCTION
This report is a critique of the company’s submission (CS) to NICE from Roche on the clinical
effectiveness and cost effectiveness of ocrelizumab for relapsing forms of multiple sclerosis. It
identifies the strengths and weaknesses of the CS. Clinical experts were consulted to advise the
ERG and to help inform this review.
Clarification on some aspects of the CS was requested from the company by the ERG via NICE
on 13th December 2017. Responses from the company via NICE were received by the ERG on
9th January and 16th January 2018 and these can be seen in the NICE committee papers for this
appraisal.
2 BACKGROUND
2.1 Critique of the company’s description of the underlying health problem
The ERG considers that the CS provides a clear and accurate overview of the nature and
clinical consequences of multiple sclerosis (MS) (CS section B.1.3). MS is an incurable
neurodegenerative disorder characterised by inflammation, demyelination, and axonal loss in
the brain and spinal cord. Symptoms of the disease vary widely among people and can affect
any part of the body. Long-term studies have estimated that MS patients have historically had a
median life expectancy around 7 years shorter than the general population, but survival rates
have consistently improved through time.1-3 Experts advising the ERG suggested that the
difference in life expectancy bettween MS patients and the general population may now be
around 5 years or less.
There are three types of MS: relapsing-remitting (RRMS), secondary progressive (SPMS) and
primary progressive (PPMS). The NICE scope focuses on adults with relapsing forms of MS
(RRMS and SPMS).
Relapsing-remitting MS
RRMS is the most common of the three phenotypes of MS (approximately 85% of the MS
population). RRMS has clearly defined inflammatory attacks (relapses), which cause lesions
anywhere in the central nervous system (CNS). Over time, disability progressively worsens due
to incomplete recovery from relapses. During remissions, the symptoms of MS, which can
include pain, muscle weakness, sensory disturbance, lack of coordination, unsteady gait,
Copyright 2018 Queen's Printer and Controller of HMSO. All rights reserved.

Version 1 25
speech problems, incontinence, visual disturbance and cognitive impairment, may all disappear
or some may continue and become permanent. According to the ERG’s clinical advisors,
spasticity and fatigue are usually persistent. Although there is currently no cure for RRMS,
treatment with disease modifying therapies (DMTs) can reduce the frequency of relapses which
improves patients’ symptoms and may slow down the accumulation of disability.
Secondary progressive MS
Natural history studies have suggested that most patients with RRMS will eventually transition
to SPMS, although recent prospective cohort studies on DMT-treated patients indicate that the
time to conversion to SPMS and the proportion of patients who convert may be lower than
previously thought.4, 5 With the transition from RRMS into SPMS, patients may initially continue
to experience a relapsing-remitting course but the frequency of relapses and remissions
typically decline over time and progressive worsening of disability occurs as the underlying
disease process shifts from the inflammatory course characteristic of RRMS, to a more steadily
progressive phase characterised by permanent nerve damage or loss. As the frequency of
relapses and remissions decline, DMTs no longer offer an effective treatment. The final NICE
scope therefore only includes those patients with SPMS who continue to experience relapses.
The diagnosis of SPMS is typically made retrospectively, since patients can vary considerably in
the frequency and severity of their relapses and it can be difficult to tell at a given point in time
whether a patient is transitioning from RRMS to SPMS. There is also inconsistency in how
SPMS is defined, with no gold standard objective definition currently available.4
Disease prevalence
The CS states that there is an absence of accurate data concerning people with MS in the UK.
Estimates from a study by Mackenzie et al.2 are cited by the CS which suggest that there were
126,669 people living with MS in the UK at the beginning of 2010 (203.4 per 100,000
population), with 6003 new cases diagnosed during that year (9.64 per 100,000/year). The
Mackenzie study was based on the General Practice Research Database (GPRD), which is a
primary care database that includes approximately 65% of the England MS patient population.
The study is therefore likely to be reflective of the UK population.
The study found a consistent downward trend in the incidence of MS in the GPRD during 1990-
2010, with a rate of decline of 1.51% per year. However, this is countered by the increasingly
expanding older population in the UK and the Mackenzie study estimated a growth rate of 2.4%
Copyright 2018 Queen's Printer and Controller of HMSO. All rights reserved.

Version 1 26
per year in the number of people with MS. Annual MS prevalence rates in database patients
below the age of 50 remained unchanged over the 20-year study period (1990-2010), but
increased by over 4% in patients aged ≥60 years.
Using a variety of sources combined with the Mackenzie study, the CS estimates that
prevalence of people with RRMS in 2017 was 57,870. Clinical experts advising the ERG agreed
that the company’s estimate appears reasonable.
2.2 Critique of the company’s overview of current service provision
The CS notes that there is variation in practice across the UK for the treatment of RRMS, but
does not describe current service provision. The ERG understands that ocrelizumab would be
administered in specialist MS clinics in a similar way to the administration of other infused
DMTs. The CS does not comment on the nature of the MS clinics although we understand from
clinical experts that these are likely to be hospital-based day-case units. The CS also does not
comment on the interdisciplinary nature of MS care which, in addition to consultant neurologists,
involves professionals such as MS nurses, physiotherapists and occupational therapists,
speech and language therapists, psychologists, dietitians, social care and continence
specialists, and GPs. The ERG is not aware of any key infrastructural or organisational issues
that might impact on the provision of ocrelizumab therapy, other than the need (as in all areas of
MS care) to ensure the availability of adequate staff with appropriate training. We understand
that Specialist MS nurses could deliver ocrelizumab infusion therapy with relatively little
additional training.
The CS provides a generally clear and accurate overview of the NICE recommendations and
treatment guidance for RRMS provided by the Association of British Neurologists (ABN).6 NICE
provides guidelines for the management of MS in adults,7 which covers RRMS as well as other
types of MS.
Diagnosis
The CS does not explicitly describe the process for diagnosing MS or, more specifically, RRMS.
Diagnosis of MS follows the McDonald criteria8 (first published in 2001, and revised in 2005 and
2010), which are summarised in Table 7. For a diagnosis of RRMS, lesions have to have
developed at different times and be in different anatomical locations.
Copyright 2018 Queen's Printer and Controller of HMSO. All rights reserved.

Version 1 27
Table 7 Revised 2010 McDonald Criteria for diagnosis of MS
Clinical presentation Additional data needed for MS diagnosis
≥2 relapses; objective clinical evidence of
≥2 lesions; objective clinical evidence of
one lesion together with reasonable
historical evidence of a previous relapse
None
≥2 attacks; objective clinical evidence of
one lesion
Dissemination in space shown by: ≥1 MRI detected
lesions typical of MS or
Await a further relapse that demonstrates activity in
another part of the CNS
One attack; objective clinical evidence of
two or more lesions
Dissemination in time shown by: MRI evidence showing
both an active (current) and non-active (previous) lesion
or
MRI evidence of a new lesion since a previous scan
or Await a further relapse
Insidious neurological progression
suggestive of multiple sclerosis (typical for
PPMS)
Continued progression for one year (determined by
looking at previous symptoms or by ongoing
observation) plus any two of:
≥1 MRI detected lesions in the brain typical of MS
≥2 MRI detected lesions in the spinal cord
Positive tests on cerebrospinal fluid drawn off by
lumbar puncture
CNS, Central nervous system; MS, multiple sclerosis; PPMS. Primary progressive MS.
The NICE Guideline for managing MS in adults7 states that:
only a consultant neurologist should make the diagnosis
diagnosis should be made on the basis of established up-to-date criteria such as the
revised 2010 McDonald criteria8
diagnosis should not be made on the basis of MRI findings alone
Copyright 2018 Queen's Printer and Controller of HMSO. All rights reserved.

Version 1 28
Induction and escalation treatment strategies
According to the literature9-11 and clinical advice to the ERG, there are currently two main
therapeutic strategies employed in clinical practice. These are mentioned, but not explained, in
CS Table 5:
Induction (or immune reset therapy)
Escalation (or optimisation) therapy
These strategies make a distinction between DMTs that are moderately effective and have a
relatively good safety profile (referred to by the ABN as category 1 DMTs), and highly effective
DMTs that are associated with safety concerns (category 2 DMTs)11 (Table 8). Induction therapy
involves short-term use of a high-efficacy DMT to obtain rapid control of highly active MS
(referred to as performing a ‘strong immuno-intervention’9) which may increase the likelihood of
long-term beneficial outcomes, but with risk of serious adverse events. Escalation therapy
consists of starting treatment with safer category 1 DMTs and, if these are ineffective, switching
to stronger DMTs.9-11
The CS suggests (in agreement with the literature and the ERG’s clinical experts) that the
choice of which DMT to prescribe in RRMS is largely based on an informed discussion and
consensus between the prescribing clinician and the patient, taking into consideration the
patient’s level of disease activity, risk tolerance, preference and lifestyle considerations. Family
planning is an important consideration as the DMTs vary in their safety profiles including the risk
of teratogenicity6 and at present only glatiramer acetate is licensed for use during pregnancy.
Table 8 ABN categories of DMTs based on efficacy6
Category 1 Category 2
Drugs of moderate efficacy (average relapse
reduction 30–50%)
Drugs of high efficacy (average relapse
reduction substantially more than 50%)
β-interferons (including ‘pegylated’ β-interferon)
Glatiramer acetate
Teriflunomide
Dimethyl fumarate
Fingolimod
Alemtuzumab
Natalizumab
Copyright 2018 Queen's Printer and Controller of HMSO. All rights reserved.

Version 1 29
The CS suggests that the early use of DMTs is limited by safety concerns, as well as specific
patient eligibility criteria as defined by EMA and NICE. ABN guidelines state that the safety
profiles for DMTs such as of interferon β and glatiramer acetate have been established due to
their long-term use, but that higher efficacy drugs have a more complex safety profile.6 While
drugs like interferons and glatiramer acetate have more favourable safety profiles compared to
the newer more effective DMTs, the more effective DMTs carry a greater risk for life threatening
infections and autoimmune disease, and carry warnings due to their risk profile.12
The CS provides a table listing common adverse events, safety issues and monitoring
requirements for each DMT (CS Table 4), as well as a listing of the efficacy limitations of DMTs
for RRMS (CS Table 5). Experts advising the ERG commented that the information on safety
provided in CS Table 4 is selective. As such, this has not been reproduced here (adverse
events are reported in section 3.3.9). Note that a detailed comparison of the safety profiles of
the DMTs can be found in Pardo and Jones (2017)10 (not reproduced here).
Treatment sequencing
Patients can be classified as having highly active (HA) or rapidly evolving severe (RES) forms of
RRMS, depending on the frequency of relapses and lesions seen on magnetic resonance
imaging (MRI) that they experienced in the previous year (for definitions of these subgroups see
Table 14 in section 3.1.6.1). According to the NICE scope, patients with HA RRMS should
receive fingolimod13 or alemtuzumab,14 whilst those with RES RRMS should receive
natalizumab15 or alemtuzumab14. Both HA and RES subgroups could also receive daclizumab,
subject to alemtuzumab being contraindicated or otherwise unsuitable, but daclizumab use is
currently restricted by an EMA alert regarding its safety (specifically liver toxicity).16 Clinical
experts advising the ERG suggested that daclizumab is unlikely to be used in the NHS until the
safety concerns can be resolved.
The company emphasise that due to variations in current management of MS, there is no typical
first-line therapy. Although there is currently no NICE pathway for the sequencing of DMTs, we
note that NICE have discussed how first-line and second-line DMTs may be used in patients
with RRMS and in the HA and RES subgroups, according to a slide in the Appraisal Committee
Papers for the review of interferon β and glatiramer acetate (TA32).17 This slide is reproduced in
Figure 1 (with a minor modification, explained below).
Copyright 2018 Queen's Printer and Controller of HMSO. All rights reserved.

Version 1 30
Source: NICE committee papers of the review of TA32 MS, Multiple sclerosis; RRMS, Relapsing-remitting multiple sclerosis.
Figure 1 Current management of RRMS
Experts advising the ERG agreed that Figure 1 reflects how first-line DMTs would be used in
current practice. Cladribine (although not in the NICE scope) could also be included as a first-
line treatment for the RES subgroup of patients. The original slide in the TA32 Committee
Papers suggested that patients would switch to second-line therapy based on adverse events.
However, the ERG’s clinical experts commented that changing between first-line therapies due
to adverse events would not be regarded as moving to a second-line treatment; only moving
therapy due to inadequate response would be considered as a switch to a second-line
treatment. Figure 1 has therefore been modified from the original NICE slide to reflect this.
There were slight differences in opinion among the experts advising the ERG regarding the
second-line DMTs in Figure 1. One clinical expert agreed with second-line therapy as depicted
in the Figure. Another expert suggested that they would not include teriflunomide as a second-
line DMT and that second-line DMTs for HA RRMS would include cladribine and probably also
dimethyl fumarate.
According to the ERG’s clinical experts, ocrelizumab could provide an alternative treatment
option for either first-line or second-line treatment.
Copyright 2018 Queen's Printer and Controller of HMSO. All rights reserved.

Version 1 31
Stopping rules
The CS points out that there are no standard stopping rules for DMT therapy, but (based on
ABN guidance), clinicians should consider stopping a DMT: (1) if there are significant side-
effects; (2) non-relapsing SPMS develops; (3) in pregnancy; or (4) when loss of mobility occurs
(an EDSS score of 6.5 is the upper limit for patient eligibility for a DMT - for an explanation of
the EDSS see Appendix 3).
2.3 Critique of the company’s definition of the decision problem
Population
The population specified in the company’s decision problem is adults with RRMS. This is based
on the pivotal trials that form the basis of the clinical effectiveness evidence provided in the CS,
which included predominantly patients with RRMS. While the population is appropriate for the
NHS, it is narrower than that specified in the NICE scope (people with relapsing forms of MS),
since patients with SPMS who experience relapses are not included. We also note that,
although it is not explicit in the decision problem (CS Table 1), the CS excludes patients aged
over 55 years, as these were not included in the pivotal ocrelizumab trials (nor in most of the
trials on the comparators). Clinical experts advising the ERG stated that patients aged over 55
years would (infrequently) be started on stronger DMTs such as ocrelizumab and the experts all
agreed that it would be preferable to have clinical evidence for effectiveness and safety in
patients up to age 65.
Intervention
In accordance with the NICE scope, the intervention described in the company’s decision
problem is ocrelizumab (brand name Ocrevus).
The CS provides an appropriate overview of the mechanism of action of ocrelizumab in relation
to the pathophysiology of MS (CS section B.1.3). In summary, ocrelizumab is a recombinant
humanised monoclonal antibody that selectively depletes CD20+ B cells, which are thought to
be implicated in the pathophysiology of MS through their role in antigen presentation, cytokine
production, autoantibody production and development of ectopic lymphoid follicle-like structures
in the CNS. Through its mode of action, ocrelizumab reduces the frequency of inflammatory
episodes in the CNS (i.e. relapses).
Copyright 2018 Queen's Printer and Controller of HMSO. All rights reserved.

Version 1 32
Ocrelizumab is administered as an intravenous infusion and the outlined use in the CS is:
First dose 600 mg, administered as two 300 mg infusions two weeks apart
Subsequent doses single 600 mg infusions, administered every six months, with a
minimum interval of five months between each subsequent dose.
Two pre-medications must be administered prior to each ocrelizumab infusion to reduce the
frequency and severity of infusion related reactions (IRRs):
100 mg intravenous methylprednisolone (or an equivalent), approximately 30 minutes
prior to each ocrelizumab infusion
Antihistamine, approximately 30–60 minutes prior to each ocrelizumab infusion
An antipyretic (e.g. paracetamol) as pre-medication may be considered approximately 30-60
minutes prior to each ocrelizumab infusion.
Safety issues
The draft summary of product characteristics (SmPC) recommends that all patients are
screened for hepatitis B virus (HBV) prior to initiation of treatment with ocrelizumab, as the
safety and efficacy of ocrelizumab in patients with hepatic impairment has not been formally
studied. The SmPC does state that a change in dose is not expected to be required for patients
with renal impairment.18 Ocrelizumab must be withheld if progressive multifocal
leukoencephalopathy (PML) is suspected and evaluation including MRI scan preferably with
contrast (compared with pre-treatment MRI), confirmatory cerebrospinal fluid (CSF) testing for
John Cunningham (JC) viral DNA, and repeat neurological assessments should be considered.
The SmPC states that a risk of PML cannot be ruled out since JC virus infection resulting in
PML has been observed in patients treated with anti-CD20 antibodies and other MS therapies.
An increased number of malignancies (including breast cancers) have been observed in clinical
trials in patients treated with ocrelizumab compared to control groups, but the SmPC noted that
the incidence was within the background rate expected for an MS population.
The Committee for Medicinal Products for Human Use (CHMP) recommended in November
2017 the granting of a marketing authorisation for ocrelizumab (granted 08/01/2018).18
Ocrelizumab is intended for the treatment of RRMS (with active disease defined by clinical or
imaging features) and also in PPMS (i.e. the marketing authorisation is wider than the proposed
population for this technology appraisal).
Copyright 2018 Queen's Printer and Controller of HMSO. All rights reserved.

Version 1 33
The intervention described in the decision problem is appropriate for the National Health Service
(NHS) and reflects its intended licensed indication.
Comparators
Eight comparators of interest are listed in the NICE scope. As shown in Table 9, these are all
included in the company’s decision problem, although there are some differences in the
comparator listings for the RRMS and SPMS patient groups when compared to the NICE scope.
Differences include:
Daclizumab is indicated for ‘patients who have had an inadequate response to at least
two DMTs and cannot be treated with other DMTs’.19 As mentioned above, daclizumab
use is currently restricted by an EMA alert regarding its safety (specifically liver
toxicity).16 The company state that, therefore, they do not consider daclizumab to be a
relevant comparator. As such, it has been excluded from the company’s economic
analysis, although daclizumab is included in the company’s mixed treatment
comparisons (MTCs). Experts advising the ERG suggested that daclizumab it is unlikely
to be used in the NHS until the safety concerns can be resolved.
Natalizumab and fingolimod: In contrast to the NICE scope, the company decision
problem includes natalizumab and fingolimod as comparators for the overall RRMS
patient group. The CS notes that these two DMTs are only recommended for the HA
and/or RES subgroups of RRMS, as per the NICE scope, but the company justifies their
wider inclusion due to limitations in the subgroup MTC analyses (see Section 3.1.7 for
more detail). The company has included natalizumab and fingolimod in their MTC and
economic analyses, but also conducted a sensitivity analysis that excludes these
comparators (CS Appendix D.1.4).
Comparators in the relapsing SPMS patient group: The NICE scope includes best
supportive care as a comparator for patients with relapsing SPMS. The company states
that there is no available subgroup data for patients with relapsing SPMS in the
company’s pivotal trials. This comparator is therefore not included in the company’s
decision problem. The ERG’s clinical experts agreed that this seems reasonable since
separate data for SPMS and RRMS patients are not usually collected in clinical trials,
and relapses in RRMS and SPMS should respond in the same way to immunotherapy
(although relapses are rarer in SPMS and generally not managed as aggressively as in
RRMS).
Copyright 2018 Queen's Printer and Controller of HMSO. All rights reserved.

Version 1 34
Table 9 Comparators included the NICE scope and the company’s decision problem
Patient disease group Final NICE scope comparators and
restrictions
Company decision
problem comparators
RRMS
• Alemtuzumab
• dimethyl fumarate
• Teriflunomide
• Beta-interferon
• Glatiramer acetate
• Daclizumab (only if the disease has
been previously treated with disease-
modifying therapy, and alemtuzumab is
contraindicated or otherwise unsuitable)
• Alemtuzumab
• Dimethyl fumarate
• Teriflunomide
• Beta-interferon
• Glatiramer acetate
• Daclizumab
• Natalizumab
• Fingolimod
RES RRMS • Alemtuzumab
• Natalizumab
• Daclizumab (only if alemtuzumab is
contraindicated or otherwise unsuitable)
• Alemtuzumab
• Natalizumab
• Daclizumab
HA RRMS despite previous
treatment
• Alemtuzumab
• Fingolimod
• Daclizumab (only if alemtuzumab is
contraindicated or otherwise unsuitable)
• Alemtuzumab
• Fingolimod
• Daclizumab
SPMS with active disease,
evidenced by relapses
• Best supportive care
HA, Highly active; RES, Rapidly evolving severe; RRMS, Relapsing-remitting multiple sclerosis; SPMS, Secondary progressive multiple sclerosis.
The comparators are diverse in terms of their dosing regimens, which include oral tablets,
intravenous infusions, subcutaneous injections and intramuscular injections, with administration
timing and frequency varying considerably (summarised in Appendix 1).
Patients receiving intravenous infusions require attendance at hospital clinics whereas oral
tablets, subcutaneous injections and intramuscular injections can be self-administered by the
patient after an initial instruction clinic visit for injections. The ERG’s clinical experts noted that
Fingolimod (oral tablet) requires attendance for a day (6 hours admission) at hospital for first
dose monitoring.
Copyright 2018 Queen's Printer and Controller of HMSO. All rights reserved.

Version 1 35
Outcomes
The outcomes are appropriate to the decision problem and conform with EMA guidance on the
outcomes that should be assessed in clinical trials of MS therapies20 (further details on the
ERG’s appraisal of the outcomes are given in section 3.1.5). The key outcomes specified in the
NICE scope are relapse rate, severity of relapse, disability, symptoms, freedom from disease
activity, mortality and adverse events.
The ERG has identified the following differences between the outcomes reported in the CS and
the NICE scope:
Severity of relapse, specified in the NICE scope, is not reported in the CS; this seems
reasonable, as relapse severity was not an outcome in the pivotal clinical trials;
Expanded disability status scale (EDSS) score, specified in the NICE scope, is reported
only at baseline in the CS and trial publication;
Four patient-reported outcomes that are either directly or indirectly relevant to the NICE
scope are not reported in the CS or trial publication; these are quality of life as assessed
by the EQ-5D, and three instruments that assessed depression and fatigue (all were
exploratory outcomes).
Where possible, the ERG has obtained these missing outcomes from the clinical study reports
(CSR) or, in the case of the EQ-5D data, via a clarification request to the company (clarification
A8). Full details of the ERG’s interpretation and appraisal of the outcomes are given in section
3.1.5.
Economic analysis
The company’s economic evaluation is appropriate for the NHS and is consistent with the
structure of established models for RRMS. Full details of the ERG’s appraisal of the company
model are given in section 4.3.
Copyright 2018 Queen's Printer and Controller of HMSO. All rights reserved.

Version 1 36
Other relevant factors
Subgroups
In addition to the aforementioned MS subgroups (RRMS, RES, and HA) the NICE scope
specifies that the following subgroups should be considered if the evidence allows:
• people whose disease has responded inadequately to previous treatment
• people who could not tolerate previous treatment
• people in whom alemtuzumab is contraindicated or otherwise unsuitable
The CS does not report subgroup comparisons that precisely match these, but does report
results of pre-specified analyses for the following subgroups that are closely related (CS
Appendix E):
analyses for treatment-naïve and treatment-experienced patients;
analyses according to the subgroups ‘active inadequate responders’, ‘active treatment
naïve’, highly active inadequate responders’ and ‘ highly active treatment naïve’ patients
(reflecting regulatory definitions).
The CS also reports analyses of subgroups for a range of patient baseline demographic
characteristics and disease variables (CS Appendix E).
Issues of validity and equality
The CS states that there are no obvious issues related to equity or equality in the decision
problem and the ERG concurs. The ERG’s clinical experts commented that travelling to an MS
clinic for infusions does put some people off, particularly if living far away. But ocrelizumab
treatment is only four infusions per year so would be less of an issue than with more frequently-
administered DMTs, and patients would usually be attending hospital every six months for clinic
visits anyway.
Copyright 2018 Queen's Printer and Controller of HMSO. All rights reserved.

Version 1 37
3 CLINICAL EFFECTIVENESS
3.1 Critique of the company’s approach to systematic review
This section summarises the company’s search strategy, the ERG’s critique, and updated
searches that were conducted by the ERG.
3.1.1 Description of the company’s search strategy
The company submission (CS) reports four systematic searches:
Clinical evidence: last updated in July 2017
Cost effectiveness: last updated in March 2017
Health related quality of life: last updated in March 2017
Cost and healthcare resource identification, measurement and valuation: last updated in
February 2017
3.1.1.1 ERG’s critique of the company’s searches
All four search strategies were thorough and well documented. The databases selected were
relevant (including Medline, Embase, the Cochrane Database of Systematic Reviews (CDSR),
Cochrane Central Register of Controlled Trials (CENTRAL), and Health Technology
Assessment database). The strategies contained a good range of controlled vocabulary terms,
free text terms and application of appropriate search filters. The search syntax was apposite
and the sets were correctly combined apart from a possible typographic error in the recording of
the Cochrane Library clinical effectiveness search in line 53 which should have recorded a
combination of lines 6-52 rather than 2-52; however, this would not have led to missing results.
Pertinent conferences were searched including: European Committee for Treatment and
Research in Multiple Sclerosis (ECTRIMS), Americas Committee for Treatment and Research in
Multiple Sclerosis conference (ACTRIMS), Consortium of Multiple Sclerosis Centers Annual
meeting (CMCS), European Academy of Neurology (EAN), European Neurological Society
(ENS), European Federation of Neurological Sciences (EFNS), American Academy of
Neurology (AAN), and the International Society for Pharmacoeconomics and Outcomes
Research (ISPOR). Relevant websites were additionally searched for supplementary grey
literature.
Copyright 2018 Queen's Printer and Controller of HMSO. All rights reserved.

Version 1 38
The CS does not explicitly mention searching for any systematic reviews or meta-analyses of
clinical effectiveness pertinent to the NICE scope bus as noted above the company did search
the CDSR. A network meta-analysis by Tolley et al.21 is briefly mentioned (CS section B.2.9)
and seven systematic reviews and meta-analyses are among the excluded studies which are
listed in Table 8 of the CS Appendices. Annotations in Table 8 of the CS Appendices appear to
imply that the company checked two of these systematic reviews for references.22, 23
The company mentions that searches were conducted to inform a review of efficacy and safety
(CS Appendix D.1.1). However, a systematic evaluation of studies reporting the safety of
ocrelizumab (which ideally would consider non-randomised studies) is not provided. Instead, the
company have obtained safety data primarily from the OPERA I and OPERA II trials (CS section
B.2.10) and also from previous NICE technology appraisals for daclizumab and alemtuzumab
(CS section B.3.4.4). Although a more systematic and transparent process for sourcing data on
the safety of ocrelizumab would have been preferable, clinical experts advising the ERG did not
identify any key issues pertaining to ocrelizumab safety that are not covered in the CS.
In summary, the searches were extensive, well recorded, reproducible and considered to be fit
for purpose, with the main limitations being: (1) that they were 4-10 months out of date when the
CS was received by the ERG; (2) systematic reviews and meta-analyses do not appear to have
been sought or checked consistently as a source of references; and (3) a systematic search for
data on safety of ocrelizumab (e.g. in non-randomised studies) was not conducted.
3.1.1.2 ERG updated searches: methods
We conducted the following additional searches to check whether the company had identified all
relevant clinical effectiveness studies for inclusion in their analyses:
All four searches were updated (restricted to Medline and Embase and to the year 2017
onwards);
An internet search was conducted for relevant systematic reviews and meta-analyses
(using free text terms for each comparator drug combined with terms referring to
evidence synthesis, applied in Google, not limited by date);
We checked all trials that were included in direct and indirect comparisons in the
previous technology appraisals for the comparators listed in the NICE scope
(alemtuzumab [TA312], beta-interferon and glatiramer acetate [TA32], cladribine
Copyright 2018 Queen's Printer and Controller of HMSO. All rights reserved.

Version 1 39
[TA493], daclizumab [TA 441], dimethyl fumarate [TA320], fingolimod [TA254],
natalizumab [TA127] and teriflunomide [TA303]);
Documents relating to technology appraisals of ocrelizumab in the USA24 and Canada25
were also checked for relevant references.
In these searches we sought randomised controlled trials (RCTs) that had compared any of the
DMTs specified in the NICE scope either in head-to-head comparisons or against placebo, in
patients who had RRMS.
3.1.1.3 ERG updated searches: results
After deduplication, the ERG’s updated clinical effectiveness search identified 799 references
published in 2017-2018, which included some references already identified by the company. It
was not feasible for the ERG to screen all of these in duplicate and so we adopted a pragmatic
approach which was to exclude conference abstracts (n=503) as these would be unlikely to
contain sufficient information to enable inclusion the company’s direct or indirect analyses. The
remaining 296 references were screened by one reviewer. From these, any relevant RCTs of
ocrelizumab or comparators that were not already included by the company, and any relevant
systematic reviews and meta-analyses, were retrieved and checked.
Internet searches identified over 40 potentially relevant published systematic reviews and meta-
analyses in RRMS. It was not feasible to check the reference lists of all these in detail and so
we adopted a pragmatic approach in which one reviewer checked only those published from
2015 onwards (n=18).21-23, 26-40 Additionally, we contacted the authors of three ongoing
systematic reviews and meta-analyses41-43 but were informed that the results of these were not
available.
Our updated searches in Medline and Embase, together with checks of the reference lists of the
aforementioned systematic reviews and meta-analyses and scrutiny of the studies included in
the comparator NICE appraisals confirmed that the company had identified all relevant
published RCTs of ocrelizumab and comparator DMTs.
Searches for ongoing trials
The CS reports searching for ongoing trials in 2 registries: clinical trials.gov and the International
Trials Registry Platform (WHO ICTRP).
Copyright 2018 Queen's Printer and Controller of HMSO. All rights reserved.

Version 1 40
To check that no ongoing trials had been missed we re-ran the searches in these two registries
and additionally searched the UK Clinical Trials Gateway (UKCTG), EU Clinical Trials Register
(EUDRACT), ISRCTN Registry, and Centerwatch (ongoing studies are summarised in section
3.1.3.3).
3.1.2 Statement of the inclusion/exclusion criteria used in the study selection.
The company provides a clear description of the inclusion and exclusion criteria for the
systematic literature review (SLR) of clinical effectiveness studies (CS Appendix D). The CS
states that the search strategy was designed with the requirements of multiple countries in mind
and is therefore more comprehensive than the NICE scope; and that the search included
comparators licensed by the Food and Drug Administration (FDA) or EMA, or those expected to
be licensed at the time of ocrelizumab launch.
Population
The population specified in the company’s SLR was limited to adults with the relapsing forms of
MS. Trials with mixed populations containing >75% relapsing form of MS were included but
those containing >25% SPMS (without relapses), PPMS and/or primary relapsing MS were
excluded. The ERG and the clinical experts advising us consider this to be appropriate.
Intervention
Studies on ocrelizumab 600mg q6m (i.e. every 6 months) were included, which is consistent
with the intended indication.
Comparators
The SLR eligibility criteria (listed under ‘Intervention’ in CS Appendix Table 3) include the eight
comparators listed in the NICE scope, as well as cladribine and placebo. As a consequence of
the broad nature of the searches, the comparators are not limited to UK-relevant dosing regimes
(e.g. teriflunomide 7mg per day is listed as well as the recommended 14 mg per day).
Outcomes
To be included, trials had to assess at least one of the following outcomes:
annualised relapse rate
relapse free proportion
Copyright 2018 Queen's Printer and Controller of HMSO. All rights reserved.

Version 1 41
disability progression (12-week or 24-week confirmed)
gadolinium-enhancing T1 lesions (number) and T2 lesions (volume)
proportion of patients with no evidence of disease activity (NEDA) including definition of
NEDA
adverse events (AE) and serious AEs
discontinuations due to AEs and all-cause discontinuation
mortality
infections
malignancies
SF-36 and EQ-5D
We note that the SLR eligibility criteria do not include the following outcomes that are specified
in the NICE scope (and which, as noted above in section 2.3, are missing from the company’s
decision problem):
severity of relapses
disability (e.g. Expanded Disability Status Scale [EDSS])
symptoms of MS such as fatigue, cognition and visual disturbance (other than those
captured within the generic SF-36 and EQ-5D)
The ERG’s clinical experts commented that as far as they are aware, no data on the severity of
relapses have been collected in clinical trials of MS and so the omission of this outcome from
the company’s SLR would appear to be appropriate.
Study design
The design of studies specified in the SLR eligibility criteria was limited to randomised controlled
trials (RCTs), but there was no limit based on the quality of the RCTs. Setting was not specified
as an inclusion or exclusion criterion.
The CS provides a flow diagram illustrating the number of records identified and
included/excluded at each stage of the SLR (Figure 1 in CS Appendix D.1.1). Reasons for the
exclusion of studies at the full-text stage are provided with listed references in Appendix D
(Table 7 in CS Appendix D.1.1), but not recorded in the flow diagram.
Copyright 2018 Queen's Printer and Controller of HMSO. All rights reserved.

Version 1 42
The CS does not report how many reviewers conducted the eligibility screening step of the SLR.
The company explained in response to a clarification request from the ERG (clarification A1)
that for each systematic review (including those for cost effectiveness, HRQoL and resource
use, as well as the SLR of clinical effectiveness), two reviewers independently checked titles,
abstracts and full-text records and any disagreements were resolved by a third reviewer. This is
appropriate practice to minimise the risk of introducing errors and bias during screening.
Given that the company’s SLR eligibility criteria were broader than the decision problem, the
ERG enquired whether the eligibility criteria were refined during the screening process. The
company explained (clarification A4) that the same eligibility criteria were applied to screening
titles, abstracts and full-text articles, but that the scope of the SLR was narrowed down at a
“feasibility assessment” stage. The CS implies that the feasibility assessment was part of the
process for determining the eligibility of studies for the company’s MTC analyses (text
immediately above CS Appendix Table 9), but does not explain the rationale for why certain
studies included in the SLR were considered ineligible for the MTC analyses. In response to a
request from the ERG, the company further clarified the feasibility assessment and study
selection process for the MTC (clarification A14); this is discussed further in section 3.1.7.
3.1.3 Identified studies
The SLR included a total of 46 RCTs, of which three are direct head-to-head comparisons of
ocrelizumab against relevant comparators, and 43 were RCTs that did not include an
ocrelizumab arm but had at least one relevant comparator arm that could be used in the MTC.
The ERG agrees that all 46 of the identified RCTs are relevant to the NICE scope and the
company’s decision problem and, as noted above (section 3.1.1), we agree that the company
has identified all relevant trials. The company has not included any studies which do not meet
the inclusion criteria.
3.1.3.1 Ocrelizumab RCTs
The 43 comparator RCTs are discussed further in the MTC section of this report (section 3.1.7).
Here, we summarise the characteristics of the three ocrelizumab studies.
The three ocrelizumab studies all included ocrelizumab as an intravenous infusion. These were:
Copyright 2018 Queen's Printer and Controller of HMSO. All rights reserved.

Version 1 43
Two identical phase III pivotal two-arm RCTs (OPERA I and OPERA II) that compared
ocrelizumab (600 mg) against subcutaneous interferon β-1a (Rebif®, 44 µg) over a 96-
week treatment period.
One phase II four-arm study that consisted of an initial randomized treatment comparison
period (weeks 0 to 24), followed by a non-comparative period (weeks 24 to 96) in which all
patients were switched to ocrelizumab. The four arms compared in the randomised period
were ocrelizumab 600 mg, ocrelizumab 2000 mg, placebo, and intramuscular interferon β-
1a (Avonex®, 30 µg).44 At week 24, all patients apart from those receiving ocrelizumab
2000 mg switched over to receive ocrelizumab 600 mg until week 96. The ocrelizumab
2000 mg group switched to ocrelizumab 1000 mg at week 24 and then to ocrelizumab 600
mg at week 72. This high-dose group is outside of the current licensed indication for
ocrelizumab and is not considered further in the present report.
The OPERA trials were followed by a non-comparative open-label extension (OLE) study in
which, following a screening period to determine eligibility, patients from both the ocrelizumab
and interferon β-1a arms of each trial could receive ocrelizumab 600 mg for up to a further 96
weeks (summarised in CS Figure 2). The OLE study is currently ongoing.
Results of the phase II trial are not presented or discussed in the CS (although details of the
methods are given). The company’s justification for this is that the assessment of the primary
endpoint (total number of T1 gadolinium-enhancing lesions on MRI scans) was shorter than 48
weeks and disease progression was not an endpoint (CS section B.2.2). The NICE scope and
the company’s decision problem do not specify study duration as being a criterion to consider,
but the ERG agrees that the duration of the randomised period of the phase II trial is very short
relative to the chronic nature of MS.
The ERG considers that, provided eligibility criteria relating to study duration are applied
consistently across all the studies (considered further in discussing the MTC eligibility criteria in
section 3.1.7), it is reasonable to exclude clinical effectiveness evidence from the phase II trial
for the following reasons:
The duration of the randomised phase (24 weeks) was considerably shorter than the
OPERA trials (96 weeks);
EMA guidance on the conduct of clinical trials in MS suggests that study duration should
be in the order of years rather than months20;
Copyright 2018 Queen's Printer and Controller of HMSO. All rights reserved.

Version 1 44
Clinical experts advising the ERG concurred that it would be appropriate to exclude the
phase II trial given its short duration;
The sample size (54-55 patients per arm) was considerably smaller than in the OPERA
trials (>400 per arm);
Phase II trial relapse rate and disability progression outcomes are likely to be
underpowered, hindering any comparisons with those in the OPERA trials.
Different interferon β-1a comparators were used in the phase II trial (Avonex: 30μg
intramuscular injection) and OPERA trials (Rebif: 44μg subcutaneous injection) and so
the ocrelizumab-interferon comparisons in the trials are not identical.
For these reasons, the ERG has not included full clinical effectiveness results from the phase II
trial in the present report, but we comment on their consistency with results of the key outcomes
assessed in the OPERA trials. Given that safety is a concern with DMTs, and adverse events
could occur at any time on treatment, we have presented safety results from both the OPERA
trials and their OLE study, and the phase II trial (see section 3.3.9).
The OPERA I and OPERA II trials were identical, double-blind, double-dummy RCTs, with
identical inclusion and exclusion criteria and statistical analysis plans (Table 10). The initial 24-
week randomised period of the phase II trial consisted of an RCT in which investigators were
double-blinded to group assignment except for the interferon β-1a group, which was an open
label arm described in the CS as being a ‘rater-masked control group’. The phase II trial
inclusion criteria were similar to those of the OPERA trials.
The CS provides a CONSORT flow chart that combines details of the populations of both
OPERA trials, without stating the reasons for discontinuations (Figure 3 in CS Appendix D.1.2),
but separate flow charts with reasons for discontinuation are given in the trial publication
appendix.45 Information about all three studies, such as design, population, countries and study
centres are summarised (CS Table 6). However, details of key inclusion/exclusion criteria (CS
Table 7), baseline demographics and disease characteristics (CS Table 8), statistical analyses
(CS Table 9) and outcomes (CS Tables 11 to 15), are summarised for the OPERA trials only.
Copyright 2018 Queen's Printer and Controller of HMSO. All rights reserved.

Version 1 45
Table 10 Characteristics of the ocrelizumab RCTs
Study OPERA I OPERA II Phase II trial
Key inclusion criteria
Aged 18–55 years at screening;
Diagnosis of MS, in accordance with the revised McDonald criteria;8
At least 2 documented clinical attacks within the last 2 years prior to screening;
Or one clinical attack in the year prior to screening (but not within 30 days prior to screening);
Neurological stability for ≥30 days prior to both screening and baseline;
EDSS from 0 to 5.5, inclusive at screening;
Documented MRI of brain with abnormalities consistent with MS prior to screening.
Aged 18–55 years
Diagnosis of RRMS
≥2 documented relapses within 3 years before screening, ≥1 of which occurred within the past year;
EDSS sore of 1–6 points at baseline;
Evidence of previous MS inflammatory disease activity with six T2 lesions or more per MRI, or 2 relapses in the year before screening.
Key exclusion criteria
Primary progressive MS;
Previous B-cell targeted therapies (i.e. rituximab, ocrelizumab, atacicept, belimumab, or ofatumumab);
Disease duration >10 years in combination with EDSS ≤2.0 at screening;
Any concomitant disease requiring chronic treatment with systemic corticosteroids or immunosuppressants during the study;
History of or active primary or secondary immunodeficiency;
Congestive heart failure;
Known active bacterial, viral, fungal, mycobacterial infection or other infection, excluding fungal infection of nail beds;
Infection requiring hospitalisation or treatment with IV antibiotics within 4 weeks or oral antibiotics within 2 weeks prior to baseline visit;
History or known presence of recurrent or chronic infection (e.g. HIV, syphilis, tuberculosis);
History of progressive multifocal leukoencephalopathy;
Contraindication to or incompatibility with IFNβ-1a;
Any previous treatment with alemtuzumab (Campath), anti-CD4, cladribine, mitoxantrone, daclizumab, teriflunomide, laquinimod, total body irradiation, or bone marrow transplantation;
Treatment with cyclophosphamide, azathioprine, mycophenolate mofetil, cyclosporine, methotrexate, or natalizumab within 24 months prior to screening (exexpt if previous natalizumab treatment <1 year);
Treatment with fingolimod or other sphingosine-1-phosphate receptor modulator within 24 weeks prior to screening (except if T lymphocyte count ≥lower limit of normal).
Secondary or primary progressive MS;
Disease duration >15 years in patients with an EDSS of ≤2;
Known history or presence of other neurological or systemic autoimmune disorders;
Treatment with rituximab or lymphocyte-depleting therapies;
Use of lymphocyte trafficking blockers within previous 24 weeks;
Use of β interferons, glatiramer acetate, intravenous immunoglobulin, plasmapheresis, and immunosuppresive treatments within previous 12 weeks;
Use of systemic glucocorticoids within previous 4 weeks;
Intolerance to interferon β-1a.
Copyright 2018 Queen's Printer and Controller of HMSO. All rights reserved.

Version 1 46
Table 10 continued
Based on CS Tables 6 &7 and the phase II trial publication44
The CS, publications and CSRs do not specify how many of the patients in the OPERA trials
and phase II trial were in each country, other than that 26-27% of patients in the OPERA trials
were in the USA. The number of UK centres was very small, with only 2/114 sites (1.8%) in
OPERA I, 4/166 sites (2.4%) in OPERA II and 4/100 sites (4%) in the phase II trial being in the
UK (Table 11).
All three studies were sponsored by F. Hoffmann-La Roche.
The CS states that the demographic and disease characteristics at baseline were similar
between OPERA I and OPERA II, and the ERG concurs. The OPERA trials did not collect
disease type (RRMS/SPMS) at baseline, but the company estimate that based on a post-hoc
analysis using ‘disease progression unrelated to relapses’ as a proxy for SPMS (CS section
Study OPERA I OPERA II Phase II trial
Countries (study centres)
32 countries (114 sites, UK n=2)
24 countries (166 sites, UK n=4)
20 countries (100 sites, UK n=4)
Intervention(s)
Ocrelizumab 600 mg (n=410)
Ocrelizumab 600 mg (n=417)
Ocrelizumab 600 mg (n=55): First treatment cycle 300 mg on days 1 & 15; subsequent cycles (weeks 24, 48 and 72) 600 mg
Ocrelizumab 2000 mg (n=56): Not relevant to the current technology appraisal and not discussed further in this report.
First dose: two of two 300 mg OCR/placebo IV infusions 14 days apart
Subsequent doses consisted of one 600 mg OCR/placebo IV infusion
Maximum 4 doses
Comparator(s)
IFNβ-1a (Rebif®) 44 µg (n=411)
IFNβ-1a (Rebif®) 44 µg (n=418)
Intravenous placebo (n=54)
IFNβ-1a (Avonex®) 30 µg (n=54) once a week open-label treatment
Injections 3x weekly during double-blind treatment period
Week 0-24 – switched to ocrelizumab weeks 24-48
Primary outcome
Annualised relapse rate - ARR Total number of gadolinium-enhancing T1 lesions
Secondary outcomes
% with confirmed disability progression – CDP
% with confirmed disability improvement – CDI
% with no evidence of disease activity – NEDA
Number of gadolinium-enhancing T1 lesions
Number of T2 hyperintense lesion
Number of T1 hypointense lesions
Brain volume change
Multiple Sclerosis Functional Composite score – MSFC
SF-36 Physical Component Summary score
Annualised relapse rate – ARR
% relapse-free
Number of new gadolinium-enhancing T1 lesions
Change in volume of T2 lesions
Number of new or enlarging T2 lesions
Copyright 2018 Queen's Printer and Controller of HMSO. All rights reserved.

Version 1 47
B1.1), more than 90% of patients in the trials could be considered to have RRMS. The phase II
trial differed from the OPERA trials in having a higher frequency of previous DMT use in the
ocrelizumab 600 mg arm; and slightly higher mean EDSS score (possibly indicating slightly
greater disability, although the difference is small) (Table 11).
The CS does not discuss any differences in patient baseline characteristics between the arms
within each study, although these appear to be fairly similar in the OPERA trials. In response to
a clarification request from the ERG, the company stated that in the phase II trial there were
slight numerical differences for duration of MS and gadolinium-T1 lesions between the treatment
arms (clarification 7b). As can be seen in Table 11, there are also differences in previous DMT
use, which was higher in the ocrelizumab 600 mg arm compared to the interferon β-1a and
placebo arms.
Copyright 2018 Queen's Printer and Controller of HMSO. All rights reserved.

Version 1 48
Table 11 Baseline demographic and disease characteristics of included trials
Characteristics OPERA I Trial OPERA II Trial Phase II trial
OCR (n=410)
IFNβ-1a (n=411)
OCR (n=417)
IFNβ-1a (n=418)
OCRa (n=55)
IFNβ-1a (n=54)
Placebo (n=54)
Mean age, years (SD) 37.1 (9.3) 36.9 (9.3) 37.2 (9.1) 37.4 (9.0) 35.6 (8.5) 38.1 (9.3) 38.0 (8.8)
Female, n (%) 270 (65.9) 272 (66.2) 271 (65.0) 280 (67.0) 35 (64%) 32 (59%) 36 (67%)
Geographic region, n (%) United States Rest of the world
105 (25.6) 305 (74.4)
105 (25.5) 306 (74.5)
112 (26.9) 305 (73.1)
114 (27.3) 304 (72.7)
NR
NR
NR
Race, White n (%) a NR NR NR NR 51 (93%) 53 (98%) 52 (96%)
Mean time since symptom onset, years (SD) [min-max]
6.74 (6.37) 6.25 (5.98) 6.72 (6.10) 6.68 (6.13) 6.5
[0.5–20.5] 5.3
[0.8–35.2] 4.8
[0.6–26.2]
Mean time since diagnosis, years (SD) [min-max]
3.82 (4.80) 3.71 (4.63) 4.15 (4.95) 4.13 (5.07) 3.6
[0.1–16.5] 3.3
[0.1–20.2] 2.7
[0.1–19.2]
Mean no. of relapses in previous 12 months (SD)
1.31 (0.65) 1.33 (0.64) 1.32 (0.69) 1.34 (0.73) NR NR NR
Relapses in past 3 years 1 2 3 ≥4
NR NR NR NR
1 (2%)
28 (51%) 16 (29%) 10 (18%)
0
30 (56%) 21 (39%) 3 (6%)
4 (7%)
26 (48%) 15 (28%) 9 (17%)
Without previous DMT, n (%)
n=408 301 (73.8)
n=409 292 (71.4)
n=417 304 (72.9)
n=417 314 (75.3)
26 (47) 37 (69) 38 (70)
With previous DMT, n (%) n=408 107 (26.2)
n=409 117 (28.6)
n=417 113 (27.1)
n=417 103 (24.7)
29 (53) 17 (31) 16 (30)
Interferon 81 (19.9) 86 (21.0) 80 (19.2) 75 (18.0) NR NR NR
Glatiramer acetate 38 (9.3) 37 (9.0) 39 (9.4) 44 (10.6) NR NR NR
Natalizumab 0 1 (0.2) 1 (0.2) 0 NR NR NR
Fingolimod 1 (0.2) 0 4 (1.0) 0 NR NR NR
Dimethyl fumarate 1 (0.2) 0 0 0 NR NR NR
Other 2 (0.5) 3 (0.7) 1 (0.2) 1 (0.2) NR NR NR
Copyright 2018 Queen's Printer and Controller of HMSO. All rights reserved.

Version 1 49
Table 11 continued
Characteristics OPERA I Trial OPERA II Trial Phase II trial
OCR (n=410)
IFNβ-1a (n=411)
OCR (n=417)
IFNβ-1a (n=418)
OCRa (n=55)
IFNβ-1a (n=54)
Placebo (n=54)
Mean EDSS score (SD); median [min-max]
2.86 (1.24) 2.75 (1.29) 2.78 (1.30) 2.84 (1.38) 3.5 (1.5); 3.5
[1.0–6.0] 3.1 (1.5); 2.8
[1.0–6.0] 3.2 (1.4); 3.0
[1.0–6.0]
Gd-enhancing T1 lesions, mean (SD), median [min-max]; (IQR)
NR NR NR NR 3.9 (9.88), 1 [0–46]; (0–3)
2.3 (5.26), 0 [0–24]; (0–1)
1.6 (4.05), 0 [0–25]; (0–1)
No. of Gd-enhancing T1 lesion (OPERA trials: lesions on T1-weighted MRI), n (%)
0
n=405 233 (57.5)
n=407 252 (61.9)
n=413 252 (61.0)
n=415 243 (58.6)
25 (49)
33 (66)
26 (55)
1 64 (15.8) 52 (12.8) 58 (14.0) 62 (14.9) 6 (12) 7 (14) 11 (23)
2 30 (7.4) 30 (7.4) 33 (8.0) 38 (9.2) 6 (12) 2 (4) 2 (4)
3 20 (4.9) 16 (3.9) 15 (3.6) 14 (3.4) 6 (12) 0 2 (4)
≥4 58 (14.3) 57 (14.0) 55 (13.3) 58 (14.0) 8 (16) 8 (16) 6 (13)
Mean no. of lesions on T2-weighted MRI, (SD)
51.04 (39.00) 51.06 (39.90) 49.26 (38.59) 51.01 (35.69) NR NR NR
Mean volume of lesions on T2-weighted MRI, cm3 (SD), median [min-max] b
10.84 (13.90)
9.74 (11.28)
10.73 (14.28)
10.61 (12.30)
13.97 (19.93), 6.69
[0.01–93.78]
13.21 (17.21), 8.25
[0.02–102.91]
8.95 (9.78), 4.77
[0.05-39.92]
Normalised brain volume, cm3 (SD) 1500.93 (84.10) 1499.18 (87.68) 1503.90 (92.63) 1501.12 (90.98) NR NR NR
From CS Table 8 and the phase II trial publication44 NR: not reported. a Phase II trial: conducted mainly in white individuals; others were mostly black (n=6) and Chinese (n=2). b Phase II trial: reported in mm3 converted to cm3 by ERG. Missing data in the OPERA trials:
Number of relapses within the previous 12 months: OPERA I: IFNβ-1a group: n=1; OPERA II: OCR n=1, IFNβ-1a n=1.
Number and volume of lesions on T2-weighted MRI: OPERA I: OCR n=2, IFNβ-1a n=3; OPERA II: OCR n=3, IFNβ-1a n=2.
Normalised brain volume: OPERA I: OCR n=4, IFNβ-1a n=7; OCR n=3, IFNβ-1a n=4.
Mean EDSS score: OPERA I: IFNβ-1a n=1
Copyright 2018 Queen's Printer and Controller of HMSO. All rights reserved.

Version 1 50
Baseline characteristics for disease activity subgroups
The company’s economic analysis utilises data from two subgroups of OPERA trial patients:
those with HA disease and those with RES disease (definitions of these subgroups are provided
in section 3.1.6.4). On request from the ERG, the company provided baseline characteristics for
patients in these subgroups (clarification A9c). Baseline characteristics which differed between
the subgroups are summarised in Table 12.
Table 12 Baseline characteristics of disease activity subgroups in the OPERA trials
Range across both arms of both OPERA trials
HA subgroup RES subgroup Non-HA, non-RES subgroup
Mean age (years) 37 to 38 34 to 36 37 to 38
% from USA 32 to 38 15 to 31 26
% with previous DMT 100 21 to 31 10 to 14
Mean years since symptom onset 8.4 to 9.6 5.2 to 5.9 6.0 to 6.6
Mean years since diagnosis 6.2 to 7.0 2.9 to 4.0 3.3 to 3.9
Mean relapses in previous 12 months 1.2 to 1.4 2.2 to 2.4 1.1 to 1.2
% with no enhancing T1 lesions 49 to 69 19 to 30 65 to 69
Mean number of T2 lesions 53 to 65 53 to 56 47 to 49
Mean normalised brain volume, cm3 1483 to 1499 1505 to 1509 1500 to 1503
Source: Tables 27 to 29 in company’s clarification response
The post-hoc selection of these disease activity subgroups led to small imbalances in patients’
mean age and geographical location, although it is unlikely these would influence clinical
interpretation. As might be expected from the subgroup definitions (section 3.1.6.4), the
proportion of patients with previous DMT, the time since symptom onset, the time since
diagnosis and the proportion with enhancing T1 lesions were greater in the HA group than the
RES group; whilst the mean number of relapses in the previous 12 months was higher in the
RES group (Table 12).
There are larger baseline differences between trial arms within the subgroups (i.e. greater
baseline clinical heterogeneity) than in the ITT population (Tables 27 to 29 in the company’s
clarification response; not reproduced here). However, the selection of the subgroups does not
appear to have introduced any systematic imbalances between the ocrelizumab and interferon
β-1a arms for any of the reported baseline characteristics.
Copyright 2018 Queen's Printer and Controller of HMSO. All rights reserved.

Version 1 51
3.1.3.2 Non-randomised ocrelizumab studies
The company did not search for non-randomised studies of ocrelizumab and no non-
randomised clinical effectiveness studies were included in the CS.
The ERG agrees that focusing on RCTs for comparisons of ocrelizumab clinical effectiveness
against other DMTs is appropriate, as there is relatively good availability of RCT clinical
effectiveness evidence. Well-conducted RCTs are preferable to non-randomised studies for
minimising risks of bias, and RCTs are required for the company’s mixed-treatment comparison.
However, we do not agree that non-randomised studies should have been entirely ignored,
since these may be sources of safety data. As noted above (section 3.1.1), the company does
not explicitly discuss any searches, or a systematic selection process, for identifying safety data,
although clinical experts advising the ERG did not identify any further safety concerns beyond
those reported in the CS.
3.1.3.3 Ongoing studies
The CS refers to the OLE study for OPERA I and II as ongoing and states that there are no
other additional studies which are likely to be available in the next 12 months (CS section
B.2.11). The ERG’s search for ongoing studies identified eight ocrelizumab studies currently
underway which are due to complete during 2018 or 2019 but these are either single-arm
studies and/or do not report interventions or outcomes relevant to the current NICE scope.
3.1.4 Description and critique of the approach to validity assessment
The company has provided a risk of bias assessment for the three ocrelizumab trials: OPERA I,
OPERA II and the phase II trial (Table 13 in CS Appendix D.1.3). The company’s risk of bias
assessment consists of yes/no/unclear answers to the standard NICE risk of bias questions, but
without any explanatory supporting text. The company’s and ERG’s risk of bias assessments for
the ocrelizumab studies are shown in Appendix 2. The ERG’s risk of bias assessment was
conducted by one reviewer and checked by a second reviewer.
In all three studies randomisation appears to have been conducted appropriately, the allocation
sequences were concealed and the study arms had similar baseline characteristics, which are
together indicative of a low risk of selection bias. The double-dummy and double-blind design of
OPERA I and OPERA II indicates that these trials would be at low risk of performance bias.
However, there is a risk of performance bias in the phase II trial since blinding was not applied
Copyright 2018 Queen's Printer and Controller of HMSO. All rights reserved.

Version 1 52
to the interferon β-1a arm. Slight differences in dropout rates between the ocrelizumab and
comparator arms occurred in the trials, but the risk of attrition bias appears to be low for the
ARR and CDP outcomes because the reasons for dropout were not unexpected, the analyses
were by ITT, and missing data appear to have been appropriately analysed. Note, however, that
missing data may not have been appropriately analysed for other secondary outcomes (section
3.1.6).
Overall, the ERG broadly agrees with the company’s assessment that the three ocrelizumab
studies generally are at low risk of bias (Appendix 2). However, several patient-reported
outcomes which were measured in the OPERA trials (EDSS scores, EQ-5D scores, and fatigue
scores) are not reported in the CS or trial publications. Although these were exploratory
outcomes they are relevant to the NICE scope.
3.1.5 Description and critique of the company’s outcome selection
Outcomes employed in clinical trials of MS can be divided into those which assess relapses
(such as the annualised relapse rate – ARR), those which assess disability (such as time to
confirmed disability progression – CDP), and those which provide supporting clinical information
(including MRI scans of MS lesions or brain volume).20, 46, 47 ARR is considered acceptable as a
primary outcome in trials on efficacy of MS therapies, but cannot be taken as a surrogate for
disability progression. The EMA guidance on conduct of clinical trials on MS therefore
recommends that progression of disability should be assessed in addition to ARR, e.g. as a key
secondary outcome.20 So far, MRI scan parameters have not been considered reliable as a
surrogate endpoints for the clinical outcomes and are not recommended as primary endpoints in
pivotal trials evaluating new MS agents. However, MRI is considered a useful tool in pivotal MS
trials to evaluate the consistency of clinical effects.20 The ERG agrees that outcomes reported
by the company are consistent with these considerations and are appropriate for trials
assessing the effectiveness and safety of MS therapies.
The following sections summarise the key features of each of the outcomes that were assessed
in the ocrelizumab trials, noting any limitations to their interpretation. EDSS scores are a
component of several of the outcome measures; an explanation of the EDSS is provided in
Appendix 3.
Copyright 2018 Queen's Printer and Controller of HMSO. All rights reserved.

Version 1 53
3.1.5.1 Relapses
A relapse is typically defined in MS trials as new or worsening neurological symptoms that are
objectified on neurological examination in the absence of fever and last for more than 24 hours,
and have been preceded by a period of clinical stability of at least 30 days, with no other
explanation than MS.47
Relapses were protocol-defined in the OPERA trials as new or worsening neurologic symptoms
that met the following criteria: were attributable to MS only in the absence of fever or infection
(or injury or adverse reactions to medications); persisted for over 24 hours; were immediately
preceded by a stable or improving neurologic state for at least 30 days; and were accompanied
by objective neurologic worsening consistent with an increase of at least half a step on the
EDSS, 2 points in one EDSS functional system score, or 1 point in each of two or more EDSS
functional system scores (pyramidal, ambulation, cerebellar, brainstem, sensory, or visual).
Protocol-defined relapses were confirmed to have met the pre-specified criteria defined in the
protocol by a computerised algorithm that was written before database closure and unblinding of
the data.45
Several caveats have been noted concerning the use of relapses as an outcome measure,
including that: identification of relapses is subjective and therefore perfect treatment blinding is
essential; patient reporting of new or worsening symptoms at scheduled clinic visits may
underestimate the total number of relapses experienced; and regression to the mean may be an
issue in cases where trial inclusion criteria require high relapse rates.47
3.1.5.2 Annualised relapse rate (ARR)
The ARR (primary outcome) was calculated in the OPERA trials as the total number of relapses
for all patients in the treatment group divided by the total patient-years of exposure to that
treatment. Since a protocol-defined relapse required a relatively stable or improving neurological
state of least 30 days, the theoretical maximum number of relapses per patient per year is up to
12.45
3.1.5.3 Confirmed disability progression (CDP)
Confirmed disability progression was defined in the OPERA trials as an increase from the
baseline EDSS score of at least 1.0 point (or 0.5 points if the baseline EDSS score was >5.5)
that was sustained for at least 12 weeks (CDP-12) or for at least 24 weeks (CDP-24).45
Copyright 2018 Queen's Printer and Controller of HMSO. All rights reserved.

Version 1 54
Guidance of the EMA on the conduct of MS clinical trials20 emphasises that disease progression
should be confirmed by two consecutive examinations of the patient by the same physician at
least six months apart, meaning that CDP-24 is preferable to CDP-12 as a measure of disease
progression.
3.1.5.4 Confirmed disability improvement (CDI-12 or CDI-24)
Confirmed disability improvement in the OPERA trials was defined as a reduction from the
baseline EDSS score of at least 1.0 point (or 0.5 points if the baseline EDSS score was >5.5)
that was sustained for at least 12 weeks (or 24 weeks), restricted to patients with a baseline
EDSS score of at least 2.0.
3.1.5.5 No evidence of disease activity (NEDA)
No evidence of disease activity was defined in the OPERA trials as: no relapse, no disability
progression as confirmed at 12 weeks or at 24 weeks, no new or newly-enlarged lesions on T2-
weighted MRI, and no gadolinium-enhancing lesions on T1-weighted MRI by the study end point
(96 weeks), restricted to patients with a baseline EDSS score of at least 2.0.
NEDA assessments at 2 years have been found to be predictive of longer-term absence of
disease progression (e.g. over 7 years) and NEDA-like outcome models are used in clinical
practice to identify responders and non-responders to treatment.47
3.1.6 Description and critique of the company’s approach to trial statistics
Relatively limited information on statistical analyses is reported in the CS and trial publications
and the information provided mainly refers to the primary outcomes. Below we summarise the
overall analysis approach, sample size estimation, analysis populations, statistical tests
employed, methods for handling missing data, and the reporting of analyses in the OPERA trials
based on information presented in the CS, trial publications and CSRs.
3.1.6.1 Statistical analysis strategy
The OPERA trials measured one primary efficacy outcome (ARR) and ten secondary outcomes.
Statistical testing of the primary and secondary outcomes in the OPERA trials followed a
protocol-specified fixed hierarchical testing sequence (Figure 2). This is a means of controlling
type I errors (i.e. the rate of false positives), whereby the pre-specification of the order of
outcomes to be tested prevents the possibility of favourable results from being selectively
Copyright 2018 Queen's Printer and Controller of HMSO. All rights reserved.
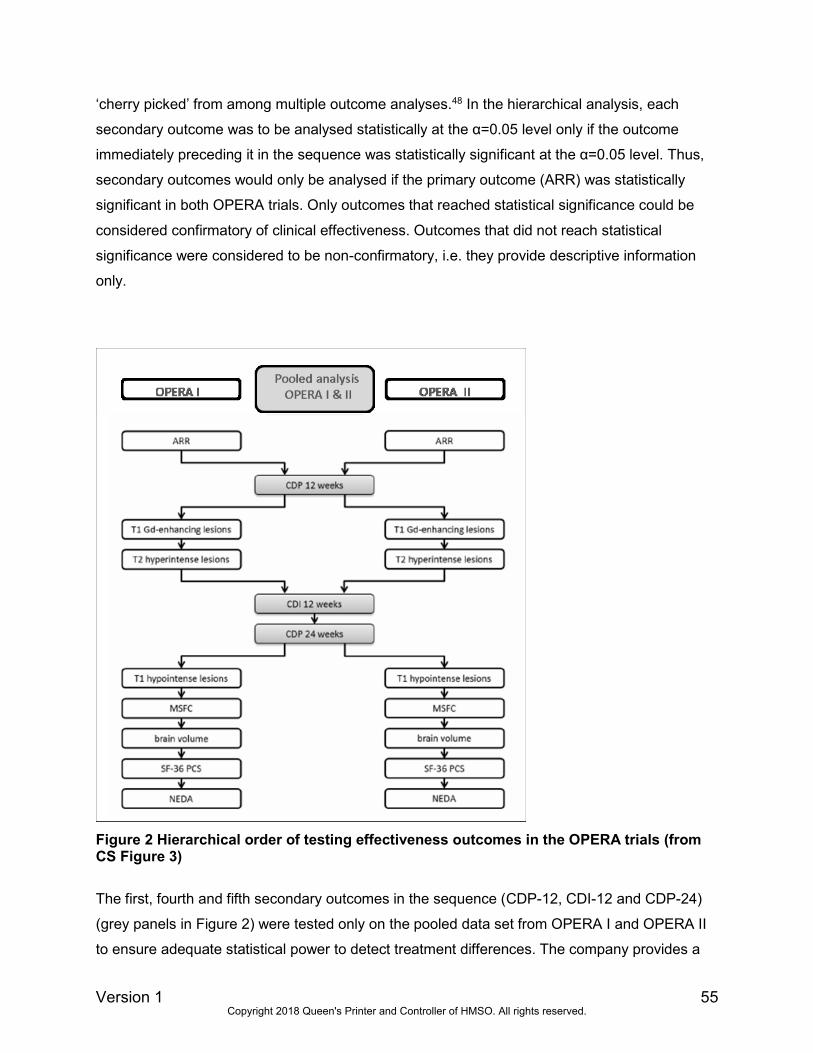
Version 1 55
‘cherry picked’ from among multiple outcome analyses.48 In the hierarchical analysis, each
secondary outcome was to be analysed statistically at the α=0.05 level only if the outcome
immediately preceding it in the sequence was statistically significant at the α=0.05 level. Thus,
secondary outcomes would only be analysed if the primary outcome (ARR) was statistically
significant in both OPERA trials. Only outcomes that reached statistical significance could be
considered confirmatory of clinical effectiveness. Outcomes that did not reach statistical
significance were considered to be non-confirmatory, i.e. they provide descriptive information
only.
Figure 2 Hierarchical order of testing effectiveness outcomes in the OPERA trials (from CS Figure 3)
The first, fourth and fifth secondary outcomes in the sequence (CDP-12, CDI-12 and CDP-24)
(grey panels in Figure 2) were tested only on the pooled data set from OPERA I and OPERA II
to ensure adequate statistical power to detect treatment differences. The company provides a
Copyright 2018 Queen's Printer and Controller of HMSO. All rights reserved.

Version 1 56
justification in the trial publication appendix45 that the characteristics and results of the two
OPERA trials were similar enough for their results to be pooled, which the ERG agrees is
reasonable. The primary efficacy outcome (ARR) and the remaining secondary outcomes had to
be statistically significant in both OPERA trials in order for testing to proceed further in the
hierarchy. For these outcomes the CS states that there was sufficient statistical power within
each OPERA trial to detect relevant treatment differences, without needing to combine data
from the two trials. However, a calculation justifying the statistical power is provided only for the
primary outcome (see sample size estimation below).
The hierarchical approach was based on clinical meaning (referring to the importance to treating
physicians and patients), regulatory requirements, and likelihood of positive outcome (CS
section B.2.4). The CS further states that established endpoints were generally given higher
priority over novel endpoints within the hierarchy. According to the OPERA CSRs, in situations
where outcomes have similar clinical relevance, those with a greater chance of achieving a
statistically significant treatment difference are listed higher in the hierarchy. The ERG agrees
that the company’s hierarchical testing approach and the rationale for the sequence of the
outcomes to be tested are appropriate, and are in line with guidance on addressing multiplicity
in statistical testing in clinical trials.48
3.1.6.2 Sample size estimation
The trial protocol states that the sample size was estimated based on data from previous RRMS
trials. According to the trial publication,45 the sample size for each OPERA trial was based on an
estimated ARR of 0.165 in the ocrelizumab group and 0.33 in the interferon β-1a group. Based
on a 2-sided t-test, it was estimated that 400 patients per arm would provide the trials with 84%
statistical power to maintain a type I error rate of 0.05 and to detect a 50% lower rate with
ocrelizumab than with interferon β-1a, assuming a withdrawal rate of approximately 20%.
3.1.6.3 Analysis populations
According to the CS and trial publication,45 efficacy analyses were performed in the ITT
population. This was defined as all randomised patients, including those who prematurely
withdrew from the study for any reason and for whom an assessment was not performed for
whatever reason. If patients received an incorrect therapy from that intended then they were
summarised according to their randomized treatment. Exceptions are the NEDA and CDI-12
outcomes, for which the analysis was restricted to a subgroup of patients who had a baseline
Copyright 2018 Queen's Printer and Controller of HMSO. All rights reserved.

Version 1 57
EDSS score ≥2 (referred to as a modified ITT population). The ERG requested clarification from
the company on why this subgroup was analysed rather than the ITT population, but the
company’s answer was not clear (clarification A12). The company did, however, provide the
results of a post-hoc ITT analysis of NEDA in their clarification response.
The per protocol population was used in sensitivity analyses for ARR and CDP, although these
are not reported in the CS. The per protocol population included all patients in the ITT
population provided they did not have any major protocol violations that had been deemed to
have the potential to affect the efficacy of the study treatment.
The safety population was used for all summaries of safety data and included all patients who
received any study drug.
Although the wording of the CS and the trial publication implies that the secondary efficacy
outcomes were analysed in the ITT population, the sample sizes reported in CS Table 11 for the
secondary outcomes that were analysed separately in OPERA I and OPERA II are smaller than
the numbers randomised. The proportions of observations missing relative to the ITT population
are summarised in Table 13 and range from around 5% to 38% across the outcomes.
Table 13 Number (%) of missing observations (relative to ITT) for secondary and exploratory outcomes in the OPERA trials OPERA I OPERA II
Outcome (data from CS Table 11
unless stated otherwise)
OCR
N=410
IFNβ-1a
N=411
OCR
N=417
IFNβ-1a
N=418
Gadolinium-enhancing T1 lesions 22 (5.4) 34 (8.3) 28 (6.7) 43 (10.3)
New and/or enlarged T2 lesions 20 (4.9) 33 (8.0) 27 (6.5) 42 (10.0)
New hypointense T1 lesions 22 (5.4) 34 (8.3) 28 (6.7) 43 (10.3)
Brain volume 129 (31.5) 144 (35.0) 130 (31.2) 159 (38.0)
NEDA (baseline EDSS ≥2) 121 (29.5) 120 (29.2) 128 (30.7) 148 (35.4)
MSFC 88 (21.4) 103 (25.1) 109 (26.1) 149 (35.6)
SF-36 PCS 79 (19.3) 102 (24.8) 102 (24.5) 142 (34.0)
The largest proportions of missing observations are for the NEDA outcome (which was
restricted to a subgroup with EDSS ≥2 at baseline), for the change in brain volume (which was
analysed for weeks 24-96 rather than weeks 0-96) and for the patient-reported outcomes of
Copyright 2018 Queen's Printer and Controller of HMSO. All rights reserved.

Version 1 58
MSFC and SF-36 PCS (which reflect that not all patients had both baseline and follow-up
measurements).
As can be seen in Table 13, the proportion of missing observations relative to the ITT population
is consistently higher in the interferon β-1a arm in each trial than the ocrelizumab arm; and the
proportion missing per outcome and per arm is in most cases higher in the OPERA II trial than
in OPERA I. The company clarified (in their ERG report factual inaccuracy check response) that
the imbalance between treatment arms is a result of the higher proportion of patients in the
IFNβ-1a arm who withdrew from treatment.
3.1.6.4 Population subgroups
Subgroups of RRMS patients can be identified who have highly active (HA) and rapidly evolving
severe (RES) disease (section 2.2).The CS reports (section B.2.7) that analyses of ARR, CDP-
12 and CDP-24 were conducted in HA and RES subgroups of patients from the OPERA trials
(the HA subgroup was pre-specified and the RES subgroup specified post-hoc). These
subgroups were defined as shown in Table 14.
Table 14 HA and RES subgroup analysis population definitions
Highly active RRMS group Rapidly evolving severe RRMS group
Treated with interferon or glatiramer acetate for ≥1
year and had:
≥1 relapse in the previous year;
≥1 gadolinium-enhancing T1 lesion at
baseline
≥9 hyperintense T2 lesions at baseline
≥2 relapses in the previous year, and
≥1 gadolinium-enhancing T1 lesion at
baseline, or
an increase in hyperintense T2 lesions at
baseline (changing from 0-5 to 6-9, >9 lesions
or 6-9 lesions to >9 lesions) compared to
previous MRI
In response to a clarification request from the ERG (clarification A9), the company stated that
the definitions of the HA and RES subgroups both relate to disease activity as measured by
relapses or MRI activity, and are not mutually exclusive. The company also commented in their
response that the key difference in the definitions of HA and RES subgroups is in the
specification of the line of therapy. HA disease occurs in pre-treated patients only whilst the
definition of the RES subgroup is not restricted to a line of therapy. As such, there is a small
degree of overlap between the two subgroups in pre-treated patients, and in the OPERA trials
Copyright 2018 Queen's Printer and Controller of HMSO. All rights reserved.

Version 1 59
14% of HA or RES patients could be defined as having both HA and RES disease (clarification
A9).
As noted above (section 2.3), further, pre-specified, subgroup analyses are presented by the
company (CS Appendix E) according to:
analyses for treatment-naïve and treatment-experienced patients;
analyses according to the subgroups ‘active inadequate responders’,
‘active treatment naïve’, highly active inadequate responders’ and ‘ highly active
treatment naïve’ patients (reflecting regulatory definitions);
a range of patient baseline demographic and disease variables.
Most of the subgroups have reasonable sample sizes since they are based on the pooled
OPERA trials data. However, the subgroup analyses should be interpreted with caution because
the large number of comparisons presented in CS Appendix E risks inflating the type I error
rate, as it is easy to selectively ‘cherry pick’ from among the presented comparisons. Note that
these subgroups reported in the CS do not precisely match those specified in the NICE scope
(i.e. people whose disease has responded inadequately to previous treatment, and people who
could not tolerate previous treatment).
3.1.6.5 Statistical tests
Primary outcome (ARR)
The analysis of ARR employed a negative binomial model to test for treatment differences
between ocrelizumab and interferon β-1a, with adjustment according to geographic region (USA
versus rest of the world) and baseline EDSS score (< 4.0 versus ≥ 4.0) (CS Table 10). Log-
transformed exposure time was included in the model as an offset variable for appropriate
computation of relapse rate. This is a standard approach for modelling event-rate data. In
response to a clarification request from the ERG, the company explained (clarification A11) that
stratification by country or region is consistent with the EMA guidance on adjustment for
baseline covariates in clinical trials,49 although they did not explain how the stratification regions
would be expected to influence clinical outcomes, as is recommended by the EMA.49 The
company also clarified that the EDSS cut-off of 4 was included as a stratification factor since
EDSS ≥4 is known to be a strong prognostic factor for future disability progression in RRMS
patients (citing Healy et al. 201350), which the ERG agrees is reasonable.
Copyright 2018 Queen's Printer and Controller of HMSO. All rights reserved.

Version 1 60
The trial publication appendix45 presents results of per-protocol analyses for ARR but does not
explicitly discuss how these differ from the ITT analyses. According to the OPERA CSRs,
several further sensitivity and robustness checks were performed on the primary outcome,
although these are not reported in the CS or trial publication. These included: presentation of
the unadjusted ARR, adjustment according to additional covariates (number of relapses
occurring within 2 years prior to study entry, baseline presence/absence of gadolinium-
enhancing T1 lesions, prior MS treatment, and age [<40, ≥ 40]); running the analyses with a
Poisson model instead of negative binomial; and using multiple imputation to explore the
potential influence of informative dropouts on the results of the primary efficacy analyses.
Secondary and exploratory outcomes
The hazard ratio for the time to confirmed disability progression (CDP-12 and CDP-24) in the
trial arms was estimated using Cox regression and the treatment effect on the outcome was
tested using a two-sided log-rank test stratified by the same covariates as the primary outcome
(CS Table 10). Cox regression assumes proportional hazards in the survival functions under
comparison, but the CS and trial publication do not provide any evidence to support this
assumption. In response to a clarification request, the company provided log cumulative hazard
plots from the OPERA I and OPERA II trials comparing ocrelizumab against interferon β-1a for
CDP-12 and CDP-24 (clarification A17). The company argues that the curves are reasonably
parallel from around 3 months onwards, suggesting the proportional hazards assumption was
not violated for the comparison of ocrelizumab against interferon β-1a and the ERG agrees with
this interpretation.
According to the trial publication appendix,45 numbers of lesions on MRI scans were analysed
using negative binomial regression, which is a standard approach. The CS and trial publication
do not specify the statistical analysis methods employed for the remaining secondary outcomes
or the exploratory outcomes which are relevant to the NICE scope although further information
is reported in the OPERA CSRs. The ERG agrees that the methods appear appropriate and are
consistent with the trial Statistical Analysis Plans.
The OPERA CSRs report eight sensitivity analyses for each of the CDP-12 and CDP-24
outcomes in which the population (ITT or per protocol), data imputation approach, and/or
analysis stratification factors were varied in different combinations. Results of these sensitivity
Copyright 2018 Queen's Printer and Controller of HMSO. All rights reserved.

Version 1 61
analyses are not reported in the CS, but are briefly summarised in the current report (section
3.3.2.1).
3.1.6.6 Methods for handling missing data
The CS does not describe any approaches for handling missing outcomes data in the OPERA
trials to support an ITT analysis. The trial publication appendix45 briefly mentions a sensitivity
analysis was conducted for missing relapse observations and that, for CDP analysis, patients
with an initial disability progression during the trial who discontinued the treatment early and did
not have subsequent visits with EDSS measurements were censored. The OPERA CSRs report
more detailed descriptions of how missing data were analysed for each outcome, including a
range of sensitivity analyses that were undertaken to test the impacts of missing data. Guidance
of the EMA on the conduct of MS clinical trials20 stresses the importance of sensitivity analyses
for evaluating the impact of missing data on effectiveness outcomes. Where available, we have
briefly summarised results of the sensitivity analyses in section 3.3.
3.1.6.7 Analysis reporting
Test statistics and variance estimates are generally reported clearly and appropriately for the
comparisons of trial outcomes, both for the individual OPERA trials and the pooled analyses
across trials. Treatment effects on the ARR are reported as rate ratios whilst effects on CDP are
reported as hazard ratios, which is appropriate. Kaplan-Meier curves are also presented for the
time to CDP. The sample size, mean, standard deviation, 95% confidence interval and p-value
are consistently reported (CS Table 11).
3.1.6.8 Summary
The analysis methods reported in the CS and trial publication are generally consistent with
those specified in the Statistical Analysis Plan for each trial and we have not identified any
serious deviations. However, we note the following limitations in the statistical analysis
approach as reported in the CS and trial publication:
Several secondary outcomes in the OPERA trials (MSFC, SF-36, NEDA, and MRI
outcomes) were stated to have been analysed according to the intention-to-treat (ITT)
principle but the reported sample sizes for these analyses are smaller than the ITT
population, with some systematic differences in missing data evident both between trial
arms and between trials that are not discussed by the company;
Copyright 2018 Queen's Printer and Controller of HMSO. All rights reserved.

Version 1 62
A range of methods was employed for handling missing data in the trials, including a
variety of sensitivity analyses to test the impact of missing data on outcomes, but results
of these are not presented in the CS or trial publication.
3.1.7 Description and critique of the company’s approach to the evidence
synthesis
The CS provides a narrative synthesis of clinical effectiveness evidence, focusing on the
OPERA I and II trials. The characteristics and results of the OPERA trials are presented in
tables and figures and described with accompanying text. The results of the two trials are
presented individually by trial, with results for the CDP and CDI outcomes pooled across the two
trials (described to be a “pre-specified pooled analysis” in CS section B.2.6, though it is not
stated where this pre-specification was originally documented e.g. whether in the trial protocol).
The rationale for pooling was to maintain sufficient power to detect relevant treatment
differences in these secondary outcomes. The CS states that the OPERA trials were identical in
terms of endpoints, inclusion and exclusion criteria, comparator, and statistical analysis plan
(CS section B.2.3). Pooling the results for these outcomes is therefore a reasonable approach in
the ERG’s opinion.
As the OPERA trials only compared ocrelizumab with interferon β-1a 44 µg it was necessary for
the company to conduct MTC analyses to facilitate indirect comparisons with the other DMTs
specified in the scope of the appraisal. CS section B.2.9 and CS Appendix sections D.1.1 to
D.1.4 report the methods for, and results of, the MTCs. In the following sub-sections below we
summarise and critique the methods used to produce the MTCs. The ERG’s critical appraisal
checklist for the MTC analyses is given in Appendix 4.
3.1.7.1 Mixed treatment comparisons (MTC) overview
The CS reports a total of 23 separate MTC networks, which vary according to the patient
population (ITT or subgroup), exclusion of comparators not in the NICE scope (restricted
networks), investigation of the impact of trial duration (meta-regression), and inclusion of an
outlier study. The network analyses conducted were as follows:
ITT population (4 MTCs);
MS patient subgroups: HA (3 MTCs) and RES (3 MTCs);
Copyright 2018 Queen's Printer and Controller of HMSO. All rights reserved.

Version 1 63
Restricted network 1 (ITT population) (4 MTCs);
Restricted network 2 (ITT population) (4 MTCs);
Meta-regression on trial follow-up duration (ITT population) (4 MTCs);
Inclusion of the INCOMIN trial for the CDP-24 outcome (1 MTC).
ITT population MTCs
MTCs were conducted for four outcomes: ARR, CDP-12, CDP-24 and all-cause discontinuation,
which all inform the company’s economic model (CDP-12 is used in the base case economic
model, and CDP-24 is used in a sensitivity analysis) (section 4.3.4). Due to a lack of published
data, the all cause-discontinuation outcome was not analysed for the HA or RES subgroups of
RRMS. In the economic model, therefore, ITT MTC results for all-cause discontinuation were
applied for the HA and RES subgroups (section 4.3.4.3). The CS states that MTCs were also
conducted for the outcomes of relapse free proportion, proportion of patients with serious
adverse events, and discontinuation due to adverse events, but these outcomes are not
reported in the CS as they are not considered relevant to the economic evaluation (CS
Appendix D.1.1). As such, ocrelizumab has not been compared against DMTs (apart from
interferon β-1a 44 µg in the direct comparison in the OPERA trials) for the remaining outcomes
in the NICE scope: freedom of disease activity; MS symptoms (e.g. fatigue, cognition and visual
disturbance); adverse effects; HRQoL; and mortality.
Sensitivity analyses were conducted for the ITT population MTCs to explore the impact of
variations to base case assumptions, using alternative prior distributions and a fixed effects
rather than a random effects model.
Subgroup MTCs
MTCs were constructed using subgroup data from the included trials to estimate effects for the
two subgroups of relevance to the NICE scope, i.e., HA and RES RRMS. The ERG and the CS
(CS section B.2.9.1) both urge caution in the interpretation of these analyses for reasons
discussed below, including the sparsity of the data, the post-hoc nature of the subgroups in the
trials, lack of consistency in the definitions of the subgroups across trials, and the observational
nature of the subgroup data.
Copyright 2018 Queen's Printer and Controller of HMSO. All rights reserved.

Version 1 64
Restricted network MTCs
The SLR of clinical effectiveness was conducted to support HTA submissions in a number of
countries, and it therefore included some comparators that are not within the NICE scope. The
two restricted network MTCs assess the impact of excluding these comparators. The CS does
not explicitly define the difference between what they refer to as restricted networks 1 and 2.
Footnotes to CS Appendix Figure 8 show that restricted network 1 excludes cladribine and 7mg
teriflunomide, and restricted network 2 excludes cladribine, 7mg teriflunomide, daclizumab,
fingolimod, and natalizumab. The ERG presumes that daclizumab is excluded as it is permitted
in the NICE scope only if the disease has been previously treated with disease-modifying
therapy, and alemtuzumab is contraindicated or otherwise unsuitable. Of the two networks,
restricted network 2 most closely adheres to the NICE scope. The CS concludes that inclusion
of comparators outside of the NICE scope ************************************************. Based on
this analysis (results are summarised below in section 3.3.8.2), the ERG agrees that the ITT
population MTCs are appropriate to inform the assessment of clinical effectiveness and cost
effectiveness.
Meta-regression
The MTCs synthesise results from different time points, and the analysis methods assume that
the results are not time dependent (see section 3.1.7.4 below). Network meta-regression was
therefore conducted to validate this assumption.
Inclusion of the INCOMIN trial
The base case MTC for CDP-24 excluded the INCOMIN trial,51 which compared interferon β-1b
to interferon β-1a, as this was considered to be an outlier by clinical experts (CS section B.2.9).
The CS cites a meta-analysis comparing studies of interferon-β products in RRMS, of which two
(one being the INCOMIN trial) found significant differences in clinical efficacy between
interferon-β products, whereas the remaining five studies showed equal clinical efficacy
between products.52 The MTC in the CS found inconsistency between CDP-12 and CDP-24
MTC inputs for interferon β-1b (with INCOMIN being the only trial of interferon β-1b informing
CDP-24). The CS reports that a separate published MTC21 also excluded the INCOMIN trial, on
grounds of inconsistent results between ARR and CDP-24. CS Appendix section D.1.4 (Figure
19) provides a forest plot showing the CDP-24 results for of the base case analyses, and a
sensitivity analysis in which the INCOMIN trial was included. Based on the results of this
analysis (summarised in section 3.3.8.2), the ERG concludes that
Copyright 2018 Queen's Printer and Controller of HMSO. All rights reserved.

Version 1 65
************************************************************************************ (though the CS does
not comment on this).
3.1.7.2 Trials included in the MTC analyses
A total of 46 eligible studies were identified from the company’s SLR of clinical effectiveness
(section 3.1.3), of which 33 provided data for inclusion in the ITT networks (CS Table 16) and 16
of these contributed HA and/or RES subgroup data (CS Table 17) (NB: CS Table 17 shows that
14 rather than 16 trials contributed data to these subgroups). The numbers of trials and DMTs
included in the company’s MTC analyses are summarised in Table 15 and further details of the
trials that contributed data to each analysis are provided in Appendix 5. As explained below, in
order to enable MTC networks to be formed for the HA and RES subgroup analyses, the
company linked the trials providing subgroup data via trials that provided ITT data for the
‘ABCR’ DMTs (see ‘Inclusion/exclusion criteria’ below). For the subgroup analyses the number
of trials that provided subgroup data (as shown in CS Table 17) is therefore a subset of the total
number of trials in the network.
Table 15 Number of treatments and trials included in MTC networks
Analysis network
Outcome
ARR CDP-12 CDP-24 All-cause
discontinuation
ITT and meta-
regression on trial
duration
Trials, n 30 22 21 26
DMTs, n 17 17 15 17
HA subgroup Trials, n 8 (21 a) 9 (16 a) 9 (15 a) NA
DMTs, n 7 (10 a) 7 (10 a) 8 (9 a) NA
RES subgroup Trials, n 9 (22 a) 9 (16 a) 4 (10 a) NA
DMTs, n 8 (11 a) 10 (13 a) 5 (7 a) NA
Restricted (ITT)
network 1
Trials, n Not reported Not reported Not reported Not reported
DMTs, n 14 14 12 14
Restricted (ITT)
network 2
Trials, n Not reported Not reported Not reported Not reported
DMTs, n 11 11 9 11
NA: Not applicable (subgroups were not analysed for this outcome).
a Numbers in brackets are the total number in the network, including the linking trials that provided ITT
ABCR data (details in Appendix 5).
Copyright 2018 Queen's Printer and Controller of HMSO. All rights reserved.

Version 1 66
Inclusion/exclusion criteria
CS Appendix Table 3 describes the inclusion and exclusion criteria for the company’s
systematic review of clinical effectiveness. As reported above, 46 trials met the inclusion criteria.
A post hoc feasibility assessment was conducted in which additional inclusion criteria for the
MTC were applied (CS Appendix D.1.1 Table 9), resulting in the exclusion of 13 trials from the
ITT MTC.
The ERG asked the company to clarify the rationale for the post hoc feasibility assessment
given that a systematic review inclusion/exclusion process had been followed (clarification
A14d). The company responded that certain requirements for building an MTC network (e.g.
knowing which outcomes have been measured) can only be informed following a systematic
review of the available evidence. This was necessary to inform the decision on an appropriate
trial duration cut-off (i.e. 48 weeks) since it became apparent from the systematic review that
there was large variation in follow-up duration across the trials (12 to 240 weeks). The ERG
agrees that, in principle, the feasibility of building an MTC network needs to be informed by a
systematic assessment of the available evidence. We also agree that additional
inclusion/exclusion criteria can be applied providing there is a sound clinical rationale (and not
based on knowledge of the results of the trials). However, the potential use of such a feasibility
assessment should be described a priori in a systematic review protocol. No such protocol is
cited in the CS but, as we did not identify any additional relevant studies from an update search
(see section 3.1.1), the MTC is unlikely to have omitted relevant evidence.
Following the company’s feasibility assessment, 13 trials were excluded, for the following
reasons (CS Appendix Table 9):
11 trials were excluded as they had a controlled treatment duration of less than 48
weeks;
Two trials were excluded as having doses or regimens which are not approved or are
‘ineligible’ (presumably according to EMA licensing, although this is not specified);
Specific arms of six further trials were excluded as having ineligible regimens, but this
did not result in these trials being fully excluded as they contained other eligible arms.
Based on further information provided by the company (clarification A14), the ERG agrees that
the study designs of the 13 excluded trials match the exclusion criteria specified by the
company in CS Appendix Table 9.
Copyright 2018 Queen's Printer and Controller of HMSO. All rights reserved.

Version 1 67
The CS states that studies with a randomised controlled treatment duration period of less than
48 weeks were not considered sufficiently robust to demonstrate treatment effect on disability
progression in a chronic disese characterised by periods of exacerbetions and remissions (CS
section B.2.9). Excluding trials of duration less than 48 weeks resulted in exclusion of the
ocrelizumab phase II trial, which had a randomised comparison duration of 24 weeks.
The ERG agrees that excluding trials that had a controlled comparison duration of less than 48
weeks (i.e. also excluding the ocrelizumab phase II trial) is appropriate, for several reasons (as
stated above in section 3.1.3.1). In summary:
48 weeks is a short time relative to the chronic course of RRMS (of the 11 trials
excluded on having a short duration we note that none had a controlled comparison
period exceeding 36 weeks);
EMA guidance on the conduct of MS trials20 recommends that outcomes should be
assessed over periods of years rather than weeks or months;
Clinical experts advising the ERG concurred that longer-term clinical data are likely to be
more reliable, given heterogeneity in the frequency and timing of relapses and
remissions among patients with RRMS; as such, excluding trials less than 48 weeks in
duration would be reasonable, since numerous longer-term studies are available;
The clinical experts also pointed out that phase II trials in MS typically have MRI
outcomes as their primary endpoint; since MRI outcomes do not inform the company’s
economic analysis, these are less likely to be directly informative than phase III trials.
Note that the above considerations refer to clinical effectiveness outcomes, not safety outcomes
(adverse events were not analysed in MTCs but are reported separately in the CS, including for
the ocrelizumab phase II trial; for details see section 3.3.9 below).
The company mentioned in their clarification letter that the Etemadefir 2006 trial was excluded
from MTC analyses of ARR but do not provide a clear justification (clarification A14).
Network structure
Figure 3 illustrates the network structure for the MTC, using the outcome of ARR in the ITT
population as an example (the CS provides network diagrams for the other outcomes).
Copyright 2018 Queen's Printer and Controller of HMSO. All rights reserved.

Version 1 68
Ocrelizumab is connected to the network via interferon β-1a 44 µg (the comparator treatment in
the OPERA trials), and then to a set of treatments including teriflunomide, glatiramer acetate,
alemtuzumab (the CS refers to this as ‘jump no. 1’, with each jump representing the distance
from ocrelizumab), and in turn to a second set of treatments including daclizumab, fingolimod,
placebo and subcutaneous interferon-β 1b (jump no. 2), and to a final set of treatments
including cladrabine, natalizumab, dimethyl fumarate, glatiramer acetate 40mg, and pegylated
interferon β (jump no. 3).
NB. The edge width of the lines is proportional to the number of inputs for each comparison.
Figure 3 Example MTC network diagram for ARR ITT (CS Figure 7)
As can be seen from Figure 3 the network includes a number of pairwise comparisons, and
some closed loops (i.e. where each comparison has both direct and indirect evidence). For the
ARR ITT network the company confirmed that there were 13 pairwise comparisons that were
informed by at least two trials, and 14 comparisons informed by only one trial (clarification
A20a). Corresponding figures for the CDP-12 ITT network were 7 and 17, respectively, for CDP-
24 ITT the figures were 6 and 12 respectively, and for all-cause discontinuations ITT the figures
were 8 and 20, respectively. The majority of comparisons across the ITT MTCs (63/97; 65%)
Copyright 2018 Queen's Printer and Controller of HMSO. All rights reserved.

Version 1 69
were, therefore, informed by a single trial. The ERG notes that the maximum number of trials
included in any of the pairwise comparisons was three.
The MTC network structure varies in size and shape according to different outcomes and
subgroups, with the highest number of jumps being three and the lowest two. Of note, the CS
reports that due to sparsity of data it was not possible to connect the networks for the HA and
RES subgroups. To connect these networks the company used ITT data from ‘ABCR’
treatments (IFNβ-1a [Avonex], IFNβ-1b [Betaferon], glatiramer acetate [Copaxone], and IFNβ-
1a [Rebif]). The underlying assumption is that, for these treatments, the treatment effect
observed in the ITT population would be the same as the treatment effects in the subgroup
populations (CS section B.2.9). The CS states that in the OPERA trials the results for the ITT
population and the subgroups were consistent with each other for CDP outcomes, but not for
ARR (for the OPERA trials subgroup results see section 3.3). The ERG suggests caution in the
interpretation of the results of the subgroup analyses as the assumption of consistency in
effects between ITT populations and subgroups is not fully supported.
Data sources used in the MTC analyses
Although the CS provides information about the MTC networks, it does not report which trials
contributed to each specific MTC analysis and does not report the MTC input data that were
used from each trial. The company clarified which trials were included in the ITT and subgroup
analyses for each outcome, and the data that were used from these trials, in Tables 30 to 39 of
their clarification response. Based on this information, we have summarised the trials that
contributed to each MTC analysis in Appendix 5. For the ITT analyses of each outcome the
company used individual trials as input data for their MTCs, but for the HA and RES subgroup
analyses data from several trials were pooled. The CS does not provide a justification for
pooling trials, but the company commented that “most inputs to the subgroup MTCs were as
pooled estimates as no individual data were available” (clarification A20b).
For the ITT analysis of CDP-12, the company mentions that results for alemtuzumab from the
CARE MS-I and CARE MS-II trials were unavailable and so the CDP-12 was instead obtained
from an MTC reported in a reimbursement dossier of the Haute Autorité de Santé (HAS) which
combined the CARE MS-I, CARE MS-II and CAMS223 trials (stated in the paragraph preceding
Table 10 in CS Appendix D). The company has not provided a reference for the HAS dossier
and does not provide any details or critique of the MTC that it contains. The ERG has been
Copyright 2018 Queen's Printer and Controller of HMSO. All rights reserved.

Version 1 70
unable to locate the dossier and therefore we cannot comment on the robustness of the HAS
MTC results that the company has used.
Note that CS Table 17 states (in a footnote) “IFN + GA summed” which refers to the ARR and
CDP-24 outcomes of the CARE MS-II trial and the CDP-12 outcome of the pooled FREEDOMS
and FREEDOMS II trials. We assume this to be an error, since these trials did not include both
interferon and glatiramer acetate arms.
Risk of bias in the trials
The company conducted a risk of bias assessment on the 46 trials identified in their SLR of
clinical effectiveness (i.e. including the 13 trials that were subsequently excluded from MTC
analyses). Judgements are summarised in CS section B.2.9.1 and also presented in a colour
coded table (CS Appendix D.1.3, Table 13), although the CS does not provide any text justifying
each judgement. The CS states that the Cochrane risk of bias criteria were used; however, the
ERG notes that the criteria used are the quality assessment criteria recommended by NICE in
the user guide for company evidence submissions (though these cover similar aspects of bias to
the Cochrane tool). It is not stated whether risk of bias judgements for each trial were made by a
single person or by more than one person. The CS notes that, where details were reported,
trials were considered adequate in terms of randomisation procedures, concealment of
treatment allocation and balance of prognostic variables at baseline. However, there is some
risk of bias due to lack of double blinding, unexpected drop-outs or missing/inappropriate ITT
analyses. The CS also notes that risk of bias assessment was limited by the availability of
information for each of the trials.
We note that, based on CS Appendix Table 13, the item with the greatest number of unclear
judgements was concealment of treatment allocation (reflecting information in the trials). This
therefore raises the possibility of selection bias in a number of the trials, though it should be
noted that most of the trials were judged to be balanced in prognostic factors at baseline
between randomised study groups.
It was not feasible for the ERG to independently assess and check the risks of bias in all of the
comparator trials listed in CS Appendix Table 13 within the timescale available for this
technology appraisal (for our assessment of bias risk in the ocrelizumab trials see section
3.1.4). However, we noted that for up to 31 of the 46 trials included in the company’s SLR
Copyright 2018 Queen's Printer and Controller of HMSO. All rights reserved.

Version 1 71
independent ERG reports are available from previous NICE DMT technology appraisals which
provide assessments of the risks of bias. We compared these independent risk of bias
judgements from other ERG reports against the company’s judgements in CS Appendix Table
13 to provide an indication of whether the company’s risk of bias judgements are likely to be
generally appropriate (further details are given in Appendix 6). This comparison indicated good
agreement between the company’s and the independent ERG assessments of risk of bias
relating to the different sources of selection bias as as determined by the first 3 questions in CS
Appendix Table 13 (randomisation, allocation concealment and balance of prognostic factors). It
was not possible to compare independent ERG and company assessments of the risk of
performance bias due to lack of blinding (question 4) since the ERG reports differed in how they
addressed this question. For the remaining questions about imbalances in dropouts (question
5), selective reporting of outcomes (question 6) and use of ITT analysis (question 7) there was
moderate agreement between the company’s risk of bias of bias judgements and those
provided by independent ERGs (Appendix 6). Overall, these findings give confidence that the
company’s judgements about the risk of selection bias in the comparator trials (including the
large number of ‘unclear’ judgements for allocation concealment) are likely to be appropriate;
there was less consistency between the company and independent ERGs in the judgements
about the risks of other types of bias.
3.1.7.3 Populations represented in the MTCs
The CS tabulates characteristics of the populations included in the MTC analyses (CS Appendix
Table 12) but does not comment on how reflective these are of patients with RRMS in NHS
clinical practice. The company also does not explicitly discuss whether there are any
imbalances in prognostic variables across the trials included in the MTCs (this is important when
considering the similary assumption of MTC analysis – see section 3.1.7.5 below). According to
the literature,9, 10 patient characteristics which confer a poorer MS prognosis include (among
others) older age, male sex, African American or non-White race, multifocal lesion onset, high
lesion load at baseline, more than one functional system affected, early cortical involvement,
and onset with motor, cerebellar, or bladder/bowel symptoms. Not all of these characteristics
are reported by the company but we have summarised here the patient population
characteristics that are given, as reported in CS Appendix D (most of the data are from CS
Appendix Table 12).
Copyright 2018 Queen's Printer and Controller of HMSO. All rights reserved.

Version 1 72
Proportion of patients with RRMS and SPMS
The company state that the scope of their SLR was patients with relapsing forms of MS, but the
eligibility criteria of the SLR allowed mixed populations of MS (i.e. RRMS and SPMS) to be
included as long as at least 75% had RRMS (CS Appendix D). The company does not comment
on whether the ≥75% cutoff could be applied reliably, given that the proportions with RRMS and
SPMS were not always reported in the trials. Of the 33 trials included in the company’s MTC
analyses, 26 (79%) specified relapsing MS or RRMS as an inclusion crierion (without specifying
any additional MS types in the inclusion criteria), and 15 (45%) specified progressive forms of
MS as an exclusion criterion (12 trials specified the type of MS in both inclusion and exclusion
criteria) (CS Appendix Table 11). However, only four trials explicitly stated that SPMS was an
exclusion criterion. The company acknowledges that there may be heterogeneity in the trial
populations included in the MTCs in terms of the proportions with RRMS and SPMS. The
eligibility criteria indicate that patients with PPMS were not eligible for any of the included trials.
Age
According to the trial eligibility criteria, the majority of the 33 trials included in the company’s
MTCs were on patients aged 18-55 years (18 trials), with some covering the range 18-45 years
(1 trial), 18-50 years (7 trials), 18-60 years (2 trials) or 18-65 years (1 trial). The trial by
Bornstein (1987) had a younger population than all other trials (age 20-35 years) whilst two
trials did not clearly report the age range. The mean age (reported in 30 trials) ranged from 31.1
to 40.6 years (CS Table 12). The MTC population therefore appears broadly representative of
adults who would be treated with DMTs. As noted above, experts advising the ERG suggested
that some patients aged up to 65 would receive the stronger DMTs including ocrelizumab, but
only one trial included patients up to this age.
Sex
All trials had a majority of female patients, which reflects the differential disease prevalence
between the sexes. The proportion male (reported in all 33 trials) ranged from 19% to 44%.
Treatment experience
The company does not explicitly define treatment naïve or treatment experienced, although they
refer to patients as being ‘purely naïve’ (clarification A22). From the information reported in CS
Appendix Table 12 it appears that patients classed as treatment-naïve could have received
treatment with corticosteroids but not with DMTs or immunosuppressants. Of the 33 trials
Copyright 2018 Queen's Printer and Controller of HMSO. All rights reserved.

Version 1 73
included in MTC analyses, 24 (73%) are listed in CS Appendix Table 12 as including treatment-
experienced patients. However, the company clarified that 13 of these 24 trials (including
OPERA I & II) actually included mixed populations of both treatment-naïve and treatment-
experienced patients (clarification A22). In these 13 mixed-population trials, the proportion of
patients who were treatment-experienced at baseline ranged from 6% in the BRAVO trial to
74% in the FREEDOMS II trial. Within each of these mixed-population trials the proportions of
patients who were treatment-experienced were similar across the trial arms, except in the
TENERE trial where there were 12.3% more treatment-experienced patients in the interferon β-
1a arm than the teriflunomide 14mg arm (clarification A22). The ERG notes that a further trial
(Calabrese 2012) which is not mentioned in the company’s clarification, also included a mixed
population, whereby a treatment-experienced ‘reference’ placebo group was compared against
three treatment-naïve DMT arms (CS Appendix Table 12). The company does not discuss the
implications of these within-trial imbalances for interpretation of the MTC results (i.e. whether
they could have introduced bias due to the within-trial comparison being confounded with the
proportion treatment-experienced). However, we note that according to CS Appendix Table 30
the placebo arm of the Calabrese 2012 trial does not appear to have been included in the ARR
MTC, although no explanation is provided.
The company consider the mixed treatment experience populations in the MTCs to be
appropriate since the anticipated licence for ocrelizumab covers both treatment-naïve and
treatment-experienced patients, and the treatment effect of ocrelizumab compared to interferon
β-1a was observed in both treatment-naïve and treatment-experienced patients (clarification
A22). The ERG considers that this is a reasonable justification from the perspective of the
ocrelizumab-interferon comparison; however, the company does not provide a justification that
the relative effectiveness of other DMTs in the MTC networks would also be independent of
patients’ treatment experience.
Relapse rates
The mean number of relapses in the previous 2 years before study entry (reported in 23 trials)
ranged from 1.38 to 3.6. The mean number of relapses in the previous year before study entry
(reported in 19 trials) ranged from 1.15 to 1.8 (CS Appendix Table 12). These rates generally
reflect the trials’ eligibility criteria which usually specified that patients had to have had at least
one relapse in the previous year or at least two in the previous 2 years before study entry (CS
Appendix Table 11).
Copyright 2018 Queen's Printer and Controller of HMSO. All rights reserved.

Version 1 74
EDSS scores
Although the EDSS is an ordinal scale, the company has preferentially reported mean EDSS
scores from the trials. The mean EDSS score at baseline (reported in 31 trials) ranged from 1.3
to 3.0. Where reported, median EDSS scores were in the range 2.0-2.5. These scores reflect a
range from minimal disability in one functional system (EDSS 2.0) to moderate disability in one
functional system, or mild disability in three or four functional systems, with no impairment to
walking (EDSS 3.0) (Appendix 3).
Time since first symptoms
The CS does not report the time since diagnosis but instead provides the time since first
symptoms. It is unclear how this was defined and we assume that is is likely to be quite a
variable measure, given that MS can present with a range of symptoms of variable intensity and
patients might not accurately recall the time of onset. The mean time since first symptoms
(measured in years) was reported in 22 trials (CS Appendix Table 12). In 21 of these trials the
range was from 1 to 10.6 years. The remaining trial (Stępień 2013) is an outlier, with time since
symptom onset in the two trial arms being 19.1 and 23 years.
3.1.7.4 MTC statistical approach
The statistical method used for conducting the MTC analyses was a standard Bayesian random
effects model, based on methods specified in NICE Decision Support Unit Technical Support
Document 2.53 The JAGS and R statistical software programmes were used to conduct the
analysis and the company provided the programming code on request from the ERG
(clarification A13). CS appendix D 1.1.1 describes the statistical procedures used. The CS does
not report procedures for checking model convergence (number of chains) and burn in. The
NICE DSU Technical Support Document 253 states that the number of iterations for burn-in and
posterior sampling should be reported. The statistical models used varied according to the
outcome measure, as follows:
Poisson model for ARR. A generalized linear model with a log link and Poisson
likelihood, with a rate ratio reported as the chosen outcome statistic. The Poisson model
accounts for the length of the observation period and assumes that the relapse rate is
constant over time (given that the MTC synthesises results from different time points).
Survival model for CDP-12 and CDP-24. A generalized linear model with identity link and
normal likelihood was used, with a hazard ratio as the chosen outcome statistic.
Copyright 2018 Queen's Printer and Controller of HMSO. All rights reserved.

Version 1 75
Binomial model for all-cause discontinuation. A generalized linear model with a logit link
and binomial likelihood was used, with an odds ratio as the chosen outcome statistic.
The survival model for the CDP outcomes assumes that hazards are proportional (CS section
B.2.9.1). The ERG requested clarification from the company on the justification for this
assumption (clarification A17). The company provided log-cumulative-hazard plots for the
OPERA I and II trials for CDP-12 and CDP-24 and state that the curves are “reasonably parallel
from around 3 months onwards. The company suggests that, on this basis, it is reasonable to
assume that proportional hazards assumption will also hold for other trials included in the MTC.
However, whilst the ERG agrees that the proportional hazards assumption appears reasonable
for the comparison of ocrelizumab against interferon β-1a (section 3.1.6.5), it is unclear whether
such an assumption is appropriate for the other DMT comparisons in the MTCs.
The random effects binomial models and survival models used an informative prior distribution
for the between-study variance, selected from a study which devised a novel set of predictive
distributions for the degree of heterogeneity for use as prior distributions for heterogeneity in
meta-analyses.54 The choice of prior was explored by using a vague prior in sensitivity analysis.
For the Poisson model (ARR) the CS reports that a good informative prior was not available for
the between-study variance, and hence for the base case a vague prior was used (CS Appendix
D 1.1). An alternative vague prior was compared in a sensitivity analysis. The CS reports model
fit data showing the deviance information criterion (DIC) values for the priors considered in the
base case and the sensitivity analyses. The base case random prior distributions used are
those with the lowest DIC values. The DIC is commonly used to compare the fit of Bayesian
statistical models, whereby the model with the smallest DIC is estimated to be the model that
would best predict a replicate dataset which has the same structure as that currently
observed.55 The ERG considers that the company has clearly reported and justified their choice
of prior distributions and have appropriately explored alternatives in sensitivity analyses.
The company provided additional information on the statistical procedures used in the network
meta-regression (clarification A19). For each outcome measure the MTC model was extended
to incorporate follow-up time as a continuous covariate, based on NICE Decision Support Unit
(DSU) Technical Support Document 3,56 which the ERG agrees is an acceptable standard
approach. The regression covariate was centred on the mean trial duration, with the ‘same
interaction effect for all treatments’ model used (defined as in the NICE Technical Support
Copyright 2018 Queen's Printer and Controller of HMSO. All rights reserved.

Version 1 76
Document56), and placebo as the reference treatment. The company state this was a pragmatic
decision based on the available data; they acknowledge that this requires assumptions to be
made on the form of the treatment and study duration interaction but do not discuss the
assumptions or their plausibility. The CS reports that the meta-regression provided similar DIC
values to the base case (ITT) MTC for the outcome of CDP-12, but for the remaining three
outcomes the meta-regression did not provide a better fit (the meta-regression increased the
DIC values by more than three units). The company provided forest plots comparing the results
of the meta-regression with the standard MTC (clarification A19) which show similar results. The
company’s conclusion is that the differences in study duration had negligible impact on results
and supported the base case. The ERG agrees with this interpretation based on the forest plots
provided.
Definitions of outcomes included in the MTC analyses
ARR
The ERG noted that the trials included in the MTCs used different definitions of relapse when
estimating the ARR (e.g. any relapses, confirmed relapses, protocol-defined relapses, qualifying
relapses) but the CS does not discuss this. We therefore requested clarification from the
company on whether this variation in definitions might influence interpretation of the MTC
results. The company provided a table showing the definitions ARR and relapse that were used
for each of the trials included in the MTCs (clarification A16d and Table 40 in the clarification
response). The company also provided a table showing the absolute ARR and the ARR rate
ratio for the comparison of ARR between DMTs both for protocol-defined relapses and for all
relapses (Table 15 in the clarification response). The ERG agrees with the company’s assertion
that the two definitions of relapse affected the absolute ARR but had only a small impact on the
rate ratio. For example, absolute ARR estimates in the CombiRx trial varied from 0.16 to 0.32 in
the interferon β-1a arm and from 0.11 to 0.23 in the glatiramer acetate arm depending upon the
ARR definition, whilst the corresponding difference in the ARR rate ratio was only 0.03.
In addition to the comparison of ARR based on protocol/non-protocol defined relapses
mentioned above, the company reported that a sensitivity analysis had been conducted within
the TENERE trial that compared definitions of ARR based on confirmed relapses and all
relapses (i.e. both confirmed and non-confirmed) (clarification A16b). Results of the sensitivity
analysis (Table 13 in the clarification response) show that these different definitions of ARR had
negligible impact on the absolute ARR and the ARR rate ratios.
Copyright 2018 Queen's Printer and Controller of HMSO. All rights reserved.

Version 1 77
The ERG agrees that, based on the results of these sensitivity analyses, the different definitions
of ARR would appear to have relatively limited impact on the ARR ratios which are used in the
company’s MTC analyses. A caveat is that these sensitivity analyses did not capture the full
range of definitions of ARR used in the trials and so it is unclear how representative they are.
CDP
The CS does not explicitly state how CDP was defined in the trials that were included in the
MTC analyses and the ERG requested clarification on this. The company provided tables
showing the definitions of CDP-12 and CDP-24 for each of the trials included in the MTCs
(clarification A18 and Tables 41 and 42 in the clarification response). The company commented
that the trials used two key definitions of CDP, which differed in the values of the EDSS score
that they used, as follows:
an increase of ≥1.5 EDSS points from a baseline score of 0 or an increase of 1 point
from a baseline score of 1 (referred to as the more stringent definition);
a 1-point increase in EDSS (referred to as the less stringent definition, as used in the
OPERA trials).
The company provided a sensitivity analysis comparing the impact of each definition on the
CDP-12 and CDP-24 outcomes using data from the pooled OPERA trials (Table 16 in the
clarification response). The proportion of patients with CDP-12 varied by 0.5 in the interferon β-
1a arm and 0.8 in the ocrelizumab arm whilst the proportion with CDP-24 varied by 0.4 and 0.7
in these arms respectively. Differences in the corresponding hazard ratios were 0.03 for CDP-12
and 0.04 for CDP-24. The company concluded that there is limited impact of the CDP definition
on MTC results and the ERG agrees.
Adjustment of outcomes included the in MTC analyses
The ERG noted that the clinical trials included in the company’s MTC analyses varied according
to whether their ARR estimates were adjusted for baseline covariates and according to which
covariates were adjusted for. We requested clarification from the company on whether this
variation in the adjustment of ARR outcomes would influence interpretation of the MTC results.
The company provided a table showing the covariates adjusted for in the trials (clarification
A16b and Table 14 in the clarification response). Adjusted values of ARR were reported in 20 of
the 33 trials included in the company’s MTC analyses, of which three (AFFIRM, OPERA I and
Copyright 2018 Queen's Printer and Controller of HMSO. All rights reserved.

Version 1 78
OPERA II) reported both adjusted and unadjusted ARR. The results presented by the company
show that most of these trials adjusted the ARR according to baseline EDSS score, region, prior
relapses and/or age. Some covariates such as EDSS score were adjusted for either as
continuous or dichotomous variables, and the cutoff values used for dichotomous covariates
varied across the trials, meaning that overall there was little consistency in how ARR outcomes
had been adjusted.
The company provided a comparison of the adjusted and unadjusted ARR in the three trials
where this comparison was possible (Table 13 in the clarification response). The difference in
adjusted and unadjusted ARR across all the arms of these three trials ranges from 0.017 to
0.09, whilst the difference in the rate ratios range from 0.01 to 0.04. These results suggest that
for the trials included in the company’s MTC analyses the method of adjusting ARR, or whether
adjustment was used, is unlikely to have substantially influenced the MTC results.
3.1.7.5 Assumptions of similarity, heterogeneity and consistency
Similarity
One of the key assumptions of an MTC, often referred to as the similarity assumption, is that the
distribution of interactions between relative treatment effects and covariates is balanced across
trials that are comparing different sets of inteventions.57 In order to satisfy the similarity
assumption, and hence avoid bias in the MTC outcome estimate, the trials in the MTC should all
be balanced in terms of any variables that could act as effect modifiers. Examples of effect
modifiers are patient characteristics, the way in which the outcomes are defined and/or
measured, protocol requirements such as allowed co-treatment, and the length of follow up.57
The CS does not provide an explicit statement of whether the similarity assumption is likely to
hold across the trials.
A challenge when assessing the similarity of trials included in an MTC is that not all potential
effect modifiers may be reported. Where available, characteristics of the trial populations,
including some prognostic factors for MS progression, which could potentially act as effect
modifiers if unbalanced across trials, have been summarised above (section 3.1.7.3).
Differences in the definitions of trial outcomes, and differences in the methods of adjusting
outcome estimates, which also have potential to be effect modifiers if unbalanced across the
trials, are also summarised above (section 3.1.7.4).
Copyright 2018 Queen's Printer and Controller of HMSO. All rights reserved.

Version 1 79
As discussed above (section 3.1.7.3), there was some variation across the trials in the baseline
proportions of patients who had RRMS and SPMS, in patients’ age, the proportion who were
male, in relapse rates in the years before study entry, and in EDSS scores, but there is no
evidence to suggest any major imbalances in any of these variables that would clearly violate
the similarity assumption. The balance of treatment-naïve and treatment-experienced patients
across the trials was more variable, ranging from 0% (in treatment-naïve patients) to 74% in one
one of the trials that included treatment-experienced patients. We also noted an imbalance in
treatment-naïve/experienced patients between arms within the Calabrese 2012 trial, but it is
unclear whether all arms of this trial were included in MTC analyses. The time since first
symptoms was also rather variable across the trials, ranging from 1 to 10.6 years, with a single
outlier trial (Stępień 2013) that included patients at 19.1 and 23 years since symptom onset.
Although the trials varied in how they defined ARR and CDP outcomes, and how they adjusted
ARR outcomes for baseline covariates, the company provided sensitivity analyses which
suggested that these differences are likely to have only a small or negligible effect on MTC
outcomes (section 3.1.7.4). A caveat is that the sensitivity analyses on ARR definitions only
covered some of the different definitions used in the trials.
In summary, most of the available baseline characteristics of the trials included in the MTC
analyses, and the ways in which outcomes were defined and adjusted, appear to be adequately
balanced across the trials. However, there is uncertainty as to whether the similarity assumption
can be supported, due to notable variation across the trials in the proportions of patients who
were treatment-naïve/experienced, and in patients’ time since onset of symptoms, both of which
could plausibly be considered as being potential effect modifiers.
Heterogeneity
The CS provides results of assessments of statistical heterogeneity for the head-to-head
pairwise comparisons included in the MTCs, colour coded according to categorisations of low
heterogeneity (I2 = 0% to 25%), low to moderate (I2 = 25% to 50%), moderate to high (I2 = 50%
to 75%) and high heterogeneity (I2 = 75% to 100%) (CS Appendix D Table 27 - the ERG
assumes this is for the ITT base case MTCs rather than for the subgroup MTCs). The majority
of comparisons produced low heterogeneity estimates, with seven (21%) of the 34 comparisons
classified as moderate to high, and none classified as high. For the seven moderate to high
comparisons the CS provides forest plots (with tau-squared and p values for statistical
Copyright 2018 Queen's Printer and Controller of HMSO. All rights reserved.

Version 1 80
heterogeneity) and a discussion, in varying detail across comparisons, of potential sources of
heterogeneity. The company speculate that reasons for heterogeneity might include differences
in trial durations and differences in overall rates of discontinuation between trials, or unknown
reasons. The company also noted an imbalance in the dropout rate between the arms within the
CONFIRM trial which they suggest might have contributed to heterogeneity. However, the CS
does not provide a detailed discussion of heterogeneity in the evidence base as a whole, apart
from noting that there may be heterogeneity in terms of the proportion of patients included in the
trials with forms of MS other than RRMS (as we have discussed above in relation to similarity).
As stated above, a random effects model was used in the base case MTC analysis, which is
recommended where heterogeneity is identified or suspected.57 Overall, the ERG considers that
the results of the MTCs are unlikely to be compromised by heterogeneity given the relatively low
I2 values reported, the use of a random effects model, and the inclusion of a meta-regression on
trial duration.
Consistency
The CS assesses the consistency between direct and indirect evidence by conducting a
consistency assessment (CS Appendix Table 28). In response to a clarification question
(clarification A20c) the company stated that they investigated inconsistency using an
inconsistency model approach as recommended in NICE DSU Technical Support Document
4.58 The inconsistency model provides results that are equivalent to having separate, unrelated,
meta-analyses for every pair-wise comparison but with a common variance parameter in
random effects models.58
The company re-ran each MTC model without assuming consistency, and the DIC values were
compared with those from the standard MTC (which assumes consistency). The CS notes that a
DIC for the inconsistency model that is higher than the consistency model by three units
suggests potential inconsistency. The standard MTC (consistency) model had a lower DIC
compared to the inconsistency model for three of the four outcome measures. The exception
was the CDP-24 outcome where the consistency model had a higher DIC than the
inconsistency model but this did not exceed three units, and the CS therefore regards this as
unimportant.
Copyright 2018 Queen's Printer and Controller of HMSO. All rights reserved.

Version 1 81
The ERG notes that the approach taken by the company is regarded by the NICE DSU as
suitable for complex networks,58 and the networks included in the CS could indeed be regarded
as complex. Other methods for investigating inconsistency are available but the company has
not provided a justification for the use of their chosen method over any other. The NICE DSU
also suggests that “inconsistency assessments are inherently underpowered and will often fail
to detect it. Investigators must therefore also ask whether, if inconsistency is not detected,
conclusions from combining direct and indirect evidence can be relied upon” (page 4).58
However, the CS does not discuss this.
The company provided forest plots for all pairwise comparisons following an ERG request
(clarification A20). The ERG cross-checked the results of the company’s pairwise meta-
analyses (direct comparisons) against the results of the base case ITT MTC (direct and indirect
comparisons) for the four outcome measures. In the majority of cases the results of the two sets
of analyses were similar, suggesting overall consistency in results. In a minority of cases the
ERG noted small differences between the width of confidence intervals from the pairwise meta-
analyses and the MTC credible intervals, where intervals crossed 1 (for ARR and all cause
discontinuations).
3.1.7.6 MTC summary
A total of 23 MTC networks are reported in the CS, varying in composition according to
patient population, subgroups and comparators included.
A total of 33 RCTs provided data to inform the MTCs, based on the company’s
systematic review of clinical effectiveness, with a smaller number informing the subgroup
MTCs. The ERG did not identify any additional relevant studies from an update search
undertaken for this report.
A Bayesian random effects model was used, with sensitivity analysis using alternative
prior distributions and fixed effects. The statistical procedures were based on methods
recommended by the NICE DSU and are reported clearly, though certain procedures
(e.g. assessing model convergence) are not described.
The networks have a complex structure with ocrelizumab (OPERA trials) connected to
comparator treatments via second-order and third-order groups of treatments (‘jumps’).
The MTCs directly inform the company’s economic model. The majority of comparisons
across the networks were informed by a single trial which can be considered a limitation.
Copyright 2018 Queen's Printer and Controller of HMSO. All rights reserved.

Version 1 82
Heterogeneity assessments undertaken by the company showed that the majority of
pairwise comparisons were considered to have low heterogeneity. The CS does not
provide a detailed discussion of heterogeneity in the evidence base as a whole, but the
ERG considers the results are unlikely to be compromised by potential heterogeneity.
The statistical consistency assessment used by the company did not suggest the
presence of inconsistency between direct and indirect evidence. The ERG’s cross-check
of the results of the direct and indirect evidence found that results were similar. The CS
does not explicitly discuss the similarity assumption across the trials.
Limitations identified in the MTCs include:
The subgroup MTCs should be interpreted with caution due to sparsity of data, the fact
that they are post hoc subgroups extracted from the trials, and the observational nature
of the data.
The MTC analyses of CDP-12 and CDP-24 assume proportional hazards. The company
provided evidence to suggest that this assumption is supported for the comparison of
ocrelizumab against interferon β-1a, but it is unclear whether the assumption would be
supported for comparisons among other DMTs.
To enable MTC networks to be formed for HA and RES disease severity subgroups, the
company utilised ITT data from trials of ‘ABCR’ comparators (types of interferon β and
glatiramer acetate). The underlying assumption is that, for these treatments, the
treatment effect observed in the ITT population would be the same as the treatment
effects in the subgroup populations. However, the company has not clearly justified that
this assumption is supported. Overall, given the limitations of the subgroup analyses,
including that they post-hoc and potentially at risk of selection bias, both the company
and ERG consider the MTC results for these subgroups to be unreliable.
There are marked differences between trials included in the MTCs in the proportions of
patients who were treatment-naïve and treatment-experienced, and also in the time
since onset of symptoms. The the ERG is therefore uncertain whether the consistency
assumption of MTC analysis is supported.
There is uncertainty around some individual input data for the MTCs. (i) An independent
MTC which the company used to provide ITT CDP-12 outcomes for some comparisons
against alemtuzumab, obtained by the company from the ‘HAS Reimbursement dossier’
has not been critiqued by the company and the ERG is unable to locate the dossier to
check it. (ii) It is unclear whether the placebo arm in the Calbrese 2012 trial was included
Copyright 2018 Queen's Printer and Controller of HMSO. All rights reserved.

Version 1 83
in MTC analysis. (iii) The company does not adequately justify why the Etemadefir 2006
trial was excluded from MTC analyses of ARR.
The company did not conduct any sensitivity analyses to investigate whether MTC
outcomes were sensitive to the inclusion of trials that were judged to be at high risk of
bias.
3.2 Summary statement of the company’s approach
Overall, the company’s approach to the synthesis of clinical effectiveness and safety data meets
the CRD’s quality criteria (Table 16).
Table 16 ERG’s quality assessment of the CS review (CRD criteria) CRD Quality Item ERG comments
1. Are any inclusion/exclusion criteria
reported relating to the primary studies
which address the review question?
Yes. The company’s SLR was designed with multiple
countries’ requirements in mind and was therefore broader
than the NICE scope. A feasibility assessment was conducted
to determine which of the identified studies were to be
included in MTC analyses, but the feasibility assessment
process is not clearly reported and the CS does not report
how many reviewers conducted screening (further information
was provided in clarification responses).
2. Is there evidence of a substantial effort
to search for all relevant research? (i.e.
all studies identified)
Yes for the clinical effectiveness evidence. However, sourcing
of safety data did not appear to follow a systematic process.
Non-randomised studies (which might provide safety data)
were not sought. The company did not initially provide the
ERG with all relevant references (these were provided in a
clarification response).
3. Is the validity of included studies
adequately assessed?
Yes, risk of bias was assessed according to standard NICE
criteria, for the two OPERA trials and the phase II trial, and for
23 RCTs of comparators that informed the company’s MTC
(narrative justification of the company’s risk of bias
judgements was not provided).
4. Is sufficient detail of the individual
studies presented?
Yes for the two OPERA trials. The CS does not report clinical
effectiveness results for the phase II trial (these were
provided in a clarification response).
5. Are the primary studies summarised
appropriately?
Yes, the information provided in the CS and Appendices is
generally well-structured and clear. The CS does not report
baseline characteristics of disease activity subgroups in the
OPERA trials (these were provided in a clarification
response), and does not report exploratory outcomes in the
OPERA trials that are relevant to the NICE scope.
The CS and Appendices are generally well-presented and easy to follow. The main limitations
are that the feasibility assessment process for including/excluding trials in the MTC analyses
Copyright 2018 Queen's Printer and Controller of HMSO. All rights reserved.

Version 1 84
was not clearly explained (but was subsequently clarified); safety data were not searched for
systematically (although no key safety issues appear to have been missed); clinical
effectiveness results of the phase II trial are not included in the CS; some exploratory outcomes
measured in the OPERA trials which are specified in the NICE scope are not mentioned in the
CS.
The company provided electronic copies of the CSRs for both OPERA trials, but not for the
phase II trial, although a study publication was provided.44 The CSR for the phase II trial, the
ocrelizumab draft summary of product characteristics (SmPC), and most other references which
were missing from the submission were subsequently provided by the company on request from
the ERG (clarifications A5 and A7a). However, a reference for the HAS meta-analysis was not
provided to the ERG and we have been unable to locate this document.
3.3 Summary of the submitted evidence
The clinical effectiveness results presented in this section are from the pivotal OPERA I and
OPERA II trials which compared ocrelizumab (600mg IV infusion) against interferon β-1a (Rebif
44 μg subcutaneous injection) over 96 weeks.
The company did not include the results of the identified ocrelizumab phase II trial comparing
ocrelizumab (600 mg or 2000 mg IV infusion) with interferon β-1a (Avonex 30 µg intramuscular
injection) or placebo in their submission (but provided information on methods and results in
clarification A7). We have not presented full clinical effectiveness results of the phase II trial
here, for the reasons explained above (section 3.1.3.1). We do, however, briefly comment on
the consistency of findings from the phase II trial and OPERA trials for those outcomes that
were assessed in both; and we have included the phase II trial as a source of adverse events
data (section 3.3.9 below).
Results are presented below in an order which broadly matches the categories of outcomes
specified in the NICE scope, i.e. relapse rate (section 3.3.1), disability progression (section
3.3.2), disability improvement (3.3.3), symptoms and quality of life (section 3.3.4), and freedom
from disease activity (section 3.3.5). All-cause discontinuation, which is not specified in the
NICE scope, is an outcome that informs the company’s economic analysis and is reported in
section 3.3.6. Outcomes relating to brain lesions and brain volume, which are not explicitly
mentioned in the NICE scope, are reported under ‘MRI outcomes’ (section 3.3.7). Mortality,
Copyright 2018 Queen's Printer and Controller of HMSO. All rights reserved.

Version 1 85
which is listed as an outcome in the NICE scope, is reported under adverse events (section
3.3.9).
The first seven of the 11 outcomes tested in the company’s hierarchical sequence (Figure 2
above) were statistically significant, supporting the company’s hypothesis of the superior clinical
effectiveness of ocrelizumab compared to interferon β-1a for these outcomes (CS Table 12).
The eighth outcome in the sequence (MSFC) was statistically significant only in the OPERA II
trial. In line with the pre-specified analysis plan, the company therefore interpreted MSFC and
the remaining three outcomes below it in the sequence (brain volume, SF-36 PCS, and NEDA)
as being non-confirmatory of clinical effectiveness (i.e. providing descriptive information only).
3.3.1 Relapse rate
Results from analyses of the ARR (the primary outcome in the OPERA trials) are presented
here for the ITT population (section 3.3.1.1) and for the subgroup analysis of ARR according to
disease activity and disease progression (section 3.3.1.2). The HA and RES subgroups are
defined in Table 14 above; note that these are not mutually exclusive since in the OPERA trials
14% of patients could be defined as having both HA and RES types of MS (indicated by the
company in clarification A9).
3.3.1.1 ITT population
The OPERA I and OPERA II trials both met their primary endpoint, with the ARR over 96 weeks
analysed in the ITT population reduced significantly in the ocrelizumab arms compared to
interferon β-1a (Table 17). The ARR for each trial arm and the rate ratios for the comparisons
were almost identical in the two trials; the rate of relapse was around 46% lower with
ocrelizumab than with interferon β-1a.
Table 17 Annualised relapse rate at 96 weeks Trial Ocrelizumab Interferon β-1a Rate ratio (95% CI) a
N ARR N ARR
OPERA I (data cut-off
02/04/2015)
410 0.156 411 0.292 0.536 (0.400 to 0.719);
p<0.0001
OPERA II (data cut-off
12/05/2015)
417 0.155 418 0.290 0.532 (0.397 to 0.714);
p<0.0001 a Adjusted by study, baseline EDSS score (<4.0 vs ≥4.0) and geographical region (US vs rest of world).
Copyright 2018 Queen's Printer and Controller of HMSO. All rights reserved.

Version 1 86
The rate ratio for the pooled analysis was 0.535 (95% CI 0.435 to 0.659) (CS Table 13). The
trial publication supplementary appendix45 reports results from a per-protocol analysis of ARR
per trial that was not part of the hierarchical testing procedure. This yielded almost identical
results to the ITT analysis for both OPERA trials. Further sensitivity analyses were conducted,
using a Poisson model, 50% and 100% imputation of missing data, and variation of the
adjustment covariates (summarised in the Canadian Agency for Drugs and Technologies in
Health (CADTH) appraisal of ocrelizumab25), and these all yielded results consistent with the
ITT analysis.
ARR was a secondary outcome in the ocrelizumab phase II trial. Results of the phase II trial
over 24 weeks were consistent with those of the OPERA trials over 96 weeks in showing
ocrelizumab to be effective in reducing the rate of relapses in patients with RRMS. According to
the phase II trial publication,44 ARR over 24 weeks in the ocrelizumab arm was 0.13 (95% CI
0.53 to 0.29), which was 80% lower than in the placebo arm (0.64 (95% CI 0.43 to 0.94);
p=0.0005) and 64% lower than in the interferon β-1a (Avonex) arm (0.36 (95% CI 0.22 to 0.60);
p=0.03).
3.3.1.2 Disease activity and treatment experience subgroups
ARR in disease activity subgroups
In both the HA and RES subgroups ocrelizumab significantly reduced the ARR compared to interferon β-1a, which is consistent with the results for the ITT population (
Copyright 2018 Queen's Printer and Controller of HMSO. All rights reserved.

Version 1 87
Table 18). In the ocrelizumab arm the subgroup ARR were similar to or lower than those in the
ITT population; whilst in the interferon β-1a arm, the subgroup ARR were higher than in the ITT
population. As such, the rate ratios for the disease activity subgroups (HA 0.32; RES 0.38) are
lower than for the ITT population (0.54).
Copyright 2018 Queen's Printer and Controller of HMSO. All rights reserved.

Version 1 88
Table 18 Annualised relapse rate in disease activity subgroups at 96 weeks (pooled OPERA trials analysis)
Analysis
group
Ocrelizumab Interferon β-1a Rate ratio
(95% CI)
Interaction
test p-value N Events ARR N Events ARR
HA 143 23 0.099 140 64 0.313 0.317 (0.181 to
0.556); p<0.0001 0.0346
RES 150 40 0.151 140 78 0.394 0.384 (0.243 to
0.607); p<0.0001 0.0811
Non-
HA/RES 567 189 0.250 556 137 0.173
0.691 (0.538 to
0.888); p=0.0038 -
ITT 827 194 0.156 829 334 0.291 0.535 (0.435 to
0.659); p<0.0001 -
Based on CS Table 13 and clarification A9 ARR, annualised relapse rate; CI, confidence interval, HA, highly active; ITT, Intention-to-treat; RES, rapidly evolving severe.
ARR in treatment experience subgroups
Based on data from the pooled OPERA I and OPERA II trials, the ARR was compared in
subgroups of treatment-experienced and treatment-naïve patients, in a post-hoc analysis (as
requested by the EMA) (CS Appendix E). Treatment-experienced patients were defined very
broadly, as having had treatment with any medication for MS in the 2 years before
randomisation. The ARR is not reported for each subgroup, but the rate ratios for ocrelizumab
versus interferon β-1a (not reported whether adjusted) were statistically significant for both the
treatment-naïve subgroup (0.567; 95% CI 0.445 to 0.772; p<0.0001) and the treatment-
experienced subgroup (0.462; 95% CI 0.310 to 0.688; p=0.0001), indicating that clinical
effectiveness of ocrelizumab at reducing relapse rates was independent of patients’ (broadly-
defined) treatment experience.
3.3.2 Disability progression
Results from analyses of the time to confirmed disability progression are presented here for the
ITT population (section 3.3.2.1) and for the subgroup analysis of CDP according to disease
activity and treatment experience (section 3.3.2.2).
3.3.2.1 ITT population
The proportion of patients with 12-week confirmed disability progression was significantly lower
in the ocrelizumab arm compared to the interferon β-1a arm in both OPERA trials and in the
pooled analysis (Table 19). The reduction in risk of CDP-12 for those receiving ocrelizumab was
40% in the pooled analysis (HR 0.60 (95% CI 0.45 to 0.81); p=0.0006).
Copyright 2018 Queen's Printer and Controller of HMSO. All rights reserved.

Version 1 89
Table 19 Proportion of patients with 12-week confirmed disability progression (CDP-12) at 96 weeks
Trial Ocrelizumab Interferon β-1a Hazard ratio
(95% CI) a N Proportion (%)
with CDP-12
N Proportion (%)
with CDP-12
OPERA I 410 7.6 b 411 12.2 b 0.57 (0.37–0.90);
p=0.0139
OPERA II 417 10.6 b 418 15.1 b 0.63 (0.42–0.92);
p=0.0169
Pooled OPERA
I + II
827 9.1 c 829 13.6 c 0.60 (0.45–0.81);
p=0.0006 a Adjusted by study, baseline EDSS score (<4.0 vs ≥4.0) and geographical region (US vs rest of world). b From trial publication (not reported in CS) c Data are from the trial publication; they differ slightly from those in CS Table 11 and the CSR.
The proportion of patients with 24-week confirmed disability progression was also significantly
lower in the ocrelizumab arm compared to the interferon β-1a arm in both OPERA trials and in
the pooled analysis (Table 20). The hazard ratios are almost identical for 24-week CDP and 12-
week CDP, both for each OPERA trial and for the pooled analysis. The reduction in risk of CDP-
24 for those receiving ocrelizumab was 40% in the pooled analysis (HR 0.60 (95% CI 0.43 to
0.84); p=0.0025).
Table 20 Proportion of patients with 24-week confirmed disability progression (CDP-24) at 96 weeks
Trial Ocrelizumab Interferon β-1a Hazard ratio
(95% CI) a N Proportion (%)
with CDP-24
N Proportion (%)
with CDP-24
OPERA I 410 5.9 b 411 9.5 b 0.57 (0.34–0.95);
p=0.0278
OPERA II 417 7.9 b 418 11.5 b 0.63 (0.40–0.98);
p=0.0370
Pooled OPERA
I + II
827 6.9 c 829 10.5 c 0.60 (0.43–0.84);
p=0.0025 a Adjusted by study, baseline EDSS score (<4.0 vs ≥4.0) and geographical region (US vs rest of world). b From trial publication (not reported in CS). c Data are from the trial publication; they differ slightly from those in CS Table 11 and the CSR.
Copyright 2018 Queen's Printer and Controller of HMSO. All rights reserved.

Version 1 90
For both the CDP-12 and CDP-24 outcomes, there was a slight difference between the trials:
the proportion of patients with an event was 2-3% lower in OPERA I than OPERA II and the
corresponding hazard ratio was 6% lower in OPERA I than OPERA II.
The CSRs for OPERA I and OPERA II present eight sensitivity analyses for each of the CDP-12
and CDP-24 outcomes (not mentioned in the CS), in which the population (ITT or per protocol),
data imputation (with or without), and/or analysis stratification factors were varied in different
combinations. For the proportion of patients with CDP-12, the hazard ratios ranged from
************ in OPERA I and ************ in OPERA II. For the proportion with CDP-24 the hazard
ratios ranged from ************ in OPERA I and ************ in OPERA II.
****************************************************.
3.3.2.2 Disease activity and treatment experience subgroups
CDP-12 and CDP-24 in disease activity subgroups
In both the HA and RES subgroups the proportion of patients with disability progression was consistently lower in the ocrelizumab arm than the interferon β-1a arm, both for progression confirmed at 12 weeks and progression confirmed at 24 weeks (
Copyright 2018 Queen's Printer and Controller of HMSO. All rights reserved.

Version 1 91
Table 21). The CS concludes that the effect of ocrelizumab at reducing progression in the
subgroups is consistent with that in the ITT population. For both CDP-12 and CDP-24 outcomes
the RES subgroup hazard ratios were similar to the ITT population hazard ratios (all were in the
range 0.60 to 0.65), whilst the HA subgroup hazard ratios were smaller (range 0.47 to 0.50).
However, only the hazard ratio for CDP-12 assessed in the HA subgroup was statistically
significant (the CS does not comment on these differences).
Copyright 2018 Queen's Printer and Controller of HMSO. All rights reserved.

Version 1 92
Table 21 CDP-12 and CDP-24 in disease activity subgroups at 96 weeks (pooled OPERA trials analysis)
Analysis
group
Ocrelizumab Interferon β-1a
Hazard ratio
(95% CI)
Inter-
action
test p-
value
N Events %
events
N Events %
events
CDP-12
HA 143 12 8.4 140 22 15.7 0.47 (0.23 to 0.95);
p=0.0311 0.5109
RES 150 15 10.0 140 20 14.3 0.65 (0.33 to 1.29);
p=0.2163 0.8490
Non-
HA/RES 567 74 13.1 556 49 8.8
0.61 (0.42 to 0.87);
p=0.0065 -
ITT 827 75 9.1 829 113 13.6 0.60 (0.45 to 0.81);
p=0.0006 -
CDP-24
HA 143 10 7.0 140 17 12.1 0.50 (0.23 to 1.09);
p=0.0763 0.6898
RES 150 14 9.3 140 20 14.3 0.61 (0.31 to 1.22);
p=0.1566 0.9853
Non-
HA/RES 567 53 9.3 556 34 6.1
0.60 (0.39 to 0.92);
p=0.0169 -
ITT 827 57 6.9 829 87 10.5 0.60 (0.43 to 0.84);
p=0.0025 -
Based on CS Tables 14 and 15 and clarification A9
CDP-12 and CDP-24 in treatment experience subgroups
Based on data from the pooled OPERA I and OPERA II trials, CDP-12 and CDP 24 were
compared in subgroups of treatment-experienced and treatment-naïve patients, in a post-hoc
analysis (as requested by the EMA) (CS Appendix E). As previously stated, treatment-
experienced patients were defined very broadly, as having had treatment with any medication
for MS in the 2 years before randomisation.
The proportions of patients with CDP-12 in the ocrelizumab and interferon β-1a groups, and the
corresponding hazard ratios, were very similar for the treatment-naïve and treatment-
experienced patient subgroups, and the ITT population (Table 22). Similar results were found
for CDP-24, except that the proportions of patients achieving an event were more variable
across the analysis groups for the ocrelizumab arm (Table 23). However, the hazard ratios for
the treatment experienced groups for both outcomes were not statistically significant. The
company suggest (CS Appendix E) that the lack of statistical significance is likely driven by the
low number of events and lack of statistical power.
Copyright 2018 Queen's Printer and Controller of HMSO. All rights reserved.

Version 1 93
Table 22 CDP-12 in treatment naïve/experienced subgroups at 96 weeks
Analysis group
(pooled OPERA
trials)
Ocrelizumab Interferon β-1a Hazard ratio
(95% CI) b N Proportion (%)
with CDP-12 a
N Proportion (%)
with CDP-12 a
Treatment naive 604 8.8 605 13.6 0.60 (0.42 to 0.85);
p=0.0037
Treatment
experienced
223 9.9 223 13.9 0.61 (0.35 to 1.06);
p=0.0797
ITT population 827 9.1 829 13.6 0.60 (0.45–0.81);
p=0.0006
Source: CS Appendix E a calculated by ERG. b ITT analysis adjusted by baseline EDSS score and region; not reported whether subgroup analyses adjusted.
Table 23 CDP-24 in treatment naïve/experienced subgroups at 96 weeks Analysis group
(pooled OPERA
trials)
Ocrelizumab Interferon β-1a Hazard ratio
(95% CI) b N Proportion (%)
with CDP-24 a
N Proportion (%)
with CDP-24 a
Treatment naive 604 6.5 605 10.6 0.57 (0.38 to 0.85);
p=0.0056
Treatment
experienced
223 8.1 223 10.3 0.67 (0.36 to 1.24);
p=0.2039
ITT population 827 6.9 829 10.5 0.60 (0.43–0.84);
p=0.0028
Source: CS Appendix E a calculated by ERG. b ITT analysis adjusted by baseline EDSS score and region; not reported whether subgroup analyses adjusted.
3.3.3 Disability improvement
Both CDI-12 and CDI-24 were measured in the OPERA trials, although only CDI-12 was
specified in the statistical testing hierarchy (Figure 2 above) and reported in the CS and trial
publication.
Proportion with CDI-12
The pooled analysis of CDI-12 demonstrated that ocrelizumab was associated with a statistically significant increase in the proportion of patients with CDI-12 by week 96 compared to interferon β-1a (
Copyright 2018 Queen's Printer and Controller of HMSO. All rights reserved.

Version 1 94
Table 24).
Copyright 2018 Queen's Printer and Controller of HMSO. All rights reserved.

Version 1 95
Table 24 Proportion of patients with 12-week confirmed disability improvement (CDI-12) at 96 weeks
Trial Ocrelizumab Interferon β-1a Risk ratio (95% CI) b
N Proportion (%)
with CDI-12 (95%
CI) a
N Proportion (%) with
CDI-12 (95% CI) a
Pooled OPERA
I + II
628 20.70
(17.60 to 24.08)
614 15.64
(12.85 to 18.75)
1.33 (1.05 to 1.68);
p=0.0194
a For subgroup of patients with baseline EDSS score ≥ 2.0; Kaplan-Meier estimate. b Adjusted by study, baseline EDSS score (<4.0 vs ≥4.0) and geographical region (US vs rest of world).
Proportion with CDI-24
The analysis of CDI-24, reported in the CSRs for OPERA I and OPERA II, demonstrated that
ocrelizumab was associated with a ********************************** in the proportion of patients
with CDI compared to interferon β-1a in OPERA I, but the difference in OPERA II was
****************************************** (Table 25). ****************************************************
**********************************************************.
Table 25 Proportion of patients with 24-week confirmed disability improvement (CDI-24) at 96 weeks
Trial Ocrelizumab Interferon β-1a Risk ratio (95% CI) b
N Proportion (%)
with CDI-24 (95%
CI) a
N Proportion (%) with
CDI-24 (95% CI) a
OPERA I *** ******
****************
*** *****
***************
*****************************
OPERA II *** ******
****************
*** ******
****************
*****************************
a For subgroup of patients with baseline EDSS score ≥ 2.0; Kaplan-Meier estimate. b Adjusted by study, baseline EDSS score (<4.0 vs ≥4.0) and geographical region (US vs rest of world).
3.3.4 Symptoms and health related quality of life
The CS reports two instruments that assessed patients’ functional ability (MSFC) and health-
related quality of life (SF-36). A further four scales which assessed patients’ disability (EDSS),
health-related quality of life (EQ-5D), fatigue (MFIS) and depression (CES-D) are not reported in
the CS or trial publication but are summarised briefly below. Apart from EQ-5D, these scales do
not provide input data to the company’s economic analysis but have relevance to interpreting
patients’ quality of life and disease burden and as such provide supporting information. Note
that some of these outcomes were exploratory and/or suffer from missing data which were
unbalanced between the study arms (see Table 13 above).
Copyright 2018 Queen's Printer and Controller of HMSO. All rights reserved.

Version 1 96
3.3.4.1 Outcomes reported in the CS
Change in Multiple Sclerosis Functional Composite (MSFC) over 96 weeks
The MSFC is appropriate as a patient reported outcome measure for MS trials since it captures
upper limb function and cognitive impairment which are not addressed by the EDSS.20
Ambulatory function is assessed with the timed 25-foot walk test; hand function with the nine-
hole peg test; and cognitive function with the paced auditory serial addition task (PASAT). The
results of the tests that assess these domains are presented on interval scales (either seconds
or number of correct responses) and are converted to a z-score based on the values of a
reference population. Changes in MSFC scores are not an explicit outcome in the NICE scope
but are a secondary outcome reported in the CS. This outcome failed the hierarchical testing
procedure and therefore provides descriptive information only. Changes in z-scores in both
OPERA trials were positive in direction, indicative of improvement through time, but statistically
significant only in OPERA II. The clinical significance of the change is uncertain because there
is no validated minimal clinically important difference for MSFC scores25 (clinical significance is
not discussed by the company) and the company does not specify the reference population
used to calculate the scores.
Change in SF-36 Physical Component Summary (SF-36 PCS) over 96 weeks
The SF-36 is a generic measure of quality of life which is relevant to the NICE scope, and
changes in SF-36 PCS from baseline are reported in the CS as a secondary outcome. However,
this outcome failed the hierarchical testing procedure and therefore provides descriptive
information only. In both OPERA trials the mean SF-36 PCS scores for patients in the
ocrelizumab groups showed a slight increase from baseline whereas the mean scores in the
interferon β-1a groups decreased from baseline, but the difference was statistically significant
only in OPERA II. Absolute SF-36 PCS scores are not reported. The ERG understands that no
minimum clinically important difference has been established for the SF-36 PCS specifically in
MS patients,25 but the changes were all less than 1.0 point (on a scale of 0-100) which is less
than the accepted minimum clinically important difference for SF-36 PCS in general use (2.0
points)59 (clinical significance is not discussed by the company).
Copyright 2018 Queen's Printer and Controller of HMSO. All rights reserved.

Version 1 97
3.3.4.2 Outcomes not reported in the CS
Change in EDSS score over 96 weeks
A description of the EDSS instrument is given in Appendix 3. The EDSS 60 quantifies disability in
MS and is an important component in the definitions of the ARR, CDP, and NEDA outcomes.
EDSS is specified as a relevant outcome in the NICE scope but only baseline scores are
reported in the CS and trial publication. According to the CSRs, the median EDSS was
*************** in both trial arms in OPERA I and OPERA II and *************************
****************** (a score of 2.5 on the EDSS scale indicates mild disability in one functional
system or minimal disability in two functional systems). A statistically significant improvement in
the mean EDSS score ************************ is reported in the CSRs. However, since EDSS has
an ordinal scale the mean is not a reliable statistic for this outcome. Clinical experts advising the
ERG commented that it is reasonable to expect a stable EDSS score over 96 weeks in RRMS
patients receiving ocrelizumab and interferon β-1a.
Change in EQ-5D over 96 weeks
EQ-5D is a generic measure of quality of life which is relevant to the NICE scope. Pooled EQ-
5D scores from OPERA I and OPERA II provided health utility values in the company’s
economic model (section 4.3.4.4). EQ-5D scores are not reported in the CS, trial publication and
OPERA CSRs and were requested from the company (clarification A8). The mean EQ-5D
scores pooled from both OPERA trials were ************ in the ocrelizumab and interferon β-1a
arms at baseline, 48 weeks and 96 weeks, ranging from ************. The company stated that
EQ-5D was measured for the purposes of economic modelling, and a comparison of EQ-5D
across treatment arms was not planned as no significant differences were expected over the
trial duration (clarification A8).
Change in MFIS fatigue scores over 96 weeks
Fatigue is specified as an outcome in the NICE scope and the company capture fatigue in their
economic analysis as an adverse event. The ERG notes that fatigue was also assessed in the
OPERA trials using the MFIS instrument, although this was an exploratory outcome and is not
mentioned in the CS or trial publication. MFIS measures the effects of fatigue in terms of
physical, cognitive, and psychosocial functioning. A minimum clinically important difference in
MFIS scores has not been established.61 According to MFIS scores reported in the CSRs, the
degree of fatigue experienced by patients in the OPERA trials ************** between the
Copyright 2018 Queen's Printer and Controller of HMSO. All rights reserved.

Version 1 98
ocrelizumab and interferon β-1a arms and **************************** over the 96-weel trial period
(on a scale of 0=best to 84=worst fatigue, scores ranged from ******** in both arms).
Change in CES-D depression scores over 96 weeks
Depression is not specified as an outcome in the NICE scope but is relevant in comparisons of
DMTs. The company capture depression in their economic analysis as an adverse event. The
ERG notes that depression was also assessed in the OPERA trials using the CES-D
instrument, although this was an exploratory outcome and is not mentioned in the CS or trial
publication. A minimum clinically important difference for CES-D has not been established.62
According to CES-D scores reported in the CSRs, the degree of depressive symptoms
experienced by patients in the OPERA trials ************** between the ocrelizumab and
interferon β-1a arms and **************************** over the 96-weel trial period (on a scale of
0=best to 60=worst depressive symptoms, scores ranged ******** in the ocrelizumab arms and
******** in the interferon β-1a arms).
3.3.5 Freedom from disease activity
Two outcomes relating to freedom from disease activity were measured in the OPERA trials:
proportion of patients with no evidence of disease activity (NEDA)
proportion of patients who remained relapse-free
Of these, only NEDA is reported in the CS. The proportion relapse-free is provided in the
OPERA CSRs (and summarised in the CADTH appraisal of ocrelizumab25).
Proportion with NEDA
The statistical testing hierarchy had been stopped before the evaluation of no evidence of
disease activity (NEDA) in both OPERA trials and so this outcome should be interpreted as
being descriptive. The results presented in the CS are differ slightly from those given in the trial
publication for this outcome, with the results presented in the CS being based on a smaller
sample size, although an explanation is not provided. Both sets of data show that a greater
proportion of patients treated with ocrelizumab than with interferon β-1a achieved NEDA at
week 96 in both OPERA trials (Table 26).
Copyright 2018 Queen's Printer and Controller of HMSO. All rights reserved.

Version 1 99
Table 26 Proportion of patients with no evidence of disease activity (NEDA) by week 96
Trial Data source
Ocrelizumab Interferon β-1a Mean difference
(MD) or relative risk
(RR) (95% CI) b N a
Proportion (%)
(95% CI) with
NEDA
N a
Proportion (%)
(95% CI) with
NEDA
OPERA
I Publication45 382 47.9 384 29.2
MD 64 (36 to 98);
p<0.001 c
CS Table 11 289 47.4
(41.5 to 53.3) 291
27.1
(22.1 to 32.6)
RR 1.74 (1.39 to
2.17);
P<0.0001 c
OPERA
II Publication45 379 47.5 375 25.1
MD 89 (54 to 132);
p<0.001 c
CS Table 11 289 43.9
(38.1 to 49.9) 270
24.1
(19.1 to 29.6)
RR 1.81 (1.41 to
2.32); P<0.0001 c a Subgroup with baseline EDSS >2; trial publication states that the analysis excluded patients who were withdrawn for reasons other than efficacy failure or death and who did not have clinical disease activity at the time of treatment discontinuation in the trial. b Adjusted by baseline EDSS score (<4.0 vs ≥4.0) and geographical region (US vs rest of world). c P-value is descriptive only, as preceding outcome in the testing hierarchy was not statistically significant.
The CADTH appraisal of ocrelizumab25 reports that a pooled analysis of NEDA across both the
OPERA trials and a sensitivity analysis in the ITT population both demonstrated consistent
results with those reported for the EDSS >2.0 subgroup (these analyses are not referred to in
the CS).
Proportion relapse-free
The proportion of patients who remained free of relapses at 96 weeks is not reported in the CS
or trial publication. According to the CADTH appraisal of ocrelizumab,25 the proportion was
higher in the ocrelizumab group than in the interferon β-1a group in both trials (OPERA I: 80.4%
versus 66.7%; OPERA II: 78.9% versus 64.3%). Relative risks were 1.20 (95% CI 1.10 to 1.31)
in OPERA I and 1.23 (95% CI 1.12 to 1.35) in OPERA II (both p<0.0001).
The proportion of patients relapse-free at 24 weeks was a secondary outcome in the
ocrelizumab phase II trial. According to the phase II trial publication,44 the differences
numerically favoured ocrelizumab (87%) over placebo (76%) and interferon β-1a (78%) but
were not statistically significant (confirmed by the company in clarification A7b).
3.3.6 All-cause discontinuation
The NICE scope does not specify all-cause discontinuation as an outcome, but this outcome
informs the company’s economic model (section 4.3.4.3). A summary of all-cause
discontinuation pooled across the OPERA trials is provided in Table 27, for the ITT analysis
Copyright 2018 Queen's Printer and Controller of HMSO. All rights reserved.

Version 1 100
population and also for the HA and RES disease activity subgroups (from the company’s
response to clarification A9). The proportion of patients who discontinued due to any cause was
higher in the ocrelizumab arms than the interferon β-1a arms. This was consistent across the
ITT population and disease activity subgroups, although not statistically significant in the
subgroups.
Table 27 All-cause discontinuation in the pooled OPERA trials
Analysis
group
Ocrelizumab Interferon β-1a
Odds ratio
(95% CI)
Inter-
action
test p-
value
N Events %
events
N Events %
events
HA 140 28 20.0 143 18 12.6 0.58 (0.30 to 1.11);
p=0.1000 0.8508
RES 140 26 18.6 150 17 11.3 0.56 (0.29 to 1.10);
p=0.0913 0.8989
Non-
HA/RES 567 117 20.6 556 69 12.4
0.54 (0.39 to 0.75);
p=0.0003 -
ITT 829 169 20.4 827 101 12.2 0.54 (0.41 to 0.71);
p<0.0001 -
From clarification A9
3.3.7 MRI outcomes
The NICE scope does not specify any MRI outcomes to be assessed and the MRI outcomes
reported by the company do not inform their economic analysis. Only a brief summary of these
outcomes is therefore provided here.
Four MRI outcomes were measured in the OPERA trials:
Cumulative number of T1 enhancing lesions over 96 weeks, which indicate sites of
active MS inflammation;
Total number of new or newly-enlarged T2 hyperintense lesions over 96 weeks, which
indicate areas of active or previous inflammation;
Total number of T1 hypointense lesions over 96 weeks, which indicate areas of chronic
irreversible MS damage;
Change in brain volume, which indicates extensive structural damage resulting from MS
and may be present even in the early stages of the disease.
Copyright 2018 Queen's Printer and Controller of HMSO. All rights reserved.

Version 1 101
The mean numbers of all three types of lesion were statistically significantly lower in the
ocrelizumab arm than the interferon β-1a arm over 96 weeks in both OPERA trials (CS Table
11). The rate ratios (95% CI) were 0.058 (0.032 to 0.104) in OPERA I and 0.051 (0.029 to
0.089) in OPERA II for enhancing T1 lesions; 0.229 (0.174 to 0.300) in OPERA I and 0.171
(0.130 to 0.225) in OPERA II for new and/or enlarged hyperintense T2 lesions; and 0.428 (0.328
to 0.557) in OPERA I and 0.357 (0.272 to 0.470) in OPERA II for hypointense T1 lesions (all
differences p<0.0001).
Brain volume decrease over 24 to 96 weeks was less in the ocrelizumab arm than the interferon
β-1a arm, although the difference was statistically significant only in OPERA I; and this outcome
was considered to be descriptive since preceding outcomes in the statistical testing hierarchy
were not significant.
The ocrelizumab phase II trial reported the total number of T1 enhancing lesions (primary
outcome), number of new T1 enhancing lesions, and number of new or enlarging T2 lesions
(secondary outcomes). According to the study publication,44 at 24 weeks there were fewer of all
three types of lesion in the ocrelizumab arm compared to the placebo and interferon β-1a
(Avonex) arms. These differences between ocrelizumab and placebo were all statistically
significant, and the difference between ocrelizumab and interferon β-1a was also statistically
significant for the primary outcome (not reported for the secondary outcomes).
The MRI outcomes together indicate that ocrelizumab is effective at reducing clinical disease
activity compared to interferon β-1a and placebo. A caveat is that the MRI outcomes in the
OPERA trials suffer from missing data which was unbalanced between the study arms (see
Table 9) and the impact of this on the results is unclear.
3.3.8 Mixed Treatment Comparison results
Results of the base case (ITT) MTC analyses are summarised below in section 3.3.8.1 and the
results of MTC subgroup and sensitivity analyses are summarised in section 3.3.8.2.
3.3.8.1 Base case analyses
Results of the base case (ITT) MTC analyses of ARR, CDP-12, CDP-24 and all-cause
discontinuation are summarised in Table 28. Shaded cells in the table indicate where the
outcome statistic (i.e., rate ratio, hazard ratio or odds ratio) is not statistically significant, i.e.
where the 95% CrI crosses 1.0.
Copyright 2018 Queen's Printer and Controller of HMSO. All rights reserved.

Version 1 102
Table 28 MTC analysis results for ITT populations
OCB 600mg versus:
ARR Rate ratio (95% CrI)
CDP-12 Hazard ratio (95% CrI)
CDP-24 Hazard ratio (95% CrI)
All-cause discont. Odds ratio (95% CrI)
ALEM 12 mg ******************* ******************* ******************* *******************
CLAD 3.5mg/kg ******************* ******************* ******************* *******************
CLAD 5.25mg/kg ******************* ******************* ******************* *******************
DAC 150 mg, q4w ******************* ******************* ******************* *******************
DMF 240 mg, bid ******************* ******************* ******************* *******************
FINGO 0.5 mg, qd ******************* ******************* ******************* *******************
GA 20 mg, qd ******************* ******************* ******************* *******************
GA 40 mg, tiw ******************* No data No data No data
IM IFNβ-1a 30 μg,
qw (Avonex) ******************* *******************
******************* *******************
SC IFNβ-1a 22 μg, tiw (Rebif)
No data ******************* No data *******************
SC IFNβ-1a 44 μg, tiw (Rebif)
******************* ******************* ******************* *******************
SC IFNβ-1b 250 μg,
eod
**** **************
******************* No data **** **************
PEGβ-1a 2W 125 μg, q2w
******************* ******************* ******************* *******************
NAT 300 mg, q4w ******************* ******************* ******************* *******************
Placebo ******************* ******************* ******************* *******************
TERI 7 mg, qd ******************* ******************* ******************* *******************
TERI 14 mg, qd ******************* ******************* ******************* *******************
Data sources CS Appendices Table 14
CS Appendices Table 17
CS Appendices Table 20
CS Appendices Table 23
bid: twice per day; eod: every other day; qd: once per day; qw; once per week; q2w: every 2 weeks; q4w: every 4 weeks; tiw: three times per week Shaded cells indicate the outcome is not statistically significant (i.e. the 95% CrI includes 1.0)
*************************************************************************************************************
*************************************************************************************************************
*******. Ocrelizumab was most effective at reducing ARR, CDP-12 and CDP-24 when compared
against
*************************************************************************************************************
*************************************************************************************************************
****************************************************** (Table 28).
3.3.8.2 Subgroup and sensitivity analyses
As explained above, the company conducted several sensitivity and subgroup analyses in the
MTC:
Copyright 2018 Queen's Printer and Controller of HMSO. All rights reserved.

Version 1 103
comparison of full and restricted networks and inclusion/exclusion of the INCOMIN trial
(see section 3.1.7.1);
comparison of fixed-effect model results against random-effects models which had two
different vague priors (see section 3.1.7.4);
comparison of the ITT population and HA and RES subgroups (see section 3.1.7.1).
Full versus restricted networks
Forest plots reported in Figures 8, 13, 19 and 24 in CS Appendix D show that the company’s
two analyses which excluded “non-NICE comparators” from the networks ********************** on
the ARR, CDP-12, CDP-24 and all-cause discontinuation outcomes when compared to the base
case ITT analysis results. Inclusion ************ of the INCOMIN trial
*********************************** the MTC results for CDP-24 (the only relevant MTC outcome
assessed in the INCOMIN trial) (Figure 19 in CS Appendix D).
Fixed versus random effects models
For each of the ARR, CDP-12, CDP-24 and all-cause discontinuation outcomes, forest plots
reported in Figures 4, 9, 14 and 20 in CS Appendix D show that the two random-effects
analyses with informative and vague priors **************************; and the fixed-effects
analysis
*************************************************************************************************************
. The differences between the fixed and random effects confidence intervals would not influence
the interpretation of statistical significance given above, except perhaps for those comparisons
where the random-effects 95% confidence interval barely overlaps 1.0.
HA and RES disease activity subgroups
For each of the ARR, CDP-12 and CDP-24 outcomes, forest plots reported in CS Figures 11, 16
and 21 show that the HA and RES subgroups
*************************************************************************************************************
****************************************************************. The CS does not provide numeric
estimates of the rate ratios and hazard ratios other than as depicted graphically in the forest
plots. Due to limitations in the data the disease activity subgroups were not analysed for all-
cause discontinuation. As mentioned above (section 3.1.7.6) the HA and RES subgroup results
for ARR, CDP-12 and CDP-24 should be interpreted with caution due to sparsity of data, the
Copyright 2018 Queen's Printer and Controller of HMSO. All rights reserved.

Version 1 104
fact that they are post hoc subgroups extracted from the trials, and the observational nature of
the data.
3.3.9 Adverse events
The CS reports adverse events in the OPERA trials in CS section B.2.10. Some additional
detail is given in the trial publication45 for infusion-related reactions, herpes infections, and
neoplasms during the 96 weeks of the randomised trials. The CS does not report adverse
events for the OPERA OLE study, but these were provided by the company in response to a
clarification request from the ERG (clarification A28). Adverse events in the OPERA trials and
OLE study are summarised below in section 3.3.9.1.
Adverse events in the phase II trial are reported up to 48 weeks in CS Appendix F and the trial
publication.44 On request from the ERG, the company provided a summary of adverse event
rates in the trial up to 96 weeks (clarification A7b) which are summarised below in section
3.3.9.2.
3.3.9.1 Adverse events in the OPERA trials and OLE study
OPERA trials up to 96 weeks
In both OPERA trials the proportion of patients who experienced at least one adverse event was
similar in the ocrelizumab and interferon β-1a arms, although slightly higher in OPERA II (ca
80%) than OPERA I (ca 86%). The proportion experiencing at least one serious adverse event
was also similar in both arms, for both trials (range 7% to 10%). Rates of discontinuation due to
adverse events were low, but half as many patients receiving ocrelizumab discontinued due to
an adverse event (3%) compared to those receiving interferon β-1a (6%) (Table 29).
The main differences in adverse events between the trial arms were for infusion-related
reactions (IRR) which were more frequent among patients receiving ocrelizumab; and influenza-
like illness and injection site reactions which were more frequent among those receiving
interferon β-1a (Table 30).
The proportion with at least one IRR ranged from 31% to 38% in the ocrelizumab arms, and
from 7% to 12% in interferon β-1a arms, with the proportions being slightly higher in OPERA II
than in OPERA I. The majority of IRR were mild (18% to 25% in the ocrelizumab arms; 5% to
8% in the interferon β-1a arms) and moderate (9% to 11% in the ocrelizumab arms; 2% to 3% in
Copyright 2018 Queen's Printer and Controller of HMSO. All rights reserved.

Version 1 105
the interferon β-1a arms). Only one life-threatening IRR occurred (bronchospasm), in the
ocrelizumab arm of OPERA I (Table 29). Infusion-related reactions led to the withdrawal of 11
ocrelizumab-treated patients (1.2% to 1.5%) compared with no patients who received the
placebo infusion, and no cases of anaphylaxis occurred in the trials.
The most commonly reported symptoms associated with IRR adverse events in the ocrelizumab
arms were pruritus, rash, throat irritation, and flushing. According to the trial publication, 45 the
first 300 mg dose of ocrelizumab was associated with the highest proportions of patients with an
IRR (27.5%), which decreased to 4.7% following the second 300 mg infusion (day 15). For the
first infusion of the full 600 mg ocrelizumab dose, 13.8% of patients had at least one IRR, and
this proportion decreased for subsequent doses.
A relatively high proportion of patients in both arms of both trials had infections (53% to 60%)
but this is not discussed in the CS.
Copyright 2018 Queen's Printer and Controller of HMSO. All rights reserved.

Version 1 106
Table 29 Summary of adverse events in the OPERA trials
Event, n (%)
OPERA I OPERA II
Ocrelizumab (n=408)
Interferon β-1a (n=409)
Ocrelizumab (n=417)
Interferon β-1a (n=417)
Any AE 327 (80.1) 331 (80.9) 360 (86.3) 357 (85.6)
Any serious AE 28 (6.9) 32 (7.8) 29 (7.0) 40 (9.6)
AE leading to treatment discontinuation
13 (3.2) 26 (6.4) 16 (3.8) 25 (6.0)
At least 1 infusion-related reaction (IRR) 126 (30.9) 30 (7.3) 157 (37.6) 50 (12.0)
Mild IRR 73 (17.9) 22 (5.4) 106 (25.4) 35 (8.4)
Moderate IRR 38 (9.3) 8 (2.0) 45 (10.8) 14 (3.4)
Severe IRR 14 (3.4) 0 6 (1.4) 1 (0.2)
Life-threatening IRR 1 (0.2) 0 0 0
Infection (MEDRA definition) a
232 (56.9)
222 (54.3)
251 (60.2)
219 (52.5)
System organ class infection or infestation 231 (56.6) 216 (52.8) 251 (60.2) 217 (52.0)
Herpes zoster 9 (2.2) 4 (1.0) 8 (1.9) 4 (1.0)
Oral herpes 9 (2.2) 8 (2.0) 15 (3.6) 9 (2.2)
Herpes simplex 4 (1.0) 1 (0.2) 3 (0.7) 1 (0.2)
Neoplasm 3 (0.7) 1 (0.2) 1 (0.2) 1 (0.2)
Death 0 1 (0.2) 1 (0.2) 1 (0.2)
Source: CS Table 18 and trial publication
AE, Adverse events; IFNβ-1a, Interferon β; NR, Not reported; OCR, Ocrelizumab; SOC, System organ
class. a Defined in the Medical Dictionary for Regulatory Activities infections system organ class “infections and infestations” or as an adverse event with pathogen information provided.
The company’s economic model utilises adverse events data for those events that occurred at a
frequency of at least 5% in any trial arm (section 0). For the majority of these, the difference
between trial arms in the proportion of patients affected was less than 5% (Table 24). In the
pooled adverse events data across both OPERA trials, events which occurred in at least 5% of
patents in any arm and also differed by at least 5% between the arms were IRRs (ocrelizumab
34%, interferon β-1a 10%), influenza-like illness (ocrelizumab 5%, interferon β-1a 21%), and
injection-site erythema (ocrelizumab 0.1%, interferon β-1a 15%) (Table 24).
Copyright 2018 Queen's Printer and Controller of HMSO. All rights reserved.

Version 1 107
Table 30 Adverse events reported in ≥ 5% of patients up to 96 weeks in the OPERA trials
Event, n (%)
OPERA I & II a
Ocrelizumab
(n=825)
Interferon β-1a
(n=826)
Total number of patients with at least
one AE occurring at relative
frequency ≥5%
544 (65.9) 539 (65.3)
Infusion related reactions 283 (34.3) 80 (9.7)
Headache 93 (11.3) 124 (15.0)
Influenza-like illness 38 (4.6) 177 (21.4)
Upper respiratory tract infection 125 (15.2) 87 (10.5)
Nasopharyngitis 122 (14.8) 84 (10.2)
Urinary tract infection 96 (11.6) 100 (12.1)
Fatigue 64 (7.8) 64 (7.7)
Injection site erythema 1 (0.1) 127 (15.4)
Depression 64 (7.8) 54 (6.5)
Arthralgia 46 (5.6) 51 (6.2)
Sinusitis 46 (5.6) 45 (5.4)
Back pain 53 (6.4) 37 (4.5)
Insomnia 46 (5.6) 38 (4.6)
Bronchitis 42 (5.1) 29 (3.5)
Injection site reaction 2 (0.2) 45 (5.4)
Source: CS Table 21
The company noted that herpes virus infections were more common in patients receiving
ocrelizumab, although as can be seen in Table 29 the difference in frequency between trial
arms was relatively small. No cases of progressive multifocal leukoencephalopathy were
reported in patients who had been treated with ocrelizumab.
Neoplasms
During the 96-week trial duration, four neoplasms occurred in the ocrelizumab arms (2 breast
carcinoma, 1 renal cell carcinoma, 1 malignant melanoma) and two occurred in the interferon β-
1a arms (1 mantle cell lymphoma, 1 squamous cell carcinoma). The trial publication45 reports
that between the clinical cutoff dates of the two trials (April-May 2015) and June 2016, five
further cases of neoplasm were detected during the OLE study, during which all the patients
received ocrelizumab. (2 breast cancer, 2 basal-cell skin carcinoma, 1 malignant melanoma).
Based on an overall analysis of all the company’s MS trials up to June 2016, the overall
neoplasm incidence was 0.40 per 100 patient-years of exposure to ocrelizumab, compared to
0.2 per 100 patient-years in groups receiving interferon β-1a or placebo. The company
concludes (CS section B.2.13) that the neoplasms observed in the OPERA I and OPERA II
Copyright 2018 Queen's Printer and Controller of HMSO. All rights reserved.

Version 1 108
trials need further investigation in terms of the epidemiology of neoplasm in the population of
patients with MS and long term experience with ocrelizumab and other anti-CD20 treatments.
Mortality
The mortality rate in the OPERA trials was low, with only three deaths recorded among the 1651
trial participants, one in each arm of OPERA II and one in the interferon β-1a arm of OPERA I.
The deaths were not considered to be treatment-related.
Anti-drug antibodies
The CS reports the baseline prevalence and post-baseline incidence of anti-drug antibodies
(ADA) to ocrelizumab and interferon β-1a (CS Table 22). The company confirmed that the tests
for ADA were conducted at 6-monthly intervals during the OPERA trials (clarification A26). The
incidence of treatment-induced ocrelizumab ADA antibodies during the 96-week trial period was
low (3/807 tested patients; 0.4%) and was similar to the baseline prevalence (5/798 tested
patients; 0.6%). Of the three patients who had treatment-induced ADA in the ocrelizumab arm,
only one tested positive for neutralizing antibodies to ocrelizumab.
Opera OLE
The CS does not report adverse events for the OLE study. In response to a request from the
ERG (clarification A28) the company provided a summary of the numbers of adverse events per
100 patient-years of exposure to ocrelizumab experienced, for patients exposed to ocrelizumab
in the core OPERA trials and in the OLE study up to the latest clinical data cut-off, 17th February
2017. This included 2301 patients who were exposed to any part of an ocrelizumab dose, and
the mean number of doses received was 7.3.
The total (95% CI) number of events per 100 patient-years was:
OPERA trials: 289.66 (280.95 to 298.56);
OPERA trials + OLE study up to 20th January 2016: 241.65 (237.63 to 245.72);
OPERA trials + OLE study up to 17th February 2017: 225.70 (222.37 to 229.07).
These data show that overall rates of adverse events declined during the OLE study. The
company also provided corresponding event rates for deaths, serious adverse events, serious
infections, and infusion-related reactions leading to withdrawal at the first infusion (clarification
A28; not reproduced here). The company concluded in their clarification response that deaths,
Copyright 2018 Queen's Printer and Controller of HMSO. All rights reserved.

Version 1 109
serious AEs and serious infections had stable event rates during the OLE study, and showed no
increase compared with the controlled treatment periods, although rates of infusion-related
reactions decreased as expected. As at February 2017, no serious confirmed opportunistic
infections had been reported. The ERG agrees that the company’s interpretation of overall
adverse event rates in the OLE study appears reasonable, although numbers of individual
adverse events were not provided.
3.3.9.2 Adverse events in the phase II trial
The phase II trial consisted of an initial 24-week randomised comparison of ocrelizumab 600mg,
interferon β-1a (Avonex) and placebo, after which (weeks 24 to 96) patients in these groups all
received ocrelizumab 600mg.
Adverse events in the phase II trial are reported up to 48 weeks in CS Appendix F and the trial
publication,44 whilst overall adverse event rates up to 96 weeks were provided by the company
upon request from the ERG (clarification A7b). These data are summarised below.
Adverse events up to 48 weeks
Adverse events are reported separately for the 0-24 weeks randomised phase and the 24-48
weeks non-comparative period.
Weeks 0 to 24
The proportion of patients with any adverse event was lower in the ocrelizumab arm (62%) than
the placebo arm (70%), and the proportion with treatment-related adverse events was also
lower among patients receiving ocrelizumab (31%) than those receiving placebo (46%). Two
patients (4%) had to withdraw due to adverse events in the ocrelizumab arm compared to one
(2%) in the interferon β-1a arm, and none in the placebo arm. A larger proportion of patients
receiving ocrelizumab than interferon β-1a had at least one infection (42% versus 20%), but the
rate in the ocrelizumab group was comparable with the placebo group (41%). Overall, the
adverse event profile during the randomised treatment comparison is consistent with that of the
OPERA trials (likely reflecting the shorter duration of the phase II study).
Weeks 24 to 48
Following the switch to ocrelizumab in the interferon β-1a and placebo arms, the proportions of
patients with the various types of adverse event remained generally similar to those observed in
Copyright 2018 Queen's Printer and Controller of HMSO. All rights reserved.

Version 1 110
the ocrelizumab arm during weeks 0 to 24. As would be expected, the proportion of patients
with IRR at the start of cycle 2 was higher among patients previously on interferon β-1a (30%)
or placebo (42%) than those who had already received ocrelizumab (16%).
Neoplasms
The CS (Appendix F) and trial publication do not mention whether any neoplasms occurred
during the overall 48 weeks of the phase II trial, although the incidence of neoplasms is
captured in an analysis of the cancer risk across all of the company’s trials (section 3.3.9.1
above).
Mortality
No deaths occurred in the three study arms during the overall 48 weeks of study.
Anti-drug antibodies
CS Appendix F reports the incidence of human antihuman antibodies. It is not specified whether
the data provided for each trial arm are for antibodies against ocrelizumab and/or against
interferon β-1a (both of which were reported for the OPERA trials above), although it seems
reasonable to assume that all the data in Table 29 of CS Appendix F refer to ocrelizumab. The
data show that the incidence rates of the ADA in patients who received ocrelizumab were 0% at
week 12, 2.7% at week 24, and 0% at week 48, which are similar to or within the baseline
prevalence rate (2%). The highest incidence of ADA (2/31 patients tested; 6.5%) was at week
24 in patients who were receiving interferon β-1a.
Adverse event rates up to 96 weeks
Total event rates were provided by the company for adverse events and serious adverse events
(clarification A7b). These indicate that overall rates of adverse events generally decreased in
the three study groups during 96 weeks of treatment (Table 32). Rates of serious adverse were
highest in cycle 3, affecting a maximum of four patients (8%) in the group who had received
interferon β-1a in cycle 1, before declining again in cycle 4. No data on frequencies of specific
adverse events over 96 weeks were provided by the company. The company concluded
(clarification A7b) that the adverse event profile of ocrelizumab during the open label treatment
period up to week 96 was consistent with observations during the first 24 weeks. The ERG
agrees is a reasonable conclusion regarding overall event rates but we would have preferred to
see more detailed data on the specific types of adverse events that occurred.
Copyright 2018 Queen's Printer and Controller of HMSO. All rights reserved.

Version 1 111
Table 31 Summary of adverse events up to 48 weeks in the phase II trial Outcome
n (%) of patients with
Week Ocrelizumab (n=55)
Interferon β-1a
(Avonex)
(n=54)
Placebo (n=54)
Any AE 0 to 24 34 (61.8) 30 (55.6) 38 (70.4)
24 to 48 26 (52.0) 30 (60.0) 36 (67.9)
Serious AE 0 to 24 1 (1.8) 2 (3.7) 2 (3.7)
24 to 48 1 (2.0) 3 (6.0) 1 (1.9)
AE leading to withdrawal 0 to 24 2 (3.6) 1 (1.9) 0
24 to 48 0 1 (2.0) 0
Any treatment-related AE (TRAE)
0 to 24
17 (30.9) 19 (35.2) 25 (46.3)
Most common TRAE:
Influenza-like illness 0 10 (18.5) 0
Headache 1 (1.8) 5 (9.3) 3 (5.6)
Urinary tract infection 3 (5.5) 1 (1.9) 5 (9.3)
Upper respiratory tract infection 4 (7.3) 0 2 (3.7)
Nasopharyngitis 1 (1.8) 3 (5.6) 2 (3.7)
Chills 1 (1.8) 3 (5.6) 0
MS relapse 1 (1.8) 0 3 (5.6)
Oral herpes 1 (1.8) 0 3 (5.6)
Any treatment-related AE (TRAE)
24 to 48
7 (14.0) 7 (14.0) 13 (24.5)
Most common TRAE:
Urinary tract infection 0 0 3 (5.7)
Headache 1 (2.0) 2 (4.0) 2 (3.8)
Nausea 0 2 (4.0) 0
Upper respiratory tract infection 0 1 (2.0) 2 (3.8)
Respiratory tract infection 1 (2.0) 1 (2.0) 2 (3.8)
Any infection 0 to 24 23 (41.8) 11 (20.4) 22 (40.7)
24 to 48 17 (34.0) 13 (26.0) 16 (30.4)
Serious infection 0 to 24 0 (0) 0 (0) 1 (1.9)
24 to 48 1 (2.0) 1 (2.0) 1 (1.9)
Infusion-related reactions: Cycle 1 Day 1 19 (34.5) - 5 (9.3)
Cycle 1 Day 15 2 (3.8) - 6 (11.1)
Cycle 2 Day 1 8 (16.0) 15 (30.0) 22 (41.5)
Cycle 2 Day 15 1 (2.0) 1 (2.1) 2 (3.8)
Source: CS Appendix F
Copyright 2018 Queen's Printer and Controller of HMSO. All rights reserved.

Version 1 112
Table 32 Overall adverse event rates up to 96 weeks in the phase II trial Assessment time Outcome Ocrelizumab a
Interferon β-1a
Placebo
Weeks 0 to 24
(cycle 1)
Safety population n=55 n=54 n=54
Patients with AE, n (%) 35 (63.6) 32 (59.3) 38 (70.4)
Number of AE 116 91 117
Patients with SAE, n
(%)
1 (1.8) 2 (3.7) 2 (3.7)
Weeks 24 to 48
(cycle 2)
Safety population n=50 n=50 n=53
Patients with AE, n (%) 27 (54.0) 30 (60.0 38 (71.7)
Number of AE 74 66 88
Patients with SAE, n
(%)
1 (2.0) 3 (6.0) 1 (1.9)
Weeks 48 to 72
(cycle 3)
Safety population n=49 n=49 n=50
Patients with AE, n (%) 24 (49.0) 19 (38.8) 25 (50.0)
Number of AE 53 46 43
Patients with SAE, n
(%)
3 (6.1) 4 (8.2) 1 (2.0)
Weeks 72 to 96
(cycle 4)
Safety population n=46 n=46 n=49
Patients with AE, n (%) 21 (45.7) 16 (34.8) 24 (49.0)
Number of AE 34 28 42
Patients with SAE, n
(%)
- 2 (4.3) -
Source: Company clarification A7b a Data for ocrelizumab 600mg (data for ocrelizumab 2000mg group not reproduced here)
In their clarification the company mentioned that following the 96 weeks of ocrelizumab in the
phase II trial there was a treatment-free period of variable duration (minimum 48 weeks).
Patients who completed both the main (96-week) treatment period and the treatment-free period
were invited to participate in an open label extension study during which they received
ocrelizumab 600 mg every 24 weeks (clarification A7b). The company stated that due to the low
number of patients that entered the open-label extension study and the fact that selection bias
cannot be excluded, data should be interpreted with caution. According to the company, no new
safety findings were identified during the treatment-free or open-label extension periods; no
increase in the rate or incidence of infections or serious infections was observed compared with
the main 96-week treatment period; and the IRR profile observed during the open-label
extension was consistent with the main 96-week treatment period in terms of severity and
nature of symptoms. No data were provided in support of these specific conclusions.
Copyright 2018 Queen's Printer and Controller of HMSO. All rights reserved.

Version 1 113
3.3.9.3 Summary of safety issues
Overall, the safety data provided by the company suggests that the most frequent adverse
events experienced by patients receiving ocrelizumab are generally similar to those experienced
by patients receiving interferon β-1a (either as Rebif or Avonex), including headache, upper
respiratory tract infection, nasopharyngitis, urinary tract infection and fatigue. Ocrelizumab is not
associated with the influenza-like symptoms and injection-site reactions typical of interferon β-
1a and slightly fewer patients on ocrelizumab seem to experience headache than those
receiving the interferon β-1a. IRR are a common problem with ocrelizumab but typically
decrease after the first infusion. Across the company’s trials the prevalence of neoplasms
among patients receiving ocrelizumab is low, but it is higher than among patients receiving
interferon β-1a or placebo, which warrants further investigation in the longer term. The baseline
prevalence and post-baseline incidence of anti-drug antibodies were low in the OPERA trials
(<1%), although slightly higher in the phase II trial (maximum 6.5%). The ERG agrees with the
company’s assertion that ocrelizumab has a generally favourable safety profile compared to the
β-interferons. Based on the aggregate data, no new safety issues appear to have arisen in the
longer-term phases of the trials compared to the randomised comparison periods.
Copyright 2018 Queen's Printer and Controller of HMSO. All rights reserved.

Version 1 114
4 COST EFFECTIVENESS
4.1 Overview of the company’s economic evaluation
The company’s submission to NICE includes:
A review of published economic evaluations of ocrelizumab compared with other DMTs
or placebo for adults with RRMS (CS Section B.3.1).
A report of an economic evaluation undertaken for the NICE STA process, comparing
ocrelizumab with the following comparators in patients with RRMS: IFNβ-1a (Avonex,
Rebif), IFNβ-1b, PEGβ-1a, glatiramer acetate, teriflunomide, dimethyl fumarate,
fingolimod, alemtuzumab, natalizumab, daclizumab (CS Section B3.2).
4.2 Company’s review of published economic evaluations
The company conducted a systematic search to identify economic evaluations of DMTs for
multiple sclerosis. This broad review was conducted to inform economic modelling and HTA
across multiple countries. Details of the review methods are reported in CS Appendix G. It
included economic evaluations (cost-utility, cost-effectiveness, cost-benefit and cost-
minimisation studies) of selected disease modifying therapies (IFNβ-1a, IFNβ-1b, GA,
natalizumab, fingolimod, teriflunomide, alemtuzumab or DMF) in comparison with any active
treatment or placebo, for adults (age ≥ 18 years) diagnosed with multiple sclerosis, with a
primary focus on RRMS, SPMS and PPMS. The search was conducted in March 2016 and
updated in March 2017, and included the MEDLINE, Embase, Cochrane Library and EconLit
databases, as well as supplementary searches of reference lists, conference proceedings,
websites and HTA documents. In total, the initial review and update included 55 full
publications, covering 53 unique economic evaluations. The PRISMA diagram is shown in
Figure 42 of CS Appendix G. The company lists excluded papers but not those that were
included, and no further details are given about the overall nature or quality of the included
studies.
The main text of the CS (section B.3.1) reports that 33 unique studies relating to RRMS as well
as 7 previous NICE appraisals were identified from the systematic review, but that none of these
related to modelling the cost-effectiveness of ocrelizumab.
The ERG has identified two more recent papers reporting economic analyses of ocrelizumab
compared with INFβ-1a, based on results from the OPERA I and II trials. The Yang et al. study
was funded by Genentech and used a model with the same structure as the submitted model
Copyright 2018 Queen's Printer and Controller of HMSO. All rights reserved.

Version 1 115
and many of the same assumptions.63 They reported that over a 20-year time horizon and
discounted at 3% per year, ocrelizumab would yield an estimated 14.557 life years and 6.826
QALYs, compared with 14.511 life years and 6.270 QALYs with INFβ-1a: a gain of 0.046 life
years and 0.556 QALYs. Ocrelizumab was estimated as cost-saving compared with IFNβ-1a,
although the cost results are not relevant for this appraisal because they are based on US costs
and resource use. The other study by Frasco et al., also funded by Genentech, used a different
model structure and longer time horizon (30 years), yielding a larger estimate of the QALY gain:
0.84 for ocrelizumab vs. INFβ-1a.Frasco, Shih (64)
The company did report a published health technology assessment prepared by the Institute for
Clinical and Economic Review for the California Technology Assessment Forum (CTAF) on
DMTs for MS, including ocrelizumab for relapsing disease.24 This included a systematic review
and MTC of clinical evidence and a cost-effectiveness model. The basic structure of the CTAF
HTA model was similar to the company’s submitted model: with 20 basic health states, EDSS
0–9 for RRMS, EDSS 1–9 for SPMS and death. However, there were some differences in
assumptions and parameter sources. For example, the CTAF HTA modelled a new-onset,
treatment-naïve RRMS population from age 29 years, whereas the company model started with
an older population (age 37 years), some previously-treated. The CTAF HTA model assumed
second-line treatment (evenly split between other commonly-used drugs) after discontinuation
of initial treatment, whereas the company assumed that patients would move directly to best
supportive care. Another difference was that the CTAF HTA did not assume discontinuation of
treatment following conversion to SPMS. The CTAF base case results indicated that
ocrelizumab is the second most effective treatment, with 10.94 QALYs over a lifetime, following
a maximum of 12.46 QALYs for alemtuzumab. The analysis was conducted from a US
healthcare payer perspective and the price of ocrelizumab was not available at the time of
analysis, so the cost and cost-effectiveness results are not relevant for the NICE appraisal.
In summary, there are no published analyses that provide cost-effectiveness estimates that are
relevant to the current appraisal. However, the modelled estimates of QALYs from the CTAF
assessment report and the analyses based on the OPERA trials by Yang et al. and Frasco et al.
provide a basis to cross-check the results of the submitted model. We discuss this further in
section 4.3.5 below.
Copyright 2018 Queen's Printer and Controller of HMSO. All rights reserved.

Version 1 116
4.3 Summary and critique of the company’s model
4.3.1 NICE reference case
Table 33 summarises the ERG assessment of whether the CS meets the NICE reference case
requirements. We conclude that it does, but note that cost-effectiveness estimates are not
presented for the whole population and all patient subgroups requested by NICE. We discuss
this in section 4.3.2 below.
The company does not present results for all comparators in the scope. They exclude
daclizumab, arguing that it is not an appropriate comparator due to the EMA alert regarding its
safety.16 Alemtuzumab is also excluded from results for the HA and RES subgroups. The main
text of the CS only presents results for the β-interferon drugs (including pegylated β-interferon)
and glatiramer acetate together in a ‘blended ABCR’ comparator. However, results for the
IFNβ-1a (Avonex an Rebif), IFNβ-1b, PEGβ -1a and GA are presented in Appendix J.1.2 of the
CS, and the model does include all comparators. The CS also presents results for some out of
scope indications: natalizumab and fingolimod are included in the main ITT analysis, although
they are only recommended for HA and RES subgroups. We discuss comparators further on
page 118 below.
In line with the NICE reference case, costs are estimated for health care funded by the NHS and
social care funded by local authority personal social service departments. The model includes
the facility to exclude non-medical (social care) costs and to include loss of wages (productivity
costs), but these options are not used in results presented in the CS.
Copyright 2018 Queen's Printer and Controller of HMSO. All rights reserved.

Version 1 117
Table 33 NICE reference case requirements
NICE reference case requirements:
Included in the CS
Comment
Decision problem: As per the scope developed by NICE
Yes Four subgroups not modelled:
Active SPMS
Inadequate response to previous treatment
Intolerance to previous treatment
Contraindicated to or unsuitable for alemtuzumab
Comparator: As listed in the scope developed by NICE
Yes Separate ‘ABCR’ drugs in Appendix J. Daclizumab results not presented in the CS, but available in model
Perspective on costs: NHS and PSS Yes
Evidence on resource use and costs: Costs should relate to NHS and PSS resources and should be valued using the prices relevant to the NHS and PSS
Yes
Perspective on outcomes: All direct health effects, whether for patients or, when relevant, carers
Yes Utility loss for carers is included, as in previous appraisals of DMTs for MS
Type of economic evaluation: Cost utility analysis with fully incremental analysis
Yes
Synthesis of evidence on outcomes: Based on a systematic review
Yes
Time horizon: Long enough to reflect all important differences in costs or outcomes between the technologies being compared
Yes 50 years
Measuring and valuing health effects: Health effect should be expressed in QALYs. The EQ-5D is the preferred measure of health-related quality of life.
Yes
Source of data for measurement of health-related quality of life: Reported directly by patients and/or carers.
Yes
Source of preference data: Representative sample of the UK population
Yes
Equity considerations: An additional QALY has the same weight regardless of the other characteristics of the individuals receiving the health benefit.
Yes
Discount rate: 3.5% per year for costs and health effects
Yes
Copyright 2018 Queen's Printer and Controller of HMSO. All rights reserved.

Version 1 118
4.3.2 Decision problem
4.3.2.1 Population
Ocrelizumab is licensed for treatment of adult patients with relapsing forms of multiple sclerosis
with active disease defined by clinical or imaging features.[EMA] This matches the NICE scope
for this appraisal.
The company used baseline characteristics of patients from the pooled OPERA I and II trials to
define the age (mean 37), gender (34% male) and EDSS distribution of the cohort in their model
(CS section B.3.3). Disease type (RRMS/SPMS) at baseline was not collected in these trials,
but the company estimate that upwards of 90% of patients in the OPERA trials could be
considered to have RRMS, based on a post-hoc analysis using ‘disease progression unrelated
to relapses’ as a proxy for SPMS (CS section B1.1). They conclude that evidence of the
effectiveness of ocrelizumab is only available for the RRMS population (CS section B.3.2.2).
The model is therefore tailored for the RRMS population and results are not estimated for
people with active SPMS.
We agree that the lack of baseline data on disease type in the OPERA trials makes it impossible
to separate the clinical effects of ocrelizumab for RRMS from those for relapsing SPMS.
However, it could be argued that the OPERA trials provide evidence for a mixed population of
patients with relapsing forms of MS, albeit with a predominance of RRMS. Experts advising the
ERG have suggested that, given its mode of action, ocrelizumab would be expected to reduce
inflammatory relapses in patients with active SPMS, although it would not prevent disability
progression due to neurodegeneration.
4.3.2.2 Subgroup analysis
Disease activity groups
The NICE scope distinguishes four subgroups based on disease activity:
1. Relapsing-remitting multiple sclerosis
2. Rapidly-evolving severe RRMS (RES)
3. Highly-active RRMS despite previous treatment (HA)
4. SPMS with active disease, evidenced by relapses (Active SPMS)
Comparators differ between groups 1 to 4 (see Table 34), so it is necessary that they are
modelled separately. This suggests that, although labelled as ‘relapsing-remitting multiple
sclerosis’, the first group should exclude people with RES or HA disease (because they are not
Copyright 2018 Queen's Printer and Controller of HMSO. All rights reserved.

Version 1 119
eligible for all of the same comparators). Group 1 above is therefore better thought of as ‘non-
HA/RES’ RRMS.
The company reports economic analyses for three RRMS groups (CS section B.3.2.2):
people with RRMS (labelled ‘ITT’ in the CS)
people with RES RRMS
people with HA RRMS despite previous treatment
The ITT group is modelled using clinical effectiveness results from the MTC for all randomised
patients analysed by ITT, and natural history data for the whole RRMS population. It therefore
incorporates the RES and HA subgroups. Despite this, the CS presents economic results for
the ITT population including comparators that are not appropriate for RES or HA (interferon-
beta, glatiramer acetate, teriflunomide and dimethyl fumarate). The use of ITT estimates of
effect might also bias the cost-effectiveness estimates for group 1 in the scope (non-HA/RES
RRMS). In response to a clarification question (A9), the company provided additional analysis of
the OPERA data for patients with non-HA/RES relapsing MS (Clarification question A9). The
disposition of participants between the HA, RES and non-HA/RES subgroups is shown in Figure
4 below.
Adapted from the company’s response to clarification
question A9. The ERG corrected the number of participants
in the HA and RES subgroups in the above graph to fit the
tabulated results (CS Tables 13 to 15)
Figure 4 Disposition of OPERA participants by subgroup
Copyright 2018 Queen's Printer and Controller of HMSO. All rights reserved.

Version 1 120
The results of the non-HA/RES subgroup analysis are shown in Tables 6-9 in the clarification
response. The effects of ocrelizumab on rates of disability progression (CDP-12 and CDP-24)
and all-cause treatment discontinuation were very similar for ITT and non-HA/RES analyses.
However, the estimated effect on the rate of relapses was lower in the non-HA/RES subgroup
than in the ITT analysis: rate ratio for ARR 0.535 (0.435 to 0.659) for ITT vs. 0.691 (0.538 to
0.888) for non-HA/RES. Thus the cost-effectiveness of ocrelizumab compared with IFNβ-1a is
likely to be worse for patients without HA or RES than is suggested in the company’s base case
results. We note that this is a post hoc analysis, conducted at the request of the ERG, and
should be treated with caution. The effect of excluding patients with HA or RES from the
comparisons with other DMTs is uncertain.
We do not have the non-HA/RES subgroup results for other trials included in the MTC, thus it is
not possible to adapt the company model to do a full comparative analysis for RRMS patients
without HA or RES.
Other patient subgroups
The company do not present economic results for other subgroups in the scope:
5. People whose disease has responded inadequately to previous treatment
6. People who could not tolerate previous treatment
7. People in whom alemtuzumab is contraindicated or otherwise unsuitable
The company cite the lack of comparative data in the public domain for a MTC, as justification
for not attempting economic analysis for these subgroups (CS section B.1.1). We agree that,
since the clinical trial publications for the comparator DMTs did not consistently report whether
trial participants were in any of these three subgroups, MTC networks would not have been
feasible for these subgroups.
The company do note that there is some evidence relevant to the ‘inadequate response’
subgroup from the pooled OPERA data (CS Appendix E). Ocrelizumab was on average more
effective for participants with active disease despite previous treatment for at least a year with
interferon or glatiramer acetate, compared with the ITT results. However, the confidence
intervals for this ‘active inadequate responder’ subgroup were wide and overlapped with those
for the ITT population. There is also a lack of evidence for people with inadequate response to
other comparators: as prior treatment with alemtuzumab, cladribine, daclizumab and
Copyright 2018 Queen's Printer and Controller of HMSO. All rights reserved.

Version 1 121
teriflunomide were exclusion criteria in the OPERA trials; and very few patients had been
previously treated with natalizumab, fingolimod or dimethyl fumarate (CS section B.2.3). The
company did not attempt subgroup analysis of the OPERA data for people who could not
tolerate previous treatment or who were contraindicated or unsuitable for alemtuzumab.
In summary, the ERG accepts that separate economic analysis for the inadequate response,
intolerance and contraindicated/unsuitable for alemtuzumab subgroups would not be feasible.
4.3.2.3 Comparators
The company’s economic model includes all of the comparators specified in the scope for
relapsing-remitting disease, see section B.3.2.3 of the CS. A summary of the availability of
results for different comparators by subgroup is shown in Table 34 below.
Table 34 Treatments included in company economic analysis
Drug Availability of results by disease activity subgroup
RRMS (ITT) HA RRMS RES RRMS Active SPMS
Ocrelizumab CS Tables 55/56 CS Table 66/67 CS Table 70/71
Blended ABCR CS Tables 55/56
IFNβ-1a Appendix J Model only a Model only a
IFNβ-1b Appendix J Model only a Model only a
PEGβ -1a Appendix J
GA Appendix J Model only a Model only a
Teriflunomide CS Tables 55/56
DMF CS Tables 55/56
Fingolimod CS Tables 55/56 CS Table 66/67 Model only a
Alemtuzumab b CS Tables 55/56 Model only a Model only a
Natalizumab CS Tables 55/56 CS Table 70/71
Daclizumab c Model only a Model only a Model only a
BSC
Shaded cells indicate that drug is not included in scope for defined subgroup a Not presented in company results, but available in model b Results presented with and without alemtuzumab as comparator c Additional restrictions in scope: where alemtuzumab is contraindicated to or otherwise unsuitable, and for patients with RES only if disease previously treated with DMT
Copyright 2018 Queen's Printer and Controller of HMSO. All rights reserved.

Version 1 122
Alemtuzumab
The company present their base case results including alemtuzumab (Table 56 page 127), but
also report an analysis excluding alemtuzumab (Table 57, page 128). Their rationale for this is
that it is important to maintain treatment choice because the “trade-offs between efficacy, safety,
convenience, resource use and cost” mean that alemtuzumab will not be suitable for every
patient (page 126). The CS does not report results for alemtuzumab in the HA and RES
subgroups, because effects on disability progression were not available from the MTC for the
CDP-12 measure, which the company use in their base case analysis (CS page 142).
However, the model does allow calculation of subgroup results for alemtuzumab with the CDP-
24 measure of progression, which we use as our base case.
Daclizumab
The company include daclizumab in their model but exclude it from tables of economic results.
They justify this by arguing that daclizumab is no longer a relevant comparator due to an EMA
safety warning that has restricted its use to ‘patients who have had an inadequate response to
at least two DMTs and cannot be treated with other DMTs’ (CS page 10).16 However, we
present results for daclizumab below, because it is still within scope. However, to aid committee
decision making, where relevant we also report incremental ICERs excluding daclizumab.
Blended ABCRs
The main text of the CS only gives results for a ‘blended ABCR’ comparator - a weighted mean
of the interferon-beta drugs (IFNβ-1a, IFNβ-1b and PEGβ-1a) and glatiramer acetate. The
company justify this by stating that these drugs are ‘generally considered by clinicians to be
broadly equivalent’ (CS page 125). The results were pooled using weightings based on market
share (page 125). The market share estimates were derived from confidential NHiS data from
92 out of 170 NHS Trusts in May-June 2017, obtained through freedom of information requests
to all hospital Trusts in the UK (Clarification response, question B1). Separate results are
presented for each drug in the blended ABCR comparator in Appendix J (page 180). The
company argue that results are insensitive to the weighting used for the ABCR comparator.
However, the pairwise ICERs comparing ocrelizumab with each drug in the ABCR comparator
does show some variation (Table 62 Appendix J.1.2). We present results below with the ABCR
blended comparator, but also for separate drugs comparator when relevant.
Copyright 2018 Queen's Printer and Controller of HMSO. All rights reserved.

Version 1 123
Out of scope comparators
The company report results for natalizumab and fingolimod for the broad RRMS (ITT)
population, which are not in the scope (CS Tables 56-58, pages 127-128). The model also has
the capacity to include some other comparators that are excluded from the scope: IFNβ-1a,
IFNβ-1b, PEGβ-1a and glatiramer acetate for the HA and RES groups; and fingolimod for the
RES group. We do not include any of these comparators in ERG analyses.
4.3.3 Model structure and assumptions
4.3.3.1 Overview of model structure
Key features of the model are described on pages 84-91 of the CS. The model structure is
illustrated in Figure 24 (CS page 85), replicated below.
Figure 5 Illustration of model structure (copied from CS Figure 24)
The model is a cohort health state transition model of a Markov type. It uses a one-year cycle,
updating the distribution of the cohort between health states, costs and outcomes annually. A
‘half-cycle correction’ (HCC) is used to adjust costs and QALYs for the timing of events within a
year. The company argue that the HCC should not be applied for alemtuzumab, which is
always administered at the beginning of a model cycle. The coding of the model makes it
difficult to turn off the HCC, so instead the company apply an uplift of 5% to the price of
Copyright 2018 Queen's Printer and Controller of HMSO. All rights reserved.

Version 1 124
alemtuzumab to offset the HCC. We tested the appropriateness of this adjustment and also
consider whether an adjustment should also be applied for the first of the two annual doses of
ocrelizumab, which is also applied at the beginning of the model cycle (see section 4.5.1 below).
The model uses a 50-year time horizon, taking the cohort from an initial age of 37 years up to
87 years.
The health states are defined by the following characteristics:
Disease type: the model starts with a cohort of people with RRMS. Over time, members
of the cohort may convert to SPMS.
Treatment status: patients start on ocrelizumab or one of the comparator drugs (DMT).
After discontinuation of treatment, patients receive best supportive care (BSC). The
model does not allow for a second line or sequencing of DMT. It is also assumed that
after conversion to SPMS, patients only receive BSC.
Level of disability: EDSS 0 to 9 - a higher score indicating worse disability. Although
EDSS allows half point increments, the model only uses integer values. This is
consistent with models in previous NICE appraisals and reported data. Due to treatment
stopping rules (see below), there are no patients on DMT with EDSS greater than 6. It is
also assumed that patients with SPMS cannot have an EDSS score less than 2.
The model therefore includes 31 health states, including death. However, 5 of the EDSS states
are always empty (EDSS states 7 to 9 in RRMS and EDSS-0 and 1 in SPMS, shown in grey in
Figure 5).
Each year, members of the cohort can make one of the following transitions:
Disability progression: The base case model uses transition probabilities between
EDSS states estimated from natural history data. Due to the progressive nature of MS,
disability tends to increase over time, although it can sometimes improve: thus the base
case model allows transitions to higher or lower EDSS states. EDSS can change by
more than one level in a year, but large jumps are unlikely. The same probabilities are
assumed for transitions between EDSS states within SPMS as within RRMS. A different
set of probabilities is used for the RES and HA subgroups, reflecting the more rapid
progression of disability in these groups. Treatment modifies the probabilities of EDSS
Copyright 2018 Queen's Printer and Controller of HMSO. All rights reserved.

Version 1 125
progression in accordance with CDP effects from the mixed treatment comparison (ITT,
RES and HA groups). In their base case, the company uses CDP-12 as the measure of
progression, but CDP-24 is used in sensitivity analysis. By assumption, treatment does
not affect rates of disability regression.
Treatment discontinuation: Patients on DMT may stop treatment for various reasons,
including intolerance and inadequate response. The model assumes a constant annual
probability of withdrawal for each drug in each subgroup (ITT, HA and RES), estimated
by MTC of all-cause discontinuation. In addition, treatment is assumed to stop when
patients progress beyond EDSS 6 or after conversion to SPMS. These stopping rules
are based on NHS England policy and ABN guidelines.6, 65 After discontinuation,
patients are assumed to receive only BSC, with no lasting effects of DMT.
Conversion to SPMS: Each year, there is a chance that patients with RRMS may
convert to SPMS, estimated from natural history data. The probability of conversion is
higher for patients with worse disability (higher EDSS). The conversion probabilities by
EDSS state are assumed constant over time and do not differ for the HA and RES
subgroups. Treatment is assumed to modify the probability of conversion to SPMS by
50% of the effect on disability progression. By assumption, conversion to SPMS is
accompanied by a one-point increase in EDSS and cessation of any DMT. SPMS is
defined as a chronic state, so transition back to RRMS is not allowed.
Mortality: Death can occur from any health state. For patients without disability (EDSS
0), mortality rates are the same as in the general population (by age and sex), but
increase with EDSS. The relative risks of mortality by EDSS level are the same for
RRMS (ITT, HA and RES) and SPMS. Treatment does not have a direct effect on
mortality, although there is an indirect effect through delay in disability progression.
In addition to state transitions the model includes two other important outcomes:
Relapse rates: Each health state is associated with a mean number of relapses per
year, the ARR, estimated from natural history data. ARR tends to decrease with time
since diagnosis and hence with increasing EDSS. The ARR is higher for people with
more active forms of RRMS, including RES and HA, and lower in SPMS. Treatment
modifies the relapse rate, reducing the mean ARR at each level of EDSS. Estimates of
the relative reductions in ARR for each DMT and subgroup come from the MTC.
Copyright 2018 Queen's Printer and Controller of HMSO. All rights reserved.

Version 1 126
Adverse events: The types and incidences of AEs vary between DMT drugs. The
model incorporates AEs with an occurrence of 5% or more in either arm of the pooled
OPERA I and II trial data. This includes infusion-related reactions and injection site
pain, a range of infections, musculoskeletal symptoms, depression, fatigue, headache
and insomnia. In addition, PML was included because of its high cost and patient
impact. Each of the included AEs is associated with an annual incidence for each DMT,
which is assumed constant over time. Estimates of AE rates come from the pooled
analysis of the OPERA data and a previous submission to NICE (Daclizumab).66
4.3.3.2 Treatment effects
In summary, DMTs are associated with the following benefits and harms, in comparison with
best supportive care (placebo):
Reduced rate of relapses (ARR)
Reduced rate of disability progression (CDP)
Reduced probability of conversion to SPMS
Annual incidence of a range of adverse events
Indirect reduction of mortality rates through delayed disability progression
In the base case model, these effects apply continuously regardless of treatment duration (there
is no ‘waning’ of treatment effects), but they cease immediately on discontinuation. The impact
of treatment waning is tested in two scenario analyses: one with the same waning assumptions
for all DMTs (25% loss of effect in years 2-5 and 50% loss from year 6); and another with the
same waning assumptions for comparators but delayed waning for ocrelizumab (25% loss for
years 5-7 and 50% loss from year 8). The company justifies the latter based on persistence of
effects for 4 years in the ocrelizumab open label extension study (CS pages 101-2).
4.3.3.3 Health-related quality of life
QALYs accumulate in the model as a function of the number of years that the cohort spend in
the different health states and utility values associated with those states. Health state utility
values are calculated from five components, shown below. The model assumes that these
values do not differ by patient group or subgroup.
For patients, utility depends on:
1) their level of disability, with declining utility from EDSS 0 to 9;
2) an additional utility loss after conversion to SPMS;
Copyright 2018 Queen's Printer and Controller of HMSO. All rights reserved.

Version 1 127
3) the utility loss associated with a relapse; and
4) the utility loss associated with each type of adverse event.
For caregivers:
5) loss of utility related to the patient’s level of disability (EDSS)
4.3.3.4 Health and social care costs
The model includes the following categories of cost:
1) Treatment costs: drug acquisition, administration and monitoring by DMT
2) Health state costs by EDSS state and additional cost for SPMS
3) The additional cost of care during relapses
4) The cost of care and treatment for each type of adverse event
Health state costs and the costs per relapse and per adverse event do not differ by patient
subgroup or treatment.
4.3.4 Model parameters
The company model includes five sets of parameters: demographics, transition probabilities,
treatment effects, utilities, and resource use and costs, as summarised in CS Table 53.
4.3.4.1 Baseline population
The OPERA I and II trials are discussed in detail in section 3.1.3.1 above. The company pooled
patient-level data from these two trials to determine mean age, gender and EDSS distribution at
baseline. Given the similarity between the values for the ITT population and the HA and RES
subgroups (CS Table 26), the company decided to use the ITT values for the subgroups. The
company tested the impact of applying baseline characteristics from the UK MS Risk Sharing
Scheme (RSS) in a scenario analysis (Pickin et al 2009)67. It is not clear how these values from
RSS were obtained, as only a graphical distribution of baseline EDSS scores is reported by
Pickin et al. We present values used in the company’s base case analysis and scenario analysis
in Table 35. On average, the OPERA trial participants were younger with lower levels of
disability than participants in the UK MS RSS.
The best source of baseline patient characteristics is not clear-cut. Although the RSS dataset is
large and specific to the UK, it was collected prior to routine use of DMT (2002-2005) and might
not be reflective of the current UK patient population. The OPERA trials recruited from 2011, but
it appears that only a small number of patients were from UK sites (ERG Table 10) and
Copyright 2018 Queen's Printer and Controller of HMSO. All rights reserved.

Version 1 128
inclusion/ exclusion criteria would have restricted the study population. On balance, the ERG
agrees with the company that the OPERA population provides a more appropriate
characterisation of the baseline population than the RSS.
Table 35 Baseline patient characteristics: adapted from CS Table 26 and model
Characteristic Base case
OPERA pooled ITT population
(n=1656)
Scenario analysis
UK MS Risk Sharing Scheme a
(n=3730)
Mean age (years) 37.2 39.3
Gender (% male) 34 25 b
EDSS, n (%)
0 51 (3.1) 112 (3.0)
1 312 (18.9) 261 (7.0)
2 504 (30.5) 746 (20.0)
3 389 (23.5) 727 (19.5)
4 244 (14.7) 765 (20.5)
5 145 (8.8) 373 (10.0)
6 10 (0.6) 578 (15.5)
7 0 (0.0) 168 (4.5)
8 0 (0.0) 0 (0.0)
9 0 (0.0) 0 (0.0) a Derived from Pickin et al. 200967
b In total number of patients recruited to start DMT for the first time (n=4871)
4.3.4.2 Natural history
The model requires parameters to describe the ‘natural history’ of the baseline population in the
absence of DMT; that is, with only best supportive care. This includes annual probabilities for
transitions: disability progression in RRMS; conversion from RRMS to SPMS; disability
progression in SPMS; and mortality. In addition, annual rates of relapse are required for each
health state. The company recognises the inadequacy of short term trials (OPERA I and II) and
opts to use real-world longitudinal observational data where possible. The lack of a placebo arm
further limits the use of the OPERA trials to explore the natural progression of MS. The ERG
agrees that the company’s preference for longer term data is reasonable. We discuss the
company’s data sources for each set of natural history parameters below.
Disability progression in RRMS
The model requires a transition matrix to define the annual probabilities of moving between
RRMS EDSS states. Two sources of data to define this matrix are cited in the CS: the British
Columbia and the London Ontario datasets. Previous NICE appraisals have used these data,
sometimes in combination with other data sources. For emphasis, we reproduce CS Table 27,
Copyright 2018 Queen's Printer and Controller of HMSO. All rights reserved.

Version 1 129
which itemises the company’s summary of major differences between the British Columbia and
the London Ontario datasets (see Table 36 below).
Table 36 CS Key differences between natural history datasets: CS Table 27
British Columbia London Ontario
Used in UK RSS and recent NICE appraisals (TA441 and ongoing ID809)
Used in older NICE appraisals (TA32, TA127, TA254, TA303, TA312, TA320)
Includes data on 898 patients Includes data on 345 patients
Follow up period 1980 - 1995 Follow up period 1972 – 1989
Improvements in EDSS allowed No improvements in EDSS allowed
Transitions available for all health states No transitions available for EDSS 0 and 9 (RRMS) or EDSS 0, 1, and 9 (SPMS)
Single matrix for mixed population of RRMS and SPMS patients
Separate matrices for RRMS and SPMS patients
The London Ontario estimates of transition probabilities between the RRMS EDSS health states
are reproduced (Commercial in Confidence) in Table 29 of the CS (section B.3.3). These were
derived in analysis conducted for the 2002 NICE appraisal of beta-interferon and glatiramer
acetate.68, 69 The analysis was subsequently criticised for retrospective smoothing to censor
improvements in EDSS states.70 The company argues that recent evidence from experts
supports health state regressions as well as progressions, as demonstrated by analysis of the
British Columbia dataset (Palace et al 2014).70
In line with the most recent NICE appraisals (TA441 and TA320), the company uses the
transition matrix derived from the British Columbia dataset (Table 37) for their base case
analysis. This was based on a subset of patients from the British Columbia database age ≥ 28
years, with EDSS ≤ 6.5, at least two relapses in the previous 2 years and included some
patients with SPMS (15.7%). The company explores the impact of using the London Ontario
dataset in a scenario analysis. We agree with this approach.
For the RES and HA subgroups, the CS applies a transition matrix that reflects more active
disease. This matrix was derived from the placebo arm in the AFFIRM phase III study for a RES
subgroup, and was used in the natalizumab NICE appraisal (TA127).15 In the absence of
published data, the company uses the same matrix to reflect transition in the HA subgroup. The
company uses data from the British Columbia matrix to impute data for EDSS states 7 and
Copyright 2018 Queen's Printer and Controller of HMSO. All rights reserved.

Version 1 130
above which were not available from the AFFIRM study (CS Table 30). The CS acknowledges
that the transition matrix for the subgroups is less robust due to a smaller sample size.
Table 37 Disability transition matrix (British Columbia): CS Table 28
EDSS EDSS state in following year
0 1 2 3 4 5 6 7 8 9
Cu
rren
t E
DS
S s
tate
0 0.6954 0.2029 0.0725 0.0217 0.0042 0.0014 0.0018 0.0001 0.0000 0.0000
1 0.0583 0.6950 0.1578 0.0609 0.0164 0.0046 0.0064 0.0005 0.0001 0.0000
2 0.0159 0.1213 0.6079 0.1680 0.0446 0.0185 0.0216 0.0017 0.0005 0.0000
3 0.0059 0.0496 0.1201 0.5442 0.0911 0.0585 0.1165 0.0103 0.0036 0.0003
4 0.0017 0.0221 0.0666 0.1152 0.4894 0.1039 0.1681 0.0258 0.0067 0.0006
5 0.0005 0.0053 0.0294 0.0587 0.0874 0.4870 0.2731 0.0388 0.0188 0.0010
6 0.0001 0.0013 0.0044 0.0250 0.0307 0.0408 0.7407 0.1090 0.0438 0.0042
7 0.0000 0.0002 0.0005 0.0025 0.0073 0.0039 0.1168 0.6927 0.1606 0.0156
8 0.0000 0.0000 0.0000 0.0003 0.0006 0.0005 0.0188 0.0557 0.9034 0.0207
9 0.0000 0.0000 0.0000 0.0000 0.0000 0.0000 0.0018 0.0057 0.1741 0.8183
Source: Palace et al 201470: Age at onset ≥ 28 years, RRMS and SPMS.
Underlined values adjusted so that rows sum to 1.
Conversion from RRMS to SPMS
The company relies on estimates of the annual probability of conversion from RRMS to SPMS
derived from the London Ontario dataset (see Table 38). Estimates of conversion probabilities
are not available from the British Colombia dataset, as this was not analysed separately for
people with RRMS and SPMS. The company use the same SPMS conversion probabilities for
the ITT population and the HA and RES subgroups, arguing that the conversion from RRMS to
SPMS is primarily driven by EDSS state. Given the faster rate of disability progression for the
RES and HA subgroups, the model will still predict that they convert to secondary-progressive
disease more quickly than patients with less active disease.
Table 38 Annual probability of conversion to SPMS (London Ontario): CS Table 31 EDSS 0 1 2 3 4 5 6 7 8 9
Probability *** ***** ***** ***** ***** ***** **** ***** ***** *
Copyright 2018 Queen's Printer and Controller of HMSO. All rights reserved.

Version 1 131
Disability progression in SPMS
The company applies the same dataset from the British Columbia study for EDSS progression
in SPMS as in RRMS (Table 37). They justify this by noting that the British Columbia study
included both RRMS and SPMS patients. This is true, although SPMS patients represented a
small proportion (16%) of the total number of patients in the cohort. We note that Yang et al.
took a more conservative approach in their economic evaluation of ocrelizumab by assuming
that EDSS regression was not possible in SPMS.63 The company has included an option to
apply this assumption in their model, by constraining the British Colombia disability transition
matrix to prevent improvements for patients with SPMS. We apply this approach in scenario
analysis.
The company applied the British Columbia transition matrix for the RES and HA subgroups after
conversion to SPMS. The London Ontario dataset was tested in sensitivity analysis (CS Table
32).
Relapse rates
Annual relapse rates by EDSS states are reported in CS Tables 35 and 36. The OPERA trials
lacked a placebo-controlled arm, so do not reflect the natural history of relapse. Estimates are
therefore based on pre-treatment natural history data. The company base case uses estimates
for the ITT population from the natalizumab appraisal (TA127).15 See Table 38 below. These
were based on two sources: the ARR by year since diagnosis reported by Patzold et al. 198271;
and EDSS state by year since diagnosis from the UK MS Survey (Orme et al. 2007)72, reported
TA127. Relapse rates for the HA and RES subgroups were estimated based on a relative risk
of relapse of 1.98 for RES vs. ITT in the AFFIRM trial, as reported in the natalizumab CS
(TA127).
Copyright 2018 Queen's Printer and Controller of HMSO. All rights reserved.

Version 1 132
Table 39 ARR by EDSS state and subgroup: CS Tables 35 and 36
EDSS ITT RES/HA
RRMS SPMS RRMS SPMS
0 0.709 0 1.407 0
1 0.729 0 1.448 0
2 0.676 0.465 1.343 0.923
3 0.720 0.875 1.430 1.738
4 0.705 0.545 1.400 1.083
5 0.591 0.524 1.173 1.041
6 0.490 0.453 0.972 0.900
7 0.508 0.340 1.009 0.676
8 0.508 0.340 1.009 0.676
9 0.508 0.340 1.009 0.676
We note that as the frequencies of relapses are expected to decrease with progression, there
are some estimates in Table 39 that appear anomalous (e.g. the ARR increases between EDSS
levels 2 and 3, and between levels 6 and 7). This leads us to question the robustness of these
estimates. Some alternative sources were reported in the economic model, based on other
previous NICE appraisals, but these have similar inconsistencies. Given the lack of a more
credible alternative, we agree with the company’s approach, but highlight the sensitivity of
results to relapse rates.
Mortality
The company’s model applies mortality multipliers for MS to all-cause mortality rates derived
from the most recent national life tables for England and Wales (ONS 2013-15).73 The mortality
multipliers by EDSS state are taken from estimates in the NICE appraisal of fingolimod
(TA254)13. See Table 40. The company’s model assumes that mortality per EDSS state is the
same for RMSS and SPMS patients as well as for subgroups with more active disease. The CS
does not model a direct treatment effect on mortality. The ERG agrees that an indirect treatment
effect is reflected through treatment effects on disability progression.
Table 40 MS mortality multipliers by EDSS: CS Table 37
EDSS 0 1 2 3 4 5 6 7 8 9
Mortality multiplier 1.00 1.43 1.60 1.64 1.67 1.84 2.27 3.10 4.45 6.45
Copyright 2018 Queen's Printer and Controller of HMSO. All rights reserved.

Version 1 133
4.3.4.3 Treatment effects
Estimates of the relative effects of treatment on relapse rates, disability progression and
treatment discontinuation are based on the company’s MTC meta-analysis. The company
analysed separate networks of evidence for the HA and RES subgroups for the ARR and CDP
outcomes. Although they question the robustness these subgroup results, due to the sparsity of
the evidence base and use of post-hoc analyses, the company uses them in base case
analysis, with scenarios based on ITT results for the subgroups. Due to ERG concerns about
the MTC subgroup analyses (see section 3.1.6 above), we use the ITT results in our base case
and additional analyses presented below.
Effects on annual relapse rate
The base case uses estimates of relative risks for the ARR outcome from the MTC (section
3.1.6 above). These relative risks are multiplied by the ARR for each EDSS state under best
supportive care; the natural history rates described above.
Table 41 Treatment effects on relapse rates: relative risk vs. placebo ARR
Treatment
ITT HA RES
Median 95% CrI Median 95% CrI Media
n 95% CrI
Ocrelizumab **** **** **** **** **** **** **** **** ****
IFNβ-1a (Avonex) **** **** **** **** **** **** **** **** ****
IFNβ-1a (Rebif) **** **** **** **** **** **** **** **** ****
IFNβ-1b **** **** **** **** **** **** **** **** ****
PEGβ-1a **** **** ****
Glatiramer acetate **** **** **** **** **** **** **** **** ****
Alemtuzumab **** **** **** **** **** **** **** **** ****
Daclizumab **** **** **** **** **** **** **** **** ****
Dimethyl fumarate **** **** ****
Fingolimod **** **** **** **** **** **** **** **** ****
Natalizumab **** **** **** **** **** ****
Teriflunomide **** **** ****
Shaded cells show indications that are not included in the NICE scope
Copyright 2018 Queen's Printer and Controller of HMSO. All rights reserved.

Version 1 134
Effects on disability progression
Hazard ratios from the company’s MTC (section 3.1.6 above) are used in the model as the basis
of treatment effect on disease progression - see Table 42. The company conducted MTCs for
the ITT population and HA and RES subgroups, which are applied to the appropriate sets of
‘natural history’ transition probabilities.
The company uses the measure of confirmed disability progression (CDP) at 12 weeks in their
base case, reporting results at 24 weeks as a scenario analysis. They justify this on the basis
that CDP-24 is less robust, due to the lower quality and quantity of trial data available in the
MTC. However, it can be seen from Table 42 that CDP-24 estimates are available for all
indications in the scope, with the exception of two forms of beta-interferon for the ITT group and
daclizumab for RES. We believe that CDP-24 should be used in the base case when available,
as it is a more robust measure of lasting disability progression. This approach has been
favoured by NICE committees in recent appraisals of DMTs for MS.14,19,74
Copyright 2018 Queen's Printer and Controller of HMSO. All rights reserved.

Version 1 135
Table 42 Treatment effects CDP at 12 and 24 weeks: HR vs placebo
Treatment ITT HA RES
Median 95% CrI Median 95% CrI Median 95% CrI
CDP-12
Ocrelizumab **** **** **** **** **** **** **** **** ****
IFNβ-1a (Avonex) **** **** **** **** **** **** **** **** ****
IFNβ-1a (Rebif) **** **** **** **** **** **** **** **** ****
IFNβ-1a (Rebif 22) **** **** **** **** **** **** **** **** ****
IFNβ-1b **** **** **** **** **** **** **** **** ****
PEGβ-1a **** **** ****
Glatiramer acetate **** **** **** **** **** **** **** **** ****
Alemtuzumab **** **** ****
Daclizumab **** **** **** **** **** ****
Dimethyl fumarate **** **** **** **** **** **** **** **** ****
Fingolimod **** **** **** **** **** **** **** **** ****
Natalizumab **** **** **** **** **** ****
Teriflunomide **** **** **** **** **** **** **** **** ****
CDP-24
Ocrelizumab **** **** **** **** **** **** **** **** ****
IFNβ-1a (Avonex) **** **** **** **** **** **** **** **** ****
IFNβ-1a (Rebif) **** **** **** **** **** **** **** **** ****
IFNβ-1a (Rebif 22)
IFNβ-1b
PEGβ-1a **** **** ****
Glatiramer acetate **** **** **** **** **** **** **** **** ****
Alemtuzumab **** **** **** **** **** **** **** **** ****
Daclizumab **** **** **** **** **** ****
Dimethyl fumarate **** **** ****
Fingolimod **** **** **** **** **** ****
Natalizumab **** **** **** **** **** ****
Teriflunomide **** **** **** **** **** ****
Shaded cells show indications that are not included in the NICE scope
Treatment discontinuation (OR all-cause discontinuation)
Section B.2.9 of the CS shows the company’s network for all-cause discontinuation for 17
treatments including placebo. The results of the company’s MTC, reported in CS Appendix
D.1.4., capture withdrawal from treatment due to adverse events as well as lack of efficacy and
are estimated as odds ratios compared with ocrelizumab - see Table 43 below. The odds ratios
are converted to annual probabilities in the model, using the absolute discontinuation rate for
Copyright 2018 Queen's Printer and Controller of HMSO. All rights reserved.

Version 1 136
ocrelizumab to anchor the estimates. The company base case uses all-cause discontinuation,
but the model does include the facility to calculate results using only AE-related discontinuation.
Due to a paucity of data, the company did not conduct separate MTCs for treatment
discontinuation in the HA or RES subgroups, hence ITT estimates were used for these
analyses. As noted above, the company model assumes a constant annual withdrawal rate
throughout the time horizon. We consider the method used to generate annual probabilities of
treatment withdrawal and the underlying assumptions to be appropriate.
Table 43
Discontinuation:
OCR vs ocrelizumab
and annual
probabilities: from
CS Table 38 and
economic
modelDMT
All cause AE-related
OCR vs. ocrelizumab Annual probability Annual probability
Median 95% CrI
Ocrelizumab NA NA NA ***** *****
IFNβ-1a (Avonex) **** **** **** ***** *****
IFNβ-1a (Rebif) **** **** **** ****** *****
IFNβ-1a (Rebif 22) **** **** **** ****** *****
IFNβ-1b **** **** **** ***** *****
PEGβ-1a **** **** **** ****** *****
Glatiramer acetate **** **** **** ***** *****
Alemtuzumab **** **** **** ***** *****
Daclizumab **** **** **** ***** *****
Dimethyl fumarate **** **** **** ***** *****
Fingolimod **** **** **** ***** *****
Natalizumab **** **** **** ***** *****
Terifluomide **** **** **** ***** *****
NA: not applicable
4.3.4.4 Health related quality of life
OPERA utility regression
EQ-5D-3L data were collected at baseline and at weeks 48 and 96 in the OPERA I and II trials,
and also at week 0 and 46 of the open label extension study. Utility scores were obtained using
the UK Value set.75 These data were collected for use in regression analysis to estimate utility
by EDSS and comparison between study arms was not pre-specified (Clarification A8). Mean
Copyright 2018 Queen's Printer and Controller of HMSO. All rights reserved.

Version 1 137
utility scores in the OPERA trials and OLE study were similar for the intervention and control
arms (company’s response to clarification question A8).
The methods used in the company’s utility regression are reported in CS Appendix H.1.5 and
further explanation is given in the Clarification response of 12 January. In total, 5073
observations were used for the regression, including 1177 observations at week 96. Imputation
was not used for missing data. No EQ-5D observations were available for patients with EDSS 8
or 9, and only 4 were available for EDSS level 7. The model included EDSS, sex, region and
relapse, and the company state that extending the model to include randomization arm did not
improve the fit (p=0.9047). The analysis could not have adjusted for RRMS/SPMS disease type
because this categorization was not collected in the OPERA trials.
Systematic review
The company also conducted a systematic review to identify HRQoL studies relevant to the
economic evaluation (CS section B.3.4.3). Figure 25 in the CS (reproduced in Figure 6 below)
plots EQ-5D utility scores by EDSS state from 7 relevant studies, in addition to the company’s
regression analysis of the OPERA data. The curves depict a consistent pattern of declining
utility with increasing EDSS score.
The OPERA results are more conservative than most, with a less steep gradient. However, the
company notes that confidence intervals overlap with those from the Orme et al. analysis72
which represent the lowest range of utility scores in the available data sources. The company
ascribed the higher utility scores in the OPERA trials to the average age of the patients at
baseline (37 years) compared to patients in the MS Trust survey with an average age of 51
years. Orme et al. used data from a postal survey of 12,968 people, of whom 2708 provided
data suitable for analysis. The final regression included recent relapse, SPMS, PPMS,
education, years since diagnosis and gender as covariates, alongside EDSS states.
The utility scores used in the economic model are listed in Table 44 below (copied from CS
Table 43). Values for RRMS states 0 to 6 were taken from the OPERA utility regression analysis
described above. Values for RRMS EDSS states 7 to 9 were obtained from the RRMS EDSS
state 6, adjusted using decrements (vs. EDSS 6) from Orme et al.. The Orme et al. analysis was
also used to provide an estimate of the decrement associated with SPMS compared with
RRMS: 0.045 (0.014 to 0.076).
Copyright 2018 Queen's Printer and Controller of HMSO. All rights reserved.

Version 1 138
Figure 6 Consistency of EDSS-dependent utility values: CS Figure 25
Table 44 Health state utility values used in model: CS Table 43 EDSS RRMS SPMS
0 0.881 0.836
1 0.843 0.798
2 0.770 0.725
3 0.705 0.660
4 0.644 0.599
5 0.601 0.556
6 0.493 0.448
7 0.308 0.263
8 -0.038 -0.083
9 -0.184 -0.229
The ERG agrees with this approach, particularly as the CS also reports a scenario analysis
using utility scores drawn entirely from the MS Trust survey (Orme et al.)72. The model uses an
appropriate method to characterise uncertainty around the OPERA utility analysis coefficients
and Orme et al utility decrements for PSA.
Copyright 2018 Queen's Printer and Controller of HMSO. All rights reserved.

Version 1 139
The same values are used for people with more active forms of disease (HA and RES). This is
appropriate because the OPERA regressions include adjustment for utility loss associated with
relapses, and the model applies separate estimates of QALY loss associated with relapses.
Relapse disutility
The company use two parameters to estimate the QALY loss per relapse:
The disutility experienced during relapses. In the base case, the Orme et al. estimate of
0.071 (0.046 to 0.096) is used. This is similar to the estimate from the OPERA utility
regression, 0.101 (0.061 to 0.140), which the company uses for scenario analysis.
An average duration of a relapse (46 days) sourced from NICE TA32. The CS reports
scenario analysis to test the impact of assuming a relapse duration of 1 or 2 months.
The estimated QALY loss attributable to relapses is therefore modest at 0.009 per relapse on
BSC in the base case model; or a maximum of 0.015 per year for patients with more active
forms of disease (ARR of 1.7 for RES/HA). These assumptions are consistent with previous
NICE appraisals.
We note that the assumption about the duration of relapses is related to the timing of
confirmation of disability progression in the natural history dataset (British Colombia in the base
case) and clinical evidence base (CDP-12 vs. CDP-24).
Caregiver disutility
The company model specifies caregiver utility values used in previous NICE assessments
based on estimates from (TA127).15, 19 These estimates were based on a maximum utility
decrement of 0.14 from studies in Alzheimer’s disease, weighted for level of EDSS in
accordance with reported time spent by caregivers in the UK MS Survey. No alternative source
of caregiver disutility is reported.
Table 45 Caregiver disutility by EDSS state
0 1 2 3 4 5 6 7 8 9
0 -0.001 -0.003 -0.009 -0.009 -0.02 -0.027 -0.053 -0.107 -0.14
We note that in the NICE appraisal TA441, the manufacturer for daclizumab reports an
additional set of values from the Delphi survey.
Copyright 2018 Queen's Printer and Controller of HMSO. All rights reserved.

Version 1 140
4.3.4.5 Resource use and costs
The model includes treatment costs, costs of ongoing health and social care by health state and
additional costs for relapses and adverse events. In this section we discuss the sources and
assumptions about treatment, health state and relapse costs. AE-related costs are discussed
in the following section.
Treatment costs: drug acquisition, administration and monitoring
The company provides detailed tables itemising resource use and cost assumptions for drug
acquisition (CS Table 45), drug administration (CS Table 47) and monitoring (CS Table 48). A
summary, based on CS Table 49, is shown below. This includes the list price for each drug:
which is confidential for ocrelizumab. The PAS price for ocrelizumab is ******* for each year of
treatment. PAS prices for other comparators are reported in Addendum 1 to this report.
Table 46 Summary of drug treatment costs (adapted from CS Table 49)
Drug Drug acquisition a Drug administration Monitoring cost
year 1 year 2+ year 1 year 2+ year 1 year 2+
Alemtuzumab 35,225 21,135 2,497 1,509 1,093 1,024
Daclizumab 19,160 19,160 172 0 374 317
Dimethyl fumerate 17,898 17,898 130 0 574 243
Fingolimod 19,163 19,163 494 0 663 231
Glatiramer acetate 6,681 6,681 172 0 347 237
IFNβ-1a (Avonex) 8,502 8,502 172 0 368 237
IFNβ-1a (Rebif) 10,572 10,572 172 0 370 237
IFNβ-1b 7,259 7,259 172 0 368 237
Natalizumab 14,690 14,690 6,422 6,422 767 451/ 597 b
Ocrelizumab 19,600 19,600 1,501 1,007 366 297
PEGβ-1a 8,502 8,502 172 0 368 237
Teriflunomide 13,529 13,529 0 0 381 240 a At list price; b Monitoring cost, year 2 / 3+;
Although the list price of alemtuzumab is £35,225 in year one and £21,135 in year 2+, these
costs are increased by 5% in the company model to adjust for the half cycle correction (HCC).
This is based on the argument that the HCC should not be applied to alemtuzumab costs, which
are only incurred at the beginning of the cycle. This is correct and we agree that the 5% uplift is
reasonable: the cost of alemtuzumab is £35,255 in year 1 without the HCC; £33,530 with the
Copyright 2018 Queen's Printer and Controller of HMSO. All rights reserved.

Version 1 141
HCC but no adjustment; and £35,207 with the HCC and 5% adjustment. However, we do
question whether some adjustment should also be made for ocrelizumab, for which one dose is
administered at the beginning of the cycle. We therefore include a 5% uplift in half the cost of
ocrelizumab in the ERG base case, as well as the 5% adjustment for the whole cost of
alemtuzumab.
The CS notes that although alemtuzumab is an induction treatment, retreatment is sometimes
required and in certain cases patients switch to other DMTs due to treatment failure. The CS
reports findings from observational studies by Tuohy et al and Willis et al to support this
assumption.76, 77 Of 87 patients observed over a median 7-year follow-up period, Tuohy and
colleagues found that 52% required just two treatments. Relapses prompted re-treatments
ranging from three to five treatment cycles. Willis et al found that out of 100 patients identified
and followed-up for 6.1 years, 40 required additional treatment cycles. Both studies were in UK
settings.
The company incorporates the assumptions from the alemtuzumab CS to account for re-
treatment. These included average re-treatment rates of 19%, 16% and 14% for years 3, 4 and
5 respectively, drawn from the CARES MS I AND II follow up data (CS Table 46).78, 79 For the
year six onwards, the company uses a 13% re-treatment rate estimated from Touhy et al.76 A
treatment switching scenario as a result of failure on alemtuzumab is not explored and the
company believes this would underestimate treatment costs associated with alemtuzumab. We
are of the opinion that evidence does point to re-treatment in a significant number of patients
who receive alemtuzumab, however the assumption of ongoing re-treatment for 13% of patients
every year is not supported. The NICE Committee on daclizumab concluded that a maximum of
four re-treatments should be modelled. We therefore exclude re-treatment with alemtuzumab
from year 6 onwards in our base case analysis, and test the effect of this in scenario analysis.
Regarding the drug administration and monitoring costs, most of the values in CS Tables 47
and 48 are derived from the daclizumab NICE appraisal, while the remaining parameters are
estimated from SmPC requirements and the opinion of the company’s experts. We checked the
component costs against specified sources and found most of them to be appropriate. We had
concerns about certain values in CS Tables 47 and 48, such as the assumption that patients on
natalizumab attended 13 day cases in the first year and 12 MS nurse visits for patients on
Copyright 2018 Queen's Printer and Controller of HMSO. All rights reserved.

Version 1 142
alemtuzumab. We note, however, that these assumptions will have negligible impact on cost-
effectiveness.
Health state costs
The CS considers four sources of evidence on resource use and costs for the modelled health
states, obtained from a systematic literature review (CS section B.3.5.2).80-83 We summarise
health state costs from these four studies in Table 48 (adapted from Table 51 on page 120 of
the CS):
Hawton and Green (2016)80 was a UK study that used data from a prospective,
longitudinal cohort to describe health and social care by EDSS category.
Karampampa et al. (2012)81 (the TRIBUNE study) analysed questionnaires completed
by 1261 MS patients from 5 European countries to estimate the societal cost of MS
linked to relapses and disease severity.
Kobelt et al. (2006)82 reported on the UK results from a survey across 16 European
countries. The study, which was based on the UK MS Trust survey, reported costs from
a societal perspective. In the three studies mentioned above, no distinction was made
between costs accrued by RRMS and SPMS patient subgroups. Costs were only
reported for pooled mild, moderate and severe EDSS states in the Karampampa ad
Kobelt papers.
Tyas et al. (2007)83 conducted a regression analysis of the the UK MS Trust Survey
data used by Kobelt et al. Tyas et al. disaggregated costs into the ten EDSS health
states, which showed significant variation with patients in the most severe MS states
accruing the greatest costs. Tyas et al. also differentiated costs for RRMS and SPSS
subgroups. The company adjusted the Tyas et al. estimates, using an estimate from
Kobelt et al. that only 25% of direct non-medical costs are publicly funded and fall within
the NICE reference case.
The manufacturer’s submission to NICE on daclizumab reported health state costs from
a burden of illness cost analysis, the Biogen BOI study.66 This analysis appears to be
related to two recently-published papers, which report results from a Biogen-funded
burden of illness study in the UK and other European countries.84, 85 However, these
published sources do not provide results at the level of detail needed for the ocrelizumab
Copyright 2018 Queen's Printer and Controller of HMSO. All rights reserved.

Version 1 143
analysis. The Warwick ERG team working on the daclizumab appraisal provided a
detailed comparison of the Biogen BOI results and other published estimates. The
Biogen analysis estimated UK costs, including: direct medical costs; direct non-medical
costs and costs of informal care from family and friends. The Warwick ERG noted
uncertainty over the proportion of investment and community care costs borne by the
NHS/PSS and applied estimates of 80% and 100% of community care costs (see Table
47 below).
Table 47 Health state cost estimates
RRMS SPMS
BOI@80% BOI@100% TA320 BOI@80% BOI@100% TA320
EDSS 0 **** **** £937 **** **** £1,263
EDSS 1 **** **** £974 **** **** £1,301
EDSS 2 ***** ***** £714 ***** ***** £1,040
EDSS 3 ***** ***** £3,906 ***** ***** £4,232
EDSS 4 ***** ***** £1,892 ***** ***** £2,218
EDSS 5 ***** ***** £3,210 ***** ***** £3,537
EDSS 6 ***** ***** £4,285 ***** ***** £4,611
EDSS 7 ***** ***** £11,279 ***** ***** £11,605
EDSS 8 ****** ****** £27,472 ****** ****** £27,798
EDSS 9 ****** ****** £21,982 ****** ****** £22,309
Source: ERG report on Daclizumab 19
The NICE daclizumab Committee concluded that the Biogen BoI study as adjusted by the ERG,
was appropriate as a “starting point” for making recommendations but acknowledged
uncertainty over the ERG adjustments. (TA441 section 4.18)
For their base case, the company uses health-state costs from Tyas et al. (2007)83, adjusted to
2016 using the PSSRU Hospital and Community Health Services inflation index (PSSRU).The
company argues that Tyas et al. represents the most complete and robust data on MS costs in
the UK. Their model also uses a cost of relapse, independently from the EDSS health state
costs. As there is wide variation in costs of relapse reported in the literature, the company uses
data from Tyas et al (£1,623) in the base case to maintain consistency with health state costs.
Based on the committee considerations in the daclizumab appraisal, we decided to use the
updated UK MS Survey figures at 2014/15 prices cited in the Warwick addendum to their report
for the daclizumab appraisal in our base case. We also conduct scenario analysis using costs
Copyright 2018 Queen's Printer and Controller of HMSO. All rights reserved.

Version 1 144
from the Biogen Burden of Illness analysis assuming 80% paid by the NHS and PSS, as cited
by Warwick.
Table 48 Summary of annual health state costs by EDSS: Adapted from CS Table 51
Cost category EDSS states and costs (£)
0 1 2 3 4 5 6 7 8 9
Hawton80
Health and social
care 510 455 358 334 501 503 652 658 1660
Karampampa 81
Medical 6714 8101 6059
Non-medical 1913 10299 41242
Kobelt 2006 82
Healthcare 5400 7000 7700
Services/
investments 400 1200 9000
Informal care 1100 7000 25200
Tyas et al. 83
Medical, RRMS 250 85 213 850 806 1419 2162 6583 10761 15121
Medical, SPMS 530 365 493 1130 1086 1699 2442 6863 11041 15401
Non-medical 2536 3462 4414 6212 4028 6333 6580 10808 15339 10161
4.3.4.6 Adverse events
Incidence of adverse events
Table 49 summarises the annual probabilities of AEs used in the economic model. Citing the
approach in the CS for the daclizumab appraisal (TA441), the company only include AEs with
an occurrence of 5% or more in either arm of the pooled OPERA analysis. They argue that this
is conservative, as events with frequency ≥ 5% for comparators but not ocrelizumab are
omitted. As in the daclizumab CS, PML is also included for natalizumab because of its high
impact on patients and costs.
The AE rates for ocrelizumab were based on pooled analysis of the OPERA I and II trials
(section 3.3.9.1). The proportions of events in OPERA I and II was similar, so the decision to
pool the two studies is reasonable. Annual AE rates for comparators were sourced from the
Biogen CS for the daclizumab appraisal (Table 79).66 Biogen stated that they had included
adverse events as an outcome in the systematic search for their MTC, but we could not
determine how they had pooled data from these studies from the published submission. The
model adjusts the AE rates for ocrelizumab to align with the common comparator treatment
Copyright 2018 Queen's Printer and Controller of HMSO. All rights reserved.

Version 1 145
(IFNβ-a1 Rebif) that links the AE rates in the daclizumab trial with those in OPERA I and II. This
adjustment is reasonable.
Table 49 Adverse event rates (%) used in economic model
OC
R
IFN
β-1
a
(Rebif)
IFN
β-1
a
(Avonex)
DA
C
PE
Gβ
-1a
IFN
β-1
b
GA
AL
EM
DM
F
FIN
GO
NA
T
TE
RI
Infusion reaction 34 10 - - - - - - - - - -
Headache 8 15 15 8 47 17 10 22 8 17 21 11
Influenza-like illness 3 21 24 4 - - - 1 - 4 - -
Upper resp. tract infection 6 11 6 8 - 4 5 8 6 17 - -
Nasopharyngitis 11 10 13 12 11 10 9 13 10 16 - 13
Urinary tract infection 3 12 5 5 - 5 5 10 8 6 11 4
Fatigue 12 8 10 3 11 13 8 8 6 8 15 6
Injection site pain 0 21 5 5 - 4 16 - - - - -
Depression 13 7 8 4 - 9 5 - 4 4 10 -
Arthralgia 2 6 4 3 12 7 5 - - 4 10 -
Sinusitis 6 5 - - - - - - - - - -
Back pain 5 4 4 4 13 6 5 - 5 5 - 5
Insomnia 6 5 - - - - - - - - - -
Bronchitis 5 4 2 3 - - - - - 4 -
PML - - - - - - - - - - 2 -
The short follow-up period in the OPERA trials could mean that certain adverse events are not
captured in the economic model. The ERG considers that criteria used in deciding which
adverse events are included in the model is arbitrary. Our clinical experts are also of the opinion
that adverse events for some DMTs are over-emphasised in CS Table 4. However, these
adverse events, such as cardiac failure and seizures, were not included in Table 40 and
therefore not modelled. Our experts were of the opinion that all headache rates in CS Table 40
were over-estimated, particularly for natalizumab which had a rate of 21.2%. Other rates
queried for natalizumab include UTI (10.5%), fatigue (14.5%), arthralgia (10%) and PML (2.1%)
which clinicians thought were much higher than expected. Clinicians also questioned the
infusion-related reaction rates reported in Table 40, specifically for alemtuzumab which they felt
were under-estimated.
Despite our concerns about the face validity of the AE probabilities, only PML and depression
have a sizeable cost or QALY effect (see below), so other AE rates are unlikely to influence
cost-effectiveness. We therefore follow the company’s approach to modelling AEs in the ERG
Copyright 2018 Queen's Printer and Controller of HMSO. All rights reserved.

Version 1 146
analysis but use scenario analysis to explore omitting PML and depression and the adjustment
for ocrelizumab versus interferon.
Adverse event disutilities and costs
The company relies mainly on estimates from the daclizumab CS for TA441 for the disutilities
and duration of adverse events. They supplemented missing data for a few adverse events with
estimates from the alemtuzumab CS to NICE (TA312). Table 42 on page 108 of the CS
summarises the assumptions about disutilities and durations of AE used in the company base
case (CS Table 42). This includes an assumption that 6.9% of adverse events are serious,
based on the overall proportion of SAEs in the pooled OPERA data.
The assumptions used to estimate the costs for treating adverse events in the company’s base
case analysis are summarised in CS Table 52. As with AE disutilities, assumptions about AE
costs were sourced primarily from the daclizumab CS to NICE and weighted by assuming 6.9%
of AEs are serious (pooled OPERA analysis). Costs were uprated to 2016 before use in the
model.
The resulting estimates of QALY loss and cost per adverse event are shown in Table 50 below.
It can be seen that the QALY loss is negligible for most types of AE. The largest loss is for
PML, based on a mean utility loss of 0.3 lasting for one year (the equivalent of 4 months of
healthy life). This may be an underestimate as, PML is likely to have more lasting effects
including mortality. The largest AE-related costs are associated with depression with an
average cost of £970 and PML with an average cost of £12,810. We note that the cost for
depression assumes an average of 12 psychotherapy sessions for non-serious depression and
52 sessions for serious depression. This is number of sessions is unlikely in the NHS. The high
cost for PML is related to a long-stay hospital admission, which may be reasonable given the
seriousness of this condition.
Copyright 2018 Queen's Printer and Controller of HMSO. All rights reserved.

Version 1 147
Table 50 QALY loss and costs for included adverse events
Adverse events
Average per event
QALY loss Cost (£)
Non- serious
Serious Mean a Non-
serious Serious Mean a
Infusion-related reaction 0.000 0.000 0.000 0 0 0
Headache 0.004 0.033 0.006 0 210 14
Influenza-like illness 0.000 0.000 0.000 0 0 0
Upper resp. infection 0.004 0.008 0.004 65 65 65
Nasopharyngitis 0.000 0.000 0.000 0 65 4
Urinary tract infection 0.001 0.001 0.001 2 907 64
Fatigue 0.000 0.000 0.000 0 109 8
Injection site pain 0.000 0.000 0.000 0 65 4
Depression 0.034 0.560 0.070 821 2,996 971
Arthralgia 0.007 0.017 0.008 2 424 31
Sinusitis 0.000 0.000 0.000 0 0 0
Back pain 0.007 0.034 0.009 0 666 46
Insomnia 0.000 0.000 0.000 0 0 0
Bronchitis 0.000 0.000 0.000 131 131 131
PML 0.300 0.300 0.300 12,810 12,810 12,810
Source: CS Table 42 and 52 a Assuming that for each type of AE 6.9% are serious, based on average proportion of SAEs in OPERA trials.
4.3.5 Model validation
4.3.5.1 Internal consistency
The company describe their approach to model validation in section B.3.10 of the CS. They
state that external agencies performed two separate quality checks of the model, reviewing
calculations and testing extreme values. Any errors identified were corrected. The face validity
of the model structure, inputs and results was considered at an advisory boards with clinical and
health economic experts from the UK.
The ERG conducted a series of internal consistency checks on the company’s submitted:
We compared all model input parameters with the figures cited in the CS and in the
original source. We did not identify any errors, although the natural history relapse rates
cited to three decimal places in the CS (Table 35) were entered in the model with only
two decimal places. We corrected this small discrepancy, which did not materially affect
the results.
Copyright 2018 Queen's Printer and Controller of HMSO. All rights reserved.

Version 1 148
We replicated all model outputs presented in the CS, including the scenario analyses
which we changed manually as well as running the macros.
Due to the size of the model we could not check every formula in the spreadsheet, but
we reviewed the chain of calculations through the model, from data inputs, through
parameter calculations to modelled outcomes and cost estimates. We also did a more
detailed check of core model calculations used to estimated transition matrices, the
Markov trace and cost and QALY calculations.
We conducted a series of model ‘stress tests’, entering extreme values and checking
that they have the expected impact on model results: for example that setting utility
values to 1 makes QALYs equal to life years.
4.3.5.2 External consistency
The company note that comparison of economic results between NICE appraisals was
complicated because of the amount of redacted information in previous submissions. They
compare clinical effectiveness estimates from their MTC that are used in the submitted model
with estimates from a recent analysis conducted by the Institute for Clinical and Economic
Review (ICER) for the California Technology Assessment Forum (CS Table 74).24 The CS and
ICER estimates of ARR for all drugs are very similar. The CDP estimates are similar for most
drugs, but do differ for some. This may be related to the timepoints for confirmation: the
company present CDP-12 and CDP-24 separately, while ICER used CDP-24 when available or
otherwise CDP-12.
The ICER report also compares their effectiveness estimates with those from other published
network meta-analyses (Table 6 page 37 for ARR and Table 8 page 42 for CDP). There are
some large discrepancies, which may relate to availability of evidence (e.g. the Cochrane review
was conducted in 2014) and/or to the methods or conduct of the systematic reviews or NMAs.
This suggests that there is additional uncertainty around the clinical effectiveness evidence
used to drive the submitted model that is not captured in the probabilistic sensitivity analysis. In
particular, we highlight that the company’s one-way sensitivity analysis shows that CDP
effectiveness parameters are a key source of decision uncertainty.
It is difficult to compare the modelled outcomes (QALYs and LYs) from the company model with
those from other appraisals (due to redaction in previous submissions). Comparisons with
outcomes from the ICER model are not straightforward because of differences in the decision
Copyright 2018 Queen's Printer and Controller of HMSO. All rights reserved.

Version 1 149
problem addressed (the ICER report considered a lifetime and sequenced approach to DMT
use from MS diagnosis).
4.3.6 ERG critique of model
The company lists assumptions in CS Table 25 and makes comparisons with previous
appraisals in Table 54. We summarise the company’s arguments and ERG judgements in
Table 51 below.
Table 51 Summary and critique of model assumptions
Assumption Company justification ERG comments
No impact of
treatment on
severity or
duration of
relapses
Lack of trial evidence of treatment
effect on severity of relapses. May
underestimate clinical benefit of ‘high-
efficacy’ treatment like ocrelizumab
Given the lack of evidence, the base
case assumption of no effect on
relapse duration /severity is
appropriate. However, we
acknowledge that this may
underestimate treatment effects.
EDSS progression
measure CDP-12
in base case
The company argue that the evidence
base is larger for disability
progression confirmed at 12 weeks
than at 24 weeks.
CDP-24 is a more robust measure of
progression, because it is less likely to
be confused with longer relapses. It
has been preferred in previous
committee considerations.
EDSS can regress
as well as
progress in RRMS
and SPMS
In recent years it has become
generally accepted that some patients
with RRMS and SPMS do experience
improvements in EDSS. The British
Columbia cohort study that is used to
provide transition probabilities for the
model includes episodes of disability
regression as well as progression.
We agree. This reflects advice
received by the ERG from clinical
experts. It is also consistent with
recent NICE committee conclusions.
However, we note that disability
improvement is less likely in SPMS,
when neurodegenerative rather than
inflammatory processes start to drive
disability progression.
Treatment affects
EDSS progression
but not regression
This is a conservative assumption
that may underestimate the clinical
benefit of ‘high-efficacy DMTs like
ocrelizumab’ which have
demonstrated the ability to reverse
disability. (See CS Table 11, page 37)
There is some evidence of disability
improvement from the OPERA trials.
However, evidence is not available for
comparators from MTC. We therefore
agree with the company’s conservative
approach.
Copyright 2018 Queen's Printer and Controller of HMSO. All rights reserved.

Version 1 150
Table 51 continued
Assumption Company justification ERG comments
Transition from
RRMS to SPMS is
accompanied by a
1-point increase in
EDSS
Assumption in line with previous
appraisals based on London Ontario
data. An increase in disability may
have been partially captured in the
British Columbia dataset (included
15.7% SPMS patients at baseline).
This is an assumption, not underpinned
by evidence. ERG experts have
suggested that the transition to
secondary-progression disease is not
necessarily accompanied by an
increase in disability.
Partial effect of
treatment on
conversion to
SPMS
In line with the previous appraisal of
natalizumab, 50% of the treatment
effect on CDP is applied to the
probability of conversion from RRMS
to SPMS.
This assumption is not based on
evidence. A more conservative
approach would be to assume no direct
effect of DMTs on converstion to
SPMS.
No direct effect of
treatment on
mortality (but
indirect effect via
EDSS)
Literature has demonstrated that the
risk of death is primarily dependent on
the level of disability (EDSS).
Duration of trials too short to detect
impact on mortality.
We agree.
Constant rate of
all-cause
treatment
withdrawal
Experience with DMTs has shown
that intolerance can occur either soon
after start of treatment (e.g. infusion
related reactions) or can develop
years later (e.g. PML). Similarly, for,
withdrawal due to lack of efficacy,
early withdrawal in non-responders
and late withdrawal after development
of neutralizing antibodies / drug
resistance. Assumption in line with
several previous appraisals and
supported by data from UK Risk
Sharing Scheme.
We agree. It is difficult to assess the
long-term pattern of withdrawals and
we acknowledge that there are factors
that might drive both early and late
withdrawals.
No waning of
treatment
effectiveness over
time
Scenarios with
waning are
presented
Long-term waning not definitively
proven nor disproven. 4-year OLE
data for ocrelizumab shows sustained
effect across ARR, CDP, and MRI
outcomes; and ocrelizumab
generates negligible neutralising
antibodies, unlike other DMTs. Also,
perceived reduction in clinical benefit
results in switching to a therapy with
different mechanism of action.
Clinical advisors to the ERG have
suggested that the generation of
neutralizing antibodies is unlikely to be
a significant indicator of continued
benefit. We acknowledge the evidence
of sustained benefit from the
ocrelizumab OLE study. However, in
the absence of a review of long-term
follow-up studies for all DMTs, we
cannot draw conclusions about the
relative persistence of effects for
different DMTs.
Copyright 2018 Queen's Printer and Controller of HMSO. All rights reserved.

Version 1 151
Table 51 continued
Assumption Company justification ERG comments
Treatment
discontinued when
EDSS>6 or on
conversion to
SPMS
Some DMTs are licensed for
relapsing SPMS (IFNβ-1a,
daclizumab, and ocrelizumab), though
the extent of use is uncertain.
Patients are likely to experience a
period of overlap between RRMS and
relapsing SPMS when they may
continue DMTs in line with the clinical
guideline and NHS England Policy.
After progression to non-relapsing
SPMS DMT is expected to cease in
line with guidance.
These are conventional stopping rules
for DMT, although expert advisors
have suggested that there is not a
sharp division between RRMS and
SPMS, and many patients will continue
to experience relapses in SPMS and
may well benefit form DMT.
Only AEs with
incidence (≥5 %)
in either arm of
pooled OPERA
studies were
included
Due to the complexity and number of
comparators in the model, the set of
AEs included was based on the safety
profile of ocrelizumab. This could
have underestimated the impact of
AEs for comparators if these weren’t
common in the OPERA trials. An
exception was made for PML which is
known to have high costs and
disutilities and is relatively common
with natalizumab (≥2 %). Other high-
efficacy DMTs like alemtuzumab are
associated with rare but severe AEs
that are not included in the model.
We agree that the exclusion of
common and high impact AEs for
comparators would have biased results
against ocrelizumab.
However, our clinical experts have
advised us that some estimates of AE
rates for comparators seem unrealistic.
They have questioned the estimate of
2% for PML with natalizumab.
There is therefore uncertainty over
whether the incidence and severity of
AEs are accurately captured in the
model.
Constant rate of
AEs
The safety profiles of DMTs are
complex and have evolved over time.
Some AEs occur soon after the start
of treatment (e.g. infusion related
reactions), while others can develop
after many years of continued
treatment (e.g. PML). This is in line
with the approach used in several
previous appraisals.
We have been advised that there is
considerable uncertainty over the
timing of AEs. Given this, the
assumptions of a constant rate over
time is reasonable.
Copyright 2018 Queen's Printer and Controller of HMSO. All rights reserved.

Version 1 152
4.4 Cost effectiveness results
4.4.1 Base case
The company’s base case results are reported in CS section B.3.7. Table 52 below reproduces
results for the ITT population with the PAS price for ocrelizumab and list prices for all
comparators.
Note that these results are not informative for comparators with a PAS (dimethyl fumerate,
fingolimod and teriflunomide) because the incremental costs do not reflect prices paid in the
NHS. We present results with all available PAS prices in Addendum 1 to this report.
We consider that the fingolimod and natalizumab comparisons in this analysis are also not
informative. The company explains that they extended their ITT base case to include fingolimod
and natalizumab, which are only recommended for subgroups with HA or RES disease
respectively, because the ITT MTC is more robust than the HA and RES MTCs. We agree that
there is greater uncertainty over the MTC subgroup analyses. However, cost-effectiveness
results for the HA and RES subgroups are influenced by natural history parameters in addition
to effectiveness parameters. Thus the ITT estimates in Table 52 are not necessarily applicable
to these subgroups. The company’s subgroup analyses are discussed in section 4.3.2.2 below.
Table 52 Company ITT base case (OCR PAS; list prices for comparators) Adapted from CS Table 57
Technologies
Total
costs (£)
Total
LYG
Total
QALYs
ICER (£/QALY)
Ocrelizumab vs.
comparator c incremental
Blended ABCRs ******* ***** **** 26,435 -
Alemtuzumab ******* ***** ***** OCR dominated 8,296
Teriflunomide b ******* ***** **** 9,832 Dominated
Ocrelizumab ******* ***** **** - Dominated
Dimethyl fumarate b ******* ***** **** OCR dominant Dominated
Fingolimod a b ******* ***** **** OCR dominant Dominated
Natalizumab a ******* ***** **** OCR dominant Dominated
Key: ICER, incremental cost-effectiveness ratio; LYG, life years gained; QALYs, quality-adjusted life years. a Comparator not in scope for ‘ITT’ population; b PAS available but not included in this analysis; c pairwise ICERs for ocrelizumab vs. comparators calculated by ERG from company model.
One can draw some conclusions from the remaining comparisons with alemtuzumab and the
blended ABCRs (for which discounted PAS prices are not available). These indicate that under
Copyright 2018 Queen's Printer and Controller of HMSO. All rights reserved.

Version 1 153
the company’s base case for the ITT population: alemtuzumab dominates ocrelizumab; but if
alemtuzumab is not an option for some patients, ocrelizumab has an ICER of £26,435
compared with blended ABCR (CS Table 59). The ICER for ocrelizumab varies between
individual ABCR comparators, with a range from £22,841 compared with IFNβ-1a (Avonex) to
£35,028 compared with Pegβ-1a (CS Appendix J.1.2 Table 63).
The company argues that the analysis excluding alemtuzumab is relevant for three reasons:
The QALY difference between ocrelizumab and alemtuzumab is small (**** over 50 years)
and relies on the CARE-MS I and II trials for alemtuzumab, which the company argue are of
lower quality than the OPERA I and II trials that underpin the effectiveness of ocrelizumab.
Particularly because the CARE-MS trials were open label.
There is uncertainty over the extent to which retreatment is required to maintain
effectiveness for alemtuzumab. We note that the company base case includes costs for
alemtuzumab retreatment for 19%, 16%, 14% and 13% of patients in years 3, 4, 5 and form
year 6 onwards.
The safety profile and monitoring requirements for alemtuzumab mean that it will not be
suitable for every patient, so it is important to maintain a choice of treatments in RRMS.
They further argue that when alemtuzumab is not an option, the appropriate comparator is
blended ABCR because, although the costs and QALYs differ between the individual β-
interferons and glatiramer acetate, clinicians consider them to be ‘broadly equivalent’.
The ERG accepts both points. There will be patients for whom alemtuzumab is not clinically
appropriate and there is considerable uncertainty over the relative effectiveness and cost-
effectiveness of the different β-interferon drugs and glatiramer acetate. However, we conclude
that according to the company’s base case assumptions, when alemtuzumab is an option it is
estimated to be less expensive and more effective than ocrelizumab. And when alemtuzumab
is not an option, there is variation in the ICER for ocrelizumab according to the ABCR
comparator.
Copyright 2018 Queen's Printer and Controller of HMSO. All rights reserved.

Version 1 154
4.4.2 Sensitivity analyses
Probabilistic sensitivity analysis
The PSA results for the company’s ITT base case analysis are reported in CS section B.3.8.1,
Table 61 (PAS for ocrelizumab and list prices for comparators). The results are very similar to
the corresponding deterministic analysis. The CS includes cost-effectiveness acceptability
curves (CEAC) and cost-effectiveness scatterplots: CS Appendix J.1.3 Figure 47 and 48 for the
ITT base case with PAS for ocrelizumab and list prices for comparators. The CEAC shows that
alemtuzumab has the highest probability of being cost-effective above a threshold of around
£15,000 per QALY gained. Excluding alemtuzumab (CS B.3.8.1 Figure 29), PEGβ -1a has the
highest estimated probability of being cost-effective up to a threshold of about £42,000 per
QALY gained, with ocrelizumab having the highest probability after that point.
One-way deterministic sensitivity analyses
The company conducted one-way sensitivity analysis, varying parameters between 95%
confidence/credible interval limits or by 20% of the mean. The CS includes tornado diagrams
illustrating how the net monetary benefit for ocrelizumab (at a threshold of £30,000 per QALY
gained) varies: CS Figure 31 (B.3.8.2) for the comparison with IFNβ-1a (Rebif) and CS
Appendix J.1.3 Figures 49 to 56 for other comparators. The results are consistently most
sensitive to the treatment effects on disability progression (CDP). Results are also sensitive to
discontinuation rates for dimethyl fumerate and teriflunomide.
Scenario Analyses
The CS also presents a series of scenario analyses testing the sensitivity of results to changes
in data sources or assumptions (CS B.3.8.3.). Results for the company ITT base case with
ocrelizumab PAS and list prices for comparators are shown in Table 65 of the CS. The cost-
effectiveness of ocrelizumb in comparison with alemtuzumab, dimethyl fumerate, fingolimod,
natalizumab and teriflunomide is not sensitive to any of the scenarios tested. However, some of
the ICERs in comparison with the ABCR drugs do vary between scenarios: we summarise these
findings in Table 53.
Ocrelizumab appears relatively less cost-effective in comparison with the ABCR drugs for four
efficacy scenarios: CDP-24 instead of CDP-12 MTC effects (scenario 9); assumptions about
waning of the effectiveness of treatment over time (scenarios 12 and 13); and a reduction in the
Copyright 2018 Queen's Printer and Controller of HMSO. All rights reserved.

Version 1 155
discontinuation rates for all drugs by 50% from year 3 onwards (scenario 14). Conversely,
results were relatively more favourable for ocrelizumab in two scenarios: use of MTC results for
the HA subgroup (scenario 10); and using social care cost estimates form the BOUNDS-MS
study, CS Appendix M (scenario 16).
Copyright 2018 Queen's Printer and Controller of HMSO. All rights reserved.

Version 1 156
Table 53 Company scenario analyses (ocrelizumab PAS, list prices for comparators)
ICER ocrelizumab vs. ABCR comparators
IFNβ-1a
(Avonex) GA
IFNβ-
1b
pegβ-
1a
IFNβ-1
(Rebif)
Company ITT base case 22,841 27,304 23,711 35,028 25,911
NATURAL HISTORY
1) Baseline demographics: Pickin et al 2009 21,773 26,079 22,691 33,717 24,670
2) EDSS transitions: London Ontario 22,781 27,822 23,885 36,150 25,803
3) ARR: HA subgroup (natalizumab submission) 22,843 27,304 23,712 35,030 25,913
4) ARR: RES subgroup (natalizumab submission) 20,695 25,869 22,254 32,772 23,913
5) ARR: Held et al 2005 and UK MS Survey 2005 21,309 25,985 22,408 33,419 24,423
6) Relapse duration:1 month 22,910 27,358 23,759 35,134 25,983
7) Relapse duration: 2 months 22,775 27,252 23,665 34,927 25,843
8) Mortality risk: Kingwell et al 2012 21,987 26,690 22,941 34,830 25,198
EFFICACY
9) Disability progression (CDP-24) 37,805 37,113 25,663 94,196 24,329
10) MTC HA subgroup 16,657 19,920 17,297 NR 18,006
11) MTC RES subgroup 25,071 29,036 25,613 NR 28,792
12) Treatment waning: 75% after 2 years and
50% after 5 years for all DMTs
34,704 40,986 35,193 56,070 40,523
13) Treatment waning: 75% after 2 years and
50% after 5 years for comparators; 75% after 4
years and 50% after 7 years for ocrelizumab
28,487 33,524 28,836 43,869 31,167
14) All-cause discontinuation: 50% after year 2 24,546 29,322 25,987 37,064 27,406
COSTS
15) Health state costs (medical): BOUNDS-MS 21,732 26,203 22,633 33,854 24,756
16) Health state costs (social): BOUNDS-MS 13,296 17,698 14,221 25,469 16,423
17) Relapse cost: Hawton et al 2016 23,644 27,828 24,252 35,832 26,649
UTILITIES
18) Health state utilities: Orme et al 2007 23,905 28,582 24,807 36,605 27,070
19) Relapse disutility: OPERA I and II regression 22,757 27,238 23,652 34,898 25,823
Copyright 2018 Queen's Printer and Controller of HMSO. All rights reserved.

Version 1 157
4.4.3 Subgroup Analyses
Finally, the company presents results for the HA and RES subgroup analyses in section B.3.9 of
the CS. These analyses do not include alemtuzumab, because results are not available from the
subgroup MTC analyses for the outcome of CDP12. As in the ITT analysis, daclizumab is
excluded because of the EMA safety warning. We reproduce tables of deterministic results for
the two subgroups below, using the ocrelizumab PAS and list price for comparators. These
results are not informative because of the omission of alemtuzumab and the PAS price for
fingolimod.
Table 54 Base case HA subgroup, deterministic: adapted from CS Table 67 (ocrelizumab PAS; list prices for comparators)
Technologies Total costs
(£)
Total LYG
Total QALYs
ICER vs baseline (£/QALY)
ICER incremental
(£/QALY)
Ocrelizumab ******* ***** ***** - -
Fingolimod ******* ***** **** Dominated Dominated
Table 55 Base case RES subgroup, deterministic: adapted from CS Table 71 (ocrelizumab PAS; list prices for comparators)
Technologies Total costs
(£)
Total LYG
Total QALYs
ICER vs baseline (£/QALY)
ICER incremental
(£/QALY)
Ocrelizumab ******* ***** **** - -
Natalizumab ******* **** ***** 1,065,854 1,065,854
Copyright 2018 Queen's Printer and Controller of HMSO. All rights reserved.

Version 1 158
4.5 ERG additional analysis
We made one very small correction to the company model, adding 3 decimal places for the
ARR natural history data, as reported in CS Table 35. Results under the company base case
are therefore slightly different to those reported in the CS.
The analyses presented below only include comparators in the scope for the population of
interest: patients without HA or RES disease, HA and RES subgroups. Results below use the
PAS price for ocrelizumab and list prices for comparators. We replicate the analyses including
PAS prices for daclizumab, dimethyl fumerate, fingolimod and teriflunomide in Addendum 1 to
this report.
For simplicity, we present results with a ‘blended ABCR’ comparator, based on the market share
weights reported by the company (CS Table 55). We use scenario analysis to show how results
differ for the separate β-interferon and GA comparators, reporting the range of results for the
most and least cost-effective ABCR drug.
4.5.1 Additional scenario analysis on company base case
Results for the company ITT base case with relevant comparators for patients without HA or
RES disease are shown in Table 56. The QALY results are the same as those reported in CS
Table 57 and there are very small differences in the estimated costs and ICERs due to our use
of more precise baseline ARR rates.
Table 56 Company base case ITT (PAS ocrelizumab; list prices for comparators)
Technologies
Total costs
(£)
Total
QALYs
ICER (£/QALY)
Ocrelizumab vs.
comparator Incremental
Blended ABCRs ******** **** £26,436
Alemtuzumab ******** ***** OCR dominated £8,299
Teriflunomide a ******** **** £9,833 Dominated
Ocrelizumab ******** **** - Dominated
Daclizumab a ******** **** OCR dominant Dominated
Dimethyl fumarate a ******** **** OCR dominant Dominated
Key: ICER, incremental cost-effectiveness ratio; LYG, life years gained; QALYs, quality-adjusted life years. a PAS available but not included in this analysis
Results of the company’s one-way sensitivity analyses with our minor corrections are illustrated
in Figure 7 and Figure 8 below. In addition to a comparison of ocrelizumab versus IFNβ-1a
Copyright 2018 Queen's Printer and Controller of HMSO. All rights reserved.

Version 1 159
(Rebif), we also present a comparison of ocrelizumab versus alemtuzumab. Neither of these
comparators has a discounted PAS price available, so the results reflect prices paid in the NHS.
The two figures show that efficacy at prevening disability progression is the major source of
uncertainty over the model results.
Figure 7 Tornado diagram: company ITT base case ocrelziumab vs alemtuzumab (PAS price for ocrelizumab)
Figure 8 Tornado diagram: company ITT base case ocrelizumab vs IFNβ-1a (Rebif) (PAS price for ocrelizumab)
Copyright 2018 Queen's Printer and Controller of HMSO. All rights reserved.

Version 1 160
We reran a series of scenario analyses on the company’s base case for the non HA/RES
population, including those presented in CS Table 65 that were relevant for this group. In
addition, we ran some analyses to address further uncertainties. Our rerun of the company’s
base case and scenarios was preceeded by a correction of model inputs for ARR by states,
which were rounded off in the company’s model. In our presentation of results, we exclude out
of scope comparisons and present results as pairwise ICERs (ocrelizumab versus
comparators).
For a complete list of scenarios and results using list prices (PAS for ocrelizumab) and PAS
prices for all treatments where available, see Table 57 below and Table 3 of Addendum 1 to this
ERG report respectively. A clear difference between these two results is that while daclizumab
and DMF appear dominated in ERG Table 57, the ICERs for most scenarios are close to the
threshold of £30,000 in the PAS analysis. Results are identical for ABCR and ALEM as PAS
prices are not available. Key conclusions from Table 57 are discussed below:
Treatment waning was a major driver, with the ICER for ocrelizumab exceeding £30,000
(versus ABCR) when the same assumption of equal waning was applied to all DMTs. An
assumption of delayed waning for ocrelizumab improved cost-effectiveness.
In our pairwise comparison of ocrelizumab versus the most cost-effective ABCR
(pegIFNβ-1a), the ICER exceeds £30,000.
In our pairwise comparison of ocrelizumab versus the least cost-effective ABCR
(avonex), the ICER was under £30,000.
In Table 58 and Table 59 below, we present a rerun of the company’s scenario analyses for the
HA and RES subgroups for relevant comparators. In the HA subgroup, ocrelizumab is
dominated by alemtuzumab in all scenarios but always dominates daclizumab and fingolimod.
Similarly, in the RES subgroup, ocrelizumab is dominated in all scenarios by alemtuzumab but
dominates daclizumab and natalizumab where applicable.
Copyright 2018 Queen's Printer and Controller of HMSO. All rights reserved.

Version 1 161
Table 57 ERG scenario analysis, company ITT base case (OCR PAS, list prices for comparators)
ICER ocrelizumab vs. ABCR comparators
ABCR ALEM DAC DMF TERI
Company ITT base case 26,436 OCR dominated OCR dominant 9,833
Company scenarios
1 Demographics: Pickin et al 2009 25,245 OCR dominated OCR dominant 9,226
2 EDSS transitions: London Ontario 26,714 OCR dominated OCR dominant 8,057
5 ARR: Held & UK MS Survey 2005 25,001 OCR dominated OCR dominant 8,473
6 Relapse duration:1 month 26,502 OCR dominated OCR dominant 9,858
7 Relapse duration: 2 months 26,373 OCR dominated OCR dominant 9,810
8 Mortality risk: Kingwell et al 2012 25,768 OCR dominated OCR dominant 8,274
9 Disability progression (CDP-24) 32,860 OCR dominated OCR dominant 9,199
12 Waning: equal across DMTs 40,332 OCR dominated OCR dominant 15,236
13 Waning: delayed waning for OCR 32,581 240,947 OCR dominant 11,763
14 Discontinuation: 50% fall year 3+ 28,273 OCR dominated OCR dominant 11,735
15 Medical costs: BOUNDS-MS 25,316 OCR dominated OCR dominant 8,688
16 Social care costs: BOUNDS-MS 16,881 OCR dominated OCR dominant 130
17 Relapse cost: Hawton et al 2016 27,101 OCR dominated OCR dominant 10,509
18 HS utilities: Orme et al 2007 27,655 OCR dominated OCR dominant 10,289
19 Relapse disutility: OPERA I and II 26,355 OCR dominated OCR dominant 9,803
ERG scenarios
1 No EDSS reductions in SPMS 18,839 OCR dominated OCR dominant 5,175
2 No effect on SPMS conversions 26,868 OCR dominated OCR dominant 9,796
3 No EDSS increase on conversion 28,273 OCR dominated OCR dominant 11,300
4 Mortality multiplier Jick et al 2014 24,269 OCR dominated OCR dominant 7,513
5 HCC adjustment ALEM: 0% 26,436 OCR dominated OCR dominant 9,833
6 HCC adjustment OCR: 2.5% 27,996 OCR dominated OCR dominant 11,566
7 HS costs: UK MS Survey 17,900 OCR dominated OCR dominant 1,158
8 HS costs: Biogen BoI 26,809 OCR dominated OCR dominant 10,207
9 ALEM retreatment maximum: 4 26,436 OCR dominated OCR dominant 9,833
10 Carer disutility: maximum -0.05 28,015 OCR dominated OCR dominant 10,432
11 Comparison with best ABCR 35,030 pegIFNβ-1a
12 Comparison with worst ABCR 22,843 IFNβ-1a (Avonex)
Copyright 2018 Queen's Printer and Controller of HMSO. All rights reserved.

Version 1 162
Table 58 ERG scenario analysis, company HA subgroup analysis (OCR PAS; list prices for comparators)
NA: MTC results not available for scenario Table 59 ERG scenario analysis, company RES subgroup analysis (OCR PAS; list prices for comparators)
SW: south west quadrant – less effective and less expensive, so higher ICER indicates ocrelizumab is relatively more cost-effective. NA: MTC results not available for scenario.
ICER ocrelizumab vs. comparators
ALEM DAC FINGO
Company HA subgroup analysis NA NA OCR dominant
Disability progression: CDP-24
1 HA MTC CDP-24 OCR dominated OCR dominant OCR dominant
2 ITT MTC CDP-24 OCR dominated OCR dominant OCR dominant
3 British Columbia EDSS transitions OCR dominated OCR dominant OCR dominant
4 ARR from Pazold/UK-MS Survey OCR dominated OCR dominant OCR dominant
5 No effect on SPMS conversion OCR dominated OCR dominant OCR dominant
6 No EDSS rise on conversion OCR dominated OCR dominant OCR dominant
7 Effect 75% year 3-4; 50% year 6+ OCR dominated OCR dominant OCR dominant
8 Delayed waning of effect OCR OCR dominated OCR dominant OCR dominant
9 HS costs: BOUNDS OCR dominated OCR dominant OCR dominant
10 HS costs: UK MS Survey OCR dominated OCR dominant OCR dominant
11 HS costs: Biogen BoI OCR dominated OCR dominant OCR dominant
ICER ocrelizumab vs. comparators
ALEM DAC NAT
Company RES subgroup analysis NA £10,636 £1,065,854 SW
Disability progression: CDP-24
1 RES MTC CDP-24 OCR dominated NA £91,265 SW
2 ITT MTC CDP-24 OCR dominated OCR dominant £203,440 SW
3 British Columbia EDSS transitions OCR dominated NA £68,025 SW
4 ARR from Pazold/UK-MS Survey OCR dominated NA £95,653 SW
5 No effect on SPMS conversion OCR dominated NA £75,992 SW
6 No EDSS rise on SPMS conversion OCR dominated NA £77,466 SW
7 Effect 75% year 3-4; 50% year 6+ OCR dominated NA £161,079 SW
8 Delayed waning of effect OCR OCR dominated NA £252,936 SW
9 HS costs: BOUNDS OCR dominated NA £80,591 SW
10 HS costs: UK MS Survey OCR dominated NA £90,162 SW
11 HS costs: Biogen BoI OCR dominated NA £92,806 SW
Copyright 2018 Queen's Printer and Controller of HMSO. All rights reserved.
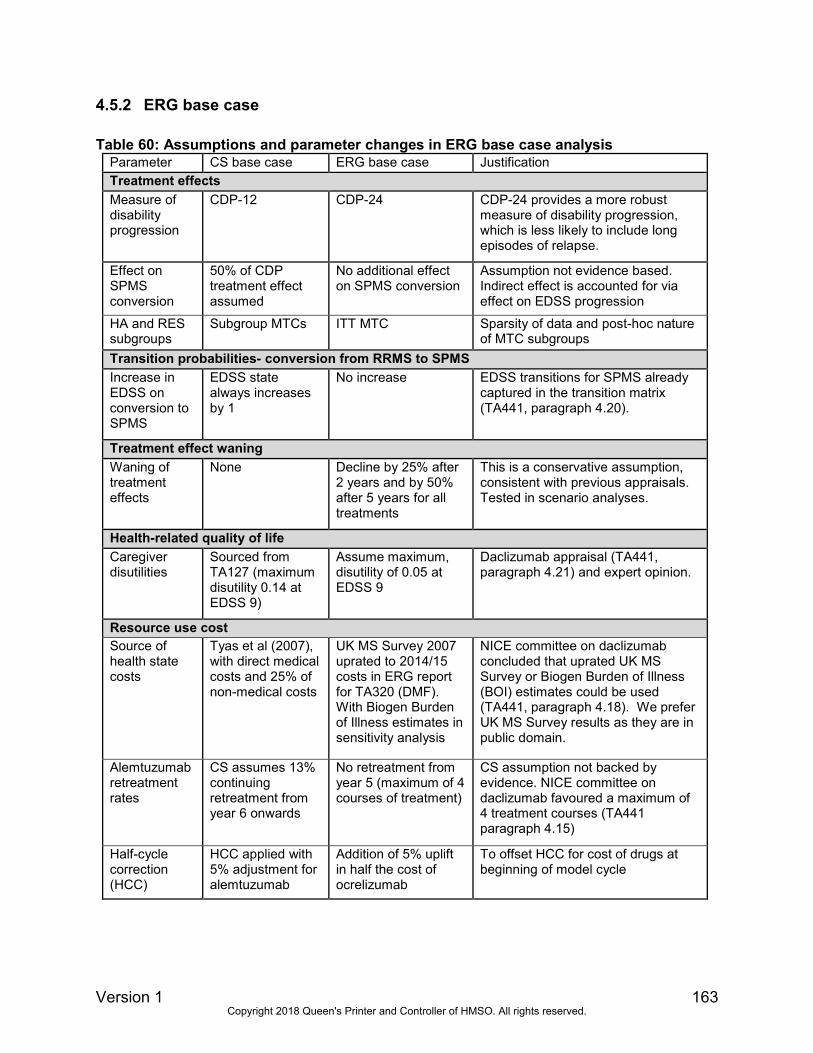
Version 1 163
4.5.2 ERG base case
Table 60: Assumptions and parameter changes in ERG base case analysis
Parameter CS base case ERG base case Justification
Treatment effects
Measure of disability progression
CDP-12 CDP-24 CDP-24 provides a more robust measure of disability progression, which is less likely to include long episodes of relapse.
Effect on SPMS conversion
50% of CDP treatment effect assumed
No additional effect on SPMS conversion
Assumption not evidence based. Indirect effect is accounted for via effect on EDSS progression
HA and RES subgroups
Subgroup MTCs ITT MTC Sparsity of data and post-hoc nature of MTC subgroups
Transition probabilities- conversion from RRMS to SPMS
Increase in EDSS on conversion to SPMS
EDSS state always increases by 1
No increase EDSS transitions for SPMS already captured in the transition matrix (TA441, paragraph 4.20).
Treatment effect waning
Waning of treatment effects
None Decline by 25% after 2 years and by 50% after 5 years for all treatments
This is a conservative assumption, consistent with previous appraisals. Tested in scenario analyses.
Health-related quality of life
Caregiver disutilities
Sourced from TA127 (maximum disutility 0.14 at EDSS 9)
Assume maximum, disutility of 0.05 at EDSS 9
Daclizumab appraisal (TA441, paragraph 4.21) and expert opinion.
Resource use cost
Source of health state costs
Tyas et al (2007), with direct medical costs and 25% of non-medical costs
UK MS Survey 2007 uprated to 2014/15 costs in ERG report for TA320 (DMF). With Biogen Burden of Illness estimates in sensitivity analysis
NICE committee on daclizumab concluded that uprated UK MS Survey or Biogen Burden of Illness (BOI) estimates could be used (TA441, paragraph 4.18). We prefer UK MS Survey results as they are in public domain.
Alemtuzumab retreatment rates
CS assumes 13% continuing retreatment from year 6 onwards
No retreatment from year 5 (maximum of 4 courses of treatment)
CS assumption not backed by evidence. NICE committee on daclizumab favoured a maximum of 4 treatment courses (TA441 paragraph 4.15)
Half-cycle correction (HCC)
HCC applied with 5% adjustment for alemtuzumab
Addition of 5% uplift in half the cost of ocrelizumab
To offset HCC for cost of drugs at beginning of model cycle
Copyright 2018 Queen's Printer and Controller of HMSO. All rights reserved.

Version 1 164
4.5.2.1 ERG analysis: people without HA or RES
The rationale for our base case assumptions are stated and compared with the company’s base
case assumptions in Table 60 above. In Table 61 below, we present our base case results for
the non-HA or RES population, based on the PAS price for ocrelizumab and list prices for
comparators. A version of our base case results using PAS prices for all treatments where
available is presented in Table 8 of Addendum 1 to this ERG report. Our findings show that
ocrelizumab is dominated by alemtuzumab under our preferred assumptions. While ocrelizumab
dominates daclizumab and DMF in Table 61, it is less cost-effective in the PAS analysis with an
ICER exceeding £30,000 for these comparisons. The ICER for ocrelizumab compared with
ABCR is £43,772 per QALY gained.
Table 61 ERG base case, non-HA/RES (PAS ocrelizumab; list prices for comparators)
Technologies
Total costs
(£)
Total
QALYs
ICER (£/QALY)
Ocrelizumab vs.
comparator Incremental
Blended ABCRs ******** **** £43,772
Alemtuzumab ******** ***** OCR dominated £1,992
Teriflunomide ******** **** £10,302 Dominated
Ocrelizumab ******** **** - Dominated
Daclizumab ******** **** OCR dominant Dominated
Dimethyl fumarate ******** **** OCR dominant Dominated
Key: ICER, incremental cost-effectiveness ratio; LYG, life years gained; QALYs, quality-adjusted life years. a PAS available but not included in this analysis
We carried out scenario analyses to test the sensitivity of our base case model to key
uncertainties (see Table 62). While the results for ocrelizumab versus alemtuzumab,
daclizumab, DMF and teriflunimide are very similar for the company and ERG base cases, they
differ for ocrelizumab versus ABCR: in all scenarios around the ERG base case (Table 62), the
ICER for ocrelizumab versus ABCR exceeds £30,000, whereas for most of the scenarios
around the company’s base case (Table 57), the ICER for ocrelizumab versus ABCR is below
£30,000. In the all-PAS version of ERG base case scenario analyses (Table 9 in Addendum 1 to
this report), the ICER of ocrelizumab is above £30,000 for almost all scenarios in comparisons
of ocrelizumab versus ABCR, daclizumab, DMF and teriflunomide.
Copyright 2018 Queen's Printer and Controller of HMSO. All rights reserved.

Version 1 165
Table 62 Scenario analyses, ERG base case non-HA/RES (ocrelizumab PAS, list prices for comparators)
ICER ocrelizumab vs. ABCR comparators
ABCR ALEM DAC DMF TERI
ERG base case 43,772 OCR dominated OCR dominant 10,302
NATURAL HISTORY
Demographics Pickin 2009 44,442 OCR dominated OCR dominant 8,508
RRMS EDSS transitions LO 55,995 OCR dominated OCR dominant 11,106
No EDSS regression in SPMS 42,211 OCR dominated OCR dominant 7,159
Effect on SPMS conversion 50% 41,810 OCR dominated OCR dominant 13,214
EDSS increase on conversion 46,501 OCR dominated OCR dominant 10,969
Relapse duration 1 month 43,872 OCR dominated OCR dominant 10,345
Relapse duration 2 months 43,676 OCR dominated OCR dominant 10,261
Mortality multiplier Kingwell 44,386 OCR dominated OCR dominant 8,086
Mortality multiplier Jick 43,342 OCR dominated OCR dominant 7,078
EFFICACY
CDP 12-week confirmation 39,524 OCR dominated OCR dominant 12,033
No waning of treatment effect 33,082 OCR dominated OCR dominant 6,090
Delayed waning for OCR 39,077 OCR dominated OCR dominant 10,357
Discontinuation falls 50% year 3 47,629 OCR dominated OCR dominant 12,379
ALEM retreatment ongoing 43,772 OCR dominated OCR dominant 10,302
COSTS
No HCC adjustment ALEM 43,772 OCR dominated OCR dominant 10,302
No HCC adjustment OCR 41,917 OCR dominated OCR dominant 7,724
Health state costs: Biogen BoI 47,237 OCR dominated OCR dominant 20,720
Medical costs: BOUNDS-MS 40,129 OCR dominated OCR dominant OCR dominant
Social costs: BOUNDS-MS 40,129 OCR dominated OCR dominant OCR dominant
Relapse cost: User input 44,382 OCR dominated OCR dominant 11,414
UTILITIES
Health state utilities: Orme 2007 47,292 OCR dominated OCR dominant 10,956
Relapse disutility: Regression analysis of trial EQ-5D data 43,649 OCR dominated OCR dominant 10,249
Carer disutility: max -0.14 43,000 OCR dominated OCR dominant 9,671
Copyright 2018 Queen's Printer and Controller of HMSO. All rights reserved.

Version 1 166
4.5.2.2 ERG analysis: HA subgroup
The results for the ERG base case analysis in the HA subgroup are shown in Table 63, with
scenario analysis in Table 64 for the ocrelizumab PAS and list prices for comparators.
Corresponding analyses based on all available PAS prices are shown in Tables 10 and 11 in
Addendum 1 to this report. These show that ocrelizumab is dominated by alemtuzumab under
ERG preferred assumptions. The ICERs for ocrelizumab versus fingolimod are subject to
uncertainty in the all-PAS analyses.
Table 63 ERG HA subgroup (OCR PAS, list prices for comparators) Technologies Total costs
(£) Total QALYs OCR vs comparator
(£/QALY) Incremental ICER
(£/QALY)
Alemtuzumab ******** ***** OCR dominated
Ocrelizumab ******** ***** - Dominated
Daclizumab ******** ***** OCR dominant Dominated
Fingolimod ******** ***** OCR dominant Dominated
Table 64 Scenario analyses, ERG HA subgroup (OCR PAS, list prices for comparators)
ICER ocrelizumab vs. comparators
ALEM DAC FINGO
ERG HA subgroup analysis OCR dominated OCR dominant OCR dominant
1 HA MTC CDP-24 OCR dominated OCR dominant OCR dominant
2 HA MTC CDP-12 NA NA OCR dominant
3 British Columbia EDSS transitions OCR dominated OCR dominant OCR dominant
4 ARR from Pazold/UK-MS Survey OCR dominated OCR dominant OCR dominant
5 50% effect on SPMS conversion OCR dominated OCR dominant OCR dominant
6 EDSS rise on SPMS conversion OCR dominated OCR dominant OCR dominant
7 No waning of treatment effects OCR dominated OCR dominant OCR dominant
8 Delayed waning of effect OCR OCR dominated OCR dominant OCR dominant
9 HS costs: BOUNDS OCR dominated OCR dominant OCR dominant
11 HS costs: Biogen BoI OCR dominated OCR dominant OCR dominant
Copyright 2018 Queen's Printer and Controller of HMSO. All rights reserved.

Version 1 167
4.5.2.3 ERG analysis: RES subgroup
Finally, Table 65 and Table 66 below show the ERG preferred analysis and scenarios for the
RES subgroup with the ocrelizumab PAS and list prices for comparators. It can be seen that
alemtuzumab dominates ocrelizumab under all scenarios tested. Compared with natalizumab,
ocrelizumab has favourable ICERs (note that ocrelizumab is estimated to be less effective but
also less costly than ocrelizumab). Results with the PAS for daclizumab as well are shown in
Tables 12 and 13 of Addendum 1 to this ERG report.
Table 65 ERG RES subgroup (OCR PAS, list prices for comparators)
Technologies Total costs (£)
Total QALYs OCR vs comparator (£/QALY)
Incremental ICER (£/QALY)
Alemtuzumab ******** ***** OCR dominated
Ocrelizumab ******** ***** - Dominated
Daclizumab ******** ***** OCR dominant Dominated
Natalizumab ******** ***** £183,633 SW Dominated
SW: south west quadrant – less effective and less expensive, so higher ICER indicates ocrelizumab is relatively more cost-effective.
Table 66 Scenario analyses, ERG RES subgroup (OCR PAS, list prices for comparators)
SW: south west quadrant – less effective and less expensive, so higher ICER indicates ocrelizumab is relatively more cost-effective. NA: MTC results not available for scenario.
ICER ocrelizumab vs. comparators
ALEM DAC NAT
ERG RES subgroup analysis OCR dominated OCR dominant £183,633 SW
1 RES MTC CDP-24 OCR dominated NA £110,264 SW
2 RES MTC CDP-12 NA £14,013 £217,721 SW
3 British Columbia EDSS transitions OCR dominated OCR dominant £202,010 SW
4 ARR from Pazold/UK-MS Survey OCR dominated OCR dominant £192,069 SW
5 50% effect on SPMS conversion OCR dominated OCR dominant £230,696 SW
6 EDSS rise on SPMS conversion OCR dominated OCR dominant £248,566 SW
7 No waning of treatment effects OCR dominated OCR dominant £107,477 SW
8 Delayed waning of effect OCR OCR dominated OCR dominant £354,302 SW
9 HS costs: BOUNDS OCR dominated OCR dominant £188,358 SW
11 HS costs: Biogen BoI OCR dominated OCR dominant £195,656 SW
Copyright 2018 Queen's Printer and Controller of HMSO. All rights reserved.

Version 1 168
5 Innovation The company makes a case for ocrelizumab being an innovative therapy (CS section B.1.2),
arguing that ocrelizumab has a mechanism of action distinct from that of other DMTs,
establishing a new standard of care in RRMS because of:
Less frequent administration than other DMTs, possibly mitigating the risk of non-adherence;
A favourable safety profile, requiring no additional monitoring tests or MRI screening;
A low probability of long-term treatment waning based on biologically plausible contributory
factors, associated evidence following literature review and consultation with clinical
experts;
A durable treatment effect based on the supporting data from the OLE phase;
Decreasing inflammation of the innate immune system based on pre-clinical investigations
using an animal model of human MS disease;
Reversibility of the pharmacodynamic effect based on the half-life of ocrelizumab (26 days),
with the Phase II trial indicating a median time to B cell repletion of 72 weeks (range 27–
175 weeks).44
The CS further states that the MTC indicates that ocrelizumab is a highly efficacious DMT linked
with lower healthcare utilisation (two infusions per year) and less frequent monitoring compared
to other high efficacy DMTs, leading to a step-change in treatment for all RRMS patients and
potential earlier treatment with a high efficacy DMT.
The ERG agrees that the above considerations are plausible benefits of ocrelizumab, but the
assertions regarding safety, patient adherence and treatment waning are as yet unproven in the
long-term.
Copyright 2018 Queen's Printer and Controller of HMSO. All rights reserved.

Version 1 169
6 DISCUSSION
The company’s searches for evidence of clinical effectiveness evidence and the overall
approach to the company’s evidence synthesis, including the assessment of direct and indirect
effects, is generally well-structured, logical, and based on established methods. The company’s
economic model also follows a logical approach based on established methods. However, there
are a number of weaknesses and uncertainties which we have summarised below.
6.1 Summary of clinical effectiveness issues
The MTC analyses of CDP-12 and CDP-24 assume proportional hazards. The company
provided evidence to suggest that this assumption is supported for the comparison of
ocrelizumab against interferon β-1a, but it is unclear whether the assumption would be
supported for comparisons among other DMTs.
To enable MTC networks to be formed for HA and RES disease severity subgroups, the
company utilised ITT data from trials of ‘ABCR’ comparators (types of interferon β and
glatiramer acetate). The underlying assumption is that, for these treatments, the
treatment effect observed in the ITT population would be the same as the treatment
effects in the subgroup populations. However, the company has not clearly justified that
this assumption is supported. Overall, given the limitations of the subgroup analyses,
including that they were post-hoc and potentially at risk of selection bias, both the
company and ERG consider the MTC results for these subgroups to be unreliable.
There are marked differences between trials included in the MTCs in the proportions of
patients who were treatment-naïve and treatment-experienced, and also in the time
since onset of symptoms. The the ERG is therefore uncertain whether the consistency
assumption of MTC analysis is supported.
There is uncertainty around some individual input data for the MTCs. (i) An independent
MTC which the company used to provide ITT CDP-12 outcomes for some comparisons
against alemtuzumab, obtained by the company from the ‘HAS Reimbursement dossier’
has not been critiqued by the company and the ERG is unable to locate the dossier to
check it. (ii) It is unclear whether the placebo arm in the Calbrese 2012 trial was included
in MTC analysis. (iii) The company does not adequately justify why the Etemadefir 2006
trial was excluded from MTC analyses of ARR.
Copyright 2018 Queen's Printer and Controller of HMSO. All rights reserved.

Version 1 170
The company did not conduct any sensitivity analyses to investigate whether MTC
outcomes were sensitive to the inclusion of trials that were judged to be at high risk of
bias.
In the OPERA trials there are unbalanced missing data for some secondary outcomes
(though these outcomes do not inform the economic analysis).
6.2 Summary of cost effectiveness issues
Decision problem addressed
The company’s economic analysis generally addresses the decision problem set in the NICE
scope. However, the CS presents results including comparators that are outside of the scope
(fingolimod and natalizumab in the company’s ITT base case analysis) and excluding
comparators that are in scope (alemtuzumab). This is not a serious problem because the model
is easily adapted to present only relevant incremental comparisons.
The appropriateness of excluding daclizumab is less clear-cut, given the EMA safety warning
issued after finalisation of the scope for this appraisal. For completeness, we report cost-
effectiveness results for daclizumab alongside other comparators as information for the
Committee.
We do have concern about bias relating to the use of ITT effectiveness evidence to drive cost-
effectiveness estimates for patients without HA or RES disease. DMTs indicated for this group
differ from those for people with HA and RES MS, thus incremental cost-effectiveness should be
considered separately for the three subgroups. In response to a clarification question, the
company shows that effectiveness estimates from the OPERA trials are rather less favourable
for the non-HA/RES subgroup than for the whole ITT population. However, conducting a
revised MTC for people without HA or RES MS is not possible for this appraisal, and might not
be possible at all unless sufficient other trials report results excluding HA and RES subgroups.
Model structure and assumptions
The model follows the NICE reference case.
The model reflects many features of models used to inform previous NICE appraisals of DMTs
for MS, including the choice of model structure and health states and sources for many of the
input parameters. It also adopts a number of assumptions employed in previous appraisals,
which we consider reasonable. These include:
Copyright 2018 Queen's Printer and Controller of HMSO. All rights reserved.

Version 1 171
Stopping rules for DMTs: EDSS>=7 or conversion to SPMS
No impact of treatment on severity or duration of relapses
Treatment reduces disability progression but not regression
Rates of withdrawal from treatment and adverse effects are constant over time
DMT does not directly affect mortality. An indirect effect is modelled because treatment
reduces EDSS progression and mortality rates are modelled to rise with EDSS
However, we identified a number of assumptions in the company model not supported by
evidence that the experts who we consulted thought were unlikely or unrealistic:
Confirmation of disability progression at 12 weeks. We believe that CDP-24 weeks is a
more robust measure, less likely to be confounded by longer-lasting temporary relapses
Effect on rate of conversion from RRMS to SPMS (assumed 50% of relative effect on
CDP)
Conversion from RRMS to SPMS is accompanied by a one-point increase in EDSS
Probability of EDSS improvement in SPMS disease
No waning of treatment effects over time
Rates of retreatment for alemtuzumab assumed 13% from year 6 onwards
Data sources
Generally, we agreed with the company’s choice of data sources to inform model parameters.
The model uses estimates of EDSS transition probabilities from the British Columbia dataset,
which we consider appropriate in the absence of a placebo arm in the OPERA trials. The
resulting transition matrix allows for improvements in EDSS as well as deterioration. As
mentioned above, we believe that CDP-24 is a better measure of treatment effectiveness in
preventing disability progression than CDP-12.
The company used estimates of health state costs from Tyas et al. 2007 (uprated for inflation) in
their base case model and estimates from the BOUNDS-MS burden of disease study in
scenario analysis. Recent NICE appraisals have used other sources of health state cost
estimates, including UK MS Survey (at 2011/12 prices) and a burden of disease study
presented in the submission for the NICE daclizumab appraisal. We consider that the latter
sources give more realistic estimates of current UK prices from an NHS and PSS perspective.
Copyright 2018 Queen's Printer and Controller of HMSO. All rights reserved.

Version 1 172
Company base case results
The company’s base case analysis for the ITT population suggests that: alemtuzumab
dominates ocrelizumab; but if alemtuzumab is not an option for some patients, ocrelizumab has
an ICER of £26,435 compared with blended ABCR (CS Table 59). The ICER for ocrelizumab
varies between individual ABCR comparators, with a range from £22,841 compared with IFNβ-
1a (Avonex) to £35,028 compared with Pegβ-1a (CS Appendix J.1.2 Table 63).
The company results for the HA and RES subgroups suggest that ocrelizumab is cost-effective
compared with fingolimod and natalizumab respectively. However, these results exclude
alemtuzumab, because results are not available from the subgroup MTC analysis for the
outcome of CDP-12 that the company used. As in the ITT analysis, daclizumab is excluded
because of the EMA safety warning.
The CS also reports one-way sensitivity analysis, scenario analyses and probabilistic analysis,
which are reproduced and discussed in this ERG report.
Summary of additional work undertaken by the ERG
The ERG analysis consists of three parts:
A rerun of the company’s model after minor corrections, but essentially maintaining the
company’s base case assumptions. Out of scope comparators are excluded from results
of this analysis.
A base case analysis based on alternative assumptions that the ERG found more
plausible following consultations with experts and after consideration of available
evidence. The ERG also explores additional scenarios for individual parameters.
A PAS analysis reported in Addendum 1 to this ERG report. As previously stated, cost-
effectiveness results reported by the company do not reflect prices paid in the NHS,
since the PAS price for ocrelizumab is compared to the list prices of comparators.
Our findings show that ocrelizumab is dominated by alemtuzumab under our preferred
assumptions. While ocrelizumab dominates daclizumab and DMF based on the PAS price for
ocrelizumab and list prices for comparators, it is less cost-effective in the all-PAS analysis. The
ICER for ocrelizumab compared with ABCR is £43,772 per QALY gained.
Copyright 2018 Queen's Printer and Controller of HMSO. All rights reserved.

Version 1 173
The ERG base case analysis in the HA subgroup shows that ocrelizumab is dominated by
alemtuzumab under ERG preferred assumptions. The ICERs for ocrelizumab versus fingolimod
are subject to uncertainty in the all-PAS analyses.
For the RES subgroup, we found that alemtuzumab dominates ocrelizumab under all scenarios
tested. Compared with natalizumab, ocrelizumab has favourable ICERs (note that ocrelizumab
is estimated to be less effective but also less costly than natalizumab). Results with the PAS for
daclizumab are shown in Tables 12 and 13 of Addendum 1 to this ERG report.
7 REFERENCES
1. Lunde H, Assmus J, Myhr K, Bø L, Grytten N. Survival and cause of death in multiple
sclerosis: a 60-year longitudinal population study. Journal of neurology, neurosurgery, and
psychiatry. 2017;88:621-5.
2. Mackenzie IS, Morant SV, Bloomfield GA, MacDonald TM, O'Riordan J. Incidence and
prevalence of multiple sclerosis in the UK 1990-2010: a descriptive study in the General
Practice Research Database. Journal of neurology, neurosurgery, and psychiatry.
2014;85(1):76-84.
3. Marrie R, Elliott L, Marriott J, Cossoy M, Blanchard J, Leung S, et al. Effect of
comorbidity on mortality in multiple sclerosis. Neurology. 2015;85:240-7.
4. Lorscheider J, Buzzard K, Jokubaitis V, Spelman T, Havrdova E, Horakova D, et al.
Defining secondary progressive multiple sclerosis. Brain. 2016;139 (Pt 9):2395-405.
5. MS-EPIC Team. Long-term evolution of multiple sclerosis disability in the treatment era.
Ann Neurol. 2016;80:499-510.
6. Scolding N, Barnes D, Cader S, Chataway J, Chaudhuri A, Coles A, et al. Association of
British Neurologists: revised (2015) guidelines for prescribing disease-modifying treatments
in multiple sclerosis. Practical neurology. 2015;15(4):273-9.
7. National Institute for Health and Care Excellence (NICE). Multiple sclerosis in adults:
management. Clinical guideline (CG186). 2014.
8. Polman CH, Reingold SC, Banwell B, Clanet M, Cohen JA, Filippi M, et al. Diagnostic
criteria for multiple sclerosis: 2010 revisions to the McDonald criteria. Ann Neurol.
2011;69(2):292-302.
Copyright 2018 Queen's Printer and Controller of HMSO. All rights reserved.

Version 1 174
9. Comi G, Radaelli M, Sørenson P. Evolving concepts in the treatment of relapsing
multiple sclerosis. Lancet. 2017;389:1347-56.
10. Pardo G, Jones D. The sequence of disease‑modifying therapies in relapsing
multiple sclerosis: safety and immunologic considerations. J Neurol. 2017;264:2351-74.
11. Wiendl H, Bourdette D, Ciccarelli O. Can immune reprogramming with
alemtuzumab induce permanent remission in multiple sclerosis? Neurology.
2017;89(11):1098-100.
12. ICER (Institute for Clinical and Economic Review). A look at disease-modifying
therapies for multiple sclerosis. Do these new drugs meet an important need? Boston, MA,
USA: ICER; 2017.
13. National Institute for Health and Care Excellence. Fingolimod for the treatment of
highly active relapsing–remitting multiple sclerosis (TA254). 2012.
14. National Institute for Health and Care Excellence. Alemtuzumab for treating
relapsing‑ remitting multiple sclerosis (TA312). 2014.
15. National Institute for Health and Care Excellence. Natalizumab for the treatment
of adults with highly active relapsing–remitting multiple sclerosis (TA127). 2007.
16. EMA (European Medicines Agency). EMA restricts use of multiple sclerosis
medicine Zinbryta. London: EMA; 2017. Report No.: EMA/424159/2017.
17. National Institute for Health and Care Excellence. Multiple sclerosis - interferon
beta, glatiramer acetate (review TA32) [ID809]. 2018.
18. F. Hoffman-La Roche Ltd. Sumary of product characteristics - Ocrevus [draft
version] [confidential document]. 2017.
19. National Institute for Health and Care Excellence. Daclizumab for treating
relapsing–remitting multiple sclerosis (TA441). 2017.
20. EMA (European Medicines Agency). Guideline on clinical investigation of
medicinal products for the treatment of multiple sclerosis 2015.
21. Tolley K, Hutchinson M, You X, Wang P, Sperling B, Taneja A, et al. A network
meta-analysis of efficacy and evaluation of safety of subcutaneous pegylated interferon
beta-1a versus other injectable therapies for the treatment of relapsing-remitting multiple
sclerosis. PLoS One. 2015;10(6):e0127960:1-21.
22. Huisman E, Papadimitropoulou K, Jarrett J, Bending M, Firth Z, Allen F, et al.
Systematic literature review and network meta-analysis in highly active relapsing–remitting
multiple sclerosis and rapidly evolving severe multiple sclerosis. BMJ Open.
2017;7:e013430:1-10.
Copyright 2018 Queen's Printer and Controller of HMSO. All rights reserved.

Version 1 175
23. Li R, Sun X, Shu Y, Mao Z, Xiao L, Qiu W, et al. Sex differences in outcomes of
disease-modifying treatments for multiple sclerosis: A systematic review. Multiple Sclerosis
and Related Disorders. 2017;12:23-8.
24. ICER (Institute for Clinical and Economic Review). Disease-modifying therapies
for relapsing-remitting and primary-progressive multiple sclerosis: effectiveness and value
Boston, MA, USA: ICER; 2017.
25. CADTH (Canadian Agency for Drugs and Technologies in Health). Clinical
review report. Ocrelizumab (Ocrevus). CADTH Common drug review. 2017.
26. Chan A, Cutter G, Fox R, Xiao J, Lewin J, Edwards M. Comparative
effectiveness of delayed-release dimethyl fumarate versus glatiramer acetate in multiple
sclerosis patients: results of a matching-adjusted indirect comparison. J Comp Eff Res.
2017;6:313-23.
27. Fogarty E, Schmitz S, Tubridy N, Walsh C, Barry M. Comparative efficacy of
disease-modifying therapies for patients with relapsing remitting multiple sclerosis:
Systematic review and network meta-analysis. Mult Scler Relat Disord. 2016;9:23-30.
28. La Mantia L, Di Pietrantonj C, Rovaris M, Rigon G, Frau S, Berardo F, et al.
Interferons-beta versus glatiramer acetate for relapsing-remitting multiple sclerosis.
Cochrane Database Syst Rev. 2016;Issue 11. Art.No.: CD009333.
29. La Mantia L, Tramacere I, Firwana B, Pacchetti I, Palumbo R, Filippini G.
Fingolimod for relapsing-remitting multiple sclerosis. Cochrane Database Syst Rev.
2016;Issue 4. Art. No.: CD009371.
30. Melendez-Torres G, Auguste P, Armoiry X, Maheswaran H, Court R, Madan J, et
al. Clinical effectiveness and cost-effectiveness of beta-interferon and glatiramer acetate for
treating multiple sclerosis: systematic review and economic evaluation. Health Technol
Assess. 2017;21(52):1-396.
31. Merkel B, Butzkueven H, Traboulsee A, Havrdova E, Kalincik T. Timing of high-
efficacy therapy in relapsing-remitting multiple sclerosis: a systematic review. Autoimmun
Rev. 2017;16:658-65.
32. Riera R, GJM P, Torloni M. Alemtuzumab for multiple sclerosis. Cochrane
Database Syst Rev. 2016;Issue 4. Art. No.: CD011203.
33. Siddiqui M, Khurana I, Budhia S, Hettle R, Harty G, Wong S. Systematic
literature review and network meta-analysis of cladribine tablets versus alternative disease-
modifying treatments for relapsing-remitting multiple sclerosis. Curr Med Res Opin.
2017;epub ahead of print.
Copyright 2018 Queen's Printer and Controller of HMSO. All rights reserved.

Version 1 176
34. Tramacere I, Del Giovane C, Salanti G, D'Amico R, Filippini G.
Immunomodulators and immunosuppressants for relapsing-remitting multiple sclerosis: a
network meta-analysis. Cochrane Database Syst Rev. 2015;Issue 9. Art. No.: CD011381
35. Tsivgoulis G, Katsanos A, Mavridis D, Grigoriadis N, Dardiotis E, Heliopoulos I,
et al. The efficacy of natalizumab versus fingolimod for patients with relapsing-remitting
multiple sclerosis: a systematic review, indirect evidence from randomized placebo-
controlled trials and meta-analysis of observational head-to-head trials. PLoS One.
2016;11(9): e0163296:1-14.
36. Vitaliti G, Matin N, Tabatabaei O, Di Traglia M, Pavone P, Lubrano R, et al.
Natalizumab in multiple sclerosis: discontinuation, progressive multifocal
leukoencephalopathy and possible use in children. Expert Rev Neurother. 2015;15:1321-
41.
37. Weideman A, Tapia-Maltos M, Johnson K, Greenwood M, Bielekova B. Meta-
analysis of the age-dependent efficacy of multiple sclerosis treatments. Front Neurol.
2017;8:577:1-12.
38. Xie Q, Li X, Sun J, Yuan B, Li Y, Wang L, et al. A meta-analysis to determine the
efficacy and tolerability of anti-B-cell monoclonal antibodies in multiple sclerosis.
Experimental and Therapeutic Medicine. 2017;13(6):3061-6.
39. Zagmutt F, Carroll C. Meta-analysis of adverse events in recent randomized
clinical trials for dimethyl fumarate, glatiramer acetate and teriflunomide for the treatment of
relapsing forms of multiple sclerosis. Int J Neurosci. 2015;125:798-807.
40. Zhang J, Shi S, Zhang Y, Luo J, Xiao Y, Meng L, et al. Alemtuzumab versus
interferon beta 1a for relapsing-remitting multiple sclerosis. Cochrane Database of
Systematic Reviews. 2017;2017 (11) (no pagination)(CD010968).
41. Lucchetta R, Riveros B, Wiens A, Bonetti A, Mendes A, Tonin F, et al.
Systematic review and network meta-analysis of disease-modifying therapies in relapsing-
remitting multiple sclerosis [protocol]. PROSPERO record number CRD420170591202017.
42. Tramacere I, Benedetti M, Capobussi M, Castellini G, Citterio A, Del Giovani C,
et al. Adverse effects of immunotherapies for multiple sclerosis: a network meta-analysis.
Cochrane Database Syst Rev. 2016;Issue 5. Art. No.: CD012186.
43. Wilson K, McCool R, Glanville J, Edwards M, Fleetwood K. Systematic review
and network meta-analysis of treatment for relapsing-remitting multiple sclerosis. York, UK:
York Health Economics Consortium; 2017.
Copyright 2018 Queen's Printer and Controller of HMSO. All rights reserved.

Version 1 177
44. Kappos L, Li D, Calabresi P, O'Connor P, Bar-Or A, Barkhof F, et al.
Ocrelizumab in relapsing-remitting multiple sclerosis: a phase 2, randomised, placebo-
controlled, multicentre trial. Lancet. 2011;378:1779-87.
45. Hauser S, Bar-Or A, Comi G, Giovannoni G, Hartung H, Hemmer B, et al.
Ocrelizumab versus interferon beta-1a in relapsing multiple sclerosis. N Engl J Med.
2017;376:221-34.
46. Lavery A, Verhey L, Waldman A. Outcome measures in relapsing-remitting
multiple sclerosis: capturing disability and disease progression in clinical trials. Mult Scler
Int. 2014;Article ID 262350:1-13.
47. van Munster C, Uitdehaag B. Outcome measures in clinical trials for multiple
sclerosis. CNS Drugs. 2017;31:217-36.
48. CPMP (Committee for Proprietary Medicinal Products). Points to consider on
multiplicity issues in clinical trials. London: EMEA; 2002.
49. EMA (European Medicines Agency). Guideline on adjustment for baseline
covariates in clinical trials. London: EMA; 2015. Report No.: EMA/CHMP/295050/2013.
50. Healy B, Engler D, Glanz B, Musallam A, Chitnis T. Assessment of definitions of
sustained disease progression in relapsing-remitting multiple sclerosis. Mult Scler Int.
2013;Article ID 189624:1-9.
51. Durelli L, Verdun E, Barbero P, Bergui M, Versino E, Ghezzi A, et al. Every-
other-day interferon beta-1b versus once-weekly interferon beta-1a for multiple sclerosis:
results of a 2-year prospective randomised multicentre study (INCOMIN). Lancet.
2002;359:1453-60.
52. Vartanian T. An examination of the results of the EVIDENCE, INCOMIN, and
phase III studies of interferon beta products in the treatment of multiple sclerosis. Clin Ther.
2003;25:105-18.
53. Dias S, Welton N, Sutton AJ, Ades A. NICE DSU Technical Support Document 2:
A Genearlised Linear Modelling Framework for Pairwise and Network Meta-analysis of
Randomised Controlled Trials (last update September 2016). 2011.
54. Turner RM, Jackson D, Wei Y, Thompson SG, Higgins JP. Predictive
distributions for between-study heterogeneity and simple methods for their application in
Bayesian meta-analysis. Statistics in medicine. 2015;34(6):984-98.
55. MRC Biostatistics Unit. DIC: Deviance Information Criteria 2017 [Available from:
https://www.mrc-bsu.cam.ac.uk/software/bugs/the-bugs-project-dic/.
Copyright 2018 Queen's Printer and Controller of HMSO. All rights reserved.

Version 1 178
56. Dias S, Sutton AJ, Welton N, Ades A. NICE DSU Technical Support Document 3:
Heterogeneity: subgroups, meta-regression, bias and bias-adjustment (last updated April
2012). 2011.
57. Jansen J, Fleurence R, Devine B, Itzler R, Barrett A, Hawkins N, et al.
Interpreting indirect treatment comparisons and network meta-analysis for health-care
decision making: report of the ISPOR Task Force on Indirect Treatment Comparisons Good
Research Practices: part 1. Value Health. 2011;14:417-28.
58. Dias S, Welton N, Sutton AJ, Caldwell DM, Lu G, Ades A. NICE DSU Technical
Support Document 4: Inconsistency in Networks of Evidence Based on Randomised
Controlled Trials (last updated April 2014). 2011.
59. Maruish M, Kosinski M, Bjorner J, Gandek B, Turner-Bowker D, Ware J. User's
manual for the SF-36v2 health survey. 3 ed. Lincoln, RI, USA: Quality Metric Inc; 2011.
60. Kurtzke J. Rating neurologic impairment in multiple sclerosis: an expanded
disability status scale (EDSS). Neurology. 1983;33:1444-52.
61. Larson R. Psychometric properties of the Modified Fatigue Impact Scale.
International journal of MS care. 2013;15:15-20.
62. Amtmann D, Kim J, Chung H, Bamer A, Askew R, Wu S, et al. Comparing
CESD-10, PHQ-9, and PROMIS depression instruments in individuals with multiple
sclerosis. Rehabil Psychol. 2014;59:220-9.
63. Yang H, Duchesneau E, Foster R, Guerin A, Ma E, Thomas NP. Cost-
effectiveness analysis of ocrelizumab versus subcutaneous interferon beta-1a for the
treatment of relapsing multiple sclerosis. Journal of Medical Economics. 2017;20(10):1056-
65.
64. Frasco MA, Shih T, Incerti D, Diaz Espinosa O, Vania DK, Thomas N.
Incremental net monetary benefit of ocrelizumab relative to subcutaneous interferon β-1a.
Journal of Medical Economics. 2017;20(10):1074-82.
65. NHS England. Clinical Commissioning Policy: Disease Modifying Therapies for
Patients with Multiple Sclerosis. 2014. Report No.: Reference: NHS ENGLAND/ D04/P/b.
66. Biogen. Daclizumab for relapsing multiple sclerosis: Company evidence
submission. 2016.
67. Pickin M, Cooper CL, Chater T, O'Hagan A, Abrams KR, Cooper NJ, et al. The
Multiple Sclerosis Risk Sharing Scheme Monitoring Study–early results and lessons for the
future. BMC neurology. 2009;9(1):1.
Copyright 2018 Queen's Printer and Controller of HMSO. All rights reserved.

Version 1 179
68. Chilcott J, Miller DH, McCabe C, Tappenden P, O'Hagan A, Cooper NJ, et al.
Modelling the cost effectiveness of interferon beta and glatiramer acetate in the
management of multiple sclerosisCommentary: Evaluating disease modifying treatments in
multiple sclerosis. BMJ. 2003;326(7388):522.
69. National Institute for Health and Care Excellence. Beta interferon and glatiramer
acetate for the treatment of multiple sclerosis. Technology appraisal guidance [TA32]. 2002.
70. Palace J, Bregenzer T, Tremlett H, Oger J, Zhu F, Boggild M, et al. UK multiple
sclerosis risk-sharing scheme: a new natural history dataset and an improved Markov
model. BMJ open. 2014;4(1):e004073.
71. Patzold U, Pocklington PR. Course of multiple sclerosis. Acta Neurologica
Scandinavica. 1982;65(4):248-66.
72. Orme M, Kerrigan J, Tyas D, Russell N, Nixon R. The effect of disease,
functional status, and relapses on the utility of people with multiple sclerosis in the UK.
Value in health. 2007;10(1):54-60.
73. Office for National Statistics (ONS). National life tables, UK: 2013–2015. 2016.
74. National Institute for Health and Care Excellence. Dimethyl fumarate for treating
relapsing‑ remitting multiple sclerosis (TA320). 2014.
75. Dolan P, Gudex C, Kind P, Williams A. A social tariff for EuroQol: results from a
UK General Population survey. University of York: Centre for Health Economics; 1995.
Contract No.: Report.
76. Tuohy O, Costelloe L, Hill-Cawthorne G, Bjornson I, Harding K, Robertson N, et
al. Alemtuzumab treatment of multiple sclerosis: long-term safety and efficacy. Journal of
neurology, neurosurgery, and psychiatry. 2014:jnnp-2014-307721.
77. Willis M, Harding K, Pickersgill T, Wardle M, Pearson O, Scolding N, et al.
Alemtuzumab for multiple sclerosis: long term follow-up in a multi-centre cohort. Multiple
Sclerosis Journal. 2016;22(9):1215-23.
78. Coles AJ, Cohen JA, Fox EJ, Giovannoni G, Hartung H-P, Havrdova E, et al.
Alemtuzumab CARE-MS II 5-year follow-up Efficacy and safety findings. Neurology.
2017;89(11):1117-26.
79. Havrdova E, Arnold DL, Cohen JA, Hartung H-P, Fox EJ, Giovannoni G, et al.
Alemtuzumab CARE-MS I 5-year follow-up Durable efficacy in the absence of continuous
MS therapy. Neurology. 2017;89(11):1107-16.
80. Hawton A, Green C. Multiple sclerosis: relapses, resource use, and costs. The
European Journal of Health Economics. 2016;17(7):875-84.
Copyright 2018 Queen's Printer and Controller of HMSO. All rights reserved.

Version 1 180
81. Karampampa K, Gustavsson A, Miltenburger C, Eckert B. Treatment experience,
burden and unmet needs (TRIBUNE) in MS study: results from five European countries.
Multiple Sclerosis Journal. 2012;18(2_suppl):7-15.
82. Kobelt G, Berg J, Lindgren P, Kerrigan J, Russell N, Nixon R. Costs and quality
of life of multiple sclerosis in the United Kingdom. The European Journal of Health
Economics. 2006;7(2):96-104.
83. Tyas D, Kerrigan J, Russell N, Nixon R. The distribution of the cost of multiple
sclerosis in the UK: how do costs vary by illness severity? Value Health. 2007;10:386-9.
84. Kobelt G, Thompson A, Berg J, Gannedahl M, Eriksson J, Group MS, et al. New
insights into the burden and costs of multiple sclerosis in Europe. Multiple Sclerosis
Journal. 2017;23(8):1123-36.
85. Thompson A, Kobelt G, Berg J, Capsa D, Eriksson J, Miller D, et al. New insights
into the burden and costs of multiple sclerosis in Europe: Results for the United Kingdom.
Multiple Sclerosis Journal. 2017;23(2_suppl):204-16.
Copyright 2018 Queen's Printer and Controller of HMSO. All rights reserved.

Version 1 181
8 APPENDICES
Appendix 1 Dosing regimens of the intervention and comparators
DMT Abbreviation Brand name Dosing (for RRMS in the NHS)
Alemtuzumab ALEM Lemtrada IV, 2 per 12 months
Daclizumab DAC Zinbryta SC, 1 per month
Dimethyl fumarate DMF Tecfidera Oral, 2 per day
Glatiramer acetate GA Copaxone SC, every other day or 3 per week a
Fingolimod FINGO Gilenya Oral, 1 per day
Interferon β-1a IFNβ-1a Avonex IM, 1 per week
Rebif SC, 3 per week
Peginterferon β-1a PEGβ-1a Plegridy IM, 1 per 2 weeks
Interferon β-1b IFNβ-1b Betaferon SC, every other day
Extavia SC, every other day
Natalizumab NAT Tysabri IV, 1 per 4 weeks
Ocrelizumab OCR Ocrevus IV, 1 per 6 months b
Teriflunomide TERI Aubagio Oral, 1 per day
IM, intramuscular injection; IV, intravenous infusion; SC, subcutaneous injection. a Dosing depends upon which of 2 preparations is used. b First dose is split into two half-doses 2 weeks apart.
Copyright 2018 Queen's Printer and Controller of HMSO. All rights reserved.

Version 1 182
Appendix 2 Company and ERG risk of bias assessments for the ocrelizumab trials
NICE quality assessment criteria for RCT Judgements OPERA I OPERA II Phase II trial Kappos 2011
1. Was the method used to generate
random allocations adequate?
CS: Yes Yes Yes
ERG: Yes Yes Yes
ERG comments: OPERA I & II: Randomisation was performed centrally with the use of an
independent interactive web-response system. Randomisation was stratified by region (United States
versus rest of the world) and baseline EDSS (<4.0 versus ≥4.0). The *********************************.
Phase II trial: A randomisation list was generated by an independent group within Roche. This list was
provided to an interactive voice response system, which then randomised patients (1:1:1:1) to one of
the four treatment groups stratified by geographical region.
2. Was the concealment of treatment
allocation adequate?
CS: Yes Yes Unclear
ERG: Yes Yes Yes
ERG comments: OPERA I & II:
*********************************************************************************************************************
*********************************************************************************************************************
*********************************************************************************************************************
.
Phase II trial: The randomisation list was not disclosed to the study centres, monitors, project
statisticians, or to the project team at Roche and Genentech.
3. Were the groups similar at the outset of
the study in terms of prognostic factors?
CS: Yes Yes Yes
ERG: Yes Yes Yes
ERG comments: There were only minor differences in all measured baseline variables between the
arms within each trial. An exception is the proportion of patients without previous DMT which varied
23% across the arms within the phase II trial (proportions were 47% in the OCR 600mg arm; 69-70% in
the placebo and IFNβ-1a arms), as well as slight differences for the duration of MS and the numbers of
gadolinium-enhancingT1 lesions (clarification A7b).
4. Were the care providers, participants
and outcome assessors blind to treatment
allocation?
CS: Yes Yes No
ERG: Yes Yes No
ERG comments: OPERA I & II: Double-blind, double-dummy design wherein all patients received
both infusion and injection in order to maintain blinding. Each trial centre had separate treating and
examining investigators, all of whom were unaware of the treatment assignments throughout the trial.
MRI scans were analysed centrally by personnel who were unaware of the treatment assignments.
Phase II trial: All individuals directly involved in the study remained blinded to the dose of ocrelizumab.
Project statisticians remained blinded until data lock and statistical analysis at week 24. Treatment
assignment was masked for patients in the placebo and both ocrelizumab groups throughout the study.
In the interferon β-1a group, only the raters were masked to allocation; therefore comparisons of the
other groups with this group on the primary and secondary outcomes were exploratory.
Continued on next page
Copyright 2018 Queen's Printer and Controller of HMSO. All rights reserved.

Version 1 183
Copyright 2018 Queen's Printer and Controller of HMSO. All rights reserved.

Version 1 184
Appendix 2 continued 5. Were there any unexpected imbalances
in drop-outs between groups?
CS: Yes Yes No
ERG: No No No
ERG comments: OPERA I & II: There were higher dropout rates in the IFNβ-1a than the OCR arms
(11-14% in the OCR arms; 17-23% in the IFNβ-1a arms). However, the specific reasons for dropout do
not appear to be unexpected and imbalances are relatively minor. The most frequent reasons for
dropout were adverse events (3-4% in OCR arms; 6% in IFNβ-1a arms), lack of efficacy (1-2% in OCR
arms; 3-4% in IFNβ-1a arms), withdrawal of consent (2-3% in OCR arms; 3-6% in IFNβ-1a arms), and
unspecified “other” reasons (2% in OCR arms; 3-4% in IFNβ-1a arms).
Phase II trial: At the end of the 24-week randomised phase of the trial, there was a higher dropout rate
in the OCR (7.3%) than the IFNβ-1a arm (5.6%) and none in the placebo arm (0%). After 48 weeks,
when all patients had received OCR, the sequence remained the same (OCR 10.9%, IFNβ-1a 9.3%,
placebo 3.7%. The proportions and reasons for dropout were similar between the OCR and IFN arms.
The main difference is that no adverse events and no withdrawal of consent occurred in the placebo
arm. No patients were withdrawn due to lack of efficacy.
6. Is there any evidence to suggest that
the authors measured more outcomes
than they reported?
CS: No No No
ERG: No No No
ERG comments: There is no suggestion that the OPERA trials measured more outcomes than reported. However, several exploratory patient-reported/disability outcomes which are relevant to the NICE scope and were measured in both trials are not reported in the CS. These include EDSS scores and fatigue scores (for further details see section 3.1.5).
There is no suggestion that the Phase II trial measured more outcomes than reported.
7. Did the analysis (1) include an
intention-to-treat (ITT) analysis? (2) If so,
was this appropriate and (3) were
appropriate methods used to account for
missing data?
CS: Yes Yes Yes
ERG: (primary outcome only)
1. Yes
2. Yes
3. Yes
1. Yes
2. Yes
3. Yes
1. Yes
2. Yes
3. Yes
ERG comments: OPERA I & II: The primary outcome was analysed appropriately according to ITT. However, although the CS implies that secondary analyses (apart from NEDA) were performed in the ITT population, Table 11 in the CS shows sample sizes for all secondary outcomes were smaller than the ITT population (see section 3.1.6.1 above). The ERG judgements for secondary outcomes in OPERA I & II would be: 1. No; 2. Not applicable; 3: Unclear.
Phase II trial: The primary outcome was analysed appropriately according to ITT.
Copyright 2018 Queen's Printer and Controller of HMSO. All rights reserved.

Version 1 185
Appendix 3 Expanded Disability Status Scale (EDSS) The EDSS60 reflects disability of MS patients based on neurological examination by describing
symptoms and signs in eight functional systems as well as ambulatory function and the ability to
carry out activities of daily living. The functional systems are: “pyramidal” (weakness or difficulty
moving limbs); “cerebellar” (ataxia, loss of coordination or tremor); “brainstem” (problems
with speech, swallowing and nystagmus); “sensory” (numbness or loss of sensations);
“bowel and bladder function”; “visual function”; “cerebral” (or mental) functions; and “other”.
Each functional system is scored on a scale of 0 (no disability) to 5 or 6 (more severe disability)
and the overall (ordinal) scale is calculated such that it ranges from 0 (normal neurological
examination) to 10 (death due to MS). The scale is divided into 0.5-point increments, each of
which is associated with a textual description of the disability state that the score reflects.
Scores from 0 to 4.0 are determined by functional systems scores, meaning that in this range
the EDSS primarily assesses impairment whilst EDSS steps 5.0 to 9.5 are defined by walking-
related disability.47
Although widely used, the EDSS faces several criticisms,20, 47 including that: the scale relies on
walking as the main measure of disability; it has high intra- and inter-rater variability; it is non-
linear, with the rate of disability progression varying depending upon the baseline score; and
several domains are not captured (e.g. cognitive function, mood, energy level and quality of life).
A pragmatic means of dealing with the non-linearity of the scale is that a clinically meaningful
change is often defined as 1.0 or more for baseline scores of 0 to 5.5, or 0.5 or more for
baseline scores >5.5.47 According to clinical experts advising the ERG, an EDSS score around
7.0, when MS patients effectively become confined to a wheelchair, is an appropriate stopping
rule for DMT therapies that aim to prevent relapses, since this approximates the transition point
from RRMS to SPMS. The minimum clinically important difference has been determined to be a
1.0 point change when EDSS is below 5.5 and a 0.5 point change when EDSS is between 5.5
and 8.5.
Copyright 2018 Queen's Printer and Controller of HMSO. All rights reserved.

Version 1 186
Expanded Disability Status Scale (EDSS)
Score Description
1.0 No disability, minimal signs in one functional system
1.5 No disability, minimal signs in more than one functional system
2.0 Minimal disability in one functional system
2.5 Mild disability in one functional system or minimal disability in two functional
systems
3.0 Moderate disability in one functional system, or mild disability in three or four
functional systems. No impairment to walking
3.5 Moderate disability in one functional system and more than minimal disability in
several others. No impairment to walking
4.0 Significant disability but self-sufficient and up and about some 12 hours a day.
Able to walk without aid or rest for 500m
4.5 Significant disability but up and about much of the day, able to work a full day, may
otherwise have some limitation of full activity or require minimal assistance. Able to
walk without aid or rest for 300m
5.0 Disability severe enough to impair full daily activities and ability to work a full day
without special provisions. Able to walk without aid or rest for 200m
5.5 Disability severe enough to preclude full daily activities. Able to walk without aid or
rest for 100m
6.0 Requires a walking aid – cane, crutch, etc. – to walk about 100m with or without
resting
6.5 Requires two walking aids – pair of canes, crutches, etc. – to walk about 20m
without resting
7.0 Unable to walk beyond approximately 5m even with aid. Essentially restricted to
wheelchair; though wheels self in standard wheelchair and transfers alone. Up and
about in wheelchair some 12 hours a day
7.5 Unable to take more than a few steps. Restricted to wheelchair and may need aid
in transferring. Can wheel self but cannot carry on in standard wheelchair for a full
day and may require a motorised wheelchair
8.0 Essentially restricted to bed or chair or pushed in wheelchair. May be out of bed
itself much of the day. Retains many self-care functions. Generally has effective
use of arms
8.5 Essentially restricted to bed much of day. Has some effective use of arms retains
some self-care functions
9.0 Confined to bed. Can still communicate and eat
9.5 Confined to bed and totally dependent. Unable to communicate effectively or
eat/swallow
10.0 Death due to MS
Copyright 2018 Queen's Printer and Controller of HMSO. All rights reserved.

Version 1 187
Appendix 4 ERG quality assessment of the company’s MTC analyses
Criterion ERG assessment
NMA purpose
1. Are the MTC results used to support the evidence for the clinical effectiveness of the intervention?
Yes, for the comparison of ocrelizumab with treatments in the scope which have not been compared to ocrelizumab directly.
2. Are the MTC results used to support the evidence for the cost-effectiveness of the intervention?
Yes. The MTC is the source for economic model estimates of disease progression, relapse rates, and all-cause discontinuation of treatment. The CS also states that MTCs were done for other outcomes but are not reported as they were not considered relevant for the economic evaluation for NICE (these were relapse free proportion, proportion of patients with serious adverse events, and discontinuation due to adverse events).
Evidence selection
3. Are inclusion/exclusion criteria adequately reported?
Yes, CS Appendix Table 3 describes the inclusion and exclusion criteria for the company’s systematic review of clinical effectiveness, which incorporates the MTC. The CS also mentions a feasibility assessment in which additional criteria for the MTC were applied, CS Appendix Table 9. These related to doses or regimens which are not approved/licensed (presumably by the EMA), and studies with controlled treatment durations less than 48 weeks (11 trials were excluded on this criterion).
4. Is quality of the included studies assessed?
Yes. Risk of bias criteria are applied to all studies included in the MTC and judgements are briefly summarised in CS section B.2.9.1 and also presented in a colour coded table (CS Appendix D.1.3, Table 13).
Methods – statistical model
5. Is the statistical model described?
Yes. CS Appendix D.1.1 describes the statistical analysis methods used. A Bayesian MTC model was used for all outcomes, as described by NICE DSU TSD 2.53 The base case MTC for each outcome is based on a random effects model with a vague prior distribution for the between-study variance. Sensitivity analyses were conducted to explore variations to base case assumptions, using alternative priors, fixed effect models and meta-regression on follow-up time.
6. Has the choice of outcome measure used in the analysis been justified?
Yes. The CS reports MTC results for outcomes that are used in the economic model. The outcomes are: ARR, CDP-12, CDP-24 and al- cause discontinuation.
7. Has a structure of the network been provided?
Yes, network diagrams are provided in CS section B.2.9 for the ITT and subgroup population MTC networks, and also in CS Appendix D for the restricted networks, the sensitivity analyses and the meta-regression MTCs.
Copyright 2018 Queen's Printer and Controller of HMSO. All rights reserved.

Version 1 188
Appendix 4 continued
8. Is homogeneity considered? Yes. CS Appendix D Table 27 provides statistical heterogeneity assessment results (as I2 values) for head to head pairwise comparisons, colour coded according to categorisations of low (I2 = 0% to 25%), low to moderate (I2 = 25% to 50%), moderate to high (I2
= 50% to 75%) and high heterogeneity (I2 = 75% to 100%) (the ERG assumes this is for the ITT base case MTCs rather than for the subgroup MTCs). The majority of comparisons produced low heterogeneity estimates, with seven (21%) of the 34 comparisons classified as moderate to high, and none classified as high. For the seven moderate to high comparisons the CS provides forest plots (with tau-squared and p values for statistical heterogeneity) and a discussion, in varying in detail across comparisons, of potential sources of heterogeneity. The company provided forest plots for all pairwise comparisons following an ERG request. A random effects model was used in the base case MTC analysis, which is recommended where heterogeneity is identified or suspected.
9. Are the studies homogenous in terms of patient characteristics and study design?
Unclear. The trials appear to be reasonably well balanced on a range of baseline characteristics (e.g. age, sex, EDSS score, previous relapses), but there are notable imbalances across trials in the proportions of patients who were treatment-naïve/experienced and in the time since the onset of symptoms.
10. If the homogeneity assumption is not satisfied, is clinical or methodological homogeneity across trials in each set involved in the indirect comparison investigated by an adequate method? (e.g. sub group analysis, sensitivity analysis, meta-regression)
Separate MTC analyses are conducted for the RES and HA subgroups (though not necessarily to investigate heterogeneity, rather, to adhere to the NICE scope), and meta-regression was conducted to assess the impact of trial follow-up.
11. Is the assumption of similarity stated?
No. An explicit statement of the similarity assumption across the trials is not given.
12. Is any of the programming code used in the statistical programme provided (for potential verification)?
Yes, following request (clarification A13).
Copyright 2018 Queen's Printer and Controller of HMSO. All rights reserved.

Version 1 189
Appendix 4 continued
Sensitivity analysis
13. Does the study report sensitivity analyses?
Yes, sensitivity analyses are reported for the ITT population MTC (but not for the RES and HA subgroups) for the four outcomes on choice of prior distribution, fixed effects model, meta-regression on follow-up time (trial duration), and two restricted networks which excluded comparators not within the NICE scope.
Results
14. Are the results of the MTC presented?
Yes. CS section B.2.9 provides a narrative description of the results with forest plots showing comparison between ocrelizumab and comparator DMTs. CS Appendix D.1.4 provides cross-tabulation of numerical results (i.e. illustrating pairwise comparisons between all included treatments) for the base case ITT MTCs (not for sensitivity analyses, patient subgroups or the restricted networks).
15. Does the study describe an assessment of the model fit?
Yes. The deviance information criterion (DIC) is used to assess model fit for the choice of prior distribution (DIC values are provided in CS Appendix D.1.4). The DIC is also used to judge the similarity in fit between the base case MTCs and the sensitivity analysis MTCs; the similarity in fit between the base case MTCs and the meta-regression on trial duration; and the MTC models assuming consistency and inconsistency. If DIC values for the sensitivity analyses are within 3 units of each other they are regarded as indicating a similar fit. For the assessment of consistency, if the DIC for the inconsistency model is lower than the consistency model by more than 3 points then potential inconsistency is suspected (as recommended by NICE DSU TSD number 458).
16. Has there been any discussion around the model uncertainty?
Yes – CS section B.2.9.1 discusses the uncertainties in the results of the MTCs, in terms of inconsistency assessments, risk of bias, data limitations, and the subgroup analyses.
17. Are the point estimates of the relative treatment effects accompanied by some measure of variance such as confidence intervals?
Yes – credible intervals are provided for all point estimates.
Discussion - overall results
18. Does the study discuss both conceptual and statistical heterogeneity?
No. Only a brief mention is made of heterogeneity across the studies included in the MTC (CS Appendix section D.1.1, page 105) in terms of the proportion of patients included in the trials with forms of MS other than RRMS.
Copyright 2018 Queen's Printer and Controller of HMSO. All rights reserved.

Version 1 190
Appendix 4 continued
Discussion - validity
19. Are the results from the MTC compared, where possible, to those just using direct evidence?
Yes. Consistency is discussed in CS section B.2.9 (pages 68 to 69), based on the results of the consistency assessments conducted. Also, as stated above (see item 8) the CS provides results of pairwise comparisons from head to head trials for comparisons where there was moderate to high heterogeneity. Following an ERG request (clarification A20) the company provided results of all head to head pairwise comparisons, which permits comparison of the results of the head to head studies with the results of the MTC (i.e. direct and indirect evidence).
DSU = Decision Support Unit ; TSD = Technical Support Document
Copyright 2018 Queen's Printer and Controller of HMSO. All rights reserved.

Version 1 191
Appendix 5 Contribution of ocrelizumab and comparator trials to the company’s MTC analyses
Trial (for references see Table 26a)
ARR CDP-12 CDP-24 All-cause discont.
ITT (Table 33a)
ITT (Table 30a)
HA (Table 34a)
RES (Table 35a)
ITT (Table 31a)
HA (Table 36a)
RES (Table 37a)
ITT (Table 32a)
HA (Table 38a)
RES (Table 39a)
ADVANCE ITT ITT ITT ITT
AFFIRM ITT SG ITT SG ITT SG ITT
BEYOND ITT ITT ABCR ITT ABCR ITT ITT ABCR ITT ABCR ITT
Bornstein 1987 ITT ITT ABCR ITT ABCR
BRAVO ITT ITT ABCR ITT ABCR ITT ITT ABCR ITT ABCR ITT ITT ABCR ITT ABCR
Calabrese 2012 ITT ITT ABCR ITT ABCR
CAMMS 223 ITT
HAS MTC
ITT ITT
CARE-MS I ITT SG ITT ITT
CARE-MS II ITT SG SG ITT SG SG ITT
CLARITY ITT ITT ITT ITT
CombiRx ITT ITT ABCR ITT ABCR ITT ITT ABCR ITT ABCR
CONFIRM ITT ITT ABCR ITT ABCR ITT
ITT ABCR SG pooled
with DEFINE
ITT ABCR SG pooled
with DEFINE
ITT ITT ABCR ITT ABCR ITT
Complymer 1 MS trial
ITT ITT ABCR ITT ABCR ITT ITT ABCR ITT ABCR ITT
DECIDE ITT SG SG ITT ITT SG ITT
DEFINE ITT ITT SG pooled
with CONFIRM
SG pooled with
CONFIRM ITT ITT
Etemadifir 2006
EVIDENCE ITT ITT ABCR ITT ABCR ITT ITT ABCR ITT ABCR ITT ITT ABCR ITT ABCR ITT
FREEDOMS ITT SG
SG ITT SG
SG ITT SG
ITT
FREEDOMS II ITT ITT ITT ITT
GALA ITT ITT ABCR ITT ABCR
IFNB MS ITT ITT ABCR ITT ABCR ITT ITT ABCR ITT ABCR ITT
INCOMIN ITT ITT ABCR ITT ABCR ITT
MSCRG ITT ITT ABCR ITT ABCR ITT ITT ABCR ITT ABCR ITT
OPERA I ITT SG SG
ITT SG SG
ITT SG SG
ITT
OPERA II ITT ITT ITT ITT
PRISMS ITT ITT ABCR ITT ABCR ITT
Copyright 2018 Queen's Printer and Controller of HMSO. All rights reserved.

Version 1 192
REGARD ITT ITT ABCR ITT ABCR ITT ITT ABCR ITT ABCR ITT
SELECT ITT SG SG ITT SG ITT SG ITT
Stepien 2013 ITT ITT ABCR ITT ABCR
TEMSO ITT ITT SG pooled
with TOWER
SG ITT SG pooled
with TOWER
ITT
TENERE ITT ITT
TOWER ITT ITT SG pooled
with TEMSO
ITT SG pooled
with TEMSO
ITT
TRANSFORMS ITT SG SG ITT SG SG ITT
Total no. of trials (no. after pooling)
30 (30) 21 (19) 22 (21) 22 (22) 16 (11) 16 (14) 21 (21) 15 (11) 10 (9) 26 (26)
a Table in the company’s clarification response HAS MTC: Data were obtained from a MTC that included CAMMS 223, CARE MS-I, and CARE MS-II CAMMS223 reported by HAS (Haute Autorité de Santé) (no references to this MTC, no details of it and no critique of it were provided by the company). ITT: Trial contributed ITT data to the specified analysis. ITT ABCR: Trial contributed ITT data for ABCR comparators to the specified analysis in lieu of subgroup data. SG: Trial contributed subgroup data to the specified analysis. Shaded cells indicate where pooled data were employed.
Copyright 2018 Queen's Printer and Controller of HMSO. All rights reserved.

Version 1 193
Appendix 6 ERG check of the company’s risk of bias assessments for comparator RCTs Introduction
It was not feasible within the timescale of this technology assessment for the ERG to check
the company’s risk of bias judgements for all the trials that they included in their SLR. The
ERG noted that for up to 31 of the 46 trials included in the company’s SLR, independent
ERG reports are available from previous NICE DMT technology appraisals which already
provide assessments of the risks of bias. We compared the risk of bias judgements in these
reports against the company’s judgements in CS Appendix Table 13 to provide an indication
of whether the company’s risk of bias judgements are likely to be generally appropriate.
Methods
One reviewer checked the risk of bias assessments that are provided in the ERG reports
available from previous NICE appraisals of DMTs. Where these were reported in a similar
format to that given in CS Appendix Table 13, the reviewer noted whether there was
agreement between the independent ERG and company judgements on risk of bias. In
cases where ERG reports provided judgements phrased as “high” or “low” risk of bias these
were translated into “yes” or “no” answers to match the questions in CS Appendix Table 13.
In cases where only a narrative statement was provided this was also translated into a “yes”
or “no” answer if this could be clearly discerned.
Results
Risk of bias assesments in ERG reports from previous NICE DMT appraisals were available
for up to 31 of the 46 trials included in the company’s SLR. The number of available
assessments varied with the risk of bias question, since not all ERGs answered the same
risk of bias questions as those given in CS Appendix Table 13. For each trial a single ERG
report was the source of the risk of bias data, since ERG reports generally focused only on
the pivotal trials for the specific DMT under assessment in each NICE appraisal.
Question 1: Was randomisation carried out appropriately? The independent ERG
judgements and company judgements for this question agreed for 30/31 trials (97%).
Question 2: Was the concealment of treatment allocation adequate? The independent
ERG judgements and company judgements for this question agreed for 21/31 trials (68%).
For 9 of the remaining 10 trials the company’s answer for this question was ‘unclear’
whereas the ERG judgements were ‘low’ (i.e. for these further 9/31 trials (29%) where the
Copyright 2018 Queen's Printer and Controller of HMSO. All rights reserved.

Version 1 194
company and ERG judgements differed, the company’s judgements were conservative
relative to those of the ERGs).
Question 3: Were the groups similar at the outset of the study in terms of prognostic
factors? There were only 11 trials where a comparison was available between ERG and
company judgements for this question, but in most (9/11) of these (82%) the judgements
were in agreement.
Question 4: Were the care providers, participants and outcome assessors blind to
treatment allocation? ERG and company answers to this question could not be compared
easily since the ERGs gave separate answers for each group specified in the question
whereas the company gave an overall answer for the three groups.
Question 5: Were there any unexpected imbalances in dropouts between groups? The
independent ERG judgements and company judgements for this question agreed for 14/30
trials (47%). For 5 of the remaining 10 trials the company’s answer for this question was
‘yes’ whereas the ERG judgements were ‘no’, and for 1 trial the company’s judgement was
‘unclear’ whereas the ERG judgement was ‘low’ (i.e. for these further 6/30 trials (20%) the
company’s judgements were conservative relative to those of the ERGs).
Question 6: Is there any evidence to suggest that the authors measured more
outcomes than they reported? The independent ERG judgements and company
judgements for this question agreed for 19/30 trials (63%). For 2 of the remaining 10 trials
the company’s answer for this question was ‘unclear’ whereas the ERG judgements were
‘no’, and for 1 trial the company’s judgement was ‘yes’ whereas the ERG judgement was ‘no’
(i.e. for these further 3/30 trials (10%) the company’s judgements were conservative relative
to those of the ERGs).
Question 7: Included an intention to treat analysis? If so, was this appropriate and
were appropriate methods used to account for missing data? There were only 11 trials
where a comparison was available between ERG and company judgements for this
question. In 4/11 trials (36%) the judgements were in agreement. For 2 of the remaining 7
trials the company’s answer for this question was ‘unclear’ whereas the ERG judgements
were ‘no’ (i.e. for these further 2/11 trials (18%) the company’s judgements were
conservative relative to those of the ERGs).
Copyright 2018 Queen's Printer and Controller of HMSO. All rights reserved.
Copyright © 2022 FDOKUMEN