Monocyte-derived IL12, CD86 (B7-2) and CD40L expression in relapsing and progressive multiple...
12
Monocyte-derived IL12, CD86 (B7-2) and CD40L expression in relapsing and progressive multiple sclerosis Lionel G. Filion, a, * Darius Matusevicius, b Gina M. Graziani-Bowering, a Ashok Kumar, a,b,c and Mark S. Freedman a,b a Department of Biochemistry, Microbiology, and Immunology, Faculty of Medicine, University of Ottawa, 451 Smyth Road, Ottawa, Ontario K1H 8M5, Canada b Department of Paediatrics, University of Ottawa, Ottawa, Ontario K1H 8M5, Canada c Department of Medicine, University of Ottawa, Ottawa, Ontario K1H 8M5, Canada Received 17 July 2002; accepted with revision 1 November 2002 Abstract Multiple sclerosis has been postulated to be an autoimmune disease in which Th1 immune responses predominate. This response is associated with an increased production of IFN and IL12 produced by T cells and by cells of the monocyte (MO) lineage, respectively. An increased expression of costimulatory molecules by T cells and antigen-presenting cells is also observed. We hypothesized that in relapsing–remitting MS (RRMS) (with or without of IFN treatment) and in secondary progressive patients (SPMS) IL12 and costimulatory molecules (CD80 [B7-1], CD86 [B7-2], CD28, CD40, CD40L) would be differentially produced or expressed by MO or T cells. We performed cross-sectional and longitudinal flow cytometric studies (at monthly intervals) on peripheral blood mononuclear cells (PBMC) or on MO from SPMS or untreated and IFN-treated patients with RRMS. We determined that CD86 and CD40L expression was highest on MO derived from SPMS patients compared to those from RRMS or from healthy controls (HC). In vitro culture of PBMC with recombinant human IL10, a cytokine that may be increased in response to treatment with IFN and that down-regulates CD86 expression, reduced the expression of CD86 on MO derived from RRMS patients to a much higher degree compared to cells derived from SPMS or HC. In vitro secreted IL12 levels from freshly isolated MO from SPMS patients were more than 10-fold higher than either the treated or the untreated RRMS or HC. RRMS patients treated with IFN demonstrated slightly lower levels of MO IL12 secretion. Our data suggest that a key mechanism in the pathogenesis of MS is the increased expression of CD86 and CD40L and the increased production of IL12 during disease progression. Part of the mechanism of action of IFN may be to reduce MO CD86 and CD40L expression and IL12 secretion; failure to do so might signify either a lack of response or a transition to a more progressive phase of illness. © 2003 Elsevier Science (USA). All rights reserved. Keywords: Monocytes; Costimulatory molecules; IL12 Introduction The etiopathogenesis of multiple sclerosis (MS) is still unknown, although there is supporting evidence that an autoimmune mechanism involving the interaction of T cells and macrophages (M) is involved in the disease process. As MS progresses from a more typical early relapsing–remitting (RR) phase to a later more clinically progressive (SP) course the brain lesions also evolve. The early lesions are a mixture of inflammatory cells consist- ing of M (macrophage/microglia) and lymphocytes but as the disease progresses the later lesions are composed mostly of M [1,2]. Thus, the mechanism of disease progression may differ depending on the stage of the disease. Autoimmunity theories usually propose important early interactions between autoreactive T cells and antigen-pre- * Corresponding author. Fax: 613-562-5452. E-mail address: [email protected] (L.G. Filion). R Available online at www.sciencedirect.com Clinical Immunology 106 (2003) 127–138 www.elsevier.com/locate/yclim 1521-6616/03/$ – see front matter © 2003 Elsevier Science (USA). All rights reserved. doi:10.1016/S1521-6616(02)00028-1
Transcript of Monocyte-derived IL12, CD86 (B7-2) and CD40L expression in relapsing and progressive multiple...
Monocyte-derived IL12, CD86 (B7-2) and CD40L expressionin relapsing and progressive multiple sclerosis
Lionel G. Filion,a,* Darius Matusevicius,b Gina M. Graziani-Bowering,a
Ashok Kumar,a,b,cand Mark S. Freedmana,b
a Department of Biochemistry, Microbiology, and Immunology, Faculty of Medicine, University of Ottawa,451 Smyth Road, Ottawa, Ontario K1H 8M5, Canada
b Department of Paediatrics, University of Ottawa, Ottawa, Ontario K1H 8M5, Canadac Department of Medicine, University of Ottawa, Ottawa, Ontario K1H 8M5, Canada
Received 17 July 2002; accepted with revision 1 November 2002
Abstract
Multiple sclerosis has been postulated to be an autoimmune disease in which Th1 immune responses predominate. This response isassociated with an increased production of IFN� and IL12 produced by T cells and by cells of the monocyte (MO) lineage, respectively.An increased expression of costimulatory molecules by T cells and antigen-presenting cells is also observed. We hypothesized that inrelapsing–remitting MS (RRMS) (with or without of IFN� treatment) and in secondary progressive patients (SPMS) IL12 and costimulatorymolecules (CD80 [B7-1], CD86 [B7-2], CD28, CD40, CD40L) would be differentially produced or expressed by MO or T cells. Weperformed cross-sectional and longitudinal flow cytometric studies (at monthly intervals) on peripheral blood mononuclear cells (PBMC)or on MO from SPMS or untreated and IFN�-treated patients with RRMS. We determined that CD86 and CD40L expression was higheston MO derived from SPMS patients compared to those from RRMS or from healthy controls (HC). In vitro culture of PBMC withrecombinant human IL10, a cytokine that may be increased in response to treatment with IFN� and that down-regulates CD86 expression,reduced the expression of CD86 on MO derived from RRMS patients to a much higher degree compared to cells derived from SPMS orHC. In vitro secreted IL12 levels from freshly isolated MO from SPMS patients were more than 10-fold higher than either the treated orthe untreated RRMS or HC. RRMS patients treated with IFN� demonstrated slightly lower levels of MO IL12 secretion. Our data suggestthat a key mechanism in the pathogenesis of MS is the increased expression of CD86 and CD40L and the increased production of IL12during disease progression. Part of the mechanism of action of IFN� may be to reduce MO CD86 and CD40L expression and IL12 secretion;failure to do so might signify either a lack of response or a transition to a more progressive phase of illness.© 2003 Elsevier Science (USA). All rights reserved.
Keywords: Monocytes; Costimulatory molecules; IL12
Introduction
The etiopathogenesis of multiple sclerosis (MS) is stillunknown, although there is supporting evidence that anautoimmune mechanism involving the interaction of Tcells and macrophages (M�) is involved in the diseaseprocess. As MS progresses from a more typical early
relapsing–remitting (RR) phase to a later more clinicallyprogressive (SP) course the brain lesions also evolve. Theearly lesions are a mixture of inflammatory cells consist-ing of M� (macrophage/microglia) and lymphocytes butas the disease progresses the later lesions are composedmostly of M� [1,2]. Thus, the mechanism of diseaseprogression may differ depending on the stage of thedisease.
Autoimmunity theories usually propose important earlyinteractions between autoreactive T cells and antigen-pre-
* Corresponding author. Fax:�613-562-5452.E-mail address: [email protected] (L.G. Filion).
R
Available online at www.sciencedirect.com
Clinical Immunology 106 (2003) 127–138 www.elsevier.com/locate/yclim
1521-6616/03/$ – see front matter © 2003 Elsevier Science (USA). All rights reserved.doi:10.1016/S1521-6616(02)00028-1

senting cells (APC) such as MO. These interactions requirethe presence of two important signals. The first signal isAg-specific and is mediated by the interaction of antigenassociated with MHC class I or II on the APC with the TCRon the T cell. The second signal involves as series ofinteraction between costimulatory molecules such as CD28and CD40L on the T cell with their respective ligandsCD80/CD86 and CD40 on the APC, respectively. The ex-pression of costimulatory molecules such as CD80 andCD86 in microglia cells, astrocytes, and vascular epitheliumwithin CNS plaques [3,4] suggests that costimulatory mol-ecules may play an indirect role in maintaining inflamma-tory cells such as M� within the MS brain lesion. Windha-gen et al. [5] and our laboratory have shown increasedexpression in the number of CD86 molecules expressed bymonocytes (MO) by MS patients.
The current theory based on mouse data suggest thatCD28 CD80 interactions between T cells and APC usuallystimulate T cells into becoming inflammatory cells thatcontribute to the cellular Th1 response, whereas signaling ofCD28 on the T cell and CD86 on the APC results in a moreregulatory type of T cell contributing to the Th2 humoralresponses [6–9]. However, this may not always be the casesince costimulation of T cells with CD86 transfected CHOand anti-CD3 Abs in the presence of APC can lead to anincrease of T cell IL12�2 receptor expression and the pro-motion of the Th1 response [10]. Furthermore, the Th1 andTh2 cytokines produced by APC and T cells (IFN� andIL10) can modulate the expression of CD86 on APC. IFN�(a Th1 cytokine) increased CD86 expression of CD86 onMO in SLE patients [11]. These seemingly contradictoryresults suggest that the regulation of CD80 and CD86 ex-pression by APC and the subsequent role of these costimu-latory molecules in promoting Th1/Th2 responses are stillunclear. It may, therefore, not be enough simply to observechanges in the number of cells expressing CD80 and/orCD86 and infer Th1/Th2 shifts, as has been previouslyreported [7].
MS may be mainly a Th1-driven disease and treatmentsable to deviate responses to mainly a Th2 profile may bebeneficial. The measurement of costimulatory moleculesmay not only provide valuable diagnostic and clinicallyrelevant tools, but also help define the role of these mole-cules in the disease process. A shift to a Th2 response is oneof the postulated mechanisms whereby IFN� improvessymptoms in early MS. We examined the expression levelsof costimulatory molecules on peripheral-blood-derivedMO and T cells, as well as cytokine secretion by these cells,to see whether there was some correlation with diseaseactivity or response to IFN� therapy. Data from our labo-ratory [12,13] and another laboratory [14] suggest that MOCD86 expression plays a pivotal role in the induction of Th1responses. In addition, IL12 has been shown to be elevatedin MS disease [15–18].
Treatments such as IFN� therapy aimed at reducing M�CD86 and CD40L signaling and IL12 production might alsoreduce disease activity [19–21]. Our goal was to determinewhether the expression and modulation of costimulatorymolecules on MO (CD40, CD40L, CD80, CD86) and Tcells (CD40L), together with levels of cytokines known toinfluence the balance of Th1/Th2 responses (such as IL12and IL10), correlate with the phase of MS or response toIFN� therapy.
Materials and methods
Patients
Blood samples were obtained with written consent frompatients attending the Multiple Sclerosis Clinic at the Ot-tawa Hospital (General Campus) and from healthy age- andsex-matched laboratory volunteers. The samples were usedfor both cross-sectional and longitudinal studies. Table 1summarizes donor information. Not all samples in the cross-sectional study were used in all experiments.
MS patients had clinically definite MS [22] and eachpatient’s Expanded Disability Status Scale score (EDSSscore) was determined at each visit [23]. Four RRMS pa-tients in the cross-sectional study were receiving Betaseronand two patients were receiving Rebif. The treatment dura-tion varied from 1 to 18 months (mean 5.3 months). In theprospective study, all patients were receiving Betaseron. Atthe time of sampling, nine patients were not being treatedwith any form of immunomodulatory therapy (RRMS ther-apy) including steroid therapy.
Cell isolation and culture
Peripheral blood mononuclear cells (PBMC) were iso-lated from heparinized whole blood by density-gradientcentrifugation using Ficoll–Hypaque (Pharmacia, UpsalaSweden). The layer of mononuclear cells was collectedand washed three times and resuspended in culture me-dium (RPMI 1640, 10% FCS, and penicillin–streptomicin[Life Technologies, Toronto, Ontario, Canada]). Thenumber of cells was enumerated and the cell density wasadjusted to 106 cells/ml. Cultures of 1 ml were estab-lished in polypropylene tubes. Polypropylene tubes wereused to minimize adherence. Untreated and recombinanthuman IL10 (rhIL10)-treated cultures (0.1 or 1 ng/ml)(Schering Plough Research Institute, Kenningworth, NJ,USA) were established. The cultures were incubated at37°C and 5% CO2 and harvested after 24 h. Cell surfacemarker enumeration and analysis were performed as out-lined below.
128 L.G. Filion et al. / Clinical Immunology 106 (2003) 127–138

MO were isolated as previously described using theOptiprep method [24]. The isolations yielded cell prepara-tions that were greater than 95% pure MO as determined byCD14, HLA-DR, and CD4 expression; these isolations con-tained fewer than 1% CD3� T cells. Cells were cultured inpolypropylene tubes at a density of 106 cells/ml for 24 h.The supernatants were harvested, stored at �80°C, andanalyzed for the spontaneous, constitutive production ofcytokines (IL1, IL6, IL10, TNF�, IL12) implicated in MSpathogenesis.
Sample preparation for flow cytometry analysis
Four-color flow cytometry analysis (FITC, PE, PE–TR,and PE–Cy5) included autofluorescence controls, colorcompensation controls, and combinations of antibodies toleukocytes (CD45), T cells (CD4, CD8, CD40L, CD152), Bcells (CD19, CD80, CD86, CD40L), and MO (CD4, CD14,CD40L, CD40, CD80, CD86). The antibodies were pur-chased from Sigma, Immunotech, Beckman Coulter, Cal-biochem, or Pharmagen (Toronto, Ontario, Canada). Isotypecontrols were included.
All blood samples and monocyte cultures were stainedas described previously [25]. Aggregated human IgG(100 �g/ml) was used to prevent the mouse monoclonalantibodies from binding to Fc receptors on the MO. Thedata of each sample were acquired on an EPICS XL FlowCytometer (Coulter Electronics). A total of 10,000 eventswere analyzed for whole blood PBMC experiments and5000 events were analyzed for cultured monocytes ex-periments. The data were saved as listmode files. Afterthe first sample (whole blood or cultured PBMC) was run
on the instrument, Flow Set Beads (Beckman Coulter)were used to standardize the fluorescence so that com-parison of fluorescent signals between samples could beperformed. When analyzing subsequent samples, FlowSet Beads were run prior to the analysis of the samplesand the fluorescence of each of the photomultiplier tubesso the mean fluorescent intensity (MFI) of the beads werewithin 0.1 of the MFI value from the first sample. Foranalysis of subsequent patient samples, only the colorcompensation values of the instrument were adjusted asrequired. Analysis and reanalysis of the listmode fileswas performed using the Epics, Expo 32 software, fromBeckman Coulter or FCS 2 Express Software from DeNovo Ltd. (San Diego, CA, USA).
The percentage and MFI of differentially gated lym-phocyte and MO populations were determined for eachsample. The mean and standard deviation of these num-bers were tabulated and graphed for each population. Thegated MO population was defined using two definitionsdepending on the Abs used. The first definition used wasthat of large granular CD14�CD86� cells, and the seconddefinition was that of large granular CD4�dim CD40L�
cells. We have previously shown that all blood mono-cytes are CD4�dim [26] and thus can be used to definemonocytes. The T cell population was defined as smaller,less granular CD4�CD28�, CD8�CD28�, CD4�CD40L�, orCD8�CD40L� cells. The percentage of cells is not reportedsince there were no significant differences observed be-tween the different treatments or groups. Data forCD14�CD86� cells are not reported since they are ill-defined cells, possibly dendritic cells or large B cells. MFIvalues were used for comparison of cell surface markers.
Table 1Patient description
Patient information, cross-sectional study
Number Female/maleratio
Age EDSS score
�3 �3
HC 24 16:8 Median: 32 NA NARange: 22–47
RRMS � therapy 23 13:10 Median: 38 n � 17 n � 6Range: 18–54 Mean � 2 Mean � 5.5
RRMS � therapya 23 15:8 Median: 40 n � 17 n � 6Range: 22–54 Mean � 1.9 Mean � 4
SPMS 29 18:11 Median: 50 n � 29Range: 27–59 Mean � 6
Prospective study
HC 9 5:4 Median: 32 NA NARange: 21–45
RRMS 7 4:3 Median: 42 n � 2 n � 5Range: 27–45 Mean � 1.8 Mean � 5.5
Note. Patients were seen in the Multiple Sclerosis Clinic at the Ottawa Hospital General Site. Informed written consent was obtained from each patient.Not all patients in the cross-sectional were used in each experiment.
a Patients on IFN� therapy at least for 3 months.
129L.G. Filion et al. / Clinical Immunology 106 (2003) 127–138

Flow cytometry histograms were superimposed and the ob-servation of a cell population shift in log fluorescence in-tensity with a change of greater than twofold on the MFI log
scale was regarded as significant. The percentage of cellswithin each population was also determined but no statisti-cally significant differences were observed.
Fig. 1. Basal CD86 expression on MO cultured for 24 h. (A) CD86 expression was analyzed on gated CD14� CD86� MO from HC (n � 24), RRMS �therapy (n � 23), RRMS � therapy (n � 23), and SPMS (n � 29) patients. The mean and standard deviation of the MFI values are shown. A multicomparisontest was performed and considered significant if P � 0.05 was achieved as reported in the table under the figure. (B) The lower figure is an overlay histogramfrom a representative patient in each patient and control category. A total of 5000 monocytes were analyzed and the MFI of the CD86 was calculated fromCD14�CD86� MO.
130 L.G. Filion et al. / Clinical Immunology 106 (2003) 127–138
Cytokine ELISA
ELISA kits for IL1�, IL6, IL10, IL12, and TNF� wereobtained from Bio-Source Int. (Camarillo, CA, USA) andthe assays were performed as instructed by the manufac-turer. The IL12 ELISA measured both the p40 and the p30subunits. The ELISA plates were read in a Spectra CountELISA plate reader (Canberra Packard, Meridien, CT,USA). The cytokine levels in each sample were extrapolated
from the standard curve generated from positive controlreagents provided with each kit.
Statistical analysis
Statistical analysis was performed using Graph Pad soft-ware, Stat Mate version 1. Data were analyzed using aone-way ANOVA (i.e., repeated measures of ANOVA sincewe had paired observations or one-way analysis of variance
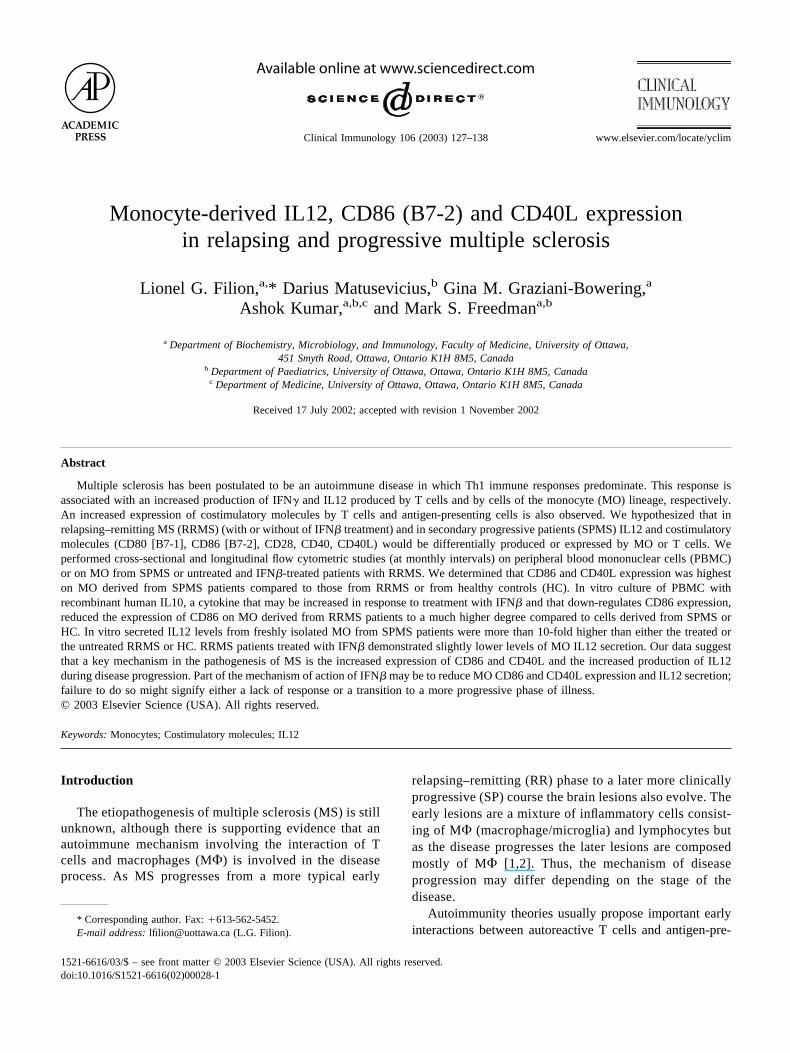
Fig. 2. CD86 expression by cultured MO treated with rhIL10. CD86 expression was analyzed on gated CD14� CD86� MO from HC (n � 24), RRMS � therapy(n � 23), RRMS � therapy (n � 23), and SPMS (n � 29) patients. The mean and standard deviation of the MFI values are shown. Data obtained from rhIL10-treatedcultures were compared to the data from the medium control cultures. A multicomparison test was performed as outlined in the legend to Fig. 1.
131L.G. Filion et al. / Clinical Immunology 106 (2003) 127–138

when the data were not paired). Posttests were performedusing Dunnett’s test for the repeated measures of ANOVAto compare the test results to control values. For the one-way ANOVA, Tukey’s test or the Newman–Keuls multiplecomparisons test for multiple comparisons was used.
Results
Effect of IFN� treatment on the expression of CD86 andits modulation with rhIL10
PBMC from healthy controls (HC) and from differentpatient groups (RRMS � therapy, RRMS � therapy pa-tients treated with IFN� for a minimum of 3 months, andSPMS patients) were cultured. CD86 expression was ele-vated in SPMS patients compared to all groups, whereasRRMS patients on therapy with IFN� had reduced levels ofCD86. Although no statistically significant differences werefound between SPMS and HC, SPMS CD86 expressionlevels were nearly twice that of RRMS � therapy or �therapy with IFN� (Fig. 1A and B). However, overlayhistograms of the flow cytometric data from representativepatients clearly show that there were obvious differences inCD86 expression observed in the patient data (Fig. 1B).Flow cytometric data were collected on log 10 scale anddifferences of as little as 0.5 times were clearly visible.There was no difference in the levels of expression of CD80between MO from MS patients and HC (data not shown)and CD80/CD86 expression on B cells.
IFN� treatment has been associated with increases inserum IL10 levels [27] and IL10 has been shown to down-regulate CD86 expression on monocytic cells [12]. To de-termine whether rhIL10 can down-regulated CD86 expres-sion in monocytic cultures, PBMC were cultured in thepresence or absence of rhIL10 (0.1 or 1.0 ng/ml) (Fig. 2).Our results showed that basal CD86 levels were lower onMO from RRMS �therapy patients treated with IFN� com-pared to untreated RRMS patients (Fig. 1). We wished toinvestigate whether CD86 could be further modulated by invitro stimulation with rhIL10 since this cytokine is reportedto be suppressive. Following 24-h in vitro culture withrhIL10 MO from all groups showed a trend toward a de-crease CD86 expression (Fig. 2). Similarly, CD40L expres-sion that can also be expressed on MO [28] was alsoreduced (data not shown). CD86 (Fig. 2) and CD40L (datanot shown) expression by MO from RRMS IFN� treatedpatients were the most sensitive to the in vitro rhIL10stimulation. CD40 expression was also assessed on MO andB cells but no significant differences were observed for anygroups.
Effect of IFN� treatment on the expression of CD28 andits modulation with rhIL10
Since the ligands for CD86 are CD28 and CTLA-4(CD152) [29–31], the levels of these molecules were alsoassessed on CD4� and CD8� T cells in PBMC cultures ofHC and the various patient groups. The basal levels ofCD28 expression by cultured CD4� T cells were signifi-cantly increased (Fig. 3) in RRMS �therapy and SPMSpatients compared to HC and of RRMS � therapy com-pared to RRMS � therapy. No such observation was made
Fig. 3. CD28 expression on CD4� or CD8� cultured lymphocytes. CD28expression of CD3�CD4� (A) or CD3�CD8� (B) gated lymphocytes wasanalyzed on HC (n � 24), RRMS � therapy (n � 23), RRMS � therapy(n � 23), and SPMS (n � 29) patients. The mean and standard deviationof the MFI values are shown. A multicomparison test was performed asoutlined in the legend to Fig. 1.
132 L.G. Filion et al. / Clinical Immunology 106 (2003) 127–138
for CD8� T cells. IFN� RRMS � therapy patients hadreduced levels of CD28 expression on CD4� T cells com-pared to untreated MS patients and HC (Fig. 3). In vitrotreatment of PBMC with rhIL10 did not alter CD28 expres-sion on CD4� and CD8� T cells from HC or MS patients’samples (data not shown). CD152 expression, the alternatereceptor for CD80 and CD86, was not observed on CD4� orCD8� T lymphocytes (data not shown).
IFN� therapy reduces the expression of costimulatorymolecules CD86 and CD40L on MO in vivo
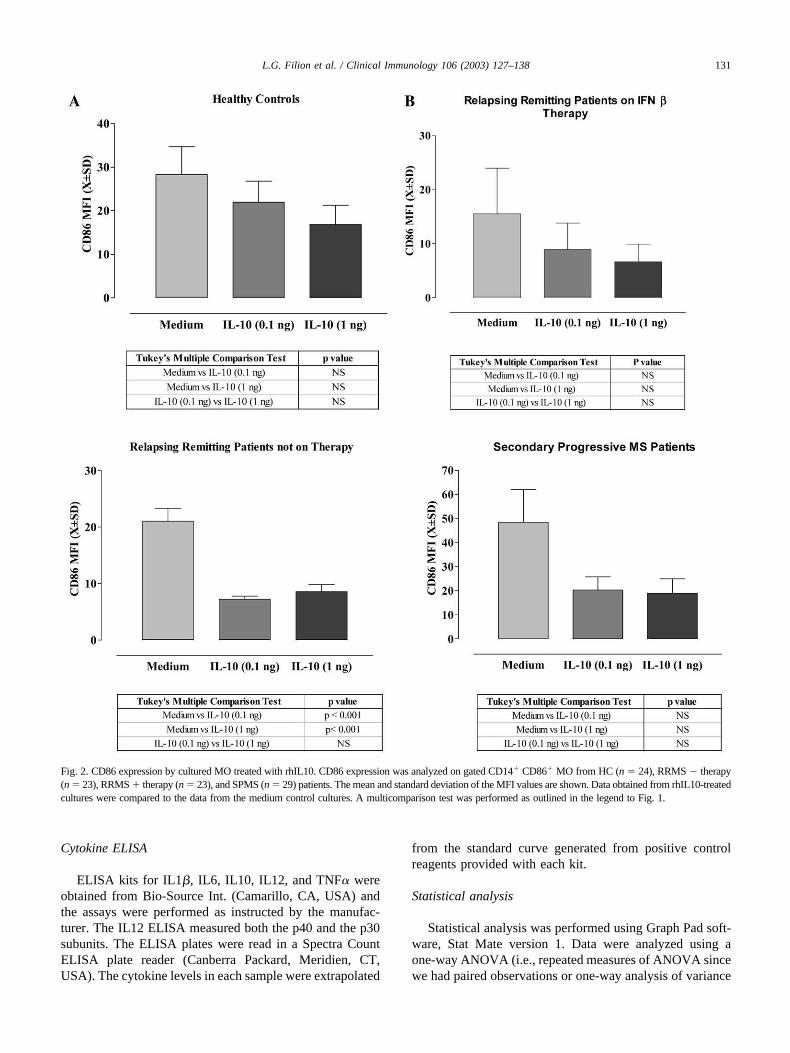
Given the results observed above in cross-sectional stud-ies of freshly derived MO, longitudinal studies were per-formed as patients began and continued IFN� (Rebif, Ares-Serono) therapy. A blood sample was taken prior to theonset of therapy, followed by sampling at monthly intervals.HC were also included at one time point. The MFI of CD86on CD14�CD86� MO from RRMS patients prior to IFN�therapy was significantly higher than for HC (Fig. 4A andB). IFN� therapy reduced the expression of CD86 by MO tothe levels expressed by HC (Fig. 4A and B) 2 months afterthe onset of therapy. Although CD40L expression by MO[28] from HC and MS patients prior to treatment was notsignificantly different, IFN� therapy reduced the levels ofCD40L on MO from MS patients further (Fig. 4A and B).
IFN� therapy reduces the expression of CD28 andCD40L on T cells in vivo
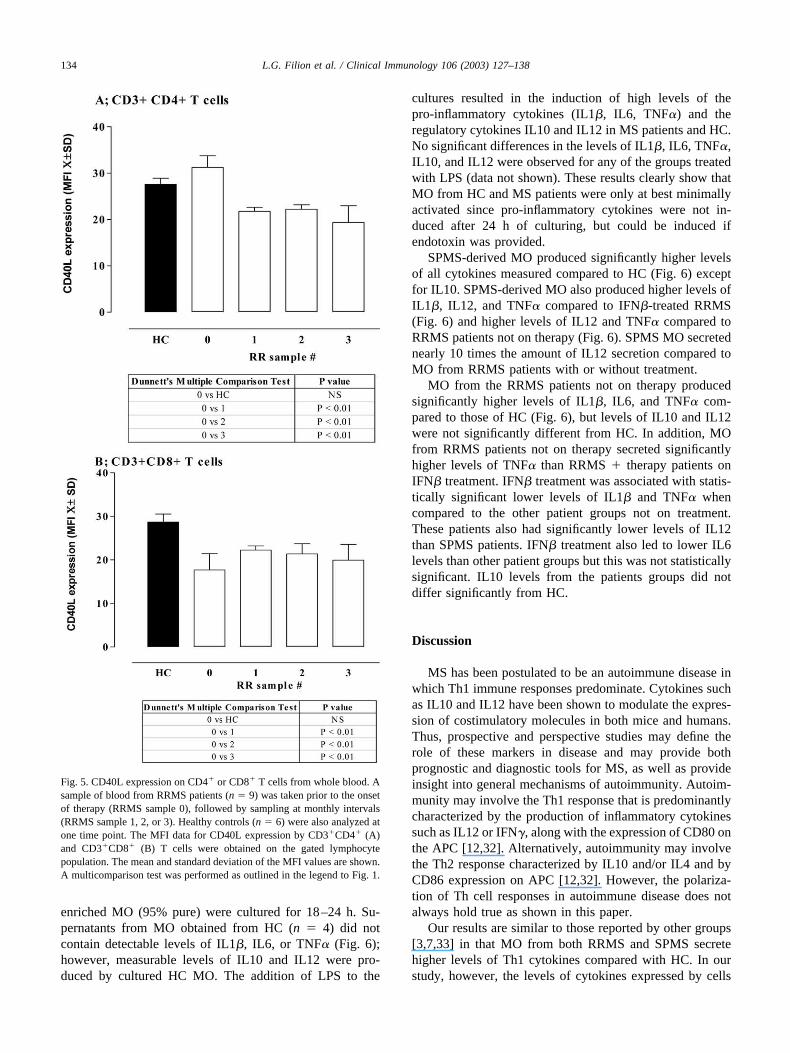
Analysis of the costimulatory molecules CD40L onCD4� and CD8� T cells from noncultured patient sampleswas also performed. No differences were observed for basallevels of CD40L and for the percentage of CD4� and CD8�
T cells between untreated RRMS patients and HC (Fig. 5).However, treatment with IFN� reduced the level of expres-sion of CD40L by CD4� T and CD8 T cells within 1 monthof therapy (Fig. 5A and B), as well as the MFI and percent-age (data not shown) of CD8�CD40L� cells. PretherapyCD28 expression by CD4� and CD8� T cells from RRMSpatients was no different than HC; however, therapy re-duced the expression of CD28. CD152, the alternate ligandfor CD80/CD86, was not observed in any of the samplestested.
Effect of IFN� therapy on the constitutive production ofcytokines by MO
IFN� therapy in MS patients may alter the constitutiveproduction of Th1 cytokines by MO. To test this hypothesis,
Fig. 4. CD86 and CD40L expression on CD14� MO from whole blood. Asample of blood from RRMS patients (n � 9) was taken prior to the onsetof IFN� therapy (RRMS sample 0), followed by sampling at monthlyintervals (RRMS sample 1, 2, or 3). Healthy controls (n � 6) were also
analyzed at one time point. The MFI data for CD86 (A) or CD40L (B)expression were obtained from the gated MO population (CD14�CD86�
or CD4�dim CD40L cells). The mean and standard deviation of the MFIvalues are shown. A multicomparison test was performed as outlined in thelegend to Fig. 1.
133L.G. Filion et al. / Clinical Immunology 106 (2003) 127–138
enriched MO (95% pure) were cultured for 18–24 h. Su-pernatants from MO obtained from HC (n � 4) did notcontain detectable levels of IL1�, IL6, or TNF� (Fig. 6);however, measurable levels of IL10 and IL12 were pro-duced by cultured HC MO. The addition of LPS to the
cultures resulted in the induction of high levels of thepro-inflammatory cytokines (IL1�, IL6, TNF�) and theregulatory cytokines IL10 and IL12 in MS patients and HC.No significant differences in the levels of IL1�, IL6, TNF�,IL10, and IL12 were observed for any of the groups treatedwith LPS (data not shown). These results clearly show thatMO from HC and MS patients were only at best minimallyactivated since pro-inflammatory cytokines were not in-duced after 24 h of culturing, but could be induced ifendotoxin was provided.
SPMS-derived MO produced significantly higher levelsof all cytokines measured compared to HC (Fig. 6) exceptfor IL10. SPMS-derived MO also produced higher levels ofIL1�, IL12, and TNF� compared to IFN�-treated RRMS(Fig. 6) and higher levels of IL12 and TNF� compared toRRMS patients not on therapy (Fig. 6). SPMS MO secretednearly 10 times the amount of IL12 secretion compared toMO from RRMS patients with or without treatment.
MO from the RRMS patients not on therapy producedsignificantly higher levels of IL1�, IL6, and TNF� com-pared to those of HC (Fig. 6), but levels of IL10 and IL12were not significantly different from HC. In addition, MOfrom RRMS patients not on therapy secreted significantlyhigher levels of TNF� than RRMS � therapy patients onIFN� treatment. IFN� treatment was associated with statis-tically significant lower levels of IL1� and TNF� whencompared to the other patient groups not on treatment.These patients also had significantly lower levels of IL12than SPMS patients. IFN� treatment also led to lower IL6levels than other patient groups but this was not statisticallysignificant. IL10 levels from the patients groups did notdiffer significantly from HC.
Discussion
MS has been postulated to be an autoimmune disease inwhich Th1 immune responses predominate. Cytokines suchas IL10 and IL12 have been shown to modulate the expres-sion of costimulatory molecules in both mice and humans.Thus, prospective and perspective studies may define therole of these markers in disease and may provide bothprognostic and diagnostic tools for MS, as well as provideinsight into general mechanisms of autoimmunity. Autoim-munity may involve the Th1 response that is predominantlycharacterized by the production of inflammatory cytokinessuch as IL12 or IFN�, along with the expression of CD80 onthe APC [12,32]. Alternatively, autoimmunity may involvethe Th2 response characterized by IL10 and/or IL4 and byCD86 expression on APC [12,32]. However, the polariza-tion of Th cell responses in autoimmune disease does notalways hold true as shown in this paper.
Our results are similar to those reported by other groups[3,7,33] in that MO from both RRMS and SPMS secretehigher levels of Th1 cytokines compared with HC. In ourstudy, however, the levels of cytokines expressed by cells
Fig. 5. CD40L expression on CD4� or CD8� T cells from whole blood. Asample of blood from RRMS patients (n � 9) was taken prior to the onsetof therapy (RRMS sample 0), followed by sampling at monthly intervals(RRMS sample 1, 2, or 3). Healthy controls (n � 6) were also analyzed atone time point. The MFI data for CD40L expression by CD3�CD4� (A)and CD3�CD8� (B) T cells were obtained on the gated lymphocytepopulation. The mean and standard deviation of the MFI values are shown.A multicomparison test was performed as outlined in the legend to Fig. 1.
134 L.G. Filion et al. / Clinical Immunology 106 (2003) 127–138
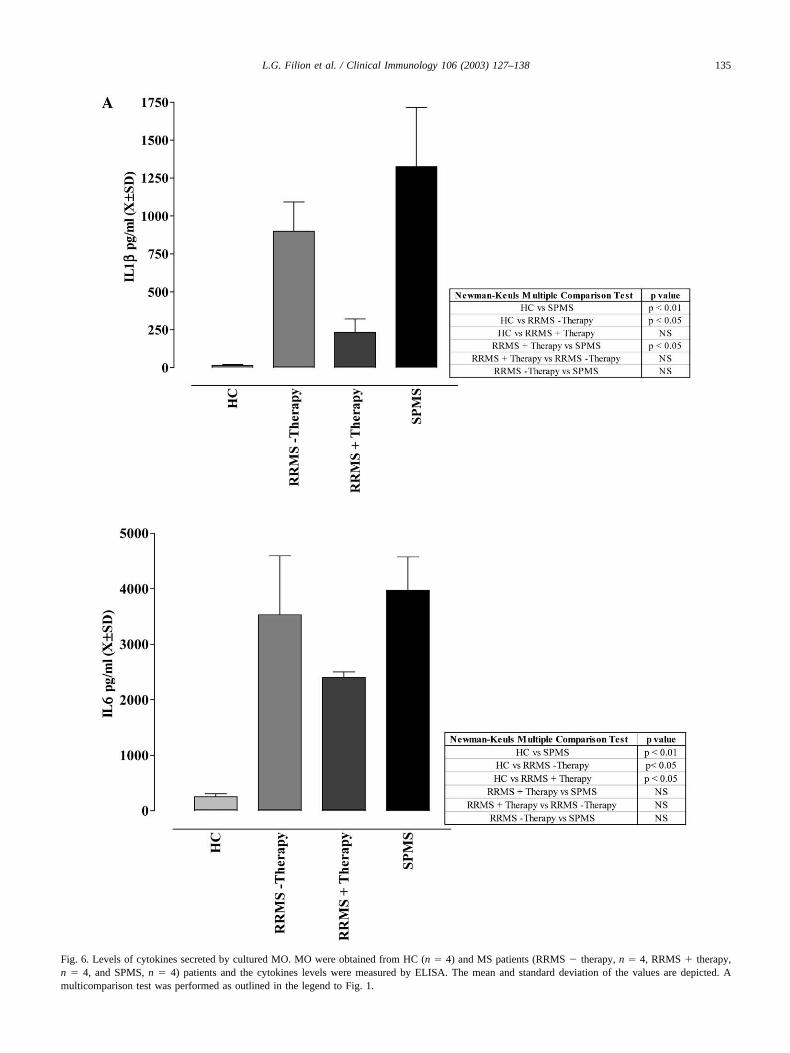
Fig. 6. Levels of cytokines secreted by cultured MO. MO were obtained from HC (n � 4) and MS patients (RRMS � therapy, n � 4, RRMS � therapy,n � 4, and SPMS, n � 4) patients and the cytokines levels were measured by ELISA. The mean and standard deviation of the values are depicted. Amulticomparison test was performed as outlined in the legend to Fig. 1.
135L.G. Filion et al. / Clinical Immunology 106 (2003) 127–138
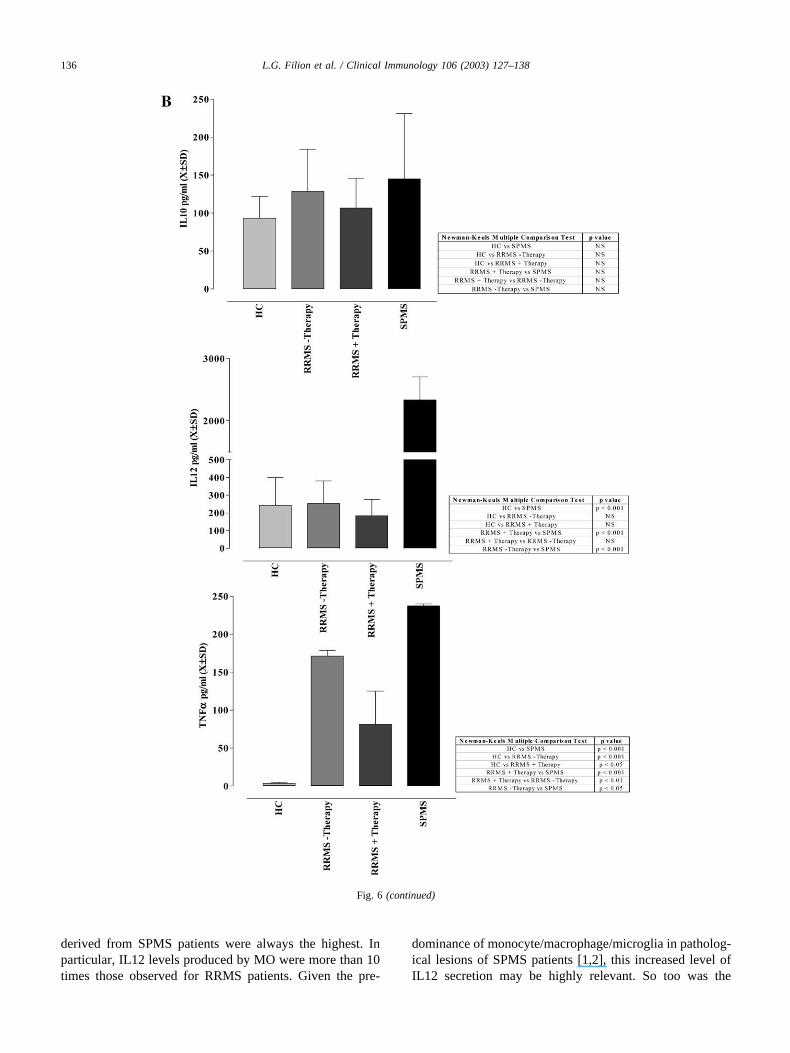
derived from SPMS patients were always the highest. Inparticular, IL12 levels produced by MO were more than 10times those observed for RRMS patients. Given the pre-
dominance of monocyte/macrophage/microglia in patholog-ical lesions of SPMS patients [1,2], this increased level ofIL12 secretion may be highly relevant. So too was the
Fig. 6 (continued)
136 L.G. Filion et al. / Clinical Immunology 106 (2003) 127–138

finding of nearly double the expression of CD86 by SPMSMO compared to RRMS or HC MO. Although this in-creased level of CD86 might be construed to be associatedwith a Th2 profile, this was not the case as we [12,13,34]and others [5,10,12,13,33,34] have similarly noted. Both ofthese observations regarding SPMS MO are novel and sug-gest that IL12 and CD86 may serve as possible immuno-logical markers of disease progression.
Increased amounts of IL1�, IL6 and TNF� were pro-duced by MO from �therapy or �therapy RRMS and fromSPMS patients. MO from SPMS patients also released sig-nificant quantities of IL12. IFN� therapy significantly re-duced the levels of IL1� and TNF� and there was a trendtoward a lowering of IL6 and IL12. IL12 levels in serum(data not shown) and culture supernatants were similar andelevated for the SPMS patient group. This increased pro-duction of IL12 is not induced by cell culture since super-natants from HC cultures contained only basal levels ofIL12 (data not shown). The levels of IL10 produced by MOfrom HC or from different patient categories did not differsignificantly [7,34,35]. These observations are consistentwith the notion of a predominant Th1 profile in SPMSpatients or RRMS patients not on therapy, i.e., high IL12levels and low IL10 levels.
Previous techniques used to examine basal levels ofcytokines produced by MO may have overestimated theselevels due to cell activation during isolation [24,25]. Wehave shown that in the procedure used in our experiments,HLA DR expression by MO was not elevated [24]. We havealso shown in this paper that the pro-inflammatory cyto-kines IL1, IL6, and TNF� were not induced after 24 h ofculture of MO from HC. Furthermore, the addition of LPSto MO cultures from HC and from all MS patient groupsinduced these pro-inflammatory cytokines within 24 h (datanot shown).
IFN� or rhIL10 on CD28 and CD40L expression on bothCD4� and CD8� T cells was also down-regulated andsuggest that these receptors are also susceptible to down-regulation, as CD86 is. The basal levels of expression ofCD28 and CD40L by T cells from patients undergoingIFN� therapy were significantly lower and the reducedlevels might indicate a further therapeutic benefit of thetreatment. The biological significance of increased CD28expression by T cells in RRMS �therapy and SPMS iscurrently being assessed. In preliminary experiments, theincreased CD28 expression seems to indicate a greater re-sponse to antibodies to CD3 and CD28 (data not shown).Further experimentation is required to unravel the complex-ity of this response.
Treatment of MS with IFN� has been purported to shiftthe balance toward a Th2 response that would correlate,therefore, with an increase in CD86 expression. We foundthe opposite to be true, however. While the percentage ofCD14� CD86� MO was not increased or decreased (datanot shown), CD86 expression on a per MO basis was lowerin RRMS compared to HC; however, it was significantly
elevated in SPMS (Figs. 1 and 4). We observed that IFN�therapy further reduced the expression of both CD86 andCD40L on MO (Fig. 4). The addition of IFN� to cells invitro from patients did not further down-regulate MO CD86expression (data not shown), although rhIL10 did. Rudick etal. [27] have shown that IFN� can induce intracellular IL10production. We have made similar observations (data notshown). However, secreted levels of IL10 in supernatantsfrom MO cultures (Fig. 6) or mRNA (data not shown) fromMO cultures were no different between HC and each patientcategory. These results suggest that while intracellular IL10production has a marginal effect on CD86 expression, ex-ogenous rhIL10 down-regulates CD86 expression in allpatient groups (Fig. 2). Lim et al. [36] have shown that LPSinduces the production and secretion of IL10 and this in turndown-regulates the expression of CD86 in a human mono-cytic cell line. Furthermore, the addition of anti-IL10 anti-body reversed the effects of IL10 and increased the expres-sion of CD86, suggesting an interaction between IL10 andCD86.
In MS patients, IL12 (a Th1 regulatory cytokine) andCD86 levels are both elevated and IFN� treatment reducesboth. Igarassi et al. [10] have shown that costimulation byCD86 transfected CHO cells and anti-CD3 antibodies in-duces the expression of the high-affinity receptor for IL12(IL12R�2) on T cells. These lines of evidence suggest atight linkage between CD86 signaling and IL12 production.Despite claims in the literature that high levels of CD86 areassociated with the Th2 response, our data suggest theopposite. In our study of MS, a Th1-mediated disease char-acterized by a cellular pathogenic response involving T cellsand MO and IL12 is observed. CD86 levels are elevated onMO, and IFN� treatment that down-regulated CD86 M�expression and IL12 levels improves symptoms. In light ofour data, the dogma that Th1 responses are regulated byCD80 while Th2 responses are regulated by CD86 may notbe correct, at least in humans. Whether IL10 and IL12 act atthe level of CD86 transcription, translation or transport tothe cell surface remains to be determined.
Acknowledgments
The authors acknowledge the Multiple Sclerosis Societyof Canada for a grant supporting this work.
References
[1] H. Lassmann, G. Suchanek, K. Ozawa, Histopathology and theblood–cerebrospinal fluid barrier in multiple sclerosis, Ann. Neurol.36 (Suppl.) (1994) S42–S46.
[2] K. Ozawa, G. Suchanek, H. Breitschopf, W. Bruck, H. Budka, K.Jellinger, H. Lassmann, Patterns of oligodendroglia pathology inmultiple sclerosis, Brain 117 (1994) 1311–1322.
[3] A. Windhagen, G. Newcombe, H. Dangond, C. Strand, M.N.Woodroofe, M.L. Cuzner, D.A. Hafler, Expression of costimulatory
137L.G. Filion et al. / Clinical Immunology 106 (2003) 127–138
molecules B7-1 (CD80), B7-2 (CD86), and interleukin 12 cytokine inmultiple sclerosis lesions, J. Exp. Med. 182 (1995) 1985–1996.
[4] S.R. De, A. Giampaolo, B. Giometto, P. Gallo, G. Levi, C. Peschle,F. Aloisi, The costimulatory molecule B7 is expressed on humanmicroglia in culture and in multiple sclerosis acute lesions, J. Neu-ropathol. Exp. Neurol. 54 (1995) 175–187.
[5] A. Windhagen, S. Maniak, A. Gebert, I. Ferger, F. Heidenreich,Costimulatory molecules B7-1 and B7-2 on CSF cells in multiplesclerosis and optic neuritis, J. Neuroimmunol. 96 (1999) 112–120.
[6] V.K. Kuchroo, M.P. Das, J.A. Brown, A.M. Ranger, S.S. Zamvil,R.A. Sobel, H.L. Weiner, N. Nabavi, L.H. Glimcher, B7-1 and B7-2costimulatory molecules activate differentially the Th1/Th2 develop-mental pathways: application to autoimmune disease therapy, Cell 80(1995) 707–718.
[7] A.T. Reder, K. Genc, P.V. Byskosh, A.M. Porrini, Monocyte activa-tion in multiple sclerosis, Mult. Scler. 4 (1998) 162–168.
[8] S. Romagnani, Biology of human TH1 and TH2 cells [Review] [77refs], J. Clin. Immunol. 15 (1995) 121–129.
[9] R.A. Seder, W.F. Paul, Acquisition of lymphokine-producing pheno-type by CD4� T cells. [Review] [107 refs], Annu. Rev. Immunol. 12(1994) 635–673.
[10] O. Igarashi, H. Yamane, S. Imajoh-Ohmi, H. Nariuchi, IL-12 receptor(IL-12R) expression and accumulation of IL-12R beta 1 and IL-12Rbeta 2 mRNAs in CD4� T cells by costimulation with B7-2 mole-cules, J. Immunol. 160 (1998) 1638–1646.
[11] M.F. Liu, J.S. Li, T.H. Weng, H.Y. Lei, Differential expression andmodulation of costimulatory molecules CD80 and CD86 on mono-cytes from patients with systemic lupus erythematosus, Scand. J. Im-munol. 49 (1999) 82–87.
[12] W.D. Creery, F. Diaz-Mitoma, L. Filion, A. Kumar, Differentialmodulation of B7-1 and B7-2 isoform expression on human mono-cytes by cytokines which influence the development of T helper cellphenotype, Eur. J. Immunol. 26 (1996) 1273–1277.
[13] A. Kumar, J.B. Angel, S. Aucoin, W.D. Creery, M.P. Daftarian, D.W.Cameron, L. Filion, F. Diaz-Mitoma, Dysregulation of B7.2 (CD86)expression on monocytes of HIV-infected individuals is associatedwith altered production of IL-2, Clin. Exp. Immunol. 117 (1999)84–91.
[14] O. Igarashi, T. Yanagida, M. Azuma, K. Okumura, H. Nariuchi, B7-1synergizes with interleukin-12 in interleukin-2 receptor alpha expres-sion by mouse T helper 1 clones, Eur. J. Immunol. 26 (1996) 300–306.
[15] K.E. Balashov, D.R. Smith, S.J. Khoury, D.A. Hafler, H.L. Weiner,Increased interleukin 12 production in progressive multiple sclerosis:induction by activated CD4� T cells via CD40 ligand, Proc. Natl.Acad. Sci. USA 94 (1997) 599–603.
[16] M. Comabella, K. Balashov, S. Issazadeh, D. Smith, H.L. Weiner,S.J. Khoury, Elevated interleukin-12 in progressive multiple sclerosiscorrelates with disease activity and is normalized by pulse cyclophos-phamide therapy, J. Clin. Invest. 102 (1998) 671–678.
[17] F. Nicoletti, F. Patti, C. Cocuzza, P. Zaccone, A. Nicoletti, R. DiMarco, A. Reggio, Elevated serum levels of interleukin-12 in chronicprogressive multiple sclerosis, J. Neuroimmunol. 70 (1996) 87–90.
[18] A. Windhagen, D.E. Anderson, A. Carrizosa, K. Balashov, H.L.Weiner, D.A. Hafler, Cytokine secretion of myelin basic proteinreactive T cells in patients with multiple sclerosis, J. Neuroimmunol.91 (1998) 1–9.
[19] S. Gardella, C. Andrei, S. Costigliolo, A. Poggi, M.R. Zocchi, A.Rubartelli, Interleukin-18 synthesis and secretion by dendritic cellsare modulated by interaction with antigen-specific T cells, J. Leuko-cyte Biol. 66 (1999) 237–241.
[20] A. Gayo, L. Mozo, A. Suarez, A. Tunon, C. Lahoz, C. Gutierrez,Interferon beta-1b treatment modulates TNFalpha and IFNgamma
spontaneous gene expression in MS. [see comments], Neurology 52(1999) 1764–1770.
[21] S.A. Brod, L.D. Nelson, M. Khan, J.S. Wolinsky, Increased in vitroinduced CD4� and CD8� T cell IFN-gamma and CD4� T cellIL-10 production in stable relapsing multiple sclerosis. [Review] [78refs], Int. J. Neurosci. 90 (1997) 187–202.
[22] C.M. Poser, D. Paty, L. Scheinberg, L.W. McDonald, F.A. Davis,G.C. Ebers, K.P. Johnson, W.A. Sibley, D.H. Silberberg, W.W.Tourtellotte, New diagnostics criteria for multiple sclerosis. Guide-lines for research protocol, in: C.M. Poser (Ed.), Diagnosis of Mul-tiple Sclerosis, Thieme–Stratton, New York, 1983, pp. 225–259.
[23] J.F. Kurtzke, Rating neurologic impairment in multiple sclerosis: anexpanded disability status scale (EDSS), Neurology 3 (1983) 1444–1452.
[24] G.M. Graziani-Bowering, J.M. Graham, L.G. Filion, A quick, easyand inexpensive method for the isolation of human peripheral bloodmonocytes, J. Immunol. Methods 207 (1997) 157–168.
[25] G.M. Graziani-Bowering, L.G. Filion, Down regulation of CD4 ex-pression following isolation and culture of human monocytes, Clin.Diagn. Lab. Immunol. 7 (2000) 182–191.
[26] L.G. Filion, C.A. Izaguirre, G.E. Garber, L. Huebsh, M.T. Aye,Detection of surface and cytoplasmic CD4 on blood monocytes fromnormal and HIV-1 infected individuals, J. Immunol. Methods 135(1990) 59–69.
[27] R.A. Rudick, R.M. Ransohoff, R. Peppler, M.S. VanderBrug, P.Lehmann, J. Alam, Interferon beta induces interleukin-10 expression:relevance to multiple sclerosis, Ann. Neurol. 40 (1996) 618–627.
[28] L.M. Pinchuk, S.J. Klaus, D.M. Magaletti, G.V. Pinchuk, J.P. Norsen,E.A. Clark, Functional CD40 ligand expressed by human blood den-dritic cells is up-regulated by CD40 ligation, J. Immunol. 157 (1996)4363–4370.
[29] J.F. Brunet, F. Denizot, M.F. Luciani, M. Roux-Dosseto, M. Suzan,M.G. Mattei, P. Golstein, A new member of the immunoglobulinsuperfamily—CTLA-4, Nature 328 (1987) 267–270.
[30] J.G. Gribben, G.J. Freeman, V.A. Boussiotis, C.L. Rennert, C.L.Jellis, E. Greenfield, M. Barber, V.A.J. Restivo, X. Ke, G.S. Gray,CTLA4 mediates antigen-specific apoptosis of human T cells, Proc.Natl. Acad. Sci. USA 92 (1995) 811–815.
[31] C.H. June, J.A. Bluestone, L.M. Nadler, C.B. Thompson, The B7 andCD28 receptor families. [Review] [93 refs], Immunol. Today 15(1994) 321–331.
[32] A. Clavreul, C.L. D’hellencourt, C. Montero-Menei, G. Potron, D.Couez, Vitamin Ddifferentially regulates B7.1 and B7.2 expressionon human peripheral blood monocytes, Immunology 95 (1998) 272–277.
[33] M. Kouwenhoven, N. Teleshova, V. Ozenci, R. Press, H. Link,Monocytes in multiple sclerosis: phenotype and cytokine profile,J. Neuroimmunol. 112 (2001) 197–205.
[34] A Kumar, J.B. Angel, M.P. Daftarian, K. Parato, W.D. Cameron, L.Filion, F. Diaz-Mitoma, Differential production of IL-10 by T cellsand monocytes of HIV-infected individuals: association of IL-10production with CD28-mediated immune responsiveness, Clin. Exp.Immunol. 114 (1998) 78–86.
[35] A.M. Porrini, L.G. De, D. Gambi, A.T. Reder, Effects of an anti-IL-10 monoclonal antibody on rIFNbeta-1b-mediated immune mod-ulation. Relevance to multiple sclerosis, J. Neuroimmunol. 81 (1998)109–115.
[36] W. Lim, W. Ma, K. Gee, S. Aucoin, D. Nandan, F. Diaz-Mitoma, M.Kozlowski, A. Kumar, Distinct role of p38 and c-Jun N-terminalkinases in IL-10-dependent and IL-10-independent regulation of thecostimulatory molecule B7.2 in lipopolysaccharide-stimulated humanmonocytic cells, J. Immunol. 168 (2002) 1759–1769.
138 L.G. Filion et al. / Clinical Immunology 106 (2003) 127–138


![NK Cells Mediate Increase of Phagocytic Activity but Not of Proinflammatory Cytokine (Interleukin6 [IL6], Tumor Necrosis Factor Alpha, and IL12) Production Elicited in Splenic Macrophages](https://static.fdokumen.com/doc/165x107/632147240c12e1161503b7d3/nk-cells-mediate-increase-of-phagocytic-activity-but-not-of-proinflammatory-cytokine.jpg)

