Descriptive and multivariable analysis of the physico-chemical and biological parameters of Sfax...
10
Desalination 246 (2009) 496–505 Descriptive and multivariable analysis of the physico-chemical and biological parameters of Sfax wastewater treatment plant Amira Ouali a, *, Chafai Azri b , Khaled Medhioub b , Ahmed Ghrabi a a CERTE, Laboratoire Traitement et Recyclage des Eaux Usées, BP 273, 8020 Soliman, Tunisia Email: [email protected] b ISEPIS, Unité de Recherche Etude et Gestion des environnements Côtiers et Urbains, 3018 Sfax, Tunisia Received 10 September 2007; revised 19 April 2008; accepted 26 April 2008 Abstract A set of quantitative descriptive and analytical data from the wastewater treatment plant (WWTP) of Sfax, located on the south-east of Tunisia, has been processed by multivariate statistical techniques in order to investigate the evolution of the wastewater quality over a period of 12 years (1984–1996) for six physico-chemical and bio- logical parameters. The experimental 6×12 matrix was analysed by principal component analysis (PCA). The exploration of the correlation matrix allowed to uncover strong associations between some variables (BOD i COD i , SS i BDO o , COD o SS o ) as well as a lack of association between the others (T water and SS o ). PCA showed the existence of up to three significant PCs which account for 74% of the variance. The first one assigned to water with relatively low organic load, whereas the second and the third assigned to water with an average and high organic and mineral loads. This study presents necessity and usefulness of multivariate statistical techniques for evaluation and inter- pretation of large complex data sets with view to get better information about the water quality and design of mon- itoring network for effective management of water resources. Keywords: Aerated lagoon; Multivariable analysis; Organic load; PCA; Wastewater treatment plant 1. Introduction Wastewater is becoming increasingly impor- tant in integrated water resources management because of the scarcity of water resources and the need of environmental protection [1]. Waste- water use in agriculture is widespread throughout the world. In arid and semi-arid areas, there is a growing need to reuse wastewater not only to reduce waste discharges to surface waters but also to improve potential water resource [2]. In many zones, as a result of the anthropogenic influences urban, industrial and agricultural activities wastewater are discharged in natural areas [3,4] or reused in agriculture without any treatment and cause many human and animal *Corresponding author. Presented at the: MEDA WATER International Conference on Sustainable Water Management, Tunis, March 21–24 2007. 0011-9164/09/$– See front matter © 2009 Elsevier B.V. All rights reserved. doi:10.1016/j.desal. 00 .0 .0 2 8 4 58
-
Upload
utctunisie -
Category
Documents
-
view
0 -
download
0
Transcript of Descriptive and multivariable analysis of the physico-chemical and biological parameters of Sfax...

Desalination 246 (2009) 496–505
Descriptive and multivariable analysis of the physico-chemical
and biological parameters of Sfax wastewater treatment plant
Amira Oualia,*, Chafai Azrib, Khaled Medhioubb, Ahmed Ghrabia
aCERTE, Laboratoire Traitement et Recyclage des Eaux Usées, BP 273, 8020 Soliman, TunisiaEmail: [email protected]
bISEPIS, Unité de Recherche Etude et Gestion des environnements Côtiers et Urbains, 3018 Sfax, Tunisia
Received 10 September 2007; revised 19 April 2008; accepted 26 April 2008
Abstract
A set of quantitative descriptive and analytical data from the wastewater treatment plant (WWTP) of Sfax,
located on the south-east of Tunisia, has been processed by multivariate statistical techniques in order to investigate
the evolution of the wastewater quality over a period of 12 years (1984–1996) for six physico-chemical and bio-
logical parameters. The experimental 6×12 matrix was analysed by principal component analysis (PCA). The
exploration of the correlation matrix allowed to uncover strong associations between some variables (BODi COD
i,
SSiBDO
o, COD
oSS
o) as well as a lack of association between the others (T
waterand SS
o). PCA showed the existence
of up to three significant PCs which account for 74% of the variance. The first one assigned to water with relatively
low organic load, whereas the second and the third assigned to water with an average and high organic and mineral
loads. This study presents necessity and usefulness of multivariate statistical techniques for evaluation and inter-
pretation of large complex data sets with view to get better information about the water quality and design of mon-
itoring network for effective management of water resources.
Keywords: Aerated lagoon; Multivariable analysis; Organic load; PCA; Wastewater treatment plant
1. Introduction
Wastewater is becoming increasingly impor-
tant in integrated water resources management
because of the scarcity of water resources and the
need of environmental protection [1]. Waste-
water use in agriculture is widespread throughout
the world. In arid and semi-arid areas, there is a
growing need to reuse wastewater not only to
reduce waste discharges to surface waters but
also to improve potential water resource [2]. In
many zones, as a result of the anthropogenic
influences urban, industrial and agricultural
activities wastewater are discharged in natural
areas [3,4] or reused in agriculture without any
treatment and cause many human and animal*Corresponding author.
Presented at the: MEDA WATER International Conference on Sustainable Water Management, Tunis, March 21–24 2007.
0011-9164/09/$– See front matter © 2009 Elsevier B.V. All rights reserved.
doi:10.1016/j.desal. 00 .0 .02 8 4 58

sanitary risks [5,6]. Treatment of this potential
resource becomes imperative before use.
Treatment of wastewater in ponds is probably
the most ancient means of waste treatment known
to humans. Oxidation ponds are also called stabi-
lization ponds or lagoons and they serve mostly
small rural areas where land is available at low
cost. They are used also for secondary treatment
of wastewater or as polishing ponds.
The present paper examines the case of an
aerated wastewater lagoon. An aerated waste-
water lagoon, or any subsection of the overall
lagoon, should function as (a) an oxidation reac-
tor for soluble BOD, (b) a clarifier for volatile
solids, and (c) a benthal aerobic/anaerobic
digester for settled particulates. The distribution
of these functions can vary within a lagoon due
to seasonal temperature variations, aeration, and
light intensity [7].
In view of the temporal variations of physico-
chemical and biological parameters regular mon-
itoring programs are required for reliable
estimates of the water quality. In wastewater
treatment process performance and operation are
measured continuously. This results in a complex
data matrix comprised of a large number of
physico-chemical parameters [7], which are
often difficult to interpret drawing meaningful
conclusions [8] and demanding a structured
approach to monitoring and analysis of the
process. Multivariate analysis provides a
methodology to extract and structure information
from large amounts of data. The multivariate
treatment of environmental data is useful for evi-
dencing temporal and spatial variations caused
by natural and anthropogenic factors linked to
seasonality [8–17]. It has been used to monitor
industrial processes for several decades [18]. It
has also been applied to wastewater treatment
operation [19–21]. These statistical techniques
and exploratory data analysis are the appropriate
tools for a meaningful data reduction and inter-
pretation of multi-consistent physical and chem-
ical measurements [22].
The multivariate statistical techniques such as
principal component analysis (PCA) have widely
been used as unbiased methods in analysis of
water-quality data for drawing meaningful infor-
mation [16,17,23–30]. PCA is a fundamental and
one of the most popular multivariate statistics
based on monitoring methods [31].
2. Materials and methods
2.1. Description of Sfax wastewater treatmentplant facilities
The WWTP of Sfax is an aerated lagoon
(Fig. 1). It has been functional since 18 January
1983. It is conceived to purify the urban waste-
water with a daily average flow rate of 24,000
m3/d and a maximum daily flow rate of 32,000
m3/d with a hydraulic retention time of 5.2 days.
The wastewater treatment process is made up of
a primary treatment and a secondary or biological
treatment.
In primary treatment, wastewater enters the
plant and is screened for large objects. Next grit,
such as sand and gravel, is removed in a grit
removal system.
In secondary treatment, biodegradable organics
and nutrients are removed from the sewage by bio-
logical treatment. Sewage from primary treatment
is passed to the aerated lagoon for biological treat-
ment. Air is supplied continuously into the lagoon
equipped with 14 aerators for the growth and
reproduction of micro-organisms which assimilate
and decompose the organic matter in the sewage.
Finally, the effluent from lagoon is settled in two
clarifier tanks. The sludge is collected and treated
by thickening and drying beds. The layout of Sfax
WWTP is represented by Fig. 1.
2.2. Monitored parameters and analyticalmethods
Under the water-quality monitoring program
of the WWTP of Sfax, samples were collected
A. Ouali et al. / Desalination 246 (2009) 496–505 497

each month during the 12 years period (1984–
1996). COD and SS sampling were restricted to
the period from 1991 to 1996.
Water temperature was measured on the site
using mercury thermometer. The biochemical
oxygen demand (BOD) was measured following
the respirometric method with OxiTop-nanome-
ters (AFNOR No. T90103). The chemical oxy-
gen demand (COD) was measured by chemical
oxidization method (AFNOR No. T90101) and
the suspended solids (SS) were determined by
filtration and drying at 110°C (AFNOR No.
T90105).
2.3. Data treatment and multivariate statisticalmethods
Multivariate analysis of the WWTP of Sfax
was performed through PCA [30,31]. PCA can be
described as a method to project high dimen-
sional measurement space with significantly
fewer dimensions. A set of quantitative analytical
data from the WWTP, has been processed by
multivariate statistical techniques in order to
investigate the evolution of the water quality dur-
ing 6 years. The original matrix consisted of six
physico-chemical variables determined monthly
over a period of 6 years. The experimental matrix
(6 × 12) was analysed by PCA.
3. Results and discussion
3.1. Descriptive analysis
3.1.1. The flow rate of water
The average flow rate of wastewater was
increasing during the period from 1984 to 1996
(Table 1). It fluctuates between 4.60 × 10⁵ and
7.57 × 10⁵ m3. During the selected period, the
flow rate variation appears very important and
depends on the water consumption by the sfaxian
A. Ouali et al. / Desalination 246 (2009) 496–505
Fig. 1. Schematic representation of Sfax wastewater treatment.
498
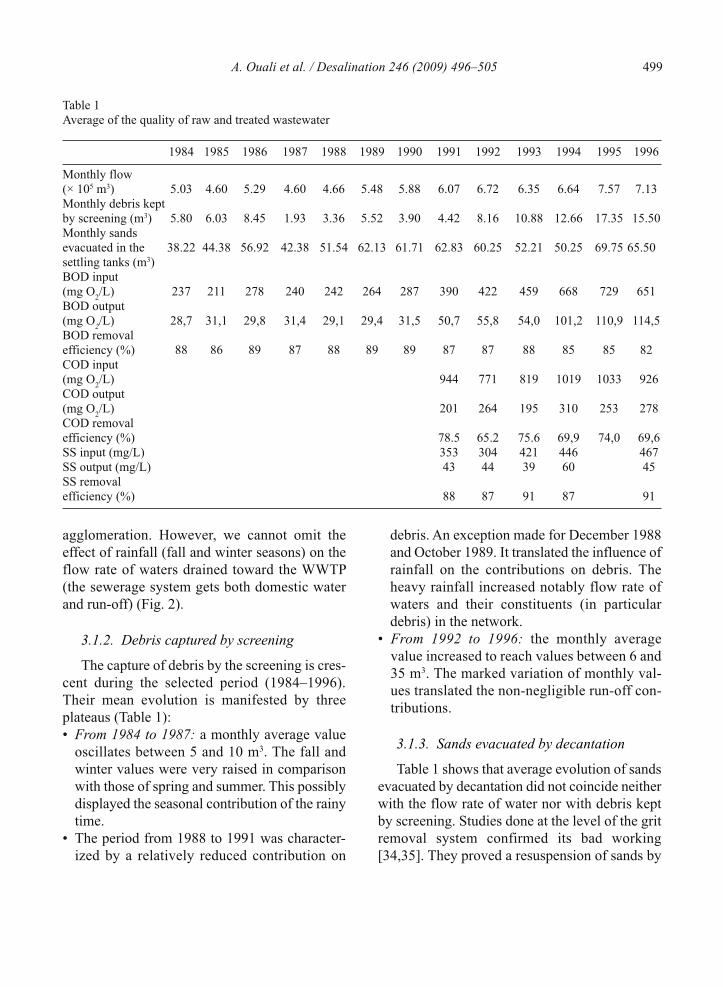
agglomeration. However, we cannot omit the
effect of rainfall (fall and winter seasons) on the
flow rate of waters drained toward the WWTP
(the sewerage system gets both domestic water
and run-off) (Fig. 2).
3.1.2. Debris captured by screening
The capture of debris by the screening is cres-
cent during the selected period (1984–1996).
Their mean evolution is manifested by three
plateaus (Table 1):
• From 1984 to 1987: a monthly average value
oscillates between 5 and 10 m3. The fall and
winter values were very raised in comparison
with those of spring and summer. This possibly
displayed the seasonal contribution of the rainy
time.
• The period from 1988 to 1991 was character-
ized by a relatively reduced contribution on
debris. An exception made for December 1988
and October 1989. It translated the influence of
rainfall on the contributions on debris. The
heavy rainfall increased notably flow rate of
waters and their constituents (in particular
debris) in the network.
• From 1992 to 1996: the monthly average
value increased to reach values between 6 and
35 m3. The marked variation of monthly val-
ues translated the non-negligible run-off con-
tributions.
3.1.3. Sands evacuated by decantation
Table 1 shows that average evolution of sands
evacuated by decantation did not coincide neither
with the flow rate of water nor with debris kept
by screening. Studies done at the level of the grit
removal system confirmed its bad working
[34,35]. They proved a resuspension of sands by
A. Ouali et al. / Desalination 246 (2009) 496–505
Table 1
Average of the quality of raw and treated wastewater
1984 1985 1986 1987 1988 1989 1990 1991 1992 1993 1994 1995 1996
Monthly flow
(× 105 m3) 5.03 4.60 5.29 4.60 4.66 5.48 5.88 6.07 6.72 6.35 6.64 7.57 7.13
Monthly debris kept
by screening (m3) 5.80 6.03 8.45 1.93 3.36 5.52 3.90 4.42 8.16 10.88 12.66 17.35 15.50
Monthly sands
evacuated in the 38.22 44.38 56.92 42.38 51.54 62.13 61.71 62.83 60.25 52.21 50.25 69.75 65.50
settling tanks (m3)
BOD input
(mg O2/L) 237 211 278 240 242 264 287 390 422 459 668 729 651
BOD output
(mg O2/L) 28,7 31,1 29,8 31,4 29,1 29,4 31,5 50,7 55,8 54,0 101,2 110,9 114,5
BOD removal
efficiency (%) 88 86 89 87 88 89 89 87 87 88 85 85 82
COD input
(mg O2/L) 944 771 819 1019 1033 926
COD output
(mg O2/L) 201 264 195 310 253 278
COD removal
efficiency (%) 78.5 65.2 75.6 69,9 74,0 69,6
SS input (mg/L) 353 304 421 446 467
SS output (mg/L) 43 44 39 60 45
SS removal
efficiency (%) 88 87 91 87 91
499

pumping that limits the decantation process.
Sands escaped from the grit removal system and
discerning in the oxidation basins increase the
water turbidity and decantation process. These
phenomena tend to disturb the water ecology
(disturbance of the biomass, reduction in the
hydraulic retention time and increase of bottom
sludge).
3.1.4. Biochemical oxygen demand (BOD)
The average of BOD at the input of the station
shows the increasing values during the period
from 1984 to 1996. It presents a succession of
three plateaus with different evolution (Table 1,
Fig. 3):
• from 1984 to 1989: the monthly average with a
weak growth appears characterized by values
oscillating between 200 and 300 mg O2/L;
• from 1990 to 1993: the monthly average is
more increasing and reach values near of 400 g
O2/L;
• from 1994 to 1996: the monthly average with
strong growth was distinguished by values
raised of 700 g O2/L;
The variability in the BOD values, at the input
of the WWTP, translated the irregular organic
A. Ouali et al. / Desalination 246 (2009) 496–505
0
200000
400000
600000
800000
1000000
1200000
1984 1986 1988 1990 1992 1994 1996
Year
Flow (m3)
minimal
maximal
average
Fig. 2. Minimal, maximal and average of flow rate treated by wastewater treatment of Sfax.
0
4000
8000
12000
16000
20000
1984 1985 1986 1987 1988 1989 1990 1991 1992 1993 1994 1995 1996
Nominal load Evolution of load
Lo
ad
(B
OD
Kg
/d)
Year
Fig. 3. Evolution of organic load (BOD), compared to nominal load of Sfax wastewater treatment.
500

matter enrichment of water, which is possibly
dependent on citizen life conditions.
The monthly output average values of the
BOD draw practically the same evolution as at
the input of the WWTP. The organic matters
enrichment of outputs waters is more accentuated
in the second and the third plateau. It possibly
results in the biologic aspect of the WWTP that
could appear in the following manner:
• From 1984 to1990: a relatively steady biologic
activity, explained by a monthly mean BOD
removal efficiency about 90% and values at the
output complied with the discharge norm. This
period is characterized by a good mineraliza-
tion of organic biodegradable compound in the
oxidation basin. This period is characterized by
a good biologic activity: equilibrium between
the contribution in organic matters, the pro-
duced biomass and the biodegradation.
• From 1991 to 1996: a relatively perturbed bio-
logic activity was explained by the important
organic load at the upstream and downstream
of the station. To the downstream the load that
passes the norm displayed of an unbalanced
biologic environmental aspect. Otherwise, the
input organic load increase displayed of an over
exploitation of the station essentially during
years 1994, 1995 and 1996. It has as effect a
massif biomass production, decrease of the
oxygen reserves and evolution of the state to
anoxia. However, the elevated BOD removal
efficiency (>80%) could be explained by the
tampon effect of an aerated lagoon, in case of a
high organic load.
3.1.5. Chemical oxygen demand (COD) andsuspended solid (SS)
During the period from 1991 to 1996, The
COD average at the input was characterised by
two antagonistic evolutions: the first was decreas-
ing. It was characterized by values about 800 g
O2/L, whereas the second was increasing with
values relatively important about 1000 g O2/L.
The input and output COD average did not show
a clear similarity. At the downstream, the load
above norm shows an unbalanced chemical
aspect with a limitation of oxygen reserves in oxi-
dation basins and sway of the COD removal effi-
ciency 65–75%.
During the period from 1991 to 1996, the
input SS mean evolution fluctuates between 300
and 500 g/L. It was similar with the one of COD,
with a minimum during the period from 1991 to
1993 and a maximum during the period from
1994 to 1996.
A. Ouali et al. / Desalination 246 (2009) 496–505
Table 2
Correlation matrix (r = 0,2º3 pour n = 72 and α = 0.05)
Input load Output load Removal efficiency
Twater
BODi
CODi
SSi
BODo
CODo
SSo
ABOD ACOD ASS
Twat
1
Input load BODi
0.214 1
CODi
0.19 0.639 1
SSi
−0.163 0.354 0.42 1
Output load BODo
0.022 0.806 0.43 0.27 1
CODo
−0.016 0.439 0.44 0.26 0.521 1
SSo
−0.58 −0.002 0.07 0.24 0.175 0.341 1
Removal ABOD 0.255 −0.22 −0.02 −0.05 −0.738 −0.46 −0.34 1
efficiency ACOD 0.111 0.044 0.27 0.05 −0,194 −0.72 −0.27 0.45 1
ASS 0.413 0.275 0.25 0.49 0.06 −0.138 −0.7 0.234 0.301 1
NB. i: input of WWTP, o: output of WWTP, A: removal efficiency.
501

A. Ouali et al. / Desalination 246 (2009) 496–505
Table 3
Eigenvalue and their percentages on the principal compo-
nents
Principal Variance Cumulative
components Eigenvalue explained (%) variance (%)
PC1 3,327 33,3 33,3
PC2 2,691 26,9 59,9
PC3 1,395 13,9 73,8
The SS oscillates between 200 and 800 g/L. It
translated the irregular wastewater enrichment in
particular matters depends probably on the urban
activity (domestic and industrial).
The monthly output SS average is similar to
COD (Table 1). It testifies to the SS enrichment in
oxidizable matters and their participation in the
chemical processes. These matters accentuate the
oxygen demand and limit reserves for the oxida-
tion of dissolved and colloidal matter.
The SS retention (97–91%) and their weak
contents at the output of the oxidation basins pos-
sibly translated both decantation and dissolution
processes.
3.2. Principal component analysis (PCA)
Water quality of the WWTP of Sfax was reg-
ularly conducted over a period of 6 years (1991–
1996) at the inlet and outlet of the station. All the
samples were analysed for various parameters
(BOD, COD, SS).
The PCA was carried out by diagonalization
of the correlation matrix, so the problems arising
from different measurement scales and numerical
ranges of the original variables are avoided, since
all variables are automatically auto scaled to
mean zero and variance unit.
PCA identified three factors, which are respon-
sible for the data structure explaining 74% of the
total variance of the data set and allowed to group
the selected parameters according to common fea-
tures as well as to evaluate the incidence of each
group on the overall variation in water quality dur-
ing the period from 1991 to 1996 (Table 3).
Table 4 summarises the PCA results including
the loadings. The amount of variance spanned by
each principal component (PC) is also shown in
Table 2. Following the criteria of Cattel and
Jaspers [36] we have retained three PCs and
explaining 74% of the variance or information
contained in the original data set. The absolute
value of the loadings is an indicator of the partic-
ipation of variables in the PCs, and in Table 1 the
maximum contribution reached by each original
variable is highlighted.
PC1 explained 33.3 of the variance and was
contributed by BODinput
, CODoutput
, SSinput
,
BODouput
, SSoutput
, ACOD, ABOD, ASS; which
were negatively correlated with the water temper-
ature. All input and output parameters were found
significantly correlated and uncorrelated with the
removal efficiency. These correlations can be
explained on the basis of a normal operating con-
dition of the WWTP. PC1 was found uncorrelated
with the SS removal efficiency. This correlation
can be attributed to a particular behaviour of the
particular matters and therefore disturbed water
ecology.
PC2 explains 26.9% of the variance and was
mainly participated by water temperature, output
Table 4
Loadings of physico-chemical variables on three signif-
icant principal components
Variables PC1 PC2 PC3
(Axis 1) (Axis 2) (Axis 3)
Twater
0.150 −0.609 −0.588
BOD (input) −0.699 −0.547 −0.015
Inlet load COD (input) −0.529 −0.570 0.283
SS (input) −0.437 −0.378 0.569
BOD (output) −0.864 −0.197 −0.146
Outlet load COD (output) −0.825 0.107 −0.246
SS (output) −0.465 0.633 0.502
ACOD 0.450 −0.519 0.511
Removal ABOD 0.699 −0.333 0.220
efficiency ASS 0.092 −0.849 −0.034
Variance % 33.3 26.9 13.9
502

A. Ouali et al. / Desalination 246 (2009) 496–505
Fig. 4. Factorial distribution of variable space on the plan
1 × 2.
parameters and their removal efficiency. This
component was correlated negatively with the
input parameters already correlated with the
water temperature. These correlations can be
explained on the basis of seasonal features in the
monitoring region.
PC3 explains 17% of the variance and was
contributed by COD, SS and the water tempera-
ture. The input parameters (COD and SS) were
correlated positively, whereas those of the output
were correlated negatively. This component was
correlated with the output parameters (COD, SS).
This correlation can be attributed to the seasonal
contribution in oxidizable particulate (industrial
wastewater)
For better refining the above-mentioned
groupings, the recourse to plane projections is of
a great interest. The following paragraphs include
the factorial distribution of the variables in the
1 × 2 and 1 × 3 plans.
3.2.1. Projection on the plan 1×2
According to this factorial representation we
notice a distribution according to four groups
illustrated in Fig 4.
– a first group was representative of the input
and the output water quality. It was con-
tributed by the input and output parameters
BOD (input), BOD (output), COD (input), COD
(output), and SS (input) which were correlated
negatively to axis 1. The BOD (input), COD
(input), and SS (input) were characterized by a
significant positive correlation. These correla-
tions can be explained by a common transport
of an organic and mineral polluting load along
the WWTP. BOD (output) and COD (output)
were correlated positively appeared also corre-
lated with those at the input. They possibly
translated purification dependent on the input
load.
– a second group was related positively to axis 1.
It was formed by the BOD, COD removal effi-
ciency. This group confirms the dependence of
the residual output oxidizable substances on
their input load.
– a third group was contributed by SS which
were uncorrelated with the water temperature
and the SS removal efficiency. The deviation
of the SS removal efficiency from the position
occupied by the BOD and the COD removal
efficiency of the second group could inform us
of particular particulate load behaviour.
– a fourth group located in the negative part of
axis 2; it was contributed by the water temper-
ature (Twater
) and the SS removal efficiency. Its
antagonistic position with the SS (outlet) can
be translated possibly by the effect of the sea-
sonal particulate contributions on the effi-
ciency of the WWTP.
3.2.2. Projection on the plan 1 × 3
It comes out from this projection (Fig. 5) a
new group contributed by the following parame-
ters: SS (input), SS (output), COD (output) which
were correlated positively. This group was
opposed to the water temperature. It could prob-
ably show the effect of seasonal polluting matter
on the ecology of the station. The positive corre-
lation between the SS and COD showed the
enrichment the SS (inlet) on oxidizable soluble
(chemical oxidation).
503

A. Ouali et al. / Desalination 246 (2009) 496–505
Fig. 5. Factorial distribution of the variable space on the
plan 1 × 3.
4. Conclusion
Water-quality monitoring programs generate
complex multidimensional data that need multi-
variate statistical treatment for their analysis and
interpretation of the underlying information. An
experimental 6 × 12 matrix was found and
analysed by multivariate statistical procedures.
The inspection of the correlation matrix of six
variables showed the existence of strong correla-
tions between variables.
PCA allowed the reduction of the six vari-
ables to three PCs to explain 74% of the vari-
ance of the original data set. PC1 (33.3 of
variance) was found uncorrelated with the SS
removal efficiency. This correlation can be
attributed to a particular behaviour of the partic-
ulate matters consequently a disturbed water
ecology. The PC2 (26.9 of variance) can be
assigned to seasonal contribution in organic and
mineral matters according to the citizen life con-
ditions. PC3 (17% of variance) can be assigned
to chemical and biochemical contributions in
utilizable particulates.
Thus, the multivariable statistical analysis
served as an excellent exploratory tool in analysis
and interpretation of complex data set on water
quality and understanding their temporal and spa-
tial variations.
References
[1] P. Xu, F. Brissaud and A. Fazio, Non-steady-state
modelling of faecal coliform removal in deep terti-
ary lagoons, Water Res., 36 (2002) 3074–3082.
[2] N. Ouazzani, K. Bouhoum, L. Mandi, L. Bouarab,
Kh. Habbari, F. Rafic, B. Picot, J. Bontoux and J.
Schwartzbrod, Wastewater treatment by stabiliza-
tion pond: Marrakesh Experiment, Wat. Sci. Tech.,
31 (12) (1995) 75–80.
[3] E. Gaume, Eléments d’écotoxicologie: dispersion
et impact sur les milieux naturels des polluants tox-
iques. (Cours d’écologie appliquée de première
année de l’école nationale des ponts et des
chaussées consacrées à la pollution des milieux
naturels, January 2001, 11p.
[4] I. Dione, Expériences de l’ONAS dans le choix et
la gestion des stations de lagunage au Sénégal,
séminaire CEREVE-EIER Traitement des eaux
usées par lagunage: challenges et perspectives pour
les pays en voie de développement 4 November
2002, Ouagadougou.
[5] A.A. Boussaid, N. Dias, J.. Legallo,, J. Y., J. Lesne
and S. Peou, Variation de la charge bactérienne des
effluents d’eaux usées de Marrakech, Revue Fac.
Sci., Marrakech, 3 (1985) 12–23.
[6] Kh. Habbari and K. Bouhoum, Les helminthiases
chez l’enfant scolarisé de la zone d’épandage des
eaux usées brutes. VIIème journées scientifiques de
la Société Marocaine de Parasitologie, Marrakech
(Maroc), 1991.
[7] Curis W. Bryant, A simple method for analysis of
the performance of operated wastewater lagoons,
Wat. Sci. Technol., 31 (12) (1995) 211–218.
[8] Chapman, Water quality assessment, in: Chapman.
(Ed.), on behalf of UNESCO, WHO, and UNPE,
Chapman &Hall, London, 1992, 585pp.
[9] W. Dixon and B. Chiswell, Review of aquatic
monitoring program design, Wat. Res., 30 (1996)
1935–1948.
[10] J.M. Andrade, D. Padra, S. Muniategui, E. Gonza
 lez and E. Alonso, Multivariate analysis of envi-
ronmental data for two hydrographic basins, Anal.
Lett., 25 (1992) 379-399.
[11] R. Aruga, D. Gastaldi, G. Negro and G. Ostacoli,
Pollution of a river basin and its evolution with time
studied by multivariate statistical analysis, Anal.
Chim. Acta 310 (1995) 15–25.
[12] S.D. Brown, R.K. Skogerboe and B.R. Kowalski.
Pattern recognition assessment of water quality
data: coal strip mine drainage, Chemosphere, 9
(1980) 265–276.
504

[13] A. Elosegui and J. Pozo, Spatial versus temporal
variability in the physical and chemical characteris-
tics of the Aguera stream (Northern Spain), Acta
Ecologica-Int. J. Ecol., 15 (1994) 543–559.
[14] J.O. Grimalt, J. Olive and J.I. Go mez-Belinchon n,
Assessment of organic source contributions in
coastal waters by principal component and factor
analysis of the dissolved and particulate hydrocar-
bon and fatty acid contents, Int. J. Environ. Anal.
Chem., 38 (1990) 305–320.
[15] V. Librando, Chemometric evaluation of surface
water quality at regional level. Fresenius, J. Anal.
Chem., 339 (1991) 613–619.
[16] E. Reisenhofer, G. Adami and P. Barbieri, Using
chemical and physical parameters to define the
quality of karstic freshwaters (Timavo River, North-
eastern Italy): A chemometric approach, Wat. Res.,
32 (1998) 1193–1203.
[17] M. Vega, R. Pardo, E. Barrado and L. Deban,
Assessment of seasonal and polluting effects on the
quality of river water by exploratory data analysis,
Wat. Res., 32 (1998) 3581–3592.
[18] B. Helena, R. Pardo, M. Vega, E. Barrado, J.M. Fer-
nandez and L. Fernandez, Temporal evolution of
groundwater composition in an alluvial aquifer
(Pisuerga river, Spain) by principal component
analysis, Water Res., 34 (2000) 807–816.
[19] Kunwar P. Singh, Amrita Malik, Dinesh Mohan,
Sarita Sinha, Multivariate statistical techniques for
the evaluation of spatial and temporal variations in
water quality of Gomti River (India)—a case study,
Wat. Res., 38 (2004) 3980–3992
[20] B.M. Wise and N.B. Gallagher, The process chemo-
metrics approach to process monitoring and fault
detection, J. Proc. Cont., 6 (6) (1996) 329–348.
[21] C. Rosen, Monitoring wastewater treatment sys-
tem,Tech. Lic. thesis, Department of Industrial
Electrical Engineering and Automation, Lund Uni-
versity, Lund Sweden, 1998.
[22] C. Rosen and G. Olsson, Disturbance detection in
wastewater treatment plants, Wat. Sci. Tech., 37
(12) (1998) 197–205.
[23] S.P. Mujunen, Modeling of activated sludge plants
treatment efficiency with PLSR: a process analyti-
cal case study. Chemomet. Intell. Lab. Syst., 41
(1998) 83-94.
[24] D.L. Massart, B.G.M. Vandeginste, S.N. Deming,
Y. Michotte and L. Kaufman, Chemometrices: A
Textbook, Elsevier, Amsterdam, 1988.
[25] S.D. Brown, S.T. Sum and F. Despagne, Chemo-
metrics, Anal. Chem., 68 (1996) 21R–61R.
[26] K. Bengraine and T.F. Marhaba, Using principal
component analysis to monitor spatial and temporal
changes in water quality, J. Hazard. Mater. B, 100
(2003) 179–195.
[27] D.B. Voncina, D. Dobcnik, M. Novic and J. Zupan,
Chemometric Characterisation of the quality of
river water, Anal. Chim. Acta 462 (2002) 87–100.
[28] C.W. Liu, K.H. Lin and Y.M. Kuo, Application of
factor analysis in the assessment of groundwater
quality in a blackfoot disease area in Taiwan, Sci.
Tot. Environ., 313 (2003) 77–89.
[29] R. Reghunath, T.R.S. Murthy and B.R. Raghavan,
The utility of multivariate statistical techniques in
hydrogeochemical studies: an example from Kar-
nataka, India, Water Res., 36 (2002) 2437–2442.
[30] V. Simeonov, J.A. Stratis, C. Samara, G. Zachari-
adis, D. Voutsa, A. Anthemidis, M. Sofoniou and
Th. Kouimtzis, Assessment of the surface water
quality in Northern Greece, Water Res., 37 (2003)
4119–4124.
[31] D.A. Wunderlin, M.P. Diaz, M.V. Ame, S.F. Pesce,
A.C. Hued and M.A. Bistoni, Pattern recognition
techniques for the evaluation of spatial and temporal
variations in water quality. A case study: Suquia
river basin (Cordoba-Argentina), Water Res., 35
(2001) 2881–2894.
[32] C. Rosen and A.J. Lennox, Multivariate and multi-
scale monitoring of wastewater treatment operation,
Wat. Res., 35 (14) (2001) 3402–3410.
[33] M. Allani, Epuration des eaux résiduaires urbaines
par lagunage aéré et désinfection par rayonnements
ultraviolets. Thèse de doctorat de l’université Paris
VII, 1993, 189p.
[34] Taktak and Trabelsi, Etude des performances épura-
trices de la station d’épuration des eaux usées de la
ville de Sfax par l’emploi des méthodes descriptives
et des analyses multivariables. Mémoire de fin d’é-
tudes, Faculté des Sciences de Sfax, 2002.
[35] R.B. Cattel and J. Jaspers, A general plasmode (No.
30-10-5-2) for factor analytic exercises and research,
Mult. Behav. Res. Monographs, 67 (1994) 1–212.
A. Ouali et al. / Desalination 246 (2009) 496–505 505