Variations in the physico-chemical properties of Dal Lake, Srinagar, Kashmir
10
Vol. 7(7), pp. 624-633, July 2013 DOI: 10.5897/AJEST2013.1504 ISSN 1996-0786 © 2013 Academic Journals http://www.academicjournals.org/AJEST African Journal of Environmental Science and Technology Full Length Research Paper Variations in the physico-chemical properties of Dal Lake, Srinagar, Kashmir Basharat Mushatq 1 *, Rajni Raina 2 , Tabasum Yaseen 3 , Ashwani wanganeo 1 and A. R. Yousuf 3 1 Department of Environmental Sciences and Limnology, Barkatullah University, 462026Bhopal India. 2 Goverment Benazeer College Bhopal M. P. India. 3 Department of Environmental Science/Centre of Research for Development (CORD), University of Kashmir, 190006 Srinagar, India. Accepted 8 July, 2013 Basic physical and chemical characteristics of the water in Dal lake Srinagar were determined. Surface water was sampled on monthly basis from June 2010 to April 2011. To determine the variations in physico-chemical parameters of Dal lake, a total of 21 physico-chemical parameters from six different site spread in four basins of lake was monitored. Our findings highlighted the deterioration of water quality in the lake due to anthropogenic activity in the lake and urbanization. The lake can be considered as eutrophic as evidenced by its shallow depth (1 to 4.5 m), low transparency (1 to 2.8 m), and higher concentrations of other nutrients such as phosphates, nitrates, sulphates and chloride. Pearson correlation coefficients were calculated to identify the strength of relation between the variables. The significant correlation was found among the temperature, depth, alkalinity, calcium, ammonia, nitrate and total phosphorus. Cluster analysis was additionally performed to obtain similarity between the sites. Key words: Physico-chemical characteristics, Dal lake, anthropogenic activity. INTRODUCTION A lake is a reflection of its watershed and as watershed landscape, the topography, soil, geology and vegetation determines the kinds of materials entering into the lake that in turn reflect on its water quality (Dong et al., 2010). Nutrient enrichment of lakes is one among the major environmental problems in many countries (Oczkowski and Nixon, 2008). Though it stimulates the growth of plants (algae as well as higher plants), nutrient enrich- ment ultimately leads to deterioration of water quality and degradation of the entire ecosystem (Guyuan et al., 2011). In present times, the aquatic ecosystems world- wide are being severely altered or destroyed at a rate greater than ever known in the human history. Dal Lake (Lat. 34° - 06’ N, 740- 45’ E, alt. 1581 m) situated in the heart of Srinagar, the summer capital of Jammu and Kashmir State is under tremendous anthropogenic pres- sure for the last three decades. More than 50,000 people live within the lake itself in various hamlets besides living in houseboats. People use this lake, for personal purposes generating huge businesses out of it but producing numerous pollutant generating substances for it in the form of floating gardens and using fertilizers at large in the nearby paddy fields therefore these activities have deteriorated the lake ecosystem in diverse ways. In recent decades, population growth, agricultural practices and sewage run-off from urban areas have increased nutrient inputs many folds than the level of their natural occurrence, resulting in accelerated eutro- phication and pollution (Zan et al., 2011). However, this process is accelerated by excess nutrients from *Corresponding author. E-mail: [email protected].
-
Upload
independent -
Category
Documents
-
view
3 -
download
0
Transcript of Variations in the physico-chemical properties of Dal Lake, Srinagar, Kashmir
Vol. 7(7), pp. 624-633, July 2013
DOI: 10.5897/AJEST2013.1504
ISSN 1996-0786 © 2013 Academic Journals
http://www.academicjournals.org/AJEST
African Journal of Environmental Science and Technology
Full Length Research Paper
Variations in the physico-chemical properties of Dal Lake, Srinagar, Kashmir
Basharat Mushatq1*, Rajni Raina2, Tabasum Yaseen3, Ashwani wanganeo1 and A. R. Yousuf3
1Department of Environmental Sciences and Limnology, Barkatullah University, 462026Bhopal India.
2Goverment Benazeer College Bhopal M. P. India.
3Department of Environmental Science/Centre of Research for Development (CORD), University of Kashmir,
190006 Srinagar, India.
Accepted 8 July, 2013
Basic physical and chemical characteristics of the water in Dal lake Srinagar were determined. Surface water was sampled on monthly basis from June 2010 to April 2011. To determine the variations in physico-chemical parameters of Dal lake, a total of 21 physico-chemical parameters from six different site spread in four basins of lake was monitored. Our findings highlighted the deterioration of water quality in the lake due to anthropogenic activity in the lake and urbanization. The lake can be considered as eutrophic as evidenced by its shallow depth (1 to 4.5 m), low transparency (1 to 2.8 m), and higher concentrations of other nutrients such as phosphates, nitrates, sulphates and chloride. Pearson correlation coefficients were calculated to identify the strength of relation between the variables. The significant correlation was found among the temperature, depth, alkalinity, calcium, ammonia, nitrate and total phosphorus. Cluster analysis was additionally performed to obtain similarity between the sites. Key words: Physico-chemical characteristics, Dal lake, anthropogenic activity.
INTRODUCTION A lake is a reflection of its watershed and as watershed landscape, the topography, soil, geology and vegetation determines the kinds of materials entering into the lake that in turn reflect on its water quality (Dong et al., 2010). Nutrient enrichment of lakes is one among the major environmental problems in many countries (Oczkowski and Nixon, 2008). Though it stimulates the growth of plants (algae as well as higher plants), nutrient enrich-ment ultimately leads to deterioration of water quality and degradation of the entire ecosystem (Guyuan et al., 2011). In present times, the aquatic ecosystems world-wide are being severely altered or destroyed at a rate greater than ever known in the human history. Dal Lake (Lat. 34° - 06’ N, 740- 45’ E, alt. 1581 m) situated in the heart of Srinagar, the summer capital of Jammu and
Kashmir State is under tremendous anthropogenic pres-sure for the last three decades. More than 50,000 people live within the lake itself in various hamlets besides living in houseboats. People use this lake, for personal purposes generating huge businesses out of it but producing numerous pollutant generating substances for it in the form of floating gardens and using fertilizers at large in the nearby paddy fields therefore these activities have deteriorated the lake ecosystem in diverse ways.
In recent decades, population growth, agricultural practices and sewage run-off from urban areas have increased nutrient inputs many folds than the level of their natural occurrence, resulting in accelerated eutro-phication and pollution (Zan et al., 2011). However, this process is accelerated by excess nutrients from
*Corresponding author. E-mail: [email protected].
human activities and is called “cultural eutrophication” (Guyer and Ilhan, 2011). It is caused by excess plant nutrients (primarily N and P) disposed into lakes mainly as untreated or partially treated domestic sewage, runoff from agricultural fields and so on. The chemistry of lake water is a cumulative reflection of catchment geology, weathering and erosional processes as well as anthro-pogenic inputs. The concentration of the chemical constituents in water depends on the availability of the parent mineral for a particular constituent and its dissolving capacity. Since many lakes are sinks of agricultural runoff and municipal and industrial waste water discharges, they become enriched with nutrients, and associated heavy metals (Koussouris and Diapoulis, 1989).
Being an urban type lake, municipal and domestic effluents have altered the surface water composition of Dal Lake, leading to increased eutrophication (Hutchinson, 1973). The results indicate that the direct discharge of sewage from houseboats, interruptions to the flow of water, human encroachments, increase in population within the catchment area, etc, have resulted in the deterioration of water quality, prolific growth of aquatic macrophytes and siltation. Keeping in view, the ecological significance of water bodies in Kashmir like Dal Lake, the present investigation were undertaken to determine the variations in physicochemical charac-teristics of Dal Lake. MATERIALS AND METHODS
Study area
The Valley of Kashmir is a lacustrine basin of the intermountain depression existing between the lesser and Greater Himalayas characterized by numerous aquatic ecosystems of great ecological and economic importance. Freshwater lakes of Kashmir Himalayas have important multistage components like source of drinking water, irrigation, navigation, fishery, agriculture, socioeconomic development and recreation. However, in recent decades, the lake ecosystem has changed drastically and come into exacerbated
trend because of disturbances in the catchment areas. As a result of heavy anthropogenic pressures, the lake surface area is shrinking with deterioration of water quality. The main problem of these lakes is nutrient enrichment from catchment area in the form of domestic wastewaters (residential areas) and runoff from agricultural fields.
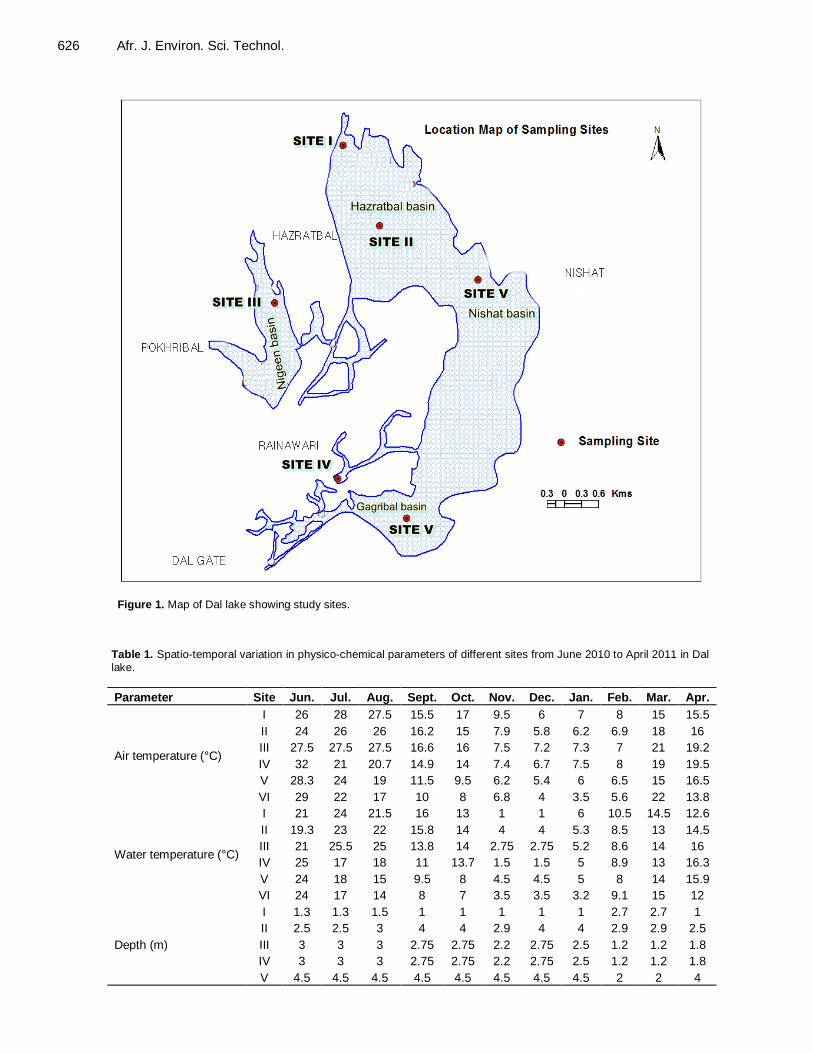
Six sampling sites were chosen for the determination of various physico-chemical parameters of water within the lake (Figure 1). Site I is located at a latitude 34° 08′ 44.6″N and longitude 74° 50′ 36.0″E near Habak STP where Bok kol enters in the Dal lake. The average depth of this site is 1.4 m. Site II is located within the centre of Hazratbal basin at latitude 34° 07′ 47.4″N and longitude 74° 50′ 38.0″E, having dense macrophytic growth and average depth of this site is 3.2 m. Site III is located in Nigeen basin (at latitude 34° 06′ 53.1″N and longitude 74° 50′ 07.3″E) near houseboats; this site is heavily impacted by direct drainage of sewage from house boats the average depth of this site is 2.4m. Site IV is located in dense floating garden area of Kandmohalla with
average depth of 2.4 m, situated in Gagribal basin of lake at latitude 34° 05′ 58.6″N and longitude 74° 50′ 47.4″E). Site V is located with
Mushatq et al. 625 the centre of Gagribal basin at latitude 34° 04′ 54.8″N and longitude 74° 49′ 52.0″E, having dense macrophytic growth and average depth of this site is 4.0 m. The last site VI is situated in Nishat Basin near Dock yard LAWDA at latitude 34° 07′ 41.4″N and longitude 74° 52′ 34.8″E; this site is regularly disturbed in summer months by manual deweeding processes. The average depth of this site is 3.0 m. Sampling analysis
Sample collection and physico- chemical analysis water samples were collected monthly from 6 sites of Dal lakes from 2010 to 2011
and were kept in polyethylene plastic bottles that were prior cleaned with metal-free soap, rinsed repeatedly with distilled water, then soaked in 10% nitric acid for 24 h and finally rinsed with distilled water. All water samples were properly stored and taken on the same day to laboratory and stored at 4°C until processing and analysis (APHA, 1995). The parameters like pH, temperature, depth, and transparency were checked on spot while the para-meters like free carbon dioxide, chloride, and alkalinity values were determined by APHA (1995). Nitrogen and phosphorus were
calculated by Spectrophotometric method (Wetzel and Lichens, 2004). Stastical analysis The measured parameters varied over the years. The arithmetic means of each parameter were therefore calculated for each basin to obtain representative values for use in statistical analyses. The
strength of relation between variables was ascertained using a Pearson correlation matrix of the data. Cluster analysis (CA) is a group of multivariate technique, which allows assembling objects based on the characteristics. CA classifies objects, so that each object is similar to the others in the cluster with respect to a predetermined selection criterion. Hierarchical agglomerative clustering is the most common approach, which provides intuitive similarity relationships between any one sample and the entire data
set and is typically illustrated by a dendrogram (tree diagram). The dendrogram provides a visual summary of the clustering processes, presenting a picture of the groups and their proximity with a dramatic reduction in dimensionality of the original data (Shrestha and Kazama, 2007).
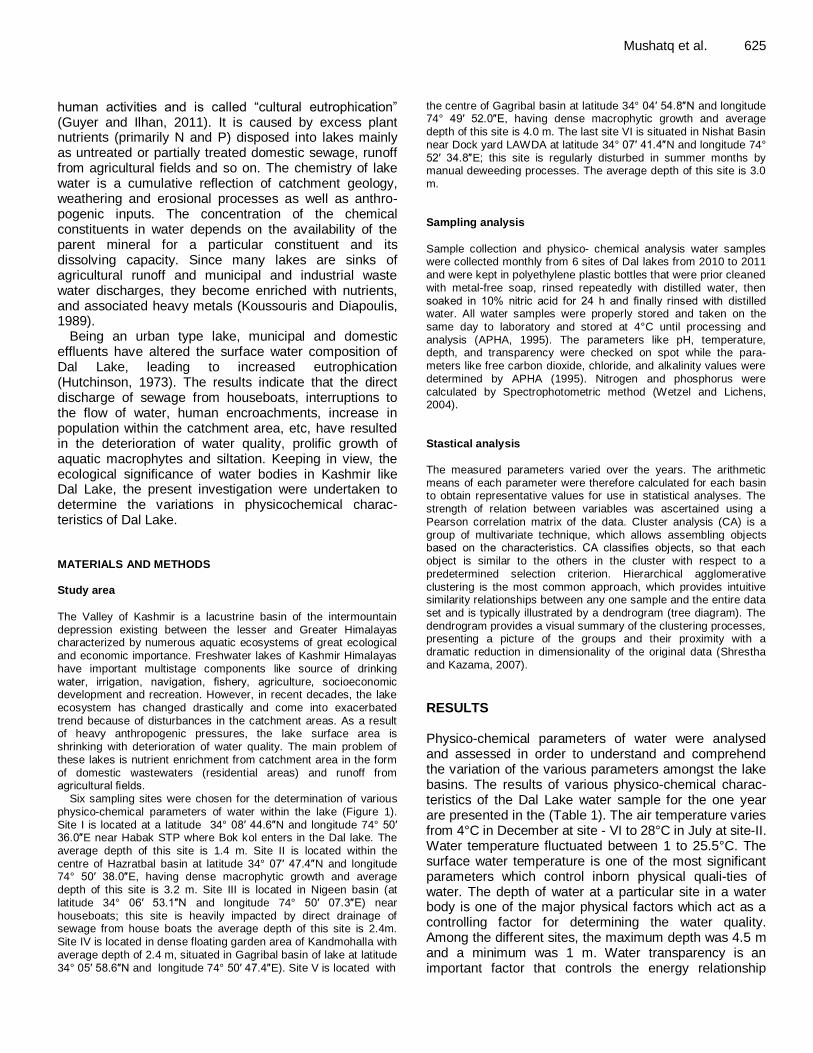
RESULTS Physico-chemical parameters of water were analysed and assessed in order to understand and comprehend the variation of the various parameters amongst the lake basins. The results of various physico-chemical charac-teristics of the Dal Lake water sample for the one year are presented in the (Table 1). The air temperature varies from 4°C in December at site - VI to 28°C in July at site-II. Water temperature fluctuated between 1 to 25.5°C. The surface water temperature is one of the most significant parameters which control inborn physical quali-ties of water. The depth of water at a particular site in a water body is one of the major physical factors which act as a controlling factor for determining the water quality. Among the different sites, the maximum depth was 4.5 m and a minimum was 1 m. Water transparency is an important factor that controls the energy relationship
626 Afr. J. Environ. Sci. Technol.
Figure 1. Map of Dal lake showing study sites.
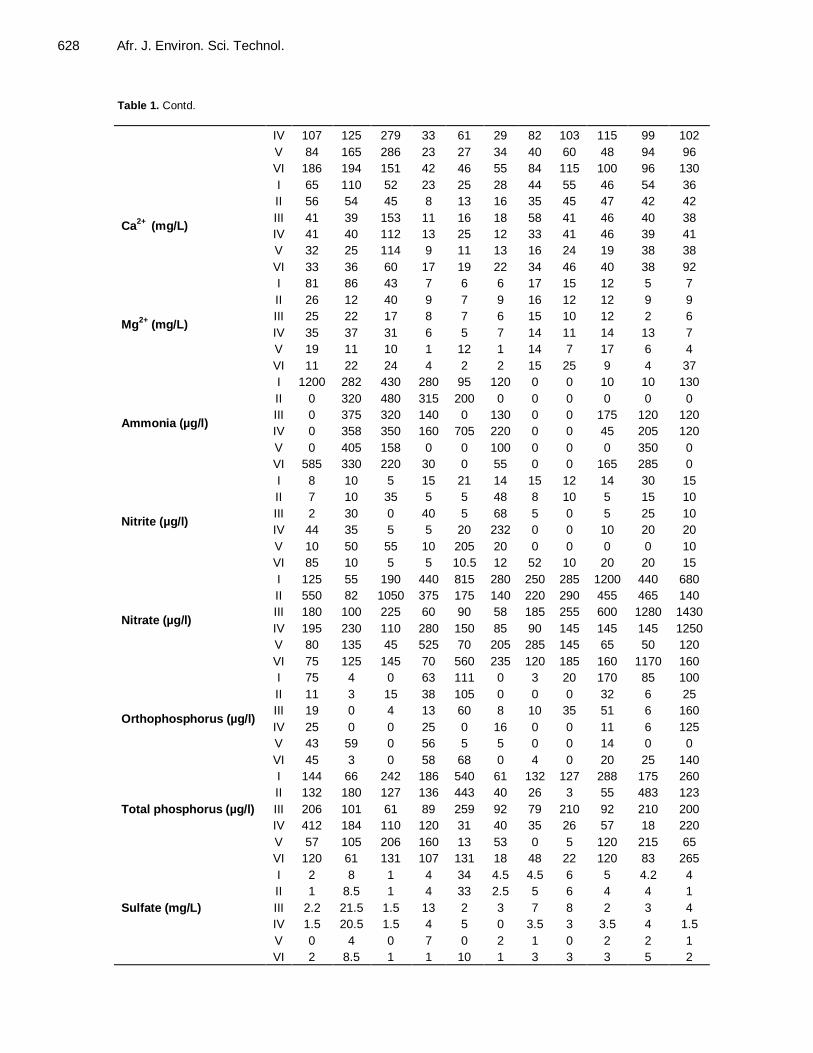
Table 1. Spatio-temporal variation in physico-chemical parameters of different sites from June 2010 to April 2011 in Dal lake.
Parameter Site Jun. Jul. Aug. Sept. Oct. Nov. Dec. Jan. Feb. Mar. Apr.
Air temperature (°C)
I 26 28 27.5 15.5 17 9.5 6 7 8 15 15.5
II 24 26 26 16.2 15 7.9 5.8 6.2 6.9 18 16
III 27.5 27.5 27.5 16.6 16 7.5 7.2 7.3 7 21 19.2
IV 32 21 20.7 14.9 14 7.4 6.7 7.5 8 19 19.5
V 28.3 24 19 11.5 9.5 6.2 5.4 6 6.5 15 16.5
VI 29 22 17 10 8 6.8 4 3.5 5.6 22 13.8
Water temperature (°C)
I 21 24 21.5 16 13 1 1 6 10.5 14.5 12.6
II 19.3 23 22 15.8 14 4 4 5.3 8.5 13 14.5
III 21 25.5 25 13.8 14 2.75 2.75 5.2 8.6 14 16
IV 25 17 18 11 13.7 1.5 1.5 5 8.9 13 16.3
V 24 18 15 9.5 8 4.5 4.5 5 8 14 15.9
VI 24 17 14 8 7 3.5 3.5 3.2 9.1 15 12
Depth (m)
I 1.3 1.3 1.5 1 1 1 1 1 2.7 2.7 1
II 2.5 2.5 3 4 4 2.9 4 4 2.9 2.9 2.5
III 3 3 3 2.75 2.75 2.2 2.75 2.5 1.2 1.2 1.8
IV 3 3 3 2.75 2.75 2.2 2.75 2.5 1.2 1.2 1.8
V 4.5 4.5 4.5 4.5 4.5 4.5 4.5 4.5 2 2 4

Mushatq et al. 627
Table 1.Contd.
VI 3.5 3.5 3.5 3.5 3.5 3.5 3.5 3.5 1.5 1.5 2
Transparency (m)
I 1 1 1 1 0.8 0.5 0.5 1 1.5 1 0.5
II 2 1.5 2.5 2.5 1.5 1.5 2 2 1.8 1.8 1.5
III 2 1.8 1.3 1.5 1.8 1 1 1 0.5 1 1
IV 1.5 2 1.5 2 2 2 1.5 1 1 0.3 0.5
V 2.8 2.8 2.6 1.5 1 2.3 1 2.4 1 1 1.8
VI 1.7 2.3 1.4 1.3 1 1.5 2 2 1 1 1.4
pH
I 7.4 7.5 6.9 6.8 7.4 6.9 8 8.3 8 8.2 7.6
II 7.7 7.6 7 7 7.2 7 8.1 8.3 8.2 7.5 8.3
III 7.8 7.2 7.2 7.6 7.5 7.3 7.2 7.8 8.5 8.1 7.5
IV 7.8 7.2 7.6 7 7.2 7.4 7.8 8 8.2 7.5 7.6
V 7.5 8.1 7.5 7 7 7.5 8 8.2 8.2 8.2 8.3
VI 7.8 8.1 7.9 7.8 7.9 7.8 8 8.4 8.1 8.4 8.7
Conductivity (µs/cm)
I 200 200 142 245 250 220 160 230 210 260 340
II 300 180 180 200 190 190 140 200 200 312 120
III 100 240 178 180 180 190 230 200 210 388 360
IV 100 220 193 195 180 180 220 180 200 382 380
V 300 120 160 160 118 200 160 110 124 343 160
VI 200 120 149 150 164 170 180 170 168 340 280
Dissolved oxygen (mg/L)
I 3 4 6.4 6 6 6.8 3.2 3 6.4 4 3
II 8 6 4 6 4 6 6 5 5 8 6
III 4.6 3 5.6 4.4 4.4 4.4 4.8 4 8 6.8 4.4
IV 3 4 4 3 2.5 2.4 4 4 4 7.2 4
V 6 4 4.8 4.8 5.2 6.2 6 4 6.8 5.6 6.6
VI 4 4 8.2 4.4 4.4 4 6 4 8 7.6 4
Free Carbon dioxide (mg/L)
I 8 4 4 4 4 4 12 4 10 12 16
II 4 6 14 8 18 4 4 4 10 0 4
III 4 8 14 10 18 2 2 6 0 16 18
IV 8 4 8 8 16 8 2 2 8 14 16
V 0 10 10 8 10 4 4 2 6 10 4
VI 2 4 4 8 12 4 4 0 4 10 0
Chloride (mg/L)
I 16 12 14 12 11 11 12 8 13 22 24
II 23 14 14 14 20 20 11 11 9 18 16
III 24 12 16 18 20 19 13 15 11 18 18
IV 23 18 12 14 22 10 14 11 11 19 30
V 21 16 12 12 20 17 9 12 10 23 16
VI 14 12 6 13 20 17 13 11 9 12 24
Total alkalinity (mg/L)
I 166 148 136 139 160 176 172 154 332 372 260
II 48 30 60 60 100 116 190 160 140 52 60
III 142 148 142 142 124 160 168 148 316 120 110
IV 142 136 154 157 102 140 154 124 344 152 148
V 124 57 46 48 114 104 196 136 116 104 110
VI 136 148 142 139 108 124 178 158 304 140 100
Total hardness (mg/L)
I 506 600 308 84 63 96 182 200 166 118 118
II 258 192 280 58 32 78 152 164 172 100 100
III 212 196 202 76 40 76 138 144 164 108 118
IV 252 278 406 40 61 58 138 150 174 154 132
V 164 214 268 38 27 38 98 88 120 118 114
VI 232 286 252 58 46 64 146 140 138 114 144
Calcium hardness (mg/L)
I 172 320 130 57 63 71 111 139 115 96 90
II 147 142 130 21 32 40 88 113 120 63 63
III 107 102 132 27 40 50 76 103 115 100 94
628 Afr. J. Environ. Sci. Technol.
Table 1. Contd.
IV 107 125 279 33 61 29 82 103 115 99 102
V 84 165 286 23 27 34 40 60 48 94 96
VI 186 194 151 42 46 55 84 115 100 96 130
Ca2+
(mg/L)
I 65 110 52 23 25 28 44 55 46 54 36
II 56 54 45 8 13 16 35 45 47 42 42
III 41 39 153 11 16 18 58 41 46 40 38
IV 41 40 112 13 25 12 33 41 46 39 41
V 32 25 114 9 11 13 16 24 19 38 38
VI 33 36 60 17 19 22 34 46 40 38 92
Mg2+
(mg/L)
I 81 86 43 7 6 6 17 15 12 5 7
II 26 12 40 9 7 9 16 12 12 9 9
III 25 22 17 8 7 6 15 10 12 2 6
IV 35 37 31 6 5 7 14 11 14 13 7
V 19 11 10 1 12 1 14 7 17 6 4
VI 11 22 24 4 2 2 15 25 9 4 37
Ammonia (µg/l)
I 1200 282 430 280 95 120 0 0 10 10 130
II 0 320 480 315 200 0 0 0 0 0 0
III 0 375 320 140 0 130 0 0 175 120 120
IV 0 358 350 160 705 220 0 0 45 205 120
V 0 405 158 0 0 100 0 0 0 350 0
VI 585 330 220 30 0 55 0 0 165 285 0
Nitrite (µg/l)
I 8 10 5 15 21 14 15 12 14 30 15
II 7 10 35 5 5 48 8 10 5 15 10
III 2 30 0 40 5 68 5 0 5 25 10
IV 44 35 5 5 20 232 0 0 10 20 20
V 10 50 55 10 205 20 0 0 0 0 10
VI 85 10 5 5 10.5 12 52 10 20 20 15
Nitrate (µg/l)
I 125 55 190 440 815 280 250 285 1200 440 680
II 550 82 1050 375 175 140 220 290 455 465 140
III 180 100 225 60 90 58 185 255 600 1280 1430
IV 195 230 110 280 150 85 90 145 145 145 1250
V 80 135 45 525 70 205 285 145 65 50 120
VI 75 125 145 70 560 235 120 185 160 1170 160
Orthophosphorus (µg/l)
I 75 4 0 63 111 0 3 20 170 85 100
II 11 3 15 38 105 0 0 0 32 6 25
III 19 0 4 13 60 8 10 35 51 6 160
IV 25 0 0 25 0 16 0 0 11 6 125
V 43 59 0 56 5 5 0 0 14 0 0
VI 45 3 0 58 68 0 4 0 20 25 140
Total phosphorus (µg/l)
I 144 66 242 186 540 61 132 127 288 175 260
II 132 180 127 136 443 40 26 3 55 483 123
III 206 101 61 89 259 92 79 210 92 210 200
IV 412 184 110 120 31 40 35 26 57 18 220
V 57 105 206 160 13 53 0 5 120 215 65
VI 120 61 131 107 131 18 48 22 120 83 265
Sulfate (mg/L)
I 2 8 1 4 34 4.5 4.5 6 5 4.2 4
II 1 8.5 1 4 33 2.5 5 6 4 4 1
III 2.2 21.5 1.5 13 2 3 7 8 2 3 4
IV 1.5 20.5 1.5 4 5 0 3.5 3 3.5 4 1.5
V 0 4 0 7 0 2 1 0 2 2 1
VI 2 8.5 1 1 10 1 3 3 3 5 2

Mushatq et al. 629
Table 1. Contd.
Silicate (mg/L)
I 4 3 2 8 5 5 3 4 4 5 8
II 2 7 10 10 5 5 12 0 5 2 2
III 5.8 4 20 4 8 8 3 0 3 5 2
IV 1 4 2 3 5 5 2 0 2 2 6
V 3 5 11 6 6 6 6 0 3 3 3
VI 2 2 2 2 3 2 2 0 3 3 2
at different trophic levels. It is essentially a function of reflection of light from the surface and is influenced by the absorption characteristics of both of water and of its dissolved and particulate matter. The transparency ranged between 1 to 2.8 m during the study period. Considerable fluctuations in pH can be observed in natural water during day, season to season and within years because of exposure to the air and biological activities. The lake is characterized by highly alkaline pH during summer as well as in the winter season. The pH recorded during the present study (6.8-8.7) was indicative of the alkaline nature (mean value 7.7). pH showed great variations during the study period and the pH remained alkaline (7.0 to 7.8) from summer to autumn. The higher values of pH were recorded from winter to spring (8.0-8.7) from December to April. However, lower values of pH were recorded (6.8 to 6.9) at site-I in summer. Conductivity is a measure of capacity of substance or solution to conduct electric current. Conductivity determines the total dissolved solids in the water. The electrical conductivity varied from 100 388 µs/cm.
Dissolved oxygen concentration showed a gradual decrease with time at various sites. The higher values with maximum concentration of 8.2 mg/L was recorded in the month of August at site - VI, while the lower values of 3 mg/L was obtained at various sites in different months. Carbon dioxide concentration varied between 0 to 18 mg/L. The carbon dioxide concentration was also found to reduce with time. The concentration of chloride during the present study showed great variations from a lower value of 6 mg/L recoded at site - VI in the month of July and in comparison to it, the higher concentration of chloride of 30 mg/L was observed at site -IV in the month of April. It was observed during the present study that the monthly values of total alkalinity depict an increasing trend in winter months. Although the higher values of total alkalinity (372 mg/L) was found in the month of March at site- I, lower value (46 mg/L) was recorded at site - V in the month of August. Total hardness and calcium hardness showed a different variation in different months. In the case of total hardness, the highest value (600 mg/L) was observes at site - I in the month of July, while the lower value (32 mg/L) was found at site - II in October. Similarly, in the case of calcium hardness, the highest value (320 mg/L) was recorded at site -I in July and lowest value (21 mg/L) was noticed at site - II in the
month of October. It was observed during the present study that average monthly values of total and calcium hardness was found lowest from September to November and highest values were observed in the summer months. Calcium and magnesium followed the same pattern as total and calcium hardness. Ca
2+ and Mg
2+ions
showed gradual reduction in their concentration from September to November and start again increasing from December. However, the highest concentrations were observed in summer months.
A great variation was observed in ammonical nitrogen concentrations during the present study. It was observed that highest concentration of ammonical nitrogen (1200 µg/l) was found in June at site - I and lowest in winter months particularly in December and January (in trace amounts). The monthly mean values of ammonical nitrogen showed increasing trend with increasing mean values of water temperature and declines with the decrease in temperature. Nitrite nitrogen also depicts variations in its concentration at different sites during the present investigation. It was found during the present study that the highest concentration of nitrite nitrogen was found in the month of October (205 µg/l) at site - V and in November (232 µg/l) at site - IV due to rapid increase in its concentration because of some anthro-pogenic activities on these particular sites. It was also noticed that NO2-N depicts (in additional to above two site) decreasing trend from summer months to winter and slightly increased from spring on words. Nitrate nitrogen depicts great variations in its concentrations at different sites in different months. However, the highest values (1400 µg/l) were observed in the month of April at site -III and lowest values (45 µg/l) at site - V in August.
Phosphorous, is generally recognized as one of the key nutrients in the productivity of freshwaters as it is essential element determining fertility of lakes. The concentration orthophosphate phosphorus during the study period varied from trace amounts at different sites in different months to a highest of 170 µg/l at site -I in February. The low orthphosphorous content in waters is due to the formation of an insoluble calcium-phosphate complex. The spatial and temporal variations in the total phosphate were much fluctuated. In general, lower concentrations were maintained in the winter months at all sampling sites. On the other hand, monthly concen-tration depicted a maximum of 540 μg/L and a mini-

630 Afr. J. Environ. Sci. Technol.
Table 2. Pearson correlation matrix for measured variables of all six sites of Dal Lake.
Temp Dep. Trans pH Cond. DO CO2 Cl TA TH C hrd Ca
2+ Mg
2+ NH4 NO2 No3 OP TP SO4
Temp
Depth 0.07
Trans 0.42 .794**
pH -0.2 -0.6 -0.5
Cond. 0.12 -.712* -.647* 0.37
DO -0 -.724* -.619* 0.26 0.46
CO2 0.3 -0.2 -0.4 -0.23 0.38 0.227
Cl 0.41 -0.2 -0.2 -0.12 0.59 -0.09 0.47
TA -0.4 -.623* -.603* .662* 0.05 .619* -0.2 -0.43
TH .674* 0.19 0.56 0.11 -0.22 -0.03 -0.3 -0.16 -0.1
C hrd .649* 0.08 0.44 0.19 -0.12 0.02 -0.2 -0.17 -0.1 .962**
Ca2+
0.52 -0 0.19 0.22 -0.01 0.194 0.02 -0.17 -0.1 .803** .901**
Mg2+
.700* 0.35 .663* 0 -0.33 -0.2 -0.3 -0.06 -0.2 .965** .881** .679*
NH4 .870** 0.29 .633* -0.52 -0.13 -0.03 0.21 0.207 -0.5 .667* .617* 0.45 .691*
NO2 -0.1 0.17 0.17 -.610* -0.12 -0.15 0.09 0.342 -0.3 -0.29 -0.34 -0.4 -0.2 0.19
NO3 0.09 -.797** -.814** 0.43 .788** 0.553 0.6 0.423 0.28 -0.3 -0.14 0.1 -0.41 -0.3 -0.33
OP 0.21 -0.4 -0.4 0.15 0.31 -0.01 0.53 0.572 0.07 -0.34 -0.29 -0.23 -0.26 -0.2 -0.13 .651*
TP .617* -0.2 -0.2 -0.09 0.44 0.159 .827** .706* -0.3 -0.04 0.017 0.07 0 0.39 0 0.57 .651*
SO4 0.09 0.31 0.2 -0.26 -0.22 -0.44 0.4 0.058 -0.3 -0.16 -0.14 -0.36 -0.06 0.19 0.22 -0.24 0.12 0.29
DS 0.21 0.3 0.16 -.748** -0.26 0.154 0.45 -0.04 -0.3 0.045 0.058 0.22 0.05 0.44 0.34 -0.09 -0.09 0.15 0.04
Temp, Temperature; Dep, depth; Trans, transpiration. Cond, conductivity; DO, dissolved oxygen; CO2, free carbon dioxide; Cl, chloride; TA, total alkalinity; TH, total hardness; C hrd, calcium hardness; NH4, ammonia; NO2, nitrite; No3, nitrate; OP, otho-phosphorus; TP, total phosphorus; SO4, sulphate DS, dissolved silica.
mum of 3 μg/L at sites-II and V in the month of January and December respectively. The values of sulphate depict a great variation during the study period. The concentration of sulphate varied from 1 mg/L to a highest of 20.5 mg/L. It was observed that the contrition of sulphate values showed irregular monthly changes. Dissolved silica also showed irregular variation in the pre-sent investigation period. The concentration of sili-ca was found to be a minimum of 1 mg/L at site -IV in June to a maximum of 20 mg/L at site - III in the month of August.
Statistical analyses Pearson correlation coefficients were calculated to obtain relations between the variables (Table 2). The temperature showed positively significant correlation with total hardness (r=0.674) and calcium hardness (r=0.649), ammonical nitrogen (r=0.870) and with total phosphorus (r=0.617). Depth was found positively correlated with transparency (r=0.794) and transparency depicted significant correlation with magnesium (r=0.663) and ammonical nitrogen (r=0.633). pH was was
positively strong correlated with total alkalinity (r=0.662) and conductivity with nitrate nitrogen (r=0.788). Similarly, other parameters were found to be positively strong correlated with one another such as, free carbon dioxide with total phosphorus (r=0.827), total hardness with calcium hardness (r=0.962), Ca
2+ (r=0.803) and Mg
2+ (r=0.965) and
calcium hardness with Ca2+
(r=0.901) and Mg2+
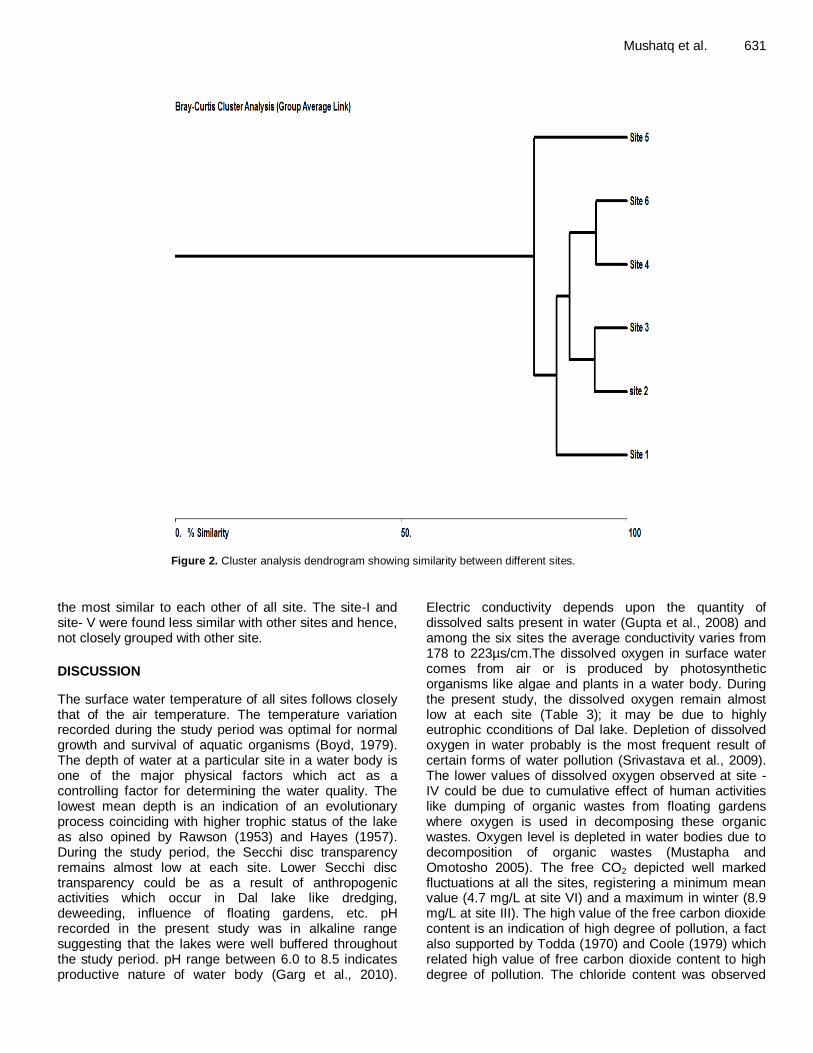
(0.881). In addition, cluster analysis was per-formed to identify natural grouping in the sites (Figure 2). The site -II and Site -III and Site- IV and Site -VI were the closest clusters and are thus
Mushatq et al. 631
Figure 2. Cluster analysis dendrogram showing similarity between different sites.
the most similar to each other of all site. The site-I and site- V were found less similar with other sites and hence, not closely grouped with other site.
DISCUSSION
The surface water temperature of all sites follows closely that of the air temperature. The temperature variation recorded during the study period was optimal for normal growth and survival of aquatic organisms (Boyd, 1979). The depth of water at a particular site in a water body is one of the major physical factors which act as a controlling factor for determining the water quality. The lowest mean depth is an indication of an evolutionary process coinciding with higher trophic status of the lake as also opined by Rawson (1953) and Hayes (1957). During the study period, the Secchi disc transparency remains almost low at each site. Lower Secchi disc transparency could be as a result of anthropogenic activities which occur in Dal lake like dredging, deweeding, influence of floating gardens, etc. pH recorded in the present study was in alkaline range suggesting that the lakes were well buffered throughout the study period. pH range between 6.0 to 8.5 indicates productive nature of water body (Garg et al., 2010).
Electric conductivity depends upon the quantity of dissolved salts present in water (Gupta et al., 2008) and among the six sites the average conductivity varies from 178 to 223µs/cm.The dissolved oxygen in surface water comes from air or is produced by photosynthetic organisms like algae and plants in a water body. During the present study, the dissolved oxygen remain almost low at each site (Table 3); it may be due to highly eutrophic cconditions of Dal lake. Depletion of dissolved oxygen in water probably is the most frequent result of certain forms of water pollution (Srivastava et al., 2009). The lower values of dissolved oxygen observed at site - IV could be due to cumulative effect of human activities like dumping of organic wastes from floating gardens where oxygen is used in decomposing these organic wastes. Oxygen level is depleted in water bodies due to decomposition of organic wastes (Mustapha and Omotosho 2005). The free CO2 depicted well marked fluctuations at all the sites, registering a minimum mean value (4.7 mg/L at site VI) and a maximum in winter (8.9 mg/L at site III). The high value of the free carbon dioxide content is an indication of high degree of pollution, a fact also supported by Todda (1970) and Coole (1979) which related high value of free carbon dioxide content to high degree of pollution. The chloride content was observed

632 Afr. J. Environ. Sci. Technol.
Table 3. The monthly mean values of physico-chemical parameters of different sites in Dal lake.
Parameter Site 1 Site 2 Site 3 Site 4 Site 5 Site 6
Air temperature (°C) 15.9 15.3 16.8 15.5 13.4 12.9
Water temperature (°C) 12.8 13.0 13.5 11.9 11.5 10.6
Depth (m) 1.4 3.2 2.4 2.4 4.0 3.0
Transparency (m) 0.9 1.9 1.3 1.4 1.8 1.5
pH 7.5 7.6 7.6 7.6 7.8 8.1
Conductivity (µs) 223 201 223 221 178 190
Dissolved oxygen (mg/L) 4.7 5.8 4.9 3.8 5.5 5.3
Free Carbondioxide (mg/L) 7 7 9 9 6 5
Chloride (mg/L) 14 15 17 17 15 14
Total alkalinity (mg/L) 201 92 156 159 105 152
Total hardness (mg/L) 222 144 134 168 117 147
Calcium hardness (mg/L) 124 87 86 103 87 109
Ca2+
(mg/L) 49 37 46 40 31 40
Mg2+
(mg/L) 26 15 12 16 9 14
Ammonia (µg/l) 232 120 125 197 92 152
Nitrite (µg/l) 14 14 17 36 33 22
Nitrate (µg/l) 433 358 406 257 157 273
Orthophosphorus (µg/l) 57 21 33 19 17 33
Total phosphorus (µg/l) 202 159 145 114 91 101
Sulfate (mg/L) 7 6 6 4 2 4
Silicate (mg/L) 5 5 6 3 5 2
higher in summer months than in winter. Similar observations were also found by Jana (1973) and Govindan and Sundaresan (1979), according to them higher concentration of chloride in the summer period could be also due to sewage mixing, increased temperature and evaporation by water. As far as total alkalinity is concerned it varied greatly between the sampling sites, lesser values were observed in open water areas such as, at site - II and site - V. It was mainly due to bicarbonate ions, but carbonates made its presence in the months of March, August and October at site - III and VI. However, the site located in the floating garden area that is site - IV cabonates were not recorded at all. The alkalinity in floating garden area was only due to bicarbonate ions and not due carbonates ions (Siraj et al., 2006). Hardness of water is due to major cations present in the water body. Calcium and magnesium are principle cations that impart the hardness to water. Bicarbonates and carbonates of calcium and magnesium cause hardness in water because of hydrolysis and they are naturally change into cations. A natural hardness of water depends on geological nature of drainage basin. The values for total hardness during the present study period prevails greater variation in different months at different sites. The values of total hardness are much fluctuating from that of summer months to autumn months while as, in winter months the values also show similar trend as in summers. The mean value of hardness was maximum at site- I; it may be due to the outflow of
Sewage treatment plant at this particular site. Among the various cations, Ca
2+ and Mg
2+ were found almost
abundant at all sites during the present study. Due to appreciable calcium and magnesium hardness, Dal lake can be classified as calcium rich (Ohle, 1934). Ca
2+ and
Mg2+
concentration of freshwater bodies of Kashmir Valley has been associated with thick population of plankton, especially Cyanophyceae (Bhat and Pandit, 2003). Ammonical nitrogen showed great fluctuations throughout the year at all the sites and ranged between maximum mean value of 232 μg/L and a minimum of 92 μg/L at site - I and site - V respectively.
Ammonical nitrogen showed during the present investigation gradual decrease in the months of December and January. After attaining the minimum values, the concentrations once again depicted an in-creasing trend. Such fluctuations in the values of ammo-nical nitrogen may be due to decomposition of organic matter into the lake as it is visited by many aquatic birds (Zuber, 2007). Organically polluted waters with high le-vels of NH4-N, which is readily available as a nutrient for plant uptake may contribute to increased biological pro-ductivity (Sheela et al., 2011). The higher values of nitrite nitrogen may be due to use of fertilizers in floating garden as its high concentration was observed in these areas. The concentration of nitrate nitrogen and phosphates also showed great variations among various sites. The highest average value of nitrate and phosphate of 433 and 202 μg/L at site-I while the lowest average value of
157 and 91 μg/L at site-V respectively were observed during the present study period. Nitrate concentration could be due to the surface run off of nitro-phosphate fertilizers from nearby farm fields into the lake as well as domestic sewage from nearby residential areas. Phos-phate enters the lakes through domestic wastewater, accounting for the accelerated eutrophication (Vyas et al., 2006). Increased concentration of phosphate and nitrate nitrogen in lakes resulted in enhanced productivity (Pandit and Yousuf, 2002). According to Rast et al. (1989), increase in nitrogen and phosphorus one or the other of which tends to limit productivity will lead to eutro-phication. The sulphate is the third most abundant ion in the lake. The concentration of sulphate in Dal Lake fluc-tuated between 1 mg/L and 21 mg/L throughout the period of survey. The maximum mean sulphate concen-tration was recorded as 7 mg/L at site - I and minimum mean value was observed at site - V. The high concentration of sulphate at site - I may be due drainage of untreated sewage from sewage treatment plant into the lake. This agrees with Renn (1968) observation on the abundance of ions into the freshwaters. The source of the sulphate could probably be the mineral rocks that are present around the lake. Silica is the most abundant ion in the lake. Silica remains variable in different months at different sites in the present study. The mean values of silica ranged from a higher concentration of (6 mg/L) at site -III to a lowest concentration of 2 (mg/L) at site -VI. Its concentration could be due to decomposition of aluminium silicate minerals in rocks. The presence of the silica in the lake will promote the growth of diatoms- a major food producer of aquatic ecosystems. According to Sarwar (1986), the silicate content in the lake water gets depleted as it is taken up by the abundance of diatoms.
Conclusion
In conclusion, the lake is also productive and will support diverse number of organisms from phyto and zooplanktons, benthos to fishes and macrophytes going by the abundance of chemical ions needed for interconversion of energy and production of organic minerals present in the lake. It may be therefore, concluded that the water quality of Dal lake were observed polluted as a result of direct drainage of sewage from nearby residential areas and from inner side human habitation particularly houseboats. Current anthropogenic activities (dredging and deweeding operations, farming activities in floating gardens, etc.) in Dal lake are also responsible for deterioration of its water quality. The physico-chemical data obtained in this lake could be used as baseline and reference point when assessing further changes caused by natural or anthropogenic in this lake.
REFERENCES
APHA (1995). Standard methods for the examination of water and
Mushatq et al. 633
wastewater,19th edn. American Public Health Association, Washington, D.C., 1467.
Bhat SA, Pandit AK (2003). Phytoplankton Dynamics in Anchar Lake,
Kashmir. J. Res. Dev. 3:71-96. Boyd CE (1979). Water quality in warm water fishponds. Craft Master
Printers, INC Opelika Alabama.
Coole GR (1979). A Text book of Limnology, 2nd ed. The Mosley Co. London, New York. p. 410.
Dong, JD, Zhang, YY, Zhang, S, Wang, YS, Yang, ZH, Wu, ML (2010).
Identification of temporal and spatial variations of water quality in Sanya Bay, China by three-way principal component analysis. Environ. Earth Sci. 60:1673-1682.
Garg RK, Rao RJ, Uchchariya D, Shukla G, Saksena DN (2010). Seasonal variations in water quality and major threats to Ramsagar reservoir, India. Afr. J. Environ. Sci. Technol. 4(2):061-076.
Govindan VS, Sundaresan BB (1979). Seasonal succession of algal flora in polluted region of Adyar River. Indian J. Environ. Health 21:131-142.
Gupta S, Maheto A, Roy P, Datta JK, Saha RN. (2008). Geochemistry of groundwater Burdwan district, West Bengal, India. Environ. Geol. 53:1271-1282.
Guyer GT, Ilhan EG (2011). Assessment of pollution profile in Buyukcekmece Watershed, Turkey. Environ. Monit. Assess. 173:211-220.
Hayes FR (1957). On the variation in bottom fauna and fish yield in relation to trophic level and lake dimensions. J. Fish. Res. Board Can. 14(1):1-32
Hutchinson GE (1973). Eutrophication. The scientic background of a contemporary practical problem. Am. Sci. 61:269-279.
Jana BB (1973). Seasonal periodicity of plankton in fresh water ponds, West Bengal, India. J. Int. Rev. Hydrobiol. 58:127-143.
Koussouris T, Diapoulis A (1989) Lake MikriPrespa. Ecological changes from natural and anthropogenic causes. Toxicol. Environ. Chem.
20:49-52. Mustapha MK (2003). A pre- impoundment study of limno-chemical
condtions of Oyunlake in Ilorin, Kwara state, Nigeria. Afr. J. Appl.
Zool. Environ. Boil. 5:44-48. Oczkowski A, Nixon S (2008). Increasing nutrient concentrations and
the rise and fall of a coastal fishery: A review of data from the Nile Delta, Egypt. Estuar. Coast Shelf Sci. 77:309-319.
Ohle W (1934). Chemischi and physikalischicheuntersuchungerNorddecutscher Seen. Archieve
Hydrobiologia 26:386-464. Rast W, Holland M, Ryding SO (1989). Eutrophication, management
framework for polycymakers. MAB digest. UNSECO, Paris. pp. 83.
Rawson DS (1953). The standing crop of net plankton in lakes. Journal Fisheries Research Board of Canada 10: 224-237.
Renn CE (1968). A study of water quality Lamotte chemical Products Company Chestertown, Maryland. pp. 46.
Sarwar SG (1986). Species composition and seasonal variation of periphyton on Cerratophyllumdemersum Linn. In Wular lake,
Kashmir, Geobios (New Reports) 6:114-118.
Sheela AM, Letha J, Joseph S (2011). Environmental status of a tropical lake system. Environ. Monit. Assess. 180(1-4):427-49.
Shrestha S, Kazama F (2007). Assessment of surface water quality
using multivariate statistical techniques: A case study of the Fuji river basin, Japan. Environ. Model. Softw. 22:464-475.
Siraj S, Yousuf AR, Bhat FA, Parveen M (2006). Impact of floating
garden onwater quality and zooplankton community on Dal lake, Kashmir. J. Res. Develop 6:25-34.
Srivastava N, Harit GH, Srivastava R (2009). A study of physico-
chemical characteristics of lakes around Jaipur. Indian J. Environ. Biol. 30(5):889-894.
Todda BK (1970). Water Encyclopedia. Water Information Centre. Port
Washington, New York. Vyas A, Mishra DD, Bajapai A, Dixit S, Verma N (2006). Environment
Impact of Idol Immersion Activity Lakes of Bhopal, India. Asian J.
Exp. Sci. 20(2):289 296. Zan F, Huo S, Xi B, Li Q, Liao H, Zhang J (2011). Phosphorus
distribution in the sediments of a shallow eutrophic lake, Lake
Chaohu, China. Environ. Earth Sci. 62:1643-1653.