
ENERGY EFFICIENT NORDIC GREENHOUSE. CASE - Jultika
139
Faculty of Technology ENERGY EFFICIENT NORDIC GREENHOUSE. CASE: UNIVERSITY OF OULU BOTANICAL GARDENS Ahasan Mohammed Khairul Environmental Engineering Master’s Thesis July 2019
-
Upload
khangminh22 -
Category
Documents
-
view
1 -
download
0
Transcript of ENERGY EFFICIENT NORDIC GREENHOUSE. CASE - Jultika

Faculty of Technology
ENERGY EFFICIENT NORDIC GREENHOUSE.
CASE: UNIVERSITY OF OULU BOTANICAL
GARDENS
Ahasan Mohammed Khairul
Environmental Engineering
Master’s Thesis
July 2019

FACULTY OF TECHNOLOGY
ENERGY EFFICIENT NORDIC GREENHOUSE.
CASE: UNIVERSITY OF OULU BOTANICAL
GARDENS
Ahasan Mohammed Khairul
Supervisors:
Professor Eva Pongrácz, Docent, D.Sc.(Tech.)
Ph.D, M.Sc. (Tech.) Antonio Caló
Environmental Engineering
Master’s Thesis
July 2019

ABSTRACT
FOR THESIS University of Oulu Faculty of Technology Degree Programme (Bachelor's Thesis, Master’s Thesis) Major Subject (Licentiate Thesis)
Environmental Engineering
Author Thesis Supervisor
Ahasan, Mohammed Khairul Professor Pongrácz, E, D.Sc.(Tech.)
Title of Thesis
Energy efficient Nordic greenhouse. Case: University of Oulu Botanical Gardens
Major Subject Type of Thesis Submission Date Number of Pages
Environmental Engineering Master’s July 2019 139
Abstract
The human population has grown sevenfold over the past two century, proportionately the food demand increased
and the land for cultivation is shrinking. According to the United Nations (UN), the present size of the world
population is more than 7.6 billion, and it estimates that this number will exceed 13 billion during the current century,
which is a considerable challenge for tackling the future food security for all. In the scarcity of land, to meet the food
demand of this enormous population, a contemporary agricultural arrangement is needed. By contrast, to conserve
the environment, the use of land and fossil fuel should be limited.
In continuation of this, to meet the future food demands, ‘greenhouse farming’ can be a suitable alternative, notably,
in the region where the environmental conditions are not entirely favourable for year-round production.
Greenhouses are widely used to provide a suitable environment in cultivation around the world. Generally, a high
amount of energy input is needed to make a favourable condition for the plants’ growth. Moreover, the energy
consumption profile is much complex when the site location is in a cold climate. For this reason, an energy-efficient
greenhouse is not as simple as anyone guess, whereas various factors, including ventilation, covering material,
orientation, lighting system and also energy input are considered as the key elements to ensure energy-efficient
environment.
In order to overcome the crisis, photovoltaic (PV) solar energy conversion systems could be considered as the most
promising systems to aggregate electricity in a carbon-free environment. However, the PV generation blended with
Economic, environmental and sustainability aspects.
This study aims to evaluate all the aspects that can hinder greenhouse efficiency in the Nordic region. For this
purpose, a grid-connected solar PV system chosen for two different scenarios. It has observed that every scenario
have an adequate individual reason for their feasibility.
For the first scenario, it was found that it can produce 10459.00 kWh electricity with a power rating 127.80 kWp,
while second can generates 109771.50 kWh with a power rating 141.30 kWp. It also observed that the PV array could
meet 25.25% to 26.51% of annual demand of the University of Oulu Botanical Gardens.
Moreover, payback time found equal for both scenario, while in their lifetime they can can reduce 846.85 tonnes to
889.15 tonnes of carbon emission to the atmosphere.

PREFACE
This master’s thesis and the included work was done at the Energy and Environmental
Engineering (EEE) unit of the University of Oulu. Throughout this thesis, I have been
supported by many people who I wish to express my gratitude.
First and foremost, I wish to express my gratitude to my supervisors, Professor Eva
Pongrácz and Dr Antonio Caló for their guidance during the whole process. Their
knowledge and hard work have driven me to grow and to understand what I am capable
of doing. Without them, this thesis would never have succeeded, and it is a testament to
them for pushing me to achieve. I am indeed acknowledged to Professor Eva Pongrácz
not only for her guidance but for her support during the whole master’s programme as a
mentor.
I would like to express thanks to Dr Jenni Ylä-Mella, for her kind heart and allocate space
for conducting the experimental work.
I also wish to thank my colleagues and friends of the Energy and Environmental
Engineering (EEE) Research Unit. It has been a pleasure to work with everyone. I would
also like to thank University of Oulu Botanical Gardens officials, especially to Professor
Aspi Jouni, Tuomas Kauppila and Anna Liisa, for their continuous assistance. Special
thanks to my friends who have been with me the whole way, especially to Alfred Akoore
for his guidance and kept me entertained.
And finally, I have to thank my wife Sania Siraj and daughter Prarthana Ahasan for
supporting throughout not only through this adventure but all the others.
I am dedicating this research work to all the fathers who had passed away.
Oulu, 12.02.2019 Ahasan Mohammed Khairul

TABLE OF CONTENT
ABSTRACT ...................................................................................................................... 9
PREFACE ....................................................................................................................... 10
TABLE OF CONTENT .................................................................................................. 11
ABBREVIATIONS ........................................................................................................ 14
1 Introduction .................................................................................................................. 16
1.1 Background ........................................................................................................... 16
1.2 Case study ............................................................................................................. 19
1.3 Objectives .............................................................................................................. 20
2 Weather conditions in the north and plants’ needS ...................................................... 23
2.1 Weather conditions in the North ........................................................................... 23
2.1.1 Solar Radiation ............................................................................................ 24
2.1.2 Temperature ................................................................................................. 26
2.1.3 Precipitation ................................................................................................. 27
2.1.4 Humidity ...................................................................................................... 28
2.1.5 Evaporation .................................................................................................. 28
2.1.6 Wind Velocity .............................................................................................. 29
3 Energy-efficient greenhouse concept ........................................................................... 31
3.1 Location ................................................................................................................. 32
3.2 Dimensions ............................................................................................................ 32
3.3 Shape and Orientation ........................................................................................... 33
3.4 Energy-efficient Covers ........................................................................................ 34
3.5 Energy-efficient Insulation .................................................................................... 36
3.6 Indoor Climate Control ......................................................................................... 36
3.7 Heating Systems .................................................................................................... 37
4 Energy balance in greenhouses .................................................................................... 39
4.1 Energy Use in Greenhouse .................................................................................... 39
4.2 Energy Needs for Different Cultivars ................................................................... 42
5 Best practices in energy efficient greenhouses ............................................................ 44
5.1 Energy Efficient Lighting ..................................................................................... 44
5.1.1 Different Energy-Saving Lighting Options ................................................. 45
5.1.2 Light spectrum vs plants need ..................................................................... 48
5.2 Solar energy .......................................................................................................... 50
5.2.1 Photovoltaics ................................................................................................ 51
5.2.2 Traditional Solar PV .................................................................................... 52

5.2.3 Transparent Solar PV ................................................................................... 53
5.2.4 PV Modules in Market ................................................................................. 54
5.3 Solar Thermal Energy ........................................................................................... 55
5.3.1 Solar Heat Collector .................................................................................... 56
5.4 Geothermal Energy ............................................................................................... 58
5.5 Energy Storage ...................................................................................................... 59
5.5.1 Sensible Heat Storage System ..................................................................... 60
5.5.2 Latent Heat Storage System ......................................................................... 65
5.5.3 Thermochemical Heat Storage .................................................................... 65
6 Agriculture-energy policies and Energy provisioning ................................................. 67
6.1 Agricultural sector in Finland ............................................................................... 67
6.2 Agricultural Policies in Finland ............................................................................ 69
6.3 Energy Policies in Finland .................................................................................... 70
6.4 Energy Provisioning for Finland ........................................................................... 71
6.5 Energy Production Scenario in Oulu ..................................................................... 72
6.6 Solar Photovoltaic Potential .................................................................................. 74
7 example of energy efficient greenhouses ..................................................................... 78
8 University of Oulu Botanical Gardens ......................................................................... 83
8.1 Location and size ................................................................................................... 83
8.2 Characteristics of the buildings ............................................................................. 84
8.3 Functions of the Botanical Gardens ...................................................................... 85
8.3.1 Heating and Cooling .................................................................................... 86
8.3.2 Ventilation ................................................................................................... 87
8.3.3 Lighting ........................................................................................................ 88
8.4 Energy Audit ......................................................................................................... 89
8.4.1 Energy Consumption ................................................................................... 89
9 Sizing of different options for energy generation and saving ...................................... 97
9.1 PV Module and Sizing .......................................................................................... 97
9.2 Scenario 1: South Facing Modules ....................................................................... 98
9.3 Scenario 2: Building Facing Module .................................................................. 101
9.4 Energy Efficiency Gain Potential ........................................................................ 102
10 Cost and Payback Calculation .................................................................................. 105
10.1 PV System Cost................................................................................................. 105
10.2 Electricity Price ................................................................................................. 105
10.3 Evaluation of the Simulated PV Systems .......................................................... 107
10.4 Tentative Payback Time (Scenario 1) ............................................................... 108
10.5 Tentative Payback Time (Scenario 2) ............................................................... 111

10.6 Summary of the Scenario .................................................................................. 112
10.7 Nordic Energy-Efficient Greenhouse Concept ................................................. 113
10.8 Improvement Possibilities in UOBGs ............................................................... 114
11 Summary and Conclusions ....................................................................................... 118
11.1 Assumptions ...................................................................................................... 121
11.2 Further Research ............................................................................................... 121
12 References ................................................................................................................ 123
13 Appendices ............................................................................................................... 144
13.1 Results: Scenario 1 ............................................................................................ 144
13.2 Results: Scenario 2 ............................................................................................ 145

ABBREVIATIONS
ATES Aquifer Thermal Energy Storage
BTES Borehole thermal energy storages
CAP Common Agricultural Policy
DLI Daily Light Integral
EU European Union
EC European Commission
EBT Energy Payback Time
DWG Deep Winter Greenhouse
FTO Fluorine-doped tin oxide
GSHP Ground Source Heat Pump
HVAC Heating, Ventilation and Air-Conditioning System
IRR Internal Rate of Return
IOT Internet of Things
IR Infrared
IEA International Energy Agency
IEA SHC International Energy Agency
ITO Indium-doped tin oxide
IRENA International Renewable Energy Agency
NPV Net Present Value
NREL National Renewable Energy Laboratory
O&M Operation and Maintenance
PEC Primary Energy Consumption
PPFD Photosynthetic Photon Flux Density
PAR Photosynthetically Active Radiation
PV Photovoltaic
PVGIS Photovoltaic Geographical Information System
PCM Phase Change Materials
PTES Pit Thermal Energy Storage
SPBT Simple Payback Time
STPV Semi Transparent Photovoltaic
TFPV Thin-film Solar Photovoltaic Cell
TPV Transparent Photovoltaic

TOPV Transparent Organic Photovoltaic
TES Thermal Energy Storage
TTES Tank Thermal Energy Storage
THS Thermochemical Heat Storage
UN United Nations
UOBGs University of Oulu Botanical Gardens
VAT Value Added Tax
VLC Visible Light Communications

1 INTRODUCTION
1.1 Background
The human population has grown sevenfold over the past two century, proportionately
the food demand increased and the land for cultivation is shrinking (Fedoroff, 2015).
According to the United Nations (UN), the present size of the world population is more
than 7.6 billion, and it estimates that this number will exceed 13 billion during the current
century, which is a considerable challenge for tackling the future food security for all
(United Nations, 2017). In the scarcity of land, to meet the food demand of this enormous
population, a contemporary agricultural arrangement is needed. By contrast, to conserve
the environment, the use of land and fossil fuel should be limited.
In continuation of this, to meet the future food demands, ‘greenhouse farming’ can be a
suitable alternative, notably, in the region where the environmental conditions are not
entirely favourable for year-round production, while indoor cultivation gives 10-20 times
greater output per unit area than outdoor.
In Finland, short growing season and cold climate limits the open field production, and
annually a large share of vegetable and fruit is imported from other countries. According
to the Natural Resources Institute Finland, in 2018, the outdoor field utilised for
vegetable, nursery product, fruit and berries cultivation was 19,131 hectares, while
greenhouse vegetable and ornamental plants cultivated on 393 hectares (Natural
Resources Institute Finland, 2019b). It has seen that in this period the prices of the outdoor
products are relatively high compared to greenhouses. Meanwhile, although 48 times
more land was used for open field cultivation, the same amount of return came from both.
With a need to reduce the imported food dependency using the domestic potentiality,
greenhouse farming is perfect candidates in Finland.
However, depending on the location, a comparative amount of lighting, heating and
humidity is need to make a favourable condition for the plants’ growth in greenhouse.
This can be varied through wide-ranging weather conditions (Qoaider and Steinbrecht,
2009). For example, indoor farming requirements in northern colder climate areas will be
different from the southern, warmer climates.

It is possible to predict from the previous statistics that the use of energy in greenhouse
sector is one of the concerns among others, while energy is used as a source for lighting,
heating and operating other electronic equipment. In the year of 2017, Finnish greenhouse
farming sector consumed about 1628 GWh energy, whereas electricity consumption was
599 GWh, which is approximately one-third of the total of this sector (Natural Resources
Institute Finland, 2019a). Comparing with the utilised area, this energy consumption
profile is considerably bigger than the open field cultivation.
Moreover, it has been observed that over the last decade’s electricity price have steady
grown in the European Union (EU), while it has set goals to reduce the energy
consumption by 20% and increase the share of renewable energy sources to 20% by 2020
(Eurostat, 2017). In this perspective, due to the shortage of energy reserves (Cuce, Young
and Riffat, 2015) and price hike, and growing environmental problems such as GHGs
emission, global warming and climate change (Cuce, 2013) nowadays energy saving has
become more than significant.
In addition to this, the EU is targeting to enlarge the efficiency of energy use, and attempt
to decouple it from economic growth. Meanwhile, the EU's Common Agricultural Policy
(CAP) also encouraging the farmer to promote and support climate-smart farming by
giving them an incentive (European Commission, 2019). Because of these factors, it is
significantly beneficial to ensure energy efficiency in the agricultural sector, especially
in greenhouse farming, which has already been demonstrated by the Netherlands.
Considering these issues as mentioned above, it is needed to ensure different key index
to operate energy saving greenhouse. For example, first of all, favourable environment
for the plants' growth; secondly, reduce the use of energy; thirdly, reduce the use of water;
fourthly, proper use of spaces and all these must be done in an environmental-friendly
manner to satisfy the EU and CAP’s goal.
In the meantime, an energy-efficient greenhouse designing covers various factors such as
heating, ventilation, insulation, covers, building orientation, shape, lighting and also the
energy input for the whole system. As the heating cost alone represents 70–85% of total
operating costs excluding labour in cold climate (Sotirios et al., 2017), therefore, reducing
the heating cost is significant for a more cost-effective and sustainable greenhouse
production.

Several studies have been conducted to design low-energy greenhouses, while Ahamed
et al. (2019a); Cuce et al. (2016) on the use of solar energy and energy saving techniques
for reducing the heating cost, Sotirios et al. (2017) on geothermal energy system for
greenhouse heating, Gourdo et al. (2019); Bazgaou et al. (2018) on solar energy storing
rock-bed for heating, Chai et al. (2012) on ground source heat pump for greenhouse
heating.
In addition to these, research has been conducted to examine the use of industrial waste
heat and wood biomass to reduce greenhouse heating cost. However, passive heating
systems such as rock bed or water tank may not be feasible in cold regions. On the other
hand, waste heat is not a good option for more decentralised area such as stand-alone
greenhouse.
Apart from the ‘Nordic energy-efficient greenhouse’ concept, the key goal of this thesis
work is to innovate an idea where the greenhouses can be a source of clean energy as
well. Finland is a key player in the utilisation of the renewable energy, while it used in
different form, i.e., bioenergy, hydropower, wind power, ground heat, fuels from forest
industry side streams and other wood-based fuels (Ministry of Economic Affairs and
Employment of Finland, 2019). It also set a goal to increase the share of renewability in
every sector including agriculture. Conversely, under the energy efficiency agreement
(2017-2025 period), Finland is seeking more innovative technology in the energy sector
to achieve its goal. However, it is assumed that the energy innovation implementation in
Northern Finland is harder than the south due to the colder climate.
Meanwhile, the theoretical potential represents more energy comes on the earth’s surface
in one and a half hour than the worldwide energy consumption in a year (Tsao, Lewis and
Crabtree Argonne, 2006), it can be assumed that the energy needs per square metre in a
greenhouse is significantly lower than the sun release energy per square metre.
Additionally, the price of solar technology is reducing as the solar energy sector is
expanding.
Considering the arguments as mentioned above, photovoltaics (PV) modules could be
novel greenhouse applications to meet the energy needs in greenhouse. Moreover PV
cells have better efficiency at cold temperatures and declines with an increase in
temperature (Shukla et al., 2017), so it can be considered as a positive issue. Additionally,

geothermal energy can also be considered as options to supplement heating needs, when
the daylight significantly declines in winter seasons in the northern climate.
Furthermore, to make greenhouses a source of energy, building-integrated photovoltaics
(BIPV), especially transparent or semi-transparent PV could be considered. Moreover,
issues relating to the effect of snow on PV panels also studied in this work, as snow and
ice covered on a solar panel reduce the energy production for an extended period
(Rahmatmand et al., 2019).
Moreover, regarding good air quality and ventilation for plants growth, as well as heating,
cooling and even humidification and de-humidification, HVAC (Heating, ventilation and
air-conditioning) system in greenhouses will be reviewed.
1.2 Case study
The University of Oulu Botanical Gardens (UOBGs) were selected as a case to analyse
the unique needs of an energy-efficient greenhouse. In this site, there are three
greenhouses that have been operating since 1983.
Currently, the sources of energy of these greenhouses are grid-connected electricity and
district heating system. Two of the greenhouses are shaped as pyramid, and during the
study, it was kept in mind that the aesthetics of the design could not be compromised.
Moreover, during the study it has been considered that the greenhouses that are located
at the UOBGs are not same like the other regular greenhouses as these are operates for
experimental purpose.
While the focus in greenhouses is to ensure a favourable environment for a plant’s growth,
energy consumption could be tallied as one of the crucial issues that is needed to subsidies
plant’s natural growth requirements. From the previous statement, it could be assumed
that, by fulfilling all the needs of plants growth as well as reduce the energy used to
control indoor weather conditions, an energy-efficient greenhouse can be a rewarding
project.
To turns the studied greenhouses as energy-efficient, different measurements and
assumptions were taken into consideration in relation to the key performance indices
(KPI), which are shown in the following figure.

Figure 1. Selected key parameter and their requirement for an energy-efficient model
In this thesis, the KPIs, as seen in Figure 1, will be studied, aimed at their optimization.
In addition to this, prior research and technical solutions will be considered.
1.3 Objectives
The objective of this thesis is to provide information about the energy efficiency in
greenhouses and what is needed to improve energy efficiency in a Northern Finland
setting. Additionally, energy demands and innovation needs for the greenhouse farming
sector in the Oulu region also set as an objective.
Moreover, the research will consider different energy sources and assess their feasibility.
For example, a grid-connected PV system will be considered as a source of energy.
Additionally, the following research questions will be studied:

i. What are the essential elements required for an energy-efficient greenhouse?
ii. Can Northern Finland be considered a prospective place for greenhouse farming?
iii. Can PV system be considered as a viable option for sustainable energy production
in the Nordic region?
iv. What are the available technologies to clear panels from ice and snow?
v. Perform a sizing study for the utilisation of PV panels at the UOBGs. Consider
also the application of transparent and semi-transparent PVs.
vi. Overall, what innovative technological options are available for the UOBGs?
To answer these questions, chapter two will analyse the weather condition of Northern
Finland, which will determine the advantages and challenges for greenhouse farming. The
Energy-efficient greenhouse concept will be discussed in chapter three, in which
orientation, shape, insulation, ventilation and indoor plants arrangement will be reviewed.
Chapter four will review the energy needs in a greenhouse for heating and lighting.
Chapter five will discuss the best practices for an energy-efficient greenhouse in terms of
lighting, solar PV and solar thermal. Additionally, the challenges of snow conditions and
available technologies for snow cleaning will be discussed in this chapter.
Chapter six will review the policies of Finnish agricultural and energy sector. Energy
provisioning for Finland will also be covered within this chapter.
Chapter seven review examples of energy-efficient greenhouse in different locations.
The Experimental part begins with chapter eight, which is an overview of the Oulu
University Botanical gardens. This chapter will cover location and size, buildings
characteristics, functions of Oulu University greenhouses and their energy consumption
profile.
Chapter nine will present different scenarios for solar PV arrays, while in chapter ten will
presents the economic evaluation of these PV systems. Results, discussion and
conclusions will be presented in chapters eleven and twelve.

Theoretical Part

2 WEATHER CONDITIONS IN THE NORTH AND PLANTS’
NEEDS
2.1 Weather conditions in the North
Within this chapter the climate conditions of the North, especially the northernmost areas
(usually north of 65o N) are covered. The Arctic Polar Region consists of the Arctic
Ocean, Alaska), Iceland, Greenland (Kingdom of Denmark), and the Northern parts of
Canada, Finland, Norway, Russia and Sweden.
The climate affecting factors such as latitude and sunlight, pressure, temperature, wind,
humidity, clouds and precipitation, as well as snow and ice properties are reviewed.
Additionally, the factors that affect plant growth in the greenhouse are also presented.
The physical properties of ice and snow have a significant contribution to the regional
character of the Arctic climate since heat is required for the ice to melt (Mcbean et al.,
2005).
The Northern climate can be characterized by short summers and long, dark winter days.
According to the US based data centre, the National Snow and Ice Data Centre (NSIDC),
in the Arctic region, the average January temperature varies from -34 °C to 0 °C; while
in winter, the temperatures can fall below to -50 °C, since the sun appears in this season
for a short time. Conversely, in the warmer season (in July), the temperature mount in a
range between −10 to +10 °C, with some land areas occasionally exceeding 30 °C in
summer (NSIDC, 2018).
On the other hand, the temperature is an important parameter for plants growth. However,
the optimal temperature depends on the plant species grown and the desired level of
photosynthetic activity, whereas too high and too low temperature reduce plant growth.
In relation with this, depend on plant species, greenhouse temperature varies in a range,
and typically optimal temperature should be between 10-30 oC.
Moreover, according to von Zabeltitz (2011), the climate elements that has to consider
for outdoor or indoor farming are:
i. Solar radiation
ii. Temperature

iii. Precipitation
iv. Humidity
v. Evaporation and evapotranspiration
vi. Wind velocity
All these elements will be covered sequentially in relation with the plant need and
regional aspects.
2.1.1 Solar Radiation
The amount of solar radiation that receives the earth’s surface is not as same as the sun
radiate. It reaches to the surface through reflection, absorption and scattering in the
atmosphere. Although the solar constant is 1.366 kW/m2, but with the changes of latitude,
season, and day length, as well as clouds influence, the average solar radiation for a
specific location could be different.
Although the Arctic region occupies less than 5% of the Earth’s surface, but it has some
significant influences in the climate system. Instrumental record shows that close to the
north of the Arctic Circle, it is more significant at the period of daylight, while during the
winter, the number of days of consecutive night decreases (Miller et al., 2010).
The radiation energy, distribution and temporal fluctuation of the sun are the key factors
to determine the climate of Finland, and the climate diversity became more evident within
the country from south to north. Meanwhile, the radiation level also changes with seasons
and different in the north to south. While, the annual sunshine is highest (1900 hours) in
the southwestern maritime and coastal regions and lowest (1300 hours) in the northern
part, precisely in the eastern Lapland. In autumn and winter, about 65% to 85 % of the
sky covered with clouds, and it increases from the northwest towards the southwest. The
clear sky appears most frequently in May and June, while least in November and
December (Finnish Meteorological Institute, 2017a).
On the other hand, the southern part of Finland receives higher solar radiation on the
horizontal surface compared to the northern region. For instance, while Helsinki, the
capital city of Finland that situated at the southern part, receives approximately 980 kWh/
m2, a northern city, Sodankylä, receives 790 kWh/ m2. On the other hand, in central

Finland, the solar radiation on the horizontal surface is about 890 kWh/ m2 (Motiva,
2017).
Oulu is a city in the northern part of Finland, which is on the shore of Bay of Bothnia and
located in the 65 oN, fifteen meters above the sea level. Compared to Sodankylä, this
region received slightly higher average solar radiation and compared to Helsinki, solar
radiation per square meter is lower in Oulu. The following figure will gives a complete
solar radiation scenario of the Oulu region.
Figure 2. Average monthly irradiation in Oulu for year 2017 (Data taken from
Photovoltaic Geographical Information System)
As seen in Figure 2, in November, December and January Oulu region receives a little
amount of solar radiation as the day-length is too short in this period. Conversely, a higher
amount of solar radiation receives in April, May, June, July and August. Meanwhile,
February, March, and September, October receive a moderate amount of solar by the
earth’s surface.
In terms of plants’ need, a minimum amount of daily solar energy is essential for the
plants’ growth, as the production of dry matter decreases with low solar radiation.
Additionally, the growth become stopped at 14–30 W/m2 light power for plants
(minimum 0.3 kWh/m2 day) (Krug et al., 2003).
The minimum daily radiation requirement for vegetable production during the shortest
day-length (November, December and January) in the Northern Hemisphere is estimated
2.34 kW/m2-day. From this, it can be assumed that around 6 hours of light per day is
needed during these months. Therefore, production of dry matter cannot be expected
0
1
2
3
4
5
6
J A N F E B M A R A P R M A Y J U N J U L A U G S E P O C T N O V D E C
KW
H/M
2/D
AY
THO
USA
ND
S
MONTH
HORIZONTAL IRRADIATION

during this period in higher northern latitudes, and artificial lighting is mandatory for
plants’ regular growth (Food and Agriculture Organization, 2013).
2.1.2 Temperature
The temperature of a region depends on radiation, season and altitude above the sea level,
distance to seas, wind conditions, and as well as cloud conditions. According to the
Finnish Meteorological Institute (Finnish Meteorological Institute, 2017b), in the
southern part of Finland, the mean annual temperature is about 5.5 °C, while 0 °C mean
limit is exist at the north.
In Finland, the temperature fluctuates from month-to-month and season-to-season. For
example, while during January the temperature difference between southern and northern
Finland is about 12 °C, in June and July, this is about 5 °C. For the same reason, the
annual mean temperature of Oulu region is lower compared to the southern part, as the
Oulu region situated at the northern part of Finland.
Figure 3. Annual mean temperature (left) and annual mean precipitation (right),
reference period 1981-2010 (Climateguide.fi web service, 2018)
As seen in Figure 3, the annual mean temperature in the northern part of Finland varies
from 2 °C to -2 °C, while in Oulu it was around 2 °C to 3 °C since last twenty years.
Meanwhile, in the most southern part, it was more than 5 °C.

Pirinen et al., (2012) give a clear temperature fluctuation scenario for the Oulu region.
According to the report, from 1981 to 2010, the average January temperature was -9.6
°C, February -9.3 °C, and in March -4.8 °C. However, the temperature rises to plus °C in
April and it remains until October. The average temperatures between April and October
in Oulu are: April 1.4 °C, May 7.8 °C, June 13.5 °C, July 16.5 °C, August 14.1 °C,
September 8.9 °C, and October 3.3 °C. At the end of October temperature begins to
decline. The average November and December temperature in Oulu region is -2.8 °C and
-7.1 °C.
Conversely, frost can kill a plant, as well as the growth, yield and quality can be affected
by temperature below 12 °C or above 30 °C. Moreover, for indoor farming, it is necessary
to ensure average temperatures ranging from 17 to 27 °C. Additionally, to maintain proper
growth of a plant such as tomato, pepper, cucumber, melon and beans, the average night
temperature should be in-between 15–18.5 °C (Nikolas, 2013).
In light of these considerations, it can assume that in the northern part of Finland, an
additional heating system is needed from January to May and September to December.
2.1.3 Precipitation
Precipitation is also an essential characteristic to evaluate indoor cultivation, while water
is a vital component for a plants’ growth. In the Arctic region, the precipitation amounts
are low as the temperature. Additionally, a significant variability in precipitation is
observed in this region.
On the other hand, in Finland, the monthly average precipitation is higher in May and less
in April and September. As seen in figure 3, like the temperature phenomenon, the
northern part of Finland experienced lower precipitation and increased towards the
southern part.
The annual precipitation in the southern and central part is around 600 and 700 millimeter
(mm), but near the coast, particularly in Ostrobothnia, precipitation is slightly less.
Conversely, the annual precipitation in northern Finland is about 550 mm or less. The
lowest annual rainfall is between 200 to 300 mm and the highest annual rainfall 700 mm
in the north of Finland and 900 to 1100 mm elsewhere (Finnish Meteorological Institute,
2017b).

Subsequently, in Oulu, August is the wettest month and April is driest, and the average
amount of annual precipitation is 433.0 mm. Pirinen et al. (2012) presents the month to
month average precipitation from 1981 to 2010 and it was 31 mm in January, 26 mm in
February, 26 mm in March, 20 mm in April, 37 mm in May, 46 mm in June, 71 mm in
July, 65 mm in August, 44 mm in September, 45 mm in October, 36 mm in November
and in December it was 30 mm.
On the other hand, in a greenhouse, the water needs for plant growth is covered by
irrigation systems. However, in a high precipitation area, the rainwater can be collected
for irrigation. Conversely, heavy rainfall can destroy crops. Therefore, a greenhouse must
have channels to drain off the unnecessary water.
2.1.4 Humidity
The amount of water vapour that presents in the air is referred as Humidity, which has a
significant influence in plants’ growth. There are three primary measurements of
humidity: absolute, relative and specific, while relative humidity, which is measured as
percentages.
Due to lower temperature, humidity is low in the Arctic atmosphere, and humidity
increase with temperature rises. In Finland, July and August are the months for highest
humidity. Conversely, lowest humidity exist in February. Meanwhile, in November and
December relative humidity reaches to 90%, while 65 to 70% in May (Finnish
Meteorological Institute, 2017c).
As humidity is correlated with temperature, therefore, the northern part of Finland has
lower humidity compared to the southern part. According to von Zabeltitz (2011), 70-
90% relative humidity can be considered as in safe range, whereas less than 55-60%
assume as shortage for plant growth. Therefore, evaporative cooling or fog systems are
used to increase the humidity inside a greenhouse. On the other hand, relative humidity
more than 95% can create serious problem for plants’ health as this environment is
favourable for fungus diseases (Food and Agriculture Organization, 2013).
2.1.5 Evaporation
In the course of evaporation, water transformed into water vapour through a phase change
and then disappeared into the atmosphere. On the other hand, in the transpiration process,

the plant takes liquid water and return as vapour to the atmosphere via the stomata on
leaves.
Climate condition, which include the solar radiation, temperature, relative humidity and
wind, influences evaporation, whereas at higher temperature the evaporation rates are
higher and at a lower temperature the evaporation rates are lower. For the same reason,
in warm weather, the water loss by evaporation is higher than in cold weather (Gigi et al.,
2018).
In 2013, evaporation measured during May-September was 350−500 mm in southern and
central Finland. On the other hand, the seasonal evaporation sum measured in northern
Finland was 200−370 mm (Finnish Environment Institute, 2014). Moreover, According
to Venäläinen et al. (2005), during mid-summer the average daily potential evaporation
is 4 mm/day above than the mean value, while in northern Finland it is below 4 mm/day.
Evaporation is essential as a plant lose heat through this process. About 60% of the light
reaches the plant is transformed into heat, which should be evacuated through
evaporation.
Regarding plants in a greenhouse, too much water loses can close the stomata, and as a
result, it halted photosynthesis. On the other hand, CO2 is obligatory to keep the
photosynthesis going. Therefore, to keep the stomata open, it is essential to reduce the
evaporation of the plant, and it can be done by keeping the humidity high.
2.1.6 Wind Velocity
Finland locates in the westerly air disturbances zone, which causes the variations in air
pressure and winds. Average wind speed varies between 2.5 metres per second to 4 metre
per second inland, while higher in the coast (5 to 7 metre) per second in maritime regions.
On average every month in autumn and winter, open sea experiences with wind speeds
over 20 metres per second, but spring and summer, storms are rare (Finnish
Meteorological Institute, 2017d).
In northern Finland the average windiest month is December and least in June. Moreover,
the measured average wind speed in Oulu for twelve months is January 4.33, February

4.11, March 3.73, April, 3.63, May 3.48, June 3.50, July 3.63, August 3.52, September
3.67, October 3.96, November 4.32 and December 4.53 m/s (Gaisma, 2018).
Additionally, wind velocity is a factor that affects the plants’ transpiration. The higher
velocity of wind activity causes for relatively higher transpiration since the moist or
humid air around a plant is quickly replaced by less humid air allowing the plant to release
even more water into the atmosphere. Therefore, in a greenhouse air flow should be
controlled in a way so that it does not affect the transpiration process. On the other hand,
wind velocity can affects a greenhouse structure as well.

3 ENERGY-EFFICIENT GREENHOUSE CONCEPT
Energy efficiency describes the amount of output with a given input of energy. On the
other hand, energy efficient greenhouses refers the whole system that can get the most
yield energy which is supplied by taking measures to reduce energy loss such as
minimising the loss of heat through the greenhouse envelope. Moreover, energy-efficient
greenhouses should be able to receive more solar radiation, less expensive to operate,
more convenient indoor atmosphere for plat’s growth, and more environmentally
friendly.
As discussed in the previous chapter, the climate elements have a close association with
the plants’ growth and production; therefore, in the greenhouse, it is required to consider
all relevant parameter to ensure energy efficiency for indoor farming.
In cold winter climate areas, the main objective for energy-efficient greenhouse is
temperature increase and prevail heat loss. Kinney and Hutson (2012) had considered the
basic principle of the energy-efficient building to design an energy-efficient greenhouse.
The basic principles of energy-efficient buildings that are considered for greenhouse
energy efficiency are as follows:
Minimise the heat loss through insulation
Control the solar energy flow to minimise the use of artificial light and heat
Maintain suitable temperature and airflow to ensure a favourable atmosphere for
plant growth
The total greenhouse system should optimise so that it makes any complications
for the plants’ health.
On the other hand, von Zabeltitz (2011) and Bakker (2009) taken into consideration
several additional parameters and best practices suitable for northern climate such as
location selection, orientation excluding insulation, ventilation, heat, geothermal, solar
energy sources, and better utilization of the available greenhouse area for energy-efficient
greenhouse design.

In the following subsections, all of the significant parameter will be discussed regarding
the Nordic climate.
3.1 Location
Before construct an energy-efficient greenhouse envelope, location choosing is very
important as the amount of available solar radiation depends on its geolocation. The solar
radiation availability varies from south to north, east to west. Moreover, different climate
zones have advantages and disadvantages regarding solar accessibility. For example,
while temperate regions experience seasonal solar radiation, arid zones receive year-
round sun. On the other hand, tropical region experiences 12 hours daylight daily, and
Mediterranean zones mild winters and hot, dry summers (Locsin, 2018).
Additionally, obstacles interfering with sunlight entering the glazing should be
considered. Notably, in the north, during the early spring, the sun position should be kept
in mind to ensure maximum utilization of solar potential. Conversely, later in the summer,
the sun is more overhead. By paying attention to the sun path, it is possible to design a
greenhouse that will receive the highest available light as well as minimise the heat
requirement in cold climate regions (Rudge, 2015).
3.2 Dimensions
The uniformity of the temperature and humidity distribution could be affected by the
greenhouse dimension (width: length) ratio as the dimensions have the most significant
influence on energy consumption. According to Goosen et al. (2003), the higher the ratio
is, the lower of the energy consumption. Meanwhile, Çakır and Şahin (2015), proposed
0.1 value for maximum solar energy collection.
On the other hand, near to 0.5 value proposed by Jain and Tiwari (2002) as the best width:
length ratio to avoid irregular air disturbance and temperature distribution throughout the
length. Therefore, it can assume that the width: length ratio within 0.1 to 0.5 can consider
as the potential range to ensure the energy efficiency in a greenhouse.

3.3 Shape and Orientation
The shape of a greenhouse plays a vital role while it influences the amount of solar
radiation received and the amount of heat exchange with the outside. Generally, two types
of greenhouses are notable: (i) single module; and (ii) multi-module, whereas, multi-
module are more energy efficient than single module and consume 4-10% less heating
energy (Djevic and Dimitrijevic, 2009). Conversely, the roof outline also has a significant
effect on solar energy gain and heat loss. Apart from climate conditions, typically, five
types of roof shapes are consider for east-west (E-W) oriented greenhouses: (i) even-span;
(ii) uneven-span; (iii) arch shape; (iv) vinery shape, and (v) Quonset (Sethi, 2009).
Figure 4. The common greenhouse shapes in East-West orientation. Adapted from
Sethi (2009)
Ahamed et al., (2018) have revealed in a review article thsat uneven-span shape is most
effective in cold climate throughout the year except November to January. On the other
hand, because of the most considerable south roof, modified arch shape receives the
highest solar as compared to the other types. In percentages, compared with even-span

shape, 8.4% higher solar radiation receives when the shape is uneven-span. Moreover,
the modified arch shape, vinery shape, and Quonset shape receive 0.7%, 5.8%, and 7.1%
less solar than the even‐span shape, respectively.
Meanwhile, east-west (E–W) oriented greenhouse need less heat since they receive higher
amounts of solar radiation in the winter season (October-March) under northern latitude
because of the lower inclination of the sun. On the other hand, similar orientation gets
less radiation during warm season. Additionally, long south-facing surface receive high
direct solar during the winter (Ahamed et al., 2019b). From these arguments, it can be
assumed that, in the winter season, E-W facing greenhouse need less heating, while less
cooling in summer.
However, shape and orientation alone may not be sufficient to provide entire heating
needs, but it can reduce the heating loss and increase the percentages of receiving solar
radiation in cold climate.
3.4 Energy-efficient Covers
To control light transmittance, heat diffusion and protecting the plants from the outer
environment, the covering material plays a vital role in a greenhouse. Moreover, an
energy-efficient covering materials should have high transparency to receive solar
radiation within the photosynthetically active radiation (PAR) range (Castilla, 2013).
There are two main types of greenhouse covering materials such as rigid panels and
plastic films. Under the rigid panels category there are different types of materials that
can be used in greenhouses, while glass, polycarbonate, polyethylene film, and acrylic
are the common materials. However, the main priorities to consider covering materials
are: it should be high transmissivity to short-wave solar radiation and low transmissivity
to long-wave radiation. Meanwhile, in the context of cold climate, thermal conductivity
has an important role in conserving energy, whereas low thermal conductivity can ensure
energy conservation.
Considering the U-value (lower value means less heat loss), light transmission, thermal
transmission, and life expectancy, the below comparison of covering materials were
presented by Ahamed et al., (2018) and Sanford (2011).

Table 1. Properties of different greenhouses covering materials (Ahamed et al.,
(2018); Sanford (2011))
Materials % Light
transmission
U-value % Thermal
transmission
Life expectancy
Glass
Single 88-93 1,10 3 25+
Double 75-80 0,70 <3 25+
Acrylic
Single 90 1,13 <5 30+
Double 84 0,49-0,56 <3 30+
Polycarbonate
Single 90 1,10 <3 10-20
Double 78-82 0,53-0,63 <3 10-20
Polyethylene film
Single 87 1,20 50 3-4
Double 78 0,70 50 3-4
As seen in Table 1, the glass and acrylic panels allow high solar radiation transmission
and have a greater life expectancy. Conversely, polyethylene film and polycarbonate
covered greenhouses have low infiltration rate and low life expectancy. On the other hand,
regarding the U-value, which determines the heat loss, acrylic (double) and polycarbonate
(double) materials have the lowest value. Moreover, considering the thermal
transmission, glass and plastic glazing have thermal transmission of less than 3%, while
the regular poly film has about 50%.
In practice, horticultural float glasses used in modern greenhouses have transparent
properties and admits a higher amount of solar radiation to ensure sufficient light in the
greenhouse. Another type of glass is diffuse glass. The advantages of diffuse glasses are,
they have a structure which changes the properties of the surface of the glass, and can be
beneficial for the crops within the greenhouse.
Since in cold climate region, one of the concerns for greenhouse cultivation is snow load
on the cover. For instance, it has evaluated that around 4 inches snow is similar to 1 inch
of rainfall and the load is equivalent to 5.2 pounds of snow per square foot. Therefore,
before choosing covering materials, this issue should be kept in mind to avoid additional
difficulties regarding cleaning the snow.

3.5 Energy-efficient Insulation
In northern cold climates, heat loss is one of the major concerns to achieve energy
efficiency in a greenhouse, while additional heat requirements for plants can be reduced
by providing proper insulation between two layers of cover. Depending on the structure
and geolocation, different types of insulator are used to ensure energy efficiency in a
greenhouse such as air layer insulation, liquid foam insulation, air bubble insulation, and
pellet insulation. Among them, the most suitable and affordable technique is inflated air
layer insulation for the double layer polyethylene covered greenhouses.
On the other hand, Insulation to the side walls up to the height of the plants can reduce a
significant amount of heat loss. This kind of heat losses can be reduced by 50% through
the installation of 25–50 mm of polyurethane or polystyrene insulation (Latimer, 2009).
Moreover, to increase the soil temperature about 10°C, polyurethane or polystyrene board
(20–50 mm thickness) can use vertically around the entire perimeter to a depth of 0.6 m
(Bartok, 2001).
3.6 Indoor Climate Control
The temperature, humidity and carbon dioxide are the central parameter that can affect
the indoor atmosphere of a greenhouse. In line with this, ventilation is a significant factor
for a greenhouse that influences crop production with good yield and quality. Practically,
ventilation controls the exchange of carbon dioxide and oxygen as well as heat,
temperature and humidity inside the greenhouse.
In general, this can be achieved naturally by opening ventilators at side walls, gables ridge
or roof area. On the other hand, using fans can be used as forced ventilation, however,
this would be additional electricity consumption.
Moreover, the characteristics of ventilation techniques differ from climate elements and
conditions. Since in cold climates, high heat loss occurs during the heating season,
therefore, dehumidification methods such as heat exchanger, chilled water condensation,
chemical dehumidification, and mechanical dehumidification methods are generally used
for commercial production. Among them, the mechanical dehumidification method is the
most cost-effective and energy-efficient (Gao, 2011).

Apart from this, while the major concern is to reduce energy consumption and maximise
the use of renewables, solar roof ventilation fan could be an option to circulate air inside
the greenhouse. Consecutively, commercially available ventilation technology referred as
mechanical heating, ventilation, and air conditioning (HVAC) design could be a suitable
selection considering the efficiency.
3.7 Heating Systems
Greenhouses may have active or passive mode heating systems. A combination of both
can be offered for better efficiency. When the supply of heat is generated from external
sources to increase indoor temperature, it is referred to as active mode. On the other hand,
in passive mode, the solar energy is used to heating the greenhouse by storing the heat in
heat storage materials such as water, rock bed, and phase change material (PCM).
Depending on climate conditions, passive and active heating modes are applicable in
greenhouses, whereas passive heating systems are suitable for small greenhouses located
in moderate climates, and in high northern latitudes the active mode of the heating system
is usually used for commercial greenhouses (Sethi and Sharma, 2008).
Under the active mode heating system, water heating, air heating and long-wave radiation
heating is most prominent. However, air heating required additional electrical energy.
Moreover, a combination of the heating pipe and the air heater also can use for optimal
control of air temperature and relative humidity, but in this case, the energy consumption
could be increased by 19% (Bartzanas et al., 2005).
On the other hand, waste heat, geothermal energy and wood biomass can be used as the
source of energy that needs for greenhouses, whereas solar photovoltaics is a suitable
option for producing electricity to operate other apparatus as well as heating. Although
geothermally heated greenhouses can reduce production cost, in alone this technology is
not very common due to high initial cost, complicated maintenance and exploitation
(D’Arpa et al., 2016).
An example of an energy-efficient heating system could be what Emmi et al. (2015)
simulated for the cold climate. In this process, the solar energy is transported from the
roof to storage, and this energy can be conserved in the ground as well.

Figure 5. An example of ground source heat pump associated by solar. Adapted from
Emmi et al.(2015)
As seen in Figure 5, this system works such a way that, in absence of solar radiation, the
heat pump works using the storage tank coupled with borehole heat exchangers. On the
other hand, pumps no. 4 and 5 begin working when the building requires heating.
Moreover, heat pump no. 3 begins operation when no heating is required, and the ground
loop works when there is a minimum amount of solar radiation.

4 ENERGY BALANCE IN GREENHOUSES
4.1 Energy Use in Greenhouse
As stated earlier, thermal energy sources need to keep the temperature and humidity
favourable to the crops. Additionally, electricity requires to drive different equipment and
artificial lights, which are essential to extend growing seasons, especially for the northern
microclimate.
Research outcome shows that air temperature, solar radiation and relative humidity
factors are accounts for up to 40% of the total production cost, while temperature alone
accounts for 50% higher energy cost in the North European countries (Maslak, 2013;
Shen et al., 2018).
Besides these, greenhouse location, orientation, design and crops selections influence
energy consumption as well (Maslak and Nimmermark, 2014). Moreover, as seen in the
previous chapter, outdoor air temperature, solar radiation, air humidity, precipitation and
wind speed, all these factors differ with location. Additionally, north-south or east-west
orientation also influence the requirement of energy.
Apart from these, size and shape, covering material, and condensation can reduce the heat
loss in a greenhouse, and increase the potentiality of receiving higher solar radiation.
Experiment shows, plant species require different temperature and humidity set points,
and different ranges of light wavelength in the greenhouse air. Therefore, various amounts
of energy required to provide a proper indoor climate (Nimmermark and Maslak, 2015).

Figure 6. Heat exchange scenario in a greenhouse. Modified from Maslak (2013)
As seen in Figure 6, thermal energy transports in three different way such as conduction,
convection and radiation. These can happen alone or combined, while convection
happens between the indoor and different components, like the cover, plants, and floor
and through the pipes, and between the external cover surfaces.
On the other hand, diffuse thermal radiation comes from the shield surface, floor, plants
and the heating system as well.
Here, in the figure, heat generates from heating system (EH), and solar radiation (ES) as
well, while heat lost through ventilation (EV), air leakage (EL) and transfers through the
cover (EC). Additionally, heat also stored in the soil, cover surface and other greenhouse
components (EST). All these heating related issues can summaries using the energy
conservation law. The energy balance equation can be written as follows (Fernández and
Bailey, 1992) :

EH + ES – EV – EL – EC – EST = 0
In that sense, to secure an energy-efficient environment, it is much needed to reduce the
total energy losses, otherwise, additional energy will be needed to supplement.
In a greenhouse, oil, gas or coal can be used as heating sources. Biofuel or solar energy
also can use considering environmental and economic factors (Marucci and Cappuccini,
2016)). Solar-assisted geothermal heat pump with a small wind turbine could be other
options (Esen and Yuksel, 2013). Additionally, a heating system can be developed using
solar energy, heat pump and cogeneration (Garcı́a et al., 1998). However, energy
consumptions are varied in different regions, which can be seen in the following Table.
Table 2. Annual energy needs per unit greenhouse area at different location
Location Electric load Energy
demand
(kWh m−2
Year−1)
References
Northern
Europe
Maximum energy
consumption is for
ventilation, heating or
cooling and lighting
2–7 (Emmott et al., 2015,
Li et al., 2018)
Spain Maximum energy
consumption is for
irrigation
7 (Rocamora and
Tripanagnostopoulos,
2006)
Mediterranean Maximum energy
consumption is for
heating, cooling and
ventilation
2–9 (Campiotti et al., 2008)
Greece Maximum energy
consumption is for
ventilation, cooling and
lighting
20 (Souliotis,
Tripanagnostopoulos
and Kavga, 2006)
China Maximum energy
consumption is for
ventilation and cooling
30 (Wang et al., 2017)
As seen in Table 2, the average electricity required per square metre in North Europe is
less than that of China and Greece. However, 85 percent energy uses for heating, and it
is responsible for the second largest cost after labour cost (Runkle and Both, 2011).
Therefore, it is expected that, if all the key performance indexes (KPI) such as cover or
glazing materials with higher transparency and higher diffusive radiation; adequate
insulation, and anti-condensation chosen effectively, it can ensure energy efficiency in a
greenhouse (Castilla, 2013, Papadakis et al., 2000).

4.2 Energy Needs for Different Cultivars
As stated earlier, the energy requirements for different crops vary with the climate
condition of a specific location. Yildirim and Bilir (2017) studied the energy needs for
tomato, cucumber and lettuce cultivation in a greenhouse (Area 150 m2 and height 2.5
m2) under the weather condition of Izmir (38° 25' 25.4388'' N) in Turkey. The average
temperature of the area was about 17 °C. Additionally, indoor temperature needs for
tomato, cucumber and lettuce are 20 °C, 26 °C and 14 °C respectively. The analysis shows
that energy requirement varies month to month due to solar radiation and other weather
factors. For instance, as seen in Table 1, lettuce needs more energy than cucumber, and
cucumber needs more to tomato.
Table 3. Electricity demand for tomato, cucumber and lettuce in the greenhouse with a
150 m2 area (Yildirim and Bilir, 2017)
Electricity demand (heating, cooling and lighting) (kWh)
Tomato Cucumber Lettuce
ANNUAL 22475,80 24794,00 20593,00
Figure 7. Annual electricity demand scenario according to the data table 3.
On the other hand, Gołaszewski et al. (2012) evaluated the energy needs in Germany to
produce tomato and cucumber, which are 12654 and 13053 GJ per hectare respectively,
whereas in Greece specific energy input for the same crops is 257 and 285 GJ per hectare.
Compared to Finland, Germany receives slightly higher solar radiation and climate
condition also likely similar. Considering these factors, Germany can be used as a
reference to compare the greenhouses in Finland. The energy demand in Germany shown
0 5 10 15 20 25 30
Tomato
Cucumber
Lettuce
Thousands (kWh)
Annual Energy Demand

in Figure 7, where the energy unit was used in kWh and area measures equal to the
Turkish greenhouse.
Figure 8. Annual electricity demand in Germany for cucumber and tomato.
Comparing the above scenarios, a significant difference in the yield from the same
greenhouse, the energy input in Germany amounted to two-fold higher than in Turkey.
As an instance, in Germany energy needed for tomato and cucumber for per square meter
is about 351.50 kWh and 362.58 kWh respectively, whereas in Turkey it was 149.83 and
165.29 kWh. On the other hand, it is seen that the Canadian Prairies weather which is
nearly exact as Oulu, needs 402.22 kWh/m2 and 460.27 kWh/m2 heats for tomato and
cucumber production.
52 52 53 53 54 54 55 55
Tomato
Cucumber
Thousands (kWh)
Annual energy demand

5 BEST PRACTICES IN ENERGY EFFICIENT
GREENHOUSES
5.1 Energy Efficient Lighting
The European Union has started to reform the energy policy to ensure energy renewability
and energy saving (EUR-Lex, 2014), while the better efficiency of the electric bulb can
show a way. Montoya et al. (2017) stated that approximately 20% of the total energy
consumption accounts for lighting to illuminate indoor and outdoor spaces, whereas
approximately 18% of energy consumes in the EU for only lighting purpose.
Additionally, energy efficiency has a relation with the life span, environmental load and
cost of the lighting system. Furthermore, it is equally important to reduce the CO2
emissions to the atmosphere (Danila and Lucache, 2016).
Since, the energy efficiency of a greenhouse related to various factors, while adequate
light is a prime concern. Because, plants’ growth in greenhouses significantly influenced
by the lighting quality, especially the ranges of spectrums (Li and Kubota, 2013). In line
with this perspective, it is significantly vital to know how much light needs for plants
healthy growth. In general, the amount of active radiation needed for the photosynthesis
of a plant is determined by the daily light integral (DLI) measurement. The unit of DLI is
moles of light (mol) per square meter (m-2) per day (d-1), or: mol·m-2·d-1 (moles per day).
In northern latitude, during the winter seasons, DLI values are between 1 to 5 mol·m-2·d-
1, due to shading from greenhouse glazing, structures, and hanging baskets (Torres et al.,
2010). However, most greenhouse plants need 15 mol·m-2·d-1. Moreover, it is needed to
calculate how much light loss or fail to receive due to a greenhouse structure. On the other
hand, the requirements of DLI varies with the species of plant.
Table 4. DLI Requirements for tomato, lettuce and cucumber (MechaTronix
Horticulture Lighting, 2018)
Plant Min
(mol·m-2·d-1)
Max
(mol·m-2·d-1)
Typical (mol·m-2·d-
1)
Tomato 15 21 16
Lettuce 9 17 9
Cucumber 9 17 13

As mentioned in Table 4, tomato required higher average DLI than lettuce and cucumber.
Therefore, while measuring the DLI for the whole day, it should be kept in consideration
what weather condition is, and what types of additional lighting are there in a greenhouse.
For example, in summer the average DLI is around 65 mol.m-2 d-1, while in a cloudy
winter day, the amount is around 1 mol.m-2 d-1 (Mattson, no date). So, for the second case,
additional lighting is needed to maintain a normal growth environment for plants.
In Finland, supplemental lighting needs for cucumber and tomato are around 26 mol.m-2
d-1 to 37 mol.m-2 d-1, and 5 to 8 moles are added between the plant rows. On the other
hand, 13 mol.m-2 d-1 lightings used for lettuces cultivation. These intensities can ensure
by providing 18 to 22 hours of lighting a day for winter days. Moreover, as in spring, the
sun provides more radiation. Therefore, the lighting requirement is lower. On an average
day in March, the solar radiation is about 17 moles per square metre and in June 40 moles
(Kaukoranta, 2017).
On the other hand, for small plants, to produce 150 to 160 moles per square metre, 90 to
100 watts per square metre high-pressure sodium (HPS) lamps are required. Meanwhile,
large plants require 220 to 300 watts per square metre. However, light emitting diodes
(LED) needs 30 to 50 percent lower electricity compared to HPS.
5.1.1 Different Energy-Saving Lighting Options
For greenhouse farming, additional lighting is most beneficial where the average daily
sunshine is less than 4.5 hours, typically in high northern or southern latitudes and
overcast weather.
In the earlier years, the HPS lamps were the first choice for indoor farming, while the
level of light required for the plant and the heat output produced is relatively suitable for
the growth. However, in the recent years, LED technology achieves huge progress and
now its efficiency is better than HPS luminaires (Kaukoranta et al., 2017).
Although, the light spectrum of HPS bulb is almost entirely within the PAR range, only
about 30% of electrical power turns into PAR light. Additionally, the HPS bulb has a
surface temperature of about 350 to 400 °C, and the lamp shell temperature extends 60 to
80 °C. On the other hand, the radiation produced by LED lamps is also entirely within the
PAR area. However, a small part can be deliberately in the area of the far-red or even in
the UV region. In addition to these, there is no infrared radiation in the light produced by
the LEDs. Apart from HPS and LEDs lamp, few other lighting options are analysed to
evaluate their advantages and disadvantages.
Fluorescent Grow Light (FLs)
In greenhouses, fluorescent grow lights are used for herbs and vegetables cultivation.
Typically, two types of fluorescent lights are considered in cultivation purpose; (i)
fluorescent tubes and, (ii) compact Fluorescent Lights (CFLs), whereas they have also
different intensities.
Although fluorescent bulbs are relatively lighter, the weight of the ballast and the stands
that hold the tubes make this whole system a bit heavier. Moreover, despite better energy
efficiency and longer bulb life, these lights are not a good option for supplemental lighting
considering the shading effect (Mattson, 2010). In addition to this, the light quality may
cause the flowering delay in some crops. However, under a combination with a more
extended period of natural lighting and a shorter period of fluorescent lighting resulted in
considerably faster generative development of vetch plants (Sysoeva et al., 2010).
Additionally, the operational lifetime of fluorescent bulbs is in the order of 20,000 hours
while only 1000 hours are for incandescent bulbs (Dutta Gupta and Agarwal, 2017). On
the other hand, as the fluorescent bulb contains mercury, inappropriate disposal could be
harmful to the environment.
High Intensity Discharge Grow Lamp (HIDs)
HID lamps are electrical gas-discharge lamps produce high-intensity light through an
electric arc. In general, these types of lamps are used for hydroponic or other forms of
indoor gardening.
Although in the earlier designs, mercury gas was used in this lamp, while currently
radioactive gases such krypton-85 are more commonly used and have the same effect as
earlier. There are two types of HID grow lights; (i) High Pressure Sodium (HPS) and, (ii)
Metal Halide (MH). Due to the intensity of the UV rays, it was common as a grow light,
but the high installation cost is a matter. Moreover, HPS lamps operate at high
temperature (≥200 °C). As a results significant radiant heat emits in the direct

environment. Although in cold climate additional heat is required in a greenhouse, but it
affects plants growth negatively when the lights are placed close to plants. Therefore,
lamps should place more than 2 metre height on the plant.
Figure 9. An illustration of high intensity discharge grow light. Figure adapted from
Just4Growers (2018)
HID lamps can choose as supplemental light in greenhouse considering the higher light
output and a little shading. Two types of HID are considered for lighting purpose, e.g.,
high-pressure sodium (HPS) with yellow/orange colour and metal halide (MH) with the
bluish look. Categorically life span differs with types of HID, whereas MH has 20,000
hours, and around 30,000 hours for HPS. Hence, the high installation cost for HID is a
significant factor for the overall cost measurement. A new HID lamps produce far more
usable light than fluorescent or incandescent lamps. However, after a 10,000 burning
hours, the HID lamps capacity began to decline gradually (Greenhouse Management,
2018).
Light Emitting Diodes (LED)
LEDs are small solid-state electroluminescent light which are consists of chips (light-
emitting semiconductor material), a lead frame and encapsulation which protects the die
as seen in Figure 10. These types of lights can generate broad-band (white) light or
narrow-spectrum (coloured) wavelengths specific to desired plants response (Nanya et
al., 2012). On the other hand, the heat that generates from the lamp can pass through the
active heat sink. That is why there is no obstacle to place a LED light close to the plant.

Figure 10. The basic structure of LED light. Illustration adapted from Singh et al.
(2015)
Moreover, LED light can reduce around 70% energy consumption compared to the
traditional light. Additionally, longer lifetime and compact size are the other significant
technical advantages over the traditional light sources (Gioia D. et al., 2008).
Therefore, considering the energy efficiency and favourable spectrum for plant growth,
LED light is the better options for supplemental lighting in greenhouses. Additionally,
long lifespan in the colder climate (25,000-50,000 hour), make it as a good supplement
for solar radiation. (Närpes, 2018)
According to Nelson and Bugbee (2014), the efficacy of LED lamps and HPS have similar
fixtures. Due to this, HPS fixtures are five to ten times cheaper than LED fixtures. In line
with the economic aspect, for a long term uses LED fixtures are more economically viable
as capital investment decreases with time and increases the efficacy. Conversely, an
incandescent lamp converts less than 5% of its input electrical energy into light, whereas
LEDs can turn 100% electrical power into optical power (Gayral, 2017).
5.1.2 Light spectrum vs plants need
Plants need proper light for photosynthesis and plant growth, however, they do not utilise
all light spectrum. Infrared, red and blue rations of the incident spectrum play an essential
role in plants’ growth, whereas the green and yellow reflect or transmits in the

photosynthetic process. Specifically, red light stimulated reproduction, blue for optimum
growth and orange ensure plants health.
Generally, the ranges of wavelength that plants required are between 400 to 700-
nanometer (nm) for photosynthesis (Brown, 2006), while different colour represent
different wavelength. For example, 400–520 nm wavelength contains violet, blue and
green bands, which are responsible for vegetative growth and photosynthesis. On the
other hand, 520–610 nm contains green, yellow and orange bands, which have less
influence on plant growth and photosynthesis. Moreover, 610–720 nm wavelength
contains red bands, and a large amount of absorption occurs at this range. The vegetative
growth, photosynthesis, flowering are the effect of this band. 720–740 nm wavelength
contain far-red, which is responsible for the growth of leaves located lower on the plants
(Danila, 2015; Mitchell and Stutte, 2016).
Since, plants need different ranges wavelength for their growth, similarly, different types
of the lamp also able to provide different light spectrum. Depends on their capability,
suitable lams are picked for indoor farming.
Table 5. Various lamps and corresponding spectral output with luminous efficiency
(Dutta Gupta and Agarwal, 2017).
Lamps type Spectral output Colour Luminous
efficiency(lm/W)
Fluorescent Broad spectrum Green 100-120
HPS Broad spectrum Red and
Orange
80-125
MH Broad spectrum Blueish 100-120
LED Specific wavelength Adjustable 80-150
As seen in table 5, LEDs have wide ranges spectral output considered with fluorescent,
HPS and MH. Moreover, in terms of lamp cost as well as energy cost with lifespan, the
LED’s are economically viable options which can seen seen in table 6.
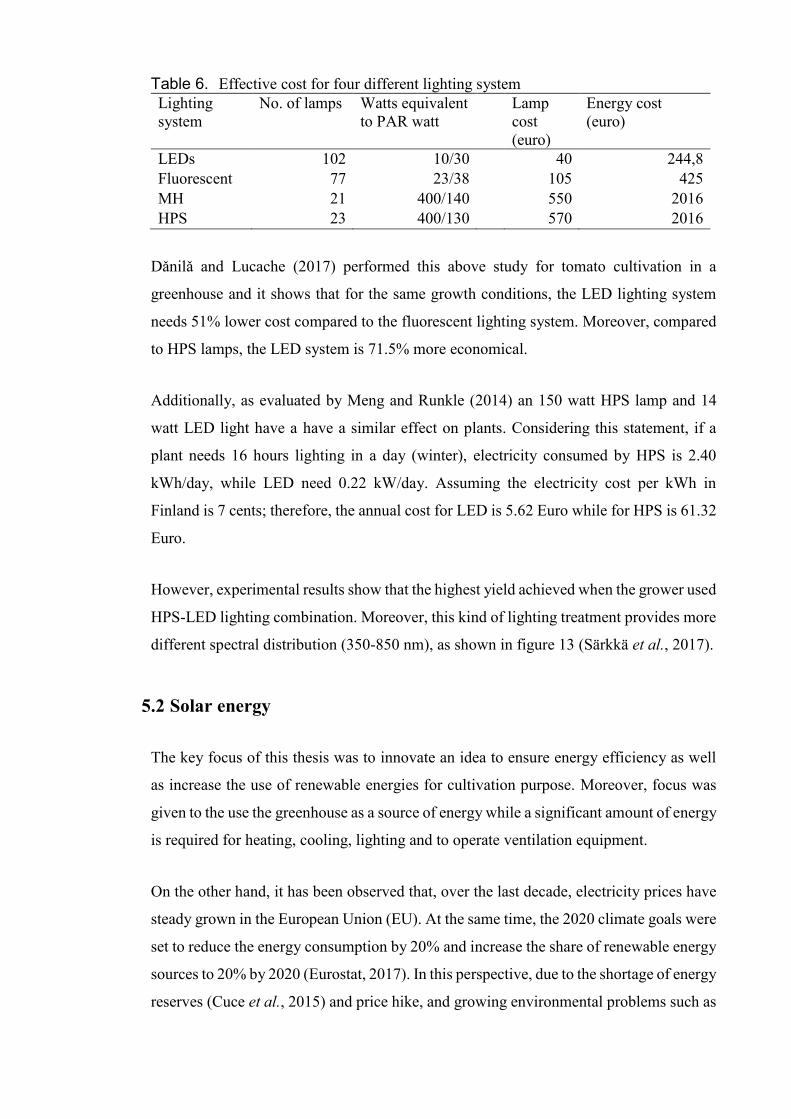
Table 6. Effective cost for four different lighting system
Lighting
system
No. of lamps Watts equivalent
to PAR watt
Lamp
cost
(euro)
Energy cost
(euro)
LEDs 102 10/30
40 244,8
Fluorescent 77 23/38
105 425
MH 21 400/140
550 2016
HPS 23 400/130
570 2016
Dǎnilǎ and Lucache (2017) performed this above study for tomato cultivation in a
greenhouse and it shows that for the same growth conditions, the LED lighting system
needs 51% lower cost compared to the fluorescent lighting system. Moreover, compared
to HPS lamps, the LED system is 71.5% more economical.
Additionally, as evaluated by Meng and Runkle (2014) an 150 watt HPS lamp and 14
watt LED light have a have a similar effect on plants. Considering this statement, if a
plant needs 16 hours lighting in a day (winter), electricity consumed by HPS is 2.40
kWh/day, while LED need 0.22 kW/day. Assuming the electricity cost per kWh in
Finland is 7 cents; therefore, the annual cost for LED is 5.62 Euro while for HPS is 61.32
Euro.
However, experimental results show that the highest yield achieved when the grower used
HPS-LED lighting combination. Moreover, this kind of lighting treatment provides more
different spectral distribution (350-850 nm), as shown in figure 13 (Särkkä et al., 2017).
5.2 Solar energy
The key focus of this thesis was to innovate an idea to ensure energy efficiency as well
as increase the use of renewable energies for cultivation purpose. Moreover, focus was
given to the use the greenhouse as a source of energy while a significant amount of energy
is required for heating, cooling, lighting and to operate ventilation equipment.
On the other hand, it has been observed that, over the last decade, electricity prices have
steady grown in the European Union (EU). At the same time, the 2020 climate goals were
set to reduce the energy consumption by 20% and increase the share of renewable energy
sources to 20% by 2020 (Eurostat, 2017). In this perspective, due to the shortage of energy
reserves (Cuce et al., 2015) and price hike, and growing environmental problems such as

GHGs emission, global warming and climate change (Cuce, 2013) nowadays energy
saving has become more than significant.
recent forecast report by International Energy Agency (IEA) stated that, in the next 6
years, the solar PV expected to achieve 575 GW of capacity, while utility-scale projects
represent 55% of this growth (IEA, 2018b). On the other hand, another report stated that
1081 GW energy would come from PV technologies by 2030 (Tyagi et al., 2013).
Moreover, in terms of cost and efficiency, enormous progress has been made in this field
and PV technologies will be more affordable and cheap in the upcoming years (World
Energy Council, 2016).
In all these aspects, among the other renewable energy sources and energy saving options,
solar energy can consider as an alternative for future energy demand.
5.2.1 Photovoltaics
The term photovoltaics refers to devices that generate electricity directly from sunlight.
In other words, due to the photovoltaic effect on semiconductors, incident lights are
converted into electrical power. In solar cells, pn (or p–i–n) junction semiconductor is
used to absorb photons and generate free electrons through the PV effect (figure 14).
Several unique semiconductor materials are used to construct solar panels that show
different characteristics. Depending on these characteristics, a photovoltaic system can
vary from silicon, polycrystalline thin films, or single-crystalline thin films.
Figure 11. A simple illustration of PV solar cells mechanism. Adapted from
Alternative Energy Tutorial (2018)
A solar system needs solar cells, a charge controller, an inverter, an AC power distribution
cabinet. Additionally, there may have an automatic solar tracking system and an
automatic dust or snow removal system.

Depends on the operation, a solar PV system can be independent, grid-connected or
distributed PV system. In general, independent systems are known as off-grid PV
systems, which are consists of solar modules, controller, battery and an AC inverter. On
the other hand, grid-connected PV systems are directly connected to the public grid.
5.2.2 Traditional Solar PV
During half of the last century, crystalline silicon base PV dominated the market, due to
its availability, no-toxicity, long lifetime and sustainability as well. Additionally, in the
early of 1980s, polycrystalline (also referred as multi-crystalline) silicon cells developed
as an alternative to the monocrystalline silicon cells.
Depending on this progress, photovoltaic cells can be mainly divided into wafer-based
(1st generation PV) and thin-film cells (2nd generation PV) category. In the first category
belong crystalline silicon (c-Si) cells (both mono and polycrystalline). Nearly 90% of the
solar markets rely on crystalline silicon. Meanwhile, thin film amorphous silicon (a-Si)
and amorphous and microcrystalline silicon (a-Si/μc-Si) are considered as second
generation development (Płaczek-Popko, 2017). The complete PV chart shown in the
following figure 15.
Additionally, cadmium telluride (CdTe), and selenium, indium, gallium and copper made
semiconductor also consider in the same second generation category. However, the third
generation (mainly organic) PV technology has already entered the solar cell market
(Płaczek-Popko, 2017), but their efficiency is not as good as that of the first and second
generations.
As stated earlier, in the present market most of the traditional PV modules are made of
silicon, whereas higher efficiency and longer lifetime make polycrystalline silicon cell as
the most attractive. The developments in material use, design, technologies, and achieved
the efficiency of PV energy make this sector most potential for the coming future
(Sampaio and González, 2017).

Figure 12. PV materials chart and category. Adapted from Tyagi et al., (2013)
On the other hand, transparent and semi-transparent photovoltaics are in developing
phase. However, a few applications have already started with reasonable efficiency;
nevertheless, have lower efficiency than silicon based solar panels. Researches have been
conducting to improve their efficiency. A complete PV materials flowchart can be seen
in figure 12.
5.2.3 Transparent Solar PV
A greenhouse could be an energy source itself if the glazing materials or covering
materials can replace by solar PV, which allows solar radiation without any damage. For
example, plants do not need all wavelengths that radiate through the sun. They need 400-
700 nm wavelengths visible light to grow. However, about half of the light that comes
from the sun is infrared. Therefore, the greenhouse needs such a solar panel that will
comply with these necessities.
To fulfil this need, transparent solar photovoltaics (TPV) could be the best candidate.
Furthermore, transparent or semi-transparent PV can consider as a functional part of the
envelope structure as well. Additionally, it will reduce the investment cost for glazing
materials as solar panels will work like a cover. Moreover, extra spaces will not need to
install the solar PV system.
Recently, Liu et al.(2019) innovate transparent organic photovoltaics that utilises the
visible light for plant growth and the IR light for power generation. In fact, this innovation
is still in laboratory level, but it can be a simple, low-cost, and promising way to utilise
the IR light for electricity generation, and the penetrated visible light for photosynthesis

in plants. About the power-conversion efficiency of this transparent organic photovoltaics
(TOPV), it has an efficiency of ∼10% with an average visible transmittance of 34%.
Moreover, plants grown under this TOPVs has a similar yield such those under over
natural sunlight. Before this innovation, MIT researcher innovates a transparent solar cell
that can transmit more than 70% of the visible light, however, their power-conversion
efficiency was about 2% (Lunt and Bulovic, 2013).
Considering the cost and efficiency and commercially available technology, instead of
TOPV semi-transparent solar PV (STPV) can consider for greenhouses. In recent years,
the semi-transparent perovskite solar cells have shown tremendous progress in terms of
the high efficiency, secure processing and low cost. Till now they have achieved a power
conversion efficiency up to 20.1%, while sputtered transparent conductive oxides (TCO)
have been reported with the highest efficiency of up to 12.1% (Fu et al., 2015).
However, thin film photovoltaics (TFPV) use has started in a small scale in greenhouses
at different locations. In 2015, Canada based PV solution provider Soliculture innovated
a LUMO solar panel, which contains a low density of silicon PV, which absorbs green
light and converts it to red light, enhancing light quality for plant growth (Soliculture,
2016).
5.2.4 PV Modules in Market
Conventional solar photovoltaic panels absorb sunlight and convert photons into usable
energy, whereas in case of the transparent solar panel the sunlight passes through the
transparent material. That means no visible light is absorbed which can generate
electricity. As stated earlier, to generate energy using photons, the transparent or semi-
transparent solar cells only absorbed infrared radiation, which is reflected in their
efficiency.
Depending on cells size, there are different capacities of PV modules in the present
market. On the other hand, the panel’s efficiency quantifies the ability to convert solar
radiation into electricity. In the present market, American SunPower module has achieved
record 22.70% efficiency, while LG (21.1%), Panasonic (20.3%), Solartech Universal
(20.2%) and Silfab (20.0%) are the other best panels (Energysaga, 2019).

While the concern is to increase the cell efficiency of a transparent solar panel, a German
Company, Heliatek GmbH, has introduced partially transparent solar panel with an
efficiency of 7.2%. These panels absorb 60% of the sunlight they receive. The efficiency
of a fully transparent solar panel that is available in the market is about 5% (Greenmatch,
2019). Moreover, few other present PV market leader company such as Prism Solar, DSM
Advanced Surfaces, Topray Solar and Sunshine Solar introduced clear glass panels.
However, the available clear glass panels in the market still not achieve the standard that
they can be incorporated into the building envelope.
Japan-based Pilkington designed semi-transparent panels that can integrate into the
building without changing the aesthetics and performances. Its ‘optiwhite’ brand has the
light transmittance capacity for 3mm thickness glass is about 91.6% and solar direct
transmittance 91.1% (Pilkington, 2018). Greek/US based nanomaterials company Brite
established a smart glass which can be installed in single pane configurations have 5-6
times better thermal conductivity than standard glass (Brite, 2019).
There are many more PV module options that can use in a greenhouse instead of covering
materials. Nevertheless, the key focus of this thesis work was not only to generate energy
but an energy-efficient greenhouse, which will not hamper plants growth. Meanwhile, for
the studied case, it was kept in mind that the aesthetic architecture of the greenhouse
remains unchanged. Due to these necessities, traditional rooftop solar panels could be a
solution that can generate energy for the reference greenhouse.
5.3 Solar Thermal Energy
Heat is the largest energy end‑use while around 50% of total heat energy consumed in
industry and another 46% used for space and water heating and cooking in the building
sector. However, the latest heat production statistics from renewable sources shows a poor
growth. In 2017. Only 10% of the heat produced from renewable sources. According to
IEA report, in the next six years, renewable heat consumption is expected to grow 20%,
while two-thirds of heat growth is expected to take place in China, the European Union,
India, and the United States. Although renewable heat energy has a positive development,
a few countries have policies for this sector (IEA, 2018c).

As the heat energy demand is increasing, among the other technologies, solar thermal is
receiving more attention in the recent years. According to the IEA report, in 2017, the
global solar thermal capacity reached 472 GWth, which is 20% higher than the total
installed solar PV capacity in power generation. It is expected that only the building sector
will consume 40% to 46% Mtoe more solar thermal energy by 2023. By now, China is
dominating in this sector in terms of uses and consumption.
5.3.1 Solar Heat Collector
The core difference between solar PV and solar thermal is, solar PV collects sun radiation
and convert it into electricity, whereas, solar thermal uses sunlight to heat a fluid. The
heated fluid or water can use heating purpose of a greenhouse or building spaces.
Moreover, domestic uses of water can be heated using thermal systems.
The energy conversion takes place on the range of temperatures at which the working
fluid is being heated. At low and medium temperature collectors can be flat plate panels
or evacuated tubes, whereas high-temperature collectors consist of concentrated solar
systems, such as parabolic trough, Fresnel reflectors, dish Stirling and solar towers
(Greenmatch, 2018).
A new technology of solar heat and solar electricity is penetrated in the market, known
as PV-thermal (PVT) that allows working combinedly as a solar PV and solar thermal
collector. Advantages of this technology are they work as a team combined on a roof and
produce both types of solar energy in one collector.
Figure 13. Diagram of a PVT cogeneration heating system. Adapted from Liang et al.
(2015)

As seen in Figure 13, the PVT operates in such a way that it fulfills certain needs. For
example, during sunny winter daytime, PVT absorbs solar radiation and heat the cold
water at a fixed temperature. Hot water used for heating the floor coils and then enters
the storage tank. Meanwhile, during the night or cloudy days, the collector stops working,
and the heat storage tank directly supplies indoor heating. On the other hand, when the
water temperature cannot meet the heating need, the electric heater is able to turn on to
supplement heat. Additionally, during non-heating seasons, PVT collector stores the heat
energy converted from the collected solar radiation in the heat storage tank.
PVT technology could be good candidates for district heating system and large scaled
greenhouses as it uses 15% to 20% of solar energy for electricity and the rest of the
irradiation to heat water or air.
Moreover, based on characteristics and uses, Kalogirou (2003) separated the solar heat
collectors as follows in Table 7:
Table 7. A comprehensive list of the solar heat collectors (Kalogirou, 2003)
Motion Collector type Absorber
type
Concentration
ratio
Indicative
temperature
range (°C)
Stationary Flat plate collector
(FPC) Flat 1 30–80
Evacuated tube
collector (ETC) Flat 1 50–200
Compound
parabolic collector
(CPC)
Tubular 1–5 60–240
Single-axis
tracking 5–15 60–300
Linear Fresnel
reflector (LFR) Tubular 10–40 60–250
Parabolic trough
collector (PTC) Tubular 15–45 60–300
Cylindrical trough
collector (CTC) Tubular 10–50 60–300
Parabolic dish
reflector (PDR) Point 100–1000 100–500
Two-axes
tracking
Heliostat field
collector (HFC) Point 100–1500 150–2000
Solar thermal systems may also have a storage system that stores heat during the day, and
used in the evening or during cloudy weather. Moreover, the system could be a hybrid
that use natural gas or other fuels to fulfill the energy needs from the sun during periods

of low solar radiation (EIA, 2018). Additionally, a solar thermal system can also be
coupled with heat pumps to cover for the heating demand that is not provided by the solar
system. Storage applications, such as underground pits, thermochemical storage or
boreholes, can be considered to provide district heat.
Depending on technology, at present evacuated tube collectors are dominating in the
market (73.8%). Meanwhile, the flat-plate collectors have a market share is about 22%,
unglazed water 4%, and with 0.2% market share, glazed and unglazed air collectors are
also in the market competition (IEA SHC, 2018).
5.4 Geothermal Energy
The energy derived from the earth is referred to as geothermal energy. The core idea of
the geothermal energy is, a vast amount of radioactive elements are inside the earth, and
they release heat at a very high temperature depending on the distance from the surface.
The estimated temperature in the earth's core is about 5000 °C (figure 18), and the outer
core is about 4000 °C, which is similar to the temperature of the solar surface.
At present, a limited number of countries are using geothermal energy to heat production,
while China, United States of America, Turkey, Sweden and Iceland are the top five
countries in this sector (World Energy Council, 2016). Around 80% of geothermal energy
is consumed by these countries. According to the IEA report, over the outlook period
(2018-23), growth is expected to be lower at 24%. However, in 2017, nine plants start in
France, Italy and the Netherlands with 75 MWth of capacity.
Although most geothermal heat is used for heating water (45%) and spaces (34%),
geothermal energy also has demand in greenhouses in some countries. Moreover, due to
strong policy support, the Netherlands has expanded its use in the agriculture sector after
China, Turkey and Japan (IEA, 2018c).
A Dutch company made a geothermal heat-based greenhouse model, and they have now
acquired energy from 1600-2800 m depth of the earth. It has estimated that the model can
generate temperature ranges from 60-90 oC geothermal heat and the flow rate is about
100-220 m3/h and generation capacity is about 4.5-10 MWth. Additionally, the initial
investment is about 7-13 million euro varying from the capacity.

On the other hand, in Finland, the annual average ground temperature at the surface
ranges from +5 ºC (south) to +2 ºC in the northern parts. Moreover, in Finland, depending
on the surface conditions, several meters of near surface ground freezes in winter. So, the
seasonal variation should be kept in consideration. It has estimated that the maximum
temperature at 500 m below the surface is 14 ºC, while to get the 40 ºC temperature in
Finland, need to drill 1-1.4 km inside the surface. Meanwhile, in order to reach 100 ºC,
boring up to 6 to 8 km inside the earth’s surface is required (Kukkonen, 2000). However,
recently, Finland has planned to start a project of acquiring geothermal heat from seven
to eight kilometres deep at Nekala in Tampere for the local district heating system
(Richter, 2019).
Geothermal energy requires very little space, and there is no noise disturbance for its
surroundings. Also, a valid option and the costs of energy will be stable and predictable
for a more extended period.
5.5 Energy Storage
Supply and demand are the crucial real-time factors that have to be balanced in an energy
system. On the other hand, due to weather conditions, renewable energy production is not
the same in between a year. Therefore, backup energy is required to meet the maximum
demand when there is energy shortage, and that can achieve by a wide ranges of storage
technologies in the current market.
In this section, energy storage technology, especially thermal energy storage (TES)
innovations will be discussed in detail. TES can be divided into different categories:
sensible, latent and thermochemical storage.
Due to technological differences and characteristics, sensible heat storage also has
categories such as tank thermal energy storage (TTES), pit thermal energy storage
(PTES), borehole thermal energy storage (BTES), aquifer thermal energy storage (ATES)
thermal energy storage, and electric storage heaters. On the other hand, different types of
phase change materials (PCM) are in latent heat storage. Meanwhile, thermochemical
heat storage (THS) uses reversible chemical reactions to store large heat in a compact
volume. Additionally, all these techniques have different applications while PTES is most
suitable at a large scale, PCM for domestic and commercial buildings (IEA, 2014).

Table 8. Different applications of thermal energy storage and their efficiency. Data
were compiled from EIA (2014) and Department for Business, Energy and
Industrial Strategy, UK (2016) report.
As seen in Table 8, ‘D’ stands for domestic, ‘DH’ for district heating, and ‘C’ stands for
commercial applications. From this table, it can assume that different storage solution has
specific applications, and these can be varied in their efficiencies. While the
thermochemical heat storage system has the highest efficiency (up to 100%), borehole
thermal heat storage is lower (6-54%). However, the efficiency of a BTES system
increases with upscale operation level and size of the system.
5.5.1 Sensible Heat Storage System
According to EIA (2014) and Department for Business, Energy and Industrial Strategy,
UK (2016), the sensible heat storage system is the most commercially used thermal
energy storage system. Notably, in this system, energy stored or extracted in a solid or
liquid, and that changes the temperature without changing its phase and no chemical
reaction takes place either.
Liquids such as water, heat transfer oils and types of molten salts are the materials used
for sensible heat storage. Moreover, solids such as concrete, pebbles, granite, rocks, earth
also use as materials source. For heat changing process, higher temperature source is
added to the store, and then this heat is extracted to a lower temperature sink.
Type Energy uses Key application
areas
Efficiency
TTES Solar thermal, boilers, CHP,
heat pumps, biomass
D / C / DH 50-90%
PTES Larger solar thermal
installations
C / DH Up to 80%
BTES Solar thermal, ground source
heat pump, CHP, gas turbines,
waste heat
D / C / DH 6-54% (Efficiency
commonly increases
the longer system is in
operation)
ATES Ground source heat pump,
waste heat, CHP.
C / DH 70-90%
PCM Boilers, CHP, heat pumps,
biomass, solar thermal, solar
PV.
D / C / DH 75-90%
THS Different heat sources C / DH Potentially very high
(up to 100%), but so
far low in practice.

Figure 14. Illustration of different TES technologies currently used for heat storage.
Adapted from Sørensen and Schmidt (2018)
Apart from TTES, Pit thermal energy storage (PTES), Borehole thermal energy storage
(BTES) and Aquifer thermal energy storage (ATES) technologies are commonly known
as underground thermal energy storage (UTES), and all these technologies are suitable
for interseasonal heat storage (Sørensen and Schmidt, 2018). In figure 20, it can be seen
the basic structure and geometry of four different energy storage system.
Borehole Thermal Energy Storage
In cold climate, to meet the heat demand in winter season is critical. To overcome this
challenge, BTES could be a better option, especially for large scale energy storage
system. BTES systems pump heated or cooled water to underground for later use as a
heating or cooling resource. In this system, thermal medium such as rock and soil are
used to store heat (Lanahan and Tabares-Velasco, 2017).
The BTES consists of several holes that are drilled with a distance from one another.
Moreover, these boreholes distances and depth plays a vital role in the whole operation
and cost, while the distance and depth vary at different geographical locations.
Additionally, the pipe diameter also significant, whereas higher diameter can ensure
maximum fluid circulation (ICRC, 2017).

According to Skarphagen et al. (2019), typically, a borehole drilled distances could be
between 100 and 150 mm diameter and depths can be anything up to 350 m, while 35 to
150 m is normal for Europe. Although, 200 m are common in the crystalline rock terrain
of Fennoscandia and the Faroes.
In BTES, U-shaped tubes are used as a heat exchange pipe to operate the flow of fluids
up and down. Coaxial or double-U pipes can consider as well. For the entire operation,
fluid is circulated (by pumping) around the borehole heat exchanger. The heat extraction
or rejection depends on the surrounding environment. For example, if the fluid
temperature is higher than the surrounding rocks, heat will be rejected. On the other hand,
if the fluid temperature is more relaxed than the rocks, heat will be extracted. Under these
conditions, the heat transfer fluid transfers the heat to a heat exchanger or heat pump at
the surface, which can then use for space cooling, space heating, agricultural or industrial
cooling or heating purpose.
A significant concern for these types of storage is, it needs a significantly substantial cost
for drilling; however, when it considers for large scale establishment, this technology is
more cost-effective compared with others. Additionally, the advantages of BTES is, this
technology provides energy return throughout their lifetime (IEA, 2014; Sibbitt,
McClenahan and Resources Canada, 2014).
According to IEA report, tank thermal energy storage (TTES), as well as borehole (BTES)
and aquifer storage (ATES) are suitable and successfully commercialised technology for
temperate climate (temperature below 10 C). Especially where heating and cooling is
needed during winter and summer such as the Netherlands, Sweden, Germany, and
Canada. (Sibbitt, McClenahan and Resources Canada, 2014).
Aquifer Thermal Energy Storage
In aquifer thermal energy storage (ATES) technology, it uses the free cooling or heating
from an aquifer. In that case, groundwater is used as a medium and then heat transfer
between the external and the aquifer.

Generally, depending on the annual mean temperature of a location, the groundwater
belongs a constant temperature. In the winter season, cold is stored in the cold side of the
aquifer to use it in the warmer season. On the other hand, during the warmer season, heat
is stored in the warm side, and pumping back during the cold season (Paksoy and Beyhan,
2015).
Figure 15. An illustration of Aquifer Thermal Energy Storage based on the model by
Drijver and Willemsen (2015)
As seen in Figure 15, like the borehole thermal energy storage system, a heat exchanger
is used in the above ATES to transfers the heat or cold from the groundwater. Moreover,
in many cases, a supplemental heating system may be needed depending on the climate
conditions.
According to Drijver and Willemsen (2015), the cost of ATES depends on the number
of wells and the distance between cold and warm wells. Meanwhile, shallow wells are
cheaper, but they can provide smaller injection pressure. On the other hand, thermal
efficiency correlates with the flow velocity, while larger flow velocity is the cause of
lower efficiency.
One of the significant disadvantages of ATES technology is hydrogeological restrictions.
Balancing of heat input and extraction is another disadvantages, meanwhile, this
technology is not suitable for all locations.
Tank Thermal Energy Storage

Two types of tank thermal energy storage (TTES) technology exist in the current market,
while, a heat exchanger is used in the indirect system to transferring the heat to the mains
or tap water from the stored water. On the other hand, in the direct system, the stored
water is passed through the domestic hot water supply.
The tank thermal energy storage can be constructed 5 to 15 m under the ground. The
common materials that are used for TTES are concrete, stainless steel or fibre reinforced
plastic (Mangold and Deschaintre, 2015). This technology can be used for seasonal and
diurnal applications. However, its economic viability depends on the size, while
considerable size may increase the initial cost.
Moreover, insulation materials also a factor that affects the efficiency and cost of the
whole system. In order to increase efficiency, different structures can be used inside the
tanks. Generally, in a greenhouse, the tanks those are used for the heating system, they
can also use to collect rainwater as well.
According to EIA (2014) and Department for Business, Energy and Industrial Strategy,
UK (2016), the essential advantages of TTES are, this technology is already established
and proven. Additionally, it is usable for a wide range of applications, and cost-effective.
On the other hand, huge space requirements can be considered a disadvantage. Moreover,
smaller stores have higher heat loss.
Pit Thermal Energy Storage
In the pit storage systems, shallow pits are used as a fluid and dug in the ground. On the
other hand, a layer of insulating material is used as a cover on the top of the storage. Heat
transferring and storing occurs when water is pumped into and out of these pits. PTES
systems are made of an artificial pool filled with storage material and closed by a lid
(Figure 20).
One of the advantages of PTES is, they have the potential for large storage capacity.
Additionally, this technology is perfect for interseasonal uses and can be used to store
solar heat using PVT. On the other hand, low energy density can be considered as
disadvantages of this storage system.

5.5.2 Latent Heat Storage System
Storing heat by changing the material's phase is known as latent heat storage (LHS)
technique. At present, the change of phase from solid to liquid is the most commonly
practiced technology. However, liquid to gas is also usable technique. To store energy, in
this system it needs to control the temperature within a specific range.
There are three categories of PCM technology, while inorganic compounds have nearly
double heat storage capacity compared to organic. Another type of PCM technology is
eutectic combination materials.
Thermal conductivity could be consider as the strength of a phase change material, while
lower conductivity consider as one of the drawbacks. Therefore, materials that are used
for phase change should be a good conductor. Although organic materials have a wide
range of melting points (5 ºC to 120 ºC) and high latent heat, they are costly and have low
energy density. On the other hand, lower cost, higher latent heat and high specific density
give advantages to inorganic compounds.
According to the IEA report, heat storage with PCM methods offers many potential
opportunities. However, the limitation of containment vessel design and stability of
materials at very high temperatures consider as the challenges (IEA, 2014).
5.5.3 Thermochemical Heat Storage
Compared with PCMs, thermochemical heat storage (THS) materials have higher energy
storage densities. Moreover, THS can store heat for an extended period, and heat loss is
relatively low.
In THSs, sorption and chemical reaction are responsible for heat generation, while both
acts in reversible direction. Meanwhile, compared to other systems, for low-temperature
applications, sorption considers as suitable technique.
As stated earlier, the construction cost of these storage technologies varies significantly.
However, it is not possible to build all storage in all places, while there is not one excellent
storage concept that met with all applications. A comparative cost optimization analysis
prepared by Solites (2012) shows that cost of a system decrease with the increase of
storage volume.

Figure 16. Comparative analysis on investment cost vs storage volume (Mangold, D.
et al., 2012)
As seen in Figure 16, it shows that the cost decrease with an increase in storage volume.
Moreover, the best cost-effective storage are those that have a volume over 1000 m³ water
equivalent.
It can also be seen in the figure that the lowest investment is required for ATES and BTES
system. However, as stated earlier, sometimes they need additional equipment, as well as
local ground condition also a factor for their operation.

6 AGRICULTURE-ENERGY POLICIES AND ENERGY
PROVISIONING
6.1 Agricultural sector in Finland
Finland has a total area of 390,903 km², whereas 95% of this area is rural. Compared to
forests, agricultural land is more than ten times smaller, while the forest and agricultural
area are 86% and 7.6%. Due to climate conditions and short and intensive growing season,
the Finnish agricultural sector is continuously facing difficulties to meet the domestic
need and annually a share of vegetable and fruit is imported from other countries. Despite
the weather adversity, agriculture has enthusiastic participation in the national economy.
Along with forestry and fishing, the Finnish agricultural sector, contribute 2.5% of total
GVA, which is relatively high compared with EU28 countries (1.5%).
According to the recent statistics by Natural Resources Institute Finland, the total
agricultural area utilised in 2018 was 2,271,900 hectares. While Southwest Finland is in
top of land utilisation, and South and North Ostrobothnia are next in positions (Figure
17).
Figure 17. Utilised agricultural area in 2018 (Natural Resources Institute Finland,
2019d)

On the other hand, during the same period, there were a total of 47,688 agricultural and
horticultural enterprises, and the average utilised agricultural area of the farms was 48
hectares, which is higher in sized compared to 16.1 hectares in EU28 (European
Commission, 2018b).
Moreover, in 2018, the outdoor field utilised for vegetable, nursery product, fruit and
berries cultivation were 19,131 hectares, while greenhouse vegetable and ornamental
plants cultivated on 393 hectares. From the open field cultivation, 163 million kg
vegetable were produced, of which 65 million kg were carrots, berries production was 18
million kg, and strawberries accounted for 15 million kg. On the other hand, the amount
of greenhouse vegetables produced was 90 million kg, of which 45 million kilos were
cucumber, and 39 million kg were tomatoes. Meanwhile, although 48 times more land
was used for open field cultivation, approximately same amount of yield came from both
(Natural Resources Institute Finland, 2019b). It has seen for the previous year that the
prices of the outdoor products are relatively high compared to greenhouses (Niemi and
Väre, 2018).
According to Natural Resources Institute Finland, in 2018, a total of 211 greenhouses in
North Ostrobothnia operate using heating technology, while a total of 45 greenhouses
used these heat for more than seven months and 125 greenhouses for less than seven
months. Moreover, plastic materials are used for cover in most of the greenhouses in
North Ostrobothnia. The total statistics of the greenhouses under cultivation by covering
material, heating and without heating is presented in the following Table 9.
Table 9. The greenhouses in North Ostrobothnia under heating (Natural Resources
Institute Finland, 2019c)
Greenhouses Total Glass Plastic Double acrylic sheet
2018 North Ostrobothnia Heating > 7 months 45 5 17 23
Heating < 7 months 125 6 109 10
Without heating 41 - 40 -
On the other hand, a total of 2254 greenhouses uses supplementary heating for more than
seven months in the whole of Finland, while 1652 use heating for less than seven months.
Moreover, a total of 462 greenhouses operates without supplementary heating. From
these statistics it can assume that plastic dominate glass and double acrylic sheet as a
glazing material.

According to Statistics Finland, in 2017, Finnish greenhouse farming sector consumed
about 1628 GWh energy, whereas electricity consumption was about 599 GWh, which is
approximately one-third of the total of this sector (Natural Resources Institute Finland,
2019a). The electricity consumption in greenhouses increase 10% compared to the year
2014. Moreover, comparing with the utilised area, this energy consumption profile is
considerably bigger than the open field cultivation.
Figure 18. Energy consumption in greenhouses sector (Statistics Finland, 2019)
As seen in Figure 18, energy chips (326 GWh) are the most important heating fuel, while
the consumption of heavy fuel oil fell to 69 GWh. Moreover, a significant amount of
energy generated from peat and purchased heat energy (district heat).
According to Statistics Finland, agricultural and horticultural production consumed a total
of 11,381 GWh of energy in 2016, which is more than five times than greenhouses energy
consumption. Under the comparison of annual production, energy consumption and land
use, it can assume that greenhouse farming is more convenient than open field cultivation
in Finland.
6.2 Agricultural Policies in Finland
The Finnish Agricultural Policy is based on the Common Agricultural Policy (CAP) of
the European Union since the beginning of EU membership. Under the CAP
fundamentals, Finland sets the priority to diversify the agricultural sector in different parts
of the country.
0 200 400 600 800 1000 1200 1400 1600 1800
Energy consumption in GWh
Ener
gy s
ou
ces
TOTAL (energy source) Field biomass (loose m3)Chips (loose m3) Wood pellets and briquettes (kg)Other wood fuel (loose m3) Purchased heat energy (GWh)Peat pellets (kg) Sod peat (m3)Milled peat (loose m3) LPG (kg)Natural gas (m3) Hard coal anf antracite 1) (kg)Light fuel oil (l) Heavy fuel oil (kg)Electricity (GWh)

However, CAP has been in place since 1962. In the early stages, the prime concern of this
policy was to make European agriculture self-sufficient. However, the current policies
focus is to produce a product according to the market needs.
After several reforms, the latest CAP came into force at the beginning of 2015. In the new
goal, it gives more strength to face the increasing food demand and climate change.
Notably, it gives focuses on environmentally friendly cultivation methods, innovation,
research and dissemination, a fairer support system. Improve the position of farmers in
the value chain also incorporate in the policy (European Commission, 2018b).
Finland gets a direct payment of around €3.7 billion for the 2014-2020 period from the
EU, which is for environmentally friendly farming practices. Apart from this direct
payment, for the same period, a total of €8.3 billion has been allocated to use in the rural
area of Finland. However, since 2015, federal aid is available for farmers in Southern
Finland, and there is also another aid element that referred to as Nordic aid. Additionally,
Certain other aid also available, but more limited.
According to the Ministry of Agriculture and Forestry of Finland (2018), Finnish aid
varies in different support areas. For example, support payment increases towards the
north for milk and beef production, while for crop farming, the support payment is the
same across the country. In addition to annual aid, to improve agricultural productivity,
develop the structure of agriculture and promote generational renewal farmers may also
receive structural support.
6.3 Energy Policies in Finland
The essence of the European energy policy is to achieve an integrated energy market,
ensure the sustainability of the energy sector and the security of energy supply. A variety
of measures were taken to satisfy these goals in the entire European Union, whereas
Finland is a member of the EU.
For example, under the Energy Efficiency Directives (EED), the EU has set a 30% energy
savings target by 2020. To achieve this target, the EU has adopted measures to improve
energy efficiency such as annually 1.5% of energy usages reduction, at least 3% of the
building must be renovated to increase the energy efficiency. Moreover, in order to fulfil

the EU's climate and energy goals, it emphasises to reduce the energy consumption for
heating and cooling and cut the use of fossil fuels.
Meanwhile, the new revised Renewables Energy Directive (RED) (2018/2001) also
entered into force, which sets a target to ensure 32% renewability in the energy sector by
2030 (Ministry of Economic Affairs and Employment of Finland, 2018b). To achieve this
goal, the renewable energy sources such as solar, wind, and hydropower must consider in
a bigger sphere for end-use energy consumption.
The Renewables Energy Directive also aiming to protects Europe’s environment and
reduce air pollution, to make households, communities and business become clean energy
producers, and reduce the dependency on energy imports and increases energy security.
Another significant point of the EU's policy is to reduce the greenhouse gas emission at
least 80-95% compared to 1990 levels by 2050 (European Parliament, 2018).
As a member states of the EU, most of the energy policies of Finland echo’s the European
Union policies and frameworks. However, Finland has its Climate and Energy Strategy
that aims to achieve EU goals while maintaining economic competitiveness. Moreover,
although the EU has set goals to reduce the carbon emission 80-95% of the 1990 levels
by 2050, Finland's goals are above the EU minimum. On the other hand, Finland has sets
ambitious climate targets for 2030, such as cutting oil consumption in half and achieving
30% of renewables in transport by 2030. Moreover, to emphasise renewable energy
production in Finland, currently, an energy aid scheme is introduced by the Finnish
government. The energy aid is granted for investments on renewable energy and new
energy technology (Ministry of Economic Affairs and Employment of Finland, 2018a).
6.4 Energy Provisioning for Finland
Several different sources play a vital role in the Finnish energy sector, while wood fuel
was the most used source (28%), oil (22%) and nuclear energy (17%) were in next to
wood fuel in 2018. As seen in figure 27, non-renewable sources such as oil and coal
account for approximately one-third of the use.
According to Statistics Finland's preliminary data, in 2018 the total consumption of
energy was 1.38 terajoule (TJ), which corresponded to a growth of two per cent compared

with the previous year. The growth of fossil fuels and peat plays a crucial role to increase
the overall growth of energy. In addition to this, the growth of renewable energy sources
increased by 3%. On the other side, carbon dioxide emissions also went up by 3%. In
2018, a total of 41 Mt CO2 emits from fuel combustion, while to fulfil the carbon
reduction goal this number should be around 15 Mt by 2015.
Figure 19. Total energy consumption by source in Finland (Statistics Finland, 2019)
6.5 Energy Production Scenario in Oulu
The studied case of this thesis is located in Oulu, so, a competent discussion over the
energy production has presented for understanding the overall energy scenario within this
area.
In Oulu, the key player in energy is Oulun Energia. Currently, they operate combined
heat power (CHP) plants, hydroelectric plant, waste incineration plant, windmill for
energy production. Apart from these, they purchase energy and heat from the grid. The
maximum amount of electricity that they sell to a customer is generated from fossil
sources (44.5%) such as peat, coal, natural gas and oil, and nuclear power (40.8%).
Renewable sources of energy such as wood, biomass, hydropower and wind generate
around 14.7% of the total production of this company (Oulun Energia, 2018a).

That means the non-renewable sources are playing a vital role for energy production in
Oulu, while peat (50%), wood (34%), hydropower (15%), wind power (0.1%) other
fossils (1%) are using as the sources of energy.
On the other side, Oulun Energia also produces and sell heat to the customer, while 69%
of heat energy produced in their Toppila power plant. The rest of the heat generates at
Eco power plant (20%) and heating plants (0.3%). Nevertheless, to meet the supply-
demand they also purchase heat from other sources, the amount is around 11% of the
total. In 2017, a total of 2151 GWh heat energy produced by Oulun Energia, whereas
electricity production was 2731 GWh (Oulun Energia, 2018c).
Figure 20. District heating network in Oulu region. Red lines are the DH network
(Oulun Karttapalvelu, 2019)
From the above energy production information, it can be assumed that, a significant
portion of energy generated in Oulu using non-renewable sources. On the other hand,
renewable sources also show a tremendous achievement. Therefore, there is a
considerable prospect to implement renewable technologies for energy, particularly heat
production in Oulu. Meanwhile, the heating services are not available far from the city
(shown in Figure 20), so it is not possible to use the district heat service to supplement a
greenhouse heating operation which is located outside of the network. In that case, energy

for agricultural sector, especially for greenhouses which are not in the district heat
network, should have their own heating source.
6.6 Solar Photovoltaic Potential
Since from the earlier discussion, it has been seen that renewable energy sources have
enormous potential in Finland, while solar PV could play a tremendous role in this sector.
Although there is a possibility, the geopolitical position, environmental condition and
economic direction of any country can affect to make an overall decision. In that sense,
to popularize the solar PV, there should have demands to review its economic aspects.
Four factors should consider evaluating the economic performance of a PV system, while
solar radiation is the vital one. The other three factors are the cost per unit or installed
peak power (€/kWp), the operational cost with the initial cost, and the lifetime (Šúri et
al., 2007).
As stated earlier, climate condition has a significant impact on energy generation using a
photovoltaics module, whereas solar irradiation that reaches the panels is the
indispensable one. The solar irradiation also influences by factors including latitude,
altitude, seasons, time of a day and cloud (Bertrand et al., 2018, Chikate et al., 2015). In
the chapter two, it has already been seen that the amount of solar irradiation that receives
in Finland is a bit lower compared to other countries. According to the Finnish
Meteorological Institute, in the northern part of the country, it receives average 790
kWh/m2, whereas in southern Finland it receives 980 kWh/m2 solar irradiation on the
horizontal surfaces (Motiva, 2015).
For instance, seen in Figure 21, the yearly sum of global irradiation in Oulu region is
about 1000 to 1100 kWh/m2, whereas the electricity generated by 1 kWp with
performance ratio 0.75 is in between 750 to 825 kWh/m2. It has examined that the
radiation levels for optimally tilted surfaces in Oulu, is much lower compared to the
southern cities in Finland. Additionally, the impacts of snow as well as cold air
temperature and wind speed also assessed to determine the photovoltaics potential in
Northern part of Finland.

Figure 21. Solar irradiation and solar electricity potential in Finland (JRC, 2017)
A more evident scenario of average solar irradiation in European countries can be seen in
Figure 22. The PVGIS solar radiation database (2005 to 2015) was used to analyse the
possibility of solar electricity generation in Finland. The results show a significant
difference within EU member and candidates’ country, while Finland receives the least
average solar irradiation over the period. However, it should also keep into consideration
that a total of 13 other countries receives approximately similar level of average radiation
compared to Finland. The Netherlands is one of the 13 countries, but they generate 3.6%
of its total renewable energy from solar PV (Junginger and Mai-Moulin, 2018). Moreover,
based on the progress of the agricultural sector, the Netherlands, which is eight times
smaller than Finland, has a strong economy in Europe.

Figure 22. Average yearly horizontal irradiation in the EU 28 Member States and 2
Candidates
A realistic layout of PV generation potential can imagine by addressing how much area
is needed to be covered with PV modules to meet the total electricity consumption.
According to Statistics Finland, the total electricity consumption in 2018 was 87 terawatt
hours (TWh), while the net imports of electricity to Finland was 20.4 TWh. Considering
the average irradiation in Finland as 841 kWh/m2 and 10% efficiency, it can calculate
how big a solar panel is needed to produce that much energy.
For example, to produce the total electricity that consumed in 2018 needs an area with 32
km X 32 km that filled with solar panels. On the other hand, 15.56 km X 15.56 km solar
panel area is needed to reduce the dependency on imported electricity. Moreover, the
current solar module technology is advancing. From this, it can easily assume that future
technologies will be more efficient, and the area covered per kWp is likely to decrease.
Figure 23. Sun path graph for the location of Oulu botanical gardens (Created using
Skelion)
y = -29,568x + 1663R² = 0,93
0
200
400
600
800
1000
1200
1400
1600
1800
2000
MT CY PT ES TR GR IT MK RO BG HR FR HU SI AT SK CZ LU DE PL LT LV BE NL DK EE IE UK SE FI
Global yearly irradiation (kWh/m2)

However, the seasonal distribution of solar radiation is uneven in Finland. Therefore, for
planning a grid-connected or off-grid system, seasonal variation should be kept into
consideration. Apart from this variation, geographical differences can be observed within
countries as well.
As seen in Figure 23, from May to July, it has a full path, whereas November to January
it is almost absent or narrow, which is just opposite of the electricity consumption by the
University of Oulu Botanical Gardens and greenhouse. In this case, a suitable storage
system for the winter months or selling extra electricity to the national grid could be the
logical choice.
Figure 24. Solar radiation annual trend in Oulu. Data acquired from the Paris based
Climate projections center The Climate Data Factory (2019)
From Figure 24, the future trend of solar radiation in Oulu can predict more deeply. Here,
to predict the Oulu city radiation scenario in the future, data were extracted from the
nearest observatory grid point, where the radiation variable corresponds to the daily
values of solar radiation averaged over the year were expressed in W/m² (1 W/m² =
8.765813 kWh/m2·y). For the better accuracy, the average median for several models was
considered in the data sets.
As seen in figure 24, although the radiation per square metre ranges in between 93 to 105,
the future solar radiation trend is linearly positive. Form linearity trend it can assume that
the solar radiation rate in Oulu will increase over the year in future. In line with this, it is
understandable that the present PV system in Oulu will generate more electricity in the
future.

7 EXAMPLE OF ENERGY EFFICIENT GREENHOUSES
The greenhouse cultivation is not a new concept. In the 19th century, it was first initiated
in France and the Netherlands. However, the earliest structural design and climate control
technique was quite simple, while low height and glass structures are mainly used for
climate protection; and ornamental plants are the main product.
After the Second World War, the technology of greenhouse construction accelerated,
especially in Western Europe cold countries such as the Netherlands. From that time the
structure of greenhouses is changing, which is currently quickened with the advancement
of technology.
Since the Netherlands is one of the pioneer countries in the field of agriculture and they
have received significant successes from greenhouse-based agricultural systems.
Therefore, discussions on the greenhouse system of the Netherlands have been presented
as an example. On the other hand, the weather conditions in Canada are similar to Finland.
To understanding their research trends on greenhouse farming and progress, an example
adopted from the country. Additionally, in the last few years, Germany shown a
significant advancement in the greenhouse farming sector. Solar radiation levels in
Finland is also nearer to Germany. These are the reasons that have inspired to choosing
Germany as an example country.
Greenhouse at Westland, Netherlands
According to Statics Netherlands, although greenhouse vegetable growers decreased 85%
between 1980 and 2017, the average cultivation area increased sevenfold. It is one of the
best examples of how a nation utilised technological advancement in agricultural sector.
In Netherlands, ‘Venlo’ type greenhouses are most common in commercial farming as
these are suitable for all crops and most climate conditions.

Figure 25. Greenhouse at Westland, Netherlands (1. Venlo-type greenhouse, 2.
Pressurised hot water boiler, 3. Heating mechanism) (Venlo AP Holland Group, no
date)
Tempered glasses are used for glazing and the ventilation system is truss-mounted and
operated by means of a push-pull rail mechanic, with roof vents on both sides of the ridge.
The specification summery are presented in Table 10.
Table 10. Westland greenhouse specifications
Feature Technology
Glazing Tempered Glass
Heating Pressurized hot water Boiler system
Lighting LED light
Ventilation Truss-mounted mechanism / roof vents
Energy sources Gridline
Water Rainwater reservoir / Recycling water supply
Snow load Snow heating
Greenhouse at Yukon, Canada
Under a research project, Yukon Research Centre at Yukon College constructed a
greenhouse for northern cold climate. This technology guided greenhouse is fully
automated. For example, watering (soil moisture), shutters, lighting, ventilation (CO2 and
RH), bed temperature, battery charging and Stirling, all these operations conducted with
their demand.

Figure 26. Greenhouse at Yukon, Canada (1. Inside of the greenhouse, 2. Glazing
material, 3. LED for lighting, 4. Heating and Power Station) (Walden Labs, 2015)
In this greenhouse, Quad-pane 25mm polycarbonate used for glazing, which has R-value
equivalent to double glass. On the other hand, LED lights are used to supplement the
lighting needs during dark seasons. The lights that are used: LED Growmaster (9w /
light) and Hydrogrow (155w / light).
Moreover, a WhisperGen Personal Power Station (PPS16) used as heat (5.5Kw thermal
power / 19,000 Btu) and electricity (800 w) producer. Additionally, thermal storage is
used in the form of water under the beds to trap daytime heat and release it during the
night. Meanwhile, fans are used for ventilation to blow hot air from the top of the
greenhouse.
Table 11. Yukon greenhouse specifications summery
Feature Technology
Glazing Polycarbonate
Heating Personal Power Station /Thermal storage
Lighting LED light
Ventilation Side wall fans and roof vents
Energy sources Gridline/ Personal Power Station

Organic Greenhouse at Mühlingen, Germany
An organic greenhouse on 6.2 hectares or 42,000 m2 area located at Mühlingen, Germany
have been operating since 2017. The specialisation of this greenhouse is that, all the
vegetables grown here are organic.
Currently, tomatoes, cucumbers and peppers are harvesting on the site. For this
greenhouse uses heat is coming from the nearby biogas plant. A 3000 m3 thermal storage
tank also installed near the glasshouse, as well as a 12,000 m3 water basin.
For biogas plant, horse manure and apple pomace are fermented, the gas is supplied as
waste heat through a 700-meter long district heating pipe and collected in a heat storage
tank.
On the other hand, the irrigation water is recovered (80%) via the roof surface of the
greenhouse.
Figure 27. Greenhouses at Germany (1. Site view of Mühlingen greenhouse, 2. Inside
the greenhouse) (Horti Daily, 2017)
The specification of the greenhouse is presented in the following table 12. There is no
information about the energy sources other than heating technology.
Table 12. Mühlingen greenhouse features
Feature Area 42,000 m2
Heating Biogas plant, gas boiler
Water Rain water retention
Glazing Glass
Lighting LED

Experimental part

8 UNIVERSITY OF OULU BOTANICAL GARDENS
8.1 Location and size
The geographical location of the University of Oulu Botanical Gardens is at 65° 03´N
latitudes and, 25° 27´E longitudes and 12 m above the sea level. The place is about seven
kilometres’ north from Oulu city centre and situated on the Shore of Kuivasjärvi Lake.
The whole garden area is about 16 hectares, including 670 m2 two pyramid-shaped
greenhouses for display, whereas spaces occupied separately are 380 m2 (Romeo) and
290 m2 (Julia) respectively. Along with this, a 300 m2 area is used for an experimental
greenhouse. The heights of Romeo and Julia are 16 and 14 metres (University of Oulu
Botanical Gardens, 2016).
The outdoor garden consists of lawns, forest areas, ponds and garden beds and different
habitats. An aerial view of the location can be seen in Figure 28.
Figure 28. The University of Oulu Botanical Gardens (Google Earth, 2019)

8.2 Characteristics of the buildings
Oulu Botanical Gardens consists of twelve different sectors (Figure 29), as well as
different building structures since it had moved from Hupisaaret Islands Park near the
city centre to Linnanmaa in 1983. Most of the underlying architectures are visible at sector
eleven, where greenhouses, office and museum are places altogether.
The areas of the different part of the building were measured using SketchUp (2018)
software. The single stories office building is 695.51 m2 and stands few meters north-
east from the two pyramid-shaped greenhouses. The orientation of this structure is north-
west facing since the shading falsification is a significant factor for the photovoltaic solar
system.
The museum building is also single stories, which worth 851.36 m2 rectangular area.
However, a beam separates the roof in two folding and is a bit higher in length considering
to the two dividing portions. The first portion of the rooftop is about 495.74 m2 (measured
using Skelion (2018)) rectangular area and south-east facing. Another portion is north-
west facing and worth 355.62 m2 (measured using Skelion (2018)) rectangular area.
Figure 29. The University of Oulu Botanical Gardens sketch (University of Oulu,
2010)

8.3 Functions of the Botanical Gardens
Several field visits, as well as personal communication and interviews, have been
conducted during this thesis work. More precisely, energy data were collected from the
University Properties of Finland Ltd (SYK) Authority for the year of 2018, while different
functions and their pros and cons were identified through interview and personal visits.
The botanical garden is an entity of the Department of Biology that provides experimental
facility to the researcher. Different living plant collection is displayed in the garden,
mainly for research purpose. Additionally, general people also have access to the garden
premises. Moreover, two greenhouses are used for plant species, whereas about 1500
plant species are in the greenhouses. These plant taxa are from tropical, subtropical and
temperate climate zones since the majority is propagated from seeds obtained via
international seed exchange (University of Oulu Botanical Gardens, 2016).
The greenhouse ‘Romeo’ is used for growing tropical and subtropical plants such as
banana, cacao, coffee, papyrus, rice, tea, various orchids, gardenia and camellia and
‘Julia’ is for the Mediterranean and temperate areas plants such as various Citrus-species.
Along with these, there is a pavilion for cactus, agave, lithops species The Botanical
Gardens Authority informed that they set the temperature at +20 oC in the bigger pyramid
for tropical plants, whereas during the winter Mediterranean plants are kept in constant
+12 oC temperature (Tuomas, 2018).
Figure 30. Different plant species at the University of Oulu greenhouse

Additionally, in the museum, there are also a conference room, library and administrative
office, which are opens during 8.00 to 16.00 under the university guideline. It can assume
that during this period of a day the energy consumption for these places are maximum as
heating, lighting and other electrical types of equipment are in the active mode.
However, heating and lighting are essential for the plants’ growth. To fulfil their needs,
depends on the weather conditions extra heat and lights are provided to the greenhouses.
There is also a greenhouse behind the collection greenhouse that has an area of 300 m2.
Research and experimental cultivation are carried out in these areas. Moreover, in these
three greenhouses double layer polycarbonate sheets are used for glazing.
Table 13. Area and opening hour information of the botanical gardens.
Building Name Operation Time Area in m2
Museum
Library
Administrative Office
Tuesday-Friday:
(0800-1500)
Sundays:
(0011-1500)
Monday & Saturday (Closed)
695.51
851.36
442
Romeo Greenhouse 24 X 7 380
Julia Greenhouse 24 X 7 290
Experimental Greenhouse 24 X 7 300
Total
2959
In Table 13, different spaces are presented while the floor space of museum, library and
administrative office were measured using SketchUp software. As shown in the table,
Museum, library and administrative offices are not open for a whole day. Therefore, it
can assume that those segments may not consume as much energy as the greenhouses are
consuming for 24 hours. Moreover, weekdays and weekends energy consumption will
vary due to many operations are in sleep mood. The buildings, as well as greenhouses,
are equipped with thermostats that controlled the temperature automatically.
8.3.1 Heating and Cooling
According to University Properties of Finland Ltd (SYK), all the buildings in the
University of Oulu heating system consists of ceiling panels connected to a low energy
consumption system, whereas hydronic radiator heating system present in the lobbies and
underfloor heating in the basement. Moreover, concurrent heating and cooling of the
office spaces has been prevented by taking necessary measures. Additionally, to keep the

indoor temperature according to the weather conditions, specific sensors are used to adjust
the temperature (SYK, 2019) .
For example, when the outdoor temperature is a maximum of 10 oC, the indoor
temperature is considered to be reasonable if it varies from 20 to 23 oC. During the
summer when the outdoor temperature is 20 oC, the maximum permitted value for indoor
temperature is 27 oC. Therefore, it can be assumed that during the winter, additional
energy is needed for heating. On the other hand, during the summer, the heating and
cooling system needs less energy.
Figure 31. Radiator heating systems in the greenhouse
However, in the greenhouses, hydronic radiator heating systems are placed to the side
walls (shown in the 1st image), and there is also underfloor heating in the basement. In
addition to these, heat flow tubes are also used on the upper side (shown in the 3rd image).
8.3.2 Ventilation
Mechanical supply and exhaust air ventilation system are equipped in the buildings for
ventilation purpose, while these are operated under the time and purpose of use. For the
ventilation operations, air screens placed in the walls of the building’s ventilation engine
rooms, from where the air is carried through a fresh air chamber to the supply air
machines. On the other hand, exhaust air is carried out through exhaust diffusers placed
on the roof of the ventilation engine room (SYK, 2019).

In the greenhouse, in addition to air exhaust diffusers, there is also truss-mounted
ventilation system that operated through a push-pull rail mechanic, with roof vents.
8.3.3 Lighting
Most of the lights in the building are HPS, while automation switches the lights on and
off in the shared areas or corridors and lobbies according to adjustable control time.
Moreover, they also work with sensors (SYK, 2019).
On the other hand, LED (shown in Figure 32) and HPS both light bulbs are used in the
three greenhouses, whereas LED in the Romeo and Julia, and HPS in the experimental
greenhouse. More specifically, in Romeo and Julia, both greenhouse contains four
quantity Luminatec Areal 300W-D120-850 LED flood light for the top angle. The bulbs
have 3x120-degrees independent lighting pattern and 4000K colour temperatures.
Additionally, each of the light has a spectrum of about 42000 lumens and power 300
watts. Aluminium and cooling fins use for the frame, and the bracket is adjustable.
Moreover, the bulbs have (340x242x194) mm dimension, and weight is about 5.6 kg.
Along with these, IP65 rating makes this bulb as water-resistant, and that is why suitable
for an outside setting (Tuomas, 2018).
Figure 32. LED lights that used in the greenhouses
Additionally, Luminatec Areal 150W-D120-850 is used in Romeo (40 pc) and Julia
(30pc). In this case, the bulbs have 18000 lumens as a light spectrum, and each bulbs
power is about 150 watt. The dimension of the bulb is (340x242x194) mm and weight

5.6 kg with 4000K colour temperature. Other configurations are the same as the previous
one. Furthermore, numbers of standard fluorescent tubes also used in these two
greenhouses. For the experimental greenhouse, it equipped with around 400 pieces of
high-pressure sodium bulbs (Tuomas, 2018).
8.4 Energy Audit
An initial walk-through of the facility is essential to understand and to ensure an energy-
efficient system that has already discussed in the above sections. In this section, attention
will be given to know:
i. Where energy is being wasted
ii. Where repair or innovation can be considered
iii. Where capital investment may be needed in order to improve energy efficiency
Therefore, to make a realistic plan for the greenhouse facilities, it is essential to know the
electricity and heating energy consumption data. To fulfil this requirement monthly
energy consumed data acquired from the University Properties of Finland Ltd Authority,
which were used to plot graphs to display the monthly, daily and hourly energy use in the
University of Oulu Botanical Gardens.
8.4.1 Energy Consumption
Figure 33. Average daily energy consumption in the University of Oulu Botanical
Gardens. The average daily electricity use is plotted against months of 2018. Data
were collected from the SYK Authority
0,00200,00400,00600,00800,00
1000,001200,001400,001600,00
Daily Electricity Consumption kWh

From Figure 33, it can be seen that the daily use of electricity varies month to month,
while in January days consumes the highest energy. Depends on consumption level, this
graph can be divided into two portions. The first one for those months that required higher
energy and the second one is for that have lower consumption. It can be understandable
that the consumption level in May, June, July and August is lower due to summer
holidays. Moreover, as stated earlier in chapter two, net energy demand correlates with
temperature, day-length or solar presence. For example, when the temperature drops,
more heat is required for heating operations. Conversely, when the day-length decreases
and solar appears for shortest time, more lights are needed, and when the day-length
increases, less lights are required. This can be seen in Figure 34.
Figure 34. The monthly energy consumption during 2018 in the University of Oulu
Botanical Gardens and monthly average temperature plotted against months
As seen in Figure 34, the average temperature (VTT, 2018) and annual energy
consumption data are plotted against the months are just opposite to one another. When
the temperature drops, energy consumption is high. On the other hand, when the
temperature rises, it shows that energy consumption is less. In May, June, July, August
and September, the consumption level became steady as the average temperature in the
Oulu region (2018) fluctuated between 11.4 oC to 21.5 oC. The day-length also maximum
over a year in these months.
Comparing Figure 33 and 34 reviews show that in June electricity consumption was a
little bit higher than July and August. The reason behind this may be air temperature, and
humidity during the certain period. Moreover, a clearer picture of electricity and heat
consumption can be seen in fig 35, where the electricity and heat consumption data are
plotted against months of the year of 2018.
-20
-10
0
10
20
30
0
10000
20000
30000
40000
50000
Temperature vs Consumption
Energy kWh Average Temperature

Figure 35. The monthly heat and electricity consumption in the year of 2018
As seen in Figure 35, while the use of monthly electricity is increasing, the use of thermal
power is also upwards. On the other hand, the use of thermal power decreased when the
use of electricity is relatively less. From this, it is possible to reach a hypothesis that there
is a close correlation between the use of electricity and the use of thermal power. If this
observation proven as true, then it can be determined the needs of the dependent variable
using the value of the independent variable.
To justify the relationship between temperature and heat consumption a regression
analysis is performed in Figure 36.
Figure 36. The relation between temperature and heat consumption over a period of
one year. Heat consumption data (2018) were acquired from the SYK authority and
average temperature of 2018 was based on Linnanmaa weather station
From Figure 36, it can be seen that there is a relation between the temperature and the
amount of heating needed over a year. It is possible to measure the thermal energy needed
0
50
100
150
200
0
10000
20000
30000
40000
50000
Month vs Heat-Electricity Consumption
Electricity Consumption (kWh) Heat Consumption (MWh)
y = -4,9348x + 109,09R² = 0,9488
0
50
100
150
200
-15 -10 -5 0 5 10 15 20 25Hea
t C
on
sum
pti
on
MW
h
Temperature
Temperature vs Heat Consumption

with the fluctuation of temperature. For example, if the temperature decreases 5 oC then
additional 24.67 MWh heat energy is needed to control the indoor temperature in the
botanical gardens. Moreover, when the temperature increases, the reverse scenario may
be seen. However, another interpretation can be drawn by using R2 value. As the R2 value
for this figure is approximately 0.95, it means 95% of the heat consumption can predict
from the temperature fluctuation, while 5% of the total variation in heat consumption may
not be possible to explain.
Since only the energy usage is considered, and have not measured the consumption by
each device; therefore, it could be complicated to measure the exact picture of the energy
losses through different form. However, with activity data, it could be possible to
understand the electricity uses and activities that contribute to peak electricity use.
Analysing the twelve months energy consumption, it has seen that although the maximum
demand for the electricity was in January, the demand for thermal power was maximum
in February. On the other hand, the minimum use of electricity was in July. However, the
demand for thermal power was the minimum in May. The average temperature of these
four months was gradual -6.4, -11.9, 11.4 and 21.5 oC.
Figure 37. The hourly energy consumption by the University of Oulu Botanical
Gardens in January 2018. Data were acquired from the SYK authority
Figure 37 shows that, on weekly holidays, energy consumption for the whole botanical
gardens were relatively low. One of the reasons may be that during the weekend most of
the fuel-based electronic appliances were not in operation. Moreover, data analysis shows
that the use of energy was highest from 8 am to 6 pm, and since then, the demand started
to decrease. The minimum electricity consumption during this month was 24.66 kWh,
while the maximum was 97.09 kWh. Conversely, the minimum heating consumption was
0.11 MWh, and the maximum was 0.35 MWh. However, it has seen that peak

consumption differ between electricity and heat energy. For example, in January 2018,
the pick electricity consumption was on 9 am and 29th days (Monday) of this month,
while in the same day and time the heat consumption was 0,21 MWh.
On the other hand, the peak heat consumption was on 23rd January (Tuesday) 8 am, while
on the same day and time the electricity consumption was 77.05 kWh. Moreover, least
electricity consumption was on 12th January (Friday) at morning 5 o’clock, whereas, on
25th January (Thursday) at 6 pm was the least heat energy consumption in University of
Oulu Botanical Gardens. It can assume from the above arguments and analysing the
monthly data for heat and electricity consumption that both have a linear trend for peak
and least consumption of energy.
Figure 38 is plotted to understand the energy consumption scenario when the demand was
minimum over the year 2018. It has seen that in July 2018, the University of Oulu
Botanical Gardens consumes the least amount of energy from both sources, while the
total electricity consumption was 28352.36 kWh and heat consumption was 15.89 MWh.
Additionally, the average temperature for this month was 21.5 oC.
Figure 38. The hourly energy consumption by the University of Oulu Botanical
Gardens in July 2018. Data were acquired from the SYK authority
According to the monthly consumption of the year 2018, the least electricity consumption
was unlikely in May. However, the total consumption of this month was just 142 kWh
lower than July. Therefore, to obtain more acceptable scenario under the temperature
fluctuation, the second least consuming month July is analysed.
It can be seen in Figure 38, the peak electricity consumption 82.25 kWh was on 17th July
at 10 am and peak heat consumption 0.10 MWh was on the same day at 9 am, while the
least electricity consumption was 17.43 kWh at 6 am and net-zero heat consumption was
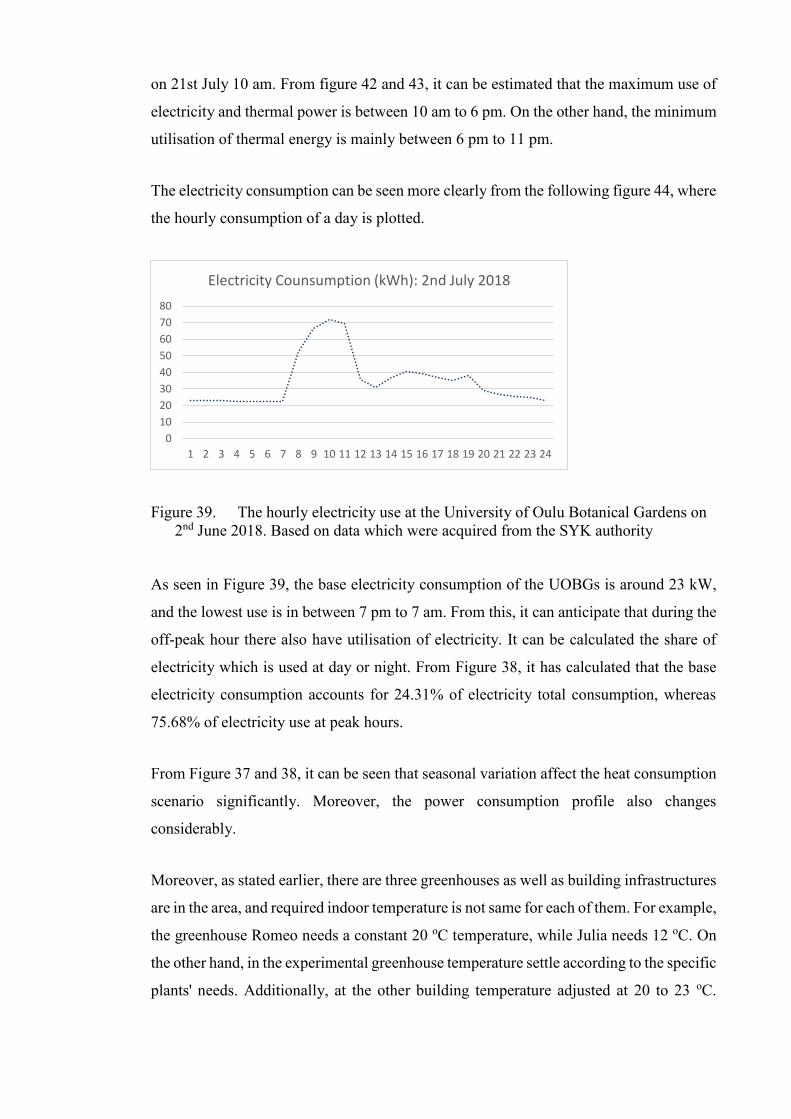
on 21st July 10 am. From figure 42 and 43, it can be estimated that the maximum use of
electricity and thermal power is between 10 am to 6 pm. On the other hand, the minimum
utilisation of thermal energy is mainly between 6 pm to 11 pm.
The electricity consumption can be seen more clearly from the following figure 44, where
the hourly consumption of a day is plotted.
Figure 39. The hourly electricity use at the University of Oulu Botanical Gardens on
2nd June 2018. Based on data which were acquired from the SYK authority
As seen in Figure 39, the base electricity consumption of the UOBGs is around 23 kW,
and the lowest use is in between 7 pm to 7 am. From this, it can anticipate that during the
off-peak hour there also have utilisation of electricity. It can be calculated the share of
electricity which is used at day or night. From Figure 38, it has calculated that the base
electricity consumption accounts for 24.31% of electricity total consumption, whereas
75.68% of electricity use at peak hours.
From Figure 37 and 38, it can be seen that seasonal variation affect the heat consumption
scenario significantly. Moreover, the power consumption profile also changes
considerably.
Moreover, as stated earlier, there are three greenhouses as well as building infrastructures
are in the area, and required indoor temperature is not same for each of them. For example,
the greenhouse Romeo needs a constant 20 oC temperature, while Julia needs 12 oC. On
the other hand, in the experimental greenhouse temperature settle according to the specific
plants' needs. Additionally, at the other building temperature adjusted at 20 to 23 oC.
0
10
20
30
40
50
60
70
80
1 2 3 4 5 6 7 8 9 10 11 12 13 14 15 16 17 18 19 20 21 22 23 24
Electricity Counsumption (kWh): 2nd July 2018

However, it can examine how much energy lost due to conduction and natural air
exchange in the greenhouses or buildings to reduce the extra cost for heating energy.
The general formula for calculating the amount of heat loss from a greenhouse is as
follows:
QT=QC+QA
Where,
QT = total heat loss
QC = heat loss through conduction
QA = heat loss through natural air exchange
Moreover,
QC = U x A x ΔT
Where, U is referring to transmittance, A is surface area and ΔT is the
temperature differences.
QA = 0.373 x ΔT x G x NAE
Where, G is the greenhouse volume, NAE reffers to number of natural air
exchange/hour, and 0.373 is the heat content of air constant.
Applying this two formula, it has seen that in January 2018, the heat loss through
conduction for the greenhouse Romeo is about 68.85 kW/h, while heat loss due to natural
air exchange was 4.98 kW/h. Therefore, the heating system must be able to provide 73.83
kW/h of heat in order to compensate for potential heat loss at -6.4 °C. On the other hand,
it can be seen that the total heat loss through conduction and natural air exchange is
approximately 4.19 kW/h, while the average July temperature was more than the required
temperature. Similarly, it can be measured the amount of heat loss in other buildings and
infrastructure that will help to screening the insulation or ventilation shortage.

However, advantages can be achieved from energy consumption data, when all the
information concerning the electrical appliances and building material are known.
Consequently, the consumption data cannot be used to promote choice over different
energy efficiency upgrades. Although, it can be used to form a plan that requires less
detailed about the activities. In that case, the local electricity and heat production would
be one of the plans, which can use as an energy source for the UOBGs as well as
greenhouses.

9 SIZING OF DIFFERENT OPTIONS FOR ENERGY
GENERATION AND SAVING
The solar radiation rates vary by region, whereas it is a bit complicated to interpret when
the location is in the northern location. In this thesis work, simulations were performed
using a simulated programme Sketchup, and PV sizing performed with Skelion, a design
plugin for Sketchup. Basically, the Sketchup programme performed to design the model,
as well as area, height and width calculation were measured with this programme.
On the other hand, with the Skelion plug-in, tilt angle, azimuth angle and shading loss for
a specific geographical location of the PV system were calculated. Additionally, the
energy production report generates with the help of the PVGIS calculator.
9.1 PV Module and Sizing
Sketchup and Skelion software were used to create the 3D model of the desired building
and measures the roof spaces for the solar PV placement. This software performs using
the appropriate geolocation and considering the accurate solar radiation as well as shading
losses. In the final stage, it provides total electricity production after subtract the shading
effect.
Three different roof spaces were measured for the PV modules placement, which are
adjacent to the greenhouses. In the Group 1 roof has 695.51 m2 spaces, group 2 has 495.74
m2 and group 3 belongs to 355.62 m2 area.
The “Solar World 300 Sunmodule” monocrystalline solar panels with module efficiency
17.89% were considered for the system. Monocrystalline Silicon is designed as a single
crystalline disposition which can be identified by its uniform colouration and solar cells.
It is also knows as Single-Crystal Silicon. The manufacturer company provides 25 years
warranty for the panels, and maximum performance digression is about 0.7%. Each of the
panels can generate 300 Wp, and the operating temperature is -45 to 85 oC (SolarWorld
300, 2018). In Table 14 more detailed specifications are presented.

Table 14. Sunmodule 300 plus panel specifications
Dimensions Unit
Length 1.675m
Width 1.001m
Height 0.33m
Weight 18.00 kg
Nominal temperature 25 oC
Total irradiance 1000 W
For the desired location, initially two planes were taken into consideration to analyse the
PV potential. In the first plan, the PV panels were placed southwards, and in the other,
the solar panels are placed in parallel with the building. The general idea for this selection
was to make a distinction between quality vs quantity outcome. It has been observed that
if solar modules installed in a different angle than the optimal, slightly lower amount of
electricity will generate.
On the other hand, it has observed that though in an optimal angle the total electricity
production is slightly higher, it varies in a higher-scale when compared with one season
to another. In that case, if the Solar PV modules are installed at a lower angle than the
optimal angle, there may not have a massive impact on the total electricity generation.
Therefore, the orientation angle for the PV modules was selected manually.
For example, the tilt angle for the first scenario was considered at 21 degrees, while the
azimuth angles set at 172.50 and 180 degrees for three different groups of PV modules.
On the other hand, with a similar tilt angle and 134.28 degrees azimuth angle were
introduced for the second scenario.
9.2 Scenario 1: South Facing Modules
South-facing PV modules get as much light as those on an east or west-facing. That is
why this direction is characteristics as ideal or real direction for a solar panel. However,
by boosting the number of cells or increasing the area, the overall outcome from a PV
system can be compensated.
As seen in Figure 40, all the solar modules are installed in the south-facing direction,
while a total of 426 pieces of solar panels are in the system. The total system is separated

into three groups, while the first group consist of 143 solar panels with tilt angle 21
degrees and azimuth 180 degrees. On the other hand, the second and third group contain
a total of 137 and 92 panels with a similar tilt angle but different azimuth, 172.50 degrees.
Figure 40. South facing scenario with solar panels (Created using the Sketchup
software)
It was calculated that the nominal power rating of all these groups are approximately
127.80 kWp. Additionally, the total system has the ability to generate a total of 104549.00
kWh electricity per year. Moreover, a total of 5.40% shading loss has been subtracted
from the total production. On the other hand, the performance metrics of a solar system
that termed as specific yield was 818.07 kWh/kWp.
Depends on the solar radiation availability, specific yield can be varied in a range. The
actual value is driven by other factors such as module selection and balance of system
efficiency as well as exposure to shade, soiling, and snow. However, compared to the
average annual solar PV output value of 825 kWh/kWp in Southern Finland, the output
that was produced from the desired scenario can be considered as acceptable (Auvinen
and Fin Solar, 2016). Summary of this scenario can be seen in Appendix.

Figure 41. Comparison of monthly electricity consumption and PV production
It can be seen in Figure 41 that electricity consumption and production varies from month
to month, For example, in Finland, generally coldest days are lies in between November
to February, which can be seen in the electricity production and consumption scenarios
as well. It has stated in the earlier chapters that temperature has a relation with the overall
electricity consumption.
With the simulated outcome, it can be seen that, the electricity that produces from the
module can meet approximately 25.25% of yearly needs of the UOBGs. On the other
hand, it has measured that, more than 50% of the electricity demand in April to August
can feed with PV production.
Along with electricity generation, another significant benefit of Solar PV is that, it does
not release CO2 (carbon dioxide) in the environment during the electricity generation.
According to Oulun Energia, on average 270 g/kWh of CO2 generate in the Oulu region
during electricity production operations (Oulun Energia, 2018b). From that, an estimation
can be done how much CO2 emission will reduce during the lifespan of the PV system.
It has been measured that, approximately 28.23 tonnes/year of CO2 will decrease in the
atmosphere due to the desired PV system in the UOBGs, while at least a total of 846.85
tonnes of CO2 will free from the environment during the lifespan of the system.
0
10
20
30
40
50
60
Jan Feb Mar Apr May Jun Jul Aug Sep Oct Nov Dec
Tho
usa
nd
s
Scenario 1: Electricity Consumption vs PV Production
PV production (kWh) Electricity Consumption (kWh)

9.3 Scenario 2: Building Facing Module
In this scenario, PV modules are installed parallel to the building orientation, which
accumulated more panels on the roof and where maximum use of the spaces was
established.
Figure 42. Building facing scenario with solar panels (Created using Sketchup
software)
As seen in Figure 42, this building facing PV system contain a total of 471 pieces of solar
panels that are mounted on the roof. The nominal power rating which was simulated
estimated for the whole system is approximately 141.30 kWp, and the annual electricity
generation capacity is about 109771.50 kWh. However, a total of 5.13% shading loss has
been subtracted from the total production. The specific yield (kWh/kWp) that measured
for this system is 776.87.
Moreover, in the final report generated by Skelion, all the factors such as wind speed,
snow loads and system loss are considered for amounting the total electricity production.
Hence, it can be assumed that the total electricity production through the system has no
weather impact.

Figure 43. Comparison of monthly Greenhouse electricity consumption and PV
production for scenario 2
In Figure 43, it appears that the electricity generation is always lower than the total
consumption. However, the electricity generated in April to August can feed more than
56% of those months need. On the other hand, the total production in a year can meet
more than one-fourth of the total demand. It should take into consideration that the second
PV system is a bit larger than the first one, while it has 45 pieces of more solar panels.
Moreover, it is noticeable that this building oriented PV system can reduce a total of 29.64
tonnes CO2 per year, while in the whole lifetime 889.15 tonnes of CO2 will free from the
environment. A complete summary for this scenario is attached in the Appendix.
9.4 Energy Efficiency Gain Potential
According to the Energy Efficiency Directive, EU countries have a goal to reach its
energy efficiency by 20% by 2020 and 30% by 2030 (European Commission, 2018a).
However, the International Energy Agency warns that energy efficiency gains are at risk
as the world used 2% more energy in 2017 compared with the previous year. It has
estimated that since 2000 around 12% less energy use due to efficient technology (IEA,
2018a).
The growing trends of electrical equipment in day-to-day uses is one of the reasons for
global electricity demand growth (IEA, 2018d). However, energy efficient technology
innovation is also creating new opportunities. For example, if an energy efficient system
works together with renewable energy to deliver clean energy at the lowest cost, it can be
a useful method for reducing stress on fuel dependency.
0
10
20
30
40
50
60
Jan Feb Mar Apr May Jun Jul Aug Sep Oct Nov Dec
Tho
usa
nd
s
Scenario 2: Electricity Consumption vs PV Production
PV Production (kWh) Electricity Consumption (kWh)

As a significance, it is the prime concern to gain energy efficiency in all of the subsectors
using sustainable technologies and renewable energy sources, whereas solar energy could
be the best options among others.
For this thesis work, the UOBGs energy profile, as well as different aspects, were studied
to estimate the energy efficiency gain potential. In this section, the energy efficiency of
the two different PV scenario will compare with the electricity consumption by the
UOBGs.
Figure 44. Compared with electricity consumption the energy efficiency gain in
scenario 1
As seen in Figure 44, April to August period is the most significant productive month
compare to the rest of the year. For scenario 1, the electricity which generates from the
solar system in April can feed up to 43.98% demand for this month, which can reduce the
amount of 4.0284 tonnes of CO2 emissions. Similarly, with the May’s production can
meet a 61.29% demand for that month, which can reduce 4.67 tonnes CO2 load to the
atmosphere. Sequentially, in June 56.50%, July 57.35% and in August 41.37% electricity
demand can fulfil with solar energy, which can reduce a total of 12.34 tonnes of CO2
emission to the atmosphere.
In March and September, a significant amount of electricity produces through the solar
module, whereas March accounts for 27.83% of the demand and September accounts for
22.68%. To produce that much electricity in Oulu, the electricity production and supplier
company Oulun Energia generates 5.00 tonnes of CO2.
0
10
20
30
40
50
60
70
Ener
gy E
ffic
ien
cy G
ain
in %
Month
Energy efficiency gain from 1st scenario Jan
Feb
Mar
Apr
May
Jun
Jul
Aug
Sep
Oct
Nov
Dec

However, months with cold weather and dark days, January, February and November,
December are responsible for small amounts of electricity supply compared to the
demand.
According to scenario 2, the produced electricity in April can feed up to 45.98% of the
demand for that month. 4.21 tonnes of CO2 emissions can reduce with that much
electricity. Similarly, with May’s production can meet 65.93% of demand for that month,
which can reduce 5.02 tonnes of CO2 load to the atmosphere. Sequentially, in June
62.02%, July 62.43% and in August 43.73% of electricity demand can fulfil with solar
energy, which can reduce total 13.365 tonnes CO2 emission to the atmosphere.
Figure 45. Compared with electricity consumption the energy efficiency gain in
scenario 2
Moreover, a significant amount of electricity produces through the solar module in March
and September as well, whereas March accounts for 27.49% of the demand and
September accounts for 23.11%. To produce that much electricity in Oulu, an average
amount of 5.011 tonnes CO2 emits to the atmosphere. Conversely, although a small
amount of electricity produced in January, February and November, December, their total
volume is significant.
0
10
20
30
40
50
60
70
Ener
gy E
ffic
ien
cy G
ain
in %
Month
Energy efficiency gain from 2nd scenario Jan
Feb
Mar
Apr
May
Jun
Jul
Aug
Sep
Oct
Nov
Dec

10 COST AND PAYBACK CALCULATION
10.1 PV System Cost
Total investment cost is essential for estimating the payback period of a system. However,
investment cost directly correlated with PV module price, and the auxiliary components,
including the inverter, controls, tube, switchboard, system monitor, combiner boxes,
disconnects and commissioning. Meanwhile, PV module cost accounts for a third to half
of the total cost, while labour cost is liable for approximately 22% of the total investment
cost (Jovanovic et al., 2017). Additionally, the size of the project and the type of PV
module also influence the total investment cost.
Based on generation capacity, PV installations can be divided into three segments, while
system up to 10 kW referred to residential, and system ranging between 10 kW to 1 MW
is the commercial system. On the other hand, capacity more than 1 MW referred to utility
systems. Comparing the installation system cost, residential PV is much higher than
utility-scale plans.
In a review report, MIT mentioned that over the last few years in the USA, the PV system
price fallen up to 70%. Regarding this matter they have given their observation: due to
the decline in the price of modules and inverters, it affects the overall price of a PV system
(MIT Energy Initiative, 2015).
However, the market trends in Finland may not be like the USA, but a similar declining
trends are observed for PV system prices in Finland. In this thesis work, solar installation
cost was estimated using the price provided by Finsolar. According to Finsolar, in
Finland, 10 to 250 kWp PV system price ranges between 1050 to1350 €/kWp. On the
other hand, for a system that is above 250 kWp, the price can be between 950-1300 €/kWp
(Finsolar, 2016).
10.2 Electricity Price
The pay-back time of a PV system is strongly correlated with the future electricity price.
However, it is quite challenging to predict what will happen in the future electricity
market. Reviewing the yearly electricity price in Finnish Nord Pool Elspot market, it has

seen that the electricity price in Nordpool has been fluctuating within 30 to 50 €/MWh in
the last 14 years (figure 49). As seen in figure 49, non-linear trends make it difficult to
predict a future electricity price. On the other hand, considering the linear trend, the future
electricity price should be more than 40.00 €/MWh.
Figure 46. Annual average Elspot electricity prices in Finland. Based on data from
Nord Pool (2019b)
However, there are a prediction that the Nordic countries average electricity price would
be 43.21 €/MWh in 2020 and 44.64 €/MWh in 2030 (Koreneff et al., 2009). On the other
hand, if a producer consumes all the produced electricity, the PV investment can be
compared to the overall price of purchased electricity. Moreover, in Oulu, electricity
producer and supplier company, Oulun Energia offers different electricity contract, which
differs from 40 Euro to 90 Euro / MWh.
Moreover, according to Statistics Finland, in 2016 the electricity price for corporate
customers was about 8 cents/kWh, and for the family, the price was 12-18 cents/kWh
(Statistics Finland, 2018). On the other hand, in 2018 the average Nord Pool spot price
was 46.80 Euro / MW, or 4.68 cents/kWh (Nord Pool, 2019). To avoid all the difficulties,
for the price calculation, base price has taken as the 2018 average spot price, which is
much higher than the previous year. Total price calculates adding the base price with the
electricity transfer fee, general tax and value-added taxes as well. Currently, electricity
tax is 2.36 c/kWh (incl. VAT 24%). After adding all these additional costs with the base
price, the net price of electricity is determined.
y = 0,0399x - 41,043R² = 0,0004
0
10
20
30
40
50
60
2004 2006 2008 2010 2012 2014 2016 2018 2020
Eur/
MW
h
Year
Year vs Electricity Price

10.3 Evaluation of the Simulated PV Systems
The Finsolar calculator was used for generating payback scenarios, while all information
remains the same for two different case studies except the production inputs and power
rating.
Since there are three greenhouses inside the UOBGs, so that a tax reduction on electricity
price will be applicable for them. In Oulu, the transfer fee is equal for all, 3.52 cent/kWh,
while general tax for greenhouse 2.79 cents/ kWh. (Pohjoista voimaa, 2019). During the
calculation, this tax rebates also considered.
Moreover, the VAT for electricity uses in Finland is 24% of the total price of electricity
including base price, transfer fee and general tax. Hence, analysing the statistics of the
last five years electricity price, it assumes the change in reference price as of 0.3%.
Sequentially, the commercial rate of interest takes like 2%, while the real interest rate was
1.4% in 2018 (Bank of Finland, 2018). For avoiding the inflation rate and other influential
factors, 0.60% more annual interest charge is considered.
The panel’s performance digression rate 0.7% considered from the Solar WorldTM
guidebook. However the annual operation and management costs (O&M) were calculated
using Finsolar calculator. It has considered that the inverter will change in every ten years
and it is about 10% of the initial investment cost.
In addition to these, a percentage of investment will be aided by the government, while
the project is related to energy efficiency and also reduced the carbon emissions and other
environmental load causes for electricity production. According to Business Finland, 25%
of total investment in energy-generating projects can receive as an aid (Business Finland,
2019).
Table 15, represents the indexes of all cost which are used for calculating the cost and
profit for the two scenarios:

Table 15. Different cost, rate and measurements for economic evaluation
Electricity purchase price 4.68 cents/kWh
Electricity transmission price 3.52 cents/kWh
Electricity tax and service security fee 2.79 cents/kWh
The VAT on Purchase Power 24%
Intermediate result: Alternative cost of solar power 13.6 cents/kWh
Estimate of change in the reference price 0.3%
The system reference price without subsidies 1,350 euro/kWp
The share of potential investment aid in initial investment 25%
Financial Interest (First 10 Years) 2.0%
Cost of inverter replacement: the share of initial
investment. (Every 10th year)
10%
Solar PV’s efficiency decrease -0.7%
10.4 Tentative Payback Time (Scenario 1)
The values mentioned above were taken into consideration to measure the economic
evaluation of each scenario. Table 14 represents the results from the Finsolar calculator.
As stated earlier, the first PV model consists of 426 pieces of solar panels and has a power
rating of 127.80 kWp, which is estimated to produce 104549.00 kWh electricity per year.
As seen in Table 16, Finsolar calculator gives the output for the production and sales
revenue in the second column. From this calculation, it can observed that after 30 years
lifetime the PV module generates a total of 251 950 Euro revenue, whereas in the third
column it gives total investment along with the operation and maintenances cost and
inverter changing investment. In that case, a total of 214 985 Euro uses as an investment.

Table 16. Financial calculations over the life cycle for scenario 1 Year Production
- Sales
Value €
Investment
and O&M €
IRR
(%)
NPV € Buying
Price
€/kWh
Sale
price
€/kWh
PV
Producti
on
kWh/Yr
LCOE
€/kWh
0 0,0 € -129 398 €
1 13 862 € -1 882 € -90,7% -115 345 0,136 € 0,030 € 101720
2 13 810 € -1 869 € -64,6% -104 093 0,137 € 0,030 € 101008 0,657 €
3 13 758 € -1 856 € -44,4% -93 097 0,137 € 0,030 € 100301 0,446 €
4 13 706 € -1 843 € -30,7% -82 352 0,138 € 0,030 € 99599 0,340 €
5 13 655 € -1 830 € -21,4% -71 852 0,138 € 0,030 € 98901 0,277 €
6 13 603 € -1 817 € -14,8% -61 591 0,139 € 0,030 € 98209 0,234 €
7 13 552 € -1 804 € -10,0% -51 565 0,139 € 0,031 € 97522 0,204 €
8 13 501 € -1 792 € -6,5% -41 767 0,139 € 0,031 € 96839 0,181 €
9 13 450 € -1 779 € -3,8% -32 192 0,140 € 0,031 € 96161 0,164 €
10 13 400 € -19 020 € -5,0% -36 712 0,140 € 0,031 € 95488 0,167 €
11 13 349 € -1 754 € -2,5% -16 996 0,141 € 0,031 € 94820 0,154 €
12 13 299 € -1 742 € -0,7% -5 439 0,141 € 0,031 € 94156 0,143 €
13 13 249 € -1 730 € 0,7% 6 080 0,142 € 0,031 € 93497 0,134 €
14 13 199 € -1 718 € 1,8% 17 562 0,142 € 0,031 € 92842 0,126 €
15 13 149 € -1 706 € 2,8% 29 005 0,143 € 0,031 € 92192 0,119 €
16 13 100 € -1 694 € 3,5% 40 412 0,143 € 0,032 € 91547 0,113 €
17 13 051 € -1 682 € 4,1% 51 780 0,144 € 0,032 € 90906 0,108 €
18 13 001 € -1 670 € 4,7% 63 112 0,144 € 0,032 € 90270 0,103 €
19 12 953 € -1 658 € 5,1% 74 406 0,144 € 0,032 € 89638 0,099 €
20 12 904 € -18 900 € 4,9% 68 410 0,145 € 0,032 € 89011 0,105 €
21 12 855 € -1 635 € 5,3% 79 630 0,145 € 0,032 € 88387 0,101 €
22 12 807 € -1 624 € 5,6% 90 813 0,146 € 0,032 € 87769 0,097 €
23 12 759 € -1 612 € 5,9% 101 960 0,146 € 0,032 € 87154 0,094 €
24 12 711 € -1 601 € 6,2% 113 069 0,147 € 0,032 € 86544 0,091 €
25 12 663 € -1 590 € 6,4% 124 142 0,147 € 0,032 € 85938 0,089 €
26 12 615 € -1 579 € 6,6% 135 179 0,148 € 0,033 € 85337 0,086 €
27 12 568 € -1 568 € 6,7% 146 179 0,148 € 0,033 € 84740 0,084 €
28 12 520 € -1 557 € 6,9% 157 143 0,149 € 0,033 € 84146 0,082 €
29 12 473 € -1 546 € 7,0% 168 070 0,149 € 0,033 € 83557 0,080 €
30 12 426 € -1 535 € 7,1% 178 961 0,150 € 0,033 € 82972 0,078 €
Total 251 950 € -214 985 €
2761172
Among the outputs, two critical factors are a net present value (NPV) and the payback
time, which are correlates with each other. From NPV values it can measures the break
event point for investment, counting the time value of cash flow.
Considering this scenario, it has measured that the payback period is 12 years and at the
end of the lifetime the systems net present value will be 178 961 Euro. Usually, when a

system or investment returns NPV>0, it will considered as a profitable investment,
whereas the selected scenario gives a healthy NPV return at its 30th year.
Additionally, the internal rate of return (IRR) is a core component, which measures the
discount rate with which the NPV of the project is zero. It assumes that if the value of
IRR for investment is negative, that represent a value-destroying project or non-
profitable. The value that gets from the scenario, it is seen that with the increase of lifetime
the value of IRR approaches to positive value, and at the end of 12th year, it reaches the
positive value, which is the break-even point of the investment. It makes a sense that at
the end of the lifetime the IRR value stands at 7.1%.
Figure 47. Comparison between the electricity purchase price and PV generated
electricity price or LCOE
Another finding from the economic evaluation was LCOE or levelized cost of energy,
which represents here the PV generated electricity price for a system. The PV generated
electricity price with 30-year retention, scenario 1 gives 7.80 cents/kWh unit price,
whereas the purchasing price over 30 years period was 14 cents/kWh. As seen in the
above Figure 56, LCOE is decreasing with the increasing of lifetime, and after 12 years
it becomes smaller compared to the purchase price of the electricity. Moreover, it can
measure the operating self-sufficiency as well, which measures the financial stability of
a project. If the ratio of total revenue and total investment cost value is greater than 1, it
represents the self-sufficiency of a project. In that case, the mentioned scenario provided
a value greater than 1.

10.5 Tentative Payback Time (Scenario 2)
With 46 pieces of more panels, this model can produce 109771.50 kWh of electricity per
year. However, the specific yield for this module is smaller in amount compared to
scenario 1. Its’ specific yield 776.87 and the power rating 141.3 kWp, which is 13.5 unit
more to the first one.
Table 17. Financial calculations over the life cycle for scenario 2 Year Production
- Sales
Value €
Investment
and O&M
€
IRR
(%)
NPV € Buying
Price
€/kWh
Sale
price
€/kWh
PV
Productio
n kWh/Yr
LCOE
€/kWh
0 0,0 € -143 066 € 0
1 15 326 € -2 081 € -90,7% -127 530 € 0,136 € 0,030 € 112465
2 15 269 € -2 066 € -64,6% -115 089 € 0,137 € 0,030 € 111678 0,657 €
3 15 211 € -2 052 € -44,4% -102 931 € 0,137 € 0,030 € 110896 0,446 €
4 15 154 € -2 037 € -30,7% -91 051 € 0,138 € 0,030 € 110120 0,340 €
5 15 097 € -2 023 € -21,4% -79 442 € 0,138 € 0,030 € 109349 0,277 €
6 15 040 € -2 009 € -14,8% -68 097 € 0,139 € 0,030 € 108583 0,234 €
7 14 983 € -1 995 € -10,0% -57 011 € 0,139 € 0,031 € 107823 0,204 €
8 14 927 € -1 981 € -6,5% -46 179 € 0,139 € 0,031 € 107069 0,181 €
9 14 871 € -1 967 € -3,8% -35 593 € 0,140 € 0,031 € 106319 0,164 €
10 14 815 € -21 029 € -5,0% -40 590 € 0,140 € 0,031 € 105575 0,167 €
11 14 759 € -1 939 € -2,5% -18 791 € 0,141 € 0,031 € 104836 0,154 €
12 14 704 € -1 926 € -0,7% -6 013 € 0,141 € 0,031 € 104102 0,143 €
13 14 648 € -1 912 € 0,7% 6 723 € 0,142 € 0,031 € 103373 0,134 €
14 14 593 € -1 899 € 1,8% 19 417 € 0,142 € 0,031 € 102650 0,126 €
15 14 538 € -1 886 € 2,8% 32 069 € 0,143 € 0,031 € 101931 0,119 €
16 14 484 € -1 873 € 3,5% 44 680 € 0,143 € 0,032 € 101218 0,113 €
17 14 429 € -1 859 € 4,1% 57 250 € 0,144 € 0,032 € 100509 0,108 €
18 14 375 € -1 846 € 4,7% 69 779 € 0,144 € 0,032 € 99805 0,103 €
19 14 321 € -1 833 € 5,1% 82 266 € 0,144 € 0,032 € 99107 0,099 €
20 14 267 € -20 896 € 4,9% 75 637 € 0,145 € 0,032 € 98413 0,105 €
21 14 213 € -1 808 € 5,3% 88 042 € 0,145 € 0,032 € 97724 0,101 €
22 14 160 € -1 795 € 5,6% 100 406 € 0,146 € 0,032 € 97040 0,097 €
23 14 106 € -1 783 € 5,9% 112 730 € 0,146 € 0,032 € 96361 0,094 €
24 14 053 € -1 770 € 6,2% 125 013 € 0,147 € 0,032 € 95686 0,091 €
25 14 000 € -1 758 € 6,4% 137 256 € 0,147 € 0,032 € 95016 0,089 €
26 13 948 € -1 746 € 6,6% 149 458 € 0,148 € 0,033 € 94351 0,086 €
27 13 895 € -1 733 € 6,7% 161 620 € 0,148 € 0,033 € 93691 0,084 €
28 13 843 € -1 721 € 6,9% 173 742 € 0,149 € 0,033 € 93035 0,082 €
29 13 791 € -1 709 € 7,0% 185 824 € 0,149 € 0,033 € 92384 0,080 €
30 13 739 € -1 697 € 7,1% 197 866 € 0,150 € 0,033 € 91737 0,078 €
Total 320 565 € -237 695 €
3052846

As seen in Table 17, after 30 years lifetime the PV module generates a total of 320 565
Euro revenue, while the total investment cost is about 237 695 Euro.
It has measured that the payback period is 12 years and at the end of the lifetime the
systems net present value will be 197 866 Euro, i.e., it can consider as a profitable
investment. Moreover, it has seen that at the end of the 12th year, IRR reaches the positive
value, and it is 7.1%. Considering this scenario, the PV electricity price is 7.80 cents/kWh,
whereas the purchasing price over 30 years was 14 cents/kWh.
Additionally, LCOE is decreasing with the increase of the lifetime, and the same as the
previous scenario, after 12 years the product cost per unit will become smaller compared
to the purchase price of the electricity. Meanwhile, the ratio of total revenue and
investment cost value is greater than 1, which represent the self-sufficiency of this model.
10.6 Summary of the Scenario
In research assessment, evaluation of a scientific performance is an essential component,
while such evaluation can play a crucial role to determine strategies. From the two
scenarios, it can be seen that, with more investment, the overall output was higher. On
the other hand, with a significant number of lesser solar panels and investment, the
production capacity was closer to the bigger solar system. In this case, the quantity versus
quality of the issue is being exposed, while south-facing scenario could be termed as a
quality-based, whereas building facing as quantity.
For an overall justification on quality versus quantity, a summarized conclusion is
presented in Table 18. Here, it can be seen that, both have equal payback time with
different investment.
Table 18. Overall summery for the two scenario
Scenario Power kWp
Investment (Euro)
Payback (Year)
NPV (Euro) IRR
Need Covered
CO2 Reduction (tonnes)
Scenario 1 127.8 214985 12 178961 7.10 % 25.25% 846.85
Scenario 2 141.3 237695 12 197866 7.10 % 26.51% 889.15

10.7 Nordic Energy-Efficient Greenhouse Concept
Different countries in the Nordic region has been experiencing with different weather
conditions. Temperature differences followed by the sun visibility and the variation of
day-night length during winter and summer make the overall weather extremely diverse.
The diversity appears more when anyone moves towards south to north.
For example, if the temperature rises from -30 °C (in winter) to +25 °C (in summer), it
means 60 °C temperature goes ups and down between this two periods. Similarly, the
length of day and night also deviates from summer to winter. Due to these reasons, it may
not be possible to follow a single greenhouse technology for the entire Nordic region.
Furthermore, the significant challenge for the Nordic greenhouses is to find a way which
can fulfil energy efficiency needs as well as reduce the overall energy consumption. It
has been calculated that 10-30% of total energy is needed to adapt to the weather in
Europe.
However, the absolute use of electricity differs from 528 kWh/m2 (Finland) to 417 kWh/
m2 (Netherlands). In this case, concentrating on energy efficiency without any focus on
absolute energy use may have unexpected effects.
On the other hand, to improve environmental control with more CO2 supply, additional
lighting, and use of heating or cooling system, causes increased energy consumption. For
the Northern region, particularly in Finland (200 W/m2) and the Netherlands (200 W/m2),
artificial light requirements in greenhouses is very high.
After cross-matching all the available pieces of information acquired as the requirements
for an energy-efficient greenhouse, some best-fitted technologies are compiled in Table
19 for the Nordic region.

Table 19. Measures to improve energy-efficiency in Nordic greenhouses
Shape and
gutters
To maximize the use of incoming solar radiation: roof slope should
be 0o to 30o. Additionally, minimal dimensions of gutter, white
coated frames to limit the light interception.
Cover Double layer glass layer (high light transmittance) can be used for
Nordic greenhouses.
Insulation Inflated air layer insulation can be used for insulation. This kinds of
insulation create additional barrier between the greenhouse and its
surrounding, which will reduces heat loss through the convection
and ventilation.
Additionally, the north-wall below the growing level should be
insulated with solid walls, while it can store heat during a day to use
at night.
Producing
electricity
To produce electricity, TPV or STPV can be a wise selection for
solar modules, which can more easily be used in combination with
current greenhouse constructions and that will reduce an additional
space requirement. Combined Heat and Power generators (CHP)
also can be an alternative.
Humidity
control
Dehumidification with heat recovery and higher humidity set-
points.
Heat storage PCM could be a choice for heat storage in cold climate as the
efficiency level also high 75-90%. However, for large area BTES
could be an alternative.
Lighting The LED lighting system needs 51% lower cost compared to the
fluorescent lighting system and 71.5% from HPS. The light
wavelength is also in PAR range. However, a combination of LED-
HPS gives a better lighting quality for plants growth.
10.8 Improvement Possibilities in UOBGs
High-tech development is a process that is continuously running towards the new era. In
the fifth chapter of this thesis, various best available technologies (BAT) were discussed,
while examples were presented in chapter six. In this context, it is possible to replace old
technologies with such new, considering environmental aspects and surroundings as well
as affordable prices.
Through the proper analysis and utilizing the intelligence, it is possible to make the
University of Oulu Botanical Gardens greenhouse as an energy-efficient greenhouse.
There is also a high possibility to set up this greenhouse as an example in Northern
Finland. To find out the improvement possibilities in in UOBGs, data were collected from
several sources including the University Properties of Finland Ltd authority, head
gardener of the University of Oulu Botanical Gardens greenhouse, Tuomas Kauppila as
well as gardener Pasi Paavola.

During the winter and summer visits to the University of Oulu Botanical Gardens
greenhouse, in an interview with gardener Pasi Paavola, it came to know that the double
layer polycarbonate glazing materials are not suitable for plants' health. In some cases, it
was observed that plants' are suffering due to the excessive transmission of UV light
during the summer season.
On the other hand, due to the snow cover on the roof, the sunlight may not reaches to the
plants'. At the same time, ice on the roof increases the heating demand to maintain the
optimum temperature of the plants'. Therefore, innovative technology is needed that help
to melt the ice on the cover.
The conventional method for melting the snow on a greenhouse is to open the energy
blanket and turn the heat up. Moreover, double layer polycarbonate glazing delays heat
transfer and the rate in which snow melts. A simple technique can be used to overcome
from this by adjusting the air pressure between the two layers which allows the deflated
to acts as a single layer. However, high-tech glass-glazed greenhouses perform much
better than polycarbonate glazing cover against snow and ice on the roof (Horti Daily,
2018). It was asked during an interview that does they have any plans to replace the
covering material with glass or by anything else. Although they have no plans for this,
they are moving forward with innovative thinking.
As stated earlier in chapter three, 85% of energy utilised in a greenhouse is for heating
purpose, and it is responsible for the second largest cost after labour. Shen et al. (2017)
developed an HVAC system for building that can save 50% of annual energy cost, while
this air source integrated heat pump have the functions of space conditioning and water
heating. Therefore, in future if a HVAC system installed in the greenhouse, it will be a
great innovation for the energy savings.
Borehole thermal energy system is another option that can be installed around the
greenhouse to generate heat. This technology is already used in several EU countries
including the Netherlands (Gao, Zhao and Tang, 2015).
A previous study that was conducted by Stewart (Stewart, 2016) in his master's thesis
mentioned that SYK had thought about the future use of heat pumps. Thermal heat pumps
can be used for cooling purpose during summer, while electric heat pumps could be

installed to reduce the heating consumption. In that case, an audit is needed to compare
the cost-effectiveness between district heat and heat pumps.
On the other hand, adequate amount of lighting is a prime concern for a greenhouse,
because plants’ growth in greenhouses significantly influenced by the lighting quality,
especially the ranges of spectrums. Approximately 18% of energy consumed in the EU is
for the purpose of lighting. Therefore, the energy needs of lighting has to be kept in
consideration while choosing light bulbs for greenhouses.
It has been seen that LEDs have wide ranges spectral output considered with fluorescent,
HPS and MH. Moreover, in terms of lamp cost as well as energy cost with lifespan, the
LED’s are economically viable options. Additionally, the LED lighting system needs
51% lower cost compared to the fluorescent lighting system. Moreover, compared to HPS
lamps, the LED system is 71.5% more economical. However, experimental results show
that the highest yield achieved when the grower used HPS-LED lighting combination.
The HPS-LED lighting system already equipped in the UOBGs greenhouse. However,
the LED light can be used in between two rows of plants’ to obtain better illumination.
Sensor-based LED system could be the right choice, while LED is a perfect candidate for
visible light communication (VLC). Combination of VLC-LED light can perform as a
sensor that will collects all indoor climate information and depends on the information
required adjustment will take place remotely.
It has been seen from the energy consumption profile for the year of 2018 that the peak
demand of the UOBGs occurs during day time due to the full-phased operation of all part
of this sector.
On the other hand, the appropriate environment of solar power generation occurs in the
presence of sunlight. Due to this reason, a photovoltaic system could be installed in the
botanical garden's premises. There is also potential in replace the glazing of the
greenhouse with transparent or semi-transparent PV. However, the UOBGs Authority
does not have such a plan to change the glazing or distorted the original architecture of
the greenhouses. In that case, the roofs of the adjacent office buildings can be used to
placing the PV array. Before that roof areas should be evaluated for their potential of a
PV installation (load-bearing, snow load, etc.). It has been seen that the museum, library
and administrative office roofs are empty and possible to installed PV arrays on them.

However, the shading effect and load capacity of the building should be measured before
this establishment.

11 SUMMARY AND CONCLUSIONS
In this thesis, the energy-efficient greenhouse in the northern region was approached to
uncover their prospects and sustainability. In order to conclude, answers were searched
against several questions in the entire study, while the first one was: what are the essential
elements required for an energy-efficient greenhouse.
It was observed that greenhouse width and length ratio within 0.1 to 0.5 is most energy-
efficient, while multi-module east-west (E–W) oriented uneven-span shape is useful as
they receive the highest solar radiation. On the other hand, considering the heat loss, light
transmission, thermal transmission, and life expectancy, double layer glass cover is the
best-fitted glazing, while inflated air layer insulation has better heat conservation ability.
Moreover, to controls the exchange of carbon dioxide and oxygen as well as heat,
temperature and humidity inside a greenhouse, HVAC design observed as a suitable
energy efficient technology compared with others. On the other hand, energy plays a
significant role in promoting energy efficiency. To achieve EUs’ energy saving and
renewability target the geothermal energy and solar energy can be considered for
sustainable heating and electricity source to use in the greenhouse farming sector.
The second objective of this thesis was to oversee the prospects of greenhouse farming in
Northern Finland. To asses this issue, northern climate and plants need for their growth
was cross-matched. In addition to this, a comparative analysis was done for greenhouse
farming against open-field farming in Finland. It has been perceived that although solar
radiation levels in North Finland are sometimes less than the requirement for plants
growth, it is possible to produce a large portion of the total demand from this sector if
necessary, heat and light are provided for year-round cultivation. The humidity is one of
the factors that influence plants growth. While 70% to 90% of relative humidity is
considered as safe range, in Northern Finland, the relative humidity of this region is
mostly within this range. Therefore, evaporative cooling or fog systems are not required
to control the humidity inside a greenhouse, which reduced the overall energy
consumption. On the other hand, according to the statistics of the past years, in
comparison to the open field methods, greenhouses utilised 48 times of less land and one-
third of energy. However, the output was the same as the open field, which is another
evidence of the usefulness of greenhouse cultivation in this region.

In order to assess the third inquiry, where innovation needs in the greenhouses were under
the screening, innovation scrutiny was performed concerning the best available
technology and set against the existing technology of the University of Oulu Botanical
Gardens greenhouses. It has been observed that due to aesthetic shape there is a limitation
to upgrade its covering material with double layer glass sheets. However, it is possible to
upgrade existing lighting with high-tech LED, and heating and ventilation requirement
can be fulfilled by the energy-efficient HVAC system and solar roof vent. Additionally,
as 85% of total energy cost is responsible for heating, the BTES can be introduced to
produce heat locally. For example, if a borehole thermal energy system is installed, it can
store heat for greenhouse as well as could be a potential source for district heating
network.
Apart from the ‘Nordic energy-efficient greenhouse’ concept, the critical goal of this
thesis work is to innovate an idea where the greenhouses can be a source of clean energy.
Finland is a crucial player in the utilisation of renewable energy. Although it has the goal
to increase the share of renewability in every sector, nevertheless, the extensive use of
solar energy in agriculture is missing. Meanwhile, as the sun releases more energy in an
hour than the whole world consumes in a year, it can assume that the energy needs per
square metre in a greenhouse is significantly lower than the sun release energy per square
metre. Additionally, the price of solar technology is reducing simultaneously.
Considering these arguments photovoltaics (PV) modules are considered as an electricity
source for the UOBGs greenhouses. The original idea was transparent or semi-transparent
PV. However, that was deemed too complicated and also observed that it is challenging
to fit them on the pyramid-shaped greenhouse without distorting their aesthetic design.
Therefore, the rooftop PV module is chosen and carry out an extensive experiment to
evaluate their efficiency against the present energy consumption profile. In order to
explain the appropriateness of these solar modules, two different scenarios were studied,
whereas energy consumption current data was acquired from the University Properties of
Finland Ltd (SYK).
Additionally, solar radiation data were obtained to understand the feasibility of PV
modules in Northern Finland. Based on solar radiation model data, it has observed that in
future the average annual radiation will be within 841 to 877 kWh/m2. However, it has
perceived that in the summer months this range is much higher compared to winter

months. Consequently, from the energy consumption data, it was observed that 75.68%
of electricity use at peak hours, which is occurred at daytime, while the rest of the
consumption followed at night. On the other hand, PV module produces electricity at
daytime, which can supplement the peak consumption at daytime.
After performed analysis the month to month yield production, investment cost and the
payback period was evaluated, where it has observed that both scenarios have contributed
in their standard with the best output. While with 46 more PV tiles and with 141.3 kWp
power rating, building facing system generates more energy than the true south facing
scenario. Although both scenarios have 12-year payback time, scenario 1 need less
investment and lower NPV. However, the levelized cost of energy that generates from
both scenarios is lower than the total price of the market. Moreover, in the context of the
environmental aspect, the CO2 reduction potential is high in scenario two as it produces
more amount of electricity with more PV arrays. It has also justified that payback time
can be varied for different aspects such as climate, location, the price of PV array,
installation cost and electricity tariff as well. Comparing to northern USA (13.8 years),
Poland (13.5 years), Sri Lanka (18-22 years), Sweden (9.2 years), Nigeria (10 years), the
two scenarios can be considered as a profitable energy source (Kessler, 2017; Wijesuriya
et al., 2017; Oko et al., 2012; Molavi and Bydén, 2018). It was also kept in consideration
that the global-weighted average installed cost and LCOE for solar power is decreasing.
According to IRENA, in 2017 installed cost and LCOE was fell 27% and 33% from 2010
respectively (Feldman, Jack Hoskins and Robert Margolis, 2017).
In the northern climate, snow covering impact on PV modules can be considered as one
of the disadvantages. However, innovative technology such as a sensor-based heating
system on glazing can be a simple solution. For example, this sensor-based heating
technology activates when the temperature drops, and with climbing the temperature, it
will stop to work. However, it should be kept in mind that additional technology also a
cause for additional energy consumption. Moreover, by adjusting the air pressure between
the two layers can be another solution, which will allow the deflated to acts as a single
layer.
Assessing the above pieces of information, data and review that the PV-oriented
greenhouse in Northern Finland, especially in Oulu, has the potential to emerge as an
innovative alternative to gaining capacity in agriculture and energy sector. However,

without subsidies and investment cost, PV is not a feasible way to reach renewable energy
destinations in Finland. Therefore, in support of EU's Common Agricultural Policy, for
the agricultural developments in Finland, the prospect of PV technology should measure
and deploy cautiously. The Ministry of Agriculture and Forestry and the Ministry of the
Environment, as well as policymakers, should think about the way that will create interest
to use and implement PV technology in the agricultural sector. Notably, a policy is needed
that can secure farmers profit when they use PV in their greenhouses without any
investment.
11.1 Assumptions
In the economic evaluation, several assumptions were made for the two scenarios. For
example, Nord Pool spot price was considered for the electricity price, while it has
observed that the price was not fixed over the year, and anything can happen in the energy
market. If high-feed tariff applies for the profit calculation, the payback time will reduce.
Moreover, the PV modules were used are made by the USA, and the unit price is reduced
already from 522.11 to 204.23 euro.
On the other hand, during the investment calculation, it was assumed that the investment
needed for a solar array is around 1350 euro, which seems slightly higher compared to
the unit price of the solar PV cells.
Due to these estimations, the actual payback time and investment cost may differ with the
prices that use for the profit evaluation.
11.2 Further Research
It is possible to expand this thesis work in several ways. First of all, the outcome found
in this work was based on several assumptions regarding economics. A more precise
economic analysis would help determine payback time and cost for the generated
electricity.
Secondly, the expectation was to consider the installation of transparent solar panels on
the greenhouse. However, due to the aesthetic design of the UOBG’s greenhouses and
lower efficiency level of transparent solar panels, this idea was abandoned in favour of

using rooftop solar panels. Further work could consider a variety of panel materials and
compare their energy generation scenarios and energy demand for plants' growth in
different months.
Moreover, the snow effect on the solar panels, is a very relevant issue in Northern Finland.
There is room for further work to understand the plants' response over different colour
lighting, while visible light communication (VLC) system could be used for monitoring
the indoor environment and plants' growth.

12 REFERENCES
Ahamed, M. S., Guo, H. and Tanino, K. (2018) ‘Energy-efficient design of greenhouse
for Canadian Prairies using a heating simulation model’, International Journal of Energy
Research. John Wiley & Sons, Ltd, 42(6), pp. 2263–2272. doi: 10.1002/er.4019.
Ahamed, M. S., Guo, H. and Tanino, K. (2019a) ‘Energy saving techniques for reducing
the heating cost of conventional greenhouses’, Biosystems Engineering. Academic Press,
178, pp. 9–33. doi: 10.1016/J.BIOSYSTEMSENG.2018.10.017.
Ahamed, M. S., Guo, H. and Tanino, K. (2019b) ‘Energy saving techniques for reducing
the heating cost of conventional greenhouses’, Biosystems Engineering. Academic Press,
178, pp. 9–33. doi: 10.1016/J.BIOSYSTEMSENG.2018.10.017.
Alternative Energy Tutorial (2018) Photovoltaic Solar Cell for Photovoltaic Solar
Panels. Available at: http://www.alternative-energy-tutorials.com/solar-
power/photovoltaics.html (Accessed: 18 November 2018).
Auvinen, K. and Fin Solar (2016) What would be a good way to promote consumer
investment in photovoltaic. Available at: http://www.finsolar.net/category/caset/
(Accessed: 6 October 2018).
Bakker, J. C. (2009) ‘Energy saving greenhouses’, Chronica. Hortivulturae, 49(2), pp.
19–23.
Bank of Finland (2018) BANK OF FINLAND ARTICLES ON THE ECONOMY. Available
at: www.bofbulletin.fi (Accessed: 4 February 2019).
Bartzanas, T., Tchamitchian, M. and Kittas, C. (2005) ‘Influence of the Heating Method
on Greenhouse Microclimate and Energy Consumption’, Biosystems Engineering.
Academic Press, 91(4), pp. 487–499. doi: 10.1016/J.BIOSYSTEMSENG.2005.04.012.
Bazgaou, A. et al. (2018) ‘An experimental study on the effect of a rock-bed heating
system on the microclimate and the crop development under canarian greenhouse’, Solar
Energy. Pergamon, 176, pp. 42–50. doi: 10.1016/J.SOLENER.2018.10.027.

Bertrand, C. et al. (2018) ‘Solar irradiation from the energy production of residential PV
systems’, Renewable Energy. Pergamon, 125, pp. 306–318. doi:
10.1016/J.RENENE.2018.02.036.
Brite (2019) Thermal Glasses | Thermal Window Glasses for homes and office buildings
| Transparent Thermal Window Glasses | Transparent Solar Thermal Window Glasses by
BriteSolar. Available at: https://www.britesolar.com/technology/brite-smart-glass/
(Accessed: 21 February 2019).
Brown, J. W. (2006) ‘Light in the Greenhouse: How Much is Enough?’
Available at: https://www.cropking.com/blog/light-greenhouse-how-much-enough
(Accessed: 8 December 2019).
Business Finland (2019) Energy aid - Business Finland, CLIMATE- AND
ENVIRONMENT-FRIENDLY INVESTMENT AND INVESTIGATION PROJECTS.
Available at: https://www.businessfinland.fi/en/for-finnish-
customers/services/funding/sme/energy-aid (Accessed: 4 February 2019).
Çakır, U. and Şahin, E. (2015) ‘Using solar greenhouses in cold climates and evaluating
optimum type according to sizing, position and location: A case study’, Computers and
Electronics in Agriculture. Elsevier, 117, pp. 245–257. doi:
10.1016/J.COMPAG.2015.08.005.
Campiotti, C. et al. (2008) ‘Photovoltaic as sustainable Energy for greenhouse and plant
production system’, Acta Horticulturae, (797), pp. 373–378. doi:
10.17660/ActaHortic.2008.797.53.
Castilla, N. (2013). Greenhouse technology and management. 2nd ed. Wallingford:
CABI, pp.30-41.
Chai, L., Ma, C. and Ni, J.-Q. (2012) ‘Performance evaluation of ground source heat
pump system for greenhouse heating in northern China’, Biosystems Engineering.
Academic Press, 111(1), pp. 107–117. doi: 10.1016/J.BIOSYSTEMSENG.2011.11.002.
Chikate, B. V, Sadawarte, Y. A. and Sewagram, B. D. C. O. E. (2015) The Factors
Affecting the Performance of Solar Cell, International Journal of Computer Applications.

Available at:
https://pdfs.semanticscholar.org/f36d/c848575cf06c20301547f08bc127a3f30bbb.pdf
(Accessed: 2 February 2019).
Climateguide.fi web service (2018) Finland´s changing climate - ilmasto-opas.fi.
Available at: http://ilmasto-opas.fi/en/ilmastonmuutos/suomen-muuttuva-ilmasto/-
/artikkeli/1c8d317b-5e65-4146-acda-f7171a0304e1/nykyinen-ilmasto-30-vuoden-
keskiarvot.html (Accessed: 9 September 2018).
Cuce, E. and Cuce, M. (2013) ‘A comprehensive review on solar cookers’, Applied
Energy, 102, pp. 1399–1421. doi: 10.1016/j.apenergy.2012.09.002.
Cuce, E., Harjunowibowo, D. and Cuce, P. M. (2016) ‘Renewable and sustainable energy
saving strategies for greenhouse systems: A comprehensive review’, Renewable and
Sustainable Energy Reviews. Pergamon, 64, pp. 34–59. doi:
10.1016/J.RSER.2016.05.077.
Cuce, E., Young, C.-H. and Riffat, S. B. (2015) ‘Thermal performance investigation of
heat insulation solar glass: A comparative experimental study’, Energy and Buildings, 86,
pp. 595–600. doi: 10.1016/j.enbuild.2014.10.063.
D’Arpa, S. et al. (2016) ‘Heating requirements in greenhouse farming in southern Italy:
evaluation of ground-source heat pump utilization compared to traditional heating
systems’, Energy Efficiency. Springer Netherlands, 9(5), pp. 1065–1085. doi:
10.1007/s12053-015-9410-y.
Danila, E. (2009) ‘EFFICIENCY OF SOME GROWING LIGHT SYSTEMS FOR
TOMATOES’, in. Iaşi, Romania: 7TH INTERNATIONAL CONFERENCE ON
ELECTROMECHANICAL AND POWER SYSTEMS. doi: 10.13140/2.1.3661.8562.
Danila, E. and Lucache, D. D. (2016) ‘Efficient lighting system for greenhouses’, in 2016
International Conference and Exposition on Electrical and Power Engineering (EPE).
IEEE, pp. 439–444. doi: 10.1109/ICEPE.2016.7781379.
Dǎnilǎ, E. and Lucache, D. D. (2017) ‘Cost effectiveness of growing plant lighting
system’, Journal of Electrical Engineering, 13(4), pp. 224–229.
Delta Energy & Environment Ltd (2016) Evidence Gathering: Thermal Energy Storage
(TES) Technologies Evidence Gathering: Thermal Energy Storage (TES) Technologies
Acknowledgements. Available at: www.nationalarchives.gov.uk/doc/open-government-
licence/ (Accessed: 24 April 2019).
Djevic, M. and Dimitrijevic, A. (2009) ‘Energy consumption for different greenhouse
constructions’, Energy. Pergamon, 34(9), pp. 1325–1331. doi:
10.1016/J.ENERGY.2009.03.008.
Drijver, B. and Willemsen, A. (2015) ‘Groundwater As a Heat Source for Geothermal
Heat Pumps’, Source, (May), pp. 1–11.
Dutta Gupta, S. and Agarwal, A. (2017) ‘Artificial Lighting System for Plant Growth and
Development: Chronological Advancement, Working Principles, and Comparative
Assessment’, in Light Emitting Diodes for Agriculture. Singapore: Springer Singapore,
pp. 1–25. doi: 10.1007/978-981-10-5807-3_1.
EIA (2018) Solar Thermal Power Plants - Energy Explained, Your Guide To
Understanding Energy - Energy Information Administration. Available at:
https://www.eia.gov/energyexplained/?page=solar_thermal_power_plants (Accessed: 22
December 2018).
Emmi, G., Zarrella, A., De Carli, M. and Galgaro, A. (2015). An analysis of solar assisted
ground source heat pumps in cold climates. Energy Conversion and Management, 106,
pp.660-675. doi: 10.1016/J.ENCONMAN.2015.10.016.
Emmott, C. J. M. et al. (2015) ‘Organic photovoltaic greenhouses: a unique application
for semi-transparent PV?’, Energy & Environmental Science. The Royal Society of
Chemistry, 8(4), pp. 1317–1328. doi: 10.1039/C4EE03132F.
Energysaga (2019) Solar Panel Efficiency: What Panels Are Most Efficient? |
EnergySage. Available at: https://news.energysage.com/what-are-the-most-efficient-
solar-panels-on-the-market/ (Accessed: 21 March 2019).
Esen, M. and Yuksel, T. (2013) ‘Experimental evaluation of using various renewable
energy sources for heating a greenhouse’, Energy and Buildings. Elsevier, 65, pp. 340–

351. doi: 10.1016/J.ENBUILD.2013.06.018.
EUR-Lex (2014) EUR-Lex - 52014DC0330 - EN - EUR-Lex, European Energy Security
Strategy . Available at: https://eur-lex.europa.eu/legal-
content/EN/ALL/?uri=CELEX:52014DC0330&qid=1407855611566 (Accessed: 17
January 2019).
European Commission (2018a) Energy Efficiency Directive | Energy, Energy Efficiency
Directive. Available at: https://ec.europa.eu/energy/en/topics/energy-efficiency/energy-
efficiency-directive (Accessed: 3 February 2019).
European Commission (2018b) The CAP in Finland. Available at:
https://ec.europa.eu/info/sites/info/files/food-farming-
fisheries/by_country/documents/cap-in-your-country-fi_en.pdf (Accessed: 26 December
2018).
European Commission (2019) THE POST-2020 COMMON AGRICULTURAL POLICY:
ENVIRONMENTAL BENEFITS AND SIMPLIFICATION. Available at:
https://ec.europa.eu/info/sites/info/files/food-farming-
fisheries/key_policies/documents/cap-post-2020-environ-benefits-simplification_en.pdf
(Accessed: 5 February 2019).
European Parliament (2018) Energy policy: general principles | Fact Sheets on the
European Union | European Parliament. Available at:
http://www.europarl.europa.eu/factsheets/en/sheet/68/energy-policy-general-principles
(Accessed: 27 December 2018).
Eurostat (2017) Archive:Consumption of energy - Statistics Explained. Available at:
https://ec.europa.eu/eurostat/statistics-
explained/index.php?title=Archive:Consumption_of_energy (Accessed: 14 December
2018).
Fedoroff, N. V (2015) ‘Food in a future of 10 billion’, Agriculture & Food Security.
BioMed Central, 4(1), p. 11. doi: 10.1186/s40066-015-0031-7.
Feldman, D., Jack Hoskins, N. and Robert Margolis, D. (2017) Q4 2017/Q1 2018 Solar

Industry Update. Available at: https://www.nrel.gov/docs/fy18osti/71493.pdf (Accessed:
12 February 2019).
Fernández, J. E. and Bailey, B. J. (1992) ‘Measurement and prediction of greenhouse
ventilation rates’, Agricultural and Forest Meteorology, 58(3–4), pp. 229–245. doi:
10.1016/0168-1923(92)90063-A.
Finnish Environment Institute (2014) Environment > Annual hydrological report
2013. Available at: https://www.ymparisto.fi/en-
US/Maps_and_statistics/Hydrological_observations/Monthly_hydrological_reports/Ann
ual_hydrological_report_2013(30163) (Accessed: 8 July 2018).
Finnish Meteorological Institute (2017a) Climate elements - Finnish Meteorological
Institute, Climate elements. Available at: https://en.ilmatieteenlaitos.fi/climate-elements
(Accessed: 25 February 2019).
Finnish Meteorological Institute (2017b) Climate elements - Finnish Meteorological
Institute, Climate elements. Available at: https://en.ilmatieteenlaitos.fi/climate-elements
(Accessed: 21 May 2018).
Finnish Meteorological Institute (2017c) Climate elements - Finnish Meteorological
Institute, Climate elements. Available at: https://en.ilmatieteenlaitos.fi/climate-elements
(Accessed: 22 May 2018).
Finnish Meteorological Institute (2017d) Climate elements - Finnish Meteorological
Institute, Wind and storms. Available at: https://en.ilmatieteenlaitos.fi/climate-elements
(Accessed: 12 January 2019).
Finsolar (2016) Price levels and profitability of photovoltaic systems. Available at:
http://www.finsolar.net/aurinkoenergian-hankintaohjeita/aurinkosahkon-hinnat-ja-
kannattavuus/ (Accessed: 6 November 2018).
Food and Agriculture Organization (2013) Good Agricultural Practices for greenhouse
vegetable crops -Principles for Mediterranean climate areas. Rome. Available at:
www.fao.org/publications (Accessed: 3 July 2018).
Fu, F., Feurer, T., Jäger, T., Avancini, E., Bissig, B., Yoon, S., Buecheler, S. and Tiwari,
A. (2015). Low-temperature-processed efficient semi-transparent planar perovskite solar
cells for bifacial and tandem applications. Nature Communications, 6(1), p. 8932. doi:
10.1038/ncomms9932.
Gaisma (2018) Oulu, Finland - Sunrise, sunset, dawn and dusk times for the whole year.
Available at: https://www.gaisma.com/en/location/oulu.html (Accessed: 5 December
2018).
Gao, L., Zhao, J. and Tang, Z. (2015) ‘A Review on Borehole Seasonal Solar Thermal
Energy Storage’, Energy Procedia. Elsevier B.V., 70, pp. 209–218. doi:
10.1016/j.egypro.2015.02.117.
Gao, Z. (2011) ‘DEHUMIDIFICATION OF GREENHOUSES IN COLD REGIONS’.
University of Saskatchewan. Available at: https://harvest.usask.ca/handle/10388/ETD-
2011-12-294 (Accessed: 13 December 2018).
Garcı́a, J., De la Plaza, S., Navas, L., Benavente, R. and Luna, L. (1998). Evaluation of
the Feasibility of Alternative Energy Sources for Greenhouse Heating. Journal of
Agricultural Engineering Research, 69(2), pp.107-114. doi: 10.1006/JAER.1997.0228.
Gayral, B. (2017) ‘LEDs for lighting: Basic physics and prospects for energy savings’,
Comptes Rendus Physique. Elsevier Masson, 18(7–8), pp. 453–461. doi:
10.1016/J.CRHY.2017.09.001.
Gigi, R., Heather, K., Steve, V., and Karl, Z. (2018) Future of Food, InTeGrate. Available
at: https://serc.carleton.edu/integrate/teaching_materials/food_supply/index.html
(Accessed: 5 November 2018).
Gioia D., Massa K., Hyeon-Hye, Wheeler, M., and Mitchell, A. (2008) ‘Plant
Productivity in Response to LED Lighting’, American Society for Horticultural Science.
Available at: https://journals.ashs.org/hortsci/view/journals/hortsci/43/7/article-
p1951.xml (Accessed: 22 December 2018).
Gołaszewski, J. et al. (2012) Country data on energy consumption in different agro-
production sectors in the European countries Project Deliverable 2.1. Available at:

http://www.agree.aua.gr/files/agree_state.pdf (Accessed: 15 July 2018).
Google Earth (2019) Google Earth, Oulu Botanical Gardens Map. Available at:
https://earth.google.com/web/@65.06360718,25.46458046,15.39404704a,154.4775872
1d,35y,-0h,44.99834608t,-0r (Accessed: 29 January 2019).
Goosen, M., Sablani, S., Paton, C., Perret, J., Al-Nuaimi, A., Haffar, I., Al-Hinai, H. and
Shayya, W. (2003). Solar energy desalination for arid coastal regions: development of a
humidification–dehumidification seawater greenhouse, Solar Energy. Pergamon, 75(5),
pp. 413–419. doi: 10.1016/J.SOLENER.2003.07.007.
Gourdo, L., Fatnassi, H., Tiskatine, R., Wifaya, A., Demrati, H., Aharoune, A. and
Bouirden, L. (2019). ‘Solar energy storing rock-bed to heat an agricultural greenhouse’,
Energy. Pergamon, 169, pp. 206–212. doi: 10.1016/J.ENERGY.2018.12.036.
Greenhouse Management (2018) Choose the right light - Greenhouse Management,
Choose the right light. Available at: https://www.greenhousemag.com/article/choose-the-
right-light/ (Accessed: 23 January 2019).
Greenmatch (2018) Differences Between Solar PV and Solar Thermal | GreenMatch.
Available at: https://www.greenmatch.co.uk/blog/2016/04/differences-between-solar-
photovoltaics-and-solar-thermal (Accessed: 22 December 2018).
Greenmatch (2019) Transparent Solar Panels: GreenMatch. Available at:
https://www.greenmatch.co.uk/blog/2015/02/transparent-solar-panels (Accessed: 21
December 2018).
Horti Daily (2017) Biggest organic greenhouse of Germany opened. Available at:
https://www.hortidaily.com/article/39974/Biggest-organic-greenhouse-of-Germany-
opened/ (Accessed: 29 December 2018).
Horti Daily (2018) Greenhouse snow load and removal. Available at:
https://www.hortidaily.com/article/6040359/greenhouse-snow-load-and-removal/
(Accessed: 2 December 2018).
ICRC (2017) Technical Review: Borehole Drilling and Rehabilitation Under Field

Conditions. Available at: https://www.icrc.org/en/publication/0998-technical-review-
borehole-drilling-and-rehabilitation-under-field-conditions (Accessed: 25 December
2018).
IEA (2014) Technology Roadmap Energy storage. Available at:
https://webstore.iea.org/technology-roadmap-energy-storage (Accessed: 24 April 2019).
IEA (2018a) Energy efficiency gains at risk of slowing down without renewed government
focus. Available at: https://www.iea.org/newsroom/news/2017/october/energy-
efficiency-gains-at-risk-of-slowing-down-without-renewed-government-focus.html
(Accessed: 3 February 2019).
IEA (2018b) Renewables 2018: Market analysis and forecast from 2018 to 2023.
Available at: https://www.iea.org/renewables2018/power/ (Accessed: 22 January 2019).
IEA (2018c) Renewables 2018: Market analysis and forecast from 2018 to 2023.
Available at: https://www.iea.org/renewables2018/heat/ (Accessed: 22 December 2018).
IEA (2018d) The global exchange for energy efficiency policies, data and analysis.
Available at: https://www.iea.org/topics/energyefficiency/ (Accessed: 9 October 2018).
IEA SHC (2018) Solar Heat Worldwide 2018. Available at: http://www.iea-shc.org/
(Accessed: 22 December 2018).
Jain, D. and Tiwari, G. N. (2002) ‘Modeling and optimal design of evaporative cooling
system in controlled environment greenhouse’, Energy Conversion and Management.
Pergamon, 43(16), pp. 2235–2250. doi: 10.1016/S0196-8904(01)00151-0.
Jovanovic, J., Sun, X., Stevovic, S. and Chen, J. (2017). Energy-efficiency gain by
combination of PV modules and Trombe wall in the low-energy building design. Energy
and Buildings, 152, pp.568-576. doi: 10.1016/j.enbuild.2017.07.073.
JRC (2017) JRC Photovoltaic Geographical Information System (PVGIS) - European
Commission, PHOTOVOLTAIC GEOGRAPHICAL INFORMATION SYSTEM. Available
at: http://re.jrc.ec.europa.eu/pvg_download/map_index.html (Accessed: 2 February
2019).

Junginger, M. and Mai-Moulin, T. (2018) National Policy Framework in the Netherlands.
Available at:
http://www.iea.org/policiesandmeasures/renewableenergy/?country=netherlands
(Accessed: 5 November 2018).
Just4Growers (2018) How do High Intensity Discharge (HID) grow lights work? | Just
For Growers. Available at: http://www.just4growers.com/stream/grow-lights/how-do-
high-intensity-discharge-(hid)-grow-lights-work.aspx (Accessed: 17 September 2018).
Kalogirou, S. (2003) ‘The potential of solar industrial process heat applications’, Applied
Energy. Elsevier, 76(4), pp. 337–361. doi: 10.1016/S0306-2619(02)00176-9.
Kaukoranta, T., Jokinen, K., Näkkilä, J. and Särkkä, L. (2017) LED-valotusta
kasvihuoneeseen Tutkimustuloksia ja kokemuksia 2016. Available at:
http://urn.fi/URN:ISBN:978-952-326-370-3 (Accessed: 17 September 2018).
Kaukoranta, T. (2017) Savings and efficiency in greenhouse cultivation through LED
lights - Luonnonvarakeskus. Available at: https://www.luke.fi/en/blog/mt-savings-
efficiency-greenhouse-cultivation-led-lights/ (Accessed: 17 April 2018).
Kessler, W. (2017). Comparing energy payback and simple payback period for solar
photovoltaic systems. E3S Web of Conferences, 22, p.80. doi:
10.1051/e3sconf/20172200080.
Kinney, L., Hutson, J. and Clute, G. (2012) ‘Energy-Efficient Greenhouse Breakthrough’,
ACEEE, pp. 176–188. Available at: https://aceee.org/files/proceedings/2012/start.htm
(Accessed: 21 November 2018)
Koreneff, G., Ruska, M., Kiviluoma, J., Shemeikka, J., Lemström, B., Alanen, R. and
Koljonen, T. (2009) Future development trends in electricity demand. VTT Research
Notes 2470. Available at: https://www.vtt.fi/inf/pdf/tiedotteet/2009/T2470.pdf
(Accessed: 7 September 2018).
Kukkonen, Ilmo T. 2000. 'Geothermal energy in Finland.' In Proceedings World
Geothermal Congress 2000, 277–82. Espoo: Proceedings World Geothermal Congress
2000. https://www.geothermal-energy.org/pdf/IGAstandard/WGC/2000/R0778.PDF.

(Accessed: 22 November 2018).
Lanahan, M. and Tabares-Velasco, P. C. (2017) ‘Seasonal thermal-energy storage: A
critical review on BTES systems, modeling, and system design for higher system
efficiency’, Energies, 10(6), pp. 2–24. doi: 10.3390/en10060743.
Latimer, J. G. (2009) Dealing with the High Cost of Energy for Greenhouse Operations,
Virginia Cooperative Extension. Virginia. Available at:
http://www.hort.vt.edu/floriculture/documents/EnergyGreenhouse.pdf.
Li, Q. and Kubota, C. (2013) ‘The effects of light-emitting diode lighting on greenhouse
plant growth and quality’, Agricultural and Food Science, 22(2), pp. 223–234. doi:
10.1016/j.envexpbot.2009.06.011.
Li, Z., Yano, A., Cossu, M., Yoshioka, H., Kita, I. and Ibaraki, Y. (2018). Electrical
Energy Producing Greenhouse Shading System with a Semi-Transparent Photovoltaic
Blind Based on Micro-Spherical Solar Cells. Energies, 11(7), p.1681. doi:
10.3390/en11071681.
Liang, R., Zhang, J. and Zhou, C. (2015) ‘Dynamic Simulation of a Novel Solar Heating
System Based on Hybrid Photovoltaic/Thermal Collectors (PVT)’, Procedia
Engineering, 121, pp. 675–683. doi: 10.1016/j.proeng.2015.09.001.
Jovanovic, J. et al. (2017) ‘Energy-efficiency gain by combination of PV modules and
Trombe wall in the low-energy building design’, Energy and Buildings, 152, pp. 568–
576. doi: 10.1016/j.enbuild.2017.07.073.
Kukkonen, I. T. (2000) ‘GEOTHERMAL ENERGY IN FINLAND’, in Proceedings
World Geothermal Congress 2000. Espoo: Proceedings World Geothermal Congress
2000, pp. 277–282. Available at: https://www.geothermal-
energy.org/pdf/IGAstandard/WGC/2000/R0778.PDF (Accessed: 22 November 2018).
Lanahan, M. and Tabares-Velasco, P. C. (2017) ‘Seasonal thermal-energy storage: A
critical review on BTES systems, modeling, and system design for higher system
efficiency’, Energies, 10(6), pp. 2–24. doi: 10.3390/en10060743.

Latimer, J. G. (2009) Dealing with the High Cost of Energy for Greenhouse Operations,
Virginia Cooperative Extension. Virginia. Available at:
http://www.hort.vt.edu/floriculture/documents/EnergyGreenhouse.pdf.
VTT Technical Research Centre of Finland and Vaisala Oyj (2018) Weather Statistics in
Oulu, Monthly Statistics. Available at: http://www.ipv6.willab.fi/weather/stats.html.en
(Accessed: 2 December 2018).
Liu, Y. et al. (2019) ‘Unraveling Sunlight by Transparent Organic Semiconductors
toward Photovoltaic and Photosynthesis’, ACS Nano. American Chemical Society, p.
acsnano.8b08577. doi: 10.1021/acsnano.8b08577.
Locsin, A. (2018) Climate Region. Available at: https://sciencing.com/six-major-climate-
regions-5382606.html (Accessed: 11 November 2018).
Lunt, R. R. and Bulovic, V. (2013) ‘Transparent, near-infrared organic photovoltaic solar
cells for window and energy-scavenging applications’, Applied Physics Letters, 98(11),
p. 113305. doi: 10.1063/1.3567516.
Mangold, D., Miedaner, O., Tziggili, E. P., Schmidt, T., Unterberger, M. and Zeh, B.
(2012) ‘Technisch-wirtschaftliche Analyse und Weiterentwicklung der solaren Langzeit-
Wärmespeicherung’, Hamburg: Solites. Available at:
http://www.solites.de/download/literatur/Solites_Technisch-
wirtschaftliche%20Analyse%20und%20Weiterentwicklung%20der%20solaren%20Lan
gzeit-W%C3%A4rmespeicherung_Forschungsbericht_FKZ%200329607N_2012.pdf
(Accessed: 25 December 2018).
Marucci, A. and Cappuccini, A. (2016) ‘Dynamic photovoltaic greenhouse: Energy
balance in completely clear sky condition during the hot period’, Energy. Pergamon, 102,
pp. 302–312. doi: 10.1016/J.ENERGY.2016.02.053.
Maslak, K. and Nimmermark, S. (2014) ‘Thermal energy use in three Swedish
greenhouses- the outdoor temperature-dependent variation and the influence of wind
speed under no-sunlight conditions’, Agricultural Engineering International: CIGR
Journal, 16(3), pp. 43–54.

Mcbean, G., Alekseev, G., Chen, D., Førland, E., Fyfe, J., Groisman, P. Y., King, R.,
Melling, H., Vose, R. and Whitfield, P. H. et al. (2005) ‘Arctic Climate: Past and Present’,
in Arctic Climate Impact Assessment. Cambridge University Press, p. 22. doi:
10.1111/j.1365-3040.2010.02114.x.
MechaTronix Horticulture Lighting (2018) MechaTronix - Typical PPFD and DLI values
per crop. Available at: https://www.horti-growlight.com/typical-ppfd-dli-values-per-
crop (Accessed: 16 November 2018).
Meng, Q. and Runkle, E. (2014) Control Flowering with LEDs. Available at:
https://www.growertalks.com/Article/?articleid=20604 (Accessed: 18 September 2018).
Miller, G. H., Brigham-Grette, J., Alley, R.B., Anderson, L., Bauch, H.A., Douglas,
M.S.V., Edwards, M.E., Elias, S.A., Finney, B.P., Fitzpatrick, J.J., Funder, S.V., Herbert,
T.D., Hinzman, L.D., Kaufmanm, D.S., MacDonald, G.M., Polyak, L., Robock, A.,
Serreze, M.C., Smol, J.P., Spielhagen, R., White, J.W.C., Wolfe, A.P. and Wolfft, E.W.
(2010) ‘Temperature and precipitation history of the Arctic’, Quaternary Science
Reviews. 29(15–16), pp. 1679–1715. doi: 10.1016/j.quascirev.2010.03.001.
Ministry of Agriculture and Forestry of Finland (2018) Support for agriculture - Maa- ja
metsätalousministeriö. Available at: https://mmm.fi/en/food-and-
agriculture/policy/support-for-agriculture (Accessed: 26 December 2018).
Ministry of Economic Affairs and Employment of Finland (2018a) Energy Efficiency
Directive and Energy Efficiency Act - Ministry of Economic Affairs and Employment.
Available at: https://tem.fi/en/energy-support (Accessed: 27 December 2018).
Ministry of Economic Affairs and Employment of Finland (2018b) Renewable energy -
Ministry of Economic Affairs and Employment. Available at: https://tem.fi/en/renewable-
energy (Accessed: 27 December 2018).
Ministry of Economic Affairs and Employment of Finland (2019) Renewable energy -
Ministry of Economic Affairs and Employment, Renewable Energy in Finland. Available
at: https://tem.fi/en/renewable-energy (Accessed: 12 February 2019).
MIT Energy Initiative (2015) The Future of Solar Energy. Available at:

http://energy.mit.edu/wp-content/uploads/2015/05/MITEI-The-Future-of-Solar-
Energy.pdf (Accessed: 25 December 2018).
Mitchell, C. and Stutte, G. (2016) Sole-Source Lighting for Controlled-Environment
Agriculture. Available at: https://ntrs.nasa.gov/search.jsp?R=20150009399 (Accessed:
23 January 2019).
Molavi, S. and Bydén, W. (2018) Solar Prosumer Business Models in Sweden. Available
at: https://pdfs.semanticscholar.org/ddf9/5bb834b1735de2722283c3c7dcffed4605be.pdf
(Accessed: 12 February 2019).
Montoyaa, F. G., Pe˜na-Garcíac, A., Juaidia, A. and Manzano-Agugliaro, F. (2017)
‘Indoor lighting techniques: An overview of evolution and new trends for energy saving’,
Energy and Buildings. 140, pp. 50–60. doi: 10.1016/J.ENBUILD.2017.01.028.
Motiva (2015) The amount of solar radiation in Finland - Motiva, The amount of solar
radiation in Finland. Available at:
https://www.motiva.fi/ratkaisut/uusiutuva_energia/aurinkosahko/aurinkosahkon_peruste
et/auringonsateilyn_maara_suomessa (Accessed: 2 February 2019).
Motiva (2017) The amount of solar radiation in Finland - Motiva, Auringonsäteilyn
määrä Suomessa. Available at:
https://www.motiva.fi/ratkaisut/uusiutuva_energia/aurinkosahko/aurinkosahkon_peruste
et/auringonsateilyn_maara_suomessa (Accessed: 26 May 2018).
Nanya, K., Ishigami, Y., Hikosaka, S. and Goto, E. (2012) ‘EFFECTS OF BLUE AND
RED LIGHT ON STEM ELONGATION AND FLOWERING OF TOMATO
SEEDLINGS’, Acta Horticulturae, (956), pp. 261–266. doi:
10.17660/ActaHortic.2012.956.29.
Närpes (2018) The world’s best vegetables are grown with responsibility! | Close-up
Vegetables, Lighting. Available at: https://www.narpesgronsaker.fi/sv/varldens-basta-
gronsaker-odlas-med-ansvar (Accessed: 23 January 2019).
Natural Resources Institute Finland (2019a) Horticultural Statistics |
Luonnonvarakeskuksen tilastot. Available at: https://stat.luke.fi/en/energy-consumption-

greenhouse-enterprises-2017_en (Accessed: 14 March 2019).
Natural Resources Institute Finland (2019b) Luonnonvarakeskuksen tilastot. Available
at: https://stat.luke.fi/en/horticultural-statistics (Accessed: 26 March 2019).
Natural Resources Institute Finland (2019c) PX-Web - Table. Available at:
http://statdb.luke.fi/PXWeb/pxweb/en/LUKE/LUKE__02 Maatalous__04 Tuotanto__20
Puutarhatilastot/04_Tuotannossa_olevat_kasvihuoneet.px/table/tableViewLayout1/?rxid
=001bc7da-70f4-47c4-a6c2-c9100d8b50db (Accessed: 26 April 2019).
Natural Resources Institute Finland (2019d) Utilised Agricultural Area |
Luonnonvarakeskuksen tilastot. Available at: https://stat.luke.fi/en/utilised-agricultural-
area-2018_en (Accessed: 26 March 2019).
Nelson, J. A. and Bugbee, B. (2014) ‘Economic analysis of greenhouse lighting: Light
emitting diodes vs. high intensity discharge fixtures’, PLoS ONE. Edited by D. A.
Campbell. Public Library of Science, 9(6), p. e99010. doi:
10.1371/journal.pone.0099010.
Niemi, J. and Väre, M. (2018) Agriculture and food sector in Finland 2018. Helsinki.
Available at: http://urn.fi/URN:ISBN:978-952-326-602-5 (Accessed: 24 November
2018).
Castilla, N. (2013). Greenhouse technology and management. 2nd ed. Wallingford:
CABI, pp.37-41.
Nimmermark, S. A. and Maslak, K. (2015) ‘Measured energy use in a greenhouse with
tomatoes compared to predicted use by a mechanistic model including transpiration’,
Agricultural Engineering International: CIGR Journal, 2015, pp. 65–70.
Nord Pool (2019) ‘Market data’. Available at: https://www.nordpoolgroup.com/Market-
data1/Dayahead/Area-Prices/FI/Yearly/?view=table (Accessed: 6 January 2019).
NSIDC (2018) Factors Affecting Arctic Weather and Climate | National Snow and Ice
Data Center, All About Arctic Climatology and Meteorology. Available at:
https://nsidc.org/cryosphere/arctic-meteorology/factors_affecting_climate_weather.html

(Accessed: 15 April 2018).
Oko, C.O.C., Diemuodeke, E.O., Omunakwe, N.F. and Nnamdi, E. (2012) ‘Design and
Economic Analysis of a Photovoltaic System: A Case Study’, International Journal of
Renewable Energy Development, 1(3), pp. 65–73. Available at:
https://ejournal.undip.ac.id/index.php/ijred/article/view/4095/3742 (Accessed: 12
February 2019).
Oulun Energia (2018a) Origin of electricity | Oulun Energia. Available at:
https://www.oulunenergia.fi/en/energy-and-environment/energy-production/origin-
electricity (Accessed: 27 December 2018).
Oulun Energia (2018b) Origin of electricity | Oulun Energia, Origin of electricity.
Available at: https://www.oulunenergia.fi/en/energy-and-environment/energy-
production/origin-electricity (Accessed: 3 February 2019).
Oulun Energia (2018c) Origin of heat | Oulun Energia. Available at:
https://www.oulunenergia.fi/en/energy-and-environment/energy-production/origin-heat
(Accessed: 27 December 2018).
Oulun Karttapalvelu (2019) District heating map of Oulu. Available at:
https://kartta.ouka.fi/IMS/en?layers=Tourist map&lon=District
heating&cp=7217760,489280&z=64 (Accessed: 27 April 2019).
Paksoy, H. Ö. and Beyhan, B. (2015) ‘Thermal energy storage (TES) systems for
greenhouse technology’, Advances in Thermal Energy Storage Systems. Woodhead
Publishing, pp. 533–548. doi: 10.1533/9781782420965.4.533.
Papadakis, G., Briassoulis, D., Scarascia Mugnozza, G., Vox, G., Feuilloley, P. and
Stoffers, J. (2000). ‘REVIEW PAPER: Radiometric and Thermal Properties of, and
Testing Methods for, Greenhouse Covering Materials’. Journal of Agricultural
Engineering Research, 77(1), pp.7-38. doi: 10.1006/jaer.2000.0525.
Pilkington (2018) Pilkington OptiwhiteTM for Solar Applications. Available at:
https://www.pilkington.com/en/global/products/product-categories/solar-
energy/pilkington-optiwhite-for-solar-applications#productrange (Accessed: 21

December 2018).
Pirinen, P. et al. (2012) TILASTOJA SUOMEN ILMASTOSTA 1981-2010. Available at:
https://helda.helsinki.fi/bitstream/handle/10138/35880/Tilastoja_Suomen_ilmastosta_19
81_2010.pdf?sequence=4 (Accessed: 9 September 2018).
Płaczek-Popko, E. (2017) ‘Top PV market solar cells 2016’, Opto-Electronics Review.
Elsevier, 25(2), pp. 55–64. doi: 10.1016/J.OPELRE.2017.03.002.
Pohjoista voimaa (2019) General electricity transmission price: Oulun Energia,
Electricity transmission price list. Available at: https://www.oulunenergia.fi/tuotteet-ja-
palvelut/sahkoverkkopalvelut/verkkopalveluhinnasto/sahkon-siirtohinnasto/yleissahkon-
siirtohinnasto (Accessed: 4 February 2019).
Qoaider, L. and Steinbrecht, D. (2009) ‘Photovoltaic systems: A cost competitive option
to supply energy to off-grid agricultural communities in arid regions’, Applied Energy,
87, pp. 427–435. doi: 10.1016/j.apenergy.2009.06.012.
Rahmatmand, A., Harrison, S. J. and Oosthuizen, P. H. (2019) ‘Evaluation of removing
snow and ice from photovoltaic-thermal (PV/T) panels by circulating hot water’, Solar
Energy. Pergamon, 179, pp. 226–235. doi: 10.1016/J.SOLENER.2018.12.053.
Richter, A. (2019) New deep geothermal heating project planned at Tampere, Finland,
Geothermal Energy News. Available at: http://www.thinkgeoenergy.com/new-deep-
geothermal-heating-project-planned-at-tampere-finland/ (Accessed: 3 February 2019).
Rocamora, M. C. and Tripanagnostopoulos, Y. (2006) ‘ASPECTS OF PV/T SOLAR
SYSTEM APPLICATION FOR VENTILATION NEEDS IN GREENHOUSES’, Acta
Horticulturae, (719), pp. 239–246. doi: 10.17660/ActaHortic.2006.719.26.
Rudge, S. (2015) ‘Greenhouses for the Northern Climate’, pp. 1–41. Available at:
http://www.emr.gov.yk.ca/agriculture/pdf/Greenhouses_for_the_Northern_Climate.pdf.
Runkle, E. and Both, A. (2011) Greenhouse energy conservation strategies. Available at:
https://rucore.libraries.rutgers.edu/rutgers-lib/47310/ (Accessed: 14 January 2019).

Sampaio, P. G. V. and González, M. O. A. (2017) ‘Photovoltaic solar energy: Conceptual
framework’, Renewable and Sustainable Energy Reviews. Pergamon, 74, pp. 590–601.
doi: 10.1016/J.RSER.2017.02.081.
Sanford, S. (2011) ‘Reducing greenhouse energy consumption—An overview’, Energy,
pp. 1–16. Available at: http://low.sare.org/content/download/61997/845719/file/ENC07-
098 Reducing Greenhouse Energy Consumption.pdf.
Särkkä, L. E. et al. (2017) ‘Effects of HPS and LED lighting on cucumber leaf
photosynthesis, light quality penetration and temperature in the canopy, plant morphology
and yield’, Agricultural and Food Science, 26(2), pp. 101–109. doi:
10.23986/afsci.60293.
Sethi, V. P. (2009) ‘On the selection of shape and orientation of a greenhouse: Thermal
modeling and experimental validation’, Solar Energy. Pergamon, 83(1), pp. 21–38. doi:
10.1016/J.SOLENER.2008.05.018.
Sethi, V. P. and Sharma, S. K. (2008) ‘Survey and evaluation of heating technologies for
worldwide agricultural greenhouse applications’, Solar Energy. Pergamon, 82(9), pp.
832–859. doi: 10.1016/J.SOLENER.2008.02.010.
Shen, Y., Wei, R. and Xu, L. (2018) ‘Energy consumption prediction of a greenhouse and
optimization of daily average temperature’, Energies, 11(1). doi: 10.3390/en11010065.
Shukla, A., Kant, K., Sharma, A. and Biwole, P. (2017). Cooling methodologies of
photovoltaic module for enhancing electrical efficiency: A review. Solar Energy
Materials and Solar Cells, North-Holland. 160, pp. 275–286. doi:
10.1016/J.SOLMAT.2016.10.047.
Sibbitt, B., McClenahan, D. and Resources Canada -, N. (2014) Large Systems Seasonal
Borehole Thermal Energy Storage. Available at: http://task45.iea-shc.org/fact-sheets
(Accessed: 25 November 2018).
Singh, D., Basu, C., Meinhardt-Wollweber, M. and Roth, B. (2015). LEDs for energy
efficient greenhouse lighting. Renewable and Sustainable Energy Reviews, Pergamon,
49, pp. 139–147. doi: 10.1016/J.RSER.2015.04.117.

Skarphagen, H., Banks, D., Frengstad, B. and Gether, H. (2019). Design Considerations
for Borehole Thermal Energy Storage (BTES): A Review with Emphasis on Convective
Heat Transfer. Geofluids, Hindawi, 2019, pp.1-26. doi: 10.1155/2019/4961781.
Skelion (2018) Sketchup Skelion solar design plugin renewable energy. Available at:
http://skelion.com/ (Accessed: 29 November 2018).
SOLARE LANGZEIT-WÄRMESPEICHERUNG (no date). Available at: www.solites.de.
SolarWorld 300 (2018) Swa 285-290 Mono Black Powering American Homes for More
Than 40 Years, Technical information. Available at: www.solarworld-usa.com.
Soliculture (2016) TECHNOLOGY – Soliculture, LUMO technology. Available at:
http://www.soliculture.com/lumo-technology/ (Accessed: 11 July 2018).
Sørensen, A. and Schmidt, T. (2018) Design and Construction of Large Scale Heat
Storages for District Heating in Denmark. Available at: http://planenergi.dk/wp-
content/uploads/2018/05/Soerensen-and-Schmidt_Design-and-Construction-of-Large-
Scale-Heat-Storages-12.03.2018-004.pdf (Accessed: 25 December 2018).
Sotirios Anifantis, A., Colantoni, A. and Pascuzzi, S. (2017) ‘Thermal energy assessment
of a small scale photovoltaic, hydrogen and geothermal stand-alone system for
greenhouse heating’, Renewable Energy, 103, pp. 115–127. doi:
10.1016/j.renene.2016.11.031.
Souliotis, M., Tripanagnostopoulos, Y. and Kavga, A. (2006) ‘THE USE OF FRESNEL
LENSES TO REDUCE THE VENTILATION NEEDS OF GREENHOUSES’, Acta
Horticulturae, (719), pp. 107–114. doi: 10.17660/ActaHortic.2006.719.9.
Statistics Finland (2018) Energy prices [e-publication]. Available at:
https://www.stat.fi/til/ehi/2018/03/ehi_2018_03_2018-12-12_kuv_005_en.html
(Accessed: 4 February 2019).
Statistics Finland (2019) Statistics Finland - Energy supply and consumption. Available
at: https://www.stat.fi/til/ehk/2018/04/ehk_2018_04_2019-03-28_tie_001_en.html
(Accessed: 27 April 2019).

Stewart, N. (2016) ‘Energy innovation needs in public buildings: Sizing a photovoltaic
system for the University of Oulu Linnanmaa campus’, MS Thesis, (October).
Šúri, M. et al. (2007) ‘Potential of solar electricity generation in the European Union
member states and candidate countries’, Solar Energy. Pergamon, 81(10), pp. 1295–1305.
doi: 10.1016/J.SOLENER.2006.12.007.
SYK (2019) ‘Dentopolis: User guide for the building’. University Properties of Finland
Ltd. Available at: https://sykoy.fi/wp-content/uploads/Dentopolis-User-Guide-in-
English-2019.pdf
Sysoeva, M. I., Markovskaya, E. F. and Shibaeva, T. G. (2010) ‘Plants under continuous
light: a review’, Plant Stress, 4(1), pp. 5–17.
The Climate Data Factory (2019) Solar radiation over Oulu (Finland). Available at:
https://theclimatedatafactory.com/product/solar-radiation-oulu-finland/ (Accessed: 6
May 2019).
Torres, A. P., Lopez, R. G. and Floriculture, P. (2010) HO-000-W Measuring Daily Light
Integral in a Greenhouse Commercial Greenhouse Production Purdue extension What Is
Light and Why Is It Important? Available at: www.hort.purdue.edu (Accessed: 29 January
2019).
Tsao, J. U., Lewis, N. and Crabtree Argonne, G. (2006) Solar FAQs. Available at:
https://www.sandia.gov/~jytsao/Solar FAQs.pdf.
Tyagi, V., Rahim, N., Rahim, N. and Selvaraj, J. (2013). Progress in solar PV technology:
Research and achievement. Renewable and Sustainable Energy Reviews. Pergamon, 20,
pp.443-461. doi: 10.1016/J.RSER.2012.09.028.
United Nations (2017) World Population Prospects: The 2017 Revision. Available at:
www.unpopulation.org. (Accessed: 20 November 2018).
University of Oulu (2010) BOTANICAL GARDENS AND BOTANICAL MUSEUM,
BOTANICAL GARDENS AND BOTANICAL MUSEUM. Available at:
https://www.oulu.fi/sites/default/files/content/yleisokartta.pdf (Accessed: 29 January

2019).
University of Oulu Botanical Gardens (2016) General description. Available at:
https://www.oulu.fi/biodiversityunit/node/16480 (Accessed: 29 November 2018).
Venäläinen, A., Tuomenvirta, H., Pirinen, P. and Drebs, A. (2005) A Basic Finnish
Climate Data Set 1961-2000-DESCRIPTION AND ILLUSTRATIONS Ilmatieteen laitos
Meteorologiska institutet Finnish Meteorological Institute Helsinki 2005. Available at:
https://www.oulu.fi/oulugis/doc/data_description.pdf (Accessed: 5 July 2018).
Venlo AP Holland Group (2018) Greenhouses - Venlo | Greenhouse Industry, 2018.
Available at: https://www.venloinc.com/greenhouses (Accessed: 28 December 2018).
Walden Labs (2015) Northern Greenhouse Examples for Cold Climates - Walden Labs.
Available at: https://waldenlabs.com/5-northern-greenhouse-examples/ (Accessed: 27
December 2018).
Wang, T., Wu, G., Chen, J., Cui, P., Chen, Z., Yan, Y., Zhang, Y., Li, M., Niu, D., Li, B.
and Chen, H. (2017). Integration of solar technology to modern greenhouse in China:
Current status, challenges and prospect. Renewable and Sustainable Energy Reviews.
Pergamon, 70, pp.1178-1188. doi: 10.1016/J.RSER.2016.12.020.
Wijesuriya, D., Wickramathilaka, K., Wijesinghe, L., Vithana, D. and Perera, H. (2017).
Reduction of Solar PV Payback Period Using Optimally Placed Reflectors, Energy
Procedia, 134, pp.480-489. doi: 10.1016/j.egypro.2017.09.606.
World Energy Council (2016) World Energy Resources | 2016. Available at:
www.worldenergy.org (Accessed: 22 December 2018).
Yildirim, N. and Bilir, L. (2017) ‘Evaluation of a hybrid system for a nearly zero energy
greenhouse’, Energy Conversion and Management. Pergamon, 148, pp. 1278–1290. doi:
10.1016/J.ENCONMAN.2017.06.068.
von Zabeltitz, C. (2011). Integrated Greenhouse Systems for Mild Climates. Berlin:
Springer Berlin, pp.5-57.

13 APPENDICES
13.1 Results: Scenario 1
Monthly Shading
Losses (%)
Face Jan Feb Mar Apr May Jun Jul Aug Sep Oct Nov Dec
1 45.53 24.1 2.21 1.45 0.86 0.46 0.71 1.2 1.48 5.06 52.49 68.59
2 45.71 18.51 1.9 1.14 1 0.94 1.1 1.02 1.09 5.07 52.41 68.11
3 51.01 48.78 15.92 8.34 3.08 1.31 2.11 5.17 11.59 28.81 59.35 74.11
Mea
n
47.42 30.46 6.68 3.64 1.65 0.9 1.31 2.47 4.72 12.98 54.75 70.27
Ed (kWh/day)
Face Jan Feb Mar Apr May Jun Jul Aug Sep Oct Nov Dec
1 6.67 48.6 161 233 261 261 246 193 124 60 11.7 0.35
2 4.49 32.78 108.88 157.94 177.08 177.08 166.91 131.02 83.76 40.5 7.9 0.23
3 3.01 22.02 73.12 106.06 118.92 118.92 112.09 87.98 56.24 27.2 5.3 0.16
Tota
l
14.17 103.4 343 497 557 557 525 412 264 127.7 24.9 0.74
Em
(kWh/month)
Face Jan Feb Mar Apr May Jun Jul Aug Sep Oct Nov Dec
1 207 1360 4990 7000 8100 7830 7620 5990 3710 1860 351 10.8
2 139.3
9
921.3
1
3374.1
5
4738.1
7
5497.9
5
5306.5
1
5168.9
1
4056.1
6
2512.6
6
1256.3
3
236.3
1
7.3
3 93.61 618.6
9
2265.8
5
3181.8
3
3692.0
5
3563.4
9
3471.0
9
2723.8
4
1687.3
4
843.67 158.6
9
4.9
Tota
l
440 2900 10630 14920 17290 16700 16260 12770 7910 3960 746 23
Hd
(kWh/m2/day
)
Face Jan Feb Mar Apr May Jun Jul Aug Sep Oct Nov Dec
1 0.17 1.01 3.21 4.77 5.54 5.65 5.43 4.23 2.67 1.3 0.29 0.02
2 0.17 1 3.2 4.75 5.54 5.63 5.43 4.22 2.67 1.29 0.28 0.02
3 0.17 1 3.2 4.75 5.54 5.63 5.43 4.22 2.67 1.29 0.28 0.02
Mea
n
0.17 1 3.2 4.76 5.54 5.64 5.43 4.22 2.67 1.29 0.28 0.02
Hm (kWh/m2/month)
Face Jan Feb Mar Apr May Jun Jul Aug Sep Oct Nov Dec
1 5.23 28.2 99.6 143 172 169 168 131 80.2 40.2 8.58 0.68
2 5.2 28.1 99.2 143 172 169 168 131 80 40 8.54 0.68
3 5.2 28.1 99.2 143 172 169 168 131 80 40 8.54 0.68
Mea
n
5.21 28.13 99.33 143 172 169 168 131 80.07 40.07 8.55 0.68
Faces global results
Solar panels NºP. P. power(Wp) P.weight(kg) Power(kWp) Energy(kWh)
Yield (kWh/kWp)
Shading L.(%)
Sunmodule
Plus:SW-300 Mono 426 300 18 127.8 104549 818.07 5.4

13.2 Results: Scenario 2
Monthly Shading Losses
(%)
Face Jan Feb Mar Apr May Jun Jul Aug Sep Oct Nov Dec
1 39.39 14.69 3.28 1.02 0.31 0.25 0.27 0.56 1.56 8.17 36.54 57.51
2 40.62 13.99 2.71 1.27 1.06 1.04 1.29 0.94 1.07 7.48 35.54 59.6
3
3 46.15 48.8 22.01 13.21 5.39 3.94 5.1 7.58 16.73 31.71 51.53 66.0
5
Mean 42.05 25.83 9.34 5.17 2.25 1.74 2.22 3.03 6.45 15.79 41.2 61.06
Ed (kWh/day)
Face Jan Feb Mar Apr May Jun Jul Aug Sep Oct Nov Dec
1 5.46 43.26 150.43 230.74 267.13 269.79 252.93 193.47 119.37 53.69 9.5 0.28
2 4.18 33.12 115.16 176.65 204.5 206.54 193.63 148.11 91.38 41.1 7.27 0.21
3 2.66 21.11 73.41 112.61 130.37 131.67 123.44 94.42 58.25 26.2 4.63 0.14
Total 12.3 97.5 339 520 602 608 570 436 269 121 21.4 0.63
Em
(kWh/month)
Face Jan Feb Mar Apr May Jun Jul Aug Sep Oct Nov Dec
1 169.0
6
1211.
4
4659.2
4
6922.2
9
8253.5 8120.3
8
7854.1
4
5990.4
5
3576.5
2
1659.5
8
284.4
4
8.65
2 129.4
3
927.3
9
3566.8
8
5299.3
6
6318.4
7
6216.5
6
6012.7
4
4585.9
9
2738 1270.4
9
217.7
5
6.62
3 82.51 591.21
2273.89
3378.34
4028.03
3963.06
3833.12
2923.57
1745.48
809.94 138.82
4.22
Total 381 2730 10500 15600 18600 18300 17700 13500 8060 3740 641 19.5
Hd
(kWh/m2/day)
Face Jan Feb Mar Apr May Jun Jul Aug Sep Oct Nov Dec
1 0.14 0.88 2.88 4.49 5.38 5.55 5.32 4.04 2.47 1.13 0.24 0.02
2 0.14 0.88 2.88 4.49 5.38 5.55 5.32 4.04 2.47 1.13 0.24 0.02
3 0.14 0.88 2.88 4.49 5.38 5.55 5.32 4.04 2.47 1.13 0.24 0.02
Mean 0.14 0.88 2.88 4.49 5.38 5.55 5.32 4.04 2.47 1.13 0.24 0.02
Hm (kWh/m2/month)
Face Jan Feb Mar Apr May Jun Jul Aug Sep Oct Nov Dec
1 4.49 24.7 89.2 135 167 167 165 125 74.1 35.1 7.22 0.64
2 4.49 24.7 89.2 135 167 167 165 125 74.1 35.1 7.22 0.64
3 4.49 24.7 89.2 135 167 167 165 125 74.1 35.1 7.22 0.64
Mean 4.49 24.7 89.2 135 167 167 165 125 74.1 35.1 7.22 0.64
Faces global results Solar panels Nº
P.
P.
power(Wp)
P.weight(k
g)
Power(kW
p)
Energy(k
Wh)
Yield
(kWh/kWp)
Shading
L.(%)
Sunmodule Plus:SW-300 Mono
471
300 18 141.3 109771.5 776.87 5.13