Krishna Ghimire FACTORS AFFECTING LIQUIDITY ... - Jultika
59
Krishna Ghimire FACTORS AFFECTING LIQUIDITY FACTOR ON BANKING SECTOR: A STUDY OF NEPALESE COMMERICIAL BANK Master’s Thesis Oulu Business School November 2021
-
Upload
khangminh22 -
Category
Documents
-
view
4 -
download
0
Transcript of Krishna Ghimire FACTORS AFFECTING LIQUIDITY ... - Jultika

Krishna Ghimire
FACTORS AFFECTING LIQUIDITY FACTOR ON BANKING SECTOR: A STUDY OF
NEPALESE COMMERICIAL BANK
Master’s Thesis
Oulu Business School
November 2021
UNIVERSITY OF OULU ABSTRACT OF THE MASTER'S THESIS Oulu Business School
Unit Oulu Business School Author Krishna Ghimire
Supervisor Henry Jarva
Title Factors affecting liquidity on banking sector: A study of Nepalese Commercial Bank Subject
Master's Thesis Type of the degree
Accounting Time of publication
2021 Number of pages
59 Abstract
Purpose
The study focuses on the factors affecting liquidity on Nepalese commercial banks over a time span of
fiscal year 2010/11 to 2019/20, which is a ten-year period also denoted as 2011 to 2020.
Methodology
The research design used in this study is a descriptive and comparative method to the issues associated
with dependent and independent variables related to bank specific and macroeconomic variables. The
correlation and regression analysis are used in the study to show the impact of liquidity of assets and
deposits to other variables.
Finding
The result of our study depicts that using correlation ROA, CAR, INF, and TB have a positive
correlation whereas NPL, GDP, and BS has negative correlation with liquidity of assets and deposits.
However, the value of correlation provides an indication of the strength of relationship. Moreover, using
regression analysis BS is significant to explain our study's liquidity (assets and deposits).
The originality of data
The data used in these studies are from the Nepal Rastra banks website which is the regulatory body for all banking systems in Nepal.
Keywords Liquidity, return on assets, non-performing loan, capital adequacy ratio, bank size, inflation, treasury
bills, gross domestic product, Commercial banks, NRB Additional information The study is based on the 10 commercial banks of Nepal.
Table of Contents
1 INTRODUCTION............................................................................................... 5
1.1 Backgrounnd of study ................................................................................ 5
1.2 Statement of problem ................................................................................. 7
1.3 Research question....................................................................................... 8
1.4 Objective of study ....................................................................................... 8
1.5 Research Hypothesis .................................................................................. 8
1.6 Significance of Study ................................................................................ 12
1.7 Limitation of study ................................................................................... 13
1.8 Organization of study............................................................................... 14
2 LITERATURE REVIEW ................................................................................ 15
2.1 Review of related literature ..................................................................... 15
2.2 Theoretical Framework ........................................................................... 22
3 RESEARCH DESIGN AND METHODOLOGY .......................................... 24
3.1 Research design ........................................................................................ 24
3.2 Population and sample size determination ............................................ 24
3.3 Nature and sources of data ...................................................................... 25
3.4 Data analysis plan..................................................................................... 26
3.5 Model Specification .................................................................................. 26
3.6 Analysis of plan......................................................................................... 28
4 DATA ANALYSIS ............................................................................................ 29
5 RESULTS .......................................................................................................... 43
5.1 Descriptive Analysis ................................................................................. 43
5.2 Correlation Analysis ................................................................................ 44
5.3 Regression Analysis.................................................................................. 45
5.4 Summary of Regression Analysis Outcomes ......................................... 48
6 SUMMARY AND CONCLUSION ................................................................. 49
6.1 Summary ................................................................................................... 50
6.2 Conclusiom................................................................................................ 51
6.3 Recommendation ...................................................................................... 51
6.4 Scope for future research ........................................................................ 52
REFERENCES ......................................................................................................... 53
ABBREVIATIONS
BOK Bank of Kathmandu Limited
CAR Capital Adequacy Ratio
GDP Gross Domestic Product
HBL Himalayan Bank Limited
INF Inflation rate
KBL Kumari Bank Limited
L1 Liquid assets by total assets
L2 Liquid assets by total deposit
LBL Laxmi Bank Limited
NABIL Nabil Bank Limited
NBL Nepal Bank Limited
NIBL Nepal Investment Bank Limited
NSBL Nepal SBI Bank Limited
ROA Return on assets
SBL Siddhartha Bank Limited
SCBL Standard Chartered Bank Limited
SPSS Statistical Packages for Social Sciences
TB Treasury Bill
NRS Nepalese Rupees
5
1 INTRODUCTION
1.1 Backgrounnd of study
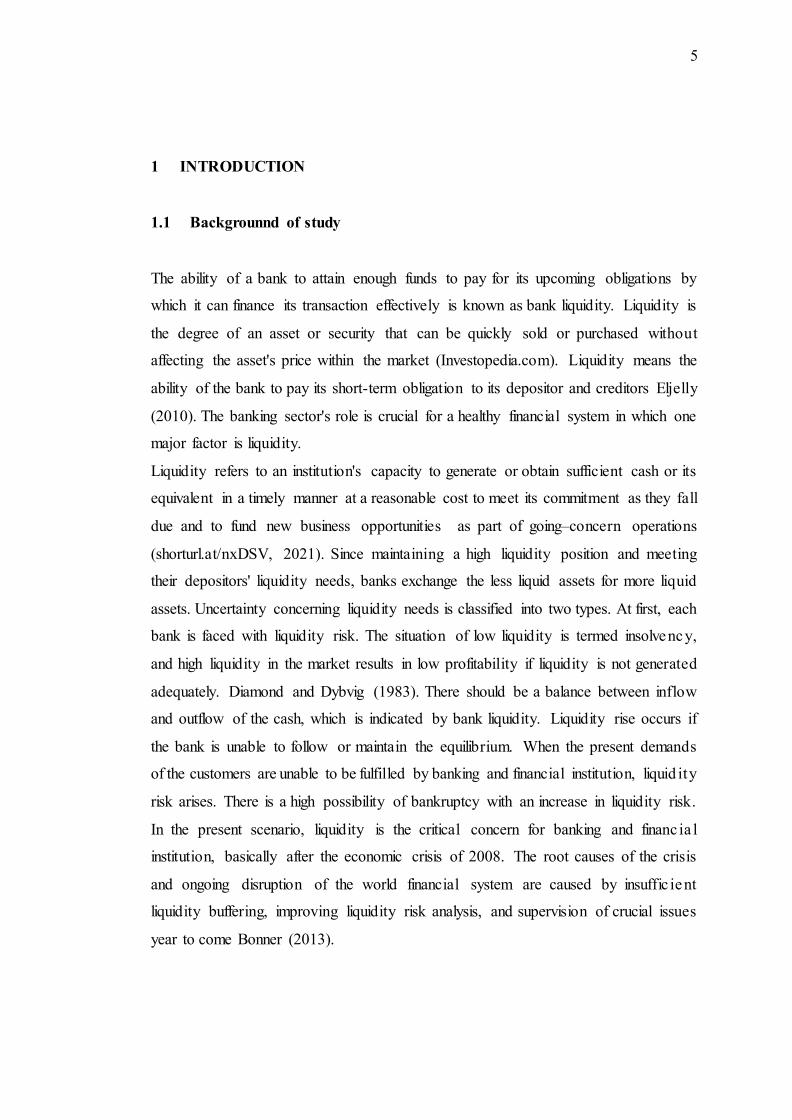
The ability of a bank to attain enough funds to pay for its upcoming obligations by
which it can finance its transaction effectively is known as bank liquidity. Liquidity is
the degree of an asset or security that can be quickly sold or purchased without
affecting the asset's price within the market (Investopedia.com). Liquidity means the
ability of the bank to pay its short-term obligation to its depositor and creditors Eljelly
(2010). The banking sector's role is crucial for a healthy financial system in which one
major factor is liquidity.
Liquidity refers to an institution's capacity to generate or obtain sufficient cash or its
equivalent in a timely manner at a reasonable cost to meet its commitment as they fall
due and to fund new business opportunities. as part of going–concern operations
(shorturl.at/nxDSV, 2021). Since maintaining a high liquidity position and meeting
their depositors' liquidity needs, banks exchange the less liquid assets for more liquid
assets. Uncertainty concerning liquidity needs is classified into two types. At first, each
bank is faced with liquidity risk. The situation of low liquidity is termed insolvency,
and high liquidity in the market results in low profitability if liquidity is not generated
adequately. Diamond and Dybvig (1983). There should be a balance between inflow
and outflow of the cash, which is indicated by bank liquidity. Liquidity rise occurs if
the bank is unable to follow or maintain the equilibrium. When the present demands
of the customers are unable to be fulfilled by banking and financial institution, liquid ity
risk arises. There is a high possibility of bankruptcy with an increase in liquidity risk.
In the present scenario, liquidity is the critical concern for banking and financ ia l
institution, basically after the economic crisis of 2008. The root causes of the crisis
and ongoing disruption of the world financial system are caused by insuffic ient
liquidity buffering, improving liquidity risk analysis, and supervision of crucial issues
year to come Bonner (2013).

6
Ogbuabor &Malaolu (2013) point out that liquidity shortage can cause significant
damage to a bank's operations. It destroys the customer relationship built over the year
and finally leads to the insolvency of the particular bank until the liquidity crisis is not
adequately managed. Increases in capital adequacy, inflation, share of non-performing
loans, and interest rate level both on loans and the interbank transaction positive ly
impact bank liquidity. Vodova (2011) stated that generally, banks strive to strike a
balance between liquidity and profitability. Vento & Ganga (2009) finds out that the
economic success achieved by the company with its capital is defined as profitability.
Liquidity plays a vital role in the successful operation of a banking business. The
liquidity position of a bank attracts every stakeholder. Therefore, a banking firm
should ensure that its short-term obligation does not suffer from a lack of or excess
liquidity to cover up Kurawa & Abubakar ( 2014).
Bank liquidities indicate the balance between outflow and inflow of the cash; the bank
ultimately leads to liquidity risk if it cannot follow or maintain the equilibr ium.
Liquidity risk is considered a significant threat to the financial institution and financ ia l
system stability. Khan et al., (2007) finds out that a bank is responsible for maintaining
a liquidity buffer for managing liquidity risk and ensuring against small liquid ity
shocks. The solvency position of the financial institution is threatened by Liquid ity
shock. Acharya and Naqvi (2012) explain that when banks have tremendous liquid ity,
bank managers may take more risk by aggressively lowering the lending rate to
increase loan volume to enhance their compensation. When banking and financ ia l
institutions are unable to fulfill the present demand of the customer or are unable to
convert the short-term deposit into a long-term deposit, liquidity risk arises. The
liquidity risk increases arise a high possibility of bankruptcy. The bank should
maintain the appropriate liquidity policy or acquire appropriate liquidates when
needed immediately at a reasonable cost. The whole banking and financial system rely
on an optimum level of liquidity. Gomes (2010) find out that the liquidity risk
management shows the flaws in management methods that emerged in the financ ia l
market.
7
Tabari et al., (2013) finds that liquidity ratio is defined as the significant ratio
composed of quick ratio and current ratio. The other ratios developed to measure
liquidity are the liquid ratio, liquid assets to total assets, and total deposit loans and
advances to deposit. Anger (2007) explain that banking stability during a crisis is
reduced by an increase in the liquidity of bank assets but not during standard times.
Macroeconomic variables and bank-specific variables affect the commercial bank's
liquidity.
In the Nepalese context, Kumar and Yadav (2013) described liquidity as the capacity
of a bank to increase funds in assets to meet both expected and unexpected cash and
collateral obligation at reasonable cost but without incurring unacceptable losses.
Baral (2005) revealed that when depositors of commercial banks seek to withdraw
money in the case of a commercial bank, the first type of liquidity risk arises.
The above discussion shows that the studies dealing with macroeconomic factors and
bank-specific factors of liquidity in the case of Nepalese private, public, and joint
venture banks are of greater significance. Although various findings as discussed
above in different countries, no such finding using more recent data exists in Nepal's
context. Hence, this study focuses on macroeconomic and bank-specific liquid ity
factors in Nepalese public, private and joint-venture banks.
1.2 Statement of problem
Bhunia (2010) finds that a study of liquidity to both the internal and external
environments is of significant importance to financial institutions and analysts because
of its close relationship with day-to-day operations. For maximizing profits level and
concurrently remaining liquid, the need for efficient liquidity management in the
banking industry cannot be over-emphasized. However, gaining more of one
ordinarily concedes some of the other Osuji & Agbada (2013).
Due to poor liquidity management, bank across the world is facing problems with the
liquidity crisis. Managing liquidity risks is paramount as every transaction or
8
commitment has implications for a bank's liquidity. In an enterprise-wide risk
management framework liquidity risk is known as one of the crucial factors. To
maintain sufficient liquidity to withstand all kinds of stress events that will be faced in
the future; banks liquidity framework gives a clear concept. The regular maintenance
of liquidity position and liquidity risk management framework is an important
supervisory action that will ensure the proper functioning of the bank
(www.globaltreasure.com, 2021).
1.3 Research question
Which factors play an essential role in determining the liquidity of Nepalese
banks?
What is the magnitude and direction of the relationship among the variables?
1.4 Objective of study
The study's primary objective is to analyze the effect of macroeconomic factors and
bank-specific factors on the liquidity of commercial banks in Nepal. However, the
specific objectives of the study are listed below:
To analyze the significant determinants of liquidity in the case of commercia l
banks.
To determine the relationship between macro-economic & bank-specific factors
and liquidity position of commercial banks.
To examine the pattern of liquidity, NPL, ROA, CAR, BS, GDP, INF, and TB
interest rate in Nepalese banks.
1.5 Research Hypothesis
This section explains and defines the various independent and dependent variables
used in this study based on the significant assumption made to conduct the study. This
study has used two types of liquidity ratios to analyze the liquidity of commercia l
9
banks in Nepal. First are liquid assets to total assets (L1), whereas liquid assets to total
deposit (L2) are second. Since L1 and L2 are the dependent variables, capital adequacy
ratios, return on assets, non-performing loan, bank size, gross domestic product,
inflation, and short-term interest rate are considered independent variables. These
variables have been described below:
Dependent Variable
Liquidity ratio
Liquid assets are defined as assets that can be convertible into cash in a short period
or within a year and measure the company's ability to pay short-term obligations. This
study describes two liquidity ratios: the ratio of liquid assets to total assets and the ratio
of liquid assets to total deposits. Delechatet. al, (2012) find out that this study uses
liquid assets such as cash balance, balance with NRB, bank balance, and money at call
and government securities. In their study, different authors have used cash, bank
balance at the central bank, and money at call and government securities as the
significant liquid assets.
Independent Variable
Non-Performing Loan
Ghafoor (2009) point out that NPL are loans in which a bank customer fails to meet
people's contractual obligations on either interest or principal payments exceeding 90
days. Huge non- performing loans can result in loss of confidence for foreign investors
and depositors who may start a run-on bank, leading to liquidity problems. McNulty
et al. (2001) finds the negative impact on bank liquidity was caused by non-performing
loans. Muriithi (2010 explain the non-performing loans have the most significant
negative influence on bank liquidity. Umar and Sun (2016) concluded that non-
10
performing loans (NPL) negatively impacted bank liquidity. Based on this study, the
following hypothesis is developed:
H0.1: There is no significant relationship between bank liquidity and non-performing
loan.
Return on assets
This ratio measures the bank's profitability by investing its assets in various sectors.
ROA is a ratio of net income by total assets. Moreover, it measures the management's
ability to convert its assets into net earnings. Almumani (2013) explain that higher
liquidity may result in lower returns on assets with a less significant impact on overall
profitability. Liquidity is inversely linked to return on assets as liquidity increases
return on assets decreases and vice versa. Margolis and Walsh (2003) found a negative
and significant relationship between financial performance and liquidity. Bourke
(1989) found that liquid assets to total assets measure liquidity ratio, negatively linked
to return on assets (ROA).
Based on it, the following hypothesis is developed in this study:
H0.2: There is no significant relationship between bank liquidity and return on assets.
Capital Adequacy ratio
The capital adequacy ratio keeps banks out of difficulty and protects the bank against
excess leverage, insolvency. The ratio of bank capital (tier 1 capital and tier 2 capitals)
to risk-weighted assets is the capital adequacy ratio Repullo (2004) revealed that
capital allows the bank to absorb risk. Empirically, CAR has a positive impact on
liquidity risk Iqbal (2012). Malik and Rafique (2013) examined the macroeconomic
and bank-specific determinants of banks liquidity and found that capital adequacy
positively impacts bank liquidity.
Based on this study, the following hypothesis are developed
H0.3: There is a significant relationship between bank liquidity and capital adequacy.
11
Bank Size
According to Akhtar et al. (2011) total bank assets are used as a proxy for bank size.
Bank size has a negative and significant impact on liquidity. The small bank needs to
maintain sufficient liquidity while a large-sized bank can arrange funds from external
sources. This study implied that the liquid buffer of the bank decreases as the increase
in bank size. Tesfaye (2012) explain that bank size has a negative and statically impact
on bank liquidity. Dinger (2009) found a negative relationship between liquidity and
bank size. Rauch et al. (2010) found that bank size is negatively associated.
Based on the above study the following hypothesis was developed in this study:
H0.4: There is no significant relationship between bank liquidity and bank size.
GDP Growth
It is the sum of the total value of services and goods produced within the specified
period within the country's boundary. Levine & Zervos (1998) explain that there are
so many factors that have been linked with GDP, so it is one of the vital determinants
of liquidity. Bunda and Desquibet (2008) found that there is a positive impact of GDP
on bank liquidity. Choon et al. (2013) finds that the export and domestic consumption
increase with the increase in GDP, leading to an increase in the income level that leads
to an increase in consumption level in contrast, liquidity also increases. Moussa (2015)
stated that GDP resulted in a positive impact on bank liquidity. GDP significantly
influenced stock market liquidity between 1976 and 1993 Levine & Zervos (1998).
Based on this study, the following hypothesis is developed:
H0.5: There is a significant relationship between bank liquidity and gross domestic
product growth.
Inflation
12
Inflation is the rate at which the subsequent purchasing power is falling, and the level
of prices for goods and services is increasing over the period. Chioma et al. (2014)
finds out that inflation results in a significant positive impact on organizations '
investment decisions Abouie et al. (2012) concluded that variables of domestic deposit
rates, foreign interest rates, and size liquidity positively affect the inflation rate. Singh
and Sharma (2016) found a positive relationship between liquidity and inflat ion.
According to Tseganesh (2012) find out that the inflation has a positive impact on
liquidity.
Based on it, the following hypothesis was developed:
H0.6: There is a significant relationship between bank liquidity and inflation.
Short-term interest rate
To meet its customers' cash requirements, a bank needs to hold liquid assets because
the short-term interest rate is usually less than one year, precisely three months. Moore
(2009) point out that when the institution does not have the resources to satisfy its
customers' demand, they either need to borrow on the inter-bank market or the central
bank. Benbouziane and Benamar (2008) stated a negative relationship between interest
rate and liquidity. Joshi (2016) found out a negative relationship between bank
liquidity and short-term interest rate.
H0.7: There is no significant relationship between short-term interest rate and bank
liquidity.
1.6 Significance of Study
In the context of Nepalese public banks, joint venture banks, and private banks, this
study mainly focuses on identifying the bank-specific and macroeconomic factors on
bank liquidity. This study could be helpful both for banking and financial institut ion
and the non-banking sector. Malik and Ahmed (2013) observed that the firm and
industry-specific factors related to liquidity management affect the chemical sector's
13
performance in terms of the market to book value. Thus, the study of liquid ity
management assists in both financial institutions, banking, and non-banking sectors.
Due to a lack of adequate liquidity, it is vital to understand the consequences. Bank
ultimately increases the liquidity risk, which results in maintaining a high level of
liquidity. The bank cannot fulfill the obligations such as deposit withdrawal, debt
maturity, and funds for loan portfolio and investment if liquidity risk increases.
Liquidity management is considered a never-ending problem for a financial institut ion,
and banks and management always try to avoid liquidity. It is indispensable to identify
the various factors affecting liquidity to reduce the liquidity problem. Different factors
are affecting liquidity. Among those factors, the dominant role is played by the bank-
specific and macroeconomic factors. Thus, this study tries to find out the impact of
bank-specific and macroeconomic determinants that affect liquidity. The issue related
to liquidity is becoming challenging to manage because, currently, banks and financ ia l
institutions in Nepal have been facing its problem. Many studies have been carried out
in an international scenario to determine the impact of macroeconomic and bank-
specific factors on liquidity. In the case of the Nepalese banking scenario, there is no
exclusive study on the bank-specific and macroeconomic determinants of liquid ity.
So, this study fulfills the gap to certain limits to help further studies in countries like
Nepal. Moreover, it contributes to the financial sectors of society and the economy.
Therefore, the primary beneficiaries of this study are commercial banks, regulatory
bodies, academic staff, and society.
1.7 Limitation of study
Though the study provides many valid reasoning and results to support the factors
affecting liquidity on banking sector, but the study has some limitations which are been
outlined.
1. There are twenty-eight commercial banks which operate in the country, but only
ten commercial banks are considered for the study purpose. Therefore, the
inclusion of all 28 commercial banks in this study would have provided more valid
results.
14
2. It may also be noted that only secondary data are considered for the study purpose
therefore, primary survey is not taken into consideration. Hence, the result of the
study is not broad and flexible.
3. In addition, this study is based on the commercial bank only. Thus, the study of
other financial institutions like finance companies, development banks, and
micro-finance and cooperative banks is not considered.
4. The study also does not include the other different liquidity measures of the bank
like quick ratio and current ratio.
5. The study used limited statistical and financial tools. So, this may limit the valid ity
of the study findings.
6. The study results could not be fruitful for manufacturing and trading enterprises
because the study is only based on the banking sector.
7. The study period includes ten years of data from the year 2010/11-2019/20.
8. The macro-economic variables do not include government expenditure because
the study is more focused on the bank-specific variable.
1.8 Organization of study
The study is divided into six chapters: introduction, literature review, research
methodology, analysis of data, results, and conclusion, and recommendation. The
introduction chapter which includes a general background of the study with narrow
aspects, a statement of the problem, the significance of the study, objectives of the
study, and operational definitions, including organization of the study. Similarly, the
review of literature includes the study regarding the subject matter from a different
research article, books, and previous studies. Likewise, Research methodology is
included research design, population, sample size, data collection, procedures and
tools used for this analysis. Moreover, chapter four deals with the main body of the
research work and deals with data presentation and analysis of data. Moreover, chapter
five explain about results using the descriptive analysis, correlation analysis and
regression analysis. Finally, the last chapter deals with a summary, conclusion. and
recommendation.
15
2 LITERATURE REVIEW
2.1 Review of related literature
Vtyurina et al., (2012) find out that using a panel of about 100 commercial banks from
central America, studied the determinants of bank' liquidity buffers. According to this
study, there was a positive relationship between bank size, capital adequacy, and
financial development with bank liquidity and profitability, whereas the loan loss
reserve ratio has a negative relationship with liquidity.
Moreover, Aspachset. al (2005) argued that government security, cash, balance with
the central bank are significant liquid assets. There is a problem of excess liquidity and
potentially low profits compared to other banks with a low ratio of loans to deposits.
On the other hand, the high loan to deposit ratio indicates the risk that some loans may
contain to be sold at a loss to meet depositor's claims.
Fatima (2014) point out that the bank's capital is used to expand the business and
ensured by an appropriate level of capital adequacy, while at the same time, its net
worth is enough to absorb any financial downturns without becoming insolvent.
Berger and Bouwman (2009) find out the positive relationship between liquidity and
capital. The study showed that a high level of capital facilitated banks to create more
liquidity which provides risk-bearing potential to the bank.
Tseganesh (2012) studied the impact of financial performance on the commercial bank
with determinants of bank liquidity in Ethiopia. The two points are mainly concerned
in this study; see the impact of bank liquidity on financial performance through the
significant variables explaining liquidity and identify determinants of commercia l
bank liquidity in Ethiopia. The bank size, capital adequacy, the share of non-
performing loans in the total volume of loans have a statistically significant and
positive impact on bank liquidity; however, loan growth has a statistically insignificant
impact on bank liquidity indicated in the study.
16
Lucas (1990) finds that a series of models for transactions in goods and assets
transactions as a primary requirement of money. Government open-market operations
induce liquidity effects which lead to interest rate behavior quite different from the
behavior based on fisherian fundamentals. A study in the USA revealed that liquid ity
effects could induce a serially correlated stochastic component to equilibrium interest
rates that do not bear any definite relationship to fundamentals in the sense of Irving
Fisher. This liquidity can induce sudden, significant drops in the prices of bonds and
other securities. The right image is getting one's wind knocked out but not a bubble
popping.
Vodova (2011) find that the study on determinants of commercial bank liquidity was
carried out in Poland which cover data periods from 2001 to 2010, where a panel of
37 commercial banks has taken as a sample of the study, including eight
macroeconomic factors and four bank-specific. The dropped financial crisis, economic
downturn, and increase in unemployment after panel data regression analysis strongly
determine the definition of bank liquidity through overall economic condition. The
study shows increasing bank profitability and increase in bank size decrease the bank
liquidity. Bank liquidity increases with higher inflation, the share of non-performing
loans capital adequacy, and interest rates on loans. Inflation increases the bank's
vulnerability to nominal values of loans provided to customers which bank holds more
liquid assets during inflation.
Abdullah and Khan (2012) examined the risk management of liquidity by taking a
comparative study between domestic and foreign banks in Pakistan, establishing the
firms level aspects that influence credit risk managing. The secondary data from the
period of 2001 to 2010 was taken in the study. Augmented Dickey-Fuller test is used,
and Johansson's Co-integration is used for the long-run relationship to check data
stationery. For the analysis linear regression model with OLS techniques is used. The
study found that the relationship between bank size and liquidity risk is negative and
significant in the domestic bank but negative and insignificant in a foreign bank. The
relationship of debt-to-equity ratio is significant for both domestic and foreign banks
17
but negative with liquidity risk. There is an insignificant relationship between domestic
and foreign banks and negative investment to assets ratio with liquidity risk. The
relationship shows a negative relationship between liquid assets with liquid ity,
insignificant in domestic banks, and positive or significant in foreign banks.
Olagunju et al. (2011) studied that the commercial banks' profitability and managing
liquidity of the banking system in Nigeria. Sarkaret (1998) explain that the
performance of banks measured by ROA reflects the bank's ability to generate profit
from the bank assets. The primary and secondary data obtained were analyzed by
collecting, grouping, and sorting data in percentage and frequency distribution tables.
This study formulated the hypothesis, which is statistically tested through Person
correlation data analysis. The significant relationship between liquidity and
profitability is concluded in the study. Profitability in commercial banks is
significantly influenced by liquidity and vice versa. The commercial banks should not
compromise effective and efficient liquidity management and liquidity risk
management. The financial diseases are result of the excess liquidity and illiquid ity
that can quickly erode the profit base of banks as they affect banks' attempt to attain a
high profitability level for the success of operation and survival.
Sudirman (2014) investigated the determinant of liquidity in Indonesia, includ ing
using indicators to measure liquidity as the ratio of liquid assets to total deposits and
short-term funding. The determinant of a bank's liquidity can be grouped into interna l
factors and external factors. The internal factors are specific banking performance,
capital, asset quality, efficiency, profitability, previous year liquidity, and funding. In
contrast, the external factors that come from the state of the macro economy consisting
of inflation, capital market development, interest rate, and GDP growth rate are
determinant factors of bank liquidity. The sample of 20 banks from 2004 to 2011 with
a generalized moment method is used in this study. The empirical findings indicate
that the liquidity of the previous year, funding, capital, asset quality, and profitability
affect bank liquidity. The funding shows a negative effect, whereas other variables
18
showed a positive effect only with proxy Tier 1 capital. Several external factors affect
the liquidity of banks, namely, capital market development, interest rate, and inflat ion.
(Fidrmuc, 2015) empirically investigated a large emerging market in Russia whether
bank liquidity creation fosters economic growth. The panel data set covers the period
from 2004 to 2012 used in the study. The study uses empirical analysis by estimating
a fixed effects model and GMM estimations to examine the relation of liquid ity
creation to economic growth for a given period. The study showed that for economic
growth the liquidity creation role is beneficial and positively associated with growth,
even though this link is only significant when computing liquidity creation based on
maturity classification.
Singh and Sharma (2016) investigated that the liquidity of Indian banks to determine
bank-specific and macroeconomic factors. Random effect estimates and OLS fixed
effect on a data set of 59 banks from 2000 to 2013 to explore the association. Bank
size, profitability, capital adequacy, and deposits are included in bank-specific factors,
while INF and GDP are considered as macroeconomic factors. The ownership
performed a liquidity trend analysis of Indian banks, which revealed that bank
ownership affects bank liquidity, including bank size, deposits, profitability, capital
adequacy, GDP, and Inflation. Moreover, bank size and GDP negatively affected bank
liquidity, while deposits, profitability, capital adequacy, and inflation positive ly
affected bank liquidity.
Subedi and Neupane (2013) analyzed that the liquidity based on pooled data of 20
commercial banks for seven years from 2007 to 2013 in Nepalese commercial banks
as idiosyncratic and macroeconomic determinants. Joshi (2016) found that interest
margin, profitability loan growth, bank size, and treasury bill rate negatively impact
liquidity. GDP with increased interest margin, profitability, loan growth, and bank size
has a positive impact with liquidity while the TB rate has negative impact with
liquidity. This study examined the determinants of commercial banks liquidity in
Nepal. The study included data of 18 commercial banks for seven years from 2008 to
2014, where the liquidity in terms of liquid assets to total assets ratio and total loans
19
to total assets ratio is selected as dependent variables. Prior study shows that net
interest margin, capital adequacy ratio, return on assets, return on equity, non-
performing loan ratio, bank size, and total deposits to total assets ratio are used as
independent variables.
Sharma (2016) showed that the relationship between liquid assets to total assets ratio
and return on assets is positive, indicating that the higher the return on assets. The
increase in bank size will lower the liquid assets to total assets ratio which reveal that
a negative relationship between bank size, net interest margin, total deposit to total
assets ratios, and liquid assets to total assets ratio, revealing that. Similarly, if the net
margin is a higher the value of liquid assets to total assets ratio will be lower. Likewise,
the result showed a positive correlation of total loan to total assets ratio with capital
adequacy ratio, which indicates that the higher the total loan to total assets the higher
will be the capital adequacy ratio.
Table 2.1.1 Summary of recent literature
Study Major findings
Distinguin, et.al(2013)
The research paper finds out the comparison of small banks
and large banks in regarding of maintenance of liquid ity
reserve, the small bank shout maintains the maximum level
of liquidity in order to make smooth operation of the bank,
but this problem does not occur in large bank.
Lei and Song (2013) The liquidity creation and performance of bank is negative
with huge bank in China and positive with small banks.
Muharam and Kurnia
(2013)
The study found positive impact of ROA with liquidity with
insignificant effect and negative and significant influence of
CAR to liquidity risk on conventional bank.
Audo (2014) The study finds out that the regression analysis shows no
significant relationship between INF and liquidity ratio of

20
commercial bank. Therefore, INF is not regarded as a
significant macroeconomic variable to affect liquidity ratio.
Chagwiza (2014)
There is a positive link between bank liquidity and CAR,
total assets, GDP, and TB rate. It also found that the adoption
of multi-currency has negative impact on liquidity. The BS
and liquidity are positively correlated.
Sudirman (2014)
The study finds out some significant variables which,
interest rate, inflation, capital, asset quality, profitability,
funding, and capital market development determine the
banking liquidity in Indonesia.
Melese and
Laximikantham
(2015)
The study points out that the large bank is more prone to
liquidity risk than small bank.
Nishanthini and
Meerajancy (2015)
This study indicated that bank having lower level of
profitability would have the higher level of liquidity.
Olarewaju
andAdekyemi (2015)
The study finds that there is no causal relationship between
liquidity and profitability of Eco bank, IBTC, Unity bank,
UBA, Fidelity bank, Wema bank, Union bank, Guaranty
trust bank, Zenith bank, Sterling bank, and Diamond bank.
Boadi,et.al (2016)
The CAR is larger for bank that is required to maintain less
liquidity therefore, the relationship of CAR and bank is
significant.
Singhand Sharma
(2016)
The study finds out that the deposits, profitability, capital
adequacy and inflation showed a positive effect on bank
liquidity whereas BS and GDP were found to have a
negative effect on bank liquidity.
Aymen et al. (2016) The study found that as inflation rates fall banks maintained
high liquidity and vice versa.

21
Table 2.1.2 Summary of Nepalese studies
Study Major findings
Baral (2005) The study finds that the high level of liquidity is reduce
profitability.
Shrestha (2012)
There is no significant impact of liquid fund to liability on
profitability, cash and bank balance to deposit ratio and
liquidity fund to deposit ratio.
Sthapit and
Maharjan (2012)
The standard chartered bank shows significant impact of
liquidity on profitability whereas Nabil bank doesn’t show
significant impact.
Subedi and Neupane
(2013)
The study explains that the loan growth, growth rate of GDP
on the basis price level, liquidity premium paid by borrowers
and TB rate have negative and statistically insignificant impact
on bank liquidity. The CAR, share of NPL in the total volume
of loans have negative and statistically significant impact on
bank liquidity whereas
Joshi (2016)
The study showed that there is positive impact of liquidity on
GDP but negative impact of liquidity on interest margin,
profitability, loan growth, BS, and TB rate.
Bariyaet.al (2016)
The study shows that the higher return on equity leads to higher
current ratio, liquidity management, net liquid balance,
financial leverage. and size. It also shows lower would be the
return on equity when there is larger the assets quality.
Sharma (2016) The study revealed that increase in bank size will lower the
liquid assets to total assets ratio. There is negative relationship
22
between BS, net interest margin, liquid assets to total assets
ratio, and total deposit to total assets ratios.
2.2 Theoretical Framework
The theoretical framework is a set of plans, designs, and ideologies used to structure a
successive presentation and required for the particular study. It has the power to
provide the correct platform for the study when the conceptual framework is clearly
and correctly articulated and assists a researcher in making meaningful findings.
Theoretical framework, in many ways, contributes to a study that identifies the
dependent and independent variables and clearly defines the appropriate relationship
among the variables. It is linked to the statement of the problem clearly to set the stage
for presenting the data. The conceptual framework consists of two dependent variables
and other independent variables to be tested through various statistical tools in the
study. The first model consists of a dependent variable: liquid assets to total assets to
shape the bank's overall liquidity.
At the same time, various researchers, Vodova (2011) and Malik & Rafique (2013)
had used a similar model to identify the appropriate relationship. The second model
consists of the dependent variable of liquid assets to total deposit ratio. The study
measures the bank-specific and macroeconomic factors based on the literature review
of the liquidity conceptual framework developed, and the conceptual framework is
presented.
The theoretical framework diagram is shown below:
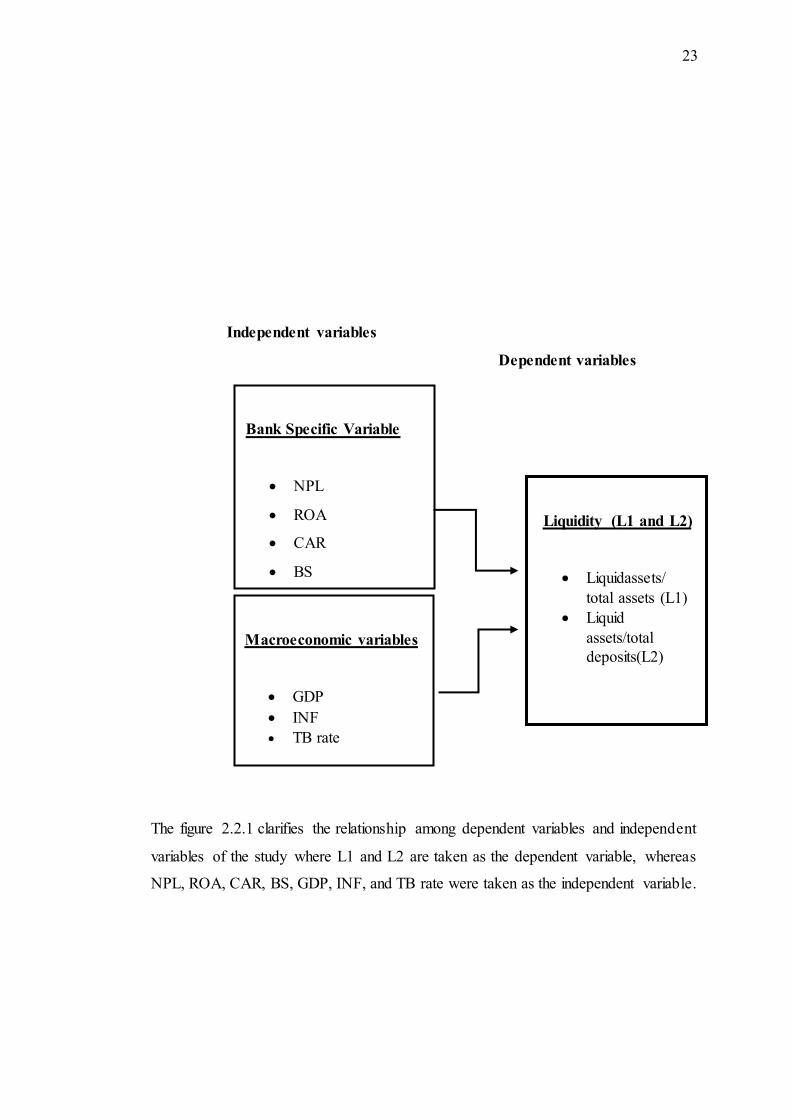
Figure 2.2.1 Theoretical Framework Diagram
23
Independent variables
Dependent variables
The figure 2.2.1 clarifies the relationship among dependent variables and independent
variables of the study where L1 and L2 are taken as the dependent variable, whereas
NPL, ROA, CAR, BS, GDP, INF, and TB rate were taken as the independent variable.
Bank Specific Variable
NPL
ROA
CAR
BS
Credit to deposit
Liquidity (L1 and L2)
Liquidassets/
total assets (L1)
Liquid
assets/total
deposits(L2)
Macroeconomic variables
GDP
INF
TB rate
24
3 RESEARCH DESIGN AND METHODOLOGY
Research is considered a systematic and organized effort to investigate a specific
problem that needs a solution. The research design, nature and sources of data, data
collection procedure, tools, and analysis techniques are looked out in this chapter and
applied methodological are used for this research.
3.1 Research design
In this study, the research design adopted consists of descriptive and causal-
comparative research design to deal with the fundamental issues associated with the
macroeconomic and bank-specific factors of liquidity. The phenomenon as they exist
is described in descriptive research design adopted to undertake fact-find ing
operations searching for adequate information in terms of efficiency in Nepalese
commercial banks. This study has been adopted to establish the directions, magnitudes,
and forms of the observed relationship between liquidity and other independent
variables and to examine the causal comparative relationship between macroeconomic
and bank-specific variables with liquidity.
3.2 Population and sample size determination
The commercial bank is taken into consideration in this study based on 'A' level
financial institution. The data in the study were collected from various sources like the
Nepal Rastra Bank website, World Bank website, and Global economy websites to
examine the impact of macroeconomic and bank-specific liquidity factors. Many
banks specific and macroeconomic variables cause a significant effect on liquid ity,
which has been used due to lack of data availability. The secondary source data focuses
on bank-specific and macroeconomic determinants of liquidity of 10 commercia l
banks, including one public sector bank, four joint-venture banks, and five private
sector banks. Based on the oldest on their cluster and availability of data, bank samples
are selected.
25
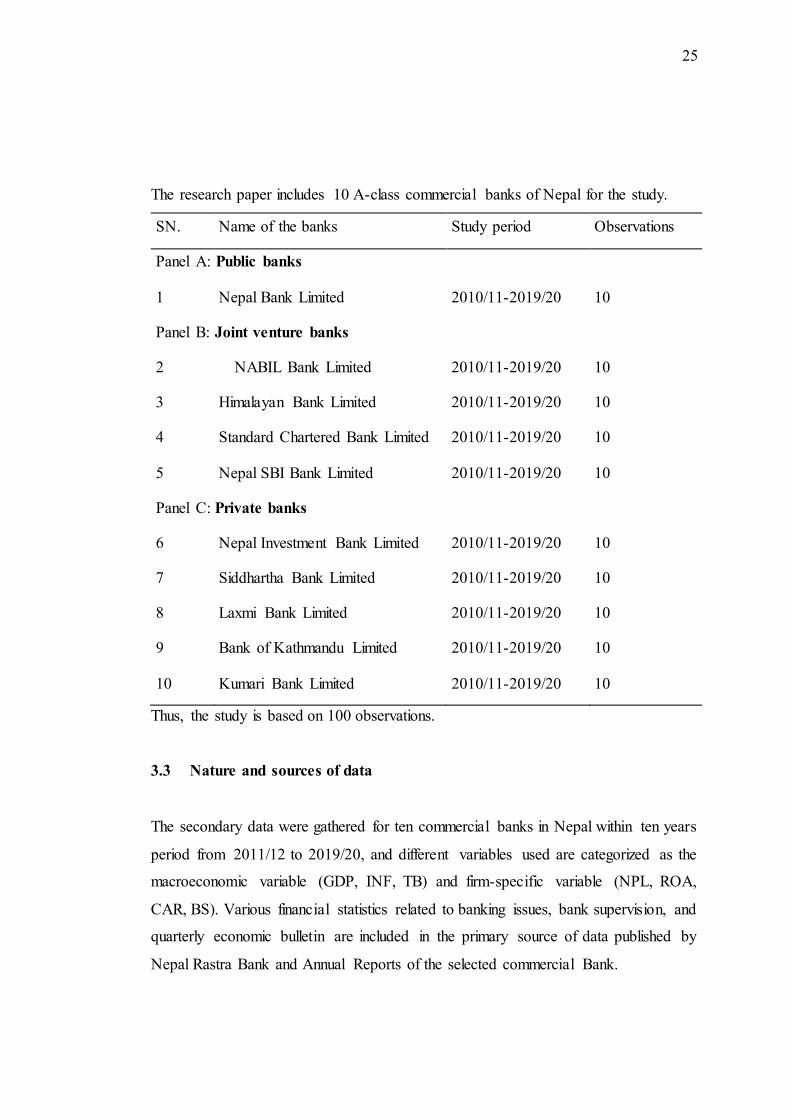
The research paper includes 10 A-class commercial banks of Nepal for the study.
SN. Name of the banks Study period Observations
Panel A: Public banks
1 Nepal Bank Limited 2010/11-2019/20 10
Panel B: Joint venture banks
2 Nabil Ban NABIL Bank Limited 2010/11-2019/20 10
3 Himalayan Bank Limited 2010/11-2019/20 10
4 Standard Chartered Bank Limited 2010/11-2019/20 10
5 Nepal SBI Bank Limited 2010/11-2019/20 10
Panel C: Private banks
6 Nepal Investment Bank Limited 2010/11-2019/20 10
7 Siddhartha Bank Limited 2010/11-2019/20 10
8 Laxmi Bank Limited 2010/11-2019/20 10
9 Bank of Kathmandu Limited 2010/11-2019/20 10
10 Kumari Bank Limited 2010/11-2019/20 10
Thus, the study is based on 100 observations.
3.3 Nature and sources of data
The secondary data were gathered for ten commercial banks in Nepal within ten years
period from 2011/12 to 2019/20, and different variables used are categorized as the
macroeconomic variable (GDP, INF, TB) and firm-specific variable (NPL, ROA,
CAR, BS). Various financial statistics related to banking issues, bank supervision, and
quarterly economic bulletin are included in the primary source of data published by
Nepal Rastra Bank and Annual Reports of the selected commercial Bank.
26
3.4 Data analysis plan
This topic deals with economic and statistical models to analyze data using a statistica l
package for social science (SPSS 20). For the analysis of data, three methods are used.
Firstly, to describe the characteristics of sample firms during the periods from 2011/12
to 2019/20, which is used to measure descriptive statistics such as mean, standard
deviations, minimum and maximum variables. Moreover, correlation analysis is used
to assess the direction of the relationship between the dependent and independent
variables. Finally, to find out the influence of independent variable over dependent
variable solely and combined with other variables, regression analysis is used.
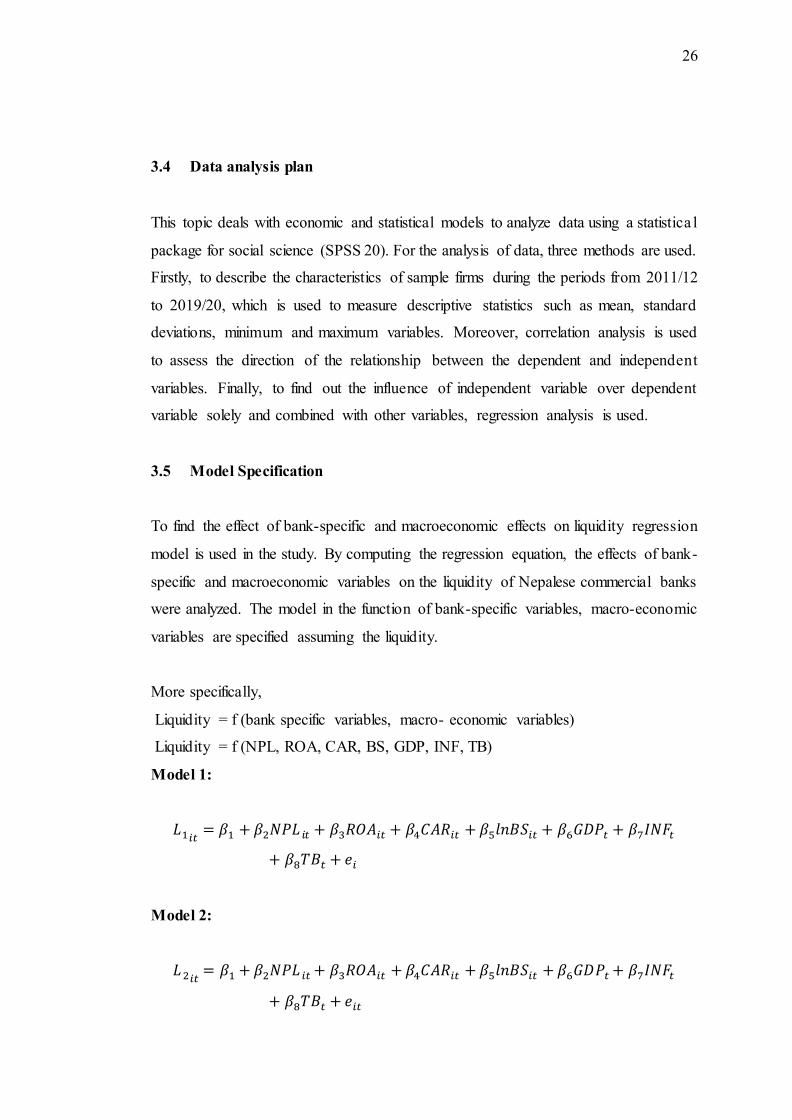
3.5 Model Specification
To find the effect of bank-specific and macroeconomic effects on liquidity regression
model is used in the study. By computing the regression equation, the effects of bank-
specific and macroeconomic variables on the liquidity of Nepalese commercial banks
were analyzed. The model in the function of bank-specific variables, macro-economic
variables are specified assuming the liquidity.
More specifically,
Liquidity = f (bank specific variables, macro- economic variables)
Liquidity = f (NPL, ROA, CAR, BS, GDP, INF, TB)
Model 1:
𝐿1𝑖𝑡= 𝛽1 + 𝛽2𝑁𝑃𝐿 𝑖𝑡 + 𝛽3𝑅𝑂𝐴𝑖𝑡 + 𝛽4𝐶𝐴𝑅𝑖𝑡 + 𝛽5𝑙𝑛𝐵𝑆𝑖𝑡 + 𝛽6𝐺𝐷𝑃𝑡 + 𝛽7𝐼𝑁𝐹𝑡
+ 𝛽8𝑇𝐵𝑡 + 𝑒𝑖
Model 2:
𝐿 2𝑖𝑡= 𝛽1 + 𝛽2𝑁𝑃𝐿 𝑖𝑡 + 𝛽3𝑅𝑂𝐴𝑖𝑡 + 𝛽4𝐶𝐴𝑅𝑖𝑡 + 𝛽5𝑙𝑛𝐵𝑆𝑖𝑡 + 𝛽6𝐺𝐷𝑃𝑡 + 𝛽7𝐼𝑁𝐹𝑡
+ 𝛽8𝑇𝐵𝑡 + 𝑒𝑖𝑡
27
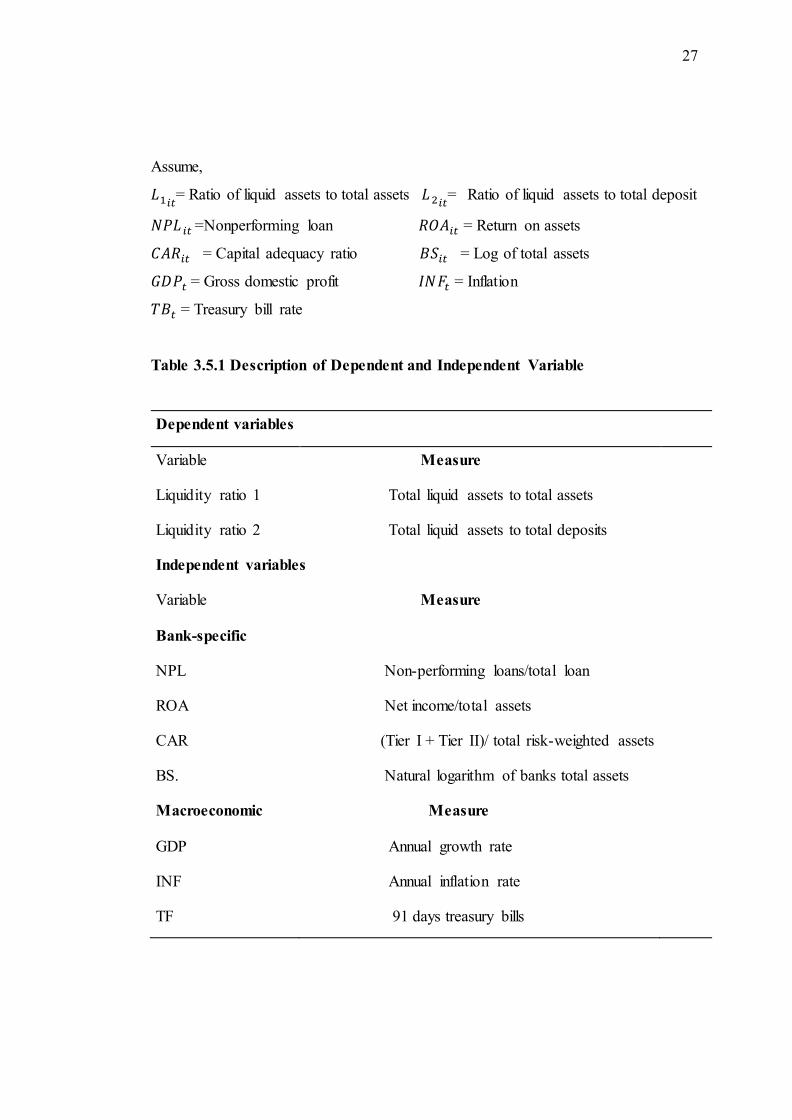
Assume,
𝐿1𝑖𝑡= Ratio of liquid assets to total assets 𝐿 2𝑖𝑡
= Ratio of liquid assets to total deposit
𝑁𝑃𝐿 𝑖𝑡 =Nonperforming loan 𝑅𝑂𝐴𝑖𝑡 = Return on assets
𝐶𝐴𝑅𝑖𝑡 = Capital adequacy ratio 𝐵𝑆𝑖𝑡 = Log of total assets
𝐺𝐷𝑃𝑡 = Gross domestic profit 𝐼𝑁𝐹𝑡 = Inflation
𝑇𝐵𝑡 = Treasury bill rate
Table 3.5.1 Description of Dependent and Independent Variable
Dependent variables
Variable Measure
Liquidity ratio 1 Total liquid assets to total assets
Liquidity ratio 2 Total liquid assets to total deposits
Independent variables
Variable Measure
Bank-specific
NPL Non-performing loans/total loan
ROA Net income/total assets
CAR (Tier I + Tier II)/ total risk-weighted assets
BS. Natural logarithm of banks total assets
Macroeconomic Measure
GDP Annual growth rate
INF Annual inflation rate
TF 91 days treasury bills
28
3.6 Analysis of plan
The analysis that has been carried out in chapter four is discussed in this section.
Specific steps and procedures are necessary for data analysis to understand the result
and generalize the findings. The relationship and cause and effect between the
variables are intended by analysis of data. The various sub-sections come under the
analysis plan. Firstly, the descriptive statistics of the sample observation include mean,
standard deviation, minimum, and maximum value of observations. In the second
section, the correlation analysis is carried out, followed by regression analysis. To
make the result more valid significance test is done. Finally, to derive the meaningful
conclusion regarding the bank-specific and macroeconomic variable effect on the
liquidity of Nepalese commercial bank, all the observed relationship and finding was
interpreted.
29
4 DATA ANALYSIS
This chapter deal with various issues related to the bank-specific and macroeconomic
determinant of liquidity, providing systematic presentation, interpretation, and
analysis of secondary data collected from the Nepal Rastra Bank website and central
bureau of finance and statistics of Nepal. Moreover, it deals with statistical and
econometric models described in the third chapter. Here, structure and pattern analysis,
descriptive statistics, correlation analysis, regression analysis, and concluding remarks
about the result derived from the secondary data are analyzed.
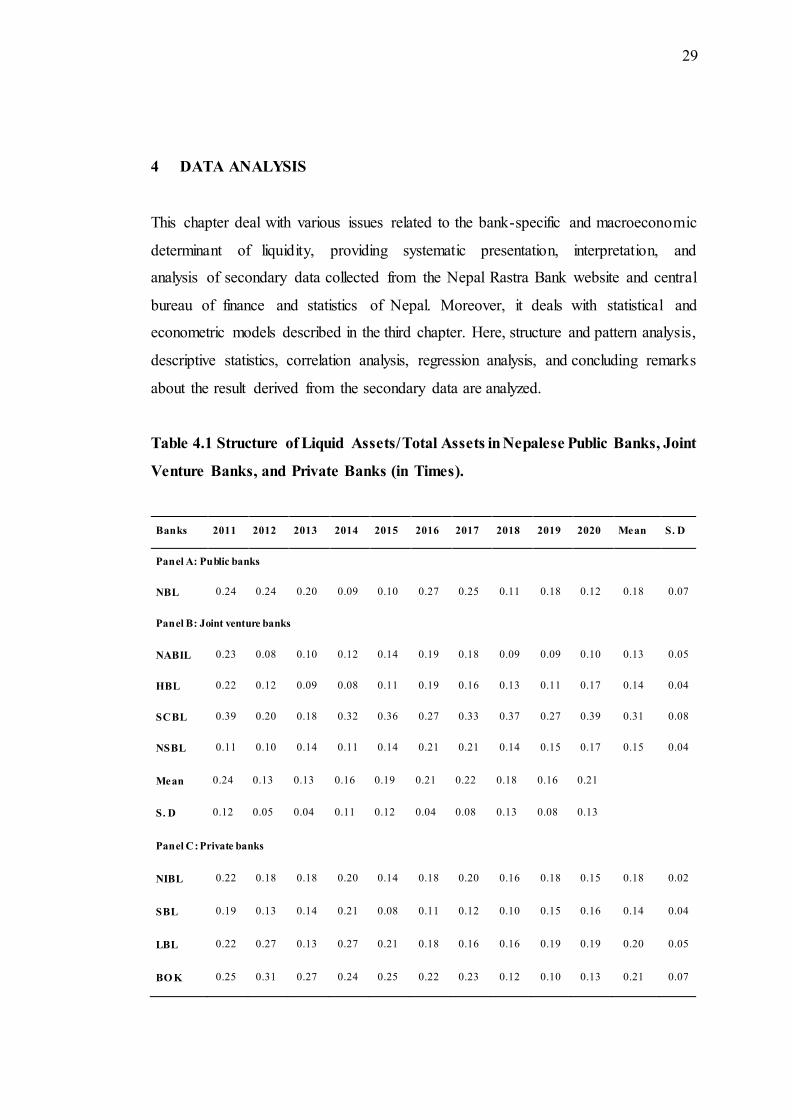
Table 4.1 Structure of Liquid Assets/ Total Assets in Nepalese Public Banks, Joint
Venture Banks, and Private Banks (in Times).
Banks 2011 2012 2013 2014 2015 2016 2017 2018 2019 2020 Mean S. D
Panel A: Public banks
NBL 0.24 0.24 0.20 0.09 0.10 0.27 0.25 0.11 0.18 0.12 0.18 0.07
Panel B: Joint venture banks
NABIL 0.23 0.08 0.10 0.12 0.14 0.19 0.18 0.09 0.09 0.10 0.13 0.05
HBL 0.22 0.12 0.09 0.08 0.11 0.19 0.16 0.13 0.11 0.17 0.14 0.04
SCBL 0.39 0.20 0.18 0.32 0.36 0.27 0.33 0.37 0.27 0.39 0.31 0.08
NSBL 0.11 0.10 0.14 0.11 0.14 0.21 0.21 0.14 0.15 0.17 0.15 0.04
Mean 0.24 0.13 0.13 0.16 0.19 0.21 0.22 0.18 0.16 0.21
S. D 0.12 0.05 0.04 0.11 0.12 0.04 0.08 0.13 0.08 0.13
Panel C: Private banks
NIBL 0.22 0.18 0.18 0.20 0.14 0.18 0.20 0.16 0.18 0.15 0.18 0.02
SBL 0.19 0.13 0.14 0.21 0.08 0.11 0.12 0.10 0.15 0.16 0.14 0.04
LBL 0.22 0.27 0.13 0.27 0.21 0.18 0.16 0.16 0.19 0.19 0.20 0.05
BO K 0.25 0.31 0.27 0.24 0.25 0.22 0.23 0.12 0.10 0.13 0.21 0.07
30
KBL 0.22 0.26 0.27 0.26 0.25 0.23 0.25 0.12 0.18 0.15 0.22 0.05
Mean 0.22 0.23 0.20 0.23 0.19 0.18 0.19 0.13 0.16 0.16
S. D 0.02 0.07 0.07 0.03 0.07 0.05 0.05 0.03 0.04 0.02
Source: Nepal Rastra Bank/Bank and Financial Statistics.
The above table 4.1 shows that SCBL bank has the highest average liquid assets to
total assets (0.31times) while NABIL bank has the lowest liquid assets to total assets
(0.13 times), and others have SBL (0.14times), BOK (0.21times), KBL (0.22 times),
NIBL (0.18times), HBL (0.14times), LBL (0.20times), NBL (0.18times) and NSBL
(0.15times). Liquid asset to total assets varies widely within the individual bank also
where it fluctuated from 2011 to 2020 and reached highest in 2017(0.27 times) for
NBL.
Moreover, there was random fluctuation for the other banks like NABIL, HBL, SCBL,
and NSB from 2011 to 2020, while SCBL liquid to total assets was 0.39 times in 2011.
The liquid asset to total assets in private banks was high for BOK bank (0.31times) in
the year 2012 and in 2015 (0.25 times). The average liquid assets to total assets for
public banks have decreased from 0.24 times in 2012 to 0.10 times in 2015. Simila r ly,
the average liquid assets to total assets for the joint bank have decreased from 0.39
times to 0.08 times. The average liquid asset to total assets for private banks has
decreased from 0.31 times in 2012 to 0.16 times in 2017.
The variation in liquid assets to total assets as indicated by standard deviation is lowest
for NIBL (0.02) and highest for SCBL (0.08). The standard deviation of NBL, NABIL,
HBL, NSBL, SBL, LBL, BOK, KBL are 0.07, 0.05, 0.04, 0.04, 0.04, 0.05, 0.07 and
0.05 respectively.
Figure 4.1 Comparative pattern of liquid assets to total assets of commercial
banks of Nepal.

31
The above figure 4.1 presents the comparative pattern of liquid assets to total assets of
the commercial bank from 2011 to 2020. The figure indicates the fluctuations of liquid
assets to total assets for a public bank. Overall, the graphs show the increasing trend
from 2013 to 2017 for joint venture banks. At the same time, there was a slightly
decreasing trend of liquid assets to total assets for private banks, joint venture banks,
and public banks after 2011. The public bank has the highest liquid assets to total assets
in 2016, which is 0.25. The structure of liquid assets to the total deposit of selected
Nepalese commercial banks throughout the study period is presented below:
Table 4.2 Structure of Liquid Assets to Total Deposit in Nepalese Public Banks,
Joint Venture Banks, and Private Banks (in Times)
Banks 2011 2012 2013 2014 2015 2016 2017 2018 2019 2020 Mean S. D
Panel A: Public banks
NBL 0.26 0.25 0.23 0.10 0.12 0.31 0.30 0.15 0.27 0.17 0.21 0.08
Panel B: Joint venture banks
NABIL 0.27 0.09 0.12 0.14 0.16 0.22 0.21 0.08 0.11 0.18 0.16 0.06
HBL 0.25 0.14 0.11 0.09 0.13 0.21 0.18 0.15 0.13 0.20 0.16 0.05
SCBL 0.45 0.24 0.21 0.37 0.41 0.31 0.32 0.41 0.25 0.60 0.36 0.12
-
0,05
0,10
0,15
0,20
0,25
0,30
2011 2012 2013 2014 2015 2016 2017 2018 2019 2020
Tim
es
Year
L1
Public Joint Private
32
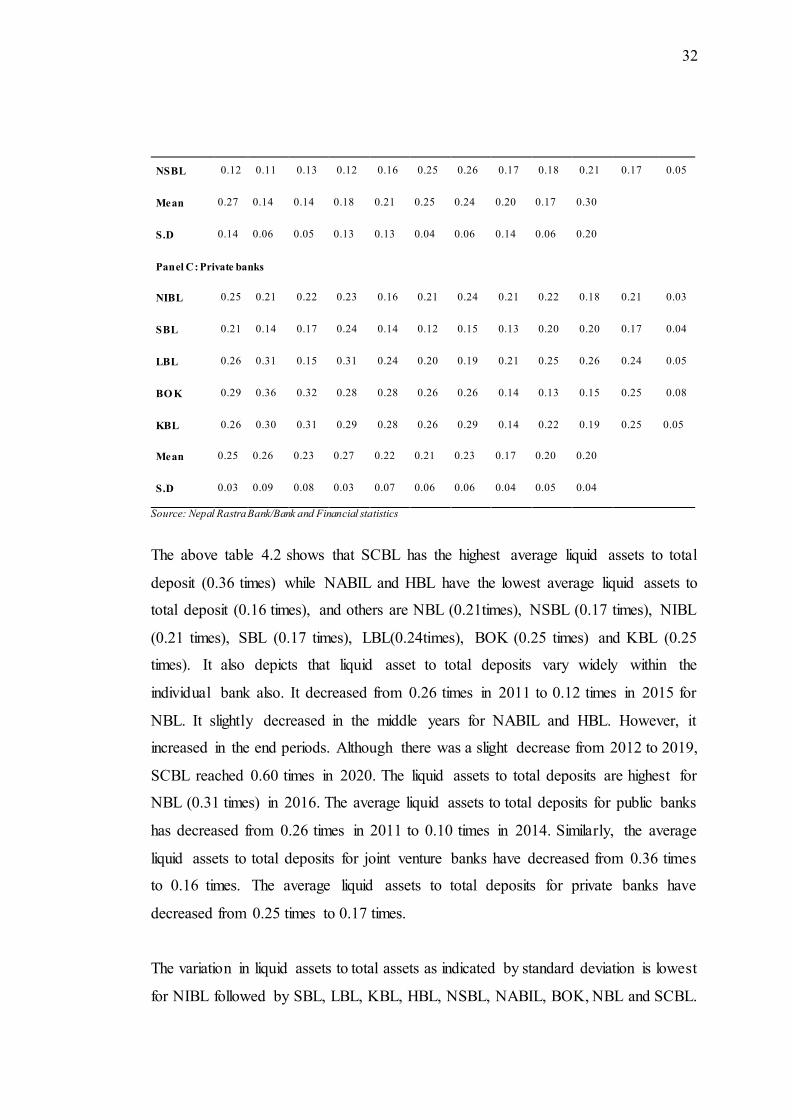
NSBL 0.12 0.11 0.13 0.12 0.16 0.25 0.26 0.17 0.18 0.21 0.17 0.05
Mean 0.27 0.14 0.14 0.18 0.21 0.25 0.24 0.20 0.17 0.30
S.D 0.14 0.06 0.05 0.13 0.13 0.04 0.06 0.14 0.06 0.20
Panel C: Private banks
NIBL 0.25 0.21 0.22 0.23 0.16 0.21 0.24 0.21 0.22 0.18 0.21 0.03
SBL 0.21 0.14 0.17 0.24 0.14 0.12 0.15 0.13 0.20 0.20 0.17 0.04
LBL 0.26 0.31 0.15 0.31 0.24 0.20 0.19 0.21 0.25 0.26 0.24 0.05
BO K 0.29 0.36 0.32 0.28 0.28 0.26 0.26 0.14 0.13 0.15 0.25 0.08
KBL 0.26 0.30 0.31 0.29 0.28 0.26 0.29 0.14 0.22 0.19 0.25 0.05
Mean 0.25 0.26 0.23 0.27 0.22 0.21 0.23 0.17 0.20 0.20
S.D 0.03 0.09 0.08 0.03 0.07 0.06 0.06 0.04 0.05 0.04
Source: Nepal Rastra Bank/Bank and Financial statistics
The above table 4.2 shows that SCBL has the highest average liquid assets to total
deposit (0.36 times) while NABIL and HBL have the lowest average liquid assets to
total deposit (0.16 times), and others are NBL (0.21times), NSBL (0.17 times), NIBL
(0.21 times), SBL (0.17 times), LBL(0.24times), BOK (0.25 times) and KBL (0.25
times). It also depicts that liquid asset to total deposits vary widely within the
individual bank also. It decreased from 0.26 times in 2011 to 0.12 times in 2015 for
NBL. It slightly decreased in the middle years for NABIL and HBL. However, it
increased in the end periods. Although there was a slight decrease from 2012 to 2019,
SCBL reached 0.60 times in 2020. The liquid assets to total deposits are highest for
NBL (0.31 times) in 2016. The average liquid assets to total deposits for public banks
has decreased from 0.26 times in 2011 to 0.10 times in 2014. Similarly, the average
liquid assets to total deposits for joint venture banks have decreased from 0.36 times
to 0.16 times. The average liquid assets to total deposits for private banks have
decreased from 0.25 times to 0.17 times.
The variation in liquid assets to total assets as indicated by standard deviation is lowest
for NIBL followed by SBL, LBL, KBL, HBL, NSBL, NABIL, BOK, NBL and SCBL.
33
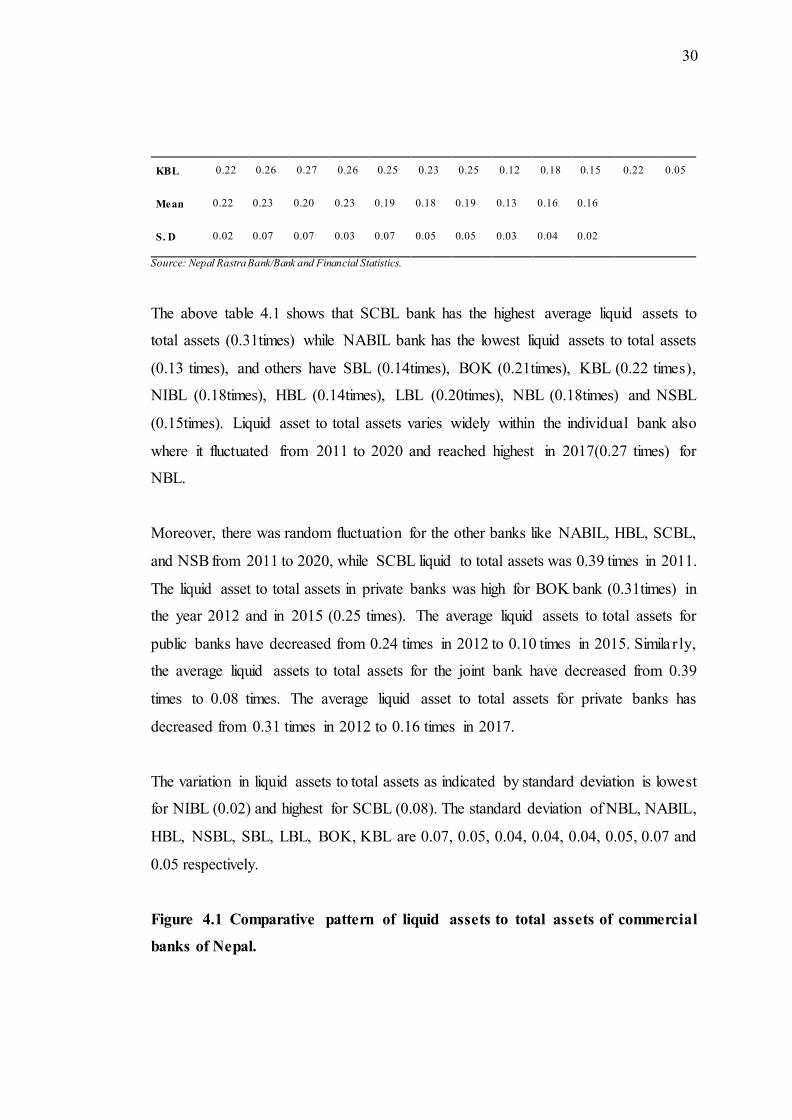
Figure 4.2 Comparative Pattern of Liquid Assets to Total Deposits of Selected
Nepalese Commercial Banks
The above figure 4.2 presents the comparative pattern of liquid assets to total deposits
of the commercial bank from 2011 to 2020. The figure indicates the fluctuations of
liquid assets to total deposits for public, private, and joint venture banks. Overall, the
graphs show the increasing trend of joint venture banks in 2014, whereas there is a
downward trend in public and private banks.
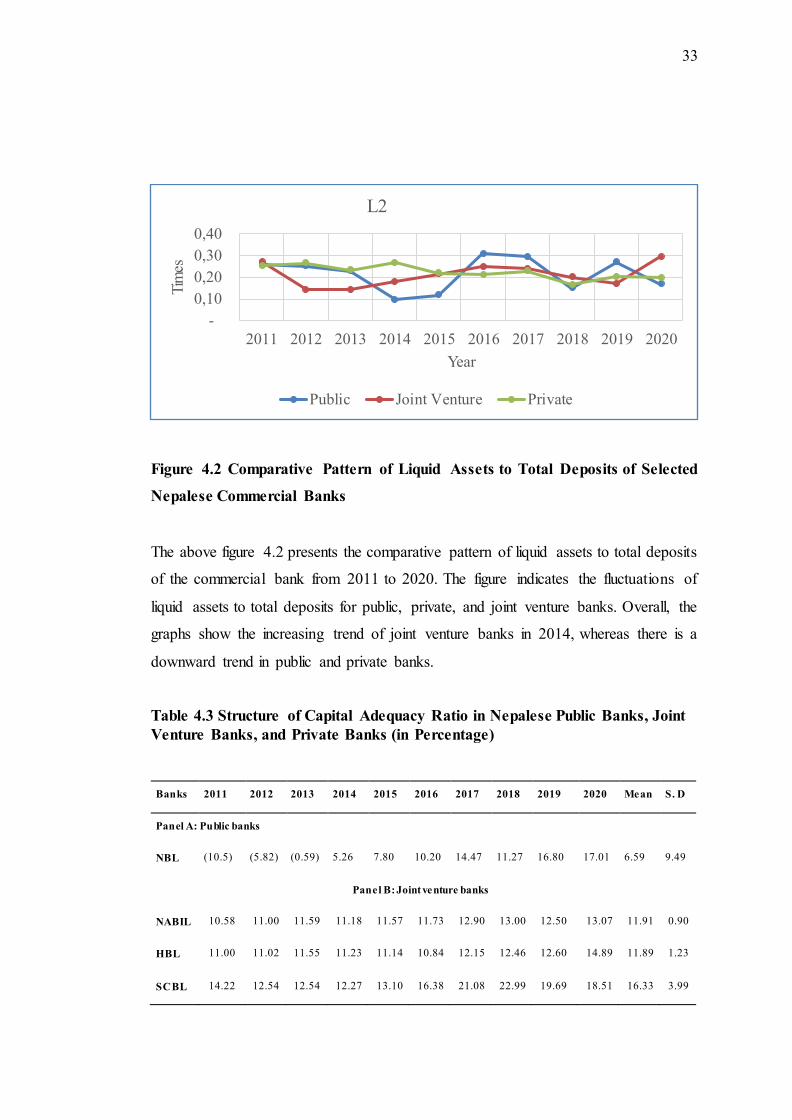
Table 4.3 Structure of Capital Adequacy Ratio in Nepalese Public Banks, Joint
Venture Banks, and Private Banks (in Percentage)
Banks 2011 2012 2013 2014 2015 2016 2017 2018 2019 2020 Mean S. D
Panel A: Public banks
NBL (10.5) (5.82) (0.59) 5.26 7.80 10.20 14.47 11.27 16.80 17.01 6.59 9.49
Panel B: Joint venture banks
NABIL 10.58 11.00 11.59 11.18 11.57 11.73 12.90 13.00 12.50 13.07 11.91 0.90
HBL 11.00 11.02 11.55 11.23 11.14 10.84 12.15 12.46 12.60 14.89 11.89 1.23
SCBL 14.22 12.54 12.54 12.27 13.10 16.38 21.08 22.99 19.69 18.51 16.33 3.99
-
0,10
0,20
0,30
0,40
2011 2012 2013 2014 2015 2016 2017 2018 2019 2020
Tim
es
Year
L2
Public Joint Venture Private
34
NSBL 11.52 11.21 12.39 13.28 14.03 13.49 15.71 15.15 14.12 15.55 13.65 1.59
Mean 11.83 11.44 12.02 11.99 12.46 13.11 15.46 15.90 14.73 15.51
S.D 1.64 0.74 0.52 1.00 1.34 2.44 4.05 4.87 3.39 2.26
Panel C: Private banks
NIBL 10.91 11.10 11.49 11.27 11.90 14.92 13.02 12.66 13.26 13.54 12.41 1.30
SBL 10.78 11.03 11.80 11.39 11.10 11.25 12.74 12.12 12.70 13.17 11.81 0.83
LBL 11.63 11.02 12.23 11.91 10.81 11.15 13.58 12.43 11.83 13.02 11.96 0.88
BO K 11.62 11.07 12.62 11.57 13.00 13.01 13.41 14.88 14.30 14.16 12.96 1.27
KBL 13.76 12.20 12.17 11.81 10.84 11.69 14.48 12.81 11.75 15.35 12.69 1.42
Mean 11.74 11.28 12.06 11.59 11.53 12.40 13.45 12.98 12.77 13.85
S. D 1.20 0.51 0.43 0.27 0.93 1.59 0.66 1.09 1.06 0.95
Source: Nepal Rastra Bank/Bank and Financial statistics
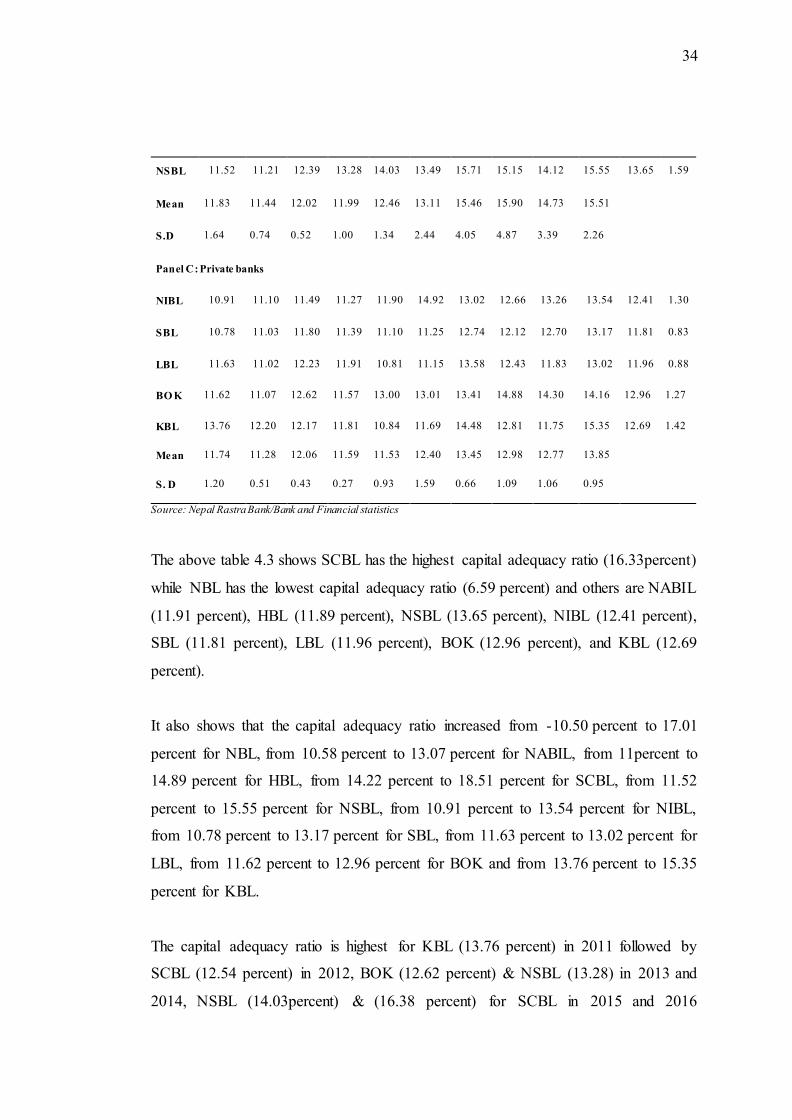
The above table 4.3 shows SCBL has the highest capital adequacy ratio (16.33percent)
while NBL has the lowest capital adequacy ratio (6.59 percent) and others are NABIL
(11.91 percent), HBL (11.89 percent), NSBL (13.65 percent), NIBL (12.41 percent),
SBL (11.81 percent), LBL (11.96 percent), BOK (12.96 percent), and KBL (12.69
percent).
It also shows that the capital adequacy ratio increased from -10.50 percent to 17.01
percent for NBL, from 10.58 percent to 13.07 percent for NABIL, from 11percent to
14.89 percent for HBL, from 14.22 percent to 18.51 percent for SCBL, from 11.52
percent to 15.55 percent for NSBL, from 10.91 percent to 13.54 percent for NIBL,
from 10.78 percent to 13.17 percent for SBL, from 11.63 percent to 13.02 percent for
LBL, from 11.62 percent to 12.96 percent for BOK and from 13.76 percent to 15.35
percent for KBL.
The capital adequacy ratio is highest for KBL (13.76 percent) in 2011 followed by
SCBL (12.54 percent) in 2012, BOK (12.62 percent) & NSBL (13.28) in 2013 and
2014, NSBL (14.03percent) & (16.38 percent) for SCBL in 2015 and 2016

35
subsequently. The average capital adequacy ratio computed across the years has
fluctuated widely over some time. Public banks' average capital adequacy ratio had
increased from -10.50 percent in 2011 to 14.47 percent in 2017. Similarly, the capital
adequacy ratio of joint venture banks has increased from 11.83 percent in 2011 to
15.90 percent in 2018. Likewise, domestic private banks' average capital adequacy
ratio had increased from 11.74 percent to 13.85 percent in 2020.
The variation in capital adequacy ratio as indicated by standard deviation is lowest for
SBL followed by LBL, NABIL, HBL, BOK, NIBL, KBL, NSBL, SCBL and NBL.
Figure 4.3 Comparative Pattern of Capital Adequacy Ratio of Selected Nepalese
Commercial Banks
The above figure 4.3 shows the comparative pattern of capital adequacy ratio of a
commercial bank based on ownership from 2011 to 2020. The figure indicates the
capital adequacy ratio of public banks increased rapidly from 2011 and reached above
15 in 2020, while the capital adequacy ratio of private banks is somewhat linear in
trend, and the capital adequacy ratio of joint venture banks is slightly increasing in
trend.
(20,00)
(10,00)
-
10,00
20,00
2011 2012 2013 2014 2015 2016 2017 2018 2019 2020
Per
cent
%
Year
CAR
Public Joint Venture Private
36
Table 4.4 Structure of Non-performing Loan in Nepalese Public Banks, Joint
Venture Banks, and Private Banks (in Percentage)
Banks 2011 2012 2013 2014 2015 2016 2017 2018 2019 2020 Mean S. D
Panel A: Public banks
NBL 5.75 5.58 5.24 4.74 3.95 3.11 3.32 3.37 2.64 2.47 4.02 1.22
Panel B: Joint venture banks
NABIL 1.77 2.30 2.13 2.23 1.82 1.14 0.80 0.55 0.74 0.98 1.45 0.67
HBL 3.92 4.22 2.89 1.96 3.22 1.23 0.85 1.40 1.12 1.01 2.18 1.27
SCBL 0.62 0.78 0.77 0.48 0.34 0.32 0.19 0.18 0.15 0.44 0.43 0.23
NSBL 1.13 0.54 0.37 0.26 0.19 0.14 0.10 0.20 0.20 0.23 0.34 0.31
Mean 1.86 1.96 1.54 1.23 1.39 0.71 0.49 0.58 0.55 0.67
S.D 1.45 1.70 1.17 1.01 1.42 0.56 0.39 0.57 0.46 0.39
Panel C: Private banks
NIBL 0.59 3.32 1.91 1.77 1.25 0.68 0.83 1.36 2.78 2.91 1.74 0.98
SBL 0.60 1.52 2.39 2.75 1.80 1.47 1.30 1.09 0.75 1.38 1.51 0.67
LBL 0.90 0.62 1.51 1.15 1.30 0.80 0.93 1.29 1.11 1.04 1.07 0.26
BO K 1.82 2.30 1.50 1.06 3.42 2.51 1.29 3.04 1.54 2.28 2.08 0.77
KBL 1.12 2.21 2.89 4.03 2.49 1.15 1.61 1.22 1.01 1.39 1.91 0.98
Mean 1.01 1.99 2.04 2.15 2.05 1.32 1.19 1.60 1.44 1.80
S. D 0.51 1.00 0.60 1.25 0.91 0.73 0.31 0.81 0.80 0.77
Source: NRB/Bank and Financial statistics
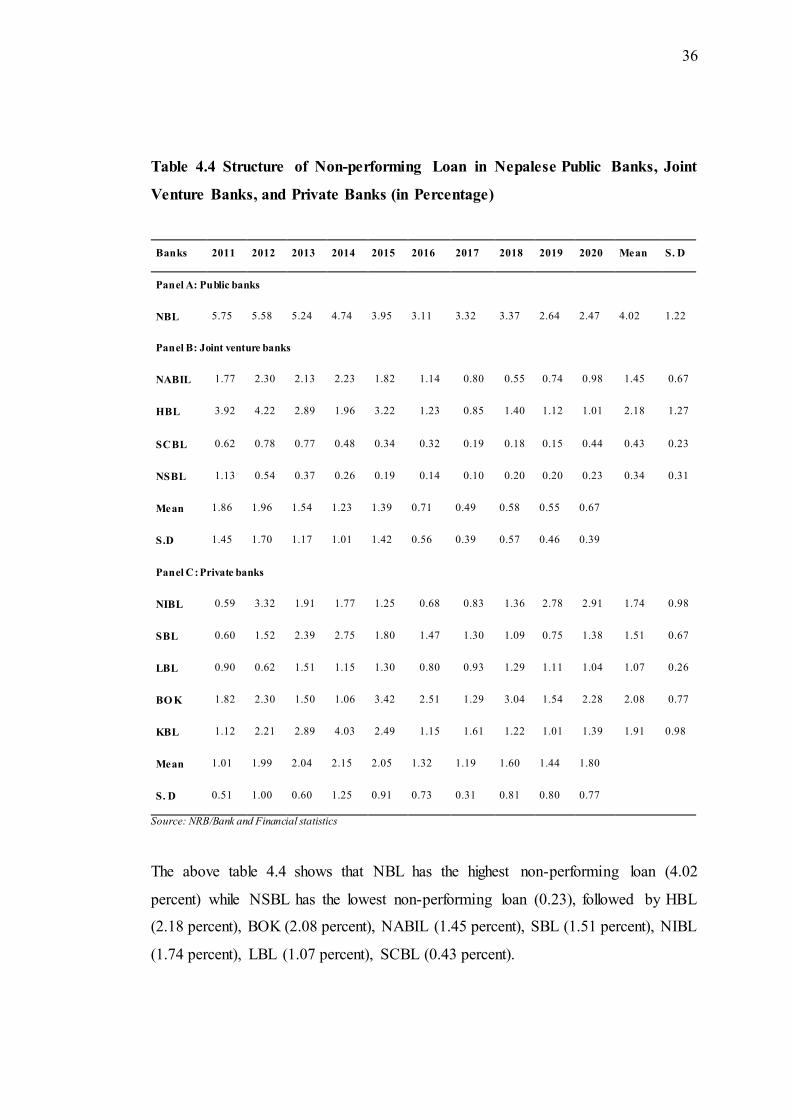
The above table 4.4 shows that NBL has the highest non-performing loan (4.02
percent) while NSBL has the lowest non-performing loan (0.23), followed by HBL
(2.18 percent), BOK (2.08 percent), NABIL (1.45 percent), SBL (1.51 percent), NIBL
(1.74 percent), LBL (1.07 percent), SCBL (0.43 percent).

37
It also depicts that non-performing loan varies widely within the individual bank
Where it decreased for joint venture bank like from 5.75 percent to 2.47 percent for
NBL, from 1.13 percent to 0.23 percent for NSBL, from 0.62 percent to 0.44 percent
for SCBL, from 1.77 percent to 0.98 percent for NABIL while it increased in the
private banks from 1.82 percent to 2.28 percent for BOK, from 0.60 percent to 1.38
percent for SBL and from 0.59 percent to 2.91percent for NIBL. The NPL is highest
for NBL (5.75 percent) in 2011, (5.58 percent) in 2012, (5.24 percent) in 2013, (4.74
percent) in 2014, (3.95 percent) in 2015, (3.11 percent) in 2016, (3.32 percent) in 2017
and 3.37, 2.64 and 2.47 in 2018,2019 and 2020 respectively. The average NPL across
the years has fluctuated widely over a while.
The variation in NPL as indicated by standard deviation is lowest for SCBL followed
by LBL, NSBL, NABIL, SBL, BOK, NIBL, KBL, NBL and HBL.
Figure 4.4 Comparative Pattern of Non-Performing Loan of Selected Nepalese
Commercial Banks
The above figure illustrates the comparative pattern of a non-performing loan of a
Nepalese commercial bank from 2011 to 2020. The figure indicates the fluctuations of
non-performing loans for public, private, and joint venture banks.
-
5,00
10,00
2011 2012 2013 2014 2015 2016 2017 2018 2019 2020
Per
cent
%
Year
NPL
Public Joint Venture Private
38
Overall, the graphs show the decreasing trend from 2011 to 2016 for public and joint
venture banks and the increasing trend of non-performing loans for the private bank
over all periods.
Table 4.5 Structure of Return on Assets of Selected Nepalese Public banks, Joint
venture banks and Private banks
Banks 2011 2012 2013 2014 2015 2016 2017 2018 2019 2020 Mean S.D
Panel A: Public banks
NBL 0.25 0.30 1.07 0.92 0.61 2.79 2.78 2.41 1.51 1.22 1.39 0.97
Panel B: Joint venture banks
NABIL 2.30 2.80 3.25 2.65 2.06 2.32 2.70 2.61 2.11 1.58 2.44 0.47
HBL 1.91 1.76 1.54 1.30 1.34 2.03 2.19 1.67 2.21 1.79 1.77 0.32
SCBL 2.50 2.80 2.67 2.51 1.99 1.98 1.84 2.61 2.61 1.71 2.32 0.40
NSBL 1.01 0.70 1.19 1.50 1.64 1.59 1.57 1.97 1.94 1.17 1.43 0.41
Mean 1.93 2.02 2.16 1.99 1.76 1.98 2.08 2.22 2.22 1.56
S. D 0.66 1.00 0.96 0.69 0.33 0.30 0.49 0.47 0.28 0.28
Panel C: Private banks
NIBL 2.02 1.60 2.60 2.30 1.90 2.00 2.10 3.00 2.50 1.70 2.17 0.43
SBL 1.28 1.12 1.43 1.74 1.51 1.69 1.53 1.59 1.49 1.17 1.46 0.21
LBL 1.74 1.37 1.50 1.47 1.04 1.35 1.52 1.55 1.66 1.20 1.44 0.21
BO K 2.44 2.10 1.90 0.65 0.78 0.84 1.57 1.45 1.88 1.33 1.49 0.60
KBL 1.23 1.10 1.03 1.10 1.06 1.66 1.12 1.26 1.17 0.76 1.15 0.23
Mean 1.74 1.46 1.69 1.45 1.26 1.51 1.57 1.77 1.74 1.23
S. D 0.51 0.41 0.59 0.63 0.44 0.44 0.35 0.70 0.50 0.34
Source: NRB/Bank and Financial statistics
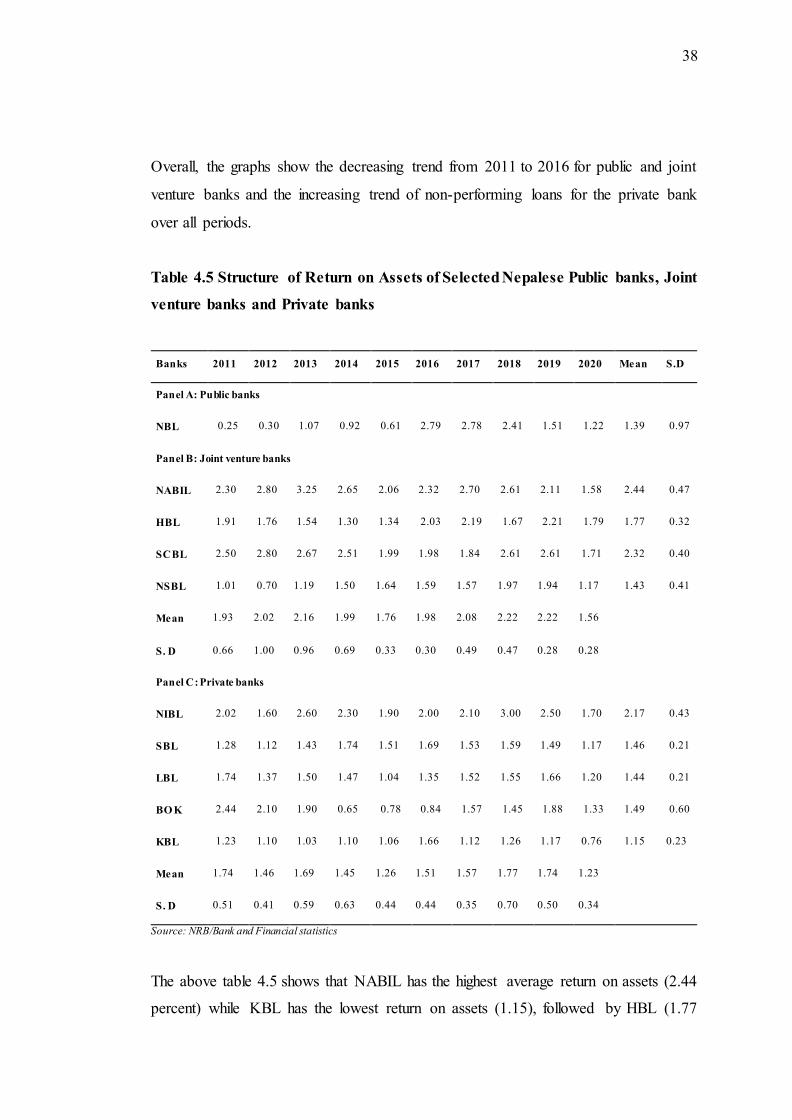
The above table 4.5 shows that NABIL has the highest average return on assets (2.44
percent) while KBL has the lowest return on assets (1.15), followed by HBL (1.77
39
percent), BOK (1.49 percent), NBL (1.39percent), SBL (1.46 percent), NIBL (2.17
percent), LBL (1.44 percent), SCBL (2.32 percent).
However, it also depicts that ROA varies widely within the individual bank; it
decreased for banks from 2.30 percent to 1.58 percent for NABIL, from 1.91 percent
to 1.79 percent for HBL, from 2.50 percent to 1.71 percent for SCBL, from 2.02
percent to 1.70 percent for NIBL, from 1.82 percent to 2.28 percent for BOK, from
1.28 percent to 1.17 percent for SBL and from 1.74 percent to 1.20 percent for LBL.
At the same time, it increased in the bank from 0.25 to 1.22 for NBL, from 1.01 to 1.17
for NSBL.
The variation in NPL as indicated by standard deviation is lowest for SBL and LBL,
followed by KBL, HBL, SCBL, NSBL, NIBL, NABIL, BOK and NBL.
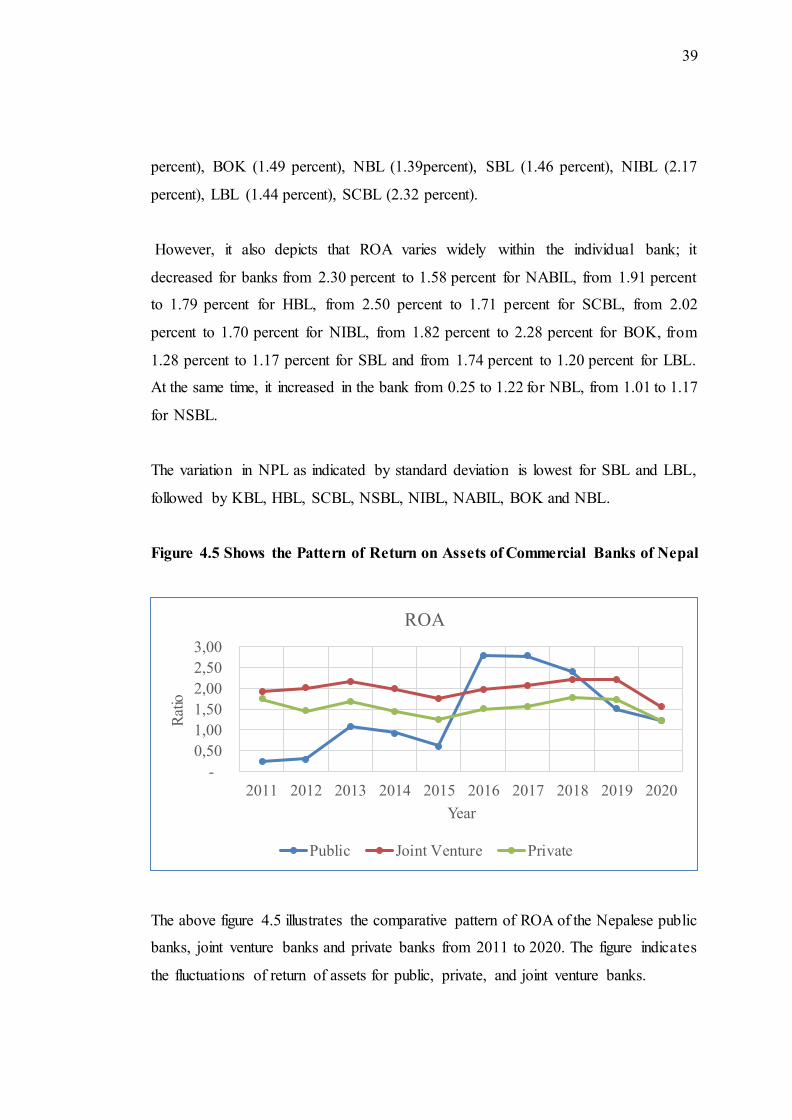
Figure 4.5 Shows the Pattern of Return on Assets of Commercial Banks of Nepal
The above figure 4.5 illustrates the comparative pattern of ROA of the Nepalese public
banks, joint venture banks and private banks from 2011 to 2020. The figure indicates
the fluctuations of return of assets for public, private, and joint venture banks.
-
0,50
1,00
1,50
2,00
2,50
3,00
2011 2012 2013 2014 2015 2016 2017 2018 2019 2020
Rat
io
Year
ROA
Public Joint Venture Private

40
Overall, the graphs are decreasing for public and joint venture banks and private banks
ROA is at peak in 2016 for the public banks.
Table 4.6 Structure of Bank Size in Nepalese Public Banks, Joint Venture
Banks, and Private Banks (in billions)
Banks 2011 2012 2013 2014 2015 2016 2017 2018 2019 2020 Mean S.D
Panel A: Public banks
NBL
51.16
58.62
70.78
77.98
88.21
103.47
112.06
133.47
171.56
191.16
105.85
47.07
Panel B: Joint venture banks
NABIL
58.10
63.19
73.24
87.27
115.99
127.30
140.33
169.08
201.14
237.68
127.33
60.65
HBL
46.74 54.36
61.15
73.59
82.80
99.87
107.26
116.46
133.15
155.88
93.13
35.74
SCBL
43.81 35.97
39.47
46.30
57.28
55.72
67.06
75.73
98.47
75.73
59.55
19.71
NSBL
46.09
58.06
64.80
61.07
59.28 78.51 99.82 102.53 118.31 132.40
82.09
29.29
Mean 48.69 52.90 59.67 67.06 78.84 90.35 103.62 115.95 137.77 150.42
S.D 6.40 11.85 14.38 17.49 27.34 30.53 30.07 39.25 44.57 67.20
Panel C: Private banks
NIBL
58.36 65.7
73.15
86.17
104.34
129.78
150.81
171.89
185.84
203.02
122.91
52.92
SBL
24.41
29.63
33.69
40.32
74.82
76.12
91.57
119.87
151.77
182.84
82.50
54.54
LBL
22.09
27.16
29.81
34.91
45.34
55.19
71.40
84.87
106.96
128.89
60.66
36.50
BO K
24.76
28.88
32.45
39.03
46.48 79.65
83.60
91.21
100.92
109.56
63.65
32.50
KBL
20.49
25.13
28.22
31.02
37.37 42.42
62.64
100.78
186.44
232.44
76.70
74.58
Mean 30.02 35.31 39.46 46.29 61.67 76.63 92.00 113.72 146.39 171.35
S.D 15.94 17.11 18.95 22.59 27.76 33.41 34.70 35.10 41.27 51.21
Source: NRB/Bank and financial statistics
The above table 4.6 shows that NABIL has the largest bank size of Rs127.33 billion
while SCBL has the smallest bank size of Rs59.55, followed by NIBL (Rs122.91
billion), NBL (Rs105.85 billion), HBL (Rs93.13 billion), SBL (Rs82.50 billion),
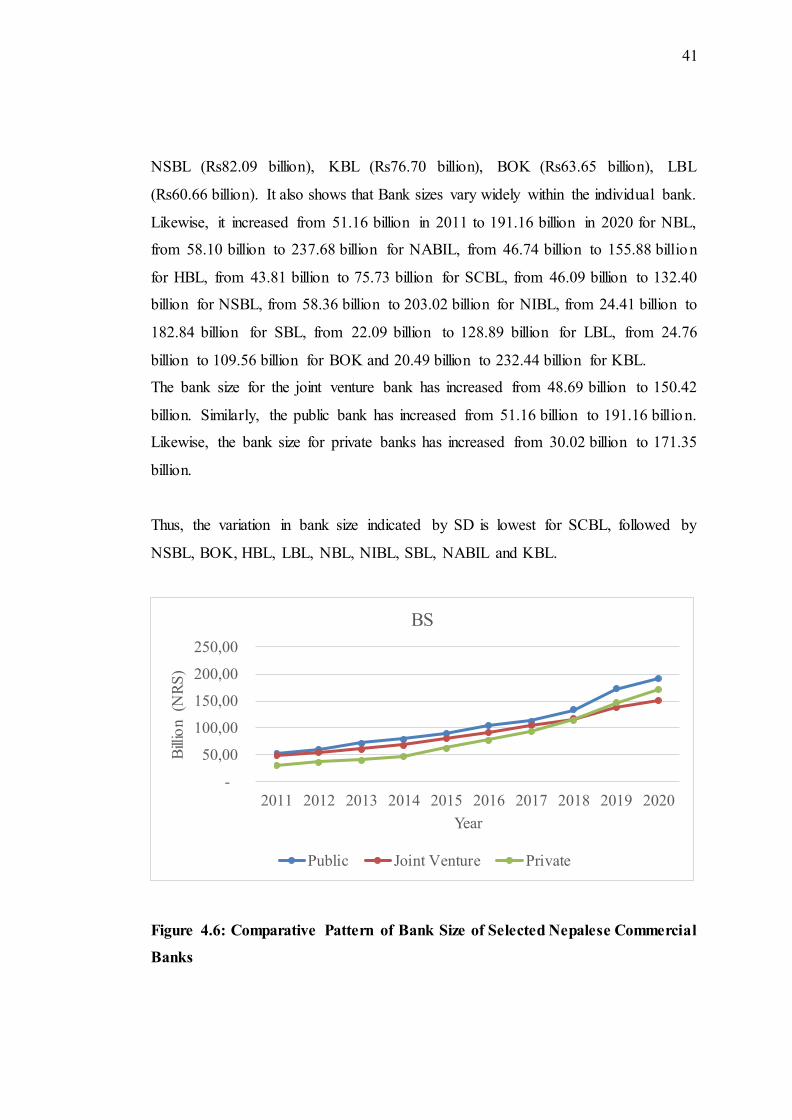
41
NSBL (Rs82.09 billion), KBL (Rs76.70 billion), BOK (Rs63.65 billion), LBL
(Rs60.66 billion). It also shows that Bank sizes vary widely within the individual bank.
Likewise, it increased from 51.16 billion in 2011 to 191.16 billion in 2020 for NBL,
from 58.10 billion to 237.68 billion for NABIL, from 46.74 billion to 155.88 billion
for HBL, from 43.81 billion to 75.73 billion for SCBL, from 46.09 billion to 132.40
billion for NSBL, from 58.36 billion to 203.02 billion for NIBL, from 24.41 billion to
182.84 billion for SBL, from 22.09 billion to 128.89 billion for LBL, from 24.76
billion to 109.56 billion for BOK and 20.49 billion to 232.44 billion for KBL.
The bank size for the joint venture bank has increased from 48.69 billion to 150.42
billion. Similarly, the public bank has increased from 51.16 billion to 191.16 billion.
Likewise, the bank size for private banks has increased from 30.02 billion to 171.35
billion.
Thus, the variation in bank size indicated by SD is lowest for SCBL, followed by
NSBL, BOK, HBL, LBL, NBL, NIBL, SBL, NABIL and KBL.
Figure 4.6: Comparative Pattern of Bank Size of Selected Nepalese Commercial
Banks
-
50,00
100,00
150,00
200,00
250,00
2011 2012 2013 2014 2015 2016 2017 2018 2019 2020
Bill
ion
(NR
S)
Year
BS
Public Joint Venture Private
42
The figure 4.6 shows the different types of commercial banks in bank size patterns
from 2011 to 2020, where various fluctuations occurred over the study period. All
public ,joint and private banks size are highest at 2020 which shows bank sizes of
public, joint, and private banks are steadily increasing over the period.
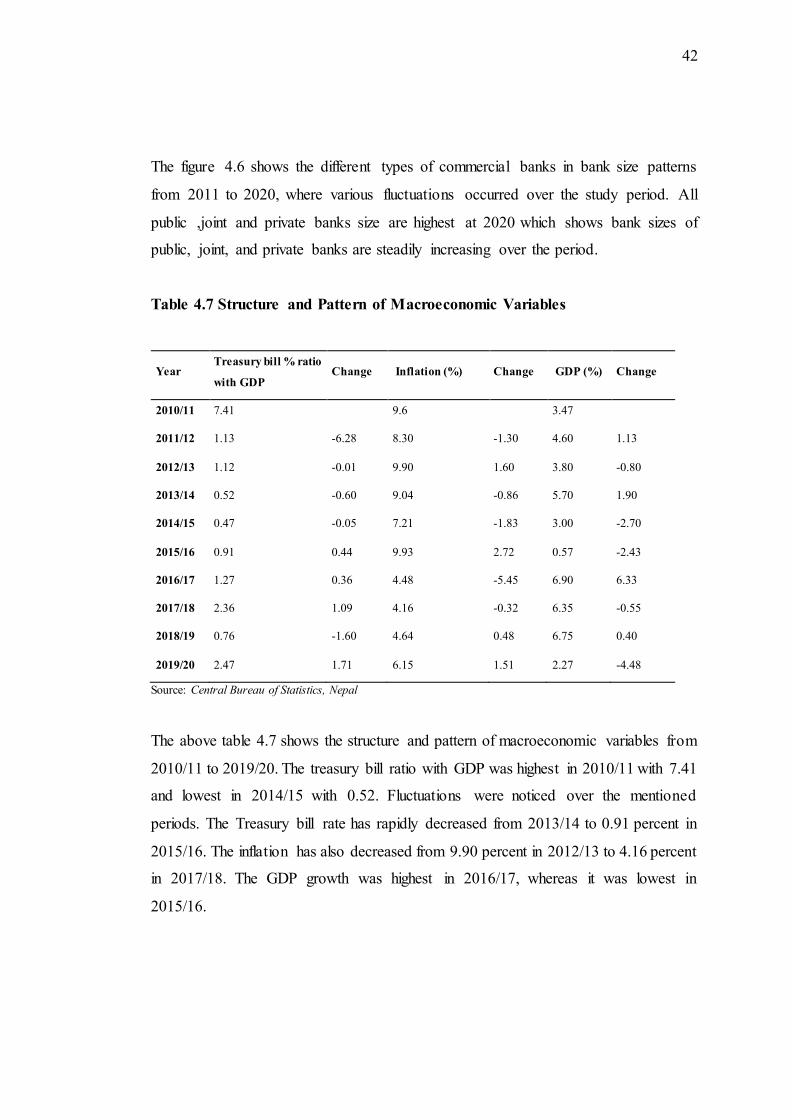
Table 4.7 Structure and Pattern of Macroeconomic Variables
Year Treasury bill % ratio
with GDP Change Inflation (%) Change GDP (%) Change
2010/11 7.41 9.6 3.47
2011/12 1.13 -6.28 8.30 -1.30 4.60 1.13
2012/13 1.12 -0.01 9.90 1.60 3.80 -0.80
2013/14 0.52 -0.60 9.04 -0.86 5.70 1.90
2014/15 0.47 -0.05 7.21 -1.83 3.00 -2.70
2015/16 0.91 0.44 9.93 2.72 0.57 -2.43
2016/17 1.27 0.36 4.48 -5.45 6.90 6.33
2017/18 2.36 1.09 4.16 -0.32 6.35 -0.55
2018/19 0.76 -1.60 4.64 0.48 6.75 0.40
2019/20 2.47 1.71 6.15 1.51 2.27 -4.48
Source: Central Bureau of Statistics, Nepal
The above table 4.7 shows the structure and pattern of macroeconomic variables from
2010/11 to 2019/20. The treasury bill ratio with GDP was highest in 2010/11 with 7.41
and lowest in 2014/15 with 0.52. Fluctuations were noticed over the mentioned
periods. The Treasury bill rate has rapidly decreased from 2013/14 to 0.91 percent in
2015/16. The inflation has also decreased from 9.90 percent in 2012/13 to 4.16 percent
in 2017/18. The GDP growth was highest in 2016/17, whereas it was lowest in
2015/16.

43
5 RESULTS
5.1 Descriptive Analysis
The descriptive analysis of Joint venture banks and Private banks are shown below:
Table 5.1.1 Descriptive statistics of Joint venture Banks
The above table 5.1.1 shows the average NPL calculated was 1.10 with a minimum of
0.10 percent and a maximum of 4.22 percent. Similarly, ROA ranges from 0.7 percent
to 3.25 percent, with an average of 1.99 percent. Likewise, the capital adequacy ratio
ranges from 10.81 percent to 22.9 percent, with an average of 13.44 percent having a
standard deviation of 2.85. Similarly, the bank size ranges from 35.97 billion to 237.68
billion, with an average of 90.52 billion. The average gross domestic product is 4.34
percent, with a minimum of 0.57 percent and a maximum of 6.9 percent. The average
inflation is a notice to be 7.341 percent with a minimum of 4.16percent to a maximum
of 9.93 percent. Finally, the average 91 days treasury bill rate ranges from 0.47 to 7.41
percent, with an average of 1.842.
Variables Minimum Maximum Mean SD
L1 0.08 0.39 0.18 0.09
L2 0.08 0.60 0.21 0.1122
NPL 0.10 4.22 1.10 1.053
ROA 0.7 3.25 1.99 0.566
CAR 10.58 22.9 13.44 2.85
BS 35.97 237.68 90.52 45.21
GDP 0.57 6.9 4.341 2.099
INF 4.16 9.93 7.341 2.337
TB 0.47 7.41 1.842 2.07
44
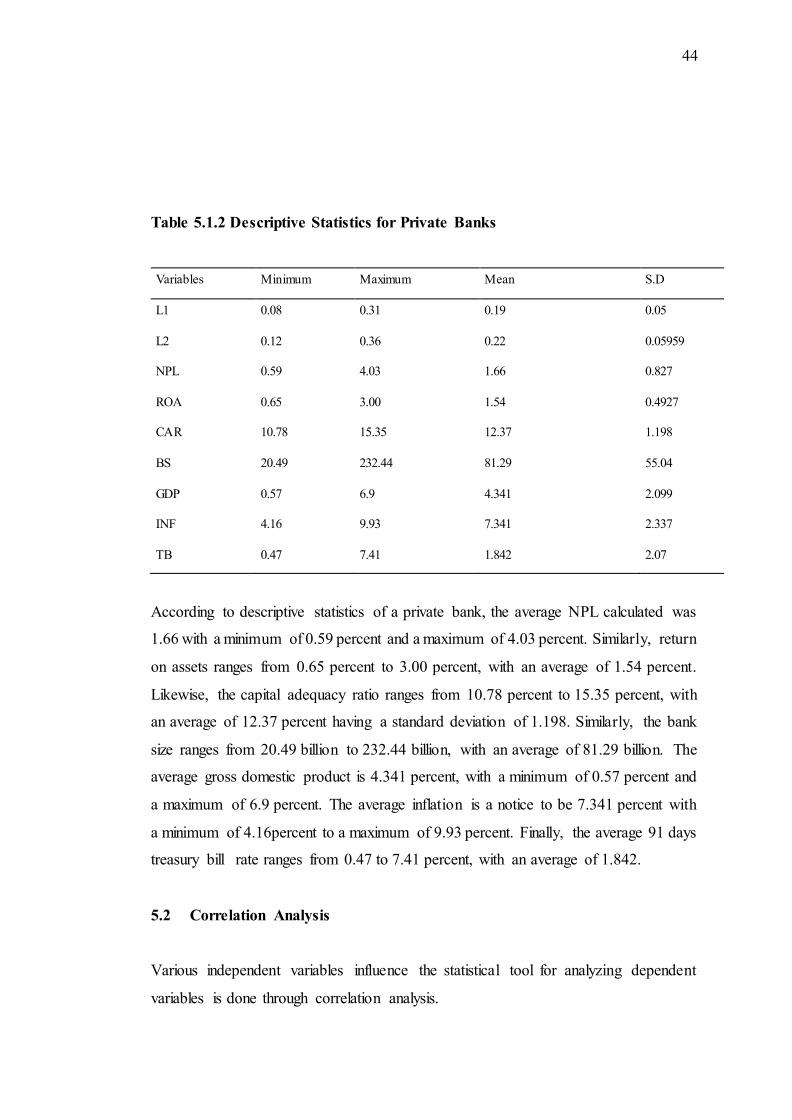
Table 5.1.2 Descriptive Statistics for Private Banks
Variables Minimum Maximum Mean S.D
L1 0.08 0.31 0.19 0.05
L2 0.12 0.36 0.22 0.05959
NPL 0.59 4.03 1.66 0.827
ROA 0.65 3.00 1.54 0.4927
CAR 10.78 15.35 12.37 1.198
BS 20.49 232.44 81.29 55.04
GDP 0.57 6.9 4.341 2.099
INF 4.16 9.93 7.341 2.337
TB 0.47 7.41 1.842 2.07
According to descriptive statistics of a private bank, the average NPL calculated was
1.66 with a minimum of 0.59 percent and a maximum of 4.03 percent. Similarly, return
on assets ranges from 0.65 percent to 3.00 percent, with an average of 1.54 percent.
Likewise, the capital adequacy ratio ranges from 10.78 percent to 15.35 percent, with
an average of 12.37 percent having a standard deviation of 1.198. Similarly, the bank
size ranges from 20.49 billion to 232.44 billion, with an average of 81.29 billion. The
average gross domestic product is 4.341 percent, with a minimum of 0.57 percent and
a maximum of 6.9 percent. The average inflation is a notice to be 7.341 percent with
a minimum of 4.16percent to a maximum of 9.93 percent. Finally, the average 91 days
treasury bill rate ranges from 0.47 to 7.41 percent, with an average of 1.842.
5.2 Correlation Analysis
Various independent variables influence the statistical tool for analyzing dependent
variables is done through correlation analysis.
45
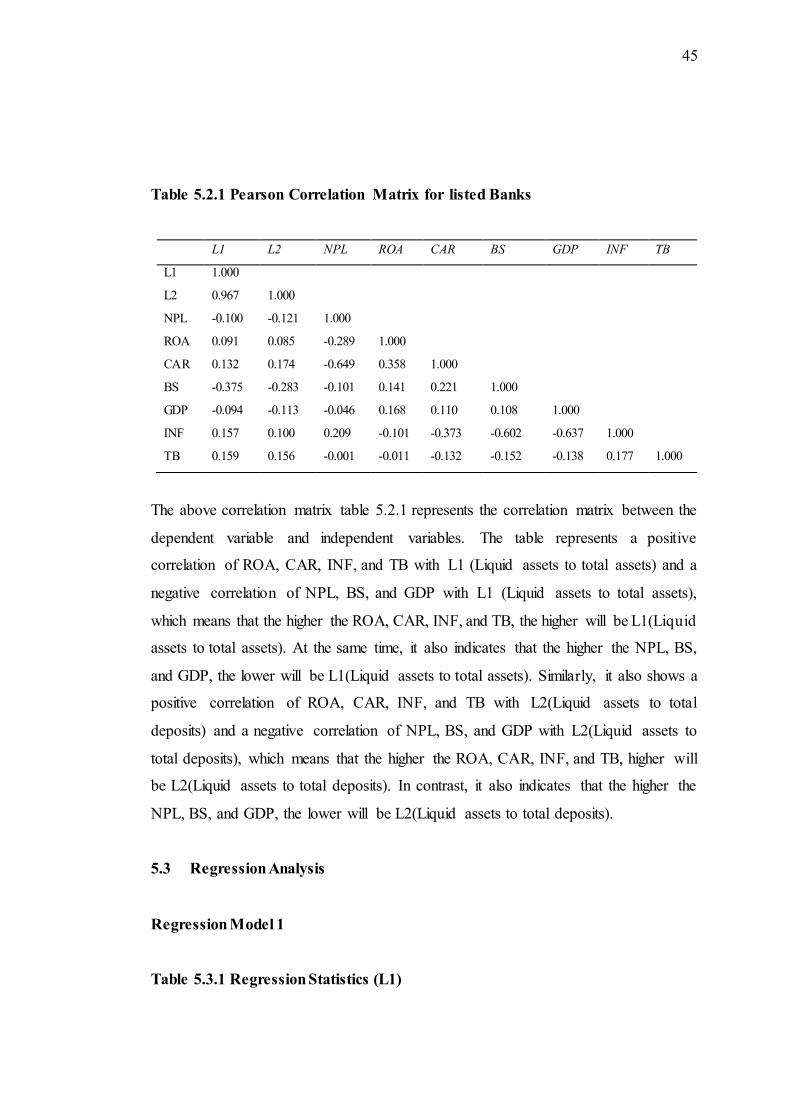
Table 5.2.1 Pearson Correlation Matrix for listed Banks
L1 L2 NPL ROA CAR BS GDP INF TB
L1 1.000
L2 0.967 1.000
NPL -0.100 -0.121 1.000
ROA 0.091 0.085 -0.289 1.000
CAR 0.132 0.174 -0.649 0.358 1.000
BS -0.375 -0.283 -0.101 0.141 0.221 1.000
GDP -0.094 -0.113 -0.046 0.168 0.110 0.108 1.000
INF 0.157 0.100 0.209 -0.101 -0.373 -0.602 -0.637 1.000
TB 0.159 0.156 -0.001 -0.011 -0.132 -0.152 -0.138 0.177 1.000
The above correlation matrix table 5.2.1 represents the correlation matrix between the
dependent variable and independent variables. The table represents a positive
correlation of ROA, CAR, INF, and TB with L1 (Liquid assets to total assets) and a
negative correlation of NPL, BS, and GDP with L1 (Liquid assets to total assets),
which means that the higher the ROA, CAR, INF, and TB, the higher will be L1(Liquid
assets to total assets). At the same time, it also indicates that the higher the NPL, BS,
and GDP, the lower will be L1(Liquid assets to total assets). Similarly, it also shows a
positive correlation of ROA, CAR, INF, and TB with L2(Liquid assets to total
deposits) and a negative correlation of NPL, BS, and GDP with L2(Liquid assets to
total deposits), which means that the higher the ROA, CAR, INF, and TB, higher will
be L2(Liquid assets to total deposits). In contrast, it also indicates that the higher the
NPL, BS, and GDP, the lower will be L2(Liquid assets to total deposits).
5.3 Regression Analysis
Regression Model 1
Table 5.3.1 Regression Statistics (L1)
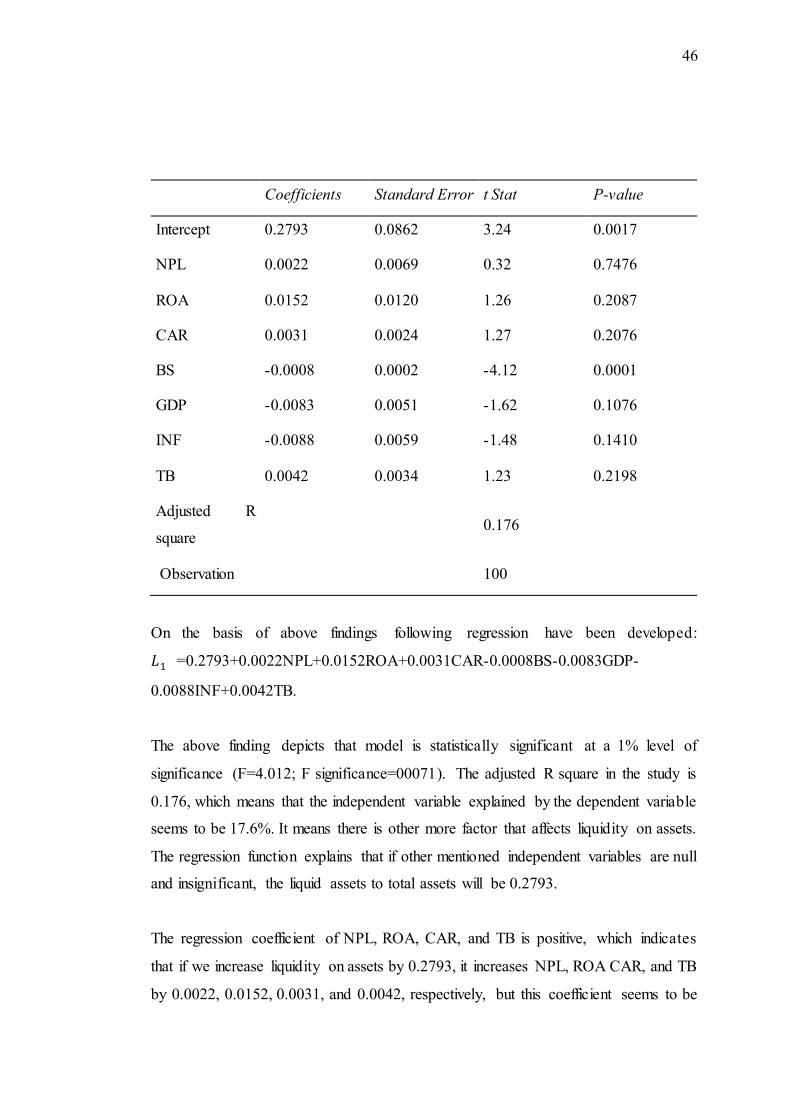
46
Coefficients Standard Error t Stat P-value
Intercept 0.2793 0.0862 3.24 0.0017
NPL 0.0022 0.0069 0.32 0.7476
ROA 0.0152 0.0120 1.26 0.2087
CAR 0.0031 0.0024 1.27 0.2076
BS -0.0008 0.0002 -4.12 0.0001
GDP -0.0083 0.0051 -1.62 0.1076
INF -0.0088 0.0059 -1.48 0.1410
TB 0.0042 0.0034 1.23 0.2198
Adjusted R
square 0.176
Observation 100
On the basis of above findings following regression have been developed:
𝐿1 =0.2793+0.0022NPL+0.0152ROA+0.0031CAR-0.0008BS-0.0083GDP-
0.0088INF+0.0042TB.
The above finding depicts that model is statistically significant at a 1% level of
significance (F=4.012; F significance=00071). The adjusted R square in the study is
0.176, which means that the independent variable explained by the dependent variable
seems to be 17.6%. It means there is other more factor that affects liquidity on assets.
The regression function explains that if other mentioned independent variables are null
and insignificant, the liquid assets to total assets will be 0.2793.
The regression coefficient of NPL, ROA, CAR, and TB is positive, which indicates
that if we increase liquidity on assets by 0.2793, it increases NPL, ROA CAR, and TB
by 0.0022, 0.0152, 0.0031, and 0.0042, respectively, but this coefficient seems to be

47
statistically insignificant at 5% level of significance. Moreover, GDP, INF, and BS
have a negative regression coefficient, which means an increase in liquidity deposits
will decrease GDP, INF, and BS by -0.0083, -0.0088, and -0.0008, respectively. GDP
and TB seem to be statistically insignificant at a 5% significance level, whereas BS
seems statistically significant at a 1% level with a P-value of 0.0001.
Regression Model 2
Table 5.3.2 Regression statistics (L2)
Coefficients Standard Error t Stat P-value
Intercept 0.334 0.105 3.18 0.002
NPL 0.003 0.008 0.36 0.714
ROA 0.015 0.015 1.03 0.304
CAR 0.004 0.003 1.46 0.148
BS -0.001 0.000 -3.48 0.001
GDP -0.012 0.006 -1.92 0.058
INF -0.012 0.007 -1.64 0.104
TB 0.006 0.004 1.32 0.188
Adjusted R
square 0.132
Observation 100
The above finding of regression analysis develops the regression model
𝐿 2 =0.334+0.003NPL+0.015ROA+0.004CAR-0.001BS-0.012GDP-
0.012INF+0.006TB.
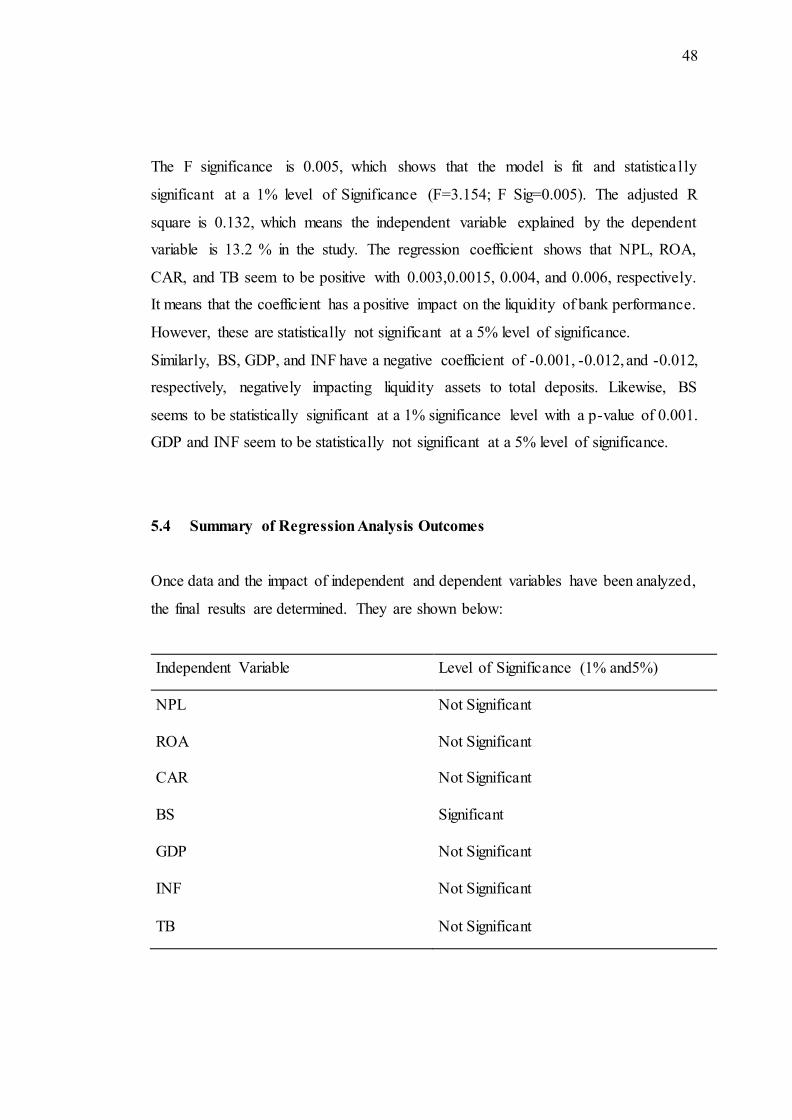
48
The F significance is 0.005, which shows that the model is fit and statistica l ly
significant at a 1% level of Significance (F=3.154; F Sig=0.005). The adjusted R
square is 0.132, which means the independent variable explained by the dependent
variable is 13.2 % in the study. The regression coefficient shows that NPL, ROA,
CAR, and TB seem to be positive with 0.003,0.0015, 0.004, and 0.006, respectively.
It means that the coefficient has a positive impact on the liquidity of bank performance.
However, these are statistically not significant at a 5% level of significance.
Similarly, BS, GDP, and INF have a negative coefficient of -0.001, -0.012, and -0.012,
respectively, negatively impacting liquidity assets to total deposits. Likewise, BS
seems to be statistically significant at a 1% significance level with a p-value of 0.001.
GDP and INF seem to be statistically not significant at a 5% level of significance.
5.4 Summary of Regression Analysis Outcomes
Once data and the impact of independent and dependent variables have been analyzed,
the final results are determined. They are shown below:
Independent Variable Level of Significance (1% and5%)
NPL Not Significant
ROA Not Significant
CAR Not Significant
BS Significant
GDP Not Significant
INF Not Significant
TB Not Significant
49
6 SUMMARY AND CONCLUSION
A summary of the entire study and the significant findings of the study is presented in
this section. Furthermore, the major conclusions are discussed in a separate section of
this chapter, followed by some implications and recommendations regarding the bank-
specific and macroeconomic factors affecting Nepalese commercial banks' liquid ity.
Finally, at the end of the chapter, the scope of future research in the same field is
mentioned.
This study has mainly focused on bank-specific and macroeconomic factors affecting
the liquidity of Nepalese commercial banks. The significant findings that significantly
impact liquidity in the Nepalese commercial bank are provided through secondary data
analyses. Also, it provides consistent findings with other studies as well. This study
uses the GDP, INF, TB as macroeconomic factors, whereas NPL, ROA, CAR, and BS
are bank-specific variables. The dependent variables used to measure liquidity are
liquid assets to total assets and liquid assets to total deposits. The results are based on
the secondary data collected for ten commercial banks from 2010/11 (2011) to 2019/20
(2020).
The correlation matrix for listed banks shows that CAR, ROA, TB, and INF are
positively related to liquid assets to total assets. In contrast, NPL, BS, and GDP are
negatively correlated for liquid assets to total assets, which means that the higher the
ROA, CAR, INF, and TB, the higher will be liquid assets to total assets and higher the
NPL, BS, and GDP, lower will be liquid assets to total assets. Likewise, CAR, ROA,
TB, and INF is positively related to liquid assets to total deposits; whereas NPL, BS,
and GDP are negatively correlated to liquid assets to total deposits, which means that
higher the ROA, CAR, INF, and TB, higher will be liquid assets to total deposits and
higher the NPL, BS, and GDP, lower will be liquid assets to total deposits.
The regression analysis of listed banks reveals that NPL, ROA, CAR, and TB have a
positive beta coefficient on liquid assets to total assets. The result shows that BS, GDP,
and INF have a negative beta coefficient on liquid assets to total assets. Likewise, NPL,
ROA, CAR, and TB positively affect liquid assets to total deposits. The result shows
that bank size, GDP, and INF negatively affect liquid assets to total deposits. Finally,
50
through the regression analysis, BS seems to be statistically significant at a 1 percent
level of significance, which explains the liquidity factors.
6.1 Summary
The liquidity plays a significant role in the economy, how quickly one can get a hand
on the cash. The bank's primary function is to convert liquid deposits (liabilities) to
liquid assets such as loans, making them inherently vulnerable to liquidity risk.
Armstrong and Coldwdel (2008 explain that the management of liquidity risk is for
banks to seek to preserve their ability to fulfill their role. While some outflows are
known with certainty, others, however, depend on external events and become,
therefore, sources of liquidity risk
The vital role of liquidity is to be the catalyst of the development of the economy to
improve the financial sector. The bank is enabled by adequate liquidity to meet three
kinds of risk. Firstly, funding risk is the ability to replace net outflows through
withdrawals of retail deposits or the non-renewal of wholesale funds. Moreover, if the
borrower or borrowers fail to meet their commitments, adequate liquidity is only a
solution for a bank to compensate for the non-receipt of the inflow of funds.
Finally, Nwankwo (1992) state that risk arises from calls to honor maturity obligat ions
or requests for funds from significant customers. In a sudden upsurge in borrowing
under atomic or agreed lines of credit or undertaking new lending when desirable,
banks must enable a mechanism to obtain new funds to honor the maturity obligations.
Liquidity plays a very significant role in shaping financial and banking institutions.
The scope of the study is to identify the macroeconomic and important bank-specific
determinants of liquidity of Nepalese commercial banks. This study employs
secondary sources of information in order to analyze the forms of relationships and
cause and effect between dependent and independent variables. The data comprises
data from 2010/11 to 2019/20 to address the study's issues and achieve study
objectives; explanatory, descriptive, and causal-comparative research design is used.

51
The primary source of data published by Nepal Rastra Bank and the Annual Reports
of selected commercial banks include various Banking and Financial Statistics issues,
Quarterly Economic Bulletin, and Bank Supervision Report. The study employed
several statistical and econometric tools such as regression analysis, correlation
analysis, descriptive analysis, and t-test to analyze the relationship as well as consider
a NPL, ROA, CAR, BS as a bank-specific variable, and GDP, INF, and TB (short-
term interest rate) as a macroeconomic variable. The relationship between dependent
and independent variables is analyzed using regression analysis. BS seems to be
significant in explaining liquidity in our study.
6.2 Conclusion
The correlation analysis for listed banks reveals that CAR, ROA, TB, and INF are
positively related to liquid assets to total assets. The result shows that NPL, BS, and
GDP are negatively correlated for liquid assets and deposits.
Through the regression analysis, study concludes that BS is a significant factor in
determining Nepalese commercial banks' liquidity. The result from regression analysis
reveals that beta coefficient NPL, ROA, CAR, and TB positively impact the liquid ity
of listed banks of Nepal. Likewise, the study shows that GDP, BS, and INF have a
negative impact on the liquidity of listed banks of Nepal indicating that the higher the
GDP, BS, and INF, the lower the liquidity (L1 and l2).
6.3 Recommendation
Based on the findings of the study, the following recommendations have been
forwarded:
1. The study found a positive impact of ROA, NPL, CAR, and TB for listed
banks. Hence, the banks willing to increase should increase the liquid ity
position of listed banks.

52
2. The study found a negative impact of GDP, BS, and INF for listed banks.
Hence, the banks willing to increase liquidity should decrease the GDP,
BS, and INF position of listed banks.
6.4 Scope for future research
In the upcoming days, in terms of data availability, models, and methodology, there
remains sufficient ground space to study, which are listed below:
1. The results are based on the commercial bank of Nepal. Financial sectors
such as finance companies, development banks, and microfinance companies
may be included in future studies.
2. A specific period and the sample size are taken in the study using a simple
regression model; however, other models can be implemented to examine the
risk management and bank financial performance.
3. The inclusion of unemployment rate and money supply factors in the further
study might give additional findings.
4. The study is based on the secondary data, but further study can be done using
both primary and secondary data.
5. The study can be done by using advanced statistical tools for future studies,
such as compared to descriptive, correlation, and regression analysis
bidirectional causality tools and non-linear statistical tools can be used.
53
REFERENCES
Abdullah, A., & Khan, A. Q. (2012). Liquidity risk management: A comparative study between domestic and foreign bank in Pakistan. Journal of Managerial
Sciences, 6(1), 61-72.
Acharya, V., & Naqvi, H. (2012). The seed of a crisis: A theory of bank liquidity risk.
Journal of Financial Economics, 106(1), 349-366.
Akhtar, M. F., Ali, K., & Sadaqat, S. (2011). Liquidity risk management: A comparative study between Conventional and Islamic Bank of Pakistan.
Journal of Research in Business,1(1), 35-44.
Allen, F., and Bolton, P. (2004). Liqudity and finincial instablity. Journal of the
European Economics Association, 6(2), 925-928.
Aymen, M., Moussa, B., & Chedia, H. (2016). Determinants of bank lending: Case of Tunisia. International Journal of Finance and Accounting, 5(1), 26-37.
Baral, K. J. (2005). Health check-up of commercial bank in the framework of CAMEL: A case study of joint venture banks in Nepal. Journal of Nepalese Business
Studies, 2(1), 41-55.
Berger, A. N., & Bouwman, C. (2009). Finincial crisis and bank liqudity creation. Wharton Finincila Institutions Centers.
Benbouziane, M., & Benamar, A. (2008). On the liquidity effect in Algeria and Morocco. Journal of Business and Management, 5(2), 232-240.
Bhattarai, B. P. (2018). Impact of bank specific and macroeconomic variables on performance of Nepalese commercial banks. Global Review of Accounting and Finance, 9(1), 35-53.
Bhunia, A. (2010). A trend analysis of liquidity management efficiency in selected private sector industry,Indian steel. International Journal of Research in
Commerce and Management, 1(5), 9-21.
Bonner, T. (2013). An analysis of banks liquidity buffer and stress testing. Journal of Tilburg University 8(2),393-397
54
Bunda, I., and Desquilbet, J. B. (2008, September). The bank liquidity smile across
exchange rate regimes. International Economic Journal, 22(3), 361-386.
Budhathoki, P. B., Rai, C. K., Lamichhane, K. P., Bhattarai, G., & Rai, A. (2020). The
Impact of Liquidity, Leverage, and Total Size on Banks' Profitability: Evidence from Nepalese Commercial Banks. Journal of Economics and business, 3(2).
Chioma, D. O., Adanm, S. E., & Clementina, N. O. (2014). Empirical study of the
impact of inflation on bank performance. Humanity and Social Sciences Journal, 9(2), 61-71.
Diamond, R., & Rajan, J. (2008). The procyclical effects of Bael II. Centre for Economic Policy Research Discus, 6862-6866.
Dinger, V. (2009). Do foreign -owned bank affect banking system liqudity risk?
Journal of Comparative Economics, 37(6), 647-657.
Eljelly, A. M. (2004). Liqudity - Profitablity trade off: An empricial investigation in
an emerging market. International Journal of Commerce and Management, 14(2), 48-61.
Fatima, N. (2014). Capital Adequacy: A financial soundness indicator for bank. Global
Journal of Finance and Management, 6(2), 771-776.
Fidrmuc, J. (2015). Does bank liquidity creation contribute to economic growth?
Evidence from Russia BOFIT Discussion Papers. 4-26.
Franklin, A., & Elena, C. (2008). The role of liqudity in finincial crises. 1-36.
Ghafoor, A. (2009). Comparison of Islamic and conventional banking in Pakistan.
Journal of Asia business studies, 23(6), 1-36.
Gomes, T. (2001). Renforcement de la gestion du risque liquidite dans les banques: les
nouvelles norms III sur la liquidite. Revue du systeme financier. Banque de Canada, 12(5), 15-25.
Graham, C., & Bordeleau, E. (2010). The impact of liquidity on profitability. Bank of
Canada Working Paper, 38(4), 6-22.
55
Iqbal, A. (2012). Liquidity risk mangement: A comparative study between
conventional and Islamic of Pakistan. Global Journal of Management and Business Research, 12(5), 54-64.
Joshi, A. (2016). Idiosyncratic and macroeconomic determinants of liquidity : A case of Nepalese commercial bank. Nepalese Journal of Business, 3(3), 103-115.
Joshi, R. (2012). Effects of dividends on stock prices. NRB Economic Review, 24(2),
1-15.
Khan, M. S., Scheule, H., & Wua, E. (2007). The impact of bank liqudity on bank risk
taking: Do high capital buffer and big bank help or hinder.
Kumar, M., & Yadav, G. C. (2013). Liqudity risk management in bank: A conceptual framework. AIMA Journal of Management and Research, 7(2), 2-12.
Kurawa, J. M., & Abubakar, A. (2014). An evaluation of the impact of Liqudity on the profitaablity of Nigerian bank. Journal of Management, 2(7), 2347-8217.
Landskroner, Y., & Paroush, J. (2011). Liquidity risk management, structure, and competition in banking. The Capco Institute Journal of Financial Transformation, 33(2), 113-119.
Levine, R., & Zervos, S. (1998). Stock markets, bank, and economic growth. The American Economic Review, 88(3), 537-558.
Lucas, R. E. (1990). Liqudity and intrest rates. Journal of Economic Theory, 1(1), 237-264.
Maharjan , A., Yadav, A., Poudel, B., Shrestha, B., & Aryal, B. (2016). The
relationship between bank credit,liquidity and profitability in Nepalese commercial banks. Nepalese Journal of Management, 3(1), 157-169.
Malik, M. F., & Rafique, A. (2013). Commercial bank liqudity in Pakistan : Firm specific and macroeconomic factors. The Romanian Economic Journal, 35(1), 139-154.
Malik, Q. A., & Ahmed, S. F. (2013). Idiosyncratic effect of liquidity management strategies on corporate performance valuation-a study of chemical industry.
World Applied Sciences Journal, 28(1), 114-119.
56
McNulty, J., Akhigbe, A., & Verbrugge, J. (2001). Small bank loan quality in a
deregulation environment: The information advantage hypothesis. Journal of Economics and Business, 53(2), 325-339.
Moussa, M. A. (2015). The determinants of bank liquidity: Case of Tunisia. . International Journal of Economics and Financial issues, 5(1), 249-259.
Muharam, H., & Kurnia, H. P. (2013). The influence of fundamental factors to
liquidity risk on banking industry: comparative study between Islamic bank and conventional bank in Indonesia. International Journal of Business and
management, 5(3), 2-14.
Muriithi, J. W. (2010). The effect of non performing loans on liquidity risk of commercial banks in Kenya. Journal of Multinational Financial Management,
12 (1), 159-169.
Murphy, S., & Shree, N. (2003). The capital structure puzzle. The Journal of Finance,
2, 575-592.
Myers, S. C., & Rajan, R. G. (1998). The paradox of liqudity. The Quartely Journal of Economics, 16(1), 733-771.
Nishanthini, A., & Meerajancy, J. (2015). Trade-Off between liquidity and profitability: A Comparative study between state bank and private banks in Sri
Lanka. Research Journal of Finance and Accounting, 5(1), 20-35.
Nwankwo, U. (1992). Economic agenda for Nigeria. Lagos: Centralist Production Ltd. Lagos Nigeria.
Nwaezeaku, N. (2006). Theories and practice of financial management. International Journal of Economics and Finincial Issues, 3(1), 237-262.
Ogbuabor, J., & Malaolu, V. (2013). Impact of informality on the liquidity of deposit. Global Journal of Human Resource Management, 1(3), 12-28.
Ojha, P. R. (2018). Macroeconomics and Bank-Specific factors affecting liquidity: A
study of Nepali commercial banks. Journal of Business and Social Sciences, 2(1), 79-87.
57
Olagunju, A., Adeyanju, O. D., and Olabode, O. S. (2011). Liquidity management and
commercia bank' profitability in Nigeria. Research Journal of Finance and Accournting, 2(7), 2222-2847.
Ongore, V. O., & Kusa, G. B. (2013). Determinants of financial performance of commercial bank in Kenya. International Journal of Economics and Financial Issues, 3(1), 237-252.
Osuji, C. C., & Agbada, A. O. (2013). The efficacy of liquidity management and banking. International Review of Management and Business Research, 2(1),
01-11.
Rijal, M. S. Impact of Liquidity on Profitability of Nepalese Commercial Banks. The Lumbini Journal of Business and Economics, 108.
Paroush, Y. L. (2011). Liqudity risk management , structure, and competition in banking. Journal of Finincial Transformation, 113-120.
Pradhan, R. S., & Shrestha, R. (2015). Impact of bank specific and macroeconomic variables on the performance of commercial bank of Nepal. Nepalese Journal of Business, 2(2), 73-84.
Rauch, C., Steffen, S., Hackethal, A., & Tyrell, M. (2010), "Determinants of bank liquidity creation",Journal of Commerce and Management, 14(2), 48-61.
Ranabhat, D. (2019). Effects of Internal Factors on Financial Performance of Joint Venture Banks in Nepal. Journal of Nepalese Business Studies, 12(1), 87-99.
Repullo, R. (2004). Capital requirement, market power, and risk taking in banking.
Journal of Financial Intermediation, 13(1), 156-182.
Rose, P. S. (1999). Commercial bank management, The Irwin. International edition
New York.
Saleem, Q., & Rehman, R. U. (2011). Impact of liqudity ratios on profitablity. Interdisciplinary Journal of Research in Business, 1(2), 59-65.
Sarkar, J., Sarkar, S., & Bhaumik, S. K. (1998). Does ownership always matter? Evidence from the Indian banking industry. Journal of Comparative
Economics , 26(1), 262–281.
58
Sawada, R. (2010). Liqudity risk and bank portfoilo management in a financial system
without deposit insurance:Empiricial evidence from prewar Japan. International Review of Economics and Finance, 19, 392-406.
Sharma, P. (2016). Determinants of commercial bank liquidity in Nepal. Nepalese Journal of Business, 3(3), 126-138.
Shin, H., & Adrian, T. (2013). Commercial bank liquidity in Pakistan: Firm specific
and macroeconomic factor. The Romanian Economic Journal, 2(1), 168-205.
Shrestha, B. (2012). Impact of liquidity on profitability of commercial bank in nepal.
Nepalese Journal of Management, 5(1), 27-38.
Singh , A., & Sharma, A. K. (2016). An emperical analysis of macroeconomic and bank specific factor affecting liquidity of Indian Bank. Future Business
Journal, 1(1), 40-53.
Sthapit, A., & Maharjan, ,. G. (2012). Impact of liquidity management on profitabil ity:
A comparative study of foreign joint-venture bank in Nepal. 2(2), 59-72.
Subba, S. (2006). Risk management of commercial bank in Nepal : A comparative study between NCC bank ltd. and NBB bank ltd. Kathmandu: An unpublished
master degree thesis, central department of mangement TU.
Subedi, S., & Neupane, B. (2013). Determinants ofbank' liquidity and their impact on
financial performance in nepalese commercial bank.
Sudirman, S. N. (2014). Determinants of bank liquidity in Indonesia. International Annual Symposium on Management. 1-16.
Tabari, N. A., Ahmadi, M., & Emami, M. (2013). The effect of liquidity risk on the performance of commercial bank. International Research Journal of Applied
and Basic Science, 4(6), 1624-1631.
Tesfaye, T. (2012). Determinants of Banks Liquidity and their Impact on Financia l Performance: Emperical study on Commercial Banks in Ethiopia. The
Department of Accounting and Finance , 1-122.
Tseganesh, T. (2012). Determinants of bank liquidity and their impact on financ ia l
performance. Journal of Finance, 58(1), 33-73.
59
Umar, M., & Sun, G. (2016). Non-performing loans (NPLs), liquidity creation, and
moral hazard: Case of Chinese banks. Journal of Economics and Finance, 3 (1), 258-277.
Umoh, P. N. (1994). Bank Loans Recovery: The roles of the regulators/ supervis ior authorities. Judiciary Law Enforcement Agencies and the Press, NIDC Quartely, 4(3), 8.
Vento, G. A., & Ganga, P. L. (2009). Bank liquidity risk management and supervis ion: Which lesson from recent market turmoli? Journal of Money , Investment and
Banking, 10, 79-126.
Vodová, P. (2011). Determinants of commercial bank ́ liquidity in hungary.Journal of Economics and Finance , 13(2), 180-189.
Vodova, P. (2011). Liquidity of Czech commercial bank and its determinants. International Journal of Mathematical Models and Methods in Applied
Sciences, 6(3), 1060-1067.
Vtyurina, R., Bonner, C., & Lely, P. (2012). Determinants of bank liquidity buffers in Central America.
Wanger, W. (2007). The liquidity of bank assest and banking stablity. Journal of Banking and Finance, 31, 121-139.