
ASSESSING THE LIQUIDITY MANAGEMENT PRACTICES OF ...
117
KWAME NKRUMAH UNIVERSITY OF SCIENCE AND TECHNOLOGY KUMASI, GHANA COLLEGE OF ARTS AND SOCIAL SCIENCE SCHOOL OF BUSINESS DEPARTMENT OF ACCOUNTING AND FINANCE ASSESSING THE LIQUIDITY MANAGEMENT PRACTICES OF SOME SELECTED RURAL BANKS IN ASHANTI REGION DARBOH, ANTHONY JULY, 2015
-
Upload
khangminh22 -
Category
Documents
-
view
0 -
download
0
Transcript of ASSESSING THE LIQUIDITY MANAGEMENT PRACTICES OF ...

KWAME NKRUMAH UNIVERSITY OF SCIENCE AND TECHNOLOGY
KUMASI, GHANA
COLLEGE OF ARTS AND SOCIAL SCIENCE
SCHOOL OF BUSINESS
DEPARTMENT OF ACCOUNTING AND FINANCE
ASSESSING THE LIQUIDITY MANAGEMENT PRACTICES OF
SOME SELECTED RURAL BANKS IN ASHANTI REGION
DARBOH, ANTHONY
JULY, 2015

i
DECLARATION
I hereby declare that this submission is my own work towards the Master of Business
Administration (Finance Option) and that, to the best of my knowledge, it contains no
material previously published by another person nor material which has been accepted for
the award of any other degree of the University, except where due acknowledgement has
been made in the text.
……………....... 30/07/2015
DARBOH, ANTHONY SIGNATURE DATE
(PG 9621813)
STUDENT NAME AND ID NUMBER
Certified by ------------------------ ------------------
KWASI POKU SIGNATURE DATE
(SUPERVISOR)
Certified by --------------------------- -----------------------
PROFESSOR J.M. FRIMPONG SIGNATURE DATE
(DEAN)

ii
ABSTRACT
Much attention generally has not been given to liquidity management within the Rural
Banking industry in Ghana, in spite of the enormous benefit that accrues to banks from its
efficient liquidity management. The Rural Banking industry is estimated to have over 30
percent of its mobilized deposits in short term investments and approximately 60 percent in
loans and advances. The huge investment in current assets, generally therefore underscores
the need for its efficient management. The study therefore looks at examining the liquidity
management practices of some selected rural banks in Ashanti Region. The objective of this
research was to investigate and assess the banks liquidity risks, identify its causes and
management practices put in place to comply with the best standards. For the purpose of this
research, the researcher obtained the primary data through semi-structured interview
questions. The interview questions referring to the General Managers and Heads of
Operation, Finance and Credit of the selected banks were prepared and conducted. An
appraisal of the financial statements and liquidity reserve returns from 2009 to 2013 was
undertaken with particular attention to assets/liabilities mismatches, liquidity reserve
requirements which had bearing on the banks liquidity risks exposures in liquidity
management practices and the level of compliance with best standards. The key findings
were inadequate liquidity management policies, poor credit administration, weak internal
control systems and inefficient management of treasury and investment portfolio.
Appropriate recommendations were given to improve the liquidity management practices of
the selected banks in particular and Ashanti Region rural banks in general.

iii
ACKNOWLEDGEMENT
I thank the most gracious God who is my source of life, protection and wisdom for the
strength and knowledge given me to produce this dissertation.
My special gratitude goes to my supervisor, Mr. Kwasi Poku of KNUST School of
Business, Accounting and Finance Department, whose comments, encouragement and
suggestions have helped produce this work.
I am also grateful to Mr. Edward Yeboah for his valuable assistance in checking and
providing useful inputs for this project.
My appreciation also goes to the General Managers and staff of Atwima Kwanwoma Rural
Bank, Odotobri Rural Bank and Bosomtwe Rural Bank, all in Ashanti Region for their
immeasurable support in obtaining data for this study.
Again, I am grateful to all the lecturers and the entire staff of School of Business for the
knowledge imparted to me and for making the learning process a pleasant one.
Finally, I wish to thank my dear family members, for their love, support and encouragement.

iv
DEDICATION
This dissertation is dedicated to the Almighty God who has helped me to overcome all
the challenges that came my way during the preparation of this work. I also dedicate it
to my dear wife Miss Mavis Opoku and my children Eugene, Jeffrey, Mildred and Ivan.

v
TABLE OF CONTENTS
Contents Pages
Declaration i
Abstract ii
Acknowledgement iii
Dedication iv
Table of Contents v
List of Tables xi
List of Figures xii
Acronyms xiii
CHAPTER ONE: INTRODUCTION
1.1 Background of the study 1
1.2 Problem statements 3
1.3 Objective of Study 6
1.4 Research questions 7
1.5 Scope of the Study 7
1.6 Significance of the study 7
1.7 Limitations of the study 8
1.8 Organization of the study 9

vi
CHAPTER TWO: LITERATURE REVIEW
2.0 Introduction 11
2.1 Historical Development of Rural Banking 11
2.2 The concept of Liquidity 12
2.3 Liquidity Risk 15
2.4 Liquidity Gap Analysis 17
2.5 Working Capital Policies 17
2.5.1 Aggressive Working Capital Management 18
2.5.2 Conservative Working Capital Management 19
2.5.3 Moderate Liquidity Management 19
2.6 Liquidity Management Policy 20
2.6.1 Liquidity Policies 21
2.6.2 Liquidity Management Planning 23
2.6.3 Factors Influencing Liquidity Management 24
2.6.4 Liquidity Contingency Plan 26
2.6.5 Indicators of Early Warning Signs of Liquidity Problems 27
2.6.6 Measurement of Liquidity Risk in Banking 28
2.7 Liquidity Profile of Banks 29
2.8 Liquidity Trends 30
2.8.1 Tradeoff between Liquidity and Profitability 30
2.8.2 A Risk-Return Analysis of a Firms Working Capital Position 32
2.9 Components of Liquidity Management 32
2.9.1 Cash Management 32

vii
2.9.2 Inventory Management 33
2.9.3 Credit/ Loan Management 34
2.9.4 Payable Management 34
CHAPTER THREE: METHODOLOGY
3.0 Introduction 36
3.1 Research Design 36
3.2 Sources of Data 37
3.2.1 Primary Data 37
3.2.2 Secondary Data 38
3.2.3 Other Literature Source 39
3.3 Methods of Data collection 39
3.3.1 Questionnaire 39
3.3.2 Interview 40
3.4 Population and Sample of the Study 40
3.5 Methods of Data Analysis 41
3.6 Ethical Consideration 41
3.7 Chapter Summary 41
CHAPTER FOUR: DATA PRESENTATION AND ANALYSIS
4.0 Introduction 42
4.1 Liquidity Risk Assessment of the Selected Banks 42
4.1.1 Assets/Liabilities Mismatches 43

viii
4.1.2 Liquidity Reserve Requirement 46
4.1.3 Liquid Assets to Total Assets 52
4.1.4 Liquid Assets to Demand Deposits 54
4.2 Respondents’ Assessment of the Causes of Liquidity Risks 57
4.2.1 Factors of causing Liquidity Risks 57
4.2.2 The Systems Put in Place to Detect Warning Signals of Liquidity 60
4.2.3 The Respondents’ Solution to the Liquidity Risks 61
4.2.4 The Banks Policies on Liquidity Risk Management 62
4.3 Liquidity Management Practices 63
4.3.1 Details of Banks Liquidity Risk Management 63
4.3.2 Key Players of Liquidity Management and Their Roles 64
4.3.3 Detail Description of Liquidity Management Practices of Banks 65
4.3.4 The Liquidity Management Plan of the Banks 66
4.3.5 Liquidly Contingency Plans for the Banks 66
4.3.6 Description of Elements in the Banks Contingency Plans 67
4.4 The Effects of Liquidity Compliance to the Best Standards 68
4.4.1 Compliance to Primary Reserve Requirement 69
4.4.2 Compliance to Secondary Reserve Requirement 69
4.4.3 Compliance of Capital Adequacy 69
4.4.4 Meeting Customers Withdrawals 69
4.4.5 Sound Credit Management 69
4.4.6 Strong Internal Control 70
4.4.7 Sound Investment of Idle Funds 70

ix
4.4.8 Sound Investment Practices 70
4.4.9 Operating Within Cash Insurable Limit 70
4.4.10 Regular Cash Count 71
4.4.11 Sound Specie Management Practices 71
4.4.12 Occurrence of Overs and Short 71
4.4.13 Regular Training for Tellers 71
4.4.14Training for the Players Involved in Liquidity Management 72
4.5 Discussion of Results 72
4.5.1 Liquidity Risk Factors 72
4.5.2 Liquidity Management Practices 72
4.5.3 Credit Management Practices 73
4.5.4 Treasury and Investment Management 73
4.6 Chapter’s Summary 74
CHAPTER FIVE: SUMMARY, CONCLUSIONS AND RECOMMENDATIONS
5.0 Introduction 75
5.1 Summary of findings 75
5.2 Liquidity Risks 76
5.2.1 The Methods Used in Assessing Liquidity Risks 76
5.2.2Liquidity Reserve Requirement 76
5.2.3 Liquid Assets to Demand Deposits 77
5.3 The Causes of Liquidity Risks of the Selected Banks 78
5.3.1 Factors which Causes Liquidity risks 78

x
5.3.2 Banks Policy on Liquidity Risks 79
5.4 Liquidity Management Practice 79
5.5 Effects of Liquidity Management Compliance 80
5.5.1 Liquidity Reserve Requirement 80
5.5.2 Other Procedures Needed Compliance to Best Standards 80
5.6 Conclusion 81
5.7 Recommendations 82
5.7.1 Sound Management Practice 82
5.7.2 Adherence to Statutory Liquidity Reserve Requirement 82
5.7.3 Sound Credit Management Practice 83
5.7.4 Sound Treasury and Investment Practices 83
5.7.5 Strong Internal Control 83
5.7.6 Application of Information and Communication Technology 84
References 85
Appendix 89

xi
LIST OF TABLES
Pages
Table 2.1 Factors Influencing Liquidity Management 25
Table 2.2 Reasons for Various Scenarios 29
Table 2.3 Liquidity Profile of Banks analyzed on static and dynamic Bases 30
Table 4.1 Liquid Assets/Total Liabilities – Atwima Kwanwoma 52
Table 4.2 Liquid Assets/Total Liabilities – Odotobri 53
Table 4.3 Liquid Assets/Total Liabilities – Bosomtwe 54
Table 4.4 Liquid Assets/Demand Deposits – Atwima Kwanwoma 55
Table 4.5 Liquid Assets/Demand Deposits – Odotobri 56
Table 4.6 Liquid Assets/Demand Deposits – Bosomtwe 57

xii
LIST OF FIGURES
Pages
Figure 2.1 Managing Liquidity Gap 18
Figure 4.1 Assets /Liabilities Mismatches- Atwima Kwanwoma 44
Figure 4.2 Assets/Liabilities Mismatches- Odotobri 45
Figure 4.3 Assets/Liabilities Mismatches- Bosomtwe 46
Figure 4.4 Compliance Rate of Liquidity Reserve Requirement- Atwima Kwanwoma 48
Figure 4.5 Compliance Rate of Liquidity Reserve Requirement- Odotobri 50
Figure 4.4 Compliance Rate of Liquidity Reserve Requirement- Bosomtwe 51

xiii
ACRONYMS
RCBs Rural and Community Banks
B o G Bank of Ghana
LM Liquidity Management
AIP Aggressive Investment Policy
AFP Aggressive Finance Policy
NPAs Non- Performing Assets
ARB Association of Rural Banks
EMU Efficiency and Monitoring Unit
OFISD Other Financial Institution Supervision Department
ALCO Assets and Liabilities Committee
BSD Banking Supervision Department

1 | P a g e
CHAPTER ONE
GENERAL INTRODUCTION
1.1 Background of the Study
Liquidity management among the rural and community banks has undergone several changes
since the inception of the concept of Rural and Community Banking which was introduced in
Ghana in 1976. The purpose of introducing that concept was to assist to mobilize rural savings
and to make loans and other banking products readily available to the persons living and
employed in the rural areas and to support their wellbeing and development generally.
(Asiedu-Mante E., 2011)
Liquidity, or capacity to fund growths in assets and meets commitment as and when it falls due,
is critical to the continuing sustainability of any financial institution, consequently handling
liquidity is among the most significant undertakings steered by the Banks. Comprehensive
liquidity management can lessen the likelihood of severe difficulties. Undeniably the importance
of liquidity surpasses individual banks, since liquidity gap at a particular rural or community
bank can have organizational wide-ranging impacts. For that matter, the scrutiny of liquidity
enjoins bank supervisors not only to assess the liquidity position of the bank on continuing basis
but to observe how financing requirement are expected to progress under numerous situations
comprising disparaging circumstances.
Nowadays, monitoring liquidity in many establishments requires cautious consideration of
possible unfavorable situations rather than just the quick calculation of a few ratios. Generally,
banks should appraise likely future cash flows, stress those cash flow assessments under various
scenarios, and develop comprehensive plans for coping with possible gaps. Modern technical and

2 | P a g e
financial modernizations have delivered to the banks new ways of funding their undertakings and
handling their liquidity. In addition a decreasing capacity to rely on core Deposits, increased
reliance on wholesale funds and recent disorder in financial markets universally have
transformed the way liquidity are viewed by the banks. All of these discrepancies have also
occasioned in new encounters for banks, of which rural and community banks are not exception.
The method and complexity of the procedure used to handle liquidity rest on the scope and
complexity of the banks as well as the nature and intricacies of its activities. It is important to
note that, good management information systems, analysis of net funding requirements under
different circumstances, broadening of funding sources and contingency planning are important
basics of strong liquidity management at a bank of any scope of operation.
Liquidity management has passed through diverse stages, generally the control, optimization and
value measurement stage. The control stage is characterized by an orderly approach of
monitoring the inward, outward and outstanding balances of cash, receivables and inventories
with the central focus of ensuring that those charged with the responsibility of its management
do not misappropriate them. Optimization stage of liquidity management focuses on
management efforts to maximize the related income of liquidity management and minimizing the
associated cost of its management whiles ensuring the physical safety. To this end various
models were developed by researchers and managers to ensure that liquidity position of an
organization is not unduly affected by the management of liquidity. And under Value
management approach Liquidity management focused in what way to assist managers in the
formation and extent of value without ignoring the above two intentions. It is important to note
that if business could be predicted to survive in the present, it gives a firm basis for the entity to
have a greater chance of surviving in the future.

3 | P a g e
Working capital distinguishes between assets in cash or easily changeable into cash (current
assets) and firms obligations for which cash will soon be required (current liabilities). It therefore
measures company’s competence and its short-term financial health. The purpose of liquidity
management is to preserve the optimum balance of each liquid item. To reach optimal liquidity,
firm managers should regulate the interchange between profitability and liquidity perfectly.
Notwithstanding the benefits associated with liquidity management, it comes with huge cost of
investments when more funds accumulated in liquid assets. Huge investment in the various
components of working capital could hold up capital and consequently lead to reduce profit
margin. Another important cost implication in the management of liquidity is time management.
Managers must always be on top of their liquidity issues at any point in time.
The major focus of this work is to examine factors militating against liquidity management and
reasons responsible for inefficient liquidity management in the rural and community banks and
to investigate ways of improving the liquidity management of that sector.
1.2 The Problem Statement
Managing liquidity is essential factor in the safe and comprehensive supervision of all financial
establishments. The survival and success of a business entity especially in the financial sector
depends on the entity’s ability to manage its liquidity which is significant component of
corporate finance. Corporate accomplishment greatly rest on the capacity of financial managers
successfully managing creditors, stocks and debtors (Filbeck and Krueger 2005)

4 | P a g e
Sound liquidity management comprises carefully supervision of assets and liabilities to ensure
that cash inflows have an appropriate connection to future cash outflows. This have to be
reinforced by development of liquidity plans which measures likely future liquidity requests, by
considering variations in economic, supervisory or other operational situations. These
arrangements includes categorizing identified estimated and probable cash outflow and assessing
different assets and liabilities management approaches to certify tolerable cash inflow that will
be accessible to the institution to meet these needs. Improving liquidity management is
realistically vital for firms to endure the effects of monetary disorder (Reason, T. 2008)
Management of liquidity has proven to be very important aspect of every financial institution
especially rural and community banks, this is evident by the recent liquidation of some banks and
withdrawal of their licenses by Bank of Ghana due to non-performance especially their inability
to meet the required stated capital, liquidity reserve requirements and Capital Adequacy which
could result in a run on the banks by their customers.
In such situations the financial markets cannot be recovered until confidence is restored by the
general public. Banks need to recover trust in each other and rebuild their reputation across the
stakeholders’ as well as the regulators.
In the light of this background, the efficient management of liquidity will be extremely critical to
the survival of any financial institution.
The rural and community banks in Ghana face some challenges in the management of its
liquidity. This scenario has been necessitated by the generally high level of illiteracy by the
customers of the banks in their catchment areas, high non-performing assets due to poor credit

5 | P a g e
management, inefficient management of investment portfolio, lack of proper internal controls
and indiscriminate investment in capital expenditures.
The rural and community banking is becoming a key contributor to the Ghanaian economy in
terms of financial intermediation, job creation and importantly avenue for mobilizing deposits
thereby inculcating the habit of savings. The implication is that, if there are a lot of inefficiencies
in the management of its liquidity the end results will be the unexpected run on the banks,
thereby forcing them into liquidation.
The selected rural banks namely Atwima Kwanwoma, Odotobri and Bosomtwe have provided
direct job opportunities to number of people and also provided a lot of indirect jobs to large
number of people through their financial intermediation.
Liquidity management is an area highlighted for the productive exploitation of the available
resources generated out of good cash flow, financial solvency and growth strategies. The
selected rural banks for this project are major players in the rural banking industry in the Ashanti
Region and bring range of issues which for the purposes of academic literature can be used to
fairly represent the general practice in the rural banking sector. The research problem is usually
the premise based upon which research objectives are generated.

6 | P a g e
1.3 Objective of the study
The general objective of the study is to evaluate the liquidity management practices of some
selected rural banks in Ashanti Region, namely Atwima Kwanwoma, Odotobri and Bosomtwe
The researcher intended to achieve the following specific objective by conducting this study.
They are outlined as follows
1. To examine the liquidity risk of the selected rural banks for the past five (5) years
2. To find out the causes of the liquidity risk of the selected banks
3. To identify the liquidity management practices of the selected rural banks
4. To evaluate whether the liquidity management of the banks meets Best Standards
1.4 Research Questions
The research is planned to respond to the ensuing questions:
1. What are the liquidity risks of the selected rural banks
2. What are the causes of liquidity risks of the selected rural banks
3. What are the liquidity management practices of the selected rural banks
4. What impact has the liquidity management compliance of the selected rural banks on the
best standards

7 | P a g e
1.5 Scope of Study
The research is limited to liquidity management practices in Ghana. The study focused on the
rural/community banking sector using multiple case study approach with some selected rural
banks namely Atwima Kwanwoma, Odotobri, and Bosomtwe in Ashanti region as a case study.
At organizational level and only departments of the banks whose decisions and activities have a
direct effect on liquidity management were used. The three rural banks were selected due to their
features as a typical rural banking entity for the purposes of generalization and ease of access to
data.
For the purposes of time constraint and fair representation, the horizontal analysis of the
financial statements of the selected banks was limited to 5 (five) years.
1.6 Significance of the Study
The management of liquidity is crucial for the success or otherwise of every business
organization particularly in financial institution. It is in the light of the aforementioned grounds
that the study was conducted. The significance of the study can be looked at from three main
perspectives.
The study, as part of its objectives, is to provide strategic policy recommendations that are
anticipated to contribute substantially towards the improvement of the management of the
various liquid assets. The empirical results of the study are expected to make management of the
selected rural banks better placed to make more informed decisions concerning their liquidity
management.

8 | P a g e
The study is also expected to make significant contribution to financial literature particularly
liquidity management within the rural/community banking. The study is also expected to serve as
a reference point for further research study in liquidity management in the rural banking sector.
At the macro level, the expectation is that, an improvement in the liquidity management within
the rural banking sector will lead to growth in profits and consequently in government revenue
(Corporate Tax) Corporate Social Responsibility (CSR) and stability of the Country.
1.7 limitation of the study
A major limitation of this research work was time; the researcher did not have enough time to
enable him to expand the sample population for administration of sample tool. That is
questionnaire and interview. This same limiting factor also influenced the selection of only three
rural banks from Ashanti to form the sample population for the study.
The researcher used a case study limiting his work to only Atwima Kwanwoma, Odotobri and
Bosomtwe Rural Banks. This reduces the time required to gather data and minimizes the
expenditure on the study but agrees that the selected banks are archetypal of the rural banking in
Ashanti Region. Future case research can be heralded with study in order to get a complete
picture of the liquidity management practices within the manufacturing industry in Ghana.
The research should focused mainly on the internal liquidity management without recourse to the
external where there could have been input from external parties such as Bank of Ghana and
customers whose decisions and activities affect the overall cost of managing liquidity.

9 | P a g e
The study is restricted to the rural banking because of this constraint it is inappropriate to widen
the researcher’s findings and conclusions to situation in all financial institution such as the
Universal banks and Insurance companies among others whose liquidity activities are influenced
by the peculiar nature of their business. Comparable research could be made in other financial
institution in order to have opportunity to compare.
The abovementioned limitation notwithstanding, the research was conducted and organized in
order to keep the impact of the identified limitation on the findings and recommendations at
reasonably low level
1.8 Organization of the study
This study is divided into five chapters:
Chapter 1 describes the significant of research, problem statement, research objectives, scope,
research methodology and limitation of the study.
Chapter 2 deals with the core issues of concerns that are associated to liquidity management and
review of previous works that tackled them systematically and pragmatically.
Chapter 3 focuses on methods used in the study to achieve the identified objectives, it includes
population sample of the respondent, the technique used in data collection, methods of data
analysis.

10 | P a g e
Chapter 4 presents data analysis, interpretation and discussion of results involving the banks in
line with the objective of the study.
Chapter 5 offers a brief summary of the research work findings, conclusions and
recommendations.

11 | P a g e
CHAPTER TWO
LITERATURE REVIEW
2.0 INTRODUCTION
This chapter deliberates and critically evaluates researches and other documents related to the
topic under study. In doing this, the researchers have duly and carefully studies various literature
related to the management of working capital in general. Nevertheless, it is important to add that
the focus of this research is to understand liquidity management practices specifically within the
rural banking sector which remains an area very much understudied.
The chapter takes a holistic view of the concept of working capital management, an overview of
the conservative and aggressive approaches to the management of working capital, an overview
of working capital components, liquidity and profitability trade-off, an overview of the working
capital cycle, an integration of the management, of various working capital components and the
various factors that impact on the liquidity management.
2.1THE HISTORICAL DEVELOPMENT OF THE RURAL BANKING CONCEPT
The concept of rural banking was introduced in Ghana in 1976. The purpose of introducing that
concept was to assist to mobilize rural savings and to make loans and other banking products
readily available to the community living and employed in the rural areas and to support their
wellbeing and development generally. (Asiedu-Mante E., 2011)
Before its establishment the key operatives in the rural areas were the branches of commercial
banks, cooperative and credit unions and other units in the informal sector such as moneylenders,
merchants and “susu” collectors. Associates and relatives were also main sources of rural
finance.

12 | P a g e
Accordingly, some members of staff of the Central Bank were sent to Countries such as
Philippines and Mexico to learn about their “fondo” and other village financial systems, after
which the first rural bank was opened at Agona Nyakrom in the central region.
The mandatory minimum startup capital of the rural banks was ¢50,000.00 old cedis (fifty
thousand old cedis). This was raised to ¢100,000.00 old cedis (one hundred thousand old cedis)
provided it was raised from the community that the bank served.
Until 1994 Bank of Ghana provided working capital to each rural bank in the form of preference
shares of ¢125,000.00 old cedis (one hundred and twenty five thousand old cedis). Presently, the
required capital is GHs 300,000.00 (three hundred thousand Ghana cedis) and Bank of Ghana
had instructed the banks to raise it to GHs 1,000,000.00 (one million Ghana cedis) by the close
of the year 2017.
The capacity of rural banks have been sponsored by the Association of Rural Banks and
supported by projects of the World Bank, DANIDA and other donors.
The Bank of Ghana was in charge of all the rural banks but found the task of supervising over
136 rural and community banks all over the country to be costly in terms of staff and the high
reserve requirement to be excessively blunt.
The consequence was an arrangement to establish ARB Apex Bank in 2002 as a licensed
banking institution under the banking law 1989 PNDC Law 225 owned exclusively by the rural
and community banks as its mini central bank to provide banking and other services to them.
Its establishment was supported by the World Bank and other donor agencies,
2.2 THE CONCEPT OF LIQUIDITY MANAGEMENT
The corporate finance emphases on the study of long-term financial choices, mainly investments,
capital structure, dividends, risk and returns and business valuation decisions. Nonetheless, the

13 | P a g e
decisive influence of current assets on others, as well as firm’s capacity to fulfill its current
obligations is an important component of total assets and requires to be prudently examined. .
Liquidity is bank’s ability to fund growth in assets and meet both predictable and unpredicted
deposits withdrawal and security commitments at a judicious cost and without suffering
intolerable losses.
Palaver of liquidity management (LM) has come to be progressively important in the financial
institutions, particularly with the dawn of financial disintegration and economic downcast.
These situations have caused increasing loans and weak market liquidity, vivacious cycle of
weakening assets market values and deleveraging. Interbank lending came to a halt; credit risk
and capital flight became the order of day. World consultants sought to find solution as banks
were on their knees in pursuit for liquidity; with interbank lending losing steam. Many financial
institutions were bailed out or restructured. The incapability of a bank to meet up with its
monetary obligation is a signal of which crisis may result. This concern may be due to
dwindling in assets quality or overall loss of confidence in financial institutions due to conditions
more or less connected to the bank in question. Consequently become imposing for banks to
develop strategies and principles that best measure and manage their liquidity situation. It is also
necessary to project how funding liquidity issues, in event of crisis could arise.
Determining and handling liquidity goes together, a good liquidity monitoring and measurement
policy decides more or less executive decisions on bank liquidity situation on an on-going basis;
specifically in periods of adverse circumstances like financial crises. Business’s treasurer has to
evaluation the appropriate cash amount for all level of activity, organize suitable time to make
payments and collections and do investments with their high liquidity asset, so that the asset can
be converted into cash in case if the company having short of cash in the future (Kamath et el.,

14 | P a g e
1985 Srinivasan & Kim, 1986). Kamath drew the attention of every management to the proper
right matching of their short term cash inflows and outflows. There are the likelihood of
mismatch of current assets and current liability throughout the process. If this happens and firm’s
manager would not be in a position to handle its property then it will affect firm’s growth and
profitability. This will further lead to financial distress and finally firms can go insolvent. Since
optimum cash levels are influenced by the factors outside the anticipatory concept of treasury,
the company must strategies to take serious operating decision on how to make the most of the
profit prospects that is accessible in the cash flow process. This concept has a relation with
monetary theory since business deal and setting up is a main reason in managing cash. In
addition, this motive also has a supposition which all the concept of treasury management is in
the good judgment of their terms. (Maseda & Iturralde, 2001).
Improving liquidity management is rationally significant for companies to survive the impacts of
economic turmoil (Reason, 2008). On the other hand, effective Liquidity Management is also
critical for companies during the thriving economic eras (Lo, 2005), for the reason that Liquidity
Management is connected to all facet of supervising current assets and current liabilities (Emery,
Finnerty, & Stowe, 2004; Hampton & Wagner, 1989; Hill & Sartoris, 1992; Scherr, 1989;
Vander Weide & Maier, 1985). Liquidity Management is not only meant to safeguard
organizations from financial disturbance but can be handled tactically to develop competitive
situation and productivity.
Hitherto it behooves on the managers to make sure that the business process is running in
effective and lucrative manner. The mixture of various working capital components change over
time. Working capital decisions impact on the liquidity as well as the profitability and risk is the

15 | P a g e
incapability to meet anticipated withdrawal and obligations, this shows the risk of cash shortages
when it cannot be met when the need arises due to maturity mismatch.
2.3 LIQUIDITY RISK
Liquidity risk is determined by examining a maturity profile of assets and liabilities, which assist
the organization to make a decision on liquidity mismatch. The basic problem is for a bank to
decide whether it will be capable of meeting maturing commitments on the date they fall due, it
must prepare a projected cash-flow statement and evaluate the likelihood of facing any liquidity
crisis.
Liquidity measurement is somewhat a challenging mission and can be assessed through stock or
cash flow approaches. The significant ratios, approved all over the banking industry are: the
other methods of measuring liquidity risk are
1. To achieve liquidity risk, banks must retain the maturity profile of liabilities well-
matched with those of assets.
2. The behavioural maturity profile of numerous elements of on/off balance sheet items is
analysed and variance analysis is carry out regularly.
3. Banks should closely monitor the mismatches within the time bands and meet the
tolerance limits on mismatches fixed for various maturities, subject to asset/liability
profile, standard deposit base, nature of cash flows, etc.
The liquidity risk in banks is evident in diverse scopes:
Funding Risk –This as a result of net outflows caused by unexpected and unusual withdrawals /
non-renewal of deposits both wholesale and retail.
Time Risk - To pay off as a result of non-receipt of projected inflows of funds, i.e. performing
assets becoming non-performing assets; and

16 | P a g e
Call Risk – Crystallization of contingent liabilities which would not able to undertake lucrative
business prospects when needed.
The Asset and Liability Committee (ALCO) has the responsibility to oversee the overall risk
management system in the banks. It denotes examination of all the assets and liabilities
simultaneously to ensure a suitable balance between funds mobilization and their distribution
with respect to their maturing periods. Banks should precinct the effects of committed facilities
and premature closure of deposits so as to accurately evaluate the liquidity risk.
Experiences have shown that assets commonly considered as liquid or risk free like Government
securities, other money market instruments have limited liquidity risk as the market players are
unidirectional. Thus, examination of liquidity involves tracking of cash flow mismatches. For
measuring and management net funding condition, the use of maturity leader and calculation of
rising surplus or deficit at selected maturity dates is recommended as a standard tool.
Banks ought to embark on variance analysis, at least, once in six months to authenticate the
anticipations. Thus, cash outflows can be graded by the date on which liabilities fall due, the
earliest date a liability holder could exercise an early repayment choice or the earliest date
eventualities could be candied.
Banks should also develop and arrange for checking high value deposits (Apart from inter-bank
deposits) or more tracts of unpredictable liabilities. Additional cash flows coming out of
contingent liabilities in standard condition and the scope for an increase in cash flow during
periods of stress should also be estimated. It is quite likely that market crisis can generate
considerable increase in the amount draw from cash, loans/overdraft accounts, and contingent
liabilities like letters of credit.

17 | P a g e
2.4 LIQUIDITY GAP ANALYSIS
The change amid a firm’s assets and a firm’s liabilities, triggered by said assets and liabilities not
sharing the similar properties. It could be resulting in favourable or unfavourable depending on
whether the firm has more assets than liabilities or vice versa.
For banks, the liquidity gap can fluctuate in the course of the day as deposits and withdrawals are
made. This postulate that the liquidity gap is more of an instant picture of a firm’s liquidity risk,
rather than figures that can be worked over for a long period of time. To liken the periods of time
banks calculate the marginal gap, which is the variance between gaps of different periods.
Fig 2.1 Managing Liquidity Gap
Fig 2.1 Managing Liquidity Gap
2.5 WORKING CAPITAL POLICIES
According to Weston et al (1977) working capital policy borders on double sets of relationship
within the financial statements. Firstly, the policy question about the degree of total current
assets to be held. Although current assets fluctuate with sales, it should be noted that the

18 | P a g e
proportion of current assets to sales turn out to be a policy issue. The correlation amongst forms
of assets and means such assets are financed is the second policy.
The strategies and procedure that constitute working capital management assume that the
corporation has implemented some major decision. These decisions are major determinant of a
firm’s long-term profitability and have two important implications for working capital
management. Firstly, the product and/or services produced by a firm couple with sales forecasts,
which let working capital managers to approximate spontaneous levels of current assets and
current liabilities. Secondly, working capital managers seek to advance the wealth of
corporation’s common shareholders primarily by providing and maintaining corporate liquidity.
Hence it involves certain strategies, which takes towards deciding optimal level of working
capital (Neveu, 1989).
Working capital incorporates three types of strategies. The strategies are identified by their risk-
return characteristics.
2.5.1 AGGRESSIVE WORKING CAPITAL MANAGEMENT
Aggressive Working Capital strategies are associated with higher return and higher risk (Gardner
et al. 1986, Weinraub and Visscher 1998). These strategies seek to minimize additional liquidity
whiles meeting short-term requests. They accept greater risk of illiquidity or even insolvency in
order to earn larger return for the corporation. Aggressive assets management results in capital
being decreased in current assets versus long-term investments. This has the anticipation of
higher profitability but greater liquidity risk. To evaluate the degree of aggressiveness the current
assets to total asset ratio is used, with a lower ratio connoting a fairly more aggressive policy.
Aggressive financing policies make use of higher levels of usually lower cost short-term debt
and less long-term capital. Though lowering capital costs raises the risk of a short-term liquidity

19 | P a g e
difficult. The total current liability to total assets ratio is used to measure the degree of
aggressive financing policy, with a high ratio being comparatively more aggressive.
2.5.2. CONSERVATIVE WORKING CAPITAL MANAGEMENT
Conservative working capital strategies are concerned with the lower risk and return (Gardner et
al. 1986, Weinraub and Visscher 1998). These strategies minimize the risk of not being able to
finance impulsive asset growth and of defaulting on matching obligations. It offers liquidity in
excess of expected needs. However, excess liquidity result in the corporation holding assets that
earn little or no return. Hence, conservative strategies are called low-risk, low-return methods to
working capital management. The strategy places a superior percentage of capital in liquid
assets, but at the detriment of some profitability. If management adopts a conservative working
capital policy, the connected risks are less, but this type of policy yields the lowest return on total
assets which may affect attractive dividend payment to shareholders. The reason for this is the
firm has acquired more assets than it needed to support sales.
2.5.3 MODERATE LIQUIDITY MANAGEMENT
A moderate strategy is one which attempts to match assets and liability maturities based on
expected levels of the assets being financed. The strategy uses long-term funds to finance all
fixed assets and all permanent current assets. Short-term funds are used to finance fluctuating
current assets. It is difficult in practice to match the financing exactly, but the moderate policy
offers a balance method of financing. The best-balanced method would fund most of the
permanent current assets and all fixed assets from long-term financing and the remainder of the
permanent current assets and all the fluctuating current assets from short-term finance.
Some firms follow the ‘matching’ principle, in which the maturity structure of the finance
matches the maturity of the project or the asset, according to Arnold (2002).

20 | P a g e
2.6 LIQUIDITY MANAGEMENT POLICY
Financial institutions especially the Rural/community banks should have a formal liquidity
policy that is developed and written by the officials with the assistance of management in line
with the Banking Act and other regulations and should be approved by the Board. The policy
must be reviewed and revised by the strategic committee with the management preferably, every
quarter. The policy should be flexible and conform to the regulators requirements so that
managers may respond quickly to any unexpected happenings. A liquidity policy should
specifically state:
1. The officials accountable for liquidity management?
2. The legal framework in setting out the liquidity management policy
3. What is the general methodology of liquidity management? How will liquidity be monitored
or, in other words, what liquidity management tools will be used. What are the time frames to be
used in cash flow analysis, the level of detail, and the intervals at which the cash flow tools used
are to be updated.
4. The level of risk that the institution is ready to take in minimizing cash to improve
profitability. Specifically, the policy should establish minimums and maximums for total cash
assets and for the amount to be kept on-site.
5.How often pronouncements about liquidity should be studied, together with: expectations used
to improve the cash flow budget, the minimum cash requirement as described in daily cash
forecasting, and any of the established ratio targets.
6. The signatory authority limits of the liquidity manager should be agreed before excess cash is
deposited at another institution. Often liquidity decisions need to be made rapidly to avoid a
crisis; therefore the liquidity manager should have some authority. This authority should have

21 | P a g e
limits; for example, another signature should be required for unusually large transactions. If
liquid funds are not invested in another financial institution or other type of investment, then
there should be very specific policies on how excess funds are to be handled, such as who has
access to them and where they are to be kept.
7. What assets are measured to be liquid?
8. Recognised limits for the maximum amount to be invested in any one bank, to be in line with
limit exposure to a bank.
9. Who is responsible for access or creation of line of credit for short-term liquidity needs?
10. What satisfactory reasons or situations are there for accessing the line of credit?
2.6.1 LIQUIDITY POLICIES
Comprehensive and judicious liquidity policies set out the bases and amount of liquidity
obligation to guarantee that its acceptability for the extension of operations and to meet all
related statutory requirements. These strategies must be sustained by effective actions to
measure, attain and retain liquidity. Operational liquidity is the level of liquidity mandatory to
meet an institution’s day-to-day cash flow obligations.
Operational requirements are met through asset / liability management procedure for monitoring
cash flows, complemented by assets readily exchangeable to cash or by an institution’s ability to
borrow.
Reasons compelling an institution’s liquidity includes:
1 Cash flows and the scope to which anticipated cash flows from maturing assets and
liabilities match; and
2. The variety, consistency and permanency of funding sources, the ability to review or
supplant deposits and the capacity to borrow.

22 | P a g e
For statutory purposes an organization is required to hold a specific amount of assets classed as
“liquid”, based on its deposit liabilities. In rural banks 13% of the deposits liabilities are kept as
primary reserve and 30% as secondary reserve. Mostly, unnecessary dependence should not be
placed on these assets, or those legally pledged, for operational purposes other than as a
provisional measure, as lawfully they may not be accessible for encashment if wanted. In
evaluating the adequacy of liquidity, each organization needs to precisely and regularly measure:
1. The term profile of current and imminent cash flows created by assets and liabilities, both
on – and off – balance sheets;
2. The magnitude to which possible cash outflows are supported by cash inflows over a
stated period of time, maturing or liquefiable assets, and cash on hand;
3. The degree to which probable cash outflows may be maintained by the organization’s
capability to borrow or to access unrestricted funding sources; and
4. The degree of mandatory liquidity reserves required to be maintained.
Fundamentally, operational liquidity is acceptable if the institution’s imminent cash inflows
complemented by assets readily convertible to cash or by an institution’s capability to borrow are
adequate to meet impending cash outflow obligations. In this context, because the timing and
amount of these cash flows are not completely predictable because of risk such as credit,
defaults, and events including honouring customer drawdown’s on credit commitment, deposit,
redemptions, and payments, either on mortgages or term loans, comprehensive and judicious
liquidity strategies must deal with this uncertainty by carefully monitoring the maturity of assets,
guaranteeing assets are readily convertible to cash, or securing sources to borrow funds. Liquid
assets should have the following attributes.

23 | P a g e
1. Differentiated, outstanding maturities suitable for the organization’s specific cash flow
requirements;
2. Readily marketable or exchangeable into cash; and
3. Minimal credit risk
Having assets in liquid form for liquidity reasons will often comprise some loss of earnings
capacity relative to other investment prospects. Nonetheless, the primary objective with respect
to managing the liquid assets portfolio is to guarantee its value and exchangeability into cash.
Liquidity lines and funding facilities may also have a role within an organization’s liquidity
programme by assisting it to protect itself against impermanent complications that might occur
when honouring cash outflow obligations.
2.6.2 LIQUIDITY MANAGEMENT PLANNING
Liquidity management plan provides the procedure of liquidity planning which assess all
probable future liquidity needs. It keeps the financial situation of the firm by evolving a
predictable cash statement from a forecast of anticipated and possible cash outflows and
weighing different asset/management approaches to ensure that acceptable cash inflow will be
available to the institution to meet these requirements for a given period. The predictions may be
used on the current operations or the predicted future operations. Liquidity management plans
are very vital evolving the overall operating plans for the firm.
Liquidity management planning may be done on daily, weekly or monthly basis. The period and
occurrence of liquidity planning generally hinge on the scope of the firm and viewpoint of
management. Large firms prepares daily and weekly forecast. Small firms may not prepare
formal cash predictions due to lack of information and operational capacity. But, if they do it

24 | P a g e
should be done on monthly basis. As the firm grows and business procedures become
multifaceted, cash planning becomes unavoidable for its continuing success.
2.6.3 FACTORS INFLUENCING LIQUIDITY MANAGEMENT
The handling of liquidity is prejudiced by external and internal factors. While external macro-
factors are going against all companies, irrespective of industry, only companies within a precise
industry are affected from external micro-factors. Nonetheless, both chances and threats can arise
from any of them. At an organizational level a set of internal factors influences on all processes
and activities, including liquidity management, but in different conducts according to the
direction and relationships between them. Accordingly, an ability to construe and respond to the
changes in these environmental variables is critical (Johnson & Soenen, 2003) to the managers
who are involved in liquidity management.

25 | P a g e
Table 2.1 Factors Influencing Liquidity Management
1. External Factors What may affect Liquidity Management
External Level Factors i. Politics
ii. Business and Economics
iii. Between Industries Effects
iv. Legislation / Regulator’s standard
Micro Level Factors i. Customer needs / requirements
ii. Financing Requirement
iii. Technology
iv. Supplier covenants / Collaboration
v. Competitors effect
vi. Shareholders wealth
1. Internal Factors What may affect Liquidity Management
Internal Level Factors i. Management System / Methods / Practices
ii. Organisational behaviour
iii. Investment / Treasury policy
iv. Building financial capacity of Mgt. (Knowledge),
v. Operations management / supply Chain management
Micro Level Factors i. Employees financial capability (Knowledge)
ii. Credit policy / Collection management

26 | P a g e
2.6.4 LIQUIDITY CONTINGENCY PLANS
Banks must have Contingency Plans to assist them develop a policy to handle crisis and involve
measures for making up for cash flow shortages in emergency situations.
The bank’s capability to survive both momentary and longer-term disorders in its capacity to
fund some or all of its activities in a timely manner and at a realistic cost can be subject to the
tolerability of its prescribed Contingency Plans. As banks rely less on core deposits as a stable
funding source and rely more on secondary sources of funding, the need for contingency plans
becomes even more critical. Effective contingency plans should address two major questions as a
road map in the event of undergoing liquidity problems
1. Does management has a plan for handling crisis?
2. Does management have procedure in place for accessing funds in an emergency?
Management has to address these questions realistically in order to regulate how the banks may
fare under unusual adverse situations. In addition, management needs to classify and
comprehend the types of events that may cause liquidity contingency plan such as
1. The identification and definition of what constitutes a liquidity crisis
2. Early warning signs
3. Actions to be taken
4. Roles and responsibilities of persons/bodies within the bank
5. Channels of communication
6. Processes for communication with the Central Bank

27 | P a g e
2.6.5 INDICATORS OF EARLY WARNING SIGNS OF LIQUIDITY PROBLEMS IN
BANKING
Banks must project a set of indicators to recognize the appearance of increased risk or
susceptibilities in its liquidity risk position or possible funding requirements. Such early warning
indicators should recognize any negative tendency and cause an assessment and possible
response by management in order to alleviate the bank’s exposure to the developing risks. The
early warning sign would therefore signal impending liquidity problems.
Early warning sign indicators can be qualitative or quantitative in nature and may include
1. Unexpected and unusually high withdrawal of deposit or non-renewal of wholesale
funding facilities. This is monitored through the daily clearing outflows.
2. Increase in cash mismatches
3. Reduction of weighted average maturity of liabilities
4. Frequent occurrences of situations imminent or breaking internal or controlling
restrictions
5. Significant worsening of the bank’s earnings, assets quality and overall financial situation
6. Increase in loan maturities
7. When demand or request for extra security for credit exposures or that resist entering into
new transactions begin by the Counterparties
8. Increased in loan default and delinquencies
9. A fall in the level of bank’s core retail deposit below projected levels. This monitored
through the monthly cash flow levels
10. Difficult in assessing longer-term funding and also difficult planning short-term liabilities

28 | P a g e
Banks should have early warning indicators signal that would prompt them whenever there is a
breach.
2.6.6 MEASUREMENT OF LIQUIDITY RISK IN BANKING
As part of early warning signal of liquidity problems there is the need to measure the liquidity
risk to determine the level of risks the bank is likely to face.
Liquidity risk can be measured by two main ways: liquidity gap and liquidity ratios.
The liquidity gap is the difference between assets and liabilities at both current and forthcoming
dates. A positive gap between assets and liabilities is comparable to a deficit
Liquidity ratios are several financial statements ratios which should classify main liquidity
trends. These ratios reveal the fact that bank should be sure that suitable low-cost funding is
obtainable in a short time. This might involve holding a portfolio of assets that can be easily hold
significant capacities of stable liabilities especially deposits from retail depositors or keeping
credit lines with other financial institutions. The bank liquidity ratios include the following;
1. Primary Reserve Requirement
2. Secondary Reserve Requirement
3. Liquid Assets/Volatile Funds
4. Net Volatile Funding Dependence
5. Liquid Assets/Total Assets
6. Liquid Assets /Demand Deposits Ratio
7. Assets/ Liabilities Mismatches
8. Capital Adequacy
9. Credit/Deposit Ratio

29 | P a g e
2.7 LIQUIDITY PROFILE OF BANKS
The capability of an institution to change its assets into cash, with cash itself (i.e. Money) being
the most liquid asset.
Factors affecting Liquidity Profile of banks.
1. Normal situation
2. Bank specific situation
3. Market crisis scenario
Table 2.2 Reasons for Various Situations
Normal Situation - Establish yardstick
- Summary of Cash flow on- on / off balance sheet item
- Managing net finance requirement
Bank specific crisis - Worse benchmark case
- Non rollover of purchase funds
- Essential assets turned Non Performing Assets
- Downgrade in Ratings
- Projection of high cost of liquidity
Market Crisis Scenario - Severe market interruptions,
- Disappointment of major market players
- Financial crisis and defect
- Flight of unpredictable deposits
- Selling investments with vast discount entailing capital loss
Table 2.3 Liquidity profile of banks to be analyzed on static and dynamic basis

30 | P a g e
On Static Basis On Dynamic Basis
Assets, Liabilities, off balance sheet exposure
to be pegged on a particular day
Due importance to be given to seasonal pattern
of deposits / loans. Possible liquidity for new
loans, uncovered loan restrictions, loan policy,
possible deposit losses and withdrawals,
investment requirements, statutory
commitments etc.
2.8 LIQUIDITY TRENDS
The suitable stages of current assets and current liabilities for a firm, which decide its level of
working capital are the consequence of essential choices in relation to the firm’s liquidity and the
maturity structure of its debt. In turn, these conclusions are prejudiced by a trade-off between
profitability and risk. The determination of this examination is to improve a context for
assessing choices affecting the firm’s liquidity position, so that best results can be made more
readily.
2.8.1 TRADE-OFF BETWEEN LIQUIDITY AND PROFITABILITY
The extract trade-off between profitability and risk depends largely on the decisions makers’
attitudes towards risk. A recurring theme in many readings of liquidity has been in considering
the presence of two important goals – profitability and liquidity
Profitability has to do with the general reasons of owner wealth maximization. Liquidity on the
other hand has to do with safeguarding that the firm is able to satisfy all its financial
requirements and has suitable funding to carry on the long-term undertakings of the firm. Thus

31 | P a g e
the liquidity objective is thoroughly aligned with liquidity management while the profitability
objective replicates both short-term and long-term decision making. The trouble with the dual
objectives of profitability and liquidity is that, one tends to be a trade-off of the other. In other
words, decisions that tend to maximize profitability tend to minimize the likelihoods of adequate
liquidity and vice versa. Moreover, the way in which working capital items is accomplished can
have significant effect on both profitability and liquidity of the firm.
Smith (1980) suggests that equivalent monthly forecasts of liquidity and profitability could be
valuable in assessing trade-offs between these two management goals, in reflecting the inherent
uncertainty of the future, and in estimating the impact of certain working policies of the firm.
There is a short-run trade-off between liquidity and profitability. The more liquid a financial
institutions is, the lower are its return on equity and return on assets, ceteris paribus. Both assets
and liability contribute to this relationship.
Liquidity planning concentrates on assuring that directly existing funds are accessible at the
lowest cost. Management must normalize whether liquidity and default risk premiums more than
reimburse for additional risk on longer-term and lower-quality bank investments. If management
is effective, long-term earnings will exceed per bank’s earnings, as will bank capital and whole
liquidity (Cooper R. and Thomas R., 1998).

32 | P a g e
2.8.2 A RISK-RETURN ANALYSIS OF A FIRM’S WORKING CAPITAL POSITION
As Moyer, McGuigan & Kretlow (2003) note, before determining on a suitable level of working
capital investment, a firm’s management has to assess the trade-off between expected
profitability and the risk that it may be incapable to meet its financial commitments. Profitability
is measured by the rate of return on total assets and the risk that a firm will encounter financial
hitches is related to the firm’s liquidity position.
Determining the suitable amount of cash and marketable securities held by the firm (liquid
assets) involves a trade-off between risk and profitability. All other aspects are the same; the
lower the level of liquid assets the greater would be the risk of being unable to meet current
commitments. For this purpose, risk is defined as the possibility of technical insolvency.
Legally insolvency occurs each and every time the assets of a firm are less than its liabilities and
the net worth is negative. Technical insolvency, on the other hand, occurs whenever a firm is
unable to meet its cash commitments. The risk of running out of cash can be reduced or even
eradicated, of sequence by keeping a high amount of liquid assets. However, there is a cost
involved. This cost is the profit foregone on the investment of these funds in other assets.
However, cost is measured, it is clear that there exists a trade-off between risk and profitability.
2.9 COMPONENTS OF LIQUIDITY MANAGEMENT
2.9.1 CASH MANAGEMENT
Cash is the basic gauge of business health and has generally been defined as important tool
which enhances the prosperity and the ultimate survival of a business. The importance of cash
for everyday running of a firm cannot be overemphasized as an entity can continue on a short
time deprived of sale or profits, but cannot do so without cash. Cash flow is a function of the

33 | P a g e
period and amounts of money that flow into and out of the entity weekly and monthly basis. A
good cash-flow enables the business entity to meet its obligations on time.
The reasons for cash management is to regulate the optimum level of cash necessary for
operations and investment in marketable securities, which is suitable for nature of business
operation cycle (Emery et al., 2004; Gitman, 2009; Scherr, 1989). The problem of cash
management is balance the appropriate level of cash and marketable securities that reduce the
risk of insufficient fund for operation and opportunity cost of holding arbitrarily high level of
these funds. Thus, a firm’s ability to complement cash inflows with cash outflow, by using cash
budgeting and forecasting in formulating a cash management strategy is noteworthy.
Cash usually would not be required if it were not for the market deficiencies and resulting
transaction costs of urgently needing cash as short notice if the need arises and there is no
enough cash (Von Eije and Westerman, 2001).
Banks may need a minimum compensating balance to be kept in its clearing account in order to
give lending services. As in the case of rural banks the total deposits are kept as follows primary
reserve of 13% is kept to meet customers’ withdrawals, 30% is put under investments and the
remaining 57% is available for Loans and Advances. Therefore, there is the need to keep to the
to the statutory liquidity reserve requirements to be able to meet all the unexpected and unusual
customers withdrawals. Cash management should reflect the readiness of the meet unexpected
banking transactions.
2.9.2 INVENTORY MANAGEMENT
Inventory plays a significant part to regulate the activities in purchasing, producing and
marketing. Since inventory controls the level of events in a company, handling it tactically
contributes to profitability (Hill & Sartoris, 1992.)

34 | P a g e
Inventories are the least liquid of all current assets; it should therefore provide the highest yield
to justify the amount invested (Block and Hirt, 1992).
Inventory is held primarily to facilitate smooth production and sales operations. Inventory can
also be to guard against the risk of inconsistent changes in inventory price, demand and supply
factors. To be operative, management has to apply a structure to keep track of inventory on hand
and on order, information of lead times and its inconsistency, a reliable forecast of inventory
demand and realistic estimates of inventory holding, ordering and shortages cost (Stevenson,
1982).
2.9.3 CREDIT / LOANS MANAGEMENT
The supervision of accounts receivable is principally sway by the credit policy and collection
procedure. A credit policy requires commitment to value the credit worthiness of customers and
a collection process offers strategies to collect unpaid invoices that will reduce interruptions in
outstanding receivables (Hill & Sartoris, 1992; Richards & Laughlin, 1908) Bring into line the
receivable management between cash, inventory and payable management is relatively
stimulating and significant and spur on the researcher’s studies to integrate the liquidity
management components.
.
2.9.4 PAYABLES MANAGEMENT
Accounts payable are one of the main bases of unsecured short-term financing (Gitman, 2009;
Hill & Sartoris, 1992). Accounts payable are requirements (debts, liabilities) what will be paid at
a future time. They are measured as “current liabilities,” which means that the debt will be
settled with current assets during the current operating cycle. Accounts payable is used in
accrual-based accounting to record debts that have been incurred but not yet paid. It is part of the

35 | P a g e
expenditure cycle, which is a subsystem of both the cash management system and the accounting
system. The objective of managing payables is to ensure that the accounts payable process
disburses cash effectively and efficiently. The process should also maximize profitable cash
flow and contain controls that will guarantee that transactions are properly recorded and
reported. If fast-paying companies are at one end of the spectrum, then companies that “lean on
the trade” and use unpaid payables as a source of financing are at the other. Between these two
dissipations there is a more real, combined approach to payment renegotiation that takes into
account all aspects of the customer – supplier affiliation, from price and payment terms to
delivery time periods, product acceptance conditions, and international trade definitions.
(Buchmann and Jung, 2009).
As a result, solid cooperation between company and its suppliers will tactically develop
production lines and reinforce credit record for imminent growth.

36 | P a g e
CHAPTER THREE
METHODOLOGY
3.0 Introduction
The purpose of the research was to assess the liquidity management practices of some selected
rural banks in Ashanti Region and suggest measures that could be adopted to ensure sound
liquidity management practices in rural banks in Ashanti Region as a whole. The study covered
the period of five (5) years from 2009 to 2013
The chapter describes the research methods employed for the study, research design samples,
instrument used, data collection, data analysis and measures used to ensure the reliability of the
findings.
3.1 The research design
The research design according to Ghauri (1995) is the complete plan for relating the theoretical
research problem to appropriate and achievable experiential research. The works on research
methods with opposing importance deal with the question of which research methods are
appropriate or precise. The choice of research design is the complete strategic choice made with
the aim of coming up with a method that allows for answering the research problem in the best
possible way within the constraints.
Ghauri, Grohhaug and Kristianshlund (1995), argues that which method or methods to follow
rest on the research problem and its purpose. Yin (1994) describes four alternatives research
approaches: case research, experiment, survey as well as history and analysis of archival
information. According to Yin, the choice to use one of these methods rest on the form of

37 | P a g e
research question, the control a researcher has over actual behavioral procedures and the
attention on modern-day as different from past occurrences.
Yin offers that a case study is preferred where, the research question to be addressed is of the
type of how-why, when control of the researcher over the study is none or very immaterial and
the attention is on modern-day occurrence within a real life situation.
In view of the research problem and the distinguishing characteristics of the research methods,
using qualitative method as the main method, with emphasis on multiple case research method
are the best approaches that can aid the researcher to achieve the research objectives due to the
fact that Multiple case study is uneven that includes two or more observations of the same
occurrence. This variant enables replication —that is, using multiple cases to independently
confirm emerging constructs and proposals. It also enables extension—that is, using the cases to
disclose complementary aspects of the phenomenon.
3.2 Sources of Data
3.2.1 Primary Data
Primary data refers to data collected precisely for the study being expected. It is therefore
personally done by the researcher for a particular need as it is captured in the research objectives.
It is used when secondary data is not accessible or not adequate to help answer research
questions. For the purpose of this research, the researcher obtained the primary data through
semi-structured interview and questionnaires. The interview questions referring to the four key
respondents including General Manager(s), Head of Operations Head of Finance and Head of
Credit of the banks were prepared and conducted.

38 | P a g e
3.2.2 Secondary Data
The Financial Statements of the banks served as the main secondary data for this research as the
General Managers of the selected banks were cautious and reluctant to give out some vital
information due to the confidentiality of the banking activities. The audited financial statements
as a secondary data were given out for the research. These financial statements covered up to
December, 2013 financial year period beginning from 2009. The data contained in the financial
statements were used to assess the banks’ performances. The evaluation of the financial
performance was divided into five sections.
First, the researcher assessed the financial statements to determine the mismatches between the
cash and cash equivalent and the banks liabilities to determine their liquidity risks.
Second the liquidity ratios (current ratios and volatile ratio) liquid assets /volatile ratio were used
to assess the firm’s liquidity and ability of short-term financing. An analysis of liquidity
investment and financing was made in order to study how the firm’s investment are financed and
evaluated its liquidity position.
Third, the liquidity reserve requirements (primary and secondary ratios) capital Adequacy
position and other relevant ratios to determine the compliance of the selected banks to the Best
Standards.
Fourth, the Bank of Ghana’s BSD Prudential Returns (which is the accepted sector template)
were used to access the liquidity and maturity gap of the firm.
Fifth, the researcher used profitability ratios (profit/income ratio) to study the firm’s overall
efficiency in generating profit. The profitability ratio employed was the profit before tax.

39 | P a g e
3.2.3 Other Literature Sources
The researcher also made use of Bank of Ghana Bulletin, ARB Apex Bank Efficiency and
Monitoring Unit Report, Association of Rural Banks Monthly Reports and the company’s
bulletins to collect data about the banks.
3.3 Methods of Data Collections
The researcher resorted to the use of both questionnaire and interviews as the appropriate
techniques for the collection of the primary data. The two (2) data collection methods were
employed with the aim of achieving reliability, construct internal and external validity and also
to consolidate the high points of the various data collection methods. In the research,
interviewer-administered questionnaire were used. These techniques were adopted to ensure a
structured way of asking questions and also to enable more inquisitive into other relevant issues
as and when they crop up.
3.3.1 Questionnaire
The questionnaire was designed in the research for each of the managers of the selected banks
whose work directly affects the management of liquidity, namely the General Manager, and
departmental heads such as Finance, operations and credit which were personally administered
by them.
The research measured the response to indicate how the respondents’ made alternative choices in
each question. It indicated the extent to which the respondents agree or disagree with each of the
statements by ticking any of the following; Strongly Agree, Agree, Neutral, Disagree, and
Strongly Disagree.
After collection of the questionnaire data, it would then be analyzed as a way of generating an
overview of the firm’s management of its liquidity.

40 | P a g e
3.3.2 Interview
Jon Dowel et al (1995) outline an interview as any verbal communication between researcher
and the subject that offers information or further acceptance through a two-way discussion. The
interview questions were designed to corroborate the responses obtained from the questionnaire
and to offer further insights about the firm’s liquidity management. The questions contained in
the interviews needs the respondents to give their views on what liquidity management methods
they use how these methods are applied, the challenges they face, how these challenges on
respective aspects of liquidity management are solved among other things. Notes were taken by
the interviewer during the period. This was to ensure that the interview objectives of
authenticating the questionnaires were attained.
3.4 Population and Sample of the Study
Malhotra (2007) describes population as the total of all components involving some common set
of characteristics that involves the universe for the purpose of the research problem.
The population of the study were the selected banks and by extension their management and the
staff of the banks’. In order to obtain data relevant to achieving the objectives of the study,
however, this research adopts a purposive and convenience sampling techniques where the
sample is selected to include people of interest that were related to the liquidity management and
exclude those who were not directly involved for that purpose and thus data were collected from
the general manager and the departmental heads such as finance, operations and credit of each
bank’. The purposive study could only be obtained from the respective managers of the selected
banks’.

41 | P a g e
3.5 Methods of Data Analysis
Financial analysis and techniques involving financial statements and other prudential returns and
financial ratios such as liquidity reserves, credit/deposits and capital adequacy were calculated
using Excel and other software application to assist in the analysis and evaluation of the data
collected. These were put into graphical representations still with the aid of Excel, for the
purpose of identifying trends and relationship between the liquidity components. The banks’
liquidity policies were qualitatively evaluated to help in the analysis of their liquidity
management practices.
3.6 Ethical Considerations
The permission of the General Managers of the selected banks, Atwima Kwanwoma, Odotobri
and Bosomtwe were sought. The researcher also sought the permission from the Authorities of
ARB Apex Bank to use the bank’s efficiency and monitoring unit report (EMU). Participants
were given adequate explanation of the research and allowed to voluntarily participate. This was
done by the researcher.
3.7 Chapter Summary
The chapter discussed the methodology and the techniques for obtaining data for the study. It
looked at the research design, sources of data. Methods of data collections, the population and
the sample of the study as well as the methods employed for the analysis of data.

42 | P a g e
CHAPTER FOUR
DATA PRESENTATION, ANALYSIS AND DISCUSSION OF FINDINGS
4.0 INTRODUCTION
In the previous chapter, research design, the sample of the study, the data collection techniques,
the method of data analysis and the statistical procedure of the study were discussed.
In this chapter, data collected from the selected rural banks were analysed to assess the liquidity
risks and its causes, liquidity management practices and its compliance to the best standards in
the rural banking industry.
4.1 Liquidity Risks Assessment of the Selected Rural Banks
Liquidity risk is assessed by formulating a maturity profile of assets and liabilities, which
enables the organization to form a conclusion on liquidity mismatches. The fundamental problem
for a bank is to establish whether it will be able to meet its maturing commitment on the date
they fall due, it must prepare an expected cash-flow statement and assess the possibility of facing
any liquidity crisis.
Measuring liquidity is quite a challenging task and can be calculated through stock or cash flow
methods. The significant ratios, accepted across the banking industry are the other procedures of
determining liquidity risk which are as follows
1. Assets /liabilities mismatches
2. Liquidity reserve requirement (primary and secondary reserve ratios)
3. Liquid assets to Total Assets Ratio
4. Liquid Assets to Demand Deposits

43 | P a g e
The liquidity risks evaluations were taken from the selected banks from 2009 to 2013 documents
and reports which include Financial Statements, liquidity reserve requirements, external auditors
reports, Bank of Ghana on site and off site reports.
4.1.1 Assets / Liabilities Mismatches
This ratio assesses the maturity of the bank’s assets and liabilities on the short time up to three
months. It is desirable for the bank to hold more assets to cover maturing liabilities. In a situation
where mismatches may arise, the ratio should not exceed 25% of the maturing liabilities. It is
measured by comparing Assets (cash and cash equivalents) to liabilities (total liabilities-net
worth)
Atwima Kwanwoma Rural Bank assessment on the Assets/Liabilities mismatches from 2009 to
2013 as in Fig. 4.1 indicates that, throughout the five years assessment the liabilities exceeded
the assets creating mismatches but within the tolerable limit except in 2009. In 2009 the
liabilities exceeded asset by creating a mismatch of 39.60%. In the successive years the
mismatches were within the tolerable limit. In 2010 the assets /liabilities mismatches stood at
23.98%, it reduced to 21.27% in 2011 and increased marginally to 22.91% in 2012 and sharply
dropped to 17.51% in 2013 to indicate how resolute the bank’s assets could cover its maturing
liabilities.

44 | P a g e
Fig 4.1 Assets and Liabilities Mismatches in GHs– Atwima Kwanwoma Rural Bank
SOURCE: Field data, 2015
In reference to Fig. 4.2 Odotobri Rural Banks Assets/Liabilities mismatches within the five years
period showed a decreasing trend towards the tolerable limit of 25%. The bank’s assets/
liabilities mismatches in 2009 was 65.53%, it was reduced to 40.27% in 2010 and increased in
2011 to 43.15%. It dropped in 2012 to 39.48% and maintained the same percentage of 39.48%
in 2013. The five years figures did not matched the tolerable limit to show how best the bank’s
assets could have covered its maturing liabilities.
0
10000000
20000000
30000000
40000000
50000000
60000000
2009 2010 2011 2012 2013
ASSETS
LIABILITIES

45 | P a g e
Fig 4.2 Assets and Liabilities Mismatches in GHs- Odotobri Rural Bank Limited
SOURCE: Field data, 2015
Bosomtwe Rural Bank’s Assets and liabilities mismatches as in Fig. 4.3 were inconsistent under
the period under reviewed 34.59% was recorded in 2009, but was reduced to 27.08% in 2010 and
it increased to 37.28% in 2011. The mismatches percentage widened in 2012 to 49.86% and
reduced marginally to 45.96% in 2013. The bank defaulted in all the five years by not meeting
the tolerable limit of 25% of mismatches of its assets to cover maturing liabilities
0
5000000
10000000
15000000
20000000
25000000
30000000
35000000
40000000
45000000
2009 2010 2011 2012 2013
ASSETS
LIABILITIES

46 | P a g e
Fig 4.3 Assets and Liabilities Mismatches in GHs- Bosomtwe Rural Bank Limited
SOURCE: Field data, 2015
4.1.2 Liquidity Reserve Requirement
The maintenance of desirable liquidity is very fundamental to sound, safe and stable banking.
Serious liquidity challenges may eventually results in a run on a bank by the depositors
The liquidity reserve requirement of the rural banks consists of primary reserve ratio of 13% of
the banks total deposits comprising 8% in cash and bank balances with other banks and 5%
placement with ARB Apex Bank. And secondary reserve ratio of 30% of total deposits in the
form of Short term investment in government treasury bills and other investments in discount
houses.
It is a requirement by banks to send a weekly liquidity reserve return to Bank of Ghana for the
purposes of maintenance of prescribed liquidity to serve as buffer for the deposit liabilities as
0
5000000
10000000
15000000
20000000
25000000
30000000
2009 2010 2011 2012 2013
ASSETS
LIABILITIES

47 | P a g e
well as indicating the excess liquidity available for investment in assets and meeting other
obligations.
In assessing the maintenance of liquidity reserve requirement of Atwima Kwanwoma rural bank
from 2009 to 2013 the bank could not maintained the entire liquidity reserve requirement
throughout the reviewed periods. The liquidity reserve balances were far above the required
reserves especially the secondary reserve ratio, an average percentage of 35%, 64.3%, 65.3%,
64.93% and 69.55% were recorded in 2009, 2010, 2011, 2012 and 2013 respectively. The high
percentage in secondary reserve resulted in the reduction of liquidity risk by way of investment
and increase in profits of the bank.
The compliance to the liquidity reserve requirements of the bank from 2009 to 2013 was as
follows; in 2009 the compliance rates for primary and secondary reserve requirement were
96.10% and 66.67% respectively. The year 2010 recorded a primary reserve ratio of 66.67% and
secondary reserve ratio of 100.00%. The subsequent years saw an improvement in the reserve
requirements as in depicted in Fig. 4.4; in 2011 both primary and secondary reserves recorded
100% whiles 2012 and 2013 recorded 91.6% and 100% in primary and secondary reserves
respectively.

48 | P a g e
Fig. 4.4 Compliance rate of Liquidity Reserve Requirement- Atwima Kwanwoma Rural Bank
SOURCE: Field data, 2015
The liquidity reserve requirement of Odotobri Rural Bank was inconsistent from 2009 to 2013
especially the statutory primary reserve requirement of 13%. The liquidity reserve requirement
was assessed monthly from January to December each year to determine the compliance rate of
the statutory requirements. The bank defaulted three (3) times in 2009 in respect of primary
reserve requirement but maintained the statutory secondary reserve requirement of 30%
throughout the year. The year 2010 also saw similar trend in the liquidity reserve requirement.
Primary reserve was defaulted four (4) times but the secondary reserves were met throughout the
twelve months period. In 2011 the bank failed to meet the primary reserve ratio of 13% three (3)
times but the secondary reserve ratio was met throughout the year. There was an improvement
0
10
20
30
40
50
60
70
80
90
100
110
120
2009 2010 2011 2012 2013
Primary Reserve %
Secondary Reserve %

49 | P a g e
in 2012; only two (2) months were defaulted within the year. Nevertheless the secondary reserve
ratio was met in the twelve months period. The banks primary reserve was only met in ten (10)
times and defaulted two (2) times in 2013 but was able to meet the secondary reserve ratio
twelve (12) times in the year.
From the analysis the bank continues default in the primary reserve requirement poses a liquidity
risks to the bank and also contravenes section 33(1) of the Banking Act 2004 (Act 673) as
amended. The default was due to the short term investment made under the secondary reserve
requirement, throughout the five year period the banks secondary reserve was above the statutory
requirement of 30%. The minimum secondary ratio was 44.92% and the maximum was 52.03%.
For the bank to meet the primary reserve requirement at all times it needs to reduce its
investment in secondary reserves.
The compliance to the liquidity reserve requirements of the bank from 2009 to 2013 was as
follows; in 2009 the compliance rates for primary and secondary reserve requirement were 75%
and 100% respectively. The year 2010 recorded a primary reserve ratio of 66.67% and secondary
reserve ratio of 100.00%. The subsequent years saw an improvement in the reserve requirements.
In 2011 primary reserve was 75% and secondary reserves recorded 100% whiles 2012 and 2013
recorded 83.33% and 100% in primary and secondary reserves respectively as shown in Fig. 4.5

50 | P a g e
Fig.4.5 Compliance rate of Liquidity reserve requirement –Odotobri Rural Bank Limited
SOURCE: Field data, 2015
In evaluating the maintenance of liquidity reserve requirement of Bosomtwe rural bank from
2009 to 2013 the bank maintained both primary and liquidity reserve requirement throughout the
reviewed periods. The liquidity reserve balances were far above the required reserves especially
the secondary reserve ratio, an average percentage of 52.29%, 57.40.%, 48.42%, 40.80% and
40.80% were recorded in 2009, 2010, 2011, 2012 and 2013 respectively. The high percentage in
secondary reserve served as a liquidity risks measure and also as a means of generating profits
for the bank.
0
10
20
30
40
50
60
70
80
90
100
110
120
2009 2010 2011 2012 2013
Primary Reserve %
Secondary Reserve %

51 | P a g e
The compliance to the liquidity reserve requirements of the bank from 2009 to 2013 as in Fig.
4.6 was as follows; in 2009 the compliance rates for primary and secondary reserve requirement
were 83.33% and 100% respectively. The year 2010 recorded a primary reserve ratio of 83.33%
and secondary reserve ratio of 100.00%. The subsequent years saw an improvement in the
reserve requirements. In 2011 both primary and secondary reserves recorded 100% whiles 2012
and 2013 recorded 91.6% and 100% in primary and secondary reserves respectively.
Fig.4.6 Compliance rate of Liquidity Reserve Requirement –Bosomtwe Rural Bank
Limited
SOURCE: Field data, 2015
0
10
20
30
40
50
60
70
80
90
100
110
120
2009 2010 2011 2012 2013
Primary Reserve %
Secondary Reserve %

52 | P a g e
4.1.3 Liquid Assets to Total Assets
This measures the proportion of Total Assets being held in non-earning Liquid Assets (cash and
bank balances with other banks) and indicates the banks willingness to take liquidity risk. Banks
experiencing increasing trend into ratio means less liquidity risk and less profit whereas
decreasing trend means more liquidity risk and more profit.
In evaluating the liquid assets to total assets in 2009 as in Table 4.1 Atwima Kwanwoma Rural
Bank 7.80% was derived and indicated the banks willingness to take liquidity risks and generate
more profit. The 2010 figure increased to 11.01% as a way of liquidity risk awareness and
indicative of profit reduction. The trend followed in 2011 which saw a 14.80%, increased in cash
and bank balances to meet customer’s heavy and unexpected withdrawals.
There was a decreasing trend in percentage of liquid assets to total assets of 11.09% and 9.90%
in 2012 and 2013 pointing to more investments than liquidity risk concerns.
Table 4.1 Liquid Assets/Total Assets –Atwima Kwanwoma Rural Bank Limited
SOURCE: Field data, 2015
YEAR LIQUID
ASSETS
GHs
TOTAL
ASSETS
GHs
liquid to
total assets
%
2009 2,067,049.00 26,517,018.00 7.80
2010 3,729,889.49 33,849,733.35 11.01
2011 6,184,957.68 41,783,435.10 14.80
2012 5,792,338.69 52,198,622.89 11.09
2013 6,194,839.43 62,521,170.98 9.90

53 | P a g e
The liquid assets to total assets ratio of Odotobri Rural Bank showed an inconsistent pattern of
managing liquidity risks as depicted in Table 4.2 In 2009 the percentage of liquid assets to total
assets was 11.86% representing a small fraction of the total assets which displayed the banks
willingness to take liquidity risk. The 2010 figure shot up to 16.30% and its effect was to reduce
liquidity risk by improving the cash and bank balances to the detriment of making profit. The
trend continues by a reduction in percentage in the following year and increasing it in the
succeeding year, this manifest in 2011, 2012 and 2013 with 12.60%, 14% and 11.14% of liquid
assets to total assets ratio respectively.
Table 4.2 Liquid Assets/ Total Assets –Odotobri Rural Bank Limited
YEAR LIQUID
ASSETS
GHs
TOTAL
ASSETS
GHs
liquid to
total assets
%
2009 1,483,609.00 12,504,623.00 11.86
2010 3,174,940.00 19,472,996.00 16.30
2011 3,587,212.23 28,463,432.10 12.60
2012 5,459,696.36 40,293,386.81 14.00
2013 5,346,236.39 47,975,442.93 11.14
SOURCE: Field data, 2015
In evaluating the liquid assets to total assets in 2009 in respect of Bosomtwe Rural Bank 12.69%
was derived indicating the banks willingness to take liquidity risks and generate more profit.
The 2010 figure improved to14.27% as a way of liquidity risk awareness and indicative of profit
reduction. The trend followed in 2011which saw 14.65%, increased in cash and bank balances to
meet customer’s heavy and unexpected withdrawals as shown in Table 4.3

54 | P a g e
There was a decreasing trend in percentage of liquid assets to total assets of 10.31% and 9.54%
in 2012 and 2013 pointing to profit oriented through investments and willingness to take
liquidity risk.
Table 4.3 Liquid Assets/ Total Assets –Bosomtwe Rural Bank Limited
YEAR LIQUID
ASSETS
GHs
TOTAL
ASSETS
GHs
liquid to
total assets
%
2009 1,558,227.10 12,270,880.21 12.69
2010 2,390,194.48 16,743,243.27 14.27
2011 3,142,832.63 21,446,986.28 14.65
2012 2,769,127.39 26,850,234.92 10.31
2013 2,984,092.92 31,274,044.27 9.54
SOURCE: Field data, 2015
4.1.4 Liquid Assets to Demand Deposits
The ratio measures the availability of liquid funds to meet volatile funds of depositors and other
creditors. The prudential tolerable limit should not be less than 1 or 100%. Liquid funds
comprise cash balances, bank balances, bills and tradable bonds. Whiles volatile funds are
deposits with short term obligations that are not time bound and for which withdrawals cannot be
predicted, these include demand deposits, special project deposits and seed funds for crop
purchases.
It is therefore measured by liquid assets / demand deposits × 100

55 | P a g e
The prudential tolerable limit of 63.47% was achieved in 2009 in the books of Atwima
Kwanwoma rural bank falling below the required limit of 100% as shown in Table 4.4 It
indicates that less funds were left in the form of cash and bank balances to meet unexpected
withdrawals. The case of 2010 was no different from 2009 the ratio was 89.86%. It was
improved in 2011 by meeting prudential tolerable limit of 100%. The ratio attained was 106.44%
but the succeeding years of 2012 and 2013 failed to meet the tolerable limits, the bank had
83.94% and 73.35% respectively. Out of the five years assessment of liquid assets to demand
deposits, the bank was able to meet the tolerable limit only once. There should always be enough
cash balances to meet such deposits demand to avoid unexpected liquidity risks.
Table 4.4 Liquid Assets/ Demand Deposits –Atwima Kwanwoma Rural Bank Limited
Prudential tolerable limit 100%
YEAR LIQUID
ASSETS
GHs
DEMAND
DEPOSIT
GHs
Liquid
Assets to
Demand
Deposit
%
2009 2,067,049.00 3,256,762.00 63.47
2010 3,729,889.49 4,150,670.92 89.86
2011 6,184,957.68 5,810,460.15 106.44
2012 5,792,338.69 6,899,884.34 83.94
2013 6,194,839.43 8,445,189.99 73.35
SOURCE: Field data, 2015
Odotobri rural bank achieved only once throughout the five years analysis of liquid assets to
demand deposits. In 2009 it was 67.25% below the prudential tolerable limit of 100% and it was
improved in 2010 which met the limit by achieving 112.25%. The subsequent year’s liquid assets

56 | P a g e
to demand deposit ratios fell below the prudential tolerable limits. In 2011 it was 80.56% and
increase up to 84.32% in 2012 but dropped to 72.46% in 2013 but all fell below the statutory
limits as represented in Table 4.5
Table 4.5 Liquid Assets/Demand Deposits – Odotobri Rural Bank Limited
Prudential Tolerable Limit 100%
YEAR LIQUID
ASSETS
GHs
DEMAND
DEPOSIT
GHs
Liquid
Assets to
Demand
Deposit
%
2009 1,483,609.00 2,205,857.00 67.25
2010 3,174,940.00 2,828,262.00 112.25
2011 3,587,212.23 4,452,371.83 80.56
2012 5,459,696.36 6,474,874.02 84.32
2013 5,346,236.39 7,377,236.24 72.46
SOURCE: Field data, 2015
The prudential tolerable limit of 99.28% was achieved in 2009 in respect of Bosomtwe rural
bank falling below the required limit of 100% as in Table 4.6. It indicates that more funds should
be left in the form of cash and bank balances to meet these unexpected withdrawals. The
situation in 2010 improved to achieve the prudential tolerable limit with the ratio of 109.11%
exceeding the statutory limit of 100%. It fell to 93.04% in 2011 by not meeting the prudential
tolerable limit of 100% and went further below the tolerable limits in 2012 and 2013.The bank
had 63.04% and 61.73% respectively. Out of the five years assessment of liquid assets to demand

57 | P a g e
deposits, the bank was able to meet the tolerable limit only once. There should always be enough
cash balances to meet such demand deposits to avoid unexpected liquidity risks.
Table 4.6 Liquid Assets/ Demand Deposit –Bosomtwe Rural Bank Limited
Prudential Tolerable Limit 100%
YEAR LIQUID
ASSETS
GHs
DEMAND
DEPOSITS
GHs
Liquid
Assets to
Demand
Deposit
%
2009 1,558,227.10 1,569,252.55 99.28
2010 2,390,194.48 2,190,475.88 109.11
2011 3,142,832.63 3,377,712.63 93.04
2012 2,769,127.39 4,392,519.51 63.04
2013 2,984,092.92 4,833,559.13 61.73
SOURCE: Field data, 2015
4.2 The Respondents’ Assessment of the Causes of Liquidity Risks
The causes of liquidity risks were due to wide variety of economic conditions in general but in
particular it pertains to the nature of operations of the rural banking industry and basically based
on the factors that affect liquidity management processes. Several factors were identified by the
researcher from the bank officials to establish its effect on the liquidity risk.
4.2.1 From the respondents the causes were identified as follows: Unexpected and unusual
high withdrawals of deposits by customers were strongly agreed by all the selected banks
officials as the major cause of liquidity risk. Customers have the right to withdraw their deposits
at any given time especially with the demand deposit which have no time bound. However other
deposits products which have time bound could also be withdrawn provided it falls within

58 | P a g e
withdrawal periods. The intensity of the withdrawal by the customers within a particular period
may affect the liquidity of the banks if it is not anticipated. If measures are not put in place to
curtail such unexpected and unusual withdrawals it will have a huge impact by way of run on the
banks.
The non-renewal of wholesale funding facilities to the bank could be a cause for liquidity
risk. The denial of the bank of such facilities could cause a liquidity risk due to over dependence
of such facilities to support its operations. All the banks agreed on the score that such outcome
could cause liquidity risk due to over reliance of such facilities especially when it have been
factored into the work plan of the bank.
Another issue that causes liquidity risk was withdrawals exceeding deposits daily, when such
situation happens it creates a warning sign to the banks of imminent liquidity crisis. All the
selected banks strongly agreed to the fact that it has potential to cause liquidity risk. Even though
it might not happen to all the bank branches of the banks but in aggregation the net effect could
be withdrawal exceeding deposits thereby affecting the liquidity position of the banks.
Decreasing maturities of deposits causes liquidity risk which affects banks in their daily
operations. When the maturity dates of the deposits are near completion it causes liquidity risk
since in no distance future the deposits will be matured and the implication is to have enough
liquidity to service the maturing deposits. All the selected banks evaluated agreed to some extent
the impact such situations had on the liquidity of the banks.
All the selected banks strongly agreed on the one of main causes of liquidity risks in respect of
the Rise in request to redeem fixed term deposits by the customers. If it becomes a source of
withdrawal of deposit then it creates liquidity risk to the banks. Redemption of fixed term

59 | P a g e
deposits before its maturity dates is allowable but it comes with condition that the interest paid
will be discounted. But the unplanned situation affects the liquidity of the banks.
Increasing retail advances faster than projected also causes liquidity risk. The selected banks
have different views about this. Two banks were of the view that increasing in such facilities
would affect its liquidity and therefore would not attempt to do that whiles the other bank was
neutral about that.
Larger than expected drawdown of committed facilities was another major cause of liquidity
risks. These are the approved overdraft facilities and other commitments that bank had accepted
to honour to its customers. When such committed facilities are unexpectedly drawdown by the
greater number of the beneficiaries then it becomes a liquidity risk since it is larger than
expected. The three selected banks strongly agreed that such cases has a potential to derail the
liquidity management practices of their banks
Finally the three selected banks strongly agreed that increased loan facilities and delinquencies
had a key role to play in the liquidity risk of the banks. Granting more than loans affects the
liquidity of the banks. When more of the customer’s deposits are given as loans (credit/deposits
ratio of 70%) then there is the tendency to face liquidity challenges based on the recovery rate.
Non-payments of loans lead to loan delinquencies and non-performing assets thereby eroding the
capital of the banks and impede their progress. It creates overdue loans, high non-performing
loan ratio and greater loss category to Total Non-Performing Loan (NPL) ratio. The selected
banks that were assessed mentioned poor credit administration, high credit/deposit ratio and high
provision for bad debt as the causes of liquidity risks of the banks.

60 | P a g e
4.2.2 The Systems put in Place to Detect Early Warning Signals of Liquidity Risks
Early warning signal indicators can be qualitative or quantitative in nature and may include the
following:
1. Unexpected and unusually high withdrawal of deposit or non-renewal of wholesale funding
facilities. This is monitored through the daily clearing outflows.
2. Increases in cash mismatches
3. Reduction of weighted standard maturity of liabilities
4. Recurrent events of positions impending or breaking internal or controlling limits
5. Important worsening in the bank’s earnings, assets value and general financial situation
6. Increase in loan maturities
7. When demand or request for additional security for credit exposures or that repel entering into
new transactions begin by the Counterparties
8. Increased in loan default and delinquencies
9. A fall in the level of bank’s core retail deposit below projected levels. This monitored through
the monthly cash flow levels
10. Difficult in assessing longer-term funding and also difficult planning short-term liabilities
Banks should have early warning pointers that signal whether there had been a breach to
warrant early solutions.
In assessing the systems put in place to detect early warning signs of Atwima Kwanwoma Rural
Bank. The bank enumerated the following processes that had been put in place to detect such
early signs of liquidity risks. They mentioned customised daily liquidity reports which enable all
the branch managers to detect any liquidity shortfalls for immediate action by the Head office.
Daily examination of their end of day cash balances and the deposits balances to enable the Head

61 | P a g e
of Treasury to determine liquidity position of the bank ensure adequate supply of cash to the
branches for operational purposes and detect frequent occurrences of positions close to or
contravening internal or regulatory limits.
Odotobri Rural Bank assessment on liquidity risks are detected by the excess withdrawals by the
customers, increase in percentage of high delinquent loans, decline in customers deposits,
premature redemption of the banks investments and other determinants of liquidity risks that the
banks attention may be drawn, The banks Treasury department has the responsibility to ensure
that any happenings of the above mention signals would be dealt with immediately.
In the of case of Bosomtwe Rural Bank the detection of early warning signal largely depends on
the default rate of liquidity reserve requirement and other factors like reduction of weighted
average maturity of liabilities, frequent occurrences of positions close to or violating internal or
controlling limits, substantial worsening in the bank’s earnings, assets value and general
financial situation and Increase in loan maturities.
4.2.3 The respondents’ Solutions to the liquidity risks
From the respondents’ they had put in place some mechanisms to solve the early warning signal
of the liquidity risks detected. The banks have almost the same solutions to the liquidity risks as
a financial institutions operating under the Banking Act, 2004 (Act 673) as amended.
The banks’ Treasury unit regularly monitors liquidity position of the bank through statutory
liquidity reserves requirement by Bank of Ghana (primary and secondary reserve ratios of 13%
and 30%) and other liquidity regulatory requirements.

62 | P a g e
The banks’ have an Assets and Liabilities Committee (ALCO) which comprises the General
Manager, heads of department including operations, finance, credit and treasury to oversee the
overall liquidity management of the bank which enable the bank to deal with any early warning
signals of liquidity risks. Actions like enhancing deposits mobilisation, proper credit
administration, meeting liquidity reserve requirements, reinforce sourcing of external funding for
capital expenditure and any other measures that would mitigate liquidity risks.
4.2.4 The banks policies on liquidity risk management
From the respondents’ the banks have policies on the liquidity management that enhance their
operations. These policies are operational guidelines that regulate the liquidity management
practices.
In assessing the banks policies on liquidity management, it became clear that all the banks had
similar guidelines in their operations. The major policies were as follows
1. That the bank should at all times meet its statutory liquidity reserve requirements
(primary and secondary reserves ratios of 13% and 30% respectively)
2. Credit/deposits ratio should not exceed 60%
3. Branches should operate within insurable cash limits at all times (cash in transit, cash in
cubicle, cash in safe and fidelity guarantee)
4. Adherence to internal control on liquidity management
5. Liquidity management plan
6. Liquidity contingency plan
All the banks liquidity management policies were almost the same but its implementation were
different from each bank depending on the situation on hand. The Bank of Ghana’s Other
Financial Institutions Supervision Department (OFISD) Examination reports 2009-2013 of all

63 | P a g e
the banks indicated on each banks shortfall on the liquidity management policies. They either do
not have liquidity management plan and/or liquidity contingency plan which epitomise the
overall liquidity management policies of the banks.
4.3 Liquidity Management Practices
Financial institutions especially the Rural/community banks have a formal liquidity policy that is
developed and written by the officials with the assistance of management in line with the
Banking Act and other regulations and approved by the Directors as indicated by the
respondents’. The policy is reviewed by the strategic committee with the management
preferably, every quarter. The liquidity management policy should be flexible and conform to the
regulators requirements so that managers may react quickly to any unforeseen events.
4.3.1 Details of the banks liquidity risk management
The liquidity risk management of the selected banks were primarily based on the policies the
banks had developed in respect of the Banking Act, regulations and liquidity related issues.
In view of this, the researcher found out that the details of all the selected banks’ liquidity risk
management for the study were based on any of the following;
1. The officials responsible the for liquidity management
2. The legal framework in setting out the liquidity management policy
3. The methodology of liquidity management? How will liquidity be monitored or, in other
words, what liquidity management tools will be used. What are the time frames to be used in
cash flow analysis, the level of detail, and the intervals at which the cash flow tools used are to
be updated.

64 | P a g e
4. The level of risk that the establishment is arranged to take in minimizing cash to improve
profitability. Specifically, the policy establishes the minimums and maximums for total cash
assets and for the amount to be kept on-site in respect of treasury management.
5. How often should decision about liquidity should be revised, comprising: expectations used to
improve the cash flow budget, the minimum cash obligation as described in daily cash
forecasting, and any of the recognized ratio targets.
6. The signatory authority limits of the liquidity manager should be sanctioned before cash could
be deposit at another organization. Often liquidity decisions need to be made rapidly to avoid a
crisis; therefore the liquidity manager should have some authority. This authority should have
limits; for example, another signature should be required for unusually large transactions. If
liquid funds are not invested in another financial institution or other type of investment, then
there should be very specific policies on how excess funds are to be handled, such as who has
access to them and where they are to be kept.
7. Conventional ceiling for the maximum amount to be invested in any one bank, to limit
exposure to liquidity risk
8. The officials responsible for accessing or establishing a credit line for short-term liquidity
requirements and the adequate reasons or circumstances for accessing the line of credit
4.3.2 The key players of the liquidity management of the banks and their roles
The key players mentioned by the selected rural banks as part of the liquidity management were
the General Manager, Head of operation, Head of finance, Treasury Officer and to large extent
the Branch Managers. All the key players are members of the Assets and Liabilities Committee
(ALCO) whose responsibility is to manage the liquidity.

65 | P a g e
The roles they played were given by the banks as that all the key players’ works hand in hand to
ensure compliance of statutory liquidity reserve requirement by investing idle funds in short term
investment at competitive rates, review liquidity reports. The treasury manager ensures that cash
balances of the branches and the clearing account balances are collated every morning and
handed over to the Head of operations for necessary action. The branch managers have the task
to mobilise deposits and ensure adherence to the liquidity reserve requirement and sound credit
administration. Above all the ALCO manages the liquidity in compliance to the statutory
requirement by making sound investments that would eradicate or minimise liquidity risk.
4.3.3 Detail description of liquidity management practices of the banks
In giving out the detailed description of the liquidity management practices of the banks, Atwima
Kwanwoma Rural Bank indicated that deposits mobilisation drive was the key issue that they
looked out for throughout the branches. The next step was to ensure sound investments on the
deposits mobilised in short term investments having ensured that the statutory liquidity reserve
requirements were met. The bank effectively used the ALCO to determine all the liquidity
management practices.
Odotobri Rural Banks uses the same liquidity management practices as above but in their case
they ensure that they reduced capital intensive projects when there are signs of liquidity risks.
Bosomtwe Rural Bank’s liquidity management practices blend the two previous banks systems
by using its Treasury Officer as the key personnel in collating the cash and bank balances to
liaise with other management team for any liquidity strategies.

66 | P a g e
4.3.4 The liquidity management plans of the banks
Liquidity management plan provides the procedure of liquidity planning that measure all
possible future liquidity requirements. It keeps the financial condition of the banks by evolving
an expected cash statement from a forecast of expected and potential cash outflows and
considering other asset/management approach to ensure that sufficient cash inflow will be
available to the banks to meet these requirements for a given period.
The selected banks liquidity management plan as indicated by all the were the adherence to the
liquidity reserve requirements by meeting the primary reserve ratio of 13% and ensuring more
would be invested in than the required secondary reserve ratio of 30% and invest lesser amount
in Loans and Advances about 45%. It means that in times of liquidity crisis or in expectation that
there would be a detection of an early warning signal the funds could easily be mobilised to meet
the liquidity shortfall. But when the loans are in higher percentage than short term investment it
would be difficult to mobilised funds through loan recovery in liquidity crisis when the facilities
are committed by the banks.
The estimates may be used on the current procedures or the expected future operations. Liquidity
management plans are very essential in evolving the general operating plans for the bank.
4.3.5 Liquidity Contingency Plans of the Banks
The liquidity Contingency Plans addresses the approach for handling crisis and includes
measures for building up cash flow deficits in urgent situations. The bank’s capability to survive
both temporary and longer-term interruptions in its ability to fund some or all of its activities in
an appropriate manner and at a realistic cost can depend on the sufficiency of its prescribed
Contingency Plans. That is the road map when experience liquidity challenges.

67 | P a g e
In assessing the selected banks on the liquidity contingency plan the researcher observed that
there was no comprehensive document that captures the entire road map to handle liquidity
stressed situation.
Even though they have Assets and Liabilities Committee (ALCO) in place to deal with the
liquidity management of the banks, it is not enough to deal with critical situation in liquidity
crisis. The banks need formalised liquidity contingency plan to handle any liquidity stressed
situation.
4.3.6 Description of elements in the banks contingency plans
In addition, management identified and understood the types of events that may warrant the use
of liquidity contingency plan such as
1. The identification and definition of what constitutes a liquidity crisis
The banks agreed on non-availability of sufficient funds to meet customers’ daily withdrawals,
high overdue loans and poor internal control systems pertaining to liquidity
2. Early warning signs
The early warning signs were identified by the selected banks as suppression of cash, inability to
meet liquidity requirement (primary and secondary reserve ratios), rise in demand from
customers in terms of deposit withdrawals
3. Actions to be taken
The selected banks strongly agreed on intensification of deposits mobilisation, embarking on
serious loan recoveries, cost reduction, defer all capital intensive projects and look for other
sources of funding.

68 | P a g e
4. Roles and responsibilities of persons/bodies within the bank
The Assets and Liabilities Committee (ALCO) has been mandated to deal with such situation.
They are therefore the key players of the banks liquidity management, which includes the
General Manager, Head of Operations, Head of Finance, Treasury Officers and Branch
Managers
5. Channels of communication
The selected banks depends on the issuance of memorandum from the board of directors or the
General Manager to the Heads of Departments and the branch managers
6. Processes for communication with the Central Bank
The banks agreed mode of communication to the central bank would be through letter from the
Board Chairman countersigned by the General Manager (Section 32 of Banking Act 673 as
amended) on behalf of the bank for non-compliance of liquidity reserve and the on-site
examination exist meetings by the OFISD of Bank of Ghana will serve as a communication. The
entire procedures are events that may trigger liquidity contingency plan
4.4 The effects of Liquidity Management Compliance of the Banks to the Best Standards
The liquidity management compliance has to be compared with the best practice or standards to
determine its reliability. There are components that were stated for the banks to agree or
otherwise to determine the compliance of liquidity management to the best standards.
4.4.1 Compliance to Primary Reserve Requirements
All the selected banks strongly agreed to the compliance of primary reserve requirement of 13%
(cash and bank balances with other banks 8% and 5% deposit with ARB Apex Bank Limited) as
it is statutory requirement and non-maintenance attracts sanctions from Bank of Ghana

69 | P a g e
4.4.2 Compliance to Secondary Reserve Ratio
The banks strongly agreed to the compliance of secondary reserve requirement of 30% in short
term investments both in government treasury bills and discount houses. It is a statutory
requirement and non-maintenance attracts sanctions from Bank of Ghana
4.4.3 Compliance of Capital Adequacy
The maintenance of a minimum capital adequacy of 10% by a bank prescribed in section 23(1)
of the Banking Act, 2004 Act (673) as amended was strongly agreed by the banks as compliance
to best standards. Capital Adequacy is measured by the Adjusted Capital over Adjusted Assets
Base multiple 100. The purpose is to ensure that the prescribed capital cushion is provided for
risks assumed by the bank
4.4.4 Meeting customers’ withdrawals
The banks strongly agreed that at all times banks should meet their customers’ withdrawals
where they are within their mandate. The inability of the banks to honour the customers’
withdrawal due to liquidity challenges may lead to run on the bank that all the depositors seek to
withdraw their funds at the same time from the bank because they fear it will be unable to make
withdrawals in the near future. And the consequence would be into solvency problems.
4.4.5 Sound credit management practices
It was strongly agreed by the selected banks that compliance to sound credit management
practices serve as a best standard of liquidity management. Poor credit administration is a major
cause of liquidity risk. Investing depositors funds in loans and advances needs good loan
appraisal and recovery procedures to avoid loans turning delinquent with high nonperforming
assets that affects the liquidity position

70 | P a g e
4.4.6 Strong internal control
Strong adherence to management policies on liquidity management practices is the best standard
to be complied with. The selected banks totally agreed on this premise that to have a sound
liquidity management practices, banks needs to have systems in place to check its compliance.
4.4.7 Sound Investment of Idle Funds
Compliance to sound investments is the best liquidity management practice that meets the best
standards as strongly agreed by the banks. Investing idle funds in a risk free short term
investment with competitive Treasury bill rates. Such investments could be redeemed as and
when liquidity challenges arises.
4.4.8 Sound investment practices
Two banks strongly agreed and the other one only agreed this statement as a best standard to
liquidity management practices. The banks could choose to invest more in secondary reserve or
loans and advances and vice versa. Despite the riskiness of loans, a better and sound credit
administration can make investments in loans better than short term investments.
4.4.9 Operating within insurable limits
Risk transfer is a way of avoiding or mitigating risk and therefore operating within insurable
limit is the best standards in liquidity management. The selected banks strongly agreed to this
statement. There should be proper controls on the cash management to ensure all cash insurance
such as cash in safe, cash in cubicle; cash in transit and fidelity guarantee are within its limit.
Since in event of unexpected happens the insurance company would indemnify the affected bank
the limit of the insurance. In case the cash is above the insurable limit then the bank will lose the
difference.

71 | P a g e
Reconciliation of treasury register as an important best standard but was only agreed by the
banks. It helps to maintained the actual balance the will make the banks transactions accurate.
4.4.10 Regular cash count
Physical cash count is the best standard practices to liquidity management. The selected banks
strongly agreed that regular cash count reveals any overs or shortage in the cash and there by
showing the true cash balance.
4.4.11 Sound specie management practices
Specie movements entail a lot in the liquidity management practices of the banks. Its rules must
be strictly adhered to. The use of police guard, specie officers, and drivers in charge must be well
trained and any other relevant issues that assist the maintenance of the movement of the specie to
its destination. The selected banks strongly agreed to its compliance since good practices would
assist the banks by way of protecting the banks cash movements.
4.4.12 Occurrence of overs and short
Persistent overs and short has a tendency to affect the banks liquidity. The banks only agreed that
it serves as compliance to the best standard. Its net affects might be minimal but in aggregation it
may rise and therefore affect the overall liquidity. Proper controls have to be applied to avoid
future occurrence.
4.4.13 Regular training for tellers
The banks that the researcher assessed agreed to the regular training for the tellers, to sharpen
their skills to deliver. The best standards to the compliance of liquidity management were indeed
training of the human capital involved.

72 | P a g e
4.4.14 Training for the players involved in management of liquidity
The selected banks agreed to the compliance of the best standards that training of players
involved in management of liquidity determines how well it is managed. They therefore need to
be trained and acquired special skills in treasury management to handle the liquidity
management of the bank.
4.5 Discussion of Results
Discussion of major findings the researcher identified in assessing the liquidity management
practices of some banks in Ashanti.
4.5.1 Liquidity Risks Factors
The study reveals that liquidity was the major problem in banking as it was evidenced by Assets/
Liabilities Mismatches and this pose a threat to banking operations. This confirmed what
(Kamath et el.,1985 Srinivasan& Kim, 1986) said, Kamath drew the attention of every
management to the proper right matching of their short term cash inflows and outflows. There
are possibilities of mismatch of current assets and current liabilities during this process, and
when not manage affect firm’s liquidity and profitability.
4.5.2 Liquidity management practices
The studies further reveal that the respondents’ lack comprehensive liquidity management
policies that contain proper liquidity management plan and contingency plan that would serve as
a road map in times of liquidity stressed up. This established what (Reason, T. 2008) said that
improving liquidity management is logically vital for companies to resist the impacts of
economic turmoil. And as (Lo, 2005) put it, capable liquidity management is necessary for

73 | P a g e
companies during economic boom and for this reason liquidity management is connected to all
aspect of managing current assets and current liabilities. Liquidity Management is not only to
protect organizations from financial upheavals but can be managed tactically to develop
competitive situation and profitability
4.5.3 Credit management practices
It was observed that sound credit management improves liquidity of the banks by way of low
default rate, more cash inflows, and increase deposits. This in effect builds customer confidence
and loyalty. The respondents credit/deposit ratio was generally within the statutory limit. This
confirmed what (Scherr, 1989) said giving credit enhances income but has its associated costs of
handling loans and the likelihood of bad debt. Therefore management have to set up control
mechanism over credit administration
4.5.4 Treasury and Investment Management
To forestall challenges of liquidity management it is prudent for the banks to establish sound
Treasury and Investment management Practices which would assist in the administration of the
bank’s cash flow as well as the creation and governance of policies and procedures that would
ensures successful management of risk This enable the banks to manage its deposits mobilised
and make a sound investment decisions. Especially the type of investment to make, where to
invest and the maturity dates of the investments. It also assisted the banks to source for long term
funds to finance capital intensive projects to avoid liquidity risk.
As confirmed by (Maseda & Iturralde, 2001) that the idea has a relation with monetary theory
because transaction and provision is a key goal in managing treasury.

74 | P a g e
4. 6 Chapter’s Summary
The chapter concentrated on reporting on the findings, analysed the data sought for using
relevant ratios, and discussed the analysed data in the light of the exiting literature, therefore
unearthing the strength in the liquidity management, as inferred from trends in the ratios
calculated, and other qualitative analysis made on the causes, management practices and
compliance to the best standards of liquidity on three selected rural banks in Ashanti region and
conversely unveiling the lapses and alarming areas spotted out in the management of liquidity.

75 | P a g e
CHAPTER FIVE
SUMMARY OF FINDINGS, CONCLUSION AND RECOMMENDATION
5.0 INTRODUCTION
This research is based on the liquidity management practices among Rural Banks in Ashanti
Region using three selected rural banks, namely Atwima Kwanwoma, Odotobri and Bosomtwe
as case study. The significance of liquidity management in an organisation cannot be over
emphasized and indeed has been the major reason for the collapse of several companies.
The research begins with an introductory chapter which deals with the background of the study a
statement of the problem, as well as the main objectives of the study. The chapter further
discusses the scope, overview of the methodology and the limitations the researchers
encountered. It finally closes with an organization of the study. The second chapter also review
existing literature. Chapter three which is the methodology of the study deals with the research
design, data collection methods and its analysis. The fourth chapter mainly looks at the
presentation and analysis of data gathered from research through the use of tables and charts.
This chapter finally summarises, draw conclusions and suggests recommendations from the
research.
5.1 Summary of Findings;
The research in summary revealed the following findings;

76 | P a g e
5.2. Liquidity Risks
The liquidity risks was examined by using the five (5) years (from 2009 to 2013) Financial
Statements, Liquidity Reserve Return (monthly), Monthly Prudential Returns, External Auditors
Long Form Reports and Bank of Ghana BSD Examination reports to determine the compliance
of the banks risks profile.
5.2.1 The methods used in assessing liquidity risks of the banks
In assessing the banks liquidity risks, the Assets/Liabilities Mismatches was used to determine
the maturity gap. A tolerable limit should not exceed 25% of the maturing liabilities. Almost all
the banks had their assets/liabilities mismatches exceeding 25% within the five years period
except Atwima Kwanwoma Rural Bank who had its maturity gap ranging from 2009 to 2013 as
39.60%, 23.98%, 21.27%, 22.91% and 17.51% respectively. The bank defaulted in 2009 but was
able to be within the tolerable limit of 25% from 2010 to 2013. Essentially 100% should be the
limit. The other banks assets/liabilities mismatches were as follows, Odotobri Rural Bank from
2009 to 2013 as 65.53%, 40.27%, 43.15%, 39.48% and 39.48% respectively failing to meet the
benchmark. Bosomtwe Rural Bank’s maturity gap from 2009 to 2013 as 34.59%, 27.08%,
37.28%, 49.86% and 45.96% respectively, all the figures were above the tolerable limit which
did not augur well for liquidity management. Among the three banks Atwima Kwanwoma
performed better for meeting the target four times.
5.2.2 Liquidity Reserve Requirement
The three selected banks performance on liquidity reserve requirement was determine through
the maintenance of primary and secondary reserves ratio of 13% and 30%. The liquidity risks of
the banks were evaluated by their compliance rate calculated within the twelve months period of
every year. The assessment reveals the following; Atwima Kwanwoma Rural Bank’s compliance

77 | P a g e
rate of the primary reserve ratio, 2009 (91.60%), 2010 (66.67%) 2011 (100%), 2012 (91.60%)
and 2013(91.60%) it indicates that in 2009 the bank defaulted once within the year and four
times in 2010. The secondary reserve requirement compliance rate was 75% in 2009 and 100%
from 2010 to 2013.
Odotobri Rural Bank’s compliance rates for primary reserve requirement were 2009 (75%), 2010
(66.67%), 2011 (75%), 2012 (83.33%), and 2013 (83.33%) the bank defaulted throughout the
review periods and the secondary reserve requirement from 2009 to 2013 was 100% throughout.
The banks secondary reserve requirement had an average per month in the year 2009 (48.64%),
2010 (47.39%), 2011 (48.79%), 2012 (47.28%) and 2013(49.98%) the bank could have divested
part of the secondary investment to augment the shortfall of the primary reserve requirement.
Bosomtwe Rural Bank had a compliance rates of primary reserve requirement under the review
period, 2009(83.33%), 2010(83.33%), 2011(100%), 2012(91.60%) and 2013(91.60%) defaulting
four times in the review period. The banks secondary reserve requirement compliance rate was
100% throughout the review period from 2009 to 2013. The bank could have divested part of the
secondary investment to augment the shortfall of the primary reserve requirement.
5.2.3 Liquid Assets to Demand Deposit
The measurement of liquid assets to demand deposit assisted the researcher to determine the
readiness of the banks to meet its volatile funds like demand deposit with short term obligations
that have no time bound. The prudential tolerable limit of 100% was required.
Atwima Kwanwoma Rural Bank from 2009 to 2013 recorded 63.47%, 89.86%, 106.44%,
83.94% and 73.35%. The bank met the required prudential limit in 2011 with 106.44% and
defaulted in the rest of the years. The liquidity risk was imminent in the review period

78 | P a g e
Odotobri Rural Bank from 2009 to 2013 posted 67.25%, 112.25%, 80.56%, 84.32% and 72.46%
respectively. The bank achieved the prudential limit of 112.25% in 2010 to meet its volatile
funds. The four times default indicates the lack of policy for liquidity.
Bosomtwe Rural Bank also defaulted four times in the review period from 2009 to 2013. The
bank attained 109.11% in 2010 to meet the tolerable limit. The liquid assets/demand deposits
from 2009 to 2013 were 99.28%, 109.11%, 93.04%, 63.04% and 61.73% respectively. This trend
showed lack of attention for liquidity risks.
5.3 The causes of liquidity risks of the selected banks
All the selected rural banks operate within the same industry and environment with similar
challenges. The causes of liquidity risks were due to wide variety of economic conditions and
other issues pertaining to the rural banking industry
5.3.1 The causes of liquidity risks of the banks were identified as the unexpected and unusual
high withdrawal of daily deposits. It is a major cause of liquidity risk in the banking industry.
Customers have the right to withdraw their deposits at any given time especially with demand
deposits which have no time bound.
The non-renewal of wholesale funding facilities to the bank also causes liquidity risks. The
denial of the banks of such facilities could cause a liquidity risk due to over dependence on it to
support its operations. It was noted that ARB Apex Bank had as a matter of policy ceased
granting overdraft facilities to support the rural banks operations.
Increased loan facilities and delinquencies plays a major in the liquidity risks of the banks. The
banks granting more loans have affected on their liquidity position besides non-payment of loans

79 | P a g e
had led to loan delinquencies and non-performing assets and thereby eroded the capital of the
banks.
Other causes like decreasing maturities of deposits, rise in request to redeem fixed term deposits
by customers, increasing retail advances faster than projected, larger than expected drawdown of
committed facilities which have the potential to create liquidity risks for the banks.
5.3.2 The banks policies on liquidity risk management
The respondents’ have policies on the liquidity management that enhances their operations.
These policies are operational guidelines that regulate the liquidity activities of the bank. The
banks major policies were the maintenance of the primary and secondary reserve requirements at
all times, the maximum credit/deposit ratio should not exceed 60%, operate within insurable cash
limit, adherence to internal control on liquidity management. The policies lack the liquidity
management and contingency plans.
5.4 Liquidity management practices
The researcher acknowledged the existence of the formal liquidity policy of all the selected
banks. It was developed and written by the officials of the bank with management in line with
the Banking Act and other regulations; it was flexible and conformed to the regulators
requirements so that managers would react quickly to any unforeseen events. It was sanctioned
by the Board of Directors. It was found out that the policies were reviewed by the strategic
committees of various banks every quarterly or half yearly

80 | P a g e
5.5 Effects of liquidity management compliance of the banks
The liquidity management compliance was compared with the best standards to determine its
reliability and acceptability of the banks liquidity management practices. Certain components
were used to determine the best standards.
5.5.1 Liquidity reserve requirements
Compliance to liquidity reserve ratio was based on the maintenance of both primary and
secondary reserve ratios of 13% and 30% as a statutory requirement. All the banks could not
comply with the standards in respect of primary reserve requirements within the assessment
period. Some years were defaulted marginally. However the secondary reserve requirement was
fully complied throughout the review period. The banks exceeded the required ratio. As a
requirement the banks should have redeemed some short term investments in secondary reserve
to augment the short fall of the primary reserve.
5.5.2 Other procedures that needed compliance to best standards
The researcher observed other measures that were compiled to the best practice such as meeting
customers withdrawals within the turnaround time, sound credit management practices by way of
appraisal, disbursing and monitoring the loans and advances granted, strong internal control
systems to ensure adherence to management and other regulatory policies, sound investment of
idle funds in risk free short term investment, sound investment practices in either short term
investments or granting of loans and advances
Other compliance issues were operating within the insurable limits, the basic cash insurance
including cash in safe, cash in transit; cash in cubicle and fidelity guarantee for the staff
especially the Tellers. Regular cash count to reconcile with the treasury books and the general
ledger, occurrence of overs and shorts and regular training for the tellers.

81 | P a g e
Other findings were embarking on sound specie management practices, the use of police guard,
specie officers and well qualified drivers coupled with proper cash movement documentation.
Training for the key players of liquidity management to enable them acquires special skills on
treasury management to handle liquidity issues.
5.6 Conclusion
Liquidity management is a significant part in banks financial management decision. The
capability of a firm to constantly operate in longer period depends on how it deals with liquidity
issue
An efficient and effective liquidity management practice should be underpinned by sound
investment practices, sound credit management, adherence to statutory liquidity reserve
requirements and strong internal controls. The rural banks studied had formalised liquidity
management policies to ensure effective liquidity issues that can assist to withstand the potential
liquidity risks. In spite of the established processes there existed lapses in the implementation
which should be resolved to improve liquidity management practices.
Banks do not survive just because they make profits but also their ability to remain solvent plays
a vital role in their sustainability. In other words, a business might report high accounting profits
but might face liquidity problems.
The study can generally be concluded that the selected banks had fairly good liquidity
management practices however; there is still room for improvement in some areas of their
liquidity management practices.

82 | P a g e
Measures to improve the liquidity management practices and to minimise the incidence of any
high liquidity risk have been outlined as recommendations.
5.7 Recommendations
In view of the analysis and findings in the previous chapter, the following recommendations
have been made to improve the selected banks’ management of their liquidity.
5.7.1 Sound Liquidity Management Practices
The policies on the liquidity management practices of the banks should be comprehensively
done. It should contain long term measures that would be able to withstand the liquidity risks.
The policies should include the elements of contingency plan to be followed when they are
stressed up in liquidity position. The assets and liabilities committee (ALCO) should be tasked
with an additional responsibility to draw up the contingency plan with the assistance of the board
subcommittee on finance. Further to this the banks liquidity risks profile of the banks needs to
be improved. The assets /liabilities mismatches of the banks were below the limit of 25%. The
liabilities exceeded the assets. The cash and cash equivalent position that makes up the assets
have to be conserved to be able to match the maturing liabilities.
5.7.2 Adherence to Statutory Liquidity Reserve Requirement
The statutory liquidity reserve requirement needs to be complied; the primary reserve
requirements of 13% and the secondary reserve of 30% should be kept at all times. The banks
needs to satisfy the primary reserve ratio before investing more in the secondary reserve in order

83 | P a g e
to boost the depositors’ confidence and allay their fears in not getting their withdrawals on time.
Funds must always be available to must the customers’ withdrawals
5.7.3 Sound Credit Management Practices
The general causes of liquidity are the unexpected and unusual high withdrawals and the
committed facilities granted to customers in view this there should be a sound credit
management policy by the banks that will regulate and monitor the quality of the loan portfolio
and to examine the incidence of defaults, classification, adequacy of provisions and progress in
recovery.
5.7.4 Sound Treasury and Investment Practices
To forestall challenges of liquidity management it is prudent for the banks to establish sound
Treasury and Investment management Practices which will assist in the administration of the
bank’s cash flow as well as the creation and governance of policies and procedures that would
ensure successful management of risk and also professional assets management in order to meet
the investment goals of the bank.
This will enable the banks to manage its deposits mobilised and make a sound investment
decisions, especially the type of investment to make, where to invest and the maturity dates of
the investments. It will also assist the banks to source for long term funds to finance capital
intensive projects to avoid liquidity risk.
5.7.5 Strong Internal Control Systems
Compliance to the best standards is quite good but constant review will be of great importance. It
needs to be done in every quarter by the Internal Control Department. The monthly reports from
the Association of Rural Banks (ARB) and the quarterly reports from Efficiency and Monitoring

84 | P a g e
Unit (EMU) of ARB Apex Bank and to the large extent annual reports from the Other Financial
Institutions Supervision Department (OFISD) of Bank of Ghana could be a guide to the banks
for shaping up their liquidity management practices.
The Internal Control Unit should also deal with regular cash count, reconciliation of treasury
books with cash position, operating within cash insurable limits, checking on Tellers efficiencies
and where necessary apply sanctions to instil discipline in cash management.
5.7.6 Application of Information and Communication Technology (ICT)
For the purposes of monitoring and controlling liquidity management practices there is the need
to network the banks activities so that its monitoring would be much easier. It reduces cost and
brings efficiency. The system will identify the defaulting branches of the banks and monitors the
cash limits and other transactions.

85 | P a g e
REFERENCES
Afza T and MS Nazir (2007). Working Capital Management Policies of Firms: Empirical
Evidence from Pakistan. Presented at 9th
South Asian Management Forum (SAMF) on February
24-25, North South University, Dhaka, Bangladesh.
Asiedu-Mante E. (2011) Rural Banking in Ghana 1st Edition
Arnold, G. (2002). Corporate Financial Management, 2nd
Edition. Pearson Education Limited,
London, UK.
Block S. B., Hirt G. A., (1992), Foundations of Financial Management, Richard D. Irwin Inc.,
Boston, Mass.
Cooper R. and Thomas R. (1998), - Bank Runs: Liquidity Costs and Investment Distortions. ll
Journal of Monterey Economics, Vol. 41, No. 1, pp. 27-38.
Eljelly, A. 2004.“Liquidity- Profitability Tradeoff: An empirical Investigation in an Emerging
Market”, International Journal of Commerce & Management, Vol 14 No 2 pp.
Emery, D. R., Finnerty, J. D., & Stowe, J. (2004). Corporate financial management. Upper
Saddle River, NJ: Prentice Hall.
Filbeck G and T Krueger (2005). Industry Related Differences in Working Capital Management.
Mid-American Journal of Business 20(2): 11-18.
Gardner MJ, DL Mills, and RA Pope (1986). Working Capital Policy and Operating Risk: An
Empirical Analysis. The Financial Review 21(3): 31-31.

86 | P a g e
Gitman, L.A (2005). Principles of Managerial Finance (11th
Edition). New York: Addison
Wesley Publishers.
Gitman, L. J. (2009). Principles of managerial finance (12th
ed.). Boston, MA: Pearson Prentice
Hall.
Hill, N. C., &Sartoris, W. L. (1992). Short-term financial management: text and cases (2nd
ed.).
New York, NY: Maxwell Macmillan International.
Johnson, R., &Soenen, L. (2003). Indicators of successful companies. European Management
Journal, 21(3), 364-369.
Kamath et al., 1985; Srinivasan & Kim, 1986. ‘Treasury Management versus Cash
Management’. International Research Journal of Finance and Economics. 19(2008), Pp.194, PDF
[Online]. Available at: http://www.bizresearchpapers.com/Paper%2019
Maseda & Iturralde, 2001. Srinivasan & Kim, 1986. “Treasury Management versus Cash
Management’. International Research Journal of Finance and Economics. 19(2008), Pp.194, PDF
[Online]. Available at: http://www.bizresearchpapers.com/Ppaper%2019
McInnes, A. N. S. (2002). Working capital management: theory and evidence from New Zealand
listed limited liability companies: a thesis submitted in partial fulfillment of the requirements for
the degree of master of commerce and management at Lincoln University. Unpublished Thesis
(M C M), Lincoln University, Lincoln, New Zealand.
Miles M. B. and Huberman A. M. (1994), Quantitative Data Analysis: An Expanded
Sourcebook, Second Edition, SAGE Publications, Thousand Oaks CA.

87 | P a g e
Moyer, R., Mcguigan, J., Kretlow, W. (2003), Contemporary Financial Management, 9th
Edition,
Thomson South-Western, Washington Dc.
Neveu, R. (1989), Fundamentals of Managerial Finance, 3K edition, South-Western Publishing
Co., Ohio, USA.
Pike, R, Neale, B. (2003), Corporate Finance & Investment: Decision and Strategies, 4th
Edition,
Pearson Education, Essex, UK.
Reason, T (2008). Preparing your company for recession. http://ezproxy.lincoln.ac.nz
Ross S. A., Westerfield R. W., Jaffe J.F. (1996). Corporate Finance, IRWIN, Boston, Mass.
Sartoris, W. L., Hill, N. C., &Kallberg, J. G. (1983). A Generalized Cash Flow Approach to
Short-Term Financial Decisions/Discussion. The Journal of Finance, 38(2), 349-360.
Scherr, F. C., (1989), Modern Working Capital Management, Text and Cases, Prentice-Hall
International Editions, Englewood Cliffs, New Jersey.
Smith K. (1980). Profitability versus Liquidity Trade-offs in Working Capital Management, in
Readings on the Management of Working Capital. New York: St. Paul, West Publishing
Company.
Richards, V. D., & Laughlin, E. J. (1980). A cash conversion cycle approach to liquidity
analysis. Financial Management, 9(1), 32-38.
Van Horne J. C., and Wachowicz J. M., (1998), Fundamentals of Financial Management,
Prentice Hall, Englewood Cliffs, NJ.

88 | P a g e
Von Eije J.H. and Westerman W. (2001), Multinational Cash Management and Conglomerate
Discounts in the Euro Zone, SOM, (Research Report No. 01E60, Review of International
Business, 2002),
Weinraub H.J. and S. Visscher (1998). Industry Practice Relating to Aggressive Conservative
Working Capital Policies. Journal of Financial and Strategic Decision 11(2): 11-18.
Weston J.F. & Brigham E.F. 1977 “Essentials of Managerial Finance” Illinois. The Dryden
press, pp. 261-76
KPMG Report on Liquidity Risk: 2012

89 | P a g e
APPENDIX 1
INTERVIEW GUIDE
I am an MBA final year student of KNUST School of business working on the thesis topic
“Assessing the liquidity management practices of some selected rural banks in the Ashanti
Region”
The objectives of the study are: To evaluate the general liquidity management practices within
the rural banking industry and to provide appropriate recommendations on how to improve the
liquidity management within the rural banking industry in Ghana. It is our expectation that the
findings of the study would immensely assist the rural banks particularly Atwima Kwanwoma
Rural Bank Limited, Odotobri Rural Bank Limited and Bosomtwe Rural Bank Limited in
assessing their liquidity management practices and contribute significantly to finance literature in
Ghana. This research is being carried out in partial fulfillment of the requirements for the award
of Masters of Business Administration (Finance Option) at the Kwame Nkrumah University of
Science and Technology. We would like to draw out your support in this request to obtain data,
which is useful for the study. The confidentiality of the information provided will be strictly
observed and will be used only for the study. In advance, thank you for your cooperation and
support for this study.
For the: General Manager(s)
Head of Operations
Head of Finance
Head of Credit

90 | P a g e
Section A: LIQUIDITY RISKS
1: Please kindly provide the following documents for the assessment and determination of your
bank’s liquidity risk from 2009 to 2013
A. Financial Statements
B. Monthly Prudential Returns
C. Liquidity Reserve Return- Monthly
D. External Auditors Long Form Reports
E. Bank of Ghana ON SITE Reports
2: Please indicate the extent to which you agree or disagree with each of the following
statements as the causes of liquidity risks in your bank.
Instructions: Please indicate the extent to which you agree or disagree with each of the
following statements by ticking one of the following; Strongly Agree, Agree, Neutral, Disagree,
and Strongly Disagree.
Statements Strongly
Agree
Agree Neutral Disagree Strongly
Disagree
A. Unexpected and unusual high withdrawal of
deposits
B. Non-renewal of wholesale funding facilities
C. Withdrawals exceeding deposits daily
D. Decreasing maturities of deposits
E. Rise in requests to redeem fixed term
deposits
F. Increasing retail advances faster than
projected

91 | P a g e
G. Larger than expected drawdown of
committed facilities
H. Increased loan facilities and delinquencies
I. Significant rise in undrawn committed
facilities
J. Please Specify Others;
3: What are the systems put in place to detect early warning signals of liquidity risks? _________________________________________________________________________________________________________________________________________________________________________________________________________________________________________________________________________________________________________________________________________________________________________________________________________________________________________
4: What are the solutions to the liquidity risks in your bank? _________________________________________________________________________________________________________________________________________________________________________________________________________________________________________________________________________________________________________________________________________________________________________________________________________________________________________
5: What are the bank’s policies on liquidity risk management? _______________________________________________________________________________________________________________________________________________________________________________________________________________________________________________________________________________________________________________________________________________

92 | P a g e
Section B: Liquidity Management Practice
6: What are the details of your bank’s Liquidity Risk Management?
______________________________________________________________________________
______________________________________________________________________________
______________________________________________________________________________
______________________________________________________________________________
7: Who are the key players of the Liquidity Management of the bank and their roles?
______________________________________________________________________________
______________________________________________________________________________
______________________________________________________________________________
______________________________________________________________________________
8: Give detail description of liquidity management practices of your bank
______________________________________________________________________________
______________________________________________________________________________
______________________________________________________________________________
______________________________________________________________________________
9: What are the liquidity management plans?
______________________________________________________________________________
______________________________________________________________________________
______________________________________________________________________________
______________________________________________________________________________
10: What are the liquidity contingency plans? (Road map when experience problems)
______________________________________________________________________________
______________________________________________________________________________
______________________________________________________________________________
______________________________________________________________________________
______________________________________________________________________________
11: Kindly describe the following elements in your liquidity contingency plans
a) Identification and definition of what constitute liquidity crisis
________________________________________________________________________
________________________________________________________________________
________________________________________________________________________
________________________________________________________________________

93 | P a g e
b) Early warning signs
________________________________________________________________________
________________________________________________________________________
________________________________________________________________________
c) Action to be taken
________________________________________________________________________
________________________________________________________________________
________________________________________________________________________
d) Roles and responsibilities of persons/ bodies within the bank
________________________________________________________________________
________________________________________________________________________
________________________________________________________________________
e) Channels of communication
________________________________________________________________________
________________________________________________________________________
________________________________________________________________________
f) Processes of communication with Bank of Ghana
________________________________________________________________________
________________________________________________________________________
________________________________________________________________________
12: Please indicate the level of compliance to the following standards of liquidity management.
Assign reasons for your choice.
Instructions: Please indicate the extent to which you agree or disagree with each of the
following statements by ticking one of the following; Strongly Agree, Agree, Disagree, and
Strongly Disagree
Statements Strongly
Agree
Agree Disagree Strongly
Disagree
REMARKS
A. Compliance to Primary Reserve
Requirement
B. Compliance to Secondary Reserve
Requirement
C. Capital Adequacy
D. Meeting Customers withdrawals
E. Sound credit management
practices
F. Strong internal control
G. Sound investment of idle funds
H. Sound investment practices
I. Operating within insurable limits
J. Reconciliation of treasury registers
K. Regular cash counts

94 | P a g e
13: If there are any special strengths or weakness of your banks’ liquidity management that you
feel should be included in its evaluation, please descried them briefly here
______________________________________________________________________________
______________________________________________________________________________
______________________________________________________________________________
______________________________________________________________________________
______________________________________________________________________________
______________________________________________________________________________
______________________________________________________________________________
THANK YOU VERY MUCH FOR YOUR TIME.
L. Sound specie management
practices
M. Occurrence of overs and short of
cash by Tellers
N. Regular training for Tellers
O. Training for the players or staff
involve in management of liquidity

95 | P a g e
APPENDIX 2
ASSETS AND LIABILITIES MISMATCHES OF THE SELECTED BANKS 2009-2013
Assets and Liabilities Mismatches from 2009 to 2013 of Atwima Kwanwoma Rural Bank Limited
YEAR ASSETS (GHs) LIABILITIES (GHs) MISMATCHES (%)
2009 14,267,049.00 23,620,964.00 39.60
2010 23,529,889.49 30,950,719.36 23.98
2011 30,084,957.68 38,211,723.17 21.27
2012 36,039,334.81 46,749,348.61 22.91
2013 44,436,785.95 53,870,857.92 17.51
SOURCE: Field data, 2015
Assets and Liabilities Mismatches from 2009 to 2013 of Odotobri Rural Bank Limited
YEAR ASSETS (GHs) LIABILITIES (GHs) MISMATCHES (%)
2009 3,769,641.00 10,935,208.00 65.53
2010 10,213,319.00 17,098,522.84 40.27
2011 14,336,651.58 25,219,375.90 43.15
2012 21,560,107.42 35,625319.46 39.48
2013 24,856,957.46 41,076,432.53 39.48
SOURCE: Field data, 2015
Assets and Liabilities Mismatches from 2009 to 2013 of Bosomtwe Rural Bank Limited
YEAR ASSETS (GHs) LIABILITIES (GHs) MISMATCHES (%)
2009 6,660,227.10 10,182,366.53 34.59
2010 10,316,784.48 14,149,577.97 27.08
2011 11,442,832.63 18,245,419.28 37.28
2012 11521914.89 22,977,477.62 49.86
2013 14,180,877.93 26,243,029.60 45.96
SOURCE: Field data, 2015

96 | P a g e
APPENDIX 3
PRIMARY RESERVE REQUIREMENT OF THE SELECTED BANKS 2009-2013
Primary Reserve Requirement (Actuals) from 2009 to 2013 of Atwima Kwanwoma Rural Bank
Limited Statutory Primary Reserve Requirement (13%)
YEAR 2009 2010 2011 2012 2013
MONTHS % % % % %
January 18.60 13.45 16.44 16.49 18.57
February 18.02 16.54 17.08 17.59 17.18
March 18.20 13.01 16.53 17.54 15.67
April 18.99 13.54 17.19 15.84 15.64
May 18.99 8.94 16.53 16.72 17.08
June 18.62 11.14 17.45 17.26 13.52
July 18.23 10.59 15.56 17.21 14.61
August 17.71 12.58 15.98 12.43 12.12
September 18.89 17.41 15.39 18.58 13.44
October 18.43 16.15 16.68 16.94 13.13
November 14.30 18.54 18.50 16.77 15.37
December
Compliance Rates
9.33
91.60
16.25
66.67
19.50
100.00
15.11
91.60
14.02
91.60
SOURCE: Field data, 2015

97 | P a g e
Primary Reserve Requirement (Actuals) from 2009 to 2013 of Odotobri Rural Bank Limited
Statutory Primary Reserve Requirement (13%)
YEAR 2009 2010 2011 2012 2013
MONTHS % % % % %
January 13.60 13.45 20.23 18.23 20.94
February 11.02 14.54 12.01 18.24 19.41
March 12.20 13.01 11.64 17.43 15.19
April 13.99 13.54 12.66 17.16 13.21
May 13.99 8.94 14.49 17.71 12.84
June 13.62 11.14 14.49 18.81 17.95
July 13.23 10.59 15.63 12.87 10.98
August 14.71 12.58 15.01 10.19 14.47
September 14.89 13.41 15.01 20.20 13.30
October 15.43 15.15 14.81 22.00 14.23
November 14.30 16.54 19.90 20.36 18.73
December
Compliance Rates
13.33
75.00
16.25
66.67
15.50
75.00
16.01
83.33
13.06
83.33
SOURCE: Field data, 2015

98 | P a g e
Primary Reserve Requirement (Actuals) from 2009 to 2013 of Bosomtwe Rural Bank Limited
Statutory Primary Reserve Requirement (13%)
YEAR 2009 2010 2011 2012 2013
MONTHS % % % % %
January 15.60 13.45 14.44 14.49 16.57
February 15.02 13.54 15.08 15.59 16.18
March 15.20 13.01 14.53 15.54 14.67
April 14.99 13.54 15.19 15.84 16.64
May 14.99 11.94 14.53 14.72 16.08
June 13.62 12.14 13.45 17.26 13.52
July 13.23 1359 13.56 13.21 13.61
August 15.71 14.58 13.98 12.43 12.12
September 13.89 15.41 13.39 16.58 13.44
October 12.43 16.15 14.68 15.94 13.13
November 12.30 15.54 14.50 14.77 15.37
December
Compliance Rates
13.33
83.33
16.25
83.33
15.50
100.00
13.11
91.60
14.02
91.60
SOURCE: Field data, 2015

99 | P a g e
APPENDIX 4
SECONDARY RESERVE REQUIREMENT OF THE SELECTED BANKS 2009-2013
Secondary Reserve Requirement (Actuals) from 2009 to 2013 of Atwima Kwanwoma Rural Bank
Limited - Statutory Secondary Reserve Requirement (30%)
YEAR 2009 2010 2011 2012 2013
MONTHS % % % % %
January 26.97 44.54 65.65 65.96 63.71
February 27.58 45.56 64.52 64.32 66.63
March 28.23 55.56 65.36 65.42 67.67
April 29.09 58.48 66.49 66.20 67.45
May 33.28 65.27 65.36 65.08 66.76
June 34.07 65.16 65.58 65.09 71.40
July 35.29 66.27 67.47 64.83 71.05
August 35.91 67.06 66.89 67.88 73.94
September 35.48 62.00 66.53 63.44 72.50
October 37.46 62.21 64.00 61.88 71.06
November 45.74 62.15 63.93 63.87 69.87
December
Compliance Rates
55.10
66.67
64.57
100.00
62.15
100.00
65.19
100.00
72.65
100.00
SOURCE: Field data, 2015

100 | P a g e
Secondary Reserve Requirement (Actuals) from 2009 to 2013 of Odotobri Rural Bank Limited
Statutory Secondary Reserve Requirement (30%)
YEAR 2009 2010 2011 2012 2013
MONTHS % % % % %
January 48.28 44.54 48.18 48.50 49.82
February 51.31 45.56 51.11 48.52 49.43
March 50.99 45.56 50.89 46.75 50.77
April 51.01 49.48 51.31 47.37 51.14
May 50.03 45.27 50.30 46.32 52.03
June 50.23 45.16 50.28 47.87 48.25
July 49.98 48.27 49.90 48.56 51.17
August 49.00 47.06 49.98 47.38 48.10
September 47.87 54.00 47.87 46.51 50.03
October 45.69 42.21 45.49 43.80 50.63
November 44.02 51.15 44.92 46.50 48.56
December
Compliance Rates
45.80
100
50.47
100
45.30
100
47.45
100
49.81
100
SOURCE: Field data, 2015

101 | P a g e
Secondary Reserve Requirement (Actuals) from 2009 to 2013 of Bosomtwe Rural Bank Limited
Statutory Secondary Reserve Requirement (30%)
YEAR 2009 2010 2011 2012 2013
MONTHS % % % % %
January 36.97 44.54 45.65 55.96 43.71
February 37.58 45.56 54.52 54.32 56.63
March 38.23 55.56 55.36 45.42 57.67
April 39.09 58.48 56.49 56.20 57.45
May 33.28 55.27 55.36 45.08 56.76
June 34.07 55.16 45.58 45.09 41.40
July 35.29 56.27 47.47 44.83 41.05
August 35.91 47.06 56.89 47.88 53.94
September 35.48 52.00 56.53 53.44 52.50
October 37.46 52.21 44.00 51.88 41.06
November 45.74 42.15 53.93 53.87 49.87
December
Compliance Rates
45.10
100.00
44.57
100.00
42.15
100.00
45.19
100.00
42.65
100.00
SOURCE: Field data, 2015

102 | P a g e
APPENDIX 5
COMPLIANCE TO LIQUIDITY RESERVE REQUIREMENT OF THE SELECTED BANKS
2009 -2013
Compliance to Liquidity Reserve Requirement –Atwima Kwanwoma Rural Bank Limited
Year Primary
Reserve
%
Secondary
Reserve
%
2009 91.60 75
2010 66.67 100
2011 100.00 100
2012 91.60 100
2013 91.60 100
SOURCE: Field data, 2015
Compliance to Liquidity Reserve Requirement – Odotobri Rural Bank Limited
Year Primary
Reserve
%
Secondary
Reserve
%
2009 75.00 100
2010 66.67 100
2011 75.00 100
2012 83.33 100
2013 83.33 100
SOURCE: Field data, 2015
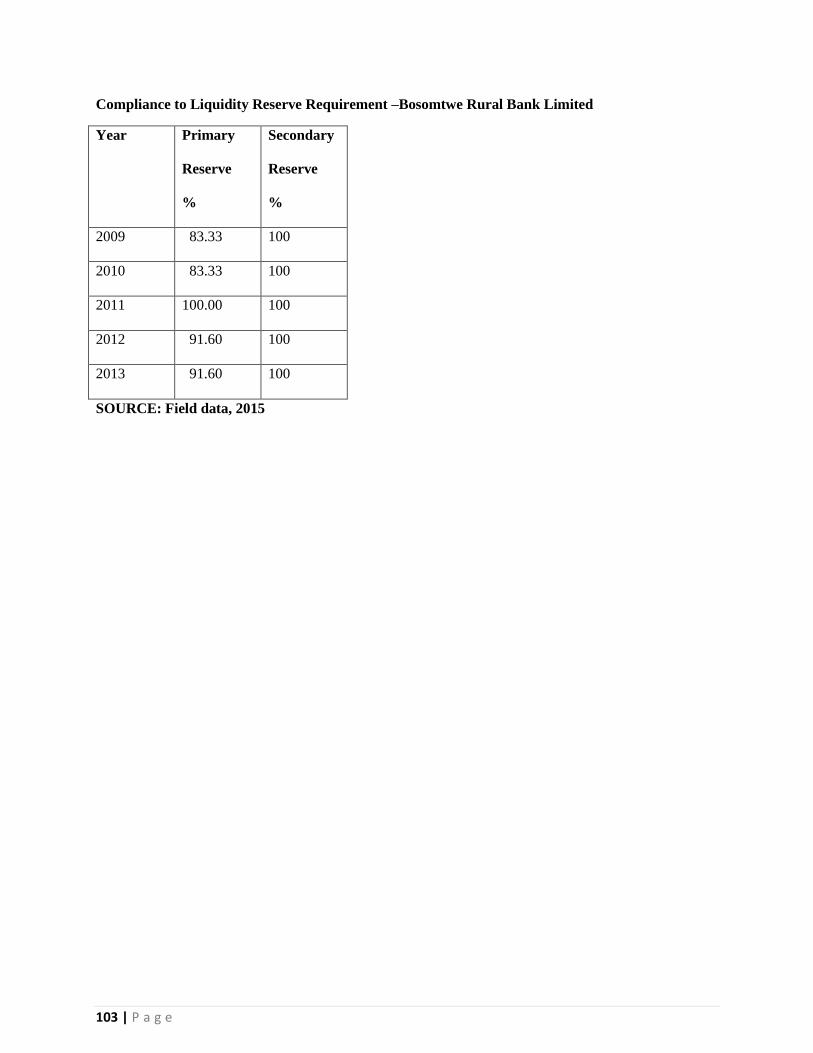
103 | P a g e
Compliance to Liquidity Reserve Requirement –Bosomtwe Rural Bank Limited
Year Primary
Reserve
%
Secondary
Reserve
%
2009 83.33 100
2010 83.33 100
2011 100.00 100
2012 91.60 100
2013 91.60 100
SOURCE: Field data, 2015