Consolidated Capital Adequacy And Liquidity Statement
13
ALLIED BANK LIMITED CAPITAL ADEQUACY AND LIQUIDITY DISCLOSURES - CONSOLIDATED AS AT DECEMBER 31, 2020 1 CAPITAL ASSESSMENT AND ADEQUACY 1.1 Capital Adequacy 1.1.1 Objectives of Managing Capital Bank's capital management seeks: - to increase strategic and tactical flexibility in the deployment of capital to allow for the timely reallocation of capital; - to safeguard the Bank’s ability to continue as a going concern so that it can continue to provide adequate return to shareholders; - availability of adequate capital (including the quantum) at a reasonable cost so as to enable the Bank to expand; and - to achieve low overall cost of capital with appropriate mix of capital elements. 1.1.2 Externally imposed Capital Requirements The Bank has complied with all externally imposed capital requirements as at year end. 1.1.3 Scope of Applications 1.1.4 Capital Structure - Basel III transition Bank's regulatory capital is analyzed into two tiers: 1.2 Leverage Ratio The Paid up Capital and Consolidated Capital Adequacy Ratio (CAR) of the Bank stood at Rs. 11.451 billion and 25.40% of its total Risk Weighted Assets (RWA) as at December 31, 2020, respectively. Capital Management aims to ensure that there is sufficient capital to meet the capital requirements of the Bank as determined by the underlying business strategy and the minimum requirements of the State Bank of Pakistan (SBP). The Capital Management process is governed by the Bank’s Asset & Liability Committee (ALCO), Risk Management Committee (RMC) and Management Committee (MANCO). Further, capital adequacy and management is overseen by the Board's Risk Management Committee (BRMC) and Strategic Planning and Monitoring Committee (SPMC). - to comply with the capital requirements set by the regulators and comparable to the peers; - to actively manage the supply of capital costs and increase capital velocity; - to improve the liquidity of the Bank’s assets to allow for an optimal deployment of the Bank’s resources; - to protect the Bank against unexpected events and maintain strong ratings; Bank through Internal Capital Adequacy Assessment Process (ICAAP) and Advance Stress Testing assesses overall capital adequacy on a periodic basis in relation to Bank’s risk profile. Utilizing sensitivity and stress analysis techniques, Bank assesses adequacy of Bank’s total capital against adverse shocks with respect to credit risk, market risk, operational risk, concentration risk, interest rate risk, liquidity risk, country risk, reputational risk and strategic risk. Further, Bank formulates its strategy, including assessment for raising additional capital for maintaining adequate capital under stressed conditions. (c) maintaining acceptable profit margins. In order to strengthen the solvency of Banks / Development Financial Institutions (DFIs), SBP through its BSD Circular No. 07 of 2009 dated April 15, 2009 prescribed the Banks to raise their minimum paid up capital to Rs. 10 billion free of losses. State Bank of Pakistan through its BPRD Circular # 6 of 2013 dated August 15, 2013 has required Banks to maintain the minimum Capital Adequacy Ratio (CAR) of 12.5% inclusive of Capital Conservation Buffer (CCB) of 2.5% on standalone as well as on consolidated basis. However, to support the banking sector in extending financing or credit facilities to their customers during COVID-19, State Bank of Pakistan vide BPRD Circular # 12 of 2020 has relaxed CAR requirements to 11.5% by reducing the Capital Conservation Buffer (CCB) from 2.5% to 1.5% till further instructions. The Basel Framework is applicable to the Bank both at the consolidated level (comprising of wholly owned subsidiary - ABL Asset Management Company Limited) and also on a stand alone basis. State Bank of Pakistan vide BPRD circular # 6 dated August 15, 2013 revised and updated Basel II Framework in accordance with Basel III capital reforms and clarifications to further strengthen capital related rules. Tier 1 capital, which includes fully issued, subscribed and paid up capital, balance in share premium account, reserve for bonus issue, general reserves as per the financial statements and net un-appropriated profits, etc. after regulatory deductions. Tier 2 capital, which includes general provisions for loan losses (up to a maximum of 1.25 % of credit risk weighted assets), reserves on the revaluation of fixed assets and equity investments and subordinated debt. Bank has also implemented full standards of Basel III with respect to capital deductions as per road map laid down by SBP through BPRD Circular # 6 dated August 15, 2013. The required capital is achieved by the Bank through: (a) enhancement in the risk profile of asset mix at the existing volume level; (b) ensuring better recovery management; and The leverage ratio of the Group as on December 31, 2020 is 5.15% (2019: 4.56%). The ratio has been computed as prescribed by State Bank of Pakistan through Instructions for Basel III Implementation in Pakistan. Shift in leverage ratio is mainly due to increase in Tier I Capital as of December 31, 2020. As on December 31, 2020; Total Tier 1 capital of the Group amounts to Rs. 95,335,586 thousands (2019: Rs. 82,135,834 thousands) whereas the total exposure measure amounts to Rs. 1,850,090,033 thousands (2019: Rs. 1,801,242,634 thousands).
-
Upload
khangminh22 -
Category
Documents
-
view
2 -
download
0
Transcript of Consolidated Capital Adequacy And Liquidity Statement

ALLIED BANK LIMITED
CAPITAL ADEQUACY AND LIQUIDITY DISCLOSURES - CONSOLIDATED
AS AT DECEMBER 31, 2020
1 CAPITAL ASSESSMENT AND ADEQUACY
1.1 Capital Adequacy
1.1.1 Objectives of Managing Capital
Bank's capital management seeks:
- to increase strategic and tactical flexibility in the deployment of capital to allow for the timely reallocation of capital;
- to safeguard the Bank’s ability to continue as a going concern so that it can continue to provide adequate return to shareholders;
- availability of adequate capital (including the quantum) at a reasonable cost so as to enable the Bank to expand; and
- to achieve low overall cost of capital with appropriate mix of capital elements.
1.1.2 Externally imposed Capital Requirements
The Bank has complied with all externally imposed capital requirements as at year end.
1.1.3 Scope of Applications
1.1.4 Capital Structure - Basel III transition
Bank's regulatory capital is analyzed into two tiers:
1.2 Leverage Ratio
The Paid up Capital and Consolidated Capital Adequacy Ratio (CAR) of the Bank stood at Rs. 11.451 billion and 25.40% of its total Risk Weighted Assets (RWA) as at
December 31, 2020, respectively.
Capital Management aims to ensure that there is sufficient capital to meet the capital requirements of the Bank as determined by the underlying business strategy and the
minimum requirements of the State Bank of Pakistan (SBP). The Capital Management process is governed by the Bank’s Asset & Liability Committee (ALCO), Risk
Management Committee (RMC) and Management Committee (MANCO). Further, capital adequacy and management is overseen by the Board's Risk Management
Committee (BRMC) and Strategic Planning and Monitoring Committee (SPMC).
- to comply with the capital requirements set by the regulators and comparable to the peers;
- to actively manage the supply of capital costs and increase capital velocity;
- to improve the liquidity of the Bank’s assets to allow for an optimal deployment of the Bank’s resources;
- to protect the Bank against unexpected events and maintain strong ratings;
Bank through Internal Capital Adequacy Assessment Process (ICAAP) and Advance Stress Testing assesses overall capital adequacy on a periodic basis in relation to
Bank’s risk profile. Utilizing sensitivity and stress analysis techniques, Bank assesses adequacy of Bank’s total capital against adverse shocks with respect to credit risk,
market risk, operational risk, concentration risk, interest rate risk, liquidity risk, country risk, reputational risk and strategic risk. Further, Bank formulates its strategy,
including assessment for raising additional capital for maintaining adequate capital under stressed conditions.
(c) maintaining acceptable profit margins.
In order to strengthen the solvency of Banks / Development Financial Institutions (DFIs), SBP through its BSD Circular No. 07 of 2009 dated April 15, 2009 prescribed
the Banks to raise their minimum paid up capital to Rs. 10 billion free of losses.
State Bank of Pakistan through its BPRD Circular # 6 of 2013 dated August 15, 2013 has required Banks to maintain the minimum Capital Adequacy Ratio (CAR) of
12.5% inclusive of Capital Conservation Buffer (CCB) of 2.5% on standalone as well as on consolidated basis. However, to support the banking sector in extending
financing or credit facilities to their customers during COVID-19, State Bank of Pakistan vide BPRD Circular # 12 of 2020 has relaxed CAR requirements to 11.5% by
reducing the Capital Conservation Buffer (CCB) from 2.5% to 1.5% till further instructions.
The Basel Framework is applicable to the Bank both at the consolidated level (comprising of wholly owned subsidiary - ABL Asset Management Company Limited) and
also on a stand alone basis.
State Bank of Pakistan vide BPRD circular # 6 dated August 15, 2013 revised and updated Basel II Framework in accordance with Basel III capital reforms and
clarifications to further strengthen capital related rules.
Tier 1 capital, which includes fully issued, subscribed and paid up capital, balance in share premium account, reserve for bonus issue, general reserves as per the
financial statements and net un-appropriated profits, etc. after regulatory deductions.
Tier 2 capital, which includes general provisions for loan losses (up to a maximum of 1.25 % of credit risk weighted assets), reserves on the revaluation of fixed assets
and equity investments and subordinated debt. Bank has also implemented full standards of Basel III with respect to capital deductions as per road map laid down by
SBP through BPRD Circular # 6 dated August 15, 2013.
The required capital is achieved by the Bank through:
(a) enhancement in the risk profile of asset mix at the existing volume level;
(b) ensuring better recovery management; and
The leverage ratio of the Group as on December 31, 2020 is 5.15% (2019: 4.56%). The ratio has been computed as prescribed by State Bank of Pakistan through
Instructions for Basel III Implementation in Pakistan.
Shift in leverage ratio is mainly due to increase in Tier I Capital as of December 31, 2020.
As on December 31, 2020; Total Tier 1 capital of the Group amounts to Rs. 95,335,586 thousands (2019: Rs. 82,135,834 thousands) whereas the total exposure measure
amounts to Rs. 1,850,090,033 thousands (2019: Rs. 1,801,242,634 thousands).

CAPITAL ADEQUACY AND LIQUIDITY DISCLOSURES - CONSOLIDATED
AS AT DECEMBER 31, 2020
1.3 CAPITAL ADEQUACY RETURN AS OF DECEMBER 31, 2020
Common Equity Tier 1 capital (CET1): Instruments and reserves
Fully Paid-up Capital/ Capital deposited with State Bank of Pakistan 11,450,739 11,450,739
Balance in Share Premium Account - -
Reserve for issue of Bonus Shares - -
General/ Statutory Reserves 22,251,451 20,448,505
Gain/(Losses) on derivatives held as Cash Flow Hedge - -
Unappropriated/unremitted profits/ (losses) 69,203,702 57,681,932
- -
CET 1 before Regulatory Adjustments 102,905,892 89,581,176
Common Equity Tier 1 capital: Regulatory adjustments
Total regulatory adjustments applied to CET1 (Note 1.3.1) (7,570,306) (7,445,342)
Common Equity Tier 1 a 95,335,586 82,135,834
Additional Tier 1 (AT 1) Capital
Qualifying Additional Tier 1 instruments plus any related share premium
of which: Classified as equity - -
of which: Classified as liabilities - -
- -
AT1 before regulatory adjustments - -
Total regulatory adjustment applied to AT1 capital (Note 1.3.2) - -
Additional Tier 1 capital after regulatory adjustments . .
Additional Tier 1 capital recognized for capital adequacy b - -
Tier 1 Capital (CET1 + admissible AT1) (c=a+b) 95,335,586 82,135,834
Tier 2 Capital
Qualifying Tier 2 capital instruments under Basel III plus any related share premium - -
- -
- -
109,459 39,795
Revaluation Reserves (net of taxes) 28,198,689 23,067,977
of which: Revaluation reserves on Property 23,322,739 15,638,996
of which: Unrealized Gains/Losses on Avaialable for Sale (AFS) Securities 4,875,950 7,428,981
Foreign Exchange Translation Reserves 2,025,733 1,821,720
Undisclosed/Other Reserves (if any) - -
Tier 2 before regulatory adjustments 30,333,881 24,929,492
Total regulatory adjustment applied to Tier 2 capital (Note 1.3.3) (2,643,198) (2,578,335)
Tier 2 capital (T2) after regulatory adjustments 27,690,683 22,351,157
Tier 2 capital recognized for capital adequacy 27,690,683 22,351,157
Portion of Additional Tier 1 capital recognized in Tier 2 capital - -
Total Tier 2 capital admissible for capital adequacy (d) 27,690,683 22,351,157
TOTAL CAPITAL (Tier 1 + admissible T2) (e=c+d) 123,026,269 104,486,991
Total Risk Weighted Assets (f) 484,346,401 479,617,816
Capital Ratios and buffers (in percentage of risk weighted assets)
CET1 to total RWA (a/f) 19.68% 17.13%
Tier 1 capital to total RWA (c/f) 19.68% 17.13%
Total capital to RWA (e/f) 25.40% 21.79%
7.50% 8.50%
of which: capital conservation buffer requirement 1.50% 2.50%
of which: countercyclical buffer requirement - -
of which: Domestic Systemically Important Banks or Global Systemically Important Banks buffer requirement - -
CET1 available to meet buffers (as a percentage of risk weighted assets) 12.18% 8.63%
National minimum capital requirements prescribed by SBP
CET1 minimum ratio 6.00% 6.00%
Tier 1 minimum ratio 7.50% 7.50%
Total capital Minimum Ratio plus Capital Conservation Buffer 11.50% 12.50%
Capital instruments subject to phase out arrangement from tier 2 (Pre-Basel III
instruments)
Minority Interests arising from CET1 capital instruments issued to third party by
consolidated bank subsidiaries (amount allowed in CET1 capital of the consolidation
group)
Tier 2 capital instruments issued to third party by consolidated subsidiaries (amount
allowed in group tier 2) of which: instruments issued by subsidiaries subject to phase out
Bank specific buffer requirement (minimum CET1 requirement plus capital conservation
buffer plus any other buffer requirement)
General Provisions or general reserves for loan losses-up to maximum
of 1.25% of Credit Risk Weighted Assets
Additional Tier 1 capital instruments issued by consolidated
subsidiaries and held by third parties (amount allowed in group AT 1)
of which: instrument issued by subsidiaries subject to phase out
Detail of the Bank's eligible capital is as follows: December 31,
2019
December 31,
2020
Rupees in '000

CAPITAL ADEQUACY AND LIQUIDITY DISCLOSURES - CONSOLIDATED
AS AT DECEMBER 31, 2020
Regulatory Adjustments and Additional Information December 31,
2020
December 31,
2019
1.3.1 Common Equity Tier 1 capital: Regulatory adjustments
1 Goodwill (net of related deferred tax liability)
2 All other intangibles (net of any associated deferred tax liability) (2,675,779) (1,948,235)
3 Shortfall in provisions against classified assets - -
4
- -
5 Defined-benefit pension fund net assets (3,786,440) (4,440,411)
6
(664,321) (858,740)
7 Cash flow hedge reserve - -
8 Investment in own shares/ CET1 instruments - -
9 Securitization gain on sale - -
10 Capital shortfall of regulated subsidiaries - -
11 Deficit on account of revaluation from bank's holdings of fixed assets/ AFS - -
12
13 - -
14 - -
15 Amount exceeding 15% threshold - -
16 of which: significant investments in the common stocks of financial entities - -
17 of which: deferred tax assets arising from temporary differences - -
18 National specific regulatory adjustments applied to CET1 capital - -
19 Investments in TFCs of other banks exceeding the prescribed limit - -
20 Any other deduction specified by SBP (mention details) (421,101) (197,956)
21 Adjustment to CET1 due to insufficient AT1 and Tier 2 to cover deductions - -
22 Total regulatory adjustments applied to CET1 (sum of 1 to 21) (7,570,306) (7,445,342)
1.3.2 Additional Tier 1 & Tier 1 Capital: regulatory adjustments
- -
24 Investment in own AT1 capital instruments - -
25 - -
26
- -
27
- -
28
- -
29 Adjustments to Additional Tier 1 due to insufficient Tier 2 to cover deductions - -
30 Total regulatory adjustment applied to AT1 capital (sum of 23 to 29) - -
1.3.3 Tier 2 Capital: regulatory adjustments
31
- -
32
- -
33 Investment in own Tier 2 capital instrument - -
34
35
(2,630,857) (2,578,335)
36 Total regulatory adjustment applied to Tier 2 capital (sum of 31 to 35) (2,643,198) (2,578,335)
23
Significant investments in the capital instruments issued by banking, financial and
insurance entities that are outside the scope of regulatory consolidation
Deferred tax assets that rely on future profitability excluding those arising from
temporary differences (net of related tax liability)
Investment in mutual funds exceeding the prescribed limit [SBP specific adjustment]
Significant investments in the capital instruments of banking, financial and insurance
entities that are outside the scope of regulatory consolidation
Portion of deduction applied 50:50 to Tier 1 and Tier 2 capital based on pre-Basel III
treatment which, during transitional period, remain subject to deduction from Tier 2
capital
Reciprocal cross holdings in Additional Tier 1 capital instruments of banking, financial
and insurance entities
Investments in the capital instruments of banking, financial and insurance entities that are
outside the scope of regulatory consolidation, where the bank does not own more than
10% of the issued share capital (amount above 10% threshold)
Portion of deduction applied 50:50 to Tier 1 and Tier 2 capital based on pre-Basel III
treatment which, during transitional period, remain subject to deduction from additional
Tier 1 capital
Reciprocal cross holdings in CET1 capital instruments of banking, financial and
insurance entities
Investments in the capital instruments of banking, financial and insurance entities that are
outside the scope of regulatory consolidation, where the bank does not own more than
10% of the issued share capital (amount above 10% threshold)
Significant investments in the common stocks of banking, financial and insurance entities
that are outside the scope of regulatory consolidation (amount above 10% threshold)
(12,341) -
Deferred Tax Assets arising from temporary differences (amount above 10% threshold,
net of related tax liability)
Rupees in '000
Reciprocal cross holdings in Tier 2 instruments of banking, financial and insurance
entities
Investments in the capital instruments of banking, financial and insurance entities that are
outside the scope of regulatory consolidation, where the bank does not own more than
10% of the issued share capital (amount above 10% threshold)
(22,665) -
CAPITAL ADEQUACY AND LIQUIDITY DISCLOSURES - CONSOLIDATED
AS AT DECEMBER 31, 2020
December 31,
2020
December 31,
2019
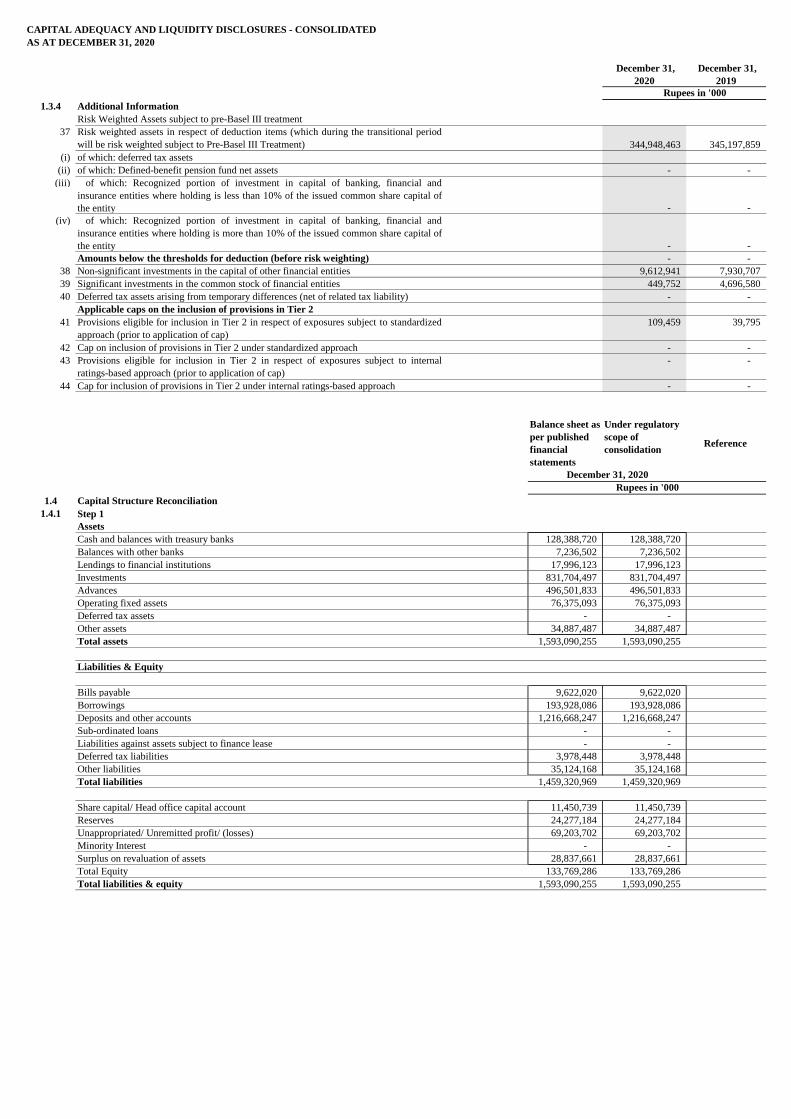
1.3.4 Additional Information
Risk Weighted Assets subject to pre-Basel III treatment
37
344,948,463 345,197,859
(i) of which: deferred tax assets
(ii) of which: Defined-benefit pension fund net assets - -
(iii)
- -
(iv)
- -
Amounts below the thresholds for deduction (before risk weighting) - -
38 Non-significant investments in the capital of other financial entities 9,612,941 7,930,707
39 Significant investments in the common stock of financial entities 449,752 4,696,580
40 Deferred tax assets arising from temporary differences (net of related tax liability) - -
Applicable caps on the inclusion of provisions in Tier 2
41 109,459 39,795
42 Cap on inclusion of provisions in Tier 2 under standardized approach - -
43 - -
44 Cap for inclusion of provisions in Tier 2 under internal ratings-based approach - -
Balance sheet as
per published
financial
statements
Under regulatory
scope of
consolidationReference
1.4 Capital Structure Reconciliation
1.4.1 Step 1
Assets
Cash and balances with treasury banks 128,388,720 128,388,720
Balances with other banks 7,236,502 7,236,502
Lendings to financial institutions 17,996,123 17,996,123
Investments 831,704,497 831,704,497
Advances 496,501,833 496,501,833
Operating fixed assets 76,375,093 76,375,093
Deferred tax assets - -
Other assets 34,887,487 34,887,487
Total assets 1,593,090,255 1,593,090,255
Liabilities & Equity
Bills payable 9,622,020 9,622,020
Borrowings 193,928,086 193,928,086
Deposits and other accounts 1,216,668,247 1,216,668,247
Sub-ordinated loans - -
Liabilities against assets subject to finance lease - -
Deferred tax liabilities 3,978,448 3,978,448
Other liabilities 35,124,168 35,124,168
Total liabilities 1,459,320,969 1,459,320,969
Share capital/ Head office capital account 11,450,739 11,450,739
Reserves 24,277,184 24,277,184
Unappropriated/ Unremitted profit/ (losses) 69,203,702 69,203,702
Minority Interest - -
Surplus on revaluation of assets 28,837,661 28,837,661
Total Equity 133,769,286 133,769,286
Total liabilities & equity 1,593,090,255 1,593,090,255
Provisions eligible for inclusion in Tier 2 in respect of exposures subject to standardized
approach (prior to application of cap)
Provisions eligible for inclusion in Tier 2 in respect of exposures subject to internal
ratings-based approach (prior to application of cap)
Rupees in '000
Risk weighted assets in respect of deduction items (which during the transitional period
will be risk weighted subject to Pre-Basel III Treatment)
of which: Recognized portion of investment in capital of banking, financial and
insurance entities where holding is less than 10% of the issued common share capital of
the entity
of which: Recognized portion of investment in capital of banking, financial and
insurance entities where holding is more than 10% of the issued common share capital of
the entity
December 31, 2020
Rupees in '000

CAPITAL ADEQUACY AND LIQUIDITY DISCLOSURES - CONSOLIDATED
AS AT DECEMBER 31, 2020
Balance sheet as
per published
financial
statements
Under regulatory
scope of
consolidationReference
1.4.2 Step 2
Assets
Cash and balances with treasury banks 128,388,720 128,388,720
Balances with other banks 7,236,502 7,236,502
Lending to financial institutions 17,996,123 17,996,123
Investments 831,704,497 831,704,497
- 35,006 a
- - b
of which: Mutual Funds exceeding regulatory threshold - - c
of which :Reciprocal cross holdings in CET1 - 664,321 d
of which :Reciprocal cross holdings in Tier2 - - e
of which: others (mention details) - - f
Advances 496,501,833 496,501,833
shortfall in provisions / excess of total EL amount over eligible provisions under IRB - - g
general provisions reflected in Tier 2 capital - 109,459 h
Fixed Assets 76,375,093 76,375,093
of which: Intangibles - 2,722,951 i
Deferred Tax Assets - -
of which: Deferred Tax Assets (DTAs) excluding those arising from temporary differences - - j
of which: DTAs arising from temporary differences exceeding regulatory threshold - - k
Other assets 34,887,487 34,887,487
of which: Goodwill - - l
of which: Defined-benefit pension fund net assets - 3,786,440 m
Total assets 1,593,090,255 1,593,090,255
Liabilities & Equity
Bills payable 9,622,020 9,622,020
Borrowings 193,928,086 193,928,086
Deposits and other accounts 1,216,668,247 1,216,668,247
Sub-ordinated loans - -
of which: eligible for inclusion in AT1 - - n
of which: eligible for inclusion in Tier 2 - - o
Liabilities against assets subject to finance lease - -
Deferred tax liabilities 3,978,448 3,978,448
of which: Deferred Tax Liabilities (DTLs) related to goodwill - - p
of which: DTLs related to intangible assets - 47,172 q
of which: DTLs related to defined pension fund net assets - - r
of which: other deferred tax liabilities - - s
Other liabilities 35,124,168 35,124,168
Total liabilities 1,459,320,969 1,459,320,969
Share capital 11,450,739 11,450,739
of which: amount eligible for CET1 - 11,450,739 t
of which: amount eligible for AT1 - - u
Reserves 24,277,184 24,277,184
of which: portion eligible for inclusion in CET1:Share Premium - - v
of which: portion eligible for inclusion in CET1 General/ Statutory Reserve - 22,251,451 w
of which: portion eligible for inclusion in Tier 2 - 2,025,733 x
Unappropriated profit / (losses) 69,203,702 69,203,702 y
Minority Interest - -
of which: portion eligible for inclusion in CET1 - - z
of which: portion eligible for inclusion in AT1 - - aa
of which: portion eligible for inclusion in Tier 2 - - ab
Surplus on revaluation of assets 28,837,661 28,837,661
of which: Revaluation reserves on Property - 23,322,739
of which: Unrealized Gains / Losses on AFS - 4,875,950
In case of Deficit on revaluation (deduction from CET1) - - ad
Total Equity 133,769,286 133,769,286
of which: significant capital investments in financial sector entities exceeding
regulatory threshold
Rupees in '000
ac
of which: Non-significant capital investments in capital of other financial institutions
exceeding 10% threshold
December 31, 2020

CAPITAL ADEQUACY AND LIQUIDITY DISCLOSURES - CONSOLIDATED
AS AT DECEMBER 31, 2020
Component of
regulatory capital
reported by bank
Source based on
reference
number from
step 2
1.4.3 Step 3
Common Equity Tier 1 capital (CET1): Instruments and reserves
1 Fully Paid-up Capital / Capital deposited with SBP 11,450,739 (t)
2 Balance in Share Premium Account - (v)
3 Reserve for issue of Bonus Shares -
4 General / Statutory Reserves 22,251,451 (w)
5 Gain / (losses) on derivatives held as Cash Flow Hedge -
6 Unappropriated / unremitted profits/(losses) 69,203,702 (y)
7
- (z)
8 CET 1 before Regulatory Adjustments 102,905,892
Common Equity Tier 1 capital: Regulatory adjustments
9 Goodwill (net of related deferred tax liability) - (l) - (p)
10 All other intangibles (net of any associated deferred tax liability) 2,675,779 (i) - (q)
11 Shortfall of provisions against classified assets - (g)
12
- (j) - (s)
13 Defined-benefit pension fund net assets 3,786,440 (m) - (r)
14 Reciprocal cross holdings in CET1 capital instruments 664,321 (d)
15 Cash flow hedge reserve -
16 Investment in own shares/ CET1 instruments -
17 Securitization gain on sale -
18 Capital shortfall of regulated subsidiaries -
19 Deficit on account of revaluation from bank's holdings of property/ AFS - (ad)
20
21
- (b) - (af) - (ai)
22
- (k)
23 Amount exceeding 15% threshold -
24 of which: significant investments in the common stocks of financial entities -
25 of which: deferred tax assets arising from temporary differences -
26 National specific regulatory adjustments applied to CET1 capital -
27 Investment in TFCs of other banks exceeding the prescribed limit -
28 Any other deduction specified by SBP (mention details) 421,101
29
-
30 Total regulatory adjustments applied to CET1 (sum of 9 to 29) 7,570,306
Common Equity Tier 1 95,335,586
Additional Tier 1 (AT 1) Capital
31 Qualifying Additional Tier 1 instruments plus any related share premium -
32 of which: Classified as equity - (u)
33 of which: Classified as liabilities - (n)
34
- (x)
35 of which: instrument issued by subsidiaries subject to phase out -
36 AT1 before regulatory adjustments -
Additional Tier 1 Capital: regulatory adjustments -
37 Investment in mutual funds exceeding the prescribed limit (SBP specific adjustment) -
38 Investment in own AT1 capital instruments -
39 Reciprocal cross holdings in Additional Tier 1 capital instruments -
40
- (ae)
41 - (af)
42
43
-
44 Total of Regulatory Adjustment applied to AT1 capital -
45 Additional Tier 1 capital -
46 Additional Tier 1 capital recognized for capital adequacy -
Tier 1 Capital (CET1 + admissible AT1) 95,335,586
Regulatory adjustments applied to Additional Tier 1 due to insufficient Tier 2 to cover
deductions
Investments in the capital instruments of banking, financial and insurance entities that are
outside the scope of regulatory consolidation, where the bank does not own more than
10% of the issued share capital (amount above 10% threshold)
Significant investments in the capital instruments issued by banking, financial and
insurance entities that are outside the scope of regulatory consolidation
Portion of deduction applied 50:50 to core capital and supplementary capital based on pre-
Basel III treatment which, during transitional period, remain subject to deduction from
Tier 1 capital
Regulatory adjustment applied to CET1 due to insufficient AT1 and Tier 2 to cover
deductions
Rupees in '000
Additional Tier 1 capital instruments issued by consolidated subsidiaries and held by
third parties (amount allowed in group AT 1)
Deferred tax assets that rely on future profitability excluding those arising from
temporary differences (net of related tax liability)
Investments in the capital instruments of banking, financial and insurance entities that are
outside the scope of regulatory consolidation, where the bank does not own more than
10% of the issued share capital (amount above 10% threshold)
Significant investments in the capital instruments issued by banking, financial and
insurance entities that are outside the scope of regulatory consolidation (amount above
10% threshold)
Deferred Tax Assets arising from temporary differences (amount above 10% threshold,
net of related tax liability)
22,665 (a) - (ae) - (ah)
Minority Interests arising from CET1 capital instruments issued to third party by
consolidated bank subsidiaries (amount allowed in CET1 capital of the consolidation
group)

CAPITAL ADEQUACY AND LIQUIDITY DISCLOSURES - CONSOLIDATED
AS AT DECEMBER 31, 2020
Component of
regulatory capital
reported by bank
Source based on
reference
number from
step 2
Tier 2 Capital
47 Qualifying Tier 2 capital instruments under Basel III -
48 Capital instruments subject to phase out arrangement from tier 2 (Pre-Basel III instruments) - (o)
49
- (ab)
50 of which: instruments issued by subsidiaries subject to phase out -
51
109,459 (h)
52 Revaluation Reserves eligible for Tier 2
53 of which: portion pertaining to Property 23,322,739 (ac)
54 of which: portion pertaining to AFS securities 4,875,950 (ac)
55 Foreign Exchange Translation Reserves 2,025,733 (x)
56 Undisclosed / Other Reserves (if any) -
57 Tier 2 before regulatory adjustments 30,333,881
Tier 2 Capital: regulatory adjustments
58 -
59 Reciprocal cross holdings in Tier 2 instruments - (e)
60 Investment in own Tier 2 capital instrument -
61
62
63 Amount of Regulatory Adjustment applied to Tier 2 capital 2,643,198
64 Tier 2 capital (T2) 27,690,683
65 Tier 2 capital recognized for capital adequacy 27,690,683
66 Excess Additional Tier 1 capital recognized in Tier 2 capital -
67 Total Tier 2 capital admissible for capital adequacy 27,690,683
TOTAL CAPITAL (Tier 1 + admissible Tier 2) 123,026,269
Significant investments in the capital instruments issued by banking, financial and
insurance entities that are outside the scope of regulatory consolidation
Tier 2 capital instruments issued to third party by consolidated subsidiaries (amount
allowed in group tier 2)
General Provisions or general reserves for loan losses-up to maximum of 1.25% of Credit
Risk Weighted Assets
Portion of deduction applied 50:50 to core capital and supplementary capital based on pre-
Basel III treatment which, during transitional period, remain subject to deduction from
Tier 2 capital
Investments in the capital instruments of banking, financial and insurance entities that are
outside the scope of regulatory consolidation, where the bank does not own more than
10% of the issued share capital (amount above 10% threshold)12,341 (ah)
2,630,857
Rupees in '000

CAPITAL ADEQUACY AND LIQUIDITY DISCLOSURES - CONSOLIDATED
AS AT DECEMBER 31, 2020
1.5 Main Features of Regulatory Capital Instruments
Sr. No. Main Features Common Shares
1 Issuer Allied Bank Limited
2 Unique identifier (eg PSX Symbol or Bloomberg identifier etc.) ABL
3 Governing law(s) of the instrument Laws applicable in Pakistan
Regulatory treatment
4 Transitional Basel III rules Common Equity Tier 1
5 Post-transitional Basel III rules Common Equity Tier 1
6 Eligible at solo/ group/ group & solo Group and standalone
7 Instrument type Ordinary Shares
8 Amount recognized in regulatory capital (Currency in PKR thousands, as of reporting date) 11,450,739
9 Par value of instrument 10
10 Accounting classification Shareholders equity
11 Original date of issuance N/A
12 Perpetual or dated Perpetual
13 Original maturity date N/A
14 Issuer call subject to prior supervisory approval No
15 Optional call date, contingent call dates and redemption amount N/A
16 Subsequent call dates, if applicable N/A
Coupons / dividends
17 Fixed or floating dividend/ coupon N/A
18 Coupon rate and any related index/ benchmark N/A
19 Existence of a dividend stopper N/A
20 Fully discretionary, partially discretionary or mandatory Fully discretionary
21 Existence of step up or other incentive to redeem No
22 Noncumulative or cumulative Noncumulative
23 Convertible or non-convertible Non Convertible
24 If convertible, conversion trigger (s) N/A
25 If convertible, fully or partially N/A
26 If convertible, conversion rate N/A
27 If convertible, mandatory or optional conversion N/A
28 If convertible, specify instrument type convertible into N/A
29 If convertible, specify issuer of instrument it converts into N/A
30 Write-down feature N/A
31 If write-down, write-down trigger(s) N/A
32 If write-down, full or partial N/A
33 If write-down, permanent or temporary N/A
34 If temporary write-down, description of write-up mechanism N/A
35 Position in subordination hierarchy in liquidation (specify instrument type immediately senior to instrument)
36 Non-compliant transitioned features No
37 If yes, specify non-compliant features N/A
Rank inferior to creditors including
deposits

CAPITAL ADEQUACY AND LIQUIDITY DISCLOSURES - CONSOLIDATED
AS AT DECEMBER 31, 2020
1.6 Risk Weighted Exposures
The capital requirements for the Bank as per the major risk categories is indicated below:-
December 31, December 31, December 31, December 31,
2020 2019 2020 2019
CREDIT RISK
On-Balance sheet
Portfolios subject to standardized approach (Simple)
2,657,857 3,227,605 23,111,803 25,820,837
- -
- - - -
Claims on Multilateral Development Banks - - - -
Claims on Public Sector Entities in Pakistan 707,273 2,580,748 6,150,197 20,645,980
Claims on Banks 1,456,312 1,412,173 12,663,582 11,297,383
- -
178,476 23,621 1,551,962 188,968
- -
267,007 231,665 2,321,800 1,853,323
Claims on Corporates (excluding equity exposures) 17,321,363 17,487,259 150,620,549 139,898,069
Claims categorized as retail portfolio 1,409,562 1,477,950 12,257,060 11,823,597
Claims fully secured by residential property 352,451 348,652 3,064,795 2,789,214
Past Due loans 62,561 94,848 544,011 758,787
Investments in premises, plant and equipment and all other fixed assets 8,469,996 7,780,008 73,652,141 62,240,063
All other assets 447,711 764,557 3,893,140 6,116,453
33,330,569 35,429,086 289,831,039 283,432,673
Off- Balance Sheet
Non Market related Exposures
Direct Credit Substitutes / Lending of securities or posting
of securities as collateral 3,256,738 3,022,978 28,319,459 24,183,823
Performance related contingencies 257,550 722,925 2,239,561 5,783,401
Trade Related contingencies/Other Commitments with original - -
maturity of one year or less 1,015,796 732,665 8,833,006 5,861,317
4,530,084 4,478,568 39,392,026 35,828,541
Market related Exposures 237,583 574,496 2,065,943 4,595,971
Equity Exposure Risk in the Banking Book
405,604 438,181 3,526,993 3,505,452
1,148,501 1,858,995 9,986,965 14,871,958
Significant investment and DTAs above 15% threshold 16,732 370,408 145,496 2,963,264
1,570,837 2,667,584 13,659,454 21,340,673
Total Credit Risk 39,669,073 43,149,734 344,948,463 345,197,859
MARKET RISK
Capital Requirement for portfolios subject to Standardized Approach
Interest rate risk 497,393 761,710 4,325,160 6,093,682
Equity position risk etc. 3,642,649 4,495,425 31,675,212 35,963,401
Foreign exchange risk 832,278 939,729 7,237,198 7,517,834
4,972,320 6,196,864 43,237,570 49,574,917
OPERATIONAL RISK
Capital Requirement for operational risks 11,058,442 10,605,630 96,160,368 84,845,040
Total Risk Weighted Assets 55,699,835 59,952,228 484,346,401 479,617,816
Capital Adequacy Ratios Required Actual Required Actual
CET1 to total RWA 6.00% 19.68% 6.00% 17.13%
Tier 1 capital to total RWA 7.50% 19.68% 7.50% 17.13%
Total capital plus CCB to total RWA 11.50% 25.40% 12.50% 21.79%
Capital Requirement Risk Weighted Assets
Claims, denominated in foreign currency, on banks with original maturity of 3 months or
less
Claims on banks with original maturity of 3 months or less denominated in PKR and
funded in PKR
Listed Equity investments and regulatory capital instruments issued by other banks (other
than those deducted from capital) held in the banking book.
December 31, 2019December 31, 2020
Rupees in '000
Claims on other sovereigns and on Government of Pakistan or provincial governments or
SBP denominated in currencies other than PKR
Claims on Bank for International Settlements, International Monetary Fund, European
Central Bank and European Community
Unlisted equity investments (other than that deducted from capital) held in banking book

CAPITAL ADEQUACY AND LIQUIDITY DISCLOSURES - CONSOLIDATED
AS AT DECEMBER 31, 2020
1.7 Credit risk - General disclosure
The Bank is following standardized approach for all its Credit Risk Exposures.
1.7.1
Long – Term Rating Grades Mapping
SBP Rating grade Fitch Moody’s S & P PACRA JCR-VIS
1 AAA Aaa AAA AAA AAA
AA+ Aa1 AA+ AA+ AA+
AA Aa2 AA AA AA
AA- Aa3 AA- AA- AA-
2 A+ A1 A+ A+ A+
A A2 A A A
A- A3 A- A- A-
3 BBB+ Baa1 BBB+ BBB+ BBB+
BBB Baa2 BBB BBB BBB
BBB- Baa3 BBB- BBB- BBB-
4 BB+ Ba1 BB+ BB+ BB+
BB Ba2 BB BB BB
BB- Ba3 BB- BB- BB-
5 B+ B1 B+ B+ B+
B B2 B B B
B- B3 B- B- B-
6 CCC+ and below Caa1 and below CCC+ and below CCC+ and below CCC+ and below
Short – Term Rating Grades Mapping
SBP Rating Grade Fitch Moody’s S & P PACRA JCR-VIS
S1 F1 P-1 A-1+ A-1+ A-1+
A-1
S2 F2 P-2 A-2 A-2 A-2
S3 F3 P-3 A-3 A-3 A-3
S4 Others Others Others Others Others
Types of exposures and ECAI's used
Exposures Fitch Moody’s S & P PACRA JCR-VIS
Corporate - - - Yes Yes
Banks Yes Yes Yes Yes Yes
Sovereigns Yes Yes Yes - -
SME's - - - - -
Securitizations - - - - -
Credit exposures subject to Standardized Approach
1 115,233,755 57,783 115,175,972 91,402,243 6,110 91,396,133
2 86,674,602 65,924 86,608,678 87,834,824 47,924 87,786,900
3 , 4 8,636,867 148,382 8,488,485 5,990,559 20,423 5,970,136
5 , 6 - -
- 20,130,552 1,610,743 18,519,809 18,328,150 1,549,864 16,778,286
1 39,045,868 14,957,656 24,088,212 27,882,757 7,124,206 20,758,551
- 1,135,173,380 2,148,438 1,133,024,943 1,020,530,625 2,539,063 1,017,991,562
- 221,006,396 126,457,577 94,548,819 243,725,719 107,842,356 135,883,363
1,754,125,526 261,515,001 1,492,610,525 1,703,538,850 317,595,803 1,385,943,047
Public sector entities
Others
Unrated
Total
Claims on banks with
original maturity of 3
months or less
- Yes Yes
Exposures
December 31, 2020 December 31, 2019
Rupees in '000
Retail
Amount
Outstanding
Deduction
CRMNet Amount
Rating
Category
Amount
Outstanding
Deduction
CRMNet Amount
Under standardized approach, the capital requirement is based on the credit rating assigned to the counterparties by the External Credit Assessment Institutions (ECAIs)
duly recognized by SBP for capital adequacy purposes. In this connection, the Bank utilizes the credit ratings assigned by ECAIs and has recognized agencies such as
PACRA (Pakistan Credit Rating Agency), JCR-VIS (Japan Credit Rating Company – Vital Information Systems), Fitch, Moody’s and Standard & Poors which are also
recognized by the SBP.
The selected final ratings for all exposures need to be translated to the standard rating grades given by the SBP. In this regard, the mapping tables to be used for
converting ECAI ratings to SBP rating grades are given below:
Public Sector
Enterprises
-
Mapping to SBP Rating Grades
-
128,224,106 116,068,499 12,155,607 207,843,973 198,465,857 9,378,116
Corporate
CAPITAL ADEQUACY AND LIQUIDITY DISCLOSURES - CONSOLIDATED
AS AT DECEMBER 31, 2020
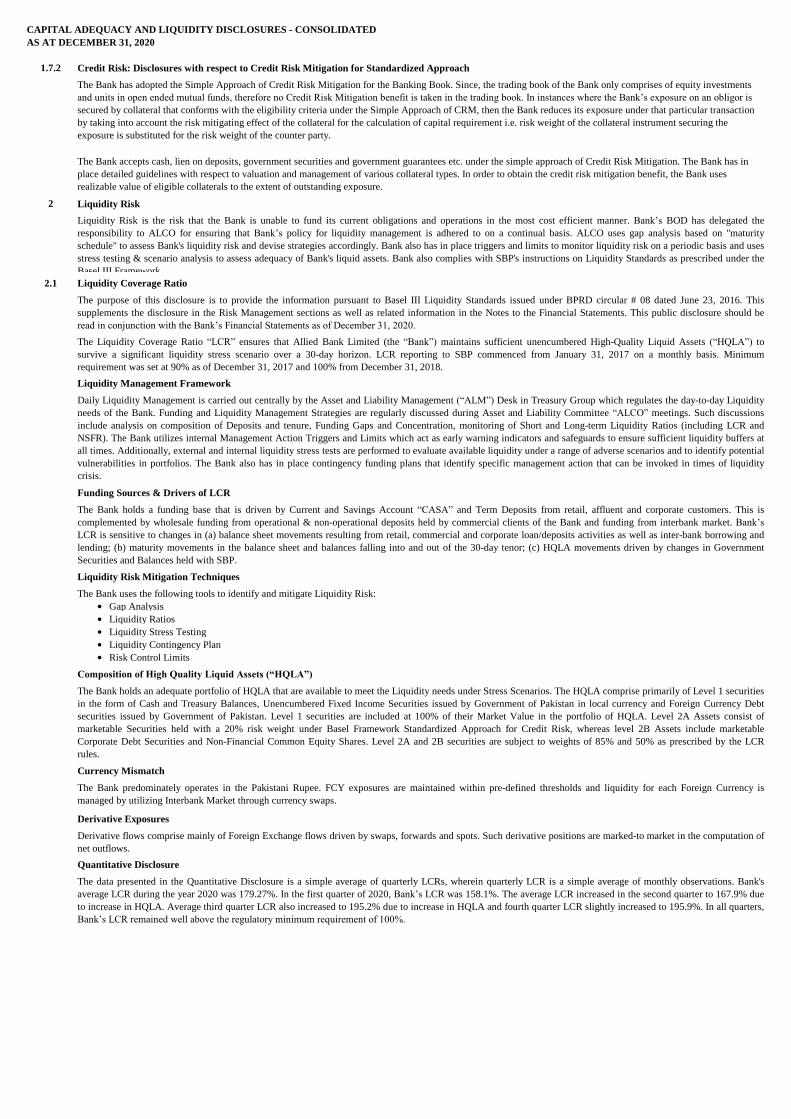
1.7.2
2 Liquidity Risk
2.1 Liquidity Coverage Ratio
Liquidity Management Framework
Funding Sources & Drivers of LCR
Liquidity Risk Mitigation Techniques
• Gap Analysis
• Liquidity Ratios
• Liquidity Stress Testing
• Liquidity Contingency Plan
• Risk Control Limits
Composition of High Quality Liquid Assets (“HQLA”)
Currency Mismatch
Derivative Exposures
Quantitative Disclosure
The data presented in the Quantitative Disclosure is a simple average of quarterly LCRs, wherein quarterly LCR is a simple average of monthly observations. Bank's
average LCR during the year 2020 was 179.27%. In the first quarter of 2020, Bank’s LCR was 158.1%. The average LCR increased in the second quarter to 167.9% due
to increase in HQLA. Average third quarter LCR also increased to 195.2% due to increase in HQLA and fourth quarter LCR slightly increased to 195.9%. In all quarters,
Bank’s LCR remained well above the regulatory minimum requirement of 100%.
Liquidity Risk is the risk that the Bank is unable to fund its current obligations and operations in the most cost efficient manner. Bank’s BOD has delegated the
responsibility to ALCO for ensuring that Bank’s policy for liquidity management is adhered to on a continual basis. ALCO uses gap analysis based on "maturity
schedule" to assess Bank's liquidity risk and devise strategies accordingly. Bank also has in place triggers and limits to monitor liquidity risk on a periodic basis and uses
stress testing & scenario analysis to assess adequacy of Bank's liquid assets. Bank also complies with SBP's instructions on Liquidity Standards as prescribed under the
Basel III Framework.
The purpose of this disclosure is to provide the information pursuant to Basel III Liquidity Standards issued under BPRD circular # 08 dated June 23, 2016. This
supplements the disclosure in the Risk Management sections as well as related information in the Notes to the Financial Statements. This public disclosure should be
read in conjunction with the Bank’s Financial Statements as of December 31, 2020.
The Liquidity Coverage Ratio “LCR” ensures that Allied Bank Limited (the “Bank”) maintains sufficient unencumbered High-Quality Liquid Assets (“HQLA”) to
survive a significant liquidity stress scenario over a 30-day horizon. LCR reporting to SBP commenced from January 31, 2017 on a monthly basis. Minimum
requirement was set at 90% as of December 31, 2017 and 100% from December 31, 2018.
Daily Liquidity Management is carried out centrally by the Asset and Liability Management (“ALM”) Desk in Treasury Group which regulates the day-to-day Liquidity
needs of the Bank. Funding and Liquidity Management Strategies are regularly discussed during Asset and Liability Committee “ALCO” meetings. Such discussions
include analysis on composition of Deposits and tenure, Funding Gaps and Concentration, monitoring of Short and Long-term Liquidity Ratios (including LCR and
NSFR). The Bank utilizes internal Management Action Triggers and Limits which act as early warning indicators and safeguards to ensure sufficient liquidity buffers at
all times. Additionally, external and internal liquidity stress tests are performed to evaluate available liquidity under a range of adverse scenarios and to identify potential
vulnerabilities in portfolios. The Bank also has in place contingency funding plans that identify specific management action that can be invoked in times of liquidity
crisis.
The Bank holds a funding base that is driven by Current and Savings Account “CASA” and Term Deposits from retail, affluent and corporate customers. This is
complemented by wholesale funding from operational & non-operational deposits held by commercial clients of the Bank and funding from interbank market. Bank’s
LCR is sensitive to changes in (a) balance sheet movements resulting from retail, commercial and corporate loan/deposits activities as well as inter-bank borrowing and
lending; (b) maturity movements in the balance sheet and balances falling into and out of the 30-day tenor; (c) HQLA movements driven by changes in Government
Securities and Balances held with SBP.
The Bank uses the following tools to identify and mitigate Liquidity Risk:
The Bank holds an adequate portfolio of HQLA that are available to meet the Liquidity needs under Stress Scenarios. The HQLA comprise primarily of Level 1 securities
in the form of Cash and Treasury Balances, Unencumbered Fixed Income Securities issued by Government of Pakistan in local currency and Foreign Currency Debt
securities issued by Government of Pakistan. Level 1 securities are included at 100% of their Market Value in the portfolio of HQLA. Level 2A Assets consist of
marketable Securities held with a 20% risk weight under Basel Framework Standardized Approach for Credit Risk, whereas level 2B Assets include marketable
Corporate Debt Securities and Non-Financial Common Equity Shares. Level 2A and 2B securities are subject to weights of 85% and 50% as prescribed by the LCR
rules.
The Bank predominately operates in the Pakistani Rupee. FCY exposures are maintained within pre-defined thresholds and liquidity for each Foreign Currency is
managed by utilizing Interbank Market through currency swaps.
Derivative flows comprise mainly of Foreign Exchange flows driven by swaps, forwards and spots. Such derivative positions are marked-to market in the computation of
net outflows.
Credit Risk: Disclosures with respect to Credit Risk Mitigation for Standardized Approach
The Bank has adopted the Simple Approach of Credit Risk Mitigation for the Banking Book. Since, the trading book of the Bank only comprises of equity investments
and units in open ended mutual funds, therefore no Credit Risk Mitigation benefit is taken in the trading book. In instances where the Bank’s exposure on an obligor is
secured by collateral that conforms with the eligibility criteria under the Simple Approach of CRM, then the Bank reduces its exposure under that particular transaction
by taking into account the risk mitigating effect of the collateral for the calculation of capital requirement i.e. risk weight of the collateral instrument securing the
exposure is substituted for the risk weight of the counter party.
The Bank accepts cash, lien on deposits, government securities and government guarantees etc. under the simple approach of Credit Risk Mitigation. The Bank has in
place detailed guidelines with respect to valuation and management of various collateral types. In order to obtain the credit risk mitigation benefit, the Bank uses
realizable value of eligible collaterals to the extent of outstanding exposure.

CAPITAL ADEQUACY AND LIQUIDITY DISCLOSURES - CONSOLIDATED
AS AT DECEMBER 31, 2020
TOTAL
UNWEIGHTED*
VALUE (average)
TOTAL
WEIGHTED**
VALUE
(average)
HIGH QUALITY LIQUID ASSETS
1 Total high quality liquid assets (HQLA) 526,731,728
CASH OUTLFLOWS
2 Retail deposits and deposits from small business customers of which: 652,880,266 57,185,084
2.1 Stable deposit 162,058,861 8,102,943
2.2 Less stable deposit 490,821,405 49,082,141
3 Unsecured wholesale funding of which: 441,361,657 240,503,872
3.1 Operational deposits (all counterparties) 3,299,182 824,045
3.2 Non-operational deposits (all counterparties) 387,558,960 206,426,385
3.3 Unsecured debt 50,503,515 33,253,442
4 Secured wholesale funding
5 Additional requirements of which: 19,942,676 3,434,665
5.1 Outflows related to derivative exposures and other collateral requirements 1,151,451 1,151,451
5.2 Outflows related to loss of funding on debt products - -
5.3 Credit and Liquidity facilities 18,791,225 2,283,214
6 Other contractual funding obligations 10,374,250 10,374,250
7 Other contingent funding obligations 201,987,844 4,976,543
8 TOTAL CASH OUTFLOWS - 316,474,414
CASH INFLOWS
9 Secured lending 12,932,682 -
10 Inflows from fully performing exposures 35,742,764 21,619,708
11 Other Cash inflows 2,336,349 1,028,527
12 TOTAL CASH INLFOWS 51,011,795 22,648,235
21 TOTAL HQLA 526,731,728
22 TOTAL NET CASH OUTFLOWS 293,826,179
23 LIQUIDITY COVERAGE RATIO 179.27%
* Unweighted values are calculated as outstanding balances maturing or callable within 30 days (for inflows and outflows).
** Weighted values are calculated after the application of respective haircuts (for HQLA) or inflow and outflow rates (for inflows and outflows).
2.2 Net Stable Funding Ratio
No Maturity < 6 months 6 months to < 1
yr ≥ 1 yr
Weighted value
ASF Item
1 Capital: 131,030,594 - - - 131,030,594
2 Regulatory capital 100,696,713 - - - 100,696,713
3 Other capital instruments 30,333,881 - - - 30,333,881
4 - 141,094,778 43,421,585 537,190,954 706,156,578
5 Stable deposits - 44,364,772 13,653,154 168,910,251 224,027,281
6 Less stable deposits - 96,730,006 29,768,431 368,280,703 482,129,297
7 Wholesale funding: - 297,597,905 45,945,146 151,427,885 266,710,497
8 Operational deposits - 675,634 180,363 2,398,865 1,627,431
9 Other wholesale funding - 296,922,271 45,764,783 149,029,020 265,083,066
10 Other liabilities: - 178,655,274 4,107,205 61,474,535 63,528,137
11 NSFR derivative liabilities - 2,017,360 - - -
12 - 176,637,914 4,107,205 61,474,535 63,528,137
13 Total ASF 1,167,425,806
RSF Item
14 Total NSFR high-quality liquid assets (HQLA) - - - - 254,341,465
15
7,236,502 - - 3,618,251
16 Performing loans and securities: - 120,566,309 44,205,034 371,508,005 365,898,172
17
- 8,299,435 - - 734,500
18
- 19,313,375 7,314,551 20,031,052 26,585,333
Performing loans to financial institutions secured by Level 1
HQLA
Performing loans to financial institutions secured by non-Level
1 HQLA and unsecured performing loans to financial
institutions
Rupees in '000
TOTAL ADJUSTED VALUE
Net Stable Funding Ratio “NSFR” ensures that Allied Bank Limited reduces funding risk over a longer time horizon by requiring banks to fund their activities with
sufficiently stable sources of funding in order to mitigate the risk of future funding stress. NSFR reporting to SBP commenced from March 31, 2017 on a quarterly basis.
Minimum requirement is set at 100%, effective from December 31, 2017 onwards.
Unweighted value by residual maturity
Rupees in '000
Retail deposits and deposit from small business customers:
All other liabilities and equity not included in other categories
Deposits held at other financial institutions for operational
purposes

CAPITAL ADEQUACY AND LIQUIDITY DISCLOSURES - CONSOLIDATED
AS AT DECEMBER 31, 2020
No Maturity < 6 months 6 months to < 1 ≥ 1 yr Weighted value
19
- 71,622,170 22,272,149 210,331,289 225,728,755
20
- 20,721,454 14,618,334 125,495,314 99,241,848
21
- 609,875 - 15,650,350 13,607,736
22 Other assets: - 26,480,498 4,977,675 88,616,971 104,732,423
23 Physical traded commodities, including gold - - - - -
24 Assets posted as initial margin for derivative contracts - - - - -
25 NSFR derivative assets - 772,732 - - 772,732
26
- - - - -
27 All other assets not included in the above categories - 25,707,766 4,977,675 88,616,971 103,959,691
28 Off-balance sheet items - 318,002,329 68,510,417 79,168,538 23,284,064
29 Total RSF - - - - 751,874,375
30 Net Stable Funding Ratio (%) - - - - 155.27%
Unweighted value by residual maturity
Rupees in '000
Performing loans to non- financial corporate clients, loans to
retail and small business customers, and loans to sovereigns,
central banks and PSEs, of which:
With a risk weight of less than or equal to 35% under the
Basel II Standardised Approach for credit risk
Securities that are not in default and do not qualify as HQLA
including exchange-traded equities.
NSFR derivative liabilities before deduction of variation
margin posted