Dynamics of Funding Liquidity and Risk-Taking - MDPI
16
Journal of Risk and Financial Management Article Dynamics of Funding Liquidity and Risk-Taking: Evidence from Commercial Banks Faisal Abbas 1 , Shoaib Ali 2 , Imran Yousaf 2 and Wing-Keung Wong 3,4,5, * Citation: Abbas, Faisal, Shoaib Ali, Imran Yousaf, and Wing-Keung Wong. 2021. Dynamics of Funding Liquidity and Risk-Taking: Evidence from Commercial Banks. Journal of Risk and Financial Management 14: 281. https://doi.org/10.3390/ jrfm14060281 Academic Editor: Stefano Zedda Received: 14 May 2021 Accepted: 16 June 2021 Published: 21 June 2021 Publisher’s Note: MDPI stays neutral with regard to jurisdictional claims in published maps and institutional affil- iations. Copyright: © 2021 by the authors. Licensee MDPI, Basel, Switzerland. This article is an open access article distributed under the terms and conditions of the Creative Commons Attribution (CC BY) license (https:// creativecommons.org/licenses/by/ 4.0/). 1 UCP Business School, University of Central Punjab, Lahore 54000, Pakistan; [email protected] 2 Air University School of Management, Air University, Islamabad 44000, Pakistan; [email protected] (S.A.); imranyousaf.fi[email protected] (I.Y.) 3 Department of Finance, Fintech & Blockchain Research Center, and Big Data Research Center, Asia University, Taichung 41354, Taiwan 4 Department of Medical Research, China Medical University Hospital, Taichung 40402, Taiwan 5 Department of Economics and Finance, The Hang Seng University of Hong Kong, Hong Kong 999077, China * Correspondence: [email protected]; Tel.: +886-4-2332-3456 Abstract: The purpose of this study is to investigate the impact of funding liquidity risk on the banks’ risk-taking behavior. To test the hypotheses, we apply the two-step system GMM technique on US commercial banks data from 2002 to 2018. We find that funding liquidity increases the banks’ risk-taking of US commercial banks. Furthermore, banks with higher deposits are less likely to face a funding shortage, and bank managers’ aggressive risk-taking activity is less likely to be monitored. Our findings infer that increases in bank funding liquidity increase both risk-weighted assets and liquidity creation, and deposit insurance creates a moral risk issue for banks taking excessive risks in response to deposit rises. The relationship between funding liquidity and the banks’ risk-taking varies with their capitalization and market conditions; the impact of funding liquidity on risk-taking is pronounced for well-capitalized banks and the Global Financial Crisis 2007. Our tests are robust for the usage of alternate proxy of funding liquidity and by controlling economic conditions. The findings of this study have implications for regulators to develop guidelines for the level of liquidity and risk-taking of commercial banks. Keywords: funding liquidity; risk-weighted assets; liquidity creations; Z-scores JEL Classification: G21; G01; G18 1. Introduction After the world financial crisis 2007–2008, rapidly growing literature has been inves- tigating numerous essential elements of Basel III 1 , such as bank regulations for higher capital requirements (Bitar et al. 2018; Cohen and Scatigna 2016; Deli and Hasan 2017), and its impact on the bank performance (Abbas et al. 2019; Asongu and Odhiambo 2019; Berger and Bouwman 2013; Ding et al. 2017), and bank risk-taking (Balla and Rose 2019; Bougatef and Mgadmi 2016). However, the studies are limited to investigating the impact of funding liquidity on bank risk-taking after the promulgation of Basel III (Dahir et al. 2018; DeYoung et al. 2018; Kim and Sohn 2017). It is important to examine the relationship between funding liquidity risk and banks’ risk-taking in the specific context of the US, because funding liquidity risk plays a significant role in all historical financial crisis and it is defined as the possibility that over a specific horizon, the bank becomes unable to settle obligation with immediacy (Drehmann and Nikolaou 2013). The first stream of research is to examine the effects of funding liquidity on the risk of assets and the overall risk-taking of US commercial banks; the next line examines the actions that well-capitalized, undercapitalized, too-big-to-fail banks conduct to take risks due to liquidity funding. It is unclear if the current focus on bank liquidity conditions laid out in J. Risk Financial Manag. 2021, 14, 281. https://doi.org/10.3390/jrfm14060281 https://www.mdpi.com/journal/jrfm
-
Upload
khangminh22 -
Category
Documents
-
view
3 -
download
0
Transcript of Dynamics of Funding Liquidity and Risk-Taking - MDPI

Journal of
Risk and FinancialManagement
Article
Dynamics of Funding Liquidity and Risk-Taking: Evidencefrom Commercial Banks
Faisal Abbas 1 , Shoaib Ali 2 , Imran Yousaf 2 and Wing-Keung Wong 3,4,5,*
�����������������
Citation: Abbas, Faisal, Shoaib Ali,
Imran Yousaf, and Wing-Keung
Wong. 2021. Dynamics of Funding
Liquidity and Risk-Taking: Evidence
from Commercial Banks. Journal of
Risk and Financial Management 14: 281.
https://doi.org/10.3390/
jrfm14060281
Academic Editor: Stefano Zedda
Received: 14 May 2021
Accepted: 16 June 2021
Published: 21 June 2021
Publisher’s Note: MDPI stays neutral
with regard to jurisdictional claims in
published maps and institutional affil-
iations.
Copyright: © 2021 by the authors.
Licensee MDPI, Basel, Switzerland.
This article is an open access article
distributed under the terms and
conditions of the Creative Commons
Attribution (CC BY) license (https://
creativecommons.org/licenses/by/
4.0/).
1 UCP Business School, University of Central Punjab, Lahore 54000, Pakistan; [email protected] Air University School of Management, Air University, Islamabad 44000, Pakistan;
[email protected] (S.A.); [email protected] (I.Y.)3 Department of Finance, Fintech & Blockchain Research Center, and Big Data Research Center, Asia University,
Taichung 41354, Taiwan4 Department of Medical Research, China Medical University Hospital, Taichung 40402, Taiwan5 Department of Economics and Finance, The Hang Seng University of Hong Kong, Hong Kong 999077, China* Correspondence: [email protected]; Tel.: +886-4-2332-3456
Abstract: The purpose of this study is to investigate the impact of funding liquidity risk on the banks’risk-taking behavior. To test the hypotheses, we apply the two-step system GMM technique onUS commercial banks data from 2002 to 2018. We find that funding liquidity increases the banks’risk-taking of US commercial banks. Furthermore, banks with higher deposits are less likely to face afunding shortage, and bank managers’ aggressive risk-taking activity is less likely to be monitored.Our findings infer that increases in bank funding liquidity increase both risk-weighted assets andliquidity creation, and deposit insurance creates a moral risk issue for banks taking excessive risksin response to deposit rises. The relationship between funding liquidity and the banks’ risk-takingvaries with their capitalization and market conditions; the impact of funding liquidity on risk-takingis pronounced for well-capitalized banks and the Global Financial Crisis 2007. Our tests are robustfor the usage of alternate proxy of funding liquidity and by controlling economic conditions. Thefindings of this study have implications for regulators to develop guidelines for the level of liquidityand risk-taking of commercial banks.
Keywords: funding liquidity; risk-weighted assets; liquidity creations; Z-scores
JEL Classification: G21; G01; G18
1. Introduction
After the world financial crisis 2007–2008, rapidly growing literature has been inves-tigating numerous essential elements of Basel III1, such as bank regulations for highercapital requirements (Bitar et al. 2018; Cohen and Scatigna 2016; Deli and Hasan 2017),and its impact on the bank performance (Abbas et al. 2019; Asongu and Odhiambo 2019;Berger and Bouwman 2013; Ding et al. 2017), and bank risk-taking (Balla and Rose 2019;Bougatef and Mgadmi 2016). However, the studies are limited to investigating the impactof funding liquidity on bank risk-taking after the promulgation of Basel III (Dahir et al.2018; DeYoung et al. 2018; Kim and Sohn 2017). It is important to examine the relationshipbetween funding liquidity risk and banks’ risk-taking in the specific context of the US,because funding liquidity risk plays a significant role in all historical financial crisis and itis defined as the possibility that over a specific horizon, the bank becomes unable to settleobligation with immediacy (Drehmann and Nikolaou 2013).
The first stream of research is to examine the effects of funding liquidity on the risk ofassets and the overall risk-taking of US commercial banks; the next line examines the actionsthat well-capitalized, undercapitalized, too-big-to-fail banks conduct to take risks due toliquidity funding. It is unclear if the current focus on bank liquidity conditions laid out in
J. Risk Financial Manag. 2021, 14, 281. https://doi.org/10.3390/jrfm14060281 https://www.mdpi.com/journal/jrfm

J. Risk Financial Manag. 2021, 14, 281 2 of 16
the recent Basel III rules internationally and in the US Dodd–Frank Act2 would render banksless volatile and the whole financial sector more resilient in the future (Khan et al. 2017;Tran 2020). Banks are usually advised to create a liquidity buffer to reduce liquidity lossesand protect against minor liquidity shocks (Rokhim and Min 2020). We are interested inaddressing the following questions on how funding liquidity influences the risk-taking ofUS large commercial banks. Is the impact of funding liquidity similar for well-capitalized,undercapitalized, and too-big-to-fail commercial banks?
Theoretically, with higher or stable funding liquidity, especially for deposits associatedwith higher risk-taking (Acharya and Naqvi 2012), in such conditions, a bank may lowerlending standards by reducing interest rates and ignore the scrutiny of credible borrowersto enhance the volume of loans. The losses due to counterparty defaults after a specific timemay cause a reduction in the wealth of shareholders. The counter-argument is also veryappealing means higher risk-taking may become beneficial for managers and shareholders.It is possible due to the moral hazard theory, where the manager exploits the depositinsurance schemes for shareholder and their benefits. The following studies favor thepositive relationship between funding liquidity and risk-taking (Acharya and Naqvi 2012;Khan et al. 2017; Lucchetta 2007; Tran 2020). Corporate finance supports higher risk-takingdue to free cash flow, as argued by (Jensen 1986). The negative relationship is also not lessappealing, as demonstrated by (Dahir et al. 2018; Drehmann and Nikolaou 2013; Jeitschkoand Jeung 2005; Rokhim and Min 2020).
Our debate is advocating the contribution and development of funding liquiditysignificance. Most of the studies are related to the current decade, particularly from the lastfive to six years. Our results provide that the commercial banks hold higher liquidity in thepost-crisis period than before-crisis. Said findings contradict the results of Khan et al. (2017)for the USA banking industry. We document that the difference between the findings maybe due to the following possibilities: The sample is not similar; the period of 2010 to 2018is entirely different from the period before the 2010 era due to regulatory changes andeconomic conditions. The next simulation uses a two-step system GMM method, whichmay provide robust and efficient estimators compared to panel regression estimation.We explain this dissimilarity in such a way that the approach of panel regression cannotintegrate the effect of simultaneity and endogeneity, which is possible in the presence ofcapital ratios, risk ratios, liquidity ratios, and profitability ratios.
In this study, we extend the work of Khan et al. (2017) by using similar assets riskmeasures risk-weighted assets to total assets, loan loss provision to total loans, and overallrisk measure as liquidity creation and Z-scores and funding liquidity measure as depositsto total assets. However, our study deviates from the following aspects: First, the studyused a comprehensive data set of commercial banks ranging from 2002 to 2018. Second,our estimates are more reliable than other studies in terms of methodological perspective.Most of the recent studies (Khan et al. 2017; Rokhim and Min 2020) use panel OLS3 withfixed and random effects to investigate the relationship between funding liquidity andrisk-taking while ignoring the aspects of endogeneity and simultaneity. After integratingthe question of cross-section heterogeneity, endogeneity, and simultaneity, we add to thecurrent studies in terms of sign and significance for their robustness. Third, the studyprovides a relationship between funding liquidity and risk-taking in a comparative wayfor more clarity and a deeper understanding by highlighting the results of the during-crisisperiod, well-capitalized, undercapitalized, and too-big-to-fail banks. The findings of thestudy enable regulators to redesign the banking regulator framework to better disciplineand regulate the perverse incentives of bank managers to take too much risk in the futurewhen bank deposits change.
The rest of the paper is structured as follows: The second section reviews the literatureon funding liquidity and risk-taking. The third section provides data collection sources,sample selection, definitions, and measurement of variables used in the analysis. Thefourth part explains the empirical findings. The fifth section of this research containsconclusions, limitations, and future recommendations.
J. Risk Financial Manag. 2021, 14, 281 3 of 16
2. Literature Review and Hypothesis Development
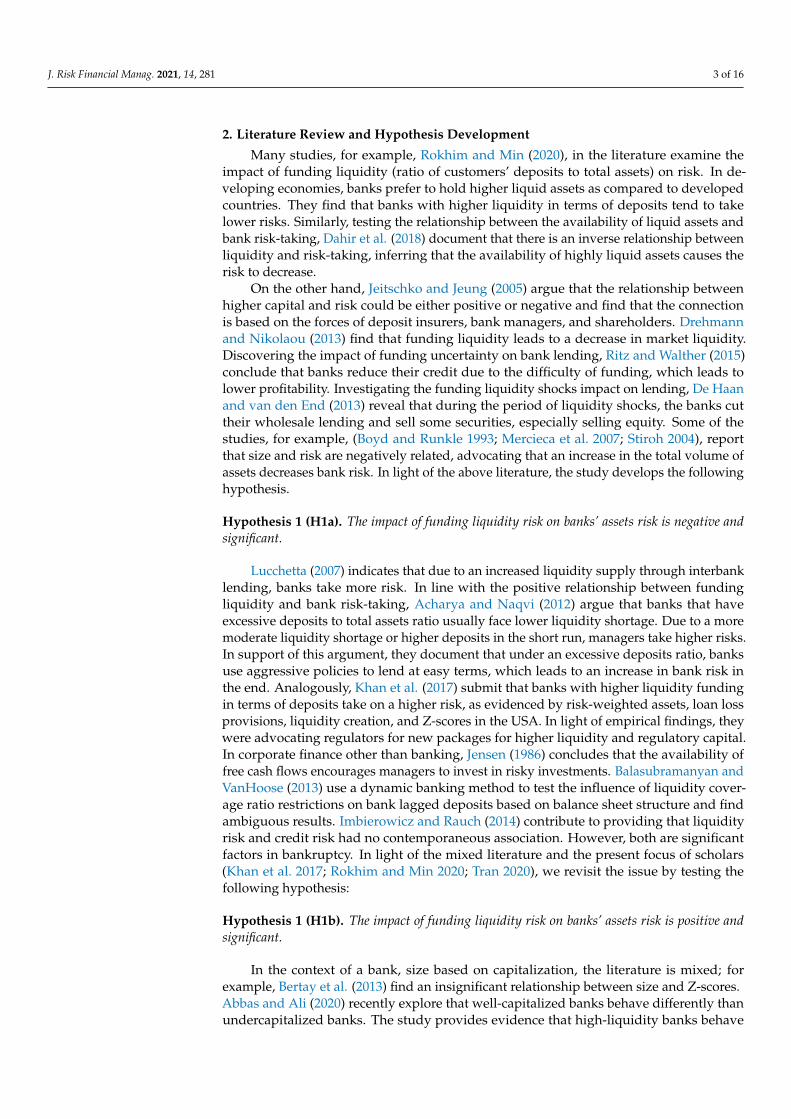
Many studies, for example, Rokhim and Min (2020), in the literature examine theimpact of funding liquidity (ratio of customers’ deposits to total assets) on risk. In de-veloping economies, banks prefer to hold higher liquid assets as compared to developedcountries. They find that banks with higher liquidity in terms of deposits tend to takelower risks. Similarly, testing the relationship between the availability of liquid assets andbank risk-taking, Dahir et al. (2018) document that there is an inverse relationship betweenliquidity and risk-taking, inferring that the availability of highly liquid assets causes therisk to decrease.
On the other hand, Jeitschko and Jeung (2005) argue that the relationship betweenhigher capital and risk could be either positive or negative and find that the connectionis based on the forces of deposit insurers, bank managers, and shareholders. Drehmannand Nikolaou (2013) find that funding liquidity leads to a decrease in market liquidity.Discovering the impact of funding uncertainty on bank lending, Ritz and Walther (2015)conclude that banks reduce their credit due to the difficulty of funding, which leads tolower profitability. Investigating the funding liquidity shocks impact on lending, De Haanand van den End (2013) reveal that during the period of liquidity shocks, the banks cuttheir wholesale lending and sell some securities, especially selling equity. Some of thestudies, for example, (Boyd and Runkle 1993; Mercieca et al. 2007; Stiroh 2004), reportthat size and risk are negatively related, advocating that an increase in the total volume ofassets decreases bank risk. In light of the above literature, the study develops the followinghypothesis.
Hypothesis 1 (H1a). The impact of funding liquidity risk on banks’ assets risk is negative andsignificant.
Lucchetta (2007) indicates that due to an increased liquidity supply through interbanklending, banks take more risk. In line with the positive relationship between fundingliquidity and bank risk-taking, Acharya and Naqvi (2012) argue that banks that haveexcessive deposits to total assets ratio usually face lower liquidity shortage. Due to a moremoderate liquidity shortage or higher deposits in the short run, managers take higher risks.In support of this argument, they document that under an excessive deposits ratio, banksuse aggressive policies to lend at easy terms, which leads to an increase in bank risk inthe end. Analogously, Khan et al. (2017) submit that banks with higher liquidity fundingin terms of deposits take on a higher risk, as evidenced by risk-weighted assets, loan lossprovisions, liquidity creation, and Z-scores in the USA. In light of empirical findings, theywere advocating regulators for new packages for higher liquidity and regulatory capital.In corporate finance other than banking, Jensen (1986) concludes that the availability offree cash flows encourages managers to invest in risky investments. Balasubramanyan andVanHoose (2013) use a dynamic banking method to test the influence of liquidity cover-age ratio restrictions on bank lagged deposits based on balance sheet structure and findambiguous results. Imbierowicz and Rauch (2014) contribute to providing that liquidityrisk and credit risk had no contemporaneous association. However, both are significantfactors in bankruptcy. In light of the mixed literature and the present focus of scholars(Khan et al. 2017; Rokhim and Min 2020; Tran 2020), we revisit the issue by testing thefollowing hypothesis:
Hypothesis 1 (H1b). The impact of funding liquidity risk on banks’ assets risk is positive andsignificant.
In the context of a bank, size based on capitalization, the literature is mixed; forexample, Bertay et al. (2013) find an insignificant relationship between size and Z-scores.Abbas and Ali (2020) recently explore that well-capitalized banks behave differently thanundercapitalized banks. The study provides evidence that high-liquidity banks behave

J. Risk Financial Manag. 2021, 14, 281 4 of 16
differently than low-liquidity banks. Chen et al. (2018) explore that external funding andmacroeconomic indicators are the significant factor of liquidity funding for commercialbanks by using the data for 12 developed economies of the world. Adusei (2015) analyzesthe rural banks of Ghana. The study concludes that the impact of liquidity risk varies withbank size; however, the relationship between liquidity risk and bank stability is positive andsignificant in Ghana. Acharya and Mora (2015) investigate the role of liquidity providersto influence the lending of commercial banks. The study demonstrates that a higher ratioof deposit withdrawal influences the lending risk of financial institutions. Abdul-Rahmanet al. (2018) examine the impact of liquidity to influence Islamic and conventional banks.The study opines that liquidity risk has equal importance for Islamic and conventionalbanks in the long run. (Abbas et al. 2020a, 2021) conclude that the behavior of banksis heterogeneous across well-capitalized, adequately capitalized, undercapitalized, high-and low-liquidity banks in the USA. In light of the above-discussed literature, the studydevelops the following hypothesis:
Hypothesis 2. The impact of funding liquidity to influence the risk-taking across well-capitalized,undercapitalized, and too-big-to-fail banks is similar.
Wagner (2007) develops a theoretical model to explain the phenomenon that higherliquidity reduces stability in a crisis period. Following the results, Tran (2020) analyzesthe impact of funding liquidity on bank lending using the sample of the USA banks.The study submits that the banks rely on deposits that have lower lending growth. Thestudy concludes that there was lower loan growth in the pre-crisis period and found norelationship between loan growth and funding liquidity in the post-crisis period. Ivashinaand Scharfstein (2010) opine that the higher availability of funding in terms of deposits incrisis causes an increase in lending. Abbas et al. (2021) find that banks behave differently indifferent economic conditions concerning risk-taking and holding of capital. Acharya andMora (2015) explore that the availability of funds to provide credits during the financialcrisis is only possible because of government support. Munteanu (2012) examines thecommercial banks of Romania and concludes that liquidity remains a critical indicatorthat influences banks during the financial crisis 2007–2008. In light of the above-discussedliterature, we developed the following hypothesis:
Hypothesis 3. The impact of liquidity funding to influence the risk-taking of banks remains similaracross pro, amid, and post-crisis eras.
3. Data and Methodology3.1. Data
The study uses unique and recent data for 945 U.S-chartered commercial banks thathave consolidated assets of $300 million or above, as of 31 December 20184. The data areretrieved over the period ranging from 2002 to 2018, which also covers the world financialcrisis 2007–2008 period5. All banks have to submit form Y-9C to the Federal Reserve Bankquarterly since 1986. The reporting information contains details in the form of an incomestatement and balance sheet for regulatory purposes. There are several reasons to studycommercial banks in current conditions: first, due to the importance and significant shareof commercial banks in the USA banking industry; second, the commercial banks remainan excellent laboratory for regulators to test the results of their recommendations; third,due to the dominating role in the expansion and development of the economy; and forth,commercial banks always remain the base for future decision-making in the USA.
To deal with outliers, we winsorized bank-specific variables at 1% and 99% by fol-lowing the recent studies by (Berger and Bouwman 2013; Khan et al. 2017). The datafor gross domestic product and inflation rate are collected from the world developmentindicators database6.

J. Risk Financial Manag. 2021, 14, 281 5 of 16
3.2. Empirical Model
We use a dynamic panel model to explore the influence of funding liquidity on theassets risk and overall risk-taking behavior of commercials in the USA. There are severalreasons to apply GMM: (1) GMM controls the endogeneity of the lagged reliant variable,(2) GMM incorporates the issue of first-order autocorrelations, (3) GMM controls themeasurement errors problem, (4) GMM reduces omitted bias issue, (5) GMM controlsthe unobserved heterogeneity problem in panels, and (6) GMM is the best choice in caseof more cross-sections than many periods. Arellano and Bond (1991) develop the GMMmethod to make the estimators consistent in the presence of a lagged dependent variable.Various studies have applied GMM in the field of banking, including (Lee and Hsieh 2013;Tran 2020). The standard form of a dynamic regression model is the basic equation for thefollowing linear regression model with endogenous variables:
Riski,t = α0 + β1Riski,t−1 + β2Funding liquidityi,t + β3control variablesi,t + ui,t (1)
where Riski,t (loan loss provisions, risk-weighted assets, liquidity creation, and Z-score)is the dependent variable; Funding liquidityi,t is the independent variable; the sign of“i” indicates cross-sections; and the notation “t” is time. Riski,t−1 represents the lag ofrisk-taking, and “ui,t” is an error term. The control variables include loan ratio, size, capital,profitability, economic growth, and inflation rate.
Model Specifications of Difference and System GMM
Difference GMM simulation of econometrics corrects the bias of endogeneity by trans-forming the included regressors through differencing them, and this method controls andremoves the fixed effects of the model. The first difference transformation has a weaknessof subtracts the last year’s observation from the present one, which significantly magnifiesthe interval in the case of an unbalanced panel. However, Arellano and Bover (1995) andBlundell and Bond (1998) provide the solution to avoid the bias of first differencing touse system GMM instead of difference GMM. This simulation deals with the problem ofendogeneity by introducing the use of more instruments that significantly magnify theefficiency of the model. This method has a feature to transform the instruments to makethem unconnected with panel fixed effects, which validate the assumption of exogenousregressors. These methods use a system of two equations that include original linearregression and transformed equations at a time to provide consistent parameters. Thenext feature of the system GMM method is that it uses the average of all future availableobservations of the series instead of the first differencing method. There is no problemwith gaps in the series, and it saves and minimizes the data loss.
The difference GMM model contains the following standard form:
lnRiski,t = φRiski,t−1 + β2Funding liquidity′ i,t + (ηi + εi,t) (2)
According to the theory of difference, GMM, the model is transferred to the firstdifference to remove the fixed effects from panels. The standard form for the above modelwould be:
∆lnRiski,t = φ∆Riski,t−1 + β2∆Funding liquidity′ i,t + ∆εi,t (3)
The above form of the transferred model equation represents that by transforming theregressors, the fixed effects are removed. No doubt, there is no problem with time, but theissue of endogeneity persists. The modified form of Equation (2) becomes
∆ui,t = ∆ηi + ∆εi,t (4)
ui,t − ui,t−1 = (ηi − ηi) + (εi,t − εi,t−1) = (εi,t − εi,t−1) (5)
The above producer removes the unknown fixed effects from the panel and remainsconstant according to the specified assumption. In this case, the lagged value of the depen-

J. Risk Financial Manag. 2021, 14, 281 6 of 16
dent variable becomes the instrument of the past level; this specification is represented inEquation (2).
The basic model of the system GMM approach is the following form:
lnRiski,t = φRiski,t−1 + β2Funding liqudity′ i,t + (ηi + εi,t) (6)
It is assumed that the above specification is a random walk equation and dependentvariables are persistent. Due to this reason, the results of difference GMM produce ineffi-cient estimates for parameters and bias particularly in finite samples. This means whena period remains limited, cross-sections contain large numbers. The empirical literatureprovides that the high bias and poor performance of difference GMM are due to poorinstruments. The system GMM uses the one equation in level forms with first differencesas instruments, whereas the second equation in the first differenced form with level asinstruments (Blundell and Bond 1998). The system GMM approach implicates a greaternumber of instruments. Still, Monte Carlo evidence recommends that where the periodis limited and dependent variable are found to be persistent, the use of system GMMreduces the bias of small samples. There is another aspect of the GMM method; if datacontain autocorrelation and heteroscedasticity, a two-step GMM method should be used tocreate a weighting matrix using residuals from the first phase. It is also argued that in thelimited sample, the standard errors are found to be downward biased. In this situation,the solution is recommended by researchers to apply the robust standard error approachdeveloped by Windmeijer (2005), which corrects the sample bias.
4. Results and Discussion4.1. Descriptive Statistics
Table 1 presents the descriptive statistics for the proxies used in this analysis. Thedetails include mean, standard deviation, and 5th, 25th, 75th, and 95th percentiles. Themeans value of loan loss provision is 0.0003 with a standard deviation of 0.0002. Theaverage value of risk-weighted assets is 0.723 with a standard deviation to be 0.11, theaverage value of liquidity creation is 0.204 with a standard deviation to be 0.069, and thedeposit ratio average value is 0.8459 with a standard deviation to be 0.135. Table 2 reportscorrelation estimates between explanatory variables. The statistics confirm that there is nohigh value of correlation between any pair of explanatory variables, inferring that thereis no issue of multicollinearity. The signs of correlation coefficients are in line with theeconomic theory. The values of the descriptive and correlation matrix are in line with thefollowing studies (Abbas and Ali 2020; Berger and Bouwman 2009).

J. Risk Financial Manag. 2021, 14, 281 7 of 16
Table 1. Variable measurement and descriptive statistics.
Variable Measurements Mean Std.Dev. P5 P25 P75 P95
Dependent Variables (Risk)Loan loss provisions (LLP) Loan loss provisions/total loans (Ali et al. 2019) 0.0003 0.0002 0.0003 0.0006 0.0039 0.0041Risk-weighted assets (RRWA) Risk-weighted assets/total assets 0.723 0.11 0.4972 0.65 0.8052 0.9001
Liquidity Creations Liquidity Creation = 0.5 (Illiquid Assets) + 0.5 (Liquid Liabilities) − 0.5(Liquid Assets) − 0.5 (Illiquid Liabilities) − 0.5 (Equity) (Khan et al. 2017) 0.204 0.069 0.0598 0.1582 0.2575 0.3619
Z-Score Return on assets plus equity to total assets scaled by the standard deviationof return on assets (Khan et al. 2017) 8.172 1.97 2.5664 12.308 38.8 49.2
Independent VariablesFunding liquidity Ratio of customer deposits to total assets (Khan et al. 2017) 0.8459 0.135 0.4756 0.6824 0.878 0.9010Control VariablesLoan Ratio Loans/total assets ratio (Abbas and Ali 2020) 0.01 0.122 0.0069 0.0221 0.1095 0.2310Size Natural Log of total assets (Ali et al. 2020) 13.554 0.95 12.259 12.854 14.134 0.1820Capital Total Equity/total Asset (Yousaf et al. 2019a) 0.102 0.018 0.0785 0.0871 0.1146 0.1661Return on Assets (ROA) Net income/total assets (Yousaf et al. 2019b) 0.01 0.005 −0.0009 0.0063 0.0129 0.0799Economic growth Annual growth rate of gross domestic product (Abbas et al. 2020b) 2.084 1.038 −0.2916 1.6773 2.8067 2.9010Inflation rate Consumer price index (Abbas and Masood 2020; Yousaf and Ali 2020) 1.92 0.665 0.759 1.535 2.065 2.1080
J. Risk Financial Manag. 2021, 14, 281 8 of 16
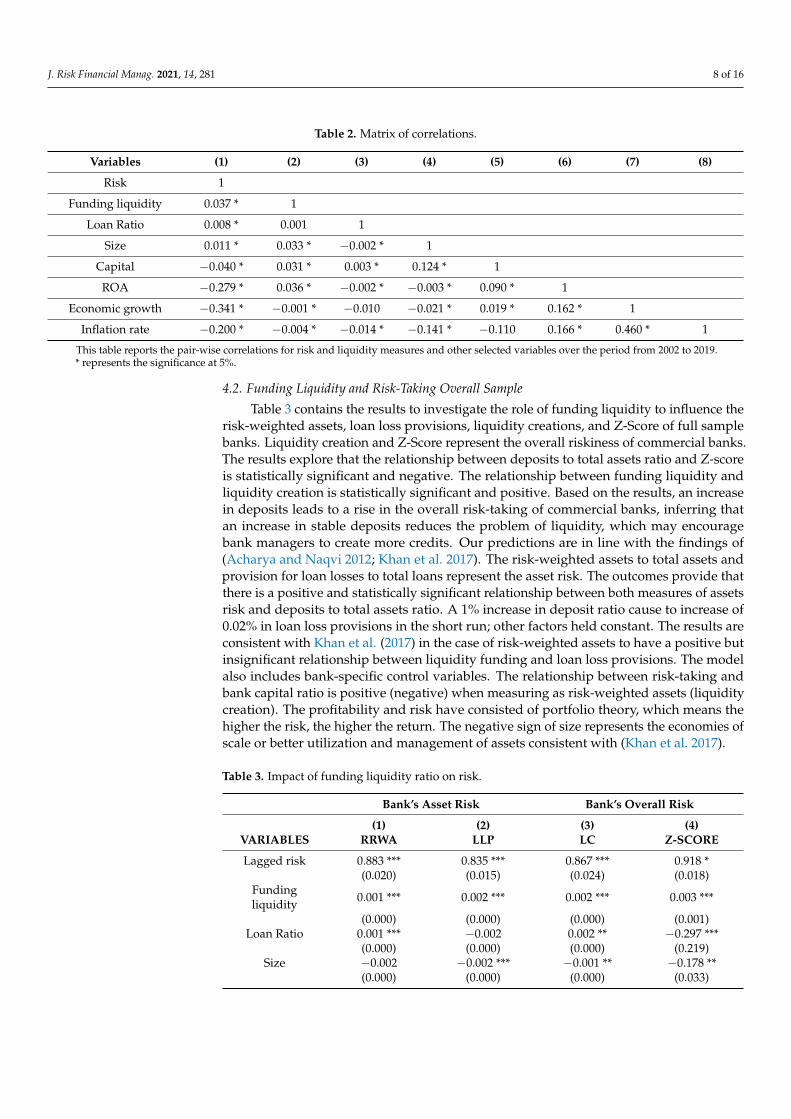
Table 2. Matrix of correlations.
Variables (1) (2) (3) (4) (5) (6) (7) (8)
Risk 1
Funding liquidity 0.037 * 1
Loan Ratio 0.008 * 0.001 1
Size 0.011 * 0.033 * −0.002 * 1
Capital −0.040 * 0.031 * 0.003 * 0.124 * 1
ROA −0.279 * 0.036 * −0.002 * −0.003 * 0.090 * 1
Economic growth −0.341 * −0.001 * −0.010 −0.021 * 0.019 * 0.162 * 1
Inflation rate −0.200 * −0.004 * −0.014 * −0.141 * −0.110 0.166 * 0.460 * 1
This table reports the pair-wise correlations for risk and liquidity measures and other selected variables over the period from 2002 to 2019.* represents the significance at 5%.
4.2. Funding Liquidity and Risk-Taking Overall Sample
Table 3 contains the results to investigate the role of funding liquidity to influence therisk-weighted assets, loan loss provisions, liquidity creations, and Z-Score of full samplebanks. Liquidity creation and Z-Score represent the overall riskiness of commercial banks.The results explore that the relationship between deposits to total assets ratio and Z-scoreis statistically significant and negative. The relationship between funding liquidity andliquidity creation is statistically significant and positive. Based on the results, an increasein deposits leads to a rise in the overall risk-taking of commercial banks, inferring thatan increase in stable deposits reduces the problem of liquidity, which may encouragebank managers to create more credits. Our predictions are in line with the findings of(Acharya and Naqvi 2012; Khan et al. 2017). The risk-weighted assets to total assets andprovision for loan losses to total loans represent the asset risk. The outcomes provide thatthere is a positive and statistically significant relationship between both measures of assetsrisk and deposits to total assets ratio. A 1% increase in deposit ratio cause to increase of0.02% in loan loss provisions in the short run; other factors held constant. The results areconsistent with Khan et al. (2017) in the case of risk-weighted assets to have a positive butinsignificant relationship between liquidity funding and loan loss provisions. The modelalso includes bank-specific control variables. The relationship between risk-taking andbank capital ratio is positive (negative) when measuring as risk-weighted assets (liquiditycreation). The profitability and risk have consisted of portfolio theory, which means thehigher the risk, the higher the return. The negative sign of size represents the economies ofscale or better utilization and management of assets consistent with (Khan et al. 2017).
Table 3. Impact of funding liquidity ratio on risk.
Bank’s Asset Risk Bank’s Overall Risk
(1) (2) (3) (4)VARIABLES RRWA LLP LC Z-SCORE
Lagged risk 0.883 *** 0.835 *** 0.867 *** 0.918 *(0.020) (0.015) (0.024) (0.018)
Fundingliquidity 0.001 *** 0.002 *** 0.002 *** 0.003 ***
(0.000) (0.000) (0.000) (0.001)Loan Ratio 0.001 *** −0.002 0.002 ** −0.297 ***
(0.000) (0.000) (0.000) (0.219)Size −0.002 −0.002 *** −0.001 ** −0.178 **
(0.000) (0.000) (0.000) (0.033)

J. Risk Financial Manag. 2021, 14, 281 9 of 16
Table 3. Cont.
Bank’s Asset Risk Bank’s Overall Risk
(1) (2) (3) (4)VARIABLES RRWA LLP LC Z-SCORE
Capital 0.207 *** −0.001 −0.350 *** 0.550 ***(0.033) (0.001) (0.034) (0.009)
ROA 0.717 *** −0.0509 *** −0.183 *** 0.126 ***(0.101) (0.004) (0.065) (0.012)
Constant 0.072 *** 0.002 *** 0.076 *** −4.019 *(0.013) (0.000) (0.009) (0.016)
Observations 15,071 15,007 14,991 14,917AR (1) 0.000 0.000 0.000 0.000AR (2) 0.114 0.442 0.987 0.730
Hansen value 0.678 0.090 0.151 0.430This table used two-step system GMM method to measure the impact of funding liquidity on banks’ assetsrisk (risk-weighted assets ratio and loan loss provision ratio) and overall risk (liquidity creation and Z-score).Robust standard errors are reported in parentheses. ***, **, * represent statistical significance at 1%, 5%, and 10%respectively.
4.3. The Impacts of Funding Liquidity on Risk-Taking across Banks Capitalization
Columns 1, 2, 3, and 4 of Table 4 report the results for well-capitalized banks. Here,we split the sample based on risk-based capital ratios, and the banks in which risk-basedcapital ratios are equal to or higher than 10% classified as well-capitalized. The outcomesreveal that the increase in funding liquidity as measured by the deposits to total assetsratio causes an increase in the riskiness of well-capitalized banks as evidenced by risk-weighted assets, loan loss provisions, liquidity creation, and Z-scores in the short runwhen other factors hold similar. The findings are consistent with (Acharya and Naqvi2012; Khan et al. 2017). The influence of funding liquidity of well-capitalized bankson risk-taking is economically significant with a 1% increase in liquidity funding ratioincreased risk-weighted assets, loan loss provisions, and liquidity creations by 9.4%, 0.1%,and 4.5%, respectively, whereas it decreased by Z-scores 4.0%. The findings hold afterincorporating the bank size, profitability, loan growth, and equity ratios as provided byloan loss provision, liquidity creation, and Z-scores similar results.
Columns 5, 6, 7, and 8 of Table 4 provide findings for undercapitalized banks’ liquidityfunding and risk-taking behavior. The outcomes explore that an increase in funding liquid-ity in terms of deposits causes an increase in the assets and overall risk of undercapitalizedbanks, as evidenced by risk-weighted assets, loan loss provisions, liquidity creation, andZ-scores. The results document that the impact of the increase in the deposits is positiveand statistically significant on risk-weighted assets, loan loss provision, and liquiditycreations and Z-scores. The findings are in line with the studies of (Acharya and Naqvi2012; Khan et al. 2017). The impact of the funding liquidity ratio of undercapitalized bankson risk-taking is economically significant as a 1% increase in liquidity funding increasedrisk-weighted assets, loan loss provisions, and liquidity creations by 2.38%, 0.028%, and0.2%, respectively. It is observed that the behavior of an increase in riskiness is higher in thecase of undercapitalized banks than well-capitalized banks. Theoretically, the conservativebehavior of well-capitalized banks to take lower risk is due to the stricter regulations andvigilant monitoring of significant important financial intuitions. The sign of coefficientremains consistent even after controlling for equity to total assets, loan growth, natural logof total assets, and profitability.

J. Risk Financial Manag. 2021, 14, 281 10 of 16
Table 4. Funding liquidity ratio and risk varies across banks capitalization.
Well-Capitalized Undercapitalized Too Big to Fail
(1) (2) (3) (4) (5) (6) (7) (8) (9) (10) (11) (12)
VARIABLES TR LLR LC Z-SCORE TR LLR LC Z-SCORE TR LLR LC Z-SCORE
Lagged risk 0.789 *** 0.851 *** 0.894 *** 0.111 *** 0.720 *** 0.962 *** 0.503 *** 0.770 *** 0.884 *** 0.836 *** 0.868 *** 0.099 ***(0.069) (0.047) (0.068) (0.086) (0.037) (0.017) (0.055) (0.026) (0.020) (0.015) (0.024) (0.000)
Funding liquidity 0.094 *** 0.002 *** 0.045 *** −0.040 ** 0.024 *** 0.003 *** 0.020 *** 0.002 *** 0.001 *** 0.002 *** 0.005 *** −0.821 ***(0.025) (0.000) (0.013) (0.020) (0.022) (0.000) (0.020) (0.000) (0.000) (0.000) (0.000) (0.000)
Funding liquidity *TB −0.006 *** −0.002 *** −0.002 ** −0.012 **(0.002) (0.001) (0.001) (0.000)
Loan Ratio 0.069 0.018 *** 0.076 −1.985 0.001 −0.006 *** 0.001 −0.498 *** 0.001 ** −0.003 0.001 ** −0.412(0.148) (0.006) (0.095) (1.479) (0.000) (0.000) (0.000) (0.345) (0.000) (0.000) (0.000) (0.047)
Size −0.002 −0.008 −0.004 *** −0.429 *** −0.001 −0.001 *** −0.002 *** −0.303 *** −0.001 ** −0.009 *** −0.008 ** 0.574 **(0.002) (0.005) (0.001) (0.162) (0.000) (0.000) (0.000) (0.041) (0.000) (0.000) (0.000) (0.000)
Capital 0.239 ** 0.004 −0.308 *** 0.304 *** 0.089 ** −0.007 *** −0.729 *** 0.851 *** 0.206 *** −0.001 −0.349 *** 0.601 ***(0.120) (0.003) (0.096) (0.012) (0.037) (0.001) (0.055) (0.284) (0.033) (0.001) (0.034) (0.004)
ROA 0.231 −0.020 ** −0.288 * 0.121 *** 0.583 *** −0.064 *** −0.538 *** 0.148 *** 0.710 *** −0.050 *** −0.183 *** 0.221 ***(0.265) (0.009) (0.174) (0.150) (0.117) (0.005) (0.085) (0.741) (0.101) (0.004) (0.065) (0.040)
Constant 0.072 * 0.001 0.070 *** −0.904 ** 0.024 * 0.001 0.055 *** 3.823 *** 0.076 *** 0.002 *** 0.077 *** −2.790 **(0.036) (0.001) (0.025) (1.424) (0.013) (0.110) (0.010) (0.741) (0.013) (0.901) (0.009) (2.612)
Observations 2310 2294 2230 2281 4265 4265 4265 4265 15,071 15,007 14,991 900AR (1) 0.000 0.000 0.000 0.000 0.000 0.000 0.000 0.000 0.000 0.000 0.000 0.000AR (2) 0.538 0.08 0.7 0.417 0.8 0.89 0.341 0.565 0.114 0.44 0.988 0.255
Hansen value 0.111 0.764 0.381 0.904 0.313 0.47 0.203 0.227 0.54 0.074 0.128 0.213
This table used the two-step system GMM method to measure the impact of funding liquidity on banks’ assets risk (risk-weighted assets ratio and loan loss provision ratio) and overall risk (liquidity creation andZ-score) for well, adequately and undercapitalized Banks. Robust standard errors are reported in parentheses. ***, **, * represent statistical significance at 1%, 5%, and 10%, respectively.

J. Risk Financial Manag. 2021, 14, 281 11 of 16
Columns 9, 10, 11, and 12 of Table 4 present the results for the relationship of liquidityfunding and bank risk-taking of too-big-to-fail banks. We follow the procedure of FederalReserve Banks to separate the too-big-to-fail banks. The study used TB as an interactiveterm for too-big-to-fail banks. The results provide that there is an inverse relationshipbetween liquidity funding and bank’s assets and overall riskiness at 1% and 5% level ofsignificance for too-big-to-fail banks, respectively. The findings are in line with the previousstudies by Khan et al. (2017) and contradicting the results of (De Haan and Poghosyan2012). The findings support that larger banks are inclined to decrease in the assets andoverall risk in response to stable funding liquidity as a comparison of smaller banks, whichis consistent with (De Haan and Poghosyan 2012; Khan et al. 2017). The argument mayhave an explanation due to the higher importance of big banks and due to the stricterregulations and vigilant monitoring within the banking industry. The larger banks take alower risk and keep their status more solvent and sounder to secure a high rating amongcounterparts. The results show a positive relationship between deposits to total assets andrisk-weighted assets, liquidity creation, and Z-scores for too-big-to-fail banks in the shortrun—other things held unchanged.
4.4. Funding Liquidity and Risk-Taking during Financial Crisis
Table 5 reports the results for the effect of liquidity funding on bank assets andoverall risk. The study uses a dummy variable to predict the impact of liquidity fundingon risk-taking in crisis conditions. The study used a financial crisis dummy (FCD) toincorporate a conclusion similar to (Khan et al. 2017; Yousaf et al. 2018). The coefficientshows that the loan loss provision, liquidity creation, and Z-scores are statistical andsignificant relationships with liquidity funding during the crisis period consistent with(Khan et al. 2017). This indicates that liquidity funding remains significant for commercialbanks to take the risk during the crisis period. In the case of the Z-score the findings revealthat when a deposit increases in the crisis period, the commercial banks become morestable, the results are in line with (Khan et al. 2017). The justification for the increase in bankdeposits during the crisis period is due to lower return on securities, due that depositorsprefer to deposit the money instead of investing in risky securities, as argued by (Acharyaand Mora 2015). The coefficient of the intercept dummy is significant for risk-weightedassets, liquidity creations, and Z-scores. The results show that commercial banks weretaking a risk in crisis as evidenced by risk-weighted assets, liquidity creation, and Z-scores.
Table 5. Relationship between funding liquidity ratio and banks risk during crisis.
Bank’s Asset Risk Bank’s Overall Risk
(1) (2) (3) (4)VARIABLES RRWA LLP LC Z-SCORE
Lagged risk 0.888 *** 0.845 *** 0.868 *** 0.112 ***(0.022) (0.015) (0.024) (0.000)
Funding liquidity 0.001 *** 0.002 *** 0.002 *** −0.016 ***(0.000) (0.000) (0.000) (0.012)
Funding liquidity *FCD 0.001 0.001 0.005 0.009(0.000) (0.000) (0.000) (0.013)
FCD 0.003 ** 0.004 −0.001 ** 0.071 ***(0.001) (0.000) (0.000) (2.021)
Loan Ratio 0.001 ** −0.002 0.006 ** −0.765(0.000) (0.000) (0.000) (2.070)
Size −0.001 * −0.009 *** −0.008 ** 0.439 **(0.000) (0.000) (0.000) (0.001)
Capital 0.203 *** 0.003 −0.350 *** 0.901 ***(0.033) (0.001) (0.034) (0.003)
ROA 0.700 *** −0.046 *** −0.189 *** 0.023 ***(0.101) (0.004) (0.065) (0.000)

J. Risk Financial Manag. 2021, 14, 281 12 of 16
Table 5. Cont.
Bank’s Asset Risk Bank’s Overall Risk
(1) (2) (3) (4)VARIABLES RRWA LLP LC Z-SCORE
Constant 0.072 *** 0.002 *** 0.077 *** −0.015 ***(0.013) (0.000) (0.009) (2.979)
Observations 15,071 15,007 14,991 2882AR (1) 0.000 0.000 0.000 0.000AR (2) 0.131 0.410 0.939 0.495
Hansen value 0.754 0.100 0.161 0.824This table used two-step system GMM method to measure the impact of funding liquidity on banks’ assets risk(Risk-weighted assets ratio and Loan loss provision ratio) and overall risk (Liquidity creation and Z-score) byusing the data of US commercial banks from 2002–2009. Robust standard errors are reported in parentheses. ***,**, * represent statistical significance at 1%, 5% and 10% respectively.
4.5. Robustness Check
Table 6 shows the impact of liquidity funding on bank risk-taking after controllingthe macroeconomic factors. We follow the suggestion of Khan et al. (2017) and test therobustness of our baseline findings by controlling the macroeconomic factors. We addedthe gross domestic product and inflation rate to the baseline equations. These factors arecommonly employed as the representative of economic conditions in the literature (Buchet al. 2014; Khan et al. 2017). The findings are similar to the baseline results after addingmacroeconomic factors. The results show that there is a positive and statistically significantrelationship between funding liquidity and risk-weighted assets, loan loss provisions, andliquidity creations as the base results and consistent with (Acharya and Mora 2015; Khanet al. 2017). The results show that an increase in funding liquidity increases the risk-takingof commercial banks, as evidenced by risk-weighted assets, loan loss provisions, liquiditycreations, and Z-scores. However, in our results, the impact of economic growth on bankrisk-taking is positive and significant, which is contradicting the findings of (Khan et al.2017). Theoretically, an increase in economic growth leads to an increase in the demand forfunds, leading to an increase in banks’ riskiness in terms of higher risk-weighted assetsand liquidity creations in the short run when other things remain constant.
Table 6. Impact of funding liquidity on risk after including macroeconomic factors.
Bank’s Asset Risk Bank’s Overall Risk
(1) (2) (3) (4)VARIABLES RRWA LLP LC Z-SCORE
Lagged risk 0.924 *** 0.959 *** 0.865 *** :(0.021) (0.016) (0.024) (0.018)
Funding liquidity 0.007 *** 0.002 *** 0.002 *** −0.003 ***(0.000) (0.000) (0.000) (0.001)
Loan Ratio 0.001 *** −0.007 *** 0.006 ** −0.268(0.000) (0.001) (0.002) (1.210)
Size −0.008 * −0.001 *** −0.008 ** 0.089 ***(0.000) (0.000) (0.000) (0.047)
Capital 0.210 *** −0.002 ** −0.354 *** 0.594 ***(0.032) (0.001) (0.034) (0.270)
ROA 0.572 *** −0.034 *** −0.191 *** 0.131 ***(0.105) (0.004) (0.068) (0.500)
Economic growth 0.002 *** −0.002 *** 0.004 0.025(0.000) (0.000) (0.000) (0.021)
Inflation rate 0.004 *** −0.002 *** −0.001 −0.1034 ***(0.000) (0.000) (0.000) (0.447)

J. Risk Financial Manag. 2021, 14, 281 13 of 16
Table 6. Cont.
Bank’s Asset Risk Bank’s Overall Risk
(1) (2) (3) (4)VARIABLES RRWA LLP LC Z-SCORE
Constant 0.030 ** 0.002 *** 0.076 *** −4.254 ***(0.013) (0.000) (0.009) (0.413)
Observations 15,071 15,007 14,991 14,909AR (1) 0.000 0.000 0.000 0.000AR (2) 0.126 0.838 0.959 0.782
Hansen value 0.133 0.204 0.155 0.988This table used two-step system GMM method to measure the impact of funding liquidity on banks’ assets risk(Risk-weighted assets ratio and Loan loss provision ratio) and overall risk (Liquidity creation and Z-score) byusing the data of US commercial banks from 2002–2009. Robust standard errors are reported in parentheses. ***,**, * represent statistical significance at 1%, 5% and 10% respectively.
5. Conclusions
Both funding liquidity and risk-taking behavior are important indicators to measurethe stability of commercial banks, especially in the period of the post-Global financial crisis.It is, therefore, important to investigate the relationship between funding liquidity andrisk-taking behavior for banks because the findings could be useful for both regulatorsand bank managers to make better decisions for the stability of commercial banks. Thus,numerous researchers explore the risk-taking behavior of commercial banks in the recentdecade. However, most, if not all, researchers examine the relationship for some specificbanks, but not for any well-capitalized, under-capitalized, and too-big-to-fail commercialbank. The lack of insights in the context of well-capitalized, under-capitalized, and too-big-to-fail commercial banks in the USA motives us to bridge the gap in the literature toinvestigate the impacts of funding liquidity on risk-taking behavior of commercial banks.
We use several financial and economic theories to explore the possible relationships be-tween funding liquidity and commercial banks’ risk-taking behavior in the USA, includingthe theory of regulatory hypothesis, moral hazard hypothesis, and agency theory. Basedon the theories, we set four hypotheses to state the relationships between funding liquidityand risk-taking behavior for commercial banks in the USA. To test the hypotheses, we usethe GMM technique because it helps to control the issues of endogeneity, autocorrelation,and cross-sectional heteroscedasticity.
Our findings confirm that banks with stable funding liquidity are inclined towardhigher risk-taking. We assume that banks with higher deposits have a lower risk attitudeon funding liquidity because deposits reduce run risks from banks in the presence ofdeposit insurance. Banks with higher deposits are less likely to face a funding shortage,and bank managers’ aggressive risk-taking activity is less likely to be monitored. Ourresults demonstrate that increases in bank funding liquidity increase both risk-weightedassets and the creation of liquidity, which is consistent with the findings in some studiessuch as Acharya and Naqvi (2012) that banks aggressively lend at lower loan rates inresponse to higher deposits. Our findings are also consistent with other findings in theliterature, for example, Keeley (1990) and Khan et al. (2017), in which deposit insurancecreates the issue of moral risk for banks taking excessive risks in response to deposit rises.Furthermore, we find that deposits are negatively related to banks’ Z-score for both well-capitalized and too-big-to-fail banks. The relationship between funding liquidity and therisk-taking behavior of the bank varies with their capitalization. The findings indicate thatwell-capitalized banks hold lower liquidity and lend more to secure higher profits. Thesecond cause may be the role of deposit insurance, and the third reason is the availability ofbailout packages. The undercapitalized banks hold higher liquidity and take a lower risk,but they still face difficulty in raising capital on short notice. Our analysis also finds thatthe impact of funding liquidity is even stronger during the period of the Global FinancialCrisis 2007, inferring that banks would take a higher risk during the crisis. The results areconsistent after adding other macroeconomic variables to the model.

J. Risk Financial Manag. 2021, 14, 281 14 of 16
Both academics and practitioners could benefit from the following inferences drawnfrom our findings. First, regulators should not only focus on improving bank capitalfor the stability of commercial banks but also consider the role of funding liquidity toinfluence the risk-taking behavior of commercial banks. Second, the heterogeneity in ourfindings has implications for policymakers in commercial banks for the improvementof commercial banks’ stability. Third, our findings help commercial bank regulators toconsider set regulations not only for well-capitalized and too-big-to-fail banks but also forunder-capitalized banks. Moreover, our findings also help commercial bank regulatorsformulate guidelines for banks’ risk-taking activities. Our study provides a thoroughunderstanding of the relationships between the risk of funding liquidity and banks’ risk-taking behavior, which could help regulators to redesign the banking regulatory frameworkto get better discipline and regulate the perverse incentives for bank managers to takehigher risk in the future when bank deposits change, especially in the period of crisis.
In this paper, we apply the GMM technique to examine the relationship betweenfunding liquidity and commercial banks’ risk-taking behavior. An extension of our papercould apply the GMM technique to examine other issues, for example, between stocks andREITs (Chiang et al. 2008). Readers may refer to Chang et al. (2018) for other importantissues that one could use the GMM technique to examine. For the limitations, the first limi-tation of our study is that our paper conducts analysis for banks listed only at Bankscope.The second limitation of our study is that the data are not for a very long period. Thus,extensions of our study include collecting data for a longer period and obtaining data ofbanks listed not only at Bankscope but also in other cities/countries. Future research couldalso be conducted to study the interrelationship between risk-based capital, risk-taking,and profitability of US commercial banks by incorporating both mediating and moderatingroles of other economic variables and bank regulations to get better in-depth insights.
Author Contributions: Conceptualization and methodology, F.A. and S.A.; formal analysis, F.A., S.A.,I.Y.; data curation, F.A., W.-K.W.; writing—original draft preparation, F.A., S.A., I.Y.; writing—reviewand editing, I.Y., W.-K.W.; project administration and funding, W.-K.W. All authors have read andagreed to the published version of the manuscript.
Funding: This research has been supported by the Asia University, China Medical UniversityHospital, The Hang Seng University of Hong Kong, Research Grants Council (RGC) of Hong Kong(project number 12500915), and Ministry of Science and Technology (MOST, Project Numbers 106-2410-H-468-002 and 107-2410-H-468-002-MY3), Taiwan.
Institutional Review Board Statement: Not applicable.
Informed Consent Statement: Not applicable.
Data Availability Statement: The data presented in this study are available on request from thecorresponding author.
Acknowledgments: The fourth author would like to thank Robert B. Miller and Howard E. Thomp-son for their continuous guidance and encouragement. This research has been supported by theAsia University, China Medical University Hospital, The Hang Seng University of Hong Kong, Re-search Grants Council (RGC) of Hong Kong (project number 12500915), and Ministry of Science andTechnology (MOST, Project Numbers 106-2410-H-468-002 and 107-2410-H-468-002-MY3), Taiwan.
Conflicts of Interest: The authors declare no conflict of interest.
Notes1 For detail see (http://www.bis.org/bcbs/basel3.htm, accessed on 21 December 2019).2 Dodd Frank Wall Street Reform and Consumer Protection Act 2010.3 Ordinary least squares.4 https://www.federalreserve.gov/releases/lbr/current/, accessed on 21 December 2019.5 For more details of crisis: (Umar et al. 2021a, 2021b, 2021c) also use the world financial crisis as subsample.6 https://data.worldbank.org/indicator, accessed on 21 December 2019.

J. Risk Financial Manag. 2021, 14, 281 15 of 16
ReferencesAbbas, Faisal, and Omar Masood. 2020. How do large commercial banks adjust capital ratios: Empirical evidence from the US?
Economic Research-Ekonomska Istraživanja 33: 1849–66. [CrossRef]Abbas, Faisal, and Shoaib Ali. 2020. Dynamics of bank capital ratios and risk-taking: Evidence from US commercial banks. Cogent
Economics & Finance 8: 1838693. [CrossRef]Abbas, Faisal, Noshaba Batool, and Fiaz Ahmad Sulehri. 2020a. Investment, Financial, Trade Freedom and Risk-taking: Empirical
Evidence from USA. Studies of Applied Economics 39. [CrossRef]Abbas, Faisal, Omar Masood, Shoaib Ali, and Sohail Rizwan. 2021. How Do Capital Ratios Affect Bank Risk-Taking: New Evidence
from the United States. SAGE Open 11: 2158244020979678. [CrossRef]Abbas, Faisal, Shahid Iqbal, and Bilal Aziz. 2019. The impact of bank capital, bank liquidity and credit risk on profitability in postcrisis
period: A comparative study of US and Asia. Cogent Economics & Finance 7: 1605683. [CrossRef]Abbas, Faisal, Shoaib Ali, Imran Yousaf, and Sohail Rizwan. 2020b. How commercial banks adjust capital ratios: Empirical evidence
from the USA? Cogent Business & Management 7: 1859848. [CrossRef]Abdul-Rahman, Aisyah, Ahmad Azam Sulaiman, and Noor Latifah Hanim Mohd Said. 2018. Does financing structure affects bank
liquidity risk? Pacific-Basin Finance Journal 52: 26–39. [CrossRef]Acharya, Viral V., and Nada Mora. 2015. A crisis of banks as liquidity providers. The Journal of Finance 70: 1–43. [CrossRef]Acharya, Viral, and Hassan Naqvi. 2012. The seeds of a crisis: A theory of bank liquidity and risk taking over the business cycle.
Journal of Financial Economics 106: 349–66. [CrossRef]Adusei, Michael. 2015. The impact of bank size and funding risk on bank stability. Cogent Economics & Finance 3: 1111489.Ali, Shoaib, Imran Yousaf, and Muhammad Naveed. 2020. Role of credit rating in determining capital structure: Evidence from
non-financial sector of Pakistan. Studies of Applied Economics 38. [CrossRef]Ali, Shoaib, Syed Zulfiqar Ali Shah, and Summaya Chughtai. 2019. The Role of Bank Competition in influencing Bank Liquidity
Creation: Evidence from China. Journal of Business & Economics 11: 21–34.Arellano, Manuel, and Olympia Bover. 1995. Another look at the instrumental variable estimation of error-components models. Journal
of Econometrics 68: 29–51. [CrossRef]Arellano, Manuel, and Stephen Bond. 1991. Some tests of specification for panel data: Monte Carlo evidence and an application to
employment equations. The Review of Economic Studies 58: 277–97. [CrossRef]Asongu, Simplice A., and Nicholas M. Odhiambo. 2019. Size, efficiency, market power, and economies of scale in the African banking
sector. Financial Innovation 5: 4. [CrossRef]Balasubramanyan, Lakshmi, and David D. VanHoose. 2013. Bank balance sheet dynamics under a regulatory liquidity-coverage-ratio
constraint. Journal of Macroeconomics 37: 53–67. [CrossRef]Balla, Eliana, and Morgan J. Rose. 2019. Earnings, risk-taking, and capital accumulation in small and large community banks. Journal of
Banking & Finance 103: 36–50.Berger, Allen N., and Christa HS Bouwman. 2009. Bank liquidity creation. The Review of Financial Studies 22: 3779–837. [CrossRef]Berger, Allen N., and Christa HS Bouwman. 2013. How does capital affect bank performance during financial crises? Journal of Financial
Economics 109: 146–76. [CrossRef]Bertay, Ata Can, Asli Demirgüç-Kunt, and Harry Huizinga. 2013. Do we need big banks? Evidence on performance, strategy and
market discipline. Journal of Financial Intermediation 22: 532–58. [CrossRef]Bitar, Mohammad, Kuntara Pukthuanthong, and Thomas Walker. 2018. The effect of capital ratios on the risk, efficiency and profitability
of banks: Evidence from OECD countries. Journal of International Financial Markets, Institutions and Money 53: 227–62. [CrossRef]Blundell, Richard, and Stephen Bond. 1998. Initial conditions and moment restrictions in dynamic panel data models. Journal of
Econometrics 87: 115–43. [CrossRef]Bougatef, Khemaies, and Nidhal Mgadmi. 2016. The impact of prudential regulation on bank capital and risk-taking: The case of
MENA countries. The Spanish Review of Financial Economics 14: 51–56. [CrossRef]Boyd, John H., and David E. Runkle. 1993. Size and performance of banking firms: Testing the predictions of theory. Journal of Monetary
Economics 31: 47–67. [CrossRef]Buch, Claudia M., Sandra Eickmeier, and Esteban Prieto. 2014. Macroeconomic factors and microlevel bank behavior. Journal of Money,
credit and Banking 46: 715–51. [CrossRef]Chang, Chia-Lin, Michael McAleer, and Wing-Keung Wong. 2018. Big data, computational science, economics, finance, marketing,
management, and psychology: Connections. Journal of Risk and Financial Management 11: 15. [CrossRef]Chen, Yi-Kai, Chung-Hua Shen, Lanfeng Kao, and Chuan-Yi Yeh. 2018. Bank liquidity risk and performance. Review of Pacific Basin
Financial Markets and Policies 21: 1850007. [CrossRef]Chiang, Thomas Chinan, Hooi Hooi Lean, and Wing-Keung Wong. 2008. Do REITs Outperform Stocks and Fixed-Income Assets?
New Evidence from Mean-Variance and Stochastic Dominance Approaches. Journal of Risk and Financial Management 1: 1–40.[CrossRef]
Cohen, Benjamin H., and Michela Scatigna. 2016. Banks and capital requirements: Channels of adjustment. Journal of Banking & Finance69: S56–S69.
Dahir, Ahmed Mohamed, Fauziah Binti Mahat, and Noor Azman Bin Ali. 2018. Funding liquidity risk and bank risk-taking in BRICScountries. International Journal of Emerging Markets 13: 231–48. [CrossRef]

J. Risk Financial Manag. 2021, 14, 281 16 of 16
De Haan, Jakob, and Tigran Poghosyan. 2012. Bank size, market concentration, and bank earnings volatility in the US. Journal ofInternational Financial Markets, Institutions and Money 22: 35–54. [CrossRef]
De Haan, Leo, and Jan Willem van den End. 2013. Bank liquidity, the maturity ladder, and regulation. Journal of Banking & Finance 37:3930–50.
Deli, Yota D., and Iftekhar Hasan. 2017. Real effects of bank capital regulations: Global evidence. Journal of Banking & Finance 82:217–28.
DeYoung, Robert, Isabelle Distinguin, and Amine Tarazi. 2018. The joint regulation of bank liquidity and bank capital. Journal ofFinancial Intermediation 34: 32–46. [CrossRef]
Ding, Ning, Hung-Gay Fung, and Jingyi Jia. 2017. Comparison of Bank Profitability in China and the USA. China & World Economy 25:90–108.
Drehmann, Mathias, and Kleopatra Nikolaou. 2013. Funding liquidity risk: Definition and measurement. Journal of Banking & Finance37: 2173–82.
Imbierowicz, Björn, and Christian Rauch. 2014. The relationship between liquidity risk and credit risk in banks. Journal of Banking &Finance 40: 242–56.
Ivashina, Victoria, and David Scharfstein. 2010. Bank lending during the financial crisis of 2008. Journal of Financial Economics 97:319–38. [CrossRef]
Jeitschko, Thomas D., and Shin Dong Jeung. 2005. Incentives for risk-taking in banking–A unified approach. Journal of Banking &Finance 29: 759–77.
Jensen, Michael C. 1986. Agency costs of free cash flow, corporate finance, and takeovers. The American Economic Review 76: 323–29.Keeley, Michael C. 1990. Deposit insurance, risk, and market power in banking. The American Economic Review 80: 1183–200.Khan, Muhammad Saifuddin, Harald Scheule, and Eliza Wu. 2017. Funding liquidity and bank risk taking. Journal of Banking & Finance
82: 203–16.Kim, Dohan, and Wook Sohn. 2017. The effect of bank capital on lending: Does liquidity matter? Journal of Banking & Finance 77:
95–107.Lee, Chien-Chiang, and Meng-Fen Hsieh. 2013. The impact of bank capital on profitability and risk in Asian banking. Journal of
International Money and Finance 32: 251–81. [CrossRef]Lucchetta, Marcella. 2007. What do data say about monetary policy, bank liquidity and bank risk taking? Economic Notes 36: 189–203.
[CrossRef]Mercieca, Steve, Klaus Schaeck, and Simon Wolfe. 2007. Small European banks: Benefits from diversification? Journal of Banking &
Finance 31: 1975–98.Munteanu, Ionica. 2012. Bank liquidity and its determinants in Romania. Procedia Economics and Finance 3: 993–98. [CrossRef]Ritz, Robert A., and Ansgar Walther. 2015. How do banks respond to increased funding uncertainty? Journal of Financial Intermediation
24: 386–410. [CrossRef]Rokhim, Rofikoh, and In Min. 2020. Funding Liquidity and Risk Taking Behavior in Southeast Asian Banks. Emerging Markets Finance
and Trade 56: 305–13. [CrossRef]Stiroh, Kevin J. 2004. Diversification in banking: Is noninterest income the answer? Journal of Money, Credit and Banking 36: 853–82.
[CrossRef]Tran, Dung Viet. 2020. Funding liquidity and bank lending. Cogent Economics & Finance 8: 1734324.Umar, Zaghum, Imran Yousaf, and Adam Zaremba. 2021b. Comovements between Heavily Shorted Stocks during a Market Squeeze:
Lessons from the GameStop Trading Frenzy. Research in International Business and Finance 58: 101453. [CrossRef]Umar, Zaghum, Imran Yousaf, and David Y. Aharon. 2021a. The relationship between yield curve components and equity sectorial
indices: Evidence from China. Pacific-Basin Finance Journal 68: 101591. [CrossRef]Umar, Zaghum, Mariya Gubareva, Imran Yousaf, and Shoaib Ali. 2021c. A tale of company fundamentals vs sentiment driven pricing:
The case of GameStop. Journal of Behavioral and Experimental Finance 30: 100501. [CrossRef]Wagner, Wolf. 2007. The liquidity of bank assets and banking stability. Journal of Banking & Finance 31: 121–139.Windmeijer, Frank. 2005. A finite sample correction for the variance of linear efficient two-step GMM estimators. Journal of Econometrics
126: 25–51. [CrossRef]Yousaf, Imran, and Shoaib Ali. 2020. Integration between real estate and stock markets: New evidence from Pakistan. International
Journal of Housing Markets and Analysis 13: 887–900. [CrossRef]Yousaf, Imran, Shoaib Ali, and Arshad Hasan. 2019b. Effect of family control on corporate financing decisions of firms: Evidence from
Pakistan. Studies of Applied Economics 37: 155–70. [CrossRef]Yousaf, Imran, Shoaib Ali, and Arshad Hassan. 2019a. Effect of family control on corporate dividend policy of firms in Pakistan.
Financial Innovation 5: 42. [CrossRef]Yousaf, Imran, Shoaib Ali, and Syed Zulfiqar Ali Shah. 2018. Herding behavior in Ramadan and financial crises: The case of the
Pakistani stock market. Financial Innovation 4: 1–14. [CrossRef]