Appendix E: Air Quality, Health Risk and Greenhouse Gas ...
428
Butterfield and Sentinel Quarries Expansion San Bernardino National Forest Butterfield‐Sentinel Draft EIR/EIS March 2018 Appendices Sespe Consulting, Inc. Appendix E: Air Quality, Health Risk and Greenhouse Gas Impact Assessment (Sespe, updated October 2017)
-
Upload
khangminh22 -
Category
Documents
-
view
0 -
download
0
Transcript of Appendix E: Air Quality, Health Risk and Greenhouse Gas ...
Butterfield and Sentinel Quarries Expansion San Bernardino National Forest
Butterfield‐Sentinel Draft EIR/EISMarch 2018
Appendices Sespe Consulting, Inc.
Appendix E: Air Quality, Health Risk and Greenhouse Gas Impact Assessment (Sespe, updated October 2017)
374 Poli Street, Suite 200 • Ventura, CA 93001 Office (805) 275-1515 • Fax (805) 667-8104
Sespe Consulting, Inc.
AIR QUALITY, HEALTH RISK AND GREENHOUSE GAS IMPACT ASSESSMENT
Omya Butterfield and Sentinel Quarries Expansion San Bernardino National Forest
October 25, 2017
Prepared for: U.S. Forest Service
41374 North Shore Drive Fawnskin, California 92333
Prepared by: Sespe Consulting, Inc. 374 Poli Street, Suite 200 Ventura, California 93001 (805) 275-1515

374 Poli Street, Suite 200 • Ventura, CA 93001 Office (805) 275-1515 • Fax (805) 667-8104
OM01_SB-AQHRCCIA_fnl.docx i Sespe Consulting, Inc.
AIR QUALITY, HEALTH RISK AND GREENHOUSE GAS IMPACT ASSESSMENT
Omya Butterfield and Sentinel Quarries Expansion San Bernardino National Forest
October 25, 2017
TABLE OF CONTENTS
1.0 Introduction ..........................................................................................................................1
2.0 Environmental Setting ............................................................................................................2
2.1 Existing Sources and Receptors .......................................................................................... 2 2.2 Meteorology and Topography ............................................................................................ 2 2.3 Ambient Air Quality ............................................................................................................ 3 2.4 Ambient Health Risk ........................................................................................................... 4 2.5 Effects of Greenhouse Gases .............................................................................................. 5 2.6 Class I and Class II Wilderness Areas................................................................................... 6
3.0 Regulatory Setting .................................................................................................................8
3.1 Air Quality Regulatory Framework ..................................................................................... 8 3.2 Conformity ........................................................................................................................ 14 3.3 Federal Land Managers’ Air Quality Related Values ......................................................... 14 3.4 Health Risk ........................................................................................................................ 15 3.5 Greenhouse Gas Regulations ............................................................................................ 16
3.5.1 Federal ................................................................................................................. 16 3.5.2 California .............................................................................................................. 17 3.5.3 San Bernardino County ........................................................................................ 20
4.0 Significance Thresholds ........................................................................................................ 21
4.1 Air Quality ......................................................................................................................... 21 4.2 Climate Change ................................................................................................................. 23
5.0 Assessment Methodology .................................................................................................... 23
5.1 Baseline Activity Levels ..................................................................................................... 23 5.1.1 Vehicles ................................................................................................................ 24 5.1.2 Crushing ............................................................................................................... 26 5.1.3 Roads ................................................................................................................... 27 5.1.4 Mining Activities .................................................................................................. 27
5.2 Baseline Emissions ............................................................................................................ 28 5.3 Proposed Activity Levels and Emissions ........................................................................... 33 5.4 Dispersion Modeling ......................................................................................................... 37
5.4.1 Sources ................................................................................................................. 37

Butterfield and Sentinel Quarries Expansion Air Quality & Greenhouse Gas Impact Assessment San Bernardino National Forest October 25, 2017
OM01_SB-AQHRCCIA_fnl.docx ii Sespe Consulting, Inc.
5.4.2 Terrain .................................................................................................................. 37 5.4.3 Meteorological Data ............................................................................................ 38 5.4.4 Receptors ............................................................................................................. 41
5.5 Health Risk Assessment .................................................................................................... 43 5.5.1 Inhalation Pathway .............................................................................................. 43 5.5.2 Ingestion Pathway ............................................................................................... 44 5.5.3 Dermal Pathway ................................................................................................... 45 5.5.4 Mother’s Milk Pathway ........................................................................................ 46
6.0 Project Impacts .................................................................................................................... 46
6.1 Regional Air Quality Impacts ............................................................................................. 46 6.2 Localized Criteria Pollutant Impacts ................................................................................. 47 6.3 Federal Conformity ........................................................................................................... 49 6.4 Class I Wilderness Area Impacts ....................................................................................... 49 6.5 Greenhouse Gas Emissions Impact ................................................................................... 51
7.0 Proposed Mitigations and Residual Impacts .......................................................................... 51
7.1 Mitigated Mass-Based Criteria Pollutant Impacts ............................................................ 51 7.2 Health Risk Impacts ........................................................................................................... 52
8.0 Alternatives ......................................................................................................................... 53
8.1 Alternative 1: No Action/Mining under Current Entitlements ........................................ 53 8.2 Alternative 2: Proposed Project ....................................................................................... 54 8.3 Alternative 3: Partial Implementation – Butterfield Quarry Expansion Only .................. 54 8.4 Alternative 4: Combined Production with the White Knob Quarry ................................. 54
9.0 References ........................................................................................................................... 56
TABLES Table 1 Ambient Pollutant Concentrations .................................................................................... 4 Table 2 Ambient Air Quality Standards ........................................................................................... 9 Table 3 MDAQMD Attainment Status .......................................................................................... 11 Table 4 MDAQMD Attainment Plans ............................................................................................ 11 Table 5 Significant Emissions Thresholds ..................................................................................... 22 Table 6 Baseline Activity Levels .................................................................................................... 24 Table 7 Baseline Vehicle Activity .................................................................................................. 25 Table 8 Baseline Stationary Source Throughputs ......................................................................... 27 Table 9 Baseline Activity on Roads ............................................................................................... 27 Table 10 Vehicle Emissions Factors ................................................................................................ 28 Table 11 Baseline Vehicle Emissions .............................................................................................. 30 Table 12 Baseline Vehicle Emissions by Location ........................................................................... 31 Table 13 Baseline Emissions on Roads ........................................................................................... 31 Table 14 Baseline Mining and Processing Emissions ...................................................................... 32 Table 15 Baseline Mining and Processing Combustion Emissions ................................................. 33 Table 16 Activity Scaling Factors..................................................................................................... 33 Table 17 Project Vehicle Emissions by Location ............................................................................. 34

Butterfield and Sentinel Quarries Expansion Air Quality & Greenhouse Gas Impact Assessment San Bernardino National Forest October 25, 2017
OM01_SB-AQHRCCIA_fnl.docx iii Sespe Consulting, Inc.
Table 18 Proposed Emissions on Roads.......................................................................................... 34 Table 19 Proposed Particulate Matter ........................................................................................... 35 Table 20 Project Mining and Processing Combustion Emissions ................................................... 36 Table 21 Incremental Change in Emissions from Project ............................................................... 36 Table 22 Nearby Receptors ............................................................................................................ 42 Table 23 Deposition Parameters .................................................................................................... 42 Table 24 Point Estimates of Residential Daily Breathing Rates by Age Group ................................ 44 Table 25 Soil Ingestion Rate Point Estimates by Age Group ........................................................... 45 Table 26 Annual Dermal Loading Point Estimates by Age Group .................................................... 45 Table 27 Project Emissions and Significance Determination .......................................................... 46 Table 28 PM10 and PM2.5 Concentrations at Point of Maximum Impact and Significance Determination 48 Table 29 Comparison of Project Emissions with Major Modification Thresholds........................... 50 Table 30 Mitigated Emissions Comparisons .................................................................................... 52 Table 31 Mitigated PM10 and PM2.5 Concentrations at PMI and Significance Determination ........ 52 Table 32 Health Risk Impacts and Significance Determination ....................................................... 53 Table 33 Alternative 4 Emissions Comparison (77% from Butterfield and Sentinel Quarries) ....... 54 Table 34 Alternative 4 Concentration at Point of Maximum Impact .............................................. 55 Table 35 Alternative 4 Health Risk Impacts and Significance Determinations ................................ 55 Table 36 Mitigated Alternative 4 Concentrations at PMI and Significance Determinations .......... 56 FIGURES Figure 1: Site Location Figure 2: Site Plan Figure 3: SCAQMD MATES IV Risk Map Figure 4: Wind Rose Figure 5: Wind Speed Frequency Distribution Figure 6: MM5 Modeling System Flow Chart Figure 7: Discrete Receptors in HRA Model Figure 8: Boundary Receptors in PM Model Figure 9: Grid Receptors in HRA Model Figure 10: Grid Receptors in Deposition Model Figure 11: Annual Deposition Figure 12: Daily Deposition Figure 13: Cancer Risk at Sensitive Receptors – Project Increment Figure 14: Chronic Risk at Sensitive Receptors – Project Increment Figure 15: Cancer Risk at Worker Receptors – Project Increment Figure 16: Chronic Risk at Worker Receptors – Project Increment Figure 17: Acute Risk – Project Increment Figure 18: Cancer Risk at Sensitive Receptors – Alternative 4 Figure 19: Chronic Risk at Sensitive Receptors – Alternative 4 Figure 20: Cancer Risk at Worker Receptors – Alternative 4 Figure 21: Chronic Risk at Worker Receptors – Alternative 4 Figure 22: Acute Risk – Alternative 4 Figure 23: Elevation Profile
Butterfield and Sentinel Quarries Expansion Air Quality & Greenhouse Gas Impact Assessment San Bernardino National Forest October 25, 2017
OM01_SB-AQHRCCIA_fnl.docx iv Sespe Consulting, Inc.
APPENDICES Appendix A: Figures Appendix B: Health Effects of Air Pollutants Appendix C: Ambient Pollutant Concentrations Appendix D: San Gorgonio Wilderness Area Description Appendix E: MDAQMD Rule Development Calendar Appendix F: MDAQMD Mineral Industry Emissions Inventory Guidelines Appendix G: Baseline Data from Omya Appendix H: Baseline Emissions Calculations Appendix I: Project Emissions Appendix J: Meteorological Data Used in Modeling Appendix K: Mitigated Emissions Appendix L: Alternative 4 Emissions Appendix M: Modeling Files on Electronic Media Appendix N: Excerpt from Air Quality Study for Proposed South Quarry Project

374 Poli Street, Suite 200 • Ventura, CA 93001 Office (805) 275-1515 • Fax (805) 667-8104
OM01_SB-AQHRCCIA_fnl.docx 1 Sespe Consulting, Inc.
AIR QUALITY, HEALTH RISK AND GREENHOUSE GAS IMPACT ASSESSMENT
Omya Butterfield and Sentinel Quarries Expansion
County of San Bernardino, California
October 25, 2017
1.0 INTRODUCTION
This Air Quality, Health Risk and Greenhouse Gas Impact Assessment (AQIA) report has been prepared for the Omya Butterfield and Sentinel Quarries Expansion project (“Project”). The Project is located in the San Bernardino National Forest (SBNF) approximately 7.5 miles south of the intersection of State Route 18 and State Route 247 in the Lucerne Valley. The Project involves the expansion of two quarries and related fill areas which are located on Crystal Creek Road before the intersection with Forest Road 3N16. Primary crushing occurs near the quarries and ore is hauled north down the mountains to the Lucerne Valley Processing Plant (LVPP) located near the intersection of Crystal Creek Road and Powerline Road. Omya operates one other quarry in the area. The White Knob Quarry is located approximately 4.2 miles west-southwest of the LVPP. Ore from the White Knob Quarry is hauled to the LVPP. White Knob Quarry completed a separate CEQA evaluation for proposed expansions on 8/6/2015 when PC approved the Project and the certified EIR. Cloudy and Claudia Quarries are located near the terminus of Crystal Creek Road south of Forest Road 3N16. Cloudy and Claudia Quarries are inactive and currently being reclaimed. The combined production from all the operating quarries (Butterfield, Sentinel, and White Knob) is limited by the LVPP maximum production rate. The Project would allow up to the maximum production rate of 680,000 tons per year of finished ore to be extracted exclusively from the Butterfield and Sentinel quarries. This would result in no material being quarried at White Knob which is an indirect effect of the Project that necessitates calculation of White Knob emissions in the air quality baseline. Moreover, vehicular activity data provided by Omya does not distinguish which units operate in each quarry. Thus, the emissions from vehicles are calculated for the fleet and apportioned to quarries based on throughput amount and to units operating on roads by vehicle miles traveled (VMT). Impacts from alternatives to the Project are assessed in this report and described in 7.2.0. The alternatives include: - Alternative 1: No Action - Alternative 2: Proposed Project - Alternative 3: Partial Implementation – Butterfield Expansion only; and - Alternative 4: Mixed Production with White Knob. Alternative 4 represents a scenario where the maximum amount of ore can be quarried from Butterfield and Sentinel without exceeding the tons per year significance thresholds identified in Section 4.0.

Butterfield and Sentinel Quarries Expansion Air Quality and Greenhouse Gas Impact Assessment San Bernardino National Forest October 25, 2017
OM01_SB-AQHRCCIA_fnl.docx 2 Sespe Consulting, Inc.
2.0 ENVIRONMENTAL SETTING
Air pollutants are regulated in order to protect public health and welfare. Health effects of common air pollutants are presented in Appendix B. Effects of pollutants on public welfare include visibility impairment; and impacts to animals, crops, vegetation, and buildings. 2.1 Existing Sources and Receptors
The Omya LVPP receives ore from the Butterfield, Sentinel and White Knob Quarries. Omya provided information on historical activity levels and equipment that was used to develop a baseline for the Project. In general, the quarries and LVPP consist of operations and equipment that emit fugitive dust and diesel exhaust. Detailed discussion of how the baseline emissions were quantified is presented in Section 5.0. 2.2 Meteorology and Topography
The MDAQMD Guidelines (2011) state:
The Mojave Desert Air Basin (MDAB) is an assemblage of mountain ranges interspersed with long broad valleys that often contain dry lakes. Many of the lower mountains which dot the vast terrain rise from 1,000 to 4,000 feet above the valley floor. Prevailing winds in the MDAB are out of the west and southwest. These prevailing winds are due to the proximity of the MDAB to coastal and central regions and the blocking nature of the Sierra Nevada mountains to the north; air masses pushed onshore in southern California by differential heating are channeled through the MDAB. The MDAB is separated from the southern California coastal and central California valley regions by mountains (highest elevation approximately 10,000 feet), whose passes form the main channels for these air masses. The Antelope Valley is bordered in the northwest by the Tehachapi Mountains, separated from the Sierra Nevadas in the north by the Tehachapi Pass (3,800 ft elevation). The Antelope Valley is bordered in the south by the San Gabriel Mountains, bisected by Soledad Canyon (3,300 ft). The Mojave Desert is bordered in the southwest by the San Bernardino Mountains, separated from the San Gabriels by the Cajon Pass (4,200 ft). A lesser channel lies between the San Bernardino Mountains and the Little San Bernardino Mountains (the Morongo Valley). During the summer the MDAB is generally influenced by a Pacific Subtropical High cell that sits off the coast, inhibiting cloud formation and encouraging daytime solar heating. The MDAB is rarely influenced by cold air masses moving south from Canada and Alaska, as these frontal systems are weak and diffuse by the time the reach the desert. Most desert moisture arrives from infrequent warm, moist and unstable air masses from the south. The MDAB averages between three and seven inches of precipitation per year (from 16 to 30 days with at least 0.01 inches of precipitation). The MDAB is classified as a dry-hot desert climate (BWh), with portions classified as dry-very hot desert (BWhh), to indicate at least three months have maximum average temperatures over 100.4° F.

Butterfield and Sentinel Quarries Expansion Air Quality and Greenhouse Gas Impact Assessment San Bernardino National Forest October 25, 2017
OM01_SB-AQHRCCIA_fnl.docx 3 Sespe Consulting, Inc.
2.3 Ambient Air Quality
Appendix C contains the airborne pollutant concentration data and number of days exceeding each Ambient Air Quality Standard (AAQS). Table 1 summarizes the maximum short term and annual average ambient concentrations measured during the last five years (2010 to 2014). The closest air monitoring station to the Project is located at the Lucerne Valley Middle School and measures only PM10. PM10 has standards with 24-hour (state and federal) and annual (state) averaging periods. Maximum concentrations at this station were less than both state and federal 24-hour standards in four of the last five years with 2013 exceeding both standards due to an exceptional event (e.g., forest fire). 24-hour concentrations were in the range of 30 to 50 µg/m3 with exception of 2013 which is reported to be 143 µg/m3. Annual average concentrations for the last five years were in the range of 14 to 17 µg/m3. There was insufficient data available to determine the number of days exceeding the 24-hour standard in three (state) and four (federal) of the last five years but maximum 24-hour concentrations and the number of measurements made (i.e., Year Coverage column in Appendix C) indicate that there were few, if any, days exceeding the PM10 standards. The Hesperia-Olive Street monitoring station is the closest location where ozone is monitored. Ozone has standards with 1-hour (state) and 8-hour (state and federal) averaging periods. Maximum concentrations at this station exceeded the state 1-hour and both 8-hour standards in each of the last five years with 1-hour concentrations ranging from 0.100 to 0.132 ppm and 8-hour concentrations ranging from 0.085 to 0.114 ppm. Ozone concentrations exceeded the state 1-hour standard between 1 and 24 days per year. The state 8-hour standard was exceeded between 35 and 101 days per year and the federal 8-hour standard was exceeded between 12 and 67 days per year (Appendix C). The Victorville monitoring station collects a full suite of pollutants and is the closest station to monitor for CO, NO2 and SO2. CO has 1-hour and 8-hour standards (state and federal) while NO2 has 1-hour and annual average standards (state and federal) and SO2 has 1-hour, 24-hour (state and federal), and annual average. There was insufficient data to determine the maximum 1-hour carbon monoxide concentration at any monitoring station in the County. 8-hour carbon monoxide concentrations ranged from 1.51 ppm to 5.17 ppm with insufficient data in 2013 and 2014 to determine the maximum 8-hour concentration. Maximum 1-hour NO2 concentrations ranged from 0.050 to 0.065 ppm and annual average NO2 concentrations ranged from 0.013 to 0.015 ppm. Neither CO nor NO2 exceeded a standard on any day in the last five years which is consistent with the fact that the entire state is in attainment for the two pollutants. The South Coast AQMD (SCAQMD) operates a PM2.5 monitoring station in the City of Big Bear Lake. PM2.5 has state and federal 24-hour and annual average standards. Maximum 24-hour concentrations for PM2.5 ranged from 24.2 to 36.4 µg/m3 and annual average concentrations ranged from 8.4 to 9.7 µg/m3. Three of the five most recent years had insufficient data to produce an annual average value (Appendix C). Resources available reported estimates for the number of days exceeding the 2006 PM2.5 24-hour standard which was updated in 2012. Three of the last five years had insufficient data to determine the number days exceeding the 2006 standard and the two years where data was sufficient to have an estimate were no days in 2011 and 6 days in 2013. The maximum 24-hour concentrations were slightly above the 35 µg/m3 standard (federal) while the annual average concentration was approximately one-quarter of the maximum day concentration which indicates that most days did not exceed the standard. Annual average concentrations were consistently less than the standards (federal and state) for years that had data.

Butterfield and Sentinel Quarries Expansion Air Quality and Greenhouse Gas Impact Assessment San Bernardino National Forest October 25, 2017
OM01_SB-AQHRCCIA_fnl.docx 4 Sespe Consulting, Inc.
Table 1 Ambient Pollutant Concentrations
Pollutant Averaging Time 2010 2011 2012 2013 2014
Ozone (ppm)
1-hr (Maximum) 0.119 0.132 0.116 0.100 0.121
8-hr (Maximum –State) 0.102 0.114 0.097 0.085 0.094
Carbon Monoxide (ppm)
1-hr (Maximum) * * * * *
8-hr (Maximum) 5.17 1.51 1.83 * *
Nitrogen Dioxide (ppm)
1-hr (98th Percentile) 0.065 0.060 0.050 0.0557 0.0527
Annual 0.015 0.015 0.013 0.014 0.013
Respirable Particulate Matter (PM10) (µg/m3)
24-hr (98th Percentile) 43 33 30 160.2 49.8
Annual 14.6 13.8 13.9 18.5 16.7
Fine Particulate Matter (PM2.5) (µg/m3)
High 24-hr 35.4 30.7 36.4 35.5 24.2
Annual * 8.4 * 9.7 *
SO2 (ppb) 1-hr 52 13 * * * 24-hr 7 7 3 2 * Annual 0.92 1.44 0.95 1.12 1.12
Notes: *There was insufficient (or no) data available to determine the value. Ozone concentrations are from Hesperia Monitoring Station operated by MDAQMD. NO2, CO, and SO2 concentrations are from Victorville Monitoring Station operated by MDAQMD. PM10 concentrations are from Lucerne Valley Middle School Monitoring Station operated by MDAQMD. PM2.5 concentrations are from Big Bear City Monitoring Station operated by South Coast AQMD.
2.4 Ambient Health Risk
The MDAQMD does not publish health risk estimates for areas within its jurisdiction. The Project is near the boundary of Mojave Desert and South Coast Air Basins. Thus, the SCAQMD Multiple Air Toxics Exposure Study (MATES) IV risk maps modeled using the most recent OEHHA new methodology (3/2015), show total cancer risk of approximately 152 excess cancer cases per one million people exposed in the Big Bear Lake area is considered representative of conditions in the area of the Project as documented on Figure 3 (Appendix A). It should be noted that the SCAQMD’s MATES Program consists of multiple years of data collection (1986 to present) summarized in most recent report (MATES IV, May 2015). MATES risk estimates are based on ambient air quality monitoring data from several monitoring stations in the South Coast Air Basin. The MATES studies include fixed monitoring sites (where data is collected over multiple years) and microscale

Butterfield and Sentinel Quarries Expansion Air Quality and Greenhouse Gas Impact Assessment San Bernardino National Forest October 25, 2017
OM01_SB-AQHRCCIA_fnl.docx 5 Sespe Consulting, Inc.
or temporary sites where monitoring occurred for a limited time period (six to ten weeks). The nearest fixed air monitoring site to the Project vicinity is the Inland Valley San Bernardino station located at 14360 Arrow Highway in Fontana, CA which is over sixty (60) miles southwest of the Project. The MATES IV study acknowledges “several uncertainties in estimating air toxics risks. These include uncertainties of the cancer potency of the substances, in estimating of population exposure, and in estimating the level of diesel particulate” (MATES-IV, May 2015).The ambient health risk identified in Figure 3 (Appendix A) includes projection of risk levels from locations that were monitored to those that were not. This report overlooks these details and considers the risk map published by SCAQMD at face value such that it represents existing conditions at the project site. Diesel particulate matter (DPM) is identified as a TAC and currently accounts for roughly 68% of the cancer risk from air pollution in urban areas where on-road sources dominate the inventory. Diesel engines are a ubiquitous source and thus it is not surprising that stationary source TAC effects "are generally much lower than region-wide risk levels, region-wide risks tend to overwhelm any potential local ‘hot spots.’” (SCAQMD Mates II Study, Section 7.3). 2.5 Effects of Greenhouse Gases
The effect of greenhouse gas emission regulations are potentially far reaching. On December 7, 2009, United States Environmental Protection Agency (US EPA) Administrator Lisa Jackson signed a final action, under Section 202(a) of the Clean Air Act, finding that six key well-mixed greenhouse gases constitute a threat to public health and welfare, and that the combined emissions from motor vehicles cause and contribute to the climate change problem. The “endangerment finding” allows the US EPA to begin regulating the six GHGs that are identified. Key effects that US EPA claims support the determination that GHGs endanger public health include:
“Temperature. There is evidence that the number of extremely hot days is already increasing. Severe heat waves are projected to intensify, which can increase heat-related mortality and sickness. Fewer deaths from exposure to extreme cold is a possible benefit of moderate temperature increases. Recent evidence suggests, however, that the net impact on mortality is more likely to be a danger because heat is already the leading cause of weather-related deaths in the United States.
Air Quality. Climate change is expected to worsen regional ground-level ozone pollution. Exposure to ground-level ozone has been linked to respiratory health problems ranging from decreased lung function and aggravated asthma to increased emergency department visits, hospital admissions, and even premature death. The impact on particulate matter remains less certain.
Climate-Sensitive Diseases and Aeroallergens. • Potential ranges of certain diseases affected by temperature and precipitation changes, including tick-borne diseases and food and water-borne pathogens, are expected to increase. • Climate change could impact the production, distribution, dispersion and allergenicity of aeroallergens and the growth and distribution of weeds, grasses, and trees that produce them. These changes in aeroallergens and subsequent human exposures could affect the prevalence and severity of allergy symptoms.

Butterfield and Sentinel Quarries Expansion Air Quality and Greenhouse Gas Impact Assessment San Bernardino National Forest October 25, 2017
OM01_SB-AQHRCCIA_fnl.docx 6 Sespe Consulting, Inc.
Vulnerable Populations and Environmental Justice. • Certain parts of the population may be especially vulnerable to climate impacts, including the poor, the elderly, those already in poor health, the disabled, those living alone, and/or indigenous populations dependent on one or a few resources. • Environmental justice issues are clearly raised through examples such as warmer temperatures in urban areas having a more direct impact on those without air-conditioning.
Extreme Events. Storm impacts are likely to be more severe, especially along the Gulf and Atlantic coasts. Heavy rainfall events are expected to increase, increasing the risk of flooding, greater runoff and erosion, and thus the potential for adverse water quality effects. These projected trends can increase the number of people at risk from suffering disease and injury due to floods, storms, droughts and fires.” (EPA’s Endangerment Finding - Health Effects Fact Sheet, US EPA).
2.6 Class I and Class II Wilderness Areas
Class I Wilderness Areas are areas designated in the Clean Air Act (42 USC 7472) including: - International parks; - National wilderness areas which exceed 5,000 acres in size; - National memorial parks which exceed 5,000 acres in size; and - National parks which exceed 6,000 acres in size. The Project is within 100 kilometers of the following Class I Wilderness Areas: - San Gorgonio 18 km. - San Jacinto 51 km. - Joshua Tree National Park 53 km. - Cucamonga 57 km. - San Gabriel 83 km. Class I areas are protected from impacts on visibility, ozone phytotoxicity, and deposition of nitrates and sulfates which can acidify water bodies. In addition, the deposition of fugitive dust onto plants is a concern particularly for protected species, such as the carbonaceous plants found near the quarries. The remainder of the SBNF is considered Class II Wilderness. Good visibility is essential to the enjoyment of national parks and scenic areas. Across the United States, regional haze has decreased the visual range in these pristine areas from 140 miles to 35-90 miles in the West, and from 90 miles to 15-25 miles in the East. This haze is composed of small particles that absorb and scatter light, affecting the clarity and color of what humans see in a vista. The pollutants that create haze (also called haze species) are measurable as sulfates, nitrates, organic carbon, elemental carbon, fine soil, sea salt, and coarse mass. Anthropogenic sources of haze include industry, motor vehicles, agricultural and forestry burning, and dust from soils disturbed by human activities. Pollutants from these sources, in concentrations much lower than those which affect public health, can impair visibility anywhere. Natural forest fires, biological emissions, sea salt and other natural events also contribute to haze species concentrations. Visibility-reducing particles can be transported long distances from where they are generated, thereby producing regional haze. When they are transported to and occur in national parks and wilderness areas, the reduced visibility impairs the quality and the value of the wilderness experience.

Butterfield and Sentinel Quarries Expansion Air Quality and Greenhouse Gas Impact Assessment San Bernardino National Forest October 25, 2017
OM01_SB-AQHRCCIA_fnl.docx 7 Sespe Consulting, Inc.
Conditions in the San Gorgonio Wilderness Area would be of primary concern for this Project because it is closest and other areas would experience less severe impacts. The environmental setting for each Class I Wilderness Area within California is found in the California Regional Haze Plan. The San Gorgonio Wilderness Area description from this Plan is provided in Appendix D. The Project is bounded on the south, west, and north by mountainous undeveloped Forest Lands and to the east by patented open space with an active limestone mine called Furnace Canyon Quarry about 0.75 to 1 mile to the northeast. Other than mining, which has historically been active in the area, land use in the rugged mountainous area has been limited to occasional use by hikers and hunters. Off highway vehicle use and fuel wood cutting have increased as more access roads were built. The “Land Management Plan, Part 2 San Bernardino National Forest Strategy” (USDA, September 2005) defines the project area as the “Desert Rim.” The Desert Rim is described as “a high desert, remote, rugged landscape formed by complex geological faulting. Today, the majority of the land is valued in the production of large quantities of high quality, limestone mineral deposits used in the production of pharmaceuticals and cement. These carbonate deposits are also valuable habitat supporting four species of threatened and endangered plants found nowhere else in the world.” An intensive collaborative effort led to the development of the Carbonate Habitat Management Strategy (CHMS) in 2003. The CHMS is designed to provide long-term protection for the carbonate endemic plants and also provide for continued long-term mining. Portions of the carbonate habitats are protected from mining impacts in perpetuity within the carbonate habitat reserves dedicated and managed as described in the CHMS.
Butterfield and Sentinel Quarries Expansion Air Quality and Greenhouse Gas Impact Assessment San Bernardino National Forest October 25, 2017
OM01_SB-AQHRCCIA_fnl.docx 8 Sespe Consulting, Inc.
3.0 REGULATORY SETTING
Regulations that affect air quality consist primarily of those promulgated under federal and state clean air acts as discussed in Section 3.1. Other regulations that affect air quality include those related to federal conformity (Section 3.2), impacts on Class I and Class II Wilderness Areas (Section 3.3), impacts on health risk (Section 3.4), and greenhouse gases (Section 3.5). 3.1 Air Quality Regulatory Framework
The Federal Clean Air Act and the California Clean Air Act each contain comprehensive frameworks for air quality planning and regulation. Title 40 of the Code of Federal Regulations and Title 17 of the California Code of Regulations contain requirements that have been promulgated under authority granted to US EPA and California Air Resource Board (CARB) by the Acts. Criteria air pollutants include sulfur oxides (SOx), nitrogen oxides (NOx), particulate matter (PM), carbon monoxide (CO), lead (Pb), and ground-level ozone (O3). AAQS are developed by US EPA and CARB for each of the criteria pollutants. Primary AAQS are designed to protect human health, with an adequate margin of safety, including sensitive populations such as children, the elderly, and individuals suffering from respiratory disease. Secondary AAQS are designed to protect public welfare from any known or anticipated adverse effects of a pollutant (e.g. building facade degradation, reduced visibility, and damage to crops and domestic animals). AAQS and related monitoring programs are among the many devices established by air quality regulations (40 CFR 50 - 51). Geographic areas called “attainment areas” are classified by US EPA and CARB based on whether the ambient air in the area meets the AAQSs. An “attainment area” is an area in which pollutant concentrations are less than or equal to the AAQS while “non-attainment areas” have pollution levels above the AAQS. State and federal AAQS are shown in Table 2. In order to make progress towards attainment with the AAQS, each state and air district containing federal non-attainment areas is required to develop a written plan improving air quality in those areas. These plans are called State Implementation Plans (SIP) and Attainment Plans. California’s SIP contains mobile source and consumer product emission control strategies proposed by CARB and a compilation of stationary and area source strategies that have been developed by local air districts under CARB supervision. Through these plans, the state and local air districts outline efforts that they will take to reduce air pollutant concentrations to levels below the standards. Federal and State attainment status designations assigned by US EPA and CARB for the Project area are summarized in Table 3. California Ambient Air Quality Standards (CAAQS) are generally more stringent than the National Ambient Air Quality Standard (NAAQS). Existing law requires district plans for attaining CAAQS to assess the cost-effectiveness of available and proposed emission control measures. Proposed emission control measures in the Attainment Plans are typically developed into air district rules. The MDAQMD assists CARB in preparing the State Implementation Plan by preparing Attainment Plans that demonstrate how the Ambient Air Quality Standards will be achieved. The Attainment Plans contain control measures and associated emissions reduction estimates that are to be considered for implementation by adopting rules and other means (e.g., incentive and education programs) by which the MDAQMD will manage the emissions within the jurisdiction. MDAQMD Attainment Plans are listed in Table 3.

Butterfield and Sentinel Quarries Expansion Air Quality and Greenhouse Gas Impact Assessment San Bernardino National Forest October 25, 2017
OM01_SB-AQHRCCIA_fnl.docx 9 Sespe Consulting, Inc.
Table 2 Ambient Air Quality Standards
Pollutant Averaging Time
California Standards1 National Standards2
Concentration3 Method4 Primary3,5 Secondary3,6 Method7
Ozone (O3)8 1 Hour 0.09 ppm (180 µg/m3)
Ultraviolet Photometry
— Same as Primary
Standard Ultraviolet
Photometry 8 Hour 0.070 ppm (137 µg/m3) 0.070 ppm (137 µg/ m3)
Respirable Particulate
Matter (PM10)9
24 Hour 50 µg/m3 Gravimetric or Beta Attenuation
150 µg/m3 Same as Primary Standard
Inertial Separation and Gravimetric
Analysis AAM 20 µg/m3 —
Fine Particulate Matter (PM2.5)9
24 Hour — — 35 µg/m3 Same as Primary Standard Inertial Separation
and Gravimetric Analysis AAM 12 µg/m3
Gravimetric or Beta Attenuation 12 µg/m3
Carbon Monoxide (CO)
1 Hour 20 ppm (23 mg/m3) Non-Dispersive
Infrared Photometry
(NDIR)
35 ppm (40 mg/m3) —
Non-Dispersive Infrared
Photometry (NDIR)
8 Hour 9.0 ppm (10 mg/m3) 9 ppm (10 mg/m3) —
8 Hour (Lake
Tahoe) 6 ppm (7 mg/m3) — —
Nitrogen Dioxide (NO2)10
1 Hour 0.18 ppm (339 µg/m3) Gas Phase Chemi-
luminescence
100 ppb (188 µg/m3) — Gas Phase Chemi-
luminescence AAM 0.030 ppm (57 µg/m3) 0.053 ppm (100 µg/m3)
Same as Primary Standard
Sulfur Dioxide (SO2)11
1 Hour 0.25 ppm (655 µg/m3)
Ultraviolet Fluorescence
75 ppb (196 µg/m3) — Ultraviolet
Flourescence; Spectro-
photometry (Pararosaniline
Method)
3 Hour — — 0.5 ppm (1300 µg/m3)
24 Hour 0.04 ppm (105 µg/m3) 0.14 ppm (for certain areas)10 —
AAM — 0.030 ppm (for certain areas)10 —
Lead12,13
30 Day Average 1.5 µg/m3 — —
High Volume Sampler and
Atomic Absorption
Calendar Quarter — Atomic
Absorption 1.5 µg/m3 (for certain areas)10
Same as Primary Standard Rolling 3-
Month Average
— 0.15 µg/m3
Visibility Reducing Particles14
8 Hour See footnote 13
Beta Attenuation and
Transmittance through Filter
Tape
No National Standards Sulfates 24 Hour 25 µg/m3 Ion Chromatography
Hydrogen Sulfide 1 Hour 0.03 ppm (42 µg/m3) Ultraviolet Fluorescence
Vinyl Chloride12 24 Hour 0.01 ppm (26 µg/m3) Gas Chromatography
Source: CARB (10/1/2015). Notes: See footnotes on next page. AAM = Annual Arithmetic Mean.

Butterfield and Sentinel Quarries Expansion Air Quality and Greenhouse Gas Impact Assessment San Bernardino National Forest October 25, 2017
OM01_SB-AQHRCCIA_fnl.docx 10 Sespe Consulting, Inc.
Footnotes for Table 2 Ambient Air Quality Standards: 1. California standards for ozone, carbon monoxide (except 8-hour Lake Tahoe), sulfur dioxide (1 and 24 hour), nitrogen
dioxide, and particulate matter (PM10, PM2.5, and visibility reducing particles), are values that are not to be exceeded. All others are not to be equaled or exceeded. California ambient air quality standards are listed in the Table of Standards in Section 70200 of Title 17 of the California Code of Regulations.
2. National standards (other than ozone, particulate matter, and those based on annual arithmetic mean) are not to be exceeded more than once a year. The ozone standard is attained when the fourth highest 8-hour concentration measured at each site in a year, averaged over three years, is equal to or less than the standard. For PM10, the 24 hour standard is attained when the expected number of days per calendar year with a 24-hour average concentration above 150 µg/m3 is equal to or less than one. For PM2.5, the 24 hour standard is attained when 98 percent of the daily concentrations, averaged over three years, are equal to or less than the standard. Contact the U.S. EPA for further clarification and current national policies.
3. Concentration expressed first in units in which it was promulgated. Equivalent units given in parentheses are based upon a reference temperature of 25°C and a reference pressure of 760 torr. Most measurements of air quality are to be corrected to a reference temperature of 25°C and a reference pressure of 760 torr; ppm in this table refers to ppm by volume, or micromoles of pollutant per mole of gas.
4. Any equivalent measurement method which can be shown to the satisfaction of the ARB to give equivalent results at or near the level of the air quality standard may be used.
5. National Primary Standards: The levels of air quality necessary, with an adequate margin of safety to protect the public health.
6. National Secondary Standards: The levels of air quality necessary to protect the public welfare from any known or anticipated adverse effects of a pollutant.
7. Reference method as described by the U.S. EPA. An “equivalent method” of measurement may be used but must have a “consistent relationship to the reference method” and must be approved by the U.S. EPA.
8. On October 1, 2015, the national 8-hour ozone primary and secondary standards were lowered from 0.075 to 0.070 ppm. 9. On December 14, 2012, the national annual PM2.5 primary standard was lowered from 15 μg/m3 to 12.0 μg/m3 . The
existing national 24- hour PM2.5 standards (primary and secondary) were retained at 35 μg/m3, as was the annual secondary standard of 15 μg/m3. The existing 24-hour PM10 standards (primary and secondary) of 150 μg/m3 also were retained. The form of the annual primary and secondary standards is the annual mean, averaged over 3 years.
10. To attain the 1-hour national standard, the 3-year average of the annual 98th percentile of the 1-hour daily maximum concentrations at each site must not exceed 100 ppb. Note that the national 1-hour standard is in units of parts per billion (ppb). California standards are in units of parts per million (ppm). To directly compare the national 1-hour standard to the California standards the units can be converted from ppb to ppm. In this case, the national standard of 100 ppb is identical to 0.100 ppm.
11. On June 2, 2010, a new 1-hour SO2 standard was established and the existing 24-hour and annual primary standards were revoked. To attain the 1-hour national standard, the 3-year average of the annual 99th percentile of the 1-hour daily maximum concentrations at each site must not exceed 75 ppb. The 1971 SO2 national standards (24-hour and annual) remain in effect until one year after an area is designated for the 2010 standard, except that in areas designated nonattainment for the 1971 standards, the 1971 standards remain in effect until implementation plans to attain or maintain the 2010 standards are approved. Note that the 1-hour national standard is in units of parts per billion (ppb). California standards are in units of parts per million (ppm). To directly compare the 1-hour national standard to the California standard the units can be converted to ppm. In this case, the national standard of 75 ppb is identical to 0.075 ppm.
12. The ARB has identified lead and vinyl chloride as 'toxic air contaminants' with no threshold level of exposure for adverse health effects determined. These actions allow for the implementation of control measures at levels below the ambient concentrations specified for these pollutants.
13. The national standard for lead was revised on October 15, 2008 to a rolling 3-month average. The 1978 lead standard (1.5 μg/m3 as a quarterly average) remains in effect until one year after an area is designated for the 2008 standard, except that in areas designated nonattainment for the 1978 standard, the 1978 standard remains in effect until implementation plans to attain or maintain the 2008 standard are approved.
14. In 1989, the ARB converted both the general statewide 10-mile visibility standard and the Lake Tahoe 30-mile visibility standard to instrumental equivalents, which are "extinction of 0.23 per kilometer" and "extinction of 0.07 per kilometer" for the statewide and Lake Tahoe Air Basin standards, respectively

Butterfield and Sentinel Quarries Expansion Air Quality and Greenhouse Gas Impact Assessment San Bernardino National Forest October 25, 2017
OM01_SB-AQHRCCIA_fnl.docx 11 Sespe Consulting, Inc.
Table 3 MDAQMD Attainment Status
Standard MDAQMD Attainment Status
One-hour Ozone (Federal, standard revoked).
Non-attainment; classified Severe-17 (portion of MDAQMD outside of Southeast Desert Modified Air Quality Management Area is unclassified/attainment)
Eight-hour Ozone (Federal 75 ppb) Non-attainment; classified Severe-15 Eight-hour Ozone (Federal 70 ppb) Non-attainment is expected. USEPA will designate in 2017 based on
conditions in years 2014 through 2016. Ozone (State) Non-attainment; classified Moderate PM10 (Federal) Non-attainment; classified Moderate (portion of MDAQMD in
Riverside County is unclassified) PM2.5 (Federal) Unclassified/attainment PM2.5 (State) Non-attainment (portion of MDAQMD outside of Western Mojave
Desert Ozone Non- attainment Area is unclassified/attainment) PM10 (State) Non-attainment Carbon Monoxide (State and Federal) Attainment Nitrogen Dioxide (State and Federal) Attainment/unclassified Sulfur Dioxide (State and Federal) Attainment/unclassified Lead (State and Federal) Attainment Particulate Sulfate (State) Attainment Hydrogen Sulfide (State) Unclassified (Searles Valley Planning Area is non-attainment) Visibility Reducing Particles (State) Unclassified
Sources: MDAQMD CEQA Guidelines (August 2011), USEPA Green Book (as of October 1, 2015), and CARB Area Designation Maps (June 2013).
Table 4 MDAQMD Attainment Plans
Name of Plan Date of Adoption
Standard(s) Targeted
Applicable Area Pollutant(s) Targeted
Attainment Date*
Federal 8-Hour Ozone Attainment Plan (Western Mojave Desert Non-attainment Area)
9-Jun-08 Federal eight hour ozone (84 ppb)
Western Mojave Desert Non- attainment Area (MDAQMD portion)
NOx and VOC
2021
2004 Ozone Attainment Plan (State and Federal)
26-Apr-04 Federal one hour ozone
Entire District NOx and VOC
2007
Triennial Revision to the 1991 Air Quality Attainment Plan
22-Jan-96 State one hour ozone
Entire District NOx and VOC
2005
Mojave Desert Planning Area Federal Particulate Matter Attainment Plan
31-Jul-95 Federal daily and annual PM10
Mojave Desert Planning Area
PM10 2000
1991 Air Quality Attainment Plan
26-Aug-91 State one hour ozone
San Bernardino County portion
NOx and VOC
1994
* A historical attainment date given in an attainment plan does not necessarily mean that the affected area has been re-designated to attainment.
Butterfield and Sentinel Quarries Expansion Air Quality and Greenhouse Gas Impact Assessment San Bernardino National Forest October 25, 2017
OM01_SB-AQHRCCIA_fnl.docx 12 Sespe Consulting, Inc.
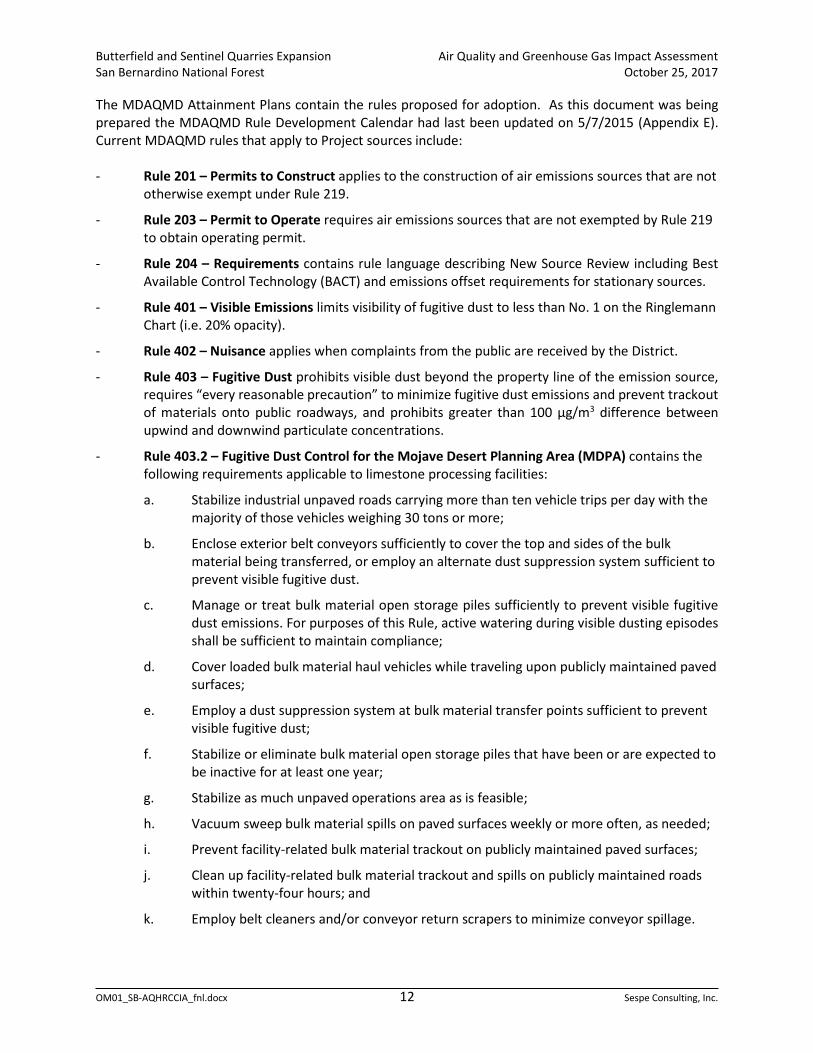
The MDAQMD Attainment Plans contain the rules proposed for adoption. As this document was being prepared the MDAQMD Rule Development Calendar had last been updated on 5/7/2015 (Appendix E). Current MDAQMD rules that apply to Project sources include: - Rule 201 – Permits to Construct applies to the construction of air emissions sources that are not
otherwise exempt under Rule 219.
- Rule 203 – Permit to Operate requires air emissions sources that are not exempted by Rule 219 to obtain operating permit.
- Rule 204 – Requirements contains rule language describing New Source Review including Best Available Control Technology (BACT) and emissions offset requirements for stationary sources.
- Rule 401 – Visible Emissions limits visibility of fugitive dust to less than No. 1 on the Ringlemann Chart (i.e. 20% opacity).
- Rule 402 – Nuisance applies when complaints from the public are received by the District.
- Rule 403 – Fugitive Dust prohibits visible dust beyond the property line of the emission source, requires “every reasonable precaution” to minimize fugitive dust emissions and prevent trackout of materials onto public roadways, and prohibits greater than 100 µg/m3 difference between upwind and downwind particulate concentrations.
- Rule 403.2 – Fugitive Dust Control for the Mojave Desert Planning Area (MDPA) contains the following requirements applicable to limestone processing facilities:
a. Stabilize industrial unpaved roads carrying more than ten vehicle trips per day with the majority of those vehicles weighing 30 tons or more;
b. Enclose exterior belt conveyors sufficiently to cover the top and sides of the bulk material being transferred, or employ an alternate dust suppression system sufficient to prevent visible fugitive dust.
c. Manage or treat bulk material open storage piles sufficiently to prevent visible fugitive dust emissions. For purposes of this Rule, active watering during visible dusting episodes shall be sufficient to maintain compliance;
d. Cover loaded bulk material haul vehicles while traveling upon publicly maintained paved surfaces;
e. Employ a dust suppression system at bulk material transfer points sufficient to prevent visible fugitive dust;
f. Stabilize or eliminate bulk material open storage piles that have been or are expected to be inactive for at least one year;
g. Stabilize as much unpaved operations area as is feasible;
h. Vacuum sweep bulk material spills on paved surfaces weekly or more often, as needed;
i. Prevent facility-related bulk material trackout on publicly maintained paved surfaces;
j. Clean up facility-related bulk material trackout and spills on publicly maintained roads within twenty-four hours; and
k. Employ belt cleaners and/or conveyor return scrapers to minimize conveyor spillage.

Butterfield and Sentinel Quarries Expansion Air Quality and Greenhouse Gas Impact Assessment San Bernardino National Forest October 25, 2017
OM01_SB-AQHRCCIA_fnl.docx 13 Sespe Consulting, Inc.
- Rule 404 – Particulate Matter Concentration sets concentration limits based upon the flow rate of the discharge. The concentration limits would apply to discharge from a stack (e.g. baghouse).
- Rule 405 – Solid Particulate Matter Weight limits emissions based upon the weight of material processed.
- Regulation IX – Standards of Performance for New Stationary Sources (NSPS) incorporates Federal regulation (40 CFR 60) which affects the construction of emissions units. Requirements may or may not apply depending upon the size, construction and manufacture date of equipment that will be used. Specifically, NSPS OOO (40 CFR 60.670) applies to equipment in non-metallic mineral processing plants.
- Regulation XIII – New Source Review contains a number of rules that are applied to new and modified sources.
- Rule 1160 – Internal Combustion Engines limits emissions of NOx, CO, and VOC from stationary engines.
- Rule 1520 – Control of Toxic Air Contaminants from Existing Sources implements AB 2588 Air Toxics Hot Spots requirements.
- Rule 2002 – General Federal Actions Conformity requires federal actions to conform to the applicable implementation plan.
In addition to the adopted rules and regulations listed above, MDAQMD has proposed amendments to Rule 1160 and the Rule Development Calendar (Appendix D) contains several of the above listed rules that are scheduled to be amended (i.e., 401, 403, and 403.2). Each potential rule change is described briefly as follows: - Rule 401 – Visible Emissions would be amended to exempt sandblasters and pile drivers pursuant
to be consistent with state law and would incorporate references to EPA Test Methods 9 and 22 (i.e., visual emissions evaluation). The SIP would be updated with the amended Rule and South Coast AQMD Rule 401 references in Riverside County SIP would be removed.
- Rule 403 – Fugitive Dust control measures would be analyzed for cost effectiveness and the Rule amended if necessary. The SIP would be updated with the amended Rule and South Coast AQMD Rules 403 and 403.1 references in Riverside County SIP would be removed.
- Rule 403.2 – Fugitive Dust Control for the Mojave Desert Planning control measures would be analyzed for cost effectiveness and the Rule amended to reflect findings and conform with PM Attainment Plan requirements. The SIP would be updated with the amended Rule and South Coast AQMD Rules 403 and 403.1 references in Riverside County SIP would be removed.
- Rule 1160 – Internal Combustion Engines is proposed to be amended as needed to address federal reasonably available control technology (RACT) and may expand scope to include engines between 50 and 500 hp. Particulate matter control measures would be assessed for cost effectiveness and the Rule updated to conform with state and federal rules that apply to affected sources (i.e., ATCM, NESHAP and NSPS). The SIP would be updated with the amended Rule and South Coast AQMD Rules 1110, 1110.1, 1110.2 references in Riverside County SIP would be removed.

Butterfield and Sentinel Quarries Expansion Air Quality and Greenhouse Gas Impact Assessment San Bernardino National Forest October 25, 2017
OM01_SB-AQHRCCIA_fnl.docx 14 Sespe Consulting, Inc.
3.2 Conformity
A project is conforming if it complies with all applicable District rules and regulations, complies with all proposed control measures that are not yet adopted from the applicable plan(s), and is consistent with the growth forecasts in the applicable plan(s) (or is directly included in the applicable plan). A project is non-conforming if it conflicts with or delays implementation of any applicable attainment or maintenance plan. Conformity with growth forecasts can be established by demonstrating that the project is consistent with the land use plan that was used to generate the growth forecast. An example of a non-conforming project would be one that increases the gross number of dwelling units, increases the number of trips, and/or increases the overall vehicle miles traveled in an affected area (relative to the applicable land use plan). Federal Conformity regulation (40CFR93) and MDAQMD Rule 2002 which mirrors the federal regulation were adopted in order to ensure that federal actions conform to the applicable implementation plan. Federal actions where the total of direct and indirect emissions in a nonattainment or maintenance area is less than specified rates would screen out of conformity analysis. As presented in Table 3, the western area of the MDAQMD where the Project is located is severe non-attainment for federal ozone, and moderate non-attainment for federal PM10. On the basis of those attainment designations, the Project would screen-out of conformity analysis if: - NOx and VOC emissions are less than 25 tons per year each;
- PM10 emissions are less than 100 tons per year; and
- Emissions are less than 10% of the non-attainment area emissions inventory. 3.3 Federal Land Managers’ Air Quality Related Values
The Federal Land Manager (FLM) and the Federal official with direct responsibility for management of Federal Class I parks and wilderness areas (i.e., Park Superintendent, Refuge Manager, Forest Supervisor) have an affirmative responsibility to protect the Air Quality Related Values (AQRVs) (including visibility) of such lands, and to consider whether a proposed project with emissions exceeding the “major” source thresholds will have an adverse impact on such values. The FLM’s decision regarding whether there is an adverse impact is then conveyed to the permitting authority for consideration in its determinations regarding the permit. The permitting authority’s determinations generally consider a wide range of factors, including the potential impact of the new source or major modification on the AQRVs of Class I areas, if applicable. At the request of both State permitting agencies and permit applicants, the FLMs formed the Federal Land Managers’ Air Quality Related Values Work Group (FLAG) to provide better consistency pertaining to their role in the review of new source permit applications near Federal Class I areas. The purpose of FLAG is twofold: (1) to develop a more consistent and objective approach for the FLMs to evaluate air pollution effects on public AQRVs in Class I areas, including a process to identify those resources and any potential adverse impacts, and (2) to provide state permitting authorities and potential permit applicants consistency on how to assess the impacts of new and existing sources on AQRVs in Class I areas. The FLMs are also concerned about resources in Class II parks and wilderness areas because they have other mandates to protect those areas as well. The information and procedures outlined in the FLAG Report are generally applicable to evaluating the effect of new or modified sources on the AQRVs in both Class I and Class II areas, including the evaluation of effects as part of Environmental Assessments (EA)

Butterfield and Sentinel Quarries Expansion Air Quality and Greenhouse Gas Impact Assessment San Bernardino National Forest October 25, 2017
OM01_SB-AQHRCCIA_fnl.docx 15 Sespe Consulting, Inc.
and/or Environmental Impact Statements (EIS) under the National Environmental Policy Act (NEPA). However, FLAG does not preclude more refined or regional analyses being performed under NEPA or other programs. The FLAG 2010 Phase I Report update recommends how to evaluate visibility, ozone phytotoxicity, and deposition impacts from new or modified sources. The FLAG Phase I Report recommends that an applicant apply the “Q/D test” for proposed sources greater than 50 km from a Class I area to determine whether or not any further analysis is necessary. The Q/D test sums emissions of SO2, NOx, PM10, and H2SO4 (i.e. Q in tons per year) and then divides that total by the distance between the source and receptor (D in kilometers). Results equal to or less than 10 do not require further assessment (i.e. Q/D ≤ 10). 3.4 Health Risk
Toxic air contaminants (TACs) are pollutants listed by the State of California that pose acute, chronic, and/or cancer health risks to exposed individuals. Hazardous air pollutants (HAP) are pollutants listed by US EPA that pose acute, chronic, and/or cancer health risks to exposed individuals. The TACs list includes all HAPs plus California specific air toxics constituents. The California Office of Environmental Health Hazard Assessment (OEHHA) is responsible for developing the scientific basis for listing and evaluation of health risk from TACs. CARB is responsible for quantifying TAC emissions and controlling TACs by promulgation and enforcement of air toxic control measures (ATCM). Assembly Bill 1807 (AB1807) passed in 1983 requires the state of California to identify and control TACs. TACs are formally identified through a detailed process which starts when a chemical’s risk to human health and the environment is above certain criteria. Once TACs are identified, the emission sources, controls, technologies and costs are reviewed to determine if regulation is needed to reduce emissions. In 1993, AB 1807 was amended by passage of Assembly Bill 2728 (AB 2728) which requires the State to list the 189 federal HAPs in the TAC list. In 1987, the AB 2588 air toxics “hot spots” program was established. This program requires subject facilities to report their air toxics emissions, determine localized health risks, and notify nearby residents for whom risk may exceed the notification level.1 The program was amended in 1992 to require facilities to reduce high risks (e.g. in the Mojave Desert AQMD, high risks are greater than 100 in 1 million cancer risk; or 10 hazard index) through the development of a risk management plan. The Hotspots Analysis and Reporting Program (HARP) is a software program that calculates TAC emission inventories and performs health risk assessments for use in the AB 2588 Program. In 2015, after preparation of numerous technical support documents and to address the mandate of the Children’s Environmental Health Protection Act of 1999; new versions of the Air Toxics Hot Spots Program Guidance Manual (HRA Guidelines) and HARP software (i.e., HARP 2) were released. These resources were used in preparation of the health risk assessment for this Project which is discussed in Section 5.5. The Off-Road Vehicle Regulation (13 CCR 2449) was adopted by the CARB in 2007 to reduce diesel particulate matter (PM) and oxides of nitrogen (NOx) emissions from in-use off-road heavy-duty diesel vehicles in California. The regulation was amended by the CARB in December 2010. Prior to that time, the regulation phased in from 2010 to 2020; but the December 2010 rulemaking pushed the start date back to 2014 and the date of final implementation back to 2024. In addition, until CARB receives a waiver
1 http://www.arb.ca.gov/ab2588/district_levels.htm

Butterfield and Sentinel Quarries Expansion Air Quality and Greenhouse Gas Impact Assessment San Bernardino National Forest October 25, 2017
OM01_SB-AQHRCCIA_fnl.docx 16 Sespe Consulting, Inc.
from US EPA to regulate in-use off-road engines, the provisions that require further control are not enforceable. Registering fleets through the Diesel Off-road On-line Reporting System (DOORS), labeling equipment, idling limits and sale notification are requirements of the Off-Road Regulation that are still in effect. Regulatory Advisory 10-414 describes the enforcement delay and was last updated in May 2011. The On-Road Heavy Duty Diesel Vehicle (In-Use) Regulation (13 CCR 2025) was adopted in December 2010. The regulation requires diesel trucks and buses that operate in California to be upgraded to reduce emissions. Heavier trucks must be retrofitted with PM filters beginning January 1, 2012, and older trucks must be replaced starting January 1, 2015. By January 1, 2023, nearly all trucks and buses will need to have 2010 model year engines or equivalent. The regulation applies to nearly all privately and federally owned diesel fueled trucks and buses and to privately and publicly owned school buses with a gross vehicle weight rating (GVWR) greater than 14,000 pounds. Portable engines are regulated by an air toxic control measure (17 CCR 93116) that limits diesel particulate matter and may also be regulated by the Portable Equipment Registration Program (PERP) or local air district permit. In-use portable engines regulated by the ATCM begin phasing in controls to meet emissions reductions criteria on January 1 of 2013, 2017, and 2020. By 2020, in-use portable engines will have Tier 4 particulate emissions characteristics. The PERP program requires applications for new registrations are accepted only for engines that emit less than the interim Tier 4 standards. 3.5 Greenhouse Gas Regulations
3.5.1 Federal
On May 13, 2010 US EPA finalized the GHG Tailoring Rule (75 FR 31514, June 3, 2010). The Tailoring Rule set major source emissions thresholds that defined when federal operating permits under Prevention Significant Deterioration (PSD) or Title V would be required. Then, on June 23, 2014, the U.S. Supreme Court issued its decision in Utility Air Regulatory Group v. EPA, 134 S.Ct. 2427 (2014) (“UARG”). The Court held that EPA may not treat GHGs as an air pollutant for purposes of determining whether a source is a major source required to obtain a PSD or Title V permit. The Court also held that PSD permits that are otherwise required (based on emissions of other pollutants) may continue to require limitations on GHG emissions based on the application of Best Available Control Technology (BACT). In accordance with the Supreme Court decision, on April 10, 2015, the D.C. Circuit issued an amended judgment in Coalition for Responsible Regulation, Inc. v. Environmental Protection Agency, Nos. 09-1322, 10-073, 10-1092 and 10-1167 (D.C. Cir. April 10, 2015), which, among other things, vacated the PSD and title V regulations under review in that case to the extent that they require a stationary source to obtain a PSD or title V permit solely because the source emits or has the potential to emit GHGs above the applicable major source thresholds. The D.C. Circuit also directed EPA to consider whether any further revisions to its regulations are appropriate in light of UARG, and if so, to make such revisions. In response to the Supreme Court decision and the D.C. Circuit’s amended judgment, the EPA will likely conduct future rulemaking action to make appropriate revisions to the PSD and operating permit rules.
Butterfield and Sentinel Quarries Expansion Air Quality and Greenhouse Gas Impact Assessment San Bernardino National Forest October 25, 2017
OM01_SB-AQHRCCIA_fnl.docx 17 Sespe Consulting, Inc.
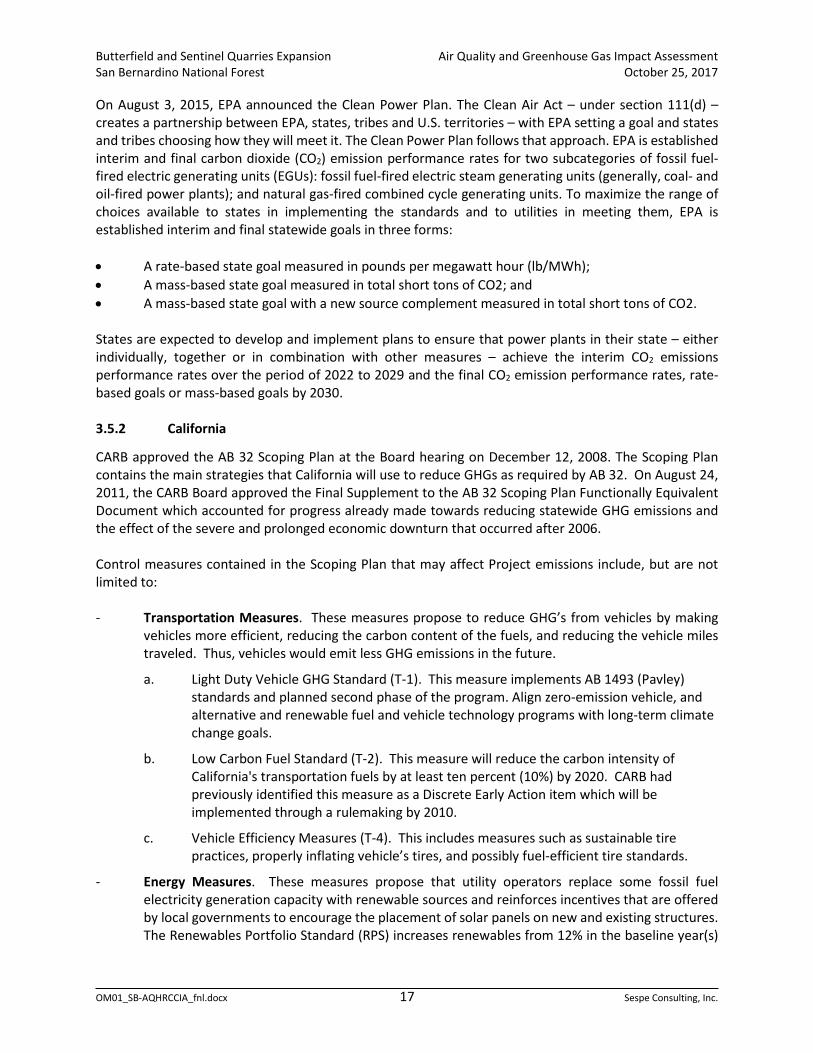
On August 3, 2015, EPA announced the Clean Power Plan. The Clean Air Act – under section 111(d) – creates a partnership between EPA, states, tribes and U.S. territories – with EPA setting a goal and states and tribes choosing how they will meet it. The Clean Power Plan follows that approach. EPA is established interim and final carbon dioxide (CO2) emission performance rates for two subcategories of fossil fuel-fired electric generating units (EGUs): fossil fuel-fired electric steam generating units (generally, coal- and oil-fired power plants); and natural gas-fired combined cycle generating units. To maximize the range of choices available to states in implementing the standards and to utilities in meeting them, EPA is established interim and final statewide goals in three forms: • A rate-based state goal measured in pounds per megawatt hour (lb/MWh); • A mass-based state goal measured in total short tons of CO2; and • A mass-based state goal with a new source complement measured in total short tons of CO2. States are expected to develop and implement plans to ensure that power plants in their state – either individually, together or in combination with other measures – achieve the interim CO2 emissions performance rates over the period of 2022 to 2029 and the final CO2 emission performance rates, rate-based goals or mass-based goals by 2030. 3.5.2 California
CARB approved the AB 32 Scoping Plan at the Board hearing on December 12, 2008. The Scoping Plan contains the main strategies that California will use to reduce GHGs as required by AB 32. On August 24, 2011, the CARB Board approved the Final Supplement to the AB 32 Scoping Plan Functionally Equivalent Document which accounted for progress already made towards reducing statewide GHG emissions and the effect of the severe and prolonged economic downturn that occurred after 2006. Control measures contained in the Scoping Plan that may affect Project emissions include, but are not limited to: - Transportation Measures. These measures propose to reduce GHG’s from vehicles by making
vehicles more efficient, reducing the carbon content of the fuels, and reducing the vehicle miles traveled. Thus, vehicles would emit less GHG emissions in the future.
a. Light Duty Vehicle GHG Standard (T-1). This measure implements AB 1493 (Pavley) standards and planned second phase of the program. Align zero-emission vehicle, and alternative and renewable fuel and vehicle technology programs with long-term climate change goals.
b. Low Carbon Fuel Standard (T-2). This measure will reduce the carbon intensity of California's transportation fuels by at least ten percent (10%) by 2020. CARB had previously identified this measure as a Discrete Early Action item which will be implemented through a rulemaking by 2010.
c. Vehicle Efficiency Measures (T-4). This includes measures such as sustainable tire practices, properly inflating vehicle’s tires, and possibly fuel-efficient tire standards.
- Energy Measures. These measures propose that utility operators replace some fossil fuel electricity generation capacity with renewable sources and reinforces incentives that are offered by local governments to encourage the placement of solar panels on new and existing structures. The Renewables Portfolio Standard (RPS) increases renewables from 12% in the baseline year(s)
Butterfield and Sentinel Quarries Expansion Air Quality and Greenhouse Gas Impact Assessment San Bernardino National Forest October 25, 2017
OM01_SB-AQHRCCIA_fnl.docx 18 Sespe Consulting, Inc.
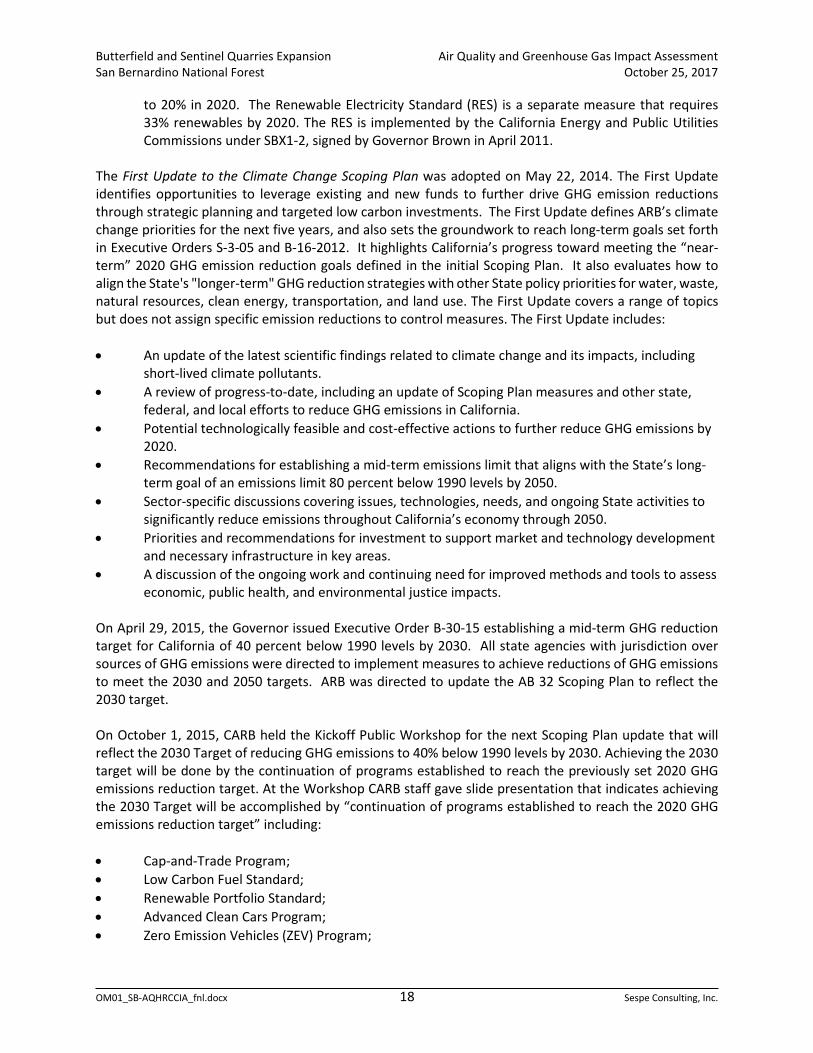
to 20% in 2020. The Renewable Electricity Standard (RES) is a separate measure that requires 33% renewables by 2020. The RES is implemented by the California Energy and Public Utilities Commissions under SBX1-2, signed by Governor Brown in April 2011.
The First Update to the Climate Change Scoping Plan was adopted on May 22, 2014. The First Update identifies opportunities to leverage existing and new funds to further drive GHG emission reductions through strategic planning and targeted low carbon investments. The First Update defines ARB’s climate change priorities for the next five years, and also sets the groundwork to reach long-term goals set forth in Executive Orders S-3-05 and B-16-2012. It highlights California’s progress toward meeting the “near-term” 2020 GHG emission reduction goals defined in the initial Scoping Plan. It also evaluates how to align the State's "longer-term" GHG reduction strategies with other State policy priorities for water, waste, natural resources, clean energy, transportation, and land use. The First Update covers a range of topics but does not assign specific emission reductions to control measures. The First Update includes: • An update of the latest scientific findings related to climate change and its impacts, including
short-lived climate pollutants. • A review of progress-to-date, including an update of Scoping Plan measures and other state,
federal, and local efforts to reduce GHG emissions in California. • Potential technologically feasible and cost-effective actions to further reduce GHG emissions by
2020. • Recommendations for establishing a mid-term emissions limit that aligns with the State’s long-
term goal of an emissions limit 80 percent below 1990 levels by 2050. • Sector-specific discussions covering issues, technologies, needs, and ongoing State activities to
significantly reduce emissions throughout California’s economy through 2050. • Priorities and recommendations for investment to support market and technology development
and necessary infrastructure in key areas. • A discussion of the ongoing work and continuing need for improved methods and tools to assess
economic, public health, and environmental justice impacts. On April 29, 2015, the Governor issued Executive Order B-30-15 establishing a mid-term GHG reduction target for California of 40 percent below 1990 levels by 2030. All state agencies with jurisdiction over sources of GHG emissions were directed to implement measures to achieve reductions of GHG emissions to meet the 2030 and 2050 targets. ARB was directed to update the AB 32 Scoping Plan to reflect the 2030 target. On October 1, 2015, CARB held the Kickoff Public Workshop for the next Scoping Plan update that will reflect the 2030 Target of reducing GHG emissions to 40% below 1990 levels by 2030. Achieving the 2030 target will be done by the continuation of programs established to reach the previously set 2020 GHG emissions reduction target. At the Workshop CARB staff gave slide presentation that indicates achieving the 2030 Target will be accomplished by “continuation of programs established to reach the 2020 GHG emissions reduction target” including: • Cap-and-Trade Program; • Low Carbon Fuel Standard; • Renewable Portfolio Standard; • Advanced Clean Cars Program; • Zero Emission Vehicles (ZEV) Program;
Butterfield and Sentinel Quarries Expansion Air Quality and Greenhouse Gas Impact Assessment San Bernardino National Forest October 25, 2017
OM01_SB-AQHRCCIA_fnl.docx 19 Sespe Consulting, Inc.
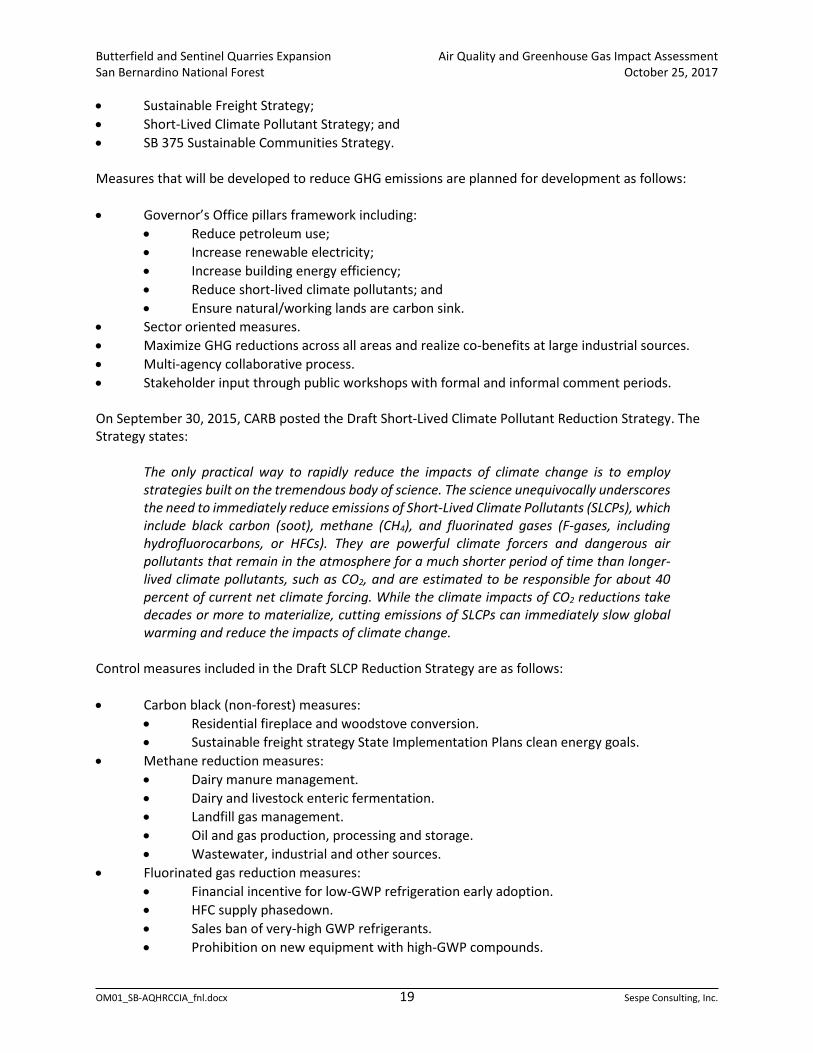
• Sustainable Freight Strategy; • Short-Lived Climate Pollutant Strategy; and • SB 375 Sustainable Communities Strategy. Measures that will be developed to reduce GHG emissions are planned for development as follows: • Governor’s Office pillars framework including:
• Reduce petroleum use; • Increase renewable electricity; • Increase building energy efficiency; • Reduce short-lived climate pollutants; and • Ensure natural/working lands are carbon sink.
• Sector oriented measures. • Maximize GHG reductions across all areas and realize co-benefits at large industrial sources. • Multi-agency collaborative process. • Stakeholder input through public workshops with formal and informal comment periods. On September 30, 2015, CARB posted the Draft Short-Lived Climate Pollutant Reduction Strategy. The Strategy states:
The only practical way to rapidly reduce the impacts of climate change is to employ strategies built on the tremendous body of science. The science unequivocally underscores the need to immediately reduce emissions of Short-Lived Climate Pollutants (SLCPs), which include black carbon (soot), methane (CH4), and fluorinated gases (F-gases, including hydrofluorocarbons, or HFCs). They are powerful climate forcers and dangerous air pollutants that remain in the atmosphere for a much shorter period of time than longer-lived climate pollutants, such as CO2, and are estimated to be responsible for about 40 percent of current net climate forcing. While the climate impacts of CO2 reductions take decades or more to materialize, cutting emissions of SLCPs can immediately slow global warming and reduce the impacts of climate change.
Control measures included in the Draft SLCP Reduction Strategy are as follows: • Carbon black (non-forest) measures:
• Residential fireplace and woodstove conversion. • Sustainable freight strategy State Implementation Plans clean energy goals.
• Methane reduction measures: • Dairy manure management. • Dairy and livestock enteric fermentation. • Landfill gas management. • Oil and gas production, processing and storage. • Wastewater, industrial and other sources.
• Fluorinated gas reduction measures: • Financial incentive for low-GWP refrigeration early adoption. • HFC supply phasedown. • Sales ban of very-high GWP refrigerants. • Prohibition on new equipment with high-GWP compounds.
Butterfield and Sentinel Quarries Expansion Air Quality and Greenhouse Gas Impact Assessment San Bernardino National Forest October 25, 2017
OM01_SB-AQHRCCIA_fnl.docx 20 Sespe Consulting, Inc.
Senate Bill 375 (SB 375) “Transportation planning: travel demand models: sustainable communities strategy: environmental review” was signed by the Governor on September 30, 2008. SB 375 is most concerned with automobile and light truck traffic, but the goal of reducing GHGs covers all transportation sources based on the need for sustainable communities.
“each transportation planning agency … shall prepare and adopt a regional transportation plan directed at achieving a coordinated and balanced regional transportation system, including, but not limited to, mass transportation, highway, railroad, maritime, bicycle, pedestrian, goods movement, and aviation facilities and services.” (Section 65080(a), underline added.)
The regional transportation plan is to be an internally consistent document and include a sustainable communities strategy (SCS).
“The sustainable communities strategy shall …(v) gather and consider the best practically available scientific information regarding resource areas and farmland in the region ….” (Section 65080(b)(2)(B)(v), underline added.)
Resource areas include: “areas of the state designated by the State Mining and Geology Board as areas of statewide or regional significance pursuant to Section 2790 of the Public Resources Code, and lands under Williamson Act contracts.” (Section 65080.01(a)(4).)
Thus, SB 375 recognizes the limestone deposits as a regionally significant resource that requires special consideration in transportation and land use planning efforts. 3.5.3 San Bernardino County
The County of San Bernardino has prepared a Climate Action Plan (CAP, 2011) that excludes sources which would be considered part of the Project. The CAP assesses “GHG emissions in two distinct ways: (1) through the exercise of its land use authority it can affect community/external emissions; (2) through its management of County government and facilities it can affect municipal/internal emissions. The External Inventory includes GHG emissions from land uses within the County’s unincorporated areas where the County has jurisdictional land use authority.” (CAP, Page 2-1). The CAP does not affect emissions from projects that are in within incorporated cities, within the National Forest, or on lands held by the Department of Defense. Thus, the CAP is not applicable to the Project. Moreover, the CAP does not propose reducing emissions from stationary sources like the Project. (CAP Table 4-1, Page 4-2). Lastly, the CAP was prepared before the 2011 Scoping Plan Update was published which lowered the amount of GHG reductions needed by 2020 from 31% to 16%. The County of San Bernardino updated the Development Review Processes (3/2015) which are applied to discretionary projects that are within the above scope of applicability. If the CAP were applicable to the Project, then the commercial/industrial performance standards listed below would need to be implemented: • Waste stream reduction by providing tenants and employees County-approved informational
materials.
• Vehicle trip reduction by providing tenants and employees County-approved informational materials.
• Other educational materials.
• Landscape equipment would be at least 20% electric-powered.

Butterfield and Sentinel Quarries Expansion Air Quality and Greenhouse Gas Impact Assessment San Bernardino National Forest October 25, 2017
OM01_SB-AQHRCCIA_fnl.docx 21 Sespe Consulting, Inc.
• Construction standards ranging from use of approved architectural coatings, low-GHG equipment, training on job efficiency for equipment operators, idling limits consistent with existing state law, non-peak hour truck activity, limited queuing of trucks, waste reduction, contractor support for ridesharing and transit.
• Building design standards including compliance with Title 24 energy efficiency requirements; low flow plumbing fixtures; insulated hot water plumbing and energy efficient boilers; lighting design that incorporates natural light, compact fluorescent light bulbs or equivalent, multi-zone programmable dimming systems, and solar panels providing a minimum of 2.5% of the on-site electricity needs; orientation of building to best utilize natural cooling/heating, reflective roofing materials, low maintenance building materials, at least 75% oval or round air ducting with testing showing that system sealed, Energy Star appliances, and building automation system; landscaping with drought tolerant and smog tolerant vegetation with shade trees around buildings; computerized irrigation systems that adjusts for weather conditions; exterior storage areas for recyclables and green waste; transportation demand management that reduces trips 20% by inclusion of bicycle parking, carpool/vanpool spaces, and mass-transit facilities (if available).
4.0 SIGNIFICANCE THRESHOLDS
Significance thresholds for evaluating potential air quality impacts associated with the Project were developed from Environmental Checklist Form (State CEQA Guidelines, Appendix G), the MDAQMD CEQA and Federal Conformity Guidelines, and the San Bernardino County GHG Reduction Plan. 4.1 Air Quality
The Environmental Checklist Form (State CEQA Guidelines, Appendix G) contains the following guidance for air quality impacts assessment:
Where available, the significance criteria established by the applicable air quality management or air pollution control district may be relied upon to make the following determinations. Would the project: a) Conflict with or obstruct implementation of the applicable air quality plan? b) Violate any air quality standard or contribute substantially to an existing or projected air
quality violation? c) Result in a cumulatively considerable net increase of any criteria pollutant for which the
project region is non-attainment under an applicable federal or state ambient air quality standard (including releasing emissions which exceed quantitative thresholds for ozone precursors)?
d) Expose sensitive receptors to substantial pollutant concentrations? e) Create objectionable odors affecting a substantial number of people?
MDAQMD CEQA and Federal Conformity Guidelines provide the following text which describes the significance criteria that have been established by that agency:
Any project is significant if it triggers or exceeds the most appropriate evaluation criteria. The District will clarify upon request which threshold is most appropriate for a given project; in general, the emissions comparison (criteria number 1) is sufficient:

Butterfield and Sentinel Quarries Expansion Air Quality and Greenhouse Gas Impact Assessment San Bernardino National Forest October 25, 2017
OM01_SB-AQHRCCIA_fnl.docx 22 Sespe Consulting, Inc.
1. Generates total emissions (direct and indirect) in excess of the thresholds given in [Table
5]; 2. Generates a violation of any ambient air quality standard when added to the local
background; 3. Does not conform with the applicable attainment or maintenance plan(s); 4. Exposes sensitive receptors to substantial pollutant concentrations, including those
resulting in a cancer risk greater than or equal to 10 in a million and/or a Hazard Index (HI) (non-cancerous) greater than or equal to 1.
A significant project must incorporate mitigation sufficient to reduce its impact to a level that is not significant. A project that cannot be mitigated to a level that is not significant must incorporate all feasible mitigation. Note that the emission thresholds are given as a daily value and an annual value, so that multi-phased project (such as project with a construction phase and a separate operational phase) with phases shorter than one year can be compared to the daily value.
Table 5 Significant Emissions Thresholds
Criteria Pollutant Annual Threshold (tons)
Daily Threshold (pounds)
Carbon Monoxide (CO) 100 548
Oxides of Nitrogen (NOx) 25 137 Volatile Organic Compounds (VOC) 25 137 Oxides of Sulfur (SOx) 25 137 Particulate Matter (PM10) 15 82 Particulate Matter (PM2.5) 15 82 Hydrogen Sulfide (H2S) 10 54 Lead (Pb) 0.6 3
Source: MDAQMD CEQA Guidelines (August 2011) modified by removal of GHG significance criteria which is presented in Section 4.2 below.
As discussed in Section 3.2, a project is non-conforming if it conflicts with or delays implementation of any applicable attainment or maintenance plan. A project is conforming if it complies with all applicable District rules and regulations, complies with all proposed control measures that are not yet adopted from the applicable plan(s), and is consistent with the growth forecasts in the applicable plan(s) (or is directly included in the applicable plan). These criteria are used to assess Project impact and address the Environmental Checklist Form Item a) above. MDAQMD states that, in general, emissions less than those listed in Table 5 will result in less than significant impact on air quality. Thus, regional impacts from a project that adds emissions to the air basin in quantities which are less than those listed in Table 5 would be less than cumulatively considerable. Consideration of thresholds in Table 5 addresses Items b) and c) from the Environmental Checklist Form. Localized impacts from stationary sources are not addressed by the values in Table 5. The project’s modeled concentration of pollutants may not exceed the increment between the AAQS and background concentrations. For pollutants where background already exceeds the AAQS, Significant Impact Levels

Butterfield and Sentinel Quarries Expansion Air Quality and Greenhouse Gas Impact Assessment San Bernardino National Forest October 25, 2017
OM01_SB-AQHRCCIA_fnl.docx 23 Sespe Consulting, Inc.
(SILs) published by USEPA and neatly summarized by SJVAPCD in Attachment B to their Policy for District Rule 2201 AAQA Modeling (APR 1925, April 14, 2014) are used to evaluate the cumulative impact. Specifically, the SJVAPCD Policy contains separate SILs for point and fugitive sources of PM10 and PM2.5. SILs are normally used in the context of PSD permitting and represent a de minimis threshold in attainment areas. In non-attainment areas, any additional degradation could be significant and so this AQIA applies the SILs (i.e. de minimis level) as significance thresholds. The increment and SIL methodologies address the Project impact as well as the cumulative impact on local concentrations satisfying Item b) and partially addressing Item d) in the Environmental Checklist Form. Health risk assessment is required to determine whether risk levels exceed the MDAQMD criteria (see Item 4 in the excerpt above) and address the remaining requirements of Item d) in the Environmental Checklist Form. Lastly, the Project does not emit objectionable odors and so no threshold has been chosen to address Item e) in the Environmental Checklist Form. 4.2 Climate Change
The MDAQMD significance criteria for GHGs (100,000 tons/yr), while higher than other screening criteria (i.e. SCAQMD 10,000 MTCO2e/yr; San Bernardino GHG Plan 3,000 MTCO2e/yr), is applied because it is supported by substantial evidence and most directly applicable to the Project. As discussed previously, the San Bernardino GHG Plan does not apply to the Project because it is located in the National Forest and also because the GHG Plan excludes stationary sources subject to air district permitting. 5.0 ASSESSMENT METHODOLOGY
Emissions were estimated using methods and parameters from the Mineral Industry Emissions Inventory Guidance (Appendix F), AP-42, EMFAC2011, OFFROAD2011, and CalEEMod. Air dispersion/deposition modeling and health risk assessment were then performed to determine the potential for the Project to result in significant localized impacts. As discussed in Section 1.0, the Project is limited to expanding the Butterfield and Sentinel Quarries areas but overall combined production from all quarries is limited by the LVPP maximum production rate. The Project would allow up to the maximum production rate to be extracted exclusively from the Butterfield and Sentinel Quarries. This would result in no material being quarried at White Knob Quarry which is an indirect effect of the Project that necessitates calculation of White Knob emissions in the baseline. 5.1 Baseline Activity Levels
Appendix F contains information that was provided by Omya. Table 6 presents baseline tonnages for the years 2004 through 2006 that were averaged in order to determine the annual baseline production and throughput. Daily and hourly ore fed to the primary crushers (i.e. Sentinel and White knob) is based on the maximum throughput in each crusher system’s permit to operate. Other daily and hourly throughputs are based upon ratio of annual tonnages (i.e. if 20% is waste annually, then 20% daily and hourly is assumed).
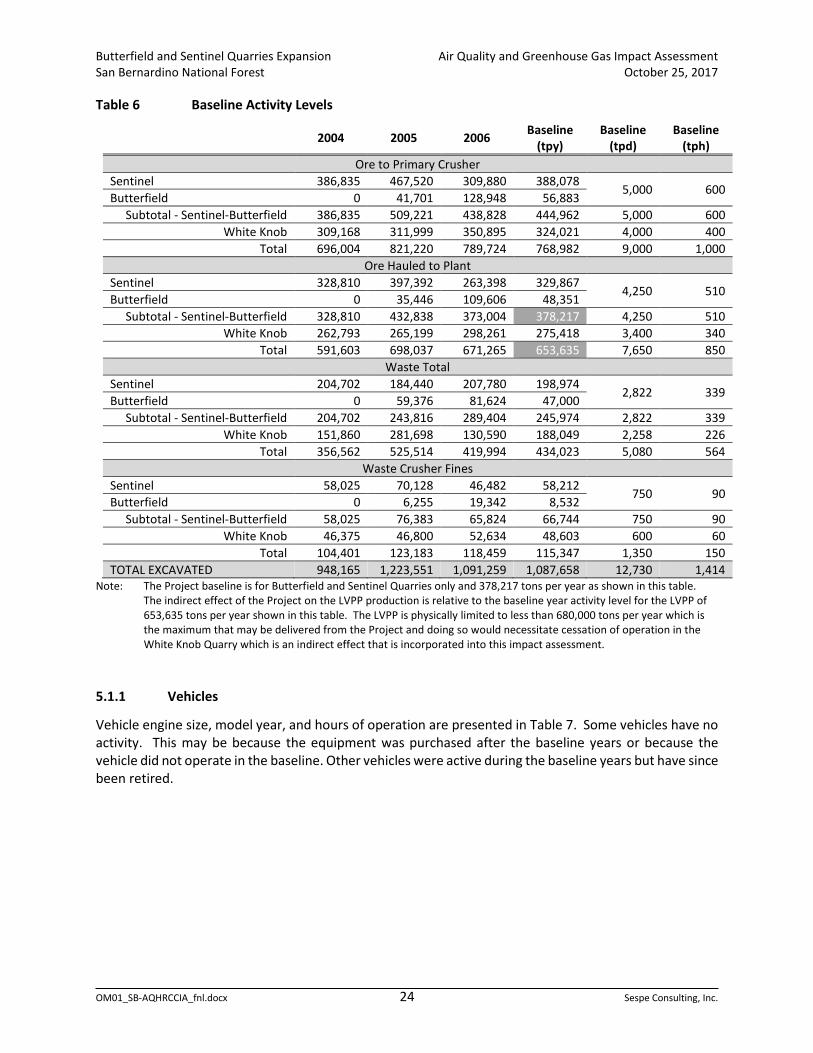
Butterfield and Sentinel Quarries Expansion Air Quality and Greenhouse Gas Impact Assessment San Bernardino National Forest October 25, 2017
OM01_SB-AQHRCCIA_fnl.docx 24 Sespe Consulting, Inc.
Table 6 Baseline Activity Levels
2004 2005 2006 Baseline (tpy)
Baseline (tpd)
Baseline (tph)
Ore to Primary Crusher Sentinel 386,835 467,520 309,880 388,078
5,000 600 Butterfield 0 41,701 128,948 56,883
Subtotal - Sentinel-Butterfield 386,835 509,221 438,828 444,962 5,000 600 White Knob 309,168 311,999 350,895 324,021 4,000 400
Total 696,004 821,220 789,724 768,982 9,000 1,000 Ore Hauled to Plant
Sentinel 328,810 397,392 263,398 329,867 4,250 510
Butterfield 0 35,446 109,606 48,351 Subtotal - Sentinel-Butterfield 328,810 432,838 373,004 378,217 4,250 510
White Knob 262,793 265,199 298,261 275,418 3,400 340 Total 591,603 698,037 671,265 653,635 7,650 850
Waste Total Sentinel 204,702 184,440 207,780 198,974
2,822 339 Butterfield 0 59,376 81,624 47,000
Subtotal - Sentinel-Butterfield 204,702 243,816 289,404 245,974 2,822 339 White Knob 151,860 281,698 130,590 188,049 2,258 226
Total 356,562 525,514 419,994 434,023 5,080 564 Waste Crusher Fines
Sentinel 58,025 70,128 46,482 58,212 750 90 Butterfield 0 6,255 19,342 8,532
Subtotal - Sentinel-Butterfield 58,025 76,383 65,824 66,744 750 90 White Knob 46,375 46,800 52,634 48,603 600 60
Total 104,401 123,183 118,459 115,347 1,350 150 TOTAL EXCAVATED 948,165 1,223,551 1,091,259 1,087,658 12,730 1,414
Note: The Project baseline is for Butterfield and Sentinel Quarries only and 378,217 tons per year as shown in this table. The indirect effect of the Project on the LVPP production is relative to the baseline year activity level for the LVPP of 653,635 tons per year shown in this table. The LVPP is physically limited to less than 680,000 tons per year which is the maximum that may be delivered from the Project and doing so would necessitate cessation of operation in the White Knob Quarry which is an indirect effect that is incorporated into this impact assessment.
5.1.1 Vehicles
Vehicle engine size, model year, and hours of operation are presented in Table 7. Some vehicles have no activity. This may be because the equipment was purchased after the baseline years or because the vehicle did not operate in the baseline. Other vehicles were active during the baseline years but have since been retired.

Butterfield and Sentinel Quarries Expansion Air Quality and Greenhouse Gas Impact Assessment San Bernardino National Forest October 25, 2017
OM01_SB-AQHRCCIA_fnl.docx 25 Sespe Consulting, Inc.
Table 7 Baseline Vehicle Activity
EQUIP # DOORS # Type hp Engine
Year 2006 (hr)
2005 (hr)
2004 (hr)
Average (hr)
Avg. (hp-hr)
330600 3306 Bobcat 50 1983 184.0 109.0 110.0 134.3 6,717
330700 3307 Bobcat 50 1983 177.0 82.0 51.0 103.3 5,167
293301 retired Bobcat 50 1987 0 0 0 0 0
299100 retired Bobcat 50 2001 17.0 0 0 5.7 283
205300 retired Crane 150 1977 0.0 55.0 46.0 33.7 5,050
333018 3418 Dozer 250 1977 31.0 14.0 23.0 22.7 5,667
333062 3462 Dozer 370 1990 30.0 66.0 218.0 104.7 38,727
333064 3464 Excavator 195 1995 278.0 342.0 261.0 293.7 57,265
825400 8254 Forklift 52 1992 129.0 73.0 129.0 110.3 5,737
826800 8268 Forklift 52 2000 1975.0 2279.0 2955.0 2403.0 124,956
826900 8269 Forklift 47 2001 3775.0 3294.0 3913.0 3660.7 172,051
827000 8270 Forklift 52 2003 4316.0 4138.0 4998.9 4484.3 233,184
827200 8272 Forklift 57 2004 2693.0 2192.0 1387.0 2090.7 119,168
208252 retired Forklift 50 1986 0 124.0 91.0 71.7 3,583
213400 retired Forklift 50 1989 78.0 55.0 105.0 79.3 3,967
825700 Retired Forklift 50 1990 0 0 126.0 42.0 2,100
825900 Retired Forklift 50 1992 0 0 0 0 0
826100 Retired Forklift 50 1993 0 15.0 244.0 86.3 4,317
826300 Retired Forklift 50 1994 348.0 351.0 650.0 449.7 22,483
826400 Retired Forklift 50 1994 564.0 242.0 207.0 337.7 16,883
826500 Retired Forklift 50 1996 1127.0 1337.0 1008.6 1157.5 57,877
826600 Retired Forklift 50 1997 1594.0 1010.0 225.6 943.2 47,160
826700 Retired Forklift 50 1998 1312.0 1683.0 1445.4 1480.1 74,007
61001102
Retired Generator 890 1992 499.0 470.0 1887.0 952.0 847,280
333410 3410 Grader 275 1987 537.0 725.0 575.0 612.3 168,392
330100 3301 Loader 375 1985 84.0 0.0 0 28.0 10,500
330200 3302 Loader 690 2004 998.0 870.0 554.0 807.3 557,060
298600 3303 Loader 235 1992 239.0 278.0 259.0 258.7 60,787
330500 3305 Loader 690 2004 796.0 715.0 612.0 707.7 488,290
330800 3308 Loader 690 1985 1535.0 834.0 639.0 1002.7 691,840
333046 3346 Loader 690 1995 1225.0 1450.0 1392.0 1355.7 935,410
333060 3360 Loader 690 1994 1107.0 1373.0 1300.0 1260.0 869,400
331200 Retired Loader 500 1985 0 7.0 1.0 2.7 1,333
207500 Retired Manlift 150 1999 87.0 0.0 0.0 29.0 4,350
299000 On-road Dump Truck 300 1988 785.1 731.7 137.5 551.4 165,430
332102 On-road GreaseTruck 300 1969 25.0 27.0 31.7 27.9 8,370

Butterfield and Sentinel Quarries Expansion Air Quality and Greenhouse Gas Impact Assessment San Bernardino National Forest October 25, 2017
OM01_SB-AQHRCCIA_fnl.docx 26 Sespe Consulting, Inc.
EQUIP # DOORS # Type hp Engine
Year 2006 (hr)
2005 (hr)
2004 (hr)
Average (hr)
Avg. (hp-hr)
332132 On-road Lube Van 300 1987 199.0 330.0 320.0 283.0 84,900
332136 On-road Fuel Truck 300 1973 82.0 108.0 65.0 85.0 25,500
293413 5134 Sweeper 150 1983 0.0 0.0 1.0 0.3 50
826000 Retired Sweeper 150 1992 0.0 6.0 67.0 24.3 3,650
827100 Retired Sweeper 150 2002 227.0 911.0 201.0 446.3 66,950
- 2202 Lube Truck 215 1985 0 0 0 0.0 0
- 2232 Lube Truck 322 1988 0 0 0 0.0 0
- 2237 Fuel Truck 370 1994 0 0 0 0.0 0
- 2271 Guzzler 322 2001 0 0 0 0.0 0
- 2290 Dump Truck 425 1989 0 0 0 0.0 0
- 5171 Sweeper 52 2003 0 0 0 0.0 0
330900 3209 Truck 1050 1991 1310.0 1220.0 1386.0 1305.3 1,370,600
333411 3211 Truck 635 2006 739.0 600.0 477.0 605.3 384,387
331600 3216 Truck 938 2000 0 0 0 0.0 0
333251 3251 Truck 1050 1982 2435.0 2472.0 2367.0 2424.7 2,545,900
333252 3252 Truck 1050 2002 2466.0 2914.0 2666.0 2682.0 2,816,100
333053 3253 Truck 635 2004 597.0 1123.0 471.0 730.3 463,762
333254 3254 Truck 1050 2004 2380.0 2837.0 2059.0 2425.3 2,546,600
333255 3255 Truck 1050 2004 2549.0 3281.0 2357.0 2729.0 2,865,450
333256 3256 Truck 1050 1997 2768.0 1715.0 1334.0 1939.0 2,035,950
333257 3257 Truck 760 2000 1143.0 629.0 510.8 760.9 578,309
333091 3291 Truck 635 1992 984.0 1186.0 904.0 1024.7 650,663
333098 3298 Truck 635 1990 638.0 1063.0 418.0 706.3 448,522 5.1.2 Crushing
Primary crushing systems are operated in the Butterfield and Sentinel Quarries area (electrified) and in the White Knob Quarry area (diesel generator, see Table 7). Table 8 presents baseline throughputs for each crushing system and the LVPP. Maximum daily and hourly rates are limited by MDAQMD permits to operate (Appendix G). It is assumed that the crushing systems and LVPP were operated at the maximum permitted daily and hourly rates during the baseline.

Butterfield and Sentinel Quarries Expansion Air Quality and Greenhouse Gas Impact Assessment San Bernardino National Forest October 25, 2017
OM01_SB-AQHRCCIA_fnl.docx 27 Sespe Consulting, Inc.
Table 8 Baseline Stationary Source Throughputs
Source kW-hr / ton Tons / Year Tons / Day Tons / Hour
Sentinel Crushing System 0.33 444,962 5,000 600
White Knob Crushing System 0.0 324,021 4,000 400
LVPP 40 653,635 7,650 850
Note: Daily and hourly rates for the crushing systems are based upon permit condition limitations. LVPP daily and hourly rates assume the fraction of waste rock produced annually applies on a daily and hourly basis.
5.1.3 Roads
Dust from paved roads occurs only off-site because on-site roads are unpaved. The average distance from the LVPP to Omya’s customers is 110 miles. The baseline production amount (653,635 tons/year) is assumed to be placed in 25 ton capacity trucks. Dust from unpaved roads occurs only on-site because off-site roads are paved. The amount of travel on each unpaved road segment presented in Table 9 is calculated based upon the average truck capacity of 75 tons and the tonnages moved on each road segment in the baseline. Figure 2 (Appendix A) shows the location of each road segment.
Table 9 Baseline Activity on Roads
Road Segment Length (ft) VMT/yr Annual VMT/day Daily VMT/hr Hourly
A - Butterfield Pit 3,360 1,618 1.2% 15 0.99% 1.8 1.1% B - Waste Pile 775 963 0.72% 11 0.71% 1.3 0.8% C - West Road 1,015 1,355 1.0% 16 1.1% 2.0 1.1% D – Not Used 0 0 0.0% 0 0.00% 0 0.00% E - Sentinel Pit 3,000 8,013 6.0% 93 6.0% 11 6.4% F – Not Used 0 0 0.0% 0 0.00% 0 0.00% G - Sentinel/Butterfield to Plant 38,000 72,587 54% 816 52% 98 56% H - White Ridge to Plant 24,260 33,746 25% 417 27% 42 24% I - Plant Feed 365 1,205 0.90% 14 0.91% 1.6 0.9% J - White Knob Pit 3,725 8,719 6.5% 106 6.8% 11 6.1% K - On-Road Trucks* 6,186 20,421 * 239 * 27 * L - Crusher to White Ridge 2,300 5,384 4.0% 66 4.2% 6.6 3.8% M - White Ridge Pit 1,300 0 0.0% 0 0.00% 0 0.00% TOTAL* 154,011 100% 1,794 100% 201 100%
Note: Segment K is used for purposes of modeling only and is not included in the total length of roads on-site. 5.1.4 Mining Activities
Mining emissions consist mainly of dust emissions from various sources (e.g. blasting, bulldozing, wind, etc.) and other criteria pollutant emissions from explosives used in blasting (i.e. NOx and CO). Excavated tons from each quarry that were reported in 2008 (Appendix G) and in the baseline were used to create scale factors. Emissions from the 2008 report were then scaled to determine the baseline emissions in
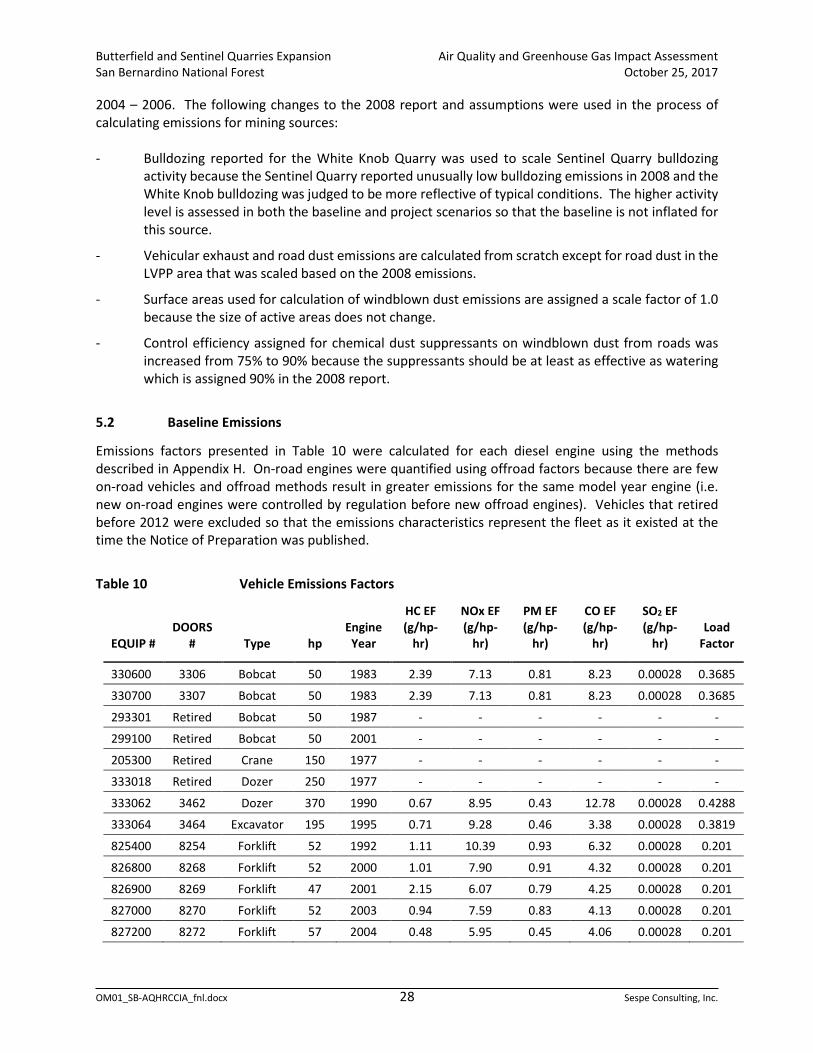
Butterfield and Sentinel Quarries Expansion Air Quality and Greenhouse Gas Impact Assessment San Bernardino National Forest October 25, 2017
OM01_SB-AQHRCCIA_fnl.docx 28 Sespe Consulting, Inc.
2004 – 2006. The following changes to the 2008 report and assumptions were used in the process of calculating emissions for mining sources: - Bulldozing reported for the White Knob Quarry was used to scale Sentinel Quarry bulldozing
activity because the Sentinel Quarry reported unusually low bulldozing emissions in 2008 and the White Knob bulldozing was judged to be more reflective of typical conditions. The higher activity level is assessed in both the baseline and project scenarios so that the baseline is not inflated for this source.
- Vehicular exhaust and road dust emissions are calculated from scratch except for road dust in the LVPP area that was scaled based on the 2008 emissions.
- Surface areas used for calculation of windblown dust emissions are assigned a scale factor of 1.0 because the size of active areas does not change.
- Control efficiency assigned for chemical dust suppressants on windblown dust from roads was increased from 75% to 90% because the suppressants should be at least as effective as watering which is assigned 90% in the 2008 report.
5.2 Baseline Emissions
Emissions factors presented in Table 10 were calculated for each diesel engine using the methods described in Appendix H. On-road engines were quantified using offroad factors because there are few on-road vehicles and offroad methods result in greater emissions for the same model year engine (i.e. new on-road engines were controlled by regulation before new offroad engines). Vehicles that retired before 2012 were excluded so that the emissions characteristics represent the fleet as it existed at the time the Notice of Preparation was published.
Table 10 Vehicle Emissions Factors
EQUIP # DOORS
# Type hp Engine
Year
HC EF (g/hp-
hr)
NOx EF (g/hp-
hr)
PM EF (g/hp-
hr)
CO EF (g/hp-
hr)
SO2 EF (g/hp-
hr) Load
Factor
330600 3306 Bobcat 50 1983 2.39 7.13 0.81 8.23 0.00028 0.3685
330700 3307 Bobcat 50 1983 2.39 7.13 0.81 8.23 0.00028 0.3685
293301 Retired Bobcat 50 1987 - - - - - -
299100 Retired Bobcat 50 2001 - - - - - -
205300 Retired Crane 150 1977 - - - - - -
333018 Retired Dozer 250 1977 - - - - - -
333062 3462 Dozer 370 1990 0.67 8.95 0.43 12.78 0.00028 0.4288
333064 3464 Excavator 195 1995 0.71 9.28 0.46 3.38 0.00028 0.3819
825400 8254 Forklift 52 1992 1.11 10.39 0.93 6.32 0.00028 0.201
826800 8268 Forklift 52 2000 1.01 7.90 0.91 4.32 0.00028 0.201
826900 8269 Forklift 47 2001 2.15 6.07 0.79 4.25 0.00028 0.201
827000 8270 Forklift 52 2003 0.94 7.59 0.83 4.13 0.00028 0.201
827200 8272 Forklift 57 2004 0.48 5.95 0.45 4.06 0.00028 0.201

Butterfield and Sentinel Quarries Expansion Air Quality and Greenhouse Gas Impact Assessment San Bernardino National Forest October 25, 2017
OM01_SB-AQHRCCIA_fnl.docx 29 Sespe Consulting, Inc.
EQUIP # DOORS
# Type hp Engine
Year
HC EF (g/hp-
hr)
NOx EF (g/hp-
hr)
PM EF (g/hp-
hr)
CO EF (g/hp-
hr)
SO2 EF (g/hp-
hr) Load
Factor
208252 Retired Forklift 50 1986 - - - - - -
213400 Retired Forklift 50 1989 - - - - - -
825700 Retired Forklift 50 1990 - - - - - -
825900 Retired Forklift 50 1992 - - - - - -
826100 Retired Forklift 50 1993 - - - - - -
826300 Retired Forklift 50 1994 - - - - - -
826400 Retired Forklift 50 1994 - - - - - -
826500 Retired Forklift 50 1996 - - - - - -
826600 Retired Forklift 50 1997 - - - - - -
826700 Retired Forklift 50 1998 - - - - - - 61001102
Retired* Generator 890 1992 0.59 9.12 0.29 13.84 0.00028 0.525
333410 3410 Grader 275 1987 0.86 12.27 0.62 13.84 0.00028 0.4087
330100 3301 Loader 375 1985 0.86 12.27 0.62 14.18 0.00028 0.3618
330200 3302 Loader 690 2004 0.26 4.64 0.14 1.11 0.00028 0.3618
298600 3303 Loader 235 1992 0.76 9.71 0.51 5.53 0.00028 0.3618
330500 3305 Loader 690 2004 0.26 4.64 0.14 1.11 0.00028 0.3618
330800 3308 Loader 690 1985 0.86 12.27 0.62 14.18 0.00028 0.3618
333046 3346 Loader 690 1995 0.69 9.12 0.45 3.34 0.00028 0.3618
333060 Retired Loader 690 1994 - - - - - -
331200 Retired Loader 500 1985 - - - - - -
207500 Retired Manlift 150 1999 - - - - - -
299000 Retired Dump Truck 300 1988 - - - - - -
332102 Retired GreaseTru
ck 300 1969 - - - - - -
332132 Retired Lube Van 300 1987 - - - - - -
332136 Retired Fuel Truck 300 1973 - - - - - -
293413 5134 Sweeper 150 1983 1.05 13.06 0.74 5.79 0.00028 0.4556
826000 Retired Sweeper 150 1992 - - - - - -
827100 Retired Sweeper 150 2002 - - - - - -
- 2202 Lube Truck 215 1985 0.99 13.06 0.74 5.67 0.00028 0.3417
- 2232 Lube Truck 322 1988 0.69 9.13 0.45 13.84 0.00028 0.3417
- 2237 Fuel Truck 370 1994 0.69 9.12 0.45 13.84 0.00028 0.3417
- 2271 Guzzler 322 2001 0.22 5.10 0.13 1.03 0.00028 0.3417

Butterfield and Sentinel Quarries Expansion Air Quality and Greenhouse Gas Impact Assessment San Bernardino National Forest October 25, 2017
OM01_SB-AQHRCCIA_fnl.docx 30 Sespe Consulting, Inc.
EQUIP # DOORS
# Type hp Engine
Year
HC EF (g/hp-
hr)
NOx EF (g/hp-
hr)
PM EF (g/hp-
hr)
CO EF (g/hp-
hr)
SO2 EF (g/hp-
hr) Load
Factor
- 2290 Dump Truck 425 1989 0.69 9.13 0.45 13.84 0.00028 0.3417
- 5171 Sweeper 52 2003 0.93 7.54 0.82 4.10 0.00028 0.3417
330900 3209 Truck 1050 1991 0.59 9.12 0.29 13.84 0.00028 0.3819
333411 3211 Truck 635 2006 0.27 2.66 0.14 1.12 0.00028 0.3819
331600 3216 Truck 938 2000 0.33 7.11 0.20 3.34 0.00028 0.3819
333251 Retired Truck 1050 1982 - - - - - -
333252 3252 Truck 1050 2002 0.33 7.11 0.20 3.34 0.00028 0.3819
333053 3253 Truck 635 2004 0.29 4.73 0.14 1.14 0.00028 0.3819
333254 3254 Truck 1050 2004 0.33 7.11 0.20 3.34 0.00028 0.3819
333255 3255 Truck 1050 2004 0.33 7.11 0.20 3.34 0.00028 0.3819
333256 3256 Truck 1050 1997 0.59 9.29 0.32 13.84 0.00028 0.3819
333257 3257 Truck 760 2000 0.33 7.11 0.20 3.34 0.00028 0.3819
333091 Retired Truck 635 1992 - - - - - -
333098 Retired Truck 635 1990 - - - - - - * White Knob Generator was replaced by a contractor-owned portable crushing system but the generator emissions rates
were analyzed. Classes of units retired (i.e. crane and manlift) replaced by equipment with the same emissions rates. Emissions factors in Table 10 were combined with activity data in Table 6 to calculate baseline vehicular emissions that are presented in Table 11.
Table 11 Baseline Vehicle Emissions
Location Type Avg. (hp-hr)
HC (lb/yr)
NOx (lb/yr)
PM (lb/yr)
CO (lb/yr)
SOx (lb/yr)
CO2 (tpy)
Pit Dozer Total 44,393 28 376 18 536 0.012 26 Pit Excavator Total 57,265 34 447 22 163 0.013 33 Pit Loader Total 3,543,333 1,468 21,668 950 13,951 0.781 2,064 Plant Bobcat Total 12,167 24 70 8 81 0.003 7 Plant Crane Total 5,050 4 46 2 19 0.001 3 Plant Forklift Total 887,473 447 2,981 308 1,816 0.109 517 Plant Guzzler Total 0 - - - - - - Plant Loader Total 71,287 46 625 32 561 0.016 42 Plant Manlift Total 4,350 2 21 1 9 0.001 3 Plant Sweeper Total 70,650 62 640 48 307 0.017 41 Roads Dump Truck Total 165,430 87 1,137 56 1,725 0.034 96 Roads Fuel Truck Total 25,500 13 175 9 266 0.005 15 Roads Grader Total 168,392 130 1,862 95 2,101 0.042 98 Roads Lube Truck Total 93,270 59 780 42 685 0.019 54

Butterfield and Sentinel Quarries Expansion Air Quality and Greenhouse Gas Impact Assessment San Bernardino National Forest October 25, 2017
OM01_SB-AQHRCCIA_fnl.docx 31 Sespe Consulting, Inc.
Location Type Avg. (hp-hr)
HC (lb/yr)
NOx (lb/yr)
PM (lb/yr)
CO (lb/yr)
SOx (lb/yr)
CO2 (tpy)
Roads Truck Total 16,706,243 4,897 91,813 2,789 57,696 3.885 9,730 WKQ Generator Total 847,280 575 8,940 285 13,576 0.271 493 Grand Total 22,692,682 7,869 131,513 4,663 93,464 5.207 13,217
Note: WKQ = White Knob Quarry. Table 12 presents the emissions summed by area. Quarry emissions are assumed to occur in locations where material is being excavated (quarries) and deposited (overburden areas). Plant emissions are assumed to occur at the LVPP. Road emissions are further allocated to specific roads based upon the vehicle miles traveled (VMT) presented in Table 9. Figure 2 (Appendix A) shows the location of each road segment. VMT is calculated based upon the tons of material being transported and the capacity of haul trucks.
Table 12 Baseline Vehicle Emissions by Location
Average (hp-hr)
HC (lb/yr)
NOx (lb/yr)
PM (lb/yr)
CO (lb/yr)
SOx (lb/yr)
CO2 (tpy)
Quarry Subtotal 3,644,992 1,531 22,491 990 14,650 0.806 2,123
Plant Subtotal 1,041,576 578 4,316 396 2,765 0.144 607
Roads Subtotal 17,158,834 5,186 95,767 2,990 62,474 3.987 9,994
WKQ Generator 847,280 575 8,940 285 13,576 0.271 493
Total 22,692,682 7,869 131,513 4,663 93,464 5.207 13,217 Note: WKQ = White Knob Quarry. The Roads Subtotal in Table 12 is combined with road dust and offsite haul truck emissions in Table 13.
Table 13 Baseline Emissions on Roads
On-site Off-site Total
VMT (miles/yr) 133,590 5,751,988 5,885,578
TSP – Dust (tpy) 248.44 105.89 354.34
PM10 – Dust (tpy) 70.65 21.18 91.83
PM2.5 – Dust (tpy) 7.06 5.20 12.26
TSP – Exhaust (tpy) 1.50 4.48 5.97
PM10 – Exhaust (tpy) 1.50 4.48 5.97
PM2.5 – Exhaust (tpy) 1.38 4.12 5.50
HC (tpy) 2.59 4.13 6.72
NOx (tpy) 47.88 77.94 125.82
CO (tpy) 31.24 18.70 49.94
SOx (tpy) 0.0020 0.10 0.10
CO2 (tpy) 9,994 10,732 20,725

Butterfield and Sentinel Quarries Expansion Air Quality and Greenhouse Gas Impact Assessment San Bernardino National Forest October 25, 2017
OM01_SB-AQHRCCIA_fnl.docx 32 Sespe Consulting, Inc.
Table 14 presents mining and processing emissions that were scaled up from the 2008 reporting and adjusted as described previously in this section.
Table 14 Baseline Mining and Processing Emissions
Emission Source / Operation / Activity -
LVPP (tons per year)
Butterfield and Sentinel Quarries
(tons per year)
White Knob Quarry (tons per year)
TSP PM10 PM2.5 TSP PM10 PM2.5 TSP PM10 PM2.5
Drilling - - - 0.31 0.25 0.25 0.23 0.19 0.19
Blasting - - - 14.46 7.52 0.43 5.41 2.81 0.16
Explosives - - - - - - - - -
Bulldozing and Grading 0.185 0.090 0.028 28.27 13.75 4.20 20.99 10.21 3.12
Loading Quarry / Pad 0.0072 0.0035 0.0011 0.39 0.19 0.06 1.65 0.81 0.25
Primary Crushing - - - 8.43 1.48 0.46 11.83 3.83 1.20
Ball Mill #1 1.68 0.106 0.033 - - - - - -
Tertiary Crushing 34.7 2.25 0.69 - - - - - -
Roller Mill #1 3.61 0.242 0.076 - - - - - -
Roller Mill #2 2.66 0.167 0.052 - - - - - -
Roller Mill #3 1.62 0.104 0.033 - - - - - -
Roller Mill #4 1.60 0.104 0.033 - - - - - -
Surface Treating Plant 0.011 0.0010 0.0003 - - - - - -
Rock Storage System/Plan 19.5 5.47 1.71 - - - - - -
Optical Sorter 0.019 0.014 0.004 - - - - - -
Coarse Product Storage System 0.48 0.080 0.025 - - - - - -
Silo 81-70c 0.58 0.082 0.026 - - - - - -
Bulk Loadout 82 System 0.16 0.025 0.008 - - - - - -
Bulk Loadout 83 System 0.028 0.005 0.001 - - - - - -
Stockpiles - Wind Erosion 1.06 0.53 0.21 0.67 0.34 0.13 0.18 0.09 0.04
Exhaust - Stationary and Portable Equipment 0.047 0.046 0.046 0.04 0.04 0.04 - - -
Exhaust - Mobile and Vehicular Equipment* - - - - - - - - -
Paved Roads - Entrained Dust* - - - - - - - - -
Unpaved Roads - Entrained Dust* 30.84 9.10 1.40 - - - - - -
Wind Erosion From Unpaved Operational Areas and Roads
11.25 5.62 2.25 20.10 10.05 4.02 20.66 10.33 4.13
Total 110.03 24.04 6.62 72.66 33.61 9.59 60.96 28.27 9.08 *Engine exhaust and road dust are calculated elsewhere except for road dust in the LVPP facility and portable water pump engines

Butterfield and Sentinel Quarries Expansion Air Quality and Greenhouse Gas Impact Assessment San Bernardino National Forest October 25, 2017
OM01_SB-AQHRCCIA_fnl.docx 33 Sespe Consulting, Inc.
that are scaled from 2008 levels. Windblown dust is not scaled because the area disturbed daily remains unchanged.
Table 15 Baseline Mining and Processing Combustion Emissions
Sources CO (tpy) NOx (tpy) ROG (tpy) SOx (tpy)
Sentinel Quarry Blasting & Water Pumps 4.2 1.6 0.042 0.037 White Knob Quarry Blasting * 3.71 0.94 0 0 LVPP Heaters 0.12 0.48 0.01 0.01 Total 8.03 3.02 0.052 0.047
Note: White Knob quarry generator emissions are quantified with the offroad vehicle emissions in Table 12. 5.3 Proposed Activity Levels and Emissions
The Project is limited to expanding the Butterfield and Sentinel Quarries area but overall combined production from all quarries is limited by the LVPP maximum production rate. The Project would allow up to the maximum production rate to be extracted exclusively from the Butterfield and Sentinel Quarries. This would result in no material being quarried at White Knob which is an indirect effect of the Project that necessitates calculation of White Knob emissions in the baseline. Moreover, vehicular activity data provided by Omya does not distinguish which units operate in each quarry. Thus, the emissions from vehicles are calculated for the fleet and apportioned to quarries based on throughput amount and to units operating on roads by VMT. Proposed future activity levels are presented in Table 16.
Table 16 Activity Scaling Factors
Source Baseline Value Project Value Scale Factor
LVPP (excludes wind erosion) 653,635 tons/yr 680,000 tons/yr 1.04 LVPP wind erosion 14.88 acres 14.88 acres 1.00 Off-site Road Emissions 3,787,946 VMT/yr 3,940,736 VMT/yr 1.04 On-site Road Emissions 133,590 VMT/yr* 187,084 VMT/yr * 1.40 Vehicles Working in Quarries (based on tons excavated) 1,087,658 tons/yr 1,487,500 tons/yr 1.37
New Mobile Crusher 0 hp-hr/yr 2,084,855 hp-hr/yr n/a ** * Value calculated based upon tonnage moved, capacity of trucks, and road segments traveled. ** Activity based on White Knob Quarry Crusher activity scaled up for greater production.

Butterfield and Sentinel Quarries Expansion Air Quality and Greenhouse Gas Impact Assessment San Bernardino National Forest October 25, 2017
OM01_SB-AQHRCCIA_fnl.docx 34 Sespe Consulting, Inc.
Project emissions are calculated in Appendix I and presented in the following tables. Table 17 presents emissions from Project vehicle engines and Table 18 presents potential proposed emissions on roads and the increment from baseline that would result from the Project. Table 19 presents Proposed emissions and incremental Project emissions from mining and processing activities. The White Knob Quarry would have zero emissions because there would be no activity there if the Project maximum were to be quarried from the Butterfield and Sentinel Quarries. Table 20 presents proposed emissions and the Project increment from mining and processing activities.
Table 17 Project Vehicle Emissions by Location
Average (hp-hr)
HC (lb/yr)
NOx (lb/yr)
PM (lb/yr)
CO (lb/yr)
SOx (lb/yr)
CO2 (tpy)
Quarry Subtotal 4,984,952 2,093 30,759 1,355 20,035 1.10 2,903 Plant Subtotal 1,093,368 607 4,531 416 2,902 0.15 643 Roads Subtotal 24,029,854 7,262 134,115 4,188 87,490 5.58 13,996 Mobile Crusher 2,084,855 208 5,307 181 6,274 0.67 638 Proposed 32,193,030 10,171 174,712 6,140 116,702 7.50 18,179 Baseline* 22,692,682 7,869 131,513 4,663 93,464 5.21 13,222 Project Increment 9,500,348 2,301 43,199 1,477 23,237 2.30 4,957
Note: * See also Table 12.
Table 18 Proposed Emissions on Roads
On-site Off-site Total Baseline Increment
VMT (miles/yr) 187,084 3,940,736 4,127,820 3,921,535 206,285
TSP – Dust (tpy) 348 72.6 420 318 102
PM10 – Dust (tpy) 98.9 14.5 113 84.6 28.9
PM2.5 – Dust (tpy) 9.89 3.56 13.5 10.5 3.0
TSP – Exhaust (tpy) 2.09 3.07 5.16 4.44 0.72
PM10 – Exhaust (tpy) 2.09 3.07 5.16 4.44 0.72
PM2.5 – Exhaust (tpy) 1.93 2.82 4.75 4.09 0.66
HC (tpy) 3.63 2.83 6.46 5.31 1.15
NOx (tpy) 67.1 53.4 120 99.2 21
CO (tpy) 43.8 12.8 56.6 43.6 13
SOx (tpy) 0.0028 0.07 0.07 0.07 0.0035
CO2 (tpy) 13,996 7,339 21,335 17,061 4,274 Note: See also Table 13 and Table 17.

Butterfield and Sentinel Quarries Expansion Air Quality and Greenhouse Gas Impact Assessment San Bernardino National Forest October 25, 2017
OM01_SB-AQHRCCIA_fnl.docx 35 Sespe Consulting, Inc.
Table 19 Proposed Particulate Matter
Emission Source / Operation / Activity LVPP (tpy) Butterfield and
Sentinel Quarries (tpy) White Knob Quarry
(tpy)
TSP PM10 PM2.5 TSP PM10 PM2.5 TSP PM10 PM2.5
Drilling - - - 0.74 0.60 0.60 - - -
Blasting - - - 34.46 17.92 1.03 - - -
Explosives - - - - - - - - -
Bulldozing, Scraping And Grading Of Material
0.19 0.09 0.03 67.36 32.77 10.01 - - -
Loading Quarry / Pad 0.01 0.00 0.00 0.92 0.45 0.14 - - -
Primary Crushing - - - 20.10 3.52 1.09 - - -
Ball Mill #1 1.75 0.11 0.03 - - - - - -
Tertiary Crushing 36.05 2.34 0.72 - - - - - -
Roller Mill #1 3.75 0.25 0.08 - - - - - -
Roller Mill #2 2.77 0.17 0.05 - - - - - -
Roller Mill #3 1.68 0.11 0.03 - - - - - -
Roller Mill #4 1.67 0.11 0.03 - - - - - -
Surface Treating Plant 0.01 0.00 0.00 - - - - - -
Rock Storage System/Plan 20.33 5.69 1.78 - - - - - -
Optical Sorter 0.02 0.01 0.00 - - - - - -
Coarse Product Storage System 0.50 0.08 0.03 - - - - - -
Silo 81-700 0.60 0.09 0.03 - - - - - -
Bulk Loadout 82 System 0.16 0.03 0.01 - - - - - -
Bulk Loadout 83 System 0.03 0.00 0.00 - - - - - -
Stockpiles - Wind Erosion 1.06 0.53 0.21 0.67 0.34 0.13 - - -
Exhaust - Stationary and Portable Equipment
0.05 0.05 0.05 0.09 0.09 0.09 - - -
Exhaust - Mobile and Vehicular Equipment*
- - - - - - - - -
Paved Roads - Entrained Dust* - - - - - - - - -
Unpaved Roads - Entrained Dust* 32.08 9.47 1.45 - - - - - -
Wind Erosion From Unpaved Operational Areas and Roads
11.25 5.62 2.25 20.10 10.05 4.02 - - -
Project Total by Area 114 24.8 6.79 144 65.7 17.1 - - -
Baseline by Area 110 24.0 6.62 72.7 33.6 9.59 61.0 28.3 9.08
Increment by Area 3.94 0.72 0.17 71.8 32.1 7.52 -61.0 -28.3 -9.08
Increment Total 14.76 4.57 -1.40 Note: Elimination of windblown dust from White Knob Quarry accounts for beneficial effect on PM2.5. See also Table 14.

Butterfield and Sentinel Quarries Expansion Air Quality and Greenhouse Gas Impact Assessment San Bernardino National Forest October 25, 2017
OM01_SB-AQHRCCIA_fnl.docx 36 Sespe Consulting, Inc.
Table 20 Project Mining and Processing Combustion Emissions
Sources CO (tpy) NOx (tpy) VOC (tpy) SOx (tpy) Sentinel Quarry Blasting & Water Pumps 10.02 3.72 0.088 0.0041
White Knob Quarry Blasting - - - -
LVPP Heaters 0.124 0.497 0.0054 0.132
Proposed 10.15 4.21 0.093 0.136
Baseline 8.03 2.98 0.042 0.13
Project Increment 2.12 1.24 0.051 0.01 Note: see also Table 15. Table 21 summarizes the incremental change in emissions that would occur if the Project were to operate at the maximum rate of 680,000 tons per year production and 100% of the ore being mined from the Butterfield and Sentinel Quarries.
Table 21 Incremental Change in Emissions from Project
Total Sentinel
Butterfield (tpy)
Total White Knob (tpy)
Total LVPP (tpy)
Total Offsite (tpy)
Total Project without
White Knob Reductions
(tpy)
Total Project with White
Knob Reductions
(tpy) VOC 2.69 -1.54 0.01 0.11 2.82 1.27
NOx 48.1 -26.4 0.10 2.07 50.3 23.9
CO 32.6 -21.1 0.07 0.50 33.1 12.0
SOx 0.0022 -0.0010 0.0000 0.0027 0.0049 0.0038
TSP 262 -151 4.04 2.93 269 118
PM10 87.3 -54.5 0.76 0.68 88.8 34.3
PM2.5 14.4 -12.5 0.18 0.25 14.8 2.38
CO2e 9,900 -4,978 28.3 0.14 9,929 4,951

Butterfield and Sentinel Quarries Expansion Air Quality and Greenhouse Gas Impact Assessment San Bernardino National Forest October 25, 2017
OM01_SB-AQHRCCIA_fnl.docx 37 Sespe Consulting, Inc.
5.4 Dispersion Modeling
Dispersion modeling was performed in consultation with the EPA Modeling Guidelines (40CFR 51, Appendix W) to determine the concentration of pollutants at receptors located near the Project and to estimate deposition of dust onto carbonaceous plant species which exist within and surrounding the Project. Consistent with the Guidelines, EPA’s AERMOD Gaussian plume model was selected for use. AERMOD requires inputs characterizing the model domain, emissions sources, terrain, and meteorological conditions. The model domain was created to encompass the Project site, the White Knob Quarry site, the Omya processing facility, and nearby receptors beyond which pollutant concentrations would decrease with distance from the Project. 5.4.1 Sources
Source characteristics including emissions rates, vertical and lateral dimensions, initial velocity, and location were determined by calculation using methods presented in this report and physical characteristics of each source. The Project includes fugitive area sources and no point sources (i.e., stacks). Initial lateral and vertical dimensions were selected based on engineering judgement regarding the nature of the source(s) being represented and the physical size of the source(s). The maximum size of a volume source in the model is 100 m x 100 m representing the mine pits. By way of comparison, the distance from the any non-haul road source to the nearest receptor exceeds 2,800 meters. Haul road emissions volume sources were converted from line-volume sources having a width and height equal to the road width and off-road truck height. These haul road parameters were converted to model source parameters using EPA approved methods documented in the Haul Road Workgroup Final Report (US EPA, March 2, 2012: https://www3.epa.gov/ttn/scram/reports/Haul_Road_Workgroup-Final_Report_Package-20120302.pdf). The large number of sources in the model, large areas on-site over which mobile equipment works, and relatively large distances to receptors were considered in choosing appropriate sizes for model objects. In general, area sources and sources operating below the surrounding ground level (i.e., in pits) were assigned zero release height while plant equipment and mobile sources were assigned release heights that reflect the sources’ actual height or represent wake off the source consistent with EPA policy for haul roads. Regardless, the property boundary and off-site receptors are at such great distances from the sources that there is no practical difference between 0 and 4.25 m releases. This is particularly true given that the AAQS analysis assumed that dry depletion of the plume would not occur (deposition is a separate model run). Thus, dust hitting the ground is reflected back into the air. The angle at which pollutants disperse in AERMOD results in pollutants hitting the ground within a lateral distance three times greater than the release height. Thus, the plume hits the ground within 13 m (50 feet) of the source and travels along the ground until it reaches the receptor which is no different than being released at ground level when receptors are hundreds of feet or more distant from the sources. 5.4.2 Terrain
Dispersion modeling was performed utilizing flat terrain. Section 4.1 of the AERMOD Implementation Guide (EPA, 12.2016) and other historical guidance documents address modeling sources with terrain-following plumes in sloping terrain.
“For cases in which receptor elevations are lower than the base elevation of the source (i.e., receptors that are down-slope of the source), AERMOD will predict concentrations

Butterfield and Sentinel Quarries Expansion Air Quality and Greenhouse Gas Impact Assessment San Bernardino National Forest October 25, 2017
OM01_SB-AQHRCCIA_fnl.docx 38 Sespe Consulting, Inc.
that are less than what would be estimated from an otherwise identical flat terrain situation…. To avoid underestimating concentrations in such situations, it may be reasonable in cases of terrain-following plumes in sloping terrain to apply the non-DFAULT option to assume flat, level terrain. This determination should be made on a case-by-case basis, relying on the modeler’s experience and knowledge of the surrounding terrain and other factors that affect the air flow in the study area, characteristics of the plume (release height and buoyancy), and other factors that may contribute to a terrain-following plume, especially under worst-case meteorological conditions associated with the source.” (EPA, 12/2016).
In addition, the South Coast AQMD has the following warning posted on it’s website.
“WARNING: According to the AERMOD Implementation Guide Link to external website. (PDF, 133kb) revised August 3,2015, for cases in which receptor elevations are lower than the base elevation of the source, AERMOD will predict concentrations that are less than what would be estimated from an otherwise identical flat terrain situation. While this is appropriate and realistic in most cases, for cases of down-sloping terrain where the plume is terrain-following, AERMOD will tend to underestimate concentrations when terrain effects are taken into account. In order to avoid underestimating concentrations in such situations, AQMD recommends the following: 1. If all receptor elevations are lower than the base elevation of the source, the
non-default option within AERMOD should be applied to assume flat, level terrain.
2. If some receptors are lower and some receptors are higher than the base elevation of the source, AERMOD should be run twice – once using the default option and the second time using the non-default option. The maximum ground-level concentration from both runs should be reported.”
(http://www.aqmd.gov/home/library/air-quality-data-studies/meteorological-data/modeling-guidance).
Existing guidance supports the use of the non-default FLAT option and it was used so that the modeling would produce conservatively high concentrations and health risks as compared to the default option. 5.4.3 Meteorological Data
Meteorological data was purchased from Lakes Environmental after consultation with the MDAQMD. Existing weather stations for which meteorological data was available from the MDAQMD (Barstow, Hesperia, Lucerne Valley, Phelan, Trona, Twentynine Palms, and Victorville) were determined to be unrepresentative of the Project site conditions because they are located far from the site and in desert valleys whereas the Project site is in the foothills and mountains. Lakes generated prognostic meteorological data for the five-year period of 2008 through 2012 based on coordinates within the Project area using the Mesoscale Meteorological model, MM5 (Pennsylvania State University / National Center for Atmospheric Research). At the time, MM5 was a non-default option and

Butterfield and Sentinel Quarries Expansion Air Quality and Greenhouse Gas Impact Assessment San Bernardino National Forest October 25, 2017
OM01_SB-AQHRCCIA_fnl.docx 39 Sespe Consulting, Inc.
observed meteorological data from a weather station was the recommended option for AERMOD. However, other EPA recommended models (i.e., grid models CAMX & CalPuff) could use MM5 data and be consistent with the Modeling Guidelines in effect at the time. Nevertheless, the observed weather data was determined by MDAQMD and Sespe to be unrepresentative and the MM5 data was determined likely to be more representative of conditions on-site because MM5 uses observational data from the weather stations and interpolates between them based on relevant factors that affect wind speed and direction (e.g., terrain). EPA’s website (https://www.epa.gov/scram/air-modeling-meteorological-grid-models) currently states:
“For air quality modeling purposes, meteorological grid models are used in conjunction with chemical interaction models to provide gridded output of chemical species or pollutant data. Meteorological grid models use mathematical formulations that simulate atmospheric processes such as the change of winds and temperature in time. These meteorological parameters are calculated at distinct spatially equidistant points over an area of interest which is called a grid. When these models are applied in a retrospective mode (i.e. modeling a past event) they are able to blend ambient data with model predictions via four-dimensional data assimilation, thereby yielding temporal and spatially complete data sets that are grounded by actual observations. There are several commonly-used meteorological grid models that can develop inputs for air quality models. These grid models differ in their simulation of atmospheric processes but each produce gridded meteorological parameters. There are also several post-processors which are needed to convert the raw meteorological modeling output to suitable air quality model input. A few of the most commonly used meteorological models and post-processors are briefly described below. [The MM5 model] … is a frequently-used meteorological model for historical episodes. It is a limited-area, nonhydrostatic, terrain-following sigma-coordinate model designed to simulate or predict mesoscale and regional-scale atmospheric circulations.”
Meteorological data used in dispersion modeling was chosen based on the EPA Modeling Guidelines in effect at the time (40CFR51 Appendix W) and which have changed slightly to better incorporate prognostic meteorological grid model as a substitute for measured data in cases where the prognostic data would be more representative.
The meteorological data used as input to a dispersion model should be selected on the basis of spatial and climatological (temporal) representativeness as well as the ability of the individual parameters selected to characterize the transport and dispersion conditions in the area of concern. The representativeness of the data is dependent on: • proximity of the meteorological monitoring site to the area under consideration; • complexity of the terrain; • exposure of the meteorological monitoring site; and • period of time during which data are collected. (70FR 68243 and 82FR 5222). Spatial representativeness of the data can be adversely affected by large distances between the source and receptors of interest and the complex topographic characteristics of the area. Temporal representativeness is a function of the year-to-year variations in weather conditions. Where appropriate, data representativeness should be viewed in
Butterfield and Sentinel Quarries Expansion Air Quality and Greenhouse Gas Impact Assessment San Bernardino National Forest October 25, 2017
OM01_SB-AQHRCCIA_fnl.docx 40 Sespe Consulting, Inc.
terms of the appropriateness of the data for constructing realistic boundary layer profiles and three dimensional meteorological fields. (70FR 68243 and 82FR 5222).
Former EPA Modeling Guidelines (2005) were silent on use of prognostic meteorological data. However, there was no better option at the time modeling was performed and EPA had come to allow its use with AERMOD in certain situations. Subsequently, EPA changed the Modeling Guidelines (2017) related to meteorological data as described in Federal Register preamble to the updated Modeling Guidelines. EPA states:
“We made extensive updates and modifications … to reflect current EPA practices, requirements, and recommendations for determining the appropriate modeling domain and model input data from new or modifying source(s) or sources under consideration for a revised permit limit, from background concentrations (including air quality monitoring data and nearby and other sources), and from meteorology…. The use of prognostic mesoscale meteorological models to provide meteorological input for regulatory dispersion modeling applications has been incorporated throughout the ‘‘Meteorological Input Data’’ subsection, including the introduction of the MMIF as a tool to inform regulatory model applications….” (82 FR 5201-5202, January 17, 2017).
A portion of the most recent Modeling Guidelines (2017) that addresses how prognostic meteorological data should be evaluated prior to its use is paraphrased below.
For some modeling applications, there may not be a representative National Weather Service (NWS) or comparable meteorological station available (e.g., complex terrain), and it may be cost prohibitive or infeasible to collect adequately representative site-specific data. For these cases, it may be appropriate to use prognostic meteorological data, if deemed adequately representative, in a regulatory modeling application. However, if prognostic meteorological data are not representative of transport and dispersion conditions in the area of concern, the collection of site-specific data is necessary.
The EPA has developed a processor, the MMIF, to process MM5 (Mesoscale Model 5) or WRF (Weather Research and Forecasting) model data for input to various models including AERMOD. MMIF can process data for input to AERMET or AERMOD for a single grid cell or multiple grid cells. MMIF output has been found to compare favorably against observed data (site-specific or NWS)…. (Section 8.4.5.1, 2017 Modeling Guidelines).
a. Prognostic model evaluation. Appropriate effort by the applicant should be
devoted to the process of evaluating the prognostic meteorological data. The modeling data should be compared to NWS observational data or other comparable data in an effort to show that the data are adequately replicating the observed meteorological conditions of the time periods modeled. An operational evaluation of the modeling data for all model years (i.e., statistical, graphical) should be completed. The use of output from prognostic mesoscale meteorological models is contingent upon the concurrence with the appropriate reviewing authority that the data are of acceptable quality, which can be demonstrated through statistical comparisons with meteorological observations aloft and at the surface at several appropriate locations.
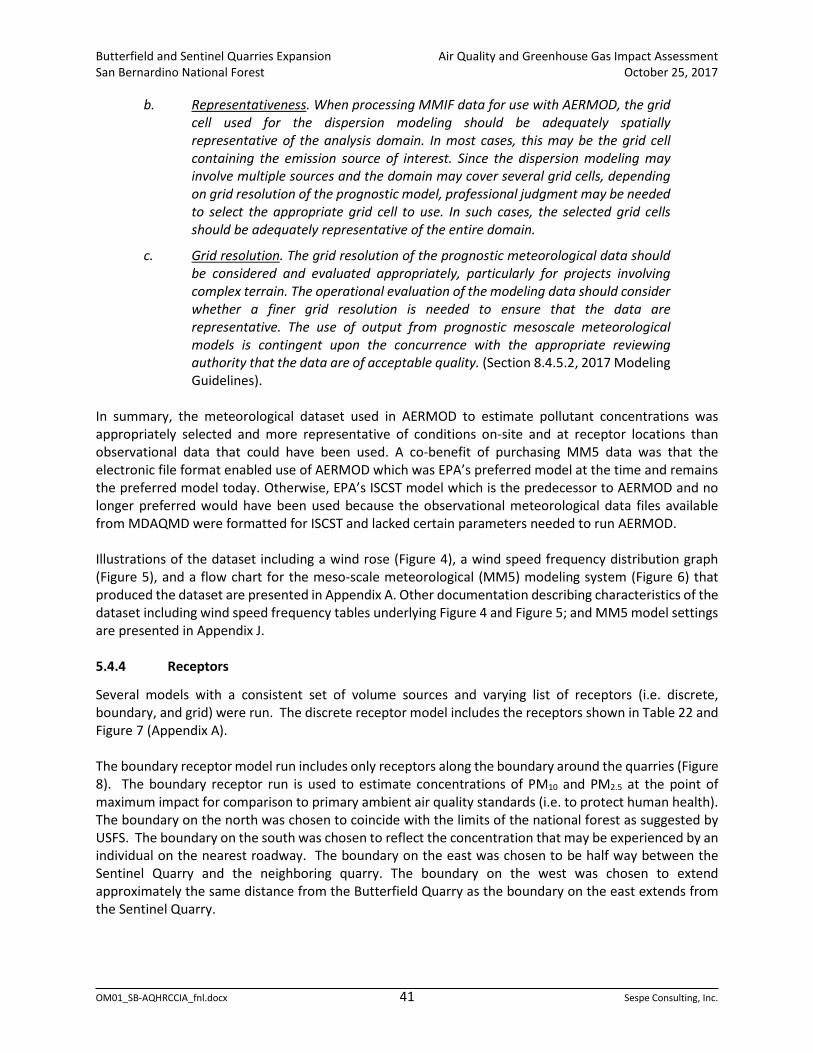
Butterfield and Sentinel Quarries Expansion Air Quality and Greenhouse Gas Impact Assessment San Bernardino National Forest October 25, 2017
OM01_SB-AQHRCCIA_fnl.docx 41 Sespe Consulting, Inc.
b. Representativeness. When processing MMIF data for use with AERMOD, the grid cell used for the dispersion modeling should be adequately spatially representative of the analysis domain. In most cases, this may be the grid cell containing the emission source of interest. Since the dispersion modeling may involve multiple sources and the domain may cover several grid cells, depending on grid resolution of the prognostic model, professional judgment may be needed to select the appropriate grid cell to use. In such cases, the selected grid cells should be adequately representative of the entire domain.
c. Grid resolution. The grid resolution of the prognostic meteorological data should be considered and evaluated appropriately, particularly for projects involving complex terrain. The operational evaluation of the modeling data should consider whether a finer grid resolution is needed to ensure that the data are representative. The use of output from prognostic mesoscale meteorological models is contingent upon the concurrence with the appropriate reviewing authority that the data are of acceptable quality. (Section 8.4.5.2, 2017 Modeling Guidelines).
In summary, the meteorological dataset used in AERMOD to estimate pollutant concentrations was appropriately selected and more representative of conditions on-site and at receptor locations than observational data that could have been used. A co-benefit of purchasing MM5 data was that the electronic file format enabled use of AERMOD which was EPA’s preferred model at the time and remains the preferred model today. Otherwise, EPA’s ISCST model which is the predecessor to AERMOD and no longer preferred would have been used because the observational meteorological data files available from MDAQMD were formatted for ISCST and lacked certain parameters needed to run AERMOD. Illustrations of the dataset including a wind rose (Figure 4), a wind speed frequency distribution graph (Figure 5), and a flow chart for the meso-scale meteorological (MM5) modeling system (Figure 6) that produced the dataset are presented in Appendix A. Other documentation describing characteristics of the dataset including wind speed frequency tables underlying Figure 4 and Figure 5; and MM5 model settings are presented in Appendix J. 5.4.4 Receptors
Several models with a consistent set of volume sources and varying list of receptors (i.e. discrete, boundary, and grid) were run. The discrete receptor model includes the receptors shown in Table 22 and Figure 7 (Appendix A). The boundary receptor model run includes only receptors along the boundary around the quarries (Figure 8). The boundary receptor run is used to estimate concentrations of PM10 and PM2.5 at the point of maximum impact for comparison to primary ambient air quality standards (i.e. to protect human health). The boundary on the north was chosen to coincide with the limits of the national forest as suggested by USFS. The boundary on the south was chosen to reflect the concentration that may be experienced by an individual on the nearest roadway. The boundary on the east was chosen to be half way between the Sentinel Quarry and the neighboring quarry. The boundary on the west was chosen to extend approximately the same distance from the Butterfield Quarry as the boundary on the east extends from the Sentinel Quarry.

Butterfield and Sentinel Quarries Expansion Air Quality and Greenhouse Gas Impact Assessment San Bernardino National Forest October 25, 2017
OM01_SB-AQHRCCIA_fnl.docx 42 Sespe Consulting, Inc.
Table 22 Nearby Receptors
ID UTM, Easting (meters)
UTM, Northing (meters) Type – Location
1 507564 3796038 Boy Scout Ranch – mountains 1.85 miles southeast of B5 Pad 2 504448 3801743 Buddhist Temple – foothills 1.7 miles south of LVPP 3 505532 3803636 Residence – valley 0.5 mile south of LVPP 4 505725 3803616 Residence – valley 0.5 mile south of LVPP 5 505322 3802524 Residence – valley 1.2 miles south of LVPP 6 504060 3801770 Residence – foothills 1.8 miles south-southwest of LVPP 7 504222 3801955 Residence – foothills 1.7 miles south-southwest of LVPP 8 503804 3802143 Residence – foothills 1.7 miles south-southwest of LVPP 9 503942 3802456 Residence – foothills 1.5 miles southwest of LVPP
10 503842 3802821 Residence – foothills 1.3 miles southwest of LVPP Grid receptor model runs were used in the health risk assessment and the deposition model to generate contoured plots of the results. Grid results were used only for illustration purposes with exception of the deposition impact on vegetation. Due to the nature of the sources which release near the ground (i.e., as compared to a source with a tall stack such as a power plant), the concentration of pollutants decreases with distance from the source and, in fact, may follow the terrain as discussed in relation to the use of the FLAT option above. In cases like this, the point of compliance for AAQS evaluation will be on the project boundary. Receptors located along the project boundary are spaced 50 meters apart which should be acceptable for a site of this size and where the primary sources are mobile (i.e., unlikely to cause a hot spot). Illustrations of contours for pollutants affecting health risk use a grid with 200 meter spacing (Figure 9). The deposition model was prepared to inform the biological impacts of the dust landing on the carbonaceous plants (i.e., as opposed to remaining in air and impacting human health). Areas of carbonaceous plant species span great distances and occur intermittently. Thus, 500 meter grid spacing was used to estimate deposition on the plants and that information was transmitted to the biological consultant (Figure 10). The deposition model is the only model run that assumes the plume is depleted by deposition. The deposition model considers three sizes of particulates. TSP (i.e. PM30), PM10, and PM2.5 are calculated for each source and the amount of each size varies based on the source type accordingly. For instance, the dominant source of dust emissions is the roads which emit a combination of dust and diesel particulate matter. When dust and diesel PM emissions are combined the resulting fractionation for unpaved roadway particulates is 3.34% PM2.5; 25.5% PM10-2.5; and 71.2% PM30-10. The combination of sources operating at the LVPP results in fractionation of 4.5% PM2.5; 14.0% PM10-2.5; and 81.5% PM30-10. Other source fractionations were varied according to the calculated amounts of dust and diesel PM.
Table 23 Deposition Parameters
Particle Size Bin (µm) Assumed Density (grams/cubic centimeter)
2.5 1.0 2.5 - 10 µm 1.75 10 - 30 µm 2.5
Note: Source: http://www.arb.ca.gov/research/ltads/ltads-ws/4-dust.pdf.

Butterfield and Sentinel Quarries Expansion Air Quality and Greenhouse Gas Impact Assessment San Bernardino National Forest October 25, 2017
OM01_SB-AQHRCCIA_fnl.docx 43 Sespe Consulting, Inc.
The weight of particles presented in Table 23 is most appropriate for dust particles which constitute the majority of particulate matter emitted by project sources. Because the diesel particulates are emitted in smaller quantities, the dust densities are applied to all particulates regardless of their origin. 5.5 Health Risk Assessment
Constituents in diesel exhaust and dust emissions were speciated into toxic components using the following CARB Speciation Profiles: - Particulate matter from unpaved roads (PM Profile #470); - Particulate matter from paved roads (PM Profile #471); - Particulate matter from aggregate processing (PM Profile #90013); - Diesel particulate matter (PM Profile #6139 for the 2013 fleet); and - Diesel total organic gases (Organic Profile #818). The health risk assessment was performed using a combination of AERMOD dispersion model (version 12345) and HARP2 (version 15180). AERMOD was used to generate plot files containing dispersion coefficients (χ/Q) that were input to the HARP2 Air Dispersion Model and Risk Tool (ADMRT version 15180). To produce the dispersion coefficients, each source in the AERMOD model was assigned the unit rate emissions factor of one gram per second (1.0 g/s). Values in the resulting plot files were then multiplied by emissions rates for each source to determine the ground level concentration (GLC, in units µg/m3) of each pollutant at each receptor location. Appendix J contains a TAC emissions summary table for the Project and Appendix L is a CDROM containing the modeling files. Peak hour and annual average GLCs calculated by HARP2 were then used for health risk assessment in HARP2. Non-cancer (acute and chronic) and cancer health risks were calculated for individual resident receptors and for worker receptors. Population-wide cancer risk was not calculated due to the remote location of the Project site and results of the individual modeling presented below. 5.5.1 Inhalation Pathway
Non-cancer health risks were determined in HARP2 by dividing the GLC of each pollutant at each receptor by the corresponding reference exposure level (REL, units of µg/m3) resulting a hazard index (HI). The HIs for pollutants affecting each target organ were then summed to determine the total HI for each target organ. The target organ with the greatest HI is reported as the non-cancer health risk at each receptor. Worker chronic non-cancer health risk results were multiplied by a Worker Adjustment Factor (WAF) of 4.2 which represents the amount overlap between the Project operating schedule and the worker’s work schedule; both of which are assumed to be 8 hr/day, 5 days/wk. For cancer risk, exposure to individuals was evaluated in HARP2 by calculating the daily dose of each pollutant in milligrams per kilogram body weight per day (mg/kg/d). HARP2 algorithms were used to calculate dose for exposure through inhalation, dermal absorption, ingestion, and mother’s milk pathways. Other pathways that are available include drinking water, fish consumption, home grown produce, beef/dairy, and pig/chicken/egg and were not used due to lack of available input parameters and observed characteristics of the residences near the Project site (i.e., no farms or lakes in the vicinity). Although the emissions sources of particulates are controlled, deposition of particles onto the skin, soil, and other media was assumed to occur at the uncontrolled rate of 0.05 meters per second (m/s) because the results were observed to be greater than when the controlled rate of 0.02 m/s was used.

Butterfield and Sentinel Quarries Expansion Air Quality and Greenhouse Gas Impact Assessment San Bernardino National Forest October 25, 2017
OM01_SB-AQHRCCIA_fnl.docx 44 Sespe Consulting, Inc.
HARP2 contains average and high-end point estimates and data distributions for adults and children for each exposure pathway. The point estimates and data distributions that were used in the HRA fall within the age bins of 3rd trimester to birth, birth to two years of age (0<2), two years through 16 years of age (2<16) and 16 years through 30 years of age (16<30; adult). Table 24 presents the mean and high end point estimates for residential intake rates that were assumed in the HRA.
Table 24 Point Estimates of Residential Daily Breathing Rates by Age Group
Estimate 3rd Trimester1
(L/kg BW-day)2 0<2 Years
(L/kg BW-day) 2<16 Years
(L/kg BW-day) 16<30 Years
(L/kg BW-day) Mean (65%ile)3 225 658 452 210 High-End (95%ile) 361 1090 745 335
Source: HRA Guidelines (p. 5-25). 1 3rd trimester breathing rates based on breathing rate of pregnant women using the assumption that the dose to the fetus
during the 3rd trimester is the same as that to the mother. 2 Values are in units of liters of air per kilogram of body weight per day. 3 Mean values were not used in the HRA and are provided for informational purposes only. As recommended in the HRA Guidelines, workers were assumed to be between the ages 16 and 70 (16<70) and performing moderate intensity activities. The mean and high-end intake rates for workers were 170 and 230 liters per kilogram per 8-hours (L/kg-8-hrs). Workers were assumed to be exposed for 25 years as recommended in the HRA Guidelines (p. 5-26). Annual residential dose was calculated by HARP2 using the GLC (mg/m3), the intake rate (L/kg-day), 365 days/yr exposure frequency, and an assumption that the entire mass of pollutants inhaled is absorbed into the body of the individual exposed (i.e., no pollutants are exhaled). A fraction of time at home (FAH) of 73% was applied for individuals 16 years and older but could have been applied from the 3rd trimester to age two (85%) and from two to 16 years (72%) because there is likely no school within the 1 in 1 million cancer risk contour (p. 8-5 HRA Guidelines). Annual worker dose was calculated the same way and adjusted to 250 days/yr exposure frequency by multiplying the result by 0.68. Inhalation dose of each pollutant at each receptor for each year was then multiplied in HARP2 by the inhalation cancer slope factor for the pollutant to estimate annual cancer risk in units of excess cancer cases per million individuals exposed. The total cancer risk from inhalation was then calculated by summing the annual risk from each pollutant and year of exposure. Residential cancer risk assumed exposure duration of 30 years as recommended by OEHHA in the HRA Guidelines (p. 8-1) and the OEHHA Derived Method intake rate for all exposure pathways and all ages which is more conservative than the recommended Risk Management Policy (RMP) (95/80%ile combination for inhalation pathway and 65%ile for other pathways), and RMP Derived Method (95/80%ile combination for two dominant exposure pathways and 65%ile for other pathways). The RMP 95/80%ile combination refers to applying the 95th percentile intake rate for ages less than two years and the 80th percentile intake rate for ages over two years whereas the OEHHA Derived Method uses 95%ile intake rate for all ages and results in greater risk estimates which is conservative. 5.5.2 Ingestion Pathway
The average concentration of pollutants in soil is a function of the deposition, accumulation period, chemical specific half-life, mixing depth, and soil bulk density. For simplicity and health protection, the

Butterfield and Sentinel Quarries Expansion Air Quality and Greenhouse Gas Impact Assessment San Bernardino National Forest October 25, 2017
OM01_SB-AQHRCCIA_fnl.docx 45 Sespe Consulting, Inc.
HARP2 default 70-year soil deposition for the accumulation period was assumed. As discussed above, the uncontrolled deposition rate (0.05 m/s) was applied, which is conservative. Equations and parameters used to estimate the concentration of pollutant in the soil from the GLC can be found in the HRA Guidelines (p. 5-6 to 5-8). The exposure dose through residential soil ingestion varies by age and was calculated for each age group. The dose is calculated by HARP2 based on the concentration in soil, pollutant specific gastrointestinal relative absorption fraction (GRAF, unitless), soil ingestion rate (mg/kg-day), and exposure frequency using the equation presented in the HRA Guidelines (p. 5-43). For simplicity, GRAF was assigned a value of one which represents the entire mass of pollutant being absorbed. Soil ingestion rates vary by age and the high-end point estimates shown in Table 25 were used.
Table 25 Soil Ingestion Rate Point Estimates by Age Group
Estimate 3rd Trimester1
(mg/kg BW-yr)2 0<2 Years
(mg/kg BW-yr) 2<16 Years
(mg/kg BW-yr) 16<30 Years
(mg/kg BW-yr) Mean (65%ile)3 0.7 20 3 0.7 High-End (95%ile) 3 40 10 3
Source: HRA Guidelines (p. 5-44). 1 3rd trimester is assumed to be the mother’s soil ingestion rate. 2 Values are in units of milligrams of pollutant ingested per kilogram of body weight per year. 3 Geometric mean (GM) values were not used in the HRA and are provided for informational purposes only. 5.5.3 Dermal Pathway
Exposure through dermal absorption (dose-dermal) is a function of the soil or dust loading of the exposed skin surface, the amount of skin surface area exposed, and the concentration and availability of the pollutant. The annual dermal load (ADL) is a composite of the body surface area per kg body weight, exposure frequency, and soil adherence to the skin. High-end point estimates of ADL for individuals located in a mixed climate were used.
Table 26 Annual Dermal Loading Point Estimates by Age Group
Estimate 3rd Trimester1
(mg/kg BW-yr)2 0<2 Years
(mg/kg BW-yr) 2<16 Years
(mg/kg BW-yr) 16<30 Years
(mg/kg BW-yr) Mean (65%ile)3 1,100 2,200 5,700 1,100 High-End (95%ile) 2,400 2,900 8,100 2,400
Source: HRA Guidelines (p. 5-37). 1 3rd trimester based on ADL of mother normalized to body weight assuming exposure to the mother and feus are the same. 2 Values are in units of milligrams of pollutant on skin per kilogram of body weight per year. 3 Mean values were not used in the HRA and are provided for informational purposes only. High-end ADL was combined with the concentration of pollutant in soil (see Section 5.5.2), the fraction absorbed across skin (pollutant-specific factor), the exposure duration (i.e., 30 years) and the averaging time (i.e., 70 year lifetime) using equations presented in the HRA Guidelines (p. 5-41) to estimate the dermal dose for each residential receptor. Worker receptors used the adult ADL and omitted exposure duration and averaging time from the calculation.
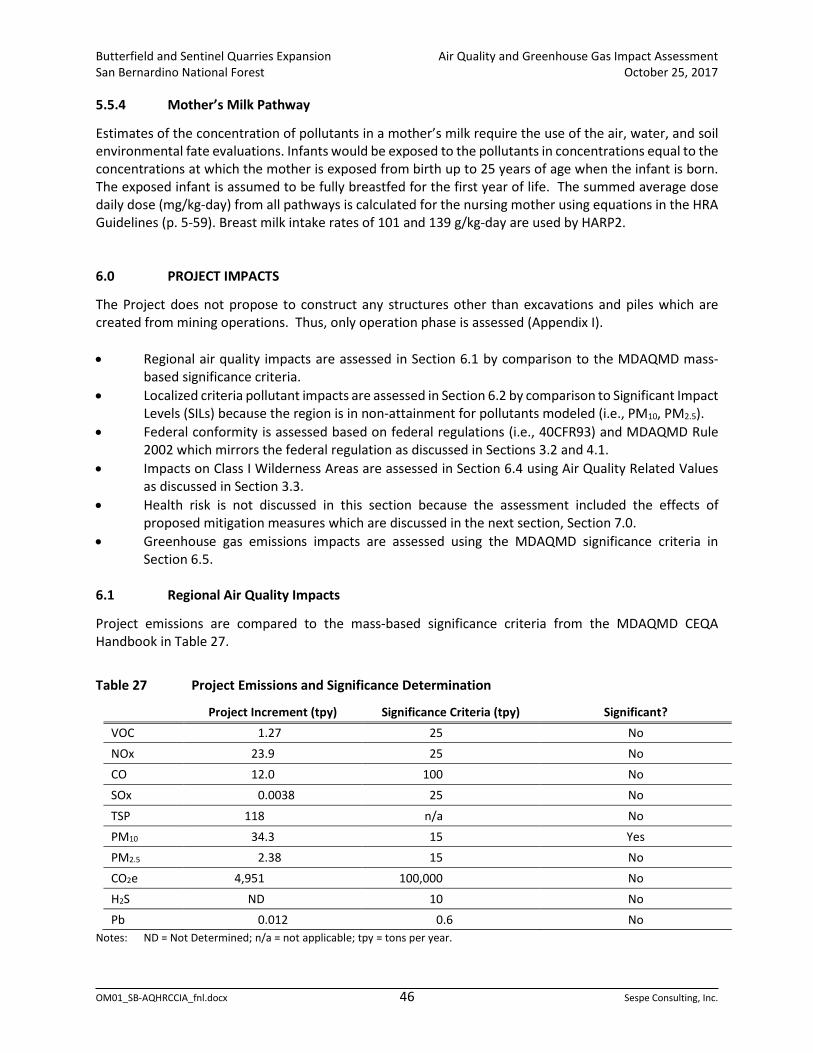
Butterfield and Sentinel Quarries Expansion Air Quality and Greenhouse Gas Impact Assessment San Bernardino National Forest October 25, 2017
OM01_SB-AQHRCCIA_fnl.docx 46 Sespe Consulting, Inc.
5.5.4 Mother’s Milk Pathway
Estimates of the concentration of pollutants in a mother’s milk require the use of the air, water, and soil environmental fate evaluations. Infants would be exposed to the pollutants in concentrations equal to the concentrations at which the mother is exposed from birth up to 25 years of age when the infant is born. The exposed infant is assumed to be fully breastfed for the first year of life. The summed average dose daily dose (mg/kg-day) from all pathways is calculated for the nursing mother using equations in the HRA Guidelines (p. 5-59). Breast milk intake rates of 101 and 139 g/kg-day are used by HARP2. 6.0 PROJECT IMPACTS
The Project does not propose to construct any structures other than excavations and piles which are created from mining operations. Thus, only operation phase is assessed (Appendix I). • Regional air quality impacts are assessed in Section 6.1 by comparison to the MDAQMD mass-
based significance criteria. • Localized criteria pollutant impacts are assessed in Section 6.2 by comparison to Significant Impact
Levels (SILs) because the region is in non-attainment for pollutants modeled (i.e., PM10, PM2.5). • Federal conformity is assessed based on federal regulations (i.e., 40CFR93) and MDAQMD Rule
2002 which mirrors the federal regulation as discussed in Sections 3.2 and 4.1. • Impacts on Class I Wilderness Areas are assessed in Section 6.4 using Air Quality Related Values
as discussed in Section 3.3. • Health risk is not discussed in this section because the assessment included the effects of
proposed mitigation measures which are discussed in the next section, Section 7.0. • Greenhouse gas emissions impacts are assessed using the MDAQMD significance criteria in
Section 6.5. 6.1 Regional Air Quality Impacts
Project emissions are compared to the mass-based significance criteria from the MDAQMD CEQA Handbook in Table 27.
Table 27 Project Emissions and Significance Determination
Project Increment (tpy) Significance Criteria (tpy) Significant? VOC 1.27 25 No NOx 23.9 25 No CO 12.0 100 No SOx 0.0038 25 No TSP 118 n/a No PM10 34.3 15 Yes PM2.5 2.38 15 No CO2e 4,951 100,000 No H2S ND 10 No Pb 0.012 0.6 No
Notes: ND = Not Determined; n/a = not applicable; tpy = tons per year.

Butterfield and Sentinel Quarries Expansion Air Quality and Greenhouse Gas Impact Assessment San Bernardino National Forest October 25, 2017
OM01_SB-AQHRCCIA_fnl.docx 47 Sespe Consulting, Inc.
As shown in Table 27, the increment in emissions exceeds the mass-based threshold for PM10. Other pollutant emissions are less than the significance criteria and will not result in a significant impact on regional air quality. 6.2 Localized Criteria Pollutant Impacts
A project will have a “potentially significant impact” on air quality if it “violates any air quality standard or contributes substantially to an existing or projected air quality violation.” Project emissions have the potential to create localized “hot spots” if, when summed with existing ambient concentrations, they result in concentrations greater than the applicable AAQS. The main criteria pollutants of concern for the Project are TSPs (used for deposition modeling), PM10, and PM2.5. Ambient air quality standards for pollutants that are less of a concern are discussed first followed by modeling results for the criteria pollutants of concern. As discussed in the EPA Modeling Guidelines (40 CFR Part 51, Appendix W), CO AAQS exceedence is generally a concern at high volume vehicular intersections in urban areas that operate at level of service (LOS) D or worse and where CO is emitted into partially or completely enclosed spaces such as parking structures and garages. The Guidelines state the following regarding CO models:
“5.1.a. This section identifies modeling approaches or models appropriate for addressing ozone (O3) a, carbon monoxide (CO), nitrogen dioxide (NO2), particulates (PM–2.5 and PM–10), and lead. These pollutants are often associated with emissions from numerous sources. Generally, mobile sources contribute significantly to emissions of these pollutants or their precursors. For cases where it is of interest to estimate concentrations of CO or NO2 near a single or small group of stationary sources, refer to Section 4. (Modeling approaches for SO2 are discussed in Section 4.) 5.1.i. Models for assessing the impact of CO emissions are needed for a number of different purposes. Examples include evaluating effects of point sources, congested intersections and highways, as well as the cumulative effect of numerous sources of CO in an urban area.
This Project has no stationary combustion sources, is not in an urban area, and would not change the number of vehicles on a public road. Moreover, the maximum possible increase in CO emissions is 12 ton/yr which is much less than the PSD screening threshold of 250 ton/yr for a single source above which CO modeling is required. Finally, even if the Project was responsible for an increasing the concentration of CO by an amount relative to the increase in emissions over the existing emissions (i.e., 40% as shown in Table 16, existing concentrations and applicable AAQS are in Table 1 and Table 2), the result would still not exceed the AAQS. For these reasons, modeling for CO is unwarranted for the Project and the impact on CO AAQS is considered less than significant. SO2 AAQS exceedences are normally a concern for industrial facilities and specifically those that burn coal or refine petroleum. In fact, the EPA Guidelines recommend all modeling for SO2 be performed using methods applicable to stationary sources (i.e., AERMOD). The maximum possible increase in SO2 emissions is 0.0038 ton/yr which is much less than the PSD screening threshold of 40 ton/yr for a single source above which SO2 modeling is warranted. Moreover, California has regulations that affect each in-use diesel engine on-site and the fuel burned in those engines. In-use requirements are implemented on

Butterfield and Sentinel Quarries Expansion Air Quality and Greenhouse Gas Impact Assessment San Bernardino National Forest October 25, 2017
OM01_SB-AQHRCCIA_fnl.docx 48 Sespe Consulting, Inc.
a fleetwide basis and require all engines to be replaced or retrofit with diesel particulate filters. In California, diesel fuel is required to be ultra-low sulfur which has less than 15 ppmw sulfur as compared to EPA standards which require less than 2,000 ppmw sulfur. Finally, even if the Project was responsible for an increasing the concentration of SO2 by an amount relative to the increase in emissions over the existing emissions (i.e., 40% as shown in Table 16, existing concentrations and applicable AAQS are in Table 1 and Table 2), the result would still not exceed the AAQS. For these reasons, SO2 modeling is unwarranted for the Project and the impact on SO2 AAQS is considered less than significant. NO2 AAQS exceedences are normally a concern for facilities with a large combustion source. The quarrying and transportation of materials is performed by diesel engines which are a source of NO2. However, the diesel vehicles are comparatively small emitters of NO2 and they move in order to perform job tasks. Movement reduces the likelihood of a hot spot. NO2 has annual and hourly AAQS. On an annual basis, the Project would result in an increase in NOx emissions that is less than the mass-based MDAQMD CEQA Significance Criteria. Therefore, modeling to determine annual NO2 concentration for comparison to the AAQS is not warranted. On an hourly basis, the Project may increase NOx hourly potential to emit by adding up to four offroad engines. Specifically, two offroad haul trucks, one loader/excavator, and one mobile crusher/screening system or surface miner. The potential for the Project to cause or contribute to an exceedence of the hourly NO2 AAQS is unlikely given the size of the operational area (214.8 acres), distance from the quarries where activity is expected to be most intense to the Project boundary, and the limited potential increase in hourly activity at any one location on-site. Therefore, modeling hourly NO2 concentrations is not warranted for the Project and the impact on NO2 AAQS is considered less than significant. Emissions of the criteria pollutants of concern for the Project (i.e., PM10 and PM2.5) are modeled to predict concentrations at the off-site point of maximum impact (PMI). For Project sources that are close to the ground relative to the distance to the boundary, the PMIs are predicted at the property boundary. Table 28 shows impact assessment results for the PM10 and PM2.5 air dispersion models that were prepared.
Table 28 PM10 and PM2.5 Concentrations at Point of Maximum Impact and Significance Determination
(all values in units µg/m3) PM10-24hr PM10-Annual PM2.5-24hr PM2.5-Annual Increment 14.4 3.07 3.0 0.37
Background 160.2 18.5 35.1 9.7
Cumulative Concentration 174.6 21.57 38.1 10.07
Most Stringent AAQS 50 20 12 35
SIL 10.4 2.08 2.5 0.63
Exceeds AAQS? No No No No
Exceeds SIL? Yes Yes Yes No Note: PMI for the 24-hr concentrations occurs at 506637.17, 3798752.79 which is located east of Sentinel Quarry. Annual
concentration PMI occurs at 505406.72, 3801304.61 which is where the Project boundary crosses Crystal Creek Road.

Butterfield and Sentinel Quarries Expansion Air Quality and Greenhouse Gas Impact Assessment San Bernardino National Forest October 25, 2017
OM01_SB-AQHRCCIA_fnl.docx 49 Sespe Consulting, Inc.
Results of criteria pollutant modeling show that the Project alone would not exceed the most stringent AAQS but would increase pollutants concentrations above the both 24-hour SILs and the SIL for annual PM10. The SILs represent the amount that is cumulatively considerable and are applied as the significance thresholds. The exceedences are because of road dust and bulldozing/grading each of which is likely overestimated by the MDAQMD and US EPA AP-42 calculation methodologies. Nevertheless, mitigations and alternatives are assessed later in this report that will reduce the impacts shown in Table 28. Deposition of dust occurs onto plants surrounding the quarries and specifically areas called out for conservation in the Carbonate Plant Habitat Management Strategy. Deposition outside the operational areas of the quarries is on the order of 1.0 gram per square meter per year (g/m2-yr). This modeling was performed in order to disclose this impact so that it could be considered as an impact on Class II Wilderness Areas that surround the quarries (i.e. Class II areas are all areas in the National Forest that are not Class I). 6.3 Federal Conformity
As discussed in Section 3.1, federal conformity analysis is not required provided that: - NOx and VOC emissions are less than 25 tons per year each; - PM10 emissions are less than 100 tons per year; and - Emissions are less than 10% of the non-attainment area emissions inventory. As shown in Table 27, the Project emits 1.27 tons per year of VOC (i.e. ROG) and 23.9 tons per year of NOx. Thus, VOC and NOx emissions are each less than the screening threshold. PM10 emissions are 34.3 tons per year which is also less than the applicable screening threshold. In 2010, sources within San Bernardino portion of the Mojave Desert Air Basin (CARB 2009 Almanac) emitted NOx and PM10 in the amounts of 55,125 tons per year and 43,646 tons per year, respectively. The Project increment represents 0.043% of the NOx emissions and 0.055% of the PM10 emissions in the region. The standard is to evaluate the emissions inventory within the non-attainment area. However, those emissions were not readily available. The Project may represent a somewhat higher percentage of the total emissions within the Western Mojave Desert Ozone Non-Attainment Area and/or the “portion of MDAQMD outside of Southeast Desert Modified AQMA.” However, is unlikely that the emissions would exceed 10% in any case. 6.4 Class I Wilderness Area Impacts
The Federal Land Managers’ AQRVs apply to new or modified major sources and are generally used for PSD permitting under the Clean Air Act. The Project does not propose a new stationary major source or a modified stationary major source that would require a permit under the Clean Air Act. Fugitive area source emissions and vehicular emissions are excluded from determining whether the quarry is a major source (i.e., only emissions from stationary sources are counted). The Omya facility is not considered a major source as evidenced by the fact that it holds local district operating permits rather than a federal operating permit under Title V of the Clean Air Act (i.e., as required by the implementing regulations in 40 CFR Part 70). The Project would modify the Sentinel and Butterfield Quarries by increasing the production rate. A major modification which would trigger review of AQRVs would have a significant emissions increase defined as exceeding the values from 40 CFR Section 52.21(b)(23) shown in Table 29.

Butterfield and Sentinel Quarries Expansion Air Quality and Greenhouse Gas Impact Assessment San Bernardino National Forest October 25, 2017
OM01_SB-AQHRCCIA_fnl.docx 50 Sespe Consulting, Inc.
Table 29 Comparison of Project Emissions with Major Modification Thresholds
Pollutant
Major Modification Significant Increase
(ton/yr) Project Increase
(ton/yr) Mitigated Project Increase (ton/yr)
CO 100 12 12 NOX 40 23.9 15.3 SOX 40 0.0038 0.0038 PM 25 118 23 PM10 15 34.3 2.1 PM2.5 10 2.38 -3.39 H2S 10 ND ND Pb 0.6 0.012 0.012
As shown in Table 29, even when fugitive and mobile sources are included in the comparison, the increased emissions from sources operated by Omya do not exceed major modification thresholds and would therefore not be evaluated under the Prevention of Significant Deterioration (PSD) program. By not triggering PSD, the increase in emissions would also not be required to assess the AQRVs. Nevertheless, US Forest Service staff has required evaluation of potential impacts on AQRVs for this Project. The FLAG report provides an equation (Quantity/Distance < 10; or Q/D < 10) by which projects may screen out of detailed analyses for impacts to AQRVs. Application of the equation is limited to projects that are located more than 50 km from a Class I Wilderness Area. This Project is located 18 km from the San Gorgonio Wilderness Area and may not use the Q/D approach. Project sources are fugitive and mobile such that a coherent plume is physically impossible. Moreover, Figure 23, which shows the intervening terrain between the Project site and the San Gorgonio Wilderness Area is such that there is little possibility that an observer of one could see the other. As shown in Table 29, were this Project a single stationary source seeking an air quality operating permit, no analysis of AQRVs would be necessary. Monitoring performed in the San Gorgonio Wilderness Area indicates that nitrates, organic matter, and sulfates have the strongest contributions to degrading visibility on worst days (Appendix D). The concentrations of these pollutants are the result of regional emissions and particularly emissions from the South Coast Air Basin to the west. The Project emits NOx, some of which may become nitrates but the relative amount as compared to the entire South Coast Air Basin is de minimis. The Project also emits particulate matter but the worst days are relatively unaffected by particulates. Thus, the Project is unlikely to emit pollutants in amounts that would affect visibility in the San Gorgonio and other nearby Class I Wilderness Areas. Nevertheless, visibility impact analysis was performed (Appendix N) using the Major Modification thresholds that are shown to be greater than Project emissions increase in Table 29. Based on the visibility analysis presented in Appendix N, even if the Project were to emit greater amounts of pollutants up to the Major Modification thresholds, the impact on visibility would be less than significant. Phytotoxic ozone concentrations may result where the plume from a large combustion source travels relatively intact a sufficient distance for the photo-chemical reaction between NOx, reactive organics, and

Butterfield and Sentinel Quarries Expansion Air Quality and Greenhouse Gas Impact Assessment San Bernardino National Forest October 25, 2017
OM01_SB-AQHRCCIA_fnl.docx 51 Sespe Consulting, Inc.
sunlight to have occurred and produced ozone. The ozone would then be concentrated at a hot spot where vegetation could be affected. The Project sources of NOx are small and distributed over a large area. Therefore, it is unlikely that the Project would cause phytotoxic ozone concentrations. The deposition AQRV is concerned with the acidification of water bodies. Specifically, sulfur and nitrogen compounds cause sensitive freshwater lakes and streams to lose acid-neutralizing capacity and sensitive soils to become acidified. Other ecosystems, including the forest, may exhibit fertilization and other effects from excess nitrogen deposition. The Project sources of nitrogen and sulfur are small and distributed over a large area. Therefore, it is unlikely that the Project would cause acidification and the Project impact for this AQRV is considered less than significant. In summary, as discussed above and analyzed in Appendix N, the Project would have a less than significant effect on each of the ARQVs. 6.5 Greenhouse Gas Emissions Impact
GHG emissions would be 4,951 tons/yr of CO2e (Appendix I) which is less than the MDAQMD criteria of 100,000 tons/yr. As discussed in Section 3.5.3, the County GHG Plan does not apply to the Project, because it is a stationary source and located on National Forest land. Thus, the 3,000 MTCO2e/yr screening criteria is not used. Even if the County screening criteria were used, the performance standards that would then be required could not be implemented because the Project does not involve the construction of buildings or additional employees traveling to the site. 7.0 PROPOSED MITIGATIONS AND RESIDUAL IMPACTS
The Project would result in significant PM10 emissions and concentrations. The following mitigations are recommended to reduce impacts to less than significant levels: Mitigation Measure AQ-1: Unpaved roads shall be controlled by at least 80% using methods that are
consistent with MDAQMD guidance.
Mitigation Measure AQ-2: Areas to be graded and where bulldozer operates shall controlled by at least 85% using methods that are consistent with MDAQMD guidance.
7.1 Mitigated Mass-Based Criteria Pollutant Impacts
Table 30 presents the mitigated increment in emissions (Appendix J: Meteorological Data Used in Modeling

Butterfield and Sentinel Quarries Expansion Air Quality and Greenhouse Gas Impact Assessment San Bernardino National Forest October 25, 2017
OM01_SB-AQHRCCIA_fnl.docx 52 Sespe Consulting, Inc.
Appendix K) and compares the increment to significance thresholds. As shown in Table 30, Mitigation Measures AQ-1 through AQ-2 reduce Project emissions to less than the MDAQMD significance thresholds.
Table 30 Mitigated Emissions Comparisons
Mitigated Increment (tpy) Significance Threshold (tpy) Significant? VOC 1.27 25 No
NOx 23.9 25 No
CO 12.0 100 No
SOx 0.0038 25 No
TSP 23 n/a No
PM10 2.1 15 No
PM2.5 -3.39 15 No
H2S ND 10 No
Pb 0.012 0.6 No Note: ND = Not Determined; n/a = not applicable; tpy = tons per year. Localized concentrations are also mitigated to less than significant levels by AQ-1 and AQ-2. Modeling results showing mitigated emissions impacts are shown in Table 31. Although cumulative concentration exceeds AAQS, the project effect would be de minimis because it does not exceed the SIL.
Table 31 Mitigated PM10 and PM2.5 Concentrations at PMI and Significance Determination
(all values in units µg/m3) PM10-24hr PM10-Annual PM2.5-24hr PM2.5-Annual Increment 7.9 1.72 1.54 0.23
Background 160.2 18.5 35.1 9.7
Cumulative Concentration 168.1 20.27 36.64 9.93
Most Stringent AAQS 50 20 12 35
SIL 10.4 2.08 2.5 0.63
Exceeds AAQS? No No No No
Exceeds SIL? No No No No Note: PMI for the 24-hr concentrations occurs at 505493.47, 3797728.78 which is located south of the B5 Pad. Annual
concentration PMI occurs at 505406.72, 3801304.61 which is where the Project boundary crosses Crystal Creek Road. 7.2 Health Risk Impacts
TACs emitted from project operation consist mainly of those found in vehicle exhaust and, to a lesser extent, trace amounts of metals and silica found fugitive dust. Table 32 presents health risk predicted at nearby receptors. As shown in Table 32, health risk impacts from the Project are less than significant. Figure 13 through Figure 17 (Appendix A) present contoured plots of health risk for the Project.

Butterfield and Sentinel Quarries Expansion Air Quality and Greenhouse Gas Impact Assessment San Bernardino National Forest October 25, 2017
OM01_SB-AQHRCCIA_fnl.docx 53 Sespe Consulting, Inc.
Table 32 Health Risk Impacts and Significance Determination
Receptor ID Cancer Risk* Chronic Non-Cancer
Risk (H.I.) * Acute Non-Cancer
Risk (H.I.) * Significant? R1 2.52 0.042 0.098 No R2 8.41 0.086 0.093 No R3 5.82 0.055 0.036 No R4 4.51 0.046 0.033 No R5 9.67 0.087 0.068 No R6 5.69 0.064 0.078 No R7 6.32 0.066 0.073 No R8 4.00 0.044 0.048 No R9 3.96 0.042 0.037 No R10 2.91 0.031 0.014 No
*Values represent excess cancer cases per million people exposed and hazard index (H.I.). 8.0 ALTERNATIVES
Reasonable alternatives were developed that respond to the significant issues, reduce potential environmental impacts and address the purpose of and need for action and project objectives. Alternatives that did not meet the purpose of and need for action, did not resolve environmental conflicts and/or were not available or feasible were eliminated from detailed consideration The Forest Supervisor and County identified the following four alternatives for detailed analysis in this DEIR/EIS, each of which is summarized below, followed by the detailed analysis. 8.1 Alternative 1: No Action/Mining under Current Entitlements
Under this alternative, Omya would not expand the Butterfield - Sentinel Quarries. The existing permitted mining activities located on approximately 137 acres within the 954 acres of unpatented placer claims controlled by Omya would continue in accordance with the approved POO and Reclamation Plans and other Federal, State and local regulations. Cancer risk which would be less than for the Project due to the shortened life of the resource and exposure duration. The additional equipment described in Table 5 of the Amended Plan of Operations (June 2013) would presumably not be added under this alternative. Nevertheless, existing entitlements would allow the project maximum of 680,000 tons to be produced from the Sentinel and Butterfield quarries exclusively. Aside from the minor differences in the number and/or type of equipment and the slightly reduced cancer risk, the air quality impacts of the No Action alternative are the same as the Project alternative.
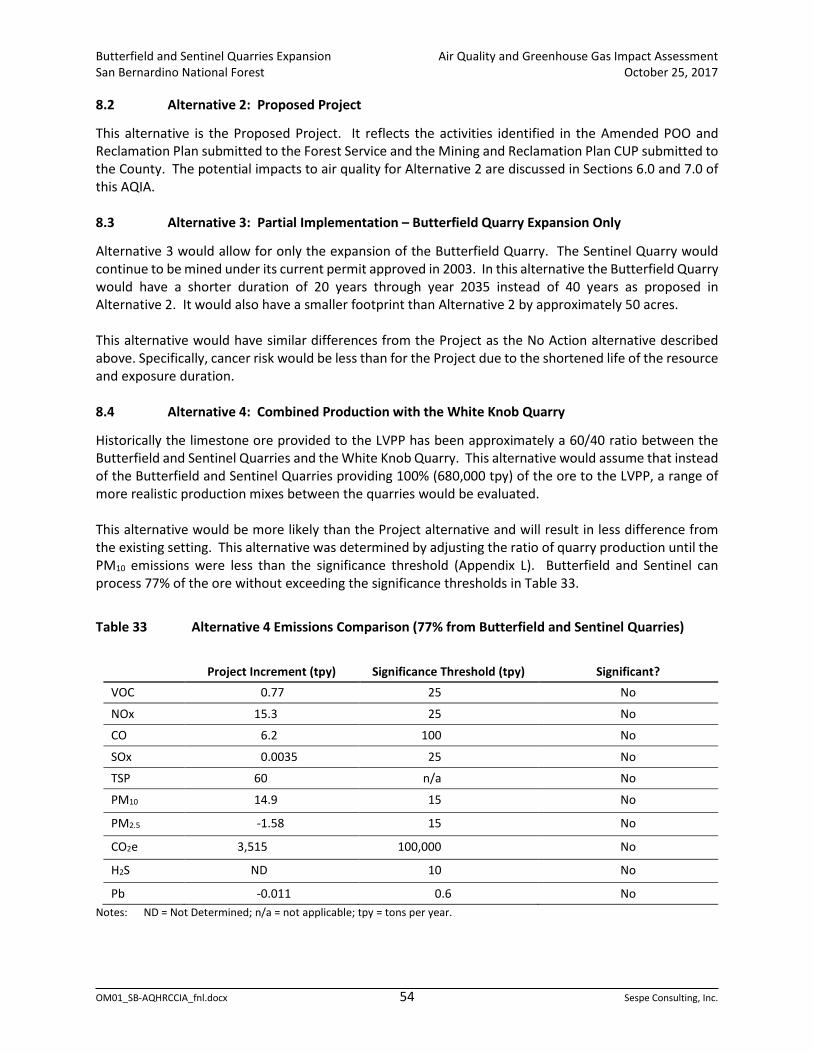
Butterfield and Sentinel Quarries Expansion Air Quality and Greenhouse Gas Impact Assessment San Bernardino National Forest October 25, 2017
OM01_SB-AQHRCCIA_fnl.docx 54 Sespe Consulting, Inc.
8.2 Alternative 2: Proposed Project
This alternative is the Proposed Project. It reflects the activities identified in the Amended POO and Reclamation Plan submitted to the Forest Service and the Mining and Reclamation Plan CUP submitted to the County. The potential impacts to air quality for Alternative 2 are discussed in Sections 6.0 and 7.0 of this AQIA. 8.3 Alternative 3: Partial Implementation – Butterfield Quarry Expansion Only
Alternative 3 would allow for only the expansion of the Butterfield Quarry. The Sentinel Quarry would continue to be mined under its current permit approved in 2003. In this alternative the Butterfield Quarry would have a shorter duration of 20 years through year 2035 instead of 40 years as proposed in Alternative 2. It would also have a smaller footprint than Alternative 2 by approximately 50 acres. This alternative would have similar differences from the Project as the No Action alternative described above. Specifically, cancer risk would be less than for the Project due to the shortened life of the resource and exposure duration. 8.4 Alternative 4: Combined Production with the White Knob Quarry
Historically the limestone ore provided to the LVPP has been approximately a 60/40 ratio between the Butterfield and Sentinel Quarries and the White Knob Quarry. This alternative would assume that instead of the Butterfield and Sentinel Quarries providing 100% (680,000 tpy) of the ore to the LVPP, a range of more realistic production mixes between the quarries would be evaluated. This alternative would be more likely than the Project alternative and will result in less difference from the existing setting. This alternative was determined by adjusting the ratio of quarry production until the PM10 emissions were less than the significance threshold (Appendix L). Butterfield and Sentinel can process 77% of the ore without exceeding the significance thresholds in Table 33.
Table 33 Alternative 4 Emissions Comparison (77% from Butterfield and Sentinel Quarries)
Project Increment (tpy) Significance Threshold (tpy) Significant? VOC 0.77 25 No
NOx 15.3 25 No
CO 6.2 100 No
SOx 0.0035 25 No
TSP 60 n/a No
PM10 14.9 15 No
PM2.5 -1.58 15 No
CO2e 3,515 100,000 No
H2S ND 10 No
Pb -0.011 0.6 No Notes: ND = Not Determined; n/a = not applicable; tpy = tons per year.

Butterfield and Sentinel Quarries Expansion Air Quality and Greenhouse Gas Impact Assessment San Bernardino National Forest October 25, 2017
OM01_SB-AQHRCCIA_fnl.docx 55 Sespe Consulting, Inc.
Table 34 presents predicted concentrations for Alternative 4. Alternative 4 is significant for the 24-hour PM10 standard and cumulative considerable when compared to PM10 annual and PM2.5 24-hour standards.
Table 34 Alternative 4 Concentration at Point of Maximum Impact
(all values in units µg/m3) PM10-24hr PM10-Annual PM2.5-24hr PM2.5-Annual
Increment 10.9 1.50 2.1 0.18
Background 160.2 18.5 35.1 9.7
Cumulative Concentration 171.1 20.0 37.2 9.88
Most Stringent AAQS 50 20 12 35
SIL 10.4 2.08 2.5 0.63
Exceeds AAQS? No No No No
Exceeds SIL? Yes No No No Note: Daily PMI for PM10 occurs at 505533.04, 3797727.34 which is located south of the B5 Pad and daily PMI for PM2.5 occurs
at 506637.17, 3798752.79 which is located east of Sentinel Quarry. Annual concentration PMI occurs at 505406.72, 3801304.61 which is where the Project boundary crosses Crystal Creek Road.
Table 35 presents health risk results for Alternative 4. The results indicate that Alternative 4 will result in less than significant impacts on health risk. Figure 18 through Figure 22 (Appendix A) show contoured plots of health risk for Alternative 4.
Table 35 Alternative 4 Health Risk Impacts and Significance Determinations
Receptor ID Cancer Risk * Chronic Non-Cancer
Risk (H.I.) * Acute Non-Cancer
Risk (H.I.) Significant?
R1 1.09 0.0064 0.00211 No R2 3.70 0.0224 0.0019 No R3 3.47 0.0542 0.0823 No R4 2.72 0.0447 0.0636 No R5 4.54 0.0338 0.0187 No R6 2.45 0.0138 0.0018 No R7 2.78 0.0167 0.0019 No R8 1.73 0.0093 0.0014 No R9 1.76 0.0113 0.0019 No R10 1.32 0.0099 0.0005 No
*Values represent excess cancer cases per million people exposed and hazard index (H.I.). As shown in Table 34, Alternative 4 would result in a cumulatively considerable concentration of PM10. Accordingly, Alternative 4 requires mitigation of the impact to less than significant levels or the maximum extent feasible. Alternative 4 Mitigation Measure AQ-1 is applied to reduce concentrations of particulates.

Butterfield and Sentinel Quarries Expansion Air Quality and Greenhouse Gas Impact Assessment San Bernardino National Forest October 25, 2017
OM01_SB-AQHRCCIA_fnl.docx 56 Sespe Consulting, Inc.
Alt 4 Mitigation Measure AQ-1: Unpaved roads shall be controlled by at least 80% using methods that are consistent with MDAQMD guidance.
Mitigated concentrations of particulates presented in Table 36 are less than the SILs which are applied as the significance threshold.
Table 36 Mitigated Alternative 4 Concentrations at PMI and Significance Determinations
(all values in units µg/m3) PM10-24hr PM10-Annual PM2.5-24hr PM2.5-Annual Increment 8.6 0.57 1.86 0.11
Background 160.2 18.5 35.1 9.7
Cumulative Concentration 168.8 19.07 36.96 9.81
Most Stringent AAQS 50 20 12 35
SIL 10.4 2.08 2.5 0.63
Exceeds AAQS? No No No No
Exceeds SIL? No No No No Note: Daily PMI for PM10 occurs at 506638.52, 3798702.95 and daily PMI for PM2.5 occurs at 506637.17, 3798752.79; both of
which are located east of Sentinel Quarry. Annual concentration PMI occurs at 505406.72, 3801304.61 which is where the Project boundary crosses Crystal Creek Road.
9.0 REFERENCES
AB 32 Scoping Plan, CARB, December 2014. (http://www.arb.ca.gov/cc/scopingplan/document/scopingplandocument.htm ). AB 32 Scoping Plan, updated October 1, 2015 http://www.arb.ca.gov/cc/scopingplan/meetings/10_1_15slides/2015slides.pdf AERMOD View Version 8.2.0 by Lakes Environmental (AERMOD build number 12345). (http://www.weblakes.com/products/aermod/index.html ) Air Toxics Hot Spots Program Guidance Manual for Preparation of Health Risk Assessments, California
Office of Environmental Health Hazard Assessment (OEHHA) (2015) (http://www.oehha.org/air/hot_spots/HRAguidefinal.html ).
AP-42, US EPA. (http://www.epa.gov/ttn/chief ). Area Designations Maps, (page last reviewed August 22, 2014) (http://www.arb.ca.gov/desig/adm/adm.htm ) CalEEMod User Guide Version 2011.1, SCAQMD, February 2011.
(http://www.aqmd.gov/caleemod/guide.htm ). CEQA and Federal Conformity Guidelines, MDAQMD, August 2011. (http://www.mdaqmd.ca.gov/Modules/ShowDocument.aspx?documentid=2910 ).

Butterfield and Sentinel Quarries Expansion Air Quality and Greenhouse Gas Impact Assessment San Bernardino National Forest October 25, 2017
OM01_SB-AQHRCCIA_fnl.docx 57 Sespe Consulting, Inc.
EMFAC2011, CARB. (http://www.arb.ca.gov/msei/msei.htm ). EPA Memorandum from Tyler Fox, Leader Air Quality Modeling Group C439-01 to Regional Air Division
Directors, “Additional Clarification Regarding Application of Appendix W Modeling Guidance for the 1-hour NO2 National Ambient Air Quality Standard” dated March 1, 2011.
(http://www.epa.gov/region7/air/nsr/nsrmemos/appwno2_2.pdf) EPA’s Endangerment Finding – Health Effects Fact Sheet (http://www.epa.gov/climatechange/Downloads/endangerment/EndangermentFinding_Health.
pdf ). Final Supplement to the AB 32 Scoping Plan Functionally Equivalent Document, CARB, August 24, 2011. (http://www.arb.ca.gov/cc/scopingplan/document/final_supplement_to_sp_fed.pdf) . GHG Emissions Development Process Review, San Bernardino County (updated 3/2015). HARP User Manual, CARB, 8/1/2014 (http://www.arb.ca.gov/toxics/harp/harp.htm ). Hot Spots Analysis and Reporting Program (HARP) Version 1.4f (Build 23.11.01), CARB, May 2012.
(http://www.arb.ca.gov/toxics/harp/harp.htm). Multiple Air Toxics Exposure Study in the South Coast Air Basin (MATES-II and MATES-III), South Coast
Air Quality Management District, March 2000 and September 2008. (http://www.aqmd.gov/matesiidf/matestoc.htm) (http://www.aqmd.gov/prdas/matesIII/matesIII.html) Multiple Air Toxics Exposure Study in the South Coast Air Basin (MATES-IV) Final Report, May 2015. (http://www.aqmd.gov/home/library/air -quality -data - studies/health -studies/mates -iv ) OFFROAD2011, CARB. (http://www.arb.ca.gov/msei/msei.htm) . “Phase I Report – Revised 2010,” Federal Land Managers’ Air Quality Related Values Work Group (FLAG),
October 2010. (http://www.nature.nps.gov/air/pubs/pdf/flag/FLAG_2010.pdf) . Rules and Regulations of the Mojave Desert Air Quality Management District. (http://www.mdaqmd.ca.gov/index.aspx?page=138) . Regulatory Advisory 10-414, CARB, May 2011. (http://www.arb.ca.gov/enf/advs/advs414.pdf ). State CEQA Guidelines, National Resources Agency, last updated March 18, 2010. (http://ceres.ca.gov/ceqa/guidelines/ ).

Butterfield and Sentinel Quarries Expansion Air Quality and Greenhouse Gas Impact Assessment San Bernardino National Forest October 25, 2017
OM01_SB-AQHRCCIA_fnl.docx 58 Sespe Consulting, Inc.
Speciation Profiles Used in ARB Modeling, CARB, December 12, 2012. (http://www.arb.ca.gov/ei/speciate/speciate.htm ).

Butterfield and Sentinel Quarries Expansion Air Quality and Greenhouse Gas Impact Assessment San Bernardino National Forest October 12, 2017
OM01_SB-AQHRCCIA_fnl.docx Sespe Consulting, Inc.
Appendix A: Figures

FIGURE
PROJECT #: OM01.12.06 DATE: 12/31/15SCALE: as shown DRAWN BY: SDC
Site Location
1OMYA
San Bernardino National ForestCalifornia

Numbered items are Volume Sources (e.g. 1 is VOL1, 2 is VOL 2, etc.) FIGURELettered items are line sources which are dissociated into individual volume sources beginning with the letter shown (e.g. road segment Ais modeled as a number of volume sources A001, A002, etc.).
PROJECT #: OM01.12.06 DATE: 12/31/15SCALE: as shown DRAWN BY: SDC
Site Plan
2OMYA
San Bernardino National ForestCalifornia

FIGURE
PROJECT #: OM01.12.06 DATE: 12/31/15SCALE: as shown DRAWN BY: SDC
SCAQMD MATES IV Risk Map
3OMYA
San Bernardino National ForestCalifornia

FIGURE
PROJECT #: OM01 DATE: 10/25/17SCALE: As shown DRAWN BY: SDC
Wind Rose (blowing from)
4OMYA
San Bernardino National ForestCalifornia
Notes: MM5 predictive meteorological data used in dispersion modeling was generated by Lakes Environmental based on coordinate provided by Sespe depicted as center of windrose. Coordinate chosen between Project site, White Knob Quarry, and nearby receptors. See also Figures 5 & 6.

FIGURE
PROJECT #: OM01 DATE: 10/25/17SCALE: As shown DRAWN BY: SDC
Wind Speed Frequency Distribution
5OMYA
San Bernardino National ForestCalifornia
0.3
9.5
18.1
36.6
30.5
3.8
1.2
0
5
10
15
20
25
30
35
40
%
y Q p
Wind Class (Knots)
Calms 0.97 - 4.08 4.08 - 7.00 7.00 - 11.08 11.08 - 17.11 17.11 - 21.58 >= 21.58
ubset 1 0.3 9.5 18.1 36.6 30.5 3.8 1.2
Notes: MM5 predictive meteorological data used in dispersion modeling was generated by Lakes Environmental based on coordinate provided by Sespe depicted as center of windrose. Coordinate chosen between Project site, White Knob Quarry, and nearby receptors. See also Figures 4 & 6.
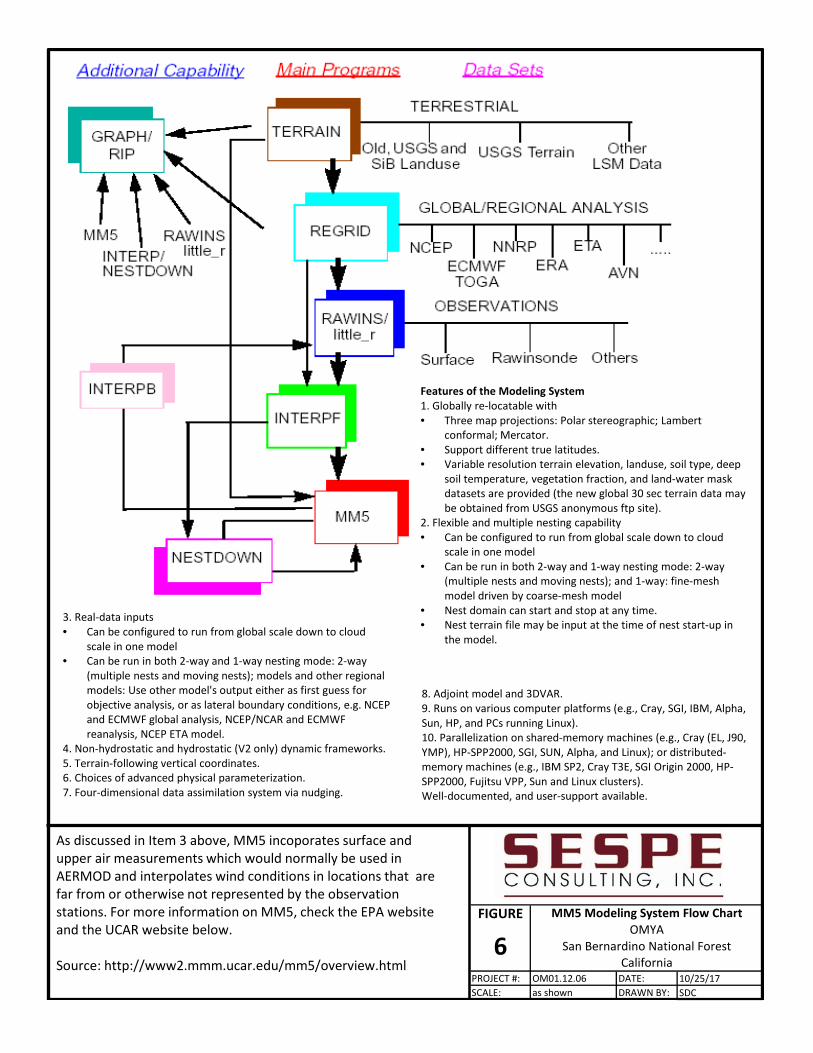
FIGURE
PROJECT #: OM01.12.06 DATE: 10/25/17SCALE: as shown DRAWN BY: SDC
MM5 Modeling System Flow Chart
6OMYA
San Bernardino National ForestCalifornia
As discussed in Item 3 above, MM5 incoporates surface and upper air measurements which would normally be used in AERMOD and interpolates wind conditions in locations that are far from or otherwise not represented by the observation stations. For more information on MM5, check the EPA website and the UCAR website below.
Source: http://www2.mmm.ucar.edu/mm5/overview.html
Features of the Modeling System 1. Globally re-locatable with• Three map projections: Polar stereographic; Lambert
conformal; Mercator. • Support different true latitudes. • Variable resolution terrain elevation, landuse, soil type, deep
soil temperature, vegetation fraction, and land-water mask datasets are provided (the new global 30 sec terrain data may be obtained from USGS anonymous ftp site).
2. Flexible and multiple nesting capability • Can be configured to run from global scale down to cloud
scale in one model • Can be run in both 2-way and 1-way nesting mode: 2-way
(multiple nests and moving nests); and 1-way: fine-mesh model driven by coarse-mesh model
• Nest domain can start and stop at any time. • Nest terrain file may be input at the time of nest start-up in
the model.
3. Real-data inputs • Can be configured to run from global scale down to cloud
scale in one model • Can be run in both 2-way and 1-way nesting mode: 2-way
(multiple nests and moving nests); models and other regional models: Use other model's output either as first guess for objective analysis, or as lateral boundary conditions, e.g. NCEP and ECMWF global analysis, NCEP/NCAR and ECMWF reanalysis, NCEP ETA model.
4. Non-hydrostatic and hydrostatic (V2 only) dynamic frameworks. 5. Terrain-following vertical coordinates. 6. Choices of advanced physical parameterization. 7. Four-dimensional data assimilation system via nudging.
8. Adjoint model and 3DVAR. 9. Runs on various computer platforms (e.g., Cray, SGI, IBM, Alpha, Sun, HP, and PCs running Linux). 10. Parallelization on shared-memory machines (e.g., Cray (EL, J90, YMP), HP-SPP2000, SGI, SUN, Alpha, and Linux); or distributed-memory machines (e.g., IBM SP2, Cray T3E, SGI Origin 2000, HP-SPP2000, Fujitsu VPP, Sun and Linux clusters).Well-documented, and user-support available.

Discrete Receptors numbers are shown in red markers. FIGUREOperational areas are shown in blue.
PROJECT #: OM01.12.06 DATE: 12/31/15SCALE: as shown DRAWN BY: SDC
Discrete Receptors in HRA Model
7OMYA
San Bernardino National ForestCalifornia
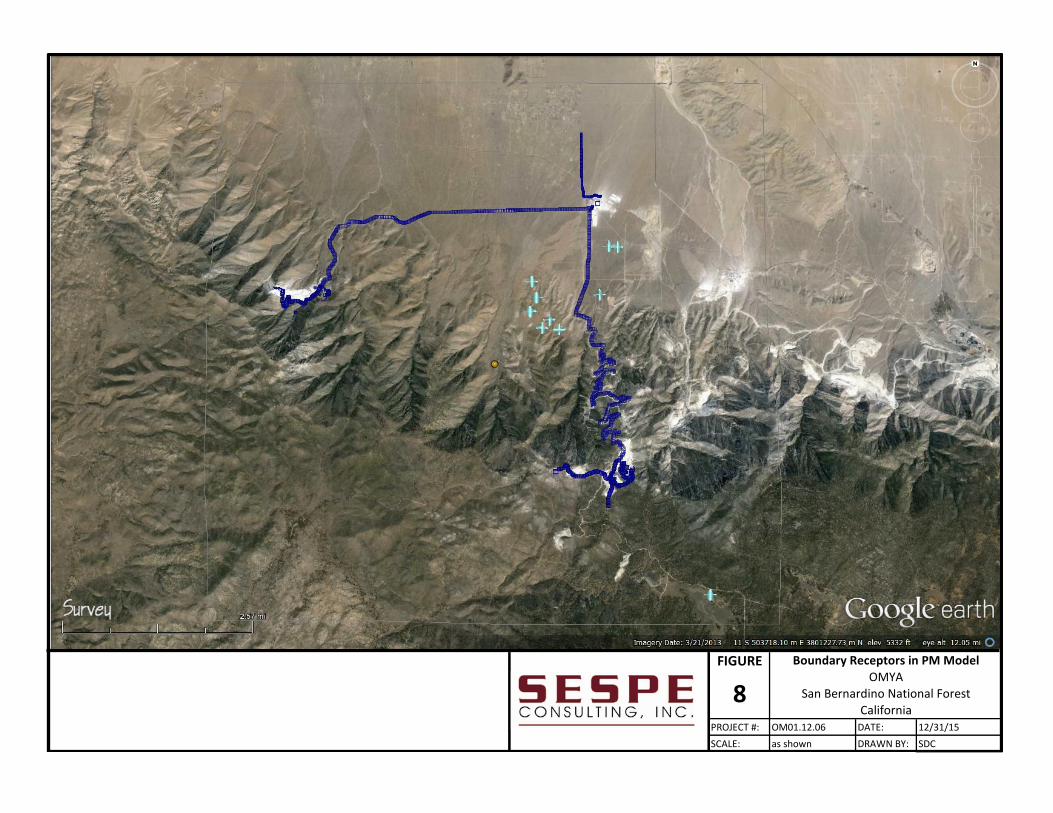
FIGURE
PROJECT #: OM01.12.06 DATE: 12/31/15SCALE: as shown DRAWN BY: SDC
8Boundary Receptors in PM Model
OMYASan Bernardino National Forest
California

FIGURE
PROJECT #: OM01.12.06 DATE: 12/31/15SCALE: as shown DRAWN BY: SDC
Grid Receptors in HRA Model
9OMYA
San Bernardino National ForestCalifornia

White areas represent Stage 1 Priority Areas from the Carbonate FIGUREHabitat Management Strategy.
PROJECT #: OM01.12.06 DATE: 12/31/15SCALE: as shown DRAWN BY: SDC
Grid Receptors in Deposition Model
10OMYA
San Bernardino National ForestCalifornia
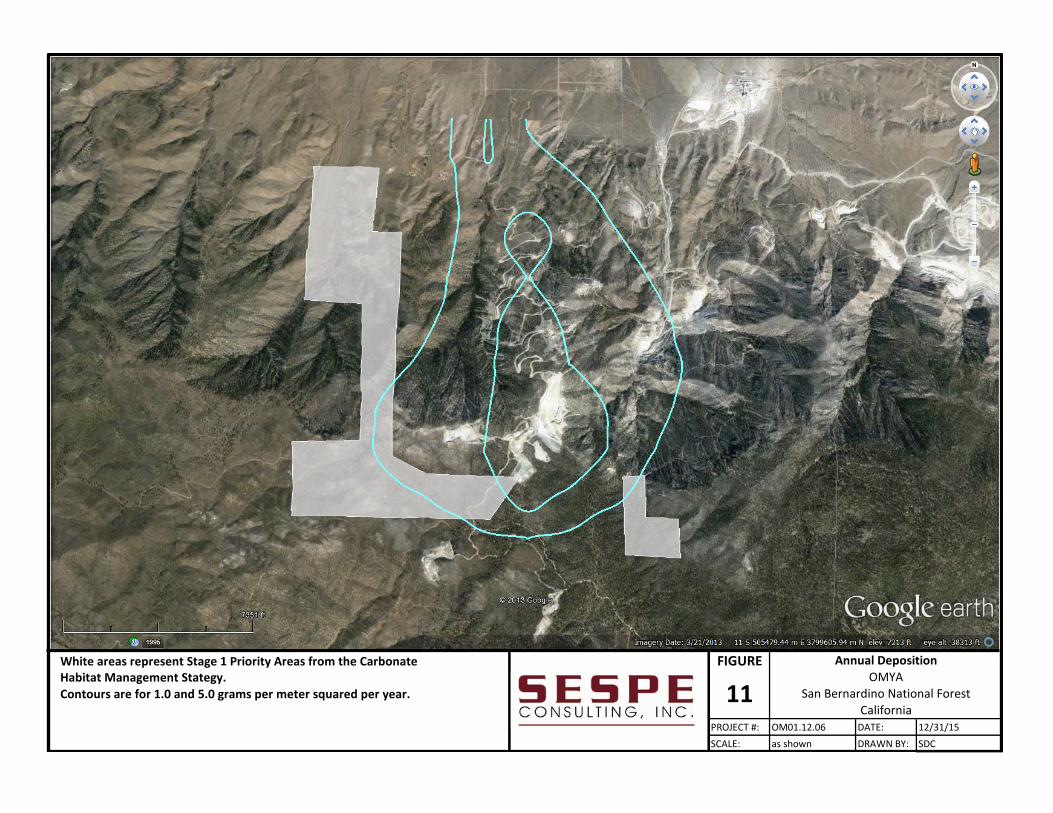
White areas represent Stage 1 Priority Areas from the Carbonate FIGUREHabitat Management Stategy.Contours are for 1.0 and 5.0 grams per meter squared per year.
PROJECT #: OM01.12.06 DATE: 12/31/15SCALE: as shown DRAWN BY: SDC
Annual Deposition
11OMYA
San Bernardino National ForestCalifornia

White areas represent Stage 1 Priority Areas from the Carbonate FIGUREHabitat Management Stategy.Contours are for 1.0 and 5.0 grams per meter squared per year.
PROJECT #: OM01.12.06 DATE: 12/31/15SCALE: as shown DRAWN BY: SDC
Daily Deposition
12OMYA
San Bernardino National ForestCalifornia

Cancer risk in units of excess cancer cases per million individuals exposed. FIGURE
PROJECT #: OM01.12.06 DATE: 12/31/15SCALE: as shown DRAWN BY: SDC
Cancer Risk at Sensitive Receptors - Project Increment
13OMYA
San Bernardino National ForestCalifornia

Non-cancer health risk is in units of hazard index. FIGURE
PROJECT #: OM01.12.06 DATE: 12/31/15SCALE: as shown DRAWN BY: SDC
Chronic Risk at Sensitive Receptors - Project Increment
14OMYA
San Bernardino National ForestCalifornia

Cancer risk in units of excess cancer cases per million individuals exposed FIGURE
PROJECT #: OM01.12.06 DATE: 12/31/15SCALE: as shown DRAWN BY: SDC
Cancer Risk at Worker Receptors - Project Increment
15OMYA
San Bernardino National ForestCalifornia

Non-cancer health risk is in units of hazard index. FIGURE
PROJECT #: OM01.12.06 DATE: 12/31/15SCALE: as shown DRAWN BY: SDC
Chronic Risk at Worker Receptors - Project Increment
16OMYA
San Bernardino National ForestCalifornia

Non-cancer health risk is in units of hazard index. FIGURE
PROJECT #: OM01.12.06 DATE: 12/31/15SCALE: as shown DRAWN BY: SDC
Acute Risk - Project Increment
17OMYA
San Bernardino National ForestCalifornia

Cancer risk in units of excess cancer cases per million individuals exposed. FIGURE
PROJECT #: OM01.12.06 DATE: 12/31/15SCALE: as shown DRAWN BY: SDC
Cancer Risk at Sensitive Receptors - Alternative 4
18OMYA
San Bernardino National ForestCalifornia

Non-cancer health risk is in units of hazard index. FIGURE
H.I. of 1 is shown in red.H.I. of 0.5 is shown in blue.
PROJECT #: OM01.12.06 DATE: 12/31/15SCALE: as shown DRAWN BY: SDC
Chronic risk at Sensitive Receptors - Alternative 4
19OMYA
San Bernardino National ForestCalifornia
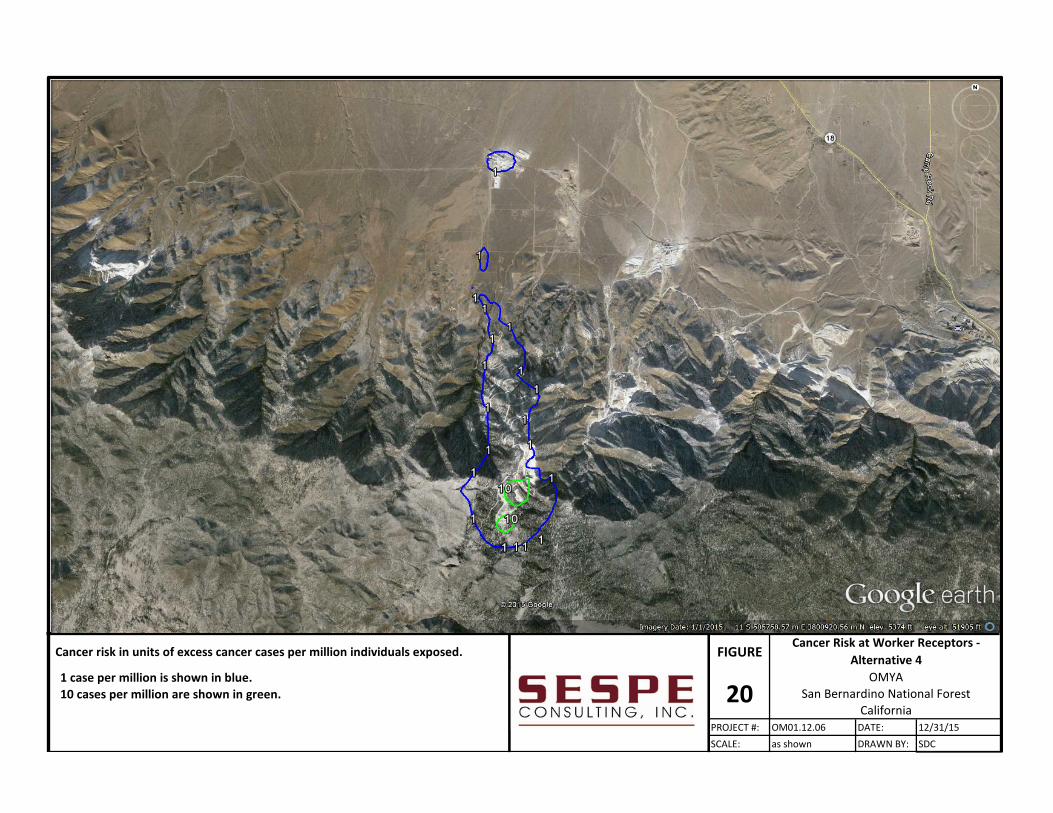
Cancer risk in units of excess cancer cases per million individuals exposed. FIGURE
1 case per million is shown in blue.10 cases per million are shown in green.
PROJECT #: OM01.12.06 DATE: 12/31/15SCALE: as shown DRAWN BY: SDC
Cancer Risk at Worker Receptors - Alternative 4
20OMYA
San Bernardino National ForestCalifornia

Non-cancer health risk is in units of hazard index. FIGURE
H.I. of 1 is shown in red.H.I. of 0.5 is shown in blue.
PROJECT #: OM01.12.06 DATE: 12/31/15SCALE: as shown DRAWN BY: SDC
Chronic Risk at Worker Receptors - Alternative 4
21OMYA
San Bernardino National ForestCalifornia

Non-cancer health risk is in units of hazard index (H.I.). FIGUREH.I. of 1 in redH.I. of 0.5 in blue
PROJECT #: OM01.12.06 DATE: 12/31/15SCALE: as shown DRAWN BY: SDC
Acute Risk - Alternative 4
22OMYA
San Bernardino National ForestCalifornia
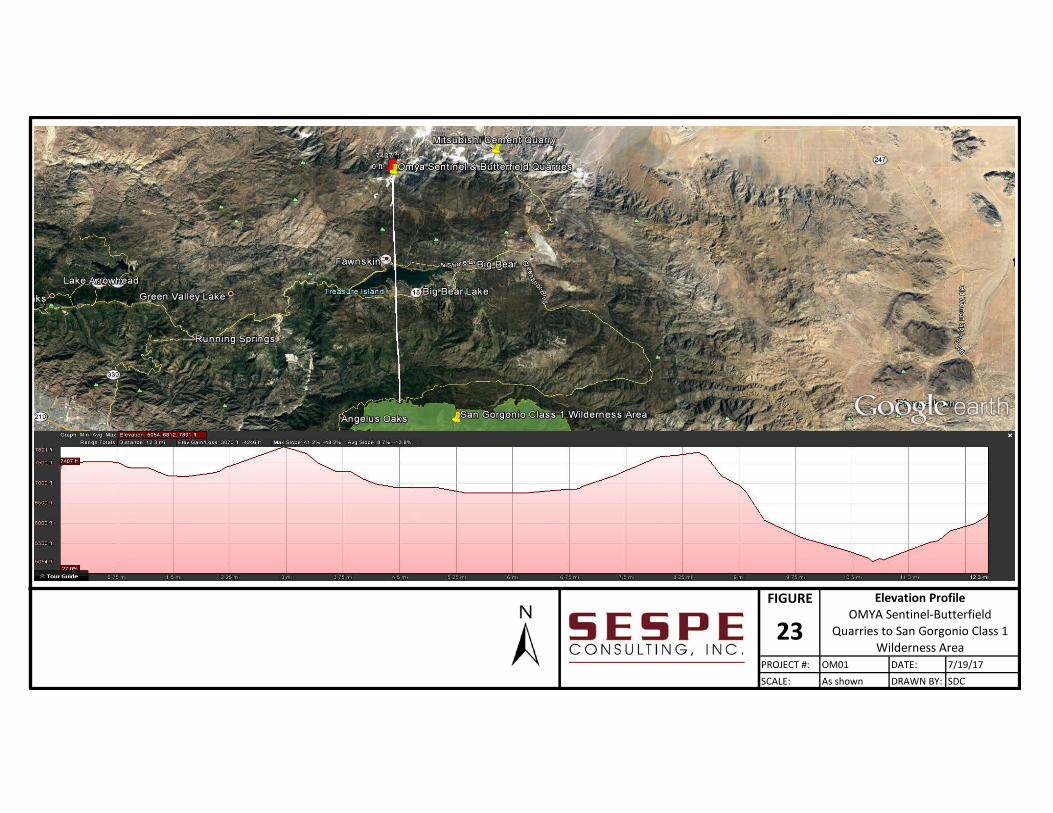
FIGURE
PROJECT #: OM01 DATE: 7/19/17SCALE: As shown DRAWN BY: SDC
Elevation Profile
23OMYA Sentinel-Butterfield
Quarries to San Gorgonio Class 1Wilderness Area

Butterfield and Sentinel Quarries Expansion Air Quality and Greenhouse Gas Impact Assessment San Bernardino National Forest October 25, 2017
OM01_SB-AQHRCCIA_fnl.docx Sespe Consulting, Inc.
Appendix B: Health Effects of Air Pollutants

APPENDIX B: HEALTH EFFECTS OF POLLUTANTS
om01_PhysicalSetting_v1.docx B-1 Sespe Consulting, Inc.
B-1.0 Ozone ....................................................................................................................................1
B-2.0 Reactive Organic Gases and Volatile Organic Compounds .......................................................2
B-3.0 Carbon Monoxide ..................................................................................................................3
B-4.0 Nitrogen Oxides .....................................................................................................................4
B-5.0 Particulate Matter .................................................................................................................5
B-6.0 Other Pollutants ....................................................................................................................6
B-6.1 Sulfur Dioxide ...................................................................................................................... 6 B-6.2 Sulfates ................................................................................................................................ 7 B-6.3 Lead ..................................................................................................................................... 8 B-6.4 Hydrogen Sulfide ................................................................................................................. 8 B-6.5 Visibility Reducing Particles ................................................................................................. 8 B-6.6 Vinyl Chloride ...................................................................................................................... 9 B-6.7 Toxic Air Contaminants ....................................................................................................... 9
Discussion presented in this section is mainly reproduced from Appendix C of the Guidelines for Preparing an Air Quality Assessment for Use in Environmental Impact Reports (County of Kern, 2006). The health effects of pollutants do not change between jurisdictions and so the information is relevant in San Bernardino County as well. B-1.0 OZONE
Ozone occurs in two layers of the atmosphere. The layer surrounding the earth's surface is the troposphere. Here, ground level or "bad" ozone is an air pollutant that damages human health, vegetation, and many common materials. It is a key ingredient of urban smog. The troposphere extends to a level about 10 miles up, where it meets the second layer, the stratosphere. The stratospheric or "good" ozone layer extends upward from about 10 to 30 miles and protects life on earth from the sun's harmful ultraviolet rays (UV-B). “Bad” ozone is what is known as a photochemical pollutant. It needs reactive organic gases (ROG), oxides of nitrogen (NOx), and sunlight. ROG and NOx are emitted from various sources throughout San Bernardino County. In order to reduce ozone concentrations, it is necessary to control the emissions of these ozone precursors. Significant ozone formation generally requires an adequate amount of precursors in the atmosphere and several hours in a stable atmosphere with strong sunlight. Ozone is a regional air pollutant. It is generated over a large area and is transported and spread by wind. Ozone, the primary constituent of smog, is the most complex, difficult to control, and pervasive of the criteria pollutants. Unlike other pollutants, ozone is not emitted directly into the air by specific sources. Ozone is created by sunlight acting on other air pollutants (called precursors), specifically NOX and ROGs. Sources of precursor gases to the photochemical reaction that form ozone number in the thousands. Common sources include consumer products, gasoline vapors, chemical solvents, and combustion products of various fuels. Originating from gas stations, motor vehicles, large industrial facilities, and small businesses such as bakeries
APPENDIX B: HEALTH EFFECTS OF POLLUTANTS
om01_PhysicalSetting_v1.docx B-2 Sespe Consulting, Inc.
and dry cleaners, the ozone forming chemical reactions often take place in another location, catalyzed by sunlight and heat. High ozone concentrations can form over large regions when emissions from motor vehicles and stationary sources are carried hundreds of miles from their origins. Approximately 50 million people lived in counties with air quality levels above U. S. EPA’s health-based national air quality standard in 1994. The highest levels of ozone were recorded in Los Angeles. High levels also persist in other heavily populated areas including the Texas Gulf Coast and much of the Northeast. While the ozone in the upper atmosphere absorbs harmful ultraviolet light, ground-level ozone is damaging to the tissues of plants, animals, and humans, as well as to a wide variety of inanimate materials such as plastics, metals, fabrics, rubber, and paints. Societal costs from ozone damage include increased medical costs, the loss of human and animal life, accelerated replacement of industrial equipment, and reduced crop yields. Health Effects While ozone in the upper atmosphere protects the earth from harmful ultraviolet radiation, high concentrations of ground level ozone can adversely affect the human respiratory system. Many respiratory ailments, as well as cardiovascular disease, are aggravated by exposure to high ozone levels. Ozone also damages natural ecosystems such as forests and foothill communities, and damages agricultural crops and some man-made materials, such as rubber, paint, and plastics. High levels of ozone may negatively impact immune systems making people more susceptible to respiratory illnesses including bronchitis and pneumonia. Ozone also accelerates aging and exacerbates pre-existing asthma and bronchitis and in cases of high concentrations can lead to the development of asthma in active children. Active people, both children and adults, appear to be more at risk from ozone exposure than those with a low level of activity. Additionally, the elderly and those with respiratory disease are also considered sensitive populations for ozone. People who work or play outdoors are at a greater risk for harmful health effects from ozone. Children and adolescents are also at greater risk, as they are more likely than adults to spend time engaged in vigorous activities. Research indicates that children under 12 years of age spend nearly twice as much time outdoors daily than adults. Teenagers spend at least twice as much time as adults in active sports and outdoor activities. Also, children inhale more air per pound of body weight than adults, and they breathe more rapidly than adults. Children are less likely than adults to notice their own symptoms and avoid harmful exposures. Ozone is a powerful oxidant – it can be compared to household bleach, which can kill living cells (such as germs or human skin cells) upon contact. Ozone can damage the respiratory tract, causing inflammation and irritation, and it can induce symptoms such as coughing, chest tightness, shortness of breath, and worsening of asthma symptoms. Ozone in sufficient doses increases the permeability of lung cells, rendering them more susceptible to toxins and microorganisms. Exposure to levels of ozone above the current ambient air quality standard leads to lung inflammation and lung tissue damage, and a reduction in the amount of air inhaled into the lungs. Recent evidence has, for the first time, linked the onset of asthma to exposure to elevated ozone levels in exercising children (McConnell, et al., 2002). Elevated ozone concentrations also reduce crop and timber yields, damage native plants, and damage materials such as rubber, paints, fabric, and plastics (CARB and American Lung Association, 2004). B-2.0 REACTIVE ORGANIC GASES AND VOLATILE ORGANIC COMPOUNDS
Hydrocarbons are organic gases that are formed solely of hydrogen and carbon. There are several subsets of organic gases including Volatile Organic Compounds (VOCs) and Reactive Organic Gases (ROGs). ROGs include all hydrocarbons except those exempted by the California Air Resources Board. Therefore, ROGs are a set of

APPENDIX B: HEALTH EFFECTS OF POLLUTANTS
om01_PhysicalSetting_v1.docx B-3 Sespe Consulting, Inc.
organic gases based on state rules and regulations. VOCs are similar to ROGs in that they include all organic gases except those exempted by federal law. The list of compounds exempt from the definition of VOC is included by the SJVAPCD and is presented in District Rule 1102. Both VOCs and ROGs are emitted from incomplete combustion of hydrocarbons or other carbon-based fuels. Combustion engine exhaust, oil refineries, and oil fueled power plants are the primary sources of hydrocarbons. Another source of hydrocarbons is evaporation from petroleum fuels, solvents, dry cleaning solutions, and paint. Health Effects The primary health effects of hydrocarbons result from the formation of ozone and its related health effects (see ozone health effects discussion above). High levels of hydrocarbons in the atmosphere can interfere with oxygen intake by reducing the amount of available oxygen through displacement. There are no separate federal or California ambient air quality standards for ROG. Carcinogenic forms of ROG are considered toxic air contaminants (TACs). An example is benzene, which is a carcinogen. The health effects of individual ROGs are described below under the toxic air contaminants heading below. B-3.0 CARBON MONOXIDE
Carbon monoxide (CO) is emitted by mobile and stationary sources as a result of incomplete combustion of hydrocarbons or other carbon-based fuels. CO is an odorless, colorless, poisonous gas that is highly reactive. CO is a byproduct of motor vehicle exhaust, which contributes more than two-thirds of all CO emissions nationwide. In cities, automobile exhaust can cause as much as 95% of all CO emissions. These emissions can result in high concentrations of CO, particularly in local areas with heavy traffic congestion. Other sources of CO emissions include industrial processes and fuel combustion in sources such as boilers and incinerators. Despite an overall downward trend in concentrations and emissions of CO, some metropolitan areas still experience high levels of CO. Health Effects CO enters the bloodstream and binds more readily to hemoglobin than oxygen, reducing the oxygen-carrying capacity of blood, thus reducing oxygen delivery to organs and tissues. The health threat from CO is most serious for those who suffer from cardiovascular disease. Healthy individuals are also affected, but only at higher levels of exposure. Carbon monoxide binds strongly to hemoglobin, the oxygen-carrying protein in blood, and thus reduces the blood’s capacity for carrying oxygen to the heart, brain, and other parts of the body. Exposure to carbon monoxide can cause chest pain in heart patients, headaches, and reduced mental alertness. At high concentrations, CO can cause heart difficulties in people with chronic diseases, and can impair mental abilities. Exposure to elevated CO levels is associated with visual impairment, reduced work capacity, reduced manual dexterity, poor learning ability, difficulty performing complex tasks, and in prolonged, enclosed exposure, death. The adverse health effects associated with exposure to ambient and indoor concentrations of CO are related to concentration of carboxyhemoglobin (COHb) in the blood. Health effects observed may include early onset of cardiovascular disease, behavioral impairment; decreased exercise performance of young healthy men, reduced birth weigh, Sudden Infant Death Syndrome (SIDS), and increased daily mortality rate (Fierro, O'Rourke, & Burgess, 2001). Most of the studies evaluating adverse health effects of CO on the central nervous system examine high-level poisoning. Such poisoning results in symptoms ranging from common flu and cold symptoms (shortness of breath on mild exertion, mild headaches, and nausea) to unconsciousness and death. Hexter and Goldsmith report an association between daily death rate and exposure to ambient CO in Los Angeles County. They postulate a concentration of 20.2 ppm (the highest daily concentration recorded during a 4 year period)

APPENDIX B: HEALTH EFFECTS OF POLLUTANTS
om01_PhysicalSetting_v1.docx B-4 Sespe Consulting, Inc.
contributed 11 out of 159 deaths (Hexter & Goldsmith, 1971). Additional studies conducted in Los Angeles (Kinney & Ozkaynak, 1991) and Sao Paulo also suggest a relationship between daily death rates and CO concentrations (Saldivia, et al., 1995). B-4.0 NITROGEN OXIDES
Nitrogen oxides (NOx) are a family of highly reactive gases that are a primary precursor to the formation of ground-level ozone, and react in the atmosphere to form acid rain. NOx is emitted from the use of solvents and combustion processes in which fuel is burned at high temperatures, principally from motor vehicle exhaust and stationary sources such as electric utilities and industrial boilers. A brownish gas, nitrogen dioxide is a strong oxidizing agent that reacts in the air to form corrosive nitric acid, as well as toxic organic nitrates. Health Effects NOx is an ozone precursor that combines with ROG to form ozone. See the ozone section above for a discussion of the health effects of ozone. Direct inhalation of NOx can also cause a wide range of health effects. NOx can irritate the lungs, cause lung damage, and lower resistance to respiratory infections such as influenza. Short-term exposures (e.g., less than 3 hours) to low levels of NO2 may lead to changes in airway responsiveness and lung function in individuals with preexisting respiratory illnesses. These exposures may also increase respiratory illnesses in children. Long-term exposures to NO2 may lead to increased susceptibility to respiratory infection and may cause irreversible alterations in lung structure. Other health effects associated with NOx are an increase in the incidence of chronic bronchitis and lung irritation. Chronic exposure to nitrogen dioxide (NO2) may lead to eye and mucus membrane aggravation, along with pulmonary dysfunction. NOx can cause fading of textile dyes and additives, deterioration of cotton and nylon, and corrosion of metals due to production of particulate nitrates. Airborne NOx can also impair visibility. NOx is a major component of acid deposition in California. NOx may affect both terrestrial and aquatic ecosystems. NOx in the air is a potentially significant contributor to a number of environmental effects such as acid rain and eutrophication in coastal waters. Eutrophication occurs when a body of water suffers an increase in nutrients that reduce the amount of oxygen in the water, producing an environment that is destructive to fish and other animal life. Nitrogen dioxide is toxic to various animals as well as to humans. Its toxicity relates to its ability to combine with water to form nitric acid in the eye, lung, mucus membranes and skin. Studies of the health impacts of NO2 include experimental studies on animals, controlled laboratory studies on humans, and observational studies. In animals, long-term exposure to NOx increases susceptibility to respiratory infections lowering their resistance to such diseases as pneumonia and influenza. Laboratory studies show susceptible humans, such as asthmatics, exposed to high concentrations of NO2 can suffer lung irritation and potentially, lung damage. Epidemiological studies have also shown associations between NO2 concentrations and daily mortality from respiratory and cardiovascular causes and with hospital admissions for respiratory conditions. NOx contributes to a wide range of environmental effects directly and when combined with other precursors in acid rain and ozone. Increased nitrogen inputs to terrestrial and wetland systems can lead to changes in plant species composition and diversity. Similarly, direct nitrogen inputs to aquatic ecosystems such as those found in estuarine and coastal waters can lead to eutrophication (a condition that promotes excessive algae growth, which can lead to a severe depletion of dissolved oxygen and increased levels of toxins harmful to aquatic life). Nitrogen, alone or in acid rain, also can acidify soils and surface waters. Acidification of soils causes the loss of

APPENDIX B: HEALTH EFFECTS OF POLLUTANTS
om01_PhysicalSetting_v1.docx B-5 Sespe Consulting, Inc.
essential plant nutrients and increased levels of soluble aluminum that are toxic to plants. Acidification of surface waters creates conditions of low pH and levels of aluminum that are toxic to fish and other aquatic organisms. NOx also contribute to visibility impairment. (U.S. EPA, 2005). B-5.0 PARTICULATE MATTER
Particulate matter pollution consists of very small liquid and solid particles floating in the air. Some particles are large or dark enough to be seen as soot or smoke. Others are so small they can be detected only with an electron microscope. Particulate matter is a mixture of materials that can include smoke, soot, dust, salt, acids, and metals. Particulate matter also forms when gases emitted from motor vehicles and industrial sources undergo chemical reactions in the atmosphere. PM10 refers to particles less than or equal to 10 microns in aerodynamic diameter. PM2.5 refers to particles less than or equal to 2.5 microns in aerodynamic diameter and are a subset of PM10. In the western United States, there are sources of PM10 in both urban and rural areas. PM10 and PM2.5 are emitted from stationary and mobile sources, including diesel trucks and other motor vehicles, power plants, industrial processing, wood burning stoves and fireplaces, wildfires, dust from roads, construction, landfills, and agriculture, and fugitive windblown dust. Because particles originate from a variety of sources, their chemical and physical compositions vary widely. Health Effects PM10 and PM2.5 particles are small enough – about 1/7th the thickness of a human hair, or smaller– to be inhaled into, and lodge in, the deepest parts of the lung, evading the respiratory system’s natural defenses. Health problems begin as the body reacts to these foreign particles. Acute and chronic health effects associated with high particulate levels include the aggravation of chronic respiratory diseases, heart and lung disease, and coughing, bronchitis, and respiratory illnesses in children. Recent mortality studies have shown a statistically significant direct association between mortality and daily concentrations of particulate matter in the air. Non health-related effects include reduced visibility and soiling of buildings. PM10 can increase the number and severity of asthma attacks, cause or aggravate bronchitis and other lung diseases, and reduce the body’s ability to fight infections. PM10 and PM2.5 can aggravate respiratory disease, and cause lung damage, cancer, and premature death. Although particulate matter can cause health problems for everyone, certain people are especially vulnerable to adverse health effects of PM10. These “sensitive populations” include children, the elderly, exercising adults, and those suffering from chronic lung disease such as asthma or bronchitis. Of greatest concern are recent studies that link PM10 exposure to the premature death of people who already have heart and lung disease, especially the elderly. Acidic PM10 can also damage manmade materials and is a major cause of reduced visibility in many parts of the U.S. Premature deaths linked to particulate matter are now at levels comparable to deaths from traffic accidents and second-hand smoke. One of the most dangerous pollutants, fine particulate matter (e.g., from diesel exhaust and fireplace soot) not only bypasses the body’s defense mechanisms and becomes embedded in the deepest recesses of the lung, but also can disrupt cellular processes. Population based studies in hundreds of cities in the U.S. and around the world have demonstrated a strong link between elevated particulate levels and premature deaths, hospital admissions, emergency room visits, and asthma attacks. Longterm studies of children’s health

APPENDIX B: HEALTH EFFECTS OF POLLUTANTS
om01_PhysicalSetting_v1.docx B-6 Sespe Consulting, Inc.
conducted in California have demonstrated that particulate pollution may significantly reduce lung function growth in children (CARB, 2002). Attaining the California PM standards would annually prevent about 6,500 premature deaths, or 3% of all deaths. These premature deaths shorten lives by an average of 14 years. This is roughly equivalent to the same number of deaths (4,200-7,400) linked to second hand smoke in the year 2000. In comparison, motor vehicle crashes cause 3,200 deaths and homicides were responsible for 2,000 deaths. Attaining the California PM and ozone standards would annually prevent 4,000 hospital admissions for respiratory disease, 3,000 hospital admissions for cardiovascular disease, and 2,000 asthma-related emergency room visits. Exposure to diesel PM causes about 250 excess cancer cases per year in California. (CARB, 2002). A recent study provides evidence that exposure to particulate air pollution is associated with lung cancer. This study found that residents who live in an area that is severely impacted by particulate air pollution are at risk of lung cancer at a rate comparable to nonsmokers exposed to second-hand smoke. This study also found an approximately 16 percent excess risk of dying from lung cancer due to fine particulate air pollution (Pope III, et al., 2002). Another study shows that individuals with existing cardiac disease can be in a potentially life-threatening situation when exposed to high levels of ultrafine air pollution. Fine particles can penetrate the lungs and may cause the heart to beat irregularly or can cause inflammation, which could lead to a heart attack (Peters, et al., 2001). Currently, 61% of California’s population live in areas that exceed the federal PM2.5 air standard, while 89% live in areas that exceed California’s PM2.5 air standard (California Air Resources Board, 2004). B-6.0 OTHER POLLUTANTS
Discussion presented in this section is mainly reproduced from Appendix C of the Guidelines for Preparing an Air Quality Assessment for Use in Environmental Impact Reports (County of Kern, 2006). B-6.1 Sulfur Dioxide
Sulfur dioxide (SO2) is a colorless, irritating gas with a “rotten egg” smell formed primarily by the combustion of sulfur-containing fossil fuels. Historically, SO2 was a pollutant of concern but with the successful application of regulations, the levels have been reduced significantly. High concentrations of SO2 can result in temporary breathing impairment for asthmatic children and adults who are active outdoors. Short-term exposures of asthmatic individuals to elevated SO2 levels during moderate activity may result in breathing difficulties that can be accompanied by symptoms such as wheezing, chest tightness, or shortness of breath. Other effects that have been associated with longer-term exposures to high concentrations of SO2, in conjunction with high levels of PM, include aggravation of existing cardiovascular disease, respiratory illness, and alterations in the lungs’ defenses. SO2 also is a major precursor to PM2.5, which is a significant health concern, and a main contributor to poor visibility. (See also the discussion of health effects of particulate matter). Sulfur dioxide not only has a bad odor, it can irritate the respiratory system. Exposure to high concentrations for short periods of time can constrict the bronchi and increase mucous flow, making breathing difficult. Sulfur dioxide can also:

APPENDIX B: HEALTH EFFECTS OF POLLUTANTS
om01_PhysicalSetting_v1.docx B-7 Sespe Consulting, Inc.
Immediately irritate the lung and throat at concentrations greater than 6 parts per million (ppm) in many people.
Impair the respiratory system's defenses against foreign particles and bacteria, when exposed to concentrations less than 6 ppm for longer time periods.
Enhance the harmful effects of ozone. (Combinations of the two gases at concentrations occasionally found in the ambient air appear to increase airway resistance to breathing.)
Sulfur dioxide tends to have more toxic effects when acidic pollutants, liquid or solid aerosols, and particulates are also present. (In the 1950s and 1960s, thousands of excess deaths occurred in areas where SO2 concentrations exceeded 1 ppm for a few days and other pollutants were also high.) Effects are more pronounced among mouth breathers, e.g., people who are exercising or who have head colds. These effects include:
Health problems, such as episodes of bronchitis requiring hospitalization associated with lower-level acid concentrations.
Self-reported respiratory conditions, such as chronic cough and difficult breathing, associated with acid aerosol concentrations. (Asthmatic individuals are especially susceptible to these effects. The elderly and those with chronic respiratory conditions may also be affected at lower concentrations than the general population.)
Increased respiratory tract infections, associated with longer term, lower-level exposures to SO2 and acid aerosols.
Subjective symptoms, such as headaches and nausea, in the absence of pathological abnormalities, due to long-term exposure.
Sulfur dioxide easily injures many plant species and varieties, both native and cultivated. Some of the most sensitive plants include various commercially valuable pines, legumes, red and black oaks, white ash, alfalfa and blackberry. The effects include:
Visible injury to the most sensitive plants at exposures as low as 0.12 ppm for 8 hours.
Visible injury to many other plant types of intermediate sensitivity at exposures of 0.30 ppm for 8 hours.
Positive benefits from low levels, in a very few species growing on sulfur deficient soils.
Increases in sulfur dioxide concentrations accelerate the corrosion of metals, probably through the formation of acids. (SO2 is a major precursor to acidic deposition.) Sulfur oxides may also damage stone and masonry, paint, various fibers, paper, leather, and electrical components.
Increased SO2 also contributes to impaired visibility. Particulate sulfate, much of which is derived from sulfur dioxide emissions, is a major component of the complex total suspended particulate mixture.
B-6.2 Sulfates
Sulfates are particulate products of combustion of sulfur containing fossil fuels. When SO or SO2 are exposed to oxygen it precipitates out into sulfates (SO3 or SO4). Data collected in San Bernardino County identify levels of sulfates that are significantly less than the applicable health standards. Sulfates (SO4 2-) are the fully oxidized ionic form of sulfur. Sulfates occur in combination with metal and / or hydrogen ions. In California, emissions of sulfur compounds occur primarily from the combustion of petroleum-derived fuels (e.g., gasoline and diesel fuel) that contain sulfur. This sulfur is oxidized to sulfur dioxide (SO2) during the combustion process and subsequently converted to sulfate compounds in the atmosphere. The conversion of SO2 to sulfates takes place comparatively rapidly and completely in urban areas of California due to regional meteorological features.

APPENDIX B: HEALTH EFFECTS OF POLLUTANTS
om01_PhysicalSetting_v1.docx B-8 Sespe Consulting, Inc.
The ARB's sulfates standard is designed to prevent aggravation of respiratory symptoms. Effects of sulfate exposure at levels above the standard include a decrease in ventilatory function, aggravation of asthmatic symptoms, and an increased risk of cardio-pulmonary disease. Sulfates are particularly effective in degrading visibility, and, due to fact that they are usually acidic, can harm ecosystems and damage materials and property (CARB, 2009). B-6.3 Lead
Lead is a metal that is a natural constituent of air, water, and the biosphere. Lead is neither created nor destroyed in the environment, so it essentially persists forever. Lead was used until recently to increase the octane rating in auto fuel. Since gasoline powered automobile engines were a major source of airborne lead through the use of leaded fuels and the use of leaded fuel has been mostly phased out, the ambient concentrations of lead have dropped dramatically. Exposure to lead occurs mainly through inhalation of air and ingestion of lead in food, water, soil, or dust. It accumulates in the blood, bones, and soft tissues and can adversely affect the kidneys, liver, nervous system, and other organs. Excessive exposure to lead may cause neurological impairments such as seizures, mental retardation, and behavioral disorders. Even at low doses, lead exposure is associated with damage to the nervous systems of fetuses and young children, resulting in learning deficits and lowered IQ. Recent studies also show that lead may be a factor in high blood pressure and subsequent heart disease. Lead can also be deposited on the leaves of plants, presenting a hazard to grazing animals and humans through ingestion (EPA, 2005). B-6.4 Hydrogen Sulfide
Hydrogen sulfide (H2S) is associated with geothermal activity, oil and gas production, refining, sewage treatment plants, and confined animal feeding operations. Exposure to low concentrations of hydrogen sulfide may cause irritation to the eyes, nose, or throat. It may also cause difficulty in breathing for some asthmatics. Exposure to higher concentrations (above 100 parts per million [ppm]), can cause olfactory fatigue, respiratory paralysis, and death. Brief exposures to high concentrations of hydrogen sulfide (greater than 500 ppm) can cause a loss of consciousness. In most cases, the person appears to regain consciousness without any other effects. However, in many individuals, there may be permanent or long-term effects such as headaches, poor attention span, poor memory, and poor motor function. No health effects have been found in humans exposed to typical environmental concentrations of hydrogen sulfide (0.00011- 0.00033 ppm). Deaths due to breathing in large amounts of hydrogen sulfide have been reported in a variety of different work settings, including sewers, animal processing plants, waste dumps, sludge plants, oil and gas well drilling sites, and tanks and cesspools. B-6.5 Visibility Reducing Particles
Visibility in important natural areas (e.g., Federal Class I areas) is protected under a number of provisions of the Clean Air Act, including Sections 169A and 169B (addressing impacts primarily from existing sources) and Section 165 (new source review). Visibility impairment is caused by light scattering and light absorption associated with particles and gases in the atmosphere. In most areas of the country, light scattering by PM–2.5 is the most significant component of visibility impairment. The key components of PM–2.5 contributing to visibility impairment include sulfates, nitrates, organic carbon, elemental carbon, and crustal material (US EPA, 2005).

APPENDIX B: HEALTH EFFECTS OF POLLUTANTS
om01_PhysicalSetting_v1.docx B-9 Sespe Consulting, Inc.
B-6.6 Vinyl Chloride
Vinyl chloride is known also as chloroethene, chloroethylene, ethylene monochloride, or monochloroethylene. At room temperature, it is a colorless gas, it burns easily, and it is not stable at high temperatures. Vinyl chloride exists in liquid form if kept under high pressure or at low temperatures. Vinyl chloride has a mild, sweet odor, which may become noticeable at 3,000 parts vinyl chloride per million parts (ppm) of air. However, the odor is of little value in preventing excess exposure. Most people begin to taste vinyl chloride in water at 3.4 ppm(ATSDR, 2006). Vinyl chloride is not normally found in urban, suburban, or rural air in amounts that are detectable by the usual methods of analysis. However, vinyl chloride has been found in the air near vinyl chloride manufacturing and processing plants, hazardous waste sites, and landfills. The U.S. Department of Health and Human Services, the International Agency for Research on Cancer, and EPA have each determined that vinyl chloride is a human carcinogen (ATSDR, 2006). Breathing high levels of vinyl chloride will cause dizziness or sleepiness. These effects occur within 5 minutes if you are exposed to about 10,000 ppm of vinyl chloride. Still higher levels (25,000 ppm) induce unconsciousness and potentially death. Studies in animals show that extremely high levels of vinyl chloride can damage the liver, lungs, and kidneys. These levels also can damage the heart and prevent blood clotting. Some people who have breathed vinyl chloride for several years have changes in the structure of their livers. Some people who have worked with vinyl chloride have nerve damage, and others develop an immune reaction (ATSDR, 2006). B-6.7 Toxic Air Contaminants
Hazardous air pollutants is a term used by the federal Clean Air Act that includes a variety of pollutants generated or emitted by industrial production activities. Called Toxic Air Contaminants (TAC) under the California Clean Act, ten have been identified through ambient air quality data as being the most substantial health risk in California. Direct exposure to these pollutants has been shown to cause cancer, birth defects, damage to brain and nervous system and respiratory disorders. TACs do not have ambient air quality standards. Instead, TAC impacts are evaluated by calculating the health risks associated with a given exposure. The requirements of the Air Toxic "Hot Spots" Information and Assessment Act apply to facilities that use, produce, or emit toxic chemicals. Facilities that are subject to the toxic emission inventory requirements of the Act must prepare and submit toxic emission inventory plans and reports, and periodically update those reports. Health Risks - Nickel “Nickel occurs naturally in the environment at low levels. Nickel is an essential element in some animal species, and it has been suggested it may be essential for human nutrition. Nickel dermatitis, consisting of itching of the fingers, hands, and forearms, is the most common effect in humans from chronic (long-term) skin contact with nickel. Respiratory effects have also been reported in humans from inhalation exposure to nickel. Human and animal studies have reported an increased risk of lung and nasal cancers from exposure to nickel refinery dusts and nickel subsulfide. Animal studies of soluble nickel compounds (i.e., nickel carbonyl) have reported lung tumors. EPA has classified nickel refinery dust and nickel subsulfide as Group A, human carcinogens, and nickel carbonyl as a Group B2, probable human carcinogen.” (US EPA, 2000). Health Risks - Diesel Particulate Matter Diesel particulate matter is emitted from both mobile and stationary sources. In California, on-road diesel fueled engines contribute approximately 24 percent of the statewide total, with an additional 71 percent attributed to
APPENDIX B: HEALTH EFFECTS OF POLLUTANTS
om01_PhysicalSetting_v1.docx B-10 Sespe Consulting, Inc.
other mobile sources such as construction and mining equipment, agricultural equipment, and transport refrigeration units. Stationary sources contribute about 5 percent of total diesel particulate matter. Diesel exhaust and many individual substances contained in it (including arsenic, benzene, formaldehyde and nickel) have the potential to contribute to mutations in cells that can lead to cancer. Long-term exposure to diesel exhaust particles poses the highest cancer risk of any toxic air contaminant evaluated by the California Office of Environmental Health Hazard Assessment (OEHHA). ARB estimates that about 70 percent of the cancer risk that the average Californian faces from breathing toxic air pollutants stems from diesel exhaust particles (OEHHA and ALA, 2002). In its comprehensive assessment of diesel exhaust, OEHHA analyzed more than 30 studies of people who worked around diesel equipment, including truck drivers, railroad workers and equipment operators. The studies showed these workers were more likely to develop lung cancer than workers who were not exposed to diesel emissions. These studies provide strong evidence that long-term occupational exposure to diesel exhaust increases the risk of lung cancer. Using information from OEHHA's assessment, ARB estimates that diesel-particle levels measured in California's air in 2000 could cause 540 "excess" cancers (beyond what would occur if there were no diesel particles in the air) in a population of 1 million people over a 70-year lifetime. Other researchers and scientific organizations, including the National Institute for Occupational Safety and Health, have calculated cancer risks from diesel exhaust that are similar to those developed by OEHHA and ARB (OEHHA and ALA, 2002). Exposure to diesel exhaust can have immediate health effects. Diesel exhaust can irritate the eyes, nose, throat and lungs, and it can cause coughs, headaches, lightheadedness and nausea. In studies with human volunteers, diesel exhaust particles made people with allergies more susceptible to the materials to which they are allergic, such as dust and pollen. Exposure to diesel exhaust also causes inflammation in the lungs, which may aggravate chronic respiratory symptoms and increase the frequency or intensity of asthma attacks (OEHHA and ALA, 2002). Diesel engines are a major source of fine-particle pollution. The elderly and people with emphysema, asthma, and chronic heart and lung disease are especially sensitive to fine-particle pollution (see also health effects discussion in Section 4.3.4.5). Numerous studies have linked elevated particle levels in the air to increased hospital admissions, emergency room visits, asthma attacks and premature deaths among those suffering from respiratory problems. Because children's lungs and respiratory systems are still developing, they are also more susceptible than healthy adults to fine particles. Exposure to fine particles is associated with increased frequency of childhood illnesses and can also reduce lung function in children. In California, diesel exhaust particles have been identified as a carcinogen (OEHHA and ALA, 2002). Health Risks - Acetaldehyde Acetaldehyde is both directly emitted into the atmosphere and formed in the atmosphere from photochemical oxidation. Sources include combustion processes such as exhaust from mobile sources and fuel combustion from stationary internal combustion engines, boilers, and process heaters. Acetaldehyde is classified as a federal hazardous air pollutant and as a California TAC. Acetaldehyde is a carcinogen that also causes chronic non-cancer toxicity in the respiratory system. Symptoms of chronic intoxication of acetaldehyde in humans resemble those of alcoholism. The primary acute effect of inhalation exposure to acetaldehyde is irritation of the eyes, skin, and respiratory tract in humans. At higher exposure levels, erythema, coughing, pulmonary edema, and necrosis may also occur. Acute inhalation of acetaldehyde resulted in a depressed respiratory rate and elevated blood pressure in experimental animals. Tests involving

APPENDIX B: HEALTH EFFECTS OF POLLUTANTS
om01_PhysicalSetting_v1.docx B-11 Sespe Consulting, Inc.
acute exposure of rats, rabbits, and hamsters have demonstrated acetaldehyde to have low acute toxicity from inhalation and moderate acute toxicity from oral or dermal exposure (US EPA, 2000). Health Risks - Benzene Approximately 84 percent of the benzene emitted in California comes from motor vehicles, including evaporative leakage and unburned fuel exhaust. Currently, the benzene content of gasoline is less than one percent. Benzene is highly carcinogenic and occurs throughout California. Benzene also has non-cancer health effects. Brief inhalation exposure to high concentrations can cause central nervous system depression. Acute effects include central nervous system symptoms of nausea, tremors, drowsiness, dizziness, headache, intoxication, and unconsciousness (CalEPA and CARB, 2005). Neurological symptoms of inhalation exposure to benzene include drowsiness, dizziness, headaches, and unconsciousness in humans. Ingestion of large amounts of benzene may result in vomiting, dizziness, and convulsions in humans. Exposure to liquid and vapor may irritate the skin, eyes, and upper respiratory tract in humans. Redness and blisters may result from dermal exposure to benzene. Chronic inhalation of certain levels of benzene causes disorders in the blood in humans. Benzene specifically affects bone marrow (the tissues that produce blood cells). Aplastic anemia, excessive bleeding, and damage to the immune system (by changes in blood levels of antibodies and loss of white blood cells) may develop. Increased incidence of leukemia (cancer of the tissues that form white blood cells) has been observed in humans occupationally exposed to benzene (US EPA, 2000). Health Risks - 1,3 –Butadiene The majority of 1,3-butadiene emissions come from incomplete combustion of gasoline and diesel fuels. Mobile sources account for 83 percent of total statewide emissions. Area wide sources such as agricultural waste burning and open burning contribute approximately 13 percent of statewide emissions. 1,3-Butadiene has been identified as a carcinogen in California. Butadiene vapors cause neurological effects at very high levels such as blurred vision, fatigue, headache, and vertigo. Dermal exposure of humans to 1,3-butadiene causes a sensation of cold, followed by a burning sensation, which may lead to frostbite (US EPA, 2009). One epidemiological study reported that chronic (long-term) exposure to 1,3-butadiene via inhalation resulted in an increase in cardiovascular diseases, such as rheumatic and arteriosclerotic heart diseases, while other human studies have reported effects on the blood. A large epidemiological study of synthetic rubber industry workers demonstrated a consistent association between 1,3-butadiene exposure and occurrence of leukemia. Several epidemiological studies of workers in styrene-butadiene rubber factories have shown an increased incidence of respiratory, bladder, stomach, and lymphato-hematopoietic cancers. However, these studies are not sufficient to determine a causal association between 1,3-butadiene exposure and cancer due to possible exposure to other chemicals and other confounding factors(US EPA, 2009). Health Risks - Carbon Tetrachloride The primary sources of carbon tetrachloride in California include chemical and allied product manufacturers and petroleum refineries.

APPENDIX B: HEALTH EFFECTS OF POLLUTANTS
om01_PhysicalSetting_v1.docx B-12 Sespe Consulting, Inc.
In California, carbon tetrachloride has been identified as a carcinogen. Carbon tetrachloride is also a central nervous system depressant and mile eye and respiratory tract irritant. EPA has classified carbon tetrachloride as a Group B2, probable human carcinogen (US EPA, 2000). Acute inhalation and oral exposures to high levels of carbon tetrachloride have been observed primarily to damage the liver (swollen, tender liver, changes in enzyme levels, and jaundice) and kidneys (nephritis, nephrosis, proteinurea) of humans. Depression of the central nervous system has also been reported. Symptoms of acute exposure in humans include headache, weakness, lethargy, nausea, and vomiting. Delayed pulmonary edema (fluid in lungs) has been observed in humans exposed to high levels of carbon tetrachloride by inhalation and ingestion, but this is believed to be due to injury to the kidney rather than direct action of carbon tetrachloride on the lung. Chronic inhalation or oral exposure to carbon tetrachloride produces liver and kidney damage in humans and animals (US EPA, 2000). Health Risks - Chromium, Hexavalent Chromium plating and other metal finishing processes are the primary sources of hexavalent chromium emissions in California. In California, hexavalent chromium has been identified as a carcinogen. There is epidemiological evidence that exposure to inhaled hexavalent chromium may result in lung cancer. The principal acute effects are renal toxicity, gastrointestinal hemorrhage, and intravascular hemolysis (CalEPA and CARB, 2005). The respiratory tract is the major target organ for chromium (VI) following inhalation exposure in humans. Other effects noted from acute inhalation exposure to very high concentrations of chromium (VI) include gastrointestinal and neurological effects, while dermal exposure causes skin burns in humans. Chronic inhalation exposure to chromium (VI) in humans results in effects on the respiratory tract, with perforations and ulcerations of the septum, bronchitis, decreased pulmonary function, pneumonia, asthma, and nasal itching and soreness reported. Chronic human exposure to high levels of chromium (VI) by inhalation or oral exposure may produce effects on the liver, kidney, gastrointestinal and immune systems, and possibly the blood (US EPA, 2000). Health Risks - Para-Dichlorobenzene The primary sources of para-dichlorobenzene include consumer products such as non-aerosol insect repellents and solid/gel air fresheners. These sources contribute 99% of statewide para-dichlorobenzene emissions. In California, para-dichlorobenzene has been identified as a carcinogen. Acute exposure to 1,4-dichlorobenzene via inhalation in humans results in irritation to the eyes, skin, and throat. In addition, long-term inhalation exposure may affect the liver, skin, and central nervous system in humans (e.g., cerebellar ataxia, dysarthria, weakness in limbs, and hyporeflexia).(CalEPA and CARB, 2005); (US EPA, 2000). Health Risks - Formaldehyde Formaldehyde is both directly emitted into the atmosphere and formed in the atmosphere as a result of photochemical oxidation. Formaldehyde is a product of incomplete combustion. One of the primary sources of formaldehyde is vehicular exhaust. Formaldehyde is also used in resins, can be found in many consumer products as an antimicrobial agent, and is used in fumigants and soil disinfectants. The major toxic effects caused by acute formaldehyde exposure via inhalation are eye, nose, and throat irritation and effects on the nasal cavity. Other effects seen from exposure to high levels of formaldehyde in humans are coughing, wheezing, chest pains, and bronchitis. Chronic exposure to formaldehyde by inhalation in humans has been associated with respiratory symptoms and eye, nose, and throat irritation. Animal studies

APPENDIX B: HEALTH EFFECTS OF POLLUTANTS
om01_PhysicalSetting_v1.docx B-13 Sespe Consulting, Inc.
have reported effects on the nasal respiratory epithelium and lesions in the respiratory system from chronic inhalation exposure to formaldehyde. Occupational studies have noted statistically significant associations between exposure to formaldehyde and increased incidence of lung and nasopharyngeal cancer. This evidence is considered to be "limited," rather than "sufficient," due to possible exposure to other agents that may have contributed to the excess cancers. EPA considers formaldehyde to be a probable human carcinogen (cancer-causing agent) and has ranked it in EPA's Group B1. In California, formaldehyde has been identified as a carcinogen. (CalEPA and CARB, 2005); (US EPA, 2000). Health Risks - Methylene Chloride Methylene chloride is used as a solvent, a blowing and cleaning agent in the manufacture of polyurethane foam and plastic manufacture, and as a solvent in paint stripping operations. Paint removers account for the largest use of methylene chloride in California. Case studies of methylene chloride poisoning during paint stripping operations have demonstrated that inhalation exposure to extremely high levels can be fatal to humans. Acute inhalation exposure to high levels of methylene chloride in humans has resulted in effects on the central nervous system (CNS) including decreased visual, auditory, and psychomotor functions, but these effects are reversible once exposure ceases. Methylene chloride also irritates the nose and throat at high concentrations. The major effects from chronic inhalation exposure to methylene chloride in humans are effects on the central nervous system, such as headaches, dizziness, nausea, and memory loss. In addition, chronic exposure can lead to bone marrow, hepatic, and renal toxicity. EPA considers methylene chloride to be a probable human carcinogen and has ranked it in EPA's Group B2. California considers methylene chloride to be carcinogenic. (US EPA, 2000). Health Risks - Perchloroethylene Perchloroethylene is used as a solvent, primarily in dry cleaning operations. Perchloroethylene is also used in degreasing operations, paints and coatings, adhesives, aerosols, specialty chemical production, printing inks, silicones, rug shampoos, and laboratory solvents. In California, perchloroethylene has been identified as a carcinogen. Perchloroethylene vapors are irritating to the eyes and respiratory tract. Following chronic exposure, workers have shown signs of liver toxicity, as well as kidney dysfunction, and neurological disorders (CalEPA and CARB, 2005).
Butterfield and Sentinel Quarries Expansion Air Quality and Greenhouse Gas Impact Assessment San Bernardino National Forest October 25, 2017
OM01_SB-AQHRCCIA_fnl.docx Sespe Consulting, Inc.
Appendix C: Ambient Pollutant Concentrations

California Home ARB: Home Search Site Map Software Contact Us AQD: Home
Ozone Trends Summary: Hesperia-Olive Street FAQs
Year
Days > Standard 1-Hour Observations 8-Hour Averages
Year
Coverage
State National
Max.
State Nat'l State National
1-Hr 8-Hr 1-Hr '08 8-Hr D.V.¹ D.V.² Max. D.V.¹ Max. '08 D.V.²
2014 8 40 0 27 0.121 0.11 0.111 0.094 0.097 0.093 0.087 100
2013 1 35 0 12 0.100 0.11 0.117 0.085 0.102 0.084 0.091 98
2012 21 93 0 55 0.116 0.12 0.118 0.097 0.102 0.097 0.095 100
2011 24 101 1 67 0.132 0.12 0.119 0.114 0.102 0.113 0.097 100
2010 15 66 0 42 0.119 0.12 0.121 0.102 0.107 0.101 0.096 100
2009 18 64 0 40 0.123 0.12 0.123 0.101 0.110 0.101 0.097 100
2008 29 80 1 58 0.132 0.12 0.132 0.107 0.107 0.106 0.097 99
2007 24 75 2 47 0.132 0.13 0.133 0.110 0.113 0.109 0.099 94
2006 22 76 2 50 0.148 0.13 0.134 0.125 0.113 0.124 0.099 100
2005 41 89 3 67 0.140 0.13 0.136 0.121 0.119 0.120 0.104 99
2004 28 67 2 53 0.138 0.13 0.138 0.119 0.120 0.119 0.107 100
2003 43 93 2 70 0.163 0.13 0.136 0.131 0.119 0.130 0.106 100
2002 46 107 5 73 0.147 0.14 0.143 0.123 0.120 0.123 0.106 99
Info: Click on a column header for more information about the statistic in that column.
Area: San Bernardino County; Mojave Desert Air Basin;
Antelope Valley & W Mojave Desert 8-Hr Ozone Plan Area
District: Mojave Desert AQMD
Years: Annual Ozone statistics are available for this site from 1985 through 2014.
Notes: All concentrations expressed in parts per million.
The national 1-hour ozone standard was revoked in June 2005 and is no longer in effect. Statistics related
to the revoked standard are shown in italics or italics . State exceedances shown in yellow . National exceedances shown in orange .
An exceedance is not necessarily a violation.
¹ D.V. = State Designation Value
² D.V. = National Design Value
* There was insufficient (or no) data available to determine the value.
Go to: Data Statistics Home Page Trends Summaries Start Page PM10 Trends for this Site
Ozone Trends Summary http://www.arb.ca.gov/adam/trends/trendsdisplay.php
1 of 1 12/29/2015 10:59 AM
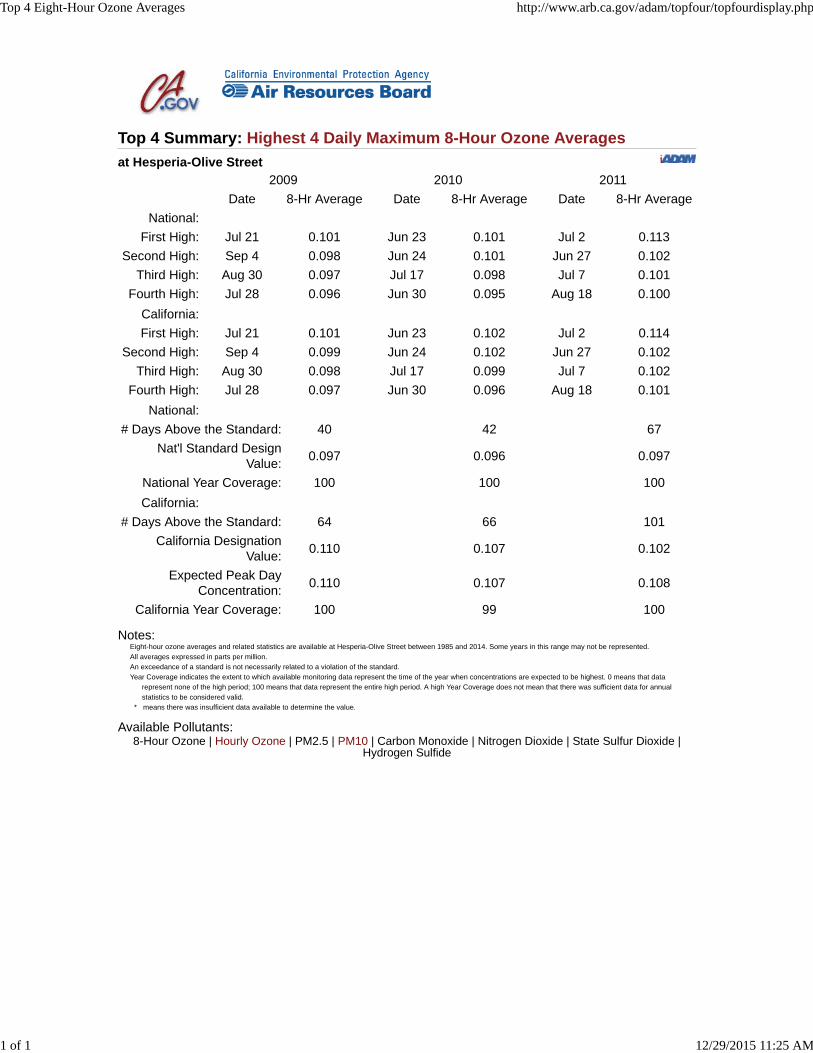
Top 4 Summary: Highest 4 Daily Maximum 8-Hour Ozone Averages
at Hesperia-Olive Street
2009 2010 2011
Date 8-Hr Average Date 8-Hr Average Date 8-Hr Average
National:
First High: Jul 21 0.101 Jun 23 0.101 Jul 2 0.113
Second High: Sep 4 0.098 Jun 24 0.101 Jun 27 0.102
Third High: Aug 30 0.097 Jul 17 0.098 Jul 7 0.101
Fourth High: Jul 28 0.096 Jun 30 0.095 Aug 18 0.100
California:
First High: Jul 21 0.101 Jun 23 0.102 Jul 2 0.114
Second High: Sep 4 0.099 Jun 24 0.102 Jun 27 0.102
Third High: Aug 30 0.098 Jul 17 0.099 Jul 7 0.102
Fourth High: Jul 28 0.097 Jun 30 0.096 Aug 18 0.101
National:
# Days Above the Standard: 40 42 67
Nat'l Standard Design
Value:0.097 0.096 0.097
National Year Coverage: 100 100 100
California:
# Days Above the Standard: 64 66 101
California Designation
Value:0.110 0.107 0.102
Expected Peak Day
Concentration:0.110 0.107 0.108
California Year Coverage: 100 99 100
Notes:Eight-hour ozone averages and related statistics are available at Hesperia-Olive Street between 1985 and 2014. Some years in this range may not be represented.
All averages expressed in parts per million.
An exceedance of a standard is not necessarily related to a violation of the standard.
Year Coverage indicates the extent to which available monitoring data represent the time of the year when concentrations are expected to be highest. 0 means that data
represent none of the high period; 100 means that data represent the entire high period. A high Year Coverage does not mean that there was sufficient data for annual
statistics to be considered valid.
* means there was insufficient data available to determine the value.
Available Pollutants:8-Hour Ozone | Hourly Ozone | PM2.5 | PM10 | Carbon Monoxide | Nitrogen Dioxide | State Sulfur Dioxide |
Hydrogen Sulfide
Top 4 Eight-Hour Ozone Averages http://www.arb.ca.gov/adam/topfour/topfourdisplay.php
1 of 1 12/29/2015 11:25 AM

Top 4 Summary: Highest 4 Daily Maximum 8-Hour Ozone Averages
at Hesperia-Olive Street
2012 2013 2014
Date 8-Hr Average Date 8-Hr Average Date 8-Hr Average
National:
First High: Jul 11 0.097 May 4 0.084 May 16 0.093
Second High: Jun 20 0.096 May 21 0.084 May 17 0.092
Third High: May 12 0.093 Jul 19 0.084 Jun 5 0.088
Fourth High: Jun 2 0.092 May 30 0.083 Jul 25 0.087
California:
First High: Jul 11 0.097 May 4 0.085 May 16 0.094
Second High: Jun 20 0.096 May 21 0.085 May 17 0.092
Third High: May 12 0.094 Jul 19 0.085 Jun 5 0.089
Fourth High: Jun 2 0.092 May 30 0.084 Jul 25 0.088
National:
# Days Above the Standard: 55 12 27
Nat'l Standard Design
Value:0.095 0.091 0.087
National Year Coverage: 100 98 100
California:
# Days Above the Standard: 93 35 40
California Designation
Value:0.102 0.102 0.097
Expected Peak Day
Concentration:0.106 0.103 0.100
California Year Coverage: 100 98 100
Notes:Eight-hour ozone averages and related statistics are available at Hesperia-Olive Street between 1985 and 2014. Some years in this range may not be represented.
All averages expressed in parts per million.
An exceedance of a standard is not necessarily related to a violation of the standard.
Year Coverage indicates the extent to which available monitoring data represent the time of the year when concentrations are expected to be highest. 0 means that data
represent none of the high period; 100 means that data represent the entire high period. A high Year Coverage does not mean that there was sufficient data for annual
statistics to be considered valid.
* means there was insufficient data available to determine the value.
Available Pollutants:8-Hour Ozone | Hourly Ozone | PM2.5 | PM10 | Carbon Monoxide | Nitrogen Dioxide | State Sulfur Dioxide |
Hydrogen Sulfide
Top 4 Eight-Hour Ozone Averages http://www.arb.ca.gov/adam/topfour/topfourdisplay.php
1 of 1 12/29/2015 11:24 AM

Top 4 Summary: Highest 4 Daily Maximum Hourly Ozone Measurements
at Hesperia-Olive Street
2009 2010 2011
Date Measurement Date Measurement Date Measurement
First High: Aug 31 0.123 Jul 15 0.119 Jul 2 0.132Second High: Jul 21 0.122 Jul 16 0.115 Jul 1 0.119
Third High: Aug 30 0.117 Jul 17 0.115 Jun 27 0.118
Fourth High: Sep 2 0.112 Jun 24 0.114 Jul 3 0.117
California:
# Days Above the Standard: 18 15 24
California Designation
Value:0.12 0.12 0.12
Expected Peak Day
Concentration:0.123 0.120 0.120
National:
# Days Above the Standard: 0 0 1Nat'l Standard Design
Value: 0.123 0.121 0.119
Year Coverage: 100 100 100
Notes:Hourly ozone measurements and related statistics are available at Hesperia-Olive Street between 1985 and 2014. Some years in this range may not be represented.
All concentrations expressed in parts per million.
The national 1-hour ozone standard was revoked in June 2005 and is no longer in effect. Statistics related to the revoked standard are shown in italics or italics .
An exceedance of a standard is not necessarily related to a violation of the standard.
Year Coverage indicates the extent to which available monitoring data represent the time of the year when concentrations are expected to be highest. 0 means that data
represent none of the high period; 100 means that data represent the entire high period. A high Year Coverage does not mean that there was sufficient data for annual
statistics to be considered valid.
* means there was insufficient data available to determine the value.
Available Pollutants:8-Hour Ozone | Hourly Ozone | PM2.5 | PM10 | Carbon Monoxide | Nitrogen Dioxide | State Sulfur Dioxide |
Hydrogen Sulfide
Top 4 Hourly Ozone Measurements http://www.arb.ca.gov/adam/topfour/topfourdisplay.php
1 of 1 12/29/2015 11:26 AM

Top 4 Summary: Highest 4 Daily Maximum Hourly Ozone Measurements
at Hesperia-Olive Street
2012 2013 2014
Date Measurement Date Measurement Date Measurement
First High: Aug 13 0.116 Jul 3 0.100 May 17 0.121
Second High: Aug 16 0.111 May 4 0.094 May 16 0.111
Third High: Aug 2 0.110 Jul 4 0.093 Jul 25 0.099
Fourth High: Jul 11 0.105 May 21 0.092 Jun 24 0.097
California:
# Days Above the Standard: 21 1 8
California Designation
Value:0.12 0.11 0.11
Expected Peak Day
Concentration:0.117 0.114 0.107
National:
# Days Above the Standard: 0 0 0Nat'l Standard Design
Value: 0.118 0.117 0.111
Year Coverage: 100 98 100
Notes:Hourly ozone measurements and related statistics are available at Hesperia-Olive Street between 1985 and 2014. Some years in this range may not be represented.
All concentrations expressed in parts per million.
The national 1-hour ozone standard was revoked in June 2005 and is no longer in effect. Statistics related to the revoked standard are shown in italics or italics .
An exceedance of a standard is not necessarily related to a violation of the standard.
Year Coverage indicates the extent to which available monitoring data represent the time of the year when concentrations are expected to be highest. 0 means that data
represent none of the high period; 100 means that data represent the entire high period. A high Year Coverage does not mean that there was sufficient data for annual
statistics to be considered valid.
* means there was insufficient data available to determine the value.
Available Pollutants:8-Hour Ozone | Hourly Ozone | PM2.5 | PM10 | Carbon Monoxide | Nitrogen Dioxide | State Sulfur Dioxide |
Hydrogen Sulfide
Top 4 Hourly Ozone Measurements http://www.arb.ca.gov/adam/topfour/topfourdisplay.php
1 of 1 12/29/2015 11:26 AM
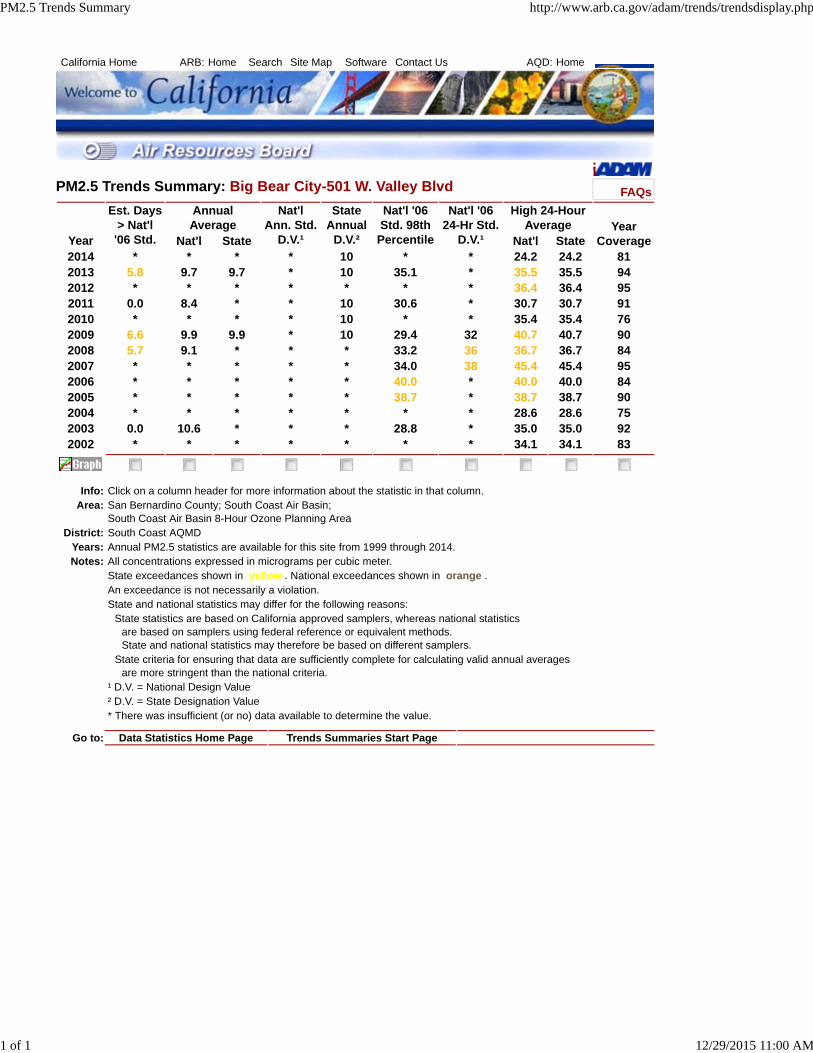
California Home ARB: Home Search Site Map Software Contact Us AQD: Home
PM2.5 Trends Summary: Big Bear City-501 W. Valley Blvd FAQs
Year
Est. Days
> Nat'l
'06 Std.
Annual
Average
Nat'l
Ann. Std.
D.V.¹
State
Annual
D.V.²
Nat'l '06
Std. 98th
Percentile
Nat'l '06
24-Hr Std.
D.V.¹
High 24-Hour
Average Year
CoverageNat'l State Nat'l State
2014 * * * * 10 * * 24.2 24.2 81
2013 5.8 9.7 9.7 * 10 35.1 * 35.5 35.5 94
2012 * * * * * * * 36.4 36.4 95
2011 0.0 8.4 * * 10 30.6 * 30.7 30.7 91
2010 * * * * 10 * * 35.4 35.4 76
2009 6.6 9.9 9.9 * 10 29.4 32 40.7 40.7 90
2008 5.7 9.1 * * * 33.2 36 36.7 36.7 84
2007 * * * * * 34.0 38 45.4 45.4 95
2006 * * * * * 40.0 * 40.0 40.0 84
2005 * * * * * 38.7 * 38.7 38.7 90
2004 * * * * * * * 28.6 28.6 75
2003 0.0 10.6 * * * 28.8 * 35.0 35.0 92
2002 * * * * * * * 34.1 34.1 83
Info: Click on a column header for more information about the statistic in that column.
Area: San Bernardino County; South Coast Air Basin;
South Coast Air Basin 8-Hour Ozone Planning Area
District: South Coast AQMD
Years: Annual PM2.5 statistics are available for this site from 1999 through 2014.
Notes: All concentrations expressed in micrograms per cubic meter.
State exceedances shown in yellow . National exceedances shown in orange .
An exceedance is not necessarily a violation.
State and national statistics may differ for the following reasons:
State statistics are based on California approved samplers, whereas national statistics
are based on samplers using federal reference or equivalent methods.
State and national statistics may therefore be based on different samplers.
State criteria for ensuring that data are sufficiently complete for calculating valid annual averages
are more stringent than the national criteria.
¹ D.V. = National Design Value
² D.V. = State Designation Value
* There was insufficient (or no) data available to determine the value.
Go to: Data Statistics Home Page Trends Summaries Start Page
PM2.5 Trends Summary http://www.arb.ca.gov/adam/trends/trendsdisplay.php
1 of 1 12/29/2015 11:00 AM

Top 4 Summary: Highest 4 Daily 24-Hour PM2.5 Averages
at Big Bear City-501 W. Valley Blvd
2009 2010 2011
Date24-Hr
AverageDate
24-Hr
AverageDate
24-Hr
Average
National:
First High: Dec 27 40.7 Jan 2 35.4 Dec 11 30.7
Second High: Jan 19 29.4 Jan 8 27.5 Dec 29 30.6
Third High: Jan 31 26.7 Dec 4 21.0 Nov 23 28.2
Fourth High: Jan 7 23.5 Nov 16 18.4 Jan 21 27.0
California:
First High: Dec 27 40.7 Jan 2 35.4 Dec 11 30.7
Second High: Jan 19 29.4 Jan 8 27.5 Dec 29 30.6
Third High: Jan 31 26.7 Dec 4 21.0 Nov 23 28.2
Fourth High: Jan 7 23.5 Nov 16 18.4 Jan 21 27.0
National:
Estimated # Days >
24-Hour Std:6.6 * 0.0
Measured # Days >
24-Hour Std:1 0 0
24-Hour Standard Design
Value:32 * *
24-Hour Standard 98th
Percentile:29.4 * 30.6
Annual Standard Design
Value:* * *
Annual Average: 9.8 * 8.4
California:
Annual Std Designation
Value:10 10 10
Annual Average: 9.9 * *
Year Coverage: 90 76 91
Notes:Daily PM2.5 averages and related statistics are available at Big Bear City-501 W. Valley Blvd between 1999 and 2014. Some years in this range may not be represented.
All averages expressed in micrograms per cubic meter.
An exceedance of a standard is not necessarily related to a violation of the standard.
State statistics are based on California approved samplers, whereas national statistics are based on samplers using federal reference or equivalent methods. State and national
statistics may therefore be based on different samplers.
Year Coverage indicates the extent to which available monitoring data represent the time of the year when concentrations are expected to be highest. 0 means that data
represent none of the high period; 100 means that data represent the entire high period. A high Year Coverage does not mean that there was sufficient data for annual
statistics to be considered valid.
* means there was insufficient data available to determine the value.
Available Pollutants:8-Hour Ozone | Hourly Ozone | PM2.5 | PM10 | Carbon Monoxide | Nitrogen Dioxide | State Sulfur Dioxide |
Hydrogen Sulfide
Top 4 Daily PM2.5 Averages http://www.arb.ca.gov/adam/topfour/topfourdisplay.php
1 of 1 12/29/2015 11:28 AM

Top 4 Summary: Highest 4 Daily 24-Hour PM2.5 Averages
at Big Bear City-501 W. Valley Blvd
2012 2013 2014
Date24-Hr
AverageDate
24-Hr
AverageDate
24-Hr
Average
National:
First High: Nov 23 36.4 Nov 30 35.5 Jan 5 24.2
Second High: Nov 11 27.4 Jan 4 35.1 Feb 22 19.1
Third High: Jan 4 18.0 Dec 30 25.8 Jan 17 17.7
Fourth High: Jan 10 15.3 Nov 6 21.8 Jan 23 15.5
California:
First High: Nov 23 36.4 Nov 30 35.5 Jan 5 24.2
Second High: Nov 11 27.4 Jan 4 35.1 Feb 22 19.1
Third High: Jan 4 18.0 Dec 30 25.8 Jan 17 17.7
Fourth High: Jan 10 15.3 Nov 6 21.8 Jan 23 15.5
National:
Estimated # Days >
24-Hour Std:* 5.8 *
Measured # Days >
24-Hour Std:1 1 0
24-Hour Standard Design
Value:* * *
24-Hour Standard 98th
Percentile:* 35.1 *
Annual Standard Design
Value:* * *
Annual Average: * 9.6 *
California:
Annual Std Designation
Value:* 10 10
Annual Average: * 9.7 *
Year Coverage: 95 94 81
Notes:Daily PM2.5 averages and related statistics are available at Big Bear City-501 W. Valley Blvd between 1999 and 2014. Some years in this range may not be represented.
All averages expressed in micrograms per cubic meter.
An exceedance of a standard is not necessarily related to a violation of the standard.
State statistics are based on California approved samplers, whereas national statistics are based on samplers using federal reference or equivalent methods. State and national
statistics may therefore be based on different samplers.
Year Coverage indicates the extent to which available monitoring data represent the time of the year when concentrations are expected to be highest. 0 means that data
represent none of the high period; 100 means that data represent the entire high period. A high Year Coverage does not mean that there was sufficient data for annual
statistics to be considered valid.
* means there was insufficient data available to determine the value.
Available Pollutants:8-Hour Ozone | Hourly Ozone | PM2.5 | PM10 | Carbon Monoxide | Nitrogen Dioxide | State Sulfur Dioxide |
Hydrogen Sulfide
Top 4 Daily PM2.5 Averages http://www.arb.ca.gov/adam/topfour/topfourdisplay.php
1 of 1 12/29/2015 11:27 AM

California Home ARB: Home Search Site Map Software Contact Us AQD: Home
PM10 Trends Summary: Lucerne Valley-Middle School FAQs
Year
Est. Days > Std. Annual Average 3-Year Average High 24-Hr Average Year
CoverageNat'l State Nat'l State Nat'l State Nat'l State
2014 * * 16.7 * 16 * 49.8 44.6 86
2013 * * 18.5 * 15 * 160.2 142.8 74
2012 0.0 * 13.9 * 14 13 30.0 27.0 89
2011 * * 13.8 * 15 15 33.0 31.0 93
2010 0.0 0.0 14.6 13.4 18 15 43.0 38.0 99
2009 0.0 6.1 17.3 15.4 23 28 93.0 81.0 99
2008 * * 20.7 * 25 28 67.0 62.0 76
2007 6.1 36.6 31.0 27.8 24 28 229.0 212.0 100
2006 0.0 * 23.0 * 20 17 56.0 50.0 97
2005 0.0 6.1 19.1 16.9 19 17 64.0 57.0 100
2004 0.0 * 18.1 * 19 17 53.0 47.0 95
2003 0.0 6.5 19.7 17.4 19 17 79.0 75.0 97
2002 0.0 * 19.2 * 20 23 46.0 46.0 94
Info: Click on a column header for more information about the statistic in that column.
Area: San Bernardino County; Mojave Desert Air Basin;
Antelope Valley & W Mojave Desert 8-Hr Ozone Plan Area
District: Mojave Desert AQMD
Years: Annual PM10 statistics are available for this site from 1990 through 2014.
Notes: All concentrations expressed in micrograms per cubic meter.
The national annual average PM10 standard was revoked in December 2006 and is no longer in effect.
Statistics related to the revoked standard are shown in italics or italics . State exceedances shown in yellow . National exceedances shown in orange .
An exceedance is not necessarily a violation.
Statistics may include data that are related to an exceptional event.
State and national statistics may differ for the following reasons:
State statistics are based on California approved samplers, whereas national statistics
are based on samplers using federal reference or equivalent methods.
State and national statistics may therefore be based on different samplers.
State statistics for 1998 and later are based on local conditions (except for sites in the
South Coast Air Basin, where State statistics for 2002 and later are based on local conditions).
National statistics are based on standard conditions.
State criteria for ensuring that data are sufficiently complete for calculating valid annual averages
are more stringent than the national criteria.
* There was insufficient (or no) data available to determine the value.
Go to: Data Statistics Home Page Trends Summaries Start Page
PM10 Trends Summary http://www.arb.ca.gov/adam/trends/trendsdisplay.php
1 of 1 12/29/2015 11:01 AM

Top 4 Summary: Highest 4 Daily 24-Hour PM10 Averages
at Lucerne Valley-Middle School
2009 2010 2011
Date24-Hr
AverageDate
24-Hr
AverageDate
24-Hr
Average
National:
First High: Jul 24 93.0 Sep 5 43.0 Apr 15 33.0
Second High: Oct 4 39.0 Sep 17 39.0 May 27 33.0
Third High: Sep 4 38.0 Jun 13 32.0 Feb 8 29.0
Fourth High: Aug 11 35.0 Sep 11 28.0 Jul 8 27.0
California:
First High: Jul 24 81.0 Sep 5 38.0 Apr 15 31.0
Second High: Oct 4 35.0 Sep 17 35.0 May 27 30.0
Third High: Sep 4 33.0 Jun 13 28.0 Feb 8 27.0
Fourth High: Aug 11 31.0 Sep 11 25.0 Jul 8 24.0
National:
Estimated # Days >
24-Hour Std:0.0 0.0 *
Measured # Days >
24-Hour Std:0 0 0
3-Yr Avg Est # Days >
24-Hr Std:* * *
Annual Average: 17.3 14.6 13.83-Year Average: 23 18 15
California:
Estimated # Days >
24-Hour Std:6.1 0.0 *
Measured # Days >
24-Hour Std:1 0 0
Annual Average: 15.4 13.4 *
3-Year Maximum Annual
Average:28 15 15
Year Coverage: 99 99 93
Notes:Daily PM10 averages and related statistics are available at Lucerne Valley-Middle School between 1990 and 2014. Some years in this range may not be represented.
All averages expressed in micrograms per cubic meter.
The national annual average PM10 standard was revoked in December 2006 and is no longer in effect. Statistics related to the revoked standard are shown in italics or
italics .
An exceedance of a standard is not necessarily related to a violation of the standard.
All values listed above represent midnight-to-midnight 24-hour averages and may be related to an exceptional event.
State and national statistics may differ for the following reasons:
State statistics are based on California approved samplers, whereas national statistics are based on samplers using federal reference or equivalent methods. State and
national statistics may therefore be based on different samplers.
State statistics for 1998 and later are based on local conditions (except for sites in the South Coast Air Basin, where State statistics for 2002 and later are based on local
conditions). National statistics are based on standard conditions.
State criteria for ensuring that data are sufficiently complete for calculating valid annual averages are more stringent than the national criteria.
Measurements are usually collected every six days. Measured days counts the days that a measurement was greater than the level of the standard; Estimated days
mathematically estimates how many days concentrations would have been greater than the level of the standard had each day been monitored.
3-Year statistics represent the listed year and the 2 years before the listed year.
Year Coverage indicates the extent to which available monitoring data represent the time of the year when concentrations are expected to be highest. 0 means that data
represent none of the high period; 100 means that data represent the entire high period. A high Year Coverage does not mean that there was sufficient data for annual
statistics to be considered valid.
* means there was insufficient data available to determine the value.
Available Pollutants:8-Hour Ozone | Hourly Ozone | PM2.5 | PM10 | Carbon Monoxide | Nitrogen Dioxide | State Sulfur Dioxide |
Hydrogen Sulfide
Top 4 Daily PM10 Averages http://www.arb.ca.gov/adam/topfour/topfourdisplay.php
1 of 2 12/29/2015 11:29 AM

Top 4 Daily PM10 Averages http://www.arb.ca.gov/adam/topfour/topfourdisplay.php
2 of 2 12/29/2015 11:29 AM

Top 4 Summary: Highest 4 Daily 24-Hour PM10 Averages
at Lucerne Valley-Middle School
2012 2013 2014
Date24-Hr
AverageDate
24-Hr
AverageDate
24-Hr
Average
National:
First High: Sep 12 30.0 Jun 3 160.2 Aug 21 49.8
Second High: Jun 8 28.0 May 4 71.4 May 11 35.8
Third High: May 9 26.0 May 16 70.3 Oct 8 31.7
Fourth High: May 21 26.0 Jul 15 50.2 Apr 17 30.3
California:
First High: Sep 12 27.0 Jun 3 142.8 Aug 21 44.6
Second High: Jun 8 25.0 May 4 64.5 May 11 33.0
Third High: May 9 23.0 May 16 63.9 Oct 8 28.5
Fourth High: May 21 23.0 Jul 15 44.2 Apr 17 27.4
National:
Estimated # Days >
24-Hour Std:0.0 * *
Measured # Days >
24-Hour Std:0 1 0
3-Yr Avg Est # Days >
24-Hr Std:* * *
Annual Average: 13.9 18.5 16.73-Year Average: 14 15 16
California:
Estimated # Days >
24-Hour Std:* * *
Measured # Days >
24-Hour Std:0 3 0
Annual Average: * * *
3-Year Maximum Annual
Average:13 * *
Year Coverage: 89 74 86
Notes:Daily PM10 averages and related statistics are available at Lucerne Valley-Middle School between 1990 and 2014. Some years in this range may not be represented.
All averages expressed in micrograms per cubic meter.
The national annual average PM10 standard was revoked in December 2006 and is no longer in effect. Statistics related to the revoked standard are shown in italics or
italics .
An exceedance of a standard is not necessarily related to a violation of the standard.
All values listed above represent midnight-to-midnight 24-hour averages and may be related to an exceptional event.
State and national statistics may differ for the following reasons:
State statistics are based on California approved samplers, whereas national statistics are based on samplers using federal reference or equivalent methods. State and
national statistics may therefore be based on different samplers.
State statistics for 1998 and later are based on local conditions (except for sites in the South Coast Air Basin, where State statistics for 2002 and later are based on local
conditions). National statistics are based on standard conditions.
State criteria for ensuring that data are sufficiently complete for calculating valid annual averages are more stringent than the national criteria.
Measurements are usually collected every six days. Measured days counts the days that a measurement was greater than the level of the standard; Estimated days
mathematically estimates how many days concentrations would have been greater than the level of the standard had each day been monitored.
3-Year statistics represent the listed year and the 2 years before the listed year.
Year Coverage indicates the extent to which available monitoring data represent the time of the year when concentrations are expected to be highest. 0 means that data
represent none of the high period; 100 means that data represent the entire high period. A high Year Coverage does not mean that there was sufficient data for annual
statistics to be considered valid.
* means there was insufficient data available to determine the value.
Available Pollutants:8-Hour Ozone | Hourly Ozone | PM2.5 | PM10 | Carbon Monoxide | Nitrogen Dioxide | State Sulfur Dioxide |
Hydrogen Sulfide
Top 4 Daily PM10 Averages http://www.arb.ca.gov/adam/topfour/topfourdisplay.php
1 of 2 12/29/2015 11:28 AM

Top 4 Daily PM10 Averages http://www.arb.ca.gov/adam/topfour/topfourdisplay.php
2 of 2 12/29/2015 11:28 AM
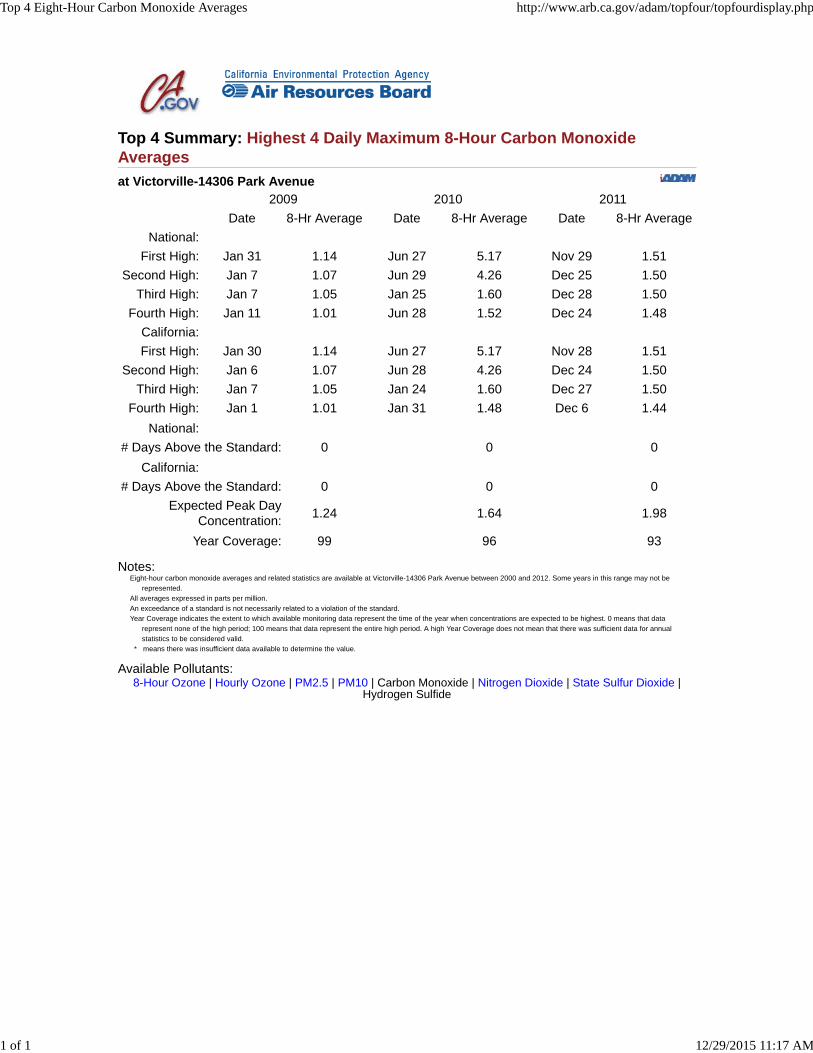
Top 4 Summary: Highest 4 Daily Maximum 8-Hour Carbon Monoxide
Averages
at Victorville-14306 Park Avenue
2009 2010 2011
Date 8-Hr Average Date 8-Hr Average Date 8-Hr Average
National:
First High: Jan 31 1.14 Jun 27 5.17 Nov 29 1.51
Second High: Jan 7 1.07 Jun 29 4.26 Dec 25 1.50
Third High: Jan 7 1.05 Jan 25 1.60 Dec 28 1.50
Fourth High: Jan 11 1.01 Jun 28 1.52 Dec 24 1.48
California:
First High: Jan 30 1.14 Jun 27 5.17 Nov 28 1.51
Second High: Jan 6 1.07 Jun 28 4.26 Dec 24 1.50
Third High: Jan 7 1.05 Jan 24 1.60 Dec 27 1.50
Fourth High: Jan 1 1.01 Jan 31 1.48 Dec 6 1.44
National:
# Days Above the Standard: 0 0 0
California:
# Days Above the Standard: 0 0 0
Expected Peak Day
Concentration:1.24 1.64 1.98
Year Coverage: 99 96 93
Notes:Eight-hour carbon monoxide averages and related statistics are available at Victorville-14306 Park Avenue between 2000 and 2012. Some years in this range may not be
represented.
All averages expressed in parts per million.
An exceedance of a standard is not necessarily related to a violation of the standard.
Year Coverage indicates the extent to which available monitoring data represent the time of the year when concentrations are expected to be highest. 0 means that data
represent none of the high period; 100 means that data represent the entire high period. A high Year Coverage does not mean that there was sufficient data for annual
statistics to be considered valid.
* means there was insufficient data available to determine the value.
Available Pollutants:8-Hour Ozone | Hourly Ozone | PM2.5 | PM10 | Carbon Monoxide | Nitrogen Dioxide | State Sulfur Dioxide |
Hydrogen Sulfide
Top 4 Eight-Hour Carbon Monoxide Averages http://www.arb.ca.gov/adam/topfour/topfourdisplay.php
1 of 1 12/29/2015 11:17 AM

Top 4 Summary: Highest 4 Daily Maximum 8-Hour Carbon Monoxide
Averages
at Victorville-14306 Park Avenue
2012 2013 2014
Date 8-Hr Average Date 8-Hr Average Date 8-Hr Average
National:
First High: Jan 15 1.83 * *
Second High: Jan 13 1.52 * *
Third High: Jan 3 1.44 * *
Fourth High: Jan 14 1.44 * *
California:
First High: Jan 14 1.83 * *
Second High: Jan 13 1.52 * *
Third High: Jan 2 1.44 * *
Fourth High: Jan 19 1.41 * *
National:
# Days Above the Standard: 0 0 0
California:
# Days Above the Standard: 0 0 0
Expected Peak Day
Concentration:2.17
Year Coverage: 51 * *
Notes:Eight-hour carbon monoxide averages and related statistics are available at Victorville-14306 Park Avenue between 2000 and 2012. Some years in this range may not be
represented.
All averages expressed in parts per million.
An exceedance of a standard is not necessarily related to a violation of the standard.
Year Coverage indicates the extent to which available monitoring data represent the time of the year when concentrations are expected to be highest. 0 means that data
represent none of the high period; 100 means that data represent the entire high period. A high Year Coverage does not mean that there was sufficient data for annual
statistics to be considered valid.
* means there was insufficient data available to determine the value.
Available Pollutants:8-Hour Ozone | Hourly Ozone | PM2.5 | PM10 | Carbon Monoxide | Nitrogen Dioxide | State Sulfur Dioxide |
Hydrogen Sulfide
Top 4 Eight-Hour Carbon Monoxide Averages http://www.arb.ca.gov/adam/topfour/topfourdisplay.php#
1 of 1 12/29/2015 11:19 AM

Top 4 Summary: Highest 4 Daily Maximum Hourly Nitrogen Dioxide
Measurements
at Victorville-14306 Park Avenue
2009 2010 2011
Date Measurement Date Measurement Date Measurement
National:
First High: Jun 25 64.0 Oct 9 137.0 Oct 31 75.0
Second High: May 11 60.0 Oct 16 131.0 May 5 70.0
Third High: Aug 13 60.0 Oct 8 85.0 Oct 13 68.0
Fourth High: Aug 17 60.0 Oct 20 81.0 Aug 26 65.0
California:
First High: Jun 25 64 Oct 9 137 Oct 31 75
Second High: May 11 60 Oct 16 131 May 5 70
Third High: Aug 13 60 Oct 8 85 Oct 13 68
Fourth High: Aug 17 60 Oct 20 81 Aug 26 65
National:
1-Hour Standard Design
Value:62 63 61
1-Hour Standard 98th
Percentile:59.0 65.0 60.0
# Days Above the Standard: 0 2 0
Annual Standard Design
Value:15 15 15
California:
1-Hour Std Designation
Value:70 80 80
Expected Peak Day
Concentration:74 78 76
# Days Above the Standard: 0 0 0
Annual Std Designation
Value:18 16 15
Annual Average: 15 15 15
Year Coverage: 98 99 100
Notes:Hourly nitrogen dioxide measurements and related statistics are available at Victorville-14306 Park Avenue between 2000 and 2014. Some years in this range may not be
represented.
All concentrations expressed in parts per billion.
An exceedance of a standard is not necessarily related to a violation of the standard.
Year Coverage indicates the extent to which available monitoring data represent the time of the year when concentrations are expected to be highest. 0 means that data
represent none of the high period; 100 means that data represent the entire high period. A high Year Coverage does not mean that there was sufficient data for annual
statistics to be considered valid.
* means there was insufficient data available to determine the value.
Available Pollutants:8-Hour Ozone | Hourly Ozone | PM2.5 | PM10 | Carbon Monoxide | Nitrogen Dioxide | State Sulfur Dioxide |
Hydrogen Sulfide
Top 4 Hourly Nitrogen Dioxide Measurements http://www.arb.ca.gov/adam/topfour/topfourdisplay.php
1 of 1 12/29/2015 11:22 AM

Top 4 Summary: Highest 4 Daily Maximum Hourly Nitrogen Dioxide
Measurements
at Victorville-14306 Park Avenue
2012 2013 2014
Date Measurement Date Measurement Date Measurement
National:
First High: Jan 20 56.0 Nov 8 64.6 Jul 31 66.6
Second High: Oct 30 55.0 Feb 12 61.0 Apr 9 60.7
Third High: Jun 12 51.0 Apr 29 60.1 Sep 12 56.3
Fourth High: Oct 29 51.0 Feb 13 57.4 Oct 24 53.3
California:
First High: Jan 20 56 Nov 8 64 Jul 31 66
Second High: Oct 30 55 Feb 12 61 Apr 9 60
Third High: Jun 12 51 Apr 29 60 Sep 12 56
Fourth High: Oct 29 51 Feb 13 57 May 16 53
National:
1-Hour Standard Design
Value:58 55 53
1-Hour Standard 98th
Percentile:50.0 55.7 52.7
# Days Above the Standard: 0 0 0
Annual Standard Design
Value:13 14 13
California:
1-Hour Std Designation
Value:80 70 60
Expected Peak Day
Concentration:75 65 61
# Days Above the Standard: 0 0 0
Annual Std Designation
Value:15 15 14
Annual Average: 13 14 13
Year Coverage: 99 99 99
Notes:Hourly nitrogen dioxide measurements and related statistics are available at Victorville-14306 Park Avenue between 2000 and 2014. Some years in this range may not be
represented.
All concentrations expressed in parts per billion.
An exceedance of a standard is not necessarily related to a violation of the standard.
Year Coverage indicates the extent to which available monitoring data represent the time of the year when concentrations are expected to be highest. 0 means that data
represent none of the high period; 100 means that data represent the entire high period. A high Year Coverage does not mean that there was sufficient data for annual
statistics to be considered valid.
* means there was insufficient data available to determine the value.
Available Pollutants:8-Hour Ozone | Hourly Ozone | PM2.5 | PM10 | Carbon Monoxide | Nitrogen Dioxide | State Sulfur Dioxide |
Hydrogen Sulfide
Top 4 Hourly Nitrogen Dioxide Measurements http://www.arb.ca.gov/adam/topfour/topfourdisplay.php
1 of 1 12/29/2015 11:20 AM

Page 1 of 1Generated: December 29, 2015
Source: U.S. EPA AirData <http://www.epa.gov/airdata>
This report is based on monitor-level summary statistics. Air quality standards for some pollutants (PM2.5 and Pb) allow for combining data from multiple monitors into a site-levelsummary statistic that can be compared to the standard. In those cases, the site-level statistics may differ from the monitor-level statistics upon which this report is based.
Readers are cautioned not to rank order geographic areas based on AirData reports. Air pollution levels measured at a particular monitoring site are not necessarily representativeof the air quality for an entire county or urban area.
AirData reports are produced from a direct query of the AQS Data Mart. The data represent the best and most recent information available to EPA from state agencies. However,some values may be absent due to incomplete reporting, and some values may change due to quality assurance activities. The AQS database is updated daily by state, local, andtribal organizations who own and submit the data. Please contact the appropriate air quality monitoring agency to report any data problems.<http://www.epa.gov/airquality/airdata/ad_contacts.html>
Get detailed information about this report, including column descriptions, at http://www.epa.gov/airquality/airdata/ad_about_reports.html#mon
Monitor Values ReportGeographic Area: San Bernardino County, CAPollutant: SO2Year: 2009Exceptional Events: Included (if any)Note: The * indicates the mean does not satisfy minimum data completeness criteria.
Obs1hr
FirstMax1hr
SecondMax1hr
99thPercentile
Obs24hr
FirstMax24hr
SecondMax24hr
Days>STD
AnnualMean
ExcEvents
MonitorNumber Site ID Address City County State
EPARegion
8343 8 7 6 364 5.5 5 0 0.68 None 1 060710306 14306 Park Ave., Victorville, Ca Victorville San Bernardino CA 09
8332 11 10 9 359 2.8 2.4 0 0.62 None 1 060711234 Corner Of Athol And Telescope Searles Valley San Bernardino CA 09
8271 5 4 4 362 2 1.8 0 0.87 None 1 060712002 14360 Arrow Blvd., Fontana Fontana San Bernardino CA 09

Page 1 of 1Generated: December 29, 2015
Source: U.S. EPA AirData <http://www.epa.gov/airdata>
This report is based on monitor-level summary statistics. Air quality standards for some pollutants (PM2.5 and Pb) allow for combining data from multiple monitors into a site-levelsummary statistic that can be compared to the standard. In those cases, the site-level statistics may differ from the monitor-level statistics upon which this report is based.
Readers are cautioned not to rank order geographic areas based on AirData reports. Air pollution levels measured at a particular monitoring site are not necessarily representativeof the air quality for an entire county or urban area.
AirData reports are produced from a direct query of the AQS Data Mart. The data represent the best and most recent information available to EPA from state agencies. However,some values may be absent due to incomplete reporting, and some values may change due to quality assurance activities. The AQS database is updated daily by state, local, andtribal organizations who own and submit the data. Please contact the appropriate air quality monitoring agency to report any data problems.<http://www.epa.gov/airquality/airdata/ad_contacts.html>
Get detailed information about this report, including column descriptions, at http://www.epa.gov/airquality/airdata/ad_about_reports.html#mon
Monitor Values ReportGeographic Area: San Bernardino County, CAPollutant: SO2Year: 2010Exceptional Events: Included (if any)Note: The * indicates the mean does not satisfy minimum data completeness criteria.
Obs1hr
FirstMax1hr
SecondMax1hr
99thPercentile
Obs24hr
FirstMax24hr
SecondMax24hr
Days>STD
AnnualMean
ExcEvents
MonitorNumber Site ID Address City County State
EPARegion
8224 52 16 11 361 7.2 6.7 0 0.92 None 1 060710306 14306 Park Ave., Victorville, Ca Victorville San Bernardino CA 09
8148 10 10 8 355 3.2 3.1 0 1.23 None 1 060711234 Corner Of Athol And Telescope Searles Valley San Bernardino CA 09
5503 6.6 4.9 3 242 1.6 1.5 0 0.65* None 1 060712002 14360 Arrow Blvd., Fontana Fontana San Bernardino CA 09
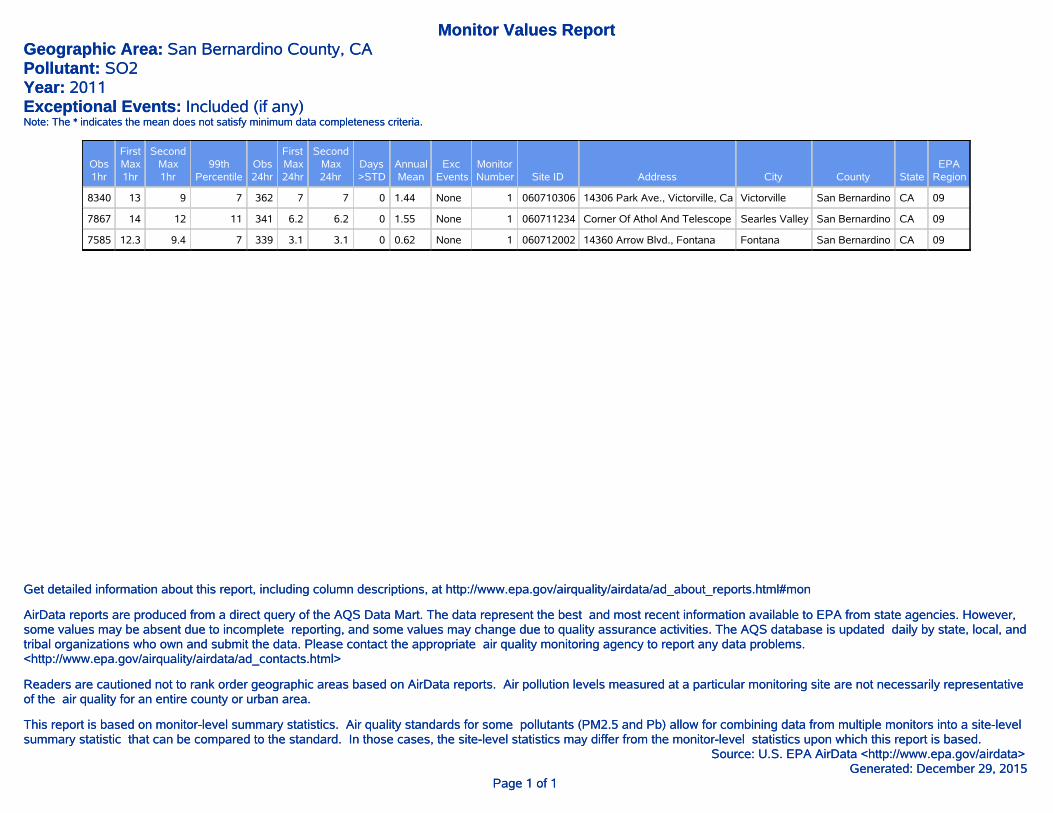
Page 1 of 1Generated: December 29, 2015
Source: U.S. EPA AirData <http://www.epa.gov/airdata>
This report is based on monitor-level summary statistics. Air quality standards for some pollutants (PM2.5 and Pb) allow for combining data from multiple monitors into a site-levelsummary statistic that can be compared to the standard. In those cases, the site-level statistics may differ from the monitor-level statistics upon which this report is based.
Readers are cautioned not to rank order geographic areas based on AirData reports. Air pollution levels measured at a particular monitoring site are not necessarily representativeof the air quality for an entire county or urban area.
AirData reports are produced from a direct query of the AQS Data Mart. The data represent the best and most recent information available to EPA from state agencies. However,some values may be absent due to incomplete reporting, and some values may change due to quality assurance activities. The AQS database is updated daily by state, local, andtribal organizations who own and submit the data. Please contact the appropriate air quality monitoring agency to report any data problems.<http://www.epa.gov/airquality/airdata/ad_contacts.html>
Get detailed information about this report, including column descriptions, at http://www.epa.gov/airquality/airdata/ad_about_reports.html#mon
Monitor Values ReportGeographic Area: San Bernardino County, CAPollutant: SO2Year: 2011Exceptional Events: Included (if any)Note: The * indicates the mean does not satisfy minimum data completeness criteria.
Obs1hr
FirstMax1hr
SecondMax1hr
99thPercentile
Obs24hr
FirstMax24hr
SecondMax24hr
Days>STD
AnnualMean
ExcEvents
MonitorNumber Site ID Address City County State
EPARegion
8340 13 9 7 362 7 7 0 1.44 None 1 060710306 14306 Park Ave., Victorville, Ca Victorville San Bernardino CA 09
7867 14 12 11 341 6.2 6.2 0 1.55 None 1 060711234 Corner Of Athol And Telescope Searles Valley San Bernardino CA 09
7585 12.3 9.4 7 339 3.1 3.1 0 0.62 None 1 060712002 14360 Arrow Blvd., Fontana Fontana San Bernardino CA 09

Page 1 of 1Generated: December 29, 2015
Source: U.S. EPA AirData <http://www.epa.gov/airdata>
This report is based on monitor-level summary statistics. Air quality standards for some pollutants (PM2.5 and Pb) allow for combining data from multiple monitors into a site-levelsummary statistic that can be compared to the standard. In those cases, the site-level statistics may differ from the monitor-level statistics upon which this report is based.
Readers are cautioned not to rank order geographic areas based on AirData reports. Air pollution levels measured at a particular monitoring site are not necessarily representativeof the air quality for an entire county or urban area.
AirData reports are produced from a direct query of the AQS Data Mart. The data represent the best and most recent information available to EPA from state agencies. However,some values may be absent due to incomplete reporting, and some values may change due to quality assurance activities. The AQS database is updated daily by state, local, andtribal organizations who own and submit the data. Please contact the appropriate air quality monitoring agency to report any data problems.<http://www.epa.gov/airquality/airdata/ad_contacts.html>
Get detailed information about this report, including column descriptions, at http://www.epa.gov/airquality/airdata/ad_about_reports.html#mon
Monitor Values ReportGeographic Area: San Bernardino County, CAPollutant: SO2Year: 2012Exceptional Events: Included (if any)Note: The * indicates the mean does not satisfy minimum data completeness criteria.
Obs1hr
FirstMax1hr
SecondMax1hr
99thPercentile
Obs24hr
FirstMax24hr
SecondMax24hr
Days>STD
AnnualMean
ExcEvents
MonitorNumber Site ID Address City County State
EPARegion
8324 6 5 5 362 2.7 2.1 0 0.95 None 1 060710306 14306 Park Ave., Victorville, Ca Victorville San Bernardino CA 09
4193 12 11 11 181 2.5 2.5 0 0.62* None 1 060711234 Corner Of Athol And Telescope Searles Valley San Bernardino CA 09
8113 4 4 4 355 3.2 3.2 0 0.64 None 1 060712002 14360 Arrow Blvd., Fontana Fontana San Bernardino CA 09

Page 1 of 1Generated: December 29, 2015
Source: U.S. EPA AirData <http://www.epa.gov/airdata>
This report is based on monitor-level summary statistics. Air quality standards for some pollutants (PM2.5 and Pb) allow for combining data from multiple monitors into a site-levelsummary statistic that can be compared to the standard. In those cases, the site-level statistics may differ from the monitor-level statistics upon which this report is based.
Readers are cautioned not to rank order geographic areas based on AirData reports. Air pollution levels measured at a particular monitoring site are not necessarily representativeof the air quality for an entire county or urban area.
AirData reports are produced from a direct query of the AQS Data Mart. The data represent the best and most recent information available to EPA from state agencies. However,some values may be absent due to incomplete reporting, and some values may change due to quality assurance activities. The AQS database is updated daily by state, local, andtribal organizations who own and submit the data. Please contact the appropriate air quality monitoring agency to report any data problems.<http://www.epa.gov/airquality/airdata/ad_contacts.html>
Get detailed information about this report, including column descriptions, at http://www.epa.gov/airquality/airdata/ad_about_reports.html#mon
Monitor Values ReportGeographic Area: San Bernardino County, CAPollutant: SO2Year: 2013Exceptional Events: Included (if any)Note: The * indicates the mean does not satisfy minimum data completeness criteria.
Obs1hr
FirstMax1hr
SecondMax1hr
99thPercentile
Obs24hr
FirstMax24hr
SecondMax24hr
Days>STD
AnnualMean
ExcEvents
MonitorNumber Site ID Address City County State
EPARegion
7983 4.4 4.4 4 359 2.2 2.2 0 1.12 None 1 060710306 14306 Park Ave., Victorville, Ca Victorville San Bernardino CA 09
6960 20.5 15.5 11 314 11.1 9.6 0 0.72* None 1 060711234 Corner Of Athol And Telescope Searles Valley San Bernardino CA 09
6738 4.3 3.1 3 288 2.1 2.1 0 0.47* None 1 060712002 14360 Arrow Blvd., Fontana Fontana San Bernardino CA 09

Page 1 of 1Generated: December 29, 2015
Source: U.S. EPA AirData <http://www.epa.gov/airdata>
This report is based on monitor-level summary statistics. Air quality standards for some pollutants (PM2.5 and Pb) allow for combining data from multiple monitors into a site-levelsummary statistic that can be compared to the standard. In those cases, the site-level statistics may differ from the monitor-level statistics upon which this report is based.
Readers are cautioned not to rank order geographic areas based on AirData reports. Air pollution levels measured at a particular monitoring site are not necessarily representativeof the air quality for an entire county or urban area.
AirData reports are produced from a direct query of the AQS Data Mart. The data represent the best and most recent information available to EPA from state agencies. However,some values may be absent due to incomplete reporting, and some values may change due to quality assurance activities. The AQS database is updated daily by state, local, andtribal organizations who own and submit the data. Please contact the appropriate air quality monitoring agency to report any data problems.<http://www.epa.gov/airquality/airdata/ad_contacts.html>
Get detailed information about this report, including column descriptions, at http://www.epa.gov/airquality/airdata/ad_about_reports.html#mon
Monitor Values ReportGeographic Area: San Bernardino County, CAPollutant: SO2Year: 2014Exceptional Events: Included (if any)Note: The * indicates the mean does not satisfy minimum data completeness criteria.
Obs1hr
FirstMax1hr
SecondMax1hr
99thPercentile
Obs24hr
FirstMax24hr
SecondMax24hr
Days>STD
AnnualMean
ExcEvents
MonitorNumber Site ID Address City County State
EPARegion
7960 4.8 3.6 3 361 1.9 1.8 0 1.12 None 1 060710306 14306 Park Ave., Victorville, Ca Victorville San Bernardino CA 09
7656 8.8 8 8 347 2.8 1.7 0 0.52 None 1 060711234 Corner Of Athol And Telescope Searles Valley San Bernardino CA 09
7313 4 3.9 3 317 1 0.9 0 0.25* None 1 060712002 14360 Arrow Blvd., Fontana Fontana San Bernardino CA 09

Top 4 Summary: Highest 4 Daily Maximum State 24-Hour Sulfur Dioxide
Averages
at Victorville-14306 Park Avenue
2009 2010 2011
Date24-Hr
AverageDate
24-Hr
AverageDate
24-Hr
Average
First High: Mar 31 0.005 May 9 0.007 Apr 18 0.007
Second High: Apr 2 0.005 May 10 0.007 Apr 19 0.007
Third High: Apr 3 0.005 May 7 0.006 Apr 20 0.007
Fourth High: Mar 30 0.005 May 6 0.006 Apr 21 0.007
Annual Average: 0.000 0.000 0.001
Year Coverage: 97 96 97
Notes:Hourly sulfur dioxide measurements and related statistics are available at Victorville-14306 Park Avenue between 2000 and 2012. Some years in this range may not be
represented.
All averages expressed in parts per million.
An exceedance of a standard is not necessarily related to a violation of the standard.
Year Coverage indicates the extent to which available monitoring data represent the time of the year when concentrations are expected to be highest. 0 means that data
represent none of the high period; 100 means that data represent the entire high period. A high Year Coverage does not mean that there was sufficient data for annual
statistics to be considered valid.
* means there was insufficient data available to determine the value.
Available Pollutants:8-Hour Ozone | Hourly Ozone | PM2.5 | PM10 | Carbon Monoxide | Nitrogen Dioxide | State Sulfur Dioxide |
Hydrogen Sulfide
Top 4 State 24-Hour Sulfur Dioxide Averages http://www.arb.ca.gov/adam/topfour/topfourdisplay.php
1 of 1 12/29/2015 11:31 AM

Top 4 Summary: Highest 4 Daily Maximum State 24-Hour Sulfur Dioxide
Averages
at Victorville-14306 Park Avenue
2012 2013 2014
Date24-Hr
AverageDate
24-Hr
AverageDate
24-Hr
Average
First High: Aug 28 0.003 Jan 18 0.002 *
Second High: Jan 5 0.002 Jan 4 0.002 *
Third High: Jan 10 0.002 Jan 22 0.002 *
Fourth High: Sep 10 0.002 Feb 12 0.002 *
Annual Average: * * *
Year Coverage: 61 * *
Notes:Hourly sulfur dioxide measurements and related statistics are available at Victorville-14306 Park Avenue between 2000 and 2012. Some years in this range may not be
represented.
All averages expressed in parts per million.
An exceedance of a standard is not necessarily related to a violation of the standard.
Year Coverage indicates the extent to which available monitoring data represent the time of the year when concentrations are expected to be highest. 0 means that data
represent none of the high period; 100 means that data represent the entire high period. A high Year Coverage does not mean that there was sufficient data for annual
statistics to be considered valid.
* means there was insufficient data available to determine the value.
Available Pollutants:8-Hour Ozone | Hourly Ozone | PM2.5 | PM10 | Carbon Monoxide | Nitrogen Dioxide | State Sulfur Dioxide |
Hydrogen Sulfide
Top 4 State 24-Hour Sulfur Dioxide Averages http://www.arb.ca.gov/adam/topfour/topfourdisplay.php
1 of 1 12/29/2015 11:30 AM

Butterfield and Sentinel Quarries Expansion Air Quality and Greenhouse Gas Impact Assessment San Bernardino National Forest October 25, 2017
OM01_SB-AQHRCCIA_fnl.docx Sespe Consulting, Inc.
Appendix D: San Gorgonio Wilderness Area Description

B-140
SAGO1 Monitor The SAGO1 monitor location represents two wilderness areas located in the San Bernardino and San Jacinto Mountains in Southern California. The wilderness areas associated with the SAGO1 monitor are San Gorgonio Wilderness Area and San Jacinto Wilderness area. The SAGO1 site has been operating since March 1988. This site does not have sufficient data for the entire baseline period. Data was not available for the year 2000. Section I. SAGO1 Wilderness Area Descriptions I.a. San Gorgonio Wilderness Area The San Gorgonio Wilderness Area (San Gorgonio) occupies 34,644 acres of the San Bernardino Mountains of southern California, approximately 75 miles east of Los Angeles. Elevations range from 1,341 meters to 3,505 meters at the crest of Mt. San Gorgonio; however most of the wilderness is above the 2,134 meter level. Eleven of the 12 peaks in the Wilderness are above 3,048 meters. Two rivers, the Santa Ana and the White, flow out of the Wilderness. Two small lakes, several meadows, and large, heavily forested areas provide a beautiful sub-alpine oasis in the dry lands that surround the mountain range.
Figure 1. SAGO1 Monitor location

B-141
Figure 2. WINHAZE image of San Gorgonio Wilderness Area (5.4 vs. 22.2 dv)
I.b. San Jacinto Wilderness Area The San Jacinto Wilderness Area (San Jacinto) is part of the San Jacinto Mountains in southern California, adjacent to the Los Angeles Basin to the west, which can be seen from its higher elevations. It is one of the Peninsular Ranges that extend south from the Los Angeles Basin to the tip of the Baja Peninsula and separate the Los Angeles Basin from the Mohave Desert to the east. It occupies 20,564 acres and is split into a north Wilderness and a south Wilderness, separated by the Mount San Jacinto State Park and Wilderness. It is separated from the San Bernardino Mountains and San Gorgonio Wilderness by San Gorgonio Pass. Elevations range from less than 610 meters on the north edge within San Gorgonio Pass to almost 3,353 meters at its higher peaks. The highest peak in the area is San Jacinto Peak located between the north and south Wilderness sections, at an elevation of 3,293 meters.
Figure 3. San Jacinto Wilderness Area

B-142
Figure 4. Photograph of San Jacinto Wilderness Area
Figure 5. SAGO1 Monitor location in California
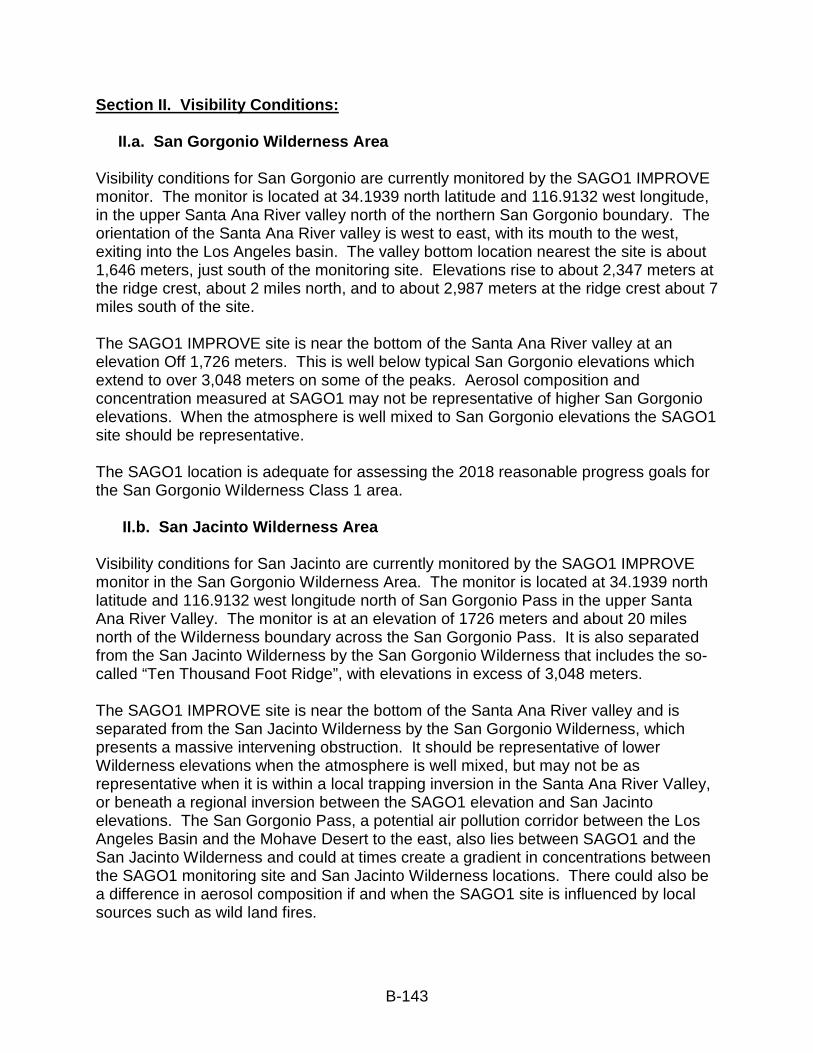
B-143
Section II. Visibility Conditions: II.a. San Gorgonio Wilderness Area Visibility conditions for San Gorgonio are currently monitored by the SAGO1 IMPROVE monitor. The monitor is located at 34.1939 north latitude and 116.9132 west longitude, in the upper Santa Ana River valley north of the northern San Gorgonio boundary. The orientation of the Santa Ana River valley is west to east, with its mouth to the west, exiting into the Los Angeles basin. The valley bottom location nearest the site is about 1,646 meters, just south of the monitoring site. Elevations rise to about 2,347 meters at the ridge crest, about 2 miles north, and to about 2,987 meters at the ridge crest about 7 miles south of the site. The SAGO1 IMPROVE site is near the bottom of the Santa Ana River valley at an elevation Off 1,726 meters. This is well below typical San Gorgonio elevations which extend to over 3,048 meters on some of the peaks. Aerosol composition and concentration measured at SAGO1 may not be representative of higher San Gorgonio elevations. When the atmosphere is well mixed to San Gorgonio elevations the SAGO1 site should be representative. The SAGO1 location is adequate for assessing the 2018 reasonable progress goals for the San Gorgonio Wilderness Class 1 area. II.b. San Jacinto Wilderness Area Visibility conditions for San Jacinto are currently monitored by the SAGO1 IMPROVE monitor in the San Gorgonio Wilderness Area. The monitor is located at 34.1939 north latitude and 116.9132 west longitude north of San Gorgonio Pass in the upper Santa Ana River Valley. The monitor is at an elevation of 1726 meters and about 20 miles north of the Wilderness boundary across the San Gorgonio Pass. It is also separated from the San Jacinto Wilderness by the San Gorgonio Wilderness that includes the so-called “Ten Thousand Foot Ridge”, with elevations in excess of 3,048 meters.
The SAGO1 IMPROVE site is near the bottom of the Santa Ana River valley and is separated from the San Jacinto Wilderness by the San Gorgonio Wilderness, which presents a massive intervening obstruction. It should be representative of lower Wilderness elevations when the atmosphere is well mixed, but may not be as representative when it is within a local trapping inversion in the Santa Ana River Valley, or beneath a regional inversion between the SAGO1 elevation and San Jacinto elevations. The San Gorgonio Pass, a potential air pollution corridor between the Los Angeles Basin and the Mohave Desert to the east, also lies between SAGO1 and the San Jacinto Wilderness and could at times create a gradient in concentrations between the SAGO1 monitoring site and San Jacinto Wilderness locations. There could also be a difference in aerosol composition if and when the SAGO1 site is influenced by local sources such as wild land fires.

B-144
The SAGO1 location is adequate for assessing the 2018 reasonable progress goals for the San Jacinto Wilderness Class 1 area. II.c. Baseline Visibility Baseline visibility is determined from SAGO1 IMPROVE monitoring data for the 20% best and the 20% worst days for the years 2000 through 2004. The baseline visibility for the SAGO1 monitor is calculated at 5.4 deciviews for the 20% best days and 22.2 deciviews for the 20% worst days. Figure 6 represents the worst baseline visibility conditions. II.d. Natural Visibility Natural visibility represents the visibility condition that would be experienced in the absence of human-caused impairment. Based on EPA guidance, the natural visibility for the SAGO1 monitor is 1.2 deciviews for the 20% best days and 7.3 deciviews for the 20% worst days. It is possible that the Natural Conditions deciview value for 2064 could change in the future as more is learned about natural plant emissions and wildfire impacts. II.e. Presumptive Glide Slope and the Uniform Rate of Progress Figure 6 also shows the uniform rate of progress, or “glide slope.” The glide slope is the rate of reduction in the 20% worst days deciview average that would have to be achieved to reach natural conditions at a uniform pace in the 60 years following the baseline period. The first benchmark along the path towards achieving natural conditions occurs in 2018. The glide slope shows that the 2018 benchmark for the 20% worst days is 18.70 deciviews. According to the Regional Haze Rule, the 20% best days baseline visibility of 5.4 deciviews must be maintained or improved by 2018, the end of the first planning period.
Figure 6. Baseline for Worst 20% days and Natural Conditions in 2064

B-145
II.f. Species Contribution Each pollutant species causes light extinction but its contribution differs on best and worst days. Figure 7 shows the contribution of each species to the 20% best and worst days in the baseline years at SAGO1.
Figure 7. Average Haze species contributions to light extinction in the baseline years
Figure 8. Individual Haze species contributions to light extinction in the baseline years
As shown in Figures 7 and 8, nitrates, organic matter, and sulfates have the strongest contributions to degrading visibility on worst days at the SAGO1 monitor. Nitrates clearly dominate on the worst days, but nitrates and sulfates equally contribute emissions on the best days. Data points for 2000 were insufficient for calculating best and worst days per the Regional Haze Rule Guidance. Figure 9 depicts the individual species contribution to worst days in 2002. Nitrates increase in the winter and spring months, while organic matter increases in the summer and fall. Sulfates remain relatively stable throughout the year. Nitrates clearly dominate the other haze species on worst days, but organic matter, sulfates, coarse mass and

B-146
elemental carbon also contribute to the worst days. There are only trace amounts of soil and sea salt present throughout the years. Figure 10 illustrates the individual species contribution on worst days in 2000-2004 by monthly average. The trend shown is comparable to Figure 9 for nitrates, organic matter, and sulfates. High organic periods vary from year to year due to the unpredictable occurrence of wild fires.
Figure 9. Species contribution on the 20% worst days in 2002
Figure 10. Species contribution on 20% worst days (2000-2004)

B-147
II.g. Sources of Haze Species Both natural and man-made sources contribute to the calculated deciview levels made by haze pollutants at SAGO1. Some haze species arise from sources that are within the control of the State of California or neighboring states. Others arise from natural, uncontrollable situations such as wildfires, sea salt or dust storms in natural areas, whether or not they from in-state or out-of-state (and out-of-country) sources. Finally, other uncontrollable, man-made sources are those industrial pollutants and other man-made (anthropogenic) emissions transported from outside the United States.
Figures 11 and 12 represent the regional contributions to nitrates on the 20% worst days. The WRAP region represents the largest contribution to nitrate in 2002 and 2018 (79%), followed by the Pacific Offshore Region (17%) and emissions from Outside Domain (3%). Mobile sources within California contribute the most nitrate at the SAGO1 monitor. In 2002, 87% of the nitrate from mobile sources at the SAGO1 monitor can be attributed to California. California mobile source emissions reductions are mainly responsible for improvement in nitrates in 2018.
Figure 13 shows the primary organic carbon source contribution from California and the outside regions. The largest contributor to primary organic carbon at the SAGO1 monitor is from natural fire sources within California. California represents 99% of all natural fire source contributions.
Figure 14 illustrates the total organic carbon source apportionment from 2000-2004 for anthropogenic and biogenic sources. The anthropogenic and biogenic primary source emissions account for 59% of the total organic carbon. Biogenic secondary emissions account for 34% of the total organic carbon emissions and anthropogenic secondary is responsible for the remaining emissions.
Figures 15 and 16 represent the regional contributions to sulfate on the 20% worst days in 2002 and 2018 at SAGO1. The WRAP region represents 38% of the sulfate contributions in 2002 and 2018, followed by the emissions from Pacific Offshore (31%) and the Outside Domain Region (27%). California contributes 33% of the total sulfate emissions seen at the SAGO1 monitor.
Individually, emissions from outside the modeling domain contribute the most to sulfate concentrations at the SAGO1 monitor. The next largest contributor to sulfate concentrations is area sources in the Pacific Offshore.

B-148
Figure 11. Regional Nitrate contribution to haze in 2002 and 2018
Figure 12. Nitrate source contribution from CA and outside regions
Figure 13. Organic carbon source contribution from CA and outside regions

B-149
Figure 14. Organic carbon Anthropogenic and Biogenic Source Apportionment
Figure 15. Regional Sulfate contribution to haze in 2002 and 2018
Figure 16. Sulfate source contribution from CA and outside regions
Butterfield and Sentinel Quarries Expansion Air Quality and Greenhouse Gas Impact Assessment San Bernardino National Forest October 25, 2017
OM01_SB-AQHRCCIA_fnl.docx Sespe Consulting, Inc.
Appendix E: MDAQMD Rule Development Calendar
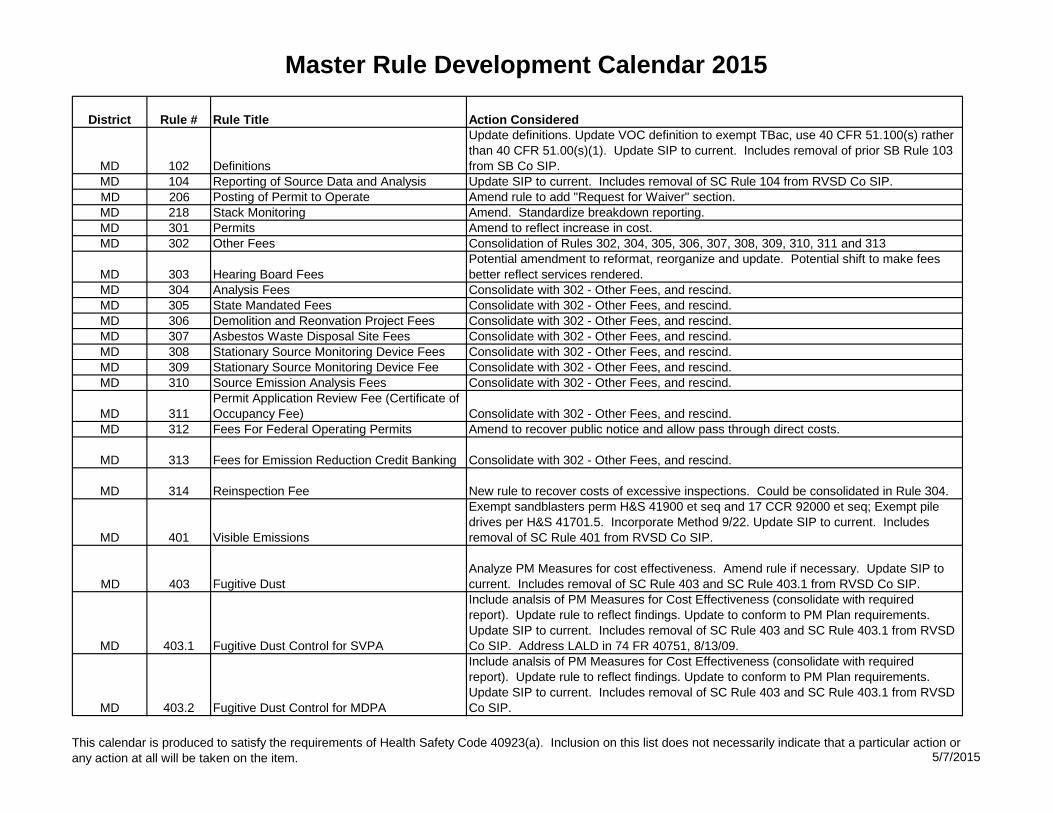
Master Rule Development Calendar 2015
District Rule # Rule Title Action Considered
MD 102 Definitions
Update definitions. Update VOC definition to exempt TBac, use 40 CFR 51.100(s) rather than 40 CFR 51.00(s)(1). Update SIP to current. Includes removal of prior SB Rule 103 from SB Co SIP.
MD 104 Reporting of Source Data and Analysis Update SIP to current. Includes removal of SC Rule 104 from RVSD Co SIP.MD 206 Posting of Permit to Operate Amend rule to add "Request for Waiver" section.MD 218 Stack Monitoring Amend. Standardize breakdown reporting.MD 301 Permits Amend to reflect increase in cost. MD 302 Other Fees Consolidation of Rules 302, 304, 305, 306, 307, 308, 309, 310, 311 and 313
MD 303 Hearing Board FeesPotential amendment to reformat, reorganize and update. Potential shift to make fees better reflect services rendered.
MD 304 Analysis Fees Consolidate with 302 - Other Fees, and rescind.MD 305 State Mandated Fees Consolidate with 302 - Other Fees, and rescind. MD 306 Demolition and Reonvation Project Fees Consolidate with 302 - Other Fees, and rescind.MD 307 Asbestos Waste Disposal Site Fees Consolidate with 302 - Other Fees, and rescind.MD 308 Stationary Source Monitoring Device Fees Consolidate with 302 - Other Fees, and rescind.MD 309 Stationary Source Monitoring Device Fee Consolidate with 302 - Other Fees, and rescind.MD 310 Source Emission Analysis Fees Consolidate with 302 - Other Fees, and rescind.
MD 311Permit Application Review Fee (Certificate of Occupancy Fee) Consolidate with 302 - Other Fees, and rescind.
MD 312 Fees For Federal Operating Permits Amend to recover public notice and allow pass through direct costs.
MD 313 Fees for Emission Reduction Credit Banking Consolidate with 302 - Other Fees, and rescind.
MD 314 Reinspection Fee New rule to recover costs of excessive inspections. Could be consolidated in Rule 304.
MD 401 Visible Emissions
Exempt sandblasters perm H&S 41900 et seq and 17 CCR 92000 et seq; Exempt pile drives per H&S 41701.5. Incorporate Method 9/22. Update SIP to current. Includes removal of SC Rule 401 from RVSD Co SIP.
MD 403 Fugitive DustAnalyze PM Measures for cost effectiveness. Amend rule if necessary. Update SIP to current. Includes removal of SC Rule 403 and SC Rule 403.1 from RVSD Co SIP.
MD 403.1 Fugitive Dust Control for SVPA
Include analsis of PM Measures for Cost Effectiveness (consolidate with required report). Update rule to reflect findings. Update to conform to PM Plan requirements. Update SIP to current. Includes removal of SC Rule 403 and SC Rule 403.1 from RVSD Co SIP. Address LALD in 74 FR 40751, 8/13/09.
MD 403.2 Fugitive Dust Control for MDPA
Include analsis of PM Measures for Cost Effectiveness (consolidate with required report). Update rule to reflect findings. Update to conform to PM Plan requirements. Update SIP to current. Includes removal of SC Rule 403 and SC Rule 403.1 from RVSD Co SIP.
This calendar is produced to satisfy the requirements of Health Safety Code 40923(a). Inclusion on this list does not necessarily indicate that a particular action or any action at all will be taken on the item. 5/7/2015

Master Rule Development Calendar 2015
District Rule # Rule Title Action Considered
MD 403.3Fugitive Dust Control for Off-Site Agricultural Sources
Add dust control for agricultural sources. Analyze PM Measures for cost effectiveness. Add rule.
MD 403.4Fugitive Dust Control for On-Site Agricultural Sources
New Rule to conform with with Agricultural Confined Animal Facilities, Agricultural Fugitive Dust, Agricultural Best Management Practices, Agricultural IC Engines, and Rule 219 proposed amendments.
MD 404 Particulate Matter - Concentration Update SIP to current. Includes removal of SC Rule 404 from RVSD Co SIP.MD 405 Solid Particulate Matter - Weight Update SIP to current. Includes removal of SC Rule 405 from RVSD Co SIP.MD 406 Specific Contaminants Update SIP to current. Includes removal of SC Rule 406 from RVSD Co SIP.MD 407 Liquid and Gaseous Air Contaminants Update SIP to current. Includes removal of SC Rule 407 from RVSD Co SIP.MD 408 Circumvention Update SIP to current. Includes removal of SC Rule 408 from RVSD Co SIP.MD 409 Combustion Contaminants Update SIP to current. Includes removal of SC Rule 409 from RVSD Co SIP.
MD 431 Sulfur content of fuels
Update to conform with CARB Diesel requirements Title 13 CCR 2281. Update SIP to current. Includes removal of SC Rule 431, SC Rule 431.1, SC Rule 431.2, SC Rule 431.3 from RVSD Co SIP.
MD 432 Gasoline Specifications Update SIP to current. Includes removal of RC Rule 432 from RVSD Co SIP.
MD 442 Usage of SolventsAmend to update language. Include analsis of PM Measures for Cost Effectiveness (consolidate with required report). Review for RACT. Update rule to reflect findings.
MD 443 Labeling of SolventsUpdate SIP to current. Includes removal of RC Rule 443 and SC Rule 443.1 from RVSD Co SIP.
MD 444 Open Outdoor Burning Analyze PM Measures for cost effectiveness. Amend rule if necessary.
MD 461 Gasoline Transfer & Dispensing
Add provisions regarding efficiency of vapor systems from 95 to 98, for EVR. Update inspection frequency requirement. Add fleet vehicle onboard EVR provisions. Update SIP to current. Includes removal of SC Rule 461 from RVSD Co SIP. Update for RACT.
MD 462 Organic Liquid LoadingUpdate SIP to current. Includes removal of SC Rule 462 from RVSD Co SIP. Update for RACT.
MD 463 Storage of Organic Liquids
Update definitions, update test methods, add the standard test method language. Update SIP to current. Includes removal of SC Rule 463 from RVSD Co SIP. Update for RACT.
MD 468 Sulfur Recovery Units Update SIP to current. Includes removal of RC Rule 468 from RVSD Co SIP.MD 469 Sulfuric Acid Units Update SIP to current. Includes removal of RC Rule 469 from RVSD Co SIP.MD 470 Asphalt Air Blowing (Rescinded) Update SIP to current. Includes removal of RC Rule 470 from RVSD Co SIP.MD 472 Reduction of Animal Matter Update SIP to current. Includes removal of RC Rule 472 from RVSD Co SIP.MD 473 Disposal of Solid and Liquid Wastes Update SIP to current. Includes removal of RC Rule 473 from RVSD Co SIP.MD 480 Natural Gas Fired Control Devices Update SIP to current.
MD 900Standards of Performance for New Stationary Sources (NSPS) Review annually and update as necessary.
This calendar is produced to satisfy the requirements of Health Safety Code 40923(a). Inclusion on this list does not necessarily indicate that a particular action or any action at all will be taken on the item. 5/7/2015

Master Rule Development Calendar 2015
District Rule # Rule Title Action Considered
MD 901Asbestos sources not covered by Federal Regulation Potential new rule.
MD 1000National Emission Standards for Hazardous Air Pollutants (NESHAP)
Review annually and update as necessary. Update SIP to current. Includes removal of SC Rule 1102 and SC Rule 1102.1 from RVSD Co SIP.
MD 1102Fugitive Emissions of VOCs from Components at Pipeline Transfer Stations
Update SIP to current. Includes removal of SC Rule 466, SC Rule 466.1 and SC Rule 1173 from RVSD Co SIP.
MD 1103 Cutback and Emulsified AsphaltUpdate SIP to current. Includes removal of SC Rule 1108 and SC Rule 1108.1 and SC Rule 1120 from RVSD Co SIP.
MD 1104 Organic Solvent Degreasing Operations
Analyze PM Measures for cost effectiveness. Amend rule if necessary. Update SIP to current. Includes removal of SC Rule 1122 and SC Rule 1171 from RVSD Co SIP. Revise rule to current RACT based on RACT re-analysis results.
MD 1106 Marine Coating OperationsUpdate SIP to current. Includes removal of SC Rule 109, SC Rule 481, SC Rule 1106 and SC Rule 1106.1 from RVSD Co SIP.
MD 1113 Architectural Coatings RuleUpdate SIP to current. Includes removal of SC Rule 109, SC Rule 481, and SC Rule 1151 from RVSD Co SIP.
MD 1114 Wood Products Coating Operations
Analyze PM Measures for cost effectiveness. Amend rule if necessary. Update SIP to current. Includes removal of SC Rule 109, SC Rule 481, SC Rule 1104, SC Rule 1106, SC Rule 1106.1 and SC Rule 1136 from RVSD Co SIP.
MD 1115 Metal Parts & Products Coating OperationsUpdate SIP to current. Includes removal of SC Rule 109, SC Rule 481, SC Rule 1106, SC Rule 1106.1, SC Rule 1107, SC Rule 1125 and SC Rule 1126 from RVSD Co SIP.
MD 1116 Automotive Refinishing OperationsUpdate SIP to current. Includes removal of SC Rule 109, SC Rule 481, SC Rule 1106, SC Rule 1106.1, SC Rule 1115 and SC Rule 1151 from RVSD Co SIP.
MD 1117Graphic Arts and Paper, Film, Foil and Fabric Coatings
Update SIP to current. Includes removal of SC Rule 1128, SC Rule 1130, SC Rule 1130.1 and SC Rule 1145 from RVSD Co SIP.
MD 1118
Aerospace Vehicle Parts and Products Coating Operations
Update rule to reflect SCM, MACT, and NESHAP requirements. Remove averaging provisions. Update SIP to current. Includes removal of SC Rule 1124 from RVSD Co SIP. CEQA IS/Neg Dec.
MD 1126 Solid Waste Landfills (VOC)Analyze PM Measures for cost effectiveness. Amend rule if necessary. Update SIP to current. Includes removal of SC Rule 1150.1 from RVSD Co SIP.
MD 1133 Composting and Related OperationsRescind and possibly re-adopt rule pursuant to Peremptory Writ of Mandate Case No. CIV BS800976
MD 1157 Boilers & Process Heaters
Analyze PM Measures for cost effectiveness. Amend rule if necessary. Update SIP to current. Includes removal of SC Rule 1121, SC Rule 1146 and SC Rule 1146.1 from RVSD Co SIP.
MD 1158 Electric Utility OperationsAnalyze PM Measures for cost effectiveness. Amend rule if necessary. Update SIP to current. Includes removal of SC Rule 1135 from RVSD Co SIP.
MD 1159 Stationary Gas Turbines Update SIP to current. Includes removal of SC Rule 1134 from RVSD Co SIP.
This calendar is produced to satisfy the requirements of Health Safety Code 40923(a). Inclusion on this list does not necessarily indicate that a particular action or any action at all will be taken on the item. 5/7/2015

Master Rule Development Calendar 2015
District Rule # Rule Title Action Considered
MD 1160 Internal Combustion Engines
Analyze PM Measures for cost effectiveness. Update for RACT. Conform to ATCM, NESHAP and NSPS. Update SIP to current. Includes removal of SC Rule 1110.1, SC Rule 1110.2 and SC Rule 1110 from RVSD Co SIP.
MD 1160.1Internal Combustion Engines in Agricultural Operations
Update SIP to current. Includes removal of SC Rule 1110.1, SC Rule 1110.2 and SC Rule 1110 from RVSD Co SIP.
MD 1161 Cement Kilns
Analyze PM Measures for cost effectiveness. Amend rule if necessary. Update SIP to current. Includes removal of SC Rule 1112 and SC Rule 1112.1 from RVSD Co SIP. Update for RACT.
MD 1162 Polyester Resin Operations Update SIP to current. Includes removal of SC Rule 1141 from RVSD Co SIP.MD 1165 Glass Melting Furnaces Update SIP to current. Includes removal of SC Rule 1117 from RVSD Co SIP.
MD 1186 Agriculture Large Confined Animal Facility
New Rule to conform with with Agricultural Confined Animal Facilities, Agricultural Fugitive Dust, Agricultural Best Management Practices, Agricultural IC Engines, and Rule 219 proposed amendments. SJVAPCD Rule is now considered RACT for this source. 77 FR 2228 1/17/12.
MD 1300 General Provide cross references to Reg XVI.MD 1302 Procedure Provide cross reference to Reg XVI.
MD 1320New Source Review for Toxic Air Contaminants Update cross references with adoption of PSD rules.
MD 2001 Transportation Conformity Amend to conform with USEPA regulations.MD 2003 Consultation procedures Rescind if MOU signed and approved into SIP.MD New Commercial Charbroiling Analyze PM Measures for cost effectiveness. Add rule if necessary.MD New Residential Water Heaters Analyze PM Measures for cost effectiveness. Add rule if necessary. MD New Furnaces Analyze PM Measures for cost effectiveness. Add rule if necessary.MD New Soil Decontamination Analyze PM Measures for cost effectiveness. Add rule if necessary.MD New Woodworking Operations Analyze PM Measures for cost effectiveness. Add rule if necessary.MD New Lawnmower Buy Back Program Analyze PM Measures for cost effectiveness. Add rule if necessary.MD New Large Spray Booths Analyze PM Measures for cost effectiveness. Add rule if necessary.MD New Wood Burning Fireplaces Analyze PM Measures for cost effectiveness. Add rule if necessary.MD Notice Notification ATCM's and MACT Standards Review annually and update as necessary.
MD Plan State Triannial UpdateUpdate for latest planning assumptions (Local facility data, regional transportation data & statewide growth data)
MD Plan PM10 Attainment & Maintainence Plan Update to comply with USEPA request.
MD Plan ROP Milestone UpldateUpdate for latest planning assumptions (Local facility data, regional transportation data & statewide growth data)
MD Reg 4 Regulation IV - ProhibitionsRescission of old SCAQMD rules in SIP for Riverside County and replacement by 8hr O3 adopted Fed Negative Declarations.
This calendar is produced to satisfy the requirements of Health Safety Code 40923(a). Inclusion on this list does not necessarily indicate that a particular action or any action at all will be taken on the item. 5/7/2015

Master Rule Development Calendar 2015
District Rule # Rule Title Action Considered
MD Reg 7 Air Pollution Emergency Contingency Actions Consolidate regulation into single rule.
MD Reg 11 Regulation XI - Source Specific StandardsRescission of old SCAQMD rules in SIP for Riverside County and replacement by 8hr O3 adopted Fed Negative Declarations.
MD Reg 12 Federal Operating Permits Modify to implement PSD Program.MD Reg 16 PSD Adopt to implement PSD Program.MD Reg 20 Conformity Modify to implement PSD Program.
MD FNDs Re-adopt Various FNDs
Re-adopt various Federal Negative Declarations for sources which are not present in the District: SC Rule 1103; SC Rule 1105; SC Rule 1119; SC Rule 1123; SC Rule 1141.1; SC Rule 1142; SC Rule 1148; SC Rule 1158; SC Rule 1159; SC Rule 1164; SC Rule 1175; SC Rule 1176.
This calendar is produced to satisfy the requirements of Health Safety Code 40923(a). Inclusion on this list does not necessarily indicate that a particular action or any action at all will be taken on the item. 5/7/2015

Butterfield and Sentinel Quarries Expansion Air Quality and Greenhouse Gas Impact Assessment San Bernardino National Forest October 25, 2017
OM01_SB-AQHRCCIA_fnl.docx Sespe Consulting, Inc.
Appendix F: MDAQMD Mineral Industry Emissions Inventory Guidelines
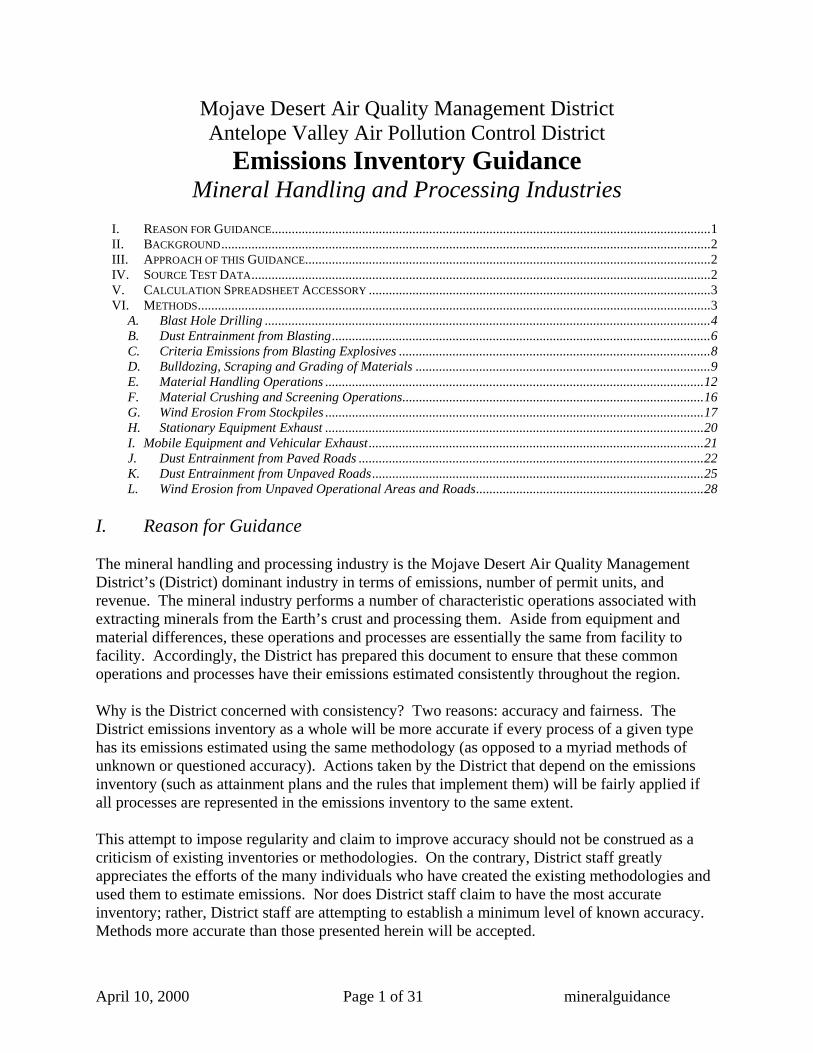
Mojave Desert Air Quality Management District Antelope Valley Air Pollution Control District
Emissions Inventory Guidance Mineral Handling and Processing Industries
I. REASON FOR GUIDANCE...................................................................................................................................1 II. BACKGROUND..................................................................................................................................................2 III. APPROACH OF THIS GUIDANCE.........................................................................................................................2 IV. SOURCE TEST DATA.........................................................................................................................................2 V. CALCULATION SPREADSHEET ACCESSORY ......................................................................................................3 VI. METHODS.........................................................................................................................................................3
A. Blast Hole Drilling .....................................................................................................................................4 B. Dust Entrainment from Blasting.................................................................................................................6 C. Criteria Emissions from Blasting Explosives .............................................................................................8 D. Bulldozing, Scraping and Grading of Materials ........................................................................................9 E. Material Handling Operations .................................................................................................................12 F. Material Crushing and Screening Operations..........................................................................................16 G. Wind Erosion From Stockpiles .................................................................................................................17 H. Stationary Equipment Exhaust .................................................................................................................20 I. Mobile Equipment and Vehicular Exhaust....................................................................................................21 J. Dust Entrainment from Paved Roads .......................................................................................................22 K. Dust Entrainment from Unpaved Roads...................................................................................................25 L. Wind Erosion from Unpaved Operational Areas and Roads....................................................................28
I. Reason for Guidance The mineral handling and processing industry is the Mojave Desert Air Quality Management District’s (District) dominant industry in terms of emissions, number of permit units, and revenue. The mineral industry performs a number of characteristic operations associated with extracting minerals from the Earth’s crust and processing them. Aside from equipment and material differences, these operations and processes are essentially the same from facility to facility. Accordingly, the District has prepared this document to ensure that these common operations and processes have their emissions estimated consistently throughout the region. Why is the District concerned with consistency? Two reasons: accuracy and fairness. The District emissions inventory as a whole will be more accurate if every process of a given type has its emissions estimated using the same methodology (as opposed to a myriad methods of unknown or questioned accuracy). Actions taken by the District that depend on the emissions inventory (such as attainment plans and the rules that implement them) will be fairly applied if all processes are represented in the emissions inventory to the same extent. This attempt to impose regularity and claim to improve accuracy should not be construed as a criticism of existing inventories or methodologies. On the contrary, District staff greatly appreciates the efforts of the many individuals who have created the existing methodologies and used them to estimate emissions. Nor does District staff claim to have the most accurate inventory; rather, District staff are attempting to establish a minimum level of known accuracy. Methods more accurate than those presented herein will be accepted.
April 10, 2000 Page 1 of 31 mineralguidance

II. Background Federal and State law requires air districts to prepare and maintain as accurate and current an emissions inventory as possible. This inventory must include criteria (oxides of nitrogen, volatile organic compounds, carbon monoxide, oxides of sulfur, particulate matter, and lead), hazardous, and toxic air pollutants. The emissions inventory is used to determine attainment strategies, progress towards clean air goals, and air quality relative to other districts. III. Approach of this Guidance This guidance will present methodologies for a large number of emissions-generating operations and processes. The methodologies will be provided with several levels of increasing complexity and accuracy; each level of increased complexity will require greater input (and effort) from the user. In practice, this means that an equation is provided for each process, with a variety of default equation inputs specified. At the lowest level of complexity, an emission factor is specified that can simply be multiplied by a process activity rate. The greatest level of complexity and accuracy involves the use of data from a source test (if feasible). Of course, the District would prefer all emission inventories to be based on source test results or continuous emission monitor (CEMS) data. This is not feasible due to obvious cost and time constraints. However, a properly performed and documented source test (and/or CEMS data) provides the greatest accuracy possible, and represents a method that will always be accepted in lieu of a methodology presented herein. Other methods may be accepted, if they have been documented and approved by the District. This guidance document is accompanied by a set of electronic spreadsheets that contains each of the equations used in these methodologies. This allows the user to ‘plug-in’ her local values and calculates her local result. IV. Source Test Data For a source test to be used to generate an emission factor, it must include additional emissions- and activity-related information. The following can be considered required supplemental elements for a source test report that is submitted to support or generate a set of equipment-specific emission factors. A. Process flow diagram that specifies pickup points B. Control equipment description that defines operational parameters during test (such as
water use or pressure drop). C. Throughput during test in hourly units (or shorter term units), including a discussion of
maximum design throughput, average throughput, and actual throughput during the test. D. Exhaust concentrations and mass emission rates, including front half, back half, and total
April 10, 2000 Page 2 of 31 mineralguidance

emissions. The concentrations and mass rates should identify values for total hydrocarbon, reactive organic gases and volatile organic compounds. The concentrations and mass rates should also identify values for total suspended particulate, particulate 10 microns and less, and particulate 2.5 microns and less.
V. Calculation Spreadsheet Accessory An accessory spreadsheet has been prepared for this document. The spreadsheet contains each of the equations referenced in the guidance. The equations are programmed into input and output spreadsheet cells to assist the user. The spreadsheet was prepared in Microsoft Excel, and two versions are available. The spreadsheet is titled “Mineral Guidance Equations” and is in Microsoft Excel 97 format. The version titled “Mineral Guidance Equations 95” is in Microsoft Excel 95 format. The spreadsheet is in the format of a multiple-worksheet workbook, with a separate worksheet for each method (the worksheets have individual tabs at the lower left). Those values which can be entered by the user are defined in dark blue, and the cells in which the values can be typed have a turquoise background. Selected turquoise cells may have a value pre-entered; these values are the District default values, and can be replaced by a known local value. After all necessary turquoise cells have a value, the results of the equation are automatically calculated (the user may need to hit the ‘enter’ key after entering the last value). In each case the calculated values are displayed in units of pounds and tons of the applicable pollutants. Please contact District emissions inventory staff if you encounter any problems or errors with the calculation spreadsheet accessory. VI. Methods Each method will be presented in the same format. The method will begin with a detailed discussion of the processes and operations for which it is an applicable emissions estimation methodology. The method itself will then be provided, beginning with the most conservative and least complex version, and followed by increasingly complex and data-intensive versions. Each method will culminate with the complete equation (where possible), for which the user has the option of providing all inputs. The District has prepared tables calculating likely values for various common inputs. Each method contains a discussion of applicable control strategies (where possible), and appropriate calculation methods for those. Each method concludes with a source reference.
April 10, 2000 Page 3 of 31 mineralguidance

A. Blast Hole Drilling This procedure applies to the drilling of charge holes for open pit or open shelf blasting. Note that the activity input for the equation requires the total amount of material shifted, including, topsoil, overburden and ore. Blast hole drilling is often performed by portable internal combustion engine powered drills; exhaust emissions from this equipment are not accounted for by this method. Such exhaust emissions should be estimated using methods presented elsewhere. “Shifted” is defined as loosened sufficiently to require removal or further handling. Least Complex: Assume negligible particulate emissions from blast hole drilling. This can only be assumed by facilities shifting less than 50,000 tons per year of ore, overburden and topsoil combined. Intermediate Complexity: This method employs a conservative factor times the total amount of material shifted by blasting.
QEE f E = Particulate matter emissions rate in pounds per year Ef = Emission factor in units of pounds of particulate per ton shifted by blasting Q = Amount of material of all types shifted by blasting during the year in tons
TSP Ef = 0.001 pounds/ton PM10 Ef = 0.0008 pounds/ton PM2.5 Ef = 0.0008 pounds/ton
neralguidance
Activity in tons (yearly) 50000 75000 100000 125000 150000 175000 200000 225000 250000TSP Emissions (tons) 0.03 0.04 0.05 0.06 0.08 0.09 0.10 0.11 0.13PM10 Emissions (tons) 0.02 0.03 0.04 0.05 0.06 0.07 0.08 0.09 0.10PM2.5 Emissions (tons) 0.02 0.03 0.04 0.05 0.06 0.07 0.08 0.09 0.10
Blast Hole Drilling Table 1 -- Blasting Activity Based Emissions
Most Complex: This method requires an estimate of the number of shot holes drilled on an annual basis.
NEE f E = Particulate matter emissions rate in pounds per year E = Emission factor in units of pounds of particulate per hole drilled fN = Number of blast holes drilled per year
April 10, 2000 Page 4 of 31 mi

TSP Ef = 1.3 pounds/hole PM10 Ef = 0.68 pounds/hole PM2.5 Ef = 0.68 pounds/hole
neralguidance
Number of Holes (yearly) 100 200 300 400 500 600 700 800 900 1000 1100 1200 1300 1400TSP Emissions (tons) 0.07 0.13 0.20 0.26 0.33 0.39 0.46 0.52 0.59 0.65 0.72 0.78 0.85 0.91PM10 Emissions (tons) 0.03 0.07 0.10 0.14 0.17 0.20 0.24 0.27 0.30 0.34 0.37 0.41 0.44 0.47PM2.5 Emissions (tons) 0.03 0.07 0.10 0.14 0.17 0.20 0.24 0.27 0.30 0.34 0.37 0.41 0.44 0.47
Blast Hole Drilling Table 2 -- Drilling Activity Based Emissions
Control Techniques: None are presently quantified. The methods assume a wet drilling operation. Enclosures, air return or other control strategies can be employed for an estimated control efficiency, subject to District review and approval. Source: The intermediate complexity method employs a low confidence emission factor presented in Chapter 15 of the Air & Waste Management Association Air Pollution Engineering Manual, 1992 edition (Stone and Quarrying Processing). The high complexity method employs a relatively highly rated emission factor derived from overburden drilling operations at western surface coal mines presented in §11.9 of USEPA’s AP-42 (January 1995 reformatted version).
April 10, 2000 Page 5 of 31 mi
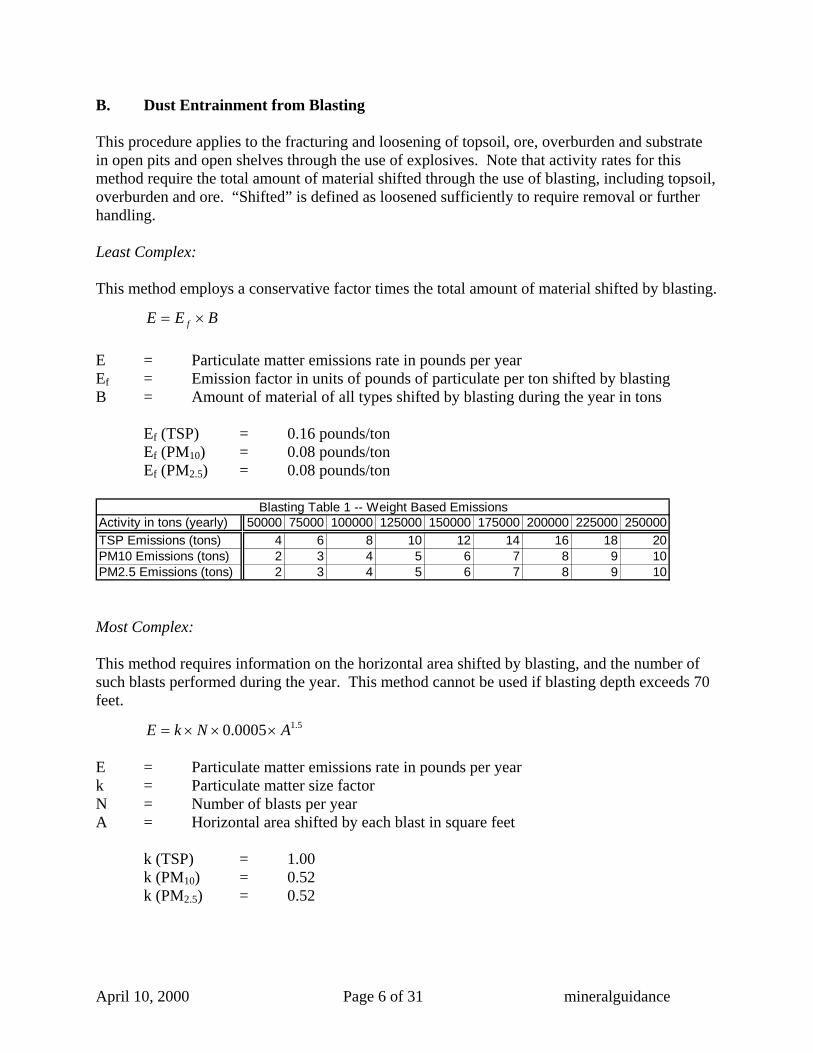
B. Dust Entrainment from Blasting This procedure applies to the fracturing and loosening of topsoil, ore, overburden and substrate in open pits and open shelves through the use of explosives. Note that activity rates for this method require the total amount of material shifted through the use of blasting, including topsoil, overburden and ore. “Shifted” is defined as loosened sufficiently to require removal or further handling. Least Complex: This method employs a conservative factor times the total amount of material shifted by blasting.
BEE f E = Particulate matter emissions rate in pounds per year Ef = Emission factor in units of pounds of particulate per ton shifted by blasting B = Amount of material of all types shifted by blasting during the year in tons
Ef (TSP) = 0.16 pounds/ton Ef (PM10) = 0.08 pounds/ton Ef (PM2.5) = 0.08 pounds/ton
neralguidance
Activity in tons (yearly) 50000 75000 100000 125000 150000 175000 200000 225000 250000TSP Emissions (tons) 4 6 8 10 12 14 16 18 20PM10 Emissions (tons) 2 3 4 5 6 7 8 9 10PM2.5 Emissions (tons) 2 3 4 5 6 7 8 9 10
Blasting Table 1 -- Weight Based Emissions
Most Complex: This method requires information on the horizontal area shifted by blasting, and the number of such blasts performed during the year. This method cannot be used if blasting depth exceeds 70 feet.
5.10005.0 ANkE E = Particulate matter emissions rate in pounds per year k = Particulate matter size factor N = Number of blasts per year A = Horizontal area shifted by each blast in square feet
k (TSP) = 1.00 k (PM10) = 0.52 k (PM2.5) = 0.52
April 10, 2000 Page 6 of 31 mi

1 2 3 4 5 6 71000 0.41 0.82 1.23 1.64 2.06 2.47 2.881500 0.76 1.51 2.27 3.02 3.78 4.53 5.292000 1.16 2.33 3.49 4.65 5.81 6.98 8.142500 1.63 3.25 4.88 6.50 8.12 9.75 11.383000 2.14 4.27 6.41 8.54 10.68 12.82 14.953500 2.69 5.38 8.08 10.77 13.46 16.15 18.844000 3.29 6.58 9.87 13.16 16.44 19.73 23.02
Typical Shelf Area
Blasting Table 2 -- Area Based TSP Emissions in tons per yearNumber of Weekly Blasts
1 2 3 4 5 6 71000 0.21 0.43 0.64 0.86 1.07 1.28 1.501500 0.39 0.79 1.18 1.57 1.96 2.36 2.752000 0.60 1.21 1.81 2.42 3.02 3.63 4.232500 0.84 1.69 2.54 3.38 4.23 5.07 5.923000 1.11 2.22 3.33 4.44 5.55 6.66 7.783500 1.40 2.80 4.20 5.60 7.00 8.40 9.804000 1.71 3.42 5.13 6.84 8.55 10.26 11.97
Blasting Table 3 -- Area Based PM10 and PM2.5 Emissions in tpy
Typical Shelf AreaNumber of Weekly Blasts
Control Techniques: None are presently quantified. The method does not assume any emission reducing procedures. Certain control techniques are available, such as blast blankets. Control strategies can be employed for an estimated control efficiency, subject to District review and approval. Source: The most complex method employs a poorly rated emission factor derived from blasting operations at western surface coal mines presented in §11.9 of USEPA’s AP-42 (January 1995 reformatted version).
April 10, 2000 Page 7 of 31 mineralguidance

C. Criteria Emissions from Blasting Explosives This procedure estimates the criteria pollutants generated by the detonation of explosives for blasting. This is a “least complex” method that multiplies an emission factor by the total amount of explosives detonated in a year.
AEE f E = Pollutant emissions rate in pounds per year Ef = Emission factor in units of pounds of pollutant per ton of explosive detonated A = Amount of explosive detonated throughout the year in tons
Explosive Type Composition CO NOx TOGBlack Powder Potassium nitrate, charcoal and sulfur 170 --- 4.2Smokeless Powder Nitrocellulose 77 --- 1.1Dynamite, straight Nitroglycerine, sodium nitrate, wood pulp, calcium carbonate 281 --- 2.5Dynamite, ammonia Nitroglycerine, ammonium nitrate, sodium nitrate, wood pulp 63 --- 1.3Dynamite, gelatin Nitroglycerine 104 53 0.7ANFO Ammonium nitrate, fuel oil 67 17 ---TNT Trinitrotoluene 796 --- 14.3RDX Cyclotrimethylenetrinitroamine 196 --- ---PETN Pentaerythritol tetranitrate 297 --- ---
Explosives Table 1 -- Emission Factors
Note that VOC emissions are considered negligible for all explosives. TSP, PM10 and PM2.5 emissions are subsumed within the dust entrainment estimations. Source: This method is presented in §13.3 of USEPA’s AP-42 (January 1995 reformatted version).
April 10, 2000 Page 8 of 31 mineralguidance

D. Bulldozing, Scraping and Grading of Materials This procedure applies to the bulldozing, scraping and grading of topsoil, overburden, waste material, and ore through the use of heavy equipment such as bulldozers, graders, scrapers, etc. This procedure does not apply to the lifting and dumping of said materials; such lifting and dumping emissions should be estimated using methods presented elsewhere. Least Complex: This method applies a conservative factor times the annual hours of operation.
TEE f E = Particulate matter emissions rate in pounds per year Ef = Emission factor in units of pounds of particulate per hour of operation T = Annual activity in hours
TSP Ef = 886 pounds/hour PM10 Ef = 431 pounds/hour PM2.5 Ef = 132 pounds/hour
(These emission factors were calculated using the defaults given in the Most Complex section)
Activity in hours (yearly) 1040 2080 2920 6240 8760TSP Emissions (tons) 460.72 921.44 1293.56 2764.32 3880.68PM10 Emissions (tons) 224.12 448.24 629.26 1344.72 1887.78PM2.5 Emissions (tons) 68.64 137.28 192.72 411.84 578.16
Bulldozing Table 1 - Time Based Emissions
Most Complex: This method presents an equation requiring inputs for the moisture content and silt content of the material being moved, as well as an estimate of the total amount of material moved.
4.1
5.1
76.2M
skE f TEE f
E = Particulate matter emissions rate in pounds per year E = Emission factor in pounds per hour of operation fT = Extent of material moving operation in hours per year k = Particulate aerodynamic factor (see below) s = Average silt content in percent (%) M = Average moisture content of material in percent (%)
k (TSP) = 0.74 (dimensionless) k (PM10) = 0.36 k (PM2.5) = 0.11
April 10, 2000 Page 9 of 31 mineralguidance
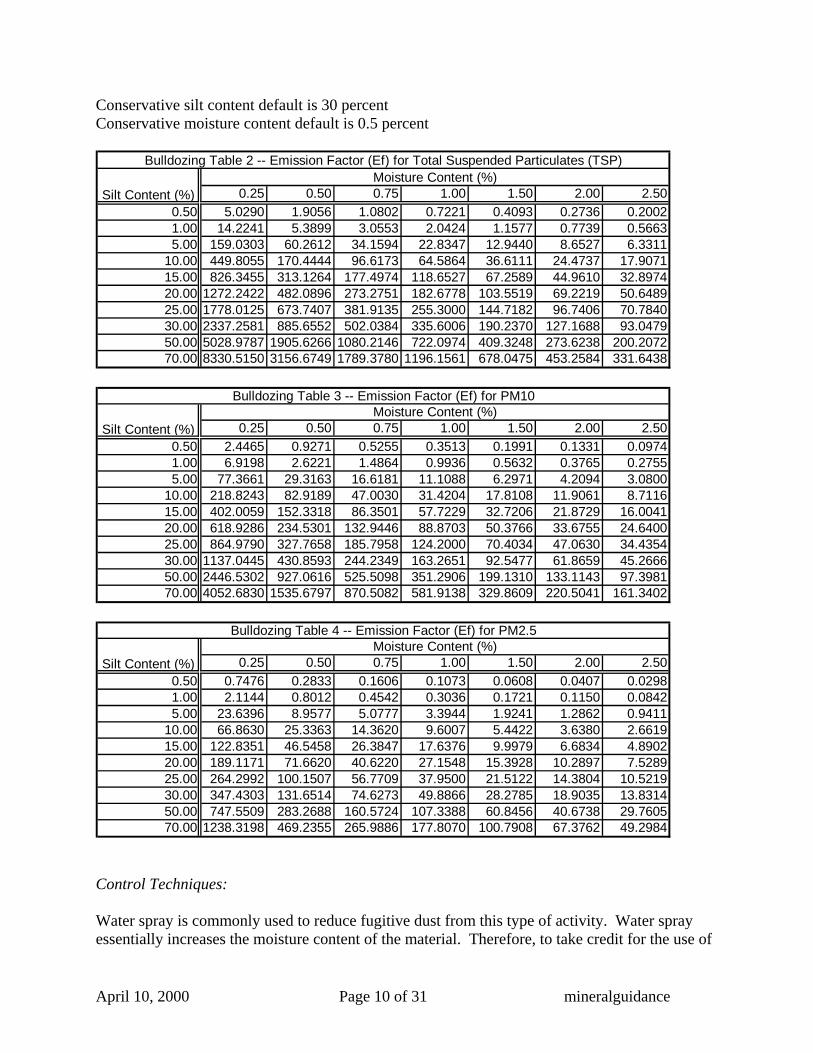
Conservative silt content default is 30 percent Conservative moisture content default is 0.5 percent
Moisture Content (%)0.25 0.50 0.75 1.00 1.50 2.00 2.50
0.50 5.0290 1.9056 1.0802 0.7221 0.4093 0.2736 0.20021.00 14.2241 5.3899 3.0553 2.0424 1.1577 0.7739 0.56635.00 159.0303 60.2612 34.1594 22.8347 12.9440 8.6527 6.3311
10.00 449.8055 170.4444 96.6173 64.5864 36.6111 24.4737 17.907115.00 826.3455 313.1264 177.4974 118.6527 67.2589 44.9610 32.897420.00 1272.2422 482.0896 273.2751 182.6778 103.5519 69.2219 50.648925.00 1778.0125 673.7407 381.9135 255.3000 144.7182 96.7406 70.784030.00 2337.2581 885.6552 502.0384 335.6006 190.2370 127.1688 93.047950.00 5028.9787 1905.6266 1080.2146 722.0974 409.3248 273.6238 200.207270.00 8330.5150 3156.6749 1789.3780 1196.1561 678.0475 453.2584 331.6438
Silt Content (%)
Bulldozing Table 2 -- Emission Factor (Ef) for Total Suspended Particulates (TSP)
Moisture Content (%)0.25 0.50 0.75 1.00 1.50 2.00 2.50
0.50 2.4465 0.9271 0.5255 0.3513 0.1991 0.1331 0.09741.00 6.9198 2.6221 1.4864 0.9936 0.5632 0.3765 0.27555.00 77.3661 29.3163 16.6181 11.1088 6.2971 4.2094 3.0800
10.00 218.8243 82.9189 47.0030 31.4204 17.8108 11.9061 8.711615.00 402.0059 152.3318 86.3501 57.7229 32.7206 21.8729 16.004120.00 618.9286 234.5301 132.9446 88.8703 50.3766 33.6755 24.640025.00 864.9790 327.7658 185.7958 124.2000 70.4034 47.0630 34.435430.00 1137.0445 430.8593 244.2349 163.2651 92.5477 61.8659 45.266650.00 2446.5302 927.0616 525.5098 351.2906 199.1310 133.1143 97.398170.00 4052.6830 1535.6797 870.5082 581.9138 329.8609 220.5041 161.3402
Silt Content (%)
Bulldozing Table 3 -- Emission Factor (Ef) for PM10
Moisture Content (%)0.25 0.50 0.75 1.00 1.50 2.00 2.50
0.50 0.7476 0.2833 0.1606 0.1073 0.0608 0.0407 0.02981.00 2.1144 0.8012 0.4542 0.3036 0.1721 0.1150 0.08425.00 23.6396 8.9577 5.0777 3.3944 1.9241 1.2862 0.9411
10.00 66.8630 25.3363 14.3620 9.6007 5.4422 3.6380 2.661915.00 122.8351 46.5458 26.3847 17.6376 9.9979 6.6834 4.890220.00 189.1171 71.6620 40.6220 27.1548 15.3928 10.2897 7.528925.00 264.2992 100.1507 56.7709 37.9500 21.5122 14.3804 10.521930.00 347.4303 131.6514 74.6273 49.8866 28.2785 18.9035 13.831450.00 747.5509 283.2688 160.5724 107.3388 60.8456 40.6738 29.760570.00 1238.3198 469.2355 265.9886 177.8070 100.7908 67.3762 49.2984
Silt Content (%)
Bulldozing Table 4 -- Emission Factor (Ef) for PM2.5
Control Techniques: Water spray is commonly used to reduce fugitive dust from this type of activity. Water spray essentially increases the moisture content of the material. Therefore, to take credit for the use of
April 10, 2000 Page 10 of 31 mineralguidance
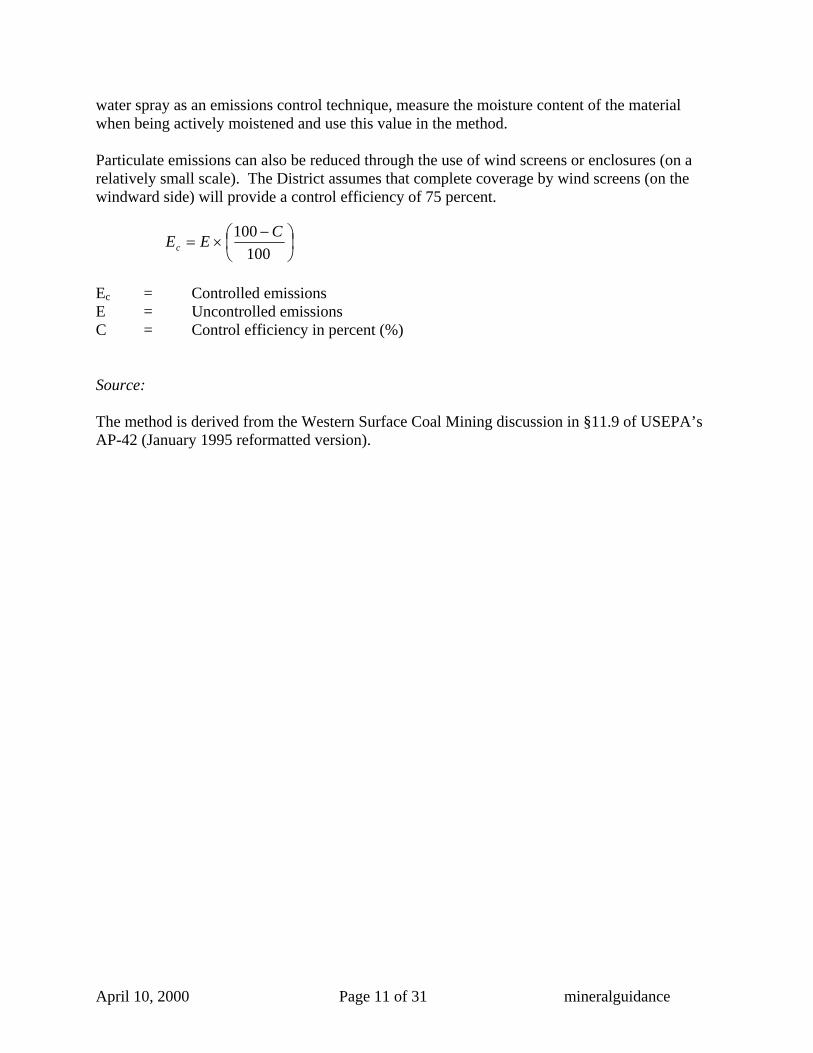
water spray as an emissions control technique, measure the moisture content of the material when being actively moistened and use this value in the method. Particulate emissions can also be reduced through the use of wind screens or enclosures (on a relatively small scale). The District assumes that complete coverage by wind screens (on the windward side) will provide a control efficiency of 75 percent.
100
100 CEEc
Ec = Controlled emissions E = Uncontrolled emissions C = Control efficiency in percent (%) Source: The method is derived from the Western Surface Coal Mining discussion in §11.9 of USEPA’s AP-42 (January 1995 reformatted version).
April 10, 2000 Page 11 of 31 mineralguidance

E. Material Handling Operations This procedure applies to the handling of materials in batches and conveyor belts, including loading, unloading, transferring and dropping. “Materials” include topsoil, overburden, waste material and ore. This procedure specifically applies to the operation of heavy equipment such as front end loaders and shovels as well as conveyor belts. This procedure is intended to be applied to each material handling point. This means that each batch drop should be counted. For example, a loader dropping a quantity of material into a temporary storage pile, then dropping into a dump truck, then the dump truck dumping into a long term storage pile would be three separate operations which should be separately accounted for. Least Complex: This method multiplies a conservative factor by the total amount of material moved in a year.
QEE f E = Particulate matter emissions rate in pounds per year Ef = Emission factor in units of pounds of particulate per ton handled Q = Quantity of material handled per year in tons
TSP Ef = 0.029 pounds/ton PM10 Ef = 0.014 pounds/ton PM2.5 Ef = 0.004 pounds/ton
(These emission factors were calculated using the defaults given in the Most Complex section)
Activity in tons (yearly) 10000 20000 30000 40000 50000 60000 70000 80000 90000 100000 110000TSP Emissions (tons) 0.15 0.29 0.44 0.58 0.73 0.87 1.02 1.16 1.31 1.45 1.60PM10 Emissions (tons) 0.07 0.14 0.21 0.28 0.35 0.42 0.49 0.56 0.63 0.70 0.77PM2.5 Emissions (tons) 0.06 0.11 0.17 0.22 0.28 0.33 0.39 0.44 0.50 0.55 0.61
Material Handling Table 1 - Weight Based Emissions
Most Complex: This method presents an equation requiring inputs for the mean wind speed at the handling site, moisture content of the material being moved, and an estimate of the total amount of material handled.
4.1
3.1
2
50032.0
M
U
kE fQEE f
E = Particulate matter emissions rate in pounds per year E = Emission factor in pounds per ton handled fQ = Quantity of material handled per year in tons k = Particulate aerodynamic factor (see below)
April 10, 2000 Page 12 of 31 mineralguidance
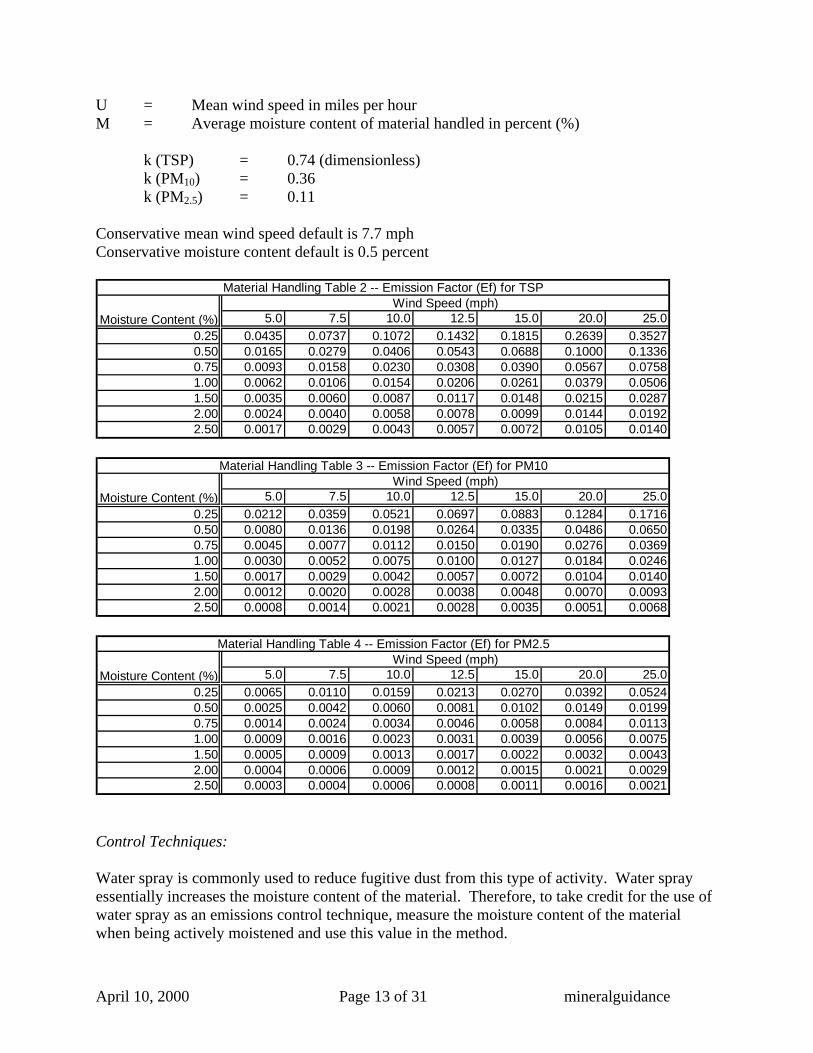
neralguidance
= Average moisture content of material handled in percent (%)
sionless)
k (PM2.5) = 0.11
onservative moisture content default is 0.5 percent
e of re content of the material
2.50 0.0017 0.0029 0.0043 0.0057 0.0072 0.0105 0.0140
U = Mean wind speed in miles per hour M
k (TSP) = 0.74 (dimenk (PM10) = 0.36
Conservative mean wind speed default is 7.7 mph C
5.0 7.5 10.0 12.5 15.0 20.0 25.00.25 0.0435 0.0737 0.1072 0.1432 0.1815 0.2639 0.35270.50 0.0165 0.0279 0.0406 0.0543 0.0688 0.1000 0.13360.75 0.0093 0.0158 0.0230 0.0308 0.0390 0.0567 0.07581.00 0.0062 0.0106 0.0154 0.0206 0.0261 0.0379 0.05061.50 0.0035 0.0060 0.0087 0.0117 0.0148 0.0215 0.02872.00 0.0024 0.0040 0.0058 0.0078 0.0099 0.0144 0.0192
Moisture Content (%)
Material Handling Table 2 -- Emission Factor (Ef) for TSPWind Speed (mph)
5.0 7.5 10.0 12.5 15.0 20.0 25.00.25 0.0212 0.0359 0.0521 0.0697 0.0883 0.1284 0.17160.50 0.0080 0.0136 0.0198 0.0264 0.0335 0.0486 0.06500.75 0.0045 0.0077 0.0112 0.0150 0.0190 0.0276 0.03691.00 0.0030 0.0052 0.0075 0.0100 0.0127 0.0184 0.02461.50 0.0017 0.0029 0.0042 0.0057 0.0072 0.0104 0.01402.00 0.0012 0.0020 0.0028 0.0038 0.0048 0.0070 0.0093
Material Handling Table 3 -- Emission Factor (Ef) for PM10Wind Speed (mph)
Moisture Content
2.50 0.0008 0.0014 0.0021 0.0028 0.0035 0.0051 0.0068
(%)
5.0 7.5 10.0 12.5 15.0 20.0 25.00.25 0.0065 0.0110 0.0159 0.0213 0.0270 0.0392 0.05240.50 0.0025 0.0042 0.0060 0.0081 0.0102 0.0149 0.01990.75 0.0014 0.0024 0.0034 0.0046 0.0058 0.0084 0.01131.00 0.0009 0.0016 0.0023 0.0031 0.0039 0.0056 0.00751.50 0.0005 0.0009 0.0013 0.0017 0.0022 0.0032 0.00432.00 0.0004 0.0006 0.0009 0.0012 0.0015 0.0021 0.0029
Wind Speed (mph)Moisture Content
2.50 0.0003 0.0004 0.0006 0.0008 0.0011 0.0016 0.0021
(%)
Material Handling Table 4 -- Emission Factor (Ef) for PM2.5
Control Techniques: Water spray is commonly used to reduce fugitive dust from this type of activity. Water spray essentially increases the moisture content of the material. Therefore, to take credit for the uswater spray as an emissions control technique, measure the moistuwhen being actively moistened and use this value in the method.
April 10, 2000 Page 13 of 31 mi
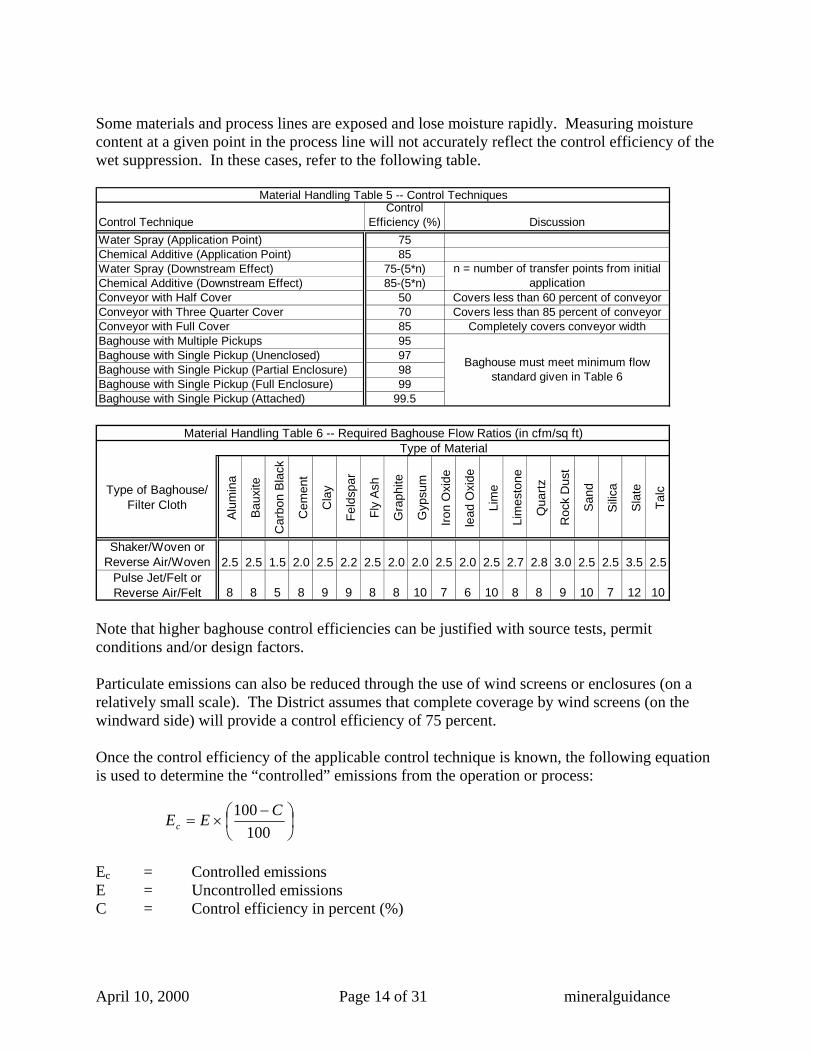
neralguidance
re rapidly. Measuring moisture ontent at a given point in the process line will not accurately reflect the control efficiency of the
ote that higher baghouse control efficiencies can be justified with source tests, permit
d screens or enclosures (on a latively small scale). The District assumes that complete coverage by wind screens (on the
e applicable control technique is known, the following equation is used to d lled” emissions from the operation or process:
= Uncontrolled emissions = Control efficiency in percent (%)
Some materials and process lines are exposed and lose moistucwet suppression. In these cases, refer to the following table.
Control TechniqueControl
Efficiency (%) DiscussionWater Spray (Application Point) 75Chemical Additive (Application Point) 85Water Spray (Downstream Effect) 75-(5*n)Chemical Additive (Downstream Effect) 85-(5*n)Conveyor with Half Cover 50 Covers less than 60 percent of conveyorConveyor with Three Quarter Cover 70 Covers less than 85 percent of conveyorConveyor with Full Cover 85 Completely covers conveyor widthBaghouse with Multiple Pickups 95Baghouse with Single Pickup (Unenclosed) 97
aghouse with Single Pickup (Partial Enclosure) 98
Material Handling Table 5 -- Control Techniques
n = number of transfer points from initial application
Baghouse must meet minimum flow BBaghouse with Single Pickup (Full Enclosure) 99Baghouse with Single Pickup (Attached) 99.5
standard given in Table 6
Type of Baghouse/ Filter Cloth
Alum
ina
Baux
ite
Car
bon
Blac
k
Cem
ent
Cla
y
Feld
spar
Fly
Ash
Gra
phite
Gyp
sum
Iron
Oxi
de
lead
Oxi
de
Lim
e
Lim
esto
ne
Qua
rtz
Roc
k D
ust
Sand
Silic
a
Slat
e
Talc
Shaker/Woven or Reverse Air/Woven 2.5 2.5 1.5 2.0 2.5 2.2 2.5 2.0 2.0 2.5 2.0 2.5 2.7 2.8 3.0 2.5 2.5 3.5 2.5
Type of MaterialMaterial Handling Table 6 -- Required Baghouse Flow Ratios (in cfm/sq ft)
Nconditions and/or design factors. Particulate emissions can also be reduced through the use of winrewindward side) will provide a control efficiency of 75 percent. Once the control efficiency of th
etermine the “contro
Ec = Controlled emissions EC
100
EEc
100 C
Pulse Jet/Felt or Reverse Air/Felt 8 8 5 8 9 9 8 8 10 7 6 10 8 8 9 10 7 12 10
April 10, 2000 Page 14 of 31 mi

Source: The method is presented in the Aggregate Handling and Storage Pile discussion in §13.2.4 of USEPA’s AP-42 (January 1995).
April 10, 2000 Page 15 of 31 mineralguidance

F. Material Crushing and Screening Operations This procedure applies to the crushing and screening of materials. This is effectively a “least complex” method that multiplies an emission factor by annual throughput. This method applies to each occurrence of a crushing or screening operation; in a process line with primary crushing and a screen, secondary crushing and a screen, and tertiary crushing followed by a screen, this method should be applied six times (to six potentially different throughputs).
TEE f E = Particulate matter emissions rate in pounds per year Ef = Emission factor in units of pounds of particulate per ton of throughput T = Throughput of material processed per year in tons
Note: “neg” indicates negligible emissions.
Processing Device TSP PM10 PM2.5Dry Primary or Secondary Crushing 0.280 0.017 0.005Wet Primary or Secondary Crushing 0.018 0.001 0.001Tertiary Crushing 1.850 0.112 0.035Dry Screening 0.160 0.120 0.038Wet Screening neg neg neg
Emission FactorMaterial Crushing and Screening Table 1 -- Emission Factors
Control Techniques: Please refer to the control techniques discussion in the Material Handling Operations section. Source: The method is derived from the Sand and Gravel Processing discussion in the Air & Waste Management Association Air Pollution Engineering Manual (1992 edition).
April 10, 2000 Page 16 of 31 mineralguidance

G. Wind Erosion From Stockpiles This procedure applies to wind erosion from open storage piles. Least Complex: This method employs a conservative emission factor multiplied by the surface area of a stockpile.
AEE f E = Particulate matter emissions rate in tons per year Ef = Emission factor in units of tons of particulate per surface acre A = Exposed surface area of stockpile in acres
TSP Ef = 8.10 tons/acre PM10 Ef = 4.05 tons/acre PM2.5 Ef = 1.62 tons/acre
(These emission factors were calculated using the defaults given in the Most Complex section)
Area (acres) 0.02 0.11 0.23 0.46 1.00 2.00 5.00 10.00Area (square feet) 1000 5000 10000 20000 43560 87120 217800 435600TSP Emissions (tons) 0.19 0.93 1.86 3.72 8.10 16.20 40.50 81.00PM10 Emissions (tons) 0.09 0.46 0.93 1.86 4.05 8.10 20.25 40.50PM2.5 Emissions (tons) 0.04 0.19 0.37 0.74 1.62 3.24 8.10 16.20
Stockpile Table 1 -- Area Based Emissions
Most Complex: This method presents an equation requiring inputs for the silt content of the stockpiled material, the average number of days during the year in question that experienced at least 0.01 inches of precipitation, the percentage of time during the year that the unobstructed wind speed exceeded 12 mph, and the exposed surface area of the stockpile.
2000365
15235365
5.17.1
IPsLJE fAEE f
E = Particulate matter emissions rate in tons per year E = Emission factor in tons per acre fA = Exposed surface area of stockpile in acres J = Particulate aerodynamic factor (see below) sL = Average silt loading of storage pile in percent (%), see below P = Average number of days during the year with at least 0.01 inches of precipitation I = Percentage of time with unobstructed wind speed >12 mph in percent (%)
April 10, 2000 Page 17 of 31 mineralguidance

J (TSP) = 1.0
neralguidance
J (PM2.5) = 0.2
onservative windy hours default is 13.3 percent
norganic Minerals 30.0
J (PM10) = 0.5 Conservative silt loading default is 30 percent Conservative days with precipitation default is 20 C
Stockpile Material Silt Content (%)Limestone 0.5Crushed Limestone 1.5Asphalt Batching 5.0Coal 6.0Concrete Batching 6.0Sand and Gravel Processing 8.0Overburden 10.0Blend Ore and Dirt 15.0Flue Dust 20.0
Stockpile Table 2 -- Silt Content Percentages
I
0.5 1.0 5.0 10.0 15.0 20.0 25.0 30.05 0.051 0.101 0.506 1.012 1.518 2.024 2.530 3.03610 0.101 0.202 1.012 2.024 3.036 4.049 5.061 6.07315 0.152 0.304 1.518 3.036 4.555 6.073 7.591 9.10920 0.202 0.405 2.024 4.049 6.073 8.097 10.122 12.146
Silt Content (%)I (% of winds > than 12 mph)
Stockpile Table 3 -- TSP Emissions for P = 20 days with >=0.01 inches
0.5 1.0 5.0 10.0 15.0 20.0 25.0 30.05 0.025 0.051 0.253 0.506 0.759 1.012 1.265 1.51810 0.051 0.101 0.506 1.012 1.518 2.024 2.530 3.03615 0.076 0.152 0.759 1.518 2.277 3.036 3.796 4.55520 0.101 0.202 1.012 2.024 3.036 4.049 5.061 6.073
Stockpile Table 4 -- PM10 Emissions for P = 20 days with >=0.01 inches
I (% of winds > than 12 mph) Silt Content (%)
0.5 1.0 5.0 10.0 15.0 20.0 25.0 30.05 0.010 0.020 0.101 0.202 0.304 0.405 0.506 0.60710 0.020 0.040 0.202 0.405 0.607 0.810 1.012 1.21515 0.030 0.061 0.304 0.607 0.911 1.215 1.518 1.822
0.040 0.081 0.405 0.810 1.215 1.619 2.024 2.429
I (% of winds > than 12 mph) Silt Content (%)Stockpile Table 5 -- PM2.5 Emissions for P = 20 days with >=0.01 inches
20
April 10, 2000 Page 18 of 31 mi

Control Techniques:
neralguidance
ced through the use of water spray al). The following table presents the required
cy. Water application or use
wind screens or ind screens (on the windward
is known, the following equation ation or process:
Controlled emissions = Uncontrolled emissions
Source: The method is derived from the Fugitive Emissions discussion in the Air & Waste Management Association Air Pollution Engineering Manual (1992 edition).
Fugitive particulate emissions from storage piles can be redu(by increasing the moisture content of the materiminimum water application rates to achieve a given control efficienrecords must accompany any watering control efficiency claim.
Desired Efficiency (%) Daily Water Application Rate (gal/acre)50 170360 2390
Stockpiles Table 6 -- Watering Control Efficiency (%)
Stockpile fugitive particulate emissions can also be reduced through the use of enclosures. The District assumes that complete coverage by wside) will provide a control efficiency of 75 percent.
e applicable control technique used to determine the “controlled” emissions from the oper
Once the control efficiency of this
Ec =EC = Control efficiency in percent (%)
100 C
E
100
Ec
95 14279
70 339680 508385 650690 8892
Desired Efficiency (%) Daily Water Application Rate (gal/acre)50 170360 2390
95 14279
Stockpiles Table 6 -- Watering Control Efficiency (%)
70 339680 508385 650690 8892
April 10, 2000 Page 19 of 31 mi
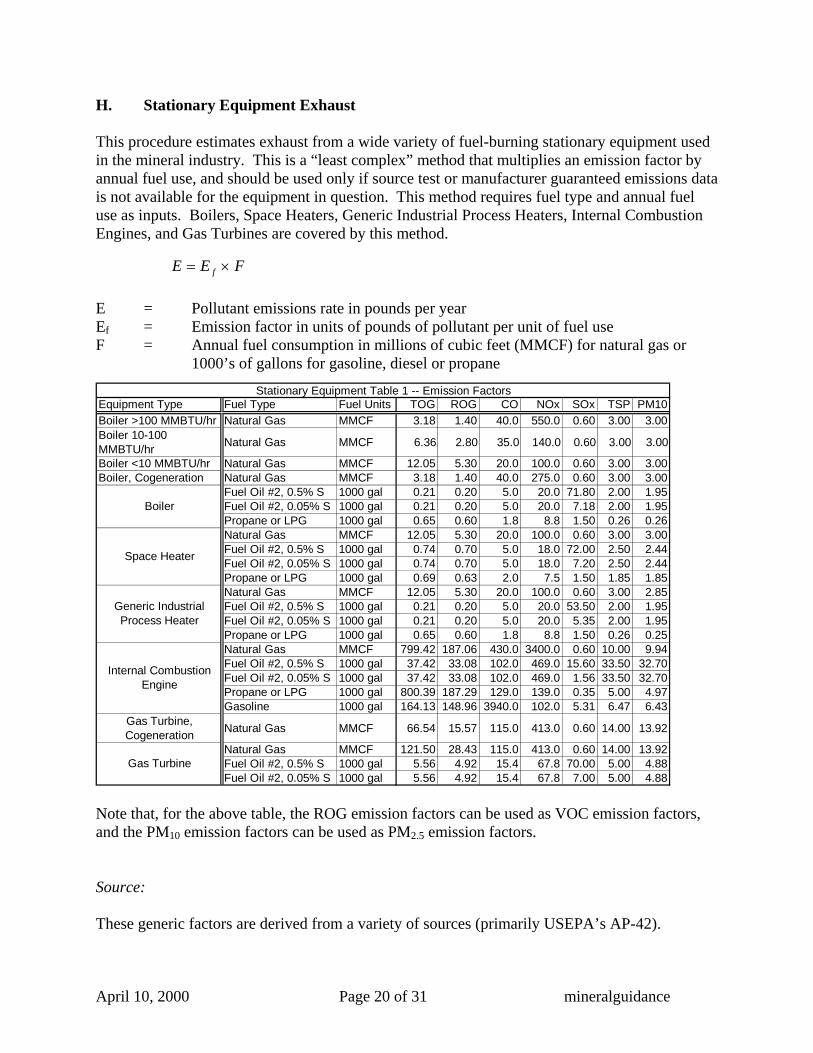
H. Stationary Equipment Exhaust This procedure estimates exhaust from a wide variety of fuel-burning stationary equipment used in the mineral industry. This is a “least complex” method that multiplies an emission factor by annual fuel use, and should be used only if source test or manufacturer guaranteed emissions data is not available for the equipment in question. This method requires fuel type and annual fuel use as inputs. Boilers, Space Heaters, Generic Industrial Process Heaters, Internal Combustion Engines, and Gas Turbines are covered by this method.
FEE f E = Pollutant emissions rate in pounds per year Ef = Emission factor in units of pounds of pollutant per unit of fuel use F = Annual fuel consumption in millions of cubic feet (MMCF) for natural gas or
1000’s of gallons for gasoline, diesel or propane
Equipment Type Fuel Type Fuel Units TOG ROG CO NOx SOx TSP PM10Boiler >100 MMBTU/hr Natural Gas MMCF 3.18 1.40 40.0 550.0 0.60 3.00 3.00Boiler 10-100 MMBTU/hr Natural Gas MMCF 6.36 2.80 35.0 140.0 0.60 3.00 3.00
Boiler <10 MMBTU/hr Natural Gas MMCF 12.05 5.30 20.0 100.0 0.60 3.00 3.00Boiler, Cogeneration Natural Gas MMCF 3.18 1.40 40.0 275.0 0.60 3.00 3.00
Fuel Oil #2, 0.5% S 1000 gal 0.21 0.20 5.0 20.0 71.80 2.00 1.95Fuel Oil #2, 0.05% S 1000 gal 0.21 0.20 5.0 20.0 7.18 2.00 1.95Propane or LPG 1000 gal 0.65 0.60 1.8 8.8 1.50 0.26 0.26Natural Gas MMCF 12.05 5.30 20.0 100.0 0.60 3.00 3.00Fuel Oil #2, 0.5% S 1000 gal 0.74 0.70 5.0 18.0 72.00 2.50 2.44Fuel Oil #2, 0.05% S 1000 gal 0.74 0.70 5.0 18.0 7.20 2.50 2.44Propane or LPG 1000 gal 0.69 0.63 2.0 7.5 1.50 1.85 1.85Natural Gas MMCF 12.05 5.30 20.0 100.0 0.60 3.00 2.85Fuel Oil #2, 0.5% S 1000 gal 0.21 0.20 5.0 20.0 53.50 2.00 1.95Fuel Oil #2, 0.05% S 1000 gal 0.21 0.20 5.0 20.0 5.35 2.00 1.95Propane or LPG 1000 gal 0.65 0.60 1.8 8.8 1.50 0.26 0.25Natural Gas MMCF 799.42 187.06 430.0 3400.0 0.60 10.00 9.94Fuel Oil #2, 0.5% S 1000 gal 37.42 33.08 102.0 469.0 15.60 33.50 32.70Fuel Oil #2, 0.05% S 1000 gal 37.42 33.08 102.0 469.0 1.56 33.50 32.70Propane or LPG 1000 gal 800.39 187.29 129.0 139.0 0.35 5.00 4.97Gasoline 1000 gal 164.13 148.96 3940.0 102.0 5.31 6.47 6.43
Gas Turbine, Cogeneration Natural Gas MMCF 66.54 15.57 115.0 413.0 0.60 14.00 13.92
Natural Gas MMCF 121.50 28.43 115.0 413.0 0.60 14.00 13.92Fuel Oil #2, 0.5% S 1000 gal 5.56 4.92 15.4 67.8 70.00 5.00 4.88Fuel Oil #2, 0.05% S 1000 gal 5.56 4.92 15.4 67.8 7.00 5.00 4.88
Internal Combustion Engine
Gas Turbine
Stationary Equipment Table 1 -- Emission Factors
Boiler
Space Heater
Generic Industrial Process Heater
Note that, for the above table, the ROG emission factors can be used as VOC emission factors, and the PM10 emission factors can be used as PM2.5 emission factors. Source: These generic factors are derived from a variety of sources (primarily USEPA’s AP-42).
April 10, 2000 Page 20 of 31 mineralguidance

I. Mobile Equipment and Vehicular Exhaust This procedure estimates the exhaust and brake wear emissions from a variety of mobile equipment common in the mineral industry. Note that this method estimates exhaust from mobile equipment only, and dust entrainment due to the travel of mobile equipment on paved and unpaved surfaces should be estimated using the methods presented elsewhere in this document. This is effectively a “least complex” method that multiplies a conservative emission factor by annual activity in hours of use, fuel consumption in 1000’s of gallons, or travel in 1000’s of miles.
AEE f E = Pollutant emissions rate in pounds per year Ef = Emission factor in units of pounds of pollutant per unit of activity A = Annual activity consumption in 1000’s of horsepower-hours, 1000’s of gallons of
diesel fuel burned, or 1000’s of vehicle miles traveled
Equipment Type Activity Type Activity Units TOG ROG CO NOx SOx TSP PM10Heavy Duty Diesel Off
Road Hours of Operation 1000 hp-hr 2.42 2.34 7.5 24.3 2.91 1.54 1.53
Heavy Duty Gasoline Off Road Hours of Operation 1000 hp-hr 16.53 15.99 474.0 9.9 2.82 0.13 0.13
Miscellaneous Natural Gas or Propane Off Road Hours of Operation 1000 hp-hr 10.40 10.06 275.6 11.9 1.50 0.13 0.13
Locomotives Fuel Burned 1000 gal 36.00 34.46 115.0 659.0 47.35 15.50 14.88Light Duty Gasoline On or
Off Road Distance Traveled 1000 vmt 2.92 2.67 18.8 2.3 0.12 0.47 0.21
Heavy Duty Diesel On Road Distance Traveled 1000 vmt 4.21 4.10 17.4 29.1 0.94 4.62 4.02
Mobile Equipment Table 1 -- Emission Factors
Note that, for the above table, the ROG emission factors can be used as VOC emission factors, and the PM10 emission factors can be used as PM2.5 emission factors. Control Techniques: None are presently quantified. Source: This method is consists of fleet average emission factors derived from the District emission inventory.
April 10, 2000 Page 21 of 31 mineralguidance

J. Dust Entrainment from Paved Roads This procedure applies to all traffic on paved roads. This procedure estimates the dust entrainment due to vehicular travel on paved surfaces. Vehicular exhaust emissions should be estimated using methods presented elsewhere. Least Complex: This method consists of multiplying a conservative default emission factor for a typical haul truck operating on a material laden surface by an estimate of that haul trucks annual activity in vehicle mile traveled.
VEE f E = Particulate matter emissions rate in pounds per year Ef = Emission factor in units of pounds of pollutant per mile traveled V = Annual travel in units of vehicle miles traveled
Ef (TSP) = 55 pounds/mile traveled Ef (PM10) = 11 pounds/mile traveled Ef (PM2.5) = 3 pounds/mile traveled
(These emission factors were calculated using the defaults given in the Most Complex section)
Activity (miles traveled) 500 1000 5000 10000 20000 50000 100000 150000 200000TSP Emissions (tons) 13.75 27.50 137.50 275 550 1375 2750 4125 5500PM10 Emissions (tons) 2.75 5.50 27.50 55 110 275 550 825 1100PM2.5 Emissions (tons) 0.75 1.50 7.50 15 30 75 150 225 300
Paved Roads Table 1 -- Activity Based Emissions
Most Complex: This method calculates a vehicle-specific emission factor based on paved surface silt loading and vehicle weight, and multiplies it by annual vehicular activity in miles traveled.
5.165.0
32
WsLkE f
VEE f
E = Particulate matter emissions rate in pounds per year E = Emission factor in units of pounds of pollutant per mile traveled fV = Annual travel in units of vehicle miles traveled k = Aerodynamic particle size multiplier (see below) sL = Roadway silt loading, in grams per square meter W = Mean vehicle weight in tons
k (TSP) = 0.082
April 10, 2000 Page 22 of 31 mineralguidance

neralguidance
k (PM2.5) = 0.004
are meter onservative mean vehicle weight default is 42 tons
200.0 1.24 3.52 9.96 18.29 39.36 111.32 314.87
k (PM10) = 0.016
Conservative silt loading default is 100 grams per squC
Paved Surface Silt Loading (g/m2)Freeway or High Traffic 0.1Low Traffic Road 0.4Municipal Solid Waste Landfill 7Quarry 8Concrete Batching 12Sand and Gravel Processing 70Industrial Site 100
Paved Roads Table 2 -- Default Silt Loadings
Asphalt Batching 120
2.5 5.0 10.0 15.0 25.0 50.0 100.00.4 0.02 0.06 0.18 0.32 0.69 1.96 5.541.0 0.04 0.11 0.32 0.58 1.26 3.56 10.061.5 0.05 0.15 0.41 0.76 1.64 4.63 13.095.0 0.11 0.32 0.91 1.66 3.58 10.12 28.63
10.0 0.18 0.50 1.42 2.61 5.62 15.88 44.9215.0 0.23 0.65 1.85 3.40 7.31 20.67 58.4725.0 0.32 0.91 2.58 4.73 10.19 28.81 81.4950.0 0.51 1.43 4.04 7.43 15.98 45.21 127.88
100.0 0.79 2.24 6.35 11.66 25.08 70.94 200.66150.0 1.03 2.92 8.26 15.17 32.65 92.34 261.17
Silt Loading (g/m2)
Mean Vehicle Weight (W) in tonsPaved Roads Table 3 -- Emission Factors (Ef) for TSP
2.5 5.0 10.0 15.0 25.0 50.0 100.00.4 0.00 0.01 0.03 0.06 0.14 0.38 1.081.0 0.01 0.02 0.06 0.11 0.25 0.69 1.961.5 0.01 0.03 0.08 0.15 0.32 0.90 2.555.0 0.02 0.06 0.18 0.32 0.70 1.97 5.59
10.0 0.03 0.10 0.28 0.51 1.10 3.10 8.7715.0 0.05 0.13 0.36 0.66 1.43 4.03 11.4125.0 0.06 0.18 0.50 0.92 1.99 5.62 15.9050.0 0.10 0.28 0.79 1.45 3.12 8.82 24.95
100.0 0.15 0.44 1.24 2.27 4.89 13.84 39.15150.0 0.20 0.57 1.61 2.96 6.37 18.02 50.96
Paved Roads Table 4 -- Emission Factors (Ef) for PM10Silt Loading
(g/m2)Mean Vehicle Weight (W) in tons
200.0 0.24 0.69 1.94 3.57 7.68 21.72 61.44
April 10, 2000 Page 23 of 31 mi
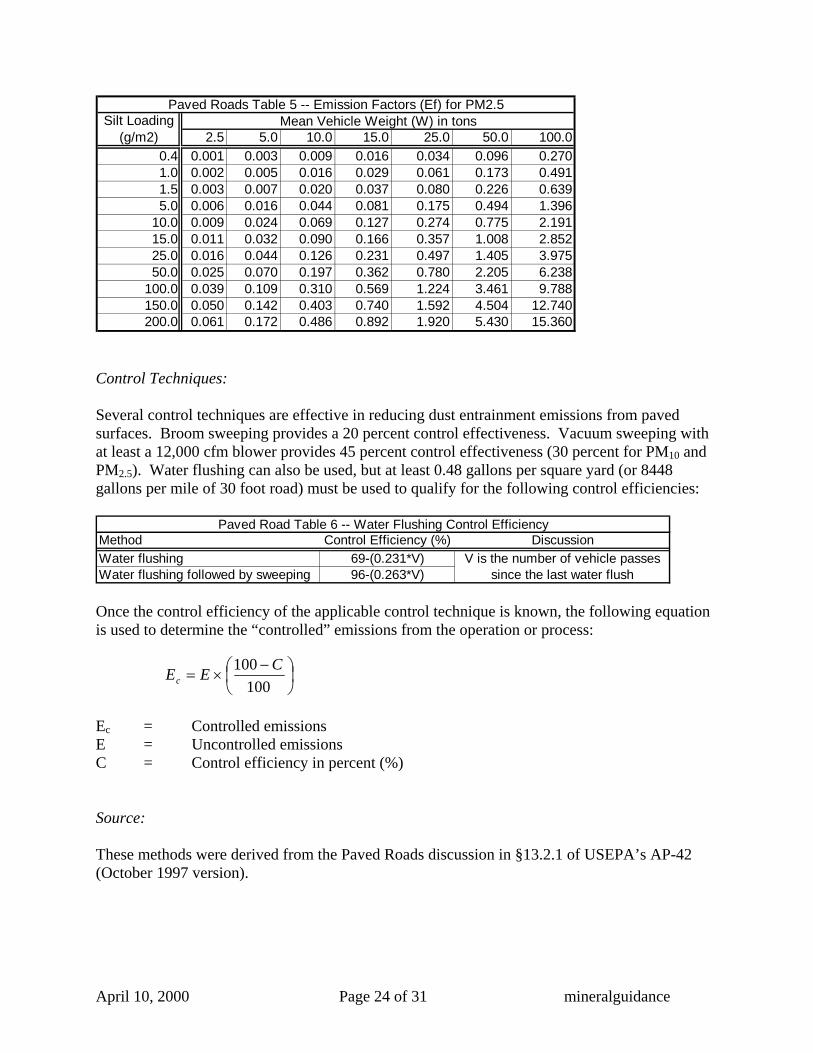
2.5 5.0 10.0 15.0 25.0 50.0 100.00.4 0.001 0.003 0.009 0.016 0.034 0.096 0.2701.0 0.002 0.005 0.016 0.029 0.061 0.173 0.4911.5 0.003 0.007 0.020 0.037 0.080 0.226 0.6395.0 0.006 0.016 0.044 0.081 0.175 0.494 1.396
10.0 0.009 0.024 0.069 0.127 0.274 0.775 2.19115.0 0.011 0.032 0.090 0.166 0.357 1.008 2.85225.0 0.016 0.044 0.126 0.231 0.497 1.405 3.97550.0 0.025 0.070 0.197 0.362 0.780 2.205 6.238
100.0 0.039 0.109 0.310 0.569 1.224 3.461 9.788150.0 0.050 0.142 0.403 0.740 1.592 4.504 12.740200.0 0.061 0.172 0.486 0.892 1.920 5.430 15.360
Paved Roads Table 5 -- Emission Factors (Ef) for PM2.5Silt Loading
(g/m2)Mean Vehicle Weight (W) in tons
Control Techniques: Several control techniques are effective in reducing dust entrainment emissions from paved surfaces. Broom sweeping provides a 20 percent control effectiveness. Vacuum sweeping with at least a 12,000 cfm blower provides 45 percent control effectiveness (30 percent for PM10 and PM2.5). Water flushing can also be used, but at least 0.48 gallons per square yard (or 8448 gallons per mile of 30 foot road) must be used to qualify for the following control efficiencies:
Method Control Efficiency (%) DiscussionWater flushing 69-(0.231*V)Water flushing followed by sweeping 96-(0.263*V)
Paved Road Table 6 -- Water Flushing Control Efficiency
V is the number of vehicle passes since the last water flush
Once the control efficiency of the applicable control technique is known, the following equation is used to determine the “controlled” emissions from the operation or process:
100
100 CEEc
E = Controlled emissions cE = Uncontrolled emissions C = Control efficiency in percent (%) Source: These methods were derived from the Paved Roads discussion in §13.2.1 of USEPA’s AP-42 (October 1997 version).
April 10, 2000 Page 24 of 31 mineralguidance

K. Dust Entrainment from Unpaved Roads This procedure applies to all traffic on unpaved roads. This procedure estimates the dust entrainment due to vehicular travel on unpaved surfaces. Vehicular exhaust emissions should be estimated using methods presented elsewhere. Least Complex: This method consists of a conservative default emission factor (based on average vehicle weight in tons) multiplied by an estimate of annual vehicular activity in miles traveled.
VEE f E = Particulate matter emissions rate in pounds per year Ef = Emission factor in units of pounds of particulate per mile traveled V = Annual travel in units of vehicle miles traveled (These emission factors were calculated using the defaults given in the Most Complex section)
Average weight (tons): 3 5 10 20 50 100 150 200TSP Emission Factor 9.33 12.04 17.03 24.08 38.08 53.85 65.96 76.16PM10 Emission Factor 2.43 2.97 3.93 5.18 7.47 9.86 11.60 13.01PM2.5 Emission Factor 0.35 0.43 0.57 0.76 1.09 1.44 1.69 1.90
Unpaved Road Table 1 -- Default Emission Factors (Ef) in pounds/vmt
Most Complex: This method calculates a vehicle specific emission factor based on unpaved surface silt content in percent, average vehicle weight in tons, and unpaved surface moisture content in percent, and multiplies it by annual vehicular activity in miles traveled.
neralguidance
nt per mile traveled t)
= Average vehicle weight in tons
E = Particulate matter emissions rate in pounds per year E = Emission factor in units of pounds of pollutafV = Annual travel in units of vehicle miles traveled (vms = Unpaved surface silt content in percent (%) W
VEE f 4.05.08.0
)( 2.031210
MWsE TSPf
3.04.08.0
)( 2.03126.2
10
MWsE PMf
3.04.08.0
)( 2.031238.0
5.2
MWsE PMf
April 10, 2000 Page 25 of 31 mi

neralguidance
t (%)
onservative default surface moisture content is 0.2 percent efault average vehicle speed is assumed to be at least 15 mph
ied; tion
ium chloride). Watering is the most common ontrol technique for unpaved roads. What follows is an equation to calculate the control
efficiency for a given water application rate:
cent inches
= Time between water applications in hours
r square yard
onservative watering intensity is 0.11 gal/yd2 or 1936 gallons per mile of 30 foot road
Once the control efficiency of the applicable control technique is known, the following equation
M = Unpaved surface moisture content in percen
Source Silt Loading (%)Sand & gravel plant road 5Landfill road 6Rural road (gravel/crushed limestone surface) 6Industrial haul road 8Construction site scraper route 9Stone quarrying and processing plant road 10Rural road (dirt surface) 11
Unpaved Roads Table 2 -- Default Silt Content
Conservative default silt content is 11 percent CD Control Techniques: Several techniques are used to reduce fugitive dust emissions from vehicular travel on unpaved roads. The equation suggests that reducing travel, speed, and vehicle weight will directly reduceemissions. In addition, changing the nature of the unpaved surface can reduce emissions, as can be seen from the default silt loading table. Chemical stabilization is often used, but the control efficiency of chemical stabilization is very dependent on the material used and how it is applconsult with the vendor and the District to derive a control efficiency for chemical stabiliza(no control efficiency will be allowed for calcc
C = Control efficiency of watering application in perfA = Average annual class A pan evaporation inD = Average hourly traffic rate in vehicles per hour TI = Water application intensity in gallons pe Conservative average annual evaporation is 75 inches Conservative time between applications is 3 hours C(These defaults equate to no control efficiency for 41 vehicles per hour)
I
0012.0100 TDAC f
mine scraper route 1724
CoalCoal mine freshly graded haul road
April 10, 2000 Page 26 of 31 mi

neralguidance
is used to determine the “controlled” emissions from the operation or process:
= Control efficiency in percent (%)
ource:
resented in the Unpaved Roads discussion (§13.2.2) in USEPA’s AP-42 eptember 1998).
100 C
EEc 100
Ec = Controlled emissions E = Uncontrolled emissions C S These methods are p(S
April 10, 2000 Page 27 of 31 mi

L. Wind Erosion from Unpaved Operational Areas and Roads This procedure applies to actively disturbed unpaved areas, specifically including plant or operational areas (such as quarries) and roads. Actively disturbed is defined as being disturbed by man’s activity at least once per day. This procedure estimates the particulate emissions from these areas due to wind erosion. Particulate emissions due to actual vehicular travel on these areas should be estimated using methods presented elsewhere. Least Complex: This method multiplies a conservative emission factor by the amount of disturbed area.
AEE f E = Particulate matter emission rate in tons per year Ef = Emission factor in tons per acre (see below) A = Disturbed area in acres
Ef (TSP) = 16 tons/acre Ef (PM10) = 8 tons/acre Ef (PM2.5) = 3.2 tons/acre
(These emission factors were calculated using the defaults given in the Intermediate Complexity section)
Area Disturbed (acres) 1 2 5 10 20 50 100TSP Emissions (tons) 16 32 80 160 320 800 1600PM10 Emissions (tons) 8 16 40 80 160 400 800PM2.5 Emissions (tons) 3.2 6.4 16 32 64 160 320
Wind Erosion Table 1 -- Area Based Emissions
Intermediate Complexity: This method presents an equation requiring inputs for the fraction of vegetative cover on the disturbed area, mean wind speed in meters per second, threshold value of wind speed in meters per second (a derived value), and a correction factor (a derived value). The derived values can be estimated from tables presented below.
)(1814.23
xCu
uvEf
t
AEkE f ** uuu tt
E = Particulate matter emission rate in tons per year k = Particulate aerodynamic factor (see below) E = Emission factor in tons per acre fA = Disturbed area in acres v = Amount of vegetative cover as a fraction u = Mean wind speed in meters per second
April 10, 2000 Page 28 of 31 mineralguidance

ut = Threshold value of wind speed in meters per second (calculated) C(x) = Correction factor (see Table 4 below) u*t = Threshold friction velocity in meters per second (see Table 2 below) u* = Ratio of wind speed to friction velocity k (TSP) = 1.0 k (PM10) = 0.5 k (PM2.5) = 0.2
Area Use Typical friction velocity particle size (mm)
Threshold friction velocity (m/s)
Mine tailings 0.05 0.14Abandoned agricultural land 0.10 0.25Construction site 0.11 0.26Disturbed desert 0.20 0.33Scrub desert 0.30 0.38Coal dust 0.60 0.52Active agricultural land 0.60 0.52Coal pile 1.00 0.64
Wind Erosion Table 2 -- Threshold Friction Velocity
Area use Typical roughness height (cm) RatioOpen space 2 15.0Light industrial 35 8.0Moderate industrial 70 6.5Heavy industrial 100 5.0
Wind Erosion Table 3 -- Ratio of wind speed to friction velocity
u
ux t 886.0
x 0.3 0.4 0.5 0.6 0.7 0.8 0.9 1.0 1.1 1.2 1.3 1.4 1.5 1.6 1.7 1.8 1.9 2.0C(x) 1.91 1.90 1.89 1.86 1.83 1.77 1.70 1.60 1.48 1.33 1.20 1.05 0.90 0.78 0.62 0.50 0.40 0.29
Wind Erosion Table 4 -- C(x) Correction Factor
Conservative default for mean wind speed is 2.36 m/s (7.7 mph) Conservative default for roughness height is 70 cm (medium industry) Conservative default for particle size is 0.1 mm (abandoned ag. land) Most Complex: This method presents an additional equation that is used as an alternative depending on the nature of the surface being eroded. Erodible surfaces can be characterized as “limited” or “unlimited” reservoirs of erodible material. The following table determines the type of surface and the appropriate equation:
April 10, 2000 Page 29 of 31 mineralguidance
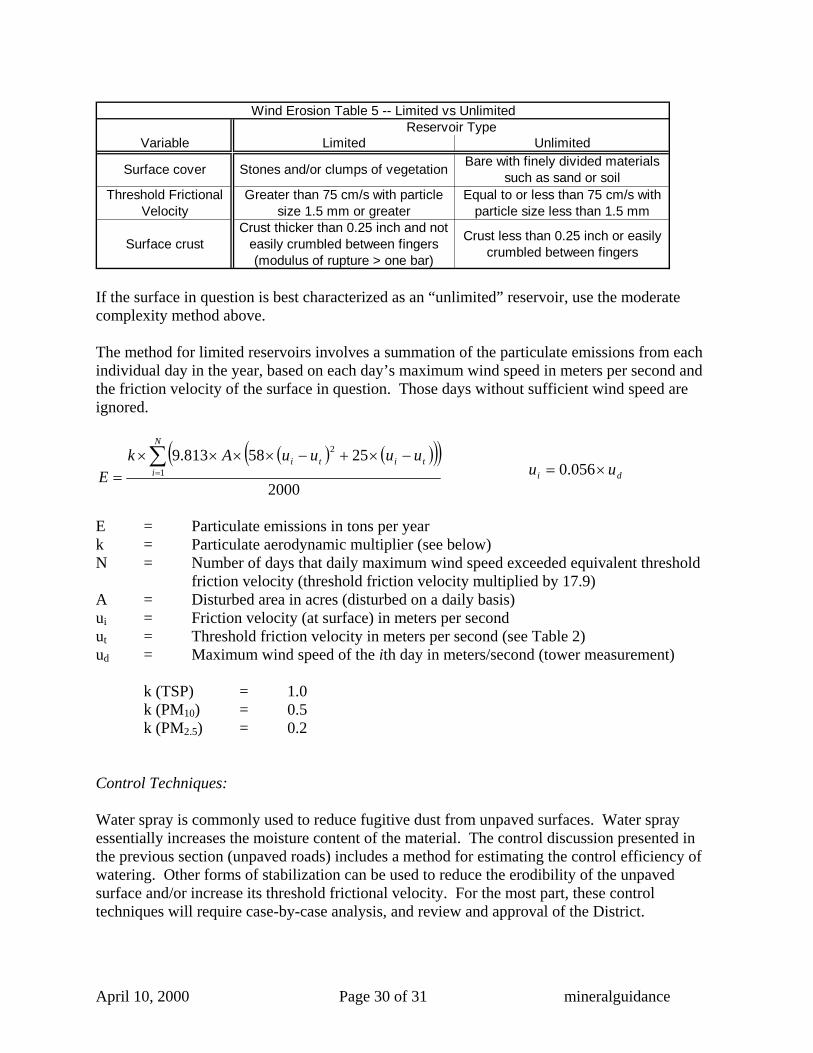
Variable Limited Unlimited
Surface cover Stones and/or clumps of vegetation Bare with finely divided materials such as sand or soil
Threshold Frictional Velocity
Greater than 75 cm/s with particle size 1.5 mm or greater
Equal to or less than 75 cm/s with particle size less than 1.5 mm
Surface crustCrust thicker than 0.25 inch and not
easily crumbled between fingers (modulus of rupture > one bar)
Crust less than 0.25 inch or easily crumbled between fingers
Reservoir TypeWind Erosion Table 5 -- Limited vs Unlimited
If the surface in question is best characterized as an “unlimited” reservoir, use the moderate complexity method above. The method for limited reservoirs involves a summation of the particulate emissions from each individual day in the year, based on each day’s maximum wind speed in meters per second and the friction velocity of the surface in question. Those days without sufficient wind speed are ignored.
E = Particulate emissions in tons per year k = Particulate aerodynamic multiplier (see below) N = Number of days that daily maximum wind speed exceeded equivalent threshold
friction velocity (threshold friction velocity multiplied by 17.9) A = Disturbed area in acres (disturbed on a daily basis) ui = Friction velocity (at surface) in meters per second ut = Threshold friction velocity in meters per second (see Table 2) ud = Maximum wind speed of the ith day in meters/second (tower measurement) k (TSP) = 1.0 k (PM10) = 0.5 k (PM2.5) = 0.2 Control Techniques: Water spray is commonly used to reduce fugitive dust from unpaved surfaces. Water spray essentially increases the moisture content of the material. The control discussion presented in the previous section (unpaved roads) includes a method for estimating the control efficiency of watering. Other forms of stabilization can be used to reduce the erodibility of the unpaved surface and/or increase its threshold frictional velocity. For the most part, these control techniques will require case-by-case analysis, and review and approval of the District.
2000
2558813.91
2
N
ititi uuuuAk
E di uu 056.0
April 10, 2000 Page 30 of 31 mineralguidance

Once the control efficiency of the applicable control technique is known, the following equation is used to determine the “controlled” emissions from the operation or process:
100
100 CEEc
Ec = Controlled emissions E = Uncontrolled emissions C = Control efficiency in percent (%) Source: These methods are presented in the Industrial Wind Erosion discussion (§13.2.5) in USEPA’s AP-42 (January 1995).
April 10, 2000 Page 31 of 31 mineralguidance

Butterfield and Sentinel Quarries Expansion Air Quality and Greenhouse Gas Impact Assessment San Bernardino National Forest October 25, 2017
OM01_SB-AQHRCCIA_fnl.docx Sespe Consulting, Inc.
Appendix G: Baseline Data from Omya

Page 1 of 38
FORMMINE
200 8 TOTAL
90461
DEVICE ID #TSP PM10 PM2.5 CO NOx TOG ROG / VOC SOx
90010 0.000 0.000 0.00090011 0.000 0.000 0.00090011 0.000 0.000 0.00090012a 0.102 0.050 0.015
90006,7,8,9 0.004 0.002 0.0012002 0.928 0.059 0.018757 19.092 1.240 0.382763 1.986 0.133 0.042763 1.465 0.092 0.0293935 0.892 0.058 0.0187674 0.884 0.057 0.0182003 0.006 0.001 0.000754 10.768 3.014 0.941763 0.010 0.007 0.0022009 0.267 0.044 0.0144967 0.320 0.045 0.0142007 0.087 0.014 0.0042009 0.016 0.003 0.001
90015 1.057 0.529 0.211VARIOUS 0.026 0.025 0.025 0.066 0.263 0.003 0.003 0.070
90001,2 0.653 0.646 0.646 3.226 29.068 1.151 1.114 5.2600 0.000 0.000 0.000
90013 16.990 5.015 0.76990014a 53.702 26.851 10.740
GRAND TOTAL 109.255 37.883 13.891 3.291 29.332 1.154 1.117 5.331
EXHAUST - MOBILE AND VEHICULAR EQUIPMENTPAVED ROADS - ENTRAINED DUSTUNPAVED ROADS - ENTRAINED DUSTWIND EROSION FROM UNPAVED OPERATIONAL AREAS AND ROADS
LOADING OF MATERIAL(S) MINE / QUARRY / PIT
Coarse Product Storage System
STOCKPILES - WIND EROSIONEXHAUST - STATIONARY AND PORTABLE EQUIPMENT
Silo 81-70cBulk Loadout 82 System
DRILLINGBLASTINGEXPLOSIVESBULLDOZING, SCRAPING AND GRADING OF MATERIAL
TOTALEMISSION SOURCE / OPERATION / ACTIVITY CRITERIA EMISSIONS (tons per year)
COMPANY NAME: Omya California Inc COMPANY NUMBER: FACILITY NAME: Plant FACILITY NUMBER:
TOTAL EMISSIONS
DATA INPUT BY FACILITY DATA FROM ANOTHER WORKSHEET OUTPUT DATA TO CEIDARS
EMISSION HARP / CEIDARSYEAR MINING OPERATIONS
Bulk Loadout 83 System
Surface Treating PlantRock Storage System/PlanOptical Sorter
Ball Mill #1Tertiary CrushingRoller Mill #1Roller Mill #2Roller Mill #3Roller Mill #4
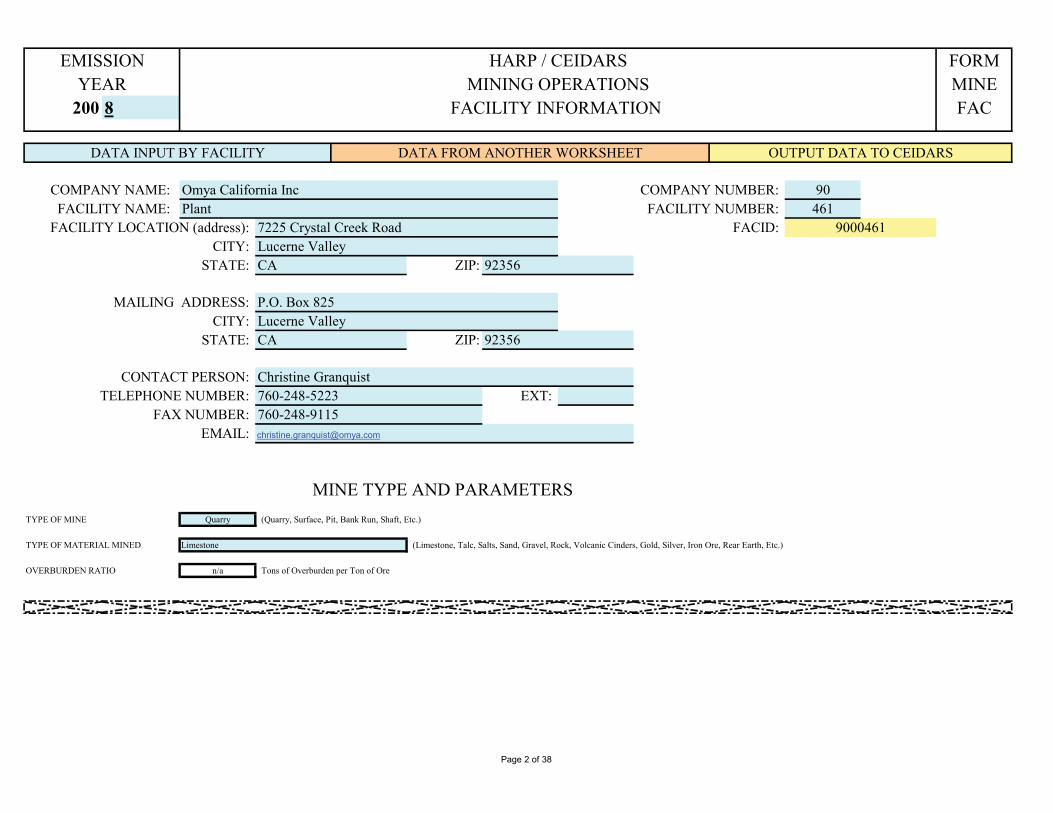
Page 2 of 38
FORMMINE
200 8 FAC
90461
CITY: STATE: ZIP:
CITY: STATE: ZIP:
EXT:
TYPE OF MINE Quarry (Quarry, Surface, Pit, Bank Run, Shaft, Etc.)
TYPE OF MATERIAL MINED (Limestone, Talc, Salts, Sand, Gravel, Rock, Volcanic Cinders, Gold, Silver, Iron Ore, Rear Earth, Etc.)
OVERBURDEN RATIO n/a Tons of Overburden per Ton of Ore
CONTACT PERSON: Christine GranquistTELEPHONE NUMBER:
MINE TYPE AND PARAMETERS
Limestone
FAX NUMBER: 760-248-9115EMAIL: [email protected]
760-248-5223
MAILING ADDRESS: P.O. Box 825
9000461FACILITY NAME: Plant FACILITY NUMBER:
FACILITY LOCATION (address): 7225 Crystal Creek RoadLucerne ValleyCA 92356
FACID:
DATA FROM ANOTHER WORKSHEET OUTPUT DATA TO CEIDARS
COMPANY NAME: Omya California Inc COMPANY NUMBER:
Lucerne ValleyCA 92356
EMISSION HARP / CEIDARSYEAR MINING OPERATIONS
FACILITY INFORMATION
DATA INPUT BY FACILITY

Page 3 of 38
FORMMINE
200 8 MIN
90461
Name ofMinerals Shifted by Blasting Total Handled Moisture (%) Silt (%)
Limestone 0 360,117 1.5 1.50.5 30.00.5 30.00.5 30.00.5 30.00.5 30.00.5 30.00.5 30.00.5 30.00.5 30.00.5 30.00.5 30.00.5 30.00.5 30.00.5 30.0
TOTAL 0 360,117
Amounts (tpy) Characteristics
COMPANY NAME: Omya California Inc COMPANY NUMBER: FACILITY NAME: Plant FACILITY NUMBER:
DATA FROM ANOTHER WORKSHEET OUTPUT DATA TO CEIDARSDATA INPUT BY FACILITY
EMISSION HARP / CEIDARSYEAR MINING OPERATIONS
MINERALS HANDLED - AMOUNT & CHARACTERISTICS
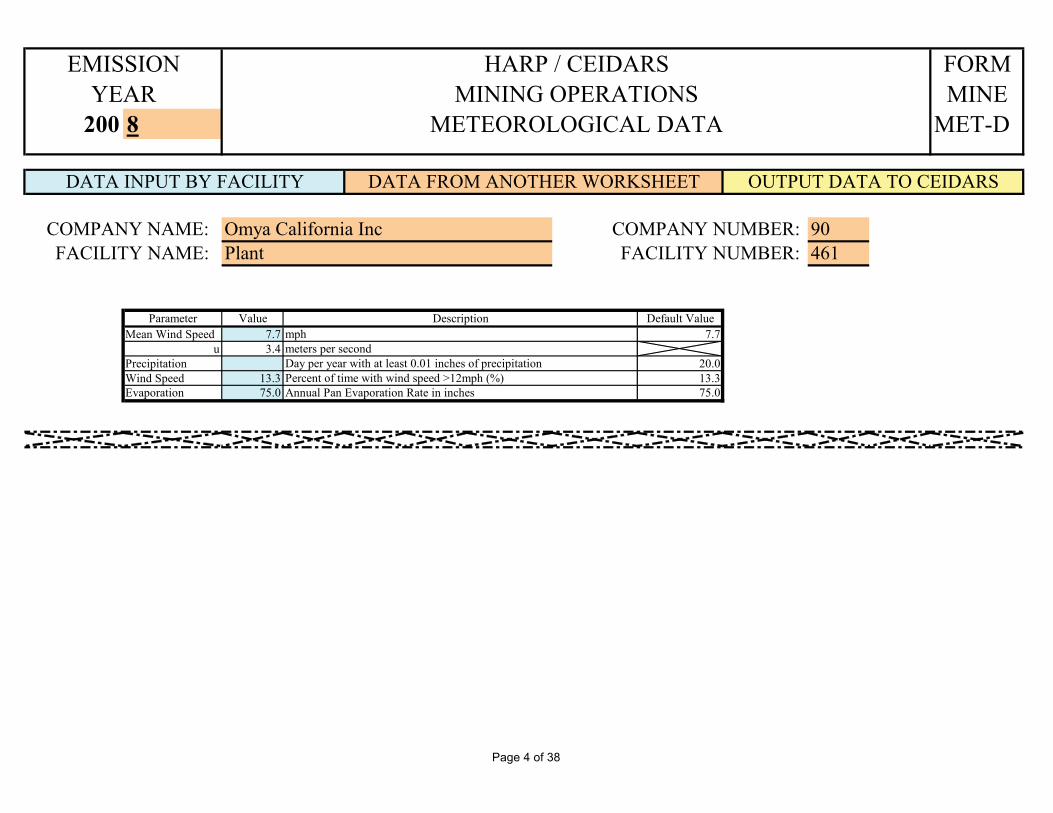
Page 4 of 38
FORMMINE
200 8 MET-D
90461
Parameter Value Default ValueMean Wind Speed 7.7 7.7
u 3.4Precipitation 20.0Wind Speed 13.3 13.3Evaporation 75.0 75.0
Day per year with at least 0.01 inches of precipitationPercent of time with wind speed >12mph (%)Annual Pan Evaporation Rate in inches
Descriptionmphmeters per second
COMPANY NAME: Omya California Inc COMPANY NUMBER: FACILITY NAME: Plant FACILITY NUMBER:
METEOROLOGICAL DATA
DATA INPUT BY FACILITY DATA FROM ANOTHER WORKSHEET OUTPUT DATA TO CEIDARS
EMISSION HARP / CEIDARSYEAR MINING OPERATIONS

Page 5 of 38
FORMMINE
200 8 D&B
90461
Device ID# 90010Device ID# 90011
0
00 Tons Ore, Waste & Overburden
DRILLINGDevice ID# 90010 SCC 30502514 SCC 30502514
Annual Throughput 0 Tons Shifted Annual Throughput 0 Holes Drilled
TSP PM10 PM2.5 PM10 PM2.5 TSP PM10 PM2.5 PM10 PM2.5
0.001 0.0008 0.0008 0.800 0.800 1.3 0.68 0.68 0.523 0.523
None, assumed wet drilling None, assumed wet drilling
TSP PM10 PM2.5 TSP PM10 PM2.5
0.000 0.000 0.000 0.000 0.000 0.000
BLASTINGDevice ID# 90011
Annual Throughput 0 Tons Shifted Area Shifted per Blast - Average 0 square foot per blast - averageSCC 30502514 Area Shifted per Year 0 square foot per year
SCC 30502514
TSP PM10 PM2.5 PM10 PM2.5 TSP PM10 PM2.5 PM10 PM2.5
0.160 0.080 0.005 0.500 0.030 0.000 0.000 0.000 #DIV/0! #DIV/0!
* EmFac = k * 0.0005 * A1.5 35.71428571k = Aerodynamic Factor
TSP = 1.00PM10 = 0.52PM2.5 = 0.03
A = Area Shifted per Blast - Average
None None
TSP PM10 PM2.5 TSP PM10 PM2.5
0 0 0 0.000 0.000 0.000
EMISSION HARP / CEIDARSYEAR MINING OPERATIONS
DRILLING AND BLASTING
DATA INPUT BY FACILITY DATA FROM ANOTHER WORKSHEET OUTPUT DATA TO CEIDARS
COMPANY NAME: Omya California Inc COMPANY NUMBER: FACILITY NAME: Plant FACILITY NUMBER:
Blast per year numberHoles per Blast - Average number
DRILLINGBLASTING
Holes drilled per year Number of holes per yearArea Shifted per Blast - Average square foot per blast - averageArea Shifted per Year square foot per yearAmount shifted by blasting
EMISSIONS
By Amount Shifted By Number of Holes Drilled
Emission Factors (pounds per tons shifted) Fractionation Value Emission Factors (pounds per hole drilled) Fractionation Value
Controls Controls
Emissions - tons per year Emissions - tons per year
By Square Foot Shifted
Emission Factors (pounds per ton shifted) Fractionation Value Emission Factors (pounds per blast) * Fractionation Value
By Tons Shifted
Em = EmFac * Amount Shift Em = EmFac * Blast per Year
Controls Controls
Emissions - tons per year Emissions - tons per year
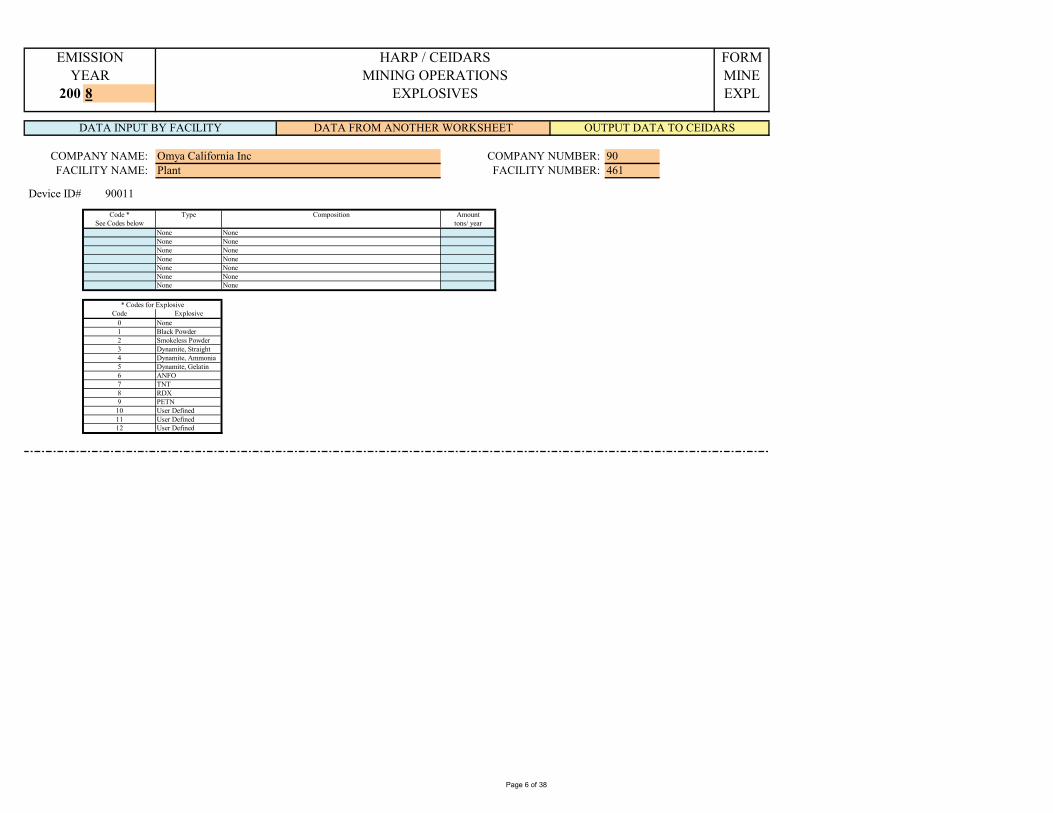
Page 6 of 38
FORMMINE
200 8 EXPL
90461
Device ID# 90011
Code * Type AmountSee Codes below tons/ year
NoneNoneNoneNoneNoneNoneNone
Code Explosive0 None1 Black Powder2 Smokeless Powder3 Dynamite, Straight4 Dynamite, Ammonia5 Dynamite, Gelatin6 ANFO7 TNT8 RDX9 PETN10 User Defined11 User Defined12 User Defined
EMISSION HARP / CEIDARSYEAR MINING OPERATIONS
EXPLOSIVES
DATA INPUT BY FACILITY DATA FROM ANOTHER WORKSHEET OUTPUT DATA TO CEIDARS
COMPANY NAME: Omya California Inc COMPANY NUMBER: FACILITY NAME: Plant FACILITY NUMBER:
Composition
NoneNoneNoneNoneNoneNoneNone
* Codes for Explosive

Page 7 of 38
FORMMINE
200 8 EXPL
EMISSION HARP / CEIDARSYEAR MINING OPERATIONS
EXPLOSIVES
Device ID# 90011 SCC 30502514
Code Type Amounttons/ year CO NOx TOG CO NOx TOG
0 None 0.000 0 0 0 0.000 0.000 0.0000 None 0.000 0 0 0 0.000 0.000 0.0000 None 0.000 0 0 0 0.000 0.000 0.0000 None 0.000 0 0 0 0.000 0.000 0.0000 None 0.000 0 0 0 0.000 0.000 0.0000 None 0.000 0 0 0 0.000 0.000 0.0000 None 0.000 0 0 0 0.000 0.000 0.000
INPUTS 0.000 #DIV/0! #DIV/0! #DIV/0!Number of Devices 0
INPUTS 0.000 0.000 0.000
Code Explosive
CO NOx TOG0 None 0.0 0.0 0.01 Black Powder 170.0 0.0 4.22 Smokeless Powder 77.0 0.0 1.13 Dynamite, Straight 281.0 0.0 2.54 Dynamite, Ammonia 63.0 0.0 1.35 Dynamite, Gelatin 104.0 53.0 0.76 ANFO 67.0 17.0 0.07 TNT 796.0 0.0 14.38 RDX 196.0 0.0 0.09 PETN 297.0 0.0 0.0
10 User Defined User Defined User Defined User Defined11 User Defined User Defined User Defined User Defined12 User Defined User Defined User Defined User Defined13 Out of Range Out of Range Out of Range Out of Range
Explosive Emission Factor
EMISSIONS
Emission Ratepounds per ton ton per year
Emission FactorsPounds per ton of explosive
Composition
LOOKUP TABLE
NonePotassium Nitrate, Charcoal and SulfurNitrocelluloseNitroglycerine, Sodium Nitrate, Wood Pulp, Calcium CarbonateNitroglycerine, Ammonium Nitrate, Sodium Nitrate, Wood PulpNitroglycerineAmmonium Nitrate, Fuel OilTrinitrotoluene
User DefinedOut of Range
CyclotrimethylenetriittoaminePentaerythritol TetranitrateUser DefinedUser Defined

Page 8 of 38
FORMMINE
200 8 BSG
90461
Device ID# 90012a
Name of MaterialBulldozing Scraping Grading Other Total None Wind Screen
Check Check New Moisture (%) CheckLimestone 253 253 x 3
0 00 00 00 00 00 00 00 00 00 00 00 00 00 0
Hours of Operations (hours per year) ControlsWater Spray
COMPANY NAME: Omya California Inc COMPANY NUMBER: FACILITY NAME: Plant FACILITY NUMBER:
DATA INPUT BY FACILITY DATA FROM ANOTHER WORKSHEET OUTPUT DATA TO CEIDARS
EMISSION HARP / CEIDARSYEAR MINING OPERATIONS
BULLDOZING, SCRAPING AND GRADING OF MATERIAL

Page 9 of 38
FORMMINE
200 8 BSG
EMISSION HARP / CEIDARSYEAR MINING OPERATIONS
BULLDOZING, SCRAPING AND GRADING OF MATERIAL
Device ID# 90012a SCC 30502599
Emission Factors (pounds per hours of operations)EmFac = 2.76 * k *(s)^1.5 / (M)^1.4
k = Aerodynamic Factor Aerodynamic factorss = silt content (%) TSP = 0.74
M = Moisture content (%) PM10 = 0.36PM2.5 = 0.11
Material Hours of OperationsTSP PM10 PM2.5 PM10 PM2.5
Limestone 253 2.127 1.035 0.316 0.486 0.1490 0 0.000 0.000 0.000 0.000 0.0000 0 0.000 0.000 0.000 0.000 0.0000 0 0.000 0.000 0.000 0.000 0.0000 0 0.000 0.000 0.000 0.000 0.0000 0 0.000 0.000 0.000 0.000 0.0000 0 0.000 0.000 0.000 0.000 0.0000 0 0.000 0.000 0.000 0.000 0.0000 0 0.000 0.000 0.000 0.000 0.0000 0 0.000 0.000 0.000 0.000 0.0000 0 0.000 0.000 0.000 0.000 0.0000 0 0.000 0.000 0.000 0.000 0.0000 0 0.000 0.000 0.000 0.000 0.0000 0 0.000 0.000 0.000 0.000 0.0000 0 0.000 0.000 0.000 0.000 0.000
TOTAL 253 2.127 1.035 0.316 0.486 0.149Number of Devices 1
Emission factors - Uncontrolled (pounds per hour) Fractionation Value
EMISSIONS

Page 10 of 38
FORMMINE
200 8 BSG
EMISSION HARP / CEIDARSYEAR MINING OPERATIONS
BULLDOZING, SCRAPING AND GRADING OF MATERIAL
MaterialType Efficiency (%) TSP PM10 PM2.5 TSP PM10 PM2.5
Limestone Water Spray 62.107 0.806 0.392 0.120 0.102 0.050 0.0150 None 0.000 0.000 0.000 0.000 0.000 0.000 0.0000 None 0.000 0.000 0.000 0.000 0.000 0.000 0.0000 None 0.000 0.000 0.000 0.000 0.000 0.000 0.0000 None 0.000 0.000 0.000 0.000 0.000 0.000 0.0000 None 0.000 0.000 0.000 0.000 0.000 0.000 0.0000 None 0.000 0.000 0.000 0.000 0.000 0.000 0.0000 None 0.000 0.000 0.000 0.000 0.000 0.000 0.0000 None 0.000 0.000 0.000 0.000 0.000 0.000 0.0000 None 0.000 0.000 0.000 0.000 0.000 0.000 0.0000 None 0.000 0.000 0.000 0.000 0.000 0.000 0.0000 None 0.000 0.000 0.000 0.000 0.000 0.000 0.0000 None 0.000 0.000 0.000 0.000 0.000 0.000 0.0000 None 0.000 0.000 0.000 0.000 0.000 0.000 0.0000 None 0.000 0.000 0.000 0.000 0.000 0.000 0.000
TOTAL 62.11 0.806 0.392 0.120
TOTAL 0.102 0.050 0.015
Control Emission factors - Controlled (pounds per hour) Emissions - tons per year

Page 11 of 38
FORMMINE
200 8 LOAD
90461
DEVICE # 90006,7,8,9
Name of Material AmountLoaded None Wind Screen
tpy Check Check New Moisture (%) Check Check Specify Efficiency (%)Limestone 5,418 x 2
00000000000000
Water Spray OtherControls
COMPANY NAME: Omya California Inc COMPANY NUMBER: FACILITY NAME: Plant FACILITY NUMBER:
LOADING OF MATERIAL(S) AT MINE / QUARRY / PIT
DATA INPUT BY FACILITY DATA FROM ANOTHER WORKSHEET OUTPUT DATA TO CEIDARS
EMISSION HARP / CEIDARSYEAR MINING OPERATIONS

Page 12 of 38
FORMMINE
200 8 LOADLOADING OF MATERIAL(S) AT MINE / QUARRY / PIT
EMISSION HARP / CEIDARSYEAR MINING OPERATIONS
Device ID# 90006,7,8,9 SCC 30502506
Emission Factors (pounds per ton)EmFac =0.0032 * k *(U/5)^1.3 / (M/2)^1.4
k = Aerodynamic Factor Aerodynamic factorsU = Mean wind speed in miles per hour TSP = 0.74M = Moisture content (%) PM10 = 0.36
PM2.5 = 0.11
Material AmountLoaded TSP PM10 PM2.5 PM10 PM2.5
tpyLimestone 5,418 0.002 0.001 0.000 0.486 0.149
0 0 0.000 0.000 0.000 0.000 0.0000 0 0.000 0.000 0.000 0.000 0.0000 0 0.000 0.000 0.000 0.000 0.0000 0 0.000 0.000 0.000 0.000 0.0000 0 0.000 0.000 0.000 0.000 0.0000 0 0.000 0.000 0.000 0.000 0.0000 0 0.000 0.000 0.000 0.000 0.0000 0 0.000 0.000 0.000 0.000 0.0000 0 0.000 0.000 0.000 0.000 0.0000 0 0.000 0.000 0.000 0.000 0.0000 0 0.000 0.000 0.000 0.000 0.0000 0 0.000 0.000 0.000 0.000 0.0000 0 0.000 0.000 0.000 0.000 0.0000 0 0.000 0.000 0.000 0.000 0.000
TOTAL 5,418 0.002 0.001 0.000 0.486 0.149Number of Devices 1
Emission factors - Uncontrolled (pounds per ton) Fractionation Value
EMISSIONS

Page 13 of 38
FORMMINE
200 8 LOADLOADING OF MATERIAL(S) AT MINE / QUARRY / PIT
EMISSION HARP / CEIDARSYEAR MINING OPERATIONS
MaterialType Efficiency (%) TSP PM10 PM2.5 TSP PM10 PM2.5
Limestone Water Spray 33.152 0.001 0.001 0.000 0.004 0.002 0.0010 None 0.000 0.000 0.000 0.000 0.000 0.000 0.0000 None 0.000 0.000 0.000 0.000 0.000 0.000 0.0000 None 0.000 0.000 0.000 0.000 0.000 0.000 0.0000 None 0.000 0.000 0.000 0.000 0.000 0.000 0.0000 None 0.000 0.000 0.000 0.000 0.000 0.000 0.0000 None 0.000 0.000 0.000 0.000 0.000 0.000 0.0000 None 0.000 0.000 0.000 0.000 0.000 0.000 0.0000 None 0.000 0.000 0.000 0.000 0.000 0.000 0.0000 None 0.000 0.000 0.000 0.000 0.000 0.000 0.0000 None 0.000 0.000 0.000 0.000 0.000 0.000 0.0000 None 0.000 0.000 0.000 0.000 0.000 0.000 0.0000 None 0.000 0.000 0.000 0.000 0.000 0.000 0.0000 None 0.000 0.000 0.000 0.000 0.000 0.000 0.0000 None 0.000 0.000 0.000 0.000 0.000 0.000 0.000
TOTAL 33.15 0.001 0.001 0.000
TOTAL 0.004 0.002 0.001
Control Emission factors - Controlled (pounds per ton) Emissions - tons per year

Page 14 of 38
. .. .
HOURS per DAY ROCK DAYS per WEEK SAND WEEK per YEAR
LIMESTONE CAL. HRS per YR LAVA ROCK ACT. HRS per YR
OTHER CAL. Hrs/Yr = Hr/Dy*Dy/Wk*Wk/Yr
PROCESS NAME Ball Mill #1
Electrostatic PrecipitatorSee Lookup Table "ConEff" for data
597.5TOTAL HORSEPOWER
Venturi Scrubber (High Efficiency)Baghouse with Multiple PickupsBaghouse with Single Pickup (Unenclosed)Baghouse with Single Pickup (Partial Enclosed)Baghouse with Single Pickup (Full Enclosed)
Conveyor with Half Cover
XII - TYPE OF EMISSION CONTROL EQUIPMENTCODE NAME OF DEVICE OR SYSTEM CODE NAME OF DEVICE OR SYSTEM CODE TYPE OF CONTROL
Spray Tower (Low Efficiency)Wet Scrubber (Med Efficiency)
NoneWater Spray, Point of ApplicationSpray with Additives, Point of Application
Gravel Bed Filters
OTHER COMMENTS
XI - TYPE OF OPERATION AND / OR DEVICE TYPE OF CONTROL CODE
VI - TYPE OF EQUIPMENT, check all that applies:x x
V - TYPE OF PLANT
AVERAGE THROUGHPUT PER DEVICE
SCREENS CONVEYORS
OTHERS
PORTABLE x check all that applies
52 50.0
19,3625 8HOURLY (average)
x
TRANSFER STORAGE
LATITUDE (deg.) LONGITUDE (deg.)
STATIONARY CRUSHERS
UTM NORTH (km)
Plant
IV - MAP COORDINATES FOR PROCESS
BLOCK IX - ANNUAL THROUGHPUT (tpy)BLOCK X - MOISTURE CONTENT (%) OF MATERIAL
UTM ZONE UTM EAST (km) 11
INVENTORY ID # DEVICE ID
PROCESS ID 4619000461
3
FACILITY #
Baghouse with Single Pickup (Attached)
FLOW DIAGRAMBLOCK III - ALL ITEMSBLOCK VIII - ACTUAL HOURS OPERATED
IX - THROUGHPUT (tons per year)10
200 8
COMPANY NAME PERMIT #
AGGREGATE HANDLING, CRUSHING & SCREENING #1
FORMYEAR MINING OPERATIONS MINE
EMISSION HARP / CEIDARS
AGG
0 290
II - MANDATORY INFORMATIONI - COLOR CODEDATA INPUT BY FACILITY DATA FROM ANOTHER WORKSHEET OUTPUT DATA TO CEIDARS
III - FACILITY INFORMATIONOmya California Inc 0
FACILITY NAME B 0 0 2COMPANY #
5 0 5 3 1 6 8 0 4 4 1 53 4 3 8 3 7 1 1 6
VII - MATERIAL TYPES VIII - OPERATING SCHEDULE9 4 2 2
x LOAD OUT
2500COMMENTS
0 11 0 11Screening, Wet Washing (Note 4)No Device1 12 1 12Silo, Filling - PneumaticDump to Hopper, truck, pile (Note 2)2 13 2 13Silo, Filling - Bucket ElevatorGrizzly (Note 2)3 14 3 14Silo, discharge to Conveyor (Note 2)Hopper (Note 2)4 15 4 15Silo, discharge to Tank TruckTransfer Point (Note 2) Conveyor with Three Quarter Cover5 16 5 16Loading Open Top Truck (Note 2)Conveyor (Note 2) Conveyor with Full Cover6 17 6 17FeederCrushing, Dry - Primary Process Enclosure7 18 7 18See Lookup Table "EmFac" for dataCrushing, Dry - Secondary Gravity Separator8 19 8 19Crushing, Dry - Tertiary See Lookup Table "EmFac" for data Cyclone - Simple9 20 9 20Crushing, Wet (Note 3) See Lookup Table "EmFac" for data Cyclone - Multiple
10 21 10 21Screening, Dry See Lookup Table "EmFac" for data Windscreen, Windward Side
XIII - EMISSION CALCULATIONSEQUIPMENT DEVICE NAME OF DEVICE MOTOR THROUGHPUT EMISSION CONTROL DEVICE EMISSION FACTORS EMISSION RATE
ID CODE BHP TONS / YEAR CODE DsF NAME OF DEVICE EFF % POUNDS PER TON TONS PER YEARNUMBER NO PM30 PM10 PM2.5 PM30 PM10 PM2.5
(A) (B) (C) (D) (E) (F) (G) (H) (I) (J) (K) (L) (M) (N) (O)
43-001 12 Silo, Filling - Pneumatic NA 19,362 18 Baghouse with Single Pickup (Full En 99.0 0.270 0.016 0.005 0.03 0.00 0.00
43-005 17 Feeder 1.5 19,362 18 Baghouse with Single Pickup (Full En 99.0 0.002 0.001 0.000 0.00 0.00 0.00
43-006 5 Conveyor (Note 2) 10 19,362 18 Baghouse with Single Pickup (Full En 99.0 0.002 0.001 0.000 0.00 0.00 0.00
43-007 3 Hopper (Note 2) NA 19,362 15 Baghouse with Multiple Pickups 95.0 0.002 0.001 0.000 0.00 0.00 0.00
43-010 17 Feeder 5 19,362 15 Baghouse with Multiple Pickups 95.0 0.002 0.001 0.000 0.00 0.00 0.00
43-011 8 Crushing, Dry - Tertiary 500 19,362 15 Baghouse with Multiple Pickups 95.0 1.850 0.112 0.035 0.90 0.05 0.02
43-027 17 Feeder 2 19,362 15 Baghouse with Multiple Pickups 95.0 0.002 0.001 0.000 0.00 0.00 0.00
43-035 4 Transfer Point (Note 2) 50 19,362 15 Baghouse with Multiple Pickups 95.0 0.002 0.001 0.000 0.00 0.00 0.00
43-043 4 Transfer Point (Note 2) NA 19,362 18 Baghouse with Single Pickup (Full En 99.0 0.002 0.001 0.000 0.00 0.00 0.00
43-049 17 Feeder 1 19,362 18 Baghouse with Single Pickup (Full En 99.0 0.002 0.001 0.000 0.00 0.00 0.00
43-055 4 Transfer Point (Note 2) 15 19,362 18 Baghouse with Single Pickup (Full En 99.0 0.002 0.001 0.000 0.00 0.00 0.00
43-050 17 Feeder 1.5 19,362 18 Baghouse with Single Pickup (Full En 99.0 0.002 0.001 0.000 0.00 0.00 0.00
43-036 17 Feeder 1.5 7,744 18 Baghouse with Single Pickup (Full En 99.0 0.002 0.001 0.000 0.00 0.00 0.00
43-037 5 Conveyor (Note 2) 10 7,744 18 Baghouse with Single Pickup (Full En 99.0 0.002 0.001 0.000 0.00 0.00 0.00
No Device None 0.0 0.000 0.000 0.000 0.00 0.00 0.00
17,702
EMISSION DATA
BLOCK XIV - EMISSIONS & HARP INPUTS
PERMIT ID PM2.5ANNUAL EMISSIONS (tpy) PM PM10
DEVICE DATA
EMISSION INVENTORY INPUTS
UNCONTROLLED 20.770 1.356 0.424
CONTROLLED 0.928 0.059 0.018
UNCONTROLLED 2.1454 0.1400 0.0438
EMISSION FACTOR (lb/ton)
0.0019
FRACTIONATION VALUE ( PM10 or PM2.5 / PM) 0.0632 0.0198
0.0958 0.0061CONTROLLED
X - MOISTURE CONTENT (%)MOISTURE CONTENT ENTERING SYS.: 3 %
2002
95.67OVERALL EFFICIENCY 95.53 95.67
ENTERING THE SYSTEM
ACTUAL ANNUAL
Hourly (average) = Annual (actual) / Actual Hours per Year (operated)2600
BLOCK XIII, COLUMNS 'B', 'E', 'F' & 'G'
MAX. DESIGN RATE
Tons/Yr.TPHTPH
50
14
B002002
8
MAX. HOURLY PRODUCTION RATE (tph)
PROCESS DATA
EQUIPMENT SIZE (bhp)
NUMBER OF DEVICES
597.5
AVE. HOURLY PRODUCTION RATE (tph)
50
MAX. DESIGN RATE (tph)
PROCESS RATE (tpy) 19,362

Page 15 of 38
. .. .
HOURS per DAY ROCK DAYS per WEEK SAND WEEK per YEAR
LIMESTONE CAL. HRS per YR LAVA ROCK ACT. HRS per YR
OTHER CAL. Hrs/Yr = Hr/Dy*Dy/Wk*Wk/Yr
EMISSION HARP / CEIDARS FORMYEAR MINING OPERATIONS MINE200 8 AGGREGATE HANDLING, CRUSHING & SCREENING #1 AGG
I - COLOR CODE II - MANDATORY INFORMATIONDATA INPUT BY FACILITY DATA FROM ANOTHER WORKSHEET OUTPUT DATA TO CEIDARS FLOW DIAGRAM
III - FACILITY INFORMATION BLOCK III - ALL ITEMSCOMPANY NAME Omya California Inc COMPANY # 90 PERMIT # B 0 0 0 7 5 7 BLOCK VIII - ACTUAL HOURS OPERATED
FACILITY NAME Plant FACILITY # 461 DEVICE ID 757 BLOCK IX - ANNUAL THROUGHPUT (tpy)PROCESS NAME Tertiary Crushing INVENTORY ID # 9000461 PROCESS ID BLOCK X - MOISTURE CONTENT (%) OF MATERIAL
IV - MAP COORDINATES FOR PROCESS ENTERING THE SYSTEMUTM ZONE 11 UTM EAST (km) 5 0 5 3 1 6 BLOCK XIII, COLUMNS 'B', 'E', 'F' & 'G'
LATITUDE (deg.) 3 4 3 8 3UTM NORTH (km) 3 8
1 6 91 50 4 4
4 2 27 LONGITUDE (deg.) 1V - TYPE OF PLANT VI - TYPE OF EQUIPMENT, check all that applies: VII - MATERIAL TYPES VIII - OPERATING SCHEDULE IX - THROUGHPUT (tons per year)
STATIONARY x CRUSHERS x TRANSFER x check all that applies 10 ACTUAL ANNUAL 365,535 Tons/Yr.PORTABLE SCREENS x STORAGE 5 HOURLY (average) 146 TPH
OTHER CONVEYORS x LOAD OUT x 52 MAX. DESIGN RATE 400.0 TPHCOMMENTS OTHERS x 2600 Hourly (average) = Annual (actual) / Actual Hours per Year (operated)
COMMENTS 2500 X - MOISTURE CONTENT (%)MOISTURE CONTENT ENTERING SYS.: 3 %
XI - TYPE OF OPERATION AND / OR DEVICE XII - TYPE OF EMISSION CONTROL EQUIPMENTCODE NAME OF DEVICE OR SYSTEM CODE NAME OF DEVICE OR SYSTEM CODE TYPE OF CONTROL CODE TYPE OF CONTROL
0 No Device 11 Screening, Wet Washing (Note 4) 0 None 11 Gravel Bed Filters1 Dump to Hopper, truck, pile (Note 2) 12 Silo, Filling - Pneumatic 1 Water Spray, Point of Application 12 Spray Tower (Low Efficiency)2 Grizzly (Note 2) 13 Silo, Filling - Bucket Elevator 2 Spray with Additives, Point of Application 13 Wet Scrubber (Med Efficiency)3 Hopper (Note 2) 14 Silo, discharge to Conveyor (Note 2) 3 Conveyor with Half Cover 14 Venturi Scrubber (High Efficiency)4 Transfer Point (Note 2) 15 Silo, discharge to Tank Truck 4 Conveyor with Three Quarter Cover 15 Baghouse with Multiple Pickups5 Conveyor (Note 2) 16 Loading Open Top Truck (Note 2) 5 Conveyor with Full Cover 16 Baghouse with Single Pickup (Unenclosed)6 Crushing, Dry - Primary 17 Feeder 6 Process Enclosure 17 Baghouse with Single Pickup (Partial Enclosed)7 Crushing, Dry - Secondary 18 See Lookup Table "EmFac" for data 7 Gravity Separator 18 Baghouse with Single Pickup (Full Enclosed)8 Crushing, Dry - Tertiary 19 See Lookup Table "EmFac" for data 8 Cyclone - Simple 19 Baghouse with Single Pickup (Attached)9 Crushing, Wet (Note 3) 20 See Lookup Table "EmFac" for data 9 Cyclone - Multiple 20 Electrostatic Precipitator10 Screening, Dry 21 See Lookup Table "EmFac" for data 10 Windscreen, Windward Side 21 See Lookup Table "ConEff" for data
XIII - EMISSION CALCULATIONSEQUIPMENT DEVICE NAME OF DEVICE MOTOR THROUGHPUT EMISSION CONTROL DEVICE EMISSION FACTORS EMISSION RATE
ID CODE BHP TONS / YEAR CODE DsF NAME OF DEVICE EFF % POUNDS PER TON TONS PER YEARNUMBER NO PM30 PM10 PM2.5 PM30 PM10 PM2.5
(A) (B) (C) (D) (E) (F) (G) (H) (I) (J) (K) (L) (M) (N) (O)
BH-1.1 4 Transfer Point (Note 2) 1 61,044 15 Baghouse with Multiple Pickups 95.0 0.002 0.001 0.000 0.00 0.00 0.00
BH-1.2 4 Transfer Point (Note 2) 1 61,044 15 Baghouse with Multiple Pickups 95.0 0.002 0.001 0.000 0.00 0.00 0.00
BH-1.3 4 Transfer Point (Note 2) 1 61,044 15 Baghouse with Multiple Pickups 95.0 0.002 0.001 0.000 0.00 0.00 0.00
BH-1.4 4 Transfer Point (Note 2) 1 61,044 15 Baghouse with Multiple Pickups 95.0 0.002 0.001 0.000 0.00 0.00 0.00
BH-1.5 4 Transfer Point (Note 2) 1 61,044 15 Baghouse with Multiple Pickups 95.0 0.002 0.001 0.000 0.00 0.00 0.00
BH-1.6 4 Transfer Point (Note 2) 1 61,044 15 Baghouse with Multiple Pickups 95.0 0.002 0.001 0.000 0.00 0.00 0.00
40-118 5 Conveyor (Note 2) 10 183,223 15 Baghouse with Multiple Pickups 95.0 0.002 0.001 0.000 0.01 0.01 0.00
40-107 5 Conveyor (Note 2) 15 366,445 15 Baghouse with Multiple Pickups 95.0 0.002 0.001 0.000 0.02 0.01 0.00
40-014 8 Crushing, Dry - Tertiary 300 366,445 15 Baghouse with Multiple Pickups 95.0 1.850 0.112 0.035 16.95 1.03 0.32
40-015 5 Conveyor (Note 2) 10 366,445 15 Baghouse with Multiple Pickups 95.0 0.002 0.001 0.000 0.02 0.01 0.00
40-017 4 Transfer Point (Note 2) NA 366,445 15 Baghouse with Multiple Pickups 95.0 0.002 0.001 0.000 0.02 0.01 0.00
40-122 5 Conveyor (Note 2) 15 40,563 15 Baghouse with Multiple Pickups 95.0 0.002 0.001 0.000 0.00 0.00 0.00
30 4 Transfer Point (Note 2) NA 40,563 15 Baghouse with Multiple Pickups 95.0 0.002 0.001 0.000 0.00 0.00 0.00
40-001 5 Conveyor (Note 2) 10 324,971 15 Baghouse with Multiple Pickups 95.0 0.002 0.001 0.000 0.02 0.01 0.00
40-006 5 Conveyor (Note 2) 7.5 324,971 15 Baghouse with Multiple Pickups 95.0 0.002 0.001 0.000 0.02 0.01 0.00
40-007 5 Conveyor (Note 2) 3 324,971 15 Baghouse with Multiple Pickups 95.0 0.002 0.001 0.000 0.02 0.01 0.00
40-008 13 Silo, Filling - Bucket Elevator 30 324,971 15 Baghouse with Multiple Pickups 95.0 0.240 0.015 0.004 1.95 0.12 0.03
40-009 4 Transfer Point (Note 2) 0.5 324,971 15 Baghouse with Multiple Pickups 95.0 0.002 0.001 0.000 0.02 0.01 0.00
40-010 4 Transfer Point (Note 2) NA 180,164 15 Baghouse with Multiple Pickups 95.0 0.002 0.001 0.000 0.01 0.01 0.00
40-011 5 Conveyor (Note 2) 3 86,309 15 Baghouse with Multiple Pickups 95.0 0.002 0.001 0.000 0.01 0.00 0.00
TOTAL HORSEPOWER 410
AVERAGE THROUGHPUT PER DEVICE 199,386
BLOCK XIV - EMISSIONS & HARP INPUTS
EMISSION INVENTORY INPUTSDEVICE DATA EMISSION DATA
PERMIT ID B000757 ANNUAL EMISSIONS (tpy) PM PM10 PM2.5
NUMBER OF DEVICES 20 UNCONTROLLED 381.836 24.792 7.639
EQUIPMENT SIZE (bhp) 410 CONTROLLED 19.092 1.240 0.382
PROCESS DATA EMISSION FACTOR (lb/ton)
PROCESS RATE (tpy) 365,535 UNCONTROLLED 2.0892 0.1357 0.0418
MAX. DESIGN RATE (tph) 400 CONTROLLED 0.1045 0.0068 0.0021
MAX. HOURLY PRODUCTION RATE (tph) 400 FRACTIONATION VALUE ( PM10 or PM2.5 / PM) 0.0649 0.0200
AVE. HOURLY PRODUCTION RATE (tph) 146 OVERALL EFFICIENCY 95.00 95.00 95.00

Page 16 of 38
. .. .
HOURS per DAY ROCK DAYS per WEEK SAND WEEK per YEAR
LIMESTONE CAL. HRS per YR LAVA ROCK ACT. HRS per YR
OTHER CAL. Hrs/Yr = Hr/Dy*Dy/Wk*Wk/Yr
EMISSION HARP / CEIDARS FORMYEAR MINING OPERATIONS MINE200 8 AGGREGATE HANDLING, CRUSHING & SCREENING #1 AGG
I - COLOR CODE II - MANDATORY INFORMATIONDATA INPUT BY FACILITY DATA FROM ANOTHER WORKSHEET OUTPUT DATA TO CEIDARS FLOW DIAGRAM
III - FACILITY INFORMATION BLOCK III - ALL ITEMSCOMPANY NAME Omya California Inc COMPANY # 90 PERMIT # B 0 0 0 7 6 3 BLOCK VIII - ACTUAL HOURS OPERATED
FACILITY NAME Plant FACILITY # 461 DEVICE ID 763 BLOCK IX - ANNUAL THROUGHPUT (tpy)PROCESS NAME Roller Mill #1 INVENTORY ID # 9000461 PROCESS ID BLOCK X - MOISTURE CONTENT (%) OF MATERIAL
IV - MAP COORDINATES FOR PROCESS ENTERING THE SYSTEMUTM ZONE 11 UTM EAST (km) 5 0 5 3 1 6 BLOCK XIII, COLUMNS 'B', 'E', 'F' & 'G'
LATITUDE (deg.) 3 4 3 8 3UTM NORTH (km) 3 8
1 6 91 50 4 4
4 2 27 LONGITUDE (deg.) 1V - TYPE OF PLANT VI - TYPE OF EQUIPMENT, check all that applies: VII - MATERIAL TYPES VIII - OPERATING SCHEDULE IX - THROUGHPUT (tons per year)
STATIONARY x CRUSHERS x TRANSFER x check all that applies 10 ACTUAL ANNUAL 36,873 Tons/Yr.PORTABLE SCREENS STORAGE x 5 HOURLY (average) 15 TPH
OTHER CONVEYORS x LOAD OUT 52 MAX. DESIGN RATE 50.0 TPHCOMMENTS OTHERS x 2600 Hourly (average) = Annual (actual) / Actual Hours per Year (operated)
COMMENTS 2500 X - MOISTURE CONTENT (%)MOISTURE CONTENT ENTERING SYS.: 3 %
XI - TYPE OF OPERATION AND / OR DEVICE XII - TYPE OF EMISSION CONTROL EQUIPMENTCODE NAME OF DEVICE OR SYSTEM CODE NAME OF DEVICE OR SYSTEM CODE TYPE OF CONTROL CODE TYPE OF CONTROL
0 No Device 11 Screening, Wet Washing (Note 4) 0 None 11 Gravel Bed Filters1 Dump to Hopper, truck, pile (Note 2) 12 Silo, Filling - Pneumatic 1 Water Spray, Point of Application 12 Spray Tower (Low Efficiency)2 Grizzly (Note 2) 13 Silo, Filling - Bucket Elevator 2 Spray with Additives, Point of Application 13 Wet Scrubber (Med Efficiency)3 Hopper (Note 2) 14 Silo, discharge to Conveyor (Note 2) 3 Conveyor with Half Cover 14 Venturi Scrubber (High Efficiency)4 Transfer Point (Note 2) 15 Silo, discharge to Tank Truck 4 Conveyor with Three Quarter Cover 15 Baghouse with Multiple Pickups5 Conveyor (Note 2) 16 Loading Open Top Truck (Note 2) 5 Conveyor with Full Cover 16 Baghouse with Single Pickup (Unenclosed)6 Crushing, Dry - Primary 17 Feeder 6 Process Enclosure 17 Baghouse with Single Pickup (Partial Enclosed)7 Crushing, Dry - Secondary 18 See Lookup Table "EmFac" for data 7 Gravity Separator 18 Baghouse with Single Pickup (Full Enclosed)8 Crushing, Dry - Tertiary 19 See Lookup Table "EmFac" for data 8 Cyclone - Simple 19 Baghouse with Single Pickup (Attached)9 Crushing, Wet (Note 3) 20 See Lookup Table "EmFac" for data 9 Cyclone - Multiple 20 Electrostatic Precipitator
10 Screening, Dry 21 See Lookup Table "EmFac" for data 10 Windscreen, Windward Side 21 See Lookup Table "ConEff" for data
XIII - EMISSION CALCULATIONSEQUIPMENT DEVICE NAME OF DEVICE MOTOR THROUGHPUT EMISSION CONTROL DEVICE EMISSION FACTORS EMISSION RATE
ID CODE BHP TONS / YEAR CODE DsF NAME OF DEVICE EFF % POUNDS PER TON TONS PER YEARNUMBER NO PM30 PM10 PM2.5 PM30 PM10 PM2.5
(A) (B) (C) (D) (E) (F) (G) (H) (I) (J) (K) (L) (M) (N) (O)
41-001 12 Silo, Filling - Pneumatic NA 36,873 15 Baghouse with Multiple Pickups 95.0 0.270 0.016 0.005 0.25 0.01 0.00
41-008 17 Feeder 5 36,873 15 Baghouse with Multiple Pickups 95.0 0.002 0.001 0.000 0.00 0.00 0.00
41-009 8 Crushing, Dry - Tertiary 250 36,873 15 Baghouse with Multiple Pickups 95.0 1.850 0.112 0.035 1.71 0.10 0.03
41-010,12 0 No Device 300 0 0 None 0.0 0.000 0.000 0.000 0.00 0.00 0.00
41-011 4 Transfer Point (Note 2) NA 36,873 8 Cyclone - Simple 50.0 0.002 0.001 0.000 0.02 0.01 0.00
41-024 4 Transfer Point (Note 2) 4.5 36,873 15 Baghouse with Multiple Pickups 95.0 0.002 0.001 0.000 0.00 0.00 0.00
41-025 5 Conveyor (Note 2) 2 13,684 15 Baghouse with Multiple Pickups 95.0 0.002 0.001 0.000 0.00 0.00 0.00
41-040 17 Feeder NA 13,684 15 Baghouse with Multiple Pickups 95.0 0.002 0.001 0.000 0.00 0.00 0.00
41-042 4 Transfer Point (Note 2) 210 13,684 15 Baghouse with Multiple Pickups 95.0 0.002 0.001 0.000 0.00 0.00 0.00
41-029 4 Transfer Point (Note 2) 2 36,873 15 Baghouse with Multiple Pickups 95.0 0.002 0.001 0.000 0.00 0.00 0.00
41-044 4 Transfer Point (Note 2) NA 2,686 9 Cyclone - Multiple 66.0 0.002 0.001 0.000 0.00 0.00 0.00
41-051 4 Transfer Point (Note 2) 1.5 2,686 15 Baghouse with Multiple Pickups 95.0 0.002 0.001 0.000 0.00 0.00 0.00
41-041 4 Transfer Point (Note 2) 2 2,686 15 Baghouse with Multiple Pickups 95.0 0.002 0.001 0.000 0.00 0.00 0.00
TOTAL HORSEPOWER 777
AVERAGE THROUGHPUT PER DEVICE 20,796
BLOCK XIV - EMISSIONS & HARP INPUTS
EMISSION INVENTORY INPUTSDEVICE DATA EMISSION DATA
PERMIT ID B000763 ANNUAL EMISSIONS (tpy) PM PM10 PM2.5
NUMBER OF DEVICES 13 UNCONTROLLED 39.317 2.469 0.772
EQUIPMENT SIZE (bhp) 777 CONTROLLED 1.986 0.133 0.042
PROCESS DATA EMISSION FACTOR (lb/ton)
PROCESS RATE (tpy) 36,873 UNCONTROLLED 2.1325 0.1339 0.0419
MAX. DESIGN RATE (tph) 50 CONTROLLED 0.1077 0.0072 0.0023
MAX. HOURLY PRODUCTION RATE (tph) 50 FRACTIONATION VALUE ( PM10 or PM2.5 / PM) 0.0670 0.0210
AVE. HOURLY PRODUCTION RATE (tph) 15 OVERALL EFFICIENCY 94.95 94.61 94.61

Page 17 of 38
. .. .
HOURS per DAY ROCK DAYS per WEEK SAND WEEK per YEAR
LIMESTONE CAL. HRS per YR LAVA ROCK ACT. HRS per YR
OTHER CAL. Hrs/Yr = Hr/Dy*Dy/Wk*Wk/Yr
EMISSION HARP / CEIDARS FORMYEAR MINING OPERATIONS MINE200 8 AGGREGATE HANDLING, CRUSHING & SCREENING #1 AGG
I - COLOR CODE II - MANDATORY INFORMATIONDATA INPUT BY FACILITY DATA FROM ANOTHER WORKSHEET OUTPUT DATA TO CEIDARS FLOW DIAGRAM
III - FACILITY INFORMATION BLOCK III - ALL ITEMSCOMPANY NAME Omya California Inc COMPANY # 90 PERMIT # B 0 0 0 7 6 3 BLOCK VIII - ACTUAL HOURS OPERATED
FACILITY NAME Plant FACILITY # 461 DEVICE ID 763 BLOCK IX - ANNUAL THROUGHPUT (tpy)PROCESS NAME Roller Mill #2 INVENTORY ID # 9000461 PROCESS ID BLOCK X - MOISTURE CONTENT (%) OF MATERIAL
IV - MAP COORDINATES FOR PROCESS ENTERING THE SYSTEMUTM ZONE 11 UTM EAST (km) 5 0 5 3 1 6 BLOCK XIII, COLUMNS 'B', 'E', 'F' & 'G'
LATITUDE (deg.) 3 4 3 8 3UTM NORTH (km) 3 8
1 6 91 50 4 4
4 2 27 LONGITUDE (deg.) 1V - TYPE OF PLANT VI - TYPE OF EQUIPMENT, check all that applies: VII - MATERIAL TYPES VIII - OPERATING SCHEDULE IX - THROUGHPUT (tons per year)
STATIONARY x CRUSHERS x TRANSFER x check all that applies 10 ACTUAL ANNUAL 146,708 Tons/Yr.PORTABLE SCREENS STORAGE x 5 HOURLY (average) 59 TPH
OTHER CONVEYORS x LOAD OUT 52 MAX. DESIGN RATE 100.0 TPHCOMMENTS OTHERS x 2600 Hourly (average) = Annual (actual) / Actual Hours per Year (operated)
COMMENTS 2500 X - MOISTURE CONTENT (%)MOISTURE CONTENT ENTERING SYS.: 3 %
XI - TYPE OF OPERATION AND / OR DEVICE XII - TYPE OF EMISSION CONTROL EQUIPMENTCODE NAME OF DEVICE OR SYSTEM CODE NAME OF DEVICE OR SYSTEM CODE TYPE OF CONTROL CODE TYPE OF CONTROL
0 No Device 11 Screening, Wet Washing (Note 4) 0 None 11 Gravel Bed Filters1 Dump to Hopper, truck, pile (Note 2) 12 Silo, Filling - Pneumatic 1 Water Spray, Point of Application 12 Spray Tower (Low Efficiency)2 Grizzly (Note 2) 13 Silo, Filling - Bucket Elevator 2 Spray with Additives, Point of Application 13 Wet Scrubber (Med Efficiency)3 Hopper (Note 2) 14 Silo, discharge to Conveyor (Note 2) 3 Conveyor with Half Cover 14 Venturi Scrubber (High Efficiency)4 Transfer Point (Note 2) 15 Silo, discharge to Tank Truck 4 Conveyor with Three Quarter Cover 15 Baghouse with Multiple Pickups5 Conveyor (Note 2) 16 Loading Open Top Truck (Note 2) 5 Conveyor with Full Cover 16 Baghouse with Single Pickup (Unenclosed)6 Crushing, Dry - Primary 17 Feeder 6 Process Enclosure 17 Baghouse with Single Pickup (Partial Enclosed)7 Crushing, Dry - Secondary 18 See Lookup Table "EmFac" for data 7 Gravity Separator 18 Baghouse with Single Pickup (Full Enclosed)8 Crushing, Dry - Tertiary 19 See Lookup Table "EmFac" for data 8 Cyclone - Simple 19 Baghouse with Single Pickup (Attached)9 Crushing, Wet (Note 3) 20 See Lookup Table "EmFac" for data 9 Cyclone - Multiple 20 Electrostatic Precipitator
10 Screening, Dry 21 See Lookup Table "EmFac" for data 10 Windscreen, Windward Side 21 See Lookup Table "ConEff" for data
XIII - EMISSION CALCULATIONSEQUIPMENT DEVICE NAME OF DEVICE MOTOR THROUGHPUT EMISSION CONTROL DEVICE EMISSION FACTORS EMISSION RATE
ID CODE BHP TONS / YEAR CODE DsF NAME OF DEVICE EFF % POUNDS PER TON TONS PER YEARNUMBER NO PM30 PM10 PM2.5 PM30 PM10 PM2.5
(A) (B) (C) (D) (E) (F) (G) (H) (I) (J) (K) (L) (M) (N) (O)
42-001 12 Silo, Filling - Pneumatic NA 146,708 19 Baghouse with Single Pickup (Attache 99.5 0.270 0.016 0.005 0.10 0.01 0.00
42-003 4 Transfer Point (Note 2) 2 146,708 18 Baghouse with Single Pickup (Full En 99.0 0.002 0.001 0.000 0.00 0.00 0.00
42-008 17 Feeder 5 146,708 18 Baghouse with Single Pickup (Full En 99.0 0.002 0.001 0.000 0.00 0.00 0.00
42-010, 12 0 No Device 300 0 0 None 0.0 0.000 0.000 0.000 0.00 0.00 0.00
42-009 8 Crushing, Dry - Tertiary 350 146,708 18 Baghouse with Single Pickup (Full En 99.0 1.850 0.112 0.035 1.36 0.08 0.03
42-011 4 Transfer Point (Note 2) NA 146,708 18 Baghouse with Single Pickup (Full En 99.0 0.002 0.001 0.000 0.00 0.00 0.00
42-034 4 Transfer Point (Note 2) 1.5 146,708 18 Baghouse with Single Pickup (Full En 99.0 0.002 0.001 0.000 0.00 0.00 0.00
41-037 4 Transfer Point (Note 2) NA 146,708 18 Baghouse with Single Pickup (Full En 99.0 0.002 0.001 0.000 0.00 0.00 0.00
TOTAL HORSEPOWER 658.5
AVERAGE THROUGHPUT PER DEVICE 128,370
BLOCK XIV - EMISSIONS & HARP INPUTS
EMISSION INVENTORY INPUTSDEVICE DATA EMISSION DATA
PERMIT ID B000763 ANNUAL EMISSIONS (tpy) PM PM10 PM2.5
NUMBER OF DEVICES 8 UNCONTROLLED 156.374 9.798 3.062
EQUIPMENT SIZE (bhp) 658.5 CONTROLLED 1.465 0.092 0.029
PROCESS DATA EMISSION FACTOR (lb/ton)
PROCESS RATE (tpy) 146,708 UNCONTROLLED 2.1318 0.1336 0.0417
MAX. DESIGN RATE (tph) 100 CONTROLLED 0.0200 0.0013 0.0004
MAX. HOURLY PRODUCTION RATE (tph) 100 FRACTIONATION VALUE ( PM10 or PM2.5 / PM) 0.0629 0.0197
AVE. HOURLY PRODUCTION RATE (tph) 59 OVERALL EFFICIENCY 99.06 99.06 99.06
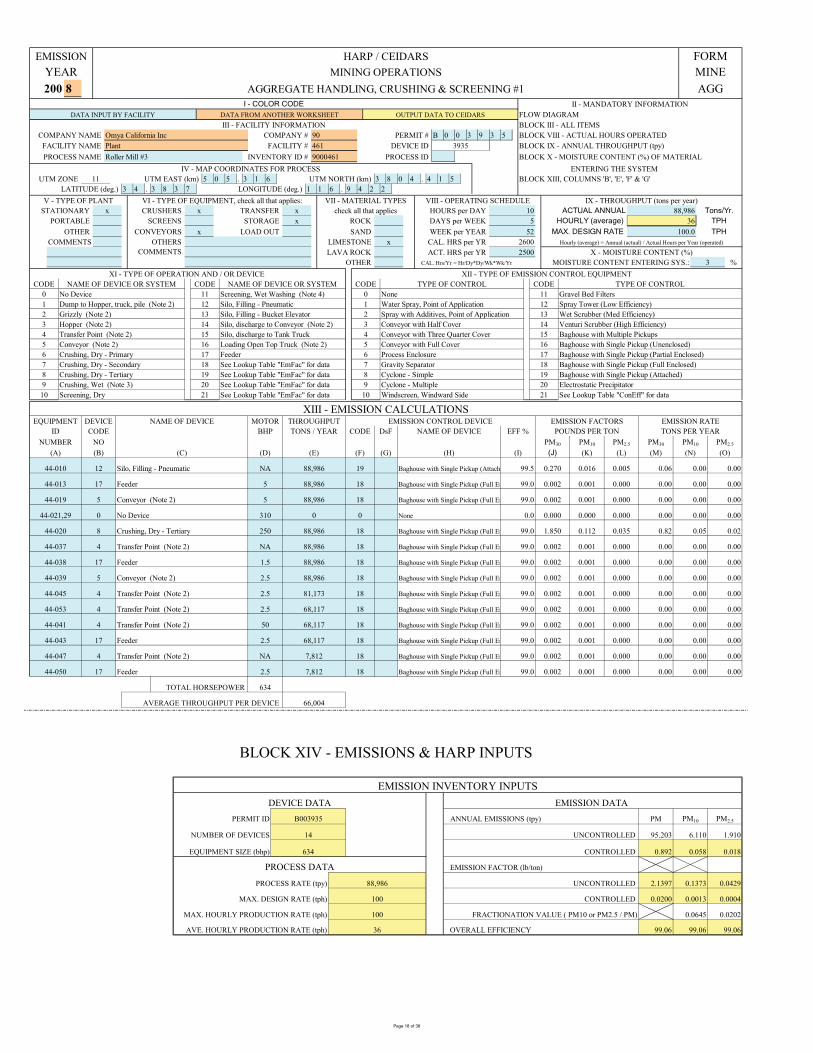
Page 18 of 38
. .. .
HOURS per DAY ROCK DAYS per WEEK SAND WEEK per YEAR
LIMESTONE CAL. HRS per YR LAVA ROCK ACT. HRS per YR
OTHER CAL. Hrs/Yr = Hr/Dy*Dy/Wk*Wk/Yr
EMISSION HARP / CEIDARS FORMYEAR MINING OPERATIONS MINE200 8 AGGREGATE HANDLING, CRUSHING & SCREENING #1 AGG
I - COLOR CODE II - MANDATORY INFORMATIONDATA INPUT BY FACILITY DATA FROM ANOTHER WORKSHEET OUTPUT DATA TO CEIDARS FLOW DIAGRAM
III - FACILITY INFORMATION BLOCK III - ALL ITEMSCOMPANY NAME Omya California Inc COMPANY # 90 PERMIT # B 0 0 3 9 3 5 BLOCK VIII - ACTUAL HOURS OPERATED
FACILITY NAME Plant FACILITY # 461 DEVICE ID 3935 BLOCK IX - ANNUAL THROUGHPUT (tpy)PROCESS NAME Roller Mill #3 INVENTORY ID # 9000461 PROCESS ID BLOCK X - MOISTURE CONTENT (%) OF MATERIAL
IV - MAP COORDINATES FOR PROCESS ENTERING THE SYSTEMUTM ZONE 11 UTM EAST (km) 5 0 5 3 1 6 BLOCK XIII, COLUMNS 'B', 'E', 'F' & 'G'
LATITUDE (deg.) 3 4 3 8 3UTM NORTH (km) 3 8
1 6 91 50 4 4
4 2 27 LONGITUDE (deg.) 1V - TYPE OF PLANT VI - TYPE OF EQUIPMENT, check all that applies: VII - MATERIAL TYPES VIII - OPERATING SCHEDULE IX - THROUGHPUT (tons per year)
STATIONARY x CRUSHERS x TRANSFER x check all that applies 10 ACTUAL ANNUAL 88,986 Tons/Yr.PORTABLE SCREENS STORAGE x 5 HOURLY (average) 36 TPH
OTHER CONVEYORS x LOAD OUT 52 MAX. DESIGN RATE 100.0 TPHCOMMENTS OTHERS x 2600 Hourly (average) = Annual (actual) / Actual Hours per Year (operated)
COMMENTS 2500 X - MOISTURE CONTENT (%)MOISTURE CONTENT ENTERING SYS.: 3 %
XI - TYPE OF OPERATION AND / OR DEVICE XII - TYPE OF EMISSION CONTROL EQUIPMENTCODE NAME OF DEVICE OR SYSTEM CODE NAME OF DEVICE OR SYSTEM CODE TYPE OF CONTROL CODE TYPE OF CONTROL
0 No Device 11 Screening, Wet Washing (Note 4) 0 None 11 Gravel Bed Filters1 Dump to Hopper, truck, pile (Note 2) 12 Silo, Filling - Pneumatic 1 Water Spray, Point of Application 12 Spray Tower (Low Efficiency)2 Grizzly (Note 2) 13 Silo, Filling - Bucket Elevator 2 Spray with Additives, Point of Application 13 Wet Scrubber (Med Efficiency)3 Hopper (Note 2) 14 Silo, discharge to Conveyor (Note 2) 3 Conveyor with Half Cover 14 Venturi Scrubber (High Efficiency)4 Transfer Point (Note 2) 15 Silo, discharge to Tank Truck 4 Conveyor with Three Quarter Cover 15 Baghouse with Multiple Pickups5 Conveyor (Note 2) 16 Loading Open Top Truck (Note 2) 5 Conveyor with Full Cover 16 Baghouse with Single Pickup (Unenclosed)6 Crushing, Dry - Primary 17 Feeder 6 Process Enclosure 17 Baghouse with Single Pickup (Partial Enclosed)7 Crushing, Dry - Secondary 18 See Lookup Table "EmFac" for data 7 Gravity Separator 18 Baghouse with Single Pickup (Full Enclosed)8 Crushing, Dry - Tertiary 19 See Lookup Table "EmFac" for data 8 Cyclone - Simple 19 Baghouse with Single Pickup (Attached)9 Crushing, Wet (Note 3) 20 See Lookup Table "EmFac" for data 9 Cyclone - Multiple 20 Electrostatic Precipitator
10 Screening, Dry 21 See Lookup Table "EmFac" for data 10 Windscreen, Windward Side 21 See Lookup Table "ConEff" for data
XIII - EMISSION CALCULATIONSEQUIPMENT DEVICE NAME OF DEVICE MOTOR THROUGHPUT EMISSION CONTROL DEVICE EMISSION FACTORS EMISSION RATE
ID CODE BHP TONS / YEAR CODE DsF NAME OF DEVICE EFF % POUNDS PER TON TONS PER YEARNUMBER NO PM30 PM10 PM2.5 PM30 PM10 PM2.5
(A) (B) (C) (D) (E) (F) (G) (H) (I) (J) (K) (L) (M) (N) (O)
44-010 12 Silo, Filling - Pneumatic NA 88,986 19 Baghouse with Single Pickup (Attache 99.5 0.270 0.016 0.005 0.06 0.00 0.00
44-013 17 Feeder 5 88,986 18 Baghouse with Single Pickup (Full En 99.0 0.002 0.001 0.000 0.00 0.00 0.00
44-019 5 Conveyor (Note 2) 5 88,986 18 Baghouse with Single Pickup (Full En 99.0 0.002 0.001 0.000 0.00 0.00 0.00
44-021,29 0 No Device 310 0 0 None 0.0 0.000 0.000 0.000 0.00 0.00 0.00
44-020 8 Crushing, Dry - Tertiary 250 88,986 18 Baghouse with Single Pickup (Full En 99.0 1.850 0.112 0.035 0.82 0.05 0.02
44-037 4 Transfer Point (Note 2) NA 88,986 18 Baghouse with Single Pickup (Full En 99.0 0.002 0.001 0.000 0.00 0.00 0.00
44-038 17 Feeder 1.5 88,986 18 Baghouse with Single Pickup (Full En 99.0 0.002 0.001 0.000 0.00 0.00 0.00
44-039 5 Conveyor (Note 2) 2.5 88,986 18 Baghouse with Single Pickup (Full En 99.0 0.002 0.001 0.000 0.00 0.00 0.00
44-045 4 Transfer Point (Note 2) 2.5 81,173 18 Baghouse with Single Pickup (Full En 99.0 0.002 0.001 0.000 0.00 0.00 0.00
44-053 4 Transfer Point (Note 2) 2.5 68,117 18 Baghouse with Single Pickup (Full En 99.0 0.002 0.001 0.000 0.00 0.00 0.00
44-041 4 Transfer Point (Note 2) 50 68,117 18 Baghouse with Single Pickup (Full En 99.0 0.002 0.001 0.000 0.00 0.00 0.00
44-043 17 Feeder 2.5 68,117 18 Baghouse with Single Pickup (Full En 99.0 0.002 0.001 0.000 0.00 0.00 0.00
44-047 4 Transfer Point (Note 2) NA 7,812 18 Baghouse with Single Pickup (Full En 99.0 0.002 0.001 0.000 0.00 0.00 0.00
44-050 17 Feeder 2.5 7,812 18 Baghouse with Single Pickup (Full En 99.0 0.002 0.001 0.000 0.00 0.00 0.00
TOTAL HORSEPOWER 634
AVERAGE THROUGHPUT PER DEVICE 66,004
BLOCK XIV - EMISSIONS & HARP INPUTS
EMISSION INVENTORY INPUTSDEVICE DATA EMISSION DATA
PERMIT ID B003935 ANNUAL EMISSIONS (tpy) PM PM10 PM2.5
NUMBER OF DEVICES 14 UNCONTROLLED 95.203 6.110 1.910
EQUIPMENT SIZE (bhp) 634 CONTROLLED 0.892 0.058 0.018
PROCESS DATA EMISSION FACTOR (lb/ton)
PROCESS RATE (tpy) 88,986 UNCONTROLLED 2.1397 0.1373 0.0429
MAX. DESIGN RATE (tph) 100 CONTROLLED 0.0200 0.0013 0.0004
MAX. HOURLY PRODUCTION RATE (tph) 100 FRACTIONATION VALUE ( PM10 or PM2.5 / PM) 0.0645 0.0202
AVE. HOURLY PRODUCTION RATE (tph) 36 OVERALL EFFICIENCY 99.06 99.06 99.06

Page 19 of 38
. .. .
HOURS per DAY ROCK DAYS per WEEK SAND WEEK per YEAR
LIMESTONE CAL. HRS per YR LAVA ROCK ACT. HRS per YR
OTHER CAL. Hrs/Yr = Hr/Dy*Dy/Wk*Wk/Yr
EMISSION HARP / CEIDARS FORMYEAR MINING OPERATIONS MINE200 8 AGGREGATE HANDLING, CRUSHING & SCREENING #1 AGG
I - COLOR CODE II - MANDATORY INFORMATIONDATA INPUT BY FACILITY DATA FROM ANOTHER WORKSHEET OUTPUT DATA TO CEIDARS FLOW DIAGRAM
III - FACILITY INFORMATION BLOCK III - ALL ITEMSCOMPANY NAME Omya California Inc COMPANY # 90 PERMIT # B 0 0 7 6 7 4 BLOCK VIII - ACTUAL HOURS OPERATED
FACILITY NAME Plant FACILITY # 461 DEVICE ID 7674 BLOCK IX - ANNUAL THROUGHPUT (tpy)PROCESS NAME Roller Mill #4 INVENTORY ID # 9000461 PROCESS ID BLOCK X - MOISTURE CONTENT (%) OF MATERIAL
IV - MAP COORDINATES FOR PROCESS ENTERING THE SYSTEMUTM ZONE 11 UTM EAST (km) 5 0 5 3 1 6 BLOCK XIII, COLUMNS 'B', 'E', 'F' & 'G'
LATITUDE (deg.) 3 4 3 8 3UTM NORTH (km) 3 8
1 6 91 50 4 4
4 2 27 LONGITUDE (deg.) 1V - TYPE OF PLANT VI - TYPE OF EQUIPMENT, check all that applies: VII - MATERIAL TYPES VIII - OPERATING SCHEDULE IX - THROUGHPUT (tons per year)
STATIONARY x CRUSHERS x TRANSFER x check all that applies 10 ACTUAL ANNUAL 88,119 Tons/Yr.PORTABLE SCREENS STORAGE x 5 HOURLY (average) 35 TPH
OTHER CONVEYORS x LOAD OUT 52 MAX. DESIGN RATE 100.0 TPHCOMMENTS OTHERS x 2600 Hourly (average) = Annual (actual) / Actual Hours per Year (operated)
COMMENTS 2500 X - MOISTURE CONTENT (%)MOISTURE CONTENT ENTERING SYS.: 3 %
XI - TYPE OF OPERATION AND / OR DEVICE XII - TYPE OF EMISSION CONTROL EQUIPMENTCODE NAME OF DEVICE OR SYSTEM CODE NAME OF DEVICE OR SYSTEM CODE TYPE OF CONTROL CODE TYPE OF CONTROL
0 No Device 11 Screening, Wet Washing (Note 4) 0 None 11 Gravel Bed Filters1 Dump to Hopper, truck, pile (Note 2) 12 Silo, Filling - Pneumatic 1 Water Spray, Point of Application 12 Spray Tower (Low Efficiency)2 Grizzly (Note 2) 13 Silo, Filling - Bucket Elevator 2 Spray with Additives, Point of Application 13 Wet Scrubber (Med Efficiency)3 Hopper (Note 2) 14 Silo, discharge to Conveyor (Note 2) 3 Conveyor with Half Cover 14 Venturi Scrubber (High Efficiency)4 Transfer Point (Note 2) 15 Silo, discharge to Tank Truck 4 Conveyor with Three Quarter Cover 15 Baghouse with Multiple Pickups5 Conveyor (Note 2) 16 Loading Open Top Truck (Note 2) 5 Conveyor with Full Cover 16 Baghouse with Single Pickup (Unenclosed)6 Crushing, Dry - Primary 17 Feeder 6 Process Enclosure 17 Baghouse with Single Pickup (Partial Enclosed)7 Crushing, Dry - Secondary 18 See Lookup Table "EmFac" for data 7 Gravity Separator 18 Baghouse with Single Pickup (Full Enclosed)8 Crushing, Dry - Tertiary 19 See Lookup Table "EmFac" for data 8 Cyclone - Simple 19 Baghouse with Single Pickup (Attached)9 Crushing, Wet (Note 3) 20 See Lookup Table "EmFac" for data 9 Cyclone - Multiple 20 Electrostatic Precipitator
10 Screening, Dry 21 See Lookup Table "EmFac" for data 10 Windscreen, Windward Side 21 See Lookup Table "ConEff" for data
XIII - EMISSION CALCULATIONSEQUIPMENT DEVICE NAME OF DEVICE MOTOR THROUGHPUT EMISSION CONTROL DEVICE EMISSION FACTORS EMISSION RATE
ID CODE BHP TONS / YEAR CODE DsF NAME OF DEVICE EFF % POUNDS PER TON TONS PER YEARNUMBER NO PM30 PM10 PM2.5 PM30 PM10 PM2.5
(A) (B) (C) (D) (E) (F) (G) (H) (I) (J) (K) (L) (M) (N) (O)
45-010 12 Silo, Filling - Pneumatic NA 88,119 19 Baghouse with Single Pickup (Attache 99.5 0.270 0.016 0.005 0.06 0.00 0.00
45-013 4 Transfer Point (Note 2) 5 88,119 18 Baghouse with Single Pickup (Full En 99.0 0.002 0.001 0.000 0.00 0.00 0.00
45-019 17 Feeder 2.7 88,119 18 Baghouse with Single Pickup (Full En 99.0 0.002 0.001 0.000 0.00 0.00 0.00
45-020,21 0 No Device 325 0 0 None 0.0 0.000 0.000 0.000 0.00 0.00 0.00
45-020 8 Crushing, Dry - Tertiary 250 88,119 18 Baghouse with Single Pickup (Full En 99.0 1.850 0.112 0.035 0.82 0.05 0.02
45-037 4 Transfer Point (Note 2) NA 88,119 18 Baghouse with Single Pickup (Full En 99.0 0.002 0.001 0.000 0.00 0.00 0.00
45-038 4 Transfer Point (Note 2) 0.5 88,119 18 Baghouse with Single Pickup (Full En 99.0 0.002 0.001 0.000 0.00 0.00 0.00
45-039 5 Conveyor (Note 2) 10 88,119 18 Baghouse with Single Pickup (Full En 99.0 0.002 0.001 0.000 0.00 0.00 0.00
45-053 5 Conveyor (Note 2) 3 87,418 18 Baghouse with Single Pickup (Full En 99.0 0.002 0.001 0.000 0.00 0.00 0.00
45-041 4 Transfer Point (Note 2) 50 76,675 18 Baghouse with Single Pickup (Full En 99.0 0.002 0.001 0.000 0.00 0.00 0.00
45-043 17 Feeder 1 88,119 18 Baghouse with Single Pickup (Full En 99.0 0.002 0.001 0.000 0.00 0.00 0.00
45-045 17 Feeder 1.5 77,375 18 Baghouse with Single Pickup (Full En 99.0 0.002 0.001 0.000 0.00 0.00 0.00
45-047 4 Transfer Point (Note 2) 150 10,743 18 Baghouse with Single Pickup (Full En 99.0 0.002 0.001 0.000 0.00 0.00 0.00
45-048 17 Feeder 0.75 10,743 18 Baghouse with Single Pickup (Full En 99.0 0.002 0.001 0.000 0.00 0.00 0.00
45-050 17 Feeder 1 10,743 18 Baghouse with Single Pickup (Full En 99.0 0.002 0.001 0.000 0.00 0.00 0.00
TOTAL HORSEPOWER 800.45
AVERAGE THROUGHPUT PER DEVICE 65,243
BLOCK XIV - EMISSIONS & HARP INPUTS
EMISSION INVENTORY INPUTSDEVICE DATA EMISSION DATA
PERMIT ID B007674 ANNUAL EMISSIONS (tpy) PM PM10 PM2.5
NUMBER OF DEVICES 15 UNCONTROLLED 94.350 6.086 1.903
EQUIPMENT SIZE (bhp) 800.45 CONTROLLED 0.884 0.057 0.018
PROCESS DATA EMISSION FACTOR (lb/ton)
PROCESS RATE (tpy) 88,119 UNCONTROLLED 2.1414 0.1381 0.0432
MAX. DESIGN RATE (tph) 100 CONTROLLED 0.0201 0.0013 0.0004
MAX. HOURLY PRODUCTION RATE (tph) 100 FRACTIONATION VALUE ( PM10 or PM2.5 / PM) 0.0649 0.0203
AVE. HOURLY PRODUCTION RATE (tph) 35 OVERALL EFFICIENCY 99.06 99.06 99.06

Page 20 of 38
. .. .
HOURS per DAY ROCK DAYS per WEEK SAND WEEK per YEAR
LIMESTONE CAL. HRS per YR LAVA ROCK ACT. HRS per YR
OTHER CAL. Hrs/Yr = Hr/Dy*Dy/Wk*Wk/Yr
EMISSION HARP / CEIDARS FORMYEAR MINING OPERATIONS MINE200 8 AGGREGATE HANDLING, CRUSHING & SCREENING #1 AGG
I - COLOR CODE II - MANDATORY INFORMATIONDATA INPUT BY FACILITY DATA FROM ANOTHER WORKSHEET OUTPUT DATA TO CEIDARS FLOW DIAGRAM
III - FACILITY INFORMATION BLOCK III - ALL ITEMSCOMPANY NAME Omya California Inc COMPANY # 90 PERMIT # B 0 0 2 0 0 3 BLOCK VIII - ACTUAL HOURS OPERATED
FACILITY NAME Plant FACILITY # 461 DEVICE ID 2003 BLOCK IX - ANNUAL THROUGHPUT (tpy)PROCESS NAME Surface Treating Plant INVENTORY ID # 9000461 PROCESS ID BLOCK X - MOISTURE CONTENT (%) OF MATERIAL
IV - MAP COORDINATES FOR PROCESS ENTERING THE SYSTEMUTM ZONE 11 UTM EAST (km) 5 0 5 3 1 6 BLOCK XIII, COLUMNS 'B', 'E', 'F' & 'G'
LATITUDE (deg.) 3 4 3 8 3UTM NORTH (km) 3 8
1 6 91 50 4 4
4 2 27 LONGITUDE (deg.) 1V - TYPE OF PLANT VI - TYPE OF EQUIPMENT, check all that applies: VII - MATERIAL TYPES VIII - OPERATING SCHEDULE IX - THROUGHPUT (tons per year)
STATIONARY x CRUSHERS TRANSFER x check all that applies 10 ACTUAL ANNUAL 7,881 Tons/Yr.PORTABLE SCREENS STORAGE x 5 HOURLY (average) 3 TPH
OTHER CONVEYORS x LOAD OUT 52 MAX. DESIGN RATE 25.0 TPHCOMMENTS OTHERS x 2600 Hourly (average) = Annual (actual) / Actual Hours per Year (operated)
COMMENTS 2500 X - MOISTURE CONTENT (%)MOISTURE CONTENT ENTERING SYS.: 3 %
XI - TYPE OF OPERATION AND / OR DEVICE XII - TYPE OF EMISSION CONTROL EQUIPMENTCODE NAME OF DEVICE OR SYSTEM CODE NAME OF DEVICE OR SYSTEM CODE TYPE OF CONTROL CODE TYPE OF CONTROL
0 No Device 11 Screening, Wet Washing (Note 4) 0 None 11 Gravel Bed Filters1 Dump to Hopper, truck, pile (Note 2) 12 Silo, Filling - Pneumatic 1 Water Spray, Point of Application 12 Spray Tower (Low Efficiency)2 Grizzly (Note 2) 13 Silo, Filling - Bucket Elevator 2 Spray with Additives, Point of Application 13 Wet Scrubber (Med Efficiency)3 Hopper (Note 2) 14 Silo, discharge to Conveyor (Note 2) 3 Conveyor with Half Cover 14 Venturi Scrubber (High Efficiency)4 Transfer Point (Note 2) 15 Silo, discharge to Tank Truck 4 Conveyor with Three Quarter Cover 15 Baghouse with Multiple Pickups5 Conveyor (Note 2) 16 Loading Open Top Truck (Note 2) 5 Conveyor with Full Cover 16 Baghouse with Single Pickup (Unenclosed)6 Crushing, Dry - Primary 17 Feeder 6 Process Enclosure 17 Baghouse with Single Pickup (Partial Enclosed)7 Crushing, Dry - Secondary 18 See Lookup Table "EmFac" for data 7 Gravity Separator 18 Baghouse with Single Pickup (Full Enclosed)8 Crushing, Dry - Tertiary 19 See Lookup Table "EmFac" for data 8 Cyclone - Simple 19 Baghouse with Single Pickup (Attached)9 Crushing, Wet (Note 3) 20 See Lookup Table "EmFac" for data 9 Cyclone - Multiple 20 Electrostatic Precipitator
10 Screening, Dry 21 See Lookup Table "EmFac" for data 10 Windscreen, Windward Side 21 See Lookup Table "ConEff" for data
XIII - EMISSION CALCULATIONSEQUIPMENT DEVICE NAME OF DEVICE MOTOR THROUGHPUT EMISSION CONTROL DEVICE EMISSION FACTORS EMISSION RATE
ID CODE BHP TONS / YEAR CODE DsF NAME OF DEVICE EFF % POUNDS PER TON TONS PER YEARNUMBER NO PM30 PM10 PM2.5 PM30 PM10 PM2.5
(A) (B) (C) (D) (E) (F) (G) (H) (I) (J) (K) (L) (M) (N) (O)
49-001 12 Silo, Filling - Pneumatic NA 7,881 19 Baghouse with Single Pickup (Attache 99.5 0.270 0.016 0.005 0.01 0.00 0.00
49-006 3 Hopper (Note 2) NA 7,881 18 Baghouse with Single Pickup (Full En 99.0 0.002 0.001 0.000 0.00 0.00 0.00
49-008 5 Conveyor (Note 2) 20 7,881 18 Baghouse with Single Pickup (Full En 99.0 0.002 0.001 0.000 0.00 0.00 0.00
49-011 4 Transfer Point (Note 2) 100 7,881 18 Baghouse with Single Pickup (Full En 99.0 0.002 0.001 0.000 0.00 0.00 0.00
49-024 4 Transfer Point (Note 2) 50 7,881 18 Baghouse with Single Pickup (Full En 99.0 0.002 0.001 0.000 0.00 0.00 0.00
49-027 4 Transfer Point (Note 2) NA 7,881 18 Baghouse with Single Pickup (Full En 99.0 0.002 0.001 0.000 0.00 0.00 0.00
49-032 17 Feeder 1 7,881 18 Baghouse with Single Pickup (Full En 99.0 0.002 0.001 0.000 0.00 0.00 0.00
No Device None 0.0 0.000 0.000 0.000 0.00 0.00 0.00
No Device None 0.0 0.000 0.000 0.000 0.00 0.00 0.00
No Device None 0.0 0.000 0.000 0.000 0.00 0.00 0.00
No Device None 0.0 0.000 0.000 0.000 0.00 0.00 0.00
No Device None 0.0 0.000 0.000 0.000 0.00 0.00 0.00
No Device None 0.0 0.000 0.000 0.000 0.00 0.00 0.00
No Device None 0.0 0.000 0.000 0.000 0.00 0.00 0.00
No Device None 0.0 0.000 0.000 0.000 0.00 0.00 0.00
No Device None 0.0 0.000 0.000 0.000 0.00 0.00 0.00
No Device None 0.0 0.000 0.000 0.000 0.00 0.00 0.00
No Device None 0.0 0.000 0.000 0.000 0.00 0.00 0.00
No Device None 0.0 0.000 0.000 0.000 0.00 0.00 0.00
No Device None 0.0 0.000 0.000 0.000 0.00 0.00 0.00
No Device None 0.0 0.000 0.000 0.000 0.00 0.00 0.00
No Device None 0.0 0.000 0.000 0.000 0.00 0.00 0.00
No Device None 0.0 0.000 0.000 0.000 0.00 0.00 0.00
No Device None 0.0 0.000 0.000 0.000 0.00 0.00 0.00
No Device None 0.0 0.000 0.000 0.000 0.00 0.00 0.00
No Device None 0.0 0.000 0.000 0.000 0.00 0.00 0.00
No Device None 0.0 0.000 0.000 0.000 0.00 0.00 0.00
No Device None 0.0 0.000 0.000 0.000 0.00 0.00 0.00
No Device None 0.0 0.000 0.000 0.000 0.00 0.00 0.00
No Device None 0.0 0.000 0.000 0.000 0.00 0.00 0.00
No Device None 0.0 0.000 0.000 0.000 0.00 0.00 0.00
No Device None 0.0 0.000 0.000 0.000
No Device 0.000 0.000 0.00
0.00 0.00 0.00
None
None 0.0 0.000
0.000 0.00 0.00
0.00 0.00
No Device 0.00
TOTAL HORSEPOWER 171
AVERAGE THROUGHPUT PER DEVICE 7,881
0.0 0.000 0.000
BLOCK XIV - EMISSIONS & HARP INPUTS
EMISSION INVENTORY INPUTSDEVICE DATA EMISSION DATA
PERMIT ID B002003 ANNUAL EMISSIONS (tpy) PM PM10 PM2.5
NUMBER OF DEVICES 7 UNCONTROLLED 1.120 0.089 0.028
EQUIPMENT SIZE (bhp) 171 CONTROLLED 0.006 0.001 0.000
PROCESS DATA EMISSION FACTOR (lb/ton)
PROCESS RATE (tpy) 7,881 UNCONTROLLED 0.2841 0.0227 0.0071
MAX. DESIGN RATE (tph) 25 CONTROLLED 0.0015 0.0001 0.0000
MAX. HOURLY PRODUCTION RATE (tph) 25 FRACTIONATION VALUE ( PM10 or PM2.5 / PM) 0.0984 0.0308
AVE. HOURLY PRODUCTION RATE (tph) 3 OVERALL EFFICIENCY 99.48 99.35 99.35
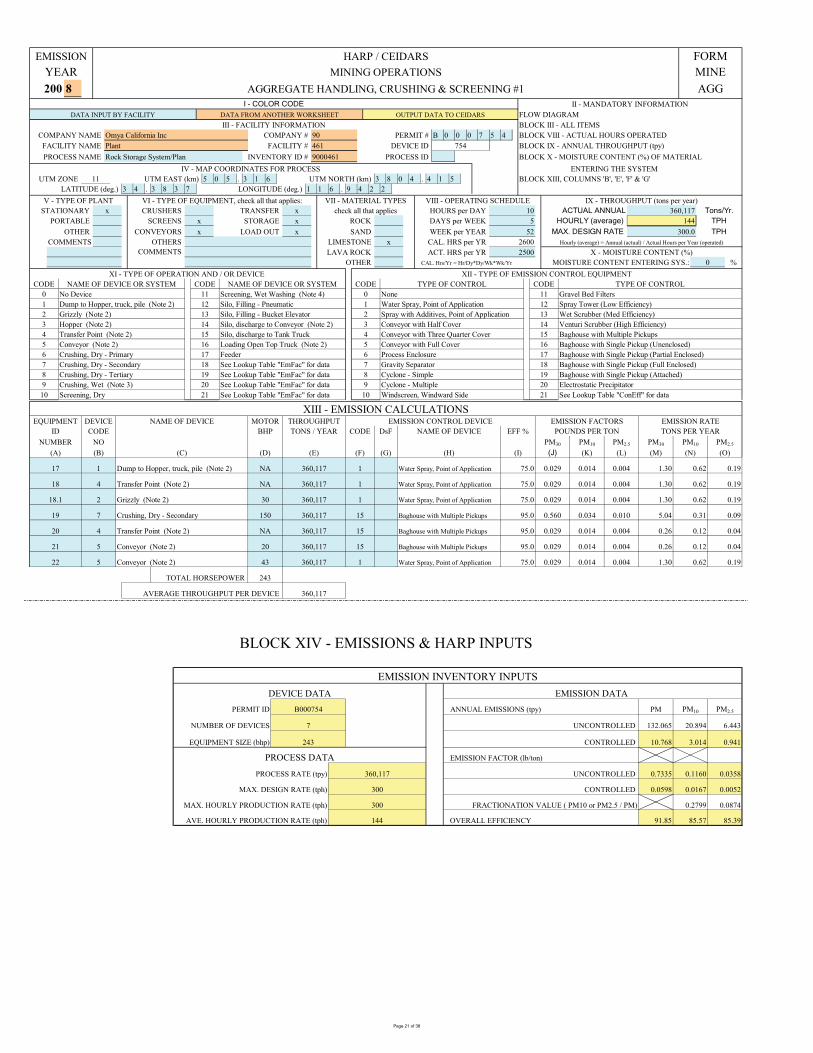
Page 21 of 38
. .. .
HOURS per DAY ROCK DAYS per WEEK SAND WEEK per YEAR
LIMESTONE CAL. HRS per YR LAVA ROCK ACT. HRS per YR
OTHER CAL. Hrs/Yr = Hr/Dy*Dy/Wk*Wk/Yr
EMISSION HARP / CEIDARS FORMYEAR MINING OPERATIONS MINE200 8 AGGREGATE HANDLING, CRUSHING & SCREENING #1 AGG
I - COLOR CODE II - MANDATORY INFORMATIONDATA INPUT BY FACILITY DATA FROM ANOTHER WORKSHEET OUTPUT DATA TO CEIDARS FLOW DIAGRAM
III - FACILITY INFORMATION BLOCK III - ALL ITEMSCOMPANY NAME Omya California Inc COMPANY # 90 PERMIT # B 0 0 0 7 5 4 BLOCK VIII - ACTUAL HOURS OPERATED
FACILITY NAME Plant FACILITY # 461 DEVICE ID 754 BLOCK IX - ANNUAL THROUGHPUT (tpy)PROCESS NAME Rock Storage System/Plan INVENTORY ID # 9000461 PROCESS ID BLOCK X - MOISTURE CONTENT (%) OF MATERIAL
IV - MAP COORDINATES FOR PROCESS ENTERING THE SYSTEMUTM ZONE 11 UTM EAST (km) 5 0 5 3 1 6 BLOCK XIII, COLUMNS 'B', 'E', 'F' & 'G'
LATITUDE (deg.) 3 4 3 8 3UTM NORTH (km) 3 8
1 6 91 50 4 4
4 2 27 LONGITUDE (deg.) 1V - TYPE OF PLANT VI - TYPE OF EQUIPMENT, check all that applies: VII - MATERIAL TYPES VIII - OPERATING SCHEDULE IX - THROUGHPUT (tons per year)
STATIONARY x CRUSHERS TRANSFER x check all that applies 10 ACTUAL ANNUAL 360,117 Tons/Yr.PORTABLE SCREENS x STORAGE x 5 HOURLY (average) 144 TPH
OTHER CONVEYORS x LOAD OUT x 52 MAX. DESIGN RATE 300.0 TPHCOMMENTS OTHERS x 2600 Hourly (average) = Annual (actual) / Actual Hours per Year (operated)
COMMENTS 2500 X - MOISTURE CONTENT (%)MOISTURE CONTENT ENTERING SYS.: 0 %
XI - TYPE OF OPERATION AND / OR DEVICE XII - TYPE OF EMISSION CONTROL EQUIPMENTCODE NAME OF DEVICE OR SYSTEM CODE NAME OF DEVICE OR SYSTEM CODE TYPE OF CONTROL CODE TYPE OF CONTROL
0 No Device 11 Screening, Wet Washing (Note 4) 0 None 11 Gravel Bed Filters1 Dump to Hopper, truck, pile (Note 2) 12 Silo, Filling - Pneumatic 1 Water Spray, Point of Application 12 Spray Tower (Low Efficiency)2 Grizzly (Note 2) 13 Silo, Filling - Bucket Elevator 2 Spray with Additives, Point of Application 13 Wet Scrubber (Med Efficiency)3 Hopper (Note 2) 14 Silo, discharge to Conveyor (Note 2) 3 Conveyor with Half Cover 14 Venturi Scrubber (High Efficiency)4 Transfer Point (Note 2) 15 Silo, discharge to Tank Truck 4 Conveyor with Three Quarter Cover 15 Baghouse with Multiple Pickups5 Conveyor (Note 2) 16 Loading Open Top Truck (Note 2) 5 Conveyor with Full Cover 16 Baghouse with Single Pickup (Unenclosed)6 Crushing, Dry - Primary 17 Feeder 6 Process Enclosure 17 Baghouse with Single Pickup (Partial Enclosed)7 Crushing, Dry - Secondary 18 See Lookup Table "EmFac" for data 7 Gravity Separator 18 Baghouse with Single Pickup (Full Enclosed)8 Crushing, Dry - Tertiary 19 See Lookup Table "EmFac" for data 8 Cyclone - Simple 19 Baghouse with Single Pickup (Attached)9 Crushing, Wet (Note 3) 20 See Lookup Table "EmFac" for data 9 Cyclone - Multiple 20 Electrostatic Precipitator
10 Screening, Dry 21 See Lookup Table "EmFac" for data 10 Windscreen, Windward Side 21 See Lookup Table "ConEff" for data
XIII - EMISSION CALCULATIONSEQUIPMENT DEVICE NAME OF DEVICE MOTOR THROUGHPUT EMISSION CONTROL DEVICE EMISSION FACTORS EMISSION RATE
ID CODE BHP TONS / YEAR CODE DsF NAME OF DEVICE EFF % POUNDS PER TON TONS PER YEARNUMBER NO PM30 PM10 PM2.5 PM30 PM10 PM2.5
(A) (B) (C) (D) (E) (F) (G) (H) (I) (J) (K) (L) (M) (N) (O)
17 1 Dump to Hopper, truck, pile (Note 2) NA 360,117 1 Water Spray, Point of Application 75.0 0.029 0.014 0.004 1.30 0.62 0.19
18 4 Transfer Point (Note 2) NA 360,117 1 Water Spray, Point of Application 75.0 0.029 0.014 0.004 1.30 0.62 0.19
18.1 2 Grizzly (Note 2) 30 360,117 1 Water Spray, Point of Application 75.0 0.029 0.014 0.004 1.30 0.62 0.19
19 7 Crushing, Dry - Secondary 150 360,117 15 Baghouse with Multiple Pickups 95.0 0.560 0.034 0.010 5.04 0.31 0.09
20 4 Transfer Point (Note 2) NA 360,117 15 Baghouse with Multiple Pickups 95.0 0.029 0.014 0.004 0.26 0.12 0.04
21 5 Conveyor (Note 2) 20 360,117 15 Baghouse with Multiple Pickups 95.0 0.029 0.014 0.004 0.26 0.12 0.04
22 5 Conveyor (Note 2) 43 360,117 1 Water Spray, Point of Application 75.0 0.029 0.014 0.004 1.30 0.62 0.19
TOTAL HORSEPOWER 243
AVERAGE THROUGHPUT PER DEVICE 360,117
BLOCK XIV - EMISSIONS & HARP INPUTS
EMISSION INVENTORY INPUTSDEVICE DATA EMISSION DATA
PERMIT ID B000754 ANNUAL EMISSIONS (tpy) PM PM10 PM2.5
NUMBER OF DEVICES 7 UNCONTROLLED 132.065 20.894 6.443
EQUIPMENT SIZE (bhp) 243 CONTROLLED 10.768 3.014 0.941
PROCESS DATA EMISSION FACTOR (lb/ton)
PROCESS RATE (tpy) 360,117 UNCONTROLLED 0.7335 0.1160 0.0358
MAX. DESIGN RATE (tph) 300 CONTROLLED 0.0598 0.0167 0.0052
MAX. HOURLY PRODUCTION RATE (tph) 300 FRACTIONATION VALUE ( PM10 or PM2.5 / PM) 0.2799 0.0874
AVE. HOURLY PRODUCTION RATE (tph) 144 OVERALL EFFICIENCY 91.85 85.57 85.39

Page 22 of 38
. .. .
HOURS per DAY ROCK DAYS per WEEK SAND WEEK per YEAR
LIMESTONE CAL. HRS per YR LAVA ROCK ACT. HRS per YR
OTHER CAL. Hrs/Yr = Hr/Dy*Dy/Wk*Wk/Yr
EMISSION HARP / CEIDARS FORMYEAR MINING OPERATIONS MINE200 8 AGGREGATE HANDLING, CRUSHING & SCREENING #1 AGG
I - COLOR CODE II - MANDATORY INFORMATIONDATA INPUT BY FACILITY DATA FROM ANOTHER WORKSHEET OUTPUT DATA TO CEIDARS FLOW DIAGRAM
III - FACILITY INFORMATION BLOCK III - ALL ITEMSCOMPANY NAME Omya California Inc COMPANY # 90 PERMIT # B 0 0 0 7 6 3 BLOCK VIII - ACTUAL HOURS OPERATED
FACILITY NAME Plant FACILITY # 461 DEVICE ID 763 BLOCK IX - ANNUAL THROUGHPUT (tpy)PROCESS NAME Optical Sorter INVENTORY ID # 9000461 PROCESS ID BLOCK X - MOISTURE CONTENT (%) OF MATERIAL
IV - MAP COORDINATES FOR PROCESS ENTERING THE SYSTEMUTM ZONE 11 UTM EAST (km) 5 0 5 3 1 6 BLOCK XIII, COLUMNS 'B', 'E', 'F' & 'G'
LATITUDE (deg.) 3 4 3 8 3UTM NORTH (km) 3 8
1 6 91 50 4 4
4 2 27 LONGITUDE (deg.) 1V - TYPE OF PLANT VI - TYPE OF EQUIPMENT, check all that applies: VII - MATERIAL TYPES VIII - OPERATING SCHEDULE IX - THROUGHPUT (tons per year)
STATIONARY x CRUSHERS x TRANSFER x check all that applies 10 ACTUAL ANNUAL 2,300 Tons/Yr.PORTABLE SCREENS STORAGE x 5 HOURLY (average) 1 TPH
OTHER CONVEYORS x LOAD OUT 52 MAX. DESIGN RATE TPHCOMMENTS OTHERS x 2600 Hourly (average) = Annual (actual) / Actual Hours per Year (operated)
COMMENTS 2500 X - MOISTURE CONTENT (%)MOISTURE CONTENT ENTERING SYS.: 3 %
XI - TYPE OF OPERATION AND / OR DEVICE XII - TYPE OF EMISSION CONTROL EQUIPMENTCODE NAME OF DEVICE OR SYSTEM CODE NAME OF DEVICE OR SYSTEM CODE TYPE OF CONTROL CODE TYPE OF CONTROL
0 No Device 11 Screening, Wet Washing (Note 4) 0 None 11 Gravel Bed Filters1 Dump to Hopper, truck, pile (Note 2) 12 Silo, Filling - Pneumatic 1 Water Spray, Point of Application 12 Spray Tower (Low Efficiency)2 Grizzly (Note 2) 13 Silo, Filling - Bucket Elevator 2 Spray with Additives, Point of Application 13 Wet Scrubber (Med Efficiency)3 Hopper (Note 2) 14 Silo, discharge to Conveyor (Note 2) 3 Conveyor with Half Cover 14 Venturi Scrubber (High Efficiency)4 Transfer Point (Note 2) 15 Silo, discharge to Tank Truck 4 Conveyor with Three Quarter Cover 15 Baghouse with Multiple Pickups5 Conveyor (Note 2) 16 Loading Open Top Truck (Note 2) 5 Conveyor with Full Cover 16 Baghouse with Single Pickup (Unenclosed)6 Crushing, Dry - Primary 17 Feeder 6 Process Enclosure 17 Baghouse with Single Pickup (Partial Enclosed)7 Crushing, Dry - Secondary 18 See Lookup Table "EmFac" for data 7 Gravity Separator 18 Baghouse with Single Pickup (Full Enclosed)8 Crushing, Dry - Tertiary 19 See Lookup Table "EmFac" for data 8 Cyclone - Simple 19 Baghouse with Single Pickup (Attached)9 Crushing, Wet (Note 3) 20 See Lookup Table "EmFac" for data 9 Cyclone - Multiple 20 Electrostatic Precipitator
10 Screening, Dry 21 See Lookup Table "EmFac" for data 10 Windscreen, Windward Side 21 See Lookup Table "ConEff" for data
XIII - EMISSION CALCULATIONSEQUIPMENT DEVICE NAME OF DEVICE MOTOR THROUGHPUT EMISSION CONTROL DEVICE EMISSION FACTORS EMISSION RATE
ID CODE BHP TONS / YEAR CODE DsF NAME OF DEVICE EFF % POUNDS PER TON TONS PER YEARNUMBER NO PM30 PM10 PM2.5 PM30 PM10 PM2.5
(A) (B) (C) (D) (E) (F) (G) (H) (I) (J) (K) (L) (M) (N) (O)
36-001 17 Feeder 13 2,300 15 Baghouse with Multiple Pickups 95.0 0.002 0.001 0.000 0.00 0.00 0.00
36-002 5 Conveyor (Note 2) 15 2,300 15 Baghouse with Multiple Pickups 95.0 0.002 0.001 0.000 0.00 0.00 0.00
36-003 10 Screening, Dry 15 2,300 15 Baghouse with Multiple Pickups 95.0 0.160 0.120 0.038 0.01 0.01 0.00
36-004 11 Screening, Wet Washing (Note 4) 25 899 0 None 0.0 0.000 0.000 0.000 0.00 0.00 0.00
36-005 17 Feeder 5 899 13 Wet Scrubber (Med Efficiency) 95.0 0.002 0.001 0.000 0.00 0.00 0.00
36-006 4 Transfer Point (Note 2) N/A 899 13 Wet Scrubber (Med Efficiency) 95.0 0.002 0.001 0.000 0.00 0.00 0.00
36-008 5 Conveyor (Note 2) 10 1,400 1 Water Spray, Point of Application 75.0 0.002 0.001 0.000 0.00 0.00 0.00
36-007 5 Conveyor (Note 2) 10 1,400 1 Water Spray, Point of Application 75.0 0.002 0.001 0.000 0.00 0.00 0.00
TOTAL HORSEPOWER 93
AVERAGE THROUGHPUT PER DEVICE 1,550
BLOCK XIV - EMISSIONS & HARP INPUTS
EMISSION INVENTORY INPUTSDEVICE DATA EMISSION DATA
PERMIT ID B000763 ANNUAL EMISSIONS (tpy) PM PM10 PM2.5
NUMBER OF DEVICES 8 UNCONTROLLED 0.195 0.143 0.045
EQUIPMENT SIZE (bhp) 93 CONTROLLED 0.010 0.007 0.002
PROCESS DATA EMISSION FACTOR (lb/ton)
PROCESS RATE (tpy) 2,300 UNCONTROLLED 0.1694 0.1245 0.0394
MAX. DESIGN RATE (tph) 0 CONTROLLED 0.0090 0.0065 0.0021
MAX. HOURLY PRODUCTION RATE (tph) 0 FRACTIONATION VALUE ( PM10 or PM2.5 / PM) 0.7180 0.2272
AVE. HOURLY PRODUCTION RATE (tph) 1 OVERALL EFFICIENCY 94.66 94.78 94.78

Page 23 of 38
. .. .
HOURS per DAY ROCK DAYS per WEEK SAND WEEK per YEAR
LIMESTONE CAL. HRS per YR LAVA ROCK ACT. HRS per YR
OTHER CAL. Hrs/Yr = Hr/Dy*Dy/Wk*Wk/Yr
EMISSION HARP / CEIDARS FORMYEAR MINING OPERATIONS MINE200 8 AGGREGATE HANDLING, CRUSHING & SCREENING #1 AGG
I - COLOR CODE II - MANDATORY INFORMATIONDATA INPUT BY FACILITY DATA FROM ANOTHER WORKSHEET OUTPUT DATA TO CEIDARS FLOW DIAGRAM
III - FACILITY INFORMATION BLOCK III - ALL ITEMSCOMPANY NAME Omya California Inc COMPANY # 90 PERMIT # B 0 0 2 0 0 9 BLOCK VIII - ACTUAL HOURS OPERATED
FACILITY NAME Plant FACILITY # 461 DEVICE ID 2009 BLOCK IX - ANNUAL THROUGHPUT (tpy)PROCESS NAME Coarse Product Storage System INVENTORY ID # 9000461 PROCESS ID BLOCK X - MOISTURE CONTENT (%) OF MATERIAL
IV - MAP COORDINATES FOR PROCESS ENTERING THE SYSTEMUTM ZONE 11 UTM EAST (km) 5 0 5 3 1 6 BLOCK XIII, COLUMNS 'B', 'E', 'F' & 'G'
LATITUDE (deg.) 3 4 3 8 3UTM NORTH (km) 3 8
1 6 91 50 4 4
4 2 27 LONGITUDE (deg.) 1V - TYPE OF PLANT VI - TYPE OF EQUIPMENT, check all that applies: VII - MATERIAL TYPES VIII - OPERATING SCHEDULE IX - THROUGHPUT (tons per year)
STATIONARY x CRUSHERS TRANSFER x check all that applies 10 ACTUAL ANNUAL Varies Tons/Yr.PORTABLE SCREENS STORAGE x 5 HOURLY (average) Refer to Block VIII TPH
OTHER CONVEYORS x LOAD OUT x 52 MAX. DESIGN RATE 50.0 TPHCOMMENTS OTHERS x 2600 Hourly (average) = Annual (actual) / Actual Hours per Year (operated)
COMMENTS 2500 X - MOISTURE CONTENT (%)MOISTURE CONTENT ENTERING SYS.: 0 %
XI - TYPE OF OPERATION AND / OR DEVICE XII - TYPE OF EMISSION CONTROL EQUIPMENTCODE NAME OF DEVICE OR SYSTEM CODE NAME OF DEVICE OR SYSTEM CODE TYPE OF CONTROL CODE TYPE OF CONTROL
0 No Device 11 Screening, Wet Washing (Note 4) 0 None 11 Gravel Bed Filters1 Dump to Hopper, truck, pile (Note 2) 12 Silo, Filling - Pneumatic 1 Water Spray, Point of Application 12 Spray Tower (Low Efficiency)2 Grizzly (Note 2) 13 Silo, Filling - Bucket Elevator 2 Spray with Additives, Point of Application 13 Wet Scrubber (Med Efficiency)3 Hopper (Note 2) 14 Silo, discharge to Conveyor (Note 2) 3 Conveyor with Half Cover 14 Venturi Scrubber (High Efficiency)4 Transfer Point (Note 2) 15 Silo, discharge to Tank Truck 4 Conveyor with Three Quarter Cover 15 Baghouse with Multiple Pickups5 Conveyor (Note 2) 16 Loading Open Top Truck (Note 2) 5 Conveyor with Full Cover 16 Baghouse with Single Pickup (Unenclosed)6 Crushing, Dry - Primary 17 Feeder 6 Process Enclosure 17 Baghouse with Single Pickup (Partial Enclosed)7 Crushing, Dry - Secondary 18 See Lookup Table "EmFac" for data 7 Gravity Separator 18 Baghouse with Single Pickup (Full Enclosed)8 Crushing, Dry - Tertiary 19 See Lookup Table "EmFac" for data 8 Cyclone - Simple 19 Baghouse with Single Pickup (Attached)9 Crushing, Wet (Note 3) 20 See Lookup Table "EmFac" for data 9 Cyclone - Multiple 20 Electrostatic Precipitator
10 Screening, Dry 21 See Lookup Table "EmFac" for data 10 Windscreen, Windward Side 21 See Lookup Table "ConEff" for data
XIII - EMISSION CALCULATIONSEQUIPMENT DEVICE NAME OF DEVICE MOTOR THROUGHPUT EMISSION CONTROL DEVICE EMISSION FACTORS EMISSION RATE
ID CODE BHP TONS / YEAR CODE DsF NAME OF DEVICE EFF % POUNDS PER TON TONS PER YEARNUMBER NO PM30 PM10 PM2.5 PM30 PM10 PM2.5
(A) (B) (C) (D) (E) (F) (G) (H) (I) (J) (K) (L) (M) (N) (O)
81-010 12 Silo, Filling - Pneumatic NA 26,663 19 Baghouse with Single Pickup (Attached 99.5 0.270 0.016 0.005 0.02 0.00 0.00
81-112 4 Transfer Point (Note 2) NA 26,663 18 Baghouse with Single Pickup (Full Encl 99.0 0.029 0.014 0.004 0.00 0.00 0.00
81-112 5 Conveyor (Note 2) 40 26,663 18 Baghouse with Single Pickup (Full Encl 99.0 0.029 0.014 0.004 0.00 0.00 0.00
81-115 4 Transfer Point (Note 2) 6 0 18 Baghouse with Single Pickup (Full Encl 99.0 0.029 0.014 0.004 0.00 0.00 0.00
81-020 12 Silo, Filling - Pneumatic NA 7,456 19 Baghouse with Single Pickup (Attached 99.5 0.270 0.016 0.005 0.01 0.00 0.00
81-024 4 Transfer Point (Note 2) NA 7,456 18 Baghouse with Single Pickup (Full Encl 99.0 0.029 0.014 0.004 0.00 0.00 0.00
81-024 5 Conveyor (Note 2) 40 7,456 18 Baghouse with Single Pickup (Full Encl 99.0 0.029 0.014 0.004 0.00 0.00 0.00
81-022 4 Transfer Point (Note 2) 1 9,353 15 Baghouse with Multiple Pickups 95.0 0.029 0.014 0.004 0.01 0.00 0.00
81-030 12 Silo, Filling - Pneumatic NA 23,861 19 Baghouse with Single Pickup (Attached 99.5 0.270 0.016 0.005 0.02 0.00 0.00
81-032 17 Feeder 2 23,861 18 Baghouse with Single Pickup (Full Encl 99.0 0.029 0.014 0.004 0.00 0.00 0.00
81-002 17 Feeder 2 47,722 18 Baghouse with Single Pickup (Full Encl 99.0 0.029 0.014 0.004 0.01 0.00 0.00
81-034 4 Transfer Point (Note 2) 1 47,722 18 Baghouse with Single Pickup (Full Encl 99.0 0.029 0.014 0.004 0.01 0.00 0.00
81-040 12 Silo, Filling - Pneumatic NA 23,861 18 Baghouse with Single Pickup (Full Encl 99.0 0.270 0.016 0.005 0.03 0.00 0.00
81-043 17 Feeder 0.75 23,861 18 Baghouse with Single Pickup (Full Encl 99.0 0.029 0.014 0.004 0.00 0.00 0.00
81-460 12 Silo, Filling - Pneumatic NA 0 19 Baghouse with Single Pickup (Attached 99.5 0.270 0.016 0.005 0.00 0.00 0.00
81-462 4 Transfer Point (Note 2) NA 0 18 Baghouse with Single Pickup (Full Encl 99.0 0.029 0.014 0.004 0.00 0.00 0.00
81-462 5 Conveyor (Note 2) 20 0 18 Baghouse with Single Pickup (Full Encl 99.0 0.029 0.014 0.004 0.00 0.00 0.00
81-500 12 Silo, Filling - Pneumatic NA 47,722 19 Baghouse with Single Pickup (Attached 99.5 0.270 0.016 0.005 0.03 0.00 0.00
81-507 17 Feeder 3 47,722 18 Baghouse with Single Pickup (Full Encl 99.0 0.029 0.014 0.004 0.01 0.00 0.00
81-508 4 Transfer Point (Note 2) NA 47,722 18 Baghouse with Single Pickup (Full Encl 99.0 0.029 0.014 0.004 0.01 0.00 0.00
81-522 5 Conveyor (Note 2) 30 23,861 18 Baghouse with Single Pickup (Full Encl 99.0 0.029 0.014 0.004 0.00 0.00 0.00
81-512 5 Conveyor (Note 2) 30 23,861 18 Baghouse with Single Pickup (Full Encl 99.0 0.029 0.014 0.004 0.00 0.00 0.00
81525 15 Silo, discharge to Tank Truck 1 23,861 18 Baghouse with Single Pickup (Full Encl 99.0 0.240 0.016 0.005 0.03 0.00 0.00
81-515 15 Silo, discharge to Tank Truck 1 23,861 18 Baghouse with Single Pickup (Full Encl 99.0 0.240 0.016 0.005 0.03 0.00 0.00
81-600 12 Silo, Filling - Pneumatic NA 16,962 19 Baghouse with Single Pickup (Attached 99.5 0.270 0.016 0.005 0.01 0.00 0.00
81-607 17 Feeder 3 16,962 18 Baghouse with Single Pickup (Full Encl 99.0 0.029 0.014 0.004 0.00 0.00 0.00
81-608 4 Transfer Point (Note 2) NA 16,962 18 Baghouse with Single Pickup (Full Encl 99.0 0.029 0.014 0.004 0.00 0.00 0.00
81-622 5 Conveyor (Note 2) 30 11,825 18 Baghouse with Single Pickup (Full Encl 99.0 0.029 0.014 0.004 0.00 0.00 0.00
81-612 5 Conveyor (Note 2) 30 11,825 18 Baghouse with Single Pickup (Full Encl 99.0 0.029 0.014 0.004 0.00 0.00 0.00
81-625 15 Silo, discharge to Tank Truck 1 11,825 18 Baghouse with Single Pickup (Full Encl 99.0 0.240 0.016 0.005 0.01 0.00 0.00
81-615 15 Silo, discharge to Tank Truck 1 11,825 18 Baghouse with Single Pickup (Full Encl 99.0 0.240 0.016 0.005 0.01 0.00 0.00
TOTAL HORSEPOWER 242.75
AVERAGE THROUGHPUT PER DEVICE 20,626
BLOCK XIV - EMISSIONS & HARP INPUTS
EMISSION INVENTORY INPUTSDEVICE DATA EMISSION DATA
PERMIT ID B002009 ANNUAL EMISSIONS (tpy) PM PM10 PM2.5
NUMBER OF DEVICES 31 UNCONTROLLED 34.438 4.625 1.450
EQUIPMENT SIZE (bhp) 242.75 CONTROLLED 0.267 0.044 0.014
PROCESS DATA EMISSION FACTOR (lb/ton)
PROCESS RATE (tpy) Varies UNCONTROLLED #VALUE! #VALUE! #VALUE!
MAX. DESIGN RATE (tph) 50 CONTROLLED #VALUE! #VALUE! #VALUE!
MAX. HOURLY PRODUCTION RATE (tph) 50 FRACTIONATION VALUE ( PM10 or PM2.5 / PM) 0.1644 0.0516
AVE. HOURLY PRODUCTION RATE (tph) Need Actual Hours in 'CD21' OVERALL EFFICIENCY #VALUE! #VALUE! #VALUE!
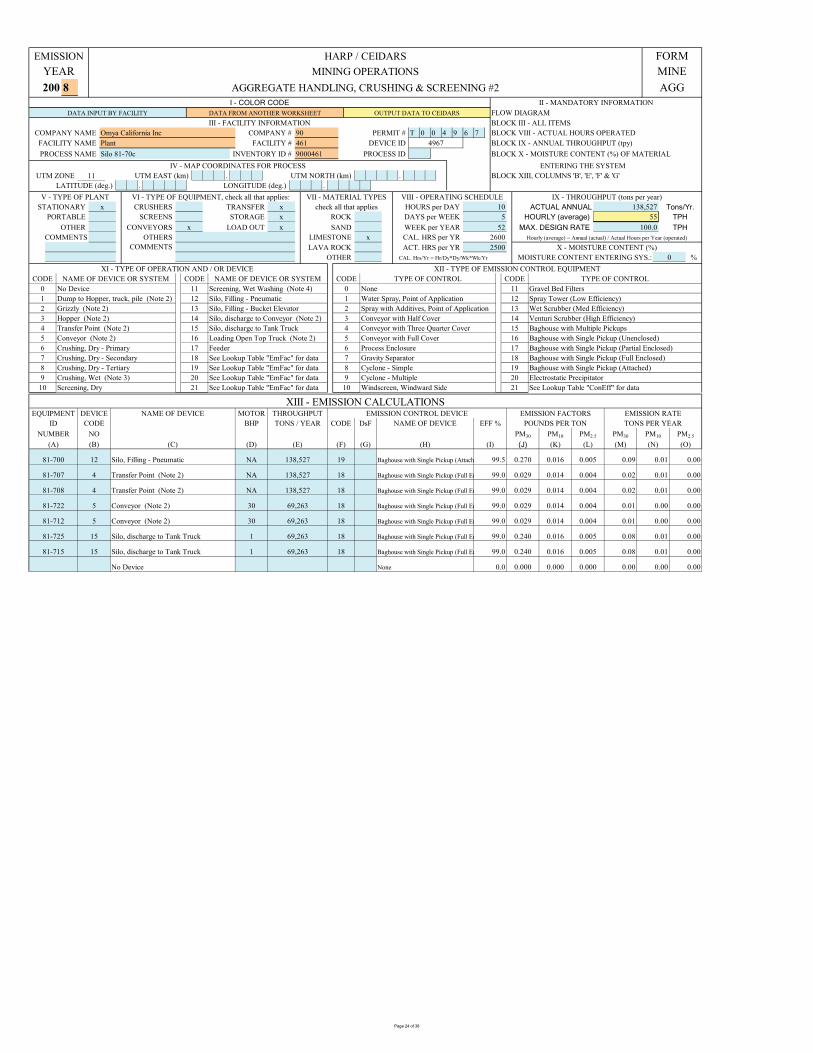
Page 24 of 38
. .. .
HOURS per DAY ROCK DAYS per WEEK SAND WEEK per YEAR
LIMESTONE CAL. HRS per YR LAVA ROCK ACT. HRS per YR
OTHER CAL. Hrs/Yr = Hr/Dy*Dy/Wk*Wk/Yr
EMISSION HARP / CEIDARS FORMYEAR MINING OPERATIONS MINE200 8 AGGREGATE HANDLING, CRUSHING & SCREENING #2 AGG
I - COLOR CODE II - MANDATORY INFORMATIONDATA INPUT BY FACILITY DATA FROM ANOTHER WORKSHEET OUTPUT DATA TO CEIDARS FLOW DIAGRAM
III - FACILITY INFORMATION BLOCK III - ALL ITEMSCOMPANY NAME Omya California Inc COMPANY # 90 PERMIT # T 0 0 4 9 6 7 BLOCK VIII - ACTUAL HOURS OPERATEDFACILITY NAME Plant FACILITY # 461 DEVICE ID 4967 BLOCK IX - ANNUAL THROUGHPUT (tpy)PROCESS NAME Silo 81-70c INVENTORY ID # 9000461 PROCESS ID BLOCK X - MOISTURE CONTENT (%) OF MATERIAL
IV - MAP COORDINATES FOR PROCESS ENTERING THE SYSTEMUTM ZONE 11 UTM EAST (km) BLOCK XIII, COLUMNS 'B', 'E', 'F' & 'G'
LATITUDE (deg.) UTM NORTH (km)
LONGITUDE (deg.) V - TYPE OF PLANT VI - TYPE OF EQUIPMENT, check all that applies: VII - MATERIAL TYPES VIII - OPERATING SCHEDULE IX - THROUGHPUT (tons per year)
STATIONARY x CRUSHERS TRANSFER x check all that applies 10 ACTUAL ANNUAL 138,527 Tons/Yr.PORTABLE SCREENS STORAGE x 5 HOURLY (average) 55 TPH
OTHER CONVEYORS x LOAD OUT x 52 MAX. DESIGN RATE 100.0 TPHCOMMENTS OTHERS x 2600 Hourly (average) = Annual (actual) / Actual Hours per Year (operated)
COMMENTS 2500 X - MOISTURE CONTENT (%)MOISTURE CONTENT ENTERING SYS.: 0 %
XI - TYPE OF OPERATION AND / OR DEVICE XII - TYPE OF EMISSION CONTROL EQUIPMENTCODE NAME OF DEVICE OR SYSTEM CODE NAME OF DEVICE OR SYSTEM CODE TYPE OF CONTROL CODE TYPE OF CONTROL
0 No Device 11 Screening, Wet Washing (Note 4) 0 None 11 Gravel Bed Filters1 Dump to Hopper, truck, pile (Note 2) 12 Silo, Filling - Pneumatic 1 Water Spray, Point of Application 12 Spray Tower (Low Efficiency)2 Grizzly (Note 2) 13 Silo, Filling - Bucket Elevator 2 Spray with Additives, Point of Application 13 Wet Scrubber (Med Efficiency)3 Hopper (Note 2) 14 Silo, discharge to Conveyor (Note 2) 3 Conveyor with Half Cover 14 Venturi Scrubber (High Efficiency)4 Transfer Point (Note 2) 15 Silo, discharge to Tank Truck 4 Conveyor with Three Quarter Cover 15 Baghouse with Multiple Pickups5 Conveyor (Note 2) 16 Loading Open Top Truck (Note 2) 5 Conveyor with Full Cover 16 Baghouse with Single Pickup (Unenclosed)6 Crushing, Dry - Primary 17 Feeder 6 Process Enclosure 17 Baghouse with Single Pickup (Partial Enclosed)7 Crushing, Dry - Secondary 18 See Lookup Table "EmFac" for data 7 Gravity Separator 18 Baghouse with Single Pickup (Full Enclosed)8 Crushing, Dry - Tertiary 19 See Lookup Table "EmFac" for data 8 Cyclone - Simple 19 Baghouse with Single Pickup (Attached)9 Crushing, Wet (Note 3) 20 See Lookup Table "EmFac" for data 9 Cyclone - Multiple 20 Electrostatic Precipitator
10 Screening, Dry 21 See Lookup Table "EmFac" for data 10 Windscreen, Windward Side 21 See Lookup Table "ConEff" for data
XIII - EMISSION CALCULATIONSEQUIPMENT DEVICE NAME OF DEVICE MOTOR THROUGHPUT EMISSION CONTROL DEVICE EMISSION FACTORS EMISSION RATE
ID CODE BHP TONS / YEAR CODE DsF NAME OF DEVICE EFF % POUNDS PER TON TONS PER YEARNUMBER NO PM30 PM10 PM2.5 PM30 PM10 PM2.5
(A) (B) (C) (D) (E) (F) (G) (H) (I) (J) (K) (L) (M) (N) (O)
81-700 12 Silo, Filling - Pneumatic NA 138,527 19 Baghouse with Single Pickup (Attach 99.5 0.270 0.016 0.005 0.09 0.01 0.00
81-707 4 Transfer Point (Note 2) NA 138,527 18 Baghouse with Single Pickup (Full En 99.0 0.029 0.014 0.004 0.02 0.01 0.00
81-708 4 Transfer Point (Note 2) NA 138,527 18 Baghouse with Single Pickup (Full En 99.0 0.029 0.014 0.004 0.02 0.01 0.00
81-722 5 Conveyor (Note 2) 30 69,263 18 Baghouse with Single Pickup (Full En 99.0 0.029 0.014 0.004 0.01 0.00 0.00
81-712 5 Conveyor (Note 2) 30 69,263 18 Baghouse with Single Pickup (Full En 99.0 0.029 0.014 0.004 0.01 0.00 0.00
81-725 15 Silo, discharge to Tank Truck 1 69,263 18 Baghouse with Single Pickup (Full En 99.0 0.240 0.016 0.005 0.08 0.01 0.00
81-715 15 Silo, discharge to Tank Truck 1 69,263 18 Baghouse with Single Pickup (Full En 99.0 0.240 0.016 0.005 0.08 0.01 0.00
No Device None 0.0 0.000 0.000 0.000 0.00 0.00 0.00

Page 25 of 38
EMISSION HARP / CEIDARS FORMYEAR MINING OPERATIONS MINE200 8 AGGREGATE HANDLING, CRUSHING & SCREENING #2 AGG
TOTAL HORSEPOWER 62
AVERAGE THROUGHPUT PER DEVICE 98,948
BLOCK XIV - EMISSIONS & HARP INPUTS
EMISSION INVENTORY INPUTSDEVICE DATA EMISSION DATA
PERMIT ID T004967 ANNUAL EMISSIONS (tpy) PM PM10 PM2.5
NUMBER OF DEVICES 7 UNCONTROLLED 41.331 5.058 1.586
EQUIPMENT SIZE (bhp) 62 CONTROLLED 0.320 0.045 0.014
PROCESS DATA EMISSION FACTOR (lb/ton)
PROCESS RATE (tpy) 138,527 UNCONTROLLED 0.5967 0.0730 0.0229
MAX. DESIGN RATE (tph) 100 CONTROLLED 0.0046 0.0007 0.0002
MAX. HOURLY PRODUCTION RATE (tph) 100 FRACTIONATION VALUE ( PM10 or PM2.5 / PM) 0.1408 0.0442
AVE. HOURLY PRODUCTION RATE (tph) 55 OVERALL EFFICIENCY 99.23 99.11 99.11
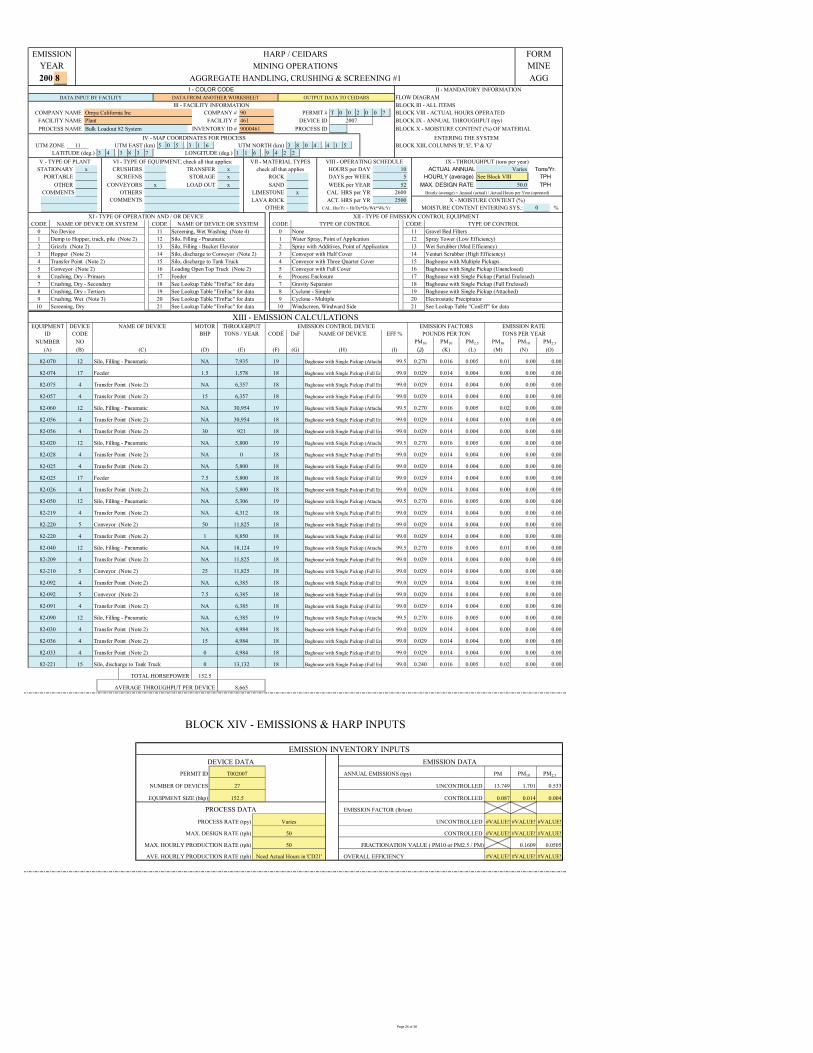
Page 26 of 38
. .. .
HOURS per DAY ROCK DAYS per WEEK SAND WEEK per YEAR
LIMESTONE CAL. HRS per YR LAVA ROCK ACT. HRS per YR
OTHER CAL. Hrs/Yr = Hr/Dy*Dy/Wk*Wk/Yr
EMISSION HARP / CEIDARS FORMYEAR MINING OPERATIONS MINE200 8 AGGREGATE HANDLING, CRUSHING & SCREENING #1 AGG
I - COLOR CODE II - MANDATORY INFORMATIONDATA INPUT BY FACILITY DATA FROM ANOTHER WORKSHEET OUTPUT DATA TO CEIDARS FLOW DIAGRAM
III - FACILITY INFORMATION BLOCK III - ALL ITEMSCOMPANY NAME Omya California Inc COMPANY # 90 PERMIT # T 0 0 2 0 0 7 BLOCK VIII - ACTUAL HOURS OPERATED
FACILITY NAME Plant FACILITY # 461 DEVICE ID 2007 BLOCK IX - ANNUAL THROUGHPUT (tpy)PROCESS NAME Bulk Loadout 82 System INVENTORY ID # 9000461 PROCESS ID BLOCK X - MOISTURE CONTENT (%) OF MATERIAL
IV - MAP COORDINATES FOR PROCESS ENTERING THE SYSTEMUTM ZONE 11 UTM EAST (km) 5 0 5 3 1 6 BLOCK XIII, COLUMNS 'B', 'E', 'F' & 'G'
LATITUDE (deg.) 3 4 3 8 3UTM NORTH (km) 3 8
1 6 91 50 4 4
4 2 27 LONGITUDE (deg.) 1V - TYPE OF PLANT VI - TYPE OF EQUIPMENT, check all that applies: VII - MATERIAL TYPES VIII - OPERATING SCHEDULE IX - THROUGHPUT (tons per year)
STATIONARY x CRUSHERS TRANSFER x check all that applies 10 ACTUAL ANNUAL Varies Tons/Yr.PORTABLE SCREENS STORAGE x 5 HOURLY (average) See Block VIII TPH
OTHER CONVEYORS x LOAD OUT x 52 MAX. DESIGN RATE 50.0 TPHCOMMENTS OTHERS x 2600 Hourly (average) = Annual (actual) / Actual Hours per Year (operated)
COMMENTS 2500 X - MOISTURE CONTENT (%)MOISTURE CONTENT ENTERING SYS.: 0 %
XI - TYPE OF OPERATION AND / OR DEVICE XII - TYPE OF EMISSION CONTROL EQUIPMENTCODE NAME OF DEVICE OR SYSTEM CODE NAME OF DEVICE OR SYSTEM CODE TYPE OF CONTROL CODE TYPE OF CONTROL
0 No Device 11 Screening, Wet Washing (Note 4) 0 None 11 Gravel Bed Filters1 Dump to Hopper, truck, pile (Note 2) 12 Silo, Filling - Pneumatic 1 Water Spray, Point of Application 12 Spray Tower (Low Efficiency)2 Grizzly (Note 2) 13 Silo, Filling - Bucket Elevator 2 Spray with Additives, Point of Application 13 Wet Scrubber (Med Efficiency)3 Hopper (Note 2) 14 Silo, discharge to Conveyor (Note 2) 3 Conveyor with Half Cover 14 Venturi Scrubber (High Efficiency)4 Transfer Point (Note 2) 15 Silo, discharge to Tank Truck 4 Conveyor with Three Quarter Cover 15 Baghouse with Multiple Pickups5 Conveyor (Note 2) 16 Loading Open Top Truck (Note 2) 5 Conveyor with Full Cover 16 Baghouse with Single Pickup (Unenclosed)6 Crushing, Dry - Primary 17 Feeder 6 Process Enclosure 17 Baghouse with Single Pickup (Partial Enclosed)7 Crushing, Dry - Secondary 18 See Lookup Table "EmFac" for data 7 Gravity Separator 18 Baghouse with Single Pickup (Full Enclosed)8 Crushing, Dry - Tertiary 19 See Lookup Table "EmFac" for data 8 Cyclone - Simple 19 Baghouse with Single Pickup (Attached)9 Crushing, Wet (Note 3) 20 See Lookup Table "EmFac" for data 9 Cyclone - Multiple 20 Electrostatic Precipitator
10 Screening, Dry 21 See Lookup Table "EmFac" for data 10 Windscreen, Windward Side 21 See Lookup Table "ConEff" for data
XIII - EMISSION CALCULATIONSEQUIPMENT DEVICE NAME OF DEVICE MOTOR THROUGHPUT EMISSION CONTROL DEVICE EMISSION FACTORS EMISSION RATE
ID CODE BHP TONS / YEAR CODE DsF NAME OF DEVICE EFF % POUNDS PER TON TONS PER YEARNUMBER NO PM30 PM10 PM2.5 PM30 PM10 PM2.5
(A) (B) (C) (D) (E) (F) (G) (H) (I) (J) (K) (L) (M) (N) (O)
82-070 12 Silo, Filling - Pneumatic NA 7,935 19 Baghouse with Single Pickup (Attache 99.5 0.270 0.016 0.005 0.01 0.00 0.00
82-074 17 Feeder 1.5 1,578 18 Baghouse with Single Pickup (Full En 99.0 0.029 0.014 0.004 0.00 0.00 0.00
82-075 4 Transfer Point (Note 2) NA 6,357 18 Baghouse with Single Pickup (Full En 99.0 0.029 0.014 0.004 0.00 0.00 0.00
82-057 4 Transfer Point (Note 2) 15 6,357 18 Baghouse with Single Pickup (Full En 99.0 0.029 0.014 0.004 0.00 0.00 0.00
82-060 12 Silo, Filling - Pneumatic NA 30,954 19 Baghouse with Single Pickup (Attache 99.5 0.270 0.016 0.005 0.02 0.00 0.00
82-056 4 Transfer Point (Note 2) NA 30,954 18 Baghouse with Single Pickup (Full En 99.0 0.029 0.014 0.004 0.00 0.00 0.00
82-056 4 Transfer Point (Note 2) 30 921 18 Baghouse with Single Pickup (Full En 99.0 0.029 0.014 0.004 0.00 0.00 0.00
82-020 12 Silo, Filling - Pneumatic NA 5,800 19 Baghouse with Single Pickup (Attache 99.5 0.270 0.016 0.005 0.00 0.00 0.00
82-028 4 Transfer Point (Note 2) NA 0 18 Baghouse with Single Pickup (Full En 99.0 0.029 0.014 0.004 0.00 0.00 0.00
82-025 4 Transfer Point (Note 2) NA 5,800 18 Baghouse with Single Pickup (Full En 99.0 0.029 0.014 0.004 0.00 0.00 0.00
82-025 17 Feeder 7.5 5,800 18 Baghouse with Single Pickup (Full En 99.0 0.029 0.014 0.004 0.00 0.00 0.00
82-026 4 Transfer Point (Note 2) NA 5,800 18 Baghouse with Single Pickup (Full En 99.0 0.029 0.014 0.004 0.00 0.00 0.00
82-050 12 Silo, Filling - Pneumatic NA 5,306 19 Baghouse with Single Pickup (Attache 99.5 0.270 0.016 0.005 0.00 0.00 0.00
82-219 4 Transfer Point (Note 2) NA 4,312 18 Baghouse with Single Pickup (Full En 99.0 0.029 0.014 0.004 0.00 0.00 0.00
82-220 5 Conveyor (Note 2) 50 11,825 18 Baghouse with Single Pickup (Full En 99.0 0.029 0.014 0.004 0.00 0.00 0.00
82-220 4 Transfer Point (Note 2) 1 8,850 18 Baghouse with Single Pickup (Full En 99.0 0.029 0.014 0.004 0.00 0.00 0.00
82-040 12 Silo, Filling - Pneumatic NA 18,124 19 Baghouse with Single Pickup (Attache 99.5 0.270 0.016 0.005 0.01 0.00 0.00
82-209 4 Transfer Point (Note 2) NA 11,825 18 Baghouse with Single Pickup (Full En 99.0 0.029 0.014 0.004 0.00 0.00 0.00
82-210 5 Conveyor (Note 2) 25 11,825 18 Baghouse with Single Pickup (Full En 99.0 0.029 0.014 0.004 0.00 0.00 0.00
82-092 4 Transfer Point (Note 2) NA 6,385 18 Baghouse with Single Pickup (Full En 99.0 0.029 0.014 0.004 0.00 0.00 0.00
82-092 5 Conveyor (Note 2) 7.5 6,385 18 Baghouse with Single Pickup (Full En 99.0 0.029 0.014 0.004 0.00 0.00 0.00
82-091 4 Transfer Point (Note 2) NA 6,385 18 Baghouse with Single Pickup (Full En 99.0 0.029 0.014 0.004 0.00 0.00 0.00
82-090 12 Silo, Filling - Pneumatic NA 6,385 19 Baghouse with Single Pickup (Attache 99.5 0.270 0.016 0.005 0.00 0.00 0.00
82-030 4 Transfer Point (Note 2) NA 4,984 18 Baghouse with Single Pickup (Full En 99.0 0.029 0.014 0.004 0.00 0.00 0.00
82-036 4 Transfer Point (Note 2) 15 4,984 18 Baghouse with Single Pickup (Full En 99.0 0.029 0.014 0.004 0.00 0.00 0.00
82-033 4 Transfer Point (Note 2) 0 4,984 18 Baghouse with Single Pickup (Full En 99.0 0.029 0.014 0.004 0.00 0.00 0.00
82-221 15 Silo, discharge to Tank Truck 0 13,132 18 Baghouse with Single Pickup (Full En 99.0 0.240 0.016 0.005 0.02 0.00 0.00
TOTAL HORSEPOWER 152.5
AVERAGE THROUGHPUT PER DEVICE 8,665
BLOCK XIV - EMISSIONS & HARP INPUTS
EMISSION INVENTORY INPUTSDEVICE DATA EMISSION DATA
PERMIT ID T002007 ANNUAL EMISSIONS (tpy) PM PM10 PM2.5
NUMBER OF DEVICES 27 UNCONTROLLED 13.749 1.701 0.533
EQUIPMENT SIZE (bhp) 152.5 CONTROLLED 0.087 0.014 0.004
PROCESS DATA EMISSION FACTOR (lb/ton)
PROCESS RATE (tpy) Varies UNCONTROLLED #VALUE! #VALUE! #VALUE!
MAX. DESIGN RATE (tph) 50 CONTROLLED #VALUE! #VALUE! #VALUE!
MAX. HOURLY PRODUCTION RATE (tph) 50 FRACTIONATION VALUE ( PM10 or PM2.5 / PM) 0.1609 0.0505
AVE. HOURLY PRODUCTION RATE (tph) Need Actual Hours in 'CD21' OVERALL EFFICIENCY #VALUE! #VALUE! #VALUE!

Page 27 of 38
. .. .
HOURS per DAY ROCK DAYS per WEEK SAND WEEK per YEAR
LIMESTONE CAL. HRS per YR LAVA ROCK ACT. HRS per YR
OTHER CAL. Hrs/Yr = Hr/Dy*Dy/Wk*Wk/Yr
EMISSION HARP / CEIDARS FORMYEAR MINING OPERATIONS MINE200 8 AGGREGATE HANDLING, CRUSHING & SCREENING #1 AGG
I - COLOR CODE II - MANDATORY INFORMATIONDATA INPUT BY FACILITY DATA FROM ANOTHER WORKSHEET OUTPUT DATA TO CEIDARS FLOW DIAGRAM
III - FACILITY INFORMATION BLOCK III - ALL ITEMSCOMPANY NAME Omya California Inc COMPANY # 90 PERMIT # T 0 0 2 0 0 9 BLOCK VIII - ACTUAL HOURS OPERATEDFACILITY NAME Plant FACILITY # 461 DEVICE ID 2009 BLOCK IX - ANNUAL THROUGHPUT (tpy)PROCESS NAME Bulk Loadout 83 System INVENTORY ID # 9000461 PROCESS ID BLOCK X - MOISTURE CONTENT (%) OF MATERIAL
IV - MAP COORDINATES FOR PROCESS ENTERING THE SYSTEMUTM ZONE 11 UTM EAST (km) 5 0 5 3 1 6 BLOCK XIII, COLUMNS 'B', 'E', 'F' & 'G'
LATITUDE (deg.) 3 4 3 8 3UTM NORTH (km) 3 8
1 6 91 50 4 4
4 2 27 LONGITUDE (deg.) 1V - TYPE OF PLANT VI - TYPE OF EQUIPMENT, check all that applies: VII - MATERIAL TYPES VIII - OPERATING SCHEDULE IX - THROUGHPUT (tons per year)
STATIONARY x CRUSHERS TRANSFER x check all that applies 10 ACTUAL ANNUAL Varies Tons/Yr.PORTABLE SCREENS STORAGE x 5 HOURLY (average) See Block VIII TPH
OTHER CONVEYORS x LOAD OUT x 52 MAX. DESIGN RATE 50.0 TPHCOMMENTS OTHERS x 2600 Hourly (average) = Annual (actual) / Actual Hours per Year (operated)
COMMENTS 2500 X - MOISTURE CONTENT (%)MOISTURE CONTENT ENTERING SYS.: 0 %
XI - TYPE OF OPERATION AND / OR DEVICE XII - TYPE OF EMISSION CONTROL EQUIPMENTCODE NAME OF DEVICE OR SYSTEM CODE NAME OF DEVICE OR SYSTEM CODE TYPE OF CONTROL CODE TYPE OF CONTROL
0 No Device 11 Screening, Wet Washing (Note 4) 0 None 11 Gravel Bed Filters1 Dump to Hopper, truck, pile (Note 2) 12 Silo, Filling - Pneumatic 1 Water Spray, Point of Application 12 Spray Tower (Low Efficiency)2 Grizzly (Note 2) 13 Silo, Filling - Bucket Elevator 2 Spray with Additives, Point of Application 13 Wet Scrubber (Med Efficiency)3 Hopper (Note 2) 14 Silo, discharge to Conveyor (Note 2) 3 Conveyor with Half Cover 14 Venturi Scrubber (High Efficiency)4 Transfer Point (Note 2) 15 Silo, discharge to Tank Truck 4 Conveyor with Three Quarter Cover 15 Baghouse with Multiple Pickups5 Conveyor (Note 2) 16 Loading Open Top Truck (Note 2) 5 Conveyor with Full Cover 16 Baghouse with Single Pickup (Unenclosed)6 Crushing, Dry - Primary 17 Feeder 6 Process Enclosure 17 Baghouse with Single Pickup (Partial Enclosed)7 Crushing, Dry - Secondary 18 See Lookup Table "EmFac" for data 7 Gravity Separator 18 Baghouse with Single Pickup (Full Enclosed)8 Crushing, Dry - Tertiary 19 See Lookup Table "EmFac" for data 8 Cyclone - Simple 19 Baghouse with Single Pickup (Attached)9 Crushing, Wet (Note 3) 20 See Lookup Table "EmFac" for data 9 Cyclone - Multiple 20 Electrostatic Precipitator10 Screening, Dry 21 See Lookup Table "EmFac" for data 10 Windscreen, Windward Side 21 See Lookup Table "ConEff" for data
XIII - EMISSION CALCULATIONSEQUIPMENT DEVICE NAME OF DEVICE MOTOR THROUGHPUT EMISSION CONTROL DEVICE EMISSION FACTORS EMISSION RATE
ID CODE BHP TONS / YEAR CODE DsF NAME OF DEVICE EFF % POUNDS PER TON TONS PER YEARNUMBER NO PM30 PM10 PM2.5 PM30 PM10 PM2.5
(A) (B) (C) (D) (E) (F) (G) (H) (I) (J) (K) (L) (M) (N) (O)
83-001 12 Silo, Filling - Pneumatic NA 3,710 19 Baghouse with Single Pickup (Attache 99.5 0.270 0.016 0.005 0.00 0.00 0.00
83-005 17 Feeder 2 3,650 18 Baghouse with Single Pickup (Full En 99.0 0.029 0.014 0.004 0.00 0.00 0.00
83-005/006 4 Transfer Point (Note 2) NA 3,650 18 Baghouse with Single Pickup (Full En 99.0 0.029 0.014 0.004 0.00 0.00 0.00
83-096 17 Feeder 2 60 18 Baghouse with Single Pickup (Full En 99.0 0.029 0.014 0.004 0.00 0.00 0.00
82-316 4 Transfer Point (Note 2) NA 60 18 Baghouse with Single Pickup (Full En 99.0 0.029 0.014 0.004 0.00 0.00 0.00
83-031 12 Silo, Filling - Pneumatic NA 5,885 19 Baghouse with Single Pickup (Attache 99.5 0.270 0.016 0.005 0.00 0.00 0.00
83-093 4 Transfer Point (Note 2) NA 4,554 18 Baghouse with Single Pickup (Full En 99.0 0.029 0.014 0.004 0.00 0.00 0.00
83-111 17 Feeder 1 4,554 18 Baghouse with Single Pickup (Full En 99.0 0.029 0.014 0.004 0.00 0.00 0.00
83-112 5 Conveyor (Note 2) 7.5 4,554 18 Baghouse with Single Pickup (Full En 99.0 0.029 0.014 0.004 0.00 0.00 0.00
83-112 15 Silo, discharge to Tank Truck 1 4,554 18 Baghouse with Single Pickup (Full En 99.0 0.240 0.016 0.005 0.01 0.00 0.00
83-035 17 Feeder 2 2,074 18 Baghouse with Single Pickup (Full En 99.0 0.029 0.014 0.004 0.00 0.00 0.00
83-035/036 4 Transfer Point (Note 2) NA 2,074 18 Baghouse with Single Pickup (Full En 99.0 0.029 0.014 0.004 0.00 0.00 0.00
83-095 17 Feeder 2 382 18 Baghouse with Single Pickup (Full En 99.0 0.029 0.014 0.004 0.00 0.00 0.00
83-101 4 Transfer Point (Note 2) 1 382 18 Baghouse with Single Pickup (Full En 99.0 0.029 0.014 0.004 0.00 0.00 0.00
None 0.000 0.00 0.00No Device 0.00
TOTAL HORSEPOWER 18.5
AVERAGE THROUGHPUT PER DEVICE 2,867
0.0 0.000 0.000
BLOCK XIV - EMISSIONS & HARP INPUTS
EMISSION INVENTORY INPUTSDEVICE DATA EMISSION DATA
PERMIT ID T002009 ANNUAL EMISSIONS (tpy) PM PM10 PM2.5
NUMBER OF DEVICES 14 UNCONTROLLED 2.218 0.291 0.091
EQUIPMENT SIZE (bhp) 18.5 CONTROLLED 0.016 0.003 0.001
PROCESS DATA EMISSION FACTOR (lb/ton)
PROCESS RATE (tpy) Varies UNCONTROLLED #VALUE! #VALUE! #VALUE!
MAX. DESIGN RATE (tph) 50 CONTROLLED #VALUE! #VALUE! #VALUE!
MAX. HOURLY PRODUCTION RATE (tph) 50 FRACTIONATION VALUE ( PM10 or PM2.5 / PM) 0.1609 0.0505
AVE. HOURLY PRODUCTION RATE (tph) Need Actual Hours in 'CD21' OVERALL EFFICIENCY #VALUE! #VALUE! #VALUE!

Page 28 of 38
FORMMINE
200 8 S-PILES
90461
Device ID# 90015A
Name of / Material Type Exposed Surface Silt Loading MoistureNumber (uncontrolled)
acres % %Feeders 1-6 Limestone 1.9000 1.5 1.5
White & Blend Limestone 3.2000 1.5 1.5titan Limestone 1.3000 1.5 1.5
OM 100 Limestone 2.3000 1.5 1.5Fines Pile Limestone 0.7000 1.5 1.5
Optical Sorter Limestone 0.5000 1.5 1.530 0.530 0.530 0.530 0.530 0.530 0.530 0.530 0.530 0.530 0.5
StockpileName / Number Wind Screen
check gal/acre/day check check Specify Efficiency (%)Feeders 1-6 x Water Spray 75
White & Blend x Water Spray 75titan x Water Spray 75
OM 100 x Water Spray 75Fines Pile x Water Spray 75
Optical Sorter x Water Spray 750000000000
Plant FACILITY NUMBER:
EMISSIONYEAR MINING OPERATIONS
HARP / CEIDARS
STOCKPILES
DATA INPUT BY FACILITY DATA FROM ANOTHER WORKSHEET OUTPUT DATA TO CEIDARS
COMPANY NAME: Omya California Inc COMPANY NUMBER: FACILITY NAME:
Stockpile
Dust ControlsWater Spray Other

Page 29 of 38
FORMMINE
200 8 S-PILES
EMISSIONYEAR MINING OPERATIONS
HARP / CEIDARS
STOCKPILES
Device ID# 90015 SCC 30502507
Emission Factors (pounds per acres)EmFac = J *1.7 * s/1.5 * (365 - P)/235 * I/15 * 365
J = Aerodynamic factor Aerodynamic factors = Silt Loading (%) TSP = 1.0P = Day per year with at least 0.01 inches of precipitation PM10 = 0.5I = Percent of time with wind speed >12mph (%) PM2.5 = 0.2
Stockpile Material Type Size (acres) TSP PM10 PM2.5 PM10 PM2.5
Feeders 1-6 Limestone 1.9000 854.530 427.265 170.906 0.500 0.200White & Blend Limestone 3.2000 854.530 427.265 170.906 0.500 0.200
titan Limestone 1.3000 854.530 427.265 170.906 0.500 0.200OM 100 Limestone 2.3000 854.530 427.265 170.906 0.500 0.200
Fines Pile Limestone 0.7000 854.530 427.265 170.906 0.500 0.200Optical Sorter Limestone 0.5000 854.530 427.265 170.906 0.500 0.200
0 0 0.0000 0.000 0.000 0.000 0.000 0.0000 0 0.0000 0.000 0.000 0.000 0.000 0.0000 0 0.0000 0.000 0.000 0.000 0.000 0.0000 0 0.0000 0.000 0.000 0.000 0.000 0.0000 0 0.0000 0.000 0.000 0.000 0.000 0.0000 0 0.0000 0.000 0.000 0.000 0.000 0.0000 0 0.0000 0.000 0.000 0.000 0.000 0.0000 0 0.0000 0.000 0.000 0.000 0.000 0.0000 0 0.0000 0.000 0.000 0.000 0.000 0.0000 0 0.0000 0.000 0.000 0.000 0.000 0.000
TOTAL 9.9 854.530 427.265 170.906 0.500 0.200Number of Devices 6
StockpileType Efficiency (%) TSP PM10 PM2.5 TSP PM10 PM2.5
Feeders 1-6 Water Spray 75.00 213.632 106.816 42.726 0.203 0.101 0.041White & Blend Water Spray 75.00 213.632 106.816 42.726 0.342 0.171 0.068
titan Water Spray 75.00 213.632 106.816 42.726 0.139 0.069 0.028OM 100 Water Spray 75.00 213.632 106.816 42.726 0.246 0.123 0.049
Fines Pile Water Spray 75.00 213.632 106.816 42.726 0.075 0.037 0.015Optical Sorter Water Spray 75.00 213.632 106.816 42.726 0.053 0.027 0.011
0 None 0.00 0.000 0.000 0.000 0.000 0.000 0.0000 None 0.00 0.000 0.000 0.000 0.000 0.000 0.0000 None 0.00 0.000 0.000 0.000 0.000 0.000 0.0000 None 0.00 0.000 0.000 0.000 0.000 0.000 0.0000 None 0.00 0.000 0.000 0.000 0.000 0.000 0.0000 None 0.00 0.000 0.000 0.000 0.000 0.000 0.0000 None 0.00 0.000 0.000 0.000 0.000 0.000 0.0000 None 0.00 0.000 0.000 0.000 0.000 0.000 0.0000 None 0.00 0.000 0.000 0.000 0.000 0.000 0.0000 None 0.00 0.000 0.000 0.000 0.000 0.000 0.000
TOTAL 75.00 213.632 106.816 42.726
TOTAL 1.057 0.529 0.211
Emission Factor - Uncontrolled (pounds/acre)
Controls Emission Factor - Controlled (pounds/acre) Emissions (tpy) = Area * EmFac
Fractionation Value
EMISSIONS
Throughput (acres)

Page 30 of 38
FORMMINE
200 8 EX-S&P
90461
DISTRICT DEVICE ID CODE FUEL TYPE UNITS OF UNITS USEDPERMIT NO. (See Code below) USAGE PER YEAR
b000767 41-014 14 FUEL OIL #2 @ 0.05 % S 1000 GAL 0.2b000767 41-014 15 PROPANE, LPG 1000 GAL 0.000B002001 42-014 14 FUEL OIL #2 @ 0.05 % S 1000 GAL 24.8B002001 42-014 15 PROPANE, LPG 1000 GAL 0.0B003936 44-027 15 PROPANE, LPG 1000 GAL 0.813B003936 44-027 14 FUEL OIL #2 @ 0.05 % S 1000 GAL 0.183B007678 37678 14 FUEL OIL #2 @ 0.05 % S 1000 GAL 0.731B007678 37678 15 PROPANE, LPG 1000 GAL 0.165
#N/A #N/A#N/A #N/A#N/A #N/A#N/A #N/A#N/A #N/A#N/A #N/A#N/A #N/A
CODE FUEL TYPE SCC1 NATURAL GAS 1-02-006-01
b000767 Roller Mill #1 2 NATURAL GAS 1-02-006-02B002001 Roller Mill #2 3 NATURAL GAS 1-02-006-03B003936 Roller Mill #3 4 NATURAL GAS 1-02-006-06B007678 Roller Mill #4 5 FUEL OIL #2 @ 0.5 % S 1-02-005-01
6 FUEL OIL #2 @ 0.05 % S 1-02-005-017 PROPANE, LPG 1-02-010-028 NATURAL GAS 1-05-001-069 FUEL OIL #2 @ 0.5 % S 1-05-001-05
10 FUEL OIL #2 @ 0.05 % S 1-05-001-0511 PROPANE, LPG 1-05-001-1012 NATURAL GAS 3-05-900-0313 FUEL OIL #2 @ 0.5 % S 3-05-900-0114 FUEL OIL #2 @ 0.05 % S 3-05-900-0115 PROPANE, LPG 3-05-900-9916 NATURAL GAS 2-03-002-0417 FUEL OIL #2 @ 0.5 % S 2-02-017-xx18 FUEL OIL #2 @ 0.05 % S 2-02-017-xx19 PROPANE, LPG 2-02-017-xx20 GASOLINE 2-02-017-2021 NATURAL GAS 2-02-002-0122 NATURAL GAS 2-02-002-0323 FUEL OIL #2 @ 0.5 % S 2-02-001-0124 FUEL OIL #2 @ 0.05 % S 2-02-001-0125 0 026 0 027 0 028 0 029 0 030 0 0
EMISSION HARP / CEIDARSYEAR MINING OPERATIONS
EXHAUST FROM STATIONARY AND PORTABLE FUEL COMBUSTION
DATA INPUT BY FACILITY DATA FROM ANOTHER WORKSHEET OUTPUT DATA TO CEIDARS
COMPANY NAME: Omya California Inc COMPANY NUMBER: FACILITY NAME: Plant FACILITY NUMBER:
EQUIPMENT TYPE
INDUSTRIAL PROCESSINDUSTRIAL PROCESSINDUSTRIAL PROCESSINDUSTRIAL PROCESSINDUSTRIAL PROCESSINDUSTRIAL PROCESSINDUSTRIAL PROCESSINDUSTRIAL PROCESS
#N/A#N/A#N/A#N/A#N/A#N/A#N/A
EQUIPMENT TYPEBOILER > 100 MMBTU/HRBOILER 10 - 100 MMBTU/HRBOILER <10 MMBTU/HRBOILER, COGENERATIONBOILERBOILERBOILERSPACE HEATERSPACE HEATERSPACE HEATERSPACE HEATERINDUSTRIAL PROCESSINDUSTRIAL PROCESSINDUSTRIAL PROCESSINDUSTRIAL PROCESSI. C. ENGINESI. C. ENGINESI. C. ENGINESI. C. ENGINESI. C. ENGINESGAS TURBINESGAS TURBINES - COGEN.GAS TURBINEGAS TURBINEUser defined, see Worksheet "SFB"User defined, see Worksheet "SFB"User defined, see Worksheet "SFB"User defined, see Worksheet "SFB"User defined, see Worksheet "SFB"User defined, see Worksheet "SFB"

Page 31 of 38
FORMMINE
200 8 EX-S&P
EMISSION HARP / CEIDARSYEAR MINING OPERATIONS
EXHAUST FROM STATIONARY AND PORTABLE FUEL COMBUSTION
EXHAUST FROM STATIONARY EQUIPMENT
PERMIT NO. DEVICE ID PROCESS RATE SOURCESUNITS PER YEAR CLASSIFICATION
CODE CODE CO NOx SOxUNITS SCC TOG FRAC PM FRAC
/CAS # 43101 ROG/VOC 42101 42603 42401 11101 PM10 / PM2.5
b000767 41-014 0.2 3-05-900-01 0.21 0.950 5 20 5.35 2 0.97514 1000 GAL Annual Emissions 0.000 0.000 0.000 0.002 0.000 0.000 0.000
b000767 41-014 0.0 3-05-900-99 0.65 0.924 1.8 8.8 1.5 0.26 0.96215 1000 GAL Annual Emissions 0.000 0.000 0.000 0.000 0.000 0.000 0.000
B002001 42-014 24.8 3-05-900-01 0.21 0.950 5 20 5.35 2 0.97514 1000 GAL Annual Emissions 0.003 0.002 0.062 0.248 0.066 0.025 0.024
B002001 42-014 0.0 3-05-900-99 0.65 0.924 1.8 8.8 1.5 0.26 0.96215 1000 GAL Annual Emissions 0.000 0.000 0.000 0.000 0.000 0.000 0.000
B003936 44-027 0.8 3-05-900-99 0.65 0.924 1.8 8.8 1.5 0.26 0.96215 1000 GAL Annual Emissions 0.000 0.000 0.001 0.004 0.001 0.000 0.000
B003936 44-027 0.2 3-05-900-01 0.21 0.950 5 20 5.35 2 0.97514 1000 GAL Annual Emissions 0.000 0.000 0.000 0.002 0.000 0.000 0.000
B007678 37678 0.7 3-05-900-01 0.21 0.950 5 20 5.35 2 0.97514 1000 GAL Annual Emissions 0.000 0.000 0.002 0.007 0.002 0.001 0.001
B007678 37678 0.2 3-05-900-99 0.65 0.924 1.8 8.8 1.5 0.26 0.96215 1000 GAL Annual Emissions 0.000 0.000 0.000 0.001 0.000 0.000 0.000
0 0.0 #N/A #N/A #N/A #N/A #N/A #N/A #N/A #N/A0 #N/A Annual Emissions 0.000 0.000 0.000 0.000 0.000 0.000 0.000
0 0.0 #N/A #N/A #N/A #N/A #N/A #N/A #N/A #N/A0 #N/A Annual Emissions 0.000 0.000 0.000 0.000 0.000 0.000 0.000
0 0.0 #N/A #N/A #N/A #N/A #N/A #N/A #N/A #N/A0 #N/A Annual Emissions 0.000 0.000 0.000 0.000 0.000 0.000 0.000
0 0.0 #N/A #N/A #N/A #N/A #N/A #N/A #N/A #N/A0 #N/A Annual Emissions 0.000 0.000 0.000 0.000 0.000 0.000 0.000
0 0.0 #N/A #N/A #N/A #N/A #N/A #N/A #N/A #N/A0 #N/A Annual Emissions 0.000 0.000 0.000 0.000 0.000 0.000 0.000
0 0.0 #N/A #N/A #N/A #N/A #N/A #N/A #N/A #N/A0 #N/A Annual Emissions 0.000 0.000 0.000 0.000 0.000 0.000 0.000
0 0.0 #N/A #N/A #N/A #N/A #N/A #N/A #N/A #N/A0 #N/A Annual Emissions 0.000 0.000 0.000 0.000 0.000 0.000 0.000
TOTAL EMISSIONS TOG ROG / VOC CO NOx SOx PM PM10 / PM2.5
Tons per Year 0.003 0.003 0.066 0.263 0.070 0.026 0.025
INDUSTRIAL PROCESSFUEL OIL #2 @ 0.05 % S
INDUSTRIAL PROCESSPROPANE, LPG
EMISSIONS
EQUIPMENT TYPE
ORGANIC GASESFUEL TYPE
EMISSIONS FACTORS (pounds per unit of usage)ANNUAL EMISSIONS (tons per year)
PARTICULATE MATTER
INDUSTRIAL PROCESSFUEL OIL #2 @ 0.05 % S
INDUSTRIAL PROCESSPROPANE, LPG
#N/A
INDUSTRIAL PROCESSFUEL OIL #2 @ 0.05 % S
#N/A#N/A
#N/A#N/A
INDUSTRIAL PROCESSPROPANE, LPG
#N/A#N/A
INDUSTRIAL PROCESSFUEL OIL #2 @ 0.05 % S
INDUSTRIAL PROCESSPROPANE, LPG
#N/A
#N/A#N/A
#N/A#N/A
#N/A#N/A

Page 32 of 38
FORMMINE
200 8 EX-M
90461
DEVICE # 90001,2
PROCESS CODE FUEL TYPE UNITS OF UNITS USEDNUMBER (See Code below) USAGE PER YEAR
1 1 DIESEL 1000 hp-hr 329.02 5 GASOLINE 1000 VMT 19.03 7 Diesel 1000 hp-hr 3,297.0
20 #N/A #N/A
CODE FUEL TYPE SCC1 DIESEL 1000 hp-hr 3-05-025-992 GASOLINE 1000 hp-hr 3-05-025-993 NG / LPG 1000 hp-hr 3-05-025-994 DIESEL 1000 GAL 3-05-025-995 GASOLINE 1000 VMT 3-05-025-996 DIESEL 1000 VMT 3-05-025-997 Diesel 1000 hp-hr 3-05-025-99
15 0 0 0
* OFF ROAD INCLUDES MINING AND EARTH MOVING EQUIPMENT 1000 hp-hr = THOUSAND OF HORSEPOWER HOURS** MISC - OFF ROAD INCLUDES NG/LPG LOADER, FORKLIFTS, ETC. 1000 GAL = THOUSAND OF GALLONS OF LIQUID FUEL
*** LIGHT DUTY INCLUDES CARS, VAS, SMALL TRUCKS, ECT. 1000 VTM = THOUSAND VEHICLE MILES TRAVELED**** ON ROAD INCLUDES TRUCKS, ETC . MMCF = MILLION OF CUBIC FEET OF NATURAL GAS
DEVICE # 90001,2
PROCESS CODE PROCESS RATE SOURCESID UNITS PER YEAR CLASSIFICATION
CODE CO NOx SOx PARTICULATE MATTERUNITS SCC TOG FRAC PM FRAC
/CAS # 43101 ROG / VOC 42101 42603 42401 11101 PM10 / PM2.5
329 3-05-025-99 2.42 0.9676 7.50 24.25 2.91 1.54 0.994 1000 hp-hr Annual Emissions 0.398 0.385 1.234 3.989 0.479 0.253 0.252
19 3-05-025-99 2.92 0.914 18.79 2.32 0.12 0.47 0.45 1000 VMT Annual Emissions 0.028 0.025 0.179 0.022 0.001 0.004 0.002
3297 3-05-025-99 0.44 0.97 1.1 15.2 2.9 0.24 0.99 1000 hp-hr Annual Emissions 0.725 0.704 1.813 25.057 4.781 0.396 0.392
TOG ROG / VOC CO NOx SOx PM PM10 / PM2.5
1.151 1.114 3.226 29.068 5.260 0.653 0.646
ORGANIC GASES
EMISSIONS FACTORS (pounds per unit of usage)ANNUAL EMISSIONS (tons per year)
TOTAL EMISSIONS
3 7 Terex low Emission Retro-Fit
2 5 LIGHT DUTY VEHICLES ***
EQUIPMENT TYPE
1 1 HEAVY DUTY - OFF ROAD *
EMISSIONS
User defined, see Lookup Table
LIGHT DUTY VEHICLES *** HEAVY DUTY - ON ROAD ****Terex low Emission Retro-Fit
HEAVY DUTY - OFF ROAD * HEAVY DUTY - OFF ROAD * MISC - OFF ROAD ** LOCOMOTIVES
#N/A
EQUIPMENT TYPE
HEAVY DUTY - OFF ROAD * LIGHT DUTY VEHICLES ***Terex low Emission Retro-Fit
FACILITY NAME: Plant FACILITY NUMBER:
EQUIPMENT TYPE
OUTPUT DATA TO CEIDARS
COMPANY NAME: Omya California Inc COMPANY NUMBER:
EMISSION HARP / CEIDARSYEAR MINING OPERATIONS
EXHAUST FROM MOBILE AND VEHICULAR EQUIPMENT
DATA INPUT BY FACILITY DATA FROM ANOTHER WORKSHEET

Page 33 of 38
FORMMINE
200 8 PROAD
90461
DEVICE #
Process Vehicle type Silt LoadingNumber Empty Loaded Mean Round Trip miles Trips per Day Days per Year Miles per Year grams / sq meter
1 0.0 0.0 1002 0.0 0.0 1003 0.0 0.0 1004 0.0 0.0 1005 0.0 0.0 1006 0.0 0.0 1007 0.0 0.0 1008 0.0 0.0 1009 0.0 0.0 100
10 0.0 0.0 10011 0.0 0.0 10012 0.0 0.0 100
Vehicle TypePaved Surface gram / meter sq.
Water Only Water+Sweeping Freeway 0.1Heavy Traffic 0.1
0 X Low Traffic Road 0.40 X Solid Waste Landfill 7.40 X Quarry 8.20 X Concrete Batching 120 X Sand & Gravel Plant 700 X Industrial Site 1000 X District Default 1000 X Asphalt Batching 1200 X Site - Specific0 X Site - Specific0 X Site - Specific0 X Site - Specific
DEVICE # 0 SCC
Emission Factors pounds / vmtEmFac = [k*(sL / 2)^0.65 * (W / 3)^1.5 - C] (1 - P/(4*N))
k = Aerodynamic CorrectionsL = TSP = 0.082 0.00047W = PM10 = 0.016 0.00047C = PM2.5 = 0.004 0.00036
100100100
100
Factors
Correction factor for fleet exhaust, brake, wear and tire wear - lbs/vmt
Aerodynamic FactorSilt Loading (%)Mean weight (tons)
FACILITY NAME: Plant FACILITY NUMBER:
Dust Control MethodBoom Sweeping
3-05-025-99
Control Method (check one) Number of Vehicle PassNone
Distance Traveled per Year (vmt)
Since Last Treatment
100100100100
DATA FROM ANOTHER WORKSHEET
EMISSIONS
100100
Weigh (tons)
COMPANY NAME: Omya California Inc
100100
COMPANY NUMBER:
OUTPUT DATA TO CEIDARS
Vacuum Sweeping with at lease 12,000 cfm
EMISSION HARP / CEIDARSYEAR MINING OPERATIONS
Topical Silt Loading
PAVED ROADS - ENTRAINED DUST
DATA INPUT BY FACILITY

Page 34 of 38
FORMMINE
200 8 PROAD
EMISSION HARP / CEIDARSYEAR MINING OPERATIONS
PAVED ROADS - ENTRAINED DUSTP = N = Number of days in averaging period or 365
Vehicle Type vmt PM PM10 PM10 PM10 PM10
0 0.0 0.000 0.000 0.000 1.000 0.7660 0.0 0.000 0.000 0.000 1.000 0.7660 0.0 0.000 0.000 0.000 1.000 0.7660 0.0 0.000 0.000 0.000 1.000 0.7660 0.0 0.000 0.000 0.000 1.000 0.7660 0.0 0.000 0.000 0.000 1.000 0.7660 0.0 0.000 0.000 0.000 1.000 0.7660 0.0 0.000 0.000 0.000 1.000 0.7660 0.0 0.000 0.000 0.000 1.000 0.7660 0.0 0.000 0.000 0.000 1.000 0.7660 0.0 0.000 0.000 0.000 1.000 0.7660 0.0 0.000 0.000 0.000 1.000 0.766
TOTAL 0.0 #DIV/0! #DIV/0! #DIV/0! #DIV/0! #DIV/0!Number of Devices 0
Controls EmissionsBroom Sweeping Vacuum Sweeping EmFac * vmt / 2000C = 20 - (0.231*V) C = 45 - (0.236*V)
Water Flushing Water Flushing + SweepingC = 69 - (0.231 * V) C = 96 - (0.263 * V)
C = Control Efficiency (%)V = Number of Vehicles passes since last treatment
Vehicle Type Efficiency(%) PM PM10 PM10 TSP PM10 PM10
0 0.000 0.000 0.000 0.000 0.000 0.000 0.0000 0.000 0.000 0.000 0.000 0.000 0.000 0.0000 0.000 0.000 0.000 0.000 0.000 0.000 0.0000 0.000 0.000 0.000 0.000 0.000 0.000 0.0000 0.000 0.000 0.000 0.000 0.000 0.000 0.0000 0.000 0.000 0.000 0.000 0.000 0.000 0.0000 0.000 0.000 0.000 0.000 0.000 0.000 0.0000 0.000 0.000 0.000 0.000 0.000 0.000 0.0000 0.000 0.000 0.000 0.000 0.000 0.000 0.0000 0.000 0.000 0.000 0.000 0.000 0.000 0.0000 0.000 0.000 0.000 0.000 0.000 0.000 0.0000 0.000 0.000 0.000 0.000 0.000 0.000 0.000
TOTAL #DIV/0! #DIV/0! #DIV/0!
TOTAL 0.000 0.000 0.000
Emission Factor - Controlled (pounds/vmt) Emissions (tpy)
Day per year with at least 0.01 inches of precipitation - See MetData
Throughput Emission Factors Uncontrolled (pounds/vmt) Fractionation Value

Page 35 of 38
FORMMINE
200 8 UPR
90461
DEVICE # 90013
Road Type * Silt Loading * MoistureInd / Pub Empty Loaded Mean Round Trip Miles Trips per Day Days per Year Miles per Year % %
1 Loader Ind 100 116 108.0 0.03 25 260 195.0 15 10 0.52 Vacum Truck Ind 22.75 22.75 22.8 0.1 3.7 260 96.2 15 10 0.53 Forklift Ind 8.5 9.5 9.0 0.05 9.5 260 123.5 15 10 0.54 Dump Truck Ind 27.5 47.6 37.6 0.24 5.2 260 324.5 15 10 0.55 Lube van Ind 20 20 20.0 9.1 1.6 130 1,892.8 15 10 0.56 Fuel truck Ind 10 20 15.0 7.2 0.9 52 337.0 15 10 0.57 WaterTruck Ind 50 80 65.0 4.8 1.4 260 1,747.2 15 10 0.58 0.0 0.0 11 0.29 0.0 0.0 11 0.210 0.0 0.0 11 0.211 0.0 0.0 11 0.212 0.0 0.0 11 0.2
* Road TypeInd = Unpaved road surfaces a industrial sites
Pub = Publicly accessible roadways dominated by light duty vehicles
Method None Water Water with Suppressants
Surface Improvement
Wind Screens or Wind Breaks
Other
Cells none D52-D63 or E52-G63 H52 - M63 D70 - E 81 G70 - H81 I70 - M811 Loader Ind x2 Vacum Truck Ind x3 Forklift Ind x4 Dump Truck Ind x5 Lube van Ind x6 Fuel truck Ind x7 WaterTruck Ind x8 0 09 0 010 0 011 0 012 0 0
Weekly Bi-Weekly Monthly Bi-Monthly
Ever 7 days Every 14 days Every 30 - 31 days Every 61 day1 Loader Ind 4.4 4 MgCI 0.15 x2 Vacum Truck Ind 3 4 MgCI 0.15 x3 Forklift Ind 1.3 4 MgCI 0.15 x4 Dump Truck Ind 4.7 4 MgCI 0.15 x5 Lube van Ind 3 58.7 4 0.26 Fuel truck Ind 1.5 3 4 0.17 WaterTruck Ind8 0 09 0 010 0 011 0 012 0 0
(* 0.1 gallons of water or suppressant per square yard of road = 1760 gallons per mile of a 30 foot wide road.)
3 Months after Application
6 Months after Application
Average
1 Loader Ind 10 752 Vacum Truck Ind 10 753 Forklift Ind 10 754 Dump Truck Ind 10 755 Lube van Ind 10 506 Fuel truck Ind 10 507 WaterTruck Ind 108 0 0 119 0 0 1110 0 0 1111 0 0 1112 0 0 11
MgCIMgCIWater TruckWater truck
EMISSION HARP / CEIDARSYEAR MINING OPERATIONS
Process Number Vehicle type
UNPAVED ROADS - ENTRAINED DUST
DATA INPUT BY FACILITY DATA FROM ANOTHER WORKSHEET OUTPUT DATA TO CEIDARS
Mean Vehicle Sped (mph)
Vehicle Weigh (tons)
COMPANY NAME: Omya California Inc COMPANY NUMBER: FACILITY NAME: Plant FACILITY NUMBER:
Distance Traveled per Year (vmt)
MgCI
Wind Screens or Wind BreaksWidth (feet)
OtherDescription
MgCI
Intensity of water gallons / sq yd of
Roadway *
Surface ImprovementNew Silt Content (%) Height (feet)
Water Application Rate Intensity of Suppressant
Gallons / sq yd of Roadway *
Type or Name of Suppressant
Dust Control Method
New Surface Moisture Content
(%)
Dust Control Method (Check "X" only one method per emission source (row) and complete appropriate cells below)
Road Type
Frequency of Application (Check (X) only one)Water with Suppressant
Traffic Rate vehicles per hour
Process Number Vehicle Type
Dust Control Method
Hours between Application
* For other Silt Loadings % is cells 'A167' through 'D178'.
Process Number Vehicle Type Road Type
Water (Either new moisture content or application rate)Vehicle TypeProcess Number
Control Efficiency (%)
Name/Type
Road Type

Page 36 of 38
FORMMINE
200 8 UPR
EMISSION HARP / CEIDARSYEAR MINING OPERATIONS
UNPAVED ROADS - ENTRAINED DUST
DEVICE # 90014
Emission Factor pounds per vehicle miles traveled
EmFac = k * (s / 12)^a * (W / 3)^b
EmFac = k * ({[(s / 12)^a * (S / 30)^d] / (M / 0.5)^c} -C)*[(365 - P)/365]k, a, b, c, & d = Constants - See Lookup Table entitled "Constants for Emission Factor Equations"
s = Silt content of unpaved surface in percent (%)W = Average vehicle weight in tonsS = Mean vehicle speed (mph)
M = Moisture content of unpaved surface in percent (%)P = Number of days per year with at least 0.01 inches of precipitation - see MetData worksheet Cell ' C16.
ProcessNumber Vehicle Type Road Type vmt PM PM10 PM10 PM10 PM10
1 Loader Ind 195.0 21.632 6.385 0.979 0.295 0.0452 Vacum Truck Ind 96.2 10.733 3.168 0.486 0.295 0.0453 Forklift Ind 123.5 7.071 2.087 0.320 0.295 0.0454 Dump Truck Ind 324.5 13.447 3.969 0.609 0.295 0.0455 Lube van Ind 1,892.8 10.128 2.989 0.458 0.295 0.0456 Fuel truck Ind 337.0 8.898 2.626 0.403 0.295 0.0457 WaterTruck Ind 1,747.2 17.214 5.081 0.779 0.295 0.0458 0 0 0.0 0.000 0.000 0.000 0.000 0.0009 0 0 0.0 0.000 0.000 0.000 0.000 0.00010 0 0 0.0 0.000 0.000 0.000 0.000 0.00011 0 0 0.0 0.000 0.000 0.000 0.000 0.00012 0 0 0.0 0.000 0.000 0.000 0.000 0.000
TOTAL 4,716.1 13.302 3.926 0.602 0.295 0.045Number of Devices 7
None Water with Suppressants
Surface Improvement
Wind Screens or Wind Breaks
Other Overall
New Surface Moisture Content
(%)
Water Application Rate *
1 Loader Ind 0.00 0.00 0.00 75.00 0.00 0.00 75.00 75.002 Vacum Truck Ind 0.00 0.00 0.00 75.00 0.00 0.00 75.00 75.003 Forklift Ind 0.00 0.00 0.00 75.00 0.00 0.00 75.00 75.004 Dump Truck Ind 0.00 0.00 0.00 75.00 0.00 0.00 75.00 75.005 Lube van Ind 0.00 95.00 -5.66 E 0.00 0.00 50.00 95.006 Fuel truck Ind 0.00 81.67 89.20 E 0.00 0.00 50.00 89.207 WaterTruck Ind 0.00 0.00 0.00 E 0.00 0.00 0.00 0.008 0 0 0.00 0.00 0.00 E 0.00 0.00 0.00 0.009 0 0 0.00 0.00 0.00 E 0.00 0.00 0.00 0.0010 0 0 0.00 0.00 0.00 E 0.00 0.00 0.00 0.0011 0 0 0.00 0.00 0.00 E 0.00 0.00 0.00 0.0012 0 0 0.00 0.00 0.00 E 0.00 0.00 0.00 0.00
* Dust Controls - Water Application RateC = 100 - (0.0012 * A * D * T) / I
C = Control efficiency (%)A = pan evaporation rate (inches)D = Vehicles per hourT = Hours between wateringI = Gallons / sq. yd (Note 0.1 gallon/sq yd = 1760 gallons per mile for a 30 foot wide road.)
Process EfficiencyNumber (%) PM PM10 PM2.5 PM PM10 PM2.5
1 Loader Ind 75.00 5.408 1.596 0.245 0.527 0.156 0.0242 Vacum Truck Ind 75.00 2.683 0.792 0.121 0.129 0.038 0.0063 Forklift Ind 75.00 1.768 0.522 0.080 0.109 0.032 0.0054 Dump Truck Ind 75.00 3.362 0.992 0.152 0.545 0.161 0.0255 Lube van Ind 95.00 0.506 0.149 0.023 0.479 0.141 0.0226 Fuel truck Ind 89.20 0.961 0.284 0.043 0.162 0.048 0.0077 WaterTruck Ind 0.00 17.214 5.081 0.779 15.038 4.439 0.6818 0 0 0.00 0.000 0.000 0.000 0.000 0.000 0.0009 0 0 0.00 0.000 0.000 0.000 0.000 0.000 0.00010 0 0 0.00 0.000 0.000 0.000 0.000 0.000 0.00011 0 0 0.00 0.000 0.000 0.000 0.000 0.000 0.00012 0 0 0.00 0.000 0.000 0.000 0.000 0.000 0.000
TOTAL 56.26 7.205 2.127 0.326
TOTAL 16.990 5.015 0.769
Fractionation ValueEmission Factors Uncontrolled (pounds / vmt)
Emissions (tpy)Emission Factor - Controlled (pounds/vmt)Road TypeVehicle Type
WaterVehicle Type Efficiency percentage (%) of Dust Control Methods
Industrial Roads
Public Road
Throughput
Road Type
EMISSIONS
Process Number

Page 37 of 38
FORMMINE
200 8 ERO
90461
DEVICE # 90014a
Process Disturbed Areas Vegetative MoistureNumber cover Natural Area Use Area Use
acres acres fraction % Code * Code **
1 0 1.8 0 0.5 3 32 0 0.28 0 0.5 3 33 0 2.9 0 0.5 3 34 0.55 0.56 0.57 0.58 0.59 0.5
10 0.5
Code Code0 01 12 23 34 45 56 67 78 89 9
10 101112
None Wind Screencheck (x) check (x) Water Added check (x) check (x) Efficiency (%)
gallons per acre per day
Calculated from Added Water
As Measured (%) Moisture Content for Calculation
1 1.8 -0.32 0.00 x 752 0.28 x 800 7.04 7.043 2.9 -0.32 0.00 x 754 0 x -0.32 0.005 0 x -0.32 0.006 0 x -0.32 0.007 0 x -0.32 0.008 0 x -0.32 0.009 0 x -0.32 0.00
10 0 x -0.32 0.00
User Defined
Water SprayNew Surface Moisture Content (%)
MgCl
User DefinedUser DefinedUser DefinedUser Defined
User DefinedActive Agricultural LandCoal Pile
User Defined
User DefinedScrub DesertCoal Dust
User Defined
None None
Moderate Industrial / MiningHeavy Industrial / Mining
Area Usage* Threshold Friction Velocity
NoneArea Usage
Mine TailingsAbandoned Agricultural Land
None NoneNone None
None NoneNone None
None NoneNone None
Construction Site Moderate Industrial / MiningConstruction Site Moderate Industrial / Mining
Name NameConstruction Site Moderate Industrial / Mining
Threshold Friction Velocity Ratio of Wind Speed to Friction VelocityUsage Usage
EMISSION HARP / CEIDARSYEAR MINING OPERATIONS
WIND EROSION FROM UNPAVED OPERATIONAL AREAS AND ROADS
DATA INPUT BY FACILITY DATA FROM ANOTHER WORKSHEET OUTPUT DATA TO CEIDARS
FACILITY NAME: Plant FACILITY NUMBER: COMPANY NAME: Omya California Inc COMPANY NUMBER:
Construction SiteDisturbed Desert
User Defined
MgCl
Total Parking and Disturbed Areas
Parking Areas
Process Number
SpecifyOther
Dust Controls (Check 'x' only one method)
** Ration of Wind Speed to Friction Velocity
NoneOpen SpaceLight Industrial / Mining

Page 38 of 38
FORMMINE
200 8 ERO
EMISSION HARP / CEIDARSYEAR MINING OPERATIONS
WIND EROSION FROM UNPAVED OPERATIONAL AREAS AND ROADS
DEVICE # 90014a
Emission Factor - pounds per acreEmFac = 2.814 * k *(1 - v) * (u / ut)^3 * C(x)*2000
k = Aerodynamic Factor for Particulate Size Aerodynamic Factor x = ut/uv = Amount of Vegetative cover as a Fraction TSP = 1.0u = Mean Wind Speed in Meters per Second (m/s) PM10 = 0.5ut = Threshold Value of Wind Speed (m/s) PM2.5 = 0.2
C(x) = Correction FactorThreshold Value of Wind Speed - ut
ut = u*t * u*
ProcessNumber Threshold Ratio Threshold Correction
Friction Velocity Wind Speed Factor TSP PM10 PM2.5
u*t u* ut x C(x)Acres Acres m/s m/s pounds/acre pounds/acre pounds/acre
1 0 1.8 0.26 6.5 1.69 0.44 1.90 90,332.145 45,166.072 18,066.4292 0 0.28 0.26 6.5 1.69 0.44 1.90 90,332.145 45,166.072 18,066.4293 0 2.9 0.26 6.5 1.69 0.44 1.90 90,332.145 45,166.072 18,066.4294 0 0 0 0 0 0.00 0.00 0.000 0.000 0.0005 0 0 0 0 0 0.00 0.00 0.000 0.000 0.0006 0 0 0 0 0 0.00 0.00 0.000 0.000 0.0007 0 0 0 0 0 0.00 0.00 0.000 0.000 0.0008 0 0 0 0 0 0.00 0.00 0.000 0.000 0.0009 0 0 0 0 0 0.00 0.00 0.000 0.000 0.000
10 0 0 0 0 0 0.00 0.00 0.000 0.000 0.000INPUTS 4.98 90,332.145 45,166.072 18,066.429
Number of Devices 0
Process Total Parking and Disturbed Areas
Number Acres PM10 PM2.5
1 1.8 0.5 0.22 0.28 0.5 0.23 2.9 0.5 0.24 0 0 05 0 0 06 0 0 07 0 0 08 0 0 09 0 0 0
10 0 0 0INPUTS 0.5 0.2
ProcessTotal Parking and Disturbed Areas
Number Acres Type Efficiency (%) TSP PM10 PM2.5 TSP PM10 PM2.5
1 1.8 MgCl 75.0 22,583.036 11,291.518 4,516.607 20.325 10.162 4.0652 0.28 Water Spray 95.0 4,516.607 2,258.304 903.321 0.632 0.316 0.1263 2.9 MgCl 75.0 22,583.036 11,291.518 4,516.607 32.745 16.373 6.5494 0 None 0.0 0.000 0.000 0.000 0.000 0.000 0.0005 0 None 0.0 0.000 0.000 0.000 0.000 0.000 0.0006 0 None 0.0 0.000 0.000 0.000 0.000 0.000 0.0007 0 None 0.0 0.000 0.000 0.000 0.000 0.000 0.0008 0 None 0.0 0.000 0.000 0.000 0.000 0.000 0.0009 0 None 0.0 0.000 0.000 0.000 0.000 0.000 0.000
10 0 None 0.0 0.000 0.000 0.000 0.000 0.000 0.000INPUTS 76.12 21,567.253 10,783.626 4,313.451
TOTAL 53.702 26.851 10.740
Emissions (tpy) = Area * EmFac
Throughput Emission Factor
EMISSIONS
Parking Areas
Fractionation Value
Controls Emission Factor - Controlled (pounds/acre)
Emission FactorsDisturbed Area
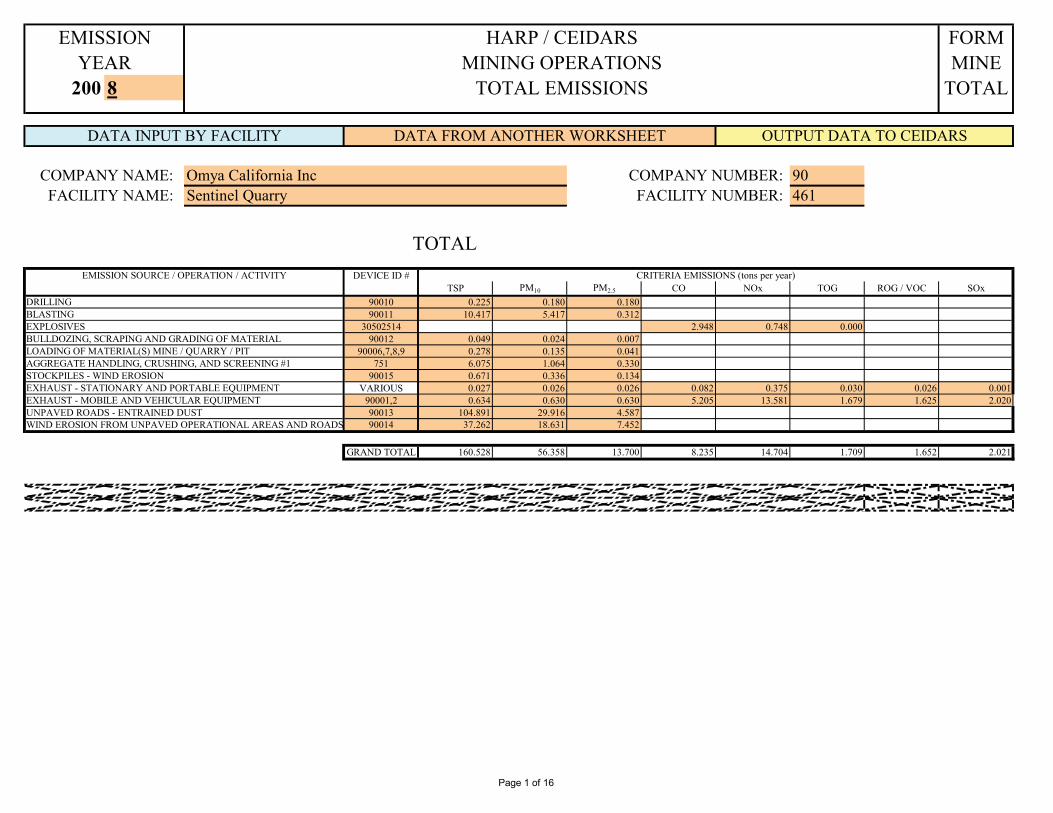
Page 1 of 16
FORMMINE
200 8 TOTAL
90461
DEVICE ID #TSP PM10 PM2.5 CO NOx TOG ROG / VOC SOx
90010 0.225 0.180 0.18090011 10.417 5.417 0.312
30502514 2.948 0.748 0.00090012 0.049 0.024 0.007
90006,7,8,9 0.278 0.135 0.041751 6.075 1.064 0.330
90015 0.671 0.336 0.134VARIOUS 0.027 0.026 0.026 0.082 0.375 0.030 0.026 0.001
90001,2 0.634 0.630 0.630 5.205 13.581 1.679 1.625 2.02090013 104.891 29.916 4.58790014 37.262 18.631 7.452
GRAND TOTAL 160.528 56.358 13.700 8.235 14.704 1.709 1.652 2.021
EXHAUST - MOBILE AND VEHICULAR EQUIPMENTUNPAVED ROADS - ENTRAINED DUSTWIND EROSION FROM UNPAVED OPERATIONAL AREAS AND ROADS
LOADING OF MATERIAL(S) MINE / QUARRY / PIT AGGREGATE HANDLING, CRUSHING, AND SCREENING #1STOCKPILES - WIND EROSIONEXHAUST - STATIONARY AND PORTABLE EQUIPMENT
DRILLINGBLASTINGEXPLOSIVESBULLDOZING, SCRAPING AND GRADING OF MATERIAL
TOTALEMISSION SOURCE / OPERATION / ACTIVITY CRITERIA EMISSIONS (tons per year)
COMPANY NAME: Omya California Inc COMPANY NUMBER: FACILITY NAME: Sentinel Quarry FACILITY NUMBER:
TOTAL EMISSIONS
DATA INPUT BY FACILITY DATA FROM ANOTHER WORKSHEET OUTPUT DATA TO CEIDARS
EMISSION HARP / CEIDARSYEAR MINING OPERATIONS

Page 2 of 16
FORMMINE
200 8 FAC
90461
CITY: STATE: ZIP:
CITY: STATE: ZIP:
EXT:
TYPE OF MINE Quarry (Quarry, Surface, Pit, Bank Run, Shaft, Etc.)
TYPE OF MATERIAL MINED (Limestone, Talc, Salts, Sand, Gravel, Rock, Volcanic Cinders, Gold, Silver, Iron Ore, Rear Earth, Etc.)
OVERBURDEN RATIO 1.2:1 Tons of Overburden per Ton of Ore
CONTACT PERSON: Christine GranquistTELEPHONE NUMBER:
MINE TYPE AND PARAMETERS
Limestone
FAX NUMBER: 760-248-9115EMAIL: [email protected]
760-248-5223
MAILING ADDRESS: P.O. Box 825
9000461FACILITY NAME: Sentinel Quarry FACILITY NUMBER:
FACILITY LOCATION (address): 7225 Crystal Creek RoadLucerne ValleyCA 92356
FACID:
DATA FROM ANOTHER WORKSHEET OUTPUT DATA TO CEIDARS
COMPANY NAME: Omya California Inc COMPANY NUMBER:
Lucerne ValleyCA 92356
EMISSION HARP / CEIDARSYEAR MINING OPERATIONS
FACILITY INFORMATION
DATA INPUT BY FACILITY

Page 3 of 16
FORMMINE
200 8 MIN
90461
Name ofMinerals Shifted by Blasting Total Handled Moisture (%) Silt (%)
Limestone 449,672 449,672 1.5 4.40.5 30.00.5 30.00.5 30.00.5 30.00.5 30.00.5 30.00.5 30.00.5 30.00.5 30.00.5 30.00.5 30.00.5 30.00.5 30.00.5 30.0
TOTAL 449,672 449,672
Amounts (tpy) Characteristics
COMPANY NAME: Omya California Inc COMPANY NUMBER: FACILITY NAME: Sentinel Quarry FACILITY NUMBER:
DATA FROM ANOTHER WORKSHEET OUTPUT DATA TO CEIDARSDATA INPUT BY FACILITY
EMISSION HARP / CEIDARSYEAR MINING OPERATIONS
MINERALS HANDLED - AMOUNT & CHARACTERISTICS
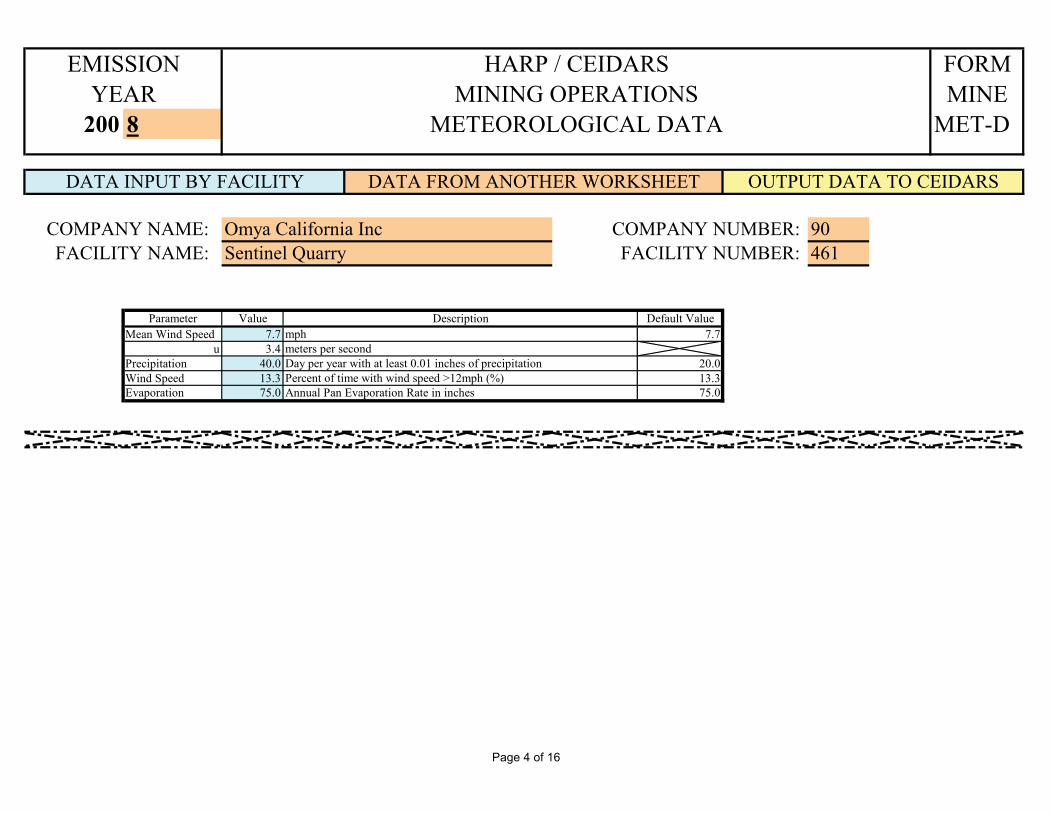
Page 4 of 16
FORMMINE
200 8 MET-D
90461
Parameter Value Default ValueMean Wind Speed 7.7 7.7
u 3.4Precipitation 40.0 20.0Wind Speed 13.3 13.3Evaporation 75.0 75.0
Day per year with at least 0.01 inches of precipitationPercent of time with wind speed >12mph (%)Annual Pan Evaporation Rate in inches
Descriptionmphmeters per second
COMPANY NAME: Omya California Inc COMPANY NUMBER: FACILITY NAME: Sentinel Quarry FACILITY NUMBER:
METEOROLOGICAL DATA
DATA INPUT BY FACILITY DATA FROM ANOTHER WORKSHEET OUTPUT DATA TO CEIDARS
EMISSION HARP / CEIDARSYEAR MINING OPERATIONS

Page 5 of 16
FORMMINE
200 8 D&B
90461
Device ID# 90010Device ID# 90011
1279
94822,930
275,160449,672 Tons Ore, Waste & Overburden
DRILLINGDevice ID# 90010 SCC 30502514 SCC 30502514
Annual Throughput 449,672 Tons Shifted Annual Throughput 948 Holes Drilled
TSP PM10 PM2.5 PM10 PM2.5 TSP PM10 PM2.5 PM10 PM2.5
0.001 0.0008 0.0008 0.800 0.800 1.3 0.68 0.68 0.523 0.523
None, assumed wet drilling None, assumed wet drilling
TSP PM10 PM2.5 TSP PM10 PM2.5
0.225 0.180 0.180 0.616 0.322 0.322
BLASTINGDevice ID# 90011
Annual Throughput 449,672 Tons Shifted Area Shifted per Blast - Average 22,930 square foot per blast - averageSCC 30502514 Area Shifted per Year 275,160 square foot per year
SCC 30502514
TSP PM10 PM2.5 PM10 PM2.5 TSP PM10 PM2.5 PM10 PM2.5
0.160 0.080 0.005 0.500 0.030 1736.105 902.775 52.083 0.520 0.030
* EmFac = k * 0.0005 * A1.5 35.71428571k = Aerodynamic Factor
TSP = 1.00PM10 = 0.52PM2.5 = 0.03
A = Area Shifted per Blast - Average
None None
TSP PM10 PM2.5 TSP PM10 PM2.5
35.97376 17.98688 1.0792128 10.417 5.417 0.312
EMISSION HARP / CEIDARSYEAR MINING OPERATIONS
DRILLING AND BLASTING
DATA INPUT BY FACILITY DATA FROM ANOTHER WORKSHEET OUTPUT DATA TO CEIDARS
COMPANY NAME: Omya California Inc COMPANY NUMBER: FACILITY NAME: Sentinel Quarry FACILITY NUMBER:
Blast per year numberHoles per Blast - Average number
DRILLINGBLASTING
Holes drilled per year Number of holes per yearArea Shifted per Blast - Average square foot per blast - averageArea Shifted per Year square foot per yearAmount shifted by blasting
EMISSIONS
By Amount Shifted By Number of Holes Drilled
Emission Factors (pounds per tons shifted) Fractionation Value Emission Factors (pounds per hole drilled) Fractionation Value
Controls Controls
Emissions - tons per year Emissions - tons per year
By Square Foot Shifted
Emission Factors (pounds per ton shifted) Fractionation Value Emission Factors (pounds per blast) * Fractionation Value
By Tons Shifted
Em = EmFac * Amount Shift Em = EmFac * Blast per Year
Controls Controls
Emissions - tons per year Emissions - tons per year

Page 6 of 16
FORMMINE
200 8 EXPL
90461
Device ID# 90011
Code * Type AmountSee Codes below tons/ year
6 ANFO 88None
Code Explosive0 None1 Black Powder2 Smokeless Powder3 Dynamite, Straight4 Dynamite, Ammonia5 Dynamite, Gelatin6 ANFO7 TNT8 RDX9 PETN10 User Defined11 User Defined12 User Defined
Device ID# 90011 SCC 30502514
Code Type Amounttons/ year CO NOx TOG CO NOx TOG
6 ANFO 88.000 67 17 0 2.948 0.748 0.0000 None 0.000 0 0 0 0.000 0.000 0.000
INPUTS 88.000 67.000 17.000 0.000Number of Devices 1
INPUTS 2.948 0.748 0.000
EMISSION HARP / CEIDARSYEAR MINING OPERATIONS
EXPLOSIVES
DATA INPUT BY FACILITY DATA FROM ANOTHER WORKSHEET OUTPUT DATA TO CEIDARS
COMPANY NAME: Omya California Inc COMPANY NUMBER: FACILITY NAME: Sentinel Quarry FACILITY NUMBER:
Composition
Ammonium Nitrate, Fuel OilNone
* Codes for Explosive
Explosive Emission Factor
EMISSIONS
Emission Ratepounds per ton ton per year

Page 7 of 16
FORMMINE
200 8 BSG
90461
Device ID# 90012
Name of MaterialBulldozing Scraping Grading Other Total None Wind Screen
Check Check New Moisture (%) CheckLimestone 24 24 X 3
0 0
Device ID# 90012 SCC 30502599
Emission Factors (pounds per hours of operations)EmFac = 2.76 * k *(s)^1.5 / (M)^1.4
k = Aerodynamic Factor Aerodynamic factorss = silt content (%) TSP = 0.74
M = Moisture content (%) PM10 = 0.36PM2.5 = 0.11
Material Hours of OperationsTSP PM10 PM2.5 PM10 PM2.5
Limestone 24 10.685 5.198 1.588 0.486 0.1490 0 0.000 0.000 0.000 0.000 0.000
TOTAL 24 10.685 5.198 1.588 0.486 0.149Number of Devices 1
MaterialType Efficiency (%) TSP PM10 PM2.5 TSP PM10 PM2.5
Limestone Water Spray 62.107 4.049 1.970 0.602 0.049 0.024 0.0070 None 0.000 0.000 0.000 0.000 0.000 0.000 0.000
TOTAL 62.11 4.049 1.970 0.602
TOTAL 0.049 0.024 0.007
Control Emission factors - Controlled (pounds per hour) Emissions - tons per year
Emission factors - Uncontrolled (pounds per hour) Fractionation Value
Hours of Operations (hours per year) ControlsWater Spray
EMISSIONS
COMPANY NAME: Omya California Inc COMPANY NUMBER: FACILITY NAME: Sentinel Quarry FACILITY NUMBER:
DATA INPUT BY FACILITY DATA FROM ANOTHER WORKSHEET OUTPUT DATA TO CEIDARS
EMISSION HARP / CEIDARSYEAR MINING OPERATIONS
BULLDOZING, SCRAPING AND GRADING OF MATERIAL

Page 8 of 16
FORMMINE
200 8 LOAD
90461
DEVICE # 90006,7,8,9
Name of Material AmountLoaded None Wind Screen
tpy Check Check New Moisture (%) Check Check Specify Efficiency (%)Limestone 672,384 x 3
0
Device ID# 90006,7,8,9 SCC 30502506
Emission Factors (pounds per ton)EmFac =0.0032 * k *(U/5)^1.3 / (M/2)^1.4
k = Aerodynamic Factor Aerodynamic factorsU = Mean wind speed in miles per hour TSP = 0.74M = Moisture content (%) PM10 = 0.36
PM2.5 = 0.11
Material AmountLoaded TSP PM10 PM2.5 PM10 PM2.5
tpyLimestone 672,384 0.002 0.001 0.000 0.486 0.149
0 0 0.000 0.000 0.000 0.000 0.000TOTAL 672,384 0.002 0.001 0.000 0.486 0.149
Number of Devices 1
MaterialType Efficiency (%) TSP PM10 PM2.5 TSP PM10 PM2.5
Limestone Water Spray 62.107 0.001 0.000 0.000 0.278 0.135 0.0410 None 0.000 0.000 0.000 0.000 0.000 0.000 0.000
TOTAL 62.11 0.001 0.000 0.000
TOTAL 0.278 0.135 0.041
Control Emission factors - Controlled (pounds per ton) Emissions - tons per year
Water Spray OtherControls
Emission factors - Uncontrolled (pounds per ton) Fractionation Value
EMISSIONS
COMPANY NAME: Omya California Inc COMPANY NUMBER: FACILITY NAME: Sentinel Quarry FACILITY NUMBER:
LOADING OF MATERIAL(S) AT MINE / QUARRY / PIT
DATA INPUT BY FACILITY DATA FROM ANOTHER WORKSHEET OUTPUT DATA TO CEIDARS
EMISSION HARP / CEIDARSYEAR MINING OPERATIONS

Page 9 of 16
. .. .
HOURS per DAY ROCK DAYS per WEEK SAND WEEK per YEAR
LIMESTONE CAL. HRS per YR LAVA ROCK ACT. HRS per YR
OTHER CAL. Hrs/Yr = Hr/Dy*Dy/Wk*Wk/Yr
PROCESS NAME Crushing Screening Circuit
Electrostatic PrecipitatorSee Lookup Table "ConEff" for data
415TOTAL HORSEPOWER
Venturi Scrubber (High Efficiency)Baghouse with Multiple PickupsBaghouse with Single Pickup (Unenclosed)Baghouse with Single Pickup (Partial Enclosed)Baghouse with Single Pickup (Full Enclosed)
Conveyor with Half Cover
XII - TYPE OF EMISSION CONTROL EQUIPMENTCODE NAME OF DEVICE OR SYSTEM CODE NAME OF DEVICE OR SYSTEM CODE TYPE OF CONTROL
Spray Tower (Low Efficiency)Wet Scrubber (Med Efficiency)
NoneWater Spray, Point of ApplicationSpray with Additives, Point of Application
Gravel Bed Filters
OTHER COMMENTS
XI - TYPE OF OPERATION AND / OR DEVICE TYPE OF CONTROL CODE
VI - TYPE OF EQUIPMENT, check all that applies:x x
V - TYPE OF PLANT
AVERAGE THROUGHPUT PER DEVICE
SCREENS CONVEYORS
OTHERS
PORTABLE x check all that applies
52 250.0
222,7125 89HOURLY (average)
x
TRANSFER STORAGE
LATITUDE (deg.) LONGITUDE (deg.)
STATIONARY CRUSHERS
UTM NORTH (km)
Sentinel Quarry
IV - MAP COORDINATES FOR PROCESS
BLOCK IX - ANNUAL THROUGHPUT (tpy)BLOCK X - MOISTURE CONTENT (%) OF MATERIAL
UTM ZONE UTM EAST (km) 11
INVENTORY ID # DEVICE ID
PROCESS ID 4619000461
3
FACILITY #
Baghouse with Single Pickup (Attached)
FLOW DIAGRAMBLOCK III - ALL ITEMSBLOCK VIII - ACTUAL HOURS OPERATED
IX - THROUGHPUT (tons per year)10
200 8
COMPANY NAME PERMIT #
AGGREGATE HANDLING, CRUSHING & SCREENING #1
FORMYEAR MINING OPERATIONS MINE
EMISSION HARP / CEIDARS
AGG-1
5 190
II - MANDATORY INFORMATIONI - COLOR CODEDATA INPUT BY FACILITY DATA FROM ANOTHER WORKSHEET OUTPUT DATA TO CEIDARS
III - FACILITY INFORMATIONOmya California Inc 7
FACILITY NAME B 0 0 0COMPANY #
5 0 5 3 1 6 8 0 4 4 1 53 4 3 8 3 7 1 1 6
VII - MATERIAL TYPES VIII - OPERATING SCHEDULE9 4 2 2
xx xLOAD OUT
x
2500COMMENTS
0 11 0 11Screening, Wet Washing (Note 4)No Device1 12 1 12Silo, Filling - PneumaticDump to Hopper, truck, pile (Note 2)2 13 2 13Silo, Filling - Bucket ElevatorGrizzly (Note 2)3 14 3 14Silo, discharge to Conveyor (Note 2)Hopper (Note 2)4 15 4 15Silo, discharge to Tank TruckTransfer Point (Note 2) Conveyor with Three Quarter Cover5 16 5 16Loading Open Top Truck (Note 2)Conveyor (Note 2) Conveyor with Full Cover6 17 6 17FeederCrushing, Dry - Primary Process Enclosure7 18 7 18See Lookup Table "EmFac" for dataCrushing, Dry - Secondary Gravity Separator8 19 8 19Crushing, Dry - Tertiary See Lookup Table "EmFac" for data Cyclone - Simple9 20 9 20Crushing, Wet (Note 3) See Lookup Table "EmFac" for data Cyclone - Multiple10 21 10 21Screening, Dry See Lookup Table "EmFac" for data Windscreen, Windward Side
XIII - EMISSION CALCULATIONSEQUIPMENT DEVICE NAME OF DEVICE MOTOR THROUGHPUT EMISSION CONTROL DEVICE EMISSION FACTORS EMISSION RATE
ID CODE BHP TONS / YEAR CODE DsF NAME OF DEVICE EFF % POUNDS PER TON TONS PER YEARNUMBER NO PM30 PM10 PM2.5 PM30 PM10 PM2.5
(A) (B) (C) (D) (E) (F) (G) (H) (I) (J) (K) (L) (M) (N) (O)
1 1 Dump to Hopper, truck, pile (Note 2) NA 222,712 0 None 0.0 0.002 0.001 0.000 0.26 0.12 0.04
2 4 Transfer Point (Note 2) NA 222,712 1 Water Spray, Point of Application 75.0 0.002 0.001 0.000 0.07 0.03 0.01
31-120 2 Grizzly (Note 2) 50 222,712 1 Water Spray, Point of Application 75.0 0.002 0.001 0.000 0.07 0.03 0.01
3 4 Transfer Point (Note 2) NA 222,712 1 Water Spray, Point of Application 75.0 0.002 0.001 0.000 0.07 0.03 0.01
3.1 10 Screening, Dry 40 222,712 16 Baghouse with Single Pickup (Unencl 97.0 0.160 0.120 0.038 0.53 0.40 0.13
4 4 Transfer Point (Note 2) NA 41,844 1 Water Spray, Point of Application 75.0 0.002 0.001 0.000 0.01 0.01 0.00
5 5 Conveyor (Note 2) 15 41,844 1 Water Spray, Point of Application 75.0 0.002 0.001 0.000 0.01 0.01 0.00
6 4 Transfer Point (Note 2) NA 11,304 1 Water Spray, Point of Application 75.0 0.002 0.001 0.000 0.00 0.00 0.00
7 4 Transfer Point (Note 2) NA 264 0 None 0.0 0.002 0.001 0.000 0.00 0.00 0.00
8 5 Conveyor (Note 2) 15 264 0 None 0.0 0.002 0.001 0.000 0.00 0.00 0.00
9 4 Transfer Point (Note 2) NA 11,304 1 Water Spray, Point of Application 75.0 0.002 0.001 0.000 0.00 0.00 0.00
10 4 Transfer Point (Note 2) NA 33,911 1 Water Spray, Point of Application 75.0 0.002 0.001 0.000 0.01 0.00 0.00
11 4 Transfer Point (Note 2) NA 135,650 1 Water Spray, Point of Application 75.0 0.002 0.001 0.000 0.04 0.02 0.01
11.1 6 Crushing, Dry - Primary 200 135,650 1 Water Spray, Point of Application 75.0 0.280 0.017 0.005 4.75 0.29 0.08
12 4 Transfer Point (Note 2) NA 135,650 1 Water Spray, Point of Application 75.0 0.002 0.001 0.000 0.04 0.02 0.01
13 5 Conveyor (Note 2) 25 180,867 1 Water Spray, Point of Application 75.0 0.002 0.001 0.000 0.05 0.03 0.01
14 5 Conveyor (Note 2) 20 180,867 1 Water Spray, Point of Application 75.0 0.002 0.001 0.000 0.05 0.03 0.01
15 5 Conveyor (Note 2) 25 180,867 1 Water Spray, Point of Application 75.0 0.002 0.001 0.000 0.05 0.03 0.01
16 5 Conveyor (Note 2) 25 180,867 1 Water Spray, Point of Application 75.0 0.002 0.001 0.000 0.05 0.03 0.01
125,511
EMISSION DATA
BLOCK XIV - EMISSIONS & HARP INPUTS
PERMIT ID PM2.5ANNUAL EMISSIONS (tpy) PM PM10
DEVICE DATAEMISSION INVENTORY INPUTS
UNCONTROLLED 39.192 15.643 4.925
CONTROLLED 6.075 1.064 0.330
UNCONTROLLED 0.3520 0.1405 0.0442
EMISSION FACTOR (lb/ton)
0.0030
FRACTIONATION VALUE ( PM10 or PM2.5 / PM) 0.1752 0.0543
0.0546 0.0096CONTROLLED
X - MOISTURE CONTENT (%)MOISTURE CONTENT ENTERING SYS.: 3 %
751
93.31OVERALL EFFICIENCY 84.50 93.20
ENTERING THE SYSTEM
ACTUAL ANNUAL
Hourly (average) = Annual (actual) / Actual Hours per Year (operated)2600
BLOCK XIII, COLUMNS 'B', 'E', 'F' & 'G'
MAX. DESIGN RATE
Tons/Yr.TPHTPH
250
19
B000751
89
MAX. HOURLY PRODUCTION RATE (tph)
PROCESS DATAEQUIPMENT SIZE (bhp)
NUMBER OF DEVICES
415
AVE. HOURLY PRODUCTION RATE (tph)
250
MAX. DESIGN RATE (tph)
PROCESS RATE (tpy) 222,712

Page 10 of 16
FORMMINE
200 8 S-PILES
90461
Device ID# 90015
Name of / Material Type Exposed Surface Silt Loading MoistureNumber (uncontrolled)
acres % %Overburden Limestone 2.0000 1.5 1.5
30 0.5
StockpileName / Number Wind Screen
check gal/acre/day check check Specify Efficiency (%)Overburden X 800
0
Device ID# 90015 SCC 30502507
Emission Factors (pounds per acres)EmFac = J *1.7 * s/1.5 * (365 - P)/235 * I/15 * 365
J = Aerodynamic factor Aerodynamic factors = Silt Loading (%) TSP = 1.0P = Day per year with at least 0.01 inches of precipitation PM10 = 0.5I = Percent of time with wind speed >12mph (%) PM2.5 = 0.2
Stockpile Material Type Size (acres) TSP PM10 PM2.5 PM10 PM2.5
Overburden Limestone 2.0000 760.883 380.441 152.177 0.500 0.2000 0 0.0000 0.000 0.000 0.000 0.000 0.000
TOTAL 2 760.883 380.441 152.177 0.500 0.200Number of Devices 1
StockpileType Efficiency (%) TSP PM10 PM2.5 TSP PM10 PM2.5
Overburden Water Spray 11.81 671.035 335.517 134.207 0.671 0.336 0.1340 None 0.00 0.000 0.000 0.000 0.000 0.000 0.000
TOTAL 11.81 671.035 335.517 134.207
TOTAL 0.671 0.336 0.134
Sentinel Quarry FACILITY NUMBER:
EMISSIONYEAR MINING OPERATIONS
HARP / CEIDARS
Emission Factor - Uncontrolled (pounds/acre)
STOCKPILES
DATA INPUT BY FACILITY DATA FROM ANOTHER WORKSHEET OUTPUT DATA TO CEIDARS
COMPANY NAME: Omya California Inc COMPANY NUMBER: FACILITY NAME:
Stockpile
Controls Emission Factor - Controlled (pounds/acre) Emissions (tpy) = Area * EmFac
Dust ControlsWater Spray Other
Fractionation Value
EMISSIONS
Throughput (acres)

Page 11 of 16
FORMMINE
200 8 EX-S&P
90461
DISTRICT DEVICE ID CODE FUEL TYPE UNITS OF UNITS USEDPERMIT NO. (See Code below) USAGE PER YEAR
543406 18 FUEL OIL #2 @ 0.05 % S 1000 GAL 1.1543407 18 FUEL OIL #2 @ 0.05 % S 1000 GAL 0.5
#N/A #N/A
CODE FUEL TYPE SCC1 NATURAL GAS 1-02-006-012 NATURAL GAS 1-02-006-023 NATURAL GAS 1-02-006-034 NATURAL GAS 1-02-006-065 FUEL OIL #2 @ 0.5 % S 1-02-005-016 FUEL OIL #2 @ 0.05 % S 1-02-005-017 PROPANE, LPG 1-02-010-028 NATURAL GAS 1-05-001-069 FUEL OIL #2 @ 0.5 % S 1-05-001-05
10 FUEL OIL #2 @ 0.05 % S 1-05-001-0511 PROPANE, LPG 1-05-001-1012 NATURAL GAS 3-05-900-0313 FUEL OIL #2 @ 0.5 % S 3-05-900-0114 FUEL OIL #2 @ 0.05 % S 3-05-900-0115 PROPANE, LPG 3-05-900-9916 NATURAL GAS 2-03-002-0417 FUEL OIL #2 @ 0.5 % S 2-02-017-xx18 FUEL OIL #2 @ 0.05 % S 2-02-017-xx19 PROPANE, LPG 2-02-017-xx20 GASOLINE 2-02-017-2021 NATURAL GAS 2-02-002-0122 NATURAL GAS 2-02-002-0323 FUEL OIL #2 @ 0.5 % S 2-02-001-0124 FUEL OIL #2 @ 0.05 % S 2-02-001-0125 0 026 0 027 0 028 0 029 0 030 0 0
EXHAUST FROM STATIONARY EQUIPMENT
PERMIT NO. DEVICE ID PROCESS RATE SOURCESUNITS PER YEAR CLASSIFICATION
CODE CODE CO NOx SOxUNITS SCC TOG FRAC PM FRAC
/CAS # 43101 ROG/VOC 42101 42603 42401 11101 PM10 / PM2.5
0 543406 1.1 2-02-017-xx 37.42 0.884 102 469 1.56 33.5 0.97618 1000 GAL Annual Emissions 0.021 0.018 0.056 0.258 0.001 0.018 0.018
0 543407 0.5 2-02-017-xx 37.42 0.884 102 469 1.56 33.5 0.97618 1000 GAL Annual Emissions 0.009 0.008 0.026 0.117 0.000 0.008 0.008
TOTAL EMISSIONS TOG ROG / VOC CO NOx SOx PM PM10 / PM2.5
Tons per Year 0.030 0.026 0.082 0.375 0.001 0.027 0.026
EMISSION HARP / CEIDARSYEAR MINING OPERATIONS
EXHAUST FROM STATIONARY AND PORTABLE FUEL COMBUSTION
DATA INPUT BY FACILITY DATA FROM ANOTHER WORKSHEET OUTPUT DATA TO CEIDARS
COMPANY NAME: Omya California Inc COMPANY NUMBER: FACILITY NAME: Sentinel Quarry FACILITY NUMBER:
EQUIPMENT TYPE
I. C. ENGINESI. C. ENGINES
#N/A
EQUIPMENT TYPEBOILER > 100 MMBTU/HRBOILER 10 - 100 MMBTU/HRBOILER <10 MMBTU/HRBOILER, COGENERATIONBOILERBOILERBOILERSPACE HEATERSPACE HEATERSPACE HEATERSPACE HEATERINDUSTRIAL PROCESSINDUSTRIAL PROCESSINDUSTRIAL PROCESSINDUSTRIAL PROCESSI. C. ENGINESI. C. ENGINESI. C. ENGINESI. C. ENGINESI. C. ENGINESGAS TURBINESGAS TURBINES - COGEN.GAS TURBINEGAS TURBINEUser defined, see Worksheet "SFB"User defined, see Worksheet "SFB"User defined, see Worksheet "SFB"User defined, see Worksheet "SFB"User defined, see Worksheet "SFB"User defined, see Worksheet "SFB"
EMISSIONS
EQUIPMENT TYPE
ORGANIC GASESFUEL TYPE
EMISSIONS FACTORS (pounds per unit of usage)ANNUAL EMISSIONS (tons per year)
PARTICULATE MATTER
I. C. ENGINESFUEL OIL #2 @ 0.05 % S
I. C. ENGINESFUEL OIL #2 @ 0.05 % S

Page 12 of 16
FORMMINE
200 8 EX-M
90461
DEVICE # 90001,2
PROCESS CODE FUEL TYPE UNITS OF UNITS USEDNUMBER (See Code below) USAGE PER YEAR
1 1 DIESEL 1000 hp-hr 670.02 8 DIESEL 1000 hp-hr 718.0
20 #N/A #N/A
CODE FUEL TYPE SCC1 DIESEL 1000 hp-hr 3-05-025-992 GASOLINE 1000 hp-hr 3-05-025-993 NG / LPG 1000 hp-hr 3-05-025-994 DIESEL 1000 GAL 3-05-025-995 GASOLINE 1000 VMT 3-05-025-996 DIESEL 1000 VMT 3-05-025-997 DIESEL 1000 hp-hr 3-05-025-998 DIESEL 1000 hp-hr 3-05-025-999 0 0 010 0 0 011 0 0 012 0 0 013 0 0 014 0 0 015 0 0 0
* OFF ROAD INCLUDES MINING AND EARTH MOVING EQUIPMENT 1000 hp-hr = THOUSAND OF HORSEPOWER HOURS** MISC - OFF ROAD INCLUDES NG/LPG LOADER, FORKLIFTS, ETC. 1000 GAL = THOUSAND OF GALLONS OF LIQUID FUEL
*** LIGHT DUTY INCLUDES CARS, VAS, SMALL TRUCKS, ECT. 1000 VTM = THOUSAND VEHICLE MILES TRAVELED**** ON ROAD INCLUDES TRUCKS, ETC . MMCF = MILLION OF CUBIC FEET OF NATURAL GAS
DEVICE # 90001,2
PROCESS CODE PROCESS RATE SOURCESID UNITS PER YEAR CLASSIFICATION
CODE CO NOx SOx PARTICULATE MATTERUNITS SCC TOG FRAC PM FRAC
/CAS # 43101 ROG / VOC 42101 42603 42401 11101 PM10 / PM2.5
670.0 3-05-025-99 2.42 0.9676 7.50 24.25 2.91 1.54 0.994 1000 hp-hr Annual Emissions 0.811 0.784 2.513 8.124 0.975 0.516 0.513
718.0 3-05-025-99 2.42 0.9676 7.5 15.2 2.91 0.33 0.991000 hp-hr Annual Emissions 0.869 0.841 2.693 5.457 1.045 0.118 0.117
TOG ROG / VOC CO NOx SOx PM PM10 / PM2.51.679 1.625 5.205 13.581 2.020 0.634 0.630
ORGANIC GASES
EMISSIONS FACTORS (pounds per unit of usage)ANNUAL EMISSIONS (tons per year)
TOTAL EMISSIONS
2 7 Low Emission Retrofit-Loaders
EQUIPMENT TYPE
1 1 HEAVY DUTY - OFF ROAD *
User defined, see Lookup TableUser defined, see Lookup TableUser defined, see Lookup Table
EMISSIONS
User defined, see Lookup TableUser defined, see Lookup TableUser defined, see Lookup TableUser defined, see Lookup Table
LIGHT DUTY VEHICLES *** HEAVY DUTY - ON ROAD ****Low Emission Retrofit-LoadersLow emission Tier I
HEAVY DUTY - OFF ROAD * HEAVY DUTY - OFF ROAD * MISC - OFF ROAD ** LOCOMOTIVES
#N/A
EQUIPMENT TYPE
HEAVY DUTY - OFF ROAD *Low emission Tier I
FACILITY NAME: Sentinel Quarry FACILITY NUMBER:
EQUIPMENT TYPE
OUTPUT DATA TO CEIDARS
COMPANY NAME: Omya California Inc COMPANY NUMBER:
EMISSION HARP / CEIDARSYEAR MINING OPERATIONS
EXHAUST FROM MOBILE AND VEHICULAR EQUIPMENT
DATA INPUT BY FACILITY DATA FROM ANOTHER WORKSHEET
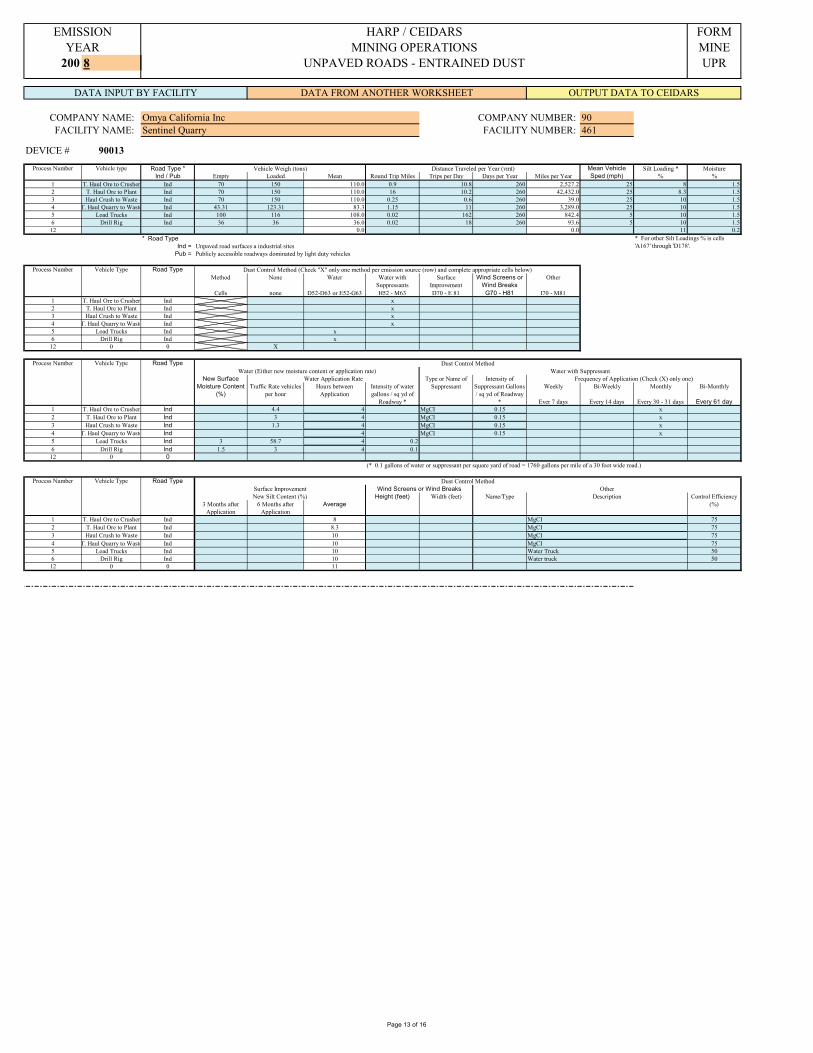
Page 13 of 16
FORMMINE
200 8 UPR
90461
DEVICE # 90013
Road Type * Silt Loading * MoistureInd / Pub Empty Loaded Mean Round Trip Miles Trips per Day Days per Year Miles per Year % %
1 T. Haul Ore to Crusher Ind 70 150 110.0 0.9 10.8 260 2,527.2 25 8 1.52 T. Haul Ore to Plant Ind 70 150 110.0 16 10.2 260 42,432.0 25 8.3 1.53 Haul Crush to Waste Ind 70 150 110.0 0.25 0.6 260 39.0 25 10 1.54 T. Haul Quarry to Waste Ind 43.31 123.31 83.3 1.15 11 260 3,289.0 25 10 1.55 Load Trucks Ind 100 116 108.0 0.02 162 260 842.4 5 10 1.56 Drill Rig Ind 36 36 36.0 0.02 18 260 93.6 5 10 1.5
12 0.0 0.0 11 0.2* Road Type
Ind = Unpaved road surfaces a industrial sitesPub = Publicly accessible roadways dominated by light duty vehicles
Method None Water Water with Suppressants
Surface Improvement
Wind Screens or Wind Breaks
Other
Cells none D52-D63 or E52-G63 H52 - M63 D70 - E 81 G70 - H81 I70 - M811 T. Haul Ore to Crusher Ind x2 T. Haul Ore to Plant Ind x3 Haul Crush to Waste Ind x4 T. Haul Quarry to Waste Ind x5 Load Trucks Ind x6 Drill Rig Ind x
12 0 0 X
Weekly Bi-Weekly Monthly Bi-Monthly
Ever 7 days Every 14 days Every 30 - 31 days Every 61 day1 T. Haul Ore to Crusher Ind 4.4 4 MgCI 0.15 x2 T. Haul Ore to Plant Ind 3 4 MgCI 0.15 x3 Haul Crush to Waste Ind 1.3 4 MgCI 0.15 x4 T. Haul Quarry to Waste Ind 4 MgCI 0.15 x5 Load Trucks Ind 3 58.7 4 0.26 Drill Rig Ind 1.5 3 4 0.1
12 0 0(* 0.1 gallons of water or suppressant per square yard of road = 1760 gallons per mile of a 30 foot wide road.)
3 Months after Application
6 Months after Application
Average
1 T. Haul Ore to Crusher Ind 8 752 T. Haul Ore to Plant Ind 8.3 753 Haul Crush to Waste Ind 10 754 T. Haul Quarry to Waste Ind 10 755 Load Trucks Ind 10 506 Drill Rig Ind 10 50
12 0 0 11
MgCIMgCIWater TruckWater truck
EMISSION HARP / CEIDARSYEAR MINING OPERATIONS
Process Number Vehicle type
UNPAVED ROADS - ENTRAINED DUST
DATA INPUT BY FACILITY DATA FROM ANOTHER WORKSHEET OUTPUT DATA TO CEIDARS
Mean Vehicle Sped (mph)
Vehicle Weigh (tons)
COMPANY NAME: Omya California Inc COMPANY NUMBER: FACILITY NAME: Sentinel Quarry FACILITY NUMBER:
Distance Traveled per Year (vmt)
MgCI
Wind Screens or Wind BreaksWidth (feet)
OtherDescription
MgCI
Intensity of water gallons / sq yd of
Roadway *
Surface ImprovementNew Silt Content (%) Height (feet)
Water Application Rate Intensity of Suppressant Gallons / sq yd of Roadway
*
Type or Name of Suppressant
Dust Control Method
New Surface Moisture Content
(%)
Dust Control Method (Check "X" only one method per emission source (row) and complete appropriate cells below)
Road Type
Frequency of Application (Check (X) only one)Water with Suppressant
Traffic Rate vehicles per hour
Process Number Vehicle Type
Dust Control Method
Hours between Application
* For other Silt Loadings % is cells 'A167' through 'D178'.
Process Number Vehicle Type Road Type
Water (Either new moisture content or application rate)Vehicle TypeProcess Number
Control Efficiency (%)
Name/Type
Road Type

Page 14 of 16
FORMMINE
200 8 UPR
EMISSION HARP / CEIDARSYEAR MINING OPERATIONS
UNPAVED ROADS - ENTRAINED DUST
DEVICE # 90014
Emission Factor pounds per vehicle miles traveled
EmFac = k * (s / 12)^a * (W / 3)^b
EmFac = k * ({[(s / 12)^a * (S / 30)^d] / (M / 0.5)^c} -C)*[(365 - P)/365]k, a, b, c, & d = Constants - See Lookup Table entitled "Constants for Emission Factor Equations"
s = Silt content of unpaved surface in percent (%)W = Average vehicle weight in tonsS = Mean vehicle speed (mph)
M = Moisture content of unpaved surface in percent (%)P = Number of days per year with at least 0.01 inches of precipitation - see MetData worksheet Cell ' C16.
ProcessNumber Vehicle Type Road Type vmt PM PM10 PM10 PM10 PM10
1 T. Haul Ore to Crusher Ind 2,527.2 16.613 4.689 0.719 0.282 0.0432 T. Haul Ore to Plant Ind 42,432.0 17.047 4.847 0.743 0.284 0.0443 Haul Crush to Waste Ind 39.0 19.421 5.732 0.879 0.295 0.0454 T. Haul Quarry to Wast Ind 3,289.0 17.138 5.059 0.776 0.295 0.0455 Load Trucks Ind 842.4 19.262 5.685 0.872 0.295 0.0456 Drill Rig Ind 93.6 11.749 3.468 0.532 0.295 0.0457 0 0 0.0 0.000 0.000 0.000 0.000 0.0008 0 0 0.0 0.000 0.000 0.000 0.000 0.0009 0 0 0.0 0.000 0.000 0.000 0.000 0.000
10 0 0 0.0 0.000 0.000 0.000 0.000 0.00011 0 0 0.0 0.000 0.000 0.000 0.000 0.00012 0 0 0.0 0.000 0.000 0.000 0.000 0.000
TOTAL 49,223.2 17.060 4.866 0.746 0.285 0.044Number of Devices 6
None Water with Suppressants
Surface Improvement
Wind Screens or Wind Breaks
Other Overall
New Surface Moisture Content
(%)
Water Application Rate *
1 T. Haul Ore to Crusher Ind 0.00 0.00 0.00 75.00 0.00 0.00 75.00 75.002 T. Haul Ore to Plant Ind 0.00 0.00 0.00 75.00 0.00 0.00 75.00 75.003 Haul Crush to Waste Ind 0.00 0.00 0.00 75.00 0.00 0.00 75.00 75.004 T. Haul Quarry to Waste Ind 0.00 0.00 0.00 75.00 0.00 0.00 75.00 75.005 Load Trucks Ind 0.00 75.00 -5.66 E 0.00 0.00 50.00 75.006 Drill Rig Ind 0.00 0.00 89.20 E 0.00 0.00 50.00 89.207 0 0 0.00 0.00 0.00 E 0.00 0.00 0.00 0.008 0 0 0.00 0.00 0.00 E 0.00 0.00 0.00 0.009 0 0 0.00 0.00 0.00 E 0.00 0.00 0.00 0.00
10 0 0 0.00 0.00 0.00 E 0.00 0.00 0.00 0.0011 0 0 0.00 0.00 0.00 E 0.00 0.00 0.00 0.0012 0 0 0.00 0.00 0.00 E 0.00 0.00 0.00 0.00
* Dust Controls - Water Application RateC = 100 - (0.0012 * A * D * T) / I
C = Control efficiency (%)A = pan evaporation rate (inches)D = Vehicles per hourT = Hours between wateringI = Gallons / sq. yd (Note 0.1 gallon/sq yd = 1760 gallons per mile for a 30 foot wide road.)
Process EfficiencyNumber (%) PM PM10 PM2.5 PM PM10 PM2.5
1 T. Haul Ore to Crusher Ind 75.00 4.153 1.172 0.180 5.248 1.481 0.2272 T. Haul Ore to Plant Ind 75.00 4.262 1.212 0.186 90.415 25.711 3.9423 Haul Crush to Waste Ind 75.00 4.855 1.433 0.220 0.095 0.028 0.0044 T. Haul Quarry to Wast Ind 75.00 4.285 1.265 0.194 7.046 2.080 0.3195 Load Trucks Ind 75.00 4.815 1.421 0.218 2.028 0.599 0.0926 Drill Rig Ind 89.20 1.269 0.375 0.057 0.059 0.018 0.0037 0 0 0.00 0.000 0.000 0.000 0.000 0.000 0.0008 0 0 0.00 0.000 0.000 0.000 0.000 0.000 0.0009 0 0 0.00 0.000 0.000 0.000 0.000 0.000 0.000
10 0 0 0.00 0.000 0.000 0.000 0.000 0.000 0.00011 0 0 0.00 0.000 0.000 0.000 0.000 0.000 0.00012 0 0 0.00 0.000 0.000 0.000 0.000 0.000 0.000
TOTAL 75.03 4.262 1.216 0.186
TOTAL 104.891 29.916 4.587
Fractionation ValueEmission Factors Uncontrolled (pounds / vmt)
Emissions (tpy)Emission Factor - Controlled (pounds/vmt)Road TypeVehicle Type
WaterVehicle Type Efficiency percentage (%) of Dust Control Methods
Industrial Roads
Public Road
Throughput
Road Type
EMISSIONS
Process Number

Page 15 of 16
FORMMINE
200 8 ERO
90461
DEVICE # 90014
Process Disturbed Areas Vegetative MoistureNumber cover Natural Area Use Area Use
acres acres fraction % Code * Code **
1 1.9 0.5 3 32 7 0.5 3 3
10 0.5
Code Code0 01 12 23 34 45 56 67 78 89 9
10 101112
None Wind Screencheck (x) check (x) Water Added check (x) check (x) Efficiency (%)
gallons per acre per day
Calculated from Added Water
As Measured (%) Moisture Content for Calculation
1 1.9 -0.32 0.00 X 752 7 x 500 4.28 4.28
10 0 x -0.32 0.00
User Defined
Water SprayNew Surface Moisture Content (%)
User DefinedUser DefinedUser DefinedUser Defined
User DefinedActive Agricultural LandCoal Pile
User Defined
User DefinedScrub DesertCoal Dust
User Defined
None None
Moderate Industrial / MiningHeavy Industrial / Mining
Area Usage* Threshold Friction Velocity
NoneArea Usage
Mine TailingsAbandoned Agricultural Land
Construction Site Moderate Industrial / Mining
Name NameConstruction Site Moderate Industrial / Mining
Threshold Friction Velocity Ratio of Wind Speed to Friction VelocityUsage Usage
EMISSION HARP / CEIDARSYEAR MINING OPERATIONS
WIND EROSION FROM UNPAVED OPERATIONAL AREAS AND ROADS
DATA INPUT BY FACILITY DATA FROM ANOTHER WORKSHEET OUTPUT DATA TO CEIDARS
FACILITY NAME: Sentinel Quarry FACILITY NUMBER: COMPANY NAME: Omya California Inc COMPANY NUMBER:
Construction SiteDisturbed Desert
User Defined
MgCl
Total Parking and Disturbed Areas
Parking Areas
Process Number
SpecifyOther
Dust Controls (Check 'x' only one method)
** Ration of Wind Speed to Friction Velocity
NoneOpen SpaceLight Industrial / Mining
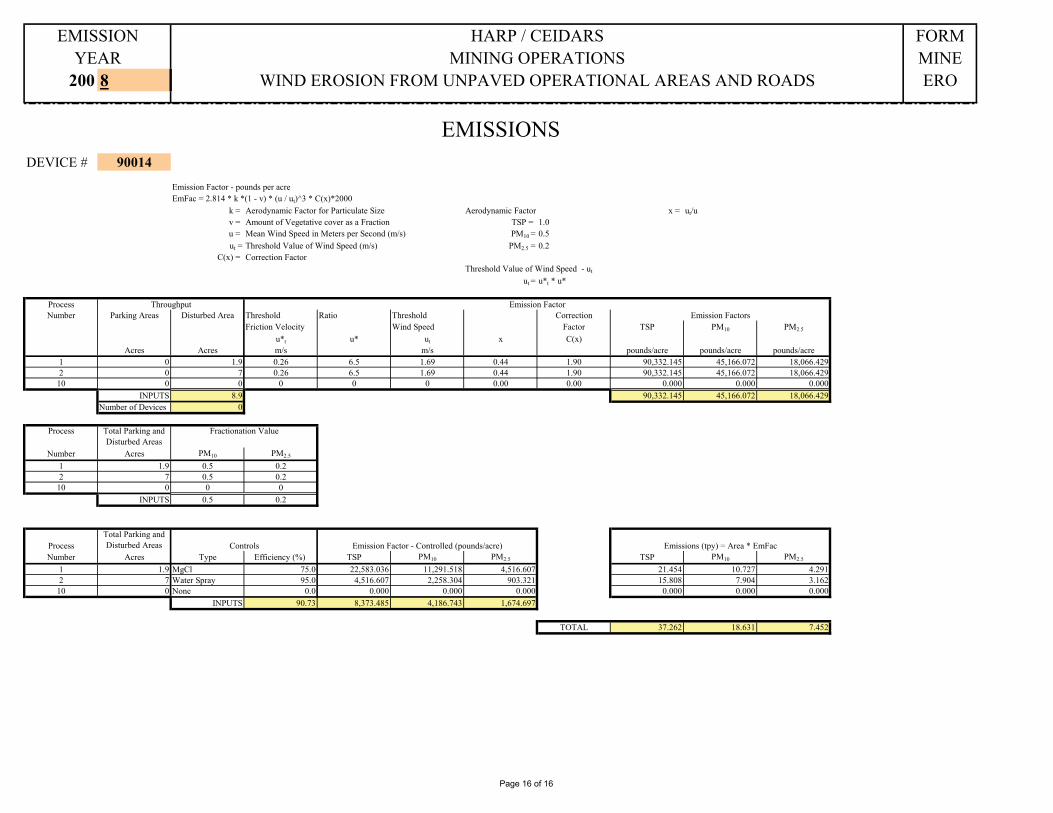
Page 16 of 16
FORMMINE
200 8 ERO
EMISSION HARP / CEIDARSYEAR MINING OPERATIONS
WIND EROSION FROM UNPAVED OPERATIONAL AREAS AND ROADS
DEVICE # 90014
Emission Factor - pounds per acreEmFac = 2.814 * k *(1 - v) * (u / ut)^3 * C(x)*2000
k = Aerodynamic Factor for Particulate Size Aerodynamic Factor x = ut/uv = Amount of Vegetative cover as a Fraction TSP = 1.0u = Mean Wind Speed in Meters per Second (m/s) PM10 = 0.5ut = Threshold Value of Wind Speed (m/s) PM2.5 = 0.2
C(x) = Correction FactorThreshold Value of Wind Speed - ut
ut = u*t * u*
ProcessNumber Threshold Ratio Threshold Correction
Friction Velocity Wind Speed Factor TSP PM10 PM2.5
u*t u* ut x C(x)Acres Acres m/s m/s pounds/acre pounds/acre pounds/acre
1 0 1.9 0.26 6.5 1.69 0.44 1.90 90,332.145 45,166.072 18,066.4292 0 7 0.26 6.5 1.69 0.44 1.90 90,332.145 45,166.072 18,066.429
10 0 0 0 0 0 0.00 0.00 0.000 0.000 0.000INPUTS 8.9 90,332.145 45,166.072 18,066.429
Number of Devices 0
Process Total Parking and Disturbed Areas
Number Acres PM10 PM2.5
1 1.9 0.5 0.22 7 0.5 0.2
10 0 0 0INPUTS 0.5 0.2
ProcessTotal Parking and Disturbed Areas
Number Acres Type Efficiency (%) TSP PM10 PM2.5 TSP PM10 PM2.5
1 1.9 MgCl 75.0 22,583.036 11,291.518 4,516.607 21.454 10.727 4.2912 7 Water Spray 95.0 4,516.607 2,258.304 903.321 15.808 7.904 3.162
10 0 None 0.0 0.000 0.000 0.000 0.000 0.000 0.000INPUTS 90.73 8,373.485 4,186.743 1,674.697
TOTAL 37.262 18.631 7.452
Emissions (tpy) = Area * EmFac
Throughput Emission Factor
EMISSIONS
Parking Areas
Fractionation Value
Controls Emission Factor - Controlled (pounds/acre)
Emission FactorsDisturbed Area

Page 1 of 16
FORMMINE
200 8 TOTAL
90461
DEVICE ID #TSP PM10 PM2.5 CO NOx TOG ROG / VOC SOx
90010 0.122 0.097 0.09790011 2.836 1.475 0.08590011 1.943 0.493 0.00090012a 11.006 5.354 1.636
90006,7,8,9 0.868 0.422 0.1292456 6.204 2.009 0.631
90015 0.178 0.089 0.036VARIOUS 0.317 0.309 0.309 0.964 4.432 0.354 0.313 0.015
90001,2 0.860 0.855 0.855 4.190 13.986 1.355 1.311 1.72090013 63.121 17.990 2.75890014a 68.088 34.044 13.618
GRAND TOTAL 153.600 62.644 20.154 7.097 18.911 1.708 1.623 1.735
TOTAL EMISSIONS
DATA INPUT BY FACILITY DATA FROM ANOTHER WORKSHEET OUTPUT DATA TO CEIDARS
EMISSION HARP / CEIDARSYEAR MINING OPERATIONS
COMPANY NAME: Omya California Inc COMPANY NUMBER: FACILITY NAME: White Knob Quarry FACILITY NUMBER:
DRILLINGBLASTINGEXPLOSIVESBULLDOZING, SCRAPING AND GRADING OF MATERIAL
TOTALEMISSION SOURCE / OPERATION / ACTIVITY CRITERIA EMISSIONS (tons per year)
EXHAUST - MOBILE AND VEHICULAR EQUIPMENTUNPAVED ROADS - ENTRAINED DUSTWIND EROSION FROM UNPAVED OPERATIONAL AREAS AND ROADS
LOADING OF MATERIAL(S) MINE / QUARRY / PIT AGGREGATE HANDLING, CRUSHING, AND SCREENING #1STOCKPILES - WIND EROSIONEXHAUST - STATIONARY AND PORTABLE EQUIPMENT

Page 2 of 16
FORMMINE
200 8 FAC
90461
CITY: STATE: ZIP:
CITY: STATE: ZIP:
EXT:
TYPE OF MINE Quarry (Quarry, Surface, Pit, Bank Run, Shaft, Etc.)
TYPE OF MATERIAL MINED (Limestone, Talc, Salts, Sand, Gravel, Rock, Volcanic Cinders, Gold, Silver, Iron Ore, Rear Earth, Etc.)
OVERBURDEN RATIO 0.66:1 Tons of Overburden per Ton of Ore
Lucerne ValleyCA 92356
EMISSION HARP / CEIDARSYEAR MINING OPERATIONS
FACILITY INFORMATION
DATA INPUT BY FACILITY
CA 92356
FACID:
DATA FROM ANOTHER WORKSHEET OUTPUT DATA TO CEIDARS
COMPANY NAME: Omya California Inc COMPANY NUMBER:
MAILING ADDRESS: P.O. Box 825
9000461FACILITY NAME: White Knob Quarry FACILITY NUMBER:
FACILITY LOCATION (address): 7225 Crystal Creek RoadLucerne Valley
CONTACT PERSON: Christine GranquistTELEPHONE NUMBER:
MINE TYPE AND PARAMETERS
Limestone
FAX NUMBER: 760-248-9115EMAIL: [email protected]
760-248-5223

Page 3 of 16
FORMMINE
200 8 MIN
90461
Name ofMinerals Shifted by Blasting Total Handled Moisture (%) Silt (%)
Limestone 243,036 243,036 0.5 5.00.5 30.00.5 30.00.5 30.00.5 30.00.5 30.00.5 30.00.5 30.00.5 30.00.5 30.00.5 30.00.5 30.00.5 30.00.5 30.00.5 30.0
TOTAL 243,036 243,036
DATA FROM ANOTHER WORKSHEET OUTPUT DATA TO CEIDARSDATA INPUT BY FACILITY
EMISSION HARP / CEIDARSYEAR MINING OPERATIONS
MINERALS HANDLED - AMOUNT & CHARACTERISTICS
Amounts (tpy) Characteristics
COMPANY NAME: Omya California Inc COMPANY NUMBER: FACILITY NAME: White Knob Quarry FACILITY NUMBER:

Page 4 of 16
FORMMINE
200 8 MET-D
90461
Parameter Value Default ValueMean Wind Speed 7.7 7.7
u 3.4Precipitation 20.0 20.0Wind Speed 13.3 13.3Evaporation 75.0 75.0
METEOROLOGICAL DATA
DATA INPUT BY FACILITY DATA FROM ANOTHER WORKSHEET OUTPUT DATA TO CEIDARS
EMISSION HARP / CEIDARSYEAR MINING OPERATIONS
COMPANY NAME: Omya California Inc COMPANY NUMBER: FACILITY NAME: White Knob Quarry FACILITY NUMBER:
Day per year with at least 0.01 inches of precipitationPercent of time with wind speed >12mph (%)Annual Pan Evaporation Rate in inches
Descriptionmphmeters per second

Page 5 of 16
FORMMINE
200 8 D&B
90461
Device ID# 90010Device ID# 90011
2221
4626,431
141,482243,036 Tons Ore, Waste & Overburden
DRILLINGDevice ID# 90010 SCC 30502514 SCC 30502514
Annual Throughput 243,036 Tons Shifted Annual Throughput 462 Holes Drilled
TSP PM10 PM2.5 PM10 PM2.5 TSP PM10 PM2.5 PM10 PM2.5
0.001 0.0008 0.0008 0.800 0.800 1.3 0.68 0.68 0.523 0.523
None, assumed wet drilling None, assumed wet drilling
TSP PM10 PM2.5 TSP PM10 PM2.5
0.122 0.097 0.097 0.300 0.157 0.157
BLASTINGDevice ID# 90011
Annual Throughput 243,036 Tons Shifted Area Shifted per Blast - Average 6,431 square foot per blast - averageSCC 30502514 Area Shifted per Year 141,482 square foot per year
SCC 30502514
TSP PM10 PM2.5 PM10 PM2.5 TSP PM10 PM2.5 PM10 PM2.5
0.160 0.080 0.005 0.500 0.030 257.862 134.088 7.736 0.520 0.030
* EmFac = k * 0.0005 * A1.5 35.71428571k = Aerodynamic Factor
TSP = 1.00PM10 = 0.52PM2.5 = 0.03
A = Area Shifted per Blast - Average
None None
TSP PM10 PM2.5 TSP PM10 PM2.5
19.44288 9.72144 0.5832864 2.836 1.475 0.085
Em = EmFac * Amount Shift Em = EmFac * Blast per Year
Controls Controls
Emissions - tons per year Emissions - tons per year
Controls Controls
Emissions - tons per year Emissions - tons per year
By Square Foot Shifted
Emission Factors (pounds per ton shifted) Fractionation Value Emission Factors (pounds per blast) * Fractionation Value
By Tons Shifted
Amount shifted by blasting
EMISSIONS
By Amount Shifted By Number of Holes Drilled
Emission Factors (pounds per tons shifted) Fractionation Value Emission Factors (pounds per hole drilled) Fractionation Value
Holes drilled per year Number of holes per yearArea Shifted per Blast - Average square foot per blast - averageArea Shifted per Year square foot per year
FACILITY NAME: White Knob Quarry FACILITY NUMBER:
Blast per year numberHoles per Blast - Average number
DRILLINGBLASTING
DATA INPUT BY FACILITY DATA FROM ANOTHER WORKSHEET OUTPUT DATA TO CEIDARS
COMPANY NAME: Omya California Inc COMPANY NUMBER:
EMISSION HARP / CEIDARSYEAR MINING OPERATIONS
DRILLING AND BLASTING
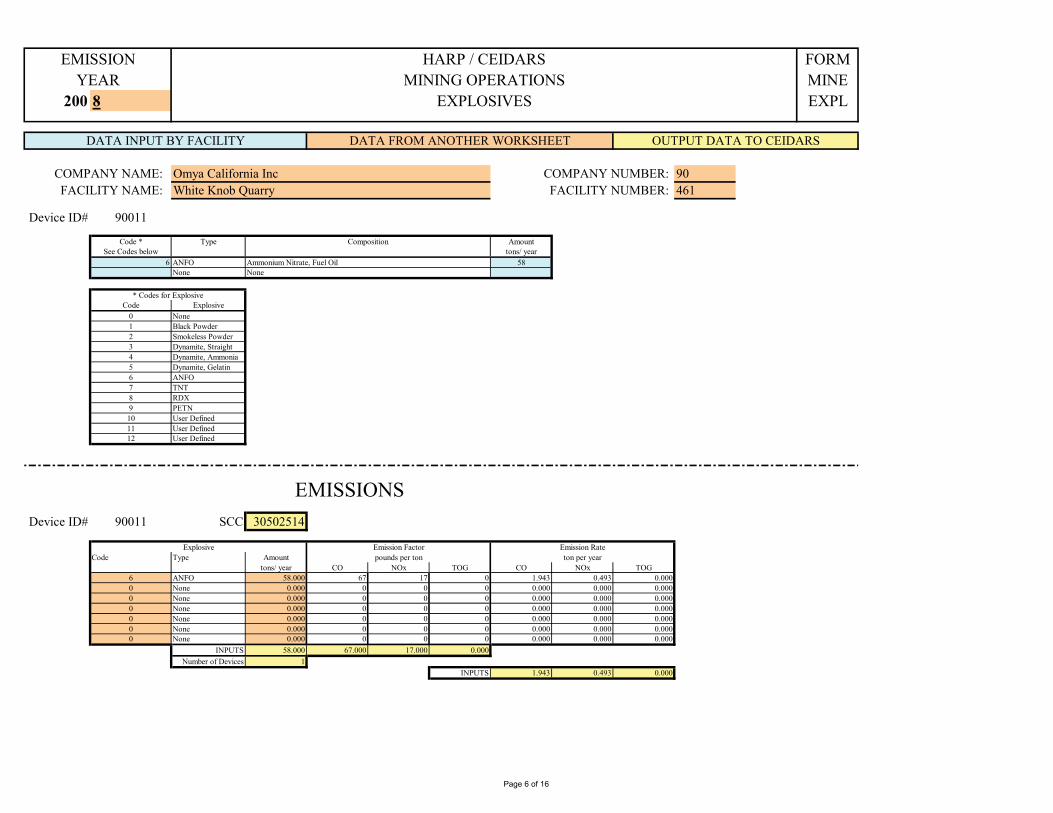
Page 6 of 16
FORMMINE
200 8 EXPL
90461
Device ID# 90011
Code * Type AmountSee Codes below tons/ year
6 ANFO 58None
Code Explosive0 None1 Black Powder2 Smokeless Powder3 Dynamite, Straight4 Dynamite, Ammonia5 Dynamite, Gelatin6 ANFO7 TNT8 RDX9 PETN10 User Defined11 User Defined12 User Defined
Device ID# 90011 SCC 30502514
Code Type Amounttons/ year CO NOx TOG CO NOx TOG
6 ANFO 58.000 67 17 0 1.943 0.493 0.0000 None 0.000 0 0 0 0.000 0.000 0.0000 None 0.000 0 0 0 0.000 0.000 0.0000 None 0.000 0 0 0 0.000 0.000 0.0000 None 0.000 0 0 0 0.000 0.000 0.0000 None 0.000 0 0 0 0.000 0.000 0.0000 None 0.000 0 0 0 0.000 0.000 0.000
INPUTS 58.000 67.000 17.000 0.000Number of Devices 1
INPUTS 1.943 0.493 0.000
* Codes for Explosive
Explosive Emission Factor
EMISSIONS
Emission Ratepounds per ton ton per year
None
FACILITY NAME: White Knob Quarry FACILITY NUMBER:
Composition
Ammonium Nitrate, Fuel Oil
DATA INPUT BY FACILITY DATA FROM ANOTHER WORKSHEET OUTPUT DATA TO CEIDARS
COMPANY NAME: Omya California Inc COMPANY NUMBER:
EMISSION HARP / CEIDARSYEAR MINING OPERATIONS
EXPLOSIVES

Page 7 of 16
FORMMINE
200 8 BSG
90461
Device ID# 90012a
Name of MaterialBulldozing Scraping Grading Other Total None Wind Screen
Check Check New Moisture (%) CheckLimestone 101 863 964 X 1
0 0
Device ID# 90012a SCC 30502599
Emission Factors (pounds per hours of operations)EmFac = 2.76 * k *(s)^1.5 / (M)^1.4
k = Aerodynamic Factor Aerodynamic factorss = silt content (%) TSP = 0.74
M = Moisture content (%) PM10 = 0.36PM2.5 = 0.11
Material Hours of OperationsTSP PM10 PM2.5 PM10 PM2.5
Limestone 964 60.261 29.316 8.958 0.486 0.1490 0 0.000 0.000 0.000 0.000 0.000
TOTAL 964 60.261 29.316 8.958 0.486 0.149Number of Devices 1
MaterialType Efficiency (%) TSP PM10 PM2.5 TSP PM10 PM2.5
Limestone Water Spray 62.107 22.835 11.109 3.394 11.006 5.354 1.6360 None 0.000 0.000 0.000 0.000 0.000 0.000 0.000
TOTAL 62.11 22.835 11.109 3.394
TOTAL 11.006 5.354 1.636
DATA INPUT BY FACILITY DATA FROM ANOTHER WORKSHEET OUTPUT DATA TO CEIDARS
EMISSION HARP / CEIDARSYEAR MINING OPERATIONS
BULLDOZING, SCRAPING AND GRADING OF MATERIAL
COMPANY NAME: Omya California Inc COMPANY NUMBER: FACILITY NAME: White Knob Quarry FACILITY NUMBER:
Control Emission factors - Controlled (pounds per hour) Emissions - tons per year
Emission factors - Uncontrolled (pounds per hour) Fractionation Value
Hours of Operations (hours per year) ControlsWater Spray
EMISSIONS

Page 8 of 16
FORMMINE
200 8 LOAD
90461
DEVICE # 90006,7,8,9
Name of Material AmountLoaded None Wind Screen
tpy Check Check New Moisture (%) Check Check Specify Efficiency (%)Limestone 451,252 x 1
0
Device ID# 90006,7,8,9 SCC 30502506
Emission Factors (pounds per ton)EmFac =0.0032 * k *(U/5)^1.3 / (M/2)^1.4
k = Aerodynamic Factor Aerodynamic factorsU = Mean wind speed in miles per hour TSP = 0.74M = Moisture content (%) PM10 = 0.36
PM2.5 = 0.11
Material AmountLoaded TSP PM10 PM2.5 PM10 PM2.5
tpyLimestone 451,252 0.010 0.005 0.002 0.486 0.149
0 0 0.000 0.000 0.000 0.000 0.000TOTAL 451,252 0.010 0.005 0.002 0.486 0.149
Number of Devices 1
MaterialType Efficiency (%) TSP PM10 PM2.5 TSP PM10 PM2.5
Limestone Water Spray 62.107 0.004 0.002 0.001 0.868 0.422 0.1290 None 0.000 0.000 0.000 0.000 0.000 0.000 0.000
TOTAL 62.11 0.004 0.002 0.001
TOTAL 0.868 0.422 0.129
LOADING OF MATERIAL(S) AT MINE / QUARRY / PIT
DATA INPUT BY FACILITY DATA FROM ANOTHER WORKSHEET OUTPUT DATA TO CEIDARS
EMISSION HARP / CEIDARSYEAR MINING OPERATIONS
COMPANY NAME: Omya California Inc COMPANY NUMBER: FACILITY NAME: White Knob Quarry FACILITY NUMBER:
Control Emission factors - Controlled (pounds per ton) Emissions - tons per year
Water Spray OtherControls
Emission factors - Uncontrolled (pounds per ton) Fractionation Value
EMISSIONS

Page 9 of 16
. .. .
HOURS per DAY ROCK DAYS per WEEK SAND WEEK per YEAR
LIMESTONE CAL. HRS per YR LAVA ROCK ACT. HRS per YR
OTHER CAL. Hrs/Yr = Hr/Dy*Dy/Wk*Wk/Yr
PROCESS DATAEQUIPMENT SIZE (bhp)
NUMBER OF DEVICES
482.5
AVE. HOURLY PRODUCTION RATE (tph)
250
MAX. DESIGN RATE (tph)
PROCESS RATE (tpy) 208,216
250
16
B002456
83
MAX. HOURLY PRODUCTION RATE (tph)
ENTERING THE SYSTEM
ACTUAL ANNUAL
Hourly (average) = Annual (actual) / Actual Hours per Year (operated)2600
BLOCK XIII, COLUMNS 'B', 'E', 'F' & 'G'
MAX. DESIGN RATE
Tons/Yr.TPHTPH
X - MOISTURE CONTENT (%)MOISTURE CONTENT ENTERING SYS.: 3 %
2456
75.00OVERALL EFFICIENCY 75.00 75.00
0.0061
FRACTIONATION VALUE ( PM10 or PM2.5 / PM) 0.3238 0.1016
0.0596 0.0193CONTROLLED
UNCONTROLLED 0.2384 0.0772 0.0242
EMISSION FACTOR (lb/ton)
UNCONTROLLED 24.814 8.035 2.522
CONTROLLED 6.204 2.009 0.631
114,511
EMISSION DATA
BLOCK XIV - EMISSIONS & HARP INPUTS
PERMIT ID PM2.5ANNUAL EMISSIONS (tpy) PM PM10
DEVICE DATAEMISSION INVENTORY INPUTS
0.04 0.02 0.01Water Spray, Point of Application 75.0 0.002 0.001 0.00045 4 Transfer Point (Note 2) NA 135,319 1
0.002 0.001 0.000 0.04 0.02 0.01
0.01
44 5 Conveyor (Note 2) 50 135,319 1 Water Spray, Point of Application 75.0
75.0 0.002 0.001 0.000 0.04 0.02
0.02 0.01
43 4 Transfer Point (Note 2) NA 135,319 1 Water Spray, Point of Application
Water Spray, Point of Application 75.0 0.002 0.001 0.000 0.04
3.64 0.22 0.07
42 5 Conveyor (Note 2) 25 135,319 1
Water Spray, Point of Application 75.0 0.280 0.017 0.00541.1 6 Crushing, Dry - Primary 250 104,108 1
0.002 0.001 0.000 0.03 0.01 0.00
0.00
41 4 Transfer Point (Note 2) NA 104,108 1 Water Spray, Point of Application 75.0
75.0 0.002 0.001 0.000 0.01 0.00
0.01 0.00
40 4 Transfer Point (Note 2) NA 31,190 1 Water Spray, Point of Application
Water Spray, Point of Application 75.0 0.002 0.001 0.000 0.02
0.02 0.01 0.00
39 4 Transfer Point (Note 2) NA 72,876 1
Water Spray, Point of Application 75.0 0.002 0.001 0.00038 5 Conveyor (Note 2) 25 72,876 1
0.002 0.001 0.000 0.02 0.01 0.00
0.49
37 5 Conveyor (Note 2) 7.5 72,876 1 Water Spray, Point of Application 75.0
75.0 0.160 0.120 0.038 2.08 1.56
0.01 0.00
36.1 10 Screening, Dry 50 104,108 1 Water Spray, Point of Application
Water Spray, Point of Application 75.0 0.002 0.001 0.000 0.03
0.03 0.01 0.00
36 4 Transfer Point (Note 2) NA 104,108 1
Water Spray, Point of Application 75.0 0.002 0.001 0.00035 5 Conveyor (Note 2) 10 104,108 1
0.002 0.001 0.000 0.03 0.01 0.00
0.01
34 5 Conveyor (Note 2) 15 104,108 1 Water Spray, Point of Application 75.0
75.0 0.002 0.001 0.000 0.06 0.03
0.03 0.01
33 2 Grizzly (Note 2) 50 208,216 1 Water Spray, Point of Application
Water Spray, Point of Application 75.0 0.002 0.001 0.000 0.06
(M) (N) (O)
32 1 Dump to Hopper, truck, pile (Note 2) NA 208,216 1
(G) (H) (I) (J) (K) (L)PM2.5 PM30 PM10 PM2.5
(A) (B) (C) (D) (E) (F)PM30 PM10
DsF NAME OF DEVICE EFF % POUNDS PER TON TONS PER YEARNUMBER NO
ID CODE BHP TONS / YEAR CODE
XIII - EMISSION CALCULATIONSEQUIPMENT DEVICE NAME OF DEVICE MOTOR THROUGHPUT EMISSION CONTROL DEVICE EMISSION FACTORS EMISSION RATE
10 21 10 21Screening, Dry See Lookup Table "EmFac" for data Windscreen, Windward Side9 20 9 20Crushing, Wet (Note 3) See Lookup Table "EmFac" for data Cyclone - Multiple8 19 8 19Crushing, Dry - Tertiary See Lookup Table "EmFac" for data Cyclone - Simple7 18 7 18See Lookup Table "EmFac" for dataCrushing, Dry - Secondary Gravity Separator6 17 6 17FeederCrushing, Dry - Primary Process Enclosure5 16 5 16Loading Open Top Truck (Note 2)Conveyor (Note 2) Conveyor with Full Cover4 15 4 15Silo, discharge to Tank TruckTransfer Point (Note 2) Conveyor with Three Quarter Cover3 14 3 14Silo, discharge to Conveyor (Note 2)Hopper (Note 2)2 13 2 13Silo, Filling - Bucket ElevatorGrizzly (Note 2)1 12 1 12Silo, Filling - PneumaticDump to Hopper, truck, pile (Note 2)0 11 0 11Screening, Wet Washing (Note 4)No Device
2500COMMENTS
xx xLOAD OUT
x
1 1 6VII - MATERIAL TYPES VIII - OPERATING SCHEDULE
9 4 2 23 4 3 8 3 78 0 4 4 1 55 0 5 3 1 6
4FACILITY NAME
B 0 0 2COMPANY # 5 690
II - MANDATORY INFORMATIONI - COLOR CODEDATA INPUT BY FACILITY DATA FROM ANOTHER WORKSHEET OUTPUT DATA TO CEIDARS
III - FACILITY INFORMATIONOmya California Inc
AGGREGATE HANDLING, CRUSHING & SCREENING #1
FORMYEAR MINING OPERATIONS MINE
EMISSION HARP / CEIDARS
AGG-1200 8
COMPANY NAME PERMIT # FACILITY #
Baghouse with Single Pickup (Attached)
FLOW DIAGRAMBLOCK III - ALL ITEMSBLOCK VIII - ACTUAL HOURS OPERATED
IX - THROUGHPUT (tons per year)10
INVENTORY ID # DEVICE ID
PROCESS ID 4619000461
3
CRUSHERS
UTM NORTH (km)
White Knob Quarry
IV - MAP COORDINATES FOR PROCESS
BLOCK IX - ANNUAL THROUGHPUT (tpy)BLOCK X - MOISTURE CONTENT (%) OF MATERIAL
UTM ZONE UTM EAST (km) 11
x
TRANSFER STORAGE
LATITUDE (deg.) LONGITUDE (deg.)
STATIONARY x check all that applies
52 250.0
208,2165 83HOURLY (average)
VI - TYPE OF EQUIPMENT, check all that applies:x x
V - TYPE OF PLANT
AVERAGE THROUGHPUT PER DEVICE
SCREENS CONVEYORS
OTHERS
PORTABLE OTHER
COMMENTS
XI - TYPE OF OPERATION AND / OR DEVICE TYPE OF CONTROL CODE
Spray Tower (Low Efficiency)Wet Scrubber (Med Efficiency)
NoneWater Spray, Point of ApplicationSpray with Additives, Point of Application
Gravel Bed Filters
XII - TYPE OF EMISSION CONTROL EQUIPMENTCODE NAME OF DEVICE OR SYSTEM CODE NAME OF DEVICE OR SYSTEM CODE TYPE OF CONTROL
Venturi Scrubber (High Efficiency)Baghouse with Multiple PickupsBaghouse with Single Pickup (Unenclosed)Baghouse with Single Pickup (Partial Enclosed)Baghouse with Single Pickup (Full Enclosed)
Conveyor with Half Cover
482.5TOTAL HORSEPOWER
Electrostatic PrecipitatorSee Lookup Table "ConEff" for data
PROCESS NAME Crushing $ Screening Circuit

Page 10 of 16
FORMMINE
200 8 S-PILES
90461
Device ID# 90015A
Name of / Material Type Exposed Surface Silt Loading MoistureNumber (uncontrolled)
acres % %Overburden Limestone 0.5000 1.5 1.5
30 0.5
StockpileName / Number Wind Screen
check gal/acre/day check check Specify Efficiency (%)Overburden X 800
0
Device ID# 90015 SCC 30502507
Emission Factors (pounds per acres)EmFac = J *1.7 * s/1.5 * (365 - P)/235 * I/15 * 365
J = Aerodynamic factor Aerodynamic factors = Silt Loading (%) TSP = 1.0P = Day per year with at least 0.01 inches of precipitation PM10 = 0.5I = Percent of time with wind speed >12mph (%) PM2.5 = 0.2
Stockpile Material Type Size (acres) TSP PM10 PM2.5 PM10 PM2.5
Overburden Limestone 0.5000 807.706 403.853 161.541 0.500 0.2000 0 0.0000 0.000 0.000 0.000 0.000 0.000
TOTAL 0.5 807.706 403.853 161.541 0.500 0.200Number of Devices 1
StockpileType Efficiency (%) TSP PM10 PM2.5 TSP PM10 PM2.5
Overburden Water Spray 11.81 712.329 356.165 142.466 0.178 0.089 0.0360 None 0.00 0.000 0.000 0.000 0.000 0.000 0.000
TOTAL 11.81 712.329 356.165 142.466
TOTAL 0.178 0.089 0.036
Stockpile
Controls Emission Factor - Controlled (pounds/acre) Emissions (tpy) = Area * EmFac
Dust ControlsWater Spray Other
Fractionation Value
EMISSIONS
Throughput (acres) Emission Factor - Uncontrolled (pounds/acre)
STOCKPILES
DATA INPUT BY FACILITY DATA FROM ANOTHER WORKSHEET OUTPUT DATA TO CEIDARS
COMPANY NAME: Omya California Inc COMPANY NUMBER: FACILITY NAME: White Knob Quarry FACILITY NUMBER:
EMISSIONYEAR MINING OPERATIONS
HARP / CEIDARS
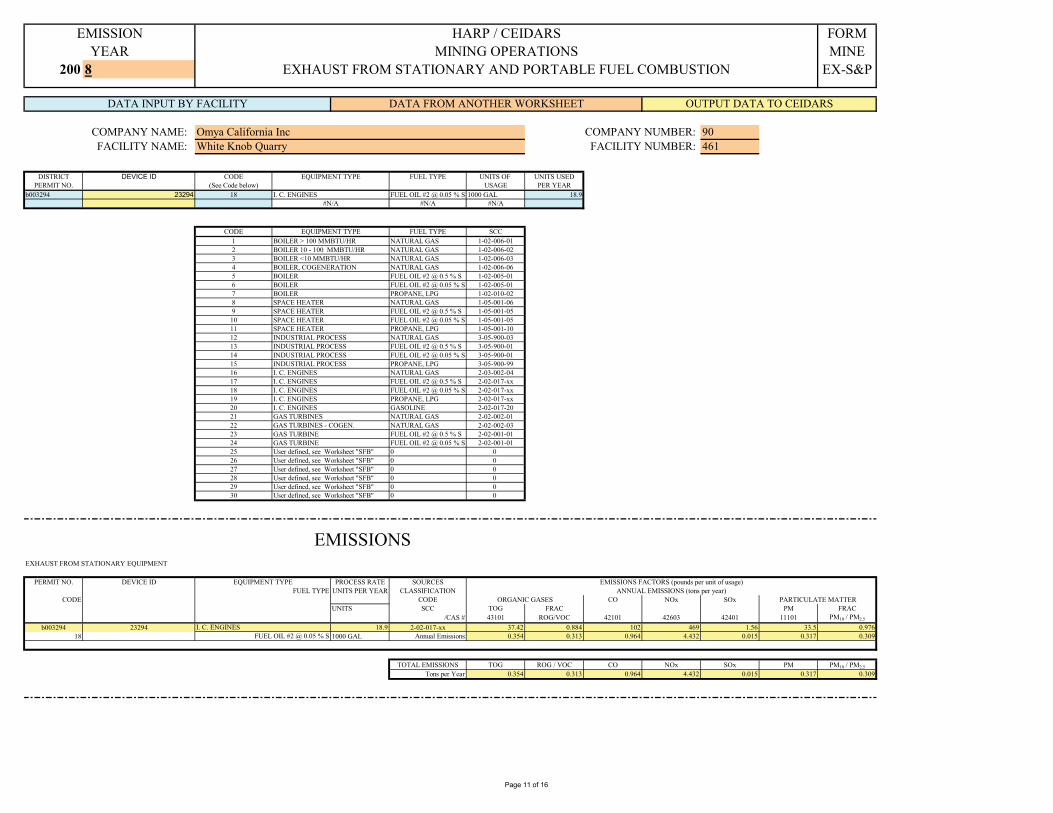
Page 11 of 16
FORMMINE
200 8 EX-S&P
90461
DISTRICT DEVICE ID CODE FUEL TYPE UNITS OF UNITS USEDPERMIT NO. (See Code below) USAGE PER YEAR
b003294 23294 18 FUEL OIL #2 @ 0.05 % S 1000 GAL 18.9#N/A #N/A
CODE FUEL TYPE SCC1 NATURAL GAS 1-02-006-012 NATURAL GAS 1-02-006-023 NATURAL GAS 1-02-006-034 NATURAL GAS 1-02-006-065 FUEL OIL #2 @ 0.5 % S 1-02-005-016 FUEL OIL #2 @ 0.05 % S 1-02-005-017 PROPANE, LPG 1-02-010-028 NATURAL GAS 1-05-001-069 FUEL OIL #2 @ 0.5 % S 1-05-001-05
10 FUEL OIL #2 @ 0.05 % S 1-05-001-0511 PROPANE, LPG 1-05-001-1012 NATURAL GAS 3-05-900-0313 FUEL OIL #2 @ 0.5 % S 3-05-900-0114 FUEL OIL #2 @ 0.05 % S 3-05-900-0115 PROPANE, LPG 3-05-900-9916 NATURAL GAS 2-03-002-0417 FUEL OIL #2 @ 0.5 % S 2-02-017-xx18 FUEL OIL #2 @ 0.05 % S 2-02-017-xx19 PROPANE, LPG 2-02-017-xx20 GASOLINE 2-02-017-2021 NATURAL GAS 2-02-002-0122 NATURAL GAS 2-02-002-0323 FUEL OIL #2 @ 0.5 % S 2-02-001-0124 FUEL OIL #2 @ 0.05 % S 2-02-001-0125 0 026 0 027 0 028 0 029 0 030 0 0
EXHAUST FROM STATIONARY EQUIPMENT
PERMIT NO. DEVICE ID PROCESS RATE SOURCESUNITS PER YEAR CLASSIFICATION
CODE CODE CO NOx SOxUNITS SCC TOG FRAC PM FRAC
/CAS # 43101 ROG/VOC 42101 42603 42401 11101 PM10 / PM2.5
b003294 23294 18.9 2-02-017-xx 37.42 0.884 102 469 1.56 33.5 0.97618 1000 GAL Annual Emissions 0.354 0.313 0.964 4.432 0.015 0.317 0.309
TOTAL EMISSIONS TOG ROG / VOC CO NOx SOx PM PM10 / PM2.5
Tons per Year 0.354 0.313 0.964 4.432 0.015 0.317 0.309
PARTICULATE MATTER
I. C. ENGINESFUEL OIL #2 @ 0.05 % S
User defined, see Worksheet "SFB"User defined, see Worksheet "SFB"User defined, see Worksheet "SFB"
EMISSIONS
EQUIPMENT TYPE
ORGANIC GASESFUEL TYPE
EMISSIONS FACTORS (pounds per unit of usage)ANNUAL EMISSIONS (tons per year)
GAS TURBINES - COGEN.GAS TURBINEGAS TURBINEUser defined, see Worksheet "SFB"User defined, see Worksheet "SFB"User defined, see Worksheet "SFB"
I. C. ENGINESI. C. ENGINESI. C. ENGINESI. C. ENGINESI. C. ENGINESGAS TURBINES
SPACE HEATERSPACE HEATERINDUSTRIAL PROCESSINDUSTRIAL PROCESSINDUSTRIAL PROCESSINDUSTRIAL PROCESS
BOILER, COGENERATIONBOILERBOILERBOILERSPACE HEATERSPACE HEATER
#N/A
EQUIPMENT TYPEBOILER > 100 MMBTU/HRBOILER 10 - 100 MMBTU/HRBOILER <10 MMBTU/HR
FACILITY NAME: White Knob Quarry FACILITY NUMBER:
EQUIPMENT TYPE
I. C. ENGINES
DATA INPUT BY FACILITY DATA FROM ANOTHER WORKSHEET OUTPUT DATA TO CEIDARS
COMPANY NAME: Omya California Inc COMPANY NUMBER:
EMISSION HARP / CEIDARSYEAR MINING OPERATIONS
EXHAUST FROM STATIONARY AND PORTABLE FUEL COMBUSTION

Page 12 of 16
FORMMINE
200 8 EX-M
90461
DEVICE # 90001,2
PROCESS CODE FUEL TYPE UNITS OF UNITS USEDNUMBER (See Code below) USAGE PER YEAR
1 1 DIESEL 1000 hp-hr 1,105.02 7 DIESEL 1000 hp-hr 77.33 5 GASOLINE 1000 VMT 0.42
20 #N/A #N/A
CODE FUEL TYPE SCC1 DIESEL 1000 hp-hr 3-05-025-992 GASOLINE 1000 hp-hr 3-05-025-993 NG / LPG 1000 hp-hr 3-05-025-994 DIESEL 1000 GAL 3-05-025-995 GASOLINE 1000 VMT 3-05-025-996 DIESEL 1000 VMT 3-05-025-997 DIESEL 1000 hp-hr 3-05-025-998 DIESEL 1001 hp-hr 3-05-025-9915 0 0 0
* OFF ROAD INCLUDES MINING AND EARTH MOVING EQUIPMENT 1000 hp-hr = THOUSAND OF HORSEPOWER HOURS** MISC - OFF ROAD INCLUDES NG/LPG LOADER, FORKLIFTS, ETC. 1000 GAL = THOUSAND OF GALLONS OF LIQUID FUEL
*** LIGHT DUTY INCLUDES CARS, VAS, SMALL TRUCKS, ECT. 1000 VTM = THOUSAND VEHICLE MILES TRAVELED**** ON ROAD INCLUDES TRUCKS, ETC . MMCF = MILLION OF CUBIC FEET OF NATURAL GAS
DEVICE # 90001,2
PROCESS CODE PROCESS RATE SOURCESID UNITS PER YEAR CLASSIFICATION
CODE CO NOx SOx PARTICULATE MATTERUNITS SCC TOG FRAC PM FRAC
/CAS # 43101 ROG / VOC 42101 42603 42401 11101 PM10 / PM2.5
1,105.0 3-05-025-99 2.42 0.9676 7.50 24.25 2.91 1.54 0.994 1000 hp-hr Annual Emissions 1.337 1.294 4.144 13.398 1.608 0.851 0.846
77.3 3-05-025-99 0.44 0.97 1.1 15.2 2.9 0.24 0.991000 hp-hr Annual Emissions 0.017 0.016 0.043 0.587 0.112 0.009 0.009
0.42 3-05-025-99 2.92 0.914 18.79 2.32 0.12 0.47 0.45 1000 VMT Annual Emissions 0.001 0.001 0.004 0.000 0.000 0.000 0.000
TOG ROG / VOC CO NOx SOx PM PM10 / PM2.51.355 1.311 4.190 13.986 1.720 0.860 0.855
EMISSION HARP / CEIDARSYEAR MINING OPERATIONS
EXHAUST FROM MOBILE AND VEHICULAR EQUIPMENT
DATA INPUT BY FACILITY DATA FROM ANOTHER WORKSHEET
FACILITY NAME: White Knob Quarry FACILITY NUMBER:
EQUIPMENT TYPE
OUTPUT DATA TO CEIDARS
COMPANY NAME: Omya California Inc COMPANY NUMBER:
HEAVY DUTY - OFF ROAD *Low emission Tier I LIGHT DUTY VEHICLES ***
HEAVY DUTY - OFF ROAD * HEAVY DUTY - OFF ROAD * MISC - OFF ROAD ** LOCOMOTIVES
#N/A
EQUIPMENT TYPE
User defined, see Lookup Table
LIGHT DUTY VEHICLES *** HEAVY DUTY - ON ROAD ****Low emission Tier ILow Emission Retrofit-Loaders
EQUIPMENT TYPE
1 1 HEAVY DUTY - OFF ROAD *
EMISSIONS
3 5 LIGHT DUTY VEHICLES ***
2 7 Low emission Tier I
ORGANIC GASES
EMISSIONS FACTORS (pounds per unit of usage)ANNUAL EMISSIONS (tons per year)
TOTAL EMISSIONS

Page 13 of 16
FORMMINE
200 8 UPR
90461
DEVICE # 90013
Road Type * Silt Loading * MoistureInd / Pub Empty Loaded Mean Round Trip Miles Trips per Day Days per Year Miles per Year % %
1 T. Haul Ore to Crusher Ind 70 145 107.5 0.6 10.7 260 1,669.2 25 8 1.52 T. Haul Ore to Plant Ind 70 150 110.0 13 7.2 260 24,336.0 25 8.3 1.53 Haul Crush to Waste Ind 100 150 125.0 0.03 4.5 260 35.1 25 10 1.54 Haul Quarry to Waste Ind 43.3 93.3 68.3 1.95 2.7 260 1,368.9 25 10 1.55 Loader Ind 100 116 108.0 0.02 109 260 566.8 5 10 1.56 Drill rig ind 35 35 35.0 0.02 12 260 62.4 10 1.5
12 0.0 0.0 11 0.2* Road Type
Ind = Unpaved road surfaces a industrial sitesPub = Publicly accessible roadways dominated by light duty vehicles
Method None Water Water with Suppressants
Surface Improvement
Wind Screens or Wind Breaks
Other
Cells none D52-D63 or E52-G63 H52 - M63 D70 - E 81 G70 - H81 I70 - M811 T. Haul Ore to Crusher Ind x2 T. Haul Ore to Plant Ind x3 Haul Crush to Waste Ind x4 Haul Quarry to Waste Ind x5 Loader Ind x6 Drill rig ind x
12 0 0 X
Weekly Bi-Weekly Monthly Bi-Monthly
Ever 7 days Every 14 days Every 30 - 31 days Every 61 day1 T. Haul Ore to Crusher Ind 4.4 4 MgCI 0.15 x2 T. Haul Ore to Plant Ind 3 4 MgCI 0.15 x3 Haul Crush to Waste Ind 1.3 4 MgCI 0.15 x4 Haul Quarry to Waste Ind 4.7 4 MgCI 0.15 x5 Loader Ind 3 58.7 4 0.26 Drill rig ind 1.5 3 4 0.1
12 0 0(* 0.1 gallons of water or suppressant per square yard of road = 1760 gallons per mile of a 30 foot wide road.)
3 Months after Application
6 Months after Application
Average
1 T. Haul Ore to Crusher Ind 8 752 T. Haul Ore to Plant Ind 8.3 753 Haul Crush to Waste Ind 10 754 Haul Quarry to Waste Ind 10 755 Loader Ind 10 506 Drill rig ind 10 50
12 0 0 11
Control Efficiency (%)
Name/Type
Road Type
* For other Silt Loadings % is cells 'A167' through 'D178'.
Process Number Vehicle Type Road Type
Water (Either new moisture content or application rate)Vehicle TypeProcess Number
Dust Control Method (Check "X" only one method per emission source (row) and complete appropriate cells below)
Road Type
Frequency of Application (Check (X) only one)Water with Suppressant
Traffic Rate vehicles per hour
Process Number Vehicle Type
Dust Control Method
Hours between Application
Intensity of water gallons / sq yd of
Roadway *
Surface ImprovementNew Silt Content (%) Height (feet)
Water Application Rate Intensity of Suppressant
Gallons / sq yd of Roadway *
Type or Name of Suppressant
Dust Control Method
New Surface Moisture Content
(%)
MgCI
Wind Screens or Wind BreaksWidth (feet)
OtherDescription
MgCI
OUTPUT DATA TO CEIDARS
Mean Vehicle Sped (mph)
Vehicle Weigh (tons)
COMPANY NAME: Omya California Inc COMPANY NUMBER: FACILITY NAME: White Knob Quarry FACILITY NUMBER:
Distance Traveled per Year (vmt)
EMISSION HARP / CEIDARSYEAR MINING OPERATIONS
Process Number Vehicle type
UNPAVED ROADS - ENTRAINED DUST
DATA INPUT BY FACILITY DATA FROM ANOTHER WORKSHEET
MgCIMgCIWater TruckWater truck

Page 14 of 16
FORMMINE
200 8 UPR
EMISSION HARP / CEIDARSYEAR MINING OPERATIONS
UNPAVED ROADS - ENTRAINED DUST
DEVICE # 90014
Emission Factor pounds per vehicle miles traveled
EmFac = k * (s / 12)^a * (W / 3)^b
EmFac = k * ({[(s / 12)^a * (S / 30)^d] / (M / 0.5)^c} -C)*[(365 - P)/365]k, a, b, c, & d = Constants - See Lookup Table entitled "Constants for Emission Factor Equations"
s = Silt content of unpaved surface in percent (%)W = Average vehicle weight in tonsS = Mean vehicle speed (mph)
M = Moisture content of unpaved surface in percent (%)P = Number of days per year with at least 0.01 inches of precipitation - see MetData worksheet Cell ' C16.
ProcessNumber Vehicle Type Road Type vmt PM PM10 PM10 PM10 PM10
1 T. Haul Ore to Crusher Ind 1,669.2 17.454 4.927 0.755 0.282 0.0432 T. Haul Ore to Plant Ind 24,336.0 18.096 5.146 0.789 0.284 0.0443 Haul Crush to Waste Ind 35.1 21.837 6.446 0.988 0.295 0.0454 Haul Quarry to Waste Ind 1,368.9 16.637 4.911 0.753 0.295 0.0455 Loader Ind 566.8 20.447 6.035 0.925 0.295 0.0456 Drill rig ind 62.4 12.315 3.635 0.557 0.295 0.045
12 0 0 0.0 0.000 0.000 0.000 0.000 0.000TOTAL 28,038.4 18.026 5.137 0.788 0.285 0.044
Number of Devices 6
None Water with Suppressants
Surface Improvement
Wind Screens or Wind Breaks
Other Overall
New Surface Moisture Content
(%)
Water Application Rate *
1 T. Haul Ore to Crusher Ind 0.00 0.00 0.00 75.00 0.00 0.00 75.00 75.002 T. Haul Ore to Plant Ind 0.00 0.00 0.00 75.00 0.00 0.00 75.00 75.003 Haul Crush to Waste Ind 0.00 0.00 0.00 75.00 0.00 0.00 75.00 75.004 Haul Quarry to Waste Ind 0.00 0.00 0.00 75.00 0.00 0.00 75.00 75.005 Loader Ind 0.00 75.00 -5.66 E 0.00 0.00 50.00 75.006 Drill rig ind 0.00 0.00 89.20 E 0.00 0.00 50.00 89.20
12 0 0 0.00 0.00 0.00 E 0.00 0.00 0.00 0.00
* Dust Controls - Water Application RateC = 100 - (0.0012 * A * D * T) / I
C = Control efficiency (%)A = pan evaporation rate (inches)D = Vehicles per hourT = Hours between wateringI = Gallons / sq. yd (Note 0.1 gallon/sq yd = 1760 gallons per mile for a 30 foot wide road.)
Process EfficiencyNumber (%) PM PM10 PM2.5 PM PM10 PM2.5
1 T. Haul Ore to Crusher Ind 75.00 4.363 1.232 0.189 3.642 1.028 0.1582 T. Haul Ore to Plant Ind 75.00 4.524 1.286 0.197 55.047 15.653 2.4003 Haul Crush to Waste Ind 75.00 5.459 1.611 0.247 0.096 0.028 0.0044 Haul Quarry to Waste Ind 75.00 4.159 1.228 0.188 2.847 0.840 0.1295 Loader Ind 75.00 5.112 1.509 0.231 1.449 0.428 0.066
12 0 0 0.00 0.000 0.000 0.000 0.000 0.000 0.000TOTAL 75.03 4.502 1.283 0.197
TOTAL 63.121 17.990 2.758
Process Number
EMISSIONS
Industrial Roads
Public Road
Throughput
Road Type
Emissions (tpy)Emission Factor - Controlled (pounds/vmt)Road TypeVehicle Type
WaterVehicle Type Efficiency percentage (%) of Dust Control Methods
Fractionation ValueEmission Factors Uncontrolled (pounds / vmt)
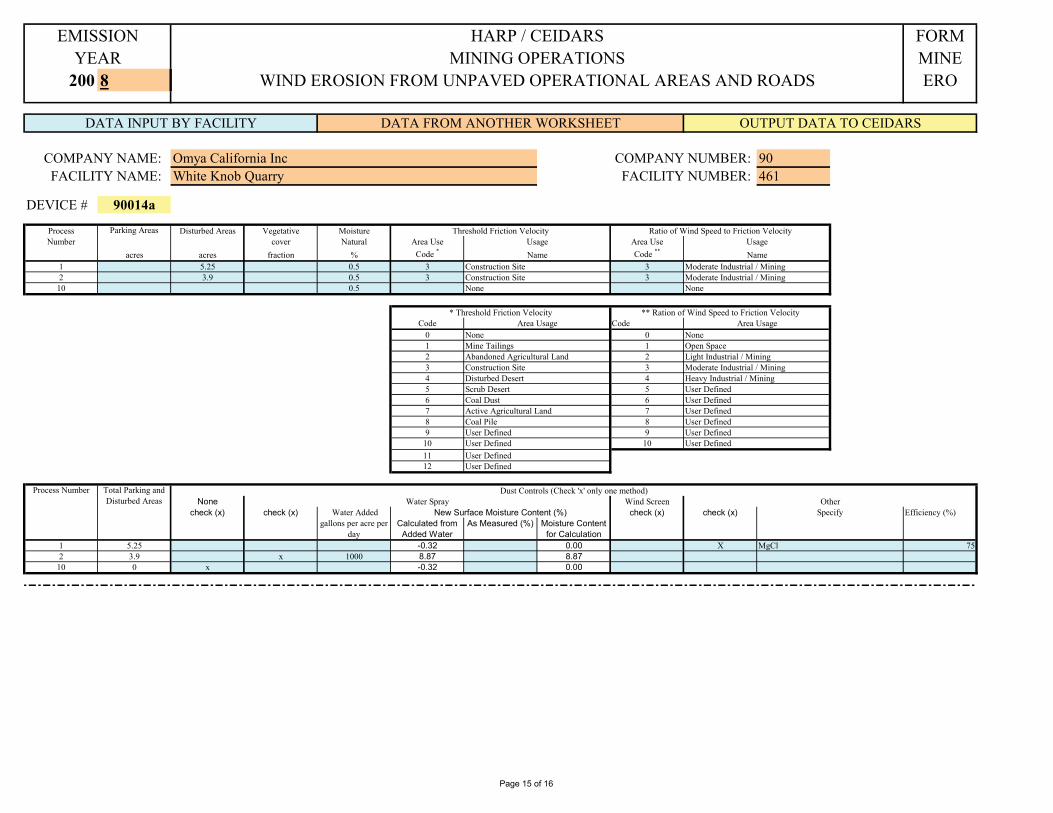
Page 15 of 16
FORMMINE
200 8 ERO
90461
DEVICE # 90014a
Process Disturbed Areas Vegetative MoistureNumber cover Natural Area Use Area Use
acres acres fraction % Code * Code **
1 5.25 0.5 3 32 3.9 0.5 3 3
10 0.5
Code Code0 01 12 23 34 45 56 67 78 89 9
10 101112
None Wind Screencheck (x) check (x) Water Added check (x) check (x) Efficiency (%)
gallons per acre per day
Calculated from Added Water
As Measured (%) Moisture Content for Calculation
1 5.25 -0.32 0.00 X 752 3.9 x 1000 8.87 8.87
10 0 x -0.32 0.00
Parking Areas
Process Number
SpecifyOther
Dust Controls (Check 'x' only one method)
** Ration of Wind Speed to Friction Velocity
NoneOpen SpaceLight Industrial / Mining
Total Parking and Disturbed Areas
Construction SiteDisturbed Desert
User Defined
MgCl
DATA INPUT BY FACILITY DATA FROM ANOTHER WORKSHEET OUTPUT DATA TO CEIDARS
FACILITY NAME: White Knob Quarry FACILITY NUMBER: COMPANY NAME: Omya California Inc COMPANY NUMBER:
Threshold Friction Velocity Ratio of Wind Speed to Friction VelocityUsage Usage
EMISSION HARP / CEIDARSYEAR MINING OPERATIONS
WIND EROSION FROM UNPAVED OPERATIONAL AREAS AND ROADS
Construction Site Moderate Industrial / Mining
Name NameConstruction Site Moderate Industrial / Mining
NoneArea Usage
Mine TailingsAbandoned Agricultural Land
User DefinedScrub DesertCoal Dust
User Defined
None None
Moderate Industrial / MiningHeavy Industrial / Mining
Area Usage* Threshold Friction Velocity
User DefinedUser DefinedUser DefinedUser Defined
User DefinedActive Agricultural LandCoal Pile
User Defined
User Defined
Water SprayNew Surface Moisture Content (%)

Page 16 of 16
FORMMINE
200 8 ERO
EMISSION HARP / CEIDARSYEAR MINING OPERATIONS
WIND EROSION FROM UNPAVED OPERATIONAL AREAS AND ROADS
DEVICE # 90014a
Emission Factor - pounds per acreEmFac = 2.814 * k *(1 - v) * (u / ut)^3 * C(x)*2000
k = Aerodynamic Factor for Particulate Size Aerodynamic Factor x = ut/uv = Amount of Vegetative cover as a Fraction TSP = 1.0u = Mean Wind Speed in Meters per Second (m/s) PM10 = 0.5ut = Threshold Value of Wind Speed (m/s) PM2.5 = 0.2
C(x) = Correction FactorThreshold Value of Wind Speed - ut
ut = u*t * u*
ProcessNumber Threshold Ratio Threshold Correction
Friction Velocity Wind Speed Factor TSP PM10 PM2.5
u*t u* ut x C(x)Acres Acres m/s m/s pounds/acre pounds/acre pounds/acre
1 0 5.25 0.26 6.5 1.69 0.44 1.90 90,332.145 45,166.072 18,066.4292 0 3.9 0.26 6.5 1.69 0.44 1.90 90,332.145 45,166.072 18,066.429
10 0 0 0 0 0 0.00 0.00 0.000 0.000 0.000INPUTS 9.15 90,332.145 45,166.072 18,066.429
Number of Devices 0
Process Total Parking and Disturbed Areas
Number Acres PM10 PM2.5
1 5.25 0.5 0.22 3.9 0.5 0.2
10 0 0 0INPUTS 0.5 0.2
ProcessTotal Parking and Disturbed Areas
Number Acres Type Efficiency (%) TSP PM10 PM2.5 TSP PM10 PM2.5
1 5.25 MgCl 75.0 22,583.036 11,291.518 4,516.607 59.280 29.640 11.8562 3.9 Water Spray 95.0 4,516.607 2,258.304 903.321 8.807 4.404 1.761
10 0 None 0.0 0.000 0.000 0.000 0.000 0.000 0.000INPUTS 83.52 14,882.591 7,441.296 2,976.518
TOTAL 68.088 34.044 13.618
Disturbed Area Emission FactorsParking Areas
Fractionation Value
Controls Emission Factor - Controlled (pounds/acre)
Throughput Emission Factor
EMISSIONS
Emissions (tpy) = Area * EmFac

MAXAVG - ALL
YEARSAVG -
2004,2005,2USDT 2002 2003 2004 2005 2006 2007 2008 2009 2010 2011Sentinel 325,951 377,760 386,835 467,520 309,880 237,946 189,453 154,967 280,363 210,316 467,520 294,099 388,078 Butterfield - - - 41,701 128,948 97,601 80,575 50,018 47,628 48,972 128,948 49,544 56,883 White Kno 261,244 274,193 309,168 311,999 350,895 212,999 190,274 52,758 228,414 144,075 350,895 233,602 324,021
USDT 2002 2003 2004 2005 2006 2007 2008 2009 2010 2011Sentinel 277,058 321,096 328,810 397,392 263,398 202,254 161,035 131,722 238,309 178,768 397,392 249,984 329,867 Butterfield - - - 35,446 109,606 82,961 68,489 42,515 40,483 41,627 109,606 42,113 48,351 White Kno 222,057 233,064 262,793 265,199 298,261 181,049 161,733 44,844 194,152 122,463 298,261 198,562 275,418
USDT 2002 2003 2004 2005 2006 2007 2008 2009 2010 2011Sentinel 178,260 171,504 204,702 184,440 207,780 203,074 165,940 109,181 305,832 782,285 782,285 251,300 198,974 Butterfield - - - 59,376 81,624 185,546 34,820 15,256 85,687 116,028 185,546 57,834 47,000 White Kno 164,666 159,728 151,860 281,698 130,590 169,776 61,020 1,250 85,766 103,348 281,698 130,970 188,049
Ore to Primary Crusher
Ore Hauled to Plant
Waste

j:\accounting\california\ca 2002\fuel\diesel2004
DIESEL DISTRIBUTION includes Amboy BEGINNING 88372.0RECEIVED 45932.0
YEAR: 2004 CALCULATEDGALLONS
ENDING READING 100414.0 includes Sentinel fuel tank andMONTH: December
GALLONS USED - MONTH 33890.0 MONTH 24354.0
PAGE 1 OF 2 GALLONS USED - Y.T.D. 510602.0 Y.T.D. 374701.7
MONTH GALLONS Y.T.D.UNLOADED GALLONS MONTH PER GALLONS Y.T.D.
EQUIP # YEAR MFG DESCRIPTION WEIGHT/TON USED HOURS HOUR USED HOURS205300 1978 GROVE CRANE 25.00 2.7 1.0 2.7 124.2 46.0208252 1987 CAT FORKLIFT 5.50 0.0 0.0 0.6 54.6 91.0213400 1990 CHAMP FORKLIFT 8.00 18.0 9.0 2.0 210.0 105.0293413 1984 I.H. ROAD SWEEPER 0.0 0.6 0.6 1.0298600 1992 CAT 966F LOADER 22.00 118.4 16.0 7.4 1916.6 259.0293301 1988 BOBCAT 2.00 0.0 0.6 0.0 0.0299000 DUMP TRUCK 65.0 13.0 5.0 687.5 137.5330200 1985 CAT 992C LOADER 100.00 1098.0 45.0 24.4 13517.6 554.0330500 1987 CAT 992C LOADER 512.4 21.0 24.4 14932.8 612.0330600 BOBCAT 6.0 10.0 0.6 66.0 110.0330700 BOBCAT 3.0 5.0 0.6 30.6 51.0330800 CAT 992C CAT LOADER 39.0 65.0 0.6 383.4 639.0330900 TEREX 94 TON HAUL TRUCK 0.6 1.0 0.6 831.6 1386.0331200 CAT 988 LOADER 0.0 24.4 24.4 1.0332102 1970 KENWORTH GREASE TRUCK 20.00 5.0 1.0 5.0 158.5 31.7332132 1988 LUBE VAN 20.00 105.0 21.0 5.0 1600.0 320.0332136 1974 FUEL TRUCK 35.0 7.0 5.0 325.0 65.0333018 TD 25 DOZER 0.0 0.0 10.7 246.1 23.0333046 1989 CAT 992C LOADER 100.00 2293.6 94.0 24.4 33964.8 1392.0333053 1983 PAYHAULER 350B TRUCK 36.00 823.2 98.0 8.4 3956.4 471.0333060 1987 CAT 992C LOADER 100.00 2537.6 104.0 24.4 31720.0 1300.0333062 1990 CAT D9N DOZER 46.00 25.0 2.0 12.5 2725.0 218.0333064 EXCAVATOR 46.00 73.0 10.0 7.3 1905.3 261.0333091 1985 PAYHAULER 350B TRUCK 36.00 966.0 115.0 8.4 7593.6 904.0333098 1985 PAYHAULER 350B TRUCK 36.00 268.8 32.0 8.4 3511.2 418.0333251 1983 TEREX 85 TON TRUCK 70.00 1646.4 98.0 16.8 39765.6 2367.0333252 1984 TEREX 85 TON TRUCK 70.00 2990.4 178.0 16.8 44788.8 2666.0333257 TEREX 1797.6 107.0 16.8 8541.2 510.8333254 1986 TEREX 85 TON TRUCK 70.00 2284.8 136.0 16.8 34591.2 2059.0333255 1987 TEREX 85 TON TRUCK 70.00 772.8 46.0 16.8 39597.6 2357.0333256 1991 TEREX 85 TON TRUCK 70.00 3024.0 180.0 16.8 22411.2 1334.0333410 1978 GRADER 16.00 144.0 24.0 6.0 3450.0 575.0333411 1978 PAYHAULER WATER TRUCK 50.00 25.2 3.0 8.4 4006.8 477.0

DIESEL
YEAR: 2004MONTH: December
PAGE 2 OF 2
MONTH GALLONS Y.T.D.UNLOADED GALLONS MONTH PER GALLONS Y.T.D.
EQUIP # YEAR MFG DESCRIPTION WEIGHT/TON USED HOURS HOUR USED HOURS825700 1991 CAT FORKLIFT 5.50 0.0 0.0 0.6 75.6 126.0825400 1992 CAT FORKLIFT 5.50 5.4 9.0 0.6 77.4 129.0825900 1993 CAT FORKLIFT 5.50 0.0 0.0 0.6 0.0 0.0826000 1993 AMERICAN LINC SWEEPER 0.6 1.0 0.6 40.2 67.0826100 1994 CAT FORKLIFT 5.50 0.0 0.0 0.6 146.4 244.0826300 1995 BAKER FORKLIFT 14.4 24.0 0.6 390.0 650.0826400 1995 BAKER FORKLIFT 3.6 6.0 0.6 124.2 207.0826500 1997 BAKER FORKLIFT 97.2 162.0 0.6 1008.6 1681.0826600 1998 BAKER FORKLIFT 0.0 0.0 0.6 225.6 376.0826700 1999 BAKER FORKLIFT 66.0 110.0 0.6 1445.4 2409.0826800 2000 BAKER FORKLIFT 155.4 259.0 0.6 1773.0 2955.0826900 2001 LINDE H300-03 FORKLIFT 164.4 274.0 0.6 2347.8 3913.0827000 2003 LINDE H300-351 FORKLIFT 201.0 335.0 0.6 2999.3 4998.9827100 2003 TENANT SWEEPER 0.0 15.0 0.6 36.0 201.0827200 2004 BAKER FORKLIFT 0.0 180.0 0.6 0.0 1387.06100 1102 WHITE KNOB GEN SET 1438.5 137.0 10.5 5071.5 1887.06160 AMBOY 0.0 0.0 0.0 0.0
0.0 0.0 0.0 0.00.0 0.0 0.0 0.0
DONNER 527.0 0.0 22736.9 0.024354.0
PRICEGALLONS USED PER GAL ENTRY $'s
6100 2300 PLANT MAINT 2.7 1.6324 4.416100 1700 HEAVY EQUPMENT MAINT 18.0 1.6324 29.386100 0400 PLANT ADMIN 183.4 1.6324 299.396100 1600 HEAVY EQUPMENT 21476.4 1.6324 35058.50DONNER 527.0 1.6324 860.29PROFIT 1.6324 129.04
0.0 1.6324 0.001.6324 0.00
0.0 1.6324 0.001.6324 0.00
0.0 1.6324 0.006100 1102 WHITE KNOB GEN SET 1438.5 1.6324 2348.246160 AMBOY 0.0 1.6324 0.006100 5511 PACKAGING 708.0 1.6324 1155.75
24354.0 1.6324 39755.96
DONNERBegin End Used
PUMP 1(NO TENTHS) 206714.0 206714.0 0.0PUMP 2 26001.2 26528.2 527.0QUARRY 583715.0 583715.0 0.0
527.0

j:\accounting\california\ca 2002\fuel\diesel2004
DIESEL DISTRIBUTION includes Amboy BEGINNING 144365.0RECEIVED 77063.0
YEAR: 2005 CALCULATEDGALLONS
ENDING READING 160167.0 includes Sentinel fuel tank andMONTH: December
GALLONS USED - MONTH 61261.0 MONTH 50467.8
PAGE 1 OF 2 GALLONS USED - Y.T.D. 614022.0 Y.T.D. 492845.6
MONTH GALLONS Y.T.D.UNLOADED GALLONS MONTH PER GALLONS Y.T.D.
EQUIP # YEAR MFG DESCRIPTION WEIGHT/TON USED HOURS HOUR USED HOURS205300 1978 GROVE CRANE 25.00 8.1 3.0 2.7 148.5 55.0208252 1987 CAT FORKLIFT 5.50 0.6 1.0 0.6 74.4 124.0213400 1990 CHAMP FORKLIFT 8.00 10.0 5.0 2.0 110.0 55.0293413 1984 I.H. ROAD SWEEPER 0.0 0.6 0.0 0.0298600 1992 CAT 966F LOADER 22.00 96.2 13.0 7.4 2057.2 278.0293301 1988 BOBCAT 2.00 0.0 1.5 0.0 0.0299000 1989 PETERBILT DUMP TRUCK 300.0 60.0 5.0 3613.5 731.7330100 CAT 988B LOADER 0.0 0.0 24.4 0.0 0.0330200 1985 CAT 992C LOADER 100.00 2171.6 89.0 24.4 21228.0 870.0330500 1987 CAT 992C LOADER 1756.8 72.0 24.4 17446.0 715.0330600 BOBCAT 6.0 4.0 1.5 111.3 109.0330700 BOBCAT 18.0 12.0 1.5 97.8 82.0330800 CAT 992C CAT LOADER 2342.4 96.0 24.4 9806.2 834.0330900 TEREX 94 TON TRUCK 0.0 16.8 10403.4 1220.0331200 CAT 988 LOADER 0.0 24.4 170.8 7.0332102 1970 KENWORTH GREASE TRUCK 20.00 10.0 2.0 5.0 135.0 27.0332132 1988 LUBE VAN 20.00 105.0 21.0 5.0 1650.0 330.0332136 1974 FUEL TRUCK 35.0 7.0 5.0 540.0 108.0333018 TD 25 DOZER 0.0 10.7 149.8 14.0333046 1989 CAT 992C LOADER 100.00 2440.0 100.0 24.4 35380.0 1450.0333053 1983 PAYHAULER 350B TRUCK 36.00 848.4 101.0 8.4 9433.2 1123.0333060 1987 CAT 992C LOADER 100.00 3123.2 128.0 24.4 33501.2 1373.0333062 1990 CAT D9N DOZER 46.00 0.0 12.5 825.0 66.0333064 EXCAVATOR 46.00 591.3 81.0 7.3 2496.6 342.0333091 1985 PAYHAULER 350B TRUCK 36.00 1050.0 125.0 8.4 9962.4 1186.0333098 1985 PAYHAULER 350B TRUCK 36.00 940.8 112.0 8.4 8929.2 1063.0333251 1983 TEREX 85 TON TRUCK 70.00 2805.6 167.0 16.8 41529.6 2472.0333252 1984 TEREX 85 TON TRUCK 70.00 3931.2 234.0 16.8 48955.2 2914.0333254 1986 TEREX 85 TON TRUCK 70.00 5275.2 314.0 16.8 47661.6 2837.0333255 1987 TEREX 85 TON TRUCK 70.00 5460.0 325.0 16.8 55120.8 3281.0333256 1991 TEREX 85 TON TRUCK 70.00 4468.8 266.0 16.8 28812.0 1715.0333257 2002 TEREX 70 TON TRUCK 1041.6 62.0 16.8 10567.2 629.0333410 1978 GRADER 16.00 120.0 20.0 6.0 4350.0 725.0333411 1978 PAYHAULER WATER TRUCK 50.00 319.2 38.0 8.4 5040.0 600.0

DIESEL
YEAR: 2005MONTH: December
PAGE 2 OF 2
MONTH GALLONS Y.T.D.UNLOADED GALLONS MONTH PER GALLONS Y.T.D.
EQUIP # YEAR MFG DESCRIPTION WEIGHT/TON USED HOURS HOUR USED HOURS825700 1991 CAT FORKLIFT 5.50 0.0 0.0 0.6 0.0 0.0825400 1992 CAT FORKLIFT 5.50 0.0 0.0 0.6 43.8 73.0825900 1993 CAT FORKLIFT 5.50 0.0 0.0 0.6 0.0 0.0826000 1993 AMERICAN LINC SWEEPER 0.6 1.0 0.6 3.6 6.0826100 1994 CAT FORKLIFT 5.50 0.0 0.0 0.6 9.0 15.0826300 1995 BAKER FORKLIFT 21.6 36.0 0.6 210.6 351.0826400 1995 BAKER FORKLIFT 21.6 36.0 0.6 145.2 242.0826500 1997 BAKER FORKLIFT 12.6 21.0 0.6 802.2 1337.0826600 1998 BAKER FORKLIFT 19.2 32.0 0.6 606.0 1010.0826700 1999 BAKER FORKLIFT 62.4 104.0 0.6 1009.8 1683.0826800 2000 BAKER FORKLIFT 105.0 175.0 0.6 1367.4 2279.0826900 2001 LINDE H300-03 FORKLIFT 206.4 344.0 0.6 1976.4 3294.0827000 2003 LINDE H300-351 FORKLIFT 211.8 353.0 0.6 2482.8 4138.0827100 2003 TENANT SWEEPER 0.0 8.0 0.6 91.2 911.0827200 2004 BAKER FORKLIFT 0.0 188.0 0.6 667.2 2192.06100 1102 WHITE KNOB GEN SET 2110.5 201.0 10.5 4935.0 470.06160 AMBOY 0.0 0.0 0.0 0.0
0.0 0.0 0.0 0.00.0 0.0 19285.5 0.0
DONNER 8421.1 0.0 32585.2 0.050467.8
PRICEGALLONS USED PER GAL ENTRY $'s
6100 2300 PLANT MAINT 8.7 2.1893 19.056100 1700 HEAVY EQUPMENT MAINT 10.0 2.1893 21.896100 0400 PLANT ADMIN 396.2 2.1893 867.406100 1600 HEAVY EQUPMENT 38860.1 2.1893 85076.03DONNER 8421.1 2.1893 18436.23PROFIT 2.1893 2765.43
0.0 2.1893 0.002.1893 0.00
0.0 2.1893 0.002.1893 0.00
0.0 2.1893 0.006100 1102 WHITE KNOB GEN SET 2110.5 2.1893 4620.506160 AMBOY 0.0 2.1893 0.006100 5511 PACKAGING 661.2 2.1893 1447.56
50467.8 2.1893 110488.65
DONNERBegin End Used
PUMP 1(NO TENTHS) 206714.0 206714.0 0.0PUMP 2 30505.3 31423.4 918.1QUARRY 602250.0 609753.0 7503.0
8421.1

j:\accounting\california\ca 2002\fuel\diesel2006
DIESEL DISTRIBUTION includes Amboy BEGINNING 133657.0RECEIVED 80161.0
YEAR: 2006 CALCULATEDGALLONS
ENDING READING 155505.0 includes Sentinel fuel tank andMONTH: December
GALLONS USED - MONTH 58313.0 MONTH 37326.2
PAGE 1 OF 2 GALLONS USED - Y.T.D. 621145.0 Y.T.D. 533724.4
MONTH GALLONS Y.T.D.UNLOADED GALLONS MONTH PER GALLONS Y.T.D.
EQUIP # YEAR MFG DESCRIPTION WEIGHT/TON USED HOURS HOUR USED HOURS205300 1978 GROVE CRANE 25.00 0.0 2.7 0.0 0.0207500 2000 SKYTRAK 10042 LIFTALL 0.0 6.0 522.0 87.0213400 1990 CHAMP FORKLIFT 8.00 8.0 4.0 2.0 156.0 78.0293413 1984 I.H. ROAD SWEEPER 0.0 0.6 0.0 0.0298600 1992 CAT 966F LOADER 22.00 74.0 10.0 7.4 1768.6 239.0299000 1989 PETERBILT DUMP TRUCK 90.0 18.0 5.0 2055.0 785.1299100 2002 BOBCAT BOBCAT 0.0 1.5 25.5 17.0330100 1986 CAT 988B LOADER 97.6 4.0 24.4 3196.4 771.1330200 1985 CAT 992C LOADER 100.00 2244.8 92.0 24.4 24351.2 219.0330500 1987 CAT 992C LOADER 2586.4 106.0 24.4 19422.4 1012.0330600 1984 BOBCAT BOBCAT 40.5 27.0 1.5 268.8 717.0330700 1984 BOBCAT BOBCAT 36.0 24.0 1.5 261.0 181.0330800 1985 CAT 992C CAT LOADER 2147.2 88.0 24.4 35454.8 241.0330900 1997 TEREX 94 TON HAUL TRUCK 1764.0 105.0 16.8 22008.0 1552.0332102 1970 KENWORTH GREASE TRUCK 20.00 0.0 0.0 5.0 125.0 1205.0332132 1988 AUTOCAR LUBE VAN 20.00 65.0 13.0 5.0 995.0 38.0332136 1974 WHITE FUEL TRUCK 35.0 7.0 5.0 410.0 193.0333018 1978 INTERNATIONAL TD 25 DOZER 0.0 0.0 10.7 331.7 75.0333046 1989 CAT 992C LOADER 100.00 1122.4 46.0 24.4 29890.0 77.0333053 1983 PAYHAULER 350B TRUCK 36.00 58.8 7.0 8.4 5014.8 1186.0333060 1987 CAT 992C LOADER 100.00 2391.2 98.0 24.4 27010.8 688.0333062 1990 CAT D9N DOZER 46.00 0.0 0.0 12.5 375.0 1009.0333064 1990 CAT EXCAVATOR 46.00 36.5 5.0 7.3 2029.4 35.0333091 1985 PAYHAULER 350B TRUCK 36.00 134.4 16.0 8.4 8265.6 289.0333098 1985 PAYHAULER 350B TRUCK 36.00 109.2 13.0 8.4 5359.2 981.0333251 1983 TEREX 85 TON TRUCK 70.00 3511.2 209.0 16.8 40908.0 834.0333252 1984 TEREX 85 TON TRUCK 70.00 705.6 42.0 16.8 41428.8 2268.0333254 1986 TEREX 85 TON TRUCK 70.00 2671.2 159.0 16.8 39984.0 2583.0333255 1987 TEREX 85 TON TRUCK 70.00 2990.4 178.0 16.8 42823.2 2399.0333256 1991 TEREX 85 TON TRUCK 70.00 4300.8 256.0 16.8 46502.4 2627.0333257 2002 TEREX 70 TON TRUCK 940.8 56.0 16.8 19202.4 2568.0333410 1978 CAT GRADER 16.00 276.0 46.0 6.0 3222.0 1133.0333411 1978 PAYHAULER WATER TRUCK 50.00 680.4 81.0 8.4 6207.6 572.0
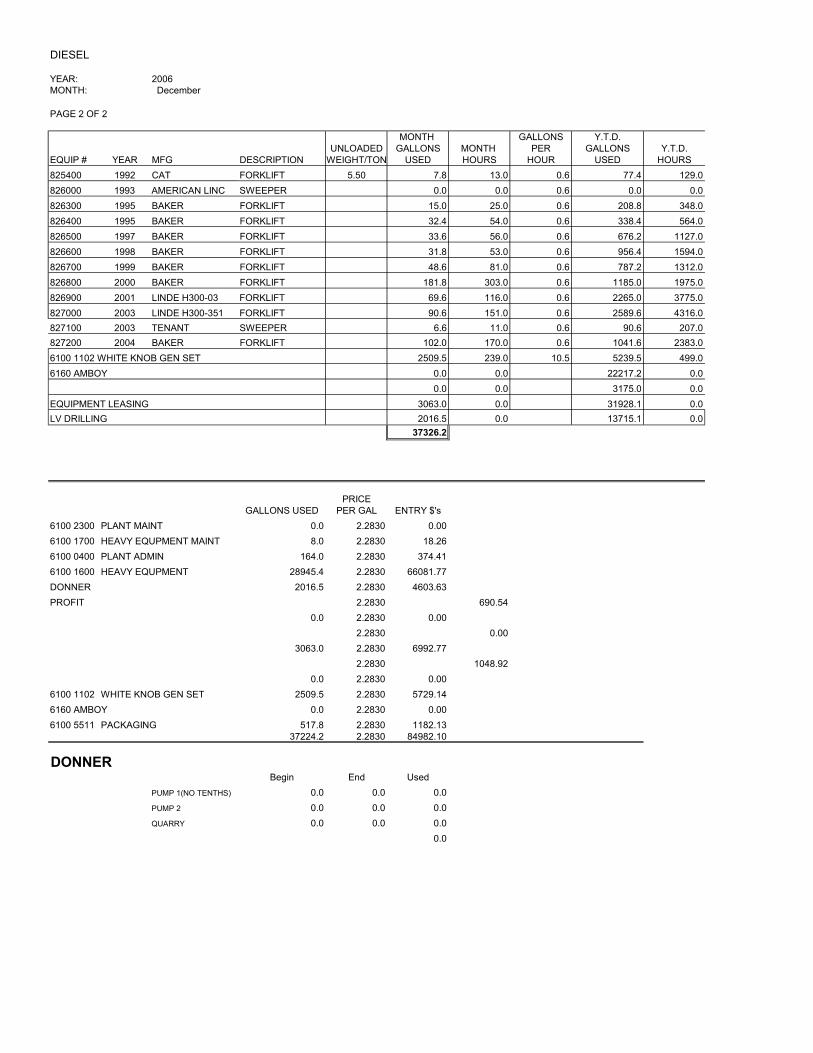
DIESEL
YEAR: 2006MONTH: December
PAGE 2 OF 2
MONTH GALLONS Y.T.D.UNLOADED GALLONS MONTH PER GALLONS Y.T.D.
EQUIP # YEAR MFG DESCRIPTION WEIGHT/TON USED HOURS HOUR USED HOURS825400 1992 CAT FORKLIFT 5.50 7.8 13.0 0.6 77.4 129.0826000 1993 AMERICAN LINC SWEEPER 0.0 0.0 0.6 0.0 0.0826300 1995 BAKER FORKLIFT 15.0 25.0 0.6 208.8 348.0826400 1995 BAKER FORKLIFT 32.4 54.0 0.6 338.4 564.0826500 1997 BAKER FORKLIFT 33.6 56.0 0.6 676.2 1127.0826600 1998 BAKER FORKLIFT 31.8 53.0 0.6 956.4 1594.0826700 1999 BAKER FORKLIFT 48.6 81.0 0.6 787.2 1312.0826800 2000 BAKER FORKLIFT 181.8 303.0 0.6 1185.0 1975.0826900 2001 LINDE H300-03 FORKLIFT 69.6 116.0 0.6 2265.0 3775.0827000 2003 LINDE H300-351 FORKLIFT 90.6 151.0 0.6 2589.6 4316.0827100 2003 TENANT SWEEPER 6.6 11.0 0.6 90.6 207.0827200 2004 BAKER FORKLIFT 102.0 170.0 0.6 1041.6 2383.06100 1102 WHITE KNOB GEN SET 2509.5 239.0 10.5 5239.5 499.06160 AMBOY 0.0 0.0 22217.2 0.0
0.0 0.0 3175.0 0.0EQUIPMENT LEASING 3063.0 0.0 31928.1 0.0LV DRILLING 2016.5 0.0 13715.1 0.0
37326.2
PRICEGALLONS USED PER GAL ENTRY $'s
6100 2300 PLANT MAINT 0.0 2.2830 0.006100 1700 HEAVY EQUPMENT MAINT 8.0 2.2830 18.266100 0400 PLANT ADMIN 164.0 2.2830 374.416100 1600 HEAVY EQUPMENT 28945.4 2.2830 66081.77DONNER 2016.5 2.2830 4603.63PROFIT 2.2830 690.54
0.0 2.2830 0.002.2830 0.00
3063.0 2.2830 6992.772.2830 1048.92
0.0 2.2830 0.006100 1102 WHITE KNOB GEN SET 2509.5 2.2830 5729.146160 AMBOY 0.0 2.2830 0.006100 5511 PACKAGING 517.8 2.2830 1182.13
37224.2 2.2830 84982.10
DONNERBegin End Used
PUMP 1(NO TENTHS) 0.0 0.0 0.0PUMP 2 0.0 0.0 0.0QUARRY 0.0 0.0 0.0
0.0

EINVeh serial
numYour veh
numEng serial
num
Eng Manufact
urer
Eng Model
Eng Family
Eng MY Eng HP Eng TierDisplace
ment (liters)
Date Purchase
Date Installed
(Repowered)Date Sold
On/Off-road
engine
Non-diesel engine
Certified to a
different standard
EINVeh serial
numYour veh
numEng serial
num
Eng Manufact
urer
Eng Model
Eng Family
Eng MY Eng HP Eng TierDisplace
ment (liters)
Date Purchase
Date Installed
(Repowered)Date Sold
On/Off-road
engine
Non-diesel engine
Certified to a
different standard
T0 10.5 1/1/1995 1/1/1995 off08Z57759CATERPILLAR, INC.
3306 274NA026 1995 195TS6F56 5AF01016 3464
1/1/1995 1/1/1995 off3412 274NA030 1995 690 T0 27
27 1/1/1994 1/1/1994 off
BC6W93 49Z1405 334673W10267
CATERPILLAR, INC.
T073W16485
CATERPILLAR, INC.
3412 274NA029 1994 690KP3K99 49Z00973 3360
1/1/1992 off274NA011 274NA011 1992 52 T0 200XV5P45 5BC1382 8254 274NA011
PERKINS ENGINES COMPANY LTD.
T0 10.5 1/1/1992 1/1/1992 off08Z64168CATERPILLAR, INC.
3306B 274NA033 1992 235
1/1/1992
CC5P99 4YG00650 3303
1/1/1992 1/1/1992 offVT1710 274NA024 1992 635 T0 28
38 1/1/1991 1/1/1991 off
LL4Y77 105N 3291 10729894CUMMINS ENGINE CO., INC.
T037206355CUMMINS ENGINE CO., INC.
KT38C 274NA025 1991 1050XL3E34T-3851060
3209
1/1/1990 off3408 274NA027 1990 370 T0 18CR6E85 1JD02200 346248W30034
CATERPILLAR, INC.
T0 28 1/1/1990 1/1/1990 off37103885CUMMINS ENGINE CO., INC.
VT1710 274NA023 1990 635
1/1/1990
FN3U54 026N 3298
1/1/1989 1/1/1989 off3406C 274NA039 1989 425 T0 14.6
14.6 1/1/1988 1/1/1988 off
PB8T391XP5LB9X4K0283070
2290 7XC11192CATERPILLAR, INC.
T04MG1811CATERPILLAR, INC.
3406B 274NA037 1988 322RF7T38 501101 2232
1/1/1987 off3406 274NA015 1987 275 T0 14.6YB8P58 93U1347 3410 93U01904CATERPILLAR, INC.
T0 18 1/1/1985 1/1/1985 offBFF00423CATERPILLAR, INC.
3408DITA 274NA035 1985 375
1/1/1987
SJ9B9750W11381
3301
1/1/1985 1/1/1985 off3306B 274NA038 1985 215 T0 10.5
27 1/1/1985 1/1/1985 off
CY3E87 115049 2202 274NA038CATERPILLAR, INC.
T073W17225
CATERPILLAR, INC.
3412 274NA031 1985 690NX9N35 49Z01382 3308

EINVeh serial
numYour veh
numEng serial
num
Eng Manufact
urer
Eng Model
Eng Family
Eng MY Eng HP Eng TierDisplace
ment (liters)
Date Purchase
Date Installed
(Repowered)Date Sold
On/Off-road
engine
Non-diesel engine
Certified to a
different standard
T2 200 1/1/2004 1/1/2004 off5.31E+09
DETROIT DIESEL CORPORATION
8V2000 274NA019 2004 635HM9D53 040N 3253
1/1/2004 1/1/2004 off3412 LE 274NA034 2004 690 T2 27
30 1/1/2004 1/1/2004 off
JU3C84 49Z00783 330280M05545
CATERPILLAR, INC.
T137214062CUMMINS ENGINE CO., INC.
QST30 274NA017 2004 1050MX9J35 73177 3255
1/1/2003 offV1505 274NA041 2003 52 T1 1.5GC4L77 21103 5171 356007KUBOTA CORPORATION
T1 2.7 1/1/2003 1/1/2003 offU178812K
PERKINS ENGINES COMPANY LTD.
CP811493PKXL02.7CP1
2003 52
1/1/2003
RD4U73H2X351P01199
8270
1/1/2002 1/1/2002 offQST30YCEXL030.AAA
2002 1050 T1 30
12 1/1/2001 1/1/2001 off
WX6V89 72473 3252 37203442CUMMINS ENGINE CO., INC.
T22KS51137CATERPILLAR, INC.
C-12 274NA041 2001 322XD9V771HTGLAXT51H-338849
2271
1/1/2001 off903 CP80820 2001 47 T1 2.79HL7F58H2X351L0061930
8269 U178812K
PERKINS ENGINES COMPANY LTD.
T1 24 1/1/2000 1/1/2000 off535EL0100200
DETROIT DIESEL CORPORATION
12V2000 274NA013 2000 760
1/1/2001
UM7G58 T7891011 3257
1/1/2000 1/1/2000 offCP81149XPKXL02.7CP1
2000 52 T1 2.7
34.5 1/1/2000 1/1/2000 off
JF6Y78H2X351L0187830
8268 U344163R
PERKINS ENGINES COMPANY LTD.
T12GR02704CATERPILLAR, INC.
3508 274NA022 2000 938NT4W68 AGC00349 3216
1/1/1997 offQST30 274NA016 1997 1050 T0 30GM5E67 T3851027 3256 37157403CUMMINS ENGINE CO., INC.
1/1/1997

0000-00-00 offM11-370LRCE661EJDARW
1994 370 T0 10.8
Rebuild
YV9J851NKDL99X1SS655352
2237 34741843CUMMINS ENGINE CO., INC.
T3 19 1/1/2006 1/1/2006 off37110873CUMMINS ENGINE CO., INC.
QSK 19 274NA014 2006 635
12/27/2007
LX5G75 N5531 3211
1/1/2005 1/1/2005 offQST30 274NA018 2005 1050 T1 30
27 1/1/2004 1/1/2004 off
CH9K94 73176 3254 37214605CUMMINS ENGINE CO., INC.
T280M05725
CATERPILLAR, INC.
3412 LE 274NA032 2004 690SK8E79 49Z00901 3305
1/1/2004 offBEU 274NA002 2004 57 T2 1.89FX9A66H2X393R02493
8272BEU006123
VOLKSWAGEN OF AMERICA, INC.
1/1/2004
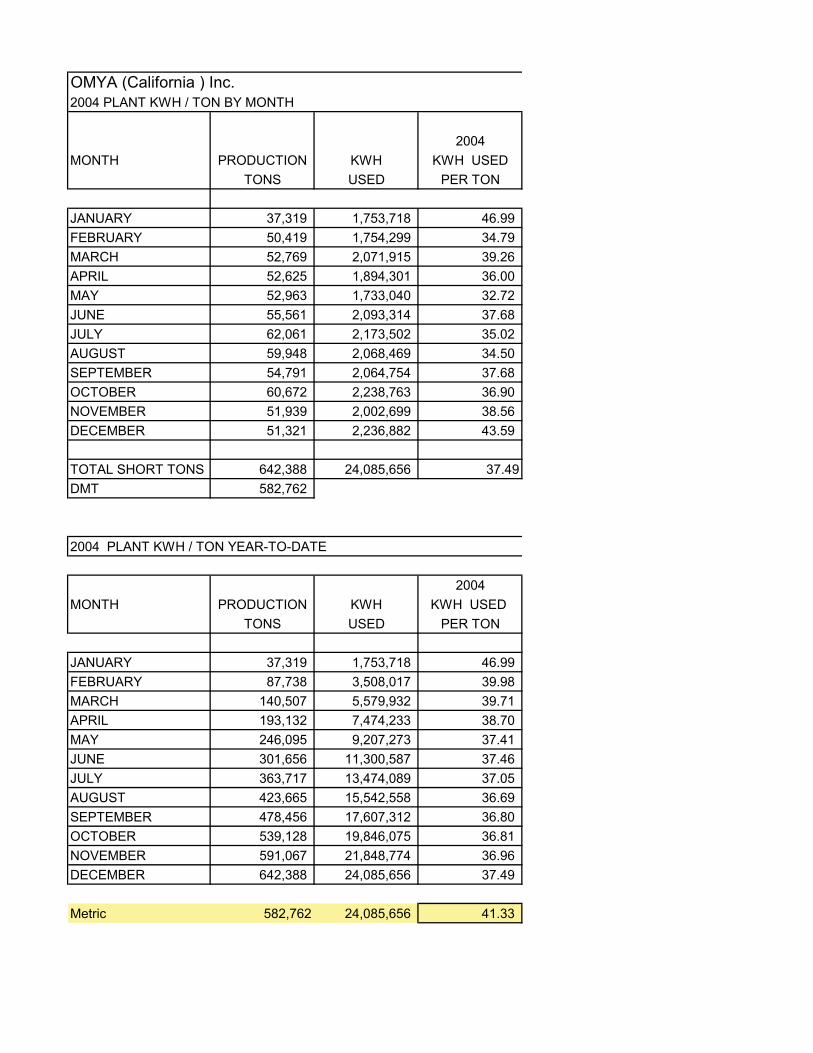
OMYA (California ) Inc.2004 PLANT KWH / TON BY MONTH
2004MONTH PRODUCTION KWH KWH USED
TONS USED PER TON
JANUARY 37,319 1,753,718 46.99FEBRUARY 50,419 1,754,299 34.79MARCH 52,769 2,071,915 39.26APRIL 52,625 1,894,301 36.00MAY 52,963 1,733,040 32.72JUNE 55,561 2,093,314 37.68JULY 62,061 2,173,502 35.02AUGUST 59,948 2,068,469 34.50SEPTEMBER 54,791 2,064,754 37.68OCTOBER 60,672 2,238,763 36.90NOVEMBER 51,939 2,002,699 38.56DECEMBER 51,321 2,236,882 43.59
TOTAL SHORT TONS 642,388 24,085,656 37.49DMT 582,762
2004 PLANT KWH / TON YEAR-TO-DATE
2004MONTH PRODUCTION KWH KWH USED
TONS USED PER TON
JANUARY 37,319 1,753,718 46.99FEBRUARY 87,738 3,508,017 39.98MARCH 140,507 5,579,932 39.71APRIL 193,132 7,474,233 38.70MAY 246,095 9,207,273 37.41JUNE 301,656 11,300,587 37.46JULY 363,717 13,474,089 37.05AUGUST 423,665 15,542,558 36.69SEPTEMBER 478,456 17,607,312 36.80OCTOBER 539,128 19,846,075 36.81NOVEMBER 591,067 21,848,774 36.96DECEMBER 642,388 24,085,656 37.49
Metric 582,762 24,085,656 41.33

Omya California Inc.2005 PLANT KWH / TON BY MONTH
2005MONTH PRODUCTION KWH KWH USED
SHORT TONS USED PER TON
JANUARY 49,451 1,894,003 38.30FEBRUARY 49,757 1,987,080 39.94MARCH 59,403 2,303,741 38.78APRIL 56,580 2,274,389 40.20MAY 56,110 2,127,898 37.92JUNE 56,336 2,439,331 43.30JULY 56,846 2,422,262 42.61AUGUST 53,252 2,134,517 40.08SEPTEMBER 56,586 2,543,467 44.95OCTOBER 59,461 2,558,554 43.03NOVEMBER 56,101 2,448,648 43.65DECEMBER 48,944 2,242,656 45.82
TOTAL 658,827 27,376,546 41.55
2005 PLANT KWH / TON YEAR-TO-DATE
2005MONTH PRODUCTION KWH KWH USED
SHORT TONS USED PER TON
JANUARY 49,451 1,894,003 38.30FEBRUARY 99,208 3,881,083 39.12MARCH 158,611 6,184,824 38.99APRIL 215,191 8,459,213 39.31MAY 271,301 10,587,111 39.02JUNE 327,637 13,026,442 39.76JULY 384,483 15,448,704 40.18AUGUST 437,735 17,583,221 40.17SEPTEMBER 494,321 20,126,688 40.72OCTOBER 553,782 22,685,242 40.96NOVEMBER 609,883 25,133,890 41.21DECEMBER 658,827 27,376,546 41.55METRIC 597,675 27,376,546 45.81
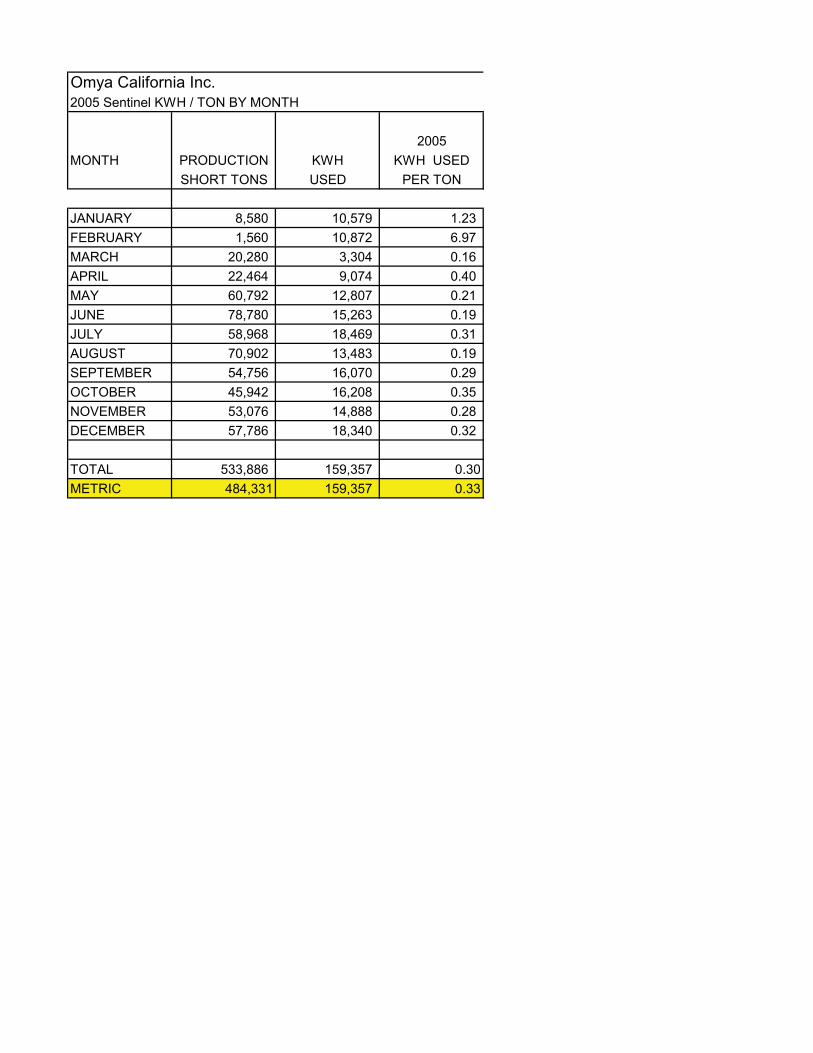
Omya California Inc.2005 Sentinel KWH / TON BY MONTH
2005MONTH PRODUCTION KWH KWH USED
SHORT TONS USED PER TON
JANUARY 8,580 10,579 1.23FEBRUARY 1,560 10,872 6.97MARCH 20,280 3,304 0.16APRIL 22,464 9,074 0.40MAY 60,792 12,807 0.21JUNE 78,780 15,263 0.19JULY 58,968 18,469 0.31AUGUST 70,902 13,483 0.19SEPTEMBER 54,756 16,070 0.29OCTOBER 45,942 16,208 0.35NOVEMBER 53,076 14,888 0.28DECEMBER 57,786 18,340 0.32
TOTAL 533,886 159,357 0.30METRIC 484,331 159,357 0.33

Omya California Inc.2006 PLANT KWH / TON BY MONTH
2006MONTH PRODUCTION KWH KWH USED
SHORT TONS USED PER TON
JANUARY 51,085 2,143,747 41.96FEBRUARY 51,076 2,540,530 49.74MARCH 55,005 2,125,277 38.64APRIL 49,929 2,012,434 40.31MAY 54,513 2,013,370 36.93JUNE 57,555 2,303,333 40.02JULY 54,645 2,116,066 38.72AUGUST 58,365 2,109,240 36.14SEPTEMBER 54,378 2,312,909 42.53OCTOBER 48,976 2,027,626 41.40NOVEMBER 43,654 1,817,438 41.63DECEMBER 33,216 1,766,510 53.18
TOTAL 612,397 25,288,480 41.29
2006 PLANT KWH / TON YEAR-TO-DATE
2006MONTH PRODUCTION KWH KWH USED
SHORT TONS USED PER TON
JANUARY 51,085 2,143,747 41.96FEBRUARY 102,161 4,684,277 45.85MARCH 157,166 6,809,554 43.33APRIL 207,095 8,821,988 42.60MAY 261,608 10,835,358 41.42JUNE 319,163 13,138,691 41.17JULY 373,808 15,254,757 40.81AUGUST 432,173 17,363,997 40.18SEPTEMBER 486,551 19,676,906 40.44OCTOBER 535,527 21,704,532 40.53NOVEMBER 579,181 23,521,970 40.61DECEMBER 612,397 25,288,480 41.29
Metric 555,554 25,288,480 45.52

Omya California Inc.2006 Sentinel KWH / TON BY MONTH
2006MONTH PRODUCTION KWH KWH USED
SHORT TONS USED PER TON
JANUARY 24,726 12,208 0.49FEBRUARY 30,852 12,636 0.41MARCH 14,544 9,508 0.65APRIL 17,394 6,405 0.37MAY 25,818 9,732 0.38JUNE 55,302 14,885 0.27JULY 29,874 12,212 0.41AUGUST 73,710 18,173 0.25SEPTEMBER 66,846 18,247 0.27OCTOBER 59,982 17,515 0.29NOVEMBER 42,744 17,736 0.41DECEMBER 16,980 18,173 1.07
TOTAL 458,772 167,430 0.36
Metric 416,189 167,430 0.40
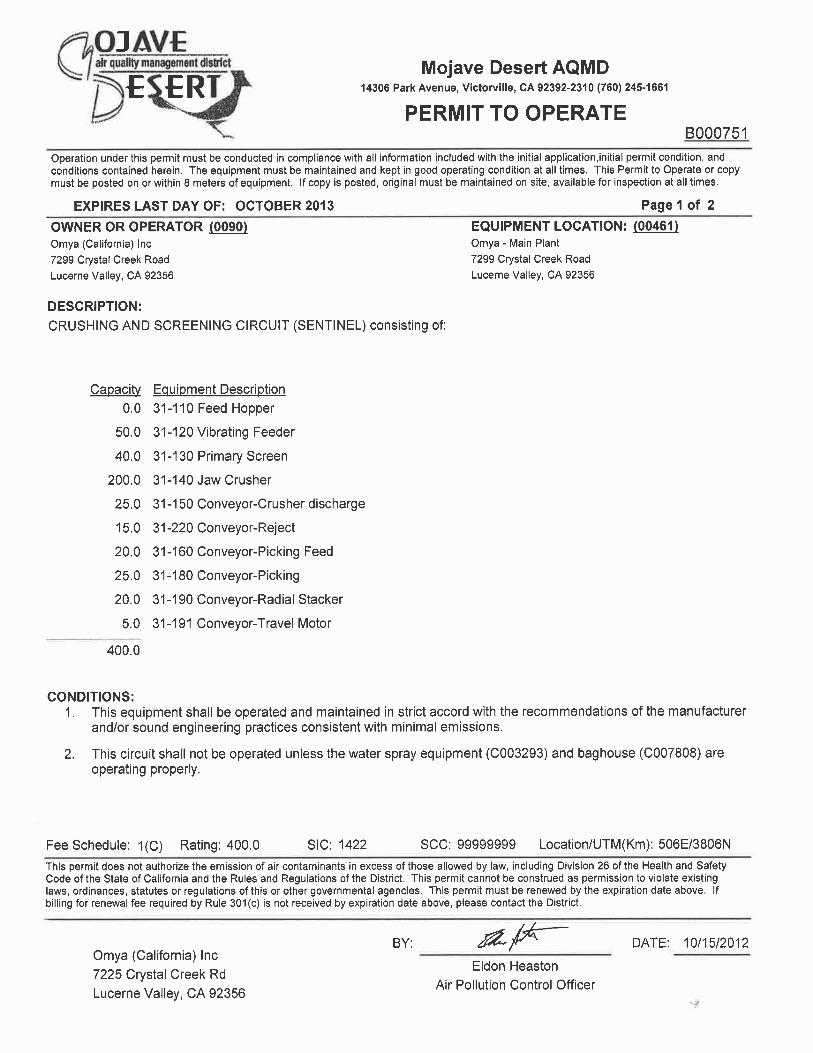


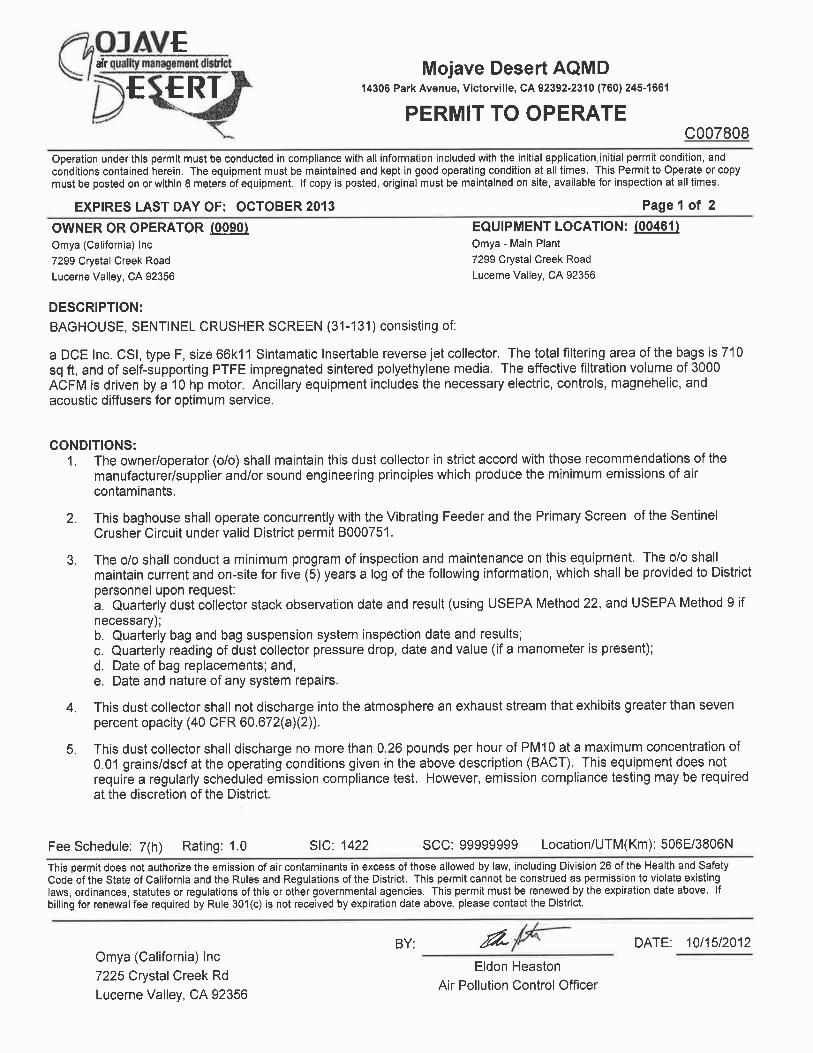


Butterfield and Sentinel Quarries Expansion Air Quality and Greenhouse Gas Impact Assessment San Bernardino National Forest October 25, 2017
OM01_SB-AQHRCCIA_fnl.docx Sespe Consulting, Inc.
Appendix H: Baseline Emissions Calculations

Sentinel-Butterfield Quarry Expansion ProjectSan Bernardino County, California
2012 Offroad Detail
om01_Baseline_v1.2.xlsb 1 7/22/2013
Location Type hp HC (g/hp-hr) HC det (g/hp-hr2) HC FCF NOx (g/hp-hr) NOx det (g/hp-hr2) NOx FCF PM (g/hp-hr) PM det (g/hp-hr2) PM FCFPit Dozer 370 0.68 0.0000237 0.72 8.17 0.000136 0.93 0.38 0.0000202 0.72Pit Excavator 195 0.68 0.0000315 0.72 8.17 0.000189 0.93 0.38 0.0000276 0.72Pit Loader 690 0.44 0.00002505 0.72 6.9375 0.0001088 0.939 0.2825 0.00001497 0.76Plant Bobcat 50Plant Crane 150 1 0.0000463 0.72 12 0.000278 0.93 0.55 0.00004 0.72Plant Forklift 52Plant Guzzler 322 0.19 0.0000195 0.72 4.95 0.0000734 0.948 0.12 0.00000651 0.8Plant Loader 305Plant Manlift 150 0.68 0.0000315 0.72 6.9 0.00016 0.948 0.38 0.0000276 0.8Plant Sweeper 101Roads Dump Truck 425Roads Fuel Truck 370Roads Grader 275 0.84 0.0000293 0.72 11 0.000183 0.93 0.53 0.0000281 0.72Roads Lube Truck 268.5Roads Truck 896WKQ Generator 890 0.68 0.00 0.72 8.17 0.00 0.93 0.38 0.00 0.72
Cells with information on units that were operated during the baseline years and then retired are filled with grey.

Sentinel-Butterfield Quarry Expansion ProjectSan Bernardino County, California
2012 Offroad Detail
om01_Baseline_v1.2.xlsb 2 7/22/2013
LocationPitPitPitPlantPlantPlantPlantPlantPlantPlantRoadsRoadsRoadsRoadsRoadsWKQ
CO (g/hp-hr) CO det (g/hp-hr2) HC EF (g/hp-hr) NOx EF (g/hp-hr) PM EF (g/hp-hr)CO EF (g/hp-hr) SO2 EF (g/hp-hr) Load Factor4.1 8.12E-04 0.67 8.95 0.43 12.78 0.00028 0.432.7 7.14E-05 0.71 9.28 0.46 3.38 0.00028 0.38
2.185 2.30E-04 0.52 7.67 0.34 4.94 0.00028 0.362.39 7.13 0.81 8.23 0.00028 0.37
4.4 1.16E-04 1.12 14.26 0.74 5.79 0.00028 0.28811.14 7.58 0.78 4.62 0.00028 0.20
0.92 1.82E-05 0.22 5.10 0.13 1.03 0.00028 0.340.81 10.99 0.57 9.86 0.00028 0.36
2.7 7.14E-05 0.57 7.11 0.39 2.97 0.00028 0.30820.99 10.30 0.78 4.94 0.00028 0.400.69 9.13 0.45 13.84 0.00028 0.340.69 9.12 0.45 13.84 0.00028 0.34
4.1 8.12E-04 0.86 12.27 0.62 13.84 0.00028 0.410.84 11.09 0.59 9.76 0.00028 0.340.35 6.53 0.20 4.10 0.00028 0.38
4.1 8.12E-04 0.59 9.12 0.29 13.84 0.00028 0.525

Sentinel-Butterfield Quarry Expansion ProjectSan Bernardino County, California
2012 Offroad Detail
om01_Baseline_v1.2.xlsb 3 7/22/2013
LocationPitPitPitPlantPlantPlantPlantPlantPlantPlantRoadsRoadsRoadsRoadsRoadsWKQ
Average (hr) Avg. (hp-hr) HC (lb/yr) NOx (lb/yr) PM (lb/yr) CO (lb/yr) SOx (lb/yr) CO2 (tpy)120.0 44,393 28 376 18 536 0.012 26293.7 57,265 34 447 22 163 0.013 33
5135.3 3,543,333 1,468 21,668 950 13,951 0.781 2,064243.3 12,167 24 70 8 81 0.003 7
33.7 5,050 4 46 2 19 0.001 317066.8 887,473 447 2,981 308 1,816 0.109 517
0.0 0 - - - - - -233.7 71,287 46 625 32 561 0.016 42
29.0 4,350 2 21 1 9 0.001 3699.5 70,650 62 640 48 307 0.017 41389.2 165,430 87 1,137 56 1,725 0.034 96
68.9 25,500 13 175 9 266 0.005 15612.3 168,392 130 1,862 95 2,101 0.042 98347.4 93,270 59 780 42 685 0.019 54
18645.4 16,706,243 4,897 91,813 2,789 57,696 3.885 9,730952.0 847,280 575 8,940 285 13,576 0.271 493
Pit Subtotal 3,644,992 1,531 22,491 990 14,650 0.806 2,123Plant Subtotal 1,041,576 578 4,316 396 2,765 0.144 607Roads Subtotal 17,158,834 5,186 95,767 2,990 62,474 3.987 9,994Total w/o Generator 21,845,402 7,294 122,573 4,377 79,888 4.936 12,723Total w/ Generator 22,692,682 7,869 131,513 4,663 93,464 5.207 13,217

Sentinel-Butterfield Quarry Expansion ProjectSan Bernardino County, California
Baseline Offroad Summary
om01_Baseline_v1.2.xlsb 1 7/22/2013
Type hpEngine Year
HC (g/hp-hr)
HC det (g/hp-hr2) HC FCF
NOx (g/hp-hr)
NOx det (g/hp-hr2)
NOx FCF
PM (g/hp-hr)
PM det (g/hp-hr2) PM FCF
CO (g/hp-hr)
CO det (g/hp-hr2)
Dozer 250 1977 0.95 0.0000331 0.72 12 0.0002 0.93 0.53 0.0000281 0.72 4.4 0.000116Dozer 370 1990 0.68 0.0000237 0.72 8.17 0.000136 0.93 0.38 0.0000202 0.72 4.1 0.000812Dozer TotalExcavator 195 1995 0.68 0.0000315 0.72 8.17 0.000189 0.93 0.38 0.0000276 0.72 2.7 0.0000714Excavator TotalLoader 690 2004 0.12 0.0000236 0.72 4.29 0.0000581 0.948 0.11 0.00000579 0.8 0.92 0.0000182Loader 690 2004 0.12 0.0000236 0.72 4.29 0.0000581 0.948 0.11 0.00000579 0.8 0.92 0.0000182Loader 690 1985 0.84 0.0000293 0.72 11 0.000183 0.93 0.53 0.0000281 0.72 4.2 0.000832Loader 690 1995 0.68 0.0000237 0.72 8.17 0.000136 0.93 0.38 0.0000202 0.72 2.7 0.0000535Loader 690 1994 0.68 0.0000237 0.72 8.17 0.000136 0.93 0.38 0.0000202 0.72 2.7 0.0000535Loader 500 1985 0.84 0.0000293 0.72 11 0.000183 0.93 0.53 0.0000281 0.72 4.2 0.000832Loader TotalBobcat 50 1983 1.84 0.000235 0.72 7 0.000105 0.93 0.76 0.0000589 0.72 5 0.000513Bobcat 50 1983 1.84 0.000235 0.72 7 0.000105 0.93 0.76 0.0000589 0.72 5 0.000513Bobcat 50 1987 1.84 0.000235 0.72 7 0.000105 0.93 0.76 0.0000589 0.72 5 0.000513Bobcat 50 2001 1.45 0.000185 0.72 5.55 0.000103 0.948 0.6 0.0000465 0.8 5 0.000513Bobcat TotalCrane 150 1977 1 0.0000463 0.72 12 0.000278 0.93 0.55 0.00004 0.72 4.4 0.000116Crane TotalForklift 52 1992 0.99 0.0000458 0.72 8.75 0.000202 0.93 0.69 0.0000502 0.72 4.8 0.000127Forklift 52 2000 0.99 0.0000458 0.72 6.9 0.00016 0.948 0.69 0.0000502 0.8 3.49 0.0000923Forklift 47 2001 1.45 0.000185 0.72 5.55 0.000103 0.948 0.6 0.0000465 0.8 3.49 0.0000923Forklift 52 2003 0.99 0.0000458 0.72 6.9 0.00016 0.948 0.69 0.0000502 0.8 3.49 0.0000923Forklift 57 2004 0.46 0.0000333 0.72 5.64 0.000103 0.948 0.39 0.0000285 0.8 3.49 0.0000923Forklift 50 1986 1.84 0.000235 0.72 7 0.000105 0.93 0.76 0.0000589 0.72 5 0.000513Forklift 50 1989 1.8 0.00023 0.72 6.9 0.000104 0.93 0.76 0.0000589 0.72 5 0.000513Forklift 50 1990 1.8 0.00023 0.72 6.9 0.000104 0.93 0.76 0.0000589 0.72 5 0.000513Forklift 50 1992 1.8 0.00023 0.72 6.9 0.000104 0.93 0.76 0.0000589 0.72 5 0.000513Forklift 50 1993 1.8 0.00023 0.72 6.9 0.000104 0.93 0.76 0.0000589 0.72 5 0.000513Forklift 50 1994 1.8 0.00023 0.72 6.9 0.000104 0.93 0.76 0.0000589 0.72 5 0.000513Forklift 50 1994 1.8 0.00023 0.72 6.9 0.000104 0.93 0.76 0.0000589 0.72 5 0.000513Forklift 50 1996 1.8 0.00023 0.72 6.9 0.000104 0.93 0.76 0.0000589 0.72 5 0.000513Forklift 50 1997 1.8 0.00023 0.72 6.9 0.000104 0.93 0.76 0.0000589 0.72 5 0.000513Forklift 50 1998 1.8 0.00023 0.72 6.9 0.000104 0.93 0.76 0.0000589 0.72 5 0.000513Forklift TotalGuzzler 322 2001 0.19 0.0000195 0.72 4.95 0.0000734 0.948 0.12 0.00000651 0.8 0.92 0.0000182Guzzler TotalLoader 375 1985 0.84 0.0000293 0.72 11 0.000183 0.93 0.53 0.0000281 0.72 4.2 0.000832Loader 235 1992 0.68 0.0000315 0.72 8.17 0.000189 0.93 0.38 0.0000276 0.72 4.2 0.000111Loader TotalManlift 150 1999 0.68 0.0000315 0.72 6.9 0.00016 0.948 0.38 0.0000276 0.8 2.7 0.0000714Manlift TotalSweeper 150 1983 0.94 0.0000435 0.72 11 0.000254 0.93 0.55 0.00004 0.72 4.4 0.000116Sweeper 150 1992 0.68 0.0000315 0.72 8.17 0.000189 0.93 0.38 0.0000276 0.72 4.2 0.000111Sweeper 150 2002 0.68 0.0000315 0.72 6.9 0.00016 0.948 0.38 0.0000276 0.8 2.7 0.0000714Sweeper 52 2003 0.99 0.0000458 0.72 6.9 0.00016 0.948 0.69 0.0000502 0.8 3.49 0.0000923Sweeper TotalDump Truck 300 1988 0.68 0.0000237 0.72 8.17 0.000136 0.93 0.38 0.0000202 0.72 4.1 0.000812Dump Truck 425 1989 0.68 0.0000237 0.72 8.18 0.000136 0.93 0.38 0.0000202 0.72 4.1 0.000812Dump Truck TotalFuel Truck 300 1973 0.95 0.0000331 0.72 12 0.0002 0.93 0.53 0.0000281 0.72 4.2 0.000832Fuel Truck 370 1994 0.68 0.0000237 0.72 8.17 0.000136 0.93 0.38 0.0000202 0.72 4.1 0.000812Fuel Truck TotalGrader 275 1987 0.84 0.0000293 0.72 11 0.000183 0.93 0.53 0.0000281 0.72 4.1 0.000812Grader TotalLube Truck 300 1969 1.26 0.0000439 0.72 14 0.000233 0.93 0.74 0.0000393 0.72 4.2 0.000832Lube Truck 215 1985 0.88 0.0000407 0.72 11 0.000254 0.93 0.55 0.00004 0.72 4.3 0.000114Lube Truck 322 1988 0.68 0.0000237 0.72 8.18 0.000136 0.93 0.38 0.0000202 0.72 4.1 0.000812Lube Truck 300 1987 0.84 0.0000293 0.72 11 0.000183 0.93 0.53 0.0000281 0.72 4.1 0.000812Lube Truck TotalTruck 1050 1991 0.68 0.0000112 0.72 8.17 0.000136 0.93 0.38 0.00000202 0.72 4.1 0.000812Truck 635 2006 0.1 0.000025 0.72 2.45 0.0000318 0.948 0.11 0.00000555 0.8 0.92 0.0000182Truck 938 2000 0.32 0.0000112 0.72 6.25 0.000104 0.948 0.15 0.00000796 0.8 2.7 0.0000535Truck 1050 1982 0.9 0.0000314 0.72 11 0.000183 0.93 0.53 0.0000281 0.72 4.2 0.000832Truck 1050 2002 0.32 0.0000112 0.72 6.25 0.000104 0.948 0.15 0.00000796 0.8 2.7 0.0000535Truck 635 2004 0.12 0.0000236 0.72 4.29 0.0000581 0.948 0.11 0.00000579 0.8 0.92 0.0000182Truck 1050 2004 0.32 0.0000112 0.72 6.25 0.000104 0.948 0.15 0.00000796 0.8 2.7 0.0000535Truck 1050 2004 0.32 0.0000112 0.72 6.25 0.000104 0.948 0.15 0.00000796 0.8 2.7 0.0000535Truck 1050 1997 0.68 0.0000112 0.72 8.17 0.000136 0.948 0.38 0.00000202 0.8 4.1 0.000812Truck 760 2000 0.32 0.0000112 0.72 6.25 0.000104 0.948 0.15 0.00000796 0.8 2.7 0.0000535Truck 635 1992 0.68 0.0000237 0.72 8.17 0.000136 0.93 0.38 0.0000202 0.72 4.1 0.000812Truck 635 1990 0.68 0.0000237 0.72 8.17 0.000136 0.93 0.38 0.0000202 0.72 4.1 0.000812Truck TotalGenerator 890 1992 0.68 0.0000112 0.72 8.17 0.000136 0.93 0.38 0.00000202 0.72 4.1 0.000812Generator TotalGrand Total
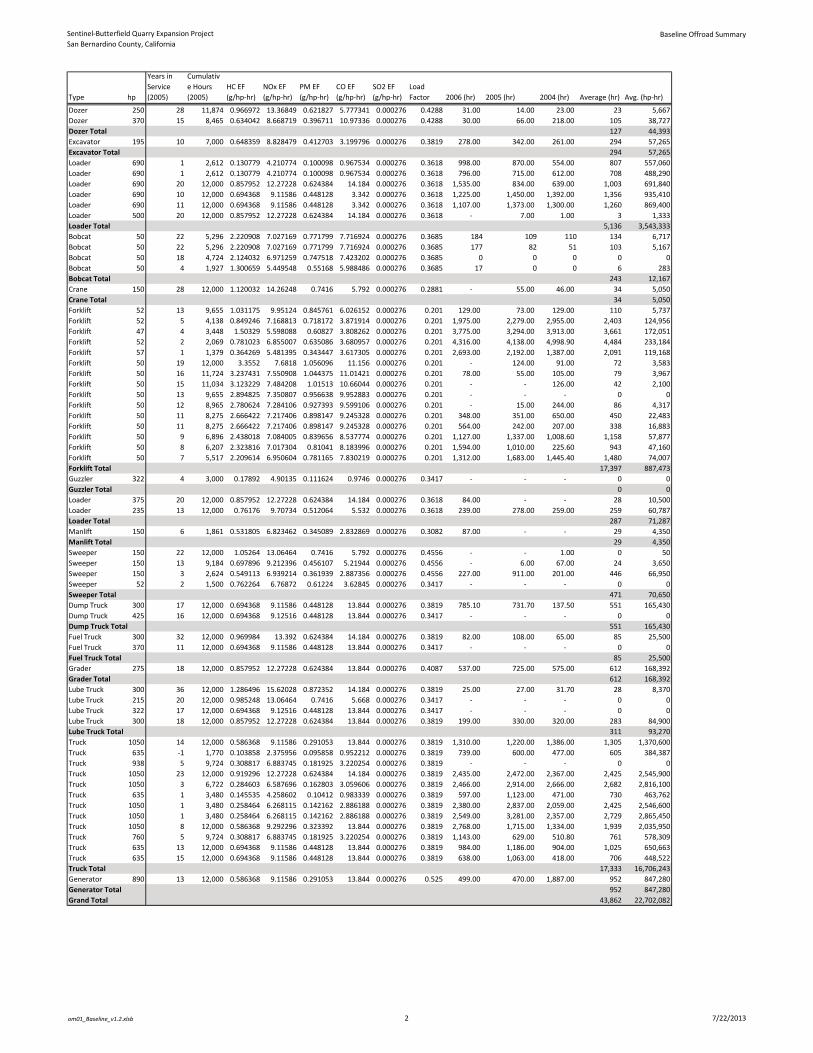
Sentinel-Butterfield Quarry Expansion ProjectSan Bernardino County, California
Baseline Offroad Summary
om01_Baseline_v1.2.xlsb 2 7/22/2013
Type hp
Dozer 250Dozer 370Dozer TotalExcavator 195Excavator TotalLoader 690Loader 690Loader 690Loader 690Loader 690Loader 500Loader TotalBobcat 50Bobcat 50Bobcat 50Bobcat 50Bobcat TotalCrane 150Crane TotalForklift 52Forklift 52Forklift 47Forklift 52Forklift 57Forklift 50Forklift 50Forklift 50Forklift 50Forklift 50Forklift 50Forklift 50Forklift 50Forklift 50Forklift 50Forklift TotalGuzzler 322Guzzler TotalLoader 375Loader 235Loader TotalManlift 150Manlift TotalSweeper 150Sweeper 150Sweeper 150Sweeper 52Sweeper TotalDump Truck 300Dump Truck 425Dump Truck TotalFuel Truck 300Fuel Truck 370Fuel Truck TotalGrader 275Grader TotalLube Truck 300Lube Truck 215Lube Truck 322Lube Truck 300Lube Truck TotalTruck 1050Truck 635Truck 938Truck 1050Truck 1050Truck 635Truck 1050Truck 1050Truck 1050Truck 760Truck 635Truck 635Truck TotalGenerator 890Generator TotalGrand Total
Years in Service (2005)
Cumulative Hours (2005)
HC EF (g/hp-hr)
NOx EF (g/hp-hr)
PM EF (g/hp-hr)
CO EF (g/hp-hr)
SO2 EF (g/hp-hr)
Load Factor 2006 (hr) 2005 (hr) 2004 (hr) Average (hr) Avg. (hp-hr)
28 11,874 0.966972 13.36849 0.621827 5.777341 0.000276 0.4288 31.00 14.00 23.00 23 5,66715 8,465 0.634042 8.668719 0.396711 10.97336 0.000276 0.4288 30.00 66.00 218.00 105 38,727
127 44,39310 7,000 0.648359 8.828479 0.412703 3.199796 0.000276 0.3819 278.00 342.00 261.00 294 57,265
294 57,2651 2,612 0.130779 4.210774 0.100098 0.967534 0.000276 0.3618 998.00 870.00 554.00 807 557,0601 2,612 0.130779 4.210774 0.100098 0.967534 0.000276 0.3618 796.00 715.00 612.00 708 488,290
20 12,000 0.857952 12.27228 0.624384 14.184 0.000276 0.3618 1,535.00 834.00 639.00 1,003 691,84010 12,000 0.694368 9.11586 0.448128 3.342 0.000276 0.3618 1,225.00 1,450.00 1,392.00 1,356 935,41011 12,000 0.694368 9.11586 0.448128 3.342 0.000276 0.3618 1,107.00 1,373.00 1,300.00 1,260 869,40020 12,000 0.857952 12.27228 0.624384 14.184 0.000276 0.3618 - 7.00 1.00 3 1,333
5,136 3,543,33322 5,296 2.220908 7.027169 0.771799 7.716924 0.000276 0.3685 184 109 110 134 6,71722 5,296 2.220908 7.027169 0.771799 7.716924 0.000276 0.3685 177 82 51 103 5,16718 4,724 2.124032 6.971259 0.747518 7.423202 0.000276 0.3685 0 0 0 0 0
4 1,927 1.300659 5.449548 0.55168 5.988486 0.000276 0.3685 17 0 0 6 283243 12,167
28 12,000 1.120032 14.26248 0.7416 5.792 0.000276 0.2881 - 55.00 46.00 34 5,05034 5,050
13 9,655 1.031175 9.95124 0.845761 6.026152 0.000276 0.201 129.00 73.00 129.00 110 5,7375 4,138 0.849246 7.168813 0.718172 3.871914 0.000276 0.201 1,975.00 2,279.00 2,955.00 2,403 124,9564 3,448 1.50329 5.598088 0.60827 3.808262 0.000276 0.201 3,775.00 3,294.00 3,913.00 3,661 172,0512 2,069 0.781023 6.855007 0.635086 3.680957 0.000276 0.201 4,316.00 4,138.00 4,998.90 4,484 233,1841 1,379 0.364269 5.481395 0.343447 3.617305 0.000276 0.201 2,693.00 2,192.00 1,387.00 2,091 119,168
19 12,000 3.3552 7.6818 1.056096 11.156 0.000276 0.201 - 124.00 91.00 72 3,58316 11,724 3.237431 7.550908 1.044375 11.01421 0.000276 0.201 78.00 55.00 105.00 79 3,96715 11,034 3.123229 7.484208 1.01513 10.66044 0.000276 0.201 - - 126.00 42 2,10013 9,655 2.894825 7.350807 0.956638 9.952883 0.000276 0.201 - - - 0 012 8,965 2.780624 7.284106 0.927393 9.599106 0.000276 0.201 - 15.00 244.00 86 4,31711 8,275 2.666422 7.217406 0.898147 9.245328 0.000276 0.201 348.00 351.00 650.00 450 22,48311 8,275 2.666422 7.217406 0.898147 9.245328 0.000276 0.201 564.00 242.00 207.00 338 16,883
9 6,896 2.438018 7.084005 0.839656 8.537774 0.000276 0.201 1,127.00 1,337.00 1,008.60 1,158 57,8778 6,207 2.323816 7.017304 0.81041 8.183996 0.000276 0.201 1,594.00 1,010.00 225.60 943 47,1607 5,517 2.209614 6.950604 0.781165 7.830219 0.000276 0.201 1,312.00 1,683.00 1,445.40 1,480 74,007
17,397 887,4734 3,000 0.17892 4.90135 0.111624 0.9746 0.000276 0.3417 - - - 0 0
0 020 12,000 0.857952 12.27228 0.624384 14.184 0.000276 0.3618 84.00 - - 28 10,50013 12,000 0.76176 9.70734 0.512064 5.532 0.000276 0.3618 239.00 278.00 259.00 259 60,787
287 71,2876 1,861 0.531805 6.823462 0.345089 2.832869 0.000276 0.3082 87.00 - - 29 4,350
29 4,35022 12,000 1.05264 13.06464 0.7416 5.792 0.000276 0.4556 - - 1.00 0 5013 9,184 0.697896 9.212396 0.456107 5.21944 0.000276 0.4556 - 6.00 67.00 24 3,650
3 2,624 0.549113 6.939214 0.361939 2.887356 0.000276 0.4556 227.00 911.00 201.00 446 66,9502 1,500 0.762264 6.76872 0.61224 3.62845 0.000276 0.3417 - - - 0 0
471 70,65017 12,000 0.694368 9.11586 0.448128 13.844 0.000276 0.3819 785.10 731.70 137.50 551 165,43016 12,000 0.694368 9.12516 0.448128 13.844 0.000276 0.3417 - - - 0 0
551 165,43032 12,000 0.969984 13.392 0.624384 14.184 0.000276 0.3819 82.00 108.00 65.00 85 25,50011 12,000 0.694368 9.11586 0.448128 13.844 0.000276 0.3417 - - - 0 0
85 25,50018 12,000 0.857952 12.27228 0.624384 13.844 0.000276 0.4087 537.00 725.00 575.00 612 168,392
612 168,39236 12,000 1.286496 15.62028 0.872352 14.184 0.000276 0.3819 25.00 27.00 31.70 28 8,37020 12,000 0.985248 13.06464 0.7416 5.668 0.000276 0.3417 - - - 0 017 12,000 0.694368 9.12516 0.448128 13.844 0.000276 0.3417 - - - 0 018 12,000 0.857952 12.27228 0.624384 13.844 0.000276 0.3819 199.00 330.00 320.00 283 84,900
311 93,27014 12,000 0.586368 9.11586 0.291053 13.844 0.000276 0.3819 1,310.00 1,220.00 1,386.00 1,305 1,370,600-1 1,770 0.103858 2.375956 0.095858 0.952212 0.000276 0.3819 739.00 600.00 477.00 605 384,3875 9,724 0.308817 6.883745 0.181925 3.220254 0.000276 0.3819 - - - 0 0
23 12,000 0.919296 12.27228 0.624384 14.184 0.000276 0.3819 2,435.00 2,472.00 2,367.00 2,425 2,545,9003 6,722 0.284603 6.587696 0.162803 3.059606 0.000276 0.3819 2,466.00 2,914.00 2,666.00 2,682 2,816,1001 3,480 0.145535 4.258602 0.10412 0.983339 0.000276 0.3819 597.00 1,123.00 471.00 730 463,7621 3,480 0.258464 6.268115 0.142162 2.886188 0.000276 0.3819 2,380.00 2,837.00 2,059.00 2,425 2,546,6001 3,480 0.258464 6.268115 0.142162 2.886188 0.000276 0.3819 2,549.00 3,281.00 2,357.00 2,729 2,865,4508 12,000 0.586368 9.292296 0.323392 13.844 0.000276 0.3819 2,768.00 1,715.00 1,334.00 1,939 2,035,9505 9,724 0.308817 6.883745 0.181925 3.220254 0.000276 0.3819 1,143.00 629.00 510.80 761 578,309
13 12,000 0.694368 9.11586 0.448128 13.844 0.000276 0.3819 984.00 1,186.00 904.00 1,025 650,66315 12,000 0.694368 9.11586 0.448128 13.844 0.000276 0.3819 638.00 1,063.00 418.00 706 448,522
17,333 16,706,24313 12,000 0.586368 9.11586 0.291053 13.844 0.000276 0.525 499.00 470.00 1,887.00 952 847,280
952 847,28043,862 22,702,082

Sentinel-Butterfield Quarry Expansion ProjectSan Bernardino County, California
Baseline Offroad Summary
om01_Baseline_v1.2.xlsb 3 7/22/2013
Type hp
Dozer 250Dozer 370Dozer TotalExcavator 195Excavator TotalLoader 690Loader 690Loader 690Loader 690Loader 690Loader 500Loader TotalBobcat 50Bobcat 50Bobcat 50Bobcat 50Bobcat TotalCrane 150Crane TotalForklift 52Forklift 52Forklift 47Forklift 52Forklift 57Forklift 50Forklift 50Forklift 50Forklift 50Forklift 50Forklift 50Forklift 50Forklift 50Forklift 50Forklift 50Forklift TotalGuzzler 322Guzzler TotalLoader 375Loader 235Loader TotalManlift 150Manlift TotalSweeper 150Sweeper 150Sweeper 150Sweeper 52Sweeper TotalDump Truck 300Dump Truck 425Dump Truck TotalFuel Truck 300Fuel Truck 370Fuel Truck TotalGrader 275Grader TotalLube Truck 300Lube Truck 215Lube Truck 322Lube Truck 300Lube Truck TotalTruck 1050Truck 635Truck 938Truck 1050Truck 1050Truck 635Truck 1050Truck 1050Truck 1050Truck 760Truck 635Truck 635Truck TotalGenerator 890Generator TotalGrand Total
HC (lb/yr) NOx (lb/yr) PM (lb/yr) CO (lb/yr) SOx (lb/yr) CO2 (tpy)HC (g/hp-hr)
NOx (g/hp-hr)
PM (g/hp-hr)
CO (g/hp-hr)
SOx (g/hp-hr) Avg. HP Diesel (gal/yr)
5.18 71.61 3.33 30.95 0.001 23.21 317.36 14.52 401.74 0.010
28 389 18 433 0.012 25.86 0.29 3.97 0.18 4.42 0.00 349 2,311 31.26 425.66 19.90 154.28 0.013
31 426 20 154 0.013 33.35 0.25 3.37 0.16 1.22 0.00 195 2,981 58.11 1,870.98 44.48 429.91 0.123 50.94 1,640.00 38.99 376.83 0.108
473.45 6,772.30 344.56 7,827.25 0.152 518.08 6,801.50 334.36 2,493.52 0.206 481.52 6,321.53 310.76 2,317.56 0.192
0.91 13.05 0.66 15.08 0.000 1,583 23,419 1,074 13,460 0.781 2,063.74 0.20 3.00 0.14 1.72 0.00 690 184,454
12.1 38.3 4.2 42.1 0.002 9.3 29.5 3.2 32.4 0.001 0.0 0.0 0.0 0.0 -
0.30 1.25 0.13 1.38 0.000 22 69 8 76 0.003 7.09 0.81 2.58 0.28 2.83 0.00 50 633
3.59 45.75 2.38 18.58 0.001 4 46 2 19 0.001 2.94 0.32 4.11 0.21 1.67 0.00 150 263
2.62 25.30 2.15 15.32 0.001 47.02 396.95 39.77 214.40 0.015
114.61 426.81 46.38 290.35 0.021 80.70 708.33 65.62 380.36 0.029 19.24 289.46 18.14 191.02 0.015
5.33 12.20 1.68 17.71 0.000 5.69 13.27 1.84 19.36 0.000 2.91 6.96 0.94 9.92 0.000
- - - - - 5.32 13.93 1.77 18.36 0.001
26.57 71.91 8.95 92.11 0.003 19.95 54.00 6.72 69.17 0.002 62.53 181.68 21.53 218.97 0.007 48.56 146.65 16.94 171.03 0.006 72.46 227.94 25.62 256.79 0.009
514 2,575 258 1,965 0.109 516.89 0.26 1.32 0.13 1.00 0.00 51 46,199 - - - - - - - - - - - - - - - - - -
7.19 102.78 5.23 118.79 0.002 36.93 470.67 24.83 268.22 0.013
44 573 30 387 0.016 41.52 0.28 3.65 0.19 2.46 0.00 249 3,711 1.57 20.17 1.02 8.37 0.001
2 20 1 8 0.001 2.53 0.16 2.10 0.11 0.87 0.00 150 226 0.05 0.66 0.04 0.29 0.000 2.56 33.77 1.67 19.14 0.001
36.93 466.64 24.34 194.17 0.019 - - - - - 40 501 26 214 0.020 41.15 0.25 3.22 0.17 1.37 0.00 150 3,678
96.71 1,269.69 62.42 1,928.24 0.038 - - - - - 97 1,270 62 1,928 0.038 96.35 0.27 3.48 0.17 5.29 0.00 300 8,612
20.83 287.52 13.41 304.53 0.006 - - - - - 21 288 13 305 0.006 14.85 0.37 5.11 0.24 5.42 0.00 300 1,327
130.17 1,862.03 94.74 2,100.50 0.042 130 1,862 95 2,101 0.042 98.08 0.35 5.02 0.26 5.66 0.00 275 8,766
9.07 110.08 6.15 99.96 0.002 - - - - - - - - - -
61.33 877.24 44.63 989.59 0.020 70 987 51 1,090 0.022 54.32 0.34 4.80 0.25 5.30 0.00 300 4,855
676.65 10,519.49 335.87 15,975.65 0.32 33.61 768.94 31.02 308.17 0.09
- - - - - 1,970.53 26,305.88 1,338.38 30,403.69 0.59
674.80 15,619.52 386.01 7,254.37 0.65 56.83 1,662.83 40.66 383.96 0.11
554.17 13,439.52 304.81 6,188.30 0.59 623.56 15,122.23 342.97 6,963.12 0.67
1,005.13 15,928.55 554.35 23,730.94 0.47 150.37 3,351.75 88.58 1,567.97 0.13 380.39 4,993.90 245.50 7,584.10 0.15 262.22 3,442.45 169.23 5,227.95 0.10
6,388 111,155 3,837 105,588 3.89 9,730.20 0.17 3.02 0.10 2.87 0.00 964 869,672 575.03 8,939.65 285.43 13,576.39 0.27
575 8,940 285 13,576 0.27 493.48 0.31 4.79 0.15 7.27 0.00 890 44,107 9,548 152,520 5,781 141,303 5.22 13,222.35 0.19 3.05 0.12 2.82 0.00 518 1,181,796

Sentinel-Butterfield Quarry Expansion ProjectSan Bernardino County, California
Baseline-RoadActivity
om01_Baseline_v1.2.xlsb 1 7/22/2013
MAXAVG - ALL
YEARSBaseline (tons) Peak Day (tons)
Peak Hour (tons)
USDT 2002 2003 2004 2005 2006 2007 2008 2009 2010 2011Sentinel 325,951 377,760 386,835 467,520 309,880 237,946 189,453 154,967 280,363 210,316 467,520 294,099 388,078 4,361 523Butterfield 3 0 0 0 41,701 128,948 97,601 80,575 50,018 47,628 48,972 128,948 49,544 56,883 639 77White Knob 261,244 274,193 309,168 311,999 350,895 212,999 190,274 52,758 228,414 144,075 350,895 233,602 324,021 4,000 400Annex 0 0 0 0 0 0 0 0 0 0 0 0 0White Ridge 0 0 0 0 0 0 0 0 0 0 0 0 0Sentinel - Butterfield 325,951 377,760 386,835 509,221 438,828 335,547 270,028 204,985 327,991 259,288 596,468 343,643 444,962 5,000 600TOTAL 587,194 651,953 696,004 821,220 789,724 548,546 460,302 257,742 556,405 403,363 947,364 577,245 768,982 9,000 1,000
USDT 2002 2003 2004 2005 2006 2007 2008 2009 2010 2011Sentinel 277,058 321,096 328,810 397,392 263,398 202,254 161,035 131,722 238,309 178,768 397,392 249,984 329,867 3,707 445Butterfield 3 0 0 0 35,446 109,606 82,961 68,489 42,515 40,483 41,627 109,606 42,113 48,351 543 65White Knob 222,057 233,064 262,793 265,199 298,261 181,049 161,733 44,844 194,152 122,463 298,261 198,562 275,418 3,400 340Annex 0 0 0 0 0 0 0 0 0 0 0 0 0White Ridge 0 0 0 0 0 0 0 0 0 0 0 0 0Sentinel - Butterfield 277,058 321,096 328,810 432,838 373,004 285,215 229,524 174,237 278,792 220,395 506,998 292,097 378,217 4,250 510TOTAL 499,115 554,160 591,603 698,037 671,265 466,264 391,257 219,081 472,944 342,858 805,259 490,658 653,635 7,650 850
USDT 2002 2003 2004 2005 2006 2007 2008 2009 2010 2011Sentinel 178,260 171,504 204,702 184,440 207,780 203,074 165,940 109,181 305,832 782,285 782,285 251,300 198,974 2,461 295Butterfield 3 0 0 0 59,376 81,624 185,546 34,820 15,256 85,687 116,028 185,546 57,834 47,000 361 43White Knob 164,666 159,728 151,860 281,698 130,590 169,776 61,020 1,250 85,766 103,348 281,698 130,970 188,049 2,258 226Annex 0 0 0 0 0 0 0 0 0 0 0 0 0White Ridge 0 0 0 0 0 0 0 0 0 0 0 0 0Sentinel - Butterfield 178,260 171,504 204,702 243,816 289,404 388,620 200,760 124,437 391,519 898,313 967,831 309,133 245,974 2,822 339TOTAL 342,926 331,232 356,562 525,514 419,994 558,396 261,780 125,687 477,285 1,001,661 1,249,529 440,104 434,023 5,080 564
USDT 2002 2003 2004 2005 2006 2007 2008 2009 2010 2011Sentinel 48,893 56,664 58,025 70,128 46,482 35,692 28,418 23,245 42,054 31,547 70,128 44,115 58,212 654 78Butterfield 3 0 0 0 6,255 19,342 14,640 12,086 7,503 7,144 7,346 19,342 7,432 8,532 96 12White Knob 39,187 41,129 46,375 46,800 52,634 31,950 28,541 7,914 34,262 21,611 52,634 35,040 48,603 600 60Annex 0 0 0 0 0 0 0 0 0 0 0 0 0White Ridge 0 0 0 0 0 0 0 0 0 0 0 0 0Sentinel - Butterfield 48,893 56,664 58,025 76,383 65,824 50,332 40,504 30,748 49,199 38,893 89,470 51,547 66,744 750 90TOTAL 88,079 97,793 104,401 123,183 118,459 82,282 69,045 38,661 83,461 60,504 142,105 86,587 115,347 1,350 150
USDT 2002 2003 2004 2005 2006 2007 2008 2009 2010 2011Sentinel 129,367 114,840 146,677 114,312 161,298 167,382 137,522 85,936 263,777 750,737 750,737 207,185 140,762 1,807 217Butterfield 3 0 0 0 53,121 62,282 170,906 22,734 7,753 78,543 108,682 170,906 50,402 38,468 265 32White Knob 125,479 118,599 105,485 234,898 77,956 137,826 32,479 (6,664) 51,504 81,737 234,898 95,930 139,446 1,658 166Annex 0 0 0 0 0 0 0 0 0 0 0 0 0White Ridge 0 0 0 0 0 0 0 0 0 0 0 0 0Sentinel - Butterfield 129,367 114,840 146,677 167,433 223,580 338,288 160,256 93,689 342,320 859,420 921,643 257,587 179,230 2,072 249TOTAL 254,847 233,439 252,161 402,331 301,535 476,114 192,735 87,026 393,824 941,157 1,156,541 353,517 318,676 3,730 414SUBTOTAL SENTINEL-B 455,318 492,600 533,512 676,654 662,408 673,835 430,284 298,674 670,311 1,118,708 1,518,111 601,230 624,191 7,072 849
AL EXCAVATED (TONS): 842,041 885,392 948,165 1,223,551 1,091,259 1,024,660 653,037 344,768 950,230 1,344,520 2,103,905 930,762 1,087,658 12,730 1,414
Waste Rock Not Processed
Ore to Primary Crusher
Ore Hauled to Plant
Waste Total
Waste Crusher Fines

Sentinel-Butterfield Quarry Expansion ProjectSan Bernardino County, California
Baseline-RoadActivity
om01_Baseline_v1.2.xlsb 2 7/22/2013
USDTSentinelButterfield 3White KnobAnnexWhite RidgeSentinel - ButterfieldTOTAL
USDTSentinelButterfield 3White KnobAnnexWhite RidgeSentinel - ButterfieldTOTAL
USDTSentinelButterfield 3White KnobAnnexWhite RidgeSentinel - ButterfieldTOTAL
USDTSentinelButterfield 3White KnobAnnexWhite RidgeSentinel - ButterfieldTOTAL
USDTSentinelButterfield 3White KnobAnnexWhite RidgeSentinel - ButterfieldTOTALSUBTOTAL SENTINEL-B
AL EXCAVATED (TONS):
Waste Rock Not Proces
Ore to Primary Crushe
Ore Hauled to Plant
Waste Total
Waste Crusher Fines
A - Butterfiel
d Pit
B - Waste
PileC - West
Road
D - Butterfiel
d Crusher
E - Sentinel
Pit
F - Crushed
Pile
G - Sentinel/Butterfiel
d to Plant
H - White Ridge to
PlantI - Plant
FeedJ - White Knob Pit
K - On-Road
Trucks
L - Crusher to White Ridge
M - White Ridge Pit
A B C D E F G H I J K L M
Trips/Year Trips/Day Trips/HourUnpaved Road Links Traveled 3,360 775 1,015 - 3,000 - 38,000 24,260 365 3,725 6,186 2300 1300
10,349 116 14 E - - - - 5,880 - - - - - - - - 1,517 17 2 A, C 965 - 292 - - - - - - - - - - 8,641 107 11 J - - - - - - - - - 6,096 - - -
0 0 0 J - - - - - - - - - - - - - 0 0 0 M, L - - - - - - - - - - - - -
11,866 133 1620,506 240 27
8,796 99 12 G, I - - - - - - 63,308 - 608 - - - - 1,289 14 2 G, I - - - - - - 9,279 - 89 - - - - 7,344 91 9 H, L, I - - - - - - - 33,746 508 - - 3,199 -
0 0 0 H, L, I - - - - - - - - - - - - - 0 0 0 H, L, I - - - - - - - - - - - - -
10,086 113 1417,430 204 23 20,421
5,306 66 81,253 10 15,015 60 6
0 0 00 0 0
6,559 75 911,574 135 15
1,552 17 2 B, C - 228 298 - - - - - - - - - - 228 3 0 B, C - 33 44 - - - - - - - - - -
1,296 16 2 L - - - - - - - - - - - 565 - 0 0 0 L - - - - - - - - - - - - - 0 0 0 L - - - - - - - - - - - - -
1,780 20 23,076 36 4
3,754 48 6 B, C, E - 551 722 - 2,133 - - - - - - - - 1,026 7 1 A, B 653 151 - - - - - - - - - - - 3,719 44 4 J, L - - - - - - - - - 2,623 - 1,620 -
0 0 0 J, L - - - - - - - - - - - - - 0 0 0 M, L - - - - - - - - - - - - -
4,779 55 78,498 99 11
16,645 189 23 A B C D E F G H I J K L M29,004 339 38 1,618 963 1,355 - 8,013 - 72,587 33,746 1,205 8,719 20,421 5,384 -
1.21% 0.72% 1.01% 0.00% 6.00% 0.00% 54.34% 25.26% 0.90% 6.53% 4.03% 0.00%

Sentinel-Butterfield Quarry Expansion ProjectSan Bernardino County, California
Baseline-RoadActivity
om01_Baseline_v1.2.xlsb 3 7/22/2013
USDTSentinelButterfield 3White KnobAnnexWhite RidgeSentinel - ButterfieldTOTAL
USDTSentinelButterfield 3White KnobAnnexWhite RidgeSentinel - ButterfieldTOTAL
USDTSentinelButterfield 3White KnobAnnexWhite RidgeSentinel - ButterfieldTOTAL
USDTSentinelButterfield 3White KnobAnnexWhite RidgeSentinel - ButterfieldTOTAL
USDTSentinelButterfield 3White KnobAnnexWhite RidgeSentinel - ButterfieldTOTALSUBTOTAL SENTINEL-B
AL EXCAVATED (TONS):
Waste Rock Not Proces
Ore to Primary Crushe
Ore Hauled to Plant
Waste Total
Waste Crusher Fines
A - Butterfield
Pit
B - Waste
PileC - West
Road
D - Butterfiel
d Crusher
E - Sentinel
Pit
F - Crushed
Pile
G - Sentinel/Butterfiel
d to Plant
H - White Ridge to
PlantI - Plant
FeedJ - White Knob Pit
K - On-Road
Trucks
L - Crusher to White Ridge
M - White Ridge Pit
A B C D E F G H I J K L M
3,360 775 1,015 - 3,000 - 38,000 24,260 365 3,725 6,186 2300 1300
- - - - 66 - - - - - - - - 11 - 3 - - - - - - - - - -
- - - - - - - - - 75 - - - - - - - - - - - - - - - - - - - - - - - - - - - - -
- - - - - - 711 - 7 - - - - - - - - - - 104 - 1 - - - - - - - - - - - 417 6 - - 39 - - - - - - - - - - - - - - - - - - - - - - - - - - -
239
- 3 3 - - - - - - - - - - - 0 0 - - - - - - - - - - - - - - - - - - - - - 7 - - - - - - - - - - - - - - - - - - - - - - - - - - -
- 7 9 - 27 - - - - - - - - 4 1 - - - - - - - - - - -
- - - - - - - - - 31 - 19 - - - - - - - - - - - - - - - - - - - - - - - - - - -
A B C D E F G H I J K L M15 11 16 - 93 - 816 417 14 106 239 66 -
0.99% 0.71% 1.05% 0.00% 6.01% 0.00% 52.46% 26.79% 0.91% 6.85% 4.23% 0.00%

Sentinel-Butterfield Quarry Expansion ProjectSan Bernardino County, California
Baseline-RoadActivity
om01_Baseline_v1.2.xlsb 4 7/22/2013
USDTSentinelButterfield 3White KnobAnnexWhite RidgeSentinel - ButterfieldTOTAL
USDTSentinelButterfield 3White KnobAnnexWhite RidgeSentinel - ButterfieldTOTAL
USDTSentinelButterfield 3White KnobAnnexWhite RidgeSentinel - ButterfieldTOTAL
USDTSentinelButterfield 3White KnobAnnexWhite RidgeSentinel - ButterfieldTOTAL
USDTSentinelButterfield 3White KnobAnnexWhite RidgeSentinel - ButterfieldTOTALSUBTOTAL SENTINEL-B
AL EXCAVATED (TONS):
Waste Rock Not Proces
Ore to Primary Crushe
Ore Hauled to Plant
Waste Total
Waste Crusher Fines
A - Butterfiel
d Pit
B - Waste
PileC - West
Road
D - Butterfiel
d Crusher
E - Sentinel
Pit
F - Crushed
Pile
G - Sentinel/Butterfiel
d to Plant
H - White Ridge to
PlantI - Plant
FeedJ - White Knob Pit
K - On-Road
Trucks
L - Crusher to White Ridge
M - White Ridge Pit
A B C D E F G H I J K L M per Year per Day per Hour
3,360 775 1,015 - 3,000 - 38,000 24,260 365 3,725 6,186 2300 1300
- - - - 8 - - - - - - - - 1 - 0 - - - - - - - - - -
- - - - - - - - - 8 - - - - - - - - - - - - - - - - - - - - - - - - - - - - -
- - - - - - 85 - 1 - - - - - - - - - - 13 - 0 - - - - - - - - - - - 42 1 - - 4 - - - - - - - - - - - - - - - - - - - - - - - - - - -
27 5,751,988 67,320 7,480
- 0 0 - - - - - - - - - - - 0 0 - - - - - - - - - - - - - - - - - - - - - 1 - - - - - - - - - - - - - - - - - - - - - - - - - - -
- 1 1 - 3 - - - - - - - - 1 0 - - - - - - - - - - -
- - - - - - - - - 3 - 2 - - - - - - - - - - - - - - - - - - - - - - - - - - -
A B C D E F G H I J K L M2 1 2 - 11 - 98 42 2 11 27 7 -
1.05% 0.76% 1.13% 0.00% 6.42% 0.00% 56.04% 23.85% 0.90% 6.09% 3.76% 0.00%
Offsite

Sentinel-Butterfield Quarry Expansion ProjectSan Bernardino County, California
ElectricityUse
om01_Baseline_v1.2.xlsb 1 7/22/2013
Omya California Inc.PLANT KWH / TON BY MONTHMONTH PRODUCTION (TONS) ELECTRICITY (KWH)
Jan-04 37,319 1,753,718Feb-04 50,419 1,754,299Mar-04 52,769 2,071,915Apr-04 52,625 1,894,301
May-04 52,963 1,733,040Jun-04 55,561 2,093,314Jul-04 62,061 2,173,502
Aug-04 59,948 2,068,469Sep-04 54,791 2,064,754Oct-04 60,672 2,238,763Nov-04 51,939 2,002,699Dec-04 51,321 2,236,882Jan-05 49,451 1,894,003Feb-05 49,757 1,987,080Mar-05 59,403 2,303,741Apr-05 56,580 2,274,389
May-05 56,110 2,127,898Jun-05 56,336 2,439,331Jul-05 56,846 2,422,262
Aug-05 53,252 2,134,517Sep-05 56,586 2,543,467Oct-05 59,461 2,558,554Nov-05 56,101 2,448,648Dec-05 48,944 2,242,656Jan-06 51,085 2,143,747Feb-06 51,076 2,540,530Mar-06 55,005 2,125,277Apr-06 49,929 2,012,434
May-06 54,513 2,013,370Jun-06 57,555 2,303,333Jul-06 54,645 2,116,066
Aug-06 58,365 2,109,240Sep-06 54,378 2,312,909Oct-06 48,976 2,027,626Nov-06 43,654 1,817,438Dec-06 33,216 1,766,510
TOTAL 1,913,612 76,750,682
PLANT USES: 40.11 KWH/TON
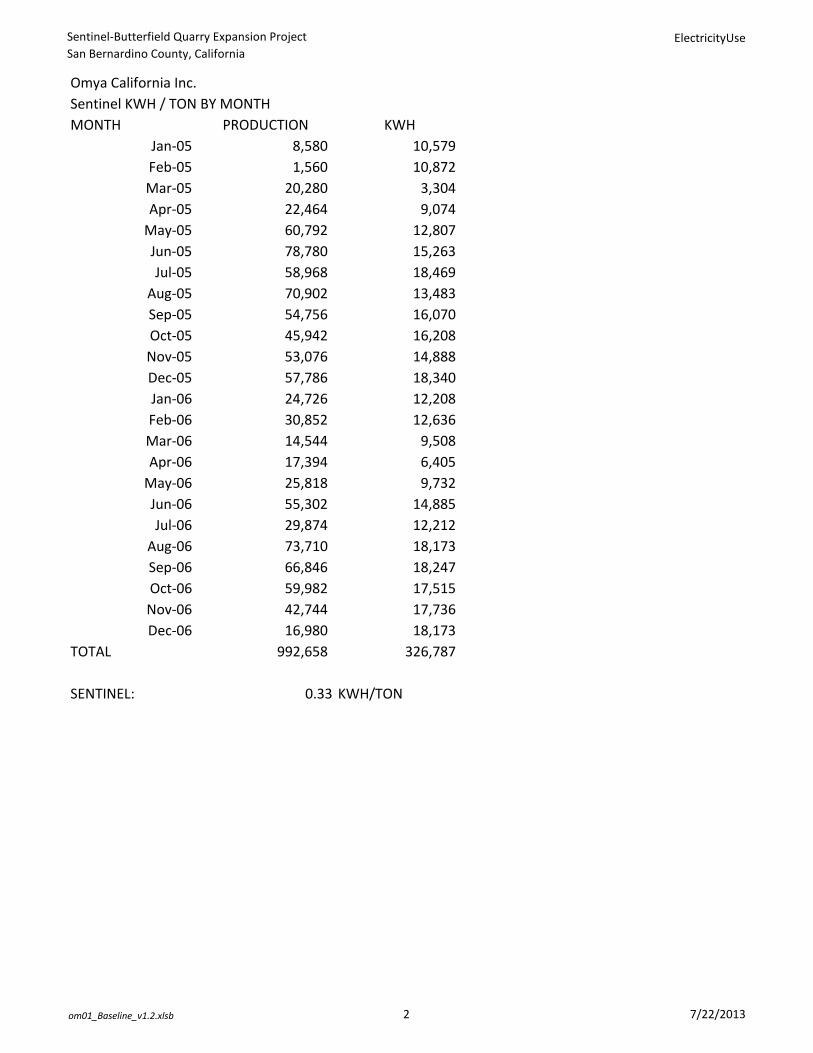
Sentinel-Butterfield Quarry Expansion ProjectSan Bernardino County, California
ElectricityUse
om01_Baseline_v1.2.xlsb 2 7/22/2013
Omya California Inc.Sentinel KWH / TON BY MONTHMONTH PRODUCTION KWH
Jan-05 8,580 10,579Feb-05 1,560 10,872Mar-05 20,280 3,304Apr-05 22,464 9,074
May-05 60,792 12,807Jun-05 78,780 15,263Jul-05 58,968 18,469
Aug-05 70,902 13,483Sep-05 54,756 16,070Oct-05 45,942 16,208Nov-05 53,076 14,888Dec-05 57,786 18,340Jan-06 24,726 12,208Feb-06 30,852 12,636Mar-06 14,544 9,508Apr-06 17,394 6,405
May-06 25,818 9,732Jun-06 55,302 14,885Jul-06 29,874 12,212
Aug-06 73,710 18,173Sep-06 66,846 18,247Oct-06 59,982 17,515Nov-06 42,744 17,736Dec-06 16,980 18,173
TOTAL 992,658 326,787
SENTINEL: 0.33 KWH/TON

Sentinel-Butterfield Quarry Expansion ProjectSan Bernardino County, California
RoadDustEFs
om01_Baseline_v1.2.xlsb 1 7/22/2013
Unpaved Road Emissions Factors Paved Road Emissions FactorsEF= k * (S/12)^a * (W/3)^b * [(N-P)/N] EF= k * (sL)^a * (W)^b * (1-P/4N)
TSP PM10 PM2.5 TSP PM10 PM2.5k= 4.9 1.5 0.15 k= 0.011 0.0022 0.00054a= 0.7 0.9 0.9 a= 0.91 0.91 0.91b= 0.45 0.45 0.45 b= 1.02 1.02 1.02N= 365 365 365 (days/yr) P= 33 33 33
P (Los Angeles-MDAB)= 33 33 33 (rain days/yr) N= 365 365 365
Sources: AP-42, Section 13.2.2 (Nov. 2006), CalEEMod User Manual Appendix D Source: AP-42, Section 13.2.1 (Jan. 2011)CalEEMod User Manual, Appendix D
OFFSITEUNCONTROLLED FACTOR
S= 8.3 % sL= 0.1 g/m2
Control Factor = 0% ParameterWeight (tons)
TSP (lb/VMT)
PM10 E.F. (lb/VMT)
PM2.5 E.F. (lb/VMT)
ParameterWeight (tons) TSP (lb/VMT)
PM10 E.F. (lb/VMT)
PM2.5 E.F. (lb/VMT) Full = 40 0.0583 0.0117 0.0029
Full = 120 19.91 5.66 0.57 Empty = 12 0.0171 0.0034 0.0008Empty = 45 12.80 3.64 0.36 Average = 26 0.0377 0.0075 0.0018
Average = 82.5 16.36 4.65 0.47 Annual Avg.1 = --- 0.0368 0.0074 0.0018
Annual Average1 = --- 14.88 4.23 0.421 Annual average emissions factors take into account the rainfall adjustment factor [(N-P)/N].
UNMITIGATED FACTOR This adjustment factor is not included in the hourly and daily emissions estimates.
S= 8.3 % Default silt loading in CalEEMod is 0.1 g/m2 and is used to model offsite road emissions.
Control Factor2 = 84%
ParameterWeight (tons) TSP (lb/VMT)
PM10 E.F. (lb/VMT)
PM2.5 E.F. (lb/VMT)
Full = 120 3.19 0.91 0.09Empty = 45 2.05 0.58 0.06
Average = 82.5 2.62 0.74 0.07 Annual Avg.1 = --- 2.38 0.68 0.07
1 Annual average emissions factors take into account the rainfall adjustment factor [(N-P)/N]. This adjustment factor is not included in the daily emissions estimate.
2 The control factor for the unmitigated emissions is chemical dust suppressants.
MEMORANDUM 5920 Friars Road, Suite 103 • San Diego, California 92108
SESPE Methods - OFFROAD2011.docx 1 SESPE Consulting. Inc.
Date: August 28, 2012 To: File From: Scott Cohen Re: Using OFFROAD2011 to Obtain Emissions Factors The OFFROAD2011 model contains table data that is used to calculate emissions from offroad vehicles that are subject to the In Use Offroad Air Toxic Control Measure (ATCM). A table summarizing the results of the offroad model is also included. Information in the model can be used in various ways to estimate emissions and emissions factors. This memo summarized the ways in which SESPE may use the OFFROAD2011 model in preparing emissions calculations. 1. Emissions Factors for a Specific Offroad Vehicle
The following example is for a 2002 model year, 250 hp to 500 hp engine (i.e. 500 hp bin) that is powers a loader during calendar year 2011. Such a loader engine would have the following attributes in the OFFROAD2011 model:
NOx emissions factors (EF0 = 4.51 g/hp-hr and EFdet = 6.32E-05 g/hp-hr2) from the table named EMFACUpdate; Load factor for a loader (LF = 0.3618) from the table named LoadFactor; Cumulative hours for a nine year old loader (12,000 hours) from the table named ActivityCMHrs; and NOx Fuel correction factor (FCF = 0.948) from table named FuelCorrectionFactorUpdate.
Emissions would be calculated by the following equation ( ) = × × ( × + × ) × Emissions in OFFROAD2011 are in units of tons (per day). Thus, the results of the above equation would be converted to tons by dividing by 453.59 g/lb and 2000 lb/ton. In order to check the above calculation method, emissions reported in table osmEmissionsForAirBasin for all 2002 model year engines in loaders are examined. First, the average horsepower of all such loaders is calculated by multiplying the total pounds of fuel burned by the brake specific fuel consumption (0.367) and then dividing by the applicable load factor (0.3618). The average horsepower of the 2002 engines in loaders between 250 hp and 500 hp is calculated to be 319.6 hp. Next, the emissions are calculated using the average horsepower and compared to the total emissions in osmEmissionsForAirBasin. As shown in Attachment 1, the percent difference between the calculated value and the osmEmissionsForAirBasin total is less than one percent (1%). Therefore, then calculation method including units of measure and other assumptions is confirmed to be correct.

Using OFFROAD2011 to Obtain Emissions Factors August 28, 2012
SESPE Methods - OFFROAD2011.docx 2 SESPE Consulting. Inc.
2. Emissions Factors for the Average Vehicle of a Particular Type and Size by Calendar Year Average emissions factors for a vehicle of a particular size, type during each calendar year can be estimated using data in the table named osmEmissionsForAirBasin. Attachment 2 contains loader NOx emissions factors that are calculated for each calendar year for the 500 hp bin. The average horsepower for each year is calculated as discussed above. Then the total NOx emissions are used to back-calculated the NOx emissions factor. By back-calculating the emissions factor from the total, the deterioration factor and fuel correction factor are incorporated into the result which reflects the average NOx emissions factor for a unit in the 500 hp bin during each calendar year. Two queries were developed in order to automate the process of calculating emissions factors for the average unit by calendar year. First, a query named EmissionsTotal sums the fuel use, hours of operation, and emissions of NOx, PM, and HC:
SELECT osmEmissionsForAirBasin.CalendarYear, Sum(osmEmissionsForAirBasin.ScenBSFC) AS SumOfScenBSFC, Sum(osmEmissionsForAirBasin.ScenNOx) AS SumOfScenNOx, Sum(osmEmissionsForAirBasin.ScenPM) AS SumOfScenPM, Sum(osmEmissionsForAirBasin.ScenHC) AS SumOfScenHC,Sum(osmEmissionsForAirBasin.ScenActivity) AS SumOfScenActivity, osmEmissionsForAirBasin.HorsepowerBin,osmEmissionsForAirBasin.EquipmentTypeID
FROM osmEmissionsForAirBasin INNER JOIN LookupEquipmentType ON osmEmissionsForAirBasin.EquipmentTypeID = LookupEquipmentType.EquipmentTypeIDGROUP BY osmEmissionsForAirBasin.CalendarYear,
osmEmissionsForAirBasin.HorsepowerBin,osmEmissionsForAirBasin.EquipmentTypeID
HAVING (((osmEmissionsForAirBasin.EquipmentTypeID)=[EquipTypeIdentification])); Next, a query named EmissionsFactors performs the necessary back-calculations to determine the average emissions factors by calendar year:
SELECT EmissionsTotals.CalendarYear, EmissionsTotals.SumOfScenBSFC,EmissionsTotals.SumOfScenNOx,EmissionsTotals.SumOfScenPM,EmissionsTotals.SumOfScenHC,EmissionsTotals.SumOfScenActivity,EmissionsTotals.HorsepowerBin,[EmissionsTotals]![SumOfScenBSFC]/0.367/[EmissionsTotals]![SumOfScenActivity]/[LoadFactor] AS AvgHP, [SumOfScenNOx]*2000*453.59237/[AvgHP]/[SumOfScenActivity]/[LoadFactor] AS NOxEF, [SumOfScenPM]*2000*453.59237/[AvgHP]/[SumOfScenActivity]/[LoadFactor] AS PMEF, [SumOfScenHC]*2000*453.59237/[AvgHP]/[SumOfScenActivity]/[LoadFactor] AS HCEF
FROM EmissionsTotals; Before running the above queries, the user must know the EquipmentTypeID and the load factor. OFFROAD2011 stores the numerical EquipmentTypeID and the load factor in the LoadFactor table and the name associated with each EquipmentTypeID is located in the LookupEquipmentType table. Attachment 2 contains the results of a query which combines these two OFFROAD2011 tables into one table that can be referenced. Attachment 3 contains output from the EmissionsFactors query for loaders in the 500 hp bin.

OFFROAD2011 Attachment 1 Calculation Method
Offroad2011_EmissionsInventory.xlsx 1 of 7 8/28/2012
BaseBSFC BaseNOx BaseActivity ScenBSFC ScenNOx ScenActivitylb fuel tpd hours lb fuel tpd hours
2011 L NCC 2002 24 500 40968 0.609564189 932.2506108 40968.44013 0.60956419 932.25061082011 L SV 2002 24 500 198752 2.957209393 4522.674252 198752.2531 2.95720939 4522.6742522011 L LC 2002 24 500 2787 0.041465898 63.41679777 2786.897914 0.0414659 63.416797772011 L MC 2002 24 500 15028 0.2235959 341.9613855 15027.7451 0.2235959 341.96138552011 L NC 2002 24 500 10366 0.154235226 235.8830888 10366.05617 0.15423523 235.88308882011 L NEP 2002 24 500 1567 0.023308623 35.64756369 1566.558457 0.02330862 35.647563692011 L SC 2002 24 500 882289 13.12745811 20076.77134 882288.5125 13.1274581 20076.771342011 L SCC 2002 24 500 73602 1.095111184 1674.832755 73601.75969 1.09511118 1674.8327552011 L SD 2002 24 500 236408 3.517484385 5379.543328 236407.9961 3.51748439 5379.5433282011 L SF 2002 24 500 466116 6.935282585 10606.62936 466116.144 6.93528259 10606.629362011 L SJV 2002 24 500 373931 5.563670273 8508.923429 373930.9108 5.56367027 8508.9234292011 L SS 2002 24 500 79345 1.180560925 1805.517226 79344.78508 1.18056093 1805.5172262011 L MD 2002 24 500 65057 0.967971201 1480.388381 65056.75839 0.9679712 1480.3883812011 L LT 2002 24 500 4617 0.068696677 105.0627975 4617.062065 0.06869668 105.06279752011 L GBV 2002 24 500 726 0.010796839 16.51238755 725.6490397 0.01079684 16.512387552011 M NCC 2002 24 500 6195 0.092179876 147.8877417 6195.35364 0.09217988 147.88774172011 M SV 2002 24 500 30056 0.447196865 717.4552358 30055.83056 0.44719686 717.45523582011 M LC 2002 24 500 421 0.006270581 10.06013501 421.4419217 0.00627058 10.060135012011 M MC 2002 24 500 2273 0.033812751 54.24710531 2272.534542 0.03381275 54.247105312011 M NC 2002 24 500 1568 0.02332385 37.41935581 1567.581867 0.02332385 37.419355812011 M NEP 2002 24 500 237 0.00352479 5.654957617 236.8990279 0.00352479 5.6549576172011 M SC 2002 24 500 133422 1.985168221 3184.882199 133421.9543 1.98516822 3184.8821992011 M SCC 2002 24 500 11130 0.16560555 265.6873924 11130.24876 0.16560555 265.68739242011 M SD 2002 24 500 35750 0.5319231 853.3848142 35750.22956 0.5319231 853.38481422011 M SF 2002 24 500 70487 1.048771398 1682.584538 70487.29072 1.0487714 1682.5845382011 M SJV 2002 24 500 56547 0.841352631 1349.814584 56546.80097 0.84135263 1349.8145842011 M SS 2002 24 500 11999 0.178527481 286.4185467 11998.72393 0.17852748 286.41854672011 M MD 2002 24 500 9838 0.146379112 234.8416745 9838.051527 0.14637911 234.84167452011 M LT 2002 24 500 698 0.010388489 16.6666556 698.2040854 0.01038849 16.66665562011 M GBV 2002 24 500 110 0.001632726 2.61944554 109.7345275 0.00163273 2.619445542011 S NCC 2002 24 500 7620 0.113370145 210.7865502 7619.538826 0.11337015 210.78655022011 S SV 2002 24 500 36965 0.549998285 1022.599387 36965.05174 0.54999828 1022.599387
CalendarYear
FleetSizeAirBas
inModelYe
arEquipmentType
HorsepowerBin
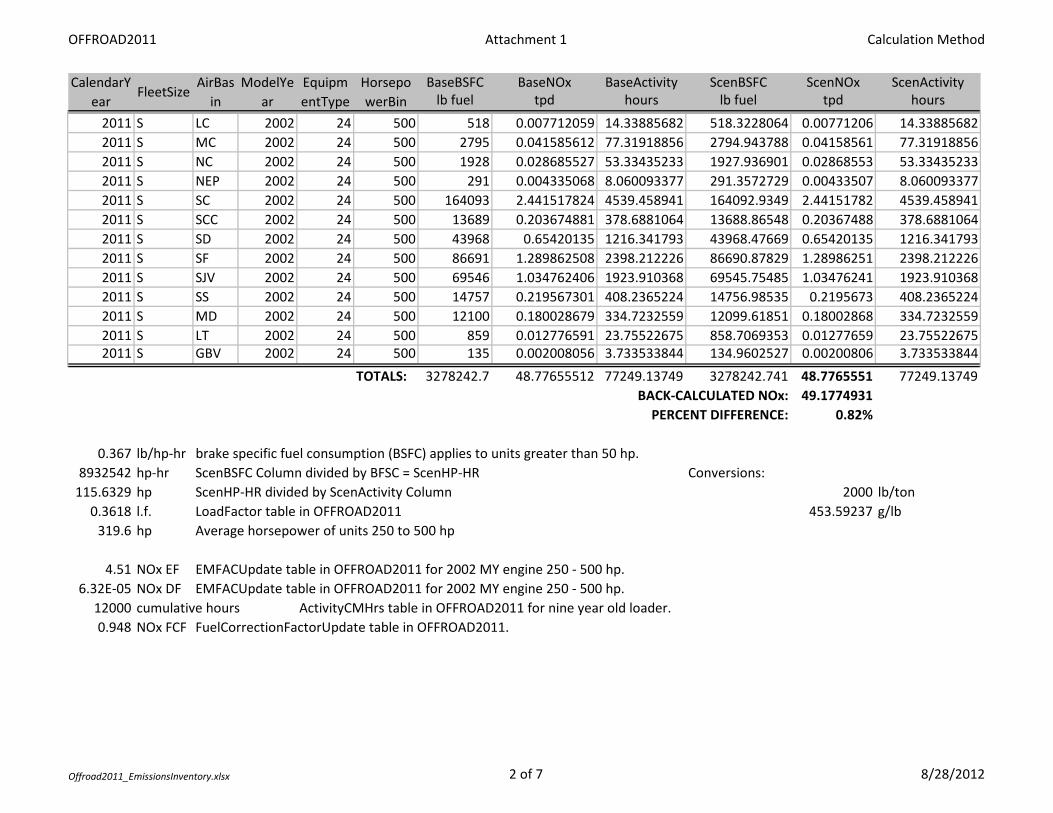
OFFROAD2011 Attachment 1 Calculation Method
Offroad2011_EmissionsInventory.xlsx 2 of 7 8/28/2012
BaseBSFC BaseNOx BaseActivity ScenBSFC ScenNOx ScenActivitylb fuel tpd hours lb fuel tpd hours
CalendarYear
FleetSizeAirBas
inModelYe
arEquipmentType
HorsepowerBin
2011 S LC 2002 24 500 518 0.007712059 14.33885682 518.3228064 0.00771206 14.338856822011 S MC 2002 24 500 2795 0.041585612 77.31918856 2794.943788 0.04158561 77.319188562011 S NC 2002 24 500 1928 0.028685527 53.33435233 1927.936901 0.02868553 53.334352332011 S NEP 2002 24 500 291 0.004335068 8.060093377 291.3572729 0.00433507 8.0600933772011 S SC 2002 24 500 164093 2.441517824 4539.458941 164092.9349 2.44151782 4539.4589412011 S SCC 2002 24 500 13689 0.203674881 378.6881064 13688.86548 0.20367488 378.68810642011 S SD 2002 24 500 43968 0.65420135 1216.341793 43968.47669 0.65420135 1216.3417932011 S SF 2002 24 500 86691 1.289862508 2398.212226 86690.87829 1.28986251 2398.2122262011 S SJV 2002 24 500 69546 1.034762406 1923.910368 69545.75485 1.03476241 1923.9103682011 S SS 2002 24 500 14757 0.219567301 408.2365224 14756.98535 0.2195673 408.23652242011 S MD 2002 24 500 12100 0.180028679 334.7232559 12099.61851 0.18002868 334.72325592011 S LT 2002 24 500 859 0.012776591 23.75522675 858.7069353 0.01277659 23.755226752011 S GBV 2002 24 500 135 0.002008056 3.733533844 134.9602527 0.00200806 3.733533844
TOTALS: 3278242.7 48.77655512 77249.13749 3278242.741 48.7765551 77249.13749BACK-CALCULATED NOx: 49.1774931
PERCENT DIFFERENCE: 0.82%
0.367 lb/hp-hr brake specific fuel consumption (BSFC) applies to units greater than 50 hp.8932542 hp-hr ScenBSFC Column divided by BFSC = ScenHP-HR Conversions:
115.6329 hp ScenHP-HR divided by ScenActivity Column 2000 lb/ton0.3618 l.f. LoadFactor table in OFFROAD2011 453.59237 g/lb
319.6 hp Average horsepower of units 250 to 500 hp
4.51 NOx EF EMFACUpdate table in OFFROAD2011 for 2002 MY engine 250 - 500 hp.6.32E-05 NOx DF EMFACUpdate table in OFFROAD2011 for 2002 MY engine 250 - 500 hp.
12000 cumulative hours ActivityCMHrs table in OFFROAD2011 for nine year old loader.0.948 NOx FCF FuelCorrectionFactorUpdate table in OFFROAD2011.
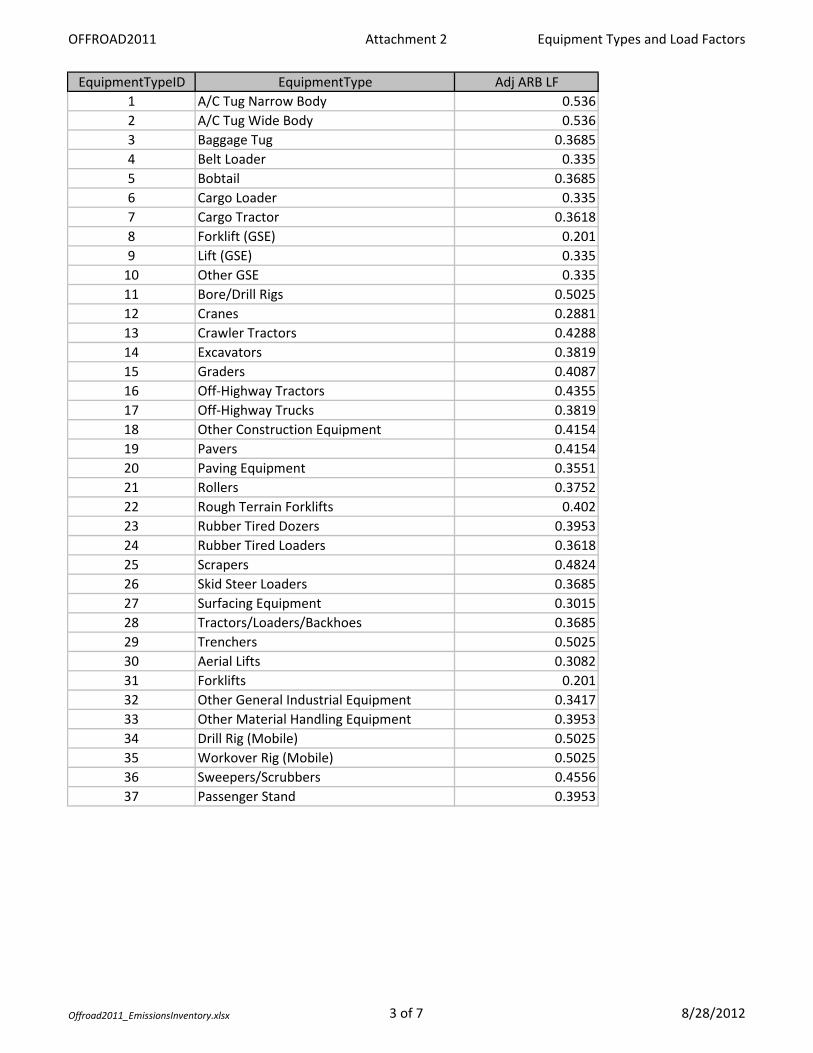
OFFROAD2011 Attachment 2 Equipment Types and Load Factors
Offroad2011_EmissionsInventory.xlsx 3 of 7 8/28/2012
EquipmentTypeID EquipmentType Adj ARB LF1 A/C Tug Narrow Body 0.5362 A/C Tug Wide Body 0.5363 Baggage Tug 0.36854 Belt Loader 0.3355 Bobtail 0.36856 Cargo Loader 0.3357 Cargo Tractor 0.36188 Forklift (GSE) 0.2019 Lift (GSE) 0.335
10 Other GSE 0.33511 Bore/Drill Rigs 0.502512 Cranes 0.288113 Crawler Tractors 0.428814 Excavators 0.381915 Graders 0.408716 Off-Highway Tractors 0.435517 Off-Highway Trucks 0.381918 Other Construction Equipment 0.415419 Pavers 0.415420 Paving Equipment 0.355121 Rollers 0.375222 Rough Terrain Forklifts 0.40223 Rubber Tired Dozers 0.395324 Rubber Tired Loaders 0.361825 Scrapers 0.482426 Skid Steer Loaders 0.368527 Surfacing Equipment 0.301528 Tractors/Loaders/Backhoes 0.368529 Trenchers 0.502530 Aerial Lifts 0.308231 Forklifts 0.20132 Other General Industrial Equipment 0.341733 Other Material Handling Equipment 0.395334 Drill Rig (Mobile) 0.502535 Workover Rig (Mobile) 0.502536 Sweepers/Scrubbers 0.455637 Passenger Stand 0.3953
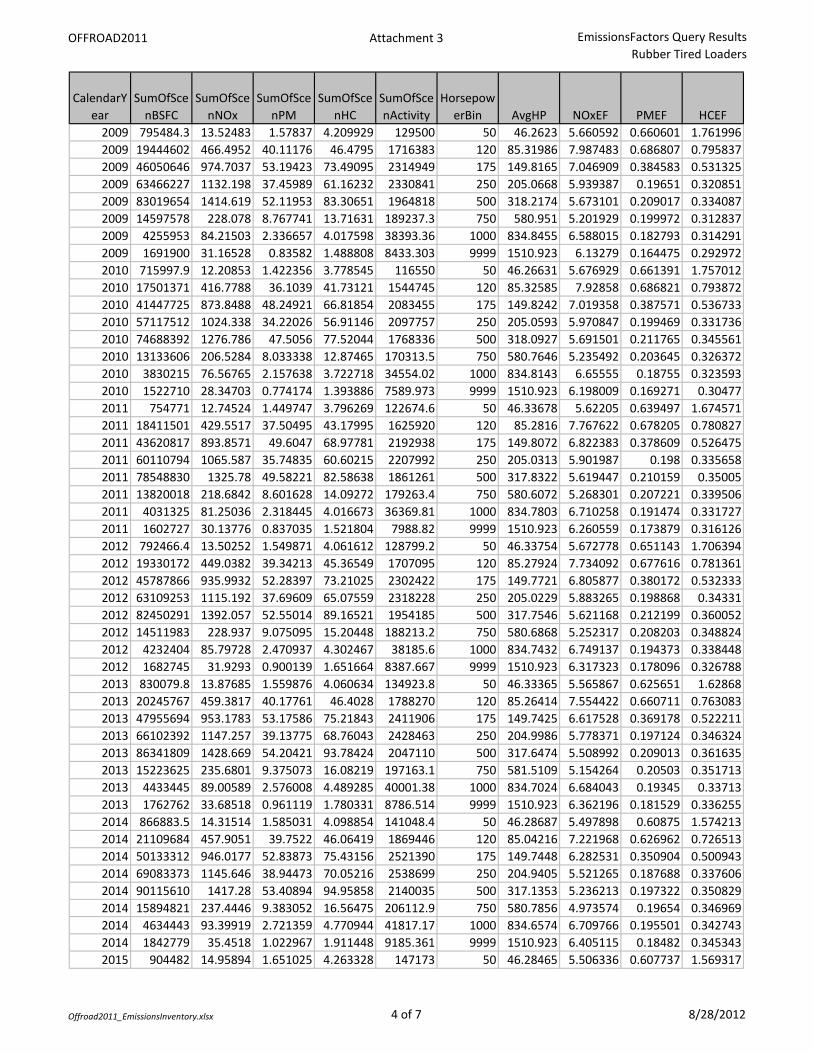
OFFROAD2011 Attachment 3 EmissionsFactors Query ResultsRubber Tired Loaders
Offroad2011_EmissionsInventory.xlsx 4 of 7 8/28/2012
CalendarYear
SumOfScenBSFC
SumOfScenNOx
SumOfScenPM
SumOfScenHC
SumOfScenActivity
HorsepowerBin AvgHP NOxEF PMEF HCEF
2009 795484.3 13.52483 1.57837 4.209929 129500 50 46.2623 5.660592 0.660601 1.7619962009 19444602 466.4952 40.11176 46.4795 1716383 120 85.31986 7.987483 0.686807 0.7958372009 46050646 974.7037 53.19423 73.49095 2314949 175 149.8165 7.046909 0.384583 0.5313252009 63466227 1132.198 37.45989 61.16232 2330841 250 205.0668 5.939387 0.19651 0.3208512009 83019654 1414.619 52.11953 83.30651 1964818 500 318.2174 5.673101 0.209017 0.3340872009 14597578 228.078 8.767741 13.71631 189237.3 750 580.951 5.201929 0.199972 0.3128372009 4255953 84.21503 2.336657 4.017598 38393.36 1000 834.8455 6.588015 0.182793 0.3142912009 1691900 31.16528 0.83582 1.488808 8433.303 9999 1510.923 6.13279 0.164475 0.2929722010 715997.9 12.20853 1.422356 3.778545 116550 50 46.26631 5.676929 0.661391 1.7570122010 17501371 416.7788 36.1039 41.73121 1544745 120 85.32585 7.92858 0.686821 0.7938722010 41447725 873.8488 48.24921 66.81854 2083455 175 149.8242 7.019358 0.387571 0.5367332010 57117512 1024.338 34.22026 56.91146 2097757 250 205.0593 5.970847 0.199469 0.3317362010 74688392 1276.786 47.5056 77.52044 1768336 500 318.0927 5.691501 0.211765 0.3455612010 13133606 206.5284 8.033338 12.87465 170313.5 750 580.7646 5.235492 0.203645 0.3263722010 3830215 76.56765 2.157638 3.722718 34554.02 1000 834.8143 6.65555 0.18755 0.3235932010 1522710 28.34703 0.774174 1.393886 7589.973 9999 1510.923 6.198009 0.169271 0.304772011 754771 12.74524 1.449747 3.796269 122674.6 50 46.33678 5.62205 0.639497 1.6745712011 18411501 429.5517 37.50495 43.17995 1625920 120 85.2816 7.767622 0.678205 0.7808272011 43620817 893.8571 49.6047 68.97781 2192938 175 149.8072 6.822383 0.378609 0.5264752011 60110794 1065.587 35.74835 60.60215 2207992 250 205.0313 5.901987 0.198 0.3356582011 78548830 1325.78 49.58221 82.58638 1861261 500 317.8322 5.619447 0.210159 0.350052011 13820018 218.6842 8.601628 14.09272 179263.4 750 580.6072 5.268301 0.207221 0.3395062011 4031325 81.25036 2.318445 4.016673 36369.81 1000 834.7803 6.710258 0.191474 0.3317272011 1602727 30.13776 0.837035 1.521804 7988.82 9999 1510.923 6.260559 0.173879 0.3161262012 792466.4 13.50252 1.549871 4.061612 128799.2 50 46.33754 5.672778 0.651143 1.7063942012 19330172 449.0382 39.34213 45.36549 1707095 120 85.27924 7.734092 0.677616 0.7813612012 45787866 935.9932 52.28397 73.21025 2302422 175 149.7721 6.805877 0.380172 0.5323332012 63109253 1115.192 37.69609 65.07559 2318228 250 205.0229 5.883265 0.198868 0.343312012 82450291 1392.057 52.55014 89.16521 1954185 500 317.7546 5.621168 0.212199 0.3600522012 14511983 228.937 9.075095 15.20448 188213.2 750 580.6868 5.252317 0.208203 0.3488242012 4232404 85.79728 2.470937 4.302467 38185.6 1000 834.7432 6.749137 0.194373 0.3384482012 1682745 31.9293 0.900139 1.651664 8387.667 9999 1510.923 6.317323 0.178096 0.3267882013 830079.8 13.87685 1.559876 4.060634 134923.8 50 46.33365 5.565867 0.625651 1.628682013 20245767 459.3817 40.17761 46.4028 1788270 120 85.26414 7.554422 0.660711 0.7630832013 47955694 953.1783 53.17586 75.21843 2411906 175 149.7425 6.617528 0.369178 0.5222112013 66102392 1147.257 39.13775 68.76043 2428463 250 204.9986 5.778371 0.197124 0.3463242013 86341809 1428.669 54.20421 93.78424 2047110 500 317.6474 5.508992 0.209013 0.3616352013 15223625 235.6801 9.375073 16.08219 197163.1 750 581.5109 5.154264 0.20503 0.3517132013 4433445 89.00589 2.576008 4.489285 40001.38 1000 834.7024 6.684043 0.19345 0.337132013 1762762 33.68518 0.961119 1.780331 8786.514 9999 1510.923 6.362196 0.181529 0.3362552014 866883.5 14.31514 1.585031 4.098854 141048.4 50 46.28687 5.497898 0.60875 1.5742132014 21109684 457.9051 39.7522 46.06419 1869446 120 85.04216 7.221968 0.626962 0.7265132014 50133312 946.0177 52.83873 75.43156 2521390 175 149.7448 6.282531 0.350904 0.5009432014 69083373 1145.646 38.94473 70.05216 2538699 250 204.9405 5.521265 0.187688 0.3376062014 90115610 1417.28 53.40894 94.95858 2140035 500 317.1353 5.236213 0.197322 0.3508292014 15894821 237.4446 9.383052 16.56475 206112.9 750 580.7856 4.973574 0.19654 0.3469692014 4634443 93.39919 2.721359 4.770944 41817.17 1000 834.6574 6.709766 0.195501 0.3427432014 1842779 35.4518 1.022967 1.911448 9185.361 9999 1510.923 6.405115 0.18482 0.3453432015 904482 14.95894 1.651025 4.263328 147173 50 46.28465 5.506336 0.607737 1.569317
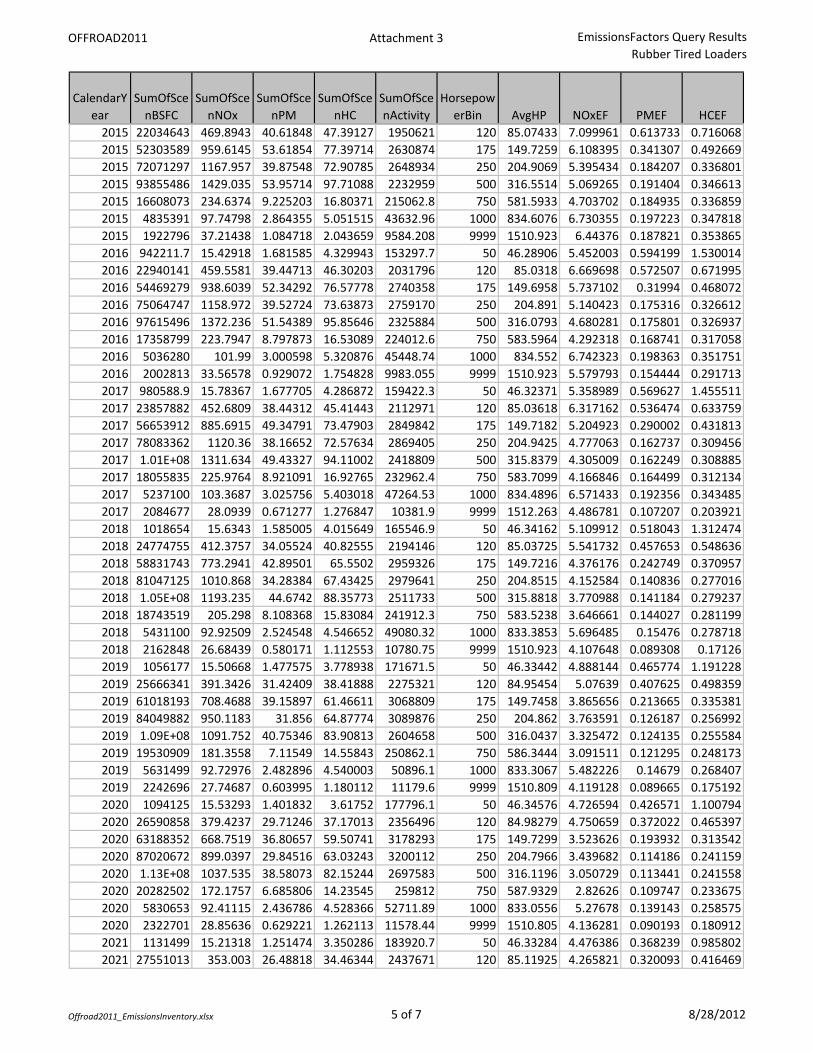
OFFROAD2011 Attachment 3 EmissionsFactors Query ResultsRubber Tired Loaders
Offroad2011_EmissionsInventory.xlsx 5 of 7 8/28/2012
CalendarYear
SumOfScenBSFC
SumOfScenNOx
SumOfScenPM
SumOfScenHC
SumOfScenActivity
HorsepowerBin AvgHP NOxEF PMEF HCEF
2015 22034643 469.8943 40.61848 47.39127 1950621 120 85.07433 7.099961 0.613733 0.7160682015 52303589 959.6145 53.61854 77.39714 2630874 175 149.7259 6.108395 0.341307 0.4926692015 72071297 1167.957 39.87548 72.90785 2648934 250 204.9069 5.395434 0.184207 0.3368012015 93855486 1429.035 53.95714 97.71088 2232959 500 316.5514 5.069265 0.191404 0.3466132015 16608073 234.6374 9.225203 16.80371 215062.8 750 581.5933 4.703702 0.184935 0.3368592015 4835391 97.74798 2.864355 5.051515 43632.96 1000 834.6076 6.730355 0.197223 0.3478182015 1922796 37.21438 1.084718 2.043659 9584.208 9999 1510.923 6.44376 0.187821 0.3538652016 942211.7 15.42918 1.681585 4.329943 153297.7 50 46.28906 5.452003 0.594199 1.5300142016 22940141 459.5581 39.44713 46.30203 2031796 120 85.0318 6.669698 0.572507 0.6719952016 54469279 938.6039 52.34292 76.57778 2740358 175 149.6958 5.737102 0.31994 0.4680722016 75064747 1158.972 39.52724 73.63873 2759170 250 204.891 5.140423 0.175316 0.3266122016 97615496 1372.236 51.54389 95.85646 2325884 500 316.0793 4.680281 0.175801 0.3269372016 17358799 223.7947 8.797873 16.53089 224012.6 750 583.5964 4.292318 0.168741 0.3170582016 5036280 101.99 3.000598 5.320876 45448.74 1000 834.552 6.742323 0.198363 0.3517512016 2002813 33.56578 0.929072 1.754828 9983.055 9999 1510.923 5.579793 0.154444 0.2917132017 980588.9 15.78367 1.677705 4.286872 159422.3 50 46.32371 5.358989 0.569627 1.4555112017 23857882 452.6809 38.44312 45.41443 2112971 120 85.03618 6.317162 0.536474 0.6337592017 56653912 885.6915 49.34791 73.47903 2849842 175 149.7182 5.204923 0.290002 0.4318132017 78083362 1120.36 38.16652 72.57634 2869405 250 204.9425 4.777063 0.162737 0.3094562017 1.01E+08 1311.634 49.43327 94.11002 2418809 500 315.8379 4.305009 0.162249 0.3088852017 18055835 225.9764 8.921091 16.92765 232962.4 750 583.7099 4.166846 0.164499 0.3121342017 5237100 103.3687 3.025756 5.403018 47264.53 1000 834.4896 6.571433 0.192356 0.3434852017 2084677 28.0939 0.671277 1.276847 10381.9 9999 1512.263 4.486781 0.107207 0.2039212018 1018654 15.6343 1.585005 4.015649 165546.9 50 46.34162 5.109912 0.518043 1.3124742018 24774755 412.3757 34.05524 40.82555 2194146 120 85.03725 5.541732 0.457653 0.5486362018 58831743 773.2941 42.89501 65.5502 2959326 175 149.7216 4.376176 0.242749 0.3709572018 81047125 1010.868 34.28384 67.43425 2979641 250 204.8515 4.152584 0.140836 0.2770162018 1.05E+08 1193.235 44.6742 88.35773 2511733 500 315.8818 3.770988 0.141184 0.2792372018 18743519 205.298 8.108368 15.83084 241912.3 750 583.5238 3.646661 0.144027 0.2811992018 5431100 92.92509 2.524548 4.546652 49080.32 1000 833.3853 5.696485 0.15476 0.2787182018 2162848 26.68439 0.580171 1.112553 10780.75 9999 1510.923 4.107648 0.089308 0.171262019 1056177 15.50668 1.477575 3.778938 171671.5 50 46.33442 4.888144 0.465774 1.1912282019 25666341 391.3426 31.42409 38.41888 2275321 120 84.95454 5.07639 0.407625 0.4983592019 61018193 708.4688 39.15897 61.46611 3068809 175 149.7458 3.865656 0.213665 0.3353812019 84049882 950.1183 31.856 64.87774 3089876 250 204.862 3.763591 0.126187 0.2569922019 1.09E+08 1091.752 40.75346 83.90813 2604658 500 316.0437 3.325472 0.124135 0.2555842019 19530909 181.3558 7.11549 14.55843 250862.1 750 586.3444 3.091511 0.121295 0.2481732019 5631499 92.72976 2.482896 4.540003 50896.1 1000 833.3067 5.482226 0.14679 0.2684072019 2242696 27.74687 0.603995 1.180112 11179.6 9999 1510.809 4.119128 0.089665 0.1751922020 1094125 15.53293 1.401832 3.61752 177796.1 50 46.34576 4.726594 0.426571 1.1007942020 26590858 379.4237 29.71246 37.17013 2356496 120 84.98279 4.750659 0.372022 0.4653972020 63188352 668.7519 36.80657 59.50741 3178293 175 149.7299 3.523626 0.193932 0.3135422020 87020672 899.0397 29.84516 63.03243 3200112 250 204.7966 3.439682 0.114186 0.2411592020 1.13E+08 1037.535 38.58073 82.15244 2697583 500 316.1196 3.050729 0.113441 0.2415582020 20282502 172.1757 6.685806 14.23545 259812 750 587.9329 2.82626 0.109747 0.2336752020 5830653 92.41115 2.436786 4.528366 52711.89 1000 833.0556 5.27678 0.139143 0.2585752020 2322701 28.85636 0.629221 1.262113 11578.44 9999 1510.805 4.136281 0.090193 0.1809122021 1131499 15.21318 1.251474 3.350286 183920.7 50 46.33284 4.476386 0.368239 0.9858022021 27551013 353.003 26.48818 34.46344 2437671 120 85.11925 4.265821 0.320093 0.416469

OFFROAD2011 Attachment 3 EmissionsFactors Query ResultsRubber Tired Loaders
Offroad2011_EmissionsInventory.xlsx 6 of 7 8/28/2012
CalendarYear
SumOfScenBSFC
SumOfScenNOx
SumOfScenPM
SumOfScenHC
SumOfScenActivity
HorsepowerBin AvgHP NOxEF PMEF HCEF
2021 65346561 613.4135 33.54525 56.25789 3287777 175 149.6876 3.125305 0.170911 0.2866312021 90028168 814.8947 27.17398 59.78651 3310347 250 204.819 3.013595 0.100493 0.2210992021 1.17E+08 928.723 34.66658 77.70099 2790507 500 316.8948 2.63339 0.098297 0.2203212021 20974908 169.9779 6.587371 14.43531 268761.8 750 587.7571 2.698076 0.104562 0.2291332021 6048477 90.53184 2.327053 4.424395 54527.67 1000 835.3999 4.983301 0.128092 0.243542021 2402705 29.96662 0.654491 1.345334 11977.29 9999 1510.801 4.152399 0.090691 0.186422022 1169715 15.00549 1.119768 3.078283 190045.3 50 46.35412 4.271023 0.31872 0.8761742022 28472884 326.117 23.06515 31.47732 2518847 120 85.13244 3.813324 0.269703 0.3680682022 67500681 511.749 27.5991 49.53335 3397261 175 149.6389 2.524124 0.136128 0.2443162022 93093466 659.2349 22.11232 52.47907 3420583 250 204.9673 2.357669 0.079082 0.1876852022 1.21E+08 799.6874 29.85869 71.91101 2883432 500 317.0309 2.193492 0.0819 0.1972472022 21756150 139.4706 5.320019 12.79927 277711.6 750 590.0018 2.134335 0.081413 0.1958692022 6271113 68.00467 1.40034 2.991675 56343.46 1000 838.2363 3.610405 0.074345 0.158832022 2482709 31.07632 0.67977 1.429614 12376.14 9999 1510.797 4.167404 0.091159 0.1917142023 1206291 14.74845 0.990241 2.82886 196169.9 50 46.31107 4.07058 0.273307 0.7807672023 29394561 313.7071 21.30253 30.41317 2600022 120 85.14426 3.553196 0.241283 0.3444742023 69636494 460.6434 24.66173 46.67714 3506745 175 149.554 2.202368 0.117909 0.2231672023 96077230 597.178 19.99711 50.28917 3530818 250 204.9323 2.069403 0.069296 0.1742672023 1.25E+08 708.2173 26.34807 68.10065 2976357 500 317.2593 1.880591 0.069964 0.1808342023 22492919 132.301 5.113731 12.84973 286661.5 750 590.9379 1.9583 0.075693 0.19022023 6465622 68.47599 1.378665 3.092152 58159.25 1000 837.2534 3.526061 0.070992 0.1592252023 2562711 32.1838 0.705016 1.514787 12774.98 9999 1510.792 4.181187 0.091593 0.1967952024 1243776 15.02851 0.962798 2.804497 202294.5 50 46.30453 4.022866 0.257724 0.7507142024 30328532 307.5767 20.30936 30.24943 2681197 120 85.18989 3.376477 0.22295 0.3320682024 71764308 407.4853 21.73469 43.97715 3616229 175 149.4576 1.89045 0.100834 0.2040242024 99069158 539.9836 18.06702 48.69311 3641054 250 204.9164 1.814696 0.060717 0.1636412024 1.29E+08 665.9032 24.70506 67.71969 3069281 500 317.2914 1.714523 0.063609 0.174362024 23210661 133.1878 5.105091 13.1984 295611.3 750 591.3326 1.910463 0.073228 0.189322024 6668080 70.92734 1.429801 3.31863 59975.03 1000 837.3281 3.541398 0.07139 0.1656992024 2642712 33.39659 0.732805 1.6022 13173.83 9999 1510.787 4.207402 0.092321 0.201852025 1257637 14.80015 0.880293 2.700925 204674.7 50 46.27606 3.918075 0.233042 0.7150212025 30691281 276.8333 16.67371 27.10479 2712744 120 85.20628 3.003068 0.180875 0.2940312025 72624548 348.0578 18.37816 40.4613 3658778 175 149.4902 1.595621 0.084252 0.1854892025 1E+08 436.2477 14.65447 44.34216 3683894 250 204.9529 1.448769 0.048667 0.1472592025 1.31E+08 567.223 20.79148 63.18094 3105395 500 317.7181 1.441525 0.052839 0.1605662025 23493193 118.4749 4.581728 12.56269 299089.5 750 591.5701 1.678983 0.064931 0.1780342025 6748115 62.54633 1.053847 2.769147 60680.7 1000 837.524 3.085895 0.051994 0.1366232025 2673796 33.99149 0.746976 1.657077 13328.84 9999 1510.781 4.232566 0.093012 0.2063372026 1272784 14.22646 0.737557 2.472334 207055 50 46.29504 3.72138 0.192931 0.6467172026 31075468 258.976 14.65046 25.57071 2744291 120 85.28112 2.774621 0.156962 0.273962026 73478874 306.7472 15.91916 38.39913 3701326 175 149.5101 1.389888 0.072131 0.1739892026 1.01E+08 381.1347 12.94906 42.89021 3726735 250 204.8744 1.251669 0.042525 0.1408542026 1.33E+08 524.4631 19.11961 61.93119 3141508 500 317.697 1.317622 0.048035 0.1555912026 23792564 109.828 4.154625 12.20825 302567.7 750 592.2214 1.536858 0.058137 0.1708342026 6827373 63.71525 1.077633 2.949595 61386.37 1000 837.62 3.107074 0.052551 0.1438372026 2705145 33.85727 0.739202 1.492533 13483.84 9999 1510.923 4.166997 0.090978 0.1836942027 1287182 14.23859 0.703119 2.420637 209435.2 50 46.28664 3.682892 0.181866 0.6261112027 31425244 242.7363 12.54497 24.05942 2775838 120 85.26089 2.571685 0.132909 0.2548992027 74348715 275.0632 13.97286 36.82471 3743875 175 149.5607 1.231745 0.062571 0.164903

OFFROAD2011 Attachment 3 EmissionsFactors Query ResultsRubber Tired Loaders
Offroad2011_EmissionsInventory.xlsx 7 of 7 8/28/2012
CalendarYear
SumOfScenBSFC
SumOfScenNOx
SumOfScenPM
SumOfScenHC
SumOfScenActivity
HorsepowerBin AvgHP NOxEF PMEF HCEF
2027 1.03E+08 323.2244 11.22077 41.19653 3769576 250 204.8941 1.049323 0.036427 0.1337412027 1.34E+08 472.7879 17.56584 60.85875 3177621 500 317.7 1.174287 0.043629 0.1511582027 24057547 94.09608 3.466569 11.50262 306045.9 750 592.0116 1.302213 0.047974 0.1591872027 6906731 64.85395 1.100276 3.123887 62092.04 1000 837.7259 3.126264 0.053038 0.1505862027 2736242 34.35132 0.750215 1.511142 13638.84 9999 1510.923 4.179754 0.091284 0.1838712028 1301697 13.99635 0.634036 2.334328 211815.4 50 46.2826 3.579865 0.162168 0.5970542028 31797695 231.2234 10.96646 23.03595 2807385 120 85.30196 2.421017 0.114824 0.2411972028 75196782 245.98 12.12649 35.38693 3786424 175 149.5669 1.089087 0.053691 0.1566772028 1.04E+08 292.6777 10.24971 41.1205 3812417 250 204.9673 0.939143 0.032889 0.1319472028 1.35E+08 449.8796 16.70758 61.24265 3213735 500 317.3387 1.10609 0.041078 0.1505732028 24288127 88.70153 3.299128 11.41824 309524.1 750 590.9694 1.215903 0.045224 0.1565192028 6985276 66.10231 1.128655 3.292656 62797.71 1000 837.732 3.150611 0.053795 0.1569372028 2767339 34.85036 0.761995 1.560496 13793.85 9999 1510.923 4.192824 0.091675 0.1877422029 1318779 13.93336 0.571985 2.239748 214195.6 50 46.36892 3.517594 0.144402 0.5654432029 32174771 225.7992 10.18067 22.89696 2838932 120 85.35437 2.336516 0.105347 0.2369322029 76095795 221.2058 10.82451 34.53263 3828973 175 149.6731 0.967827 0.04736 0.1510882029 1.05E+08 273.4534 9.629486 41.49637 3855258 250 204.9765 0.867667 0.030554 0.1316682029 1.37E+08 424.5485 15.84455 61.23872 3249848 500 316.9402 1.033509 0.038572 0.1490782029 24537796 87.22084 3.237043 11.70892 313002.2 750 590.4097 1.183441 0.043921 0.158872029 7063164 65.81549 1.101656 3.36654 63503.38 1000 837.6601 3.102349 0.051929 0.1586892029 2798437 26.56762 0.435185 1.070151 13948.85 9999 1510.923 3.160814 0.051775 0.127318
Note: Emissions factors have fuel correction factor incorporated.
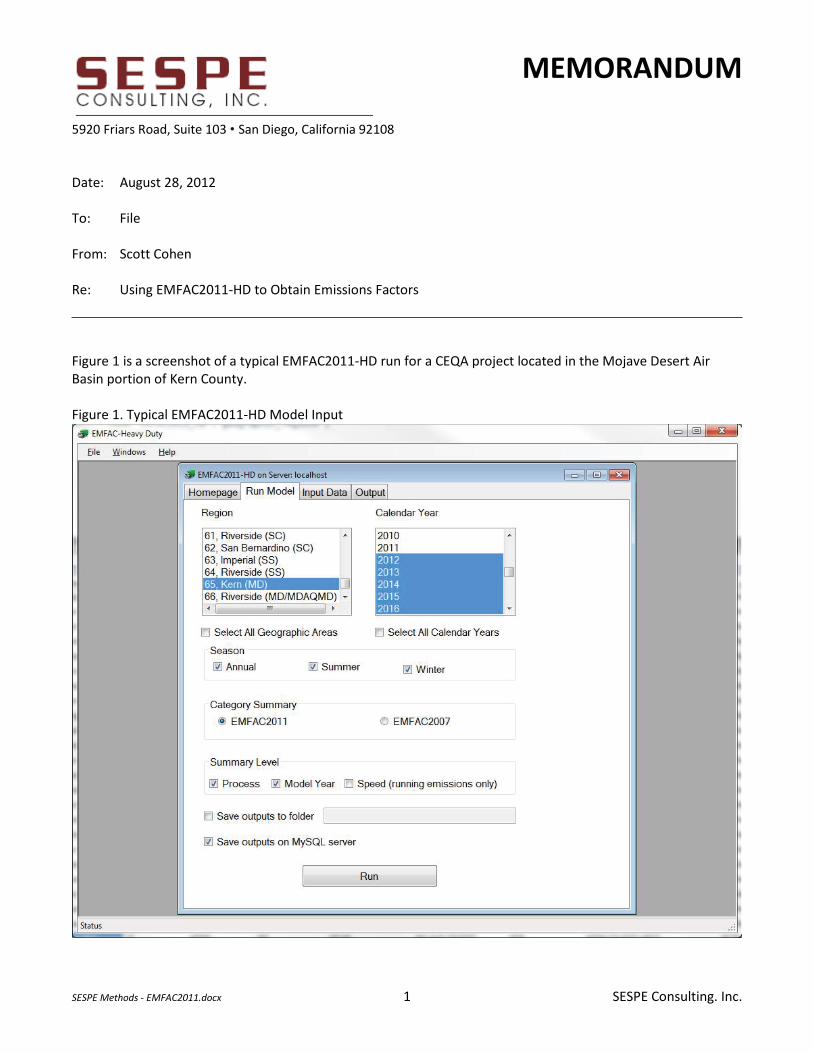
MEMORANDUM 5920 Friars Road, Suite 103 • San Diego, California 92108
SESPE Methods - EMFAC2011.docx 1 SESPE Consulting. Inc.
Date: August 28, 2012 To: File From: Scott Cohen Re: Using EMFAC2011-HD to Obtain Emissions Factors Figure 1 is a screenshot of a typical EMFAC2011-HD run for a CEQA project located in the Mojave Desert Air Basin portion of Kern County. Figure 1. Typical EMFAC2011-HD Model Input

Using EMFAC2011-HD to Obtain Emissions Factors August 28, 2012
SESPE Methods - EMFAC2011.docx 2 SESPE Consulting. Inc.
Figure 2 shows the tables that are generated by EMFFAC2011-HD in the emfac2011_hd_outputs schema. MySQL Workbench and MySQL server must be installed in order to perform the remaining tasks. Figure 2. Tables in emfac2011_hd_outputs Schema

Using EMFAC2011-HD to Obtain Emissions Factors August 28, 2012
SESPE Methods - EMFAC2011.docx 3 SESPE Consulting. Inc.
The contents of the emfac2011_hd_outputs schema must be moved in order to prevent them from being overwritten by a later run of the model. This is accomplished by exporting the data as shown in Figure 3. Figure 3. Export Data from emfac2011_hd_output Schema
The dumped tables have references to the emfac2011_hd_outputs schema that must be manually changed in order to reload them with a different schema name. Each file is opened using BigFileEditor (http://mascix.com) and the schema name is changed manually in three places near the top of each file as shown in Figure 4.

Using EMFAC2011-HD to Obtain Emissions Factors August 28, 2012
SESPE Methods - EMFAC2011.docx 4 SESPE Consulting. Inc.
Figure 4. Use BigFileEditor to Change Schema Name
Once the files are edited to reference a new schema name, then import them using MySQL Workbench. Ensure that the file extension remains sql and has not been changed to txt by BigFileEditor when you save it. In the example case, two tables were needed to perform the calculations described later. Idling emissions factors are the same in all geographic regions and emissions estimates are discussed later in this document. Figure 5 shows the import screen. Once the import is complete then, the tables will be available to query without having to worry about overwriting them. It may be easier to rename the tables with a more common name. For this example, the two tables are renamed as follows:
emfac_hd_ei_output_summary_gai_65 summary emfac_hd_ei_output_by_spd_gai_65 byspeed
Change schema names at three locations. The example uses “KernMD” as the new schema name.

Using EMFAC2011-HD to Obtain Emissions Factors August 28, 2012
SESPE Methods - EMFAC2011.docx 5 SESPE Consulting. Inc.
Figure 5. Import Tables into New Schema
Typically, there are a few factors that are used in evaluation of running emissions for heavy-heavy duty trucks:
Average emissions factors that incorporate all speeds and idling for each calendar year. This type of factor would be used to estimate emissions from off-site truck travel. If daily emissions are required, then seasonal emissions may be more appropriate to use. For annual emissions, the annual emissions should be used. Emissions factors at a specific speed. This type of factor would be used to estimate emissions from on-site truck travel or for a road with a known speed limit. On-site travel is typically assumed to occur at a speed of 15 mph. Seasonal or annual emissions should be selected as appropriate.
1. Average Emissions Factors (all speeds)
The above emissions factors can be derived from EMFAC2011-HD by running queries on the table data. MySQL Workbench allows queries to be saved as views. The views can be used with each other. The first view created is named “emissions” and it returns results (Attachment 1) from the following query:
select`kernmd`.`summary`.`CalYr` AS `CalYr`,(sum(`kernmd`.`summary`.`vmt`)/3) AS `Total_VMT`,sum(`kernmd`.`summary`.`ROG`) AS `Total_ROG`,sum(`kernmd`.`summary`.`NOx`) AS `Total_NOx`,sum(`kernmd`.`summary`.`CO`) AS `Total_CO`,sum(`kernmd`.`summary`.`SOx`) AS `Total_SOx`,sum(`kernmd`.`summary`.`PM10`) AS `Total_PM10`,sum(`kernmd`.`summary`.`PM2_5`) AS `Total_PM2_5`,sum(`kernmd`.`summary`.`CO2`) AS `Total_CO2`,sum(`kernmd`.`summary`.`Fuel_DSL`) AS `Total_Fuel_DSL`
from`kernmd`.`summary`
where(`kernmd`.`summary`.`Veh` = 'T7 tractor construction')
group by `kernmd`.`summary`.`CalYr`
Using EMFAC2011-HD to Obtain Emissions Factors August 28, 2012
SESPE Methods - EMFAC2011.docx 6 SESPE Consulting. Inc.
The “emissions” view calculates total emissions of each pollutant, total fuel use, and total vehicle miles traveled (VMT) for a region. VMT is divided by three (3) because the model results contain VMT in triplicate (i.e. the same VMT appears in rows for running emissions, brake wear, and tire wear). The “emissions” view example above limits the vehicle type to “T7 tractor construction” and could be modified to select a season, model year range, other vehicle types, etc. by changing the WHERE clause. The “factors” view calculates emissions factors and miles per gallon operating on results of the “emissions” view in the following query:
select`emissions`.`CalYr` AS `CalYr`,((`emissions`.`Total_ROG`*2000)/`emissions`.`Total_VMT`) AS `ROG_EF`,((`emissions`.`Total_CO`*2000)/`emissions`.`Total_VMT`) AS `CO_EF`,((`emissions`.`Total_NOx`*2000)/`emissions`.`Total_VMT`) AS `NOx_EF`,((`emissions`.`Total_CO2`*2000)/`emissions`.`Total_VMT`) AS `CO2_EF`,((`emissions`.`Total_PM10`*2000)/`emissions`.`Total_VMT`) AS `PM10_EF`,((`emissions`.`Total_SOx`*2000)/`emissions`.`Total_VMT`) AS `SOx_EF`,((`emissions`.`Total_VMT`/`emissions`.`Total_Fuel_DSL`)/1000) AS `MPG`
from`kernmd`.`emissions`
Total emissions of each pollutant is converted from tons to pounds and then divided by Total VMT to determine the annual average emissions factor in units of pounds per VMT for each pollutant by calendar year for “T7 tractor construction” type vehicles.
2. Emissions Factors by Speed The following query is assigned to a view named “emissionsbyspeed-15a” and returns annual average emissions from “T7 tractor construction” type vehicles while running at 15 mph by calendar year (Attachment 3).
select`kernmd`.`byspeed`.`CalYr` AS `CalYr`,sum(`kernmd`.`byspeed`.`vmt`) AS `Total_VMT`,sum(`kernmd`.`byspeed`.`ROG`) AS `Total_ROG`,sum(`kernmd`.`byspeed`.`NOx`) AS `Total_NOx`,sum(`kernmd`.`byspeed`.`CO`) AS `Total_CO`,sum(`kernmd`.`byspeed`.`SOx`) AS `Total_SOx`,sum(`kernmd`.`byspeed`.`PM10`) AS `Total_PM10`,sum(`kernmd`.`byspeed`.`PM2_5`) AS `Total_PM2_5`,sum(`kernmd`.`byspeed`.`CO2`) AS `Total_CO2`,sum(`kernmd`.`byspeed`.`Fuel_DSL`) AS `Total_Fuel_DSL`
from`kernmd`.`byspeed`
where((`kernmd`.`byspeed`.`Veh` = 'T7 tractor construction') and
(`kernmd`.`byspeed`.`Season` = 'a') and (`kernmd`.`byspeed`.`Speed_bin` = 15))group by `kernmd`.`byspeed`.`CalYr`
Using EMFAC2011-HD to Obtain Emissions Factors August 28, 2012
SESPE Methods - EMFAC2011.docx 7 SESPE Consulting. Inc.
A second view named “factorsbyspeed-15a” contains the following query which produces emissions factors in units of lb/VMT and miles per gallon (Attachment 4).
select`emissionsbyspeed-15a`.`CalYr` AS `CalYr`,((`emissionsbyspeed-15a`.`Total_ROG`*2000)/`emissionsbyspeed-
15a`.`Total_VMT`) AS `ROG_EF`,((`emissionsbyspeed-15a`.`Total_CO`*2000)/`emissionsbyspeed-15a`.`Total_VMT`)
AS `CO_EF`,((`emissionsbyspeed-15a`.`Total_NOx`*2000)/`emissionsbyspeed-
15a`.`Total_VMT`) AS `NOx_EF`,((`emissionsbyspeed-15a`.`Total_CO2`*2000)/`emissionsbyspeed-
15a`.`Total_VMT`) AS `CO2_EF`,((`emissionsbyspeed-15a`.`Total_PM10`*2000)/`emissionsbyspeed-
15a`.`Total_VMT`) AS `PM10_EF`,((`emissionsbyspeed-15a`.`Total_SOx`*2000)/`emissionsbyspeed-
15a`.`Total_VMT`) AS `SOx_EF`,((`emissionsbyspeed-15a`.`Total_VMT`/`emissionsbyspeed-
15a`.`Total_Fuel_DSL`)/1000) AS `MPG`from
`kernmd`.`emissionsbyspeed-15a`

EMFAC2011-HD Attachment 1 emissions
EMFAC2011 Methods.xlsx 1 of 4 8/28/2012
CalYr Total_VMT Total_ROG Total_NOx Total_CO Total_SOx Total_PM10 Total_PM2_5 Total_CO2 Total_Fuel_DSL2012 9423.37093 0.008066629 0.138404642 0.03677079 0.000174925 0.006203732 0.005141723 18.33507956 1.6501571612013 10475.84077 0.008003753 0.143422764 0.036805418 0.000194956 0.006075046 0.004960149 20.43461003 1.8391149032014 11589.70234 0.006195982 0.147231846 0.028901341 0.000216881 0.004586902 0.003524188 22.73272979 2.0459456812015 12766.41984 0.005681756 0.141788012 0.026353218 0.000238502 0.004010251 0.002923028 24.99897757 2.2499079812016 14007.4274 0.00422522 0.131916566 0.020085444 0.000262448 0.00302484 0.001941948 27.50887714 2.4757989422017 15314.18296 0.004404384 0.128956698 0.021147266 0.000286674 0.003062225 0.001897895 30.04821834 2.704339652018 15998.50698 0.004682058 0.120881057 0.022592429 0.000299207 0.003181871 0.001966887 31.36192954 2.8225736592019 16697.5566 0.004888696 0.114345646 0.023695833 0.000312054 0.003302714 0.002036096 32.70843235 2.9437589112020 17411.33182 0.005216121 0.093901691 0.0254842 0.000325417 0.003420949 0.002102023 34.10909537 3.0698185842021 17627.24226 0.00553968 0.069014128 0.027324799 0.000329333 0.003431911 0.002099146 34.51962574 3.1067663172022 17839.49143 0.005950424 0.053312733 0.029454545 0.000333354 0.003430608 0.002085206 34.94108389 3.144697552023 18048.07933 0.005701599 0.047464196 0.028365944 0.000336715 0.00343484 0.002076577 35.29334805 3.1764013242024 18253.00596 0.005775508 0.048272443 0.028727547 0.000340471 0.003482696 0.002108302 35.68703866 3.2118334792025 18454.27132 0.005852855 0.049057263 0.029107189 0.000344195 0.003529405 0.002139191 36.07735709 3.2469621382026 18651.87542 0.005923469 0.049711846 0.029456374 0.000347869 0.003571825 0.002166356 36.46243188 3.2816188692027 18845.81824 0.005981157 0.050185593 0.029745962 0.00035148 0.003608307 0.002188276 36.84097064 3.3156873582028 19036.0998 0.006028733 0.050560292 0.029987077 0.000355011 0.00364103 0.002206958 37.21104014 3.3489936132029 19222.72009 0.006076414 0.050957488 0.030229708 0.000358485 0.003673006 0.002225172 37.57519933 3.381767942030 19405.67911 0.006129296 0.051407917 0.030496523 0.000361901 0.003706191 0.002244719 37.93328549 3.4139956942031 19792.94666 0.006250966 0.052432792 0.03110322 0.000369128 0.00377984 0.002289228 38.6907817 3.4821703532032 20182.87843 0.006371999 0.053437936 0.031707122 0.000376403 0.003853461 0.00233355 39.45333838 3.5508004542033 20575.47442 0.006491467 0.054422627 0.03230313 0.000383721 0.003926931 0.002377575 40.22031705 3.6198285352034 20970.73462 0.00661045 0.05541877 0.032896827 0.000391084 0.004000534 0.002421561 40.992154 3.689293862035 21368.65904 0.006732975 0.056444688 0.033507392 0.000398501 0.004075538 0.002466675 41.76954839 3.759259355
Emissions are in units of tons per day and diesel fuel is in units of 1,000 gallons per day.
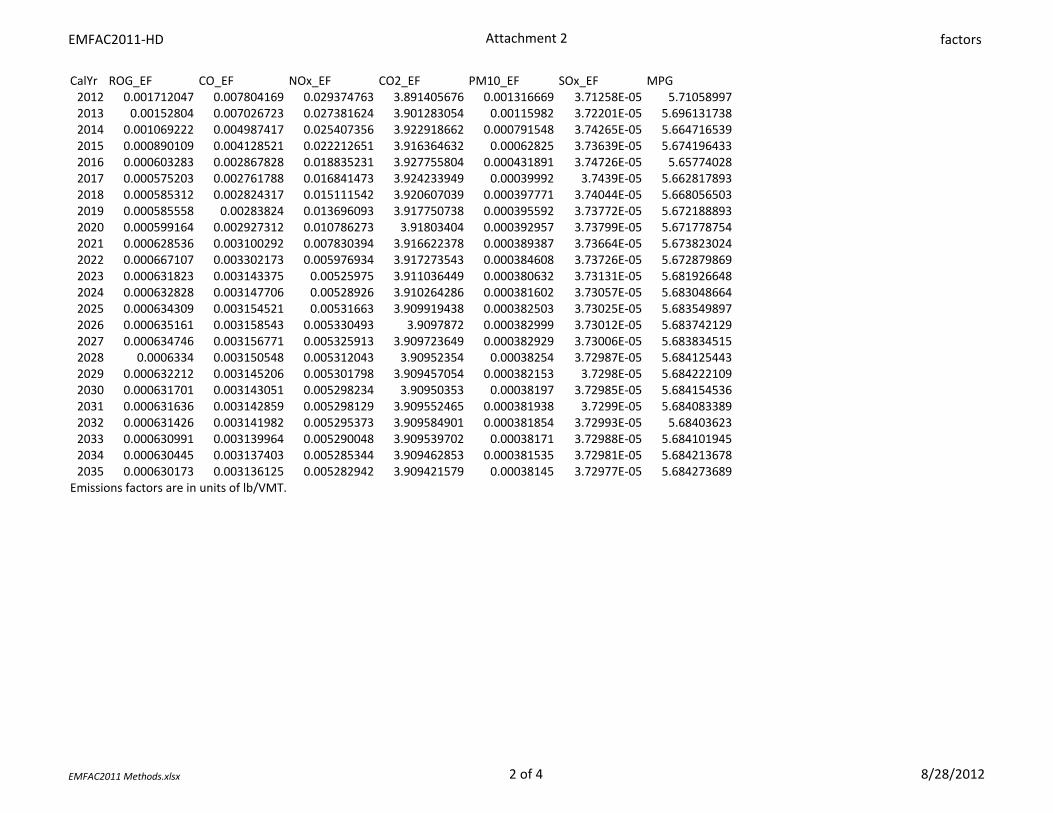
EMFAC2011-HD Attachment 2 factors
EMFAC2011 Methods.xlsx 2 of 4 8/28/2012
CalYr ROG_EF CO_EF NOx_EF CO2_EF PM10_EF SOx_EF MPG2012 0.001712047 0.007804169 0.029374763 3.891405676 0.001316669 3.71258E-05 5.710589972013 0.00152804 0.007026723 0.027381624 3.901283054 0.00115982 3.72201E-05 5.6961317382014 0.001069222 0.004987417 0.025407356 3.922918662 0.000791548 3.74265E-05 5.6647165392015 0.000890109 0.004128521 0.022212651 3.916364632 0.00062825 3.73639E-05 5.6741964332016 0.000603283 0.002867828 0.018835231 3.927755804 0.000431891 3.74726E-05 5.657740282017 0.000575203 0.002761788 0.016841473 3.924233949 0.00039992 3.7439E-05 5.6628178932018 0.000585312 0.002824317 0.015111542 3.920607039 0.000397771 3.74044E-05 5.6680565032019 0.000585558 0.00283824 0.013696093 3.917750738 0.000395592 3.73772E-05 5.6721888932020 0.000599164 0.002927312 0.010786273 3.91803404 0.000392957 3.73799E-05 5.6717787542021 0.000628536 0.003100292 0.007830394 3.916622378 0.000389387 3.73664E-05 5.6738230242022 0.000667107 0.003302173 0.005976934 3.917273543 0.000384608 3.73726E-05 5.6728798692023 0.000631823 0.003143375 0.00525975 3.911036449 0.000380632 3.73131E-05 5.6819266482024 0.000632828 0.003147706 0.00528926 3.910264286 0.000381602 3.73057E-05 5.6830486642025 0.000634309 0.003154521 0.00531663 3.909919438 0.000382503 3.73025E-05 5.6835498972026 0.000635161 0.003158543 0.005330493 3.9097872 0.000382999 3.73012E-05 5.6837421292027 0.000634746 0.003156771 0.005325913 3.909723649 0.000382929 3.73006E-05 5.6838345152028 0.0006334 0.003150548 0.005312043 3.90952354 0.00038254 3.72987E-05 5.6841254432029 0.000632212 0.003145206 0.005301798 3.909457054 0.000382153 3.7298E-05 5.6842221092030 0.000631701 0.003143051 0.005298234 3.90950353 0.00038197 3.72985E-05 5.6841545362031 0.000631636 0.003142859 0.005298129 3.909552465 0.000381938 3.7299E-05 5.6840833892032 0.000631426 0.003141982 0.005295373 3.909584901 0.000381854 3.72993E-05 5.684036232033 0.000630991 0.003139964 0.005290048 3.909539702 0.00038171 3.72988E-05 5.6841019452034 0.000630445 0.003137403 0.005285344 3.909462853 0.000381535 3.72981E-05 5.6842136782035 0.000630173 0.003136125 0.005282942 3.909421579 0.00038145 3.72977E-05 5.684273689
Emissions factors are in units of lb/VMT.

EMFAC2011-HD Attachment 3 emissionsbyspeed-15a
EMFAC2011 Methods.xlsx 3 of 4 8/28/2012
CalYr Total_VMT Total_ROG Total_NOx Total_CO Total_SOx Total_PM10 Total_PM2_5 Total_CO2 Total_Fuel_DSL2012 50.2489574 0.000164982 0.001139853 0.000452039 1.44143E-06 5.32299E-05 4.89715E-05 0.151086217 0.013597762013 55.86112234 0.000160837 0.001186039 0.000440398 1.60378E-06 4.99655E-05 4.59683E-05 0.168103083 0.0151292772014 61.80065109 0.000120127 0.001221099 0.000331898 1.78108E-06 3.57761E-05 3.2914E-05 0.18668651 0.0168017862015 68.07535133 0.000106969 0.00118418 0.000285592 1.95465E-06 2.65761E-05 2.445E-05 0.204880381 0.0184392342016 74.69287031 7.20502E-05 0.00111812 0.000180755 2.14309E-06 1.12696E-05 1.0368E-05 0.224631262 0.0202168142017 81.66098236 7.24454E-05 0.001097568 0.00017969 2.33837E-06 9.32409E-06 8.57816E-06 0.24509998 0.0220589982018 85.31005537 7.58146E-05 0.001034046 0.000187646 2.43798E-06 9.1875E-06 8.4525E-06 0.255541327 0.0229987192019 89.03765081 7.79441E-05 0.000984933 0.000192538 2.54027E-06 9.05451E-06 8.33015E-06 0.266262878 0.0239636592020 92.84376869 8.0047E-05 0.000841077 0.000195474 2.6425E-06 8.0104E-06 7.36956E-06 0.276978197 0.0249280382021 93.99508434 8.22172E-05 0.00063633 0.000200487 2.66627E-06 7.15981E-06 6.58703E-06 0.279469351 0.0251522422022 95.12687672 8.68622E-05 0.000474441 0.000211921 2.69139E-06 7.03975E-06 6.47657E-06 0.282102118 0.0253891912023 96.23914585 8.13249E-05 0.000411912 0.000198577 2.71653E-06 6.95449E-06 6.39813E-06 0.28473751 0.0256263762024 97.33189171 8.25472E-05 0.000419707 0.000201597 2.74729E-06 7.07584E-06 6.50977E-06 0.28796161 0.0259165452025 98.40511432 8.37754E-05 0.000427094 0.000204616 2.77754E-06 7.19339E-06 6.61792E-06 0.291132728 0.0262019462026 99.45881366 8.48433E-05 0.000433051 0.000207238 2.80726E-06 7.2924E-06 6.70901E-06 0.294247197 0.0264822482027 100.4929897 8.565E-05 0.000437108 0.000209224 2.8364E-06 7.36511E-06 6.7759E-06 0.297301597 0.0267571442028 101.5076426 8.62893E-05 0.000440216 0.000210807 2.86496E-06 7.42199E-06 6.82823E-06 0.300295886 0.027026632029 102.5027721 8.69112E-05 0.000443503 0.000212346 2.89298E-06 7.47712E-06 6.87895E-06 0.303232652 0.0272909392030 103.4783784 8.76237E-05 0.000447313 0.000214099 2.92048E-06 7.53981E-06 6.93663E-06 0.306114541 0.0275503092031 105.5434346 8.93468E-05 0.000456193 0.000218313 2.97875E-06 7.68875E-06 7.07365E-06 0.312222193 0.0280999972032 107.6226974 9.10555E-05 0.000464864 0.000222493 3.03741E-06 7.83619E-06 7.20929E-06 0.318371483 0.0286534332033 109.7161669 9.27452E-05 0.000473354 0.000226627 3.09648E-06 7.98159E-06 7.34307E-06 0.32456241 0.0292106172034 111.8238429 9.44277E-05 0.000481968 0.000230744 3.15594E-06 8.12627E-06 7.47617E-06 0.330794987 0.0297715492035 113.9457256 9.61696E-05 0.000490865 0.000235004 3.21581E-06 8.2762E-06 7.6141E-06 0.337070632 0.030336357
Emissions are in units of tons per day and diesel fuel is in units of 1,000 gallons per day.
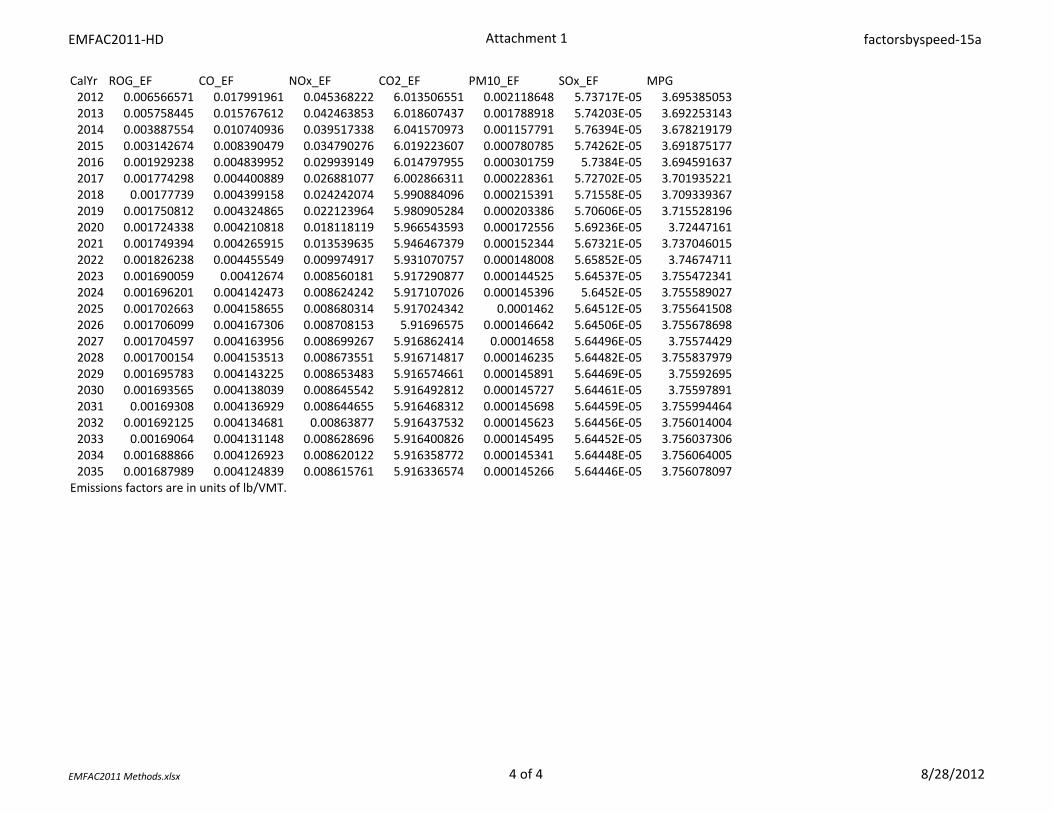
EMFAC2011-HD Attachment 1 factorsbyspeed-15a
EMFAC2011 Methods.xlsx 4 of 4 8/28/2012
CalYr ROG_EF CO_EF NOx_EF CO2_EF PM10_EF SOx_EF MPG2012 0.006566571 0.017991961 0.045368222 6.013506551 0.002118648 5.73717E-05 3.6953850532013 0.005758445 0.015767612 0.042463853 6.018607437 0.001788918 5.74203E-05 3.6922531432014 0.003887554 0.010740936 0.039517338 6.041570973 0.001157791 5.76394E-05 3.6782191792015 0.003142674 0.008390479 0.034790276 6.019223607 0.000780785 5.74262E-05 3.6918751772016 0.001929238 0.004839952 0.029939149 6.014797955 0.000301759 5.7384E-05 3.6945916372017 0.001774298 0.004400889 0.026881077 6.002866311 0.000228361 5.72702E-05 3.7019352212018 0.00177739 0.004399158 0.024242074 5.990884096 0.000215391 5.71558E-05 3.7093393672019 0.001750812 0.004324865 0.022123964 5.980905284 0.000203386 5.70606E-05 3.7155281962020 0.001724338 0.004210818 0.018118119 5.966543593 0.000172556 5.69236E-05 3.724471612021 0.001749394 0.004265915 0.013539635 5.946467379 0.000152344 5.67321E-05 3.7370460152022 0.001826238 0.004455549 0.009974917 5.931070757 0.000148008 5.65852E-05 3.746747112023 0.001690059 0.00412674 0.008560181 5.917290877 0.000144525 5.64537E-05 3.7554723412024 0.001696201 0.004142473 0.008624242 5.917107026 0.000145396 5.6452E-05 3.7555890272025 0.001702663 0.004158655 0.008680314 5.917024342 0.0001462 5.64512E-05 3.7556415082026 0.001706099 0.004167306 0.008708153 5.91696575 0.000146642 5.64506E-05 3.7556786982027 0.001704597 0.004163956 0.008699267 5.916862414 0.00014658 5.64496E-05 3.755744292028 0.001700154 0.004153513 0.008673551 5.916714817 0.000146235 5.64482E-05 3.7558379792029 0.001695783 0.004143225 0.008653483 5.916574661 0.000145891 5.64469E-05 3.755926952030 0.001693565 0.004138039 0.008645542 5.916492812 0.000145727 5.64461E-05 3.755978912031 0.00169308 0.004136929 0.008644655 5.916468312 0.000145698 5.64459E-05 3.7559944642032 0.001692125 0.004134681 0.00863877 5.916437532 0.000145623 5.64456E-05 3.7560140042033 0.00169064 0.004131148 0.008628696 5.916400826 0.000145495 5.64452E-05 3.7560373062034 0.001688866 0.004126923 0.008620122 5.916358772 0.000145341 5.64448E-05 3.7560640052035 0.001687989 0.004124839 0.008615761 5.916336574 0.000145266 5.64446E-05 3.756078097
Emissions factors are in units of lb/VMT.

Butterfield and Sentinel Quarries Expansion Air Quality and Greenhouse Gas Impact Assessment San Bernardino National Forest October 25, 2017
OM01_SB-AQHRCCIA_fnl.docx Sespe Consulting, Inc.
Appendix I: Project Emissions
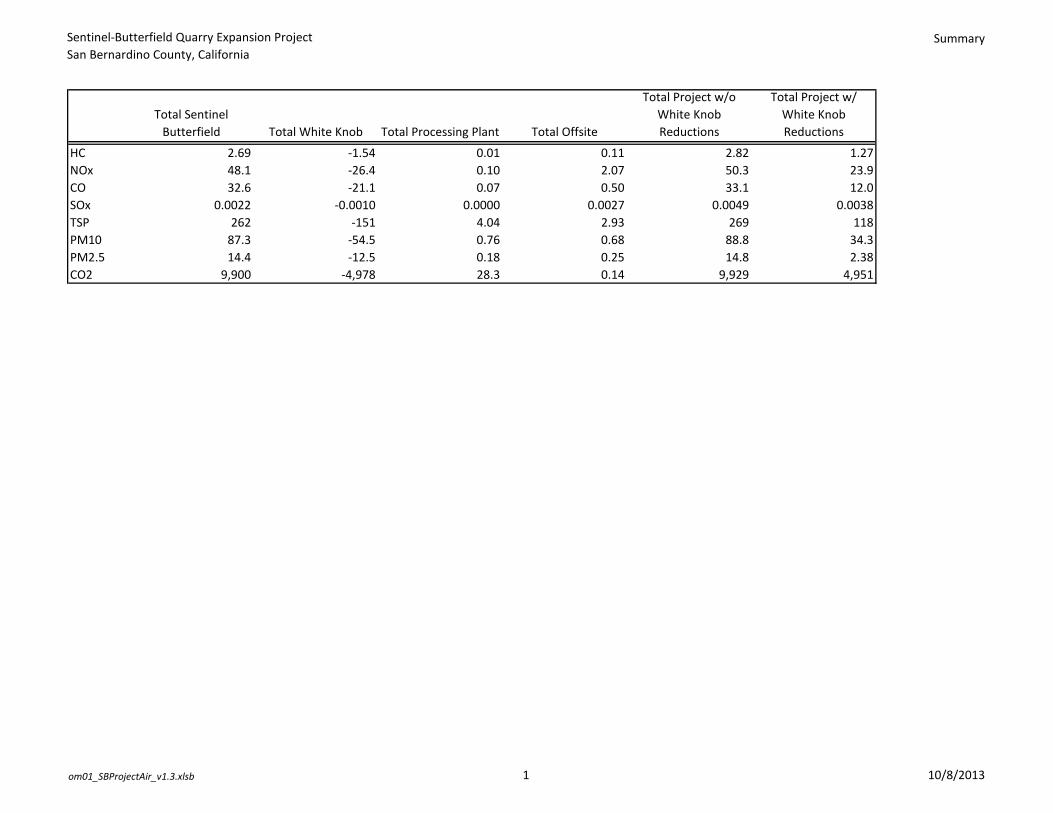
Sentinel-Butterfield Quarry Expansion ProjectSan Bernardino County, California
Summary
om01_SBProjectAir_v1.3.xlsb 1 10/8/2013
Total Sentinel Butterfield Total White Knob Total Processing Plant Total Offsite
Total Project w/o White Knob Reductions
Total Project w/ White Knob Reductions
HC 2.69 -1.54 0.01 0.11 2.82 1.27NOx 48.1 -26.4 0.10 2.07 50.3 23.9CO 32.6 -21.1 0.07 0.50 33.1 12.0SOx 0.0022 -0.0010 0.0000 0.0027 0.0049 0.0038TSP 262 -151 4.04 2.93 269 118PM10 87.3 -54.5 0.76 0.68 88.8 34.3PM2.5 14.4 -12.5 0.18 0.25 14.8 2.38CO2 9,900 -4,978 28.3 0.14 9,929 4,951

Sentinel-Butterfield Quarry Expansion ProjectSan Bernardino County, California
Mining and Processing
om01_SBProjectAir_v1.3.xlsb 1 10/8/2013
2008 Emissions from Processing Plant Area
360,117 tons produced in 2008EMISSION SOURCE / OPERATION / ACTIVITY DEVICE ID # CRITERIA EMISSIONS (tons per year)
- - TSP PM10 PM2.5 CO NOx TOG ROG / VOC SOxDRILLING 90,010 - - - - - - - -BLASTING 90,011 - - - - - - - -EXPLOSIVES 90,011 - - - - - - - -BULLDOZING, SCRAPING AND GRADING OF MATERIAL 90012a 0.10 0.05 0.02 - - - - -LOADING OF MATERIAL(S) MINE / QUARRY / PIT 90006,7,8,9 0.00 0.00 0.00 - - - - -Ball Mill #1 2,002 0.93 0.06 0.02 - - - - -Tertiary Crushing 757 19.09 1.24 0.38 - - - - -Roller Mill #1 763 1.99 0.13 0.04 - - - - -Roller Mill #2 763 1.46 0.09 0.03 - - - - -Roller Mill #3 3,935 0.89 0.06 0.02 - - - - -Roller Mill #4 7,674 0.88 0.06 0.02 - - - - -Surface Treating Plant 2,003 0.01 0.00 0.00 - - - - -Rock Storage System/Plan 754 10.77 3.01 0.94 - - - - -Optical Sorter 763 0.01 0.01 0.00 - - - - -Coarse Product Storage System 2,009 0.27 0.04 0.01 - - - - -Silo 81-70c 4,967 0.32 0.05 0.01 - - - - -Bulk Loadout 82 System 2,007 0.09 0.01 0.00 - - - - -Bulk Loadout 83 System 2,009 0.02 0.00 0.00 - - - - -STOCKPILES - WIND EROSION 90,015 1.06 0.53 0.21 - - - - -EXHAUST - STATIONARY AND PORTABLE EQUIPMENT VARIOUS 0.03 0.03 0.03 0.07 0.26 0.00 0.00 0.07EXHAUST - MOBILE AND VEHICULAR EQUIPMENT 90001,2PAVED ROADS - ENTRAINED DUST - - - - - - - - -UNPAVED ROADS - ENTRAINED DUST 90,013 16.99 5.01 0.77 - - - - -WIND EROSION FROM UNPAVED OPERATIONAL AREAS AND ROA 90014a 11.25 5.62 2.25 - - - - -
GRAND TOTAL 66.15 16.01 4.75 0.07 0.26 0.00 0.00 0.07
2008 Emissions from Sentinel-Butterfield Quarry Area
449,672 tons excavated in 2008EMISSION SOURCE / OPERATION / ACTIVITY DEVICE ID # CRITERIA EMISSIONS (tons per year)
- - TSP PM10 PM2.5 CO NOx TOG ROG / VOC SOxDRILLING 90,010 0.22 0.18 0.18 - - - - -BLASTING 90,011 10.42 5.42 0.31 - - - - -EXPLOSIVES 30,502,514 - - - 2.95 0.75 - - -BULLDOZING, SCRAPING AND GRADING OF MATERIAL 90,012 0.05 0.02 0.01 - - - - -LOADING OF MATERIAL(S) MINE / QUARRY / PIT 90006,7,8,9 0.28 0.14 0.04 - - - - -AGGREGATE HANDLING, CRUSHING, AND SCREENING #1 751 6.08 1.06 0.33 - - - - -STOCKPILES - WIND EROSION 90,015 0.67 0.34 0.13 - - - - -EXHAUST - STATIONARY AND PORTABLE EQUIPMENT VARIOUS 0.03 0.03 0.03 0.08 0.38 0.03 0.03 0.00EXHAUST - MOBILE AND VEHICULAR EQUIPMENT 90001,2UNPAVED ROADS - ENTRAINED DUST 90,013WIND EROSION FROM UNPAVED OPERATIONAL AREAS AND ROA 90,014 20.10 10.05 4.02 - - - - -
GRAND TOTAL 37.84 17.23 5.05 3.03 1.12 0.03 0.03 0.00
2008 Emissions from White Knob Quarry Area
243,036 tons excavated in 2008EMISSION SOURCE / OPERATION / ACTIVITY DEVICE ID # CRITERIA EMISSIONS (tons per year)
- - TSP PM10 PM2.5 CO NOx TOG ROG / VOC SOxDRILLING 90,010 0.12 0.10 0.10 - - - - -BLASTING 90,011 2.84 1.47 0.09 - - - - -EXPLOSIVES 90,011 - - - 1.94 0.49 - - -BULLDOZING, SCRAPING AND GRADING OF MATERIAL 90012a 11.01 5.35 1.64 - - - - -LOADING OF MATERIAL(S) MINE / QUARRY / PIT 90006,7,8,9 0.87 0.42 0.13 - - - - -AGGREGATE HANDLING, CRUSHING, AND SCREENING #1 2,456 6.20 2.01 0.63 - - - - -STOCKPILES - WIND EROSION 90,015 0.18 0.09 0.04 - - - - -EXHAUST - STATIONARY AND PORTABLE EQUIPMENT VARIOUSEXHAUST - MOBILE AND VEHICULAR EQUIPMENT 90001,2UNPAVED ROADS - ENTRAINED DUST 90,013WIND EROSION FROM UNPAVED OPERATIONAL AREAS AND ROA 90014a 20.66 10.33 4.13 - - - - -
GRAND TOTAL 41.88 19.78 6.75 1.94 0.49 - - -
Notes: There are no paved roads on-site. Exhaust from stationary and portable equipment excludes White Knob generator which is calculated elsewhere. Exhaust from mobile/vehicular equipment and travel on unpaved roads is calculated elsewhere. Wind erosion is not expected to change because the active area that is disturbed on a daily basis will not change with project.

Sentinel-Butterfield Quarry Expansion ProjectSan Bernardino County, California
Mining and Processing
om01_SBProjectAir_v1.3.xlsb 2 10/8/2013
EMISSION SOURCE / OPERATION / ACTIVITY -
DRILLINGBLASTINGEXPLOSIVESBULLDOZING, SCRAPING AND GRADING OF MATERIALLOADING OF MATERIAL(S) MINE / QUARRY / PIT Ball Mill #1Tertiary CrushingRoller Mill #1Roller Mill #2Roller Mill #3Roller Mill #4Surface Treating PlantRock Storage System/PlanOptical SorterCoarse Product Storage SystemSilo 81-70cBulk Loadout 82 System Bulk Loadout 83 System STOCKPILES - WIND EROSIONEXHAUST - STATIONARY AND PORTABLE EQUIPMENTEXHAUST - MOBILE AND VEHICULAR EQUIPMENTPAVED ROADS - ENTRAINED DUSTUNPAVED ROADS - ENTRAINED DUSTWIND EROSION FROM UNPAVED OPERATIONAL AREAS AND ROA
EMISSION SOURCE / OPERATION / ACTIVITY -
DRILLINGBLASTINGEXPLOSIVESBULLDOZING, SCRAPING AND GRADING OF MATERIALLOADING OF MATERIAL(S) MINE / QUARRY / PIT AGGREGATE HANDLING, CRUSHING, AND SCREENING #1STOCKPILES - WIND EROSIONEXHAUST - STATIONARY AND PORTABLE EQUIPMENTEXHAUST - MOBILE AND VEHICULAR EQUIPMENTUNPAVED ROADS - ENTRAINED DUSTWIND EROSION FROM UNPAVED OPERATIONAL AREAS AND ROA
Baseline Emissions from Processing Plant Area
653,635 tons produced in BaselineCRITERIA EMISSIONS (tons per year)
Multiplier TSP PM10 PM2.5 CO NOx TOG ROG / VOC SOx - - - - - - - - - - - - - - - - - - - - - - - - - - -
1.82 0.185 0.090 0.028 - - - - -1.82 0.0072 0.0035 0.0011 - - - - -1.82 1.68 0.106 0.033 - - - - -1.82 34.7 2.25 0.69 - - - - -1.82 3.61 0.242 0.076 - - - - -1.82 2.66 0.167 0.052 - - - - -1.82 1.62 0.104 0.033 - - - - -1.82 1.60 0.104 0.033 - - - - -1.82 0.011 0.0010 0.0003 - - - - -1.82 19.5 5.47 1.71 - - - - -1.82 0.019 0.014 0.004 - - - - -1.82 0.48 0.080 0.025 - - - - -1.82 0.58 0.082 0.026 - - - - -1.82 0.16 0.025 0.008 - - - - -1.82 0.028 0.005 0.001 - - - - -1.00 1.06 0.53 0.21 - - - - -1.82 0.047 0.046 0.046 0.12 0.48 0.01 0.01 0.13
- - - - - - - - - - - - - - - - - -
1.82 30.84 9.10 1.40 - - - - -1.00 11.25 5.62 2.25 - - - - -
110.03 24.04 6.62 0.12 0.48 0.01 0.01 0.13
Baseline Emissions from Sentinel-Butterfield Quarry Area
624,191 tons excavated in BaselineCRITERIA EMISSIONS (tons per year)
Multiplier TSP PM10 PM2.5 CO NOx TOG ROG / VOC SOx1.39 0.31 0.25 0.25 - - - - -1.39 14.46 7.52 0.43 - - - - -1.39 - - - 4.09 1.04 - - -2.57 28.27 13.75 4.20 - - - - -1.39 0.39 0.19 0.06 - - - - -1.39 8.43 1.48 0.46 - - - - -1.00 0.67 0.34 0.13 - - - - -1.39 0.04 0.04 0.04 0.11 0.52 0.042 0.037 0.0017
- - - - - - - - - - - - - - - - - -
1.00 20.10 10.05 4.02 - - - - -72.66 33.61 9.59 4.2 1.6 0.042 0.037 0.0017
Note: Bulldozing scaled based on White Knob Quarry activity level to reflect increased overburden with
Baseline Emissions from White Knob Quarry Area
463,467 tons excavated in BaselineCRITERIA EMISSIONS (tons per year)
Multiplier TSP PM10 PM2.5 CO NOx TOG ROG / VOC SOx1.91 0.23 0.19 0.19 - - - - -1.91 5.41 2.81 0.16 - - - - -1.91 - - - 3.71 0.94 - - -1.91 20.99 10.21 3.12 - - - - -1.91 1.65 0.81 0.25 - - - - -1.91 11.83 3.83 1.20 - - - - -1.00 0.18 0.09 0.04 - - - - -
- - - - - - - - - - - - - - - - - - - - - - - - - - -
1.00 20.66 10.33 4.13 - - - - -60.96 28.27 9.08 3.71 0.94 - - -
Note: Sentinel-Butterfield bulldozing scaled based on White Knob Quarry activity level to reflect increased overburden with project.

Sentinel-Butterfield Quarry Expansion ProjectSan Bernardino County, California
Mining and Processing
om01_SBProjectAir_v1.3.xlsb 3 10/8/2013
EMISSION SOURCE / OPERATION / ACTIVITY -
DRILLINGBLASTINGEXPLOSIVESBULLDOZING, SCRAPING AND GRADING OF MATERIALLOADING OF MATERIAL(S) MINE / QUARRY / PIT Ball Mill #1Tertiary CrushingRoller Mill #1Roller Mill #2Roller Mill #3Roller Mill #4Surface Treating PlantRock Storage System/PlanOptical SorterCoarse Product Storage SystemSilo 81-70cBulk Loadout 82 System Bulk Loadout 83 System STOCKPILES - WIND EROSIONEXHAUST - STATIONARY AND PORTABLE EQUIPMENTEXHAUST - MOBILE AND VEHICULAR EQUIPMENTPAVED ROADS - ENTRAINED DUSTUNPAVED ROADS - ENTRAINED DUSTWIND EROSION FROM UNPAVED OPERATIONAL AREAS AND ROA
EMISSION SOURCE / OPERATION / ACTIVITY -
DRILLINGBLASTINGEXPLOSIVESBULLDOZING, SCRAPING AND GRADING OF MATERIALLOADING OF MATERIAL(S) MINE / QUARRY / PIT AGGREGATE HANDLING, CRUSHING, AND SCREENING #1STOCKPILES - WIND EROSIONEXHAUST - STATIONARY AND PORTABLE EQUIPMENTEXHAUST - MOBILE AND VEHICULAR EQUIPMENTUNPAVED ROADS - ENTRAINED DUSTWIND EROSION FROM UNPAVED OPERATIONAL AREAS AND ROA
EMISSION SOURCE / OPERATION / ACTIVITY -
DRILLINGBLASTINGEXPLOSIVESBULLDOZING, SCRAPING AND GRADING OF MATERIALLOADING OF MATERIAL(S) MINE / QUARRY / PIT AGGREGATE HANDLING, CRUSHING, AND SCREENING #1STOCKPILES - WIND EROSIONEXHAUST - STATIONARY AND PORTABLE EQUIPMENTEXHAUST - MOBILE AND VEHICULAR EQUIPMENTUNPAVED ROADS - ENTRAINED DUSTWIND EROSION FROM UNPAVED OPERATIONAL AREAS AND ROA
Project Plus Baseline Emissions from Processing Plant Area
680,000 tons produced with ProjectCRITERIA EMISSIONS (tons per year)
Multiplier TSP PM10 PM2.5 CO NOx TOG ROG / VOC SOx - - - - - - - - - - - - - - - - - - - - - - - - - - -
1.89 0.19 0.09 0.03 - - - - -1.89 0.01 0.00 0.00 - - - - -1.89 1.75 0.11 0.03 - - - - -1.89 36.05 2.34 0.72 - - - - -1.89 3.75 0.25 0.08 - - - - -1.89 2.77 0.17 0.05 - - - - -1.89 1.68 0.11 0.03 - - - - -1.89 1.67 0.11 0.03 - - - - -1.89 0.01 0.00 0.00 - - - - -1.89 20.33 5.69 1.78 - - - - -1.89 0.02 0.01 0.00 - - - - -1.89 0.50 0.08 0.03 - - - - -1.89 0.60 0.09 0.03 - - - - -1.89 0.16 0.03 0.01 - - - - -1.89 0.03 0.00 0.00 - - - - -1.00 1.06 0.53 0.21 - - - - -1.89 0.05 0.05 0.05 0.12 0.50 0.01 0.0054 0.13
- - - - - - - - - - - - - - - - - -
1.89 32.08 9.47 1.45 - - - - -1.00 11.25 5.62 2.25 - - - - -
113.97 24.77 6.79 0.12 0.50 0.01 0.01 0.13
Project Plus Baseline Emissions from Sentinel-Butterfield Quarry Area
1,487,500 tons excavated with ProjectCRITERIA EMISSIONS (tons per year)
Multiplier TSP PM10 PM2.5 CO NOx TOG ROG / VOC SOx3.31 0.74 0.60 0.60 - - - - -3.31 34.46 17.92 1.03 - - - - -3.31 - - - 9.75 2.47 - - -6.12 67.36 32.77 10.01 - - - - -3.31 0.92 0.45 0.14 - - - - -3.31 20.10 3.52 1.09 - - - - -1.00 0.67 0.34 0.13 - - - - -3.31 0.09 0.09 0.09 0.27 1.24 0.10 0.088 0.0041
- - - - - - - - - - - - - - - - - -
1.00 20.10 10.05 4.02 - - - - -144.44 65.72 17.11 10.02 3.72
Note: Bulldozing scaled based on White Knob Quarry activity level to reflect increased overburden with p
Project Plus Baseline Emissions from White Knob Quarry Area
- tons excavated with ProjectCRITERIA EMISSIONS (tons per year)
Multiplier TSP PM10 PM2.5 CO NOx TOG ROG / VOC SOx - - - - - - - - - - - - - - - - - - - - - - - - - - - - - - - - - - - - - - - - - - - - - - - - - - - - - - - - - - - - - - - - - - - - - - - - - - - - - - - - - - - - - - - - - - - - - - - - - - -
- - - - - - - -
Note: Sentinel-Butterfield bulldozing scaled based on White Knob Quarry activity level to reflect increased overburden with project.
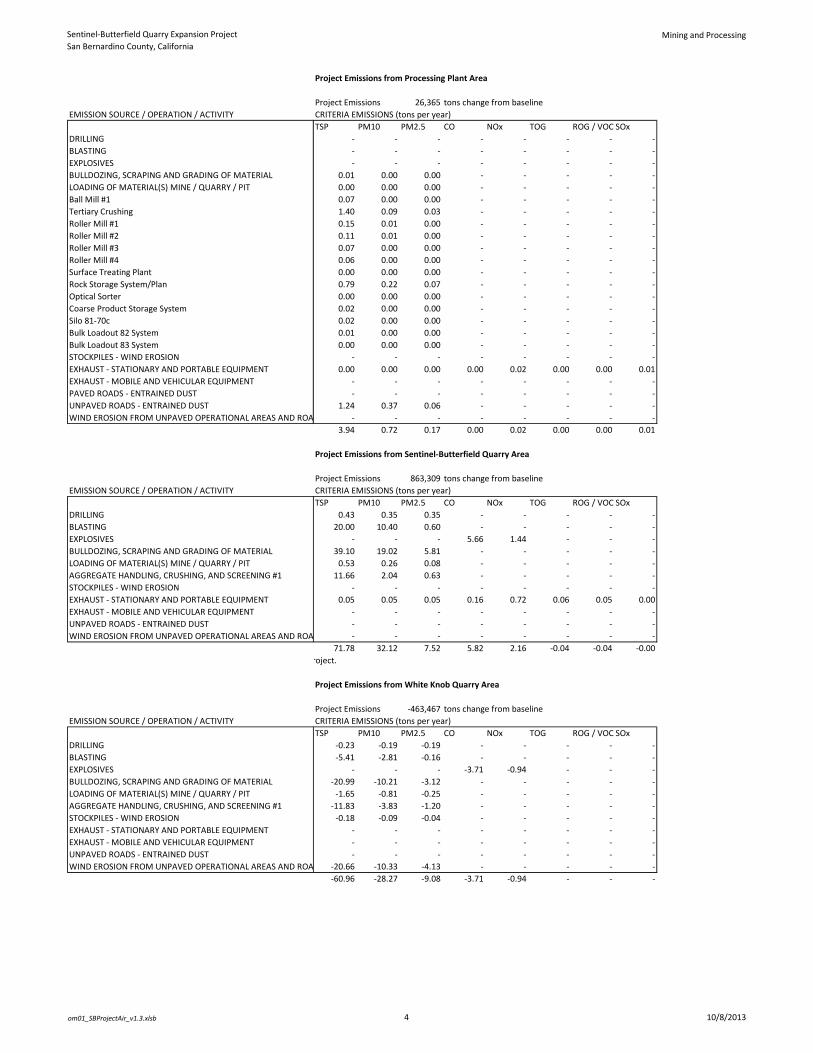
Sentinel-Butterfield Quarry Expansion ProjectSan Bernardino County, California
Mining and Processing
om01_SBProjectAir_v1.3.xlsb 4 10/8/2013
EMISSION SOURCE / OPERATION / ACTIVITY -
DRILLINGBLASTINGEXPLOSIVESBULLDOZING, SCRAPING AND GRADING OF MATERIALLOADING OF MATERIAL(S) MINE / QUARRY / PIT Ball Mill #1Tertiary CrushingRoller Mill #1Roller Mill #2Roller Mill #3Roller Mill #4Surface Treating PlantRock Storage System/PlanOptical SorterCoarse Product Storage SystemSilo 81-70cBulk Loadout 82 System Bulk Loadout 83 System STOCKPILES - WIND EROSIONEXHAUST - STATIONARY AND PORTABLE EQUIPMENTEXHAUST - MOBILE AND VEHICULAR EQUIPMENTPAVED ROADS - ENTRAINED DUSTUNPAVED ROADS - ENTRAINED DUSTWIND EROSION FROM UNPAVED OPERATIONAL AREAS AND ROA
EMISSION SOURCE / OPERATION / ACTIVITY -
DRILLINGBLASTINGEXPLOSIVESBULLDOZING, SCRAPING AND GRADING OF MATERIALLOADING OF MATERIAL(S) MINE / QUARRY / PIT AGGREGATE HANDLING, CRUSHING, AND SCREENING #1STOCKPILES - WIND EROSIONEXHAUST - STATIONARY AND PORTABLE EQUIPMENTEXHAUST - MOBILE AND VEHICULAR EQUIPMENTUNPAVED ROADS - ENTRAINED DUSTWIND EROSION FROM UNPAVED OPERATIONAL AREAS AND ROA
EMISSION SOURCE / OPERATION / ACTIVITY -
DRILLINGBLASTINGEXPLOSIVESBULLDOZING, SCRAPING AND GRADING OF MATERIALLOADING OF MATERIAL(S) MINE / QUARRY / PIT AGGREGATE HANDLING, CRUSHING, AND SCREENING #1STOCKPILES - WIND EROSIONEXHAUST - STATIONARY AND PORTABLE EQUIPMENTEXHAUST - MOBILE AND VEHICULAR EQUIPMENTUNPAVED ROADS - ENTRAINED DUSTWIND EROSION FROM UNPAVED OPERATIONAL AREAS AND ROA
Project Emissions from Processing Plant Area
Project Emissions 26,365 tons change from baselineCRITERIA EMISSIONS (tons per year)TSP PM10 PM2.5 CO NOx TOG ROG / VOC SOx
- - - - - - - - - - - - - - - - - - - - - - - -
0.01 0.00 0.00 - - - - -0.00 0.00 0.00 - - - - -0.07 0.00 0.00 - - - - -1.40 0.09 0.03 - - - - -0.15 0.01 0.00 - - - - -0.11 0.01 0.00 - - - - -0.07 0.00 0.00 - - - - -0.06 0.00 0.00 - - - - -0.00 0.00 0.00 - - - - -0.79 0.22 0.07 - - - - -0.00 0.00 0.00 - - - - -0.02 0.00 0.00 - - - - -0.02 0.00 0.00 - - - - -0.01 0.00 0.00 - - - - -0.00 0.00 0.00 - - - - -
- - - - - - - -0.00 0.00 0.00 0.00 0.02 0.00 0.00 0.01
- - - - - - - - - - - - - - - -
1.24 0.37 0.06 - - - - - - - - - - - - -
3.94 0.72 0.17 0.00 0.02 0.00 0.00 0.01
Project Emissions from Sentinel-Butterfield Quarry Area
Project Emissions 863,309 tons change from baselineCRITERIA EMISSIONS (tons per year)TSP PM10 PM2.5 CO NOx TOG ROG / VOC SOx
0.43 0.35 0.35 - - - - -20.00 10.40 0.60 - - - - -
- - - 5.66 1.44 - - -39.10 19.02 5.81 - - - - -
0.53 0.26 0.08 - - - - -11.66 2.04 0.63 - - - - -
- - - - - - - -0.05 0.05 0.05 0.16 0.72 0.06 0.05 0.00
- - - - - - - - - - - - - - - - - - - - - - - -
71.78 32.12 7.52 5.82 2.16 -0.04 -0.04 -0.00roject.
Project Emissions from White Knob Quarry Area
Project Emissions -463,467 tons change from baselineCRITERIA EMISSIONS (tons per year)TSP PM10 PM2.5 CO NOx TOG ROG / VOC SOx
-0.23 -0.19 -0.19 - - - - - -5.41 -2.81 -0.16 - - - - -
- - - -3.71 -0.94 - - - -20.99 -10.21 -3.12 - - - - -
-1.65 -0.81 -0.25 - - - - - -11.83 -3.83 -1.20 - - - - -
-0.18 -0.09 -0.04 - - - - - - - - - - - - - - - - - - - - - - - - - - - - -
-20.66 -10.33 -4.13 - - - - - -60.96 -28.27 -9.08 -3.71 -0.94 - - -

Sentinel-Butterfield Quarry Expansion ProjectSan Bernardino County, California
NonRoad Engines
om01_SBProjectAir_v1.3.xlsb 4 10/8/2013
BaselineVOL1 WK Crusher VOL2 WK Pit VOL3 WR Pit
Per Year Per Day Per Hour Per Year Per Day Per Hour Per Year Per Day Per Hourhp-hr 1,002,598.38 10,025.98 1,671.00 1,320,206.27 13,202.06 2,200.34 - - -HC (lb) 640.25 6.40 1.07 554.35 5.54 0.92 - - -NOx (lb) 9,898.01 98.98 16.50 8,146.06 81.46 13.58 - - -PM (lb) 327.63 3.28 0.55 358.76 3.59 0.60 - - -CO (lb) 14,200.65 142.01 23.67 5,306.16 53.06 8.84 - - -SOx (lb) 0.31 0.00 0.00 0.29 0.00 0.00 - - -CO2 (tons) 583.94 5.84 0.97 768.93 7.69 1.28 - - -
ProjectVOL1 WK Crusher VOL2 WK Pit VOL3 WR Pit
Per Year Per Day Per Hour Per Year Per Day Per Hour Per Year Per Day Per Hourhp-hr - - - - - - - - -HC (lb) - - - - - - - - -NOx (lb) - - - - - - - - -PM (lb) - - - - - - - - -CO (lb) - - - - - - - - -SOx (lb) - - - - - - - - -CO2 (tons) - - - - - - - - -
IncrementVOL1 WK Crusher VOL2 WK Pit VOL3 WR Pit
Per Year Per Day Per Hour Per Year Per Day Per Hour Per Year Per Day Per Hourhp-hr -1,002,598.38 -10,025.98 -1,671.00 -1,320,206.27 -13,202.06 -2,200.34 - - -HC (lb) -640.25 -6.40 -1.07 -554.35 -5.54 -0.92 - - -NOx (lb) -9,898.01 -98.98 -16.50 -8,146.06 -81.46 -13.58 - - -PM (lb) -327.63 -3.28 -0.55 -358.76 -3.59 -0.60 - - -CO (lb) -14,200.65 -142.01 -23.67 -5,306.16 -53.06 -8.84 - - -SOx (lb) -0.31 -0.00 -0.00 -0.29 -0.00 -0.00 - - -CO2 (tons) -583.94 -5.84 -0.97 -768.93 -7.69 -1.28 - - -
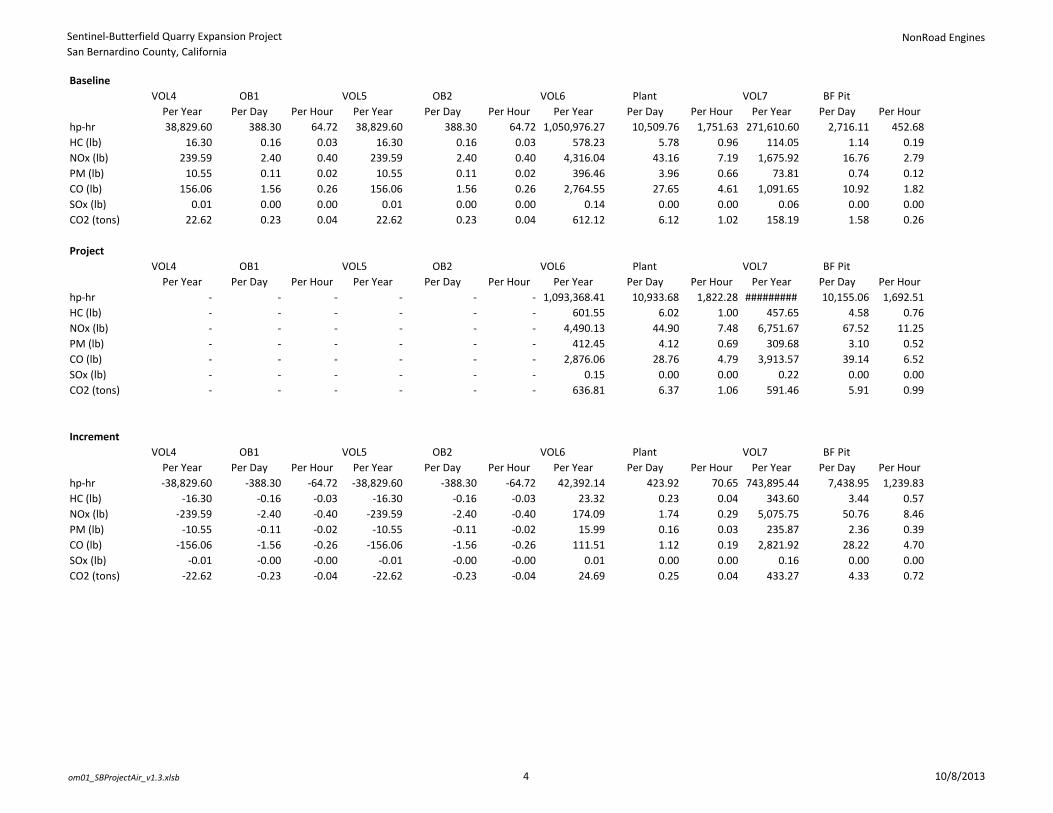
Sentinel-Butterfield Quarry Expansion ProjectSan Bernardino County, California
NonRoad Engines
om01_SBProjectAir_v1.3.xlsb 4 10/8/2013
Baseline
hp-hrHC (lb)NOx (lb)PM (lb)CO (lb)SOx (lb)CO2 (tons)
Project
hp-hrHC (lb)NOx (lb)PM (lb)CO (lb)SOx (lb)CO2 (tons)
Increment
hp-hrHC (lb)NOx (lb)PM (lb)CO (lb)SOx (lb)CO2 (tons)
VOL4 OB1 VOL5 OB2 VOL6 Plant VOL7 BF PitPer Year Per Day Per Hour Per Year Per Day Per Hour Per Year Per Day Per Hour Per Year Per Day Per Hour38,829.60 388.30 64.72 38,829.60 388.30 64.72 1,050,976.27 10,509.76 1,751.63 271,610.60 2,716.11 452.68
16.30 0.16 0.03 16.30 0.16 0.03 578.23 5.78 0.96 114.05 1.14 0.19239.59 2.40 0.40 239.59 2.40 0.40 4,316.04 43.16 7.19 1,675.92 16.76 2.79
10.55 0.11 0.02 10.55 0.11 0.02 396.46 3.96 0.66 73.81 0.74 0.12156.06 1.56 0.26 156.06 1.56 0.26 2,764.55 27.65 4.61 1,091.65 10.92 1.82
0.01 0.00 0.00 0.01 0.00 0.00 0.14 0.00 0.00 0.06 0.00 0.0022.62 0.23 0.04 22.62 0.23 0.04 612.12 6.12 1.02 158.19 1.58 0.26
VOL4 OB1 VOL5 OB2 VOL6 Plant VOL7 BF PitPer Year Per Day Per Hour Per Year Per Day Per Hour Per Year Per Day Per Hour Per Year Per Day Per Hour
- - - - - - 1,093,368.41 10,933.68 1,822.28 ######### 10,155.06 1,692.51 - - - - - - 601.55 6.02 1.00 457.65 4.58 0.76 - - - - - - 4,490.13 44.90 7.48 6,751.67 67.52 11.25 - - - - - - 412.45 4.12 0.69 309.68 3.10 0.52 - - - - - - 2,876.06 28.76 4.79 3,913.57 39.14 6.52 - - - - - - 0.15 0.00 0.00 0.22 0.00 0.00 - - - - - - 636.81 6.37 1.06 591.46 5.91 0.99
VOL4 OB1 VOL5 OB2 VOL6 Plant VOL7 BF PitPer Year Per Day Per Hour Per Year Per Day Per Hour Per Year Per Day Per Hour Per Year Per Day Per Hour
-38,829.60 -388.30 -64.72 -38,829.60 -388.30 -64.72 42,392.14 423.92 70.65 743,895.44 7,438.95 1,239.83 -16.30 -0.16 -0.03 -16.30 -0.16 -0.03 23.32 0.23 0.04 343.60 3.44 0.57
-239.59 -2.40 -0.40 -239.59 -2.40 -0.40 174.09 1.74 0.29 5,075.75 50.76 8.46 -10.55 -0.11 -0.02 -10.55 -0.11 -0.02 15.99 0.16 0.03 235.87 2.36 0.39
-156.06 -1.56 -0.26 -156.06 -1.56 -0.26 111.51 1.12 0.19 2,821.92 28.22 4.70 -0.01 -0.00 -0.00 -0.01 -0.00 -0.00 0.01 0.00 0.00 0.16 0.00 0.00
-22.62 -0.23 -0.04 -22.62 -0.23 -0.04 24.69 0.25 0.04 433.27 4.33 0.72
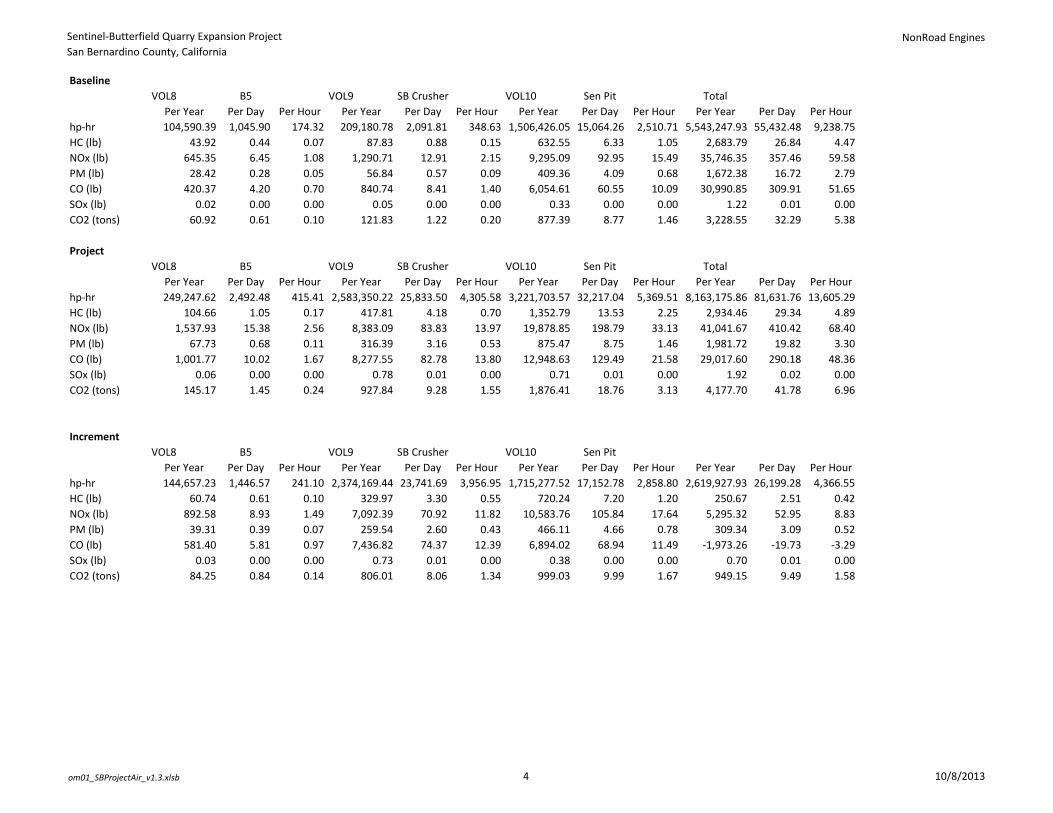
Sentinel-Butterfield Quarry Expansion ProjectSan Bernardino County, California
NonRoad Engines
om01_SBProjectAir_v1.3.xlsb 4 10/8/2013
Baseline
hp-hrHC (lb)NOx (lb)PM (lb)CO (lb)SOx (lb)CO2 (tons)
Project
hp-hrHC (lb)NOx (lb)PM (lb)CO (lb)SOx (lb)CO2 (tons)
Increment
hp-hrHC (lb)NOx (lb)PM (lb)CO (lb)SOx (lb)CO2 (tons)
VOL8 B5 VOL9 SB Crusher VOL10 Sen Pit TotalPer Year Per Day Per Hour Per Year Per Day Per Hour Per Year Per Day Per Hour Per Year Per Day Per Hour104,590.39 1,045.90 174.32 209,180.78 2,091.81 348.63 1,506,426.05 15,064.26 2,510.71 5,543,247.93 55,432.48 9,238.75
43.92 0.44 0.07 87.83 0.88 0.15 632.55 6.33 1.05 2,683.79 26.84 4.47645.35 6.45 1.08 1,290.71 12.91 2.15 9,295.09 92.95 15.49 35,746.35 357.46 59.58
28.42 0.28 0.05 56.84 0.57 0.09 409.36 4.09 0.68 1,672.38 16.72 2.79420.37 4.20 0.70 840.74 8.41 1.40 6,054.61 60.55 10.09 30,990.85 309.91 51.65
0.02 0.00 0.00 0.05 0.00 0.00 0.33 0.00 0.00 1.22 0.01 0.0060.92 0.61 0.10 121.83 1.22 0.20 877.39 8.77 1.46 3,228.55 32.29 5.38
VOL8 B5 VOL9 SB Crusher VOL10 Sen Pit TotalPer Year Per Day Per Hour Per Year Per Day Per Hour Per Year Per Day Per Hour Per Year Per Day Per Hour249,247.62 2,492.48 415.41 2,583,350.22 25,833.50 4,305.58 3,221,703.57 32,217.04 5,369.51 8,163,175.86 81,631.76 13,605.29
104.66 1.05 0.17 417.81 4.18 0.70 1,352.79 13.53 2.25 2,934.46 29.34 4.891,537.93 15.38 2.56 8,383.09 83.83 13.97 19,878.85 198.79 33.13 41,041.67 410.42 68.40
67.73 0.68 0.11 316.39 3.16 0.53 875.47 8.75 1.46 1,981.72 19.82 3.301,001.77 10.02 1.67 8,277.55 82.78 13.80 12,948.63 129.49 21.58 29,017.60 290.18 48.36
0.06 0.00 0.00 0.78 0.01 0.00 0.71 0.01 0.00 1.92 0.02 0.00145.17 1.45 0.24 927.84 9.28 1.55 1,876.41 18.76 3.13 4,177.70 41.78 6.96
VOL8 B5 VOL9 SB Crusher VOL10 Sen PitPer Year Per Day Per Hour Per Year Per Day Per Hour Per Year Per Day Per Hour Per Year Per Day Per Hour144,657.23 1,446.57 241.10 2,374,169.44 23,741.69 3,956.95 1,715,277.52 17,152.78 2,858.80 2,619,927.93 26,199.28 4,366.55
60.74 0.61 0.10 329.97 3.30 0.55 720.24 7.20 1.20 250.67 2.51 0.42892.58 8.93 1.49 7,092.39 70.92 11.82 10,583.76 105.84 17.64 5,295.32 52.95 8.83
39.31 0.39 0.07 259.54 2.60 0.43 466.11 4.66 0.78 309.34 3.09 0.52581.40 5.81 0.97 7,436.82 74.37 12.39 6,894.02 68.94 11.49 -1,973.26 -19.73 -3.29
0.03 0.00 0.00 0.73 0.01 0.00 0.38 0.00 0.00 0.70 0.01 0.0084.25 0.84 0.14 806.01 8.06 1.34 999.03 9.99 1.67 949.15 9.49 1.58

Sentinel-Butterfield Quarry Expansion ProjectSan Bernardino County, California
NonRoad Engines
om01_SBProjectAir_v1.3.xlsb 4 10/8/2013
Baseline Offroad Activity Baseline Fleet CharacteristicsAvg. (hp-hr) HC (lb/yr) NOx (lb/yr) PM (lb/yr) CO (lb/yr) SOx (lb/yr) CO2 (tpy)
Pit Subtotal 3,644,992 1,643 24,234 1,112 14,047 0.81 2,123Plant Subtotal 1,050,976 624 3,785 325 2,668 0.15 612Roads Subtotal 17,158,834 6,706 115,562 4,059 111,011 3.99 9,994Total w/o Generator 21,854,802 8,973 143,581 5,495 127,726 4.95 12,729Total w/ Generator 22,702,082 9,548 152,520 5,781 141,303 5.22 13,222Generator 847,280 575 8,940 285 13,576 0.27 493
Baseline Offroad Activity 2012 Fleet CharacteristicsAvg. (hp-hr) HC (lb/yr) NOx (lb/yr) PM (lb/yr) CO (lb/yr) SOx (lb/yr) CO2 (tpy)
Pit Subtotal 3,644,992 1,531 22,491 990 14,650 0.81 2,123Plant Subtotal 1,041,576 578 4,316 396 2,765 0.14 612Roads Subtotal 17,158,834 5,186 95,767 2,990 62,474 3.99 9,994Total w/o Generator 21,845,402 7,294 122,573 4,377 79,888 4.94 12,729Total w/ Generator 22,692,682 7,869 131,513 4,663 93,464 5.21 13,222
Baseline Pit Activity AllocationsTon Excavated hp-hr Pit (hp-hr) Fill (hp-hr) Loadout (hp-hr)
White Knob 463,467 1,553,184 1,320,206 77,659 155,318Sentinel 528,841 1,772,266 1,506,426 88,613 177,227Butterfield 95,351 319,542 271,611 15,977 31,954
1,087,658 3,644,992 3,098,243 182,250 364,499
Project Pit Activity AllocationsTon Excavated hp-hr Pit (hp-hr) Fill (hp-hr) Loadout (hp-h Percentage
White Knob - -Sentinel 1,131,000 3,790,239 3,221,704 189,512 379,024 76%Butterfield 356,500 1,194,713 1,015,506 59,736 119,471 24%
1,487,500 4,984,952 4,237,210 249,248 498,495
Project Offroad Activity Baseline Fleet CharacteristicsAvg. (hp-hr) HC (lb/yr) NOx (lb/yr) PM (lb/yr) CO (lb/yr) SOx (lb/yr) CO2 (tpy)
Pit Subtotal 4,984,952 2,093 30,759 1,355 20,035 1.10 2,903Plant Subtotal 1,093,368 607 4,531 416 2,902 0.15 643Roads Subtotal 24,029,854 7,262 134,115 4,188 87,490 5.58 13,996Mobile Crusher 2,084,855 208 5,307 181 6,274 0.67 638Total 32,193,030 10,171 174,712 6,140 116,702 7.50 18,179Increment 9,500,348 2,301 43,199 1,477 23,237 2.30 4,957
Mobile CrusherTier 3 E.F. (g/hp-hr) (CalEEMod 201 0.12 2.32 0.088 2.6 0.000276 528.4Fuel Correction Factor 0.720 0.948 0.852 1 1 1
0.525 load factor
10% of Pit Subtotal assumed to be loading at plant5% of Pit Subtotal assumed to be placement of fill
85% of Pit Subtotal assumed to be excavation100 maximum days are used to estimate daily emissions from annual activity levels
6 maximum hours are assumed to occur on the maximum day in order to determine peak hour

Sentinel-Butterfield Quarry Expansion ProjectSan Bernardino County, California
Data for Road Activity
om01_SBProjectAir_v1.3.xlsb 1 10/8/2013
Vehicle Miles Traveled per Year
Locaiton Tons/Year Tons/Day Tons/Hour Trips/YearTrips/Da
y Trips/Hour Links
Traveled
A - Butterfield
PitB - Waste
PileC - West
RoadD - Not Used
E - Senteniel
PitF - Not Used
G - Sentinel/Butterfield to Plant
Ore to Primary Crusher 4,065 1,800 1,460 - 6,045 - 38,000 Sentinel 606,769 3,805 457 16,181 101 12 E - - - - 18,525 - - Butterfield 3 190,531 1,195 143 5,081 32 4 A, C 3,912 1,405 - - - - White Knob - - - - - - J - - - - - - - Sentinel - Butterfield 797,300 5,000 600 21,261 133 16 - TOTAL 797,300 5,000 600 21,261 133 16 - Ore Hauled to Plant - Sentinel 517,500 3,245 389 13,800 87 10 G, I - - - - - - 99,318 Butterfield 3 162,500 1,019 122 4,333 27 3 G, I - - - - - - 31,187 White Knob - - - - - - H, L, I - - - - - - - Sentinel - Butterfield 680,000 4,264 512 18,133 114 14 - TOTAL 680,000 4,264 512 18,133 114 14 - Waste Crusher FinesSentinel 89,269 560 67 2,381 15 2 B, C - 812 658 - - - - Butterfield 3 28,031 176 21 748 5 1 B, C - 255 207 - - - - White Knob - - - - - - L - - - - - - - Sentinel - Butterfield 117,300 736 88 3,128 20 2 - TOTAL 117,300 736 88 3,128 20 2 - Waste Rock Not ProcessedSentinel 524,231 3,294 395 13,980 88 11 B, C, E - 4,766 3,866 - 16,005 - - Butterfield 3 165,969 1,034 124 4,426 28 3 A, B 3,407 1,509 - - - - - White Knob - - - - - - J, L - - - - - - - Sentinel - Butterfield 690,200 4,328 519 18,405 115 14 - TOTAL 690,200 4,328 519 18,405 115 14 -
1,487,500 tons, total excavated A B C D E F GTotal VMT: not used on this page. 7,319 7,341 6,135 - 34,530 - 130,505 % of VMT: not used on this page. 4% 4% 3% 0% 18% 0% 70%
Activity Data

Sentinel-Butterfield Quarry Expansion ProjectSan Bernardino County, California
Data for Road Activity
om01_SBProjectAir_v1.3.xlsb 2 10/8/2013
Locaiton Tons/Year Tons/Day Tons/Hour
Ore to Primary CrusherSentinel 606,769 3,805 457 Butterfield 3 190,531 1,195 143 White Knob - - - Sentinel - Butterfield 797,300 5,000 600 TOTAL 797,300 5,000 600 Ore Hauled to PlantSentinel 517,500 3,245 389 Butterfield 3 162,500 1,019 122 White Knob - - - Sentinel - Butterfield 680,000 4,264 512 TOTAL 680,000 4,264 512 Waste Crusher FinesSentinel 89,269 560 67 Butterfield 3 28,031 176 21 White Knob - - - Sentinel - Butterfield 117,300 736 88 TOTAL 117,300 736 88 Waste Rock Not ProcessedSentinel 524,231 3,294 395 Butterfield 3 165,969 1,034 124 White Knob - - - Sentinel - Butterfield 690,200 4,328 519 TOTAL 690,200 4,328 519
1,487,500 tons, total excavatedTotal VMT: not used on this page.% of VMT: not used on this page.
Activity Data Vehicle Miles Traveled per Year
H - White Ridge to
PlantI - Plant
FeedJ - White Knob Pit
K - On-Road Trucks
L - Crusher to White Ridge
M - White Ridge Pit
24,260 365 3,725 6,186 2,300 1,300 - - - - - - - - - - - - - - - - - -
- - - - - - - -
- - - - 954 - - - - - 300 - - - - - - - - - -
- - - - 28,453 - - - - -
- - - - - - - - - - - - - - - - - -
- - - - - - - - -
- - - - - - - - - - - - - - - - - -
- - -
H I J K L M- 1,254 - 28,453 - - 0% 1% 0% 0% 0%

Sentinel-Butterfield Quarry Expansion ProjectSan Bernardino County, California
Data for Road Activity
om01_SBProjectAir_v1.3.xlsb 3 10/8/2013
Locaiton Tons/Year Tons/Day Tons/Hour
Ore to Primary CrusherSentinel 606,769 3,805 457 Butterfield 3 190,531 1,195 143 White Knob - - - Sentinel - Butterfield 797,300 5,000 600 TOTAL 797,300 5,000 600 Ore Hauled to PlantSentinel 517,500 3,245 389 Butterfield 3 162,500 1,019 122 White Knob - - - Sentinel - Butterfield 680,000 4,264 512 TOTAL 680,000 4,264 512 Waste Crusher FinesSentinel 89,269 560 67 Butterfield 3 28,031 176 21 White Knob - - - Sentinel - Butterfield 117,300 736 88 TOTAL 117,300 736 88 Waste Rock Not ProcessedSentinel 524,231 3,294 395 Butterfield 3 165,969 1,034 124 White Knob - - - Sentinel - Butterfield 690,200 4,328 519 TOTAL 690,200 4,328 519
1,487,500 tons, total excavatedTotal VMT: not used on this page.% of VMT: not used on this page.
Activity Data Vehicle Miles Traveled per Day
A - Butterfiel
d Pit
B - Waste
PileC - West
RoadD - Not Used
E - Senteniel
PitF - Not Used
G - Sentinel/Butterfie
ld to Plant
4,065 1,800 1,460 - 6,045 - 38,000 - - - - 116.17 - -
24.53 8.81 - - - - - - - - - - -
- - - - - - 622.84 - - - - - - 195.58 - - - - - - -
- 5.09 4.13 - - - - - 1.60 1.30 - - - - - - - - - - -
- 29.95 24.29 - 100.57 - - 21.24 9.40 - - - - -
- - - - - - -
A B C D E F G46 46 39 - 217 - 818 4% 4% 3% 0% 18% 0% 70%
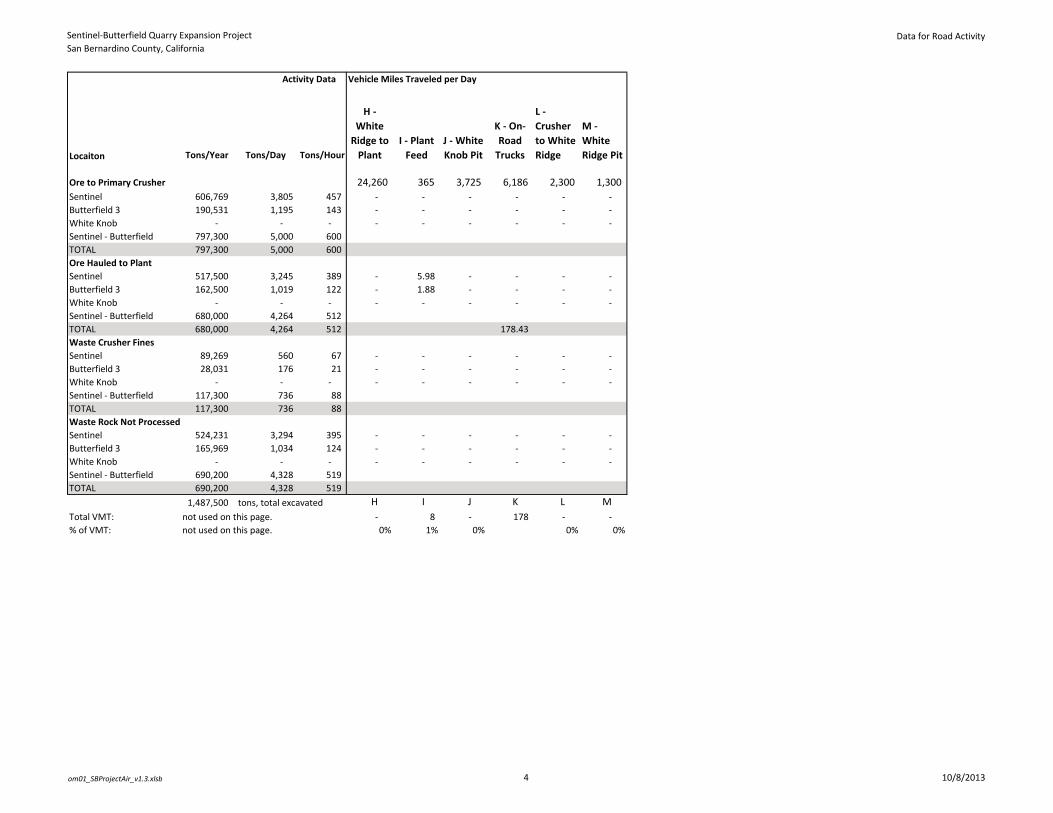
Sentinel-Butterfield Quarry Expansion ProjectSan Bernardino County, California
Data for Road Activity
om01_SBProjectAir_v1.3.xlsb 4 10/8/2013
Locaiton Tons/Year Tons/Day Tons/Hour
Ore to Primary CrusherSentinel 606,769 3,805 457 Butterfield 3 190,531 1,195 143 White Knob - - - Sentinel - Butterfield 797,300 5,000 600 TOTAL 797,300 5,000 600 Ore Hauled to PlantSentinel 517,500 3,245 389 Butterfield 3 162,500 1,019 122 White Knob - - - Sentinel - Butterfield 680,000 4,264 512 TOTAL 680,000 4,264 512 Waste Crusher FinesSentinel 89,269 560 67 Butterfield 3 28,031 176 21 White Knob - - - Sentinel - Butterfield 117,300 736 88 TOTAL 117,300 736 88 Waste Rock Not ProcessedSentinel 524,231 3,294 395 Butterfield 3 165,969 1,034 124 White Knob - - - Sentinel - Butterfield 690,200 4,328 519 TOTAL 690,200 4,328 519
1,487,500 tons, total excavatedTotal VMT: not used on this page.% of VMT: not used on this page.
Activity Data Vehicle Miles Traveled per Day
H - White
Ridge to Plant
I - Plant Feed
J - White Knob Pit
K - On-Road
Trucks
L - Crusher to White Ridge
M - White Ridge Pit
24,260 365 3,725 6,186 2,300 1,300 - - - - - - - - - - - - - - - - - -
- 5.98 - - - - - 1.88 - - - - - - - - - -
178.43
- - - - - - - - - - - - - - - - - -
- - - - - - - - - - - - - - - - - -
H I J K L M- 8 - 178 - - 0% 1% 0% 0% 0%

Sentinel-Butterfield Quarry Expansion ProjectSan Bernardino County, California
Data for Road Activity
om01_SBProjectAir_v1.3.xlsb 5 10/8/2013
Locaiton Tons/Year Tons/Day Tons/Hour
Ore to Primary CrusherSentinel 606,769 3,805 457 Butterfield 3 190,531 1,195 143 White Knob - - - Sentinel - Butterfield 797,300 5,000 600 TOTAL 797,300 5,000 600 Ore Hauled to PlantSentinel 517,500 3,245 389 Butterfield 3 162,500 1,019 122 White Knob - - - Sentinel - Butterfield 680,000 4,264 512 TOTAL 680,000 4,264 512 Waste Crusher FinesSentinel 89,269 560 67 Butterfield 3 28,031 176 21 White Knob - - - Sentinel - Butterfield 117,300 736 88 TOTAL 117,300 736 88 Waste Rock Not ProcessedSentinel 524,231 3,294 395 Butterfield 3 165,969 1,034 124 White Knob - - - Sentinel - Butterfield 690,200 4,328 519 TOTAL 690,200 4,328 519
1,487,500 tons, total excavatedTotal VMT: not used on this page.% of VMT: not used on this page.
Activity Data Vehicle Miles Traveled per Hour
A - Butterfie
ld Pit
B - Waste
PileC - West
RoadD - Not Used
E - Senteniel
PitF - Not Used
G - Sentinel/Butterfie
ld to Plant
4,065 1,800 1,460 - 6,045 - 38,000 - - - - 13.94 - -
2.94 1.06 - - - - - - - - - - -
- - - - - - 74.74 - - - - - - 23.47 - - - - - - -
- 0.61 0.50 - - - - - 0.19 0.16 - - - - - - - - - - -
- 3.59 2.91 - 12.07 - - 2.55 1.13 - - - - -
- - - - - - -
A B C D E F G 5.49 5.52 4.62 - 26.01 - 98.21
4% 4% 3% 0% 18% 0% 70%

Sentinel-Butterfield Quarry Expansion ProjectSan Bernardino County, California
Data for Road Activity
om01_SBProjectAir_v1.3.xlsb 6 10/8/2013
Locaiton Tons/Year Tons/Day Tons/Hour
Ore to Primary CrusherSentinel 606,769 3,805 457 Butterfield 3 190,531 1,195 143 White Knob - - - Sentinel - Butterfield 797,300 5,000 600 TOTAL 797,300 5,000 600 Ore Hauled to PlantSentinel 517,500 3,245 389 Butterfield 3 162,500 1,019 122 White Knob - - - Sentinel - Butterfield 680,000 4,264 512 TOTAL 680,000 4,264 512 Waste Crusher FinesSentinel 89,269 560 67 Butterfield 3 28,031 176 21 White Knob - - - Sentinel - Butterfield 117,300 736 88 TOTAL 117,300 736 88 Waste Rock Not ProcessedSentinel 524,231 3,294 395 Butterfield 3 165,969 1,034 124 White Knob - - - Sentinel - Butterfield 690,200 4,328 519 TOTAL 690,200 4,328 519
1,487,500 tons, total excavatedTotal VMT: not used on this page.% of VMT: not used on this page.
Activity Data Vehicle Miles Traveled per Hour Off-site
H - White
Ridge to Plant
I - Plant Feed
J - White Knob Pit
K - On-Road
Trucks
L - Crusher to White Ridge
M - White Ridge Pit per Year
24,260 365 3,725 6,186 2,300 1,300 - - - - - - - - - - - - - - - - - -
- 0.72 - - - - - 0.23 - - - - - - - - - -
21.41 3940736
- - - - - - - - - - - - - - - - - -
- - - - - - - - - - - - - - - - - -
H I J K L M - 0.94 - 21.41 - - 0% 1% 0% 0% 0%

Sentinel-Butterfield Quarry Expansion ProjectSan Bernardino County, California
Road Emissions
om01_SBProjectAir_v1.3.xlsb 1 10/8/2013
BaselineA Bper Year per Day per Hour per Year per Day per Hour
VMT (miles) 1,618.07 15.34 1.84 962.78 11.05 1.33VMT (%) 1.21% 0.99% 1.05% 0.72% 0.71% 0.76%TSP - Dust 6,018.41 57.06 6.85 3,581.04 41.09 4.93PM10 - Dust 1,711.42 16.23 1.95 1,018.32 11.68 1.40PM2.5 - Dust 171.14 1.62 0.19 101.83 1.17 0.14TSP - Exhaust 36.22 0.34 0.04 21.55 0.25 0.03PM10 - Exhaust 36.22 0.34 0.04 21.55 0.25 0.03PM2.5 - Exhaust 33.32 0.32 0.04 19.83 0.23 0.03HC 62.81 0.60 0.07 37.37 0.43 0.05NOx 1,160 11.00 1.32 690 7.92 0.95CO 757 7.17 0.86 450 5.17 0.62SOx 0.05 0.00 0.00 0.03 0.00 0.00CO2 121.05 - - 72.03 - -
Project 1.40 scale factor from Project VMT/yr over Baseline VMT/yrA Bper Year per Day per Hour per Year per Day per Hour
VMT (miles) 7,319.05 45.77 5.49 7,340.91 46.04 5.52VMT (%) 3.91% 3.90% 3.90% 3.92% 3.92% 3.92%TSP - Dust 27,223.18 170.23 20.43 27,304.48 171.23 20.55PM10 - Dust 7,741.29 48.41 5.81 7,764.41 48.69 5.84PM2.5 - Dust 774.13 4.84 0.58 776.44 4.87 0.58TSP - Exhaust 163.84 1.02 0.12 164.33 1.03 0.12PM10 - Exhaust 163.84 1.02 0.12 164.33 1.03 0.12PM2.5 - Exhaust 150.73 0.94 0.11 151.18 0.95 0.11HC 284.11 1.78 0.21 284.96 1.79 0.21NOx 5,246.83 32.81 3.94 5,262.50 33.00 3.96CO 3,422.78 21.40 2.57 3,433.00 21.53 2.58SOx 0.22 0.00 0.00 0.22 0.00 0.00CO2 (tons) 547.54 - - 549.17 - -
IncrementA Bper Year per Day per Hour per Year per Day per Hour
VMT (miles) 5,700.98 30.42 3.65 6,378.13 34.99 4.20TSP - Dust 21,204.77 113.16 13.58 23,723.43 130.15 15.62PM10 - Dust 6,029.87 32.18 3.86 6,746.09 37.01 4.44PM2.5 - Dust 602.99 3.22 0.39 674.61 3.70 0.44TSP - Exhaust 127.62 0.68 0.08 142.78 0.78 0.09PM10 - Exhaust 127.62 0.68 0.08 142.78 0.78 0.09PM2.5 - Exhaust 117.41 0.63 0.08 131.35 0.72 0.09HC 221.30 1.18 0.14 247.58 1.36 0.16NOx 4,086.88 21.81 2.62 4,572.31 25.08 3.01CO 2,666.08 14.23 1.71 2,982.75 16.36 1.96SOx 0.17 0.00 0.00 0.19 0.00 0.00CO2 (tons) 426.49 - - 477.15 - -

Sentinel-Butterfield Quarry Expansion ProjectSan Bernardino County, California
Road Emissions
om01_SBProjectAir_v1.3.xlsb 2 10/8/2013
Baseline
VMT (miles)VMT (%)TSP - DustPM10 - DustPM2.5 - DustTSP - ExhaustPM10 - ExhaustPM2.5 - ExhaustHCNOxCOSOxCO2
Project
VMT (miles)VMT (%)TSP - DustPM10 - DustPM2.5 - DustTSP - ExhaustPM10 - ExhaustPM2.5 - ExhaustHCNOxCOSOxCO2 (tons)
Increment
VMT (miles)TSP - DustPM10 - DustPM2.5 - DustTSP - ExhaustPM10 - ExhaustPM2.5 - ExhaustHCNOxCOSOxCO2 (tons)
C Dper Year per Day per Hour per Year per Day per Hour
1,355.33 16.39 1.97 - - -1.01% 1.05% 1.13% 0.00% 0.00% 0.00%
5,041.15 60.95 7.31 - - -1,433.52 17.33 2.08 - - -
143.35 1.73 0.21 - - -30.34 0.37 0.04 - - -30.34 0.37 0.04 - - -27.91 0.34 0.04 - - -52.61 0.64 0.08 - - -
972 11.75 1.41 - - -634 7.66 0.92 - - -
0.04 0.00 0.00 - - -101.39 - - - - -
C Dper Year per Day per Hour per Year per Day per Hour
6,135.41 38.52 4.62 - - -3.28% 3.28% 3.28% 0.00% 0.00% 0.00%
22,820.63 143.29 17.19 - - -6,489.36 40.75 4.89 - - -
648.94 4.07 0.49 - - -137.34 0.86 0.10 - - -137.34 0.86 0.10 - - -126.35 0.79 0.10 - - -238.16 1.50 0.18 - - -
4,398.31 27.62 3.31 - - -2,869.24 18.02 2.16 - - -
0.18 0.00 0.00 - - -458.99 - - - - -
C Dper Year per Day per Hour per Year per Day per Hour
4,780.08 22.14 2.66 - - -17,779.48 82.34 9.88 - - -
5,055.84 23.42 2.81 - - -505.58 2.34 0.28 - - -107.00 0.50 0.06 - - -107.00 0.50 0.06 - - -
98.44 0.46 0.05 - - -185.55 0.86 0.10 - - -
3,426.71 15.87 1.90 - - -2,235.42 10.35 1.24 - - -
0.14 0.00 0.00 - - -357.60 - - - - -

Sentinel-Butterfield Quarry Expansion ProjectSan Bernardino County, California
Road Emissions
om01_SBProjectAir_v1.3.xlsb 3 10/8/2013
Baseline
VMT (miles)VMT (%)TSP - DustPM10 - DustPM2.5 - DustTSP - ExhaustPM10 - ExhaustPM2.5 - ExhaustHCNOxCOSOxCO2
Project
VMT (miles)VMT (%)TSP - DustPM10 - DustPM2.5 - DustTSP - ExhaustPM10 - ExhaustPM2.5 - ExhaustHCNOxCOSOxCO2 (tons)
Increment
VMT (miles)TSP - DustPM10 - DustPM2.5 - DustTSP - ExhaustPM10 - ExhaustPM2.5 - ExhaustHCNOxCOSOxCO2 (tons)
E Fper Year per Day per Hour per Year per Day per Hour
8,012.74 93.45 11.21 - - -6.00% 6.01% 6.42% 0.00% 0.00% 0.00%
29,803.34 347.60 41.71 - - -8,475.00 98.85 11.86 - - -
847.50 9.88 1.19 - - -179.37 2.09 0.25 - - -179.37 2.09 0.25 - - -165.02 1.92 0.23 - - -311.04 3.63 0.44 - - -
5,744 66.99 8.04 - - -3,747 43.70 5.24 - - -
0.24 0.00 0.00 - - -599.43 - - - - -
E Fper Year per Day per Hour per Year per Day per Hour
34,529.77 216.74 26.01 - - -18.46% 18.47% 18.47% 0.00% 0.00% 0.00%
128,433.33 806.16 96.74 - - -36,521.81 229.24 27.51 - - -
3,652.18 22.92 2.75 - - -772.95 4.85 0.58 - - -772.95 4.85 0.58 - - -711.12 4.46 0.54 - - -
1,340.37 8.41 1.01 - - -24,753.46 155.37 18.64 - - -16,147.95 101.36 12.16 - - -
1.03 0.01 0.00 - - -2,583.16 - - - - -
E Fper Year per Day per Hour per Year per Day per Hour
26,517.04 123.29 14.79 - - -98,629.99 458.56 55.03 - - -28,046.81 130.40 15.65 - - -
2,804.68 13.04 1.56 - - -593.59 2.76 0.33 - - -593.59 2.76 0.33 - - -546.10 2.54 0.30 - - -
1,029.33 4.79 0.57 - - -19,009.34 88.38 10.61 - - -12,400.77 57.65 6.92 - - -
0.79 0.00 0.00 - - -1,983.73 - - - - -
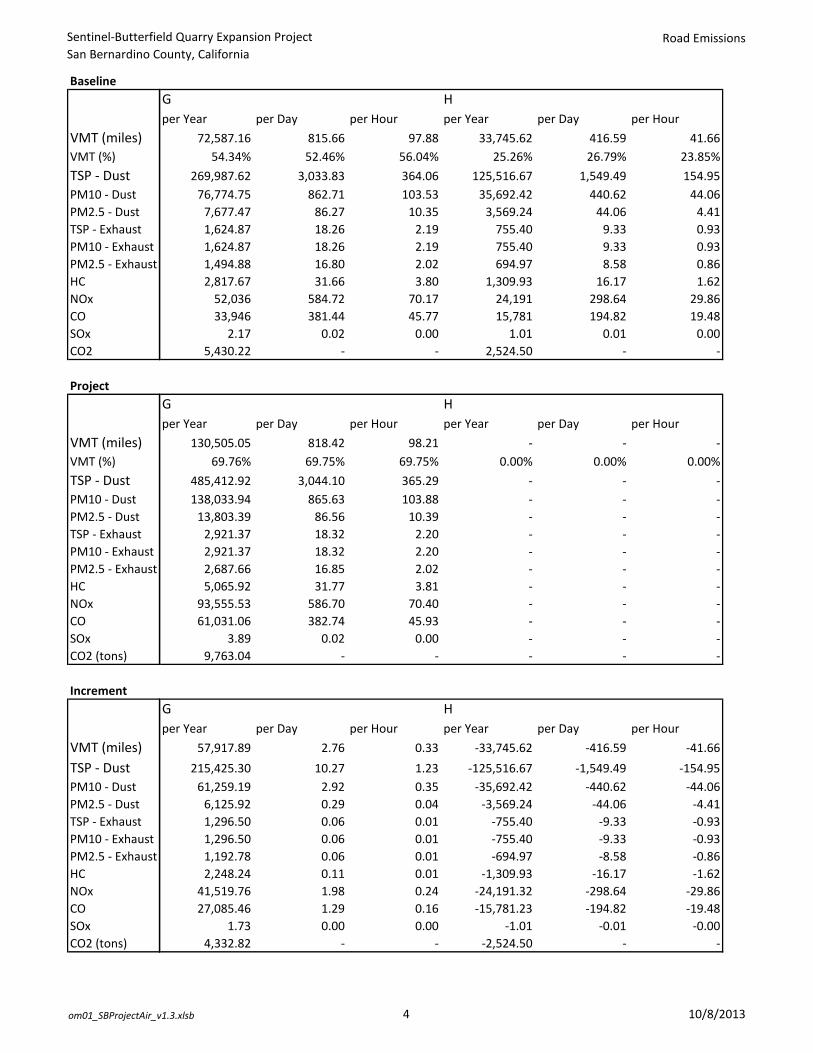
Sentinel-Butterfield Quarry Expansion ProjectSan Bernardino County, California
Road Emissions
om01_SBProjectAir_v1.3.xlsb 4 10/8/2013
Baseline
VMT (miles)VMT (%)TSP - DustPM10 - DustPM2.5 - DustTSP - ExhaustPM10 - ExhaustPM2.5 - ExhaustHCNOxCOSOxCO2
Project
VMT (miles)VMT (%)TSP - DustPM10 - DustPM2.5 - DustTSP - ExhaustPM10 - ExhaustPM2.5 - ExhaustHCNOxCOSOxCO2 (tons)
Increment
VMT (miles)TSP - DustPM10 - DustPM2.5 - DustTSP - ExhaustPM10 - ExhaustPM2.5 - ExhaustHCNOxCOSOxCO2 (tons)
G Hper Year per Day per Hour per Year per Day per Hour
72,587.16 815.66 97.88 33,745.62 416.59 41.6654.34% 52.46% 56.04% 25.26% 26.79% 23.85%
269,987.62 3,033.83 364.06 125,516.67 1,549.49 154.9576,774.75 862.71 103.53 35,692.42 440.62 44.06
7,677.47 86.27 10.35 3,569.24 44.06 4.411,624.87 18.26 2.19 755.40 9.33 0.931,624.87 18.26 2.19 755.40 9.33 0.931,494.88 16.80 2.02 694.97 8.58 0.862,817.67 31.66 3.80 1,309.93 16.17 1.62
52,036 584.72 70.17 24,191 298.64 29.8633,946 381.44 45.77 15,781 194.82 19.48
2.17 0.02 0.00 1.01 0.01 0.005,430.22 - - 2,524.50 - -
G Hper Year per Day per Hour per Year per Day per Hour
130,505.05 818.42 98.21 - - -69.76% 69.75% 69.75% 0.00% 0.00% 0.00%
485,412.92 3,044.10 365.29 - - -138,033.94 865.63 103.88 - - -
13,803.39 86.56 10.39 - - -2,921.37 18.32 2.20 - - -2,921.37 18.32 2.20 - - -2,687.66 16.85 2.02 - - -5,065.92 31.77 3.81 - - -
93,555.53 586.70 70.40 - - -61,031.06 382.74 45.93 - - -
3.89 0.02 0.00 - - -9,763.04 - - - - -
G Hper Year per Day per Hour per Year per Day per Hour
57,917.89 2.76 0.33 -33,745.62 -416.59 -41.66215,425.30 10.27 1.23 -125,516.67 -1,549.49 -154.95
61,259.19 2.92 0.35 -35,692.42 -440.62 -44.066,125.92 0.29 0.04 -3,569.24 -44.06 -4.411,296.50 0.06 0.01 -755.40 -9.33 -0.931,296.50 0.06 0.01 -755.40 -9.33 -0.931,192.78 0.06 0.01 -694.97 -8.58 -0.862,248.24 0.11 0.01 -1,309.93 -16.17 -1.62
41,519.76 1.98 0.24 -24,191.32 -298.64 -29.8627,085.46 1.29 0.16 -15,781.23 -194.82 -19.48
1.73 0.00 0.00 -1.01 -0.01 -0.004,332.82 - - -2,524.50 - -

Sentinel-Butterfield Quarry Expansion ProjectSan Bernardino County, California
Road Emissions
om01_SBProjectAir_v1.3.xlsb 5 10/8/2013
Baseline
VMT (miles)VMT (%)TSP - DustPM10 - DustPM2.5 - DustTSP - ExhaustPM10 - ExhaustPM2.5 - ExhaustHCNOxCOSOxCO2
Project
VMT (miles)VMT (%)TSP - DustPM10 - DustPM2.5 - DustTSP - ExhaustPM10 - ExhaustPM2.5 - ExhaustHCNOxCOSOxCO2 (tons)
Increment
VMT (miles)TSP - DustPM10 - DustPM2.5 - DustTSP - ExhaustPM10 - ExhaustPM2.5 - ExhaustHCNOxCOSOxCO2 (tons)
I Jper Year per Day per Hour per Year per Day per Hour
1,204.93 14.10 1.57 8,719.27 106.44 10.640.90% 0.91% 0.90% 6.53% 6.85% 6.09%
4,481.74 52.45 5.83 32,431.27 395.90 39.591,274.45 14.92 1.66 9,222.28 112.58 11.26
127.44 1.49 0.17 922.23 11.26 1.1326.97 0.32 0.04 195.18 2.38 0.2426.97 0.32 0.04 195.18 2.38 0.2424.81 0.29 0.03 179.57 2.19 0.2246.77 0.55 0.06 338.46 4.13 0.41
864 10.11 1.12 6,251 76.30 7.63563 6.59 0.73 4,078 49.78 4.98
0.04 0.00 0.00 0.26 0.00 0.0090.14 - - 652.29 - -
I Jper Year per Day per Hour per Year per Day per Hour
1,253.54 7.86 0.94 - - -0.67% 0.67% 0.67% 0.00% 0.00% 0.00%
4,662.52 29.24 3.51 - - -1,325.85 8.31 1.00 - - -
132.59 0.83 0.10 - - -28.06 0.18 0.02 - - -28.06 0.18 0.02 - - -25.82 0.16 0.02 - - -48.66 0.31 0.04 - - -
898.63 5.64 0.68 - - -586.22 3.68 0.44 - - -
0.04 0.00 0.00 - - -93.78 - - - - -
I Jper Year per Day per Hour per Year per Day per Hour
48.60 -6.24 -0.62 -8,719.27 -106.44 -10.64180.78 -23.21 -2.32 -32,431.27 -395.90 -39.59
51.41 -6.60 -0.66 -9,222.28 -112.58 -11.265.14 -0.66 -0.07 -922.23 -11.26 -1.131.09 -0.14 -0.01 -195.18 -2.38 -0.241.09 -0.14 -0.01 -195.18 -2.38 -0.241.00 -0.13 -0.01 -179.57 -2.19 -0.221.89 -0.24 -0.02 -338.46 -4.13 -0.41
34.84 -4.47 -0.45 -6,250.60 -76.30 -7.6322.73 -2.92 -0.29 -4,077.59 -49.78 -4.98
0.00 -0.00 -0.00 -0.26 -0.00 -0.003.64 - - -652.29 - -

Sentinel-Butterfield Quarry Expansion ProjectSan Bernardino County, California
Road Emissions
om01_SBProjectAir_v1.3.xlsb 6 10/8/2013
Baseline
VMT (miles)VMT (%)TSP - DustPM10 - DustPM2.5 - DustTSP - ExhaustPM10 - ExhaustPM2.5 - ExhaustHCNOxCOSOxCO2
Project
VMT (miles)VMT (%)TSP - DustPM10 - DustPM2.5 - DustTSP - ExhaustPM10 - ExhaustPM2.5 - ExhaustHCNOxCOSOxCO2 (tons)
Increment
VMT (miles)TSP - DustPM10 - DustPM2.5 - DustTSP - ExhaustPM10 - ExhaustPM2.5 - ExhaustHCNOxCOSOxCO2 (tons)
K Lper Year per Day per Hour per Year per Day per Hour
20,421.14 239.00 26.56 5,383.71 65.72 6.570.00% 0.00% 0.00% 4.03% 4.23% 3.76%
751.91 8.80 0.98 20,024.68 244.45 24.44150.38 1.76 0.20 5,694.30 69.51 6.95
36.91 0.43 0.05 569.43 6.95 0.7031.80 0.37 0.04 120.51 1.47 0.1531.80 0.37 0.04 120.51 1.47 0.1529.25 0.34 0.04 110.87 1.35 0.1429.32 0.34 0.04 208.98 2.55 0.26
553.40 6.48 0.72 3,859 47.11 4.71132.81 1.55 0.17 2,518 30.73 3.07
0.72 0.01 0.00 0.16 0.00 0.00 - - - 402.75 - -
K Lper Year per Day per Hour per Year per Day per Hour
28,452.92 178.43 21.41 - - -0.00% 0.00% 0.00% 0.00% 0.00% 0.00%
1,047.65 6.57 0.79 - - -209.53 1.31 0.16 - - -
51.43 0.32 0.04 - - -44.30 0.28 0.03 - - -44.30 0.28 0.03 - - -40.76 0.26 0.03 - - -40.85 0.26 0.03 - - -
771.05 4.84 0.58 - - -185.05 1.16 0.14 - - -
1.01 0.01 0.00 - - - - - - - - -
K Lper Year per Day per Hour per Year per Day per Hour
8,031.78 -60.57 -5.14 -5,383.71 -65.72 -6.57295.73 -2.23 -0.19 -20,024.68 -244.45 -24.44
59.15 -0.45 -0.04 -5,694.30 -69.51 -6.9514.52 -0.11 -0.01 -569.43 -6.95 -0.7012.51 -0.09 -0.01 -120.51 -1.47 -0.1512.51 -0.09 -0.01 -120.51 -1.47 -0.1511.51 -0.09 -0.01 -110.87 -1.35 -0.1411.53 -0.09 -0.01 -208.98 -2.55 -0.26
217.66 -1.64 -0.14 -3,859.43 -47.11 -4.7152.24 -0.39 -0.03 -2,517.71 -30.73 -3.07
0.28 -0.00 -0.00 -0.16 -0.00 -0.00 - - - -402.75 - -
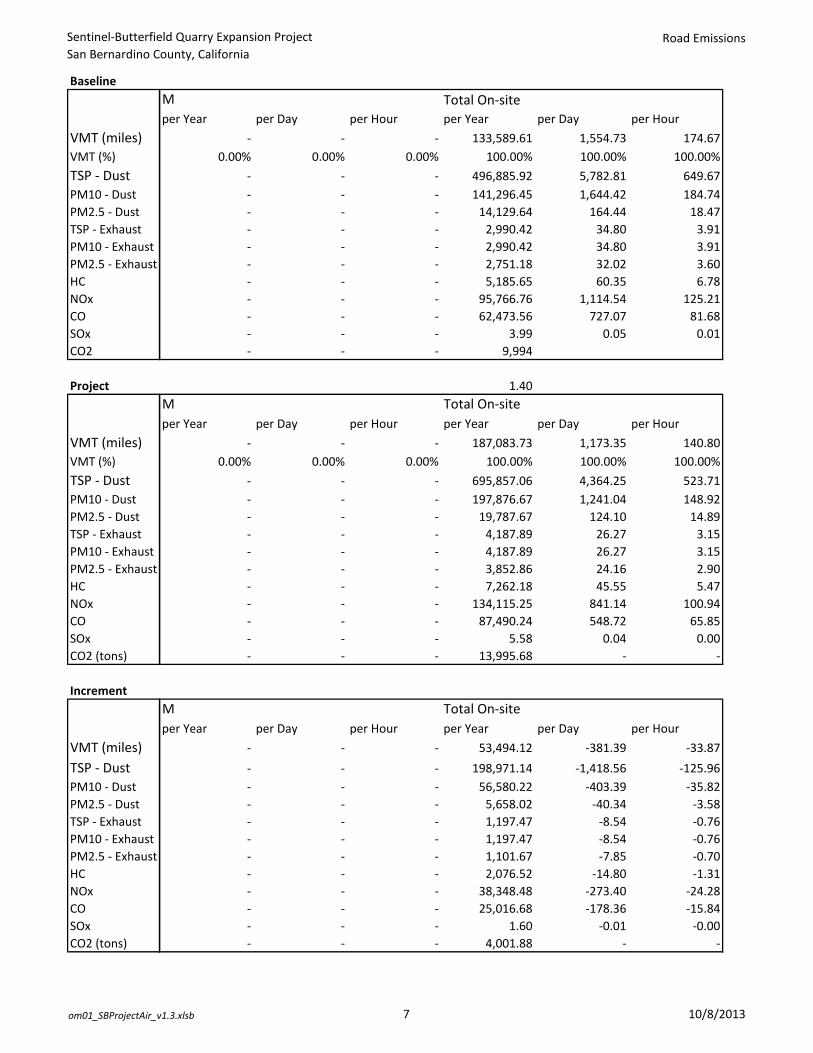
Sentinel-Butterfield Quarry Expansion ProjectSan Bernardino County, California
Road Emissions
om01_SBProjectAir_v1.3.xlsb 7 10/8/2013
Baseline
VMT (miles)VMT (%)TSP - DustPM10 - DustPM2.5 - DustTSP - ExhaustPM10 - ExhaustPM2.5 - ExhaustHCNOxCOSOxCO2
Project
VMT (miles)VMT (%)TSP - DustPM10 - DustPM2.5 - DustTSP - ExhaustPM10 - ExhaustPM2.5 - ExhaustHCNOxCOSOxCO2 (tons)
Increment
VMT (miles)TSP - DustPM10 - DustPM2.5 - DustTSP - ExhaustPM10 - ExhaustPM2.5 - ExhaustHCNOxCOSOxCO2 (tons)
M Total On-siteper Year per Day per Hour per Year per Day per Hour
- - - 133,589.61 1,554.73 174.670.00% 0.00% 0.00% 100.00% 100.00% 100.00%
- - - 496,885.92 5,782.81 649.67 - - - 141,296.45 1,644.42 184.74 - - - 14,129.64 164.44 18.47 - - - 2,990.42 34.80 3.91 - - - 2,990.42 34.80 3.91 - - - 2,751.18 32.02 3.60 - - - 5,185.65 60.35 6.78 - - - 95,766.76 1,114.54 125.21 - - - 62,473.56 727.07 81.68 - - - 3.99 0.05 0.01 - - - 9,994
1.40M Total On-siteper Year per Day per Hour per Year per Day per Hour
- - - 187,083.73 1,173.35 140.800.00% 0.00% 0.00% 100.00% 100.00% 100.00%
- - - 695,857.06 4,364.25 523.71 - - - 197,876.67 1,241.04 148.92 - - - 19,787.67 124.10 14.89 - - - 4,187.89 26.27 3.15 - - - 4,187.89 26.27 3.15 - - - 3,852.86 24.16 2.90 - - - 7,262.18 45.55 5.47 - - - 134,115.25 841.14 100.94 - - - 87,490.24 548.72 65.85 - - - 5.58 0.04 0.00 - - - 13,995.68 - -
M Total On-siteper Year per Day per Hour per Year per Day per Hour
- - - 53,494.12 -381.39 -33.87 - - - 198,971.14 -1,418.56 -125.96 - - - 56,580.22 -403.39 -35.82 - - - 5,658.02 -40.34 -3.58 - - - 1,197.47 -8.54 -0.76 - - - 1,197.47 -8.54 -0.76 - - - 1,101.67 -7.85 -0.70 - - - 2,076.52 -14.80 -1.31 - - - 38,348.48 -273.40 -24.28 - - - 25,016.68 -178.36 -15.84 - - - 1.60 -0.01 -0.00 - - - 4,001.88 - -

Sentinel-Butterfield Quarry Expansion ProjectSan Bernardino County, California
Road Emissions
om01_SBProjectAir_v1.3.xlsb 8 10/8/2013
Baseline
VMT (miles)VMT (%)TSP - DustPM10 - DustPM2.5 - DustTSP - ExhaustPM10 - ExhaustPM2.5 - ExhaustHCNOxCOSOxCO2
Project
VMT (miles)VMT (%)TSP - DustPM10 - DustPM2.5 - DustTSP - ExhaustPM10 - ExhaustPM2.5 - ExhaustHCNOxCOSOxCO2 (tons)
Increment
VMT (miles)TSP - DustPM10 - DustPM2.5 - DustTSP - ExhaustPM10 - ExhaustPM2.5 - ExhaustHCNOxCOSOxCO2 (tons)
Total Offsite Totalper Year per Day per Hour per Year per Day per Hour
3,787,945.55 3,787,945.55 3,787,945.55 3,921,535.16 3,789,500.28 3,788,120.22100.00% 100.00% 100.00% 200.00% 200.00% 200.00%
139,473.29 139,473.29 139,473.29 636,359.21 145,256.10 140,122.9627,894.66 27,894.66 27,894.66 169,191.10 29,539.08 28,079.40
6,846.87 6,846.87 6,846.87 20,976.52 7,011.31 6,865.355,898.06 5,898.06 5,898.06 8,888.47 5,932.86 5,901.975,898.06 5,898.06 5,898.06 8,888.47 5,932.86 5,901.975,426.21 5,426.21 5,426.21 8,177.40 5,458.23 5,429.815,437.75 5,437.75 5,437.75 10,623.40 5,498.10 5,444.53
102,650.55 102,650.55 102,650.55 198,417.31 103,765.10 102,775.7724,635.25 24,635.25 24,635.25 87,108.81 25,362.33 24,716.94
133.92 133.92 133.92 137.90 133.96 133.927,067.22 7,067.22 7,067.22 17,061.02 7,067.22 7,067.22
Total Offsite Totalper Year per Day per Hour per Year per Day per Hour
3,940,736.00 3,940,736.00 3,940,736.00 4,127,819.73 3,941,909.35 3,940,876.80100.00% 100.00% 100.00% 200.00% 200.00% 200.00%
145,099.08 145,099.08 145,099.08 840,956.14 149,463.33 145,622.7929,019.82 29,019.82 29,019.82 226,896.48 30,260.85 29,168.74
7,123.05 7,123.05 7,123.05 26,910.71 7,247.15 7,137.946,135.96 6,135.96 6,135.96 10,323.85 6,162.23 6,139.116,135.96 6,135.96 6,135.96 10,323.85 6,162.23 6,139.115,645.08 5,645.08 5,645.08 9,497.94 5,669.25 5,647.985,657.09 5,657.09 5,657.09 12,919.27 5,702.63 5,662.55
106,791.06 106,791.06 106,791.06 240,906.31 107,632.20 106,892.0025,628.94 25,628.94 25,628.94 113,119.18 26,177.66 25,694.79
139.32 139.32 139.32 144.90 139.35 139.327,339.35 7,339.35 7,339.35 21,335.03 7,339.35 7,339.35
Total Offsite Totalper Year per Day per Hour per Year per Day per Hour
152,790.45 152,790.45 152,790.45 206,284.57 152,409.06 152,756.585,625.79 5,625.79 5,625.79 204,596.93 4,207.23 5,499.831,125.16 1,125.16 1,125.16 57,705.38 721.77 1,089.34
276.18 276.18 276.18 5,934.20 235.84 272.59237.90 237.90 237.90 1,435.38 229.37 237.15237.90 237.90 237.90 1,435.38 229.37 237.15218.87 218.87 218.87 1,320.55 211.02 218.17219.34 219.34 219.34 2,295.86 204.53 218.02
4,140.51 4,140.51 4,140.51 42,488.99 3,867.10 4,116.23993.69 993.69 993.69 26,010.37 815.33 977.85
5.40 5.40 5.40 7.00 5.39 5.40272.13 272.13 272.13 4,274.01 272.13 272.13

Sentinel-Butterfield Quarry Expansion ProjectSan Bernardino County, California
Criteria
om01_SBProjectAir_v1.3.xlsb 1 10/8/2013
21 VOL1 VOL2 VOL3 VOL4 VOL5 VOL6 VOL7 VOL8 VOL9 VOL10TSPann -3.50E-01 -8.14E-01 0.00E+00 -3.00E-01 -3.00E-01 1.14E-01 4.33E-01 8.23E-03 3.41E-01 1.30E+00TSPday -1.28E+00 -2.97E+00 0.00E+00 -1.09E+00 -1.09E+00 4.15E-01 1.58E+00 3.01E-02 1.24E+00 4.73E+00PM10ann -1.17E-01 -4.10E-01 0.00E+00 -1.48E-01 -1.48E-01 2.10E-02 2.18E-01 4.30E-03 6.40E-02 6.52E-01PM10day -4.29E-01 -1.50E+00 0.00E+00 -5.40E-01 -5.40E-01 7.66E-02 7.97E-01 1.57E-02 2.33E-01 2.38E+00PM25ann -4.03E-02 -1.27E-01 0.00E+00 -5.23E-02 -5.23E-02 5.06E-03 5.23E-02 1.71E-03 2.34E-02 1.53E-01PM25day -1.47E-01 -4.62E-01 0.00E+00 -1.91E-01 -1.91E-01 1.85E-02 1.91E-01 6.22E-03 8.53E-02 5.60E-01NOxyr -1.42E-01 -1.17E-01 0.00E+00 -3.45E-03 -3.45E-03 2.50E-03 7.30E-02 1.28E-02 1.02E-01 1.52E-01NOxhr -2.08E+00 -1.71E+00 0.00E+00 -5.03E-02 -5.03E-02 3.66E-02 1.07E+00 1.87E-01 1.49E+00 2.22E+00
TSPann (lb/yr/src) -24344.179 -56602.499 0 -20836.774 -20836.774 7899.79756 30132.5258 572.507122 23689.7697 90156.0658TSPday (lb/day/src) -243.44179 -566.02499 0 -208.36774 -208.36774 78.9979756 301.325258 5.72507122 236.897697 901.560658PM10ann (lb/yr/src) -8167.1132 -28507.675 0 -10281.845 -10281.845 1459.43901 15182.9663 298.702889 4446.23095 45307.3873PM10day (lb/day/src) -81.671132 -285.07675 0 -102.81845 -102.81845 14.5943901 151.829663 2.98702889 44.4623095 453.073873PM25ann (lb/yr/src) -2803.8977 -8798.7133 0 -3636.8902 -3636.8902 351.818377 3634.15286 118.568524 1625.57054 10660.9469PM25day (lb/day/src) -28.038977 -87.987133 0 -36.368902 -36.368902 3.51818377 36.3415286 1.18568524 16.2557054 106.609469NOx (lb/yr/src) -9898.008 -8146.057 0 -239.58991 -239.58991 174.091745 5075.75189 892.577239 7092.38564 10583.7616NOx (lb/hr/src) -16.49668 -13.576762 0 -0.3993165 -0.3993165 0.29015291 8.45958648 1.48762873 11.8206427 17.6396027
TSPann (lb/yr) -24,344 -56,602 0 -20,837 -20,837 7,900 30,133 573 23,690 90,156TSPday (lb/day) -243 -566 0 -208 -208 79 301 6 237 902PM10ann (lb/yr) -8,167 -28,508 0 -10,282 -10,282 1,459 15,183 299 4,446 45,307PM10day (lb/day) -82 -285 0 -103 -103 15 152 3 44 453PM25ann (lb/yr) -2,804 -8,799 0 -3,637 -3,637 352 3,634 119 1,626 10,661PM25day (lb/day) -28 -88 0 -36 -36 4 36 1 16 107
HC (lb/yr) -640 -554 0 -16 -16 23 344 61 330 720NOx (lb/yr) -9,898 -8,146 0 -240 -240 174 5,076 893 7,092 10,584CO (lb/yr) -14,201 -5,306 0 -156 -156 112 2,822 581 7,437 6,894SOx (lb/yr) -0.305 -0.292 0 -0.009 -0.009 0.006 0.164 0.032 0.731 0.379CO2 (ton/yr) -584 -769 0 -23 -23 25 433 84 806 999TSP (lb/yr) -24,344 -56,602 0 -20,837 -20,837 7,900 30,133 573 23,690 90,156PM10 (lb/yr) -8,167 -28,508 0 -10,282 -10,282 1,459 15,183 299 4,446 45,307PM2.5 (lb/yr) -2,804 -8,799 0 -3,637 -3,637 352 3,634 119 1,626 10,661
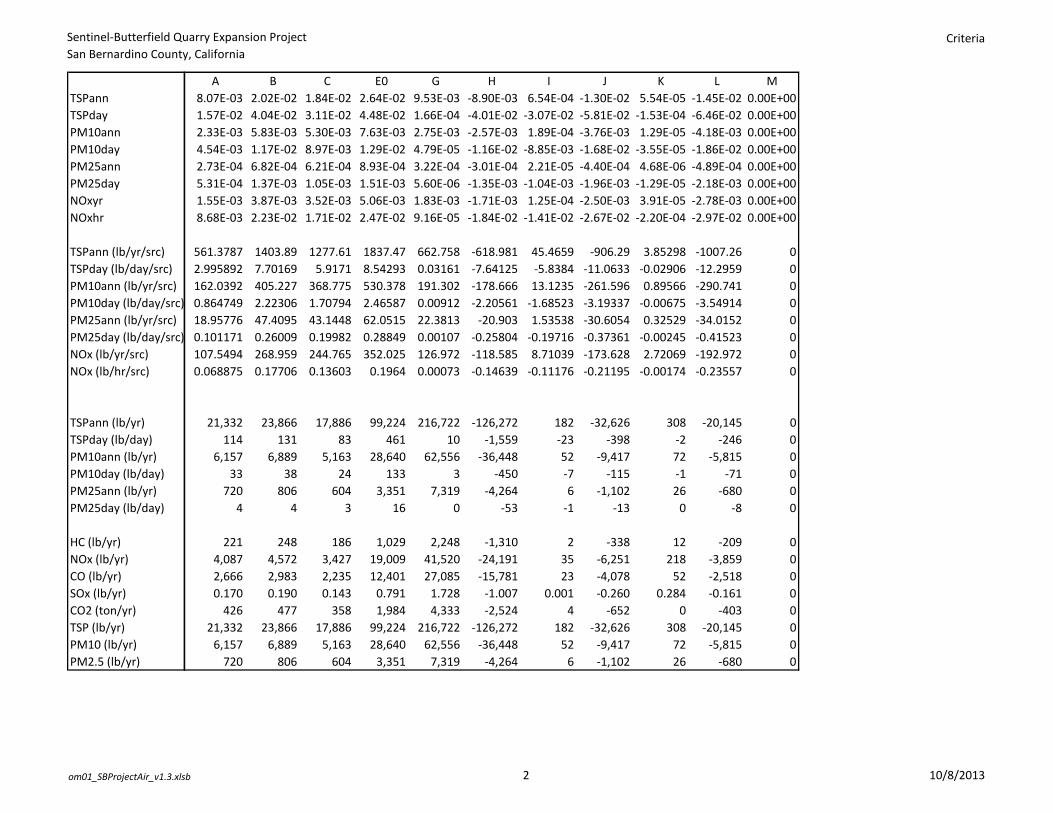
Sentinel-Butterfield Quarry Expansion ProjectSan Bernardino County, California
Criteria
om01_SBProjectAir_v1.3.xlsb 2 10/8/2013
21TSPannTSPdayPM10annPM10dayPM25annPM25dayNOxyrNOxhr
TSPann (lb/yr/src)TSPday (lb/day/src)PM10ann (lb/yr/src)PM10day (lb/day/src)PM25ann (lb/yr/src)PM25day (lb/day/src)NOx (lb/yr/src)NOx (lb/hr/src)
TSPann (lb/yr)TSPday (lb/day)PM10ann (lb/yr)PM10day (lb/day)PM25ann (lb/yr)PM25day (lb/day)
HC (lb/yr)NOx (lb/yr)CO (lb/yr)SOx (lb/yr)CO2 (ton/yr)TSP (lb/yr)PM10 (lb/yr)PM2.5 (lb/yr)
A B C E0 G H I J K L M8.07E-03 2.02E-02 1.84E-02 2.64E-02 9.53E-03 -8.90E-03 6.54E-04 -1.30E-02 5.54E-05 -1.45E-02 0.00E+001.57E-02 4.04E-02 3.11E-02 4.48E-02 1.66E-04 -4.01E-02 -3.07E-02 -5.81E-02 -1.53E-04 -6.46E-02 0.00E+002.33E-03 5.83E-03 5.30E-03 7.63E-03 2.75E-03 -2.57E-03 1.89E-04 -3.76E-03 1.29E-05 -4.18E-03 0.00E+004.54E-03 1.17E-02 8.97E-03 1.29E-02 4.79E-05 -1.16E-02 -8.85E-03 -1.68E-02 -3.55E-05 -1.86E-02 0.00E+002.73E-04 6.82E-04 6.21E-04 8.93E-04 3.22E-04 -3.01E-04 2.21E-05 -4.40E-04 4.68E-06 -4.89E-04 0.00E+005.31E-04 1.37E-03 1.05E-03 1.51E-03 5.60E-06 -1.35E-03 -1.04E-03 -1.96E-03 -1.29E-05 -2.18E-03 0.00E+001.55E-03 3.87E-03 3.52E-03 5.06E-03 1.83E-03 -1.71E-03 1.25E-04 -2.50E-03 3.91E-05 -2.78E-03 0.00E+008.68E-03 2.23E-02 1.71E-02 2.47E-02 9.16E-05 -1.84E-02 -1.41E-02 -2.67E-02 -2.20E-04 -2.97E-02 0.00E+00
561.3787 1403.89 1277.61 1837.47 662.758 -618.981 45.4659 -906.29 3.85298 -1007.26 02.995892 7.70169 5.9171 8.54293 0.03161 -7.64125 -5.8384 -11.0633 -0.02906 -12.2959 0162.0392 405.227 368.775 530.378 191.302 -178.666 13.1235 -261.596 0.89566 -290.741 00.864749 2.22306 1.70794 2.46587 0.00912 -2.20561 -1.68523 -3.19337 -0.00675 -3.54914 018.95776 47.4095 43.1448 62.0515 22.3813 -20.903 1.53538 -30.6054 0.32529 -34.0152 00.101171 0.26009 0.19982 0.28849 0.00107 -0.25804 -0.19716 -0.37361 -0.00245 -0.41523 0107.5494 268.959 244.765 352.025 126.972 -118.585 8.71039 -173.628 2.72069 -192.972 00.068875 0.17706 0.13603 0.1964 0.00073 -0.14639 -0.11176 -0.21195 -0.00174 -0.23557 0
21,332 23,866 17,886 99,224 216,722 -126,272 182 -32,626 308 -20,145 0114 131 83 461 10 -1,559 -23 -398 -2 -246 0
6,157 6,889 5,163 28,640 62,556 -36,448 52 -9,417 72 -5,815 033 38 24 133 3 -450 -7 -115 -1 -71 0
720 806 604 3,351 7,319 -4,264 6 -1,102 26 -680 04 4 3 16 0 -53 -1 -13 0 -8 0
221 248 186 1,029 2,248 -1,310 2 -338 12 -209 04,087 4,572 3,427 19,009 41,520 -24,191 35 -6,251 218 -3,859 02,666 2,983 2,235 12,401 27,085 -15,781 23 -4,078 52 -2,518 00.170 0.190 0.143 0.791 1.728 -1.007 0.001 -0.260 0.284 -0.161 0
426 477 358 1,984 4,333 -2,524 4 -652 0 -403 021,332 23,866 17,886 99,224 216,722 -126,272 182 -32,626 308 -20,145 0
6,157 6,889 5,163 28,640 62,556 -36,448 52 -9,417 72 -5,815 0720 806 604 3,351 7,319 -4,264 6 -1,102 26 -680 0

Sentinel-Butterfield Quarry Expansion ProjectSan Bernardino County, California
Criteria
om01_SBProjectAir_v1.3.xlsb 3 10/8/2013
21TSPannTSPdayPM10annPM10dayPM25annPM25dayNOxyrNOxhr
TSPann (lb/yr/src)TSPday (lb/day/src)PM10ann (lb/yr/src)PM10day (lb/day/src)PM25ann (lb/yr/src)PM25day (lb/day/src)NOx (lb/yr/src)NOx (lb/hr/src)
TSPann (lb/yr)TSPday (lb/day)PM10ann (lb/yr)PM10day (lb/day)PM25ann (lb/yr)PM25day (lb/day)
HC (lb/yr)NOx (lb/yr)CO (lb/yr)SOx (lb/yr)CO2 (ton/yr)TSP (lb/yr)PM10 (lb/yr)PM2.5 (lb/yr)
Total Sentinel Butterfield Total White Knob Total Processing Plant Total Offsite
523,581 -301,664 8,0822,245 -3,429 56
174,641 -108,919 1,512883 -1,208 8
28,839 -24,923 358187 -263 3
5,387 -3,085 25 219.396,259 -52,825 209 4140.565,105 -42,195 134 993.7
4 -2 0 5.49,900 -4,978 28 272.1
523,581 -301,664 8,082 5863.7174,641 -108,919 1,512 1363.1
28,839 -24,923 358 495.0

Sentinel-Butterfield Quarry Expansion ProjectSan Bernardino County, California
Criteria
om01_SBProjectAir_v1.3.xlsb 4 10/8/2013
21TSPannTSPdayPM10annPM10dayPM25annPM25dayNOxyrNOxhr
TSPann (lb/yr/src)TSPday (lb/day/src)PM10ann (lb/yr/src)PM10day (lb/day/src)PM25ann (lb/yr/src)PM25day (lb/day/src)NOx (lb/yr/src)NOx (lb/hr/src)
TSPann (lb/yr)TSPday (lb/day)PM10ann (lb/yr)PM10day (lb/day)PM25ann (lb/yr)PM25day (lb/day)
HC (lb/yr)NOx (lb/yr)CO (lb/yr)SOx (lb/yr)CO2 (ton/yr)TSP (lb/yr)PM10 (lb/yr)PM2.5 (lb/yr)
Total Project w/o White KnoTotal Project w/ White Knob Volume Source Identifiers LOCATION VOL1 VOLUME 498771.228 3802380.117 0.** DESCRSRC White Knob Crushing LOCATION VOL2 VOLUME 498410.694 3802532.330 0.** DESCRSRC White Knob Pit LOCATION VOL3 VOLUME 499367.635 3802416.274 0.** DESCRSRC White Ridge Pit
LOCATION VOL4 VOLUME 499169.967 3802653.553 0.** DESCRSRC OB1 LOCATION VOL5 VOLUME 498786.819 3802108.559 0.** DESCRSRC OB2 LOCATION VOL6 VOLUME 505294.247 3804607.151 0.** DESCRSRC Processing Plant LOCATION VOL7 VOLUME 504322.000 3798695.000 0.** DESCRSRC Butterfield Pit LOCATION VOL8 VOLUME 505430.000 3797960.000 0.** DESCRSRC B5 Pad Expansion LOCATION VOL9 VOLUME 505555.000 3798545.000 0.
531,663 229,999 ** DESCRSRC Butterfield-Sentinel Crushing2,300 -1,129 LOCATION VOL10 VOLUME 505808.000 3798770.000 0
176,153 67,234 ** DESCRSRC Sentinel Pit891 -317
29,197 4,274190 -73
5,631 2,547100,609 47,784
66,233 24,03710 8
10,201 5,223537,527 235,863177,516 68,597
29,692 4,769

Sentinel-Butterfield Quarry Expansion ProjectSan Bernardino County, California
Toxics
om01_SBProjectAir_v1.3.xlsb 1 10/8/2013
Number of Sources ID # of sources ID # of sources ID # of sources ID # of sources19 A 38 B 17 C 14 E0 54
CHEMICAL (lb/yr) (lb/hr) (lb/yr) (lb/hr) (lb/yr) (lb/hr) (lb/yr) (lb/hr)arsenic 0.00238 8.24097E-06 0.005952 3.92963E-06 0.005417 3.01908E-06 0.007791 4.35885E-06bromine 0.002856 1.52625E-05 0.007143 4.7244E-06 0.0065 3.62969E-06 0.009349 5.24043E-06cadmium 0.002063 0.000102071 0.005159 3.56196E-06 0.004695 2.7366E-06 0.006752 3.95102E-06chlorine 0.133927 0.000189875 0.334923 0.000220656 0.304795 0.000169527 0.438361 0.000244758copper 0.025072 0.000224273 0.062699 4.16184E-05 0.057059 3.19748E-05 0.082063 4.61642E-05lead 0.020629 4.67939E-05 0.051588 3.40162E-05 0.046947 2.61342E-05 0.06752 3.77317E-05manganese 0.145193 0.000287765 0.363098 0.000239353 0.330436 0.000183892 0.475238 0.000265497mercury 0.002222 2.49311E-05 0.005556 3.69603E-06 0.005056 2.83961E-06 0.007271 4.09974E-06nickel 0.005871 3.3985E-05 0.014683 9.71556E-06 0.013362 7.46433E-06 0.019217 1.07768E-05selenium 0.000476 2.71716E-05 0.00119 8.27944E-07 0.001083 6.36098E-07 0.001558 9.18378E-07vanadium (fume or dust) 0.012218 1.1183E-05 0.030556 2.01208E-05 0.027807 1.54586E-05 0.039993 2.23186E-05Silica, Crystln 6.347235 0.00406477 15.87315 0.010449513 14.44527 0.008028214 20.77542 0.011590883Asbestos 0 0 0 0 0 0 0 01,3-butadiene 0 7.08601E-06 0 1.82164E-05 0 1.39954E-05 0 2.02061E-05acetaldehyde 0 0.000274117 0 0.000704686 0 0.0005414 0 0.000781657benzene 0 7.45896E-05 0 0.000191751 0 0.00014732 0 0.000212696ethyl benzene 0 1.15614E-05 0 2.97215E-05 0 2.28346E-05 0 3.29678E-05formaldehyde 0 0.000548606 0 0.001410331 0 0.001083537 0 0.001564377hexane 0 5.96717E-06 0 1.53401E-05 0 1.17856E-05 0 1.70157E-05methanol 0 1.11884E-06 0 2.87627E-06 0 2.2098E-06 0 3.19044E-06methyl ethyl ketone {2-butanone 0 5.51963E-05 0 0.000141896 0 0.000109017 0 0.000157395m-xylene 0 2.27498E-05 0 5.84841E-05 0 4.49325E-05 0 6.48722E-05naphthalene 0 3.35653E-06 0 8.62881E-06 0 6.62939E-06 0 9.57131E-06o-xylene 0 1.26802E-05 0 3.25977E-05 0 2.50444E-05 0 3.61583E-05propylene 0 9.69665E-05 0 0.000249277 0 0.000191516 0 0.000276504p-xylene 0 3.72948E-06 0 9.58756E-06 0 7.36599E-06 0 1.06348E-05styrene 0 2.23769E-06 0 5.75254E-06 0 4.41959E-06 0 6.38087E-06toluene 0 5.48234E-05 0 0.000140937 0 0.00010828 0 0.000156331DieselExhPM 3.358343 0 8.398536 0 7.64304 0 10.99234 0

Sentinel-Butterfield Quarry Expansion ProjectSan Bernardino County, California
Toxics
om01_SBProjectAir_v1.3.xlsb 2 10/8/2013
Number of Sources19
CHEMICALarsenicbrominecadmiumchlorinecopperleadmanganesemercurynickelseleniumvanadium (fume or dust)Silica, CrystlnAsbestos1,3-butadieneacetaldehydebenzeneethyl benzeneformaldehydehexanemethanolmethyl ethyl ketone {2-butanonem-xylenenaphthaleneo-xylenepropylenep-xylenestyrenetolueneDieselExhPM
ID # of sources ID # of sources ID # of sources ID # of sourcesG 327 H 204 I 4 J 36
(lb/yr) (lb/hr) (lb/yr) (lb/hr) (lb/yr) (lb/hr) (lb/yr) (lb/hr)0.002810055 1.61271E-08 -0.00262 -3.24899E-06 0.000193 -2.48032E-06 -0.00384 -4.70401E-060.003372066 1.93888E-08 -0.00315 -3.9061E-06 0.000231 -2.98197E-06 -0.00461 -5.6554E-060.002435381 1.46182E-08 -0.00227 -2.945E-06 0.000167 -2.24826E-06 -0.00333 -4.26389E-060.158112409 9.05569E-07 -0.14767 -0.000182437 0.010847 -0.000139275 -0.21621 -0.0002641390.029599242 1.70801E-07 -0.02764 -3.44098E-05 0.002031 -2.62689E-05 -0.04048 -4.98198E-050.024353807 1.39602E-07 -0.02275 -2.81244E-05 0.001671 -2.14706E-05 -0.0333 -4.07196E-050.171413334 9.82301E-07 -0.16009 -0.000197896 0.011759 -0.000151076 -0.2344 -0.0002865210.002622718 1.51684E-08 -0.00245 -3.05585E-06 0.00018 -2.33288E-06 -0.00359 -4.42438E-060.006931468 3.98725E-08 -0.00647 -8.03276E-06 0.000476 -6.13233E-06 -0.00948 -1.16301E-050.000562011 3.39787E-09 -0.00052 -6.84539E-07 3.86E-05 -5.22587E-07 -0.00077 -9.91102E-070.014424947 8.25755E-08 -0.01347 -1.66358E-05 0.00099 -1.27E-05 -0.01973 -2.40859E-057.493479098 4.28846E-05 -6.99851 -0.008639586 0.51406 -0.006595587 -10.247 -0.012508731
0 0 0 0 0 0 0 00 7.47596E-08 0 -1.50612E-05 0 -1.14979E-05 0 -2.18062E-050 2.89202E-06 0 -0.00058263 0 -0.000444788 0 -0.0008435540 7.86944E-07 0 -0.000158539 0 -0.000121031 0 -0.0002295380 1.21976E-07 0 -2.45735E-05 0 -1.87598E-05 0 -3.55785E-050 5.78797E-06 0 -0.001166052 0 -0.000890181 0 -0.0016882560 6.29555E-08 0 -1.26831E-05 0 -9.68246E-06 0 -1.83631E-050 1.18042E-08 0 -2.37808E-06 0 -1.81546E-06 0 -3.44308E-060 5.82338E-07 0 -0.000117319 0 -8.95628E-05 0 -0.0001698580 2.40018E-07 0 -4.83543E-05 0 -3.69144E-05 0 -7.00092E-050 3.54125E-08 0 -7.13424E-06 0 -5.44638E-06 0 -1.03292E-050 1.3378E-07 0 -2.69516E-05 0 -2.05752E-05 0 -3.90215E-050 1.02303E-06 0 -0.0002061 0 -0.00015734 0 -0.00029840 3.93472E-08 0 -7.92693E-06 0 -6.05154E-06 0 -1.14769E-050 2.36083E-08 0 -4.75616E-06 0 -3.63092E-06 0 -6.88615E-060 5.78404E-07 0 -0.000116526 0 -8.89576E-05 0 -0.000168711
3.964824266 0 -3.70294 0 0.271991 0 -5.42171 0

Sentinel-Butterfield Quarry Expansion ProjectSan Bernardino County, California
Toxics
om01_SBProjectAir_v1.3.xlsb 3 10/8/2013
Number of Sources19
CHEMICALarsenicbrominecadmiumchlorinecopperleadmanganesemercurynickelseleniumvanadium (fume or dust)Silica, CrystlnAsbestos1,3-butadieneacetaldehydebenzeneethyl benzeneformaldehydehexanemethanolmethyl ethyl ketone {2-butanonem-xylenenaphthaleneo-xylenepropylenep-xylenestyrenetolueneDieselExhPM
ID # of sources ID # of sources ID # of sources ID # of sources ID # of sourcesK 80 L 20 M 12 VOL1 1 VOL2 1
(lb/yr) (lb/hr) (lb/yr) (lb/hr) (lb/yr) (lb/hr) (lb/yr) (lb/hr) (lb/yr) (lb/hr)3.92867E-05 -7.30302E-09 -0.00427 -5.22808E-06 0 0 -0.6271584 -0.001046 -2.251914 -0.003754
4.7144E-05 -8.92382E-09 -0.00512 -6.28547E-06 0 0 -0.391974 -0.000655 -1.407446 -0.0023483.40485E-05 -9.15937E-09 -0.0037 -4.73893E-06 0 0 -0.6271584 -0.001062 -2.251914 -0.0037710.002210531 -4.02753E-07 -0.2403 -0.000293567 0 0 -140.091507 -0.233503 -503.0212 -0.838387
0.00041382 -8.10234E-08 -0.04498 -5.53702E-05 0 0 -5.56603079 -0.009311 -19.98573 -0.0333470.000340485 -6.25586E-08 -0.03701 -4.52561E-05 0 0 -13.5623004 -0.022609 -48.69763 -0.0811690.002396488 -4.39077E-07 -0.26051 -0.000318442 0 0 -5.09566199 -0.008524 -18.2968 -0.0305293.66676E-05 -7.33011E-09 -0.00399 -4.9173E-06 0 0 -0.0783948 -0.000134 -0.281489 -0.0004739.69072E-05 -1.84213E-08 -0.01053 -1.29258E-05 0 0 -2.2734492 -0.003794 -8.163187 -0.0136117.85734E-06 -2.22152E-09 -0.00085 -1.10152E-06 0 0 -4.39010879 -0.007321 -15.76339 -0.0262770.000201672 -3.65611E-08 -0.02192 -2.67693E-05 0 0 -0.1567896 -0.000262 -0.562978 -0.0009390.104764511 -1.89407E-05 -11.3886 -0.013902321 0 0 -313.5792 -0.522632 -1125.957 -1.876595
0 0 0 0 0 0 0 0 0 00 -2.06513E-06 0 -2.42356E-05 0 0 0 -0.002027 0 -0.0017550 -7.9888E-05 0 -0.000937534 0 0 0 -0.078431 0 -0.0679080 -2.17382E-05 0 -0.000255111 0 0 0 -0.021342 0 -0.0184780 -3.36943E-06 0 -3.95422E-05 0 0 0 -0.003308 0 -0.0028640 -0.000159885 0 -0.001876343 0 0 0 -0.156968 0 -0.1359090 -1.73906E-06 0 -2.04089E-05 0 0 0 -0.001707 0 -0.0014780 -3.26074E-07 0 -3.82667E-06 0 0 0 -0.00032 0 -0.0002770 -1.60863E-05 0 -0.000188782 0 0 0 -0.015793 0 -0.0136740 -6.63016E-06 0 -7.78089E-05 0 0 0 -0.006509 0 -0.0056360 -9.78221E-07 0 -1.148E-05 0 0 0 -0.00096 0 -0.0008320 -3.6955E-06 0 -4.33689E-05 0 0 0 -0.003628 0 -0.0031410 -2.82597E-05 0 -0.000331645 0 0 0 -0.027744 0 -0.0240220 -1.08691E-06 0 -1.27556E-05 0 0 0 -0.001067 0 -0.0009240 -6.52147E-07 0 -7.65334E-06 0 0 0 -0.00064 0 -0.0005540 -1.59776E-05 0 -0.000187507 0 0 0 -0.015686 0 -0.013582
0.156324494 0 -6.02574 0 0 0 -327.633166 0 -358.7551 0
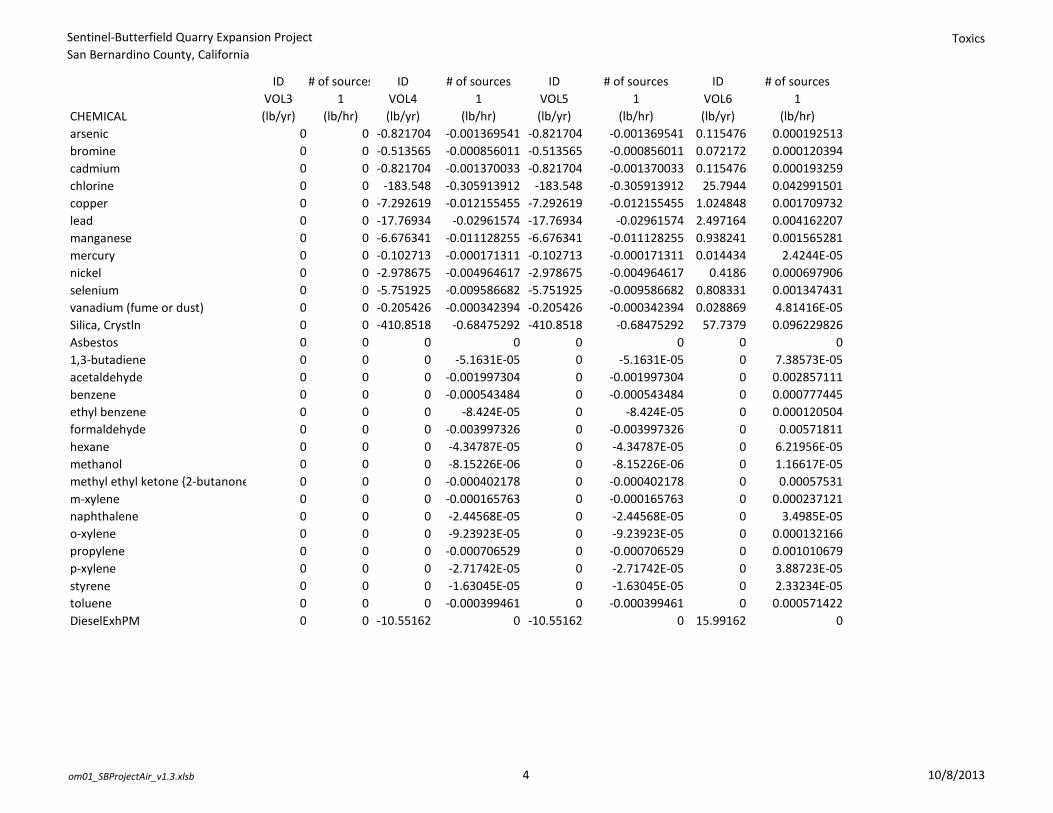
Sentinel-Butterfield Quarry Expansion ProjectSan Bernardino County, California
Toxics
om01_SBProjectAir_v1.3.xlsb 4 10/8/2013
Number of Sources19
CHEMICALarsenicbrominecadmiumchlorinecopperleadmanganesemercurynickelseleniumvanadium (fume or dust)Silica, CrystlnAsbestos1,3-butadieneacetaldehydebenzeneethyl benzeneformaldehydehexanemethanolmethyl ethyl ketone {2-butanonem-xylenenaphthaleneo-xylenepropylenep-xylenestyrenetolueneDieselExhPM
ID # of sources ID # of sources ID # of sources ID # of sourcesVOL3 1 VOL4 1 VOL5 1 VOL6 1(lb/yr) (lb/hr) (lb/yr) (lb/hr) (lb/yr) (lb/hr) (lb/yr) (lb/hr)
0 0 -0.821704 -0.001369541 -0.821704 -0.001369541 0.115476 0.0001925130 0 -0.513565 -0.000856011 -0.513565 -0.000856011 0.072172 0.0001203940 0 -0.821704 -0.001370033 -0.821704 -0.001370033 0.115476 0.0001932590 0 -183.548 -0.305913912 -183.548 -0.305913912 25.7944 0.0429915010 0 -7.292619 -0.012155455 -7.292619 -0.012155455 1.024848 0.0017097320 0 -17.76934 -0.02961574 -17.76934 -0.02961574 2.497164 0.0041622070 0 -6.676341 -0.011128255 -6.676341 -0.011128255 0.938241 0.0015652810 0 -0.102713 -0.000171311 -0.102713 -0.000171311 0.014434 2.4244E-050 0 -2.978675 -0.004964617 -2.978675 -0.004964617 0.4186 0.0006979060 0 -5.751925 -0.009586682 -5.751925 -0.009586682 0.808331 0.0013474310 0 -0.205426 -0.000342394 -0.205426 -0.000342394 0.028869 4.81416E-050 0 -410.8518 -0.68475292 -410.8518 -0.68475292 57.7379 0.0962298260 0 0 0 0 0 0 00 0 0 -5.1631E-05 0 -5.1631E-05 0 7.38573E-050 0 0 -0.001997304 0 -0.001997304 0 0.0028571110 0 0 -0.000543484 0 -0.000543484 0 0.0007774450 0 0 -8.424E-05 0 -8.424E-05 0 0.0001205040 0 0 -0.003997326 0 -0.003997326 0 0.005718110 0 0 -4.34787E-05 0 -4.34787E-05 0 6.21956E-050 0 0 -8.15226E-06 0 -8.15226E-06 0 1.16617E-050 0 0 -0.000402178 0 -0.000402178 0 0.000575310 0 0 -0.000165763 0 -0.000165763 0 0.0002371210 0 0 -2.44568E-05 0 -2.44568E-05 0 3.4985E-050 0 0 -9.23923E-05 0 -9.23923E-05 0 0.0001321660 0 0 -0.000706529 0 -0.000706529 0 0.0010106790 0 0 -2.71742E-05 0 -2.71742E-05 0 3.88723E-050 0 0 -1.63045E-05 0 -1.63045E-05 0 2.33234E-050 0 0 -0.000399461 0 -0.000399461 0 0.0005714220 0 -10.55162 0 -10.55162 0 15.99162 0

Sentinel-Butterfield Quarry Expansion ProjectSan Bernardino County, California
Toxics
om01_SBProjectAir_v1.3.xlsb 5 10/8/2013
Number of Sources19
CHEMICALarsenicbrominecadmiumchlorinecopperleadmanganesemercurynickelseleniumvanadium (fume or dust)Silica, CrystlnAsbestos1,3-butadieneacetaldehydebenzeneethyl benzeneformaldehydehexanemethanolmethyl ethyl ketone {2-butanonem-xylenenaphthaleneo-xylenepropylenep-xylenestyrenetolueneDieselExhPM
ID # of sources ID # of sources ID # of sources ID # of sourcesVOL7 1 VOL8 1 VOL9 1 VOL10 1(lb/yr) (lb/hr) (lb/yr) (lb/hr) (lb/yr) (lb/hr) (lb/yr) (lb/hr)
1.195767 0.001993732 0.020751 3.47168E-05 0.334935 0.00055909 3.587302 0.005980390.747355 0.001247163 0.01297 2.18782E-05 0.209334 0.000350621 2.242064 0.003739881.195767 0.002004739 0.020751 3.65513E-05 0.334935 0.000571202 3.587302 0.006002142267.1045 0.445186399 4.635362 0.007727634 74.81613 0.124706966 801.3136 1.33554671910.61244 0.017711765 0.184169 0.000311011 2.972549 0.004981068 31.83731 0.0531103425.85847 0.043101379 0.448751 0.000748573 7.242972 0.012075946 77.57541 0.129300111
9.71561 0.016215484 0.168606 0.00028481 2.721348 0.004560669 29.14683 0.0486231050.149471 0.00025187 0.002594 4.78183E-06 0.041867 7.28061E-05 0.448413 0.0007527934.334657 0.007227966 0.075224 0.000125963 1.21414 0.00202746 13.00397 0.0216802758.370371 0.013953764 0.14526 0.000242625 2.344546 0.003911037 25.11111 0.0418580710.298942 0.00049863 0.005188 8.71197E-06 0.083734 0.000139989 0.896825 0.001495486597.8837 0.996472775 10.37574 0.017292899 167.4676 0.279112605 1793.651 2.989418326
0 0 0 0 0 0 0 00 0.00108807 0 0.000192348 0 0.001044915 0 0.0022807730 0.042091125 0 0.007440831 0 0.040421699 0 0.0882298840 0.011453367 0 0.002024716 0 0.010999102 0 0.0240081320 0.001775272 0 0.000313831 0 0.001704861 0 0.003721260 0.084239517 0 0.014891786 0 0.080898394 0 0.1765798080 0.000916269 0 0.000161977 0 0.000879928 0 0.0019206510 0.000171801 0 3.03707E-05 0 0.000164987 0 0.0003601220 0.008475492 0 0.00149829 0 0.008139335 0 0.0177660170 0.003493277 0 0.000617538 0 0.003354726 0 0.007322480 0.000515402 0 9.11122E-05 0 0.00049496 0 0.0010803660 0.001947072 0 0.000344202 0 0.001869847 0 0.0040813820 0.014889378 0 0.002632131 0 0.014298832 0 0.0312105710 0.000572668 0 0.000101236 0 0.000549955 0 0.0012004070 0.000343601 0 6.07415E-05 0 0.000329973 0 0.0007202440 0.008418225 0 0.001488166 0 0.00808434 0 0.017645977
235.8747 0 39.3094 0 259.5419 0 466.1125 0

Butterfield and Sentinel Quarries Expansion Air Quality and Greenhouse Gas Impact Assessment San Bernardino National Forest October 25, 2017
OM01_SB-AQHRCCIA_fnl.docx Sespe Consulting, Inc.
Appendix J: Meteorological Data Used in Modeling

Butterfield and Sentinel Quarries ExpansionSan Bernardino National Forest
Air Quality and Greenhouse Gas Impact Assessment
om01_BS_WindStatistics.xlsb 1 of 2 10/25/2017
Table J-1. Wind Speed Class Distribution of Hours in MM5 Meteorological Dataset (2008 to 2012)
SectorWind Direction
(degrees)
Number of Hours Less Than 0.97
knots (Calms)
Number of Hours
Between 0.97 - 4.08 knots
Number of Hours
Between 4.08 - 7.00 knots
Number of Hours
Between 7.00 - 11.08 knots
Number of Hours
Between 11.08 - 17.11
knots
Number of Hours
Between 17.11 - 21.58
knots
Number of Hours Greater
Than 21.58 knots
Number of Hours at Any
Speed
0 Calms 150 0 0 0 0 0 0 1501 348.75 - 11.25 0 334 273 180 38 3 0 8282 11.25 - 33.75 0 225 361 357 90 12 0 10453 33.75 - 56.25 0 226 385 706 257 50 8 16324 56.25 - 78.75 0 156 364 659 520 59 6 17645 78.75 - 101.25 0 159 351 776 481 54 0 18216 101.25 - 123.75 0 196 646 2087 676 0 0 36057 123.75 - 146.25 0 266 562 1178 387 0 0 23938 146.25 - 168.75 0 304 364 467 145 0 0 12809 168.75 - 191.25 0 302 630 857 498 2 4 2293
10 191.25 - 213.75 0 276 826 3156 5432 375 182 1024711 213.75 - 236.25 0 209 666 2423 3034 776 303 741112 236.25 - 258.75 0 223 763 1724 939 155 26 383013 258.75 - 281.25 0 282 769 736 427 43 4 226114 281.25 - 303.75 0 295 448 404 350 107 5 160915 303.75 - 326.25 0 349 301 235 75 12 0 97216 326.25 - 348.75 0 352 214 122 13 5 1 707
Total 150 4154 7923 16067 13362 1653 539 43848Notes:Wind direction is referenced to north and increases in the clockwise direction.Calms are hours with wind speed less than one knot. Plume behaviour during calm hours is modeled by a seperate meandering algorithm in AERMOD.

Butterfield and Sentinel Quarries ExpansionSan Bernardino National Forest
Air Quality and Greenhouse Gas Impact Assessment
om01_BS_WindStatistics.xlsb 2 of 2 10/25/2017
Table J-2. Wind Speed Class Distribution of MM5 Meteorological Dataset (2008 to 2012)
SectorWind Direction
(degrees)
Fraction of Hours Less Than 0.97
knots (Calms)
Fraction of Hours
Between 0.97 - 4.08 knots
Fraction of Hours
Between 4.08 - 7.00 knots
Fraction of Hours
Between 7.00 - 11.08 knots
Fraction of Hours
Between 11.08 - 17.11
knots
Fraction of Hours
Between 17.11 - 21.58
knots
Fraction of Hours Greater
Than 21.58 knots
Fraction of Hours at Any
Speed
0 Calms 0.00342 0 0 0 0 0 0 0.003421 348.75 - 11.25 0 0.00762 0.00623 0.00411 0.00087 0.00007 0 0.01892 11.25 - 33.75 0 0.00513 0.00823 0.00814 0.00205 0.00027 0 0.023823 33.75 - 56.25 0 0.00515 0.00878 0.0161 0.00586 0.00114 0.00018 0.037214 56.25 - 78.75 0 0.00356 0.0083 0.01503 0.01186 0.00135 0.00014 0.040245 78.75 - 101.25 0 0.00363 0.008 0.0177 0.01097 0.00123 0 0.041536 101.25 - 123.75 0 0.00447 0.01473 0.0476 0.01542 0 0 0.082227 123.75 - 146.25 0 0.00607 0.01282 0.02687 0.00883 0 0 0.054598 146.25 - 168.75 0 0.00693 0.0083 0.01065 0.00331 0 0 0.029199 168.75 - 191.25 0 0.00689 0.01437 0.01954 0.01136 0.00005 0.00009 0.0523
10 191.25 - 213.75 0 0.00629 0.01884 0.07198 0.12388 0.00855 0.00415 0.2336911 213.75 - 236.25 0 0.00477 0.01519 0.05526 0.06919 0.0177 0.00691 0.1690212 236.25 - 258.75 0 0.00509 0.0174 0.03932 0.02141 0.00353 0.00059 0.0873413 258.75 - 281.25 0 0.00643 0.01754 0.01679 0.00974 0.00098 0.00009 0.0515714 281.25 - 303.75 0 0.00673 0.01022 0.00921 0.00798 0.00244 0.00011 0.0366915 303.75 - 326.25 0 0.00796 0.00686 0.00536 0.00171 0.00027 0 0.0221616 326.25 - 348.75 0 0.00803 0.00488 0.00278 0.0003 0.00011 0.00002 0.01612
Subtotal 0.00342 0.09475 0.18069 0.36644 0.30474 0.03769 0.01228 1Notes:Wind direction is referenced to north and increases in the clockwise direction.Calms are hours with wind speed less than one knot. Plume behaviour during calm hours is modeled by a seperate meandering algorithm in AERMOD.

Lakes Environmental Software Met Data Services
1 of 8
Lakes Environmental Software
E-mail: [email protected]
Web: www.webLakes.com
Surface & Upper Air Met Data
AERMET/AERMOD Preprocessed from MM5 Data
May 30, 2013
Met Data Order Information:
Order #: MET133753
Ordered by: Scott Cohen
Company: Sespe Consulting, Inc.
Met Data Type: AERMET-Ready (Surface & Upper Air Data)
Start-End Date: Jan 01, 2008 - Dec 31, 2012
Latitude: 34.351308 N
Longitude: 116.973803 W
Datum: WGS 84
Site Time Zone: UTC/GMT UTC - 8 hour(s)
Closest City & Country: Lucerne Valley - USA
Calculated Pseudo Met Station Parameters:
Anemometer Height: 13 m
Station Base Elevation: 1543 m
Upper Air Adjustment: +8 hour(s)

Lakes Environmental Software Met Data Services
2 of 8
Lakes Environmental Software
E-mail: [email protected]
Web: www.webLakes.com
MM5-Processed Grid Cell
• Grid cell centre (Lat, Lon): 34.351308 N, 116.973803 W
• Grid cell dimension: 12 km x 12 km
• Output period: Jan 01, 2008 to Dec 31, 2012
• For more information on MM5 Mesoscale Model, see link below:
http://www.mmm.ucar.edu/mm5/mm5-home.html
Hourly Surface Met Data (*.sam)
• Format: SAMSON (surface met data for preprocessing by AERMET)
• Anemometer height: 13 meters
• Base elevation above MSL = 1543 meters
• Time Zone: UTC/GMT UTC - 8 hour(s) (data reported in local time)
• Output interval: hourly
• File format description: http://www.webmet.com/MetGuide/Samson.html
Column Parameter Unit
6 Total cloud cover tenths
7 Opaque cloud cover tenths
8 Dry bulb temperature degrees Celsius (°C)
9 Dew point temperature degrees Celsius (°C)
10 Relative humidity Percentage (%)
11 Station pressure millibars (mb)
12 Wind direction degrees (deg)
13 Wind speed meters/second (m/s)
15 Ceiling height meters (m)
77777 = unlimited ceiling height
21 Hourly precipitation amount hundredths of inches
Note:
Although not necessary, if the surface file (*.SAM) is opened in a text editor (e.g.,
Windows NotePad), it may become apparent the file contains numerous 99999
entries in several columns. This is expected as the SAMSON format contains
numerous columns which corresponds to parameters that are not used by the
current version of the US EPA AERMET model. This does not affect the met data
quality and is an artifact generated during MM5 processing to ensure the file is in the
correct format for use in AERMET. Rest assured the data needed to support modeling
in AERMET is included and not affected by the presence of columns with 99999 data
flags.
Upper Air Data (*.ua)
• Format: TD-6201 – Fixed Length (upper air met data for preprocessing by
AERMET)
• Data reported in Universal Time Coordinate (UTC) / GMT
• Output interval: 00Z and 12Z
• File format description: http://www.webmet.com/MetGuide/TD6200.html
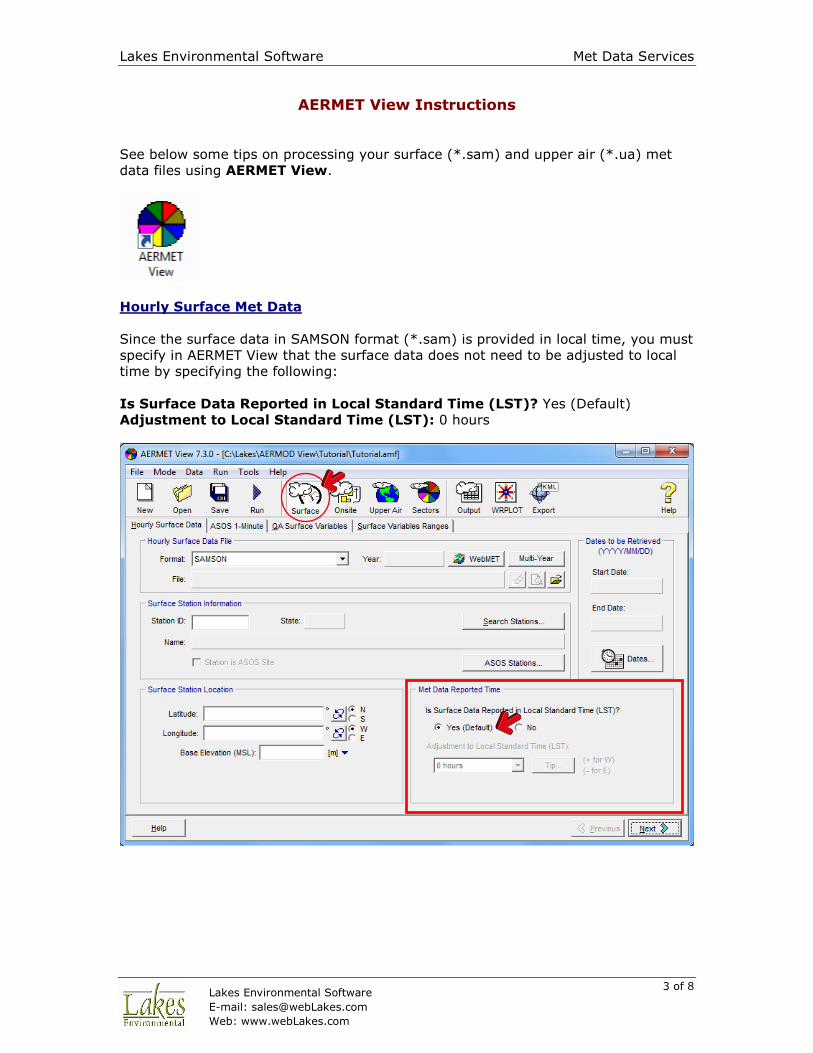
Lakes Environmental Software Met Data Services
3 of 8
Lakes Environmental Software
E-mail: [email protected]
Web: www.webLakes.com
AERMET View Instructions
See below some tips on processing your surface (*.sam) and upper air (*.ua) met
data files using AERMET View.
Hourly Surface Met Data
Since the surface data in SAMSON format (*.sam) is provided in local time, you must
specify in AERMET View that the surface data does not need to be adjusted to local
time by specifying the following:
Is Surface Data Reported in Local Standard Time (LST)? Yes (Default)
Adjustment to Local Standard Time (LST): 0 hours

Lakes Environmental Software Met Data Services
4 of 8
Lakes Environmental Software
E-mail: [email protected]
Web: www.webLakes.com
Upper Air Met Data
Since the Upper Air data (*.ua) is provided in UTC/GMT time then you must specify
in AERMET View that the data must be adjusted to local time by specifying the
following:
Format: NCDC TD-6201 – Fixed Length
Is Upper Air Reported in Greenwich Mean Time (GMT)? Yes
Adjustment from GMT to Local Time: +8 hour(s)

Lakes Environmental Software Met Data Services
5 of 8
Lakes Environmental Software
E-mail: [email protected]
Web: www.webLakes.com
Application Site Parameters
In AERMET View, press the Sectors menu toolbar button and then under the
Processing Options tab, specify the following parameter:
Anemometer Height = 13 [m]

Lakes Environmental Software Met Data Services
6 of 8
Lakes Environmental Software
E-mail: [email protected]
Web: www.webLakes.com
Sectors & Surface Parameters
Under the Sectors (Surface) tab, specify the number of sectors and the
corresponding surface parameters around the facility you are modeling for.

Lakes Environmental Software Met Data Services
7 of 8
Lakes Environmental Software
E-mail: [email protected]
Web: www.webLakes.com
AERMOD View Instructions
Start your AERMOD View project and go to the Meteorology Pathway – Met
Input Data window.
After you preprocess your surface (*.SAM) and upper air (*.UA) met data using
AERMET View, two (2) meteorological output files will be generated:
1. Surface Met Data (*.SFC)
2. Profile Met Data (*.PFL)
Under the Meteorology Pathway – Met Input Data window, specify the Surface
Met Data file (*.SFC) and the Profile Met Data file (*.PFL) generated by AERMET.
Under the same window, specify the base elevation for the surface station as:
Base Elevation (MSL) = 1543 [m]

Lakes Environmental Software Met Data Services
8 of 8
Lakes Environmental Software
E-mail: [email protected]
Web: www.webLakes.com
Having Problems?
If you have any problems with the met data you received from us or need additional
information on the above steps, please do not hesitate to contact us by sending an
email to:
When contacting us, please provide:
� Met data Order # MET133753
� Detailed description of the problem

Butterfield and Sentinel Quarries Expansion Air Quality and Greenhouse Gas Impact Assessment San Bernardino National Forest October 25, 2017
OM01_SB-AQHRCCIA_fnl.docx Sespe Consulting, Inc.
Appendix K: Mitigated Emissions

Sentinel-Butterfield Quarry Expansion ProjectSan Bernardino County, California
Mitigated Summary
om01_SBProjectAir_v1.3.xlsb 1 10/8/2013
Total Sentinel Butterfield Total White Knob Total Processing Plant Total Off-site
Total Project w/o White Knob Reductions
Total Project w/ White Knob Reductions
HC 2.69 -1.54 0.01 0.11 2.82 1.27NOx 48.1 -26.4 0.10 2.07 50.3 23.9CO 32.6 -21.1 0.07 0.50 33.1 12.0SOx 0.0022 -0.0010 0.0000 0.0027 0.0049 0.0038TSP 167 -151 3.57 2.93 174 23PM10 55.2 -54.5 0.62 0.68 56.6 2.1PM2.5 8.7 -12.5 0.17 0.25 9.1 -3.39CO2 9,900 -4,978 28.3 0.1 9,929 4,951

Sentinel-Butterfield Quarry Expansion ProjectSan Bernardino County, California
Road Dust EFs
om01_SBProjectAir_v1.3.xlsb 1 10/8/2013
Unpaved Road Emissions Factors Paved Road Emissions FactorsEF= k * (S/12)^a * (W/3)^b * [(N-P)/N] EF= k * (sL)^a * (W)^b * (1-P/4N)
TSP PM10 PM2.5 TSP PM10 PM2.5k= 4.9 1.5 0.15 k= 0.011 0.0022 0.00054a= 0.7 0.9 0.9 a= 0.91 0.91 0.91b= 0.45 0.45 0.45 b= 1.02 1.02 1.02N= 365 365 365 (days/yr) P= 33 33 33
P (Los Angeles-MDAB)= 33 33 33 (rain days/yr) N= 365 365 365
Sources: AP-42, Section 13.2.2 (Nov. 2006), CalEEMod User Manual Appendix D Source: AP-42, Section 13.2.1 (Jan. 2011)CalEEMod User Manual, Appendix D
OFFSITEUNCONTROLLED FACTOR
S= 8.3 % sL= 0.1 g/m2
Control Factor = 0% ParameterWeight (tons)
TSP (lb/VMT)
PM10 E.F. (lb/VMT)
PM2.5 E.F. (lb/VMT)
ParameterWeight (tons) TSP (lb/VMT)
PM10 E.F. (lb/VMT)
PM2.5 E.F. (lb/VMT) Full = 40 0.0583 0.0117 0.0029
Full = 120 19.91 5.66 0.57 Empty = 12 0.0171 0.0034 0.0008Empty = 45 12.80 3.64 0.36 Average = 26 0.0377 0.0075 0.0018
Average = 82.5 16.36 4.65 0.47 Annual Avg.1 = --- 0.0368 0.0074 0.0018
Annual Average1 = --- 14.88 4.23 0.421 Annual average emissions factors take into account the rainfall adjustment factor [(N-P)/N].
UNMITIGATED FACTOR This adjustment factor is not included in the hourly and daily emissions estimates.
S= 8.3 % Default silt loading in CalEEMod is 0.1 g/m2 and is used to model offsite road emissions.
Control Factor2 = 75%
ParameterWeight (tons) TSP (lb/VMT)
PM10 E.F. (lb/VMT)
PM2.5 E.F. (lb/VMT)
Full = 120 4.98 1.42 0.14Empty = 45 3.20 0.91 0.09
Average = 82.5 4.09 1.16 0.12 Annual Avg.1 = --- 3.72 1.06 0.11
1 Annual average emissions factors take into account the rainfall adjustment factor [(N-P)/N]. This adjustment factor is not included in the daily emissions estimate.
2 The control factor for the unmitigated emissions is chemical dust suppressants applied 0.15 g/sq.yd./month as reported in 2008.
MITIGATED All Roads Road to B5 PadS= 8.3 % S= 8.3 %
Control Factor2 = 80% Control Factor2 = 80%
Parameter Weight (tons) TSP (lb/VMT)
PM10 E.F. (lb/VMT)
PM2.5 E.F. (lb/VMT)
Parameter Weight (tons)
TSP (lb/VMT
)PM10 E.F. (lb/VMT)
PM2.5 E.F. (lb/VMT)
Full = 120 3.98 1.13 0.11 Full = 120 3.98 1.13 0.11Empty = 45 2.56 0.73 0.07 Empty = 45 2.56 0.73 0.07
Average = 82.5 3.27 0.93 0.09 Average = 82.5 3.27 0.93 0.09 Annual Avg.1 = --- 2.98 0.85 0.08 Annual Avg.1 = --- 2.98 0.85 0.08

Sentinel-Butterfield Quarry Expansion ProjectSan Bernardino County, California
Mitigated Road Emissions
om01_SBProjectAir_v1.3.xlsb 1 10/8/2013
BaselineA Bper Year per Day per Hour per Year per Day per Hour
VMT (miles) 1,618.07 15.34 1.84 962.78 11.05 1.33VMT (%) 1.21% 0.99% 1.05% 0.72% 0.71% 0.76%TSP - Dust 6,018.41 57.06 6.85 3,581.04 41.09 4.93PM10 - Dust 1,711.42 16.23 1.95 1,018.32 11.68 1.40PM2.5 - Dust 171.14 1.62 0.19 101.83 1.17 0.14TSP - Exhaust 36.22 0.34 0.04 21.55 0.25 0.03PM10 - Exhaust 36.22 0.34 0.04 21.55 0.25 0.03PM2.5 - Exhaust 33.32 0.32 0.04 19.83 0.23 0.03HC 62.81 0.60 0.07 37.37 0.43 0.05NOx 1,160 11.00 1.32 690 7.92 0.95CO 757 7.17 0.86 450 5.17 0.62SOx 0.05 0.00 0.00 0.03 0.00 0.00CO2 121.05 - - 72.03 - -
Project 1.40 scale factor from Project VMT/yr over Baseline VMT/yrA Bper Year per Day per Hour per Year per Day per Hour
VMT (miles) 7,319.05 45.77 5.49 7,340.91 46.04 5.52VMT (%) 3.91% 3.90% 3.90% 3.92% 3.92% 3.92%TSP - Dust 21,778.55 136.18 16.34 21,843.58 136.98 16.44PM10 - Dust 6,193.03 38.73 4.65 6,211.53 38.95 4.67PM2.5 - Dust 619.30 3.87 0.46 621.15 3.90 0.47TSP - Exhaust 163.84 1.02 0.12 164.33 1.03 0.12PM10 - Exhaust 163.84 1.02 0.12 164.33 1.03 0.12PM2.5 - Exhaust 150.73 0.94 0.11 151.18 0.95 0.11HC 284.11 1.78 0.21 284.96 1.79 0.21NOx 5,246.83 32.81 3.94 5,262.50 33.00 3.96CO 3,422.78 21.40 2.57 3,433.00 0.90 0.11SOx 0.22 0.00 0.00 0.22 0.00 0.00CO2 (tons) 547.54 - - 549.17 - -
IncrementA Bper Year per Day per Hour per Year per Day per Hour
VMT (miles) 5,700.98 30.42 3.65 6,378.13 34.99 4.20TSP - Dust 15,760.14 79.12 9.49 18,262.54 95.90 11.51PM10 - Dust 4,481.61 22.50 2.70 5,193.21 27.27 3.27PM2.5 - Dust 448.16 2.25 0.27 519.32 2.73 0.33TSP - Exhaust 127.62 0.68 0.08 142.78 0.78 0.09PM10 - Exhaust 127.62 0.68 0.08 142.78 0.78 0.09PM2.5 - Exhaust 117.41 0.63 0.08 131.35 0.72 0.09HC 221.30 1.18 0.14 247.58 1.36 0.16NOx 4,086.88 21.81 2.62 4,572.31 25.08 3.01CO 2,666.08 14.23 1.71 2,982.75 -4.27 -0.51SOx 0.17 0.00 0.00 0.19 0.00 0.00CO2 (tons) 426.49 - - 477.15 - -

Sentinel-Butterfield Quarry Expansion ProjectSan Bernardino County, California
Mitigated Road Emissions
om01_SBProjectAir_v1.3.xlsb 2 10/8/2013
Baseline
VMT (miles)VMT (%)TSP - DustPM10 - DustPM2.5 - DustTSP - ExhaustPM10 - ExhaustPM2.5 - ExhaustHCNOxCOSOxCO2
Project
VMT (miles)VMT (%)TSP - DustPM10 - DustPM2.5 - DustTSP - ExhaustPM10 - ExhaustPM2.5 - ExhaustHCNOxCOSOxCO2 (tons)
Increment
VMT (miles)TSP - DustPM10 - DustPM2.5 - DustTSP - ExhaustPM10 - ExhaustPM2.5 - ExhaustHCNOxCOSOxCO2 (tons)
C Dper Year per Day per Hour per Year per Day per Hour
1,355.33 16.39 1.97 - - -1.01% 1.05% 1.13% 0.00% 0.00% 0.00%
5,041.15 60.95 7.31 - - -1,433.52 17.33 2.08 - - -
143.35 1.73 0.21 - - -30.34 0.37 0.04 - - -30.34 0.37 0.04 - - -27.91 0.34 0.04 - - -52.61 0.64 0.08 - - -
972 11.75 1.41 - - -634 7.66 0.92 - - -
0.04 0.00 0.00 - - -101.39 - - - - -
C Dper Year per Day per Hour per Year per Day per Hour
6,135.41 38.52 4.62 - - -3.28% 3.28% 3.28% 0.00% 0.00% 0.00%
18,256.50 114.63 13.76 - - -5,191.49 32.60 3.91 - - -
519.15 3.26 0.39 - - -137.34 0.86 0.10 - - -137.34 0.86 0.10 - - -126.35 0.79 0.10 - - -238.16 1.50 0.18 - - -
4,398.31 27.62 3.31 - - -2,869.24 18.02 2.16 - - -
0.18 0.00 0.00 - - -458.99 - - - - -
C Dper Year per Day per Hour per Year per Day per Hour
4,780.08 22.14 2.66 - - -13,215.36 53.69 6.44 - - -
3,757.97 15.27 1.83 - - -375.80 1.53 0.18 - - -107.00 0.50 0.06 - - -107.00 0.50 0.06 - - -
98.44 0.46 0.05 - - -185.55 0.86 0.10 - - -
3,426.71 15.87 1.90 - - -2,235.42 10.35 1.24 - - -
0.14 0.00 0.00 - - -357.60 - - - - -

Sentinel-Butterfield Quarry Expansion ProjectSan Bernardino County, California
Mitigated Road Emissions
om01_SBProjectAir_v1.3.xlsb 3 10/8/2013
Baseline
VMT (miles)VMT (%)TSP - DustPM10 - DustPM2.5 - DustTSP - ExhaustPM10 - ExhaustPM2.5 - ExhaustHCNOxCOSOxCO2
Project
VMT (miles)VMT (%)TSP - DustPM10 - DustPM2.5 - DustTSP - ExhaustPM10 - ExhaustPM2.5 - ExhaustHCNOxCOSOxCO2 (tons)
Increment
VMT (miles)TSP - DustPM10 - DustPM2.5 - DustTSP - ExhaustPM10 - ExhaustPM2.5 - ExhaustHCNOxCOSOxCO2 (tons)
E Fper Year per Day per Hour per Year per Day per Hour
8,012.74 93.45 11.21 - - -6.00% 6.01% 6.42% 0.00% 0.00% 0.00%
29,803.34 347.60 41.71 - - -8,475.00 98.85 11.86 - - -
847.50 9.88 1.19 - - -179.37 2.09 0.25 - - -179.37 2.09 0.25 - - -165.02 1.92 0.23 - - -311.04 3.63 0.44 - - -
5,744 66.99 8.04 - - -3,747 43.70 5.24 - - -
0.24 0.00 0.00 - - -599.43 - - - - -
E Fper Year per Day per Hour per Year per Day per Hour
34,529.77 216.74 26.01 - - -18.46% 18.47% 18.47% 0.00% 0.00% 0.00%
102,746.66 644.93 77.39 - - -29,217.45 183.39 22.01 - - -
2,921.74 18.34 2.20 - - -772.95 4.85 0.58 - - -772.95 4.85 0.58 - - -711.12 4.46 0.54 - - -
1,340.37 8.41 1.01 - - -24,753.46 155.37 18.64 - - -16,147.95 101.36 12.16 - - -
1.03 0.01 0.00 - - -2,583.16 - - - - -
E Fper Year per Day per Hour per Year per Day per Hour
26,517.04 123.29 14.79 - - -72,943.32 297.33 35.68 - - -20,742.45 84.55 10.15 - - -
2,074.25 8.45 1.01 - - -593.59 2.76 0.33 - - -593.59 2.76 0.33 - - -546.10 2.54 0.30 - - -
1,029.33 4.79 0.57 - - -19,009.34 88.38 10.61 - - -12,400.77 57.65 6.92 - - -
0.79 0.00 0.00 - - -1,983.73 - - - - -

Sentinel-Butterfield Quarry Expansion ProjectSan Bernardino County, California
Mitigated Road Emissions
om01_SBProjectAir_v1.3.xlsb 4 10/8/2013
Baseline
VMT (miles)VMT (%)TSP - DustPM10 - DustPM2.5 - DustTSP - ExhaustPM10 - ExhaustPM2.5 - ExhaustHCNOxCOSOxCO2
Project
VMT (miles)VMT (%)TSP - DustPM10 - DustPM2.5 - DustTSP - ExhaustPM10 - ExhaustPM2.5 - ExhaustHCNOxCOSOxCO2 (tons)
Increment
VMT (miles)TSP - DustPM10 - DustPM2.5 - DustTSP - ExhaustPM10 - ExhaustPM2.5 - ExhaustHCNOxCOSOxCO2 (tons)
G Hper Year per Day per Hour per Year per Day per Hour
72,587.16 815.66 97.88 33,745.62 416.59 41.6654.34% 52.46% 56.04% 25.26% 26.79% 23.85%
269,987.62 3,033.83 364.06 125,516.67 1,549.49 154.9576,774.75 862.71 103.53 35,692.42 440.62 44.06
7,677.47 86.27 10.35 3,569.24 44.06 4.411,624.87 18.26 2.19 755.40 9.33 0.931,624.87 18.26 2.19 755.40 9.33 0.931,494.88 16.80 2.02 694.97 8.58 0.862,817.67 31.66 3.80 1,309.93 16.17 1.62
52,036 584.72 70.17 24,191 298.64 29.8633,946 381.44 45.77 15,781 194.82 19.48
2.17 0.02 0.00 1.01 0.01 0.005,430.22 - - 2,524.50 - -
G Hper Year per Day per Hour per Year per Day per Hour
130,505.05 818.42 98.21 - - -69.76% 69.75% 69.75% 0.00% 0.00% 0.00%
388,330.34 2,435.28 292.23 - - -110,427.15 692.51 83.10 - - -
11,042.72 69.25 8.31 - - -2,921.37 18.32 2.20 - - -2,921.37 18.32 2.20 - - -2,687.66 16.85 2.02 - - -5,065.92 31.77 3.81 - - -
93,555.53 586.70 70.40 - - -61,031.06 382.74 45.93 - - -
3.89 0.02 0.00 - - -9,763.04 - - - - -
G Hper Year per Day per Hour per Year per Day per Hour
57,917.89 2.76 0.33 -33,745.62 -416.59 -41.66118,342.72 -598.55 -71.83 -125,516.67 -1,549.49 -154.95
33,652.40 -170.21 -20.42 -35,692.42 -440.62 -44.063,365.24 -17.02 -2.04 -3,569.24 -44.06 -4.411,296.50 0.06 0.01 -755.40 -9.33 -0.931,296.50 0.06 0.01 -755.40 -9.33 -0.931,192.78 0.06 0.01 -694.97 -8.58 -0.862,248.24 0.11 0.01 -1,309.93 -16.17 -1.62
41,519.76 1.98 0.24 -24,191.32 -298.64 -29.8627,085.46 1.29 0.16 -15,781.23 -194.82 -19.48
1.73 0.00 0.00 -1.01 -0.01 -0.004,332.82 - - -2,524.50 - -

Sentinel-Butterfield Quarry Expansion ProjectSan Bernardino County, California
Mitigated Road Emissions
om01_SBProjectAir_v1.3.xlsb 5 10/8/2013
Baseline
VMT (miles)VMT (%)TSP - DustPM10 - DustPM2.5 - DustTSP - ExhaustPM10 - ExhaustPM2.5 - ExhaustHCNOxCOSOxCO2
Project
VMT (miles)VMT (%)TSP - DustPM10 - DustPM2.5 - DustTSP - ExhaustPM10 - ExhaustPM2.5 - ExhaustHCNOxCOSOxCO2 (tons)
Increment
VMT (miles)TSP - DustPM10 - DustPM2.5 - DustTSP - ExhaustPM10 - ExhaustPM2.5 - ExhaustHCNOxCOSOxCO2 (tons)
I Jper Year per Day per Hour per Year per Day per Hour
1,204.93 14.10 1.57 8,719.27 106.44 10.640.90% 0.91% 0.90% 6.53% 6.85% 6.09%
4,481.74 52.45 5.83 32,431.27 395.90 39.591,274.45 14.92 1.66 9,222.28 112.58 11.26
127.44 1.49 0.17 922.23 11.26 1.1326.97 0.32 0.04 195.18 2.38 0.2426.97 0.32 0.04 195.18 2.38 0.2424.81 0.29 0.03 179.57 2.19 0.2246.77 0.55 0.06 338.46 4.13 0.41
864 10.11 1.12 6,251 76.30 7.63563 6.59 0.73 4,078 49.78 4.98
0.04 0.00 0.00 0.26 0.00 0.0090.14 - - 652.29 - -
I Jper Year per Day per Hour per Year per Day per Hour
1,253.54 7.86 0.94 - - -0.67% 0.67% 0.67% 0.00% 0.00% 0.00%
3,730.02 23.39 2.81 - - -1,060.68 6.65 0.80 - - -
106.07 0.67 0.08 - - -28.06 0.18 0.02 - - -28.06 0.18 0.02 - - -25.82 0.16 0.02 - - -48.66 0.31 0.04 - - -
898.63 5.64 0.68 - - -586.22 3.68 0.44 - - -
0.04 0.00 0.00 - - -93.78 - - - - -
I Jper Year per Day per Hour per Year per Day per Hour
48.60 -6.24 -0.62 -8,719.27 -106.44 -10.64-751.73 -29.06 -3.02 -32,431.27 -395.90 -39.59-213.76 -8.26 -0.86 -9,222.28 -112.58 -11.26
-21.38 -0.83 -0.09 -922.23 -11.26 -1.131.09 -0.14 -0.01 -195.18 -2.38 -0.241.09 -0.14 -0.01 -195.18 -2.38 -0.241.00 -0.13 -0.01 -179.57 -2.19 -0.221.89 -0.24 -0.02 -338.46 -4.13 -0.41
34.84 -4.47 -0.45 -6,250.60 -76.30 -7.6322.73 -2.92 -0.29 -4,077.59 -49.78 -4.98
0.00 -0.00 -0.00 -0.26 -0.00 -0.003.64 - - -652.29 - -
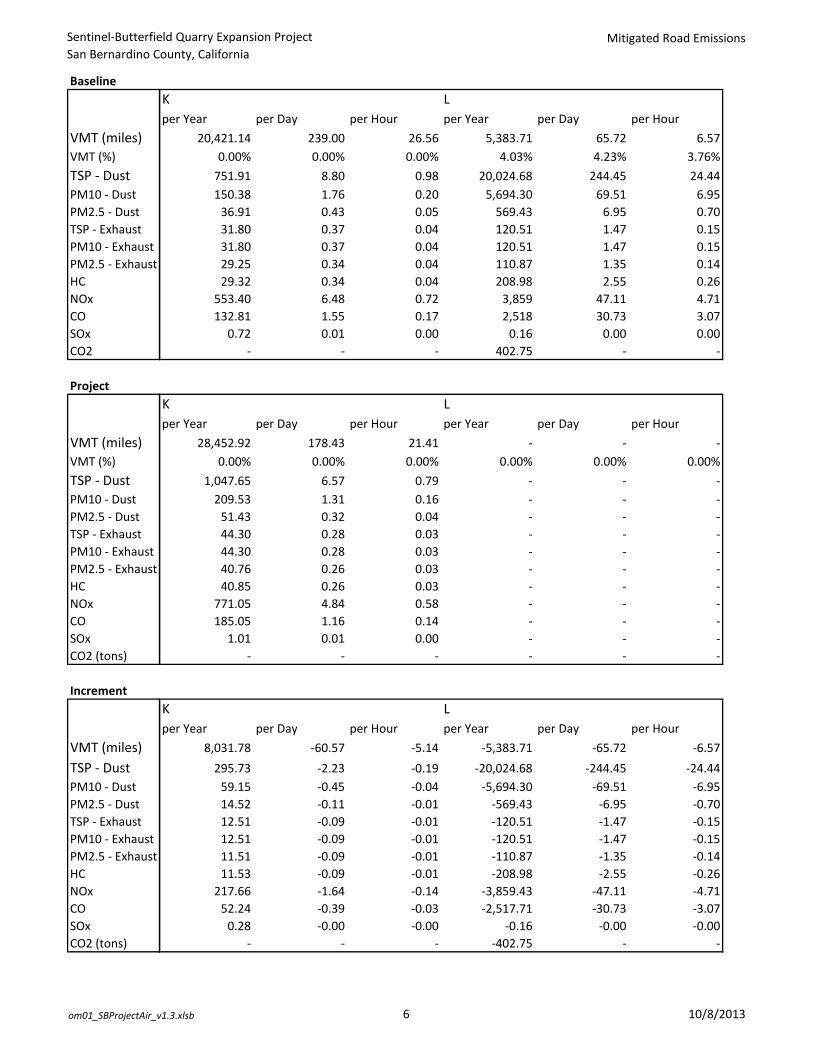
Sentinel-Butterfield Quarry Expansion ProjectSan Bernardino County, California
Mitigated Road Emissions
om01_SBProjectAir_v1.3.xlsb 6 10/8/2013
Baseline
VMT (miles)VMT (%)TSP - DustPM10 - DustPM2.5 - DustTSP - ExhaustPM10 - ExhaustPM2.5 - ExhaustHCNOxCOSOxCO2
Project
VMT (miles)VMT (%)TSP - DustPM10 - DustPM2.5 - DustTSP - ExhaustPM10 - ExhaustPM2.5 - ExhaustHCNOxCOSOxCO2 (tons)
Increment
VMT (miles)TSP - DustPM10 - DustPM2.5 - DustTSP - ExhaustPM10 - ExhaustPM2.5 - ExhaustHCNOxCOSOxCO2 (tons)
K Lper Year per Day per Hour per Year per Day per Hour
20,421.14 239.00 26.56 5,383.71 65.72 6.570.00% 0.00% 0.00% 4.03% 4.23% 3.76%
751.91 8.80 0.98 20,024.68 244.45 24.44150.38 1.76 0.20 5,694.30 69.51 6.95
36.91 0.43 0.05 569.43 6.95 0.7031.80 0.37 0.04 120.51 1.47 0.1531.80 0.37 0.04 120.51 1.47 0.1529.25 0.34 0.04 110.87 1.35 0.1429.32 0.34 0.04 208.98 2.55 0.26
553.40 6.48 0.72 3,859 47.11 4.71132.81 1.55 0.17 2,518 30.73 3.07
0.72 0.01 0.00 0.16 0.00 0.00 - - - 402.75 - -
K Lper Year per Day per Hour per Year per Day per Hour
28,452.92 178.43 21.41 - - -0.00% 0.00% 0.00% 0.00% 0.00% 0.00%
1,047.65 6.57 0.79 - - -209.53 1.31 0.16 - - -
51.43 0.32 0.04 - - -44.30 0.28 0.03 - - -44.30 0.28 0.03 - - -40.76 0.26 0.03 - - -40.85 0.26 0.03 - - -
771.05 4.84 0.58 - - -185.05 1.16 0.14 - - -
1.01 0.01 0.00 - - - - - - - - -
K Lper Year per Day per Hour per Year per Day per Hour
8,031.78 -60.57 -5.14 -5,383.71 -65.72 -6.57295.73 -2.23 -0.19 -20,024.68 -244.45 -24.44
59.15 -0.45 -0.04 -5,694.30 -69.51 -6.9514.52 -0.11 -0.01 -569.43 -6.95 -0.7012.51 -0.09 -0.01 -120.51 -1.47 -0.1512.51 -0.09 -0.01 -120.51 -1.47 -0.1511.51 -0.09 -0.01 -110.87 -1.35 -0.1411.53 -0.09 -0.01 -208.98 -2.55 -0.26
217.66 -1.64 -0.14 -3,859.43 -47.11 -4.7152.24 -0.39 -0.03 -2,517.71 -30.73 -3.07
0.28 -0.00 -0.00 -0.16 -0.00 -0.00 - - - -402.75 - -

Sentinel-Butterfield Quarry Expansion ProjectSan Bernardino County, California
Mitigated Road Emissions
om01_SBProjectAir_v1.3.xlsb 7 10/8/2013
Baseline
VMT (miles)VMT (%)TSP - DustPM10 - DustPM2.5 - DustTSP - ExhaustPM10 - ExhaustPM2.5 - ExhaustHCNOxCOSOxCO2
Project
VMT (miles)VMT (%)TSP - DustPM10 - DustPM2.5 - DustTSP - ExhaustPM10 - ExhaustPM2.5 - ExhaustHCNOxCOSOxCO2 (tons)
Increment
VMT (miles)TSP - DustPM10 - DustPM2.5 - DustTSP - ExhaustPM10 - ExhaustPM2.5 - ExhaustHCNOxCOSOxCO2 (tons)
M Total On-siteper Year per Day per Hour per Year per Day per Hour
- - - 133,589.61 1,554.73 174.670.00% 0.00% 0.00% 100.00% 100.00% 100.00%
- - - 496,885.92 5,782.81 649.67 - - - 141,296.45 1,644.42 184.74 - - - 14,129.64 164.44 18.47 - - - 2,990.42 34.80 3.91 - - - 2,990.42 34.80 3.91 - - - 2,751.18 32.02 3.60 - - - 5,185.65 60.35 6.78 - - - 95,766.76 1,114.54 125.21 - - - 62,473.56 727.07 81.68 - - - 3.99 0.05 0.01 - - - 9,994
1.40M Total On-siteper Year per Day per Hour per Year per Day per Hour
- - - 187,083.73 1,173.35 140.800.00% 0.00% 0.00% 100.00% 100.00% 100.00%
- - - 556,685.65 3,491.40 418.97 - - - 158,301.33 992.83 119.14 - - - 15,830.13 99.28 11.91 - - - 4,187.89 26.27 3.15 - - - 4,187.89 26.27 3.15 - - - 3,852.86 24.16 2.90 - - - 7,262.18 45.55 5.47 - - - 134,115.25 841.14 100.94 - - - 84,004.83 504.98 60.65 - - - 5.58 0.04 0.00 - - - 13,995.68 - -
M Total On-siteper Year per Day per Hour per Year per Day per Hour
- - - 53,494.12 -381.39 -33.87 - - - 59,799.73 -2,291.41 -230.71 - - - 17,004.89 -651.59 -65.60 - - - 1,700.49 -65.16 -6.56 - - - 1,197.47 -8.54 -0.76 - - - 1,197.47 -8.54 -0.76 - - - 1,101.67 -7.85 -0.70 - - - 2,076.52 -14.80 -1.31 - - - 38,348.48 -273.40 -24.28 - - - 21,531.28 -222.09 -21.04 - - - 1.60 -0.01 -0.00 - - - 4,001.88 - -

Sentinel-Butterfield Quarry Expansion ProjectSan Bernardino County, California
Mitigated Road Emissions
om01_SBProjectAir_v1.3.xlsb 8 10/8/2013
Baseline
VMT (miles)VMT (%)TSP - DustPM10 - DustPM2.5 - DustTSP - ExhaustPM10 - ExhaustPM2.5 - ExhaustHCNOxCOSOxCO2
Project
VMT (miles)VMT (%)TSP - DustPM10 - DustPM2.5 - DustTSP - ExhaustPM10 - ExhaustPM2.5 - ExhaustHCNOxCOSOxCO2 (tons)
Increment
VMT (miles)TSP - DustPM10 - DustPM2.5 - DustTSP - ExhaustPM10 - ExhaustPM2.5 - ExhaustHCNOxCOSOxCO2 (tons)
Total Offsite Totalper Year per Day per Hour per Year per Day per Hour
3,787,945.55 3,787,945.55 3,787,945.55 3,921,535.16 3,789,500.28 3,788,120.22100.00% 100.00% 100.00% 200.00% 200.00% 200.00%
139,473.29 139,473.29 139,473.29 636,359.21 145,256.10 140,122.9627,894.66 27,894.66 27,894.66 169,191.10 29,539.08 28,079.40
6,846.87 6,846.87 6,846.87 20,976.52 7,011.31 6,865.355,898.06 5,898.06 5,898.06 8,888.47 5,932.86 5,901.975,898.06 5,898.06 5,898.06 8,888.47 5,932.86 5,901.975,426.21 5,426.21 5,426.21 8,177.40 5,458.23 5,429.815,437.75 5,437.75 5,437.75 10,623.40 5,498.10 5,444.53
102,650.55 102,650.55 102,650.55 198,417.31 103,765.10 102,775.7724,635.25 24,635.25 24,635.25 87,108.81 25,362.33 24,716.94
133.92 133.92 133.92 137.90 133.96 133.927,067.22 7,067.22 7,067.22 17,061.02 7,067.22 7,067.22
Total Offsite Totalper Year per Day per Hour per Year per Day per Hour
3,940,736.00 3,940,736.00 3,940,736.00 4,127,819.73 3,941,909.35 3,940,876.80100.00% 100.00% 100.00% 200.00% 200.00% 200.00%
145,099.08 145,099.08 145,099.08 701,784.73 148,590.48 145,518.0529,019.82 29,019.82 29,019.82 187,321.15 30,012.64 29,138.96
7,123.05 7,123.05 7,123.05 22,953.18 7,222.33 7,134.966,135.96 6,135.96 6,135.96 10,323.85 6,162.23 6,139.116,135.96 6,135.96 6,135.96 10,323.85 6,162.23 6,139.115,645.08 5,645.08 5,645.08 9,497.94 5,669.25 5,647.985,657.09 5,657.09 5,657.09 12,919.27 5,702.63 5,662.55
106,791.06 106,791.06 106,791.06 240,906.31 107,632.20 106,892.0025,628.94 25,628.94 25,628.94 109,633.77 26,133.92 25,689.59
139.32 139.32 139.32 144.90 139.35 139.327,339.35 7,339.35 7,339.35 21,335.03 7,339.35 7,339.35
Total Offsite Totalper Year per Day per Hour per Year per Day per Hour
152,790.45 152,790.45 152,790.45 206,284.57 152,409.06 152,756.585,625.79 5,625.79 5,625.79 65,425.52 3,334.38 5,395.081,125.16 1,125.16 1,125.16 18,130.05 473.56 1,059.55
276.18 276.18 276.18 1,976.66 211.02 269.61237.90 237.90 237.90 1,435.38 229.37 237.15237.90 237.90 237.90 1,435.38 229.37 237.15218.87 218.87 218.87 1,320.55 211.02 218.17219.34 219.34 219.34 2,295.86 204.53 218.02
4,140.51 4,140.51 4,140.51 42,488.99 3,867.10 4,116.23993.69 993.69 993.69 22,524.96 771.59 972.65
5.40 5.40 5.40 7.00 5.39 5.40272.13 272.13 272.13 4,274.01 272.13 272.13
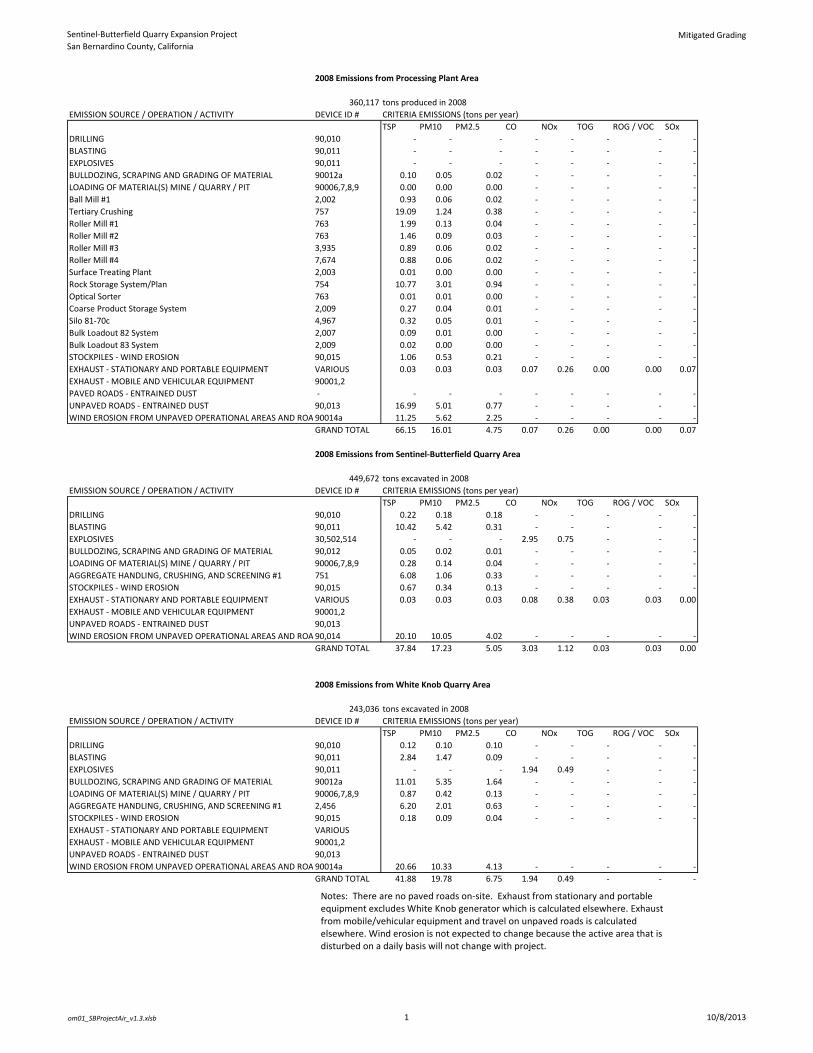
Sentinel-Butterfield Quarry Expansion ProjectSan Bernardino County, California
Mitigated Grading
om01_SBProjectAir_v1.3.xlsb 1 10/8/2013
2008 Emissions from Processing Plant Area
360,117 tons produced in 2008EMISSION SOURCE / OPERATION / ACTIVITY DEVICE ID # CRITERIA EMISSIONS (tons per year)
- - TSP PM10 PM2.5 CO NOx TOG ROG / VOC SOxDRILLING 90,010 - - - - - - - -BLASTING 90,011 - - - - - - - -EXPLOSIVES 90,011 - - - - - - - -BULLDOZING, SCRAPING AND GRADING OF MATERIAL 90012a 0.10 0.05 0.02 - - - - -LOADING OF MATERIAL(S) MINE / QUARRY / PIT 90006,7,8,9 0.00 0.00 0.00 - - - - -Ball Mill #1 2,002 0.93 0.06 0.02 - - - - -Tertiary Crushing 757 19.09 1.24 0.38 - - - - -Roller Mill #1 763 1.99 0.13 0.04 - - - - -Roller Mill #2 763 1.46 0.09 0.03 - - - - -Roller Mill #3 3,935 0.89 0.06 0.02 - - - - -Roller Mill #4 7,674 0.88 0.06 0.02 - - - - -Surface Treating Plant 2,003 0.01 0.00 0.00 - - - - -Rock Storage System/Plan 754 10.77 3.01 0.94 - - - - -Optical Sorter 763 0.01 0.01 0.00 - - - - -Coarse Product Storage System 2,009 0.27 0.04 0.01 - - - - -Silo 81-70c 4,967 0.32 0.05 0.01 - - - - -Bulk Loadout 82 System 2,007 0.09 0.01 0.00 - - - - -Bulk Loadout 83 System 2,009 0.02 0.00 0.00 - - - - -STOCKPILES - WIND EROSION 90,015 1.06 0.53 0.21 - - - - -EXHAUST - STATIONARY AND PORTABLE EQUIPMENT VARIOUS 0.03 0.03 0.03 0.07 0.26 0.00 0.00 0.07EXHAUST - MOBILE AND VEHICULAR EQUIPMENT 90001,2PAVED ROADS - ENTRAINED DUST - - - - - - - - -UNPAVED ROADS - ENTRAINED DUST 90,013 16.99 5.01 0.77 - - - - -WIND EROSION FROM UNPAVED OPERATIONAL AREAS AND ROA 90014a 11.25 5.62 2.25 - - - - -
GRAND TOTAL 66.15 16.01 4.75 0.07 0.26 0.00 0.00 0.07
2008 Emissions from Sentinel-Butterfield Quarry Area
449,672 tons excavated in 2008EMISSION SOURCE / OPERATION / ACTIVITY DEVICE ID # CRITERIA EMISSIONS (tons per year)
- - TSP PM10 PM2.5 CO NOx TOG ROG / VOC SOxDRILLING 90,010 0.22 0.18 0.18 - - - - -BLASTING 90,011 10.42 5.42 0.31 - - - - -EXPLOSIVES 30,502,514 - - - 2.95 0.75 - - -BULLDOZING, SCRAPING AND GRADING OF MATERIAL 90,012 0.05 0.02 0.01 - - - - -LOADING OF MATERIAL(S) MINE / QUARRY / PIT 90006,7,8,9 0.28 0.14 0.04 - - - - -AGGREGATE HANDLING, CRUSHING, AND SCREENING #1 751 6.08 1.06 0.33 - - - - -STOCKPILES - WIND EROSION 90,015 0.67 0.34 0.13 - - - - -EXHAUST - STATIONARY AND PORTABLE EQUIPMENT VARIOUS 0.03 0.03 0.03 0.08 0.38 0.03 0.03 0.00EXHAUST - MOBILE AND VEHICULAR EQUIPMENT 90001,2UNPAVED ROADS - ENTRAINED DUST 90,013WIND EROSION FROM UNPAVED OPERATIONAL AREAS AND ROA 90,014 20.10 10.05 4.02 - - - - -
GRAND TOTAL 37.84 17.23 5.05 3.03 1.12 0.03 0.03 0.00
2008 Emissions from White Knob Quarry Area
243,036 tons excavated in 2008EMISSION SOURCE / OPERATION / ACTIVITY DEVICE ID # CRITERIA EMISSIONS (tons per year)
- - TSP PM10 PM2.5 CO NOx TOG ROG / VOC SOxDRILLING 90,010 0.12 0.10 0.10 - - - - -BLASTING 90,011 2.84 1.47 0.09 - - - - -EXPLOSIVES 90,011 - - - 1.94 0.49 - - -BULLDOZING, SCRAPING AND GRADING OF MATERIAL 90012a 11.01 5.35 1.64 - - - - -LOADING OF MATERIAL(S) MINE / QUARRY / PIT 90006,7,8,9 0.87 0.42 0.13 - - - - -AGGREGATE HANDLING, CRUSHING, AND SCREENING #1 2,456 6.20 2.01 0.63 - - - - -STOCKPILES - WIND EROSION 90,015 0.18 0.09 0.04 - - - - -EXHAUST - STATIONARY AND PORTABLE EQUIPMENT VARIOUSEXHAUST - MOBILE AND VEHICULAR EQUIPMENT 90001,2UNPAVED ROADS - ENTRAINED DUST 90,013WIND EROSION FROM UNPAVED OPERATIONAL AREAS AND ROA 90014a 20.66 10.33 4.13 - - - - -
GRAND TOTAL 41.88 19.78 6.75 1.94 0.49 - - -
Notes: There are no paved roads on-site. Exhaust from stationary and portable equipment excludes White Knob generator which is calculated elsewhere. Exhaust from mobile/vehicular equipment and travel on unpaved roads is calculated elsewhere. Wind erosion is not expected to change because the active area that is disturbed on a daily basis will not change with project.

Sentinel-Butterfield Quarry Expansion ProjectSan Bernardino County, California
Mitigated Grading
om01_SBProjectAir_v1.3.xlsb 2 10/8/2013
EMISSION SOURCE / OPERATION / ACTIVITY -
DRILLINGBLASTINGEXPLOSIVESBULLDOZING, SCRAPING AND GRADING OF MATERIALLOADING OF MATERIAL(S) MINE / QUARRY / PIT Ball Mill #1Tertiary CrushingRoller Mill #1Roller Mill #2Roller Mill #3Roller Mill #4Surface Treating PlantRock Storage System/PlanOptical SorterCoarse Product Storage SystemSilo 81-70cBulk Loadout 82 System Bulk Loadout 83 System STOCKPILES - WIND EROSIONEXHAUST - STATIONARY AND PORTABLE EQUIPMENTEXHAUST - MOBILE AND VEHICULAR EQUIPMENTPAVED ROADS - ENTRAINED DUSTUNPAVED ROADS - ENTRAINED DUSTWIND EROSION FROM UNPAVED OPERATIONAL AREAS AND ROA
EMISSION SOURCE / OPERATION / ACTIVITY -
DRILLINGBLASTINGEXPLOSIVESBULLDOZING, SCRAPING AND GRADING OF MATERIALLOADING OF MATERIAL(S) MINE / QUARRY / PIT AGGREGATE HANDLING, CRUSHING, AND SCREENING #1STOCKPILES - WIND EROSIONEXHAUST - STATIONARY AND PORTABLE EQUIPMENTEXHAUST - MOBILE AND VEHICULAR EQUIPMENTUNPAVED ROADS - ENTRAINED DUSTWIND EROSION FROM UNPAVED OPERATIONAL AREAS AND ROA
EMISSION SOURCE / OPERATION / ACTIVITY -
DRILLINGBLASTINGEXPLOSIVESBULLDOZING, SCRAPING AND GRADING OF MATERIALLOADING OF MATERIAL(S) MINE / QUARRY / PIT AGGREGATE HANDLING, CRUSHING, AND SCREENING #1STOCKPILES - WIND EROSIONEXHAUST - STATIONARY AND PORTABLE EQUIPMENTEXHAUST - MOBILE AND VEHICULAR EQUIPMENTUNPAVED ROADS - ENTRAINED DUSTWIND EROSION FROM UNPAVED OPERATIONAL AREAS AND ROA
Baseline Emissions from Processing Plant Area
653,635 tons produced in BaselineCRITERIA EMISSIONS (tons per year)
Multiplier TSP PM10 PM2.5 CO NOx TOG ROG / VOC SOx - - - - - - - - - - - - - - - - - - - - - - - - - - -
1.82 0.185 0.090 0.028 - - - - -1.82 0.0072 0.0035 0.0011 - - - - -1.82 1.68 0.106 0.033 - - - - -1.82 34.7 2.25 0.69 - - - - -1.82 3.61 0.242 0.076 - - - - -1.82 2.66 0.167 0.052 - - - - -1.82 1.62 0.104 0.033 - - - - -1.82 1.60 0.104 0.033 - - - - -1.82 0.011 0.0010 0.0003 - - - - -1.82 19.5 5.47 1.71 - - - - -1.82 0.019 0.014 0.004 - - - - -1.82 0.48 0.080 0.025 - - - - -1.82 0.58 0.082 0.026 - - - - -1.82 0.16 0.025 0.008 - - - - -1.82 0.028 0.005 0.001 - - - - -1.00 1.06 0.53 0.21 - - - - -1.82 0.047 0.046 0.046 0.12 0.48 0.01 0.01 0.13
- - - - - - - - - - - - - - - - - -
1.82 30.84 9.10 1.40 - - - - -1.00 11.25 5.62 2.25 - - - - -
110.03 24.04 6.62 0.12 0.48 0.01 0.01 0.13
Baseline Emissions from Sentinel-Butterfield Quarry Area
624,191 tons excavated in BaselineCRITERIA EMISSIONS (tons per year)
Multiplier TSP PM10 PM2.5 CO NOx TOG ROG / VOC SOx1.39 0.31 0.25 0.25 - - - - -1.39 14.46 7.52 0.43 - - - - -1.39 - - - 4.09 1.04 - - -2.57 28.27 13.75 4.20 - - - - -1.39 0.39 0.19 0.06 - - - - -1.39 8.43 1.48 0.46 - - - - -1.00 0.67 0.34 0.13 - - - - -1.39 0.04 0.04 0.04 0.11 0.52 0.042 0.037 0.0017
- - - - - - - - - - - - - - - - - -
1.00 20.10 10.05 4.02 - - - - -72.66 33.61 9.59 4.2 1.6 0.042 0.037 0.0017
Baseline Emissions from White Knob Quarry Area
463,467 tons excavated in BaselineCRITERIA EMISSIONS (tons per year)
Multiplier TSP PM10 PM2.5 CO NOx TOG ROG / VOC SOx1.91 0.23 0.19 0.19 - - - - -1.91 5.41 2.81 0.16 - - - - -1.91 - - - 3.71 0.94 - - -1.91 20.99 10.21 3.12 - - - - -1.91 1.65 0.81 0.25 - - - - -1.91 11.83 3.83 1.20 - - - - -1.00 0.18 0.09 0.04 - - - - -
- - - - - - - - - - - - - - - - - - - - - - - - - - -
1.00 20.66 10.33 4.13 - - - - -60.96 28.27 9.08 3.71 0.94 - - -
Note: Sentinel-Butterfield bulldozing scaled based on White Knob Quarry activity level to reflect increased overburden with project.

Sentinel-Butterfield Quarry Expansion ProjectSan Bernardino County, California
Mitigated Grading
om01_SBProjectAir_v1.3.xlsb 3 10/8/2013
EMISSION SOURCE / OPERATION / ACTIVITY -
DRILLINGBLASTINGEXPLOSIVESBULLDOZING, SCRAPING AND GRADING OF MATERIALLOADING OF MATERIAL(S) MINE / QUARRY / PIT Ball Mill #1Tertiary CrushingRoller Mill #1Roller Mill #2Roller Mill #3Roller Mill #4Surface Treating PlantRock Storage System/PlanOptical SorterCoarse Product Storage SystemSilo 81-70cBulk Loadout 82 System Bulk Loadout 83 System STOCKPILES - WIND EROSIONEXHAUST - STATIONARY AND PORTABLE EQUIPMENTEXHAUST - MOBILE AND VEHICULAR EQUIPMENTPAVED ROADS - ENTRAINED DUSTUNPAVED ROADS - ENTRAINED DUSTWIND EROSION FROM UNPAVED OPERATIONAL AREAS AND ROA
EMISSION SOURCE / OPERATION / ACTIVITY -
DRILLINGBLASTINGEXPLOSIVESBULLDOZING, SCRAPING AND GRADING OF MATERIALLOADING OF MATERIAL(S) MINE / QUARRY / PIT AGGREGATE HANDLING, CRUSHING, AND SCREENING #1STOCKPILES - WIND EROSIONEXHAUST - STATIONARY AND PORTABLE EQUIPMENTEXHAUST - MOBILE AND VEHICULAR EQUIPMENTUNPAVED ROADS - ENTRAINED DUSTWIND EROSION FROM UNPAVED OPERATIONAL AREAS AND ROA
EMISSION SOURCE / OPERATION / ACTIVITY -
DRILLINGBLASTINGEXPLOSIVESBULLDOZING, SCRAPING AND GRADING OF MATERIALLOADING OF MATERIAL(S) MINE / QUARRY / PIT AGGREGATE HANDLING, CRUSHING, AND SCREENING #1STOCKPILES - WIND EROSIONEXHAUST - STATIONARY AND PORTABLE EQUIPMENTEXHAUST - MOBILE AND VEHICULAR EQUIPMENTUNPAVED ROADS - ENTRAINED DUSTWIND EROSION FROM UNPAVED OPERATIONAL AREAS AND ROA
Project Plus Baseline Emissions from Processing Plant Area
680,000 tons produced with ProjectCRITERIA EMISSIONS (tons per year)
Multiplier TSP PM10 PM2.5 CO NOx TOG ROG / VOC SOx - - - - - - - - - - - - - - - - - - - - - - - - - - -
1.89 0.19 0.09 0.03 - - - - -1.89 0.01 0.00 0.00 - - - - -1.89 1.75 0.11 0.03 - - - - -1.89 36.05 2.34 0.72 - - - - -1.89 3.75 0.25 0.08 - - - - -1.89 2.77 0.17 0.05 - - - - -1.89 1.68 0.11 0.03 - - - - -1.89 1.67 0.11 0.03 - - - - -1.89 0.01 0.00 0.00 - - - - -1.89 20.33 5.69 1.78 - - - - -1.89 0.02 0.01 0.00 - - - - -1.89 0.50 0.08 0.03 - - - - -1.89 0.60 0.09 0.03 - - - - -1.89 0.16 0.03 0.01 - - - - -1.89 0.03 0.00 0.00 - - - - -1.00 1.06 0.53 0.21 - - - - -1.89 0.05 0.05 0.05 0.12 0.50 0.01 0.0054 0.13
- - - - - - - - - - - - - - - - - -
1.89 32.08 9.47 1.45 - - - - -1.00 11.25 5.62 2.25 - - - - -
113.97 24.77 6.79 0.12 0.50 0.01 0.01 0.13
Project Plus Baseline Emissions from Sentinel-Butterfield Quarry Area
1,487,500 tons excavated with ProjectCRITERIA EMISSIONS (tons per year)
Multiplier TSP PM10 PM2.5 CO NOx TOG ROG / VOC SOx3.31 0.74 0.60 0.60 - - - - -3.31 34.46 17.92 1.03 - - - - -3.31 - - - 9.75 2.47 - - -6.12 41.84 20.35 6.22 - - - - -3.31 0.92 0.45 0.14 - - - - -3.31 20.10 3.52 1.09 - - - - -1.00 0.67 0.34 0.13 - - - - -3.31 0.09 0.09 0.09 0.27 1.24 0.10 0.088 0.0041
- - - - - - - - - - - - - - - - - -
1.00 20.10 10.05 4.02 - - - - -118.91 53.31 13.32 10.02 3.72
Project Plus Baseline Emissions from White Knob Quarry Area
- tons excavated with ProjectCRITERIA EMISSIONS (tons per year)
Multiplier TSP PM10 PM2.5 CO NOx TOG ROG / VOC SOx - - - - - - - - - - - - - - - - - - - - - - - - - - - - - - - - - - - - - - - - - - - - - - - - - - - - - - - - - - - - - - - - - - - - - - - - - - - - - - - - - - - - - - - - - - - - - - - - - - -
- - - - - - - -
Note: Sentinel-Butterfield bulldozing scaled based on White Knob Quarry activity level to reflect increased overburden with project. Grading mitigated by watering . Baseline control efficiency from 2008 emissions inventory of 62.1% control was increased to 85.6% control from increased moisture in material affected due to watering.

Sentinel-Butterfield Quarry Expansion ProjectSan Bernardino County, California
Mitigated Grading
om01_SBProjectAir_v1.3.xlsb 4 10/8/2013
EMISSION SOURCE / OPERATION / ACTIVITY -
DRILLINGBLASTINGEXPLOSIVESBULLDOZING, SCRAPING AND GRADING OF MATERIALLOADING OF MATERIAL(S) MINE / QUARRY / PIT Ball Mill #1Tertiary CrushingRoller Mill #1Roller Mill #2Roller Mill #3Roller Mill #4Surface Treating PlantRock Storage System/PlanOptical SorterCoarse Product Storage SystemSilo 81-70cBulk Loadout 82 System Bulk Loadout 83 System STOCKPILES - WIND EROSIONEXHAUST - STATIONARY AND PORTABLE EQUIPMENTEXHAUST - MOBILE AND VEHICULAR EQUIPMENTPAVED ROADS - ENTRAINED DUSTUNPAVED ROADS - ENTRAINED DUSTWIND EROSION FROM UNPAVED OPERATIONAL AREAS AND ROA
EMISSION SOURCE / OPERATION / ACTIVITY -
DRILLINGBLASTINGEXPLOSIVESBULLDOZING, SCRAPING AND GRADING OF MATERIALLOADING OF MATERIAL(S) MINE / QUARRY / PIT AGGREGATE HANDLING, CRUSHING, AND SCREENING #1STOCKPILES - WIND EROSIONEXHAUST - STATIONARY AND PORTABLE EQUIPMENTEXHAUST - MOBILE AND VEHICULAR EQUIPMENTUNPAVED ROADS - ENTRAINED DUSTWIND EROSION FROM UNPAVED OPERATIONAL AREAS AND ROA
EMISSION SOURCE / OPERATION / ACTIVITY -
DRILLINGBLASTINGEXPLOSIVESBULLDOZING, SCRAPING AND GRADING OF MATERIALLOADING OF MATERIAL(S) MINE / QUARRY / PIT AGGREGATE HANDLING, CRUSHING, AND SCREENING #1STOCKPILES - WIND EROSIONEXHAUST - STATIONARY AND PORTABLE EQUIPMENTEXHAUST - MOBILE AND VEHICULAR EQUIPMENTUNPAVED ROADS - ENTRAINED DUSTWIND EROSION FROM UNPAVED OPERATIONAL AREAS AND ROA
Project Emissions from Processing Plant Area
Project Emissions 26,365 tons change from baselineCRITERIA EMISSIONS (tons per year)TSP PM10 PM2.5 CO NOx TOG ROG / VOC SOx
- - - - - - - - - - - - - - - - - - - - - - - -
0.01 0.00 0.00 - - - - -0.00 0.00 0.00 - - - - -0.07 0.00 0.00 - - - - -1.40 0.09 0.03 - - - - -0.15 0.01 0.00 - - - - -0.11 0.01 0.00 - - - - -0.07 0.00 0.00 - - - - -0.06 0.00 0.00 - - - - -0.00 0.00 0.00 - - - - -0.79 0.22 0.07 - - - - -0.00 0.00 0.00 - - - - -0.02 0.00 0.00 - - - - -0.02 0.00 0.00 - - - - -0.01 0.00 0.00 - - - - -0.00 0.00 0.00 - - - - -
- - - - - - - -0.00 0.00 0.00 0.00 0.02 0.00 0.00 0.01
- - - - - - - - - - - - - - - -
1.24 0.37 0.06 - - - - - - - - - - - - -
3.94 0.72 0.17 0.00 0.02 0.00 0.00 0.01
Project Emissions from Sentinel-Butterfield Quarry Area
Project Emissions 863,309 tons change from baselineCRITERIA EMISSIONS (tons per year)TSP PM10 PM2.5 CO NOx TOG ROG / VOC SOx
0.43 0.35 0.35 - - - - -20.00 10.40 0.60 - - - - -
- - - 5.66 1.44 - - -13.57 6.60 2.02 - - - - -
0.53 0.26 0.08 - - - - -11.66 2.04 0.63 - - - - -
- - - - - - - -0.05 0.05 0.05 0.16 0.72 0.06 0.05 0.00
- - - - - - - - - - - - - - - - - - - - - - - -
46.25 19.70 3.72 5.82 2.16 -0.04 -0.04 -0.00
Project Emissions from White Knob Quarry Area
Project Emissions -463,467 tons change from baselineCRITERIA EMISSIONS (tons per year)TSP PM10 PM2.5 CO NOx TOG ROG / VOC SOx
-0.23 -0.19 -0.19 - - - - - -5.41 -2.81 -0.16 - - - - -
- - - -3.71 -0.94 - - - -20.99 -10.21 -3.12 - - - - -
-1.65 -0.81 -0.25 - - - - - -11.83 -3.83 -1.20 - - - - -
-0.18 -0.09 -0.04 - - - - - - - - - - - - - - - - - - - - - - - - - - - - -
-20.66 -10.33 -4.13 - - - - - -60.96 -28.27 -9.08 -3.71 -0.94 - - -

Sentinel-Butterfield Quarry Expansion ProjectSan Bernardino County, California
Mitigated Criteria
om01_SBProjectAir_v1.3.xlsb 1 10/8/2013
21 VOL1 VOL2 VOL3 VOL4 VOL5 VOL6 VOL7 VOL8 VOL9 VOL10MitTSPann -3.50E-01 -8.14E-01 0.00E+00 -3.00E-01 -3.00E-01 1.14E-01 2.50E-01 8.23E-03 3.41E-01 7.46E-01MitTSPday -1.28E+00 -2.97E+00 0.00E+00 -1.09E+00 -1.09E+00 4.15E-01 9.12E-01 3.01E-02 1.24E+00 2.72E+00MitPM10ann -1.17E-01 -4.10E-01 0.00E+00 -1.48E-01 -1.48E-01 2.10E-02 1.29E-01 4.30E-03 6.40E-02 3.84E-01MitPM10day -4.29E-01 -1.50E+00 0.00E+00 -5.40E-01 -5.40E-01 7.66E-02 4.71E-01 1.57E-02 2.33E-01 1.40E+00MitPM25ann -4.03E-02 -1.27E-01 0.00E+00 -5.23E-02 -5.23E-02 5.06E-03 2.50E-02 1.71E-03 2.34E-02 7.15E-02MitPM25day -1.47E-01 -4.62E-01 0.00E+00 -1.91E-01 -1.91E-01 1.85E-02 9.12E-02 6.22E-03 8.53E-02 2.61E-01
TSPann (lb/yr/src) -24344.179 -56602.499 0 -20836.774 -20836.774 7899.79756 17369.395 572.507122 23689.7697 51866.6732TSPday (lb/day/src) -243.44179 -566.02499 0 -208.36774 -208.36774 78.9979756 173.69395 5.72507122 236.897697 518.666732PM10ann (lb/yr/src) -8167.1132 -28507.675 0 -10281.845 -10281.845 1459.43901 8973.87565 298.702889 4446.23095 26680.1152PM10day (lb/day/src) -81.671132 -285.07675 0 -102.81845 -102.81845 14.5943901 89.7387565 2.98702889 44.4623095 266.801152PM25ann (lb/yr/src) -2803.8977 -8798.7133 0 -3636.8902 -3636.8902 351.818377 1736.9307 118.568524 1625.57054 4969.28041PM25day (lb/day/src) -28.038977 -87.987133 0 -36.368902 -36.368902 3.51818377 17.369307 1.18568524 16.2557054 49.6928041
TSPann (lb/yr) -24,344 -56,602 0 -20,837 -20,837 7,900 17,369 573 23,690 51,867TSPday (lb/day) -243 -566 0 -208 -208 79 174 6 237 519PM10ann (lb/yr) -8,167 -28,508 0 -10,282 -10,282 1,459 8,974 299 4,446 26,680PM10day (lb/day) -82 -285 0 -103 -103 15 90 3 44 267PM25ann (lb/yr) -2,804 -8,799 0 -3,637 -3,637 352 1,737 119 1,626 4,969PM25day (lb/day) -28 -88 0 -36 -36 4 17 1 16 50
HC (lb/yr) -640 -554 0 -16 -16 23 344 61 330 720NOx (lb/yr) -9,898 -8,146 0 -240 -240 174 5,076 893 7,092 10,584CO (lb/yr) -14,201 -5,306 0 -156 -156 112 2,822 581 7,437 6,894SOx (lb/yr) -0.305 -0.292 0 -0.009 -0.009 0.006 0.164 0.032 0.731 0.379CO2 (ton/yr) -584 -769 0 -23 -23 25 433 84 806 999TSP (lb/yr) -24,344 -56,602 0 -20,837 -20,837 7,900 17,369 573 23,690 51,867PM10 (lb/yr) -8,167 -28,508 0 -10,282 -10,282 1,459 8,974 299 4,446 26,680PM2.5 (lb/yr) -2,804 -8,799 0 -3,637 -3,637 352 1,737 119 1,626 4,969

Sentinel-Butterfield Quarry Expansion ProjectSan Bernardino County, California
Mitigated Criteria
om01_SBProjectAir_v1.3.xlsb 2 10/8/2013
21MitTSPannMitTSPdayMitPM10annMitPM10dayMitPM25annMitPM25day
TSPann (lb/yr/src)TSPday (lb/day/src)PM10ann (lb/yr/src)PM10day (lb/day/src)PM25ann (lb/yr/src)PM25day (lb/day/src)
TSPann (lb/yr)TSPday (lb/day)PM10ann (lb/yr)PM10day (lb/day)PM25ann (lb/yr)PM25day (lb/day)
HC (lb/yr)NOx (lb/yr)CO (lb/yr)SOx (lb/yr)CO2 (ton/yr)TSP (lb/yr)PM10 (lb/yr)PM2.5 (lb/yr)
A B C E0 G 327 H I J K L6.01E-03 1.56E-02 1.37E-02 1.96E-02 5.26E-03 0.00E+00 -8.90E-03 -2.70E-03 -1.30E-02 5.54E-05 -1.45E-021.10E-02 2.99E-02 2.03E-02 2.92E-02 -9.61E-03 0.00E+00 -4.01E-02 -3.83E-02 -5.81E-02 -1.53E-04 -6.46E-021.74E-03 4.51E-03 3.97E-03 5.68E-03 1.54E-03 0.00E+00 -2.57E-03 -7.65E-04 -3.76E-03 1.29E-05 -4.18E-033.20E-03 8.66E-03 5.91E-03 8.49E-03 -2.73E-03 0.00E+00 -1.16E-02 -1.10E-02 -1.68E-02 -3.55E-05 -1.86E-022.14E-04 5.51E-04 4.87E-04 6.98E-04 2.00E-04 0.00E+00 -3.01E-04 -7.33E-05 -4.40E-04 4.68E-06 -4.89E-043.97E-04 1.06E-03 7.43E-04 1.07E-03 -2.72E-04 0.00E+00 -1.35E-03 -1.25E-03 -1.96E-03 -1.29E-05 -2.18E-03
418.098759 1082.66541 951.597207 1361.79462 365.869163 -618.98074 -187.66009 -906.29025 3.85298136 -1007.25952.09995884 5.68721127 3.870112 5.55714444 -1.8302301 -7.6412474 -7.3003763 -11.063298 -0.0290572 -12.295853121.295568 313.881316 276.069581 395.111822 106.877374 -178.66577 -53.169119 -261.59625 0.89565587 -290.740530.60997849 1.65021006 1.12585241 1.6168252 -0.5203162 -2.2056087 -2.100959 -3.1933668 -0.0067546 -3.549137914.8833978 38.274931 33.8742506 48.5249021 13.9388933 -20.902984 -5.0938793 -30.605429 0.32529078 -34.0151610.07569418 0.20280163 0.14161156 0.20358981 -0.0518766 -0.258045 -0.2387362 -0.3736076 -0.0024532 -0.4152311
15,888 18,405 13,322 73,537 119,639 -72 -126,272 -751 -32,626 308 -20,14580 97 54 300 -598 -1,559 -29 -398 -2 -246
4,609 5,336 3,865 21,336 34,949 -20 -36,448 -213 -9,417 72 -5,81523 28 16 87 -170 -450 -8 -115 -1 -71
566 651 474 2,620 4,558 -2 -4,264 -20 -1,102 26 -6803 3 2 11 -17 -53 -1 -13 0 -8
221 248 186 1,029 2,248 0 -1,310 2 -338 12 -2094,087 4,572 3,427 19,009 41,520 0 -24,191 35 -6,251 218 -3,8592,666 2,983 2,235 12,401 27,085 0 -15,781 23 -4,078 52 -2,5180.170 0.190 0.143 0.791 1.728 0.000 -1.007 0.001 -0.260 0.284 -0.161
426 477 358 1,984 4,333 0 -2,524 4 -652 0 -40315,888 18,405 13,322 73,537 119,639 -72 -126,272 -751 -32,626 308 -20,145
4,609 5,336 3,865 21,336 34,949 -20 -36,448 -213 -9,417 72 -5,815566 651 474 2,620 4,558 -2 -4,264 -20 -1,102 26 -680
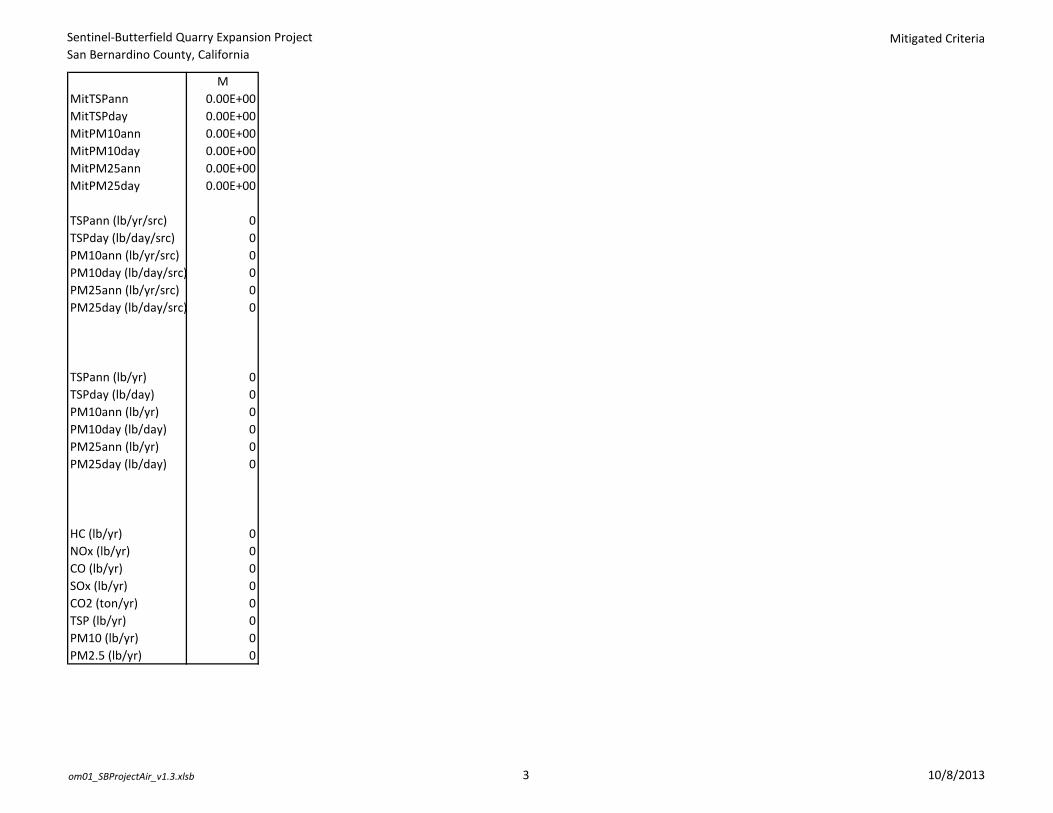
Sentinel-Butterfield Quarry Expansion ProjectSan Bernardino County, California
Mitigated Criteria
om01_SBProjectAir_v1.3.xlsb 3 10/8/2013
21MitTSPannMitTSPdayMitPM10annMitPM10dayMitPM25annMitPM25day
TSPann (lb/yr/src)TSPday (lb/day/src)PM10ann (lb/yr/src)PM10day (lb/day/src)PM25ann (lb/yr/src)PM25day (lb/day/src)
TSPann (lb/yr)TSPday (lb/day)PM10ann (lb/yr)PM10day (lb/day)PM25ann (lb/yr)PM25day (lb/day)
HC (lb/yr)NOx (lb/yr)CO (lb/yr)SOx (lb/yr)CO2 (ton/yr)TSP (lb/yr)PM10 (lb/yr)PM2.5 (lb/yr)
M0.00E+000.00E+000.00E+000.00E+000.00E+000.00E+00
000000
000000
00000000
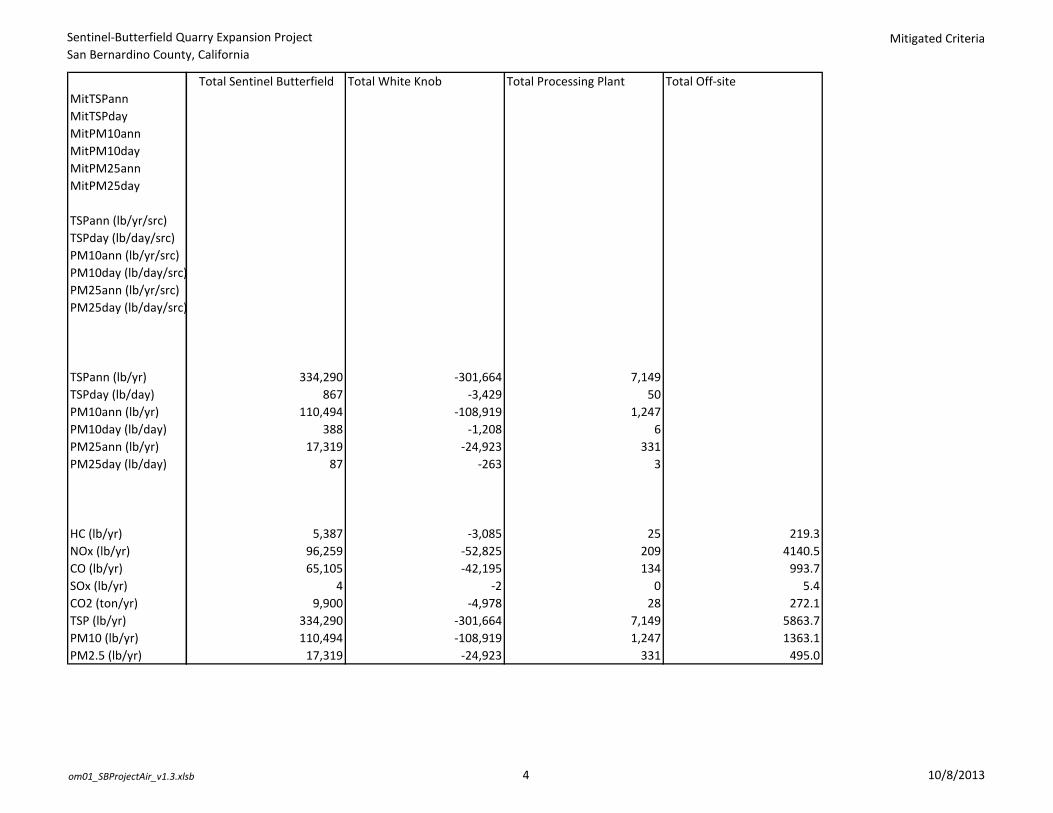
Sentinel-Butterfield Quarry Expansion ProjectSan Bernardino County, California
Mitigated Criteria
om01_SBProjectAir_v1.3.xlsb 4 10/8/2013
21MitTSPannMitTSPdayMitPM10annMitPM10dayMitPM25annMitPM25day
TSPann (lb/yr/src)TSPday (lb/day/src)PM10ann (lb/yr/src)PM10day (lb/day/src)PM25ann (lb/yr/src)PM25day (lb/day/src)
TSPann (lb/yr)TSPday (lb/day)PM10ann (lb/yr)PM10day (lb/day)PM25ann (lb/yr)PM25day (lb/day)
HC (lb/yr)NOx (lb/yr)CO (lb/yr)SOx (lb/yr)CO2 (ton/yr)TSP (lb/yr)PM10 (lb/yr)PM2.5 (lb/yr)
Total Sentinel Butterfield Total White Knob Total Processing Plant Total Off-site
334,290 -301,664 7,149867 -3,429 50
110,494 -108,919 1,247388 -1,208 6
17,319 -24,923 33187 -263 3
5,387 -3,085 25 219.396,259 -52,825 209 4140.565,105 -42,195 134 993.7
4 -2 0 5.49,900 -4,978 28 272.1
334,290 -301,664 7,149 5863.7110,494 -108,919 1,247 1363.1
17,319 -24,923 331 495.0

Sentinel-Butterfield Quarry Expansion ProjectSan Bernardino County, California
Mitigated Criteria
om01_SBProjectAir_v1.3.xlsb 5 10/8/2013
21MitTSPannMitTSPdayMitPM10annMitPM10dayMitPM25annMitPM25day
TSPann (lb/yr/src)TSPday (lb/day/src)PM10ann (lb/yr/src)PM10day (lb/day/src)PM25ann (lb/yr/src)PM25day (lb/day/src)
TSPann (lb/yr)TSPday (lb/day)PM10ann (lb/yr)PM10day (lb/day)PM25ann (lb/yr)PM25day (lb/day)
HC (lb/yr)NOx (lb/yr)CO (lb/yr)SOx (lb/yr)CO2 (ton/yr)TSP (lb/yr)PM10 (lb/yr)PM2.5 (lb/yr)
Total Project w/o White KnobTotal Project w/ White Knob Volume Source Identifiers LOCATION VOL1 VOLUME 498771.228 3802380.117 0** DESCRSRC White Knob Crushing LOCATION VOL2 VOLUME 498410.694 3802532.330 0** DESCRSRC White Knob Pit LOCATION VOL3 VOLUME 499367.635 3802416.274 0** DESCRSRC White Ridge Pit LOCATION VOL4 VOLUME 499169.967 3802653.553 0** DESCRSRC OB1 LOCATION VOL5 VOLUME 498786.819 3802108.559 0** DESCRSRC OB2 LOCATION VOL6 VOLUME 505294.247 3804607.151 0** DESCRSRC Processing Plant LOCATION VOL7 VOLUME 504322.000 3798695.000 0** DESCRSRC Butterfield Pit LOCATION VOL8 VOLUME 505430.000 3797960.000 0** DESCRSRC B5 Pad Expansion
341,439 39,775 ** DESCRSRC Butterfield-Sentinel Crushing917 -2,512 LOCATION VOL10 VOLUME 505808.000 3798770.000 0
111,741 2,822 ** DESCRSRC Sentinel Pit394 -814
17,651 -7,27289 -174
5,631 2,547100,609 47,784
66,233 24,03710 8
10,201 5,223347,303 45,639113,104 4,185
18,146 -6,777

Butterfield and Sentinel Quarries Expansion Air Quality and Greenhouse Gas Impact Assessment San Bernardino National Forest October 25, 2017
OM01_SB-AQHRCCIA_fnl.docx Sespe Consulting, Inc.
Appendix L: Alternative 4 Emissions

Sentinel-Butterfield Quarry Expansion ProjectSan Bernardino County, California
Summary
om01_SBAlternativeAir_v1.4.xlsb 1 10/8/2013
Total Sentinel Butterfield Total White Knob Total Processing Plant Total Offsite
Total Project w/o White Knob Reductions
Total Project w/ White Knob Reductions
HC 1.61 -0.97 0.01 0.11 1.74 0.77NOx 29.0 -15.8 0.10 2.07 31.1 15.3CO 19.9 -14.2 0.07 0.50 20.4 6.2SOx 0.0013 -0.0006 0.0000 0.0027 0.0040 0.0035TSP 155 -103 4.04 2.93 162 60PM10 52.0 -38.5 0.76 0.68 53.4 14.9PM2.5 8.6 -10.6 0.18 0.25 9.1 -1.58CO2 5,980 -2,765 28.3 272.13 6,280 3,515

Sentinel-Butterfield Quarry Expansion ProjectSan Bernardino County, California
Mining and Processing
om01_SBAlternativeAir_v1.4.xlsb 1 10/8/2013
2008 Emissions from Processing Plant Area
360,117 tons produced in 2008EMISSION SOURCE / OPERATION / ACTIVITY DEVICE ID # CRITERIA EMISSIONS (tons per year)
- - TSP PM10 PM2.5 CO NOx TOG ROG / VOC SOxDRILLING 90,010 - - - - - - - -BLASTING 90,011 - - - - - - - -EXPLOSIVES 90,011 - - - - - - - -BULLDOZING, SCRAPING AND GRADING OF MATERIAL 90012a 0.10 0.05 0.02 - - - - -LOADING OF MATERIAL(S) MINE / QUARRY / PIT 90006,7,8,9 0.00 0.00 0.00 - - - - -Ball Mill #1 2,002 0.93 0.06 0.02 - - - - -Tertiary Crushing 757 19.09 1.24 0.38 - - - - -Roller Mill #1 763 1.99 0.13 0.04 - - - - -Roller Mill #2 763 1.46 0.09 0.03 - - - - -Roller Mill #3 3,935 0.89 0.06 0.02 - - - - -Roller Mill #4 7,674 0.88 0.06 0.02 - - - - -Surface Treating Plant 2,003 0.01 0.00 0.00 - - - - -Rock Storage System/Plan 754 10.77 3.01 0.94 - - - - -Optical Sorter 763 0.01 0.01 0.00 - - - - -Coarse Product Storage System 2,009 0.27 0.04 0.01 - - - - -Silo 81-70c 4,967 0.32 0.05 0.01 - - - - -Bulk Loadout 82 System 2,007 0.09 0.01 0.00 - - - - -Bulk Loadout 83 System 2,009 0.02 0.00 0.00 - - - - -STOCKPILES - WIND EROSION 90,015 1.06 0.53 0.21 - - - - -EXHAUST - STATIONARY AND PORTABLE EQUIPMENT VARIOUS 0.03 0.03 0.03 0.07 0.26 0.00 0.00 0.07EXHAUST - MOBILE AND VEHICULAR EQUIPMENT 90001,2PAVED ROADS - ENTRAINED DUST - - - - - - - - -UNPAVED ROADS - ENTRAINED DUST 90,013 16.99 5.01 0.77 - - - - -WIND EROSION FROM UNPAVED OPERATIONAL AREAS AND ROA 90014a 11.25 5.62 2.25 - - - - -
GRAND TOTAL 66.15 16.01 4.75 0.07 0.26 0.00 0.00 0.07
2008 Emissions from Sentinel-Butterfield Quarry Area
449,672 tons excavated in 2008EMISSION SOURCE / OPERATION / ACTIVITY DEVICE ID # CRITERIA EMISSIONS (tons per year)
- - TSP PM10 PM2.5 CO NOx TOG ROG / VOC SOxDRILLING 90,010 0.22 0.18 0.18 - - - - -BLASTING 90,011 10.42 5.42 0.31 - - - - -EXPLOSIVES 30,502,514 - - - 2.95 0.75 - - -BULLDOZING, SCRAPING AND GRADING OF MATERIAL 90,012 0.05 0.02 0.01 - - - - -LOADING OF MATERIAL(S) MINE / QUARRY / PIT 90006,7,8,9 0.28 0.14 0.04 - - - - -AGGREGATE HANDLING, CRUSHING, AND SCREENING #1 751 6.08 1.06 0.33 - - - - -STOCKPILES - WIND EROSION 90,015 0.67 0.34 0.13 - - - - -EXHAUST - STATIONARY AND PORTABLE EQUIPMENT VARIOUS 0.03 0.03 0.03 0.08 0.38 0.03 0.03 0.00EXHAUST - MOBILE AND VEHICULAR EQUIPMENT 90001,2UNPAVED ROADS - ENTRAINED DUST 90,013WIND EROSION FROM UNPAVED OPERATIONAL AREAS AND ROA 90,014 20.10 10.05 4.02 - - - - -
GRAND TOTAL 37.84 17.23 5.05 3.03 1.12 0.03 0.03 0.00
2008 Emissions from White Knob Quarry Area
243,036 tons excavated in 2008EMISSION SOURCE / OPERATION / ACTIVITY DEVICE ID # CRITERIA EMISSIONS (tons per year)
- - TSP PM10 PM2.5 CO NOx TOG ROG / VOC SOxDRILLING 90,010 0.12 0.10 0.10 - - - - -BLASTING 90,011 2.84 1.47 0.09 - - - - -EXPLOSIVES 90,011 - - - 1.94 0.49 - - -BULLDOZING, SCRAPING AND GRADING OF MATERIAL 90012a 11.01 5.35 1.64 - - - - -LOADING OF MATERIAL(S) MINE / QUARRY / PIT 90006,7,8,9 0.87 0.42 0.13 - - - - -AGGREGATE HANDLING, CRUSHING, AND SCREENING #1 2,456 6.20 2.01 0.63 - - - - -STOCKPILES - WIND EROSION 90,015 0.18 0.09 0.04 - - - - -EXHAUST - STATIONARY AND PORTABLE EQUIPMENT VARIOUSEXHAUST - MOBILE AND VEHICULAR EQUIPMENT 90001,2UNPAVED ROADS - ENTRAINED DUST 90,013WIND EROSION FROM UNPAVED OPERATIONAL AREAS AND ROA 90014a 20.66 10.33 4.13 - - - - -
GRAND TOTAL 41.88 19.78 6.75 1.94 0.49 - - -
Notes: There are no paved roads on-site. Exhaust from stationary and portable equipment excludes White Knob generator which is calculated elsewhere. Exhaust from mobile/vehicular equipment and travel on unpaved roads is calculated elsewhere. Wind erosion is not expected to change because the active area that is disturbed on a daily basis will not change with project.

Sentinel-Butterfield Quarry Expansion ProjectSan Bernardino County, California
Mining and Processing
om01_SBAlternativeAir_v1.4.xlsb 2 10/8/2013
EMISSION SOURCE / OPERATION / ACTIVITY -
DRILLINGBLASTINGEXPLOSIVESBULLDOZING, SCRAPING AND GRADING OF MATERIALLOADING OF MATERIAL(S) MINE / QUARRY / PIT Ball Mill #1Tertiary CrushingRoller Mill #1Roller Mill #2Roller Mill #3Roller Mill #4Surface Treating PlantRock Storage System/PlanOptical SorterCoarse Product Storage SystemSilo 81-70cBulk Loadout 82 System Bulk Loadout 83 System STOCKPILES - WIND EROSIONEXHAUST - STATIONARY AND PORTABLE EQUIPMENTEXHAUST - MOBILE AND VEHICULAR EQUIPMENTPAVED ROADS - ENTRAINED DUSTUNPAVED ROADS - ENTRAINED DUSTWIND EROSION FROM UNPAVED OPERATIONAL AREAS AND ROA
EMISSION SOURCE / OPERATION / ACTIVITY -
DRILLINGBLASTINGEXPLOSIVESBULLDOZING, SCRAPING AND GRADING OF MATERIALLOADING OF MATERIAL(S) MINE / QUARRY / PIT AGGREGATE HANDLING, CRUSHING, AND SCREENING #1STOCKPILES - WIND EROSIONEXHAUST - STATIONARY AND PORTABLE EQUIPMENTEXHAUST - MOBILE AND VEHICULAR EQUIPMENTUNPAVED ROADS - ENTRAINED DUSTWIND EROSION FROM UNPAVED OPERATIONAL AREAS AND ROA
EMISSION SOURCE / OPERATION / ACTIVITY -
DRILLINGBLASTINGEXPLOSIVESBULLDOZING, SCRAPING AND GRADING OF MATERIALLOADING OF MATERIAL(S) MINE / QUARRY / PIT AGGREGATE HANDLING, CRUSHING, AND SCREENING #1STOCKPILES - WIND EROSIONEXHAUST - STATIONARY AND PORTABLE EQUIPMENTEXHAUST - MOBILE AND VEHICULAR EQUIPMENTUNPAVED ROADS - ENTRAINED DUSTWIND EROSION FROM UNPAVED OPERATIONAL AREAS AND ROA
Baseline Emissions from Processing Plant Area
653,635 tons produced in BaselineCRITERIA EMISSIONS (tons per year)
Multiplier TSP PM10 PM2.5 CO NOx TOG ROG / VOC SOx - - - - - - - - - - - - - - - - - - - - - - - - - - -
1.82 0.185 0.090 0.028 - - - - -1.82 0.0072 0.0035 0.0011 - - - - -1.82 1.68 0.106 0.033 - - - - -1.82 34.7 2.25 0.69 - - - - -1.82 3.61 0.242 0.076 - - - - -1.82 2.66 0.167 0.052 - - - - -1.82 1.62 0.104 0.033 - - - - -1.82 1.60 0.104 0.033 - - - - -1.82 0.011 0.0010 0.0003 - - - - -1.82 19.5 5.47 1.71 - - - - -1.82 0.019 0.014 0.004 - - - - -1.82 0.48 0.080 0.025 - - - - -1.82 0.58 0.082 0.026 - - - - -1.82 0.16 0.025 0.008 - - - - -1.82 0.028 0.005 0.001 - - - - -1.00 1.06 0.53 0.21 - - - - -1.82 0.047 0.046 0.046 0.12 0.48 0.01 0.01 0.13
- - - - - - - - - - - - - - - - - -
1.82 30.84 9.10 1.40 - - - - -1.00 11.25 5.62 2.25 - - - - -
110.03 24.04 6.62 0.12 0.48 0.01 0.01 0.13
Baseline Emissions from Sentinel-Butterfield Quarry Area
624,191 tons excavated in BaselineCRITERIA EMISSIONS (tons per year)
Multiplier TSP PM10 PM2.5 CO NOx TOG ROG / VOC SOx1.39 0.31 0.25 0.25 - - - - -1.39 14.46 7.52 0.43 - - - - -1.39 - - - 4.09 1.04 - - -2.57 28.27 13.75 4.20 - - - - -1.39 0.39 0.19 0.06 - - - - -1.39 8.43 1.48 0.46 - - - - -1.00 0.67 0.34 0.13 - - - - -1.39 0.04 0.04 0.04 0.11 0.52 0.042 0.037 0.0017
- - - - - - - - - - - - - - - - - -
1.00 20.10 10.05 4.02 - - - - -72.66 33.61 9.59 4.2 1.6 0.042 0.037 0.0017
Baseline Emissions from White Knob Quarry Area
463,467 tons excavated in BaselineCRITERIA EMISSIONS (tons per year)
Multiplier TSP PM10 PM2.5 CO NOx TOG ROG / VOC SOx1.91 0.23 0.19 0.19 - - - - -1.91 5.41 2.81 0.16 - - - - -1.91 - - - 3.71 0.94 - - -1.91 20.99 10.21 3.12 - - - - -1.91 1.65 0.81 0.25 - - - - -1.91 11.83 3.83 1.20 - - - - -1.00 0.18 0.09 0.04 - - - - -
- - - - - - - - - - - - - - - - - - - - - - - - - - -
1.00 20.66 10.33 4.13 - - - - -60.96 28.27 9.08 3.71 0.94 - - -
Note: Sentinel-Butterfield bulldozing scaled based on White Knob Quarry activity level to reflect increased overburden with project.

Sentinel-Butterfield Quarry Expansion ProjectSan Bernardino County, California
Mining and Processing
om01_SBAlternativeAir_v1.4.xlsb 3 10/8/2013
EMISSION SOURCE / OPERATION / ACTIVITY -
DRILLINGBLASTINGEXPLOSIVESBULLDOZING, SCRAPING AND GRADING OF MATERIALLOADING OF MATERIAL(S) MINE / QUARRY / PIT Ball Mill #1Tertiary CrushingRoller Mill #1Roller Mill #2Roller Mill #3Roller Mill #4Surface Treating PlantRock Storage System/PlanOptical SorterCoarse Product Storage SystemSilo 81-70cBulk Loadout 82 System Bulk Loadout 83 System STOCKPILES - WIND EROSIONEXHAUST - STATIONARY AND PORTABLE EQUIPMENTEXHAUST - MOBILE AND VEHICULAR EQUIPMENTPAVED ROADS - ENTRAINED DUSTUNPAVED ROADS - ENTRAINED DUSTWIND EROSION FROM UNPAVED OPERATIONAL AREAS AND ROA
EMISSION SOURCE / OPERATION / ACTIVITY -
DRILLINGBLASTINGEXPLOSIVESBULLDOZING, SCRAPING AND GRADING OF MATERIALLOADING OF MATERIAL(S) MINE / QUARRY / PIT AGGREGATE HANDLING, CRUSHING, AND SCREENING #1STOCKPILES - WIND EROSIONEXHAUST - STATIONARY AND PORTABLE EQUIPMENTEXHAUST - MOBILE AND VEHICULAR EQUIPMENTUNPAVED ROADS - ENTRAINED DUSTWIND EROSION FROM UNPAVED OPERATIONAL AREAS AND ROA
EMISSION SOURCE / OPERATION / ACTIVITY -
DRILLINGBLASTINGEXPLOSIVESBULLDOZING, SCRAPING AND GRADING OF MATERIALLOADING OF MATERIAL(S) MINE / QUARRY / PIT AGGREGATE HANDLING, CRUSHING, AND SCREENING #1STOCKPILES - WIND EROSIONEXHAUST - STATIONARY AND PORTABLE EQUIPMENTEXHAUST - MOBILE AND VEHICULAR EQUIPMENTUNPAVED ROADS - ENTRAINED DUSTWIND EROSION FROM UNPAVED OPERATIONAL AREAS AND ROA
Project Plus Baseline Emissions from Processing Plant Area
680,000 tons produced with ProjectCRITERIA EMISSIONS (tons per year)
Multiplier TSP PM10 PM2.5 CO NOx TOG ROG / VOC SOx - - - - - - - - - - - - - - - - - - - - - - - - - - -
1.89 0.19 0.09 0.03 - - - - -1.89 0.01 0.00 0.00 - - - - -1.89 1.75 0.11 0.03 - - - - -1.89 36.05 2.34 0.72 - - - - -1.89 3.75 0.25 0.08 - - - - -1.89 2.77 0.17 0.05 - - - - -1.89 1.68 0.11 0.03 - - - - -1.89 1.67 0.11 0.03 - - - - -1.89 0.01 0.00 0.00 - - - - -1.89 20.33 5.69 1.78 - - - - -1.89 0.02 0.01 0.00 - - - - -1.89 0.50 0.08 0.03 - - - - -1.89 0.60 0.09 0.03 - - - - -1.89 0.16 0.03 0.01 - - - - -1.89 0.03 0.00 0.00 - - - - -1.00 1.06 0.53 0.21 - - - - -1.89 0.05 0.05 0.05 0.12 0.50 0.01 0.0054 0.13
- - - - - - - - - - - - - - - - - -
1.89 32.08 9.47 1.45 - - - - -1.00 11.25 5.62 2.25 - - - - -
113.97 24.77 6.79 0.12 0.50 0.01 0.01 0.13
Project Plus Baseline Emissions from Sentinel-Butterfield Quarry Area
1,145,375 tons excavated with ProjectCRITERIA EMISSIONS (tons per year)
Multiplier TSP PM10 PM2.5 CO NOx TOG ROG / VOC SOx2.55 0.57 0.46 0.46 - - - - -2.55 26.53 13.80 0.80 - - - - -2.55 - - - 7.51 1.91 - - -4.71 51.87 25.23 7.71 - - - - -2.55 0.71 0.34 0.11 - - - - -2.55 15.47 2.71 0.84 - - - - -1.00 0.67 0.34 0.13 - - - - -2.55 0.07 0.07 0.07 0.21 0.96 0.08 0.067 0.0032
- - - - - - - - - - - - - - - - - -
1.00 20.10 10.05 4.02 - - - - -116.00 53.00 14.13 7.72 2.86
Project Plus Baseline Emissions from White Knob Quarry Area
- tons excavated with ProjectCRITERIA EMISSIONS (tons per year)
Multiplier TSP PM10 PM2.5 CO NOx TOG ROG / VOC SOx - - - - - - - - - - - - - - - - - - - - - - - - - - - - - - - - - - - - - - - - - - - - - - - - - - - - - - - - - - - - - - - - - - - - - - - - - - - - - - - - - - - - - - - - - - - - - - - - - - -
- - - - - - - -
Note: Sentinel-Butterfield bulldozing scaled based on White Knob Quarry activity level to reflect increased overburden with project.

Sentinel-Butterfield Quarry Expansion ProjectSan Bernardino County, California
Mining and Processing
om01_SBAlternativeAir_v1.4.xlsb 4 10/8/2013
EMISSION SOURCE / OPERATION / ACTIVITY -
DRILLINGBLASTINGEXPLOSIVESBULLDOZING, SCRAPING AND GRADING OF MATERIALLOADING OF MATERIAL(S) MINE / QUARRY / PIT Ball Mill #1Tertiary CrushingRoller Mill #1Roller Mill #2Roller Mill #3Roller Mill #4Surface Treating PlantRock Storage System/PlanOptical SorterCoarse Product Storage SystemSilo 81-70cBulk Loadout 82 System Bulk Loadout 83 System STOCKPILES - WIND EROSIONEXHAUST - STATIONARY AND PORTABLE EQUIPMENTEXHAUST - MOBILE AND VEHICULAR EQUIPMENTPAVED ROADS - ENTRAINED DUSTUNPAVED ROADS - ENTRAINED DUSTWIND EROSION FROM UNPAVED OPERATIONAL AREAS AND ROA
EMISSION SOURCE / OPERATION / ACTIVITY -
DRILLINGBLASTINGEXPLOSIVESBULLDOZING, SCRAPING AND GRADING OF MATERIALLOADING OF MATERIAL(S) MINE / QUARRY / PIT AGGREGATE HANDLING, CRUSHING, AND SCREENING #1STOCKPILES - WIND EROSIONEXHAUST - STATIONARY AND PORTABLE EQUIPMENTEXHAUST - MOBILE AND VEHICULAR EQUIPMENTUNPAVED ROADS - ENTRAINED DUSTWIND EROSION FROM UNPAVED OPERATIONAL AREAS AND ROA
EMISSION SOURCE / OPERATION / ACTIVITY -
DRILLINGBLASTINGEXPLOSIVESBULLDOZING, SCRAPING AND GRADING OF MATERIALLOADING OF MATERIAL(S) MINE / QUARRY / PIT AGGREGATE HANDLING, CRUSHING, AND SCREENING #1STOCKPILES - WIND EROSIONEXHAUST - STATIONARY AND PORTABLE EQUIPMENTEXHAUST - MOBILE AND VEHICULAR EQUIPMENTUNPAVED ROADS - ENTRAINED DUSTWIND EROSION FROM UNPAVED OPERATIONAL AREAS AND ROA
Project Emissions from Processing Plant Area
Project Emissions 26,365 tons change from baselineCRITERIA EMISSIONS (tons per year)TSP PM10 PM2.5 CO NOx TOG ROG / VOC SOx
- - - - - - - - - - - - - - - - - - - - - - - -
0.01 0.00 0.00 - - - - -0.00 0.00 0.00 - - - - -0.07 0.00 0.00 - - - - -1.40 0.09 0.03 - - - - -0.15 0.01 0.00 - - - - -0.11 0.01 0.00 - - - - -0.07 0.00 0.00 - - - - -0.06 0.00 0.00 - - - - -0.00 0.00 0.00 - - - - -0.79 0.22 0.07 - - - - -0.00 0.00 0.00 - - - - -0.02 0.00 0.00 - - - - -0.02 0.00 0.00 - - - - -0.01 0.00 0.00 - - - - -0.00 0.00 0.00 - - - - -
- - - - - - - -0.00 0.00 0.00 0.00 0.02 0.00 0.00 0.01
- - - - - - - - - - - - - - - -
1.24 0.37 0.06 - - - - - - - - - - - - -
3.94 0.72 0.17 0.00 0.02 0.00 0.00 0.01
Project Emissions from Sentinel-Butterfield Quarry Area
Project Emissions 521,184 tons change from baselineCRITERIA EMISSIONS (tons per year)TSP PM10 PM2.5 CO NOx TOG ROG / VOC SOx
0.26 0.21 0.21 - - - - -12.07 6.28 0.36 - - - - -
- - - 3.42 0.87 - - -23.60 11.48 3.51 - - - - -
0.32 0.16 0.05 - - - - -7.04 1.23 0.38 - - - - -
- - - - - - - -0.03 0.03 0.03 0.09 0.43 0.03 0.03 0.00
- - - - - - - - - - - - - - - - - - - - - - - -
43.33 19.39 4.54 3.51 1.30 -0.04 -0.04 -0.00
Project Emissions from White Knob Quarry Area
Project Emissions -463,467 tons change from baselineCRITERIA EMISSIONS (tons per year)TSP PM10 PM2.5 CO NOx TOG ROG / VOC SOx
-0.23 -0.19 -0.19 - - - - - -5.41 -2.81 -0.16 - - - - -
- - - -3.71 -0.94 - - - -20.99 -10.21 -3.12 - - - - -
-1.65 -0.81 -0.25 - - - - - -11.83 -3.83 -1.20 - - - - -
-0.18 -0.09 -0.04 - - - - - - - - - - - - - - - - - - - - - - - - - - - - -
-20.66 -10.33 -4.13 - - - - - -60.96 -28.27 -9.08 -3.71 -0.94 - - -

Sentinel-Butterfield Quarry Expansion ProjectSan Bernardino County, California
NonRoad Engines
om01_SBAlternativeAir_v1.4.xlsb 4 10/8/2013
BaselineVOL1 WK Crusher VOL2 WK Pit VOL3 WR Pit
Per Year Per Day Per Hour Per Year Per Day Per Hour Per Year Per Day Per Hourhp-hr 1,002,598.38 10,025.98 1,671.00 1,320,206.27 13,202.06 2,200.34 - - -HC (lb) 640.25 6.40 1.07 554.35 5.54 0.92 - - -NOx (lb) 9,898.01 98.98 16.50 8,146.06 81.46 13.58 - - -PM (lb) 327.63 3.28 0.55 358.76 3.59 0.60 - - -CO (lb) 14,200.65 142.01 23.67 5,306.16 53.06 8.84 - - -SOx (lb) 0.31 0.00 0.00 0.29 0.00 0.00 - - -CO2 (tons) 583.94 5.84 0.97 768.93 7.69 1.28 - - -
ProjectVOL1 WK Crusher VOL2 WK Pit VOL3 WR Pit
Per Year Per Day Per Hour Per Year Per Day Per Hour Per Year Per Day Per Hourhp-hr - - - - - - - - -HC (lb) - - - - - - - - -NOx (lb) - - - - - - - - -PM (lb) - - - - - - - - -CO (lb) - - - - - - - - -SOx (lb) - - - - - - - - -CO2 (tons) - - - - - - - - -
IncrementVOL1 WK Crusher VOL2 WK Pit VOL3 WR Pit
Per Year Per Day Per Hour Per Year Per Day Per Hour Per Year Per Day Per Hourhp-hr -1,002,598.38 -10,025.98 -1,671.00 -1,320,206.27 -13,202.06 -2,200.34 - - -HC (lb) -640.25 -6.40 -1.07 -554.35 -5.54 -0.92 - - -NOx (lb) -9,898.01 -98.98 -16.50 -8,146.06 -81.46 -13.58 - - -PM (lb) -327.63 -3.28 -0.55 -358.76 -3.59 -0.60 - - -CO (lb) -14,200.65 -142.01 -23.67 -5,306.16 -53.06 -8.84 - - -SOx (lb) -0.31 -0.00 -0.00 -0.29 -0.00 -0.00 - - -CO2 (tons) -583.94 -5.84 -0.97 -768.93 -7.69 -1.28 - - -

Sentinel-Butterfield Quarry Expansion ProjectSan Bernardino County, California
NonRoad Engines
om01_SBAlternativeAir_v1.4.xlsb 4 10/8/2013
Baseline
hp-hrHC (lb)NOx (lb)PM (lb)CO (lb)SOx (lb)CO2 (tons)
Project
hp-hrHC (lb)NOx (lb)PM (lb)CO (lb)SOx (lb)CO2 (tons)
Increment
hp-hrHC (lb)NOx (lb)PM (lb)CO (lb)SOx (lb)CO2 (tons)
VOL4 OB1 VOL5 OB2 VOL6 Plant VOL7 BF PitPer Year Per Day Per Hour Per Year Per Day Per Hour Per Year Per Day Per Hour Per Year Per Day Per Hour38,829.60 388.30 64.72 38,829.60 388.30 64.72 1,050,976.27 10,509.76 1,751.63 271,610.60 2,716.11 452.68
16.30 0.16 0.03 16.30 0.16 0.03 578.23 5.78 0.96 114.05 1.14 0.19239.59 2.40 0.40 239.59 2.40 0.40 4,316.04 43.16 7.19 1,675.92 16.76 2.79
10.55 0.11 0.02 10.55 0.11 0.02 396.46 3.96 0.66 73.81 0.74 0.12156.06 1.56 0.26 156.06 1.56 0.26 2,764.55 27.65 4.61 1,091.65 10.92 1.82
0.01 0.00 0.00 0.01 0.00 0.00 0.14 0.00 0.00 0.06 0.00 0.0022.62 0.23 0.04 22.62 0.23 0.04 612.12 6.12 1.02 158.19 1.58 0.26
VOL4 OB1 VOL5 OB2 VOL6 Plant VOL7 BF PitPer Year Per Day Per Hour Per Year Per Day Per Hour Per Year Per Day Per Hour Per Year Per Day Per Hour
- - - - - - 1,093,368.41 10,933.68 1,822.28 417,091.86 4,170.92 695.15 - - - - - - 601.55 6.02 1.00 187.97 1.88 0.31 - - - - - - 4,490.13 44.90 7.48 2,773.07 27.73 4.62 - - - - - - 412.45 4.12 0.69 127.19 1.27 0.21 - - - - - - 2,876.06 28.76 4.79 1,607.40 16.07 2.68 - - - - - - 0.15 0.00 0.00 0.09 0.00 0.00 - - - - - - 636.81 6.37 1.06 242.93 2.43 0.40
VOL4 OB1 VOL5 OB2 VOL6 Plant VOL7 BF PitPer Year Per Day Per Hour Per Year Per Day Per Hour Per Year Per Day Per Hour Per Year Per Day Per Hour
-38,829.60 -388.30 -64.72 -38,829.60 -388.30 -64.72 42,392.14 423.92 70.65 145,481.26 1,454.81 242.47 -16.30 -0.16 -0.03 -16.30 -0.16 -0.03 23.32 0.23 0.04 73.92 0.74 0.12
-239.59 -2.40 -0.40 -239.59 -2.40 -0.40 174.09 1.74 0.29 1,097.15 10.97 1.83 -10.55 -0.11 -0.02 -10.55 -0.11 -0.02 15.99 0.16 0.03 53.39 0.53 0.09
-156.06 -1.56 -0.26 -156.06 -1.56 -0.26 111.51 1.12 0.19 515.74 5.16 0.86 -0.01 -0.00 -0.00 -0.01 -0.00 -0.00 0.01 0.00 0.00 0.03 0.00 0.00
-22.62 -0.23 -0.04 -22.62 -0.23 -0.04 24.69 0.25 0.04 84.73 0.85 0.14

Sentinel-Butterfield Quarry Expansion ProjectSan Bernardino County, California
NonRoad Engines
om01_SBAlternativeAir_v1.4.xlsb 4 10/8/2013
Baseline
hp-hrHC (lb)NOx (lb)PM (lb)CO (lb)SOx (lb)CO2 (tons)
Project
hp-hrHC (lb)NOx (lb)PM (lb)CO (lb)SOx (lb)CO2 (tons)
Increment
hp-hrHC (lb)NOx (lb)PM (lb)CO (lb)SOx (lb)CO2 (tons)
VOL8 B5 VOL9 SB Crusher VOL10 Sen Pit TotalPer Year Per Day Per Hour Per Year Per Day Per Hour Per Year Per Day Per Hour Per Year Per Day Per Hour104,590.39 1,045.90 174.32 209,180.78 2,091.81 348.63 1,506,426.05 15,064.26 2,510.71 5,543,247.93 55,432.48 9,238.75
43.92 0.44 0.07 87.83 0.88 0.15 632.55 6.33 1.05 2,683.79 26.84 4.47645.35 6.45 1.08 1,290.71 12.91 2.15 9,295.09 92.95 15.49 35,746.35 357.46 59.58
28.42 0.28 0.05 56.84 0.57 0.09 409.36 4.09 0.68 1,672.38 16.72 2.79420.37 4.20 0.70 840.74 8.41 1.40 6,054.61 60.55 10.09 30,990.85 309.91 51.65
0.02 0.00 0.00 0.05 0.00 0.00 0.33 0.00 0.00 1.22 0.01 0.0060.92 0.61 0.10 121.83 1.22 0.20 877.39 8.77 1.46 3,228.55 32.29 5.38
VOL8 B5 VOL9 SB Crusher VOL10 Sen Pit TotalPer Year Per Day Per Hour Per Year Per Day Per Hour Per Year Per Day Per Hour Per Year Per Day Per Hour191,920.67 1,919.21 319.87 1,989,179.67 19,891.80 3,315.30 2,845,559.54 28,455.60 4,742.60 6,537,120.15 65,371.20 10,895.20
80.59 0.81 0.13 321.71 3.22 0.54 1,194.85 11.95 1.99 2,386.67 23.87 3.981,184.21 11.84 1.97 6,454.98 64.55 10.76 17,557.93 175.58 29.26 32,460.32 324.60 54.10
52.15 0.52 0.09 243.62 2.44 0.41 773.26 7.73 1.29 1,608.67 16.09 2.68771.37 7.71 1.29 6,373.72 63.74 10.62 11,436.84 114.37 19.06 23,065.38 230.65 38.44
0.04 0.00 0.00 0.60 0.01 0.00 0.63 0.01 0.00 1.51 0.02 0.00111.78 1.12 0.19 714.44 7.14 1.19 1,657.34 16.57 2.76 3,363.29 33.63 5.61
VOL8 B5 VOL9 SB Crusher VOL10 Sen PitPer Year Per Day Per Hour Per Year Per Day Per Hour Per Year Per Day Per Hour Per Year Per Day Per Hour87,330.28 873.30 145.55 1,779,998.89 17,799.99 2,966.66 1,339,133.49 13,391.33 2,231.89 993,872.22 9,938.72 1,656.45
36.67 0.37 0.06 233.88 2.34 0.39 562.30 5.62 0.94 -297.12 -2.97 -0.50538.85 5.39 0.90 5,164.27 51.64 8.61 8,262.84 82.63 13.77 -3,286.03 -32.86 -5.48
23.73 0.24 0.04 186.77 1.87 0.31 363.90 3.64 0.61 -63.71 -0.64 -0.11351.00 3.51 0.58 5,532.98 55.33 9.22 5,382.23 53.82 8.97 -7,925.47 -79.25 -13.21
0.02 0.00 0.00 0.55 0.01 0.00 0.30 0.00 0.00 0.29 0.00 0.0050.86 0.51 0.08 592.61 5.93 0.99 779.95 7.80 1.30 134.74 1.35 0.22
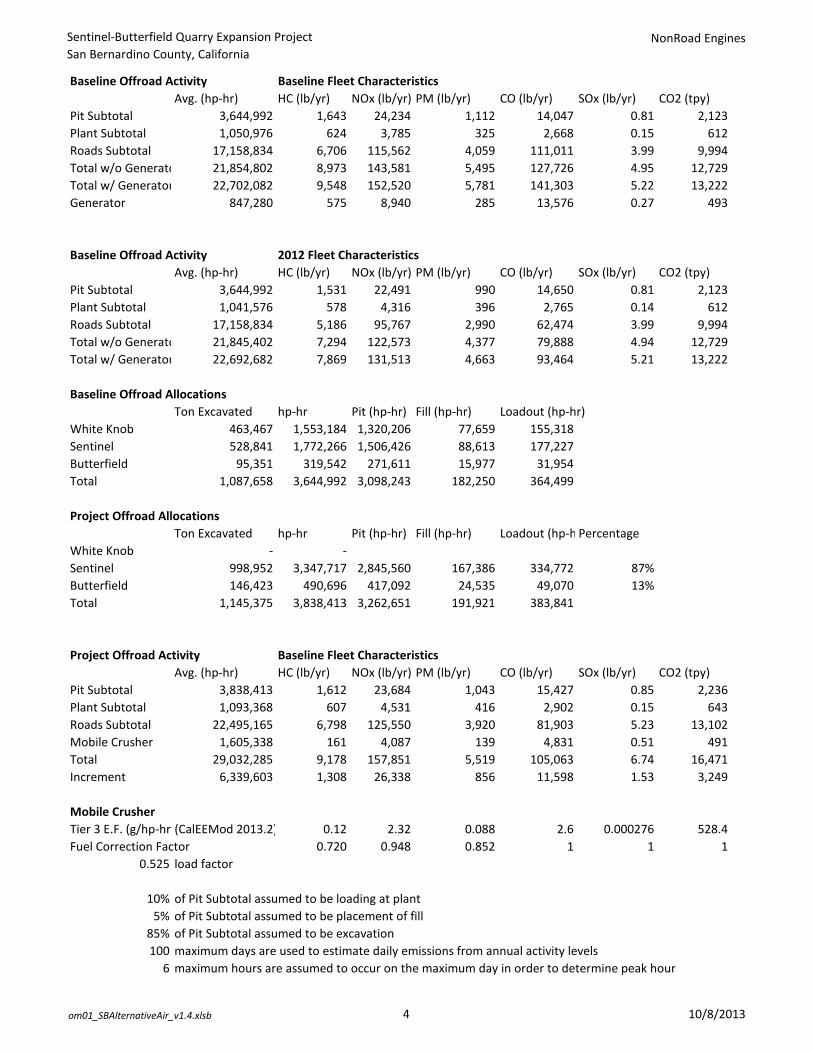
Sentinel-Butterfield Quarry Expansion ProjectSan Bernardino County, California
NonRoad Engines
om01_SBAlternativeAir_v1.4.xlsb 4 10/8/2013
Baseline Offroad Activity Baseline Fleet CharacteristicsAvg. (hp-hr) HC (lb/yr) NOx (lb/yr) PM (lb/yr) CO (lb/yr) SOx (lb/yr) CO2 (tpy)
Pit Subtotal 3,644,992 1,643 24,234 1,112 14,047 0.81 2,123Plant Subtotal 1,050,976 624 3,785 325 2,668 0.15 612Roads Subtotal 17,158,834 6,706 115,562 4,059 111,011 3.99 9,994Total w/o Generato 21,854,802 8,973 143,581 5,495 127,726 4.95 12,729Total w/ Generator 22,702,082 9,548 152,520 5,781 141,303 5.22 13,222Generator 847,280 575 8,940 285 13,576 0.27 493
Baseline Offroad Activity 2012 Fleet CharacteristicsAvg. (hp-hr) HC (lb/yr) NOx (lb/yr) PM (lb/yr) CO (lb/yr) SOx (lb/yr) CO2 (tpy)
Pit Subtotal 3,644,992 1,531 22,491 990 14,650 0.81 2,123Plant Subtotal 1,041,576 578 4,316 396 2,765 0.14 612Roads Subtotal 17,158,834 5,186 95,767 2,990 62,474 3.99 9,994Total w/o Generato 21,845,402 7,294 122,573 4,377 79,888 4.94 12,729Total w/ Generator 22,692,682 7,869 131,513 4,663 93,464 5.21 13,222
Baseline Offroad AllocationsTon Excavated hp-hr Pit (hp-hr) Fill (hp-hr) Loadout (hp-hr)
White Knob 463,467 1,553,184 1,320,206 77,659 155,318Sentinel 528,841 1,772,266 1,506,426 88,613 177,227Butterfield 95,351 319,542 271,611 15,977 31,954Total 1,087,658 3,644,992 3,098,243 182,250 364,499
Project Offroad AllocationsTon Excavated hp-hr Pit (hp-hr) Fill (hp-hr) Loadout (hp-h Percentage
White Knob - -Sentinel 998,952 3,347,717 2,845,560 167,386 334,772 87%Butterfield 146,423 490,696 417,092 24,535 49,070 13%Total 1,145,375 3,838,413 3,262,651 191,921 383,841
Project Offroad Activity Baseline Fleet CharacteristicsAvg. (hp-hr) HC (lb/yr) NOx (lb/yr) PM (lb/yr) CO (lb/yr) SOx (lb/yr) CO2 (tpy)
Pit Subtotal 3,838,413 1,612 23,684 1,043 15,427 0.85 2,236Plant Subtotal 1,093,368 607 4,531 416 2,902 0.15 643Roads Subtotal 22,495,165 6,798 125,550 3,920 81,903 5.23 13,102Mobile Crusher 1,605,338 161 4,087 139 4,831 0.51 491Total 29,032,285 9,178 157,851 5,519 105,063 6.74 16,471Increment 6,339,603 1,308 26,338 856 11,598 1.53 3,249
Mobile CrusherTier 3 E.F. (g/hp-hr (CalEEMod 2013.2) 0.12 2.32 0.088 2.6 0.000276 528.4Fuel Correction Factor 0.720 0.948 0.852 1 1 1
0.525 load factor
10% of Pit Subtotal assumed to be loading at plant5% of Pit Subtotal assumed to be placement of fill
85% of Pit Subtotal assumed to be excavation100 maximum days are used to estimate daily emissions from annual activity levels
6 maximum hours are assumed to occur on the maximum day in order to determine peak hour

Sentinel-Butterfield Quarry Expansion ProjectSan Bernardino County, California
Data for Road Activity
om01_SBAlternativeAir_v1.4.xlsb 1 10/8/2013
Vehicle Miles Traveled per Year
Locaiton Tons/Year Tons/Day Tons/Hour Trips/YearTrips/Da
y Trips/Hour Links
Traveled
A - Butterfield
PitB - Waste
PileC - West
RoadD - Sentinel
Crusher
E - Senteniel
PitF - Crushed
Pile
G - Sentinel/Butterfield to Plant
Ore to Primary Crusher 4,065 1,800 1,460 - 6,045 - 38,000 Sentinel 535,438 4,361 523 14,278 116 14 E - - - - 16,347 - - Butterfield 3 78,483 639 77 2,093 17 2 A, C 1,611 579 - - - - White Knob 183,379 4,000 400 4,890 107 11 J - - - - - - - Sentinel - Butterfield 613,921 5,000 600 16,371 133 16 - TOTAL 797,300 9,000 1,000 21,261 240 27 - Ore Hauled to Plant - Sentinel 456,664 3,719.24 446.31 12,178 99 12 G, I - - - - - - 87,643 Butterfield 3 66,936 545.15 65.42 1,785 15 2 G, I - - - - - - 12,846 White Knob 156,400 3,412 341 4,171 91 9 H, L, I - - - - - - - Sentinel - Butterfield 523,600 4,264 512 13,963 114 14 - TOTAL 680,000 7,676 853 18,133 205 23 - Waste Crusher FinesSentinel 78,775 642 77 2,101 17 2 B, C - 716 581 - - - - Butterfield 3 11,546 94 11 308 3 0 B, C - 105 85 - - - - White Knob 26,979 588 59 719 16 2 L - - - - - - - Sentinel - Butterfield 90,321 736 88 2,409 20 2 - TOTAL 117,300 1,324 147 3,128 35 4 - Waste Rock Not ProcessedSentinel 463,514 3,775 453 12,360 101 12 B, C, E - 4,214 3,418 - 14,151 - - Butterfield 3 67,940 553 66 1,812 15 2 A, B 1,395 618 - - - - - White Knob 158,746 3,463 346 4,233 92 9 J, L - - - - - - - Sentinel - Butterfield 531,454 4,328 519 14,172 115 14 - TOTAL 690,200 7,791 866 18,405 208 23 -
1,487,500 tons, total excavated A B C D E F GTotal VMT: not used on this page. 3,006 5,653 4,663 - 30,498 - 100,489 % of VMT: not used on this page. 2% 3% 3% 0% 17% 0% 57%
Alternative Baseline % of Total Baseline % of BS76.1% 67% 50% sentinel 87.2%23.9% 10% 7% butterfield 12.8%
23% 42% white knob77% 58% butterfield and sentinel
Activity Data

Sentinel-Butterfield Quarry Expansion ProjectSan Bernardino County, California
Data for Road Activity
om01_SBAlternativeAir_v1.4.xlsb 2 10/8/2013
Locaiton Tons/Year Tons/Day Tons/Hour
Ore to Primary CrusherSentinel 535,438 4,361 523 Butterfield 3 78,483 639 77 White Knob 183,379 4,000 400 Sentinel - Butterfield 613,921 5,000 600 TOTAL 797,300 9,000 1,000 Ore Hauled to PlantSentinel 456,664 3,719.24 446.31 Butterfield 3 66,936 545.15 65.42 White Knob 156,400 3,412 341 Sentinel - Butterfield 523,600 4,264 512 TOTAL 680,000 7,676 853 Waste Crusher FinesSentinel 78,775 642 77 Butterfield 3 11,546 94 11 White Knob 26,979 588 59 Sentinel - Butterfield 90,321 736 88 TOTAL 117,300 1,324 147 Waste Rock Not ProcessedSentinel 463,514 3,775 453 Butterfield 3 67,940 553 66 White Knob 158,746 3,463 346 Sentinel - Butterfield 531,454 4,328 519 TOTAL 690,200 7,791 866
1,487,500 tons, total excavatedTotal VMT: not used on this page.% of VMT: not used on this page.
Alternative Baseline % o76.1% 67% 50%23.9% 10% 7%
23% 42%77% 58%
Activity Data Vehicle Miles Traveled per Year
H - White Ridge to
PlantI - Plant
FeedJ - White Knob Pit
K - On-Road
Trucks
L - Crusher to White Ridge
M - White Ridge Pit
24,260 365 3,725 6,186 2,300 1,300 - - - - - - - - - - - - - - 3,450 - - -
- - - - - - - -
- - - - 842 - - - - - 123 - - - -
19,163 288 - - 1,817 - - - - - 21,244.85 - - - - -
- - - - - - - - - - - - - - - - 313 -
- - - - - - - - -
- - - - - - - - - - - - - - 2,987 - 1,844 -
- - -
H I J K L M19,163 1,254 6,436 21,245 3,974 -
11% 1% 4% 2% 0%100%

Sentinel-Butterfield Quarry Expansion ProjectSan Bernardino County, California
Data for Road Activity
om01_SBAlternativeAir_v1.4.xlsb 3 10/8/2013
Locaiton Tons/Year Tons/Day Tons/Hour
Ore to Primary CrusherSentinel 535,438 4,361 523 Butterfield 3 78,483 639 77 White Knob 183,379 4,000 400 Sentinel - Butterfield 613,921 5,000 600 TOTAL 797,300 9,000 1,000 Ore Hauled to PlantSentinel 456,664 3,719.24 446.31 Butterfield 3 66,936 545.15 65.42 White Knob 156,400 3,412 341 Sentinel - Butterfield 523,600 4,264 512 TOTAL 680,000 7,676 853 Waste Crusher FinesSentinel 78,775 642 77 Butterfield 3 11,546 94 11 White Knob 26,979 588 59 Sentinel - Butterfield 90,321 736 88 TOTAL 117,300 1,324 147 Waste Rock Not ProcessedSentinel 463,514 3,775 453 Butterfield 3 67,940 553 66 White Knob 158,746 3,463 346 Sentinel - Butterfield 531,454 4,328 519 TOTAL 690,200 7,791 866
1,487,500 tons, total excavatedTotal VMT: not used on this page.% of VMT: not used on this page.
Alternative Baseline % o76.1% 67% 50%23.9% 10% 7%
23% 42%77% 58%
Activity Data Vehicle Miles Traveled per Day
A - Butterfiel
d Pit
B - Waste
PileC - West
Road
D - Butterfie
ld Crusher
E - Senteniel
Pit
F - Crushed
Pile
G - Sentinel/Butterfie
ld to Plant
4,065 1,800 1,460 - 6,045 - 38,000 - - - - 133.14 - -
13.12 4.71 - - - - - - - - - - -
- - - - - - 713.79 - - - - - - 104.63 - - - - - - -
- 5.83 4.73 - - - - - 0.85 0.69 - - - - - - - - - - -
- 34.32 27.84 - 115.25 - - 11.36 5.03 - - - - -
- - - - - - -
A B C D E F G24 46 38 - 248 - 818 1% 3% 2% 0% 14% 0% 45%
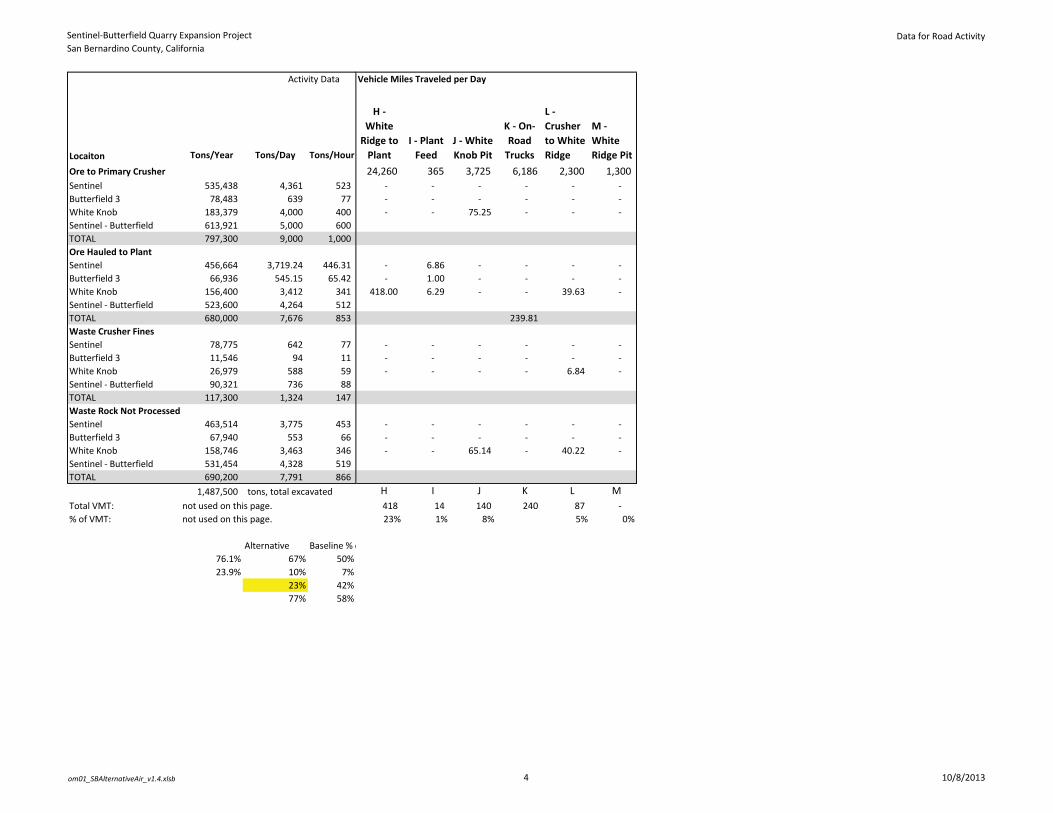
Sentinel-Butterfield Quarry Expansion ProjectSan Bernardino County, California
Data for Road Activity
om01_SBAlternativeAir_v1.4.xlsb 4 10/8/2013
Locaiton Tons/Year Tons/Day Tons/Hour
Ore to Primary CrusherSentinel 535,438 4,361 523 Butterfield 3 78,483 639 77 White Knob 183,379 4,000 400 Sentinel - Butterfield 613,921 5,000 600 TOTAL 797,300 9,000 1,000 Ore Hauled to PlantSentinel 456,664 3,719.24 446.31 Butterfield 3 66,936 545.15 65.42 White Knob 156,400 3,412 341 Sentinel - Butterfield 523,600 4,264 512 TOTAL 680,000 7,676 853 Waste Crusher FinesSentinel 78,775 642 77 Butterfield 3 11,546 94 11 White Knob 26,979 588 59 Sentinel - Butterfield 90,321 736 88 TOTAL 117,300 1,324 147 Waste Rock Not ProcessedSentinel 463,514 3,775 453 Butterfield 3 67,940 553 66 White Knob 158,746 3,463 346 Sentinel - Butterfield 531,454 4,328 519 TOTAL 690,200 7,791 866
1,487,500 tons, total excavatedTotal VMT: not used on this page.% of VMT: not used on this page.
Alternative Baseline % o76.1% 67% 50%23.9% 10% 7%
23% 42%77% 58%
Activity Data Vehicle Miles Traveled per Day
H - White
Ridge to Plant
I - Plant Feed
J - White Knob Pit
K - On-Road
Trucks
L - Crusher to White Ridge
M - White Ridge Pit
24,260 365 3,725 6,186 2,300 1,300 - - - - - - - - - - - - - - 75.25 - - -
- 6.86 - - - - - 1.00 - - - -
418.00 6.29 - - 39.63 -
239.81
- - - - - - - - - - - - - - - - 6.84 -
- - - - - - - - - - - - - - 65.14 - 40.22 -
H I J K L M418 14 140 240 87 - 23% 1% 8% 5% 0%
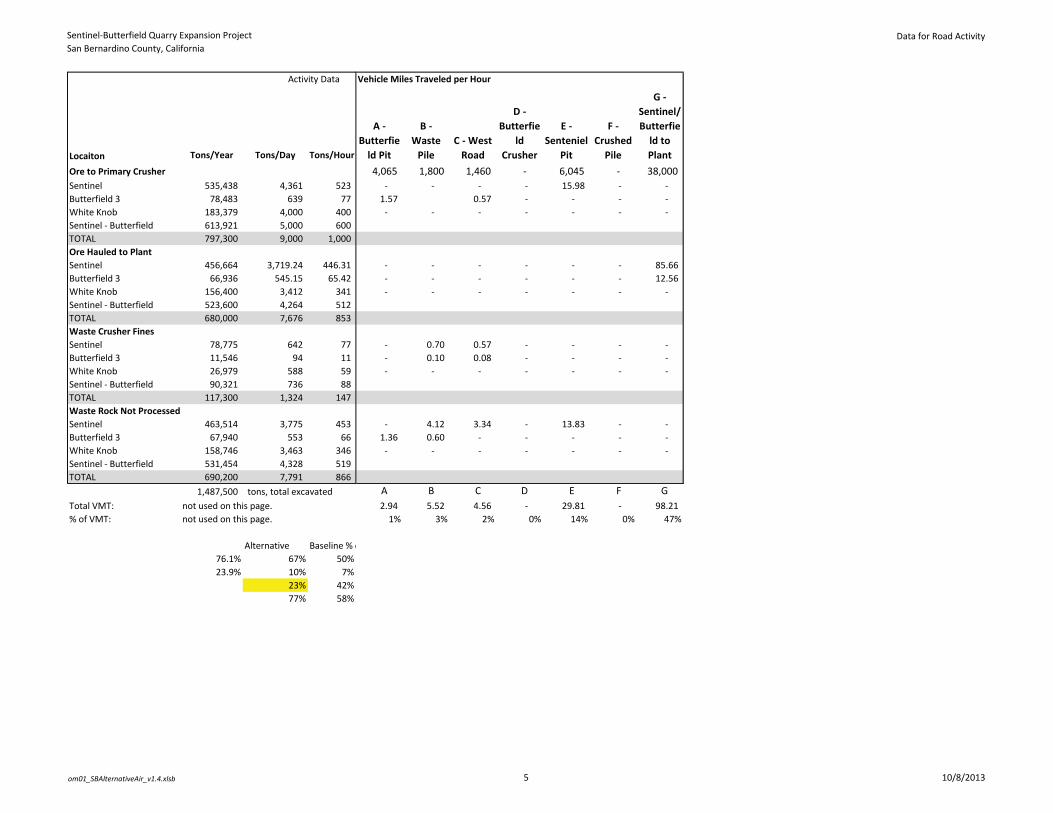
Sentinel-Butterfield Quarry Expansion ProjectSan Bernardino County, California
Data for Road Activity
om01_SBAlternativeAir_v1.4.xlsb 5 10/8/2013
Locaiton Tons/Year Tons/Day Tons/Hour
Ore to Primary CrusherSentinel 535,438 4,361 523 Butterfield 3 78,483 639 77 White Knob 183,379 4,000 400 Sentinel - Butterfield 613,921 5,000 600 TOTAL 797,300 9,000 1,000 Ore Hauled to PlantSentinel 456,664 3,719.24 446.31 Butterfield 3 66,936 545.15 65.42 White Knob 156,400 3,412 341 Sentinel - Butterfield 523,600 4,264 512 TOTAL 680,000 7,676 853 Waste Crusher FinesSentinel 78,775 642 77 Butterfield 3 11,546 94 11 White Knob 26,979 588 59 Sentinel - Butterfield 90,321 736 88 TOTAL 117,300 1,324 147 Waste Rock Not ProcessedSentinel 463,514 3,775 453 Butterfield 3 67,940 553 66 White Knob 158,746 3,463 346 Sentinel - Butterfield 531,454 4,328 519 TOTAL 690,200 7,791 866
1,487,500 tons, total excavatedTotal VMT: not used on this page.% of VMT: not used on this page.
Alternative Baseline % o76.1% 67% 50%23.9% 10% 7%
23% 42%77% 58%
Activity Data Vehicle Miles Traveled per Hour
A - Butterfie
ld Pit
B - Waste
PileC - West
Road
D - Butterfie
ld Crusher
E - Senteniel
Pit
F - Crushed
Pile
G - Sentinel/Butterfie
ld to Plant
4,065 1,800 1,460 - 6,045 - 38,000 - - - - 15.98 - -
1.57 0.57 - - - - - - - - - - -
- - - - - - 85.66 - - - - - - 12.56 - - - - - - -
- 0.70 0.57 - - - - - 0.10 0.08 - - - - - - - - - - -
- 4.12 3.34 - 13.83 - - 1.36 0.60 - - - - -
- - - - - - -
A B C D E F G 2.94 5.52 4.56 - 29.81 - 98.21
1% 3% 2% 0% 14% 0% 47%
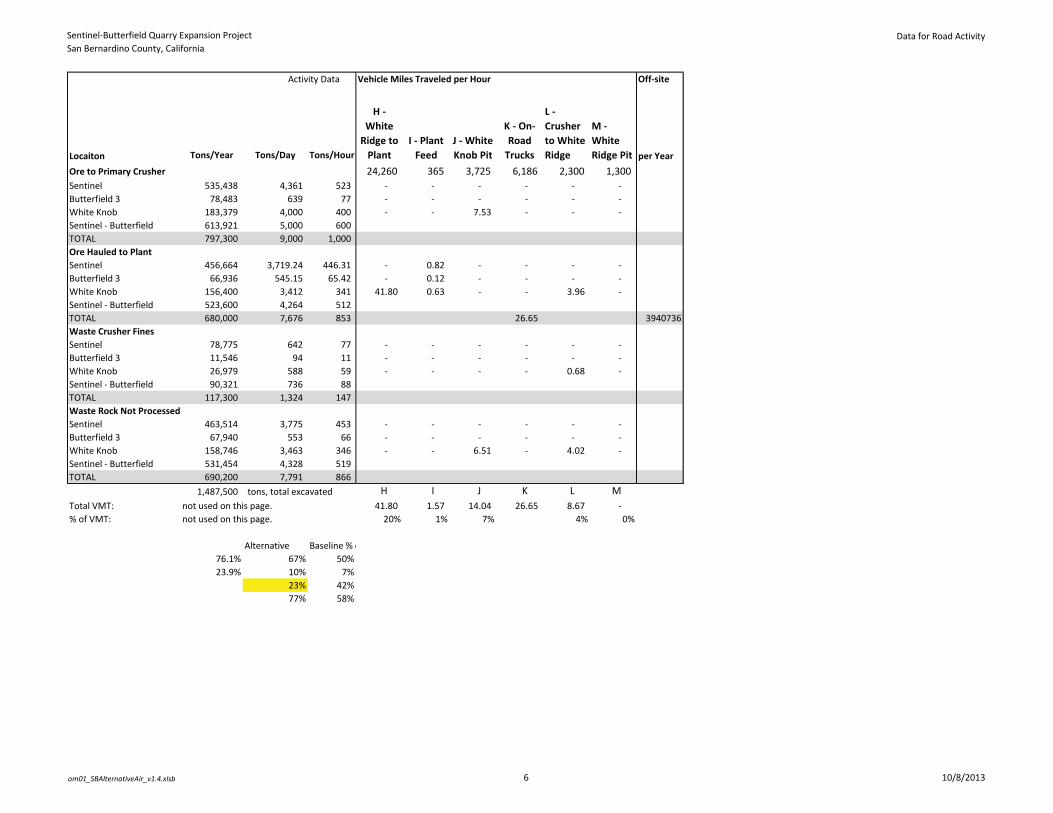
Sentinel-Butterfield Quarry Expansion ProjectSan Bernardino County, California
Data for Road Activity
om01_SBAlternativeAir_v1.4.xlsb 6 10/8/2013
Locaiton Tons/Year Tons/Day Tons/Hour
Ore to Primary CrusherSentinel 535,438 4,361 523 Butterfield 3 78,483 639 77 White Knob 183,379 4,000 400 Sentinel - Butterfield 613,921 5,000 600 TOTAL 797,300 9,000 1,000 Ore Hauled to PlantSentinel 456,664 3,719.24 446.31 Butterfield 3 66,936 545.15 65.42 White Knob 156,400 3,412 341 Sentinel - Butterfield 523,600 4,264 512 TOTAL 680,000 7,676 853 Waste Crusher FinesSentinel 78,775 642 77 Butterfield 3 11,546 94 11 White Knob 26,979 588 59 Sentinel - Butterfield 90,321 736 88 TOTAL 117,300 1,324 147 Waste Rock Not ProcessedSentinel 463,514 3,775 453 Butterfield 3 67,940 553 66 White Knob 158,746 3,463 346 Sentinel - Butterfield 531,454 4,328 519 TOTAL 690,200 7,791 866
1,487,500 tons, total excavatedTotal VMT: not used on this page.% of VMT: not used on this page.
Alternative Baseline % o76.1% 67% 50%23.9% 10% 7%
23% 42%77% 58%
Activity Data Vehicle Miles Traveled per Hour Off-site
H - White
Ridge to Plant
I - Plant Feed
J - White Knob Pit
K - On-Road
Trucks
L - Crusher to White Ridge
M - White Ridge Pit per Year
24,260 365 3,725 6,186 2,300 1,300 - - - - - - - - - - - - - - 7.53 - - -
- 0.82 - - - - - 0.12 - - - -
41.80 0.63 - - 3.96 -
26.65 3940736
- - - - - - - - - - - - - - - - 0.68 -
- - - - - - - - - - - - - - 6.51 - 4.02 -
H I J K L M 41.80 1.57 14.04 26.65 8.67 -
20% 1% 7% 4% 0%
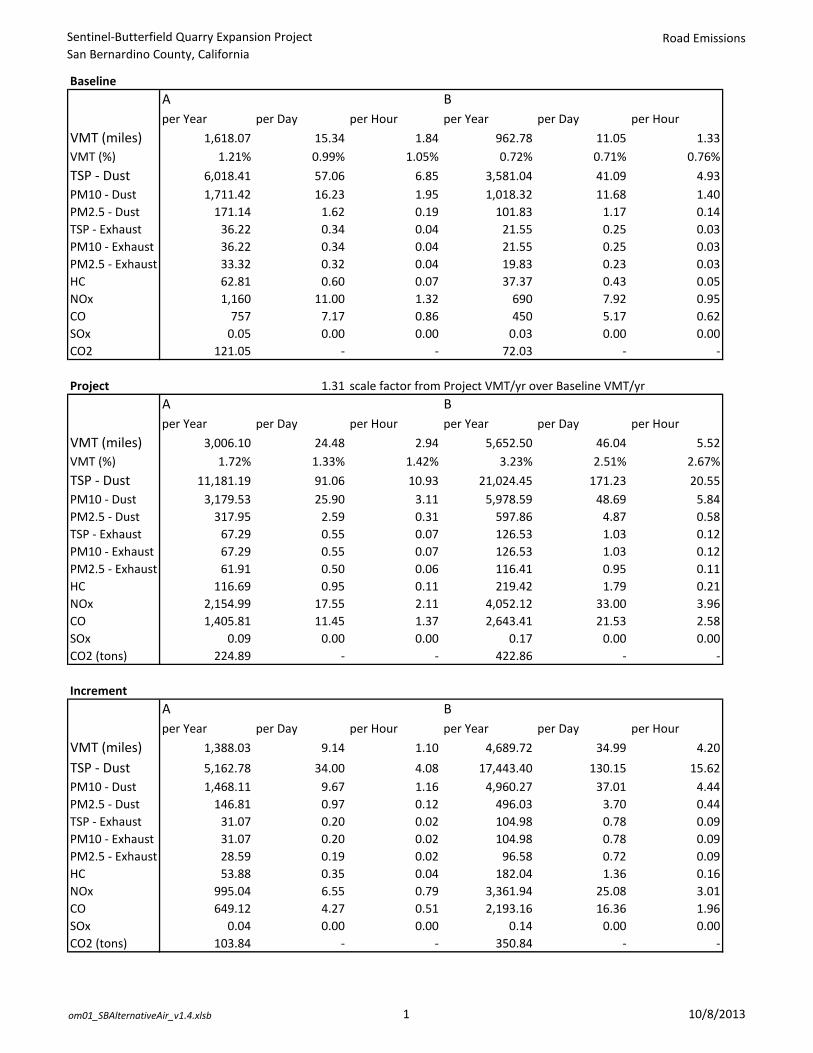
Sentinel-Butterfield Quarry Expansion ProjectSan Bernardino County, California
Road Emissions
om01_SBAlternativeAir_v1.4.xlsb 1 10/8/2013
BaselineA Bper Year per Day per Hour per Year per Day per Hour
VMT (miles) 1,618.07 15.34 1.84 962.78 11.05 1.33VMT (%) 1.21% 0.99% 1.05% 0.72% 0.71% 0.76%TSP - Dust 6,018.41 57.06 6.85 3,581.04 41.09 4.93PM10 - Dust 1,711.42 16.23 1.95 1,018.32 11.68 1.40PM2.5 - Dust 171.14 1.62 0.19 101.83 1.17 0.14TSP - Exhaust 36.22 0.34 0.04 21.55 0.25 0.03PM10 - Exhaust 36.22 0.34 0.04 21.55 0.25 0.03PM2.5 - Exhaust 33.32 0.32 0.04 19.83 0.23 0.03HC 62.81 0.60 0.07 37.37 0.43 0.05NOx 1,160 11.00 1.32 690 7.92 0.95CO 757 7.17 0.86 450 5.17 0.62SOx 0.05 0.00 0.00 0.03 0.00 0.00CO2 121.05 - - 72.03 - -
Project 1.31 scale factor from Project VMT/yr over Baseline VMT/yrA Bper Year per Day per Hour per Year per Day per Hour
VMT (miles) 3,006.10 24.48 2.94 5,652.50 46.04 5.52VMT (%) 1.72% 1.33% 1.42% 3.23% 2.51% 2.67%TSP - Dust 11,181.19 91.06 10.93 21,024.45 171.23 20.55PM10 - Dust 3,179.53 25.90 3.11 5,978.59 48.69 5.84PM2.5 - Dust 317.95 2.59 0.31 597.86 4.87 0.58TSP - Exhaust 67.29 0.55 0.07 126.53 1.03 0.12PM10 - Exhaust 67.29 0.55 0.07 126.53 1.03 0.12PM2.5 - Exhaust 61.91 0.50 0.06 116.41 0.95 0.11HC 116.69 0.95 0.11 219.42 1.79 0.21NOx 2,154.99 17.55 2.11 4,052.12 33.00 3.96CO 1,405.81 11.45 1.37 2,643.41 21.53 2.58SOx 0.09 0.00 0.00 0.17 0.00 0.00CO2 (tons) 224.89 - - 422.86 - -
IncrementA Bper Year per Day per Hour per Year per Day per Hour
VMT (miles) 1,388.03 9.14 1.10 4,689.72 34.99 4.20TSP - Dust 5,162.78 34.00 4.08 17,443.40 130.15 15.62PM10 - Dust 1,468.11 9.67 1.16 4,960.27 37.01 4.44PM2.5 - Dust 146.81 0.97 0.12 496.03 3.70 0.44TSP - Exhaust 31.07 0.20 0.02 104.98 0.78 0.09PM10 - Exhaust 31.07 0.20 0.02 104.98 0.78 0.09PM2.5 - Exhaust 28.59 0.19 0.02 96.58 0.72 0.09HC 53.88 0.35 0.04 182.04 1.36 0.16NOx 995.04 6.55 0.79 3,361.94 25.08 3.01CO 649.12 4.27 0.51 2,193.16 16.36 1.96SOx 0.04 0.00 0.00 0.14 0.00 0.00CO2 (tons) 103.84 - - 350.84 - -

Sentinel-Butterfield Quarry Expansion ProjectSan Bernardino County, California
Road Emissions
om01_SBAlternativeAir_v1.4.xlsb 2 10/8/2013
Baseline
VMT (miles)VMT (%)TSP - DustPM10 - DustPM2.5 - DustTSP - ExhaustPM10 - ExhaustPM2.5 - ExhaustHCNOxCOSOxCO2
Project
VMT (miles)VMT (%)TSP - DustPM10 - DustPM2.5 - DustTSP - ExhaustPM10 - ExhaustPM2.5 - ExhaustHCNOxCOSOxCO2 (tons)
Increment
VMT (miles)TSP - DustPM10 - DustPM2.5 - DustTSP - ExhaustPM10 - ExhaustPM2.5 - ExhaustHCNOxCOSOxCO2 (tons)
C Dper Year per Day per Hour per Year per Day per Hour
1,355.33 16.39 1.97 - - -1.01% 1.05% 1.13% 0.00% 0.00% 0.00%
5,041.15 60.95 7.31 - - -1,433.52 17.33 2.08 - - -
143.35 1.73 0.21 - - -30.34 0.37 0.04 - - -30.34 0.37 0.04 - - -27.91 0.34 0.04 - - -52.61 0.64 0.08 - - -
972 11.75 1.41 - - -634 7.66 0.92 - - -
0.04 0.00 0.00 - - -101.39 - - - - -
C Dper Year per Day per Hour per Year per Day per Hour
4,662.54 37.97 4.56 - - -2.66% 2.07% 2.20% 0.00% 0.00% 0.00%
17,342.31 141.24 16.95 - - -4,931.53 40.16 4.82 - - -
493.15 4.02 0.48 - - -104.37 0.85 0.10 - - -104.37 0.85 0.10 - - -
96.02 0.78 0.09 - - -180.99 1.47 0.18 - - -
3,342.45 27.22 3.27 - - -2,180.45 17.76 2.13 - - -
0.14 0.00 0.00 - - -348.80 - - - - -
C Dper Year per Day per Hour per Year per Day per Hour
3,307.21 21.59 2.59 - - -12,301.16 80.30 9.64 - - -
3,498.01 22.83 2.74 - - -349.80 2.28 0.27 - - -
74.03 0.48 0.06 - - -74.03 0.48 0.06 - - -68.11 0.44 0.05 - - -
128.38 0.84 0.10 - - -2,370.85 15.48 1.86 - - -1,546.63 10.10 1.21 - - -
0.10 0.00 0.00 - - -247.41 - - - - -
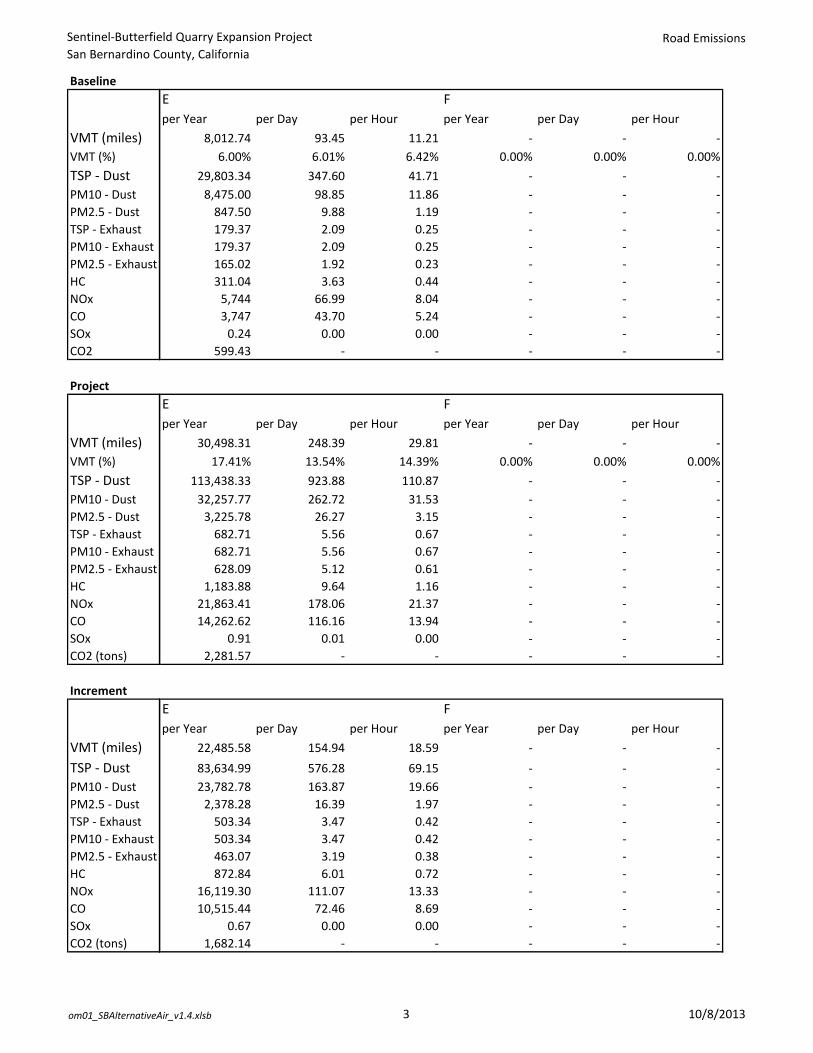
Sentinel-Butterfield Quarry Expansion ProjectSan Bernardino County, California
Road Emissions
om01_SBAlternativeAir_v1.4.xlsb 3 10/8/2013
Baseline
VMT (miles)VMT (%)TSP - DustPM10 - DustPM2.5 - DustTSP - ExhaustPM10 - ExhaustPM2.5 - ExhaustHCNOxCOSOxCO2
Project
VMT (miles)VMT (%)TSP - DustPM10 - DustPM2.5 - DustTSP - ExhaustPM10 - ExhaustPM2.5 - ExhaustHCNOxCOSOxCO2 (tons)
Increment
VMT (miles)TSP - DustPM10 - DustPM2.5 - DustTSP - ExhaustPM10 - ExhaustPM2.5 - ExhaustHCNOxCOSOxCO2 (tons)
E Fper Year per Day per Hour per Year per Day per Hour
8,012.74 93.45 11.21 - - -6.00% 6.01% 6.42% 0.00% 0.00% 0.00%
29,803.34 347.60 41.71 - - -8,475.00 98.85 11.86 - - -
847.50 9.88 1.19 - - -179.37 2.09 0.25 - - -179.37 2.09 0.25 - - -165.02 1.92 0.23 - - -311.04 3.63 0.44 - - -
5,744 66.99 8.04 - - -3,747 43.70 5.24 - - -
0.24 0.00 0.00 - - -599.43 - - - - -
E Fper Year per Day per Hour per Year per Day per Hour
30,498.31 248.39 29.81 - - -17.41% 13.54% 14.39% 0.00% 0.00% 0.00%
113,438.33 923.88 110.87 - - -32,257.77 262.72 31.53 - - -
3,225.78 26.27 3.15 - - -682.71 5.56 0.67 - - -682.71 5.56 0.67 - - -628.09 5.12 0.61 - - -
1,183.88 9.64 1.16 - - -21,863.41 178.06 21.37 - - -14,262.62 116.16 13.94 - - -
0.91 0.01 0.00 - - -2,281.57 - - - - -
E Fper Year per Day per Hour per Year per Day per Hour
22,485.58 154.94 18.59 - - -83,634.99 576.28 69.15 - - -23,782.78 163.87 19.66 - - -
2,378.28 16.39 1.97 - - -503.34 3.47 0.42 - - -503.34 3.47 0.42 - - -463.07 3.19 0.38 - - -872.84 6.01 0.72 - - -
16,119.30 111.07 13.33 - - -10,515.44 72.46 8.69 - - -
0.67 0.00 0.00 - - -1,682.14 - - - - -

Sentinel-Butterfield Quarry Expansion ProjectSan Bernardino County, California
Road Emissions
om01_SBAlternativeAir_v1.4.xlsb 4 10/8/2013
Baseline
VMT (miles)VMT (%)TSP - DustPM10 - DustPM2.5 - DustTSP - ExhaustPM10 - ExhaustPM2.5 - ExhaustHCNOxCOSOxCO2
Project
VMT (miles)VMT (%)TSP - DustPM10 - DustPM2.5 - DustTSP - ExhaustPM10 - ExhaustPM2.5 - ExhaustHCNOxCOSOxCO2 (tons)
Increment
VMT (miles)TSP - DustPM10 - DustPM2.5 - DustTSP - ExhaustPM10 - ExhaustPM2.5 - ExhaustHCNOxCOSOxCO2 (tons)
G Hper Year per Day per Hour per Year per Day per Hour
72,587.16 815.66 97.88 33,745.62 416.59 41.6654.34% 52.46% 56.04% 25.26% 26.79% 23.85%
269,987.62 3,033.83 364.06 125,516.67 1,549.49 154.9576,774.75 862.71 103.53 35,692.42 440.62 44.06
7,677.47 86.27 10.35 3,569.24 44.06 4.411,624.87 18.26 2.19 755.40 9.33 0.931,624.87 18.26 2.19 755.40 9.33 0.931,494.88 16.80 2.02 694.97 8.58 0.862,817.67 31.66 3.80 1,309.93 16.17 1.62
52,036 584.72 70.17 24,191 298.64 29.8633,946 381.44 45.77 15,781 194.82 19.48
2.17 0.02 0.00 1.01 0.01 0.005,430.22 - - 2,524.50 - -
G Hper Year per Day per Hour per Year per Day per Hour
100,488.89 818.42 98.21 19,162.95 418.00 41.8057.38% 44.61% 47.42% 10.94% 22.78% 20.18%
373,767.95 3,044.10 365.29 71,276.50 1,554.74 155.47106,286.13 865.63 103.88 20,268.47 442.11 44.21
10,628.61 86.56 10.39 2,026.85 44.21 4.422,249.45 18.32 2.20 327.21 7.14 0.712,249.45 18.32 2.20 327.21 7.14 0.712,069.50 16.85 2.02 301.03 6.57 0.663,900.76 31.77 3.81 743.86 16.23 1.62
72,037.76 586.70 70.40 13,737.40 299.65 29.9746,993.91 382.74 45.93 8,961.61 195.48 19.55
3.00 0.02 0.00 0.57 0.01 0.007,517.54 - - 1,433.57 - -
G Hper Year per Day per Hour per Year per Day per Hour
27,901.72 2.76 0.33 -14,582.67 1.41 0.14103,780.33 10.27 1.23 -54,240.17 5.25 0.52
29,511.39 2.92 0.35 -15,423.95 1.49 0.152,951.14 0.29 0.04 -1,542.39 0.15 0.01
624.58 0.06 0.01 -428.19 -2.19 -0.22624.58 0.06 0.01 -428.19 -2.19 -0.22574.62 0.06 0.01 -393.94 -2.01 -0.20
1,083.08 0.11 0.01 -566.07 0.05 0.0120,001.99 1.98 0.24 -10,453.92 1.01 0.1013,048.32 1.29 0.16 -6,819.63 0.66 0.07
0.83 0.00 0.00 -0.44 0.00 0.002,087.32 - - -1,090.93 - -
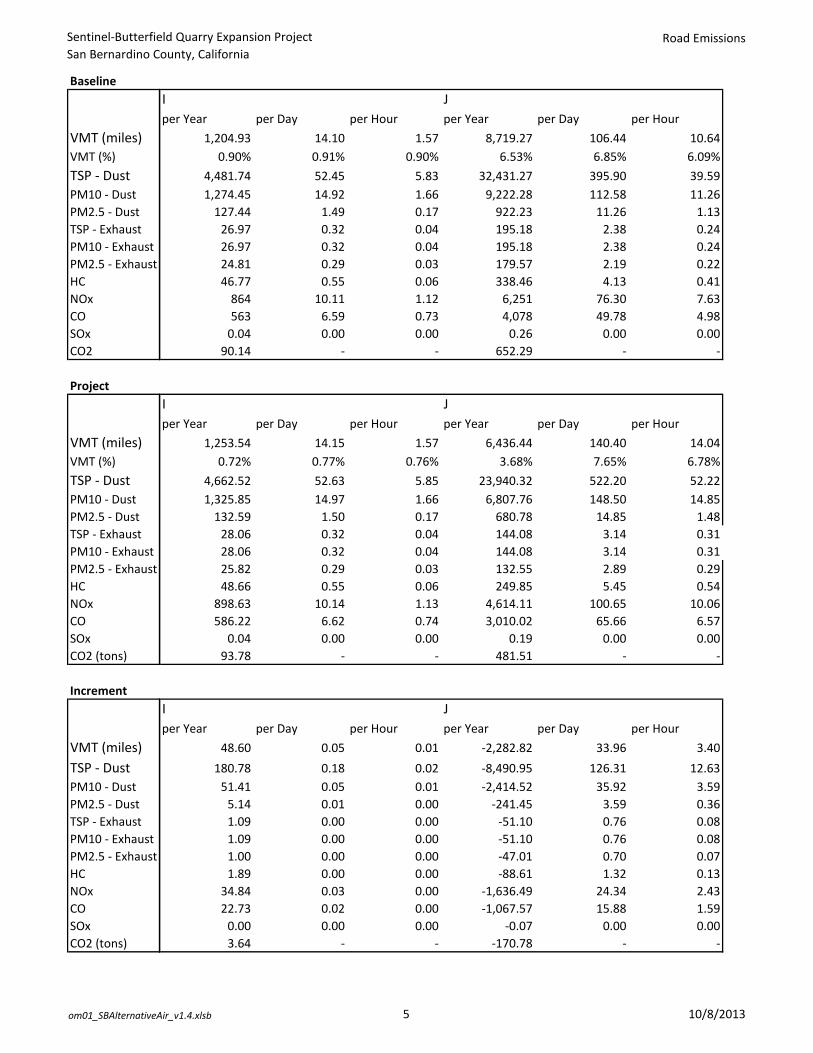
Sentinel-Butterfield Quarry Expansion ProjectSan Bernardino County, California
Road Emissions
om01_SBAlternativeAir_v1.4.xlsb 5 10/8/2013
Baseline
VMT (miles)VMT (%)TSP - DustPM10 - DustPM2.5 - DustTSP - ExhaustPM10 - ExhaustPM2.5 - ExhaustHCNOxCOSOxCO2
Project
VMT (miles)VMT (%)TSP - DustPM10 - DustPM2.5 - DustTSP - ExhaustPM10 - ExhaustPM2.5 - ExhaustHCNOxCOSOxCO2 (tons)
Increment
VMT (miles)TSP - DustPM10 - DustPM2.5 - DustTSP - ExhaustPM10 - ExhaustPM2.5 - ExhaustHCNOxCOSOxCO2 (tons)
I Jper Year per Day per Hour per Year per Day per Hour
1,204.93 14.10 1.57 8,719.27 106.44 10.640.90% 0.91% 0.90% 6.53% 6.85% 6.09%
4,481.74 52.45 5.83 32,431.27 395.90 39.591,274.45 14.92 1.66 9,222.28 112.58 11.26
127.44 1.49 0.17 922.23 11.26 1.1326.97 0.32 0.04 195.18 2.38 0.2426.97 0.32 0.04 195.18 2.38 0.2424.81 0.29 0.03 179.57 2.19 0.2246.77 0.55 0.06 338.46 4.13 0.41
864 10.11 1.12 6,251 76.30 7.63563 6.59 0.73 4,078 49.78 4.98
0.04 0.00 0.00 0.26 0.00 0.0090.14 - - 652.29 - -
I Jper Year per Day per Hour per Year per Day per Hour
1,253.54 14.15 1.57 6,436.44 140.40 14.040.72% 0.77% 0.76% 3.68% 7.65% 6.78%
4,662.52 52.63 5.85 23,940.32 522.20 52.221,325.85 14.97 1.66 6,807.76 148.50 14.85
132.59 1.50 0.17 680.78 14.85 1.4828.06 0.32 0.04 144.08 3.14 0.3128.06 0.32 0.04 144.08 3.14 0.3125.82 0.29 0.03 132.55 2.89 0.2948.66 0.55 0.06 249.85 5.45 0.54
898.63 10.14 1.13 4,614.11 100.65 10.06586.22 6.62 0.74 3,010.02 65.66 6.57
0.04 0.00 0.00 0.19 0.00 0.0093.78 - - 481.51 - -
I Jper Year per Day per Hour per Year per Day per Hour
48.60 0.05 0.01 -2,282.82 33.96 3.40180.78 0.18 0.02 -8,490.95 126.31 12.63
51.41 0.05 0.01 -2,414.52 35.92 3.595.14 0.01 0.00 -241.45 3.59 0.361.09 0.00 0.00 -51.10 0.76 0.081.09 0.00 0.00 -51.10 0.76 0.081.00 0.00 0.00 -47.01 0.70 0.071.89 0.00 0.00 -88.61 1.32 0.13
34.84 0.03 0.00 -1,636.49 24.34 2.4322.73 0.02 0.00 -1,067.57 15.88 1.59
0.00 0.00 0.00 -0.07 0.00 0.003.64 - - -170.78 - -

Sentinel-Butterfield Quarry Expansion ProjectSan Bernardino County, California
Road Emissions
om01_SBAlternativeAir_v1.4.xlsb 6 10/8/2013
Baseline
VMT (miles)VMT (%)TSP - DustPM10 - DustPM2.5 - DustTSP - ExhaustPM10 - ExhaustPM2.5 - ExhaustHCNOxCOSOxCO2
Project
VMT (miles)VMT (%)TSP - DustPM10 - DustPM2.5 - DustTSP - ExhaustPM10 - ExhaustPM2.5 - ExhaustHCNOxCOSOxCO2 (tons)
Increment
VMT (miles)TSP - DustPM10 - DustPM2.5 - DustTSP - ExhaustPM10 - ExhaustPM2.5 - ExhaustHCNOxCOSOxCO2 (tons)
K Lper Year per Day per Hour per Year per Day per Hour
20,421.14 239.00 26.56 5,383.71 65.72 6.570.00% 0.00% 0.00% 4.03% 4.23% 3.76%
751.91 8.80 0.98 20,024.68 244.45 24.44150.38 1.76 0.20 5,694.30 69.51 6.95
36.91 0.43 0.05 569.43 6.95 0.7031.80 0.37 0.04 120.51 1.47 0.1531.80 0.37 0.04 120.51 1.47 0.1529.25 0.34 0.04 110.87 1.35 0.1429.32 0.34 0.04 208.98 2.55 0.26
553.40 6.48 0.72 3,859 47.11 4.71132.81 1.55 0.17 2,518 30.73 3.07
0.72 0.01 0.00 0.16 0.00 0.00 - - - 402.75 - -
K Lper Year per Day per Hour per Year per Day per Hour
21,244.85 239.81 26.65 3,974.18 86.69 8.670.00% 0.00% 0.00% 2.27% 4.73% 4.19%
782.24 8.83 0.98 - - -156.45 1.77 0.20 4,203.45 91.69 9.17
38.40 0.43 0.05 420.35 9.17 0.9233.08 0.37 0.04 88.96 1.94 0.1933.08 0.37 0.04 88.96 1.94 0.1930.43 0.34 0.04 81.85 1.79 0.1830.50 0.34 0.04 154.27 3.37 0.34
575.72 6.50 0.72 2,848.98 62.14 6.21138.17 1.56 0.17 1,858.54 40.54 4.05
0.75 0.01 0.00 0.12 0.00 0.00 - - - 297.31 - -
K Lper Year per Day per Hour per Year per Day per Hour
823.71 0.81 0.09 -1,409.53 20.97 2.1030.33 0.03 0.00 -20,024.68 -244.45 -24.44
6.07 0.01 0.00 -1,490.84 22.18 2.221.49 0.00 0.00 -149.08 2.22 0.221.28 0.00 0.00 -31.55 0.47 0.051.28 0.00 0.00 -31.55 0.47 0.051.18 0.00 0.00 -29.03 0.43 0.041.18 0.00 0.00 -54.71 0.81 0.08
22.32 0.02 0.00 -1,010.45 15.03 1.505.36 0.01 0.00 -659.17 9.81 0.980.03 0.00 0.00 -0.04 0.00 0.00
- - - -105.45 - -

Sentinel-Butterfield Quarry Expansion ProjectSan Bernardino County, California
Road Emissions
om01_SBAlternativeAir_v1.4.xlsb 7 10/8/2013
Baseline
VMT (miles)VMT (%)TSP - DustPM10 - DustPM2.5 - DustTSP - ExhaustPM10 - ExhaustPM2.5 - ExhaustHCNOxCOSOxCO2
Project
VMT (miles)VMT (%)TSP - DustPM10 - DustPM2.5 - DustTSP - ExhaustPM10 - ExhaustPM2.5 - ExhaustHCNOxCOSOxCO2 (tons)
Increment
VMT (miles)TSP - DustPM10 - DustPM2.5 - DustTSP - ExhaustPM10 - ExhaustPM2.5 - ExhaustHCNOxCOSOxCO2 (tons)
M Total On-siteper Year per Day per Hour per Year per Day per Hour
- - - 133,589.61 1,554.73 174.670.00% 0.00% 0.00% 100.00% 100.00% 100.00%
- - - 496,885.92 5,782.81 649.67 - - - 141,296.45 1,644.42 184.74 - - - 14,129.64 164.44 18.47 - - - 2,990.42 34.80 3.91 - - - 2,990.42 34.80 3.91 - - - 2,751.18 32.02 3.60 - - - 5,185.65 60.35 6.78 - - - 95,766.76 1,114.54 125.21 - - - 62,473.56 727.07 81.68 - - - 3.99 0.05 0.01 - - - 9,994
1.31M Total On-siteper Year per Day per Hour per Year per Day per Hour
- - - 175,135.46 1,834.53 207.120.00% 0.00% 0.00% 100.00% 100.00% 100.00%
- - - 636,633.57 6,501.10 738.12 - - - 185,239.09 1,940.37 219.07 - - - 18,523.91 194.04 21.91 - - - 3,818.66 38.85 4.41 - - - 3,818.66 38.85 4.41 - - - 3,513.17 35.74 4.06 - - - 6,798.37 71.21 8.04 - - - 125,549.85 1,315.13 148.48 - - - 81,902.59 857.92 96.86 - - - 5.23 0.05 0.01 - - - 13,101.83 - -
M Total On-siteper Year per Day per Hour per Year per Day per Hour
- - - 41,545.85 279.80 32.45 - - - 139,747.65 718.28 88.45 - - - 43,942.65 295.94 34.32 - - - 4,394.26 29.59 3.43 - - - 828.25 4.04 0.50 - - - 828.25 4.04 0.50 - - - 761.99 3.72 0.46 - - - 1,612.72 10.86 1.26 - - - 29,783.09 200.58 23.26 - - - 19,429.03 130.85 15.17 - - - 1.24 0.01 0.00 - - - 3,108.03 - -
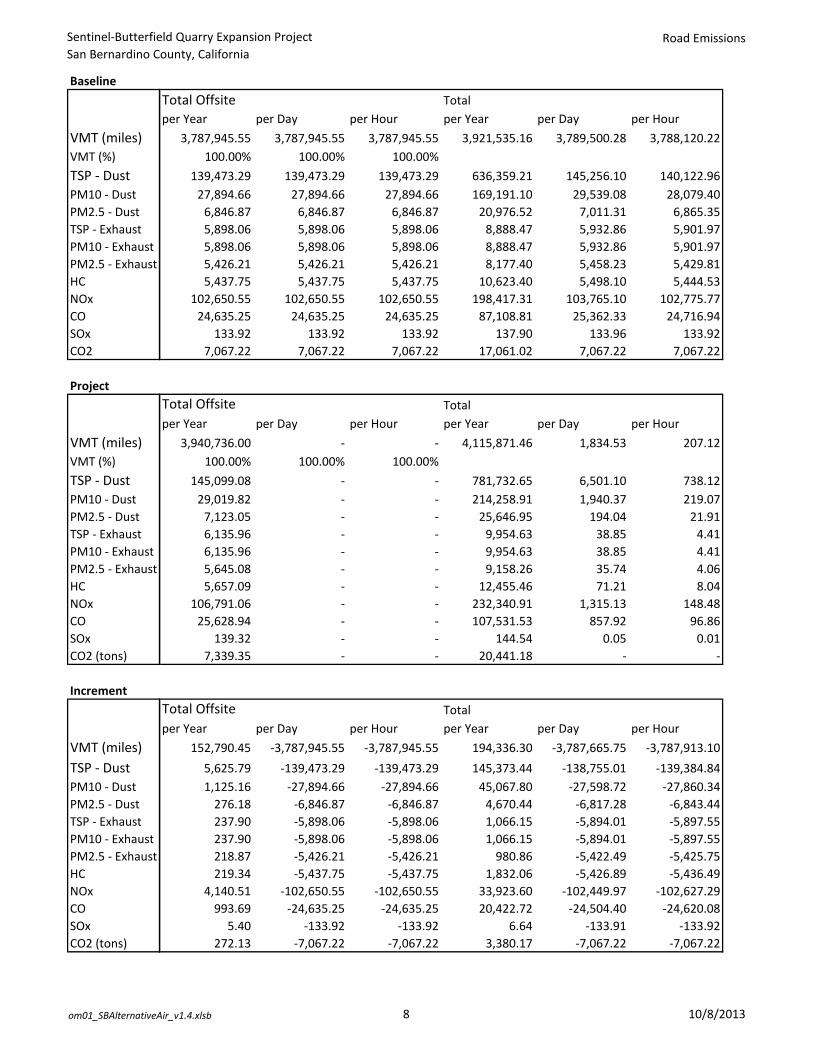
Sentinel-Butterfield Quarry Expansion ProjectSan Bernardino County, California
Road Emissions
om01_SBAlternativeAir_v1.4.xlsb 8 10/8/2013
Baseline
VMT (miles)VMT (%)TSP - DustPM10 - DustPM2.5 - DustTSP - ExhaustPM10 - ExhaustPM2.5 - ExhaustHCNOxCOSOxCO2
Project
VMT (miles)VMT (%)TSP - DustPM10 - DustPM2.5 - DustTSP - ExhaustPM10 - ExhaustPM2.5 - ExhaustHCNOxCOSOxCO2 (tons)
Increment
VMT (miles)TSP - DustPM10 - DustPM2.5 - DustTSP - ExhaustPM10 - ExhaustPM2.5 - ExhaustHCNOxCOSOxCO2 (tons)
Total Offsite Totalper Year per Day per Hour per Year per Day per Hour
3,787,945.55 3,787,945.55 3,787,945.55 3,921,535.16 3,789,500.28 3,788,120.22100.00% 100.00% 100.00% 200.00% 200.00% 200.00%
139,473.29 139,473.29 139,473.29 636,359.21 145,256.10 140,122.9627,894.66 27,894.66 27,894.66 169,191.10 29,539.08 28,079.40
6,846.87 6,846.87 6,846.87 20,976.52 7,011.31 6,865.355,898.06 5,898.06 5,898.06 8,888.47 5,932.86 5,901.975,898.06 5,898.06 5,898.06 8,888.47 5,932.86 5,901.975,426.21 5,426.21 5,426.21 8,177.40 5,458.23 5,429.815,437.75 5,437.75 5,437.75 10,623.40 5,498.10 5,444.53
102,650.55 102,650.55 102,650.55 198,417.31 103,765.10 102,775.7724,635.25 24,635.25 24,635.25 87,108.81 25,362.33 24,716.94
133.92 133.92 133.92 137.90 133.96 133.927,067.22 7,067.22 7,067.22 17,061.02 7,067.22 7,067.22
Total Offsite Totalper Year per Day per Hour per Year per Day per Hour
3,940,736.00 - - 4,115,871.46 1,834.53 207.12100.00% 100.00% 100.00% 200.00% 200.00% 200.00%
145,099.08 - - 781,732.65 6,501.10 738.1229,019.82 - - 214,258.91 1,940.37 219.07
7,123.05 - - 25,646.95 194.04 21.916,135.96 - - 9,954.63 38.85 4.416,135.96 - - 9,954.63 38.85 4.415,645.08 - - 9,158.26 35.74 4.065,657.09 - - 12,455.46 71.21 8.04
106,791.06 - - 232,340.91 1,315.13 148.4825,628.94 - - 107,531.53 857.92 96.86
139.32 - - 144.54 0.05 0.017,339.35 - - 20,441.18 - -
Total Offsite Totalper Year per Day per Hour per Year per Day per Hour
152,790.45 -3,787,945.55 -3,787,945.55 194,336.30 -3,787,665.75 -3,787,913.105,625.79 -139,473.29 -139,473.29 145,373.44 -138,755.01 -139,384.841,125.16 -27,894.66 -27,894.66 45,067.80 -27,598.72 -27,860.34
276.18 -6,846.87 -6,846.87 4,670.44 -6,817.28 -6,843.44237.90 -5,898.06 -5,898.06 1,066.15 -5,894.01 -5,897.55237.90 -5,898.06 -5,898.06 1,066.15 -5,894.01 -5,897.55218.87 -5,426.21 -5,426.21 980.86 -5,422.49 -5,425.75219.34 -5,437.75 -5,437.75 1,832.06 -5,426.89 -5,436.49
4,140.51 -102,650.55 -102,650.55 33,923.60 -102,449.97 -102,627.29993.69 -24,635.25 -24,635.25 20,422.72 -24,504.40 -24,620.08
5.40 -133.92 -133.92 6.64 -133.91 -133.92272.13 -7,067.22 -7,067.22 3,380.17 -7,067.22 -7,067.22

Sentinel-Butterfield Quarry Expansion ProjectSan Bernardino County, California
Criteria
om01_SBAlternativeAir_v1.4.xlsb 1 10/8/2013
21 VOL1 VOL2 VOL3 VOL4 VOL5 VOL6 VOL7 VOL8 VOL9 VOL10altTSPann -3.50E-01 -8.14E-01 0.00E+00 -3.00E-01 -3.00E-01 1.14E-01 2.60E-01 4.97E-03 2.06E-01 7.84E-01altTSPday -1.28E+00 -2.97E+00 0.00E+00 -1.09E+00 -1.09E+00 4.15E-01 9.50E-01 1.81E-02 7.52E-01 2.86E+00altPM10ann -1.17E-01 -4.10E-01 0.00E+00 -1.48E-01 -1.48E-01 2.10E-02 1.31E-01 2.59E-03 3.90E-02 3.95E-01altPM10day -4.29E-01 -1.50E+00 0.00E+00 -5.40E-01 -5.40E-01 7.66E-02 4.77E-01 9.47E-03 1.42E-01 1.44E+00altPM25ann -4.03E-02 -1.27E-01 0.00E+00 -5.23E-02 -5.23E-02 5.06E-03 3.03E-02 1.03E-03 1.45E-02 9.38E-02altPM25day -1.47E-01 -4.62E-01 0.00E+00 -1.91E-01 -1.91E-01 1.85E-02 1.11E-01 3.76E-03 5.31E-02 3.42E-01
TSPann (lb/yr/src) -24344.2 -56602.5 0 -20836.8 -20836.8 7899.8 18102.1 345.62535 14331.7 54510.2TSPday (lb/day/src) -243.442 -566.025 0 -208.368 -208.368 78.998 181.021 3.4562535 143.317 545.102PM10ann (lb/yr/src -8167.11 -28507.7 0 -10281.8 -10281.8 1459.44 9077.02 180.3284 2714.3 27434.8PM10day (lb/day/s -81.6711 -285.077 0 -102.818 -102.818 14.5944 90.7702 1.803284 27.143 274.348PM25ann (lb/yr/src -2803.9 -8798.71 0 -3636.89 -3636.89 351.818 2104.94 71.580398 1011.45 6518.57PM25day (lb/day/s -28.039 -87.9871 0 -36.3689 -36.3689 3.51818 21.0494 0.715804 10.1145 65.1857
TSPann (lb/yr) -24,344 -56,602 0 -20,837 -20,837 7,900 18,102 346 14,332 54,510TSPday (lb/day) -243 -566 0 -208 -208 79 181 3 143 545PM10ann (lb/yr) -8,167 -28,508 0 -10,282 -10,282 1,459 9,077 180 2,714 27,435PM10day (lb/day) -82 -285 0 -103 -103 15 91 2 27 274PM25ann (lb/yr) -2,804 -8,799 0 -3,637 -3,637 352 2,105 72 1,011 6,519PM25day (lb/day) -28 -88 0 -36 -36 4 21 1 10 65
HC (lb/yr) -640 -554 0 -16 -16 23 74 37 234 562NOx (lb/yr) -9,898 -8,146 0 -240 -240 174 1,097 539 5,164 8,263CO (lb/yr) -14,201 -5,306 0 -156 -156 112 516 351 5,533 5,382SOx (lb/yr) -0.305 -0.292 0 -0.009 -0.009 0.006 0.032 0.019 0.552 0.296CO2 (ton/yr) -584 -769 0 -23 -23 25 85 51 593 780TSP (lb/yr) -24,344 -56,602 0 -20,837 -20,837 7,900 18,102 346 14,332 54,510PM10 (lb/yr) -8,167 -28,508 0 -10,282 -10,282 1,459 9,077 180 2,714 27,435PM2.5 (lb/yr) -2,804 -8,799 0 -3,637 -3,637 352 2,105 72 1,011 6,519
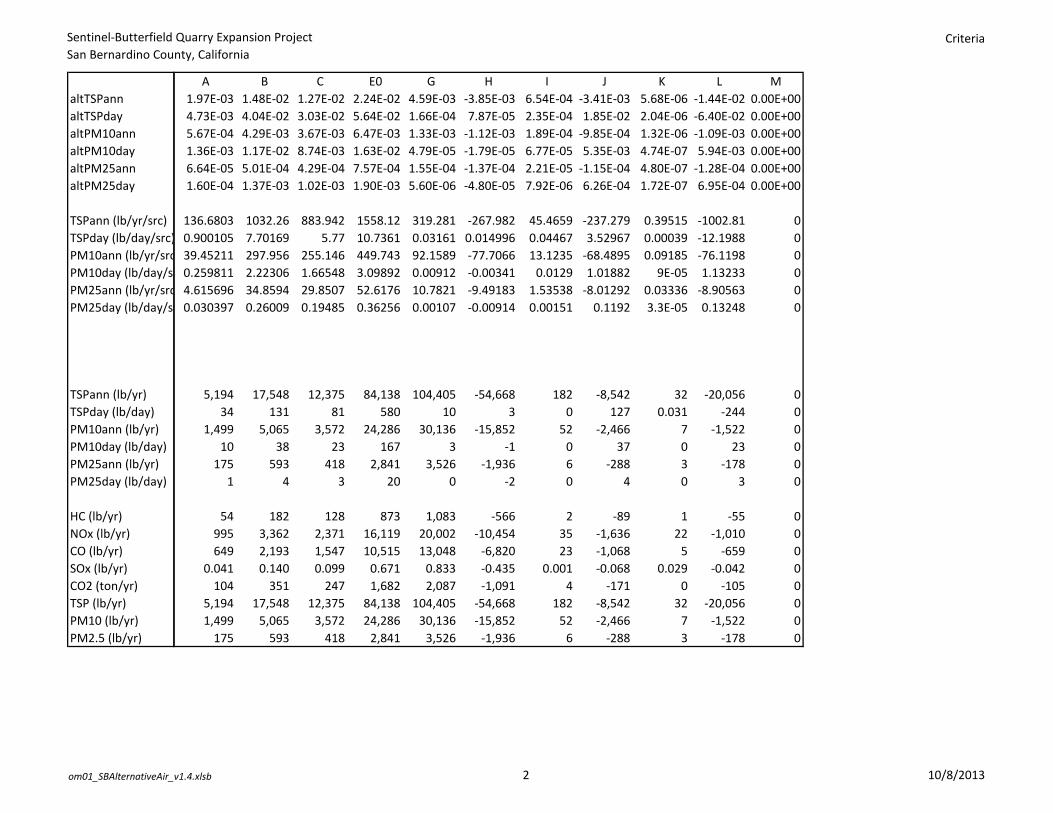
Sentinel-Butterfield Quarry Expansion ProjectSan Bernardino County, California
Criteria
om01_SBAlternativeAir_v1.4.xlsb 2 10/8/2013
21altTSPannaltTSPdayaltPM10annaltPM10dayaltPM25annaltPM25day
TSPann (lb/yr/src)TSPday (lb/day/src)PM10ann (lb/yr/srcPM10day (lb/day/sPM25ann (lb/yr/srcPM25day (lb/day/s
TSPann (lb/yr)TSPday (lb/day)PM10ann (lb/yr)PM10day (lb/day)PM25ann (lb/yr)PM25day (lb/day)
HC (lb/yr)NOx (lb/yr)CO (lb/yr)SOx (lb/yr)CO2 (ton/yr)TSP (lb/yr)PM10 (lb/yr)PM2.5 (lb/yr)
A B C E0 G H I J K L M1.97E-03 1.48E-02 1.27E-02 2.24E-02 4.59E-03 -3.85E-03 6.54E-04 -3.41E-03 5.68E-06 -1.44E-02 0.00E+004.73E-03 4.04E-02 3.03E-02 5.64E-02 1.66E-04 7.87E-05 2.35E-04 1.85E-02 2.04E-06 -6.40E-02 0.00E+005.67E-04 4.29E-03 3.67E-03 6.47E-03 1.33E-03 -1.12E-03 1.89E-04 -9.85E-04 1.32E-06 -1.09E-03 0.00E+001.36E-03 1.17E-02 8.74E-03 1.63E-02 4.79E-05 -1.79E-05 6.77E-05 5.35E-03 4.74E-07 5.94E-03 0.00E+006.64E-05 5.01E-04 4.29E-04 7.57E-04 1.55E-04 -1.37E-04 2.21E-05 -1.15E-04 4.80E-07 -1.28E-04 0.00E+001.60E-04 1.37E-03 1.02E-03 1.90E-03 5.60E-06 -4.80E-05 7.92E-06 6.26E-04 1.72E-07 6.95E-04 0.00E+00
136.6803 1032.26 883.942 1558.12 319.281 -267.982 45.4659 -237.279 0.39515 -1002.81 00.900105 7.70169 5.77 10.7361 0.03161 0.014996 0.04467 3.52967 0.00039 -12.1988 039.45211 297.956 255.146 449.743 92.1589 -77.7066 13.1235 -68.4895 0.09185 -76.1198 00.259811 2.22306 1.66548 3.09892 0.00912 -0.00341 0.0129 1.01882 9E-05 1.13233 04.615696 34.8594 29.8507 52.6176 10.7821 -9.49183 1.53538 -8.01292 0.03336 -8.90563 00.030397 0.26009 0.19485 0.36256 0.00107 -0.00914 0.00151 0.1192 3.3E-05 0.13248 0
5,194 17,548 12,375 84,138 104,405 -54,668 182 -8,542 32 -20,056 034 131 81 580 10 3 0 127 0.031 -244 0
1,499 5,065 3,572 24,286 30,136 -15,852 52 -2,466 7 -1,522 010 38 23 167 3 -1 0 37 0 23 0
175 593 418 2,841 3,526 -1,936 6 -288 3 -178 01 4 3 20 0 -2 0 4 0 3 0
54 182 128 873 1,083 -566 2 -89 1 -55 0995 3,362 2,371 16,119 20,002 -10,454 35 -1,636 22 -1,010 0649 2,193 1,547 10,515 13,048 -6,820 23 -1,068 5 -659 0
0.041 0.140 0.099 0.671 0.833 -0.435 0.001 -0.068 0.029 -0.042 0104 351 247 1,682 2,087 -1,091 4 -171 0 -105 0
5,194 17,548 12,375 84,138 104,405 -54,668 182 -8,542 32 -20,056 01,499 5,065 3,572 24,286 30,136 -15,852 52 -2,466 7 -1,522 0
175 593 418 2,841 3,526 -1,936 6 -288 3 -178 0

Sentinel-Butterfield Quarry Expansion ProjectSan Bernardino County, California
Criteria
om01_SBAlternativeAir_v1.4.xlsb 3 10/8/2013
21altTSPannaltTSPdayaltPM10annaltPM10dayaltPM25annaltPM25day
TSPann (lb/yr/src)TSPday (lb/day/src)PM10ann (lb/yr/srcPM10day (lb/day/sPM25ann (lb/yr/srcPM25day (lb/day/s
TSPann (lb/yr)TSPday (lb/day)PM10ann (lb/yr)PM10day (lb/day)PM25ann (lb/yr)PM25day (lb/day)
HC (lb/yr)NOx (lb/yr)CO (lb/yr)SOx (lb/yr)CO2 (ton/yr)TSP (lb/yr)PM10 (lb/yr)PM2.5 (lb/yr)
Total Sentinel Butterfield Total White Knob Total Processing Plant Total Offsite
310,950 -205,887 8,0821,709 -1,340 79
103,965 -77,079 1,512635 -514 15
17,260 -21,279 358125 -184 4
3,227 -1,937 25 219.357,912 -31,624 209 4140.539,735 -28,365 134 993.7
3 -1 0 5.45,980 -2,765 28 272.1
310,950 -205,887 8,082 5863.7103,965 -77,079 1,512 1363.1
17,260 -21,279 358 495.0

Sentinel-Butterfield Quarry Expansion ProjectSan Bernardino County, California
Criteria
om01_SBAlternativeAir_v1.4.xlsb 4 10/8/2013
21altTSPannaltTSPdayaltPM10annaltPM10dayaltPM25annaltPM25day
TSPann (lb/yr/src)TSPday (lb/day/src)PM10ann (lb/yr/srcPM10day (lb/day/sPM25ann (lb/yr/srcPM25day (lb/day/s
TSPann (lb/yr)TSPday (lb/day)PM10ann (lb/yr)PM10day (lb/day)PM25ann (lb/yr)PM25day (lb/day)
HC (lb/yr)NOx (lb/yr)CO (lb/yr)SOx (lb/yr)CO2 (ton/yr)TSP (lb/yr)PM10 (lb/yr)PM2.5 (lb/yr)
Total Project w/o White Knob Total Project w/ White Knob Volume Source Identifiers LOCATION VOL1 VOLUME 498771.228 3802380.117 0** DESCRSRC White Knob Crushing LOCATION VOL2 VOLUME 498410.694 3802532.330 0** DESCRSRC White Knob Pit LOCATION VOL3 VOLUME 499367.635 3802416.274 0** DESCRSRC White Ridge Pit LOCATION VOL4 VOLUME 499169.967 3802653.553 0** DESCRSRC OB1 LOCATION VOL5 VOLUME 498786.819 3802108.559 0** DESCRSRC OB2 LOCATION VOL6 VOLUME 505294.247 3804607.151 0** DESCRSRC Processing Plant LOCATION VOL7 VOLUME 504322.000 3798695.000 0** DESCRSRC Butterfield Pit LOCATION VOL8 VOLUME 505430.000 3797960.000 0** DESCRSRC B5 Pad Expansion LOCATION VOL9 VOLUME 505555.000 3798545.000 0
319,032 113,145 ** DESCRSRC Butterfield-Sentinel Crushing1,788 448 LOCATION VOL10 VOLUME 505808.000 3798770.000 0
105,477 28,398 ** DESCRSRC Sentinel Pit650 136
17,618 -3,662129 -55
3,252 1,31658,121 26,49739,869 11,504
3 26,008 3,243
319,032 113,145105,477 28,398
17,618 -3,662

Sentinel-Butterfield Quarry Expansion ProjectSan Bernardino County, California
Toxics
om01_SBAlternativeAir_v1.4.xlsb 1 10/8/2013
Number of Sources ID # of sources ID # of sources ID # of sources ID # of sources19 A 38 B 17 C 14 E0 54
CHEMICAL (lb/yr) (lb/hr) (lb/yr) (lb/hr) (lb/yr) (lb/hr) (lb/yr) (lb/hr)arsenic 0.00058 2.0933E-06 0.004377 3.92963E-06 0.003748 2.94402E-06 0.006606 5.47787E-06bromine 0.000695 3.82022E-06 0.005252 4.7244E-06 0.004497 3.53945E-06 0.007928 6.58577E-06cadmium 0.000502 2.49268E-05 0.003793 3.56196E-06 0.003248 2.66857E-06 0.005725 4.96534E-06chlorine 0.032607 5.11159E-05 0.246263 0.000220656 0.21088 0.000165312 0.371716 0.000307593copper 0.006104 5.55191E-05 0.046101 4.16184E-05 0.039478 3.11799E-05 0.069587 5.80157E-05lead 0.005022 1.21457E-05 0.037932 3.40162E-05 0.032481 2.54845E-05 0.057255 4.74183E-05manganese 0.035351 7.53605E-05 0.26698 0.000239353 0.22862 0.00017932 0.402986 0.000333657mercury 0.000541 6.15109E-06 0.004085 3.69603E-06 0.003498 2.76901E-06 0.006166 5.15224E-06nickel 0.001429 8.48863E-06 0.010796 9.71556E-06 0.009245 7.27876E-06 0.016296 1.35434E-05selenium 0.000116 6.63291E-06 0.000875 8.27944E-07 0.00075 6.20284E-07 0.001321 1.15415E-06vanadium (fume or dust) 0.002975 3.16856E-06 0.022467 2.01208E-05 0.019239 1.50742E-05 0.033912 2.80483E-05Silica, Crystln 1.545378 0.001221246 11.67124 0.010449513 9.994305 0.007828625 17.61687 0.014566538Asbestos 0 0 0 0 0 0 0 01,3-butadiene 0 2.12897E-06 0 1.82164E-05 0 1.36474E-05 0 2.53935E-05acetaldehyde 0 8.23574E-05 0 0.000704686 0 0.000527941 0 0.000982327benzene 0 2.24102E-05 0 0.000191751 0 0.000143657 0 0.0002673ethyl benzene 0 3.47358E-06 0 2.97215E-05 0 2.22669E-05 0 4.14315E-05formaldehyde 0 0.000164827 0 0.001410331 0 0.0010566 0 0.00196599hexane 0 1.79281E-06 0 1.53401E-05 0 1.14926E-05 0 2.1384E-05methanol 0 3.36153E-07 0 2.87627E-06 0 2.15486E-06 0 4.0095E-06methyl ethyl ketone {2-butanone 0 1.65835E-05 0 0.000141896 0 0.000106306 0 0.000197802m-xylene 0 6.8351E-06 0 5.84841E-05 0 4.38155E-05 0 8.15264E-05naphthalene 0 1.00846E-06 0 8.62881E-06 0 6.46458E-06 0 1.20285E-05o-xylene 0 3.80973E-06 0 3.25977E-05 0 2.44217E-05 0 4.5441E-05propylene 0 2.91332E-05 0 0.000249277 0 0.000186755 0 0.00034749p-xylene 0 1.12051E-06 0 9.58756E-06 0 7.18287E-06 0 1.3365E-05styrene 0 6.72305E-07 0 5.75254E-06 0 4.30972E-06 0 8.01899E-06toluene 0 1.64715E-05 0 0.000140937 0 0.000105588 0 0.000196465DieselExhPM 0.817664 0 6.175289 0 5.288019 0 9.321145 0

Sentinel-Butterfield Quarry Expansion ProjectSan Bernardino County, California
Toxics
om01_SBAlternativeAir_v1.4.xlsb 2 10/8/2013
Number of Sources19
CHEMICALarsenicbrominecadmiumchlorinecopperleadmanganesemercurynickelseleniumvanadium (fume or dust)Silica, CrystlnAsbestos1,3-butadieneacetaldehydebenzeneethyl benzeneformaldehydehexanemethanolmethyl ethyl ketone {2-butanonem-xylenenaphthaleneo-xylenepropylenep-xylenestyrenetolueneDieselExhPM
ID # of sources ID # of sources ID # of sources ID # of sourcesG 327 H 204 I 4 J 36
(lb/yr) (lb/hr) (lb/yr) (lb/hr) (lb/yr) (lb/hr) (lb/yr) (lb/hr)0.001353733 1.61271E-08 -0.00113 8.82633E-09 0.000193 2.11058E-08 -0.00101 1.50078E-06
0.00162448 1.93888E-08 -0.00136 8.87546E-09 0.000231 2.53745E-08 -0.00121 1.80432E-060.001173236 1.46182E-08 -0.00098 -2.26689E-08 0.000167 1.91311E-08 -0.00087 1.36037E-060.076170059 9.05569E-07 -0.06381 5.8408E-07 0.010847 1.18513E-06 -0.05661 8.42719E-050.014259324 1.70801E-07 -0.01195 4.90662E-08 0.002031 2.2353E-07 -0.0106 1.58947E-050.011732355 1.39602E-07 -0.00983 8.43605E-08 0.001671 1.82699E-07 -0.00872 1.29913E-05
0.08257773 9.82301E-07 -0.06918 6.07052E-07 0.011759 1.28555E-06 -0.06137 9.14127E-050.001263484 1.51684E-08 -0.00106 2.73197E-09 0.00018 1.98512E-08 -0.00094 1.41157E-060.003339209 3.98725E-08 -0.0028 1.74098E-08 0.000476 5.21818E-08 -0.00248 3.71052E-060.000270747 3.39787E-09 -0.00023 -6.38638E-09 3.86E-05 4.44685E-09 -0.0002 3.16205E-070.006949164 8.25755E-08 -0.00582 5.52478E-08 0.00099 1.08068E-07 -0.00516 7.68446E-063.609955422 4.28846E-05 -3.0243 2.92573E-05 0.51406 5.61238E-05 -2.6828 0.003990828
0 0 0 0 0 0 0 00 7.47596E-08 0 5.10036E-08 0 9.78392E-08 0 6.95711E-060 2.89202E-06 0 1.97303E-06 0 3.78483E-06 0 0.000269130 7.86944E-07 0 5.3688E-07 0 1.02989E-06 0 7.32327E-050 1.21976E-07 0 8.32164E-08 0 1.59632E-07 0 1.13511E-050 5.78797E-06 0 3.94875E-06 0 7.57482E-06 0 0.0005386270 6.29555E-08 0 4.29504E-08 0 8.23909E-08 0 5.85862E-060 1.18042E-08 0 8.0532E-09 0 1.54483E-08 0 1.09849E-060 5.82338E-07 0 3.97291E-07 0 7.62116E-07 0 5.41922E-050 2.40018E-07 0 1.63748E-07 0 3.14115E-07 0 2.2336E-050 3.54125E-08 0 2.41596E-08 0 4.63449E-08 0 3.29547E-060 1.3378E-07 0 9.12696E-08 0 1.75081E-07 0 1.24496E-050 1.02303E-06 0 6.97944E-07 0 1.33885E-06 0 9.52026E-050 3.93472E-08 0 2.6844E-08 0 5.14943E-08 0 3.66164E-060 2.36083E-08 0 1.61064E-08 0 3.08966E-08 0 2.19698E-060 5.78404E-07 0 3.94607E-07 0 7.56967E-07 0 5.38261E-05
1.910039205 0 -2.09899 0 0.271991 0 -1.41948 0

Sentinel-Butterfield Quarry Expansion ProjectSan Bernardino County, California
Toxics
om01_SBAlternativeAir_v1.4.xlsb 3 10/8/2013
Number of Sources19
CHEMICALarsenicbrominecadmiumchlorinecopperleadmanganesemercurynickelseleniumvanadium (fume or dust)Silica, CrystlnAsbestos1,3-butadieneacetaldehydebenzeneethyl benzeneformaldehydehexanemethanolmethyl ethyl ketone {2-butanonem-xylenenaphthaleneo-xylenepropylenep-xylenestyrenetolueneDieselExhPM
ID # of sources ID # of sources ID # of sources ID # of sources ID # of sourcesK 80 L 20 M 12 VOL1 1 VOL2 1
(lb/yr) (lb/hr) (lb/yr) (lb/hr) (lb/yr) (lb/hr) (lb/yr) (lb/hr) (lb/yr) (lb/hr)2.93341E-05 1.27673E-10 -0.00112 1.66799E-06 0 0 -0.6271584 -0.001046 -2.251914 -0.0037543.52009E-05 1.56008E-10 -0.00134 2.00534E-06 0 0 -0.391974 -0.000655 -1.407446 -0.0023482.54229E-05 1.60126E-10 -0.00097 1.51192E-06 0 0 -0.6271584 -0.001062 -2.251914 -0.0037710.00165053 7.04101E-09 -0.06291 9.36606E-05 0 0 -140.091507 -0.233503 -503.0212 -0.838387
0.000308985 1.41647E-09 -0.01178 1.76655E-05 0 0 -5.56603079 -0.009311 -19.98573 -0.0333470.000254229 1.09366E-09 -0.00969 1.44387E-05 0 0 -13.5623004 -0.022609 -48.69763 -0.0811690.001789378 7.67602E-09 -0.06821 0.000101597 0 0 -5.09566199 -0.008524 -18.2968 -0.0305292.73785E-05 1.28146E-10 -0.00104 1.56883E-06 0 0 -0.0783948 -0.000134 -0.281489 -0.0004737.23574E-05 3.22044E-10 -0.00276 4.12391E-06 0 0 -2.2734492 -0.003794 -8.163187 -0.0136115.86681E-06 3.88371E-11 -0.00022 3.51433E-07 0 0 -4.39010879 -0.007321 -15.76339 -0.0262770.000150582 6.39167E-10 -0.00574 8.54058E-06 0 0 -0.1567896 -0.000262 -0.562978 -0.0009390.078224169 3.31126E-07 -2.98169 0.004435444 0 0 -313.5792 -0.522632 -1125.957 -1.876595
0 0 0 0 0 0 0 0 0 00 2.75948E-08 0 7.7322E-06 0 0 0 -0.002027 0 -0.0017550 1.06748E-06 0 0.000299114 0 0 0 -0.078431 0 -0.0679080 2.90472E-07 0 8.13916E-05 0 0 0 -0.021342 0 -0.0184780 4.50231E-08 0 1.26157E-05 0 0 0 -0.003308 0 -0.0028640 2.13642E-06 0 0.000598635 0 0 0 -0.156968 0 -0.1359090 2.32377E-08 0 6.51132E-06 0 0 0 -0.001707 0 -0.0014780 4.35708E-09 0 1.22087E-06 0 0 0 -0.00032 0 -0.0002770 2.14949E-07 0 6.02298E-05 0 0 0 -0.015793 0 -0.0136740 8.85939E-08 0 2.48244E-05 0 0 0 -0.006509 0 -0.0056360 1.30712E-08 0 3.66262E-06 0 0 0 -0.00096 0 -0.0008320 4.93802E-08 0 1.38366E-05 0 0 0 -0.003628 0 -0.0031410 3.77613E-07 0 0.000105809 0 0 0 -0.027744 0 -0.0240220 1.45236E-08 0 4.06958E-06 0 0 0 -0.001067 0 -0.0009240 8.71415E-09 0 2.44175E-06 0 0 0 -0.00064 0 -0.0005540 2.13497E-07 0 5.98228E-05 0 0 0 -0.015686 0 -0.013582
0.016032001 0 -1.57762 0 0 0 -327.633166 0 -358.7551 0

Sentinel-Butterfield Quarry Expansion ProjectSan Bernardino County, California
Toxics
om01_SBAlternativeAir_v1.4.xlsb 4 10/8/2013
Number of Sources19
CHEMICALarsenicbrominecadmiumchlorinecopperleadmanganesemercurynickelseleniumvanadium (fume or dust)Silica, CrystlnAsbestos1,3-butadieneacetaldehydebenzeneethyl benzeneformaldehydehexanemethanolmethyl ethyl ketone {2-butanonem-xylenenaphthaleneo-xylenepropylenep-xylenestyrenetolueneDieselExhPM
ID # of sources ID # of sources ID # of sources ID # of sourcesVOL3 1 VOL4 1 VOL5 1 VOL6 1(lb/yr) (lb/hr) (lb/yr) (lb/hr) (lb/yr) (lb/hr) (lb/yr) (lb/hr)
0 0 -0.821704 -0.001370304 -0.821704 -0.001369541 0.115476 0.0001925130 0 -0.513565 -0.000857538 -0.513565 -0.000856011 0.072172 0.0001203940 0 -0.821704 -0.001381485 -0.821704 -0.001370033 0.115476 0.0001932590 0 -183.548 -0.305925746 -183.548 -0.305913912 25.7944 0.0429915010 0 -7.292619 -0.012179122 -7.292619 -0.012155455 1.024848 0.0017097320 0 -17.76934 -0.029619557 -17.76934 -0.02961574 2.497164 0.0041622070 0 -6.676341 -0.011150395 -6.676341 -0.011128255 0.938241 0.0015652810 0 -0.102713 -0.000173983 -0.102713 -0.000171311 0.014434 2.4244E-050 0 -2.978675 -0.004968053 -2.978675 -0.004964617 0.4186 0.0006979060 0 -5.751925 -0.009589735 -5.751925 -0.009586682 0.808331 0.0013474310 0 -0.205426 -0.000342776 -0.205426 -0.000342394 0.028869 4.81416E-050 0 -410.8518 -0.68475292 -410.8518 -0.68475292 57.7379 0.0962298260 0 0 0 0 0 0 00 0 0 -5.1631E-05 0 -5.1631E-05 0 7.38573E-050 0 0 -0.001997304 0 -0.001997304 0 0.0028571110 0 0 -0.000543484 0 -0.000543484 0 0.0007774450 0 0 -8.424E-05 0 -8.424E-05 0 0.0001205040 0 0 -0.003997326 0 -0.003997326 0 0.005718110 0 0 -4.34787E-05 0 -4.34787E-05 0 6.21956E-050 0 0 -8.15226E-06 0 -8.15226E-06 0 1.16617E-050 0 0 -0.000402178 0 -0.000402178 0 0.000575310 0 0 -0.000165763 0 -0.000165763 0 0.0002371210 0 0 -2.44568E-05 0 -2.44568E-05 0 3.4985E-050 0 0 -9.23923E-05 0 -9.23923E-05 0 0.0001321660 0 0 -0.000706529 0 -0.000706529 0 0.0010106790 0 0 -2.71742E-05 0 -2.71742E-05 0 3.88723E-050 0 0 -1.63045E-05 0 -1.63045E-05 0 2.33234E-050 0 0 -0.000399461 0 -0.000399461 0 0.0005714220 0 -10.55162 0 -10.55162 0 15.99162 0
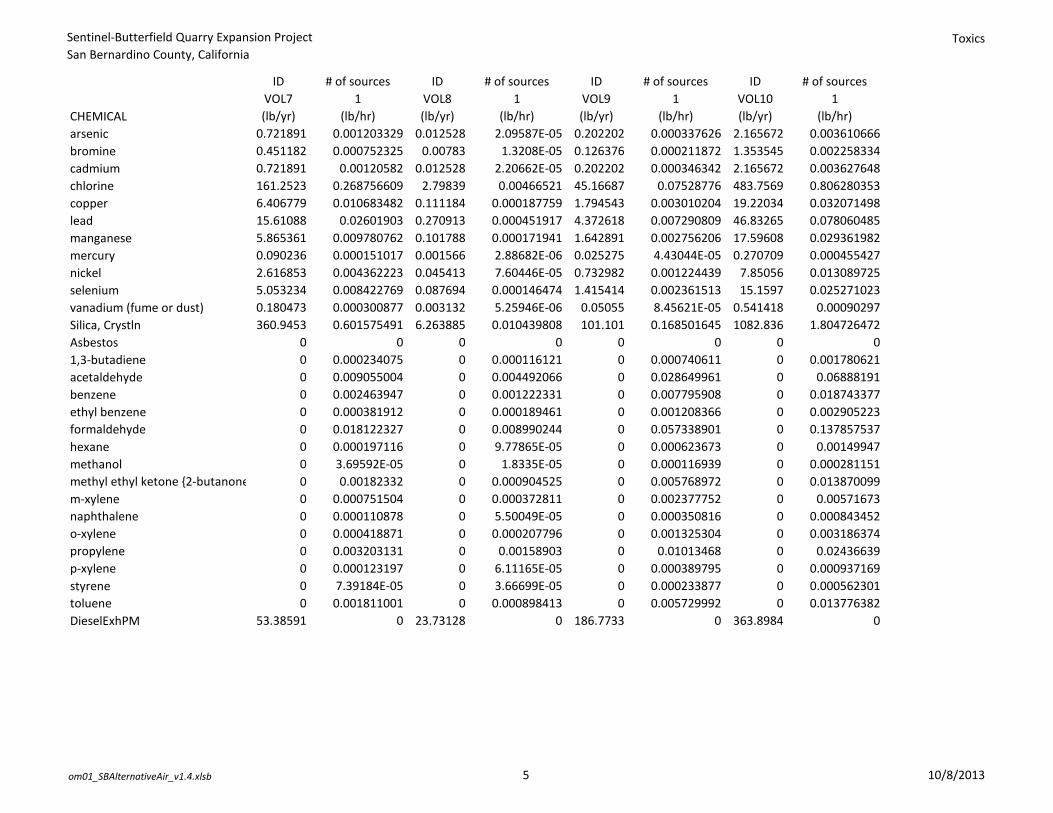
Sentinel-Butterfield Quarry Expansion ProjectSan Bernardino County, California
Toxics
om01_SBAlternativeAir_v1.4.xlsb 5 10/8/2013
Number of Sources19
CHEMICALarsenicbrominecadmiumchlorinecopperleadmanganesemercurynickelseleniumvanadium (fume or dust)Silica, CrystlnAsbestos1,3-butadieneacetaldehydebenzeneethyl benzeneformaldehydehexanemethanolmethyl ethyl ketone {2-butanonem-xylenenaphthaleneo-xylenepropylenep-xylenestyrenetolueneDieselExhPM
ID # of sources ID # of sources ID # of sources ID # of sourcesVOL7 1 VOL8 1 VOL9 1 VOL10 1(lb/yr) (lb/hr) (lb/yr) (lb/hr) (lb/yr) (lb/hr) (lb/yr) (lb/hr)
0.721891 0.001203329 0.012528 2.09587E-05 0.202202 0.000337626 2.165672 0.0036106660.451182 0.000752325 0.00783 1.3208E-05 0.126376 0.000211872 1.353545 0.0022583340.721891 0.00120582 0.012528 2.20662E-05 0.202202 0.000346342 2.165672 0.003627648161.2523 0.268756609 2.79839 0.00466521 45.16687 0.07528776 483.7569 0.8062803536.406779 0.010683482 0.111184 0.000187759 1.794543 0.003010204 19.22034 0.03207149815.61088 0.02601903 0.270913 0.000451917 4.372618 0.007290809 46.83265 0.0780604855.865361 0.009780762 0.101788 0.000171941 1.642891 0.002756206 17.59608 0.0293619820.090236 0.000151017 0.001566 2.88682E-06 0.025275 4.43044E-05 0.270709 0.0004554272.616853 0.004362223 0.045413 7.60446E-05 0.732982 0.001224439 7.85056 0.0130897255.053234 0.008422769 0.087694 0.000146474 1.415414 0.002361513 15.1597 0.0252710230.180473 0.000300877 0.003132 5.25946E-06 0.05055 8.45621E-05 0.541418 0.00090297360.9453 0.601575491 6.263885 0.010439808 101.101 0.168501645 1082.836 1.804726472
0 0 0 0 0 0 0 00 0.000234075 0 0.000116121 0 0.000740611 0 0.0017806210 0.009055004 0 0.004492066 0 0.028649961 0 0.068881910 0.002463947 0 0.001222331 0 0.007795908 0 0.0187433770 0.000381912 0 0.000189461 0 0.001208366 0 0.0029052230 0.018122327 0 0.008990244 0 0.057338901 0 0.1378575370 0.000197116 0 9.77865E-05 0 0.000623673 0 0.001499470 3.69592E-05 0 1.8335E-05 0 0.000116939 0 0.0002811510 0.00182332 0 0.000904525 0 0.005768972 0 0.0138700990 0.000751504 0 0.000372811 0 0.002377752 0 0.005716730 0.000110878 0 5.50049E-05 0 0.000350816 0 0.0008434520 0.000418871 0 0.000207796 0 0.001325304 0 0.0031863740 0.003203131 0 0.00158903 0 0.01013468 0 0.024366390 0.000123197 0 6.11165E-05 0 0.000389795 0 0.0009371690 7.39184E-05 0 3.66699E-05 0 0.000233877 0 0.0005623010 0.001811001 0 0.000898413 0 0.005729992 0 0.013776382
53.38591 0 23.73128 0 186.7733 0 363.8984 0

Sentinel-Butterfield Quarry Expansion ProjectSan Bernardino County, California
Mitigated Summary
om01_SBAlternativeAir_v1.4.xlsb 1 10/8/2013
Total Sentinel Butterfield Total White Knob Total Processing Plant
Total Project w/o White Knob Reductions
Total Project w/ White Knob Reductions
HC 1.61 -0.97 0.01 1.63 0.66NOx 29.0 -15.8 0.10 29.06 13.2CO 19.9 -14.2 0.07 19.93 5.8SOx 0.0013 -0.0006 0.0000 0.0013 0.0008TSP 102 -112 3.57 105.37 -7PM10 36.7 -41.7 0.62 37.34 -4.3PM2.5 7.1 -11.0 0.17 7.27 -3.7CO2 5,980 -2,765 28.3 6,008.02 3,243

Sentinel-Butterfield Quarry Expansion ProjectSan Bernardino County, California
Mitigated Road Emissions
om01_SBAlternativeAir_v1.4.xlsb 1 10/8/2013
BaselineA Bper Year per Day per Hour per Year per Day per Hour
VMT (miles) 1,618.07 15.34 1.84 962.78 11.05 1.33VMT (%) 1.21% 0.99% 1.05% 0.72% 0.71% 0.76%TSP - Dust 6,018.41 57.06 6.85 3,581.04 41.09 4.93PM10 - Dust 1,711.42 16.23 1.95 1,018.32 11.68 1.40PM2.5 - Dust 171.14 1.62 0.19 101.83 1.17 0.14TSP - Exhaust 36.22 0.34 0.04 21.55 0.25 0.03PM10 - Exhaust 36.22 0.34 0.04 21.55 0.25 0.03PM2.5 - Exhaust 33.32 0.32 0.04 19.83 0.23 0.03HC 62.81 0.60 0.07 37.37 0.43 0.05NOx 1,160 11.00 1.32 690 7.92 0.95CO 757 7.17 0.86 450 5.17 0.62SOx 0.05 0.00 0.00 0.03 0.00 0.00CO2 121.05 - - 72.03 - -
Project 1.31 scale factor from Project VMT/yr over Baseline VMT/yrA Bper Year per Day per Hour per Year per Day per Hour
VMT (miles) 3,006.10 24.48 2.94 5,652.50 46.04 5.52VMT (%) 1.72% 1.33% 1.42% 3.23% 2.51% 2.67%TSP - Dust 8,944.95 72.85 8.74 16,819.56 136.98 16.44PM10 - Dust 2,543.62 20.72 2.49 4,782.88 38.95 4.67PM2.5 - Dust 254.36 2.07 0.25 478.29 3.90 0.47TSP - Exhaust 67.29 0.55 0.07 126.53 1.03 0.12PM10 - Exhaust 67.29 0.55 0.07 126.53 1.03 0.12PM2.5 - Exhaust 61.91 0.50 0.06 116.41 0.95 0.11HC 116.69 0.95 0.11 219.42 1.79 0.21NOx 2,154.99 17.55 2.11 4,052.12 33.00 3.96CO 1,405.81 11.45 1.37 2,643.41 0.85 0.10SOx 0.09 0.00 0.00 0.17 0.00 0.00CO2 (tons) 224.89 - - 422.86 - -
IncrementA Bper Year per Day per Hour per Year per Day per Hour
VMT (miles) 1,388.03 9.14 1.10 4,689.72 34.99 4.20TSP - Dust 2,926.54 15.79 1.89 13,238.51 95.90 11.51PM10 - Dust 832.20 4.49 0.54 3,764.56 27.27 3.27PM2.5 - Dust 83.22 0.45 0.05 376.46 2.73 0.33TSP - Exhaust 31.07 0.20 0.02 104.98 0.78 0.09PM10 - Exhaust 31.07 0.20 0.02 104.98 0.78 0.09PM2.5 - Exhaust 28.59 0.19 0.02 96.58 0.72 0.09HC 53.88 0.35 0.04 182.04 1.36 0.16NOx 995.04 6.55 0.79 3,361.94 25.08 3.01CO 649.12 4.27 0.51 2,193.16 -4.31 -0.52SOx 0.04 0.00 0.00 0.14 0.00 0.00CO2 (tons) 103.84 - - 350.84 - -

Sentinel-Butterfield Quarry Expansion ProjectSan Bernardino County, California
Mitigated Road Emissions
om01_SBAlternativeAir_v1.4.xlsb 2 10/8/2013
Baseline
VMT (miles)VMT (%)TSP - DustPM10 - DustPM2.5 - DustTSP - ExhaustPM10 - ExhaustPM2.5 - ExhaustHCNOxCOSOxCO2
Project
VMT (miles)VMT (%)TSP - DustPM10 - DustPM2.5 - DustTSP - ExhaustPM10 - ExhaustPM2.5 - ExhaustHCNOxCOSOxCO2 (tons)
Increment
VMT (miles)TSP - DustPM10 - DustPM2.5 - DustTSP - ExhaustPM10 - ExhaustPM2.5 - ExhaustHCNOxCOSOxCO2 (tons)
C Dper Year per Day per Hour per Year per Day per Hour
1,355.33 16.39 1.97 - - -1.01% 1.05% 1.13% 0.00% 0.00% 0.00%
5,041.15 60.95 7.31 - - -1,433.52 17.33 2.08 - - -
143.35 1.73 0.21 - - -30.34 0.37 0.04 - - -30.34 0.37 0.04 - - -27.91 0.34 0.04 - - -52.61 0.64 0.08 - - -
972 11.75 1.41 - - -634 7.66 0.92 - - -
0.04 0.00 0.00 - - -101.39 - - - - -
C Dper Year per Day per Hour per Year per Day per Hour
4,662.54 37.97 4.56 - - -2.66% 2.07% 2.20% 0.00% 0.00% 0.00%
13,873.84 112.99 13.56 - - -3,945.22 32.13 3.86 - - -
394.52 3.21 0.39 - - -104.37 0.85 0.10 - - -104.37 0.85 0.10 - - -
96.02 0.78 0.09 - - -180.99 1.47 0.18 - - -
3,342.45 27.22 3.27 - - -2,180.45 17.76 2.13 - - -
0.14 0.00 0.00 - - -348.80 - - - - -
C Dper Year per Day per Hour per Year per Day per Hour
3,307.21 21.59 2.59 - - -8,832.70 52.05 6.25 - - -2,511.70 14.80 1.78 - - -
251.17 1.48 0.18 - - -74.03 0.48 0.06 - - -74.03 0.48 0.06 - - -68.11 0.44 0.05 - - -
128.38 0.84 0.10 - - -2,370.85 15.48 1.86 - - -1,546.63 10.10 1.21 - - -
0.10 0.00 0.00 - - -247.41 - - - - -

Sentinel-Butterfield Quarry Expansion ProjectSan Bernardino County, California
Mitigated Road Emissions
om01_SBAlternativeAir_v1.4.xlsb 3 10/8/2013
Baseline
VMT (miles)VMT (%)TSP - DustPM10 - DustPM2.5 - DustTSP - ExhaustPM10 - ExhaustPM2.5 - ExhaustHCNOxCOSOxCO2
Project
VMT (miles)VMT (%)TSP - DustPM10 - DustPM2.5 - DustTSP - ExhaustPM10 - ExhaustPM2.5 - ExhaustHCNOxCOSOxCO2 (tons)
Increment
VMT (miles)TSP - DustPM10 - DustPM2.5 - DustTSP - ExhaustPM10 - ExhaustPM2.5 - ExhaustHCNOxCOSOxCO2 (tons)
E Fper Year per Day per Hour per Year per Day per Hour
8,012.74 93.45 11.21 - - -6.00% 6.01% 6.42% 0.00% 0.00% 0.00%
29,803.34 347.60 41.71 - - -8,475.00 98.85 11.86 - - -
847.50 9.88 1.19 - - -179.37 2.09 0.25 - - -179.37 2.09 0.25 - - -165.02 1.92 0.23 - - -311.04 3.63 0.44 - - -
5,744 66.99 8.04 - - -3,747 43.70 5.24 - - -
0.24 0.00 0.00 - - -599.43 - - - - -
E Fper Year per Day per Hour per Year per Day per Hour
30,498.31 248.39 29.81 - - -17.41% 13.54% 14.39% 0.00% 0.00% 0.00%
90,750.67 739.11 88.69 - - -25,806.22 210.18 25.22 - - -
2,580.62 21.02 2.52 - - -682.71 5.56 0.67 - - -682.71 5.56 0.67 - - -628.09 5.12 0.61 - - -
1,183.88 9.64 1.16 - - -21,863.41 178.06 21.37 - - -14,262.62 116.16 13.94 - - -
0.91 0.01 0.00 - - -2,281.57 - - - - -
E Fper Year per Day per Hour per Year per Day per Hour
22,485.58 154.94 18.59 - - -60,947.33 391.50 46.98 - - -17,331.22 111.33 13.36 - - -
1,733.12 11.13 1.34 - - -503.34 3.47 0.42 - - -503.34 3.47 0.42 - - -463.07 3.19 0.38 - - -872.84 6.01 0.72 - - -
16,119.30 111.07 13.33 - - -10,515.44 72.46 8.69 - - -
0.67 0.00 0.00 - - -1,682.14 - - - - -

Sentinel-Butterfield Quarry Expansion ProjectSan Bernardino County, California
Mitigated Road Emissions
om01_SBAlternativeAir_v1.4.xlsb 4 10/8/2013
Baseline
VMT (miles)VMT (%)TSP - DustPM10 - DustPM2.5 - DustTSP - ExhaustPM10 - ExhaustPM2.5 - ExhaustHCNOxCOSOxCO2
Project
VMT (miles)VMT (%)TSP - DustPM10 - DustPM2.5 - DustTSP - ExhaustPM10 - ExhaustPM2.5 - ExhaustHCNOxCOSOxCO2 (tons)
Increment
VMT (miles)TSP - DustPM10 - DustPM2.5 - DustTSP - ExhaustPM10 - ExhaustPM2.5 - ExhaustHCNOxCOSOxCO2 (tons)
G Hper Year per Day per Hour per Year per Day per Hour
72,587.16 815.66 97.88 33,745.62 416.59 41.6654.34% 52.46% 56.04% 25.26% 26.79% 23.85%
269,987.62 3,033.83 364.06 125,516.67 1,549.49 154.9576,774.75 862.71 103.53 35,692.42 440.62 44.06
7,677.47 86.27 10.35 3,569.24 44.06 4.411,624.87 18.26 2.19 755.40 9.33 0.931,624.87 18.26 2.19 755.40 9.33 0.931,494.88 16.80 2.02 694.97 8.58 0.862,817.67 31.66 3.80 1,309.93 16.17 1.62
52,036 584.72 70.17 24,191 298.64 29.8633,946 381.44 45.77 15,781 194.82 19.48
2.17 0.02 0.00 1.01 0.01 0.005,430.22 - - 2,524.50 - -
G Hper Year per Day per Hour per Year per Day per Hour
100,488.89 818.42 98.21 19,162.95 418.00 41.8057.38% 44.61% 47.42% 10.94% 22.78% 20.18%
299,014.36 2,435.28 292.23 57,021.20 1,243.79 124.3885,028.91 692.51 83.10 16,214.77 353.69 35.37
8,502.89 69.25 8.31 1,621.48 35.37 3.542,249.45 18.32 2.20 327.21 7.14 0.712,249.45 18.32 2.20 327.21 7.14 0.712,069.50 16.85 2.02 301.03 6.57 0.663,900.76 31.77 3.81 743.86 16.23 1.62
72,037.76 586.70 70.40 13,737.40 299.65 29.9746,993.91 382.74 45.93 8,961.61 195.48 19.55
3.00 0.02 0.00 0.57 0.01 0.007,517.54 - - 1,433.57 - -
G Hper Year per Day per Hour per Year per Day per Hour
27,901.72 2.76 0.33 -14,582.67 1.41 0.1429,026.74 -598.55 -71.83 -68,495.47 -305.70 -30.57
8,254.16 -170.21 -20.42 -19,477.64 -86.93 -8.69825.42 -17.02 -2.04 -1,947.76 -8.69 -0.87624.58 0.06 0.01 -428.19 -2.19 -0.22624.58 0.06 0.01 -428.19 -2.19 -0.22574.62 0.06 0.01 -393.94 -2.01 -0.20
1,083.08 0.11 0.01 -566.07 0.05 0.0120,001.99 1.98 0.24 -10,453.92 1.01 0.1013,048.32 1.29 0.16 -6,819.63 0.66 0.07
0.83 0.00 0.00 -0.44 0.00 0.002,087.32 - - -1,090.93 - -

Sentinel-Butterfield Quarry Expansion ProjectSan Bernardino County, California
Mitigated Road Emissions
om01_SBAlternativeAir_v1.4.xlsb 5 10/8/2013
Baseline
VMT (miles)VMT (%)TSP - DustPM10 - DustPM2.5 - DustTSP - ExhaustPM10 - ExhaustPM2.5 - ExhaustHCNOxCOSOxCO2
Project
VMT (miles)VMT (%)TSP - DustPM10 - DustPM2.5 - DustTSP - ExhaustPM10 - ExhaustPM2.5 - ExhaustHCNOxCOSOxCO2 (tons)
Increment
VMT (miles)TSP - DustPM10 - DustPM2.5 - DustTSP - ExhaustPM10 - ExhaustPM2.5 - ExhaustHCNOxCOSOxCO2 (tons)
I Jper Year per Day per Hour per Year per Day per Hour
1,204.93 14.10 1.57 8,719.27 106.44 10.640.90% 0.91% 0.90% 6.53% 6.85% 6.09%
4,481.74 52.45 5.83 32,431.27 395.90 39.591,274.45 14.92 1.66 9,222.28 112.58 11.26
127.44 1.49 0.17 922.23 11.26 1.1326.97 0.32 0.04 195.18 2.38 0.2426.97 0.32 0.04 195.18 2.38 0.2424.81 0.29 0.03 179.57 2.19 0.2246.77 0.55 0.06 338.46 4.13 0.41
864 10.11 1.12 6,251 76.30 7.63563 6.59 0.73 4,078 49.78 4.98
0.04 0.00 0.00 0.26 0.00 0.0090.14 - - 652.29 - -
I Jper Year per Day per Hour per Year per Day per Hour
1,253.54 14.15 1.57 6,436.44 140.40 14.040.72% 0.77% 0.76% 3.68% 7.65% 6.78%
3,730.02 42.10 4.68 19,152.25 417.76 41.781,060.68 11.97 1.33 5,446.21 118.80 11.88
106.07 1.20 0.13 544.62 11.88 1.1928.06 0.32 0.04 144.08 3.14 0.3128.06 0.32 0.04 144.08 3.14 0.3125.82 0.29 0.03 132.55 2.89 0.2948.66 0.55 0.06 249.85 5.45 0.54
898.63 10.14 1.13 4,614.11 100.65 10.06586.22 6.62 0.74 3,010.02 65.66 6.57
0.04 0.00 0.00 0.19 0.00 0.0093.78 - - 481.51 - -
I Jper Year per Day per Hour per Year per Day per Hour
48.60 0.05 0.01 -2,282.82 33.96 3.40-751.73 -10.35 -1.15 -13,279.01 21.87 2.19-213.76 -2.94 -0.33 -3,776.07 6.22 0.62
-21.38 -0.29 -0.03 -377.61 0.62 0.061.09 0.00 0.00 -51.10 0.76 0.081.09 0.00 0.00 -51.10 0.76 0.081.00 0.00 0.00 -47.01 0.70 0.071.89 0.00 0.00 -88.61 1.32 0.13
34.84 0.03 0.00 -1,636.49 24.34 2.4322.73 0.02 0.00 -1,067.57 15.88 1.59
0.00 0.00 0.00 -0.07 0.00 0.003.64 - - -170.78 - -

Sentinel-Butterfield Quarry Expansion ProjectSan Bernardino County, California
Mitigated Road Emissions
om01_SBAlternativeAir_v1.4.xlsb 6 10/8/2013
Baseline
VMT (miles)VMT (%)TSP - DustPM10 - DustPM2.5 - DustTSP - ExhaustPM10 - ExhaustPM2.5 - ExhaustHCNOxCOSOxCO2
Project
VMT (miles)VMT (%)TSP - DustPM10 - DustPM2.5 - DustTSP - ExhaustPM10 - ExhaustPM2.5 - ExhaustHCNOxCOSOxCO2 (tons)
Increment
VMT (miles)TSP - DustPM10 - DustPM2.5 - DustTSP - ExhaustPM10 - ExhaustPM2.5 - ExhaustHCNOxCOSOxCO2 (tons)
K Lper Year per Day per Hour per Year per Day per Hour
20,421.14 239.00 26.56 5,383.71 65.72 6.570.00% 0.00% 0.00% 4.03% 4.23% 3.76%
751.91 8.80 0.98 20,024.68 244.45 24.44150.38 1.76 0.20 5,694.30 69.51 6.95
36.91 0.43 0.05 569.43 6.95 0.7031.80 0.37 0.04 120.51 1.47 0.1531.80 0.37 0.04 120.51 1.47 0.1529.25 0.34 0.04 110.87 1.35 0.1429.32 0.34 0.04 208.98 2.55 0.26
553.40 6.48 0.72 3,859 47.11 4.71132.81 1.55 0.17 2,518 30.73 3.07
0.72 0.01 0.00 0.16 0.00 0.00 - - - 402.75 - -
K Lper Year per Day per Hour per Year per Day per Hour
21,244.85 239.81 26.65 3,974.18 86.69 8.670.00% 0.00% 0.00% 2.27% 4.73% 4.19%
782.24 8.83 0.98 - - -156.45 1.77 0.20 3,362.76 73.35 7.34
38.40 0.43 0.05 336.28 7.34 0.7333.08 0.37 0.04 88.96 1.94 0.1933.08 0.37 0.04 88.96 1.94 0.1930.43 0.34 0.04 81.85 1.79 0.1830.50 0.34 0.04 154.27 3.37 0.34
575.72 6.50 0.72 2,848.98 62.14 6.21138.17 1.56 0.17 1,858.54 40.54 4.05
0.75 0.01 0.00 0.12 0.00 0.00 - - - 297.31 - -
K Lper Year per Day per Hour per Year per Day per Hour
823.71 0.81 0.09 -1,409.53 20.97 2.1030.33 0.03 0.00 -20,024.68 -244.45 -24.44
6.07 0.01 0.00 -2,331.53 3.84 0.381.49 0.00 0.00 -233.15 0.38 0.041.28 0.00 0.00 -31.55 0.47 0.051.28 0.00 0.00 -31.55 0.47 0.051.18 0.00 0.00 -29.03 0.43 0.041.18 0.00 0.00 -54.71 0.81 0.08
22.32 0.02 0.00 -1,010.45 15.03 1.505.36 0.01 0.00 -659.17 9.81 0.980.03 0.00 0.00 -0.04 0.00 0.00
- - - -105.45 - -

Sentinel-Butterfield Quarry Expansion ProjectSan Bernardino County, California
Mitigated Road Emissions
om01_SBAlternativeAir_v1.4.xlsb 7 10/8/2013
Baseline
VMT (miles)VMT (%)TSP - DustPM10 - DustPM2.5 - DustTSP - ExhaustPM10 - ExhaustPM2.5 - ExhaustHCNOxCOSOxCO2
Project
VMT (miles)VMT (%)TSP - DustPM10 - DustPM2.5 - DustTSP - ExhaustPM10 - ExhaustPM2.5 - ExhaustHCNOxCOSOxCO2 (tons)
Increment
VMT (miles)TSP - DustPM10 - DustPM2.5 - DustTSP - ExhaustPM10 - ExhaustPM2.5 - ExhaustHCNOxCOSOxCO2 (tons)
M Total On-siteper Year per Day per Hour per Year per Day per Hour
- - - 133,589.61 1,554.73 174.670.00% 0.00% 0.00% 100.00% 100.00% 100.00%
- - - 496,885.92 5,782.81 649.67 - - - 141,296.45 1,644.42 184.74 - - - 14,129.64 164.44 18.47 - - - 2,990.42 34.80 3.91 - - - 2,990.42 34.80 3.91 - - - 2,751.18 32.02 3.60 - - - 5,185.65 60.35 6.78 - - - 95,766.76 1,114.54 125.21 - - - 62,473.56 727.07 81.68 - - - 3.99 0.05 0.01 - - - 9,994
1.31M Total On-siteper Year per Day per Hour per Year per Day per Hour
- - - 175,135.46 1,834.53 207.120.00% 0.00% 0.00% 100.00% 100.00% 100.00%
- - - 509,306.85 5,200.88 590.50 - - - 148,191.27 1,552.29 175.25 - - - 14,819.13 155.23 17.53 - - - 3,818.66 38.85 4.41 - - - 3,818.66 38.85 4.41 - - - 3,513.17 35.74 4.06 - - - 6,798.37 71.21 8.04 - - - 125,549.85 1,315.13 148.48 - - - 76,303.04 761.11 86.54 - - - 5.23 0.05 0.01 - - - 13,101.83 - -
M Total On-siteper Year per Day per Hour per Year per Day per Hour
- - - 41,545.85 279.80 32.45 - - - 12,420.94 -581.94 -59.17 - - - 6,894.83 -92.13 -9.49 - - - 689.48 -9.21 -0.95 - - - 828.25 4.04 0.50 - - - 828.25 4.04 0.50 - - - 761.99 3.72 0.46 - - - 1,612.72 10.86 1.26 - - - 29,783.09 200.58 23.26 - - - 13,829.48 34.03 4.85 - - - 1.24 0.01 0.00 - - - 3,108.03 - -
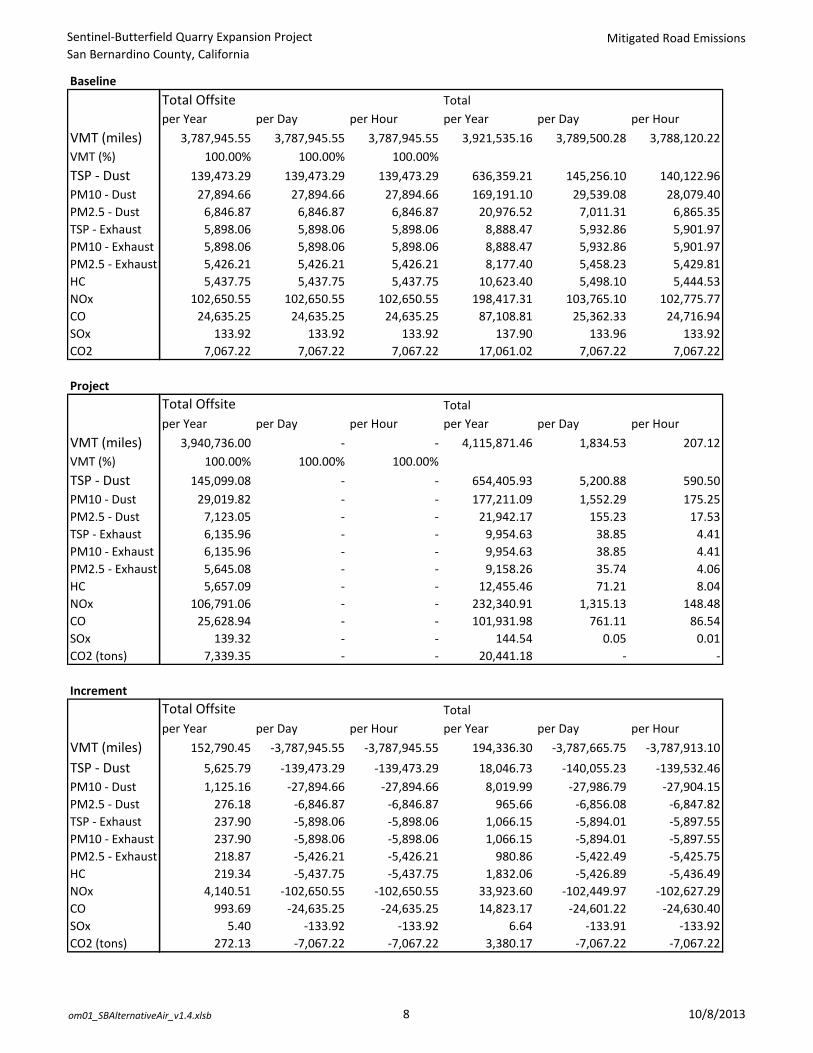
Sentinel-Butterfield Quarry Expansion ProjectSan Bernardino County, California
Mitigated Road Emissions
om01_SBAlternativeAir_v1.4.xlsb 8 10/8/2013
Baseline
VMT (miles)VMT (%)TSP - DustPM10 - DustPM2.5 - DustTSP - ExhaustPM10 - ExhaustPM2.5 - ExhaustHCNOxCOSOxCO2
Project
VMT (miles)VMT (%)TSP - DustPM10 - DustPM2.5 - DustTSP - ExhaustPM10 - ExhaustPM2.5 - ExhaustHCNOxCOSOxCO2 (tons)
Increment
VMT (miles)TSP - DustPM10 - DustPM2.5 - DustTSP - ExhaustPM10 - ExhaustPM2.5 - ExhaustHCNOxCOSOxCO2 (tons)
Total Offsite Totalper Year per Day per Hour per Year per Day per Hour
3,787,945.55 3,787,945.55 3,787,945.55 3,921,535.16 3,789,500.28 3,788,120.22100.00% 100.00% 100.00% 200.00% 200.00% 200.00%
139,473.29 139,473.29 139,473.29 636,359.21 145,256.10 140,122.9627,894.66 27,894.66 27,894.66 169,191.10 29,539.08 28,079.40
6,846.87 6,846.87 6,846.87 20,976.52 7,011.31 6,865.355,898.06 5,898.06 5,898.06 8,888.47 5,932.86 5,901.975,898.06 5,898.06 5,898.06 8,888.47 5,932.86 5,901.975,426.21 5,426.21 5,426.21 8,177.40 5,458.23 5,429.815,437.75 5,437.75 5,437.75 10,623.40 5,498.10 5,444.53
102,650.55 102,650.55 102,650.55 198,417.31 103,765.10 102,775.7724,635.25 24,635.25 24,635.25 87,108.81 25,362.33 24,716.94
133.92 133.92 133.92 137.90 133.96 133.927,067.22 7,067.22 7,067.22 17,061.02 7,067.22 7,067.22
Total Offsite Totalper Year per Day per Hour per Year per Day per Hour
3,940,736.00 - - 4,115,871.46 1,834.53 207.12100.00% 100.00% 100.00% 200.00% 200.00% 200.00%
145,099.08 - - 654,405.93 5,200.88 590.5029,019.82 - - 177,211.09 1,552.29 175.25
7,123.05 - - 21,942.17 155.23 17.536,135.96 - - 9,954.63 38.85 4.416,135.96 - - 9,954.63 38.85 4.415,645.08 - - 9,158.26 35.74 4.065,657.09 - - 12,455.46 71.21 8.04
106,791.06 - - 232,340.91 1,315.13 148.4825,628.94 - - 101,931.98 761.11 86.54
139.32 - - 144.54 0.05 0.017,339.35 - - 20,441.18 - -
Total Offsite Totalper Year per Day per Hour per Year per Day per Hour
152,790.45 -3,787,945.55 -3,787,945.55 194,336.30 -3,787,665.75 -3,787,913.105,625.79 -139,473.29 -139,473.29 18,046.73 -140,055.23 -139,532.461,125.16 -27,894.66 -27,894.66 8,019.99 -27,986.79 -27,904.15
276.18 -6,846.87 -6,846.87 965.66 -6,856.08 -6,847.82237.90 -5,898.06 -5,898.06 1,066.15 -5,894.01 -5,897.55237.90 -5,898.06 -5,898.06 1,066.15 -5,894.01 -5,897.55218.87 -5,426.21 -5,426.21 980.86 -5,422.49 -5,425.75219.34 -5,437.75 -5,437.75 1,832.06 -5,426.89 -5,436.49
4,140.51 -102,650.55 -102,650.55 33,923.60 -102,449.97 -102,627.29993.69 -24,635.25 -24,635.25 14,823.17 -24,601.22 -24,630.40
5.40 -133.92 -133.92 6.64 -133.91 -133.92272.13 -7,067.22 -7,067.22 3,380.17 -7,067.22 -7,067.22

Sentinel-Butterfield Quarry Expansion ProjectSan Bernardino County, California
Mitigated Criteria
om01_SBAlternativeAir_v1.4.xlsb 1 10/8/2013
21 VOL1 VOL2 VOL3 VOL4 VOL5 VOL6 VOL7 VOL8 VOL9 VOL10altMitTSPann -3.50E-01 -8.14E-01 0.00E+00 -3.00E-01 -3.00E-01 1.14E-01 2.60E-01 4.97E-03 2.06E-01 7.84E-01altMitTSPday -1.28E+00 -2.97E+00 0.00E+00 -1.09E+00 -1.09E+00 4.15E-01 9.50E-01 1.81E-02 7.52E-01 2.86E+00altMitPM10ann -1.17E-01 -4.10E-01 0.00E+00 -1.48E-01 -1.48E-01 2.10E-02 1.31E-01 2.59E-03 3.90E-02 3.95E-01altMitPM10day -4.29E-01 -1.50E+00 0.00E+00 -5.40E-01 -5.40E-01 7.66E-02 4.77E-01 9.47E-03 1.42E-01 1.44E+00altMitPM25ann -4.03E-02 -1.27E-01 0.00E+00 -5.23E-02 -5.23E-02 5.06E-03 3.03E-02 1.03E-03 1.45E-02 9.38E-02altMitPM25day -1.47E-01 -4.62E-01 0.00E+00 -1.91E-01 -1.91E-01 1.85E-02 1.11E-01 3.76E-03 5.31E-02 3.42E-01
TSPann (lb/yr/src) -24344.2 -56602.5 0 -20836.8 -20836.8 7899.8 18102.1 345.62535 14331.7 54510.2TSPday (lb/day/src) -243.442 -566.025 0 -208.368 -208.368 78.998 181.021 3.4562535 143.317 545.102PM10ann (lb/yr/src -8167.11 -28507.7 0 -10281.8 -10281.8 1459.44 9077.02 180.3284 2714.3 27434.8PM10day (lb/day/s -81.6711 -285.077 0 -102.818 -102.818 14.5944 90.7702 1.803284 27.143 274.348PM25ann (lb/yr/src -2803.9 -8798.71 0 -3636.89 -3636.89 351.818 2104.94 71.580398 1011.45 6518.57PM25day (lb/day/s -28.039 -87.9871 0 -36.3689 -36.3689 3.51818 21.0494 0.715804 10.1145 65.1857
TSPann (lb/yr) -24,344 -56,602 0 -20,837 -20,837 7,900 18,102 346 14,332 54,510TSPday (lb/day) -243 -566 0 -208 -208 79 181 3 143 545PM10ann (lb/yr) -8,167 -28,508 0 -10,282 -10,282 1,459 9,077 180 2,714 27,435PM10day (lb/day) -82 -285 0 -103 -103 15 91 2 27 274PM25ann (lb/yr) -2,804 -8,799 0 -3,637 -3,637 352 2,105 72 1,011 6,519PM25day (lb/day) -28 -88 0 -36 -36 4 21 1 10 65
HC (lb/yr) -640 -554 0 -16 -16 23 74 37 234 562NOx (lb/yr) -9,898 -8,146 0 -240 -240 174 1,097 539 5,164 8,263CO (lb/yr) -14,201 -5,306 0 -156 -156 112 516 351 5,533 5,382SOx (lb/yr) -0.305 -0.292 0 -0.009 -0.009 0.006 0.032 0.019 0.552 0.296CO2 (ton/yr) -584 -769 0 -23 -23 25 85 51 593 780TSP (lb/yr) -24,344 -56,602 0 -20,837 -20,837 7,900 18,102 346 14,332 54,510PM10 (lb/yr) -8,167 -28,508 0 -10,282 -10,282 1,459 9,077 180 2,714 27,435PM2.5 (lb/yr) -2,804 -8,799 0 -3,637 -3,637 352 2,105 72 1,011 6,519

Sentinel-Butterfield Quarry Expansion ProjectSan Bernardino County, California
Mitigated Criteria
om01_SBAlternativeAir_v1.4.xlsb 2 10/8/2013
21altMitTSPannaltMitTSPdayaltMitPM10annaltMitPM10dayaltMitPM25annaltMitPM25day
TSPann (lb/yr/src)TSPday (lb/day/src)PM10ann (lb/yr/srcPM10day (lb/day/sPM25ann (lb/yr/srcPM25day (lb/day/s
TSPann (lb/yr)TSPday (lb/day)PM10ann (lb/yr)PM10day (lb/day)PM25ann (lb/yr)PM25day (lb/day)
HC (lb/yr)NOx (lb/yr)CO (lb/yr)SOx (lb/yr)CO2 (ton/yr)TSP (lb/yr)PM10 (lb/yr)PM2.5 (lb/yr)
A B C E0 G H I J K L M1.12E-03 1.13E-02 9.15E-03 1.64E-02 1.30E-03 -4.86E-03 -2.70E-03 -5.33E-03 5.68E-06 -1.44E-02 0.00E+002.21E-03 2.99E-02 1.97E-02 3.84E-02 -9.61E-03 -7.92E-03 -1.36E-02 3.30E-03 2.04E-06 -6.40E-02 0.00E+003.27E-04 3.27E-03 2.66E-03 4.75E-03 3.91E-04 -1.40E-03 -7.65E-04 -1.53E-03 1.32E-06 -1.70E-03 0.00E+006.48E-04 8.66E-03 5.73E-03 1.12E-02 -2.73E-03 -2.29E-03 -3.86E-03 1.02E-03 4.74E-07 1.13E-03 0.00E+004.23E-05 4.00E-04 3.28E-04 5.85E-04 6.16E-05 -1.65E-04 -7.33E-05 -1.70E-04 4.80E-07 -1.89E-04 0.00E+008.80E-05 1.06E-03 7.22E-04 1.39E-03 -2.72E-04 -2.76E-04 -3.85E-04 1.93E-04 1.72E-07 2.14E-04 0.00E+00
77.83195 784.911 636.195 1137.98 90.676831 -337.861 -187.66 -370.281 0.39515 -1002.81 00.420822 5.68721 3.75225 7.31431 -1.83023 -1.50926 -2.58687 0.62854 0.00039 -12.1988 022.71775 227.62 184.695 330.27 27.152115 -97.5776 -53.1691 -106.31 0.09185 -118.154 0
0.12352 1.65021 1.09171 2.12589 -0.520316 -0.43685 -0.73542 0.19384 9E-05 0.21544 02.94226 27.8257 22.8057 40.6703 4.2814437 -11.4789 -5.09388 -11.795 0.03336 -13.1091 0
0.016767 0.2028 0.13748 0.26525 -0.051877 -0.05248 -0.07332 0.0367 3.3E-05 0.04079 0
2,958 13,343 8,907 61,451 29,651 -68,924 -751 -13,330 32 -20,056 016 97 53 395 -598 -308 -10 23 0 -244 0
863 3,870 2,586 17,835 8,879 -19,906 -213 -3,827 7 -2,363 05 28 15 115 -170 -89 -3 7 0 4 0
112 473 319 2,196 1,400 -2,342 -20 -425 3 -262 01 3 2 14 -17 -11 0 1 0 1 0
54 182 128 873 1,083 -566 2 -89 1 -55 0995 3,362 2,371 16,119 20,002 -10,454 35 -1,636 22 -1,010 0649 2,193 1,547 10,515 13,048 -6,820 23 -1,068 5 -659 0
0.041 0.140 0.099 0.671 0.833 -0.435 0.001 -0.068 0.029 -0.042 0104 351 247 1,682 2,087 -1,091 4 -171 0 -105 0
2,958 13,343 8,907 61,451 29,651 -68,924 -751 -13,330 32 -20,056 0863 3,870 2,586 17,835 8,879 -19,906 -213 -3,827 7 -2,363 0112 473 319 2,196 1,400 -2,342 -20 -425 3 -262 0

Sentinel-Butterfield Quarry Expansion ProjectSan Bernardino County, California
Mitigated Criteria
om01_SBAlternativeAir_v1.4.xlsb 3 10/8/2013
21altMitTSPannaltMitTSPdayaltMitPM10annaltMitPM10dayaltMitPM25annaltMitPM25day
TSPann (lb/yr/src)TSPday (lb/day/src)PM10ann (lb/yr/srcPM10day (lb/day/sPM25ann (lb/yr/srcPM25day (lb/day/s
TSPann (lb/yr)TSPday (lb/day)PM10ann (lb/yr)PM10day (lb/day)PM25ann (lb/yr)PM25day (lb/day)
HC (lb/yr)NOx (lb/yr)CO (lb/yr)SOx (lb/yr)CO2 (ton/yr)TSP (lb/yr)PM10 (lb/yr)PM2.5 (lb/yr)
Total Sentinel Butterfield Total White Knob
203,599 835 141 -224,930 -1,448 -227835 - - -1,755 - -
73,438 387 65 -83,335 -561 -94387 - - -650 - -
14,207 100 17 -21,905 -187 -31100 - - -197 - -
3,227 18 3 -1,937 -10 -257,912 311 44 -31,624 -146 -2739,735 202 30 -28,365 -173 -30
3 0 0 -1 - -5,980 15 3 -2,765 -14 -2
203,599 835 141 -224,930 -1,448 -22773,438 387 65 -83,335 -561 -9414,207 100 17 -21,905 -187 -31

Sentinel-Butterfield Quarry Expansion ProjectSan Bernardino County, California
Mitigated Criteria
om01_SBAlternativeAir_v1.4.xlsb 4 10/8/2013
21altMitTSPannaltMitTSPdayaltMitPM10annaltMitPM10dayaltMitPM25annaltMitPM25day
TSPann (lb/yr/src)TSPday (lb/day/src)PM10ann (lb/yr/srcPM10day (lb/day/sPM25ann (lb/yr/srcPM25day (lb/day/s
TSPann (lb/yr)TSPday (lb/day)PM10ann (lb/yr)PM10day (lb/day)PM25ann (lb/yr)PM25day (lb/day)
HC (lb/yr)NOx (lb/yr)CO (lb/yr)SOx (lb/yr)CO2 (ton/yr)TSP (lb/yr)PM10 (lb/yr)PM2.5 (lb/yr)
Total Processing Plant Total Project w/o White Knob
7,149 69 12 210,749 903 15369 - - 903 - -
1,247 12 2 74,685 398 6712 - - 398 - -
331 3 1 14,538 104 173 - - 104 - -
25 0 0 3,252 18 3209 2 0 58,121 313 45134 1 0 39,869 203 30
0 0 0 3 0 028 0 0 6,008 15 3
7,149 69 12 210,749 903 1531,247 12 2 74,685 398 67
331 3 1 14,538 104 17

Sentinel-Butterfield Quarry Expansion ProjectSan Bernardino County, California
Mitigated Criteria
om01_SBAlternativeAir_v1.4.xlsb 5 10/8/2013
21altMitTSPannaltMitTSPdayaltMitPM10annaltMitPM10dayaltMitPM25annaltMitPM25day
TSPann (lb/yr/src)TSPday (lb/day/src)PM10ann (lb/yr/srcPM10day (lb/day/sPM25ann (lb/yr/srcPM25day (lb/day/s
TSPann (lb/yr)TSPday (lb/day)PM10ann (lb/yr)PM10day (lb/day)PM25ann (lb/yr)PM25day (lb/day)
HC (lb/yr)NOx (lb/yr)CO (lb/yr)SOx (lb/yr)CO2 (ton/yr)TSP (lb/yr)PM10 (lb/yr)PM2.5 (lb/yr)
Total Project w/ White Knob Volume Source Identifiers LOCATION VOL1 VOLUME 498771.228 3802380.117 0** DESCRSRC White Knob Crushing LOCATION VOL2 VOLUME 498410.694 3802532.330 0** DESCRSRC White Knob Pit LOCATION VOL3 VOLUME 499367.635 3802416.274 0** DESCRSRC White Ridge Pit LOCATION VOL4 VOLUME 499169.967 3802653.553 0
-14,182 -544 -74 ** DESCRSRC OB1 -852 - - LOCATION VOL5 VOLUME 498786.819 3802108.559 0
-8,650 -163 -27 ** DESCRSRC OB2 -252 - - LOCATION VOL6 VOLUME 505294.247 3804607.151 0
-7,367 -83 -14 ** DESCRSRC Processing Plant -94 - - LOCATION VOL7 VOLUME 504322.000 3798695.000 0
** DESCRSRC Butterfield Pit1,316 8 1 LOCATION VOL8 VOLUME 505430.000 3797960.000 0
26,497 167 18 ** DESCRSRC B5 Pad Expansion11,504 30 -1 ** DESCRSRC Butterfield-Sentinel Crushing
2 0 0 LOCATION VOL10 VOLUME 505808.000 3798770.000 03,243 1 0 ** DESCRSRC Sentinel Pit
-14,182 -544 -74 -8,650 -163 -27 -7,367 -83 -14

Butterfield and Sentinel Quarries Expansion Air Quality and Greenhouse Gas Impact Assessment San Bernardino National Forest October 25, 2017
OM01_SB-AQHRCCIA_fnl.docx Sespe Consulting, Inc.
Appendix M: Modeling Files on Electronic Media

Butterfield and Sentinel Quarries Expansion Air Quality and Greenhouse Gas Impact Assessment San Bernardino National Forest October 25, 2017
OM01_SB-AQHRCCIA_fnl.docx Sespe Consulting, Inc.
Appendix N: Excerpt from Air Quality Study for Proposed South Quarry Project

Air Quality Study for Proposed South Quarry Project in Lucerne Valley, California
Mitsubishi Cement Corporation
Copyright ©2016, Yorke Engineering, LLC 73
8.0 CLASS I AREA ANALYSIS
As discussed in Section 2.0, this Project is not subject to either PSD or a conformity analysis. This
section discusses the Class I area analysis, which is a CEQA/NEPA requirement.
For both the construction and operational phases, the emission increase associated with the mine
expansion is less than 25 tpy of NOx, less than 15 tpy of PM10, and less than 2 tpy of PM2.5, and
the Project will be below the MDAQMD and CEQA significance thresholds. The SO2 increase
associated with the Project is less than 0.05 tpy and is considered negligible.
For all of the discussion in Section 8.0, we are using the project emissions increase of 0.1 tons/year
for NOx emissions and 15 tons/year for PM10 emissions (rounded up from 14.2 tons/year, for
simplicity).
8.1 Federal Land Manager (FLM) Requirements for Class I Areas
Class I areas are designated in 40 CFR Part 81 and are defined as areas of special national or
regional value from a natural, scenic, recreational, or historic perspective. Mandatory federal Class
I areas include the following areas in existence on August 7, 1977:
International parks;
National wilderness areas that exceed 5,000 acres in size;
National memorial parks that exceed 5,000 acres in size; and
National parks that exceed 6,000 acres in size.
These areas are administered by the National Park Service (NPS), the USFS, or the United States
Fish and Wildlife Service (USFWS). These FLMs are also responsible for evaluating a project’s
air quality impacts in the Class I areas and may make recommendations to the permitting agency
to approve or deny permit applications. The FLMs are also responsible for preparing NEPA
documents for sources located on federal lands. The FLM is typically consulted prior to the
preparation of the NEPA document, which allows the FLM to assess the need for a Class I area
impact analysis and provides the source the opportunity to provide their own analysis and data to
support the NEPA process.
The FLM has authority under the CAA to require impact analyses if any source is thought to impact
the air quality related values (AQRVs) in a Class I area. Class I area impact analyses were
historically performed for proposed projects located within 100 kilometers (km) of a Class I area,
although this has been extended to 300 km for some large projects.
The nearest Class I area to the Project is the San Gorgonio Wilderness located approximately 21
km to the south of the Project in the San Bernardino National Forest. Other Class I areas located
within 100 km of the facility are presented in Figure 1-5. All are under USFS management, except
for Joshua Tree National Park, which is located 48 km from the site and is under the management
of the NPS. Therefore, the only Class I areas that are located within 50 km of the source are the
San Gorgonio Wilderness and Joshua Tree National Park.
The Class I area analysis typically consists of:
An analysis of impacts on other AQRVs, such as impacts to flora and fauna, water, and
cultural resources (AQRV impact analysis), which includes:

Air Quality Study for Proposed South Quarry Project in Lucerne Valley, California
Mitsubishi Cement Corporation
Copyright ©2016, Yorke Engineering, LLC 74
A Visibility Impairment Analysis (VIA);
An ozone impact analysis; and
An Acid Deposition Analysis (ADA).
8.2 AQRV Impact Analysis
The FLM Air Quality Related Values Work Group (FLAG) has published two FLM guidance
documents, both titled Phase I Report. The first was published in December 2000 and an updated
document was published in November 2010. These documents provide procedures the FLM
should use for determining AQRVs in Class I areas and the procedures the applicant should use to
evaluate impacts on AQRVs. To the extent practical, procedures described in the 2010 FLAG
Phase I Report have been employed to demonstrate the likelihood that the Project will not result
in adverse impacts to the region’s Class I areas.
Prior to the establishment of FLAG and its predecessor, the Interagency Workgroup on Air Quality
Modeling (IWAQM), the various FLMs had little coordination on how to implement the
requirements for Class I areas. The IWAQM and FLAG reports have allowed the FLMs to act on
Class I area analyses using a consistent framework. The first Phase I Report was prepared in 2000.
In 2008, FLAG released a draft update to the 2000 report. The update was prepared after FLAG
recognized the need to update information in the 2000 report based on new scientific data. In
addition, an initial screening test was added to determine if a source would need to perform further
analysis. After publishing a federal register notice requesting comments on the revised document,
a draft document was finalized and published in November 2010, which is referred to hereinafter
as the 2010 FLAG Phase I Report.
The 2010 FLAG Phase I Report instructs the FLMs to review each application on a case-by-case
basis and take into account the following factors:
Current conditions of sensitive AQRVs within the Class I area;
Magnitude of emissions from the project;
Distance of the project from the Class I area;
Potential for source growth in the region surrounding the Class I area;
Existing/prevailing meteorological conditions in the region; and
Cumulative effects to AQRVs of the project with other regional sources.
The 2010 FLAG Phase I Report identifies three major AQRVs the FLM should focus on,
specifically visibility impacts, ozone impacts, and deposition of nitrogen and sulfur compounds.
The AQRVs are set by the FLM and are specific to each Class I Area. Wilderness area (acid
deposition impact) AQRVs can be found through the USFS Website at
http://www.fs.fed.us/air/index.htm. Each major AQRV for the San Gorgonio Wilderness is
presented in Appendix F. For the AQRV impact analysis, we are using the total Project emissions
increase, including both mining fugitive source and mobile source Project emissions increases (as
described in the previous sections).

Air Quality Study for Proposed South Quarry Project in Lucerne Valley, California
Mitsubishi Cement Corporation
Copyright ©2016, Yorke Engineering, LLC 75
8.2.1 Analysis for Class I Areas Located 50 km or More from the Site
For Class I areas located 50 km or more from the site, the 2010 FLAG Phase I Report
provides a general screening method that was not available in the 2000 FLAG Phase I
Report. If the total emissions of certain pollutants (tpy) divided by the distance to the Class
I area in km is less than 10, no further analysis is necessary. The general screening method
is applied to each area of concern: visibility impairment, ozone impacts, and acid
deposition.
For MCC, the general screening method is quantified as follows:
(15 tpy of PM10 + 0.1 tpy of NOx)/50 km = 0.3 << 10
Based on this result, the FLMs will not be expected to require a more detailed analysis of
visibility and haze impacts in Class I areas located beyond 50 km of the Project. This
approach will also eliminate the requirements for ozone impacts and acid deposition
impacts analysis for Class I areas beyond 50 km.
8.2.2 Analysis for Class I Areas Located Within 50 km of the Site
The following sections specifically address visibility, ozone, and acid deposition impacts
for Class I areas located within 50 km of the site. The following sections present results
for the San Gorgonio Wilderness, which is the closest Class I area to the site. Assuming
that results for San Gorgonio Wilderness show that the specified screening criteria are not
exceeded, an analysis for Joshua Tree National Park is not needed because it is further
away.
For sources located within 50 km of a Class I area, the general screening method described
above (for Class I areas located beyond 50 km of the Project) does not apply and the FLM
is to be consulted as to the availability of any initial screening methods for each analysis.
If no initial screening methods are available, the next level of screening analysis (referred
to as Level 1 Screening) will likely be required by the FLMs.
8.2.2.1 Visual Impacts Analysis
For the Class I areas less than 50 km from MCC (San Gorgonio Wilderness and a small
corner of Joshua Tree National Park), the plume visibility impacts are evaluated using a
tiered approach.
For the VIA, the 2010 FLAG Phase I Report calls for VISCREEN modeling as the correct
screening approach (page 20). Note that the VIA screening method discussed in this
section is distinct from the general screening method discussed in Section 8.2.1. The
VISCREEN model uses worst-case meteorology to estimate plume visibility. The two
parameters output by VISCREEN are delta E, a plume perceptibility parameter based on
color differences and brightness, and the plume contrast, a spectral criterion defined for a
green wavelength of 0.55 microns.
VIA Summary
The VISCREEN model was run for the Project using PM10 and NOx emission rates of 15
and 25 tons/yr, both of which were conservatively set at threshold levels for the purpose of
the VIA screening analysis. The nearest Class I area is the San Gorgonio Wilderness, with

Air Quality Study for Proposed South Quarry Project in Lucerne Valley, California
Mitsubishi Cement Corporation
Copyright ©2016, Yorke Engineering, LLC 76
the closest boundary located 21 km south of the Project. The most distant boundary in the
San Gorgonio Wilderness is 42 km south of the Project.
A Level 2 VIA screening analysis was performed in accordance with the 2010 FLAG Phase
I Report and USEPA guidance for VISCREEN (1992). Both meteorology and complex
terrain were considered for the analysis, as follows:
Wind direction: The boundaries of the San Gorgonio Wilderness lie within a
southerly sector ranging from 153° to 204° of the Project. Since wind direction is
measured at angles from which the wind is blowing, this sector corresponds to wind
directions ranging from 333° to 24°. To further account for a plume angle of
11.25°, wind directions ranging from 322° to 35° were considered in the Level 2
VIA screening analysis.
Stability class and wind speed: The VISCREEN guidance prescribes a procedure
by which local hourly meteorological data is evaluated in order to identify the joint
frequency of the occurrence of stability class, wind speed, and relevant wind
directions. The meteorological data set used for AERMOD modeling was used in
this analysis. Additionally, complex terrain was considered in selecting the stability
class. A stability class of E and a wind speed of 2.0 meters per second (m/s) were
selected based on this analysis, which is described below in greater detail.
Background visual range: A background visual range of 257 km was obtained from
the USFS website regarding AQRVs, and is identified as the average annual natural
visibility in the wilderness area (USFS 2016).
Other parameters: Neither the 2010 FLAG Phase I Report nor the MDAQMD have
provided modeling guidelines or recommended parameters for the other
VISCREEN inputs. Nearby air quality management districts do provide modeling
guidelines and it is common to use other jurisdiction’s guidelines if appropriate for
the situation. For this analysis, we used the guidance in SCAQMD Rule 1303,
Appendix B, Modeling Analysis for Visibility, which recommends that primary
NO2, soot, and sulfate (SO4) emissions be set to 0 tpy, which is also the model
default. The USEPA defaults for particle characteristics and background ozone
were also used.
The threshold visibility values to which VISCREEN results should be compared are stated
in the 2010 FLAG Phase I Report (page 21), and are the same as those listed in the USEPA
guidance for VISCREEN, dated June 1992. These threshold values are 2.0 for the total
color contrast (delta E) and 0.05 for contrast. The VISCREEN model output file is
provided in Appendix G.
The VISCREEN modeling results are presented in Table 8-1 and show that the results
inside the Class I area (“Plume”) are below the threshold values (“Standard”) for both delta
E and contrast. A negative value for plume contrast is a valid result and indicates that the
plume appears darker than the sky. The conservative nature of the VISCREEN model will
ensure the proposed changes at MCC will not negatively impact visibility at nearby Class
I areas.

Air Quality Study for Proposed South Quarry Project in Lucerne Valley, California
Mitsubishi Cement Corporation
Copyright ©2016, Yorke Engineering, LLC 77
Table 8-1: Maximum Visual Impacts Inside the Class I Area
Delta E Contrast
Background Theta Azimuth Distance Alpha Standard Plume Standard Plume
SKY 10 158 42 10 2 0.428 0.05 0.009
SKY 140 158 42 10 2 0.091 0.05 -0.003
TERRAIN 10 158 42 10 2 1.206 0.05 0.009
TERRAIN 140 158 42 10 2 0.085 0.05 0.001
Stability Class and Wind Speed Analysis for Use as Inputs to the VIA for Level 2
VISCREEN Modeling
The Level 2 VIA screening analysis consists of identifying the joint frequency distribution
of wind direction, wind speed, and atmospheric stability as measured at or near the location
of the emission source. As described previously, a sequential hourly 5-year meteorological
data set was prepared for the purpose of performing an ambient air quality analysis of
Project emissions using the AERMOD dispersion model. This 5-year data set was used
for identifying the stability class and wind speed to be used in the VISCREEN analysis.
The first step in the analysis is to stratify the data set into four equal length time periods of
the day, specifically with a duration of 6 hours each. The second step is to rank dispersion
conditions by the calculated product of σy × σz × u, where u is the measured wind speed
and σy and σz are the Pasquill-Gifford horizontal and vertical diffusion coefficients for the
calculated stability class and downwind distance along the stable plume trajectory. Table
8-2 summarizes the results of these first two steps of the analysis.

Air Quality Study for Proposed South Quarry Project in Lucerne Valley, California
Mitsubishi Cement Corporation
Copyright ©2016, Yorke Engineering, LLC 78
Table 8-2: Worst-Case Meteorological Conditions for Plume Visual Impact Calculations
Dispersion Condition Transport
Time
(Hours)
Frequency (f) and Cumulative Frequency (cf) of the Occurrence of Hourly
Dispersion Conditions Associated with Class I Area Transport Wind Direction by
Time of Day (Percent)
Stability Class,
Wind Speed (m/s) σy × σz × u
(m3/s)
Hours 1-6 Hours 7-12 Hours 13-18 Hours 19-24
f cf f cf f cf f cf
F, 1 3.13E+04 5.7 0.34 0.34 0.06 0.06 0.22 0.22 0.52 0.52
F, 2 6.26E+04 2.9 0.31 0.65 0.04 0.10 0.12 0.34 0.66 1.18
F, 3 9.39E+04 1.9 0.02 0.67 0.02 0.12 0.05 0.38 – –
E, 1 8.53E+04 5.7 0.00 0.67 0.00 0.12 0.00 0.38 – –
E, 2 1.71E+05 2.9 0.04 0.70 0.03 0.15 0.04 0.42 – –
D, 1 2.09E+05 5.7 0.00 0.70 0.03 0.17 0.03 0.45 – –
E, 3 2.56E+05 1.9 0.16 0.87 0.05 0.22 0.15 0.59 – –
E, 4 3.41E+05 1.4 0.04 0.90 0.00 0.22 0.04 0.63 – –
E, 5 4.27E+05 1.1 0.00 0.90 0.00 0.22 0.00 0.63 – –
D, 2 4.19E+05 2.9 0.00 0.90 0.02 0.24 0.09 0.72 – –
D, 3 6.28E+05 1.9 0.03 0.93 0.04 0.27 0.19 0.91 – –
D, 4 8.38E+05 1.4 0.06 0.99 0.05 0.32 0.27 1.19 – –
D, 5 1.05E+06 1.1 0.06 1.06 0.12 0.44 – – – –
D, 6 1.26E+06 1.0 – – 0.17 0.61 – – – –
D, 7 1.47E+06 0.8 – – 0.16 0.78 – – – –
C, 1 1.51E+06 5.7 – – 0.01 0.79 – – – –
D, 8 1.68E+06 0.7 – – 0.05 0.84 – – – –
D, 9 1.88E+06 0.6 – – 0.06 0.90 – – – –
D, 10 2.09E+06 0.6 – – 0.05 0.96 – – – –
D, 11 2.30E+06 0.5 – – 0.02 0.98 – – – –
D, 12 2.51E+06 0.5 – – 0.01 0.99 – – – –
C, 2 3.02E+06 2.9 – – 0.04 1.02 – –

Air Quality Study for Proposed South Quarry Project in Lucerne Valley, California
Mitsubishi Cement Corporation
Copyright ©2016, Yorke Engineering, LLC 79
The next step is to select the worst-case 1st percentile meteorological condition as being
indicative of worst-day plume visual impacts. In this case, the combination of F stability
class and a wind speed of 2 m/s is selected based on the results for the meteorological hours
from 19:00 to 24:00. While this time period is generally associated with nighttime hours,
the USEPA VISCREEN guidance explicitly states that nighttime dispersion conditions
must be considered because maximum plume visual impacts are often observed in the
morning after a period of nighttime transport. However, the selection of meteorological
conditions from this time period is conservative because the Project will not be operating
beyond sunset. Nevertheless, for the purposes of the Level 2 VIA screening analysis of
the Project, the combination of F stability class and a wind speed of 2 m/s was selected for
further analysis.
The last step in the process is to evaluate complex terrain. The Project, at about 6,000 feet
in elevation, is separated from the San Gorgonio Wilderness by a high ridge that exceeds
8,000 feet in elevation, the Big Bear Lake valley, and Sugarloaf Mountain (9,950 feet).
The San Gorgonio Wilderness has terrain with elevations greater than 10,000 feet. The
USEPA’s VISCREEN guidance states that the selected stability class should be shifted to
one category less stable if an observer in the Class I area is at least 500 meters above the
emissions release height or if elevated terrain separates an observer in the Class I area from
the emission source. In the case of an observer in the San Gorgonio Wilderness, both
criteria are satisfied. Therefore, the combination of E stability class and a wind speed of
2 m/s was selected for input to VISCREEN.
8.2.2.2 Ozone Impact Analysis
The 2010 FLAG Phase I Report has identified ozone as an ambient air quality pollutant of
concern. AQRVs have been established in Class I areas to determine if the ozone impacts
are damaging to the flora of the area. The AQRV values for the San Gorgonio Wilderness
are listed in Appendix F, which shows that the lowest AQRV for ozone is 45 parts per
billion (ppb).
There are no recommended or approved models available for calculating ozone impacts
from an individual project. As noted in the 2010 FLAG Phase I Report, ozone impacts are
directly related to NOx concentrations. Therefore, we used calculated NOx concentration
increases and then applied a reference that relates NOx concentration increases to ozone
concentration increases. This approach is used because, in this instance, there is no
standard approach provided by the 2010 FLAG Phase I Report. The NOx concentration
used is based on AERMOD modeling for annual average concentrations at the Class I area,
as discussed above. The threshold values applied for comparing with the model results are
the ozone AQRVs published for the San Gorgonio Wilderness.
The USEPA-approved AERMOD dispersion model was used to estimate the annual NOx
concentration of the emissions from the Project at the northern edge of the San Gorgonio
Wilderness boundary. The model was run with 5 years of meteorological data per USEPA
modeling guidance in 40 CFR 51 Appendix W, which the 2010 FLAG Phase I Report
references. Only the haul road emissions source was considered in this analysis, as that is
the source that comprises the haul trucks and water trucks being evaluated. These trucks
were assumed by AERMOD to operate for 10 hours each weekday from 7:00 am to 5:00
pm. Since the trucks operate on a schedule of 2,500 hours per year (10 hours each weekday,

Air Quality Study for Proposed South Quarry Project in Lucerne Valley, California
Mitsubishi Cement Corporation
Copyright ©2016, Yorke Engineering, LLC 80
50 weeks per year), the modeled NO2 emission rate is calculated by dividing 0.1 tpy by
2,500 operating hours. The resulting modeled emission rate is 0.13 lb/hr [0.017 grams per
second (g/s)]. The model output file and input parameters for the worst-case year are
provided in Appendices C and D.
AERMOD predicted a 5-year maximum annual X/Q of 0.00148 microgram per cubic meter
(μg/m3)/(g/s), as shown in Appendices C and D. Multiplying this value by the modeled
emission rate of 0.017 g/s results in a maximum predicted annual NO2 concentration of 0.
μg/m3. The USEPA national default ratio of NO2 to NOx is 0.75 per 40 CFR 51 Appendix
W. However, we have conservatively assumed that all NOx is NO2. Assuming all the NOx
as NO2, this will translate to 0.00000195 parts per billion (ppb) of NO2.
Using the ozone isopleths in the Seinfeld 1986 reference (see Appendix H), the worst-case
ratio of the ozone increase to the NO2 increase is less than 10. Therefore, as shown in
Table 8-3, based on a NOx concentration of 0.000013 ppb, the maximum ozone increase is
0.00013 ppb. This is much less than the lowest AQRV for ozone in Appendix F, which is
45 ppb.
Table 8-3: Evaluation of Ozone Impacts Using Relationship between NOx
Concentration Increases and Ozone Concentration Increases
Item Units Value Reference
Maximum annual NOx concentration
at northern edge of the San Gorgonio
Wilderness boundary
µg/m3 0.000025 AERMOD modeling
Maximum NO2 concentration in ppb ppb 0.000013 Conversion of µg/m3 to ppb
Ratio of ozone increase to NO2
concentration increase Ratio <10 Seinfeld 1986
Maximum ozone increase ppb 0.00013 Calculated from above ratio
AQRV for ozone impacts ppb 45 Appendix F
Is increase above AQRV? Yes/No No –
For comparison, please note that the NOx emissions from this Project were less than 0.1%
of the total NOx emissions in the MDAQMD territory in 2007.
8.2.2.3 Acid Deposition Analysis
Emissions of NOx and SOx may be converted into nitrates, sulfates, and sulfites in the
atmosphere. These compounds, in turn, may then be deposited into water bodies and
vegetative surfaces where the acidic nature of the compounds may damage the flora or
fauna.
The FLM may request a nitrogen and sulfur deposition analysis. As mentioned, it is in the
FLM’s authority to request deposition impacts for sources if they suspect a detrimental
impact on Class I areas. AQRVs for nitrogen and sulfur deposition have been established
through the FLAG Phase I process. The AQRV values for the San Gorgonio Wilderness
are listed in Appendix F, which shows that the lowest AQRV for acid deposition is 3.0
kilogram per hectare per year (kg/ha/year).

Air Quality Study for Proposed South Quarry Project in Lucerne Valley, California
Mitsubishi Cement Corporation
Copyright ©2016, Yorke Engineering, LLC 81
The following ADA screening method can be used to perform an ADA for Class I areas
less than 50 km from the site. An USFS ADA screening methodology for calculating acid
neutralizing capacity (ANC) change to high elevation lakes includes a calculation to
determine the deposition rates of nitrogen and sulfur from ambient NOx and SOx
concentrations. Dispersion modeling without the complex nitrogen and sulfur chemical
mechanisms can then be used to determine the concentrations of NOx and SOx at the
location of interest. If the ADA screening method estimates deposition rates above the
AQRV values, more refined modeling may be required by the FLM.
The ADA screening methodology provided by the USFS was used to estimate the nitrogen
deposition rates. This methodology was applied based on predicted NO2 concentrations at
the boundary of the San Gorgonio Wilderness. SOx emissions from the Project are
insignificant and will not impact the acid deposition rates.
The 2010 FLAG Phase I Report specifies the MAGIC-WAND deposition model and also
mentions the USFS Rocky Mountain Region’s recommendation to use either CALPUFF
or AERMOD modeling for nitrogen deposition (page 65). The 2010 FLAG Phase I Report
also indicates that the Rocky Mountain Region recommends the USFS publication,
“Screening Methodology for Calculating ANC Change to High Elevation Lakes,” for ADA
screening (page 65). The parameter values used are those found in the nitrogen deposition
rate equation in the USFS publication (which calculates nitrogen deposition rate from NOx
concentration and other parameters). The NOx concentration used is based on AERMOD
modeling for annual average concentrations at the Class I area. The threshold values
applied for comparing with the model results are the acid deposition AQRVs published for
the San Gorgonio Wilderness.
The NO2 deposition can be estimated from the NO2 concentration according to the equation
found in the USFS publication, “Screening Methodology for Calculating ANC Change to
High Elevation Lakes”:
The annual NOx concentration at the Northern edge of the San Gorgonio Wilderness
boundary was estimated, as described above, under ozone impact analysis. The estimated
deposition according to the above equation is 0.00014 kg/ha/year. As shown in Table 8-4,
the estimated deposition is considerably less than the lowest listed AQRV threshold for the
San Gorgonio Wilderness, as detailed in Appendix F.
m/s x
3
2 3 3 m / g
yr / ha / kg 4 . 315 0 . 2
ratio deposition dry to deposition total
46 14
N to NO ratio weight molecular
HNO for s
m 05 . 0 velocity
deposition m
g ion concentrat
pollutant Dn

Air Quality Study for Proposed South Quarry Project in Lucerne Valley, California
Mitsubishi Cement Corporation
Copyright ©2016, Yorke Engineering, LLC 82
Table 8-4: Evaluation of Acid Deposition Based on USFS ADA Screening
Methodology
Item Units Value Reference
Maximum annual NOx
concentration at northern edge of
the San Gorgonio Wilderness
boundary
µg/m3 0.000015 AERMOD modeling
Deposition rate kg/ha/year 0.00014
Calculated from above
equation from USFS
publication
AQRV for acid deposition kg/ha/year 0.005 Appendix F
Is increase above AQRV? Yes/No No –
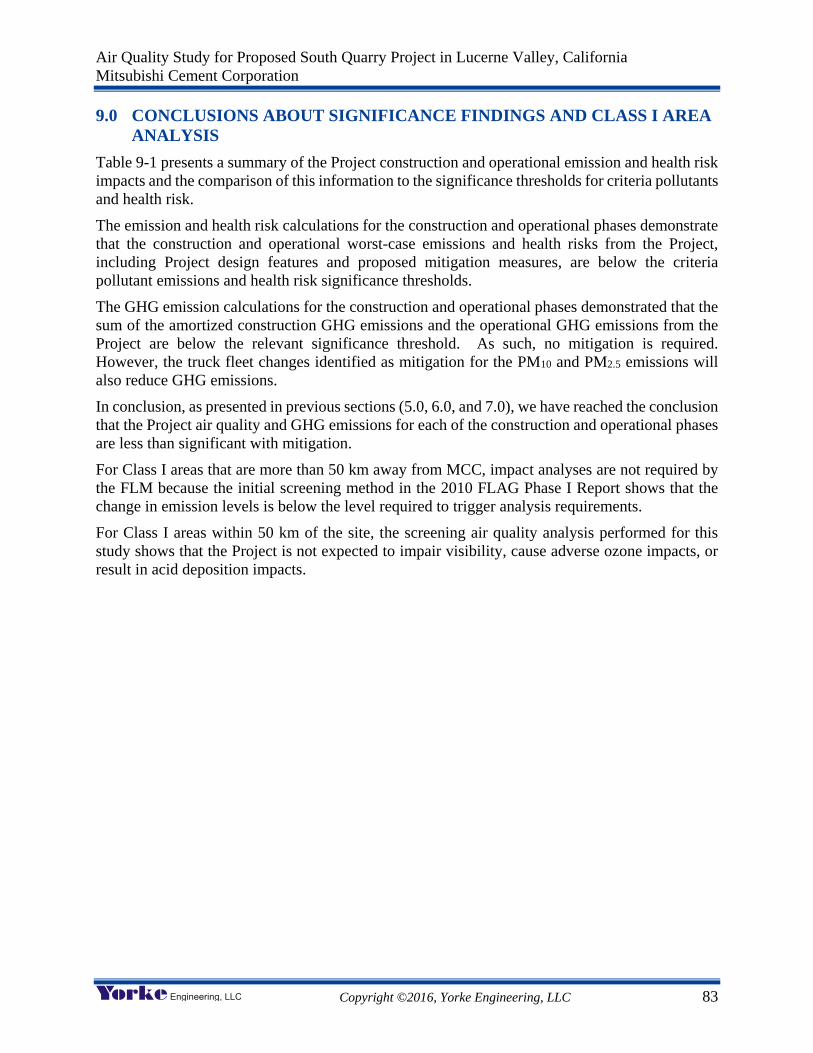
Air Quality Study for Proposed South Quarry Project in Lucerne Valley, California
Mitsubishi Cement Corporation
Copyright ©2016, Yorke Engineering, LLC 83
9.0 CONCLUSIONS ABOUT SIGNIFICANCE FINDINGS AND CLASS I AREA
ANALYSIS
Table 9-1 presents a summary of the Project construction and operational emission and health risk
impacts and the comparison of this information to the significance thresholds for criteria pollutants
and health risk.
The emission and health risk calculations for the construction and operational phases demonstrate
that the construction and operational worst-case emissions and health risks from the Project,
including Project design features and proposed mitigation measures, are below the criteria
pollutant emissions and health risk significance thresholds.
The GHG emission calculations for the construction and operational phases demonstrated that the
sum of the amortized construction GHG emissions and the operational GHG emissions from the
Project are below the relevant significance threshold. As such, no mitigation is required.
However, the truck fleet changes identified as mitigation for the PM10 and PM2.5 emissions will
also reduce GHG emissions.
In conclusion, as presented in previous sections (5.0, 6.0, and 7.0), we have reached the conclusion
that the Project air quality and GHG emissions for each of the construction and operational phases
are less than significant with mitigation.
For Class I areas that are more than 50 km away from MCC, impact analyses are not required by
the FLM because the initial screening method in the 2010 FLAG Phase I Report shows that the
change in emission levels is below the level required to trigger analysis requirements.
For Class I areas within 50 km of the site, the screening air quality analysis performed for this
study shows that the Project is not expected to impair visibility, cause adverse ozone impacts, or
result in acid deposition impacts.