Report on National Greenhouse Gas Inventory System in the ...
270
-
Upload
khangminh22 -
Category
Documents
-
view
1 -
download
0
Transcript of Report on National Greenhouse Gas Inventory System in the ...


Report on National Greenhouse Gas Inventory System in the Republic of Moldova – 2018
Chisinau, 2018

CZU 351.777.6:504.054(478)(047)
T 22
The “Report on National Greenhouse Gas Inventory System in the Republic of Moldova – 2018” was developed within the Project “Republic of Moldova: Enabling Activities for the Preparation of the Second Biennial Update Report under the United Nations Framework Convention on Climate Change” implemented by Ministry of Agriculture, Regional Development and Environment and United Nations Environment Programme, with financial support of the Global Environment Facility.
Technical References
Title: Report on National Greenhouse Gas Inventory System in the Republic of Moldova – 2018
Coordinators: Valentina TAPIS, State Secretary, Ministry of Agriculture, Regional Development and Environment (MARDE)Suzanne LEKOYIET, Programme Manager, United Nations Environment Programme (UN Environment)
Author-Coordinator Marius Taranu, Coordinator of the National GHG Inventory, Climate Change Office, Ministry of Agriculture, Regional Development and Environment
Authors-Contributors: Elena BICOVA, Irina VASILIEV, Larisa MORARU, Tatiana KIRILLOVA, Serghei BURTEV, Vladimir BREGA, Anatolie TARITA, Sergiu COSMAN, Lilia TARANU, Ion TALMACI, Victor SFECLA, Aliona MIRON, Tatiana TUGUI, Natalia EFROS, Members of the National GHG Inventory Team, Climate Change Office, Ministry of Agriculture, Regional Development and Environment
Project Team: Vasile SCORPAN, Project Manager, Climate Change Office, Ministry of Agriculture, Regional Development and Environment Aliona SOLOMON, Financial and Administrative Assistant, Climate Change Office, Ministry of Agriculture, Regional Development and Environment
Website Version: This document is available on website: <http://www.clima.md>
Comments may be sent to:
Marius Taranu, Coordinator of National GHG Inventory, 156A Mitropolit Dosoftei str., Office 37, MD 2004, Chisinau, Republic of Moldova, tel./fax: +373 22 232247, E-mail: <[email protected]>
CIP Description of the National Book ChamberReport on National Greenhouse Gas Inventory System in the Republic of Moldova – 2018 / aut-coord.: Marius Taranu; aut-contributors: Elena Bicova, Irina Vasiliev, Larisa Moraru, [et al.]; coord: Valentina Tapis, Suzanne Lekoyiet; Min. of Agriculture, Regional Development and Environment, United Nations Environment Programme (UN Environment). – Chisinau: S. n., 2018 (Tipogr. “Bons Offices”). 269 p.Aut. sunt indicați pe vs. f. de tit. - Referințe bibliogr. în subsol. - 15 ex.
ISBN 978-9975-87-452-6.351.777.6:504.054(478)(047)T 22
Ministry of Agriculture, Regional Development and Environment Address: 9 Constantin Tanase Str., MD 2005, Chisinau, Republic of MoldovaTel.: +373 22 200547 Fax: +373 22 226858E-mail: <[email protected]>Website: http://www.madrm.gov.md
United Nations Environment Programme (UN Environment)Address: United Nations Avenue, Gigiri, P.O. Box 30552, 00100, Nairobi, KenyaTel.: +254 (0) 20 762 1234Fax: +254 (0) 20 762 3718E-mail: <[email protected]>Website: https://www.unenvironment.org/
© Ministry of Agriculture, Regional Development and Environment© United Nations Environment Programme (UN Environment)
ISBN 978-9975-87-452-6.

ACKNOWLEDGEMENTS
The development of the “Report on National Greenhouse Gas Inventory System in the Republic of Moldova – 2018” would not have been possible without the fi-nancial support of the United Nations Environment Programme (UN Environment) and without the methodology support received from the Environmental Protec-tion Agency of the United States of America (US EPA).
Thanks, are also due to National GHG Inventory Team members for substantial contribution that led to the development of this Report.
Additionally, we give thanks to Mr. Igor Bercu for assistance with the document layout.
III

IV
CONTENTSTechnical References .............................................................................................................................. ii
Acknowledgements ............................................................................................................................... iii
Contents ................................................................................................................................................ iv
Introduction .......................................................................................................................................... vi
Chapter 1: Institutional Arrangements ................................................................................................1-11. Institutional Arrangements ......................................................................................................................................................................................1-2
1.1. Overview of Current Inventory Management Team .................................................................................................................................................................1-21.2. Sectoral Roles and Arrangements ............................................................................................................................................................................................1-31.3. Potential Improvements ........................................................................................................................................................................................................1-151.4. National Greenhouse Gas Emissions Inventory Cycle .............................................................................................................................................................1-15
Chapter 2: Methods and Data Documentation ......................................................................................2-12. Methods and Data Documentation ..........................................................................................................................................................................2-2
2.1. Energy Sector ..........................................................................................................................................................................................................................2-22.2. Industrial Processes and Product Use Sector .........................................................................................................................................................................2-962.3. Agriculture Sector ...............................................................................................................................................................................................................2-1542.4. Land Use, Land-Use Change and Forestry Sector ..................................................................................................................................................................2-1682.5. Waste Sector .......................................................................................................................................................................................................................2-187
Chapter 3: Description of QA/QC Procedures ......................................................................................3-13. Quality Assurance/Quality Control Procedures ........................................................................................................................................................3-2
3.1. Background .............................................................................................................................................................................................................................3-23.2. Quality Assurance and Quality Control Plan ............................................................................................................................................................................3-23.3. Quality Assurance and Quality Control Personnel ....................................................................................................................................................................3-33.4. Communicating Quality Assurance and Quality Control Plan ...................................................................................................................................................3-43.5. General (Tier 1) QC Procedures for Source/Sink Category Leads ..............................................................................................................................................3-53.6. Category-Specific (Tier 2) Procedures ......................................................................................................................................................................................3-7

V
3.7. Quality Assurance (QA) Procedures .........................................................................................................................................................................................3-93.8. Supplemental QA/QC Checklists ............................................................................................................................................................................................3-10
Chapter 4: Description of Archiving System.........................................................................................4-14. Description of Archiving System ...............................................................................................................................................................................4-2
4.1. Background .............................................................................................................................................................................................................................4-24.2. Assess Existing Archiving Program and Procedures ..................................................................................................................................................................4-24.3. Archive System ........................................................................................................................................................................................................................4-34.4. Recommended Improvements to the Inventory Archive System ..............................................................................................................................................4-7
Chapter 5: Key Category Analysis ........................................................................................................5-15. Key Category Analysis ..............................................................................................................................................................................................5-2
5.1. Background .............................................................................................................................................................................................................................5-25.2. Key Category Software ............................................................................................................................................................................................................5-25.3. Tier 1 Current Year Level Analysis ............................................................................................................................................................................................5-25.4. Tier 1 Base Year Level and Trend Analyses ...............................................................................................................................................................................5-45.5. Tier 2 Current Year Level Analysis ............................................................................................................................................................................................5-65.6. Tier 2 Base Year and Trend Analyses with Incorporated Uncertainty ........................................................................................................................................5-85.7. Methodology ........................................................................................................................................................................................................................5-105.8. References ............................................................................................................................................................................................................................5-13
Chapter 6: National Inventory Improvement Plan ...............................................................................6-16. National Inventory Improvement Plan .....................................................................................................................................................................6-2
6.1. Objectives ...............................................................................................................................................................................................................................6-26.2. Institutional Arrangement Priorities ........................................................................................................................................................................................6-26.3. Summary of Key Categories .....................................................................................................................................................................................................6-36.4. Potential Sector and Category Improvements ..........................................................................................................................................................................6-56.5. Potential Improvements to QA/QC Procedures........................................................................................................................................................................6-86.6. Potential Archiving System Improvements ..............................................................................................................................................................................6-96.7. Communication, Outreach, and Training Priorities .................................................................................................................................................................6-106.8. Prioritized List of Potential Improvements .............................................................................................................................................................................6-11

INTRODUCTION The “Report on National Inventory System in the Republic of Moldo-va - 2018” was developed at the end of 2017-2018 years inventory cycle within the Project “Republic of Moldova: Enabling Activities for the Preparation of the Second Biennial Update Report under the United Nations Framework Convention on Climate Change” imple-mented by Ministry of Agriculture, Regional Development and En-vironment and United Nations Environment Programme, with fi-nancial support of the Global Environment Facility, drawing on six templates worked out by the Environmental Protection Agency of the United States of America (US EPA)1. The Report provides complete documentation of every major com-ponent related to the inventory management process in the Repub-lic of Moldova on anthropogenic emissions of greenhouse gases by sources and removals by sinks, which are not regulated by the Mon-treal Protocol.
The advantages of using the predefined templates (adapted to na-tional conditions of the Republic of Moldova) are as follows:
• They focus on documenting essential information in a concise format and avoid unnecessary waste of time in lengthy report writing;
• They ensure understanding of roles and responsibilities;
• They are adapted to different levels of national capacity; They standardize the tasks to be achieved, which allows a compara-tive analysis of national inventory systems and a comparison and review of data from different countries;
• They provide an objective and effective system for identifying
1 www.epa.gov/climatechange/emissions/ghginventorycapacitybuilding.
priorities for future improvements;
• They serve as guideline and starting point for the national inven-tory team in the development of future national GHG invento-ries;
• They help the national team to apply the 2006 IPCC Guidelines for National Emission Inventories of GHG emissions (IPCC, 2006) and other guidance of the UNFCCC on development of national GHG inventories;
• They ensure transparency in matters relating to the operation of the National Inventory System in the Republic of Moldova; and
• They facilitate the improvement of the inventory over time.
The six predefined templates for the development of the National Inventory System are as follows:
1. Institutional Arrangements for the National Inventory System (lA) – assist the national inventory team to assess and docu-ment strengths and weaknesses of existing institutional arrange-ments in developing the national inventory of anthropogenic emissions of greenhouse gas by sources and removals by sinks, ensure its continuity and integrity and promote the inventory institutionalization process.
2. Methods and Data Documentation (MDD) – assist national in-ventory team in documentation and communication of the ori-gin of the methodology used, of activity data sets and emission factors used to estimate future GHG emissions or removals; the future national teams inventory will be able to refer to the tem-plate completed for each source and sink category to determine what information was collected, how the data were obtained and what calculation methods were used, and to reproduce es-timates of GHG emissions.
VI

3. Description of Quality Assurance / Quality Control (QA/QC) – guides the national entity responsible for managing the na-tional inventory system in creating a Plan for quality assurance and quality control in a cost-effective manner to improve trans-parency, consistency, comparability, completeness and accu-racy of the national inventory of anthropogenic emissions of greenhouse gases from sources and sinks not controlled by the Montreal Protocol; the template includes checklists with rec-ommended QA / QC procedures that are suitable for staff with management responsibility, such as the Inventory Coordinator, QA/QC Coordinator, as well as sectorial coordinators.
4. Description of the Archiving System (AS) – an archiving system is a relatively inexpensive component, but particularly impor-tant for a sustainable national inventory system; the archiving
system allows for easy reproduction of estimates, ensures avoid-ing loss of data and information and facilitates further develop-ment of inventories by staff involved in the inventory process.
5. Key Category Analysis (KCA) – identifies sources or sinks that contributing the most to the total national emissions and there-fore it constitutes a priority objective for improvement efforts. KCA tools and template are consistent with 2006 IPCC Guide-lines for National Emission Inventories of GHG emissions (IPCC, 2006).
6. National Inventory Improvement Plan (NIIP) – is a summary of conclusions on capacity building needs and it describe specific priorities for future activities based on the capacity needs iden-tified following completion of the first five templates; the plan facilitates continual inventory improvements.
VII

1-1
Chapter 1: Institutional Arrangements
1: Institutional Arrangements
2: Methods and Data Documentation
3: Description of QA/QC Procedures
4: Description of Archiving System
5: Key Category Analysis
6: National Inventory Improvement Plan
Contact data of the Coordinator of the National Greenhous Gas Inventory
Country Republic of Moldova Postal address: 156A Mitropolit Dosoftei str., room 37, MD-2004, Chisinau, Republic of MoldovaName: Taranu Marius Telephone/Fax: +373 22 23 22 47Position: Coordinator of the National Greenhouse Gas Inventory E-mail: [email protected] Organization: Climate Change Office, Ministry of Agriculture, Regional Development and Environment URL: http://www.clima.md

Chapter 1: Institutional Arrangements
1 - 2
1. Institutional Arrangements 1.1 Overview of Current Inventory Management Team
Table 1.1: Designated Inventory AgencyDesignated Inventory Agency, as of end of December 2018
UNFCCC focal point Describe the arrangements or relationship between Inventory Agency and UNFCCC Focal Point Agency
Climate Change Office, Ministry of Ag-riculture, Regional Development and Environment of the Republic of Moldova
The Ministry of Agriculture, Regional Development and Environment (MARDE) of the Republic of Moldova is the state authority vested with the power to deve-lop and promote policies and strategies addressing agriculture, food production, food safety, regional and rural development, spatial planning, environment pro-tection and climate change as well as natural resources.On behalf of the Government of the Republic of Moldova, the Ministry of Agricul-ture, Regional Development and Environment is responsible for implementing international environmental treaties to which the Republic of Moldova is a party (including the United Nations Framework Convention on Climate Change).The State Secretary in the area of Environment Protection and Natural Resour-ces of the Ministry of Agriculture, Regional Development and Environment holds the position of the UNFCCC focal point.
Climate Change Office of the Ministry of Agriculture, Regional Development and Environment has been designated as GHG Inventory Preparation Agency by Order No. 21 of 11.02.2004 of the Minister of Ecology, Constructions and Terri-tory Development of the Republic of Moldova (reorganized in 2005 into Ministry of Ecology and Natural Resources, in 2009 into Ministry of Environment and in 2017 into Ministry of Agriculture, Regional Development and Environment). In Annex 1 of the Order No. 21 of 11.02.2004, Chapter II, paragraph 7 (b) (v), it is stated that Climate Change Office (CCO) is responsible for „facilitating creation of databases and of informational and monitoring systems for green-house gases and periodic estimates of GHG emissions, including preparation of national inventory reports”. The role of CCO is also specified within the Government Decision No. 141 dated 24.02.2014 on creating the en-ergy statistical system. Thus, Chapter 2.1, Paragraph 3(h) notes that the Climate Change Office is responsible for developing national inventories of direct (CO2, CH4, N2O, HFC, PFC and SF6) and indirect greenhouse gases (NOx, CO, NMVOC and SO2), originated from Energy, Industrial Processes, Solvents and Other Products Use, Agriculture, LULUCF and Waste sectors.
Table 1.2: National Inventory Management TeamRole Name Organization Contact data
Inventory Coordinator Marius Taranu, MSc in Biology
Climate Change Office, Ministry of Agriculture, Regional Development and Environment
156A, Mitropolit Dosoftei Str., room 37, MD-2004, Chisinau, Republic of MoldovaTel/Fax: +373-22-23-22-47, E-mail: [email protected], [email protected]
Energy Sector Lead Elena Bicova, PhD in Power Engineering Institute of Power Engineering 5, Academiei Str., room 443, MD-2028, Chisinau, Republic of Moldova
Tel.: +373-22-73-74-94, E-mail: [email protected] Industrial Processes and Product Use Sector Lead
Anatolie Tarita, PhD in Biology Institute of Ecology and Geography 3, Academiei Str., room 437, MD-2028, Chisinau, Republic of Moldova
Tel.: +373-22-71-89-38, +373-22-72-17-74, E-mail: [email protected]
Agriculture Sector Lead Sergiu Cosman, PhD in Agriculture
Scientific-Practical Institute for Biotechnology in Animal Breeding and Veterinary Medicine
Maximovca village, Anenii-Noi district, MD-6525, Republic of Moldova Tel.: +373-22-35-93-57; +373-22-35-92-95, E-mail: [email protected]
Land Use, Land-Use Change and For-estry Sector Lead
Ion Talmaci, MSc in Biology
Forestry Research and Management Institute, Moldsilva Agency, Ministry of Environment
69, Calea Iesilor Str., MD-2069, Chisinau, Republic of MoldovaTel.: +373-22-92-89-59, E-mail: [email protected]
Waste Sector Lead Tatiana Tugui, PhD in Chemistry
Environmental Pollution Prevention Office, Ministry of Agri-culture, Regional Development and Environment
156A, Mitropolit Dosoftei Str., room 310, MD-2004, Chisinau, Republic of MoldovaTel./Fax: +373-22-22-25-42, E-mail: [email protected]
Archive Manager Marius Taranu, MSc in Biology
Climate Change Office, Ministry of Agriculture, Regional Development and Environment
156A, Mitropolit Dosoftei Str., room 37, MD-2004, Chisinau, Republic of MoldovaTel/Fax: +373-22-23-22-47, E-mail: [email protected], [email protected]
QA/QC Coordinator Marius Taranu, MSc in Biology
Climate Change Office, Ministry of Agriculture, Regional Development and Environment
156A, Mitropolit Dosoftei Str., room 37, MD-2004, Chisinau, Republic of MoldovaTel/Fax: +373-22-23-22-47, E-mail: [email protected], [email protected]
Uncertainties Analysis Coordinator Marius Taranu, MSc in Biology
Climate Change Office, Ministry of Agriculture, Regional Development and Environment
156A, Mitropolit Dosoftei Str., room 37, MD-2004, Chisinau, Republic of MoldovaTel/Fax: +373-22-23-22-47, E-mail: [email protected], [email protected]

1 - 3
Chapter 1: Institutional Arrangements
1.2 Sectoral Roles and Arrangements
Table 1.3: Energy Sector Institutional Arrangements
Role Organization Contact person [Name]
Contact data[E-mail, telephone, etc.]
Participation in meetings on GHG inventory development?
[Yes/No]
Comments[Institutional arrangements]
Energy Sector Lead, responsible also for categories: 1A3 Transport, Inter-national aviation and CO2 emissions from biomass
Institute of Power Engi-neering
Elena Bicova, PhD in Power Engineering
5, Academiei Str., room 443, MD-2028, Chisinau, Republic of Moldova Tel.: +373-22-73-74-94 E-mail: [email protected]
Yes Personal contract for provision of consultancy services
Consultant compiling estimates from categories 1A1 Energy Industries and 1A5 Other
Institute of Power Engi-neering
Irina Vasiliev, MSc in Power Engineering
5, Academiei Str., room 443, MD-2028, Chisinau, Republic of Moldova Tel.: +373-22-73-74-94 E-mail: [email protected]
Yes Personal contract for provision of consultancy services
Consultant compiling estimates from category 1A2 Manufacturing indus-tries and constructions
Institute of Power Engi-neering Larisa Moraru
5, Academiei Str., room 421, MD-2028, Chisinau, Republic of Moldova Tel.: +373-22-72-80-62E-mail: [email protected]
Yes Personal contract for provision of consultancy services
Consultant compiling estimates from category 1A4 Other sectors
Institute of Power Engi-neering Tatiana Kirillova
5, Academiei Str., room 439, MD-2028, Chisinau, Republic of Moldova Tel.: +373-22-73-74-94E-mail: [email protected]
Yes Personal contract for provision of consultancy services
Consultant compiling estimates from category 1B2 Fugitive emissions from oil and natural gas
Institute of Power Engi-neering / “Termoelectrica” JSC
Serghei Burtev
5, Academiei Str., room 443, MD-2028, Chisinau, Republic of Moldova, Tel.: +373-22-73-74-94 E-mail: [email protected]
Yes Personal contract for provision of consultancy services
Data provider (Energy Balance of the Republic of Moldova)
National Bureau for Statis-tics, Division for statistics of industry, energy and construction
Bulgac Svetlana, Head of division
106, Grenoble Str., MD-2019, Chisinau, Republic of Moldova Tel.: +373-22-40-30-55, E-mail: [email protected]
No
The information is requested by official letter of the Manager of the Cli-mate Change Office to the Director of the National Bureau for Statistics (NBS). The legal basis for such request and provision of information is Law No. 93 as of 26.05.2017 on official statistics and Law No. 982 of 11.05.2000 on access to information.
Data provider (fuel use and amount of produced power and heat) “Termoelectrica” JSC
Alexander Ru-denco,Engineer
3, Mesterul Manole Str., MD-2023, Chisinau, Republic of MoldovaTel.: +373-22-82-93-66E-mail: [email protected]
No
The information is requested by official letter of the Manager of the Cli-mate Change Office to the Director of “Termoelectrica” JSC. The legal basis for such request and provision of information is Law No. 982 of 11.05.2000 on access to information.
Data provider (fuel use and amount of produced power and heat)
“Termoelectrica” JSC (“CHP-2” unit)
Vitalie Mita,Engineer
3, Mesterul Manole Str., MD-2023, Chisinau, Republic of MoldovaTel.: +373-22-38-52-19E-mail: [email protected]
No
The information is requested by official letter of the Manager of the Cli-mate Change Office to the Director of “Termoelectrica” JSC. The legal basis for such request and provision of information is Law No. 982 of 11.05.2000 on access to information.
Data provider (fuel use, amount of produced power and heat and the CHP-2 technical specifications)
“Termoelectrica” JSC (“CHP-2” unit)
Oxana Contedai-lova, Engineer
3, Mesterul Manole Str., MD-2023, Chisinau, Republic of MoldovaTel.: +373-22-38-53-54E-mail: [email protected]
No
The information is requested by official letter of the Manager of the Cli-mate Change Office to the Director of “Termoelectrica” JSC. The legal basis for such request and provision of information is Law No. 982 of 11.05.2000 on access to information.

Chapter 1: Institutional Arrangements
1 - 4
Role Organization Contact person [Name]
Contact data[E-mail, telephone, etc.]
Participation in meetings on GHG inventory development?
[Yes/No]
Comments[Institutional arrangements]
Data provider (fuel use, amount of produced power and heat and the CHP-1 technical specifications)
“Termoelectrica” JSC (“CHP-1” unit) Tatiana Coma-
rova, Engineer
5, Vadul lui Voda Str.,MD-2023, Chisinau, Republic of Moldova Tel.: +373-22-40-33-19E-mail: [email protected]
No
The information is requested by official letter of the Manager of the Cli-mate Change Office to the Director of “Termoelectrica” JSC. The legal basis for such request and provision of information is Law No. 982 of 11.05.2000 on access to information.
Data provider (fuel use, amount of heat produced and technical specifi-cations of HPs)
“Termoelectrica” JSC (“Termoservice” unit)
Oleg Sarateanu, Engineer
6, Tudor Vladimirescu Str.,MD-2024, Chisinau, Republic of Moldova Tel.: +373-22-83-93-12E-mail: [email protected]
No
The information is requested by official letter of the Manager of the Cli-mate Change Office to the Director of “Termoelectrica” JSC, „Termoser-vice” unit. The legal basis for such request and provision of information is Law No. 982 of 11.05.2000 on access to information.
Data provider (fuel use, amount of produced power and heat) “CHP-North” JSC Olga Lisenco,
Engineer
168, Stefan cel Mare Str., MD-3100, Balți, Republic of MoldovaTel.: +373-231-53-365E-mail: [email protected]
No
The information is requested by official letter of the Manager of the Cli-mate Change Office to the Director of “CHP-North”. The legal basis for such request and provision of information is Law No. 982 of 11.05.2000 on access to information.
Data provider (fuel use, amount of produced power and heat) “CHP-North” JSC Serghei Macarov,
Engineer
168, Stefan cel Mare Str., MD-3100, Balți, Republic of MoldovaTel.: +373-231-53-365E-mail: [email protected]
No
The information is requested by official letter of the Manager of the Cli-mate Change Office to the Director of “CHP-North”. The legal basis for such request and provision of information is Law No. 982 of 11.05.2000 on access to information.
Data provider (information included in the State Registry of Vehicles, in-cluding number of vehicles by type of classes, age, fuel use)
Public Service Agency Olesea Sav-cenco
42, Puskin Str., MD-2012, Chisinau, Republic of MoldovaTel.: +373-22-25-70-70 / +373-22-26-95-94E-mail: [email protected],[email protected]
No
The information is requested by official letter of the Manager of the Cli-mate Change Office to the Director of Public Service Agency. The legal basis for such request and provision of information is Law No. 982 of 11.05.2000 on access to information. A service provision agreement has been concluded between parties for data provision.
Data provider (diesel oil consumption for international maritime transporta-tion)
Public Institution Harbor Master Giurgiulesti, Minis-try of Economy and Infra-structure
Victor Andrusca, Master of Giurgi-ulesti Harbor
53A, Hincesti Highway, Chisinau, MD-2028, Republic of Moldova,Tel./Fax: +373-22-73-13-96E-mail: [email protected]
No
The information is requested by official letter of the Manager of the Climate Change Office to the Master of Giurgiulesti Harbour. The legal basis for such request and provision of information is Law No. 982 of 11.05.2000 on access to information.
Data provider (diesel oil consumption for naval transportation)
Fluvial Harbor Ungheni (on Prut River)
Vladimir Medve-dev, Interim Ad-ministrator
1, Lacului Str., MD-3600, Ungheni, Republic of Moldova,Tel.: +373-236-3-32-70; +373-236-3-32-75Fax: +373-236-3-38-56E-mail: [email protected]
No
The information is requested by official letter of the Manager of the Cli-mate Change Office to the Administrator of Fluvial Harbor Ungheni. The legal basis for such request and provision of information is Law No. 982 of 11.05.2000 on access to information.
Data provider (diesel oil consumption for naval transportation)
State Enterprise “Bacul Molovata” (on Dniester River)
V. Carpov, Ad-ministrator
1, Alexandri Str., Molovata Noua village, Dubasari district, MD-4576, Republic of Moldova,Tel.: +373-248-51-330
No
The information is requested by official letter of the Manager of the Climate Change Office to the Administrator of State Enterprise “Bacul Molovata”. The legal basis for such request and provision of information is Law No. 982 of 11.05.2000 on access to information.
Data provider (fuel use and number of engines, wagons and trains)
State Company “Railways of Moldova” T.V. Orehova
48, Vlaicu Parcalab Str., MD-2012, Chisinau, Republic of MoldovaTel.: 373-22-83-20-40 / 83-47-56Fax: +373-22-83-43-90E-mail: [email protected]
No
The information is requested by official letter of the Manager of the Climate Change Office to the Director of State Company “Railways of Moldova”. The legal basis for such request and provision of information is Law No. 982 of 11.05.2000 on access to information.

1 - 5
Chapter 1: Institutional Arrangements
Role Organization Contact person [Name]
Contact data[E-mail, telephone, etc.]
Participation in meetings on GHG inventory development?
[Yes/No]
Comments[Institutional arrangements]
Data provider (fuel use and number of engines, wagons and trains)
State Company “Railways of Moldova” Emil Fiodorov
48, Vlaicu Parcalab Str., MD-2012, Chisinau, Republic of MoldovaTel.: 373-22-83-20-40 / 83-45-04Fax: +373-22-83-43-90 E-mail: [email protected], [email protected]
No
The information is requested by official letter of the Manager of the Climate Change Office to the Director of State Company “Railways of Moldova”. The legal basis for such request and provision of information is Law No. 982 of 11.05.2000 on access to information.
Data provider (use of fuels and lu-bricants in the National Army of the Republic of Moldova)
Ministry of DefenseCol. Iurie Bruma, Head of Logistic Direction
84, Hancesti Highway, MD-2021, Chisinau, Republic of Moldova,Tel.: +373-22-25-24-07 E-mail: [email protected]
No
The information is requested by official letter of the Manager of the Cli-mate Change Office to the Minister of Defense. The legal basis for such request and provision of information is Law No. 982 of 11.05.2000 on access to information.
Data provider (fuel use for domestic and international aviation, number of airplanes used and number of flights)
Civil Aeronautical Authority of the Republic of Moldova Svetlana Siscanu
80/2, Dacia Ave., MD-2026, Chisinau, Republic of Moldova,Tel.: +373-22-82-35-00, +373-22-82-35-94Fax: +373-22-52-91-18E-mail: [email protected], [email protected]
No
The information is requested by official letter of the Manager of the Cli-mate Change Office to the Director of Civil Aeronautical Authority. The legal basis for such request and provision of information is Law No. 982 of 11.05.2000 on access to information.
Data provider (import, use, transit and technology loss of natural gas, specifications of natural gas distribu-tion networks and main pipelines)
“Moldovagaz” JSC Ivan Garciu
38, Albisoara Str., MD-2005, Chisinau, Republic of Moldova,Tel.: +373-22-57-80-02 / 57-80-47Fax: +373-22-22-00-02 E-mail: [email protected]
No
The information is requested by official letter of the Manager of the Cli-mate Change Office to the President of the Board of Directors of “Moldo-vagaz” JSC. The legal basis for such request and provision of informa-tion is Law No. 982 of 11.05.2000 on access to information.
Data provider (fuel import and export) Customs Service of the Republic of Moldova Angela Timuta
30, Nicolae Starostenco Str., MD-2065, Chisinau, Republic of Moldova,Tel./Fax: +373-22-27-30-61 Tel.: +373-22-57-42-61 E-mail: [email protected]
No
The information is requested by official letter of the Manager of the Cli-mate Change Office to the General Director of the Customs Service. The legal basis for such request and provision of information is Law No. 982 of 11.05.2000 on access to information.
Consultant responsible for verifica-tion and quality control (QC)
Institute of Power Engi-neering
Irina Vasiliev, MSc in Power Engineering
5, Academiei Str., room 443, MD-2028, Chisinau, Republic of Moldova Tel.: +373-22-73-74-94 E-mail: [email protected]
Yes Personal contract for provision of consultancy services
Consultant responsible for quality as-surance (QA)
Institute of Power Engi-neering
Mihai Tirsu, PhD in Power Engineering
5, Academiei Str., room 400, MD-2028, Chisinau, Republic of Moldova Tel.: +373-22-73-53-84, Fax: +373-22-73-53-82E-mail: [email protected]
No Personal contract for provision of consultancy services
Consultant responsible for uncer-tainty analysis
Institute of Power Engi-neering
Elena Bicova, PhD in Power Engineering
5, Academiei Str., room 443, MD-2028, Chisinau, Republic of Moldova Tel.: +373-22-73-74-94 E-mail: [email protected]
Yes Personal contract for provision of consultancy services

Chapter 1: Institutional Arrangements
1 - 6
Table 1.4: Industrial Processes and Product Use Sector Institutional Arrangements
Role Organization Contact [Name]
Contact data[E-mail, telephone, etc.]
Participation in meetings on GHG inventory development?
[Yes/No]
Comments[Institutional arrangements]
Industrial Processes Lead, responsible also for compiling estimates from categories 2F Product Use as Substitutes for ODS and 2G Other Prod-uct Manufacture and Use
Institute for Ecology and Geography
Anatol Tarita, PhD in Biology
3, Academiei Str., room 437, MD-2028, Chisinau, Republic of Moldova Tel.: +373-22-71-89-38 / +373-22-72-17-74E-mail: [email protected]
Yes Personal contract for provision of consultancy services
Consultant responsible for categories: 2A Min-eral Industry, 2B Chemical Industry, 2C Metal Industry, 2D Non-Energy Products from Fuels and Product Use and 2H Other
Institute for Ecology and Geography
Vladimir Brega, PhD in Chemistry
1, Academiei Str., room 405, MD-2028, Chisinau, Republic of Moldova Tel.: +373-22-71-94-48 / +373-22-73-19-18 E-mail: [email protected]
Yes Personal contract for provision of consultancy services
Data provider (Statistical Reports PRODMOLD – A “Production in natural expression in the in-dustry of the Republic of Moldova)”
National Bureau for Statistics, Division for Statistics of Industry, Energy and Con-struction
Bulgac Svetlana, Head of Division
106, Grenoble Str., MD-2019, Chisinau, Republic of Moldova Tel.: +373-22-40-30-55, E-mail: [email protected]
No
The information is requested by official letter of the Manager of the Climate Change Office to the Director of the National Bureau for Statistics (NBS). The legal basis for such request and provision of information is Law No. 93 as of 26.05.2017 on official statistics and Law No. 982 of 11.05.2000 on access to information.
Data provider (Statistical Report No.1-ozon „Trade regime and regulating use of haloge-nated hydrocarbons which destroy the ozone layer”)
National Bureau for Statistics, Head of Environment Statis-tics Service
Ludmila Lungu, Head of Service
106, Grenoble Str., MD-2019, Chisinau, Republic of MoldovaTel.: +373-22-40-30-23 E-mail: [email protected]
No
The information is requested by official letter of the Manager of the Climate Change Office to the Director of the National Bureau for Statistics (NBS). The legal basis for such request and provision of information is Law No. 93 as of 26.05.2017 on official statistics and Law No. 982 of 11.05.2000 on access to information.
Data provider (data on annual production of ce-ment and clinker, use of raw materials and ad-ditional material resources)
Lafarge Cement (Moldova) JSC Olga Ignatenco
1, Viitorului Str., MD-5400, Rezina, Republic of Moldova,Tel.: +373-254-55-500 / +373 69 888 289Fax: +373-254-55-549E-mail: [email protected]
No
The information is requested by official letter of the Manager of the Climate Change Office to the General Director of Lafarge Ciment JSC (Moldova). The legal basis for such request and provision of information is Law No. 982 of 11.05.2000 on access to information.
Data provider (data on annual production of bricks and expanded clay and use of raw ma-terials)
Building Materials Company “MACON” JSC
Maxim Vasiliev, Head of Produc-tion Development and New Technol-ogies Department
104, Uzinelor Str., MD-2023, Chisinau, Republic of Moldova,Tel.: +373-22-40-58-88, +373-22-40-58-54Fax: +373-22-47-43-21, +373-22-47-43-63Mobile: +373 69 257 701E-mail: [email protected]
No
The information is requested by official letter of the Manager of the Climate Change Office to the General Director of the Building Mate-rials Company “MACON” JSC. The legal basis for such request and provision of information is Law No. 982 of 11.05.2000 on access to information.
Data provider (data on annual production of glass and raw material use)
State Enterprise “Chi-sinau Glass Factory”
V. Zubovici, Engi-neer
20, Transnistria Str., MD-2023, Chisinau, Republic of Moldova,Tel.: +373-22-47-39-26, +373-22-47-39-34Fax: +373-22-47-38-70, +373-22-47-34-30E-mail: [email protected], [email protected], [email protected]
No
The information is requested by official letter of the Manager of the Climate Change Office to the General Director of the State Enter-prise “Chisinau Glass Factory”. The legal basis for such request and provision of information is Law No. 982 of 11.05.2000 on ac-cess to information.
Data provider (data on annual production of glass and raw material use)
IM „Glass Container Company” S.A.
Ion Tibuh, Engi-neer
201, Uzinelor Str., MD-2023, Chisinau, Republic of Moldova,Tel.: +373-22-47-24-18, +373-22-47-24-45Fax: +373-22-47-24-32, +373-22-47-54-57E-mail: [email protected], [email protected]
No
The information is requested by official letter of the Manager of the Climate Change Office to the General Director of the Joint Venture „Glass Container Company” JSC. The legal basis for such request and provision of information is Law No. 982 of 11.05.2000 on ac-cess to information.

1 - 7
Chapter 1: Institutional Arrangements
Role Organization Contact [Name]
Contact data[E-mail, telephone, etc.]
Participation in meetings on GHG inventory development?
[Yes/No]
Comments[Institutional arrangements]
Data provider (data on extracted non-metal cal-careous minerals to be used as raw materials in industrial processes which involve limestone oven combustion)
Agency for Geol-ogy and Mineral Re-sources
Adriana Curcubet,Senior Specialist, Geology Division
156, Mitropolit Dosoftei Str., MD-2004, Chisinau, Republic of MoldovaTel.: +373-22-75-06-56; +373-22-75-14-38Fax: +373-22-75-08-63, E-mail: [email protected], [email protected]
No
The information is requested by official letter of the Manager of the Climate Change Office to the Director of the Agency for Geology and Mineral Resources. The legal basis for such request and pro-vision of information is Law No. 982 of 11.05.2000 on access to information.
Data provider (data on production of bitumen-based asphalt mixtures (asphalt concrete) for works on roads and bridges)
Ministry of Economy and Infrastructure of the Republic of Mol-dova
Radu Rogovei
1, Piata Marii Adunari Nationale, MD-2033, Chisinau, Republic of Moldova,Tel.: +373-22-25-01-07; +373-22-25-06-95Fax: +373-22-23-40-64E-mail: [email protected]
No
The information is requested by official letter of the Manager of the Climate Change Office to the Minister of Economy and Infrastruc-ture. The legal basis for such request and provision of information is Law No. 982 of 11.05.2000 on access to information.
Data provider (data on production of bitumen-based asphalt mixtures (asphalt concrete) for works on roads and bridges)
State Enterprise “State Administration of Roads”
Petru Triboi
12A, Bucuriei Str., MD-2004, Chisinau, Republic of Moldova,Tel.: +373-22-74-05-70; +373-22-74-12-05Fax: +373-22-22-22-80
No
The information is requested by official letter of the Manager of the Climate Change Office to the General Director of the State Enter-prise “State Administration of Roads”. The legal basis for such re-quest and provision of information is Law No. 982 of 11.05.2000 on access to information.
Data provider (import and export of industrial products, including cooling equipment and fre-ons)
Customs Service of the Republic of Mol-dova
Angela Timuta
30, Nicolae Starostenco Str., MD-2065, Chisinau, Republic of Moldova,Tel./Fax: +373-22-27-30-61 Tel.: +373-22-57-42-61 E-mail: [email protected], [email protected]
No
The information is requested by official letter of the Manager of the Climate Change Office to the General Director of the Customs Ser-vice. The legal basis for such request and provision of information is Law No. 982 of 11.05.2000 on access to information.
Data provider (data on share of different re-frigeration agents incorporated in refrigeration equipment and air conditioning devices import-ed in Moldova)
Non-governmental association of refrig-eration technicians of the Republic of Moldova
Vasile Cartofeanu, Director
9/6, Studentilor Str., room 204, MD-2045, Chisinau, Republic of Moldova, Tel.: +373-22-32-17-16, +373-22-50-99-30 Fax: +373-22-50-99-40E-mail: [email protected]
No
The information is requested by official letter of the Manager of the Climate Change Office to the Director of Non-governmental asso-ciation of refrigeration technicians. The legal basis for such request and provision of information is Law No. 982 of 11.05.2000 on ac-cess to information.
Data provider (import of refrigeration equipment and freons)
Trade Company ECOLUX Ltd(S.C. Ecolux S.R.L.)
Nadejada Pus-casu, Chief Accountant
79/1, 31 August 1989 Str., ap.29, MD-2012, Chisinau, Republic of Moldova,Tel.: +373-22-50-03-99Fax: +373-22-50-09-64 E-mail: [email protected] www.ecolux.md
No
The information is requested by official letter of the Manager of the Climate Change Office to the Director of Trade Company ECOLUX Ltd. The legal basis for such request and provision of information is Law No. 982 of 11.05.2000 on access to information.
Data provider (import of refrigeration equipment and freons)
Trade Company ECOLUX Ltd(S.C. Ecolux S.R.L.)
Lilia Gudi
3, Sfintul Gheorghe Str., MD-2001, Chisinau, Republic of Moldova,Tel.: +373-22-50-09-63 Fax: +373-22-50-09-64Mobile: +373-69-44-54-55E-mail: [email protected]: http://www.ecolux.md
No
The information is requested by official letter of the Manager of the Climate Change Office to the Director of Trade Company ECOLUX Ltd. The legal basis for such request and provision of information is Law No. 982 of 11.05.2000 on access to information.

Chapter 1: Institutional Arrangements
1 - 8
Role Organization Contact [Name]
Contact data[E-mail, telephone, etc.]
Participation in meetings on GHG inventory development?
[Yes/No]
Comments[Institutional arrangements]
Data provider (import of refrigeration equipment and freons)
Trade Company MASFRIGCOM Ltd
Stepan Marinov, Director
1, V. Crasescu, or. Straseni, Republic of Moldova, Tel.: +373-237-2-24-28, Fax: +373-237-2-30-13, Mobile: +373-69-12-50-83,E-mail: [email protected]
No
The information is requested by official letter of the Manager of the Climate Change Office to the Director of the Trade Company MAS-FRIGCOM Ltd. The legal basis for such request and provision of information is Law No. 982 of 11.05.2000 on access to information.
Data provider (import of refrigeration equipment and freons)
Trade Company MASFRIGCOM Ltd(S.R.L. Masfrigcom)
Stela Buzi,Chief Accountant
1, V. Crasescu, or. Straseni, Republic of Moldova, Tel.: +373-237-2-24-28, Fax: +373-237-2-30-13, E-mail: [email protected]
No
The information is requested by official letter of the Manager of the Climate Change Office to the Director of the Trade Company MAS-FRIGCOM Ltd. The legal basis for such request and provision of information is Law No. 982 of 11.05.2000 on access to information.
Data provider (import of refrigeration equipment and freons)
Trade Company FRIGOMAS Ltd(Frigomas S.A.)
Petru Bonta, Di-rector
51, Stefan cel Mare Str., or. Straseni, Republic of Moldova, Tel.: +373-237-2-31-30, +373-237-2-43-36Mobile: +373-79-54-90-41E-mail: [email protected]
No
The information is requested by official letter of the Manager of the Climate Change Office to the Director of the Trade Company FRIGOMAS Ltd. The legal basis for such request and provision of information is Law No. 982 of 11.05.2000 on access to information.
Data provider (import of refrigeration equipment and freons)
Trade Company FRIO-DINS Ltd(FRIO-DINS SRL)
Arcadie Cojocari, Director
1, Florilor Str., MD-2068, Chisinau, Republic of Moldova, Tel./Fax: +373-22-49-01-32, Mobile: +373-69-15-63-22,E-mail: [email protected]
No
The information is requested by official letter of the Manager of the Climate Change Office to the Director of Trade Company FRIO-DINS Ltd. The legal basis for such request and provision of informa-tion is Law No. 982 of 11.05.2000 on access to information.
Data provider (import of refrigeration equipment and freons)
Trade Company FRI-GOIND Ltd
Teodor Anghel, Director
4/1, Romana Str., ap.56, Chisinau, Republic of Moldova, Tel.: +373-22-92-85-17, +373-22-47-37-16, +373-22-47-04-30, Mobile: +373-69-05-14-10E-mail: [email protected]
No
The information is requested by official letter of the Manager of the Climate Change Office to the Director of the Trade Company FRIGOIND Ltd. The legal basis for such request and provision of information is Law No. 982 of 11.05.2000 on access to information.
Data provider (import of refrigeration equipment and freons)
Trade Company DINA COCIUG Ltd (Dina Cociug SRL)
Cociug Mihail, Di-rectorVasile Postolachi, Deputy General Director
38/7, Dacia Av., MD-2060, Chisinau, Republic of Moldova Tel/Fax: +373-22-56-88-30 E-mail: [email protected], [email protected]: http://dina.md
No
The information is requested by official letter of the Manager of the Climate Change Office to the Director of Trade Company DINA COCIUG Ltd. The legal basis for such request and provision of in-formation is Law No. 982 of 11.05.2000 on access to information.
Data provider (import of refrigeration equipment and freons)
Trade Company DINA COCIUG Ltd(Dina Cociug SRL)
Margineanu L.
Butin V.
38/7, Dacia Av., MD-2060, Chisinau, Republic of Moldova Tel/Fax: +373-22-56-88-30 / 56-88-75Mobile: +373-79-70-37-05 E-mail: [email protected]
No
The information is requested by official letter of the Manager of the Climate Change Office to the Director of Trade Company DINA COCIUG Ltd. The legal basis for such request and provision of in-formation is Law No. 982 of 11.05.2000 on access to information.
Data provider (import of refrigeration equipment and freons)
Trade Company YORK REFRIGER-ENT Ltd (SRL York Refrigerent)
Sergiu Baltaga, DirectorOlga Gorodetcaia,Import manager
22, Mihail Kogalniceanu Str., of. 9MD-2001, Chisinau, Republic of MoldovaTel/Fax: +373-22-22-60-16; + 373-22-27-39-43; E-mail: [email protected]
No
The information is requested by official letter of the Manager of the Climate Change Office to the Director of Trade Company YORK REFRIGERENT Ltd. The legal basis for such request and provision of information is Law No. 982 of 11.05.2000 on access to informa-tion.

1 - 9
Chapter 1: Institutional Arrangements
Role Organization Contact [Name]
Contact data[E-mail, telephone, etc.]
Participation in meetings on GHG inventory development?
[Yes/No]
Comments[Institutional arrangements]
Data provider (data on number and capacity of electrical equipment – high voltage powered installations, using sulphur hexafluoride and perfluorocarbons as insulating gas)
Foreign Capital Com-pany GAS NATURAL FENOSA JSC (ICS “Gas Natural Fenosa Furnizare Energie” SRL)
Lilian Cernolevckii,Quality and Envi-ronment Depart-ment
4, Andrei Doga Str., MD-2024, Chisinau, Republic of MoldovaTel.: +373-22-43-13-60 / +373-22-43-16-75Mobile: +373-69-87-17-91E-mail: [email protected]: http://gasnaturalfenosa.com
No
The information is requested by official letter of the Manager of the Climate Change Office to the Director of Foreign Capital Company GAS NATURAL FENOSA JSC. The legal basis for such request and provision of information is Law No. 982 of 11.05.2000 on ac-cess to information.
Data provider (data on number and capacity of electrical equipment – high voltage powered installations, using sulphur hexafluoride and perfluorocarbons as insulating gas)
State Company “Moldelectrica” (IS “Moldelectrica”)
N. Melnicenco
78, Vasile Alexandri Str., MD-2012, Chisinau, Republic of MoldovaTel. +373-22-22-22-70, +373-22-25-33-96Fax: +373-22-25-31-42E-mail: [email protected], [email protected]
No
The information is requested by official letter of the Manager of the Climate Change Office to the Director of State Company “Moldelec-trica”. The legal basis for such request and provision of information is Law No. 982 of 11.05.2000 on access to information.
Data provider (data on number and capacity of electrical equipment – high voltage powered installations, using sulphur hexafluoride and perfluorocarbons as insulating gas)
RED “NORD-VEST”Ltd (SA “Retelele Electrice de Distribu-tie Nord-Vest”)
A. Botnariuc
30, Stefan cel Mare Str., MD-5102, or. Donduseni, Republic of MoldovaTel. +373-251-2-23-06, +373-251-2-02-48Fax: +373-251-2-42-79E-mail: [email protected]
No
The information is requested by official letter of the Manager of the Climate Change Office to the Director of RED “Nord-Vest” Ltd. The legal basis for such request and provision of information is Law No. 982 of 11.05.2000 on access to information.
Data provider (data on number and capacity of electrical equipment – high voltage powered installations, using sulphur hexafluoride and perfluorocarbons as insulating gas)
“RED-NORD” Ltd (SA “Retelele Elec-trice de Distributie Nord”)
Pavel Vladimir
180A, Stefan cel Mare Str., MD-3100, mun. Balti, Republic of MoldovaTel./Fax: +373-231-5-31-00 / +373-231-5-31-18Tel.: +373-231-5-31-09 / +373-231-5-31-08E-mail: [email protected]
No
The information is requested by official letter of the Manager of the Climate Change Office to the Director of “RED-Nord” Ltd. The legal basis for such request and provision of information is Law No. 982 of 11.05.2000 on access to information.
Data provider (data on import of pressurized aerosols with inhalation dosing, propulsion sub-stance based on HFCs)
Medicines and Medi-cal Devices Agency (Agentia Medicamen-tului si Dispozitivelor medicale)
Vladislav Zara,General Director
2/1, Korolenco Str., MD-2028, Chisinau, Republic of MoldovaTel. +373-22-88-43-01E-mail: [email protected]: http://amed.md
No
The information is requested by official letter of the Manager of the Climate Change Office to the General Director of the Medicines and Medical Devices Agency. The legal basis for such request and provision of information is Law No. 982 of 11.05.2000 on access to information.
Data provider (information on number of ve-hicles registered in the Republic of Moldova, ac-cording to data of the State Registry of Vehicles)
Public Service Agen-cy Olesea Savcenco
42, Puskin Str., MD-2012, Chisinau, Republic of MoldovaTel.: +373-22-25-70-70 / +373-22-26-95-94E-mail: [email protected],[email protected]
No
The information is requested by official letter of the Manager of the Climate Change Office to the Director of Public Service Agency. The legal basis for such request and provision of information is Law No. 982 of 11.05.2000 on access to information. A service provision agreement has been concluded between parties for data provision.
Consultant responsible for verification and qual-ity control (QC)
Climate Change Of-fice, Ministry of Ag-riculture, Regional Development and Environment
Marius Taranu, MSc in Biology
156A, Mitropolit Dosoftei Str., room 37, MD-2004, Chisinau, Republic of MoldovaTel/Fax: +373-22-23-22-47, E-mail: [email protected], [email protected]
Yes Personal contract for provision of consultancy services

Chapter 1: Institutional Arrangements
1 - 10
Role Organization Contact [Name]
Contact data[E-mail, telephone, etc.]
Participation in meetings on GHG inventory development?
[Yes/No]
Comments[Institutional arrangements]
Consultant responsible for quality assurance (QA)
Technical University of Moldova, Faculty of Urbanism and Ar-chitecture, Program “Engineering of Heat, Gas and Climate Control Systems in Buildings and Envi-ronment Protection”
Natalia Beglet, PhD in Power En-gineering, Head of Program
78, 31 August 1989 Str., Building No.2, MD-2004, Chisinau, Republic of Moldova, Tel: +373-68-16-88-22E-mail: [email protected]
No Personal contract for provision of consultancy services
Consultant responsible for uncertainty analysis
Climate Change Of-fice, Ministry of Ag-riculture, Regional Development and Environment
Marius Taranu, MSc in Biology
156A, Mitropolit Dosoftei Str., room 37, MD-2004, Chisinau, Republic of MoldovaTel/Fax: +373-22-23-22-47, E-mail: [email protected], [email protected]
Yes Personal contract for provision of consultancy services
Table 1.5: Agriculture Sector Institutional Arrangements
Role Organization Contact person[Name]
Contact data[E-mail, telephone, etc.]
Participation in meetings on development of GHG inventory?
[Yes/No]
Comments[Institutional arrangements]
Agriculture Sector Lead, responsible also for categories: 3A Enteric Fer-mentation and 3B Manure Manage-ment
Scientific-Practical In-stitute for Biotechnol-ogy in Animal Breed-ing and Veterinary Medicine
Sergiu Cosman, PhD Hab. in Agriculture
Maximovca village, Anenii-Noi district, MD-6525, Republic of Moldova Tel.: +373-22-35-93-57; +373-22-35-92-95, E-mail: [email protected]
Yes Personal contract for provision of consultancy services
Consultant responsible for compiling estimates for categories 3D Agricul-tural Soils and 3H Urea Application
Climate Change Of-fice, Ministry of Ag-riculture, Regional Development and En-vironment
Lilia Taranu, PhD in Biology
156A, Mitropolit Dosoftei Str., room 37, MD-2004, Chisinau, Republic of MoldovaTel/Fax: +373-22-23-22-47, E-mail: [email protected]
Yes Personal contract for provision of consultancy services
Data provider (Statistical Reports No. 9-AGR „Use of plant protection prod-ucts and introduction of artificial and natural fertilizer”, No. 29-AGR „Pro-duction obtained from crops harvested from all seeded area”)
National Bureau for Statistics, Statistics in Agriculture and Environment Division, Section for Agricultural Statistics
Maria Chiperi
106, Grenoble Str., MD-2019,Chisinau, Republic of MoldovaTel.: +373-22-40-30-23 E-mail: [email protected]
No
The information is requested by official letter of the Manager of the Climate Change Office to the Director of the National Bureau for Statistics (NBS). The legal basis for such request and provi-sion of information is Law No. 93 as of 26.05.2017 on official sta-tistics and Law No. 982 of 11.05.2000 on access to information.
Data provider (Statistical Reports No. 6 “Number of cattle and poultry in households”, No. 15-AGR “Livestock number”, No. 24-AGR „Condition of the livestock sector”)
National Bureau for Statistics, Division for Statistics in Agricul-ture and Environment, Section of Agricultural Censuses
Rodica Boinstean, Head of Section
106, Grenoble Str., MD-2019,Chisinau, Republic of MoldovaTel.: +373-22-73-17-81 E-mail: [email protected]
No
The information is requested by official letter of the Manager of the Climate Change Office to the Director of the National Bureau for Statistics (NBS). The legal basis for such request and provi-sion of information is Law No. 93 as of 26.05.2017 on official sta-tistics and Law No. 982 of 11.05.2000 on access to information.

1 - 11
Chapter 1: Institutional Arrangements
Role Organization Contact person[Name]
Contact data[E-mail, telephone, etc.]
Participation in meetings on development of GHG inventory?
[Yes/No]
Comments[Institutional arrangements]
Consultant responsible for verification and quality control (QC)
Scientific-Practical In-stitute for Biotechnol-ogy in Animal Breed-ing and Veterinary Medicine
Sergiu Cosman, PhD Hab. in Agriculture
Maximovca village, Anenii-Noi district, MD-6525, Republic of Moldova Tel.: +373-22-35-93-57; +373-22-35-92-95, E-mail: [email protected]
Yes Personal contract for provision of consultancy services
Consultant responsible for quality as-surance (QA) (Categories 3A Enteric Fermentation and 3B Manure Man-agement)
Technical University of Moldova
Nicolae Bucataru, Prof., PhD Hab. in Agriculture
8/1, Mircești Str., ap.71, Chisinau, Republic of MoldovaTel: +373-22-43-21-50E-mail: [email protected]
No Personal contract for provision of consultancy services
Consultant responsible for quality as-surance (QA) (Categories 3D Agricul-tural Soils and 3H Urea Application)
Institute for Pedology, Agrochemistry and Soil Protection “Nico-lae Dimo”
Tamara Leah, Prof., PhD Agriculture, Re-searcher
100, Ialoveni Str., 1st floor, MD-2070, Chisinau, Republic of Moldova Tel: +373-22-28-48-43 / 28-48-62, Fax: +373-22-28-48-55E-mail: [email protected]
No Personal contract for provision of consultancy services
Consultant responsible for uncertainty analysis
Climate Change Of-fice, Ministry of Ag-riculture, Regional Development and En-vironment
Lilia Taranu, PhD in Biology
156A, Mitropolit Dosoftei Str., room 37, MD-2004, Chisinau, Republic of MoldovaTel/Fax: +373-22-23-22-47, E-mail: [email protected]
Yes Personal contract for provision of consultancy services
Table 1.6: Land Use, Land-Use Change and Forestry Sector Institutional Arrangements
Role Organization Contact person [Name]
Contact data[E-mail, telephone, etc.]
Participation in meetings on development of GHG inventory?
[Yes/No]
Comments[Institutional arrangements]
LULUCF Sector Lead, consultant responsible also for categories: 4A Forest Land, 4F Other Land and 4G Harvested Wood Products
Forestry Research and Management Institute, “Moldsilva” Agency
Ion Talmaci, Technical Vice Director
69, Calea Iesilor Str., MD-2069, Chisinau, Republic of MoldovaTel: +373-22-92-89-59Fax: +373-22-59-33-51Mobile: +373-22-69-18-76-93E-mail: [email protected]
Yes Personal contract for provision of consultancy services
Consultant responsible for compiling estimates for categories 4B Cropland (cropland covered with woody vegeta-tion and land converted to cropland) and 4E Settlements
State Agricultural Uni-versity of Moldova, Faculty of Horticulture,Department of Forest-ry and Public Gardens
Victor Sfecla, Vice-Dean,Senior Lecturer
44, Mircesti Str.MD-2049, Chisinau, Republic of MoldovaTel: +373-22-43-22-05 / 43-28-09Mobile: +373-69-53-30-63E-mail: [email protected], [email protected], [email protected] Web: http://www.uasm.md
Yes Personal contract for provision of consultancy services

Chapter 1: Institutional Arrangements
1 - 12
Role Organization Contact person [Name]
Contact data[E-mail, telephone, etc.]
Participation in meetings on development of GHG inventory?
[Yes/No]
Comments[Institutional arrangements]
Consultant responsible for compiling estimates for category 4B Cropland (annual changes in carbon stocks in mineral soils)
Institute for Pedology, Agrochemistry and Soil Protection “Nico-lae Dimo”
Tamara Leah, Prof., PhD in Agriculture, Researcher
100, Ialoveni Str., 1st floor, MD-2070, Chisinau, Republic of Moldova Tel: +373-22-28-48-43 / 28-48-62, Fax: +373-22-28-48-55E-mail: [email protected]
Yes Personal contract for provision of consultancy services
Consultant responsible for compiling estimates for categories 4C Grassland and 4D Wetlands
Forestry Research and Management Institute, “Moldsilva” Agency
Aliona Miron, PhD in Biology, Scientific Secretary
69, Calea Iesilor Str., MD-2069, Chisinau, Republic of MoldovaTel.: +373-22-93-12-02Fax: +373-22-59-33-51Mobile: +373-79-64-31-66E-mail: [email protected]
Yes Personal contract for provision of consultancy services
Data provider (Statistical Report No. 2-LIV-VII “Establishing and deforesta-tion of multiannual plantations, produc-tion of seeding material”)
National Bureau for Statistics, Division for Statistics in Agricul-ture and Environment, Environment Statistics Service
Ludmila Lungu, Head of Service
106, Grenoble Str., MD-2019, Chisinau, Republic of MoldovaTel.: +373-22-73-75-42 E-mail: [email protected]
No
The information is requested by official letter of the Manager of the Climate Change Office to the Director of the National Bureau for Statistics (NBS). The legal basis for such request and provision of information is Law No. 93 as of 26.05.2017 on official statistics and Law No. 982 of 11.05.2000 on access to information.
Data provider (Statistical Report on Forest Cultivation Works (Form 1 G.S.); Statistical Report on Condition of Forests (Form 2 GS); Statistical Re-port on Release of Wood mass, forest care works and associated uses (Form 3GS); Statistical Report on Cases of Forestry Fires (Form 4 GS); Forest Balance of Land Managed by ”Mold-silva” Agency (Form 22); Report on deforested areas and transferred to another land use category; Report on forest guarding; State accounting of forestry fund; Forestry improvement (Part III: Accounting of forest improve-ment); Report on forest areas and other forest land categories in which N based fertilizer was applied; Report on forest areas and other forest land categories which were improved by application of limestone and dolomite)
“Moldsilva” Agency, Division for Forestry Fund, Protected Ar-eas, Guarding and Protection
Petru Rotaru, Head of Division
124, Stefan cel Mare Ave., Chisinau, Republic of MoldovaTel: +373-22-27-23-06, +373-22-272-425,Fax: +373-22-27-73-45E-mail: [email protected]
No Information is requested by the Forestry Research and Man-agement Institute

1 - 13
Chapter 1: Institutional Arrangements
Role Organization Contact person [Name]
Contact data[E-mail, telephone, etc.]
Participation in meetings on development of GHG inventory?
[Yes/No]
Comments[Institutional arrangements]
Data provider (Land Cadaster, as of 1st January of the reporting year, Explana-tory Note)
Agency for Land Rela-tions and Cadaster, Division Cadaster of Real Estate
Octavian Mocreac, Leading Consultant
48 Serghei Lazo Str., MD-2004, Chisinau, Republic of MoldovaTel: +373-22-88-12-55; +373-22-88-12-63 Fax: +373-22-22-63-73E-mail: [email protected], [email protected]
No Information is requested by the Forestry Research and Man-agement Institute
Data provider (Report on area of for-ests and other categories of forest vegetation affected by fires (for land which is not managed by “Moldsilva” Agency); Report on illegal deforesta-tion in forests and other types of forest vegetation; Report on wood mass ap-proved for harvesting)
Environment Protec-tion Inspectorate, Direction for Flora and Fauna
Daniel Zugravu, Head of Direction
9, Constantin Tanase Str., MD-2005, Chisinau, Republic of Moldova Tel.: +373-22-24-23-26 E-mail: [email protected]
No Information is requested by the Forestry Research and Man-agement Institute
Consultant responsible for verification and quality control (QC)
Forestry Research and Management Institute, “Moldsilva” Agency
Ion Talmaci, Technical Vice Director
69, Calea Iesilor Str., MD-2069, Chisinau, Republic of MoldovaTel: +373-22-92-89-59Fax: +373-22-59-33-51E-mail: [email protected]
Yes Personal contract for provision of consultancy services
Consultant responsible for quality as-surance (QA)
“Moldsilva” Agency, Forestry Research and Management Institute, Service for Prognoses, Monitor-ing, Programs and Strategies
Liliana Spitoc, Head of Service
69, Calea Iesilor Str., MD-2069, Chisinau, Republic of MoldovaTel.: +373-22-92-89-56E-mail: [email protected]
No Personal contract for provision of consultancy services
Consultant responsible for uncertainty analysis
Forestry Research and Management Institute, “Moldsilva” Agency
Ion Talmaci, Technical Vice Director
69, Calea Iesilor Str., MD-2069, Chisinau, Republic of MoldovaTel: +373-22-92-89-59Fax: +373-22-59-33-51E-mail: [email protected]
Yes Personal contract for provision of consultancy services

Chapter 1: Institutional Arrangements
1 - 14
Table 1.7: Waste Sector Institutional Arrangements
Role Organization Contact person [Name]
Contact data[E-mail, telephone, etc.]
Participation in meetings related to GHG Inventory development? [Yes/No]
Comments[Institutional arrangements]
Waste Sector Lead, consultant re-sponsible for compiling estimates for categories 5A Solid Waste Disposal and 5B Biological Treatment of Solid Waste
Environmental Pollu-tion Prevention Office, Ministry of Agriculture, regional Development and Environment
Tatiana Tugui, PhD in Chemistry, Manager
156A, Mitropolit Dosoftei Str., room 310, MD- 2004, Chisinau, Republic of MoldovaTel/Fax: +373-22-22-25-42 E-mail: [email protected]
Yes Personal contract for provision of consultancy services
Consultant responsible for compiling estimates for categories 5C Incinera-tion and Open Burning of Waste and 5D Wastewater Treatment and Dis-charge
Environmental Pollu-tion Prevention Office, Ministry of Agriculture, regional Development and Environment
Natalia Efros,Consultant
156A, Mitropolit Dosoftei Str., room 310, MD- 2004, Chisinau, Republic of MoldovaTel/Fax: +373-22-22-25-42 E-mail: [email protected], [email protected]
Yes Personal contract for provision of consultancy services
Data provider (Statistical Report No. 1 – “Toxic waste: generation, use and neutralization of toxic waste”, Statisti-cal Report No.2 „Generation, use of waste”)
National Bureau for Statistics, Division for Statistics in Agricul-ture and Environment, Environment Statistics Service
Ludmila Lungu, Head of Service
106, Grenoble Str., MD-2019, Chisinau, Republic of MoldovaTel.: +373-22-73-75-42 E-mail: [email protected]
No
The information is requested by official letter of the Manager of the Climate Change Office to the Director of the National Bureau for Statistics (NBS). The legal basis for such request and provision of information is Law No. 93 as of 26.05.2017 on official statistics and Law No. 982 of 11.05.2000 on access to information.
Consultant responsible for verification and quality control (QC)
Environmental Pollu-tion Prevention Office, Ministry of Agriculture, regional Development and Environment
Tatiana Tugui, PhD in Chemistry, Manager
156A, Mitropolit Dosoftei Str., room 310, MD- 2004, Chisinau, Republic of MoldovaTel/Fax: +373-22-22-25-42 E-mail: [email protected]
Yes Personal contract for provision of consultancy services
Consultant responsible for quality as-surance (QA)
Independent Consul-tant Ludmila Gofman Tel: +373-69-06-23-39
E-mail: [email protected] No Personal contract for provision of consultancy services
Consultant responsible for uncertainty analysis
Environmental Pollu-tion Prevention Office, Ministry of Agriculture, regional Development and Environment
Natalia Efros,Consultant
156A, Mitropolit Dosoftei Str., room 310, MD- 2004, Chisinau, Republic of MoldovaTel/Fax: +373-22-22-25-42 E-mail: [email protected], [email protected]
Yes Personal contract for provision of consultancy services

1 - 15
Chapter 1: Institutional Arrangements
1.3 Potential Improvements
Table 1.8: Potential Improvements in the Management Structure Strengths in management structure of National Inventory System Potential improvements in management structure of the National Inventory System
The key strengths in the management structure of the National Inventory System (NIS) are as follows:• The existence of regulatory provisions that establish the obligation to submit data related to the inventory pro-
cess of GHG emissions towards specific deadlines to the competent authority designated with responsibility for national inventory preparation;
• Existence of a group of qualified experts specializing in areas related to the process of GHG emissions inventory with rich experience gained over the years 1998-2018, starting from the first cycle of GHG emissions inventory conducted during preparation of the First National Communication of the Republic of Moldova to the UNFCCC (1997-2000) and ending with the latest inventory cycles conducted during preparation of the Forth National Com-munication of the Republic of Moldova to UNFCCC (2014-2017) and of the Second Biennial Update Report of the Republic of Moldova under the UNFCCC (2017-2018);
• Possibilities for elucidation of quantitative and qualitative aspects related to the inventory process from sectorial, national and international statistical reports and publications;
• The existence of national studies in various sectorial areas, which allowed for the possibility in the near future to start using calculation methodologies of higher tiers within the national inventory;
• The existence of a database of activity data related to the inventory process of GHG emissions, which is updated within each inventory cycle and is maintained institutionally starting from the first cycle of GHG emissions inven-tory.
• Experience gained in implementing quality verification, quality control and quality assurance measures for the national inventory of GHG emissions.
While starting the most recent inventory cycle within the Project “Republic of Moldova: Enabling Activities for the Prepa-ration of the Second Biennial Update Report under the United Nations Framework Convention on Climate Change” (2017-2018), it has been anticipated that by the end of 2018 year, the National System for Monitoring and Reporting (NSMR) Greenhouse Gas Emissions and Other Information Relevant to Climate Change will be established through a Governmental Decision (since 20.07.2016 the draft GD was under the public consultation on the Climate Change Office website: http://clima.md/lib.php?l=en&idc=276, while since 07.02.2018 the draft GD was under the public consultation on the Governmental web platform: http://www.particip.gov.md/proiectview.php?l=ro&idd=4992). The NSMR has been recently established through the Government Decision No. 1277 as of 26 December 2018 (http://lex.justice.md/index.php?action=view&view=doc&lang=1&id=379061).Through establishing the NSMR it will be created the legal framework for enforcement the Article 15 of the Law on Environmental Protection No. 1515-XII of June 16, 1993 (Gazette of the Parliament of the Republic of Moldova No. 10 of January 10, 1993), the implementation of the provisions of the United Nations Framework Convention on Climate Change ratified by Parliament Decision No. 404-XIII of March 16, 1995 (Official Gazette of the Republic of Moldova No. 23 of April 27, 1995), the provisions of the Kyoto Protocol to which Moldova joined by Law No. 29 of February 13, 2003 (Official Gazette of the Republic of Moldova No. 48 of March 18, 2003); the provisions of the Association Agreement the Republic of Moldova - European Union (Title IV “Cooperation in the economic sector and other sectors,” Chapter 17 “Climate policies”), and the provisions of the Action Plan for implementation of the Environment Strategy for 2014 - 2023 regulated by Government Decision No. 301 of April 24, 2014 (Official Gazette of the Republic of Moldova No. 104-109, Art. 328 of June 05, 2014). By crating the NSMR it will be also partially transposed the Regulation (EU) No. 525/2013 of the European Parliament and of the Council of 21 May 2013 on a mechanism for monitoring and reporting greenhouse gas emissions and for reporting other information relevant to climate change at national and Union level and for repeal-ing Decision No. 280/2004/EC.
1.4 National Greenhouse Gas Emissions Inventory Cycle
The duration of the inventory cycle depends on national circumstances and reporting requirements. The diagram of the GHG inventory cycle is shown in Figure 1.1. In the Republic of Moldova, a biannual reporting cycle is applied. The side boxes show the calendar periods for completion of each stage of the last inven-tory cycle under the Second Biennial Update Report of the Republic of Moldova under the UNFCCC. The GHG inventory cycle presents important information that is believed to reflect the institutional arrangements in the scheme of development of the national inventory. Within the process, the cycle allows com-municating where and when institutional coordination is needed. Data providers may have different deadlines for submission of relevant information, depend-ing on the complexity and the time of publication of different statistical reports. Thus, for sector-specific data, collection periods are scheduled as adjusted to deadlines for generating information and inventory team needs.

Chapter 1: Institutional Arrangements
1 - 16
Figure 1.1: The most recent inventory cycle in the Republic of Moldova
Deadline: December 31, 2018
Deadline: November 30, 2018
Deadline: October 31, 2018
Deadline: September 30, 2018
Deadline: June 30, 2018 Deadline: May 31, 2018
Deadline: April 30, 2018
Deadline: January 31, 2018
Deadline: December 31, 2017
Deadline: November 01, 2017
Submit to UNFCCC. Prepare National Inventory Improvement Plan.
Kicko� meeting for initating a new cycle with the inventory team and potential data providers.
Finalize National Inventory Report Draft, Key Category Analysis, and Prepare Archives.
Address Errors and Comments from Review.
Prepare and QC initial estimates
Collect and QC AD and EFs.
Choose methods, identifying AD and EFs
Quality Assurance (QA) of Draft National Inventory Report.
Prepare and QC Draft National Inventory Report.
Draft and QC Key Category Analysis (KCA).
Organize AD and EFs.
Send letters with questionaires to data providers.
Send invitations to the kicko� meeting
Cycle beginsagain
Plan
Collect
EstimateWrite
Improve
Finalize

Chapter 2: Methods and Data Documentation
1: Institutional Arrangements
2: Methods and Data Documentation
3: Description of QA/QC Procedures
4: Description of Archiving System
5: Key Category Analysis
6: National Inventory Improvement Plan
Contact data of the Coordinator of the National Greenhous Gas Inventory
Country Republic of Moldova Postal address: 156A Mitropolit Dosoftei str., room 37, MD-2004, Chisinau, Republic of MoldovaName: Taranu Marius Telephone/Fax: +373 22 23 22 47Position: Coordinator of the National Greenhouse Gas Inventory E-mail: [email protected] Organization: Climate Change Office, Ministry of Agriculture, Regional Development and Environment URL: http://www.clima.md
2-1

Chapter 2: Methods and Data Documentation
2 - 2
2. Methods and Data Documentation 2.1. Energy SectorRelevant information on categories comprised within the inventory, including description of each category allocated to Sector 1 ‘Energy’ is provided below.
2.1.1. Category 1A1 ‘Energy Industries’Tables 2.1.1.1 – 2.1.1.18 below comprise relevant information on source categories comprised within the inventory, including description of each source by type of fuel allocated to category 1A1 ‘Energy Industries’.Table 2.1.1.1: Information on source category 1A1a Main activity electricity and heat production, solid fuels / CO2Sector EnergyCategory 1A1 Energy IndustriesSource / Fuel / Gas 1A1a Main activity electricity and heat production, solid fuels / CO2
Key Category? Tier 1: Yes: 1990 (L), 2016 (L, T); Tier 2: Yes: 1990 (L), 2016 (L, T) (1A1 Energy Industries – aggregated)
Category Description / Defini-tion
Sum of emissions from main activity producers of electricity generation, combined heat and power generation, and heat plants. Main activity producers (formerly known as public utilities) are defined as those undertakings whose primary activity is to supply the public. They may be in public or private ownership. Emissions from own on-site use of fuel should be included. Emissions from autoproducers should be assigned to the sector where they were generated and not under 1A1a.
Country Detail
In the Republic of Moldova electricity generation capacity include: Moldavian Thermal Power Plant (MTPP) in Dnestrovsk (on the left bank of the Dniester River) with an installed capacity of 2,520 MW; CHP-2 Chisinau, with an installed capacity of 240 MW and 1,200 Gcal/h heat capacity; CHP-1 Chisinau, with an installed capacity of 66 MW and 254 Gcal/h heat capacity; CHP-North Balti, with an installed capacity of 24 MW and 200 Gcal/h heat capacity; other power plants, including CHP owned by sugar plants with an installed capacity of 97.5 MW operating on natural gas and residual fuel oil, built during 1956-1981. In recent years, renewable energy sources of small power are being developed. Their total capacity in 2015 represented 5 MW of electric power, while in 2016 – circa 6.9 МW. In the RM, within 1990-2016, the share of solid fuels (coal) from total fuel consumption within category 1A1a decreased from 23.0 percent to 0.4 percent. Within the current inventory cycle, GHG emission under the Sector 1 ‘Energy’ were estimated for the first time separately for the RBDR (Right Bank of Dniester River) and LBDR (Left Bank of Dniester River).
Equation(Describe variables for method used)
Emissions GHG, fuel = Fuel Consumption fuel • Emission factor GHG, fuel (Equation 2.1)Where:
Emissions GHG, fuel - emission of the greenhouse gases by type of fuel (kg GHG);Fuel Consumption fuel - amount of fuel consumed (TJ);Emission factor GHG, fuel - default emission factor of a given greenhouse gases by type of fuel (kg gas/TJ). For CO2, it includes the carbon oxidation factor, assumed to be 1.
Methodology: Tier 1
Reference2006 IPCC Guidelines for National Greenhouse Gas Inventories, Volume 2: Energy, Chapter 2: Stationary Combustion, p. 2.11 (available on: https://www.ipcc-nggip.iges.or.jp/public/2006gl/pdf/2_Volume2/V2_2_Ch2_Stationary_Combustion.pdf).National Inventory Report: 1990-2016. Greenhouse Gas Sources and Sinks in the Republic of Moldova (2018).
Describe How and Why this Method Was Chosen The Tier 1 method has been chosen because the CS EFs are not available.
Type and source of activity dataQuantity of fuel (TJ) – activity data from Energy Balances of the Republic of Moldova and Quantity of fuel (t) – Statistical Yearbooks of the ATULBD (Administrative Territorial Units on the Left Bank of Dnies-ter), NCV for Other Bituminous Coal (25.44 TJ/kt). Quantity of fuel consumed is reported in the Table 3-54 from National Inventory Report: 1990-2016. Greenhouse Gas Sources and Sinks in the Republic of Moldova.
Type and source of EF and OF
IPCC Default EF from 2006 IPCC Guidelines for National Greenhouse Gas Inventories, Volume 2: Energy, Chapter 2: Stationary Combustion, page 2.16, Table 2.2.Fuel type CO2 Emission Factor UnitOther Bituminous Coal 94.600 t CO2 /TJAnthracite 98.300 t CO2 /TJ
Uncertainty of AD and source ±5%, expert judgement

Chapter 2: Methods and Data Documentation
2 - 3
Uncertainty of EF and source ±5%, expert judgement
Potential Improvements Potential improvements within the 1A1 ‘Energy Industries’ category could be possible once new AD regarding the fuel consumption for electricity and heat generation on the territory of the LBDR are available (filling the gaps for certain years). Also, another potential improvement could be identifying additional AD sources or updating AD from official statistical publications.
Table 2.1.1.2: Information on source category 1A1a Main activity electricity and heat production, solid fuels / CH4, N2OSector EnergyCategory 1A1 Energy IndustriesSource / Fuel / Gas 1A1a Main activity electricity and heat production, solid fuels / CH4, N2OKey Category? No
Category Description / Defini-tion
Sum of emissions from main activity producers of electricity generation, combined heat and power generation, and heat plants. Main activity producers (formerly known as public utilities) are defined as those undertakings whose primary activity is to supply the public. They may be in public or private ownership. Emissions from own on-site use of fuel should be included. Emissions from autoproducers should be assigned to the sector where they were generated and not under 1A1a.
Country Detail
In the Republic of Moldova electricity generation capacity include: Moldavian Thermal Power Plant (MTPP) in Dnestrovsk (on the Left Bank of the Dniester River) with an installed capacity of 2,520 MW; CHP-2 Chisinau, with an installed capacity of 240 MW and 1,200 Gcal/h heat capacity; CHP-1 Chisinau, with an installed capacity of 66 MW and 254 Gcal/h heat capacity; CHP-North Balti, with an installed capacity of 24 MW and 200 Gcal/h heat capacity; other power plants, including CHP owned by sugar plants with an installed capacity of 97.5 MW operating on natural gas and residual fuel oil, built during 1956-1981. In recent years, renewable energy sources of small power are being developed. Their total capacity in 2015 represented 5 MW of electric power, while in 2016 – circa 6.9 МW. In the RM, within 1990-2016, the share of solid fuels (coal) from total fuel consumption within category 1A1a decreased from 23.0 percent to 0.4 percent. Within the current inventory cycle, GHG emission under the Sector 1 ‘Energy’ were estimated for the first time separately for the RBDR and LBDR.
Equation(Describe variables for method used)
Emissions GHG, fuel = Fuel Consumption fuel • Emission factor GHG, fuel (Equation 2.1)Where:
Emissions GHG, fuel - emission of the greenhouse gases by type of fuel (kg GHG);Fuel Consumption fuel - amount of fuel consumed (TJ);Emission factor GHG, fuel - default emission factor of a given greenhouse gases by type of fuel (kg gas/TJ).
Methodology: Tier 1
Reference2006 IPCC Guidelines for National Greenhouse Gas Inventories, Volume 2: Energy, Chapter 2: Stationary Combustion, p. 2.11 (available on: https://www.ipcc-nggip.iges.or.jp/public/2006gl/pdf/2_Volume2/V2_2_Ch2_Stationary_Combustion.pdf).National Inventory Report: 1990-2016. Greenhouse Gas Sources and Sinks in the Republic of Moldova (2018).
Describe How and Why this Method Was Chosen Due to the unavailability of country specific emission factors, the Tier 1 methodology has been used.
Type and source of activity data Quantity of fuel (TJ) – activity data from Energy Balances of the Republic of Moldova and Quantity of fuel (t) – Statistical Yearbooks of the ATULBD, NCV for Other Bituminous Coal (25.44 TJ/kt). Quantity of fuel consumed is reported in the Table 3-54 from National Inventory Report: 1990-2016. Greenhouse Gas Sources and Sinks in the Republic of Moldova.
Type and source of EF and OF
IPCC Default EF from 2006 IPCC Guidelines for National Greenhouse Gas Inventories, Volume 2: Energy, Chapter 2: Stationary Combustion, page 2.16, Table 2.2
Fuel typeCH4 Emission Factor N2O Emission Factor
kg/TJOther Bituminous Coal 1.0 1.5 Anthracite 1.0 1.5
Uncertainty of AD and source ±5%, expert judgementUncertainty of EF and source ±50%, expert judgement
Potential Improvements Potential improvements within the 1A1 ‘Energy Industries’ category could be possible once new AD regarding the fuel consumption for electricity and heat generation on the territory of the LBDR are available (filling the gaps for certain years). Also, another potential improvement could be identifying additional AD sources or updating AD from official statistical publications.

Chapter 2: Methods and Data Documentation
2 - 4
Table 2.1.1.3: Information on source category 1A1a Main activity electricity and heat production, solid fuels / NOx, CO, NMVOC and SO2Sector EnergyCategory 1A1 Energy IndustriesSource / Fuel / Gas 1A1a Main activity electricity and heat production, solid fuels / NOx, CO, NMVOC and SO2
Key Category? Not applicable for pollutant emissions
Category Description / Defini-tion
Sum of emissions from main activity producers of electricity generation, combined heat and power generation, and heat plants. Main activity producers (formerly known as public utilities) are defined as those undertakings whose primary activity is to supply the public. They may be in public or private ownership. Emissions from own on-site use of fuel should be included. Emissions from autoproducers should be assigned to the sector where they were generated and not under 1A1a.
Country Detail
In the Republic of Moldova electricity generation capacity include: Moldavian Thermal Power Plant (MTPP) in Dnestrovsk (on the left bank of the Dniester River) with an installed capacity of 2,520 MW; CHP-2 Chisinau, with an installed capacity of 240 MW and 1,200 Gcal/h heat capacity; CHP-1 Chisinau, with an installed capacity of 66 MW and 254 Gcal/h heat capacity; CHP-North Balti, with an installed capacity of 24 MW and 200 Gcal/h heat capacity; other power plants, including CHP owned by sugar plants with an installed capacity of 97.5 MW operating on natural gas and residual fuel oil, built during 1956-1981. In recent years, renewable energy sources of small power are being developed. Their total capacity in 2015 represented 5 MW of electric power, while in 2016 – circa 6.9 МW. In the RM, within 1990-2016, the share of solid fuels (coal) from total fuel consumption within category 1A1a decreased from 23.0 percent to 0.4 percent. Within the current inventory cycle, GHG emission under the Sector 1 ‘Energy’ were estimated for the first time separately for the RBDR and LBDR.
Equation(Describe variables for method used)
E pollutant = AR fuel, consumption • EF pollutant (Equation 1)Where:
E pollutant – Annual emission of pollutant;AR fuel, consumption – Activity rate by fuel consumption;EF pollutant – Emission factor of pollutant.
Methodology: Tier 1
ReferenceEEA (2016), EMEP/EEA air pollutant emission inventory guidebook 2016.1.A.1 Energy industries, page 15 (available on: https://www.eea.europa.eu/publications/emep-eea-guidebook-2016/part-b-sectoral-guidance-chapters/1-energy/1-a-combustion/1-a-1-energy-industries/view).National Inventory Report: 1990-2016. Greenhouse Gas Sources and Sinks in the Republic of Moldova (2018).
Describe How and Why this Method Was Chosen Due to the unavailability of country specific emission factors, the Tier 1 methodology has been used.
Type and source of activity data Quantity of fuel (TJ) – activity data from Energy Balances of the Republic of Moldova and Quantity of fuel (t) – Statistical Yearbooks of the ATULBD, NCV for Other Bituminous Coal (25.44 TJ/kt). Quantity of fuel consumed is reported in the Table 3-54 from National Inventory Report: 1990-2016. Greenhouse Gas Sources and Sinks in the Republic of Moldova.
Type and source of EF and OF
EMEP/EEA air pollutant emission inventory guidebook 2016.1.A.1 Energy industries, page 16, Table 3-2.
Fuel type NOx CO NMVOC SO2
kg/TJ
Hard Coal 209 (200-350)
8.7 (6.15-15)
1.0 (0.6-2.4)
820 (330-5000)
Uncertainty of AD and source ±5%, expert judgementUncertainty of EF and source See the 95% confidence interval in the table above (in the brackets, lower-upper).
Potential Improvements Potential improvements within the 1A1 ‘Energy Industries’ category could be possible once new AD regarding the fuel consumption for electricity and heat generation on the territory of the LBDR are available (filling the gaps for certain years). Also, another potential improvement could be identifying additional AD sources or updating AD from official statistical publications.
Table 2.1.1.4: Information on source category 1A1a Main activity electricity and heat production, liquid fuels / CO2Sector EnergyCategory 1A1 Energy IndustriesSource / Fuel / Gas 1A1a Main activity electricity and heat production, liquid fuels / CO2
Key Category? Tier 1: Yes: 1990 (L), 2016 (L, T); Tier 2: Yes: 1990 (L), 2016 (L, T) (1A1 Energy Industries – aggregated)

Chapter 2: Methods and Data Documentation
2 - 5
Category Description / Defini-tion
Sum of emissions from main activity producers of electricity generation, combined heat and power generation, and heat plants. Main activity producers (formerly known as public utilities) are defined as those undertakings whose primary activity is to supply the public. They may be in public or private ownership. Emissions from own on-site use of fuel should be included. Emissions from autoproducers should be assigned to the sector where they were generated and not under 1A1a.
Country Detail
In the Republic of Moldova electricity generation capacity include: Moldavian Thermal Power Plant (MTPP) in Dnestrovsk (on the left bank of the Dniester River) with an installed capacity of 2,520 MW; CHP-2 Chisinau, with an installed capacity of 240 MW and 1,200 Gcal/h heat capacity; CHP-1 Chisinau, with an installed capacity of 66 MW and 254 Gcal/h heat capacity; CHP-North Balti, with an installed capacity of 24 MW and 200 Gcal/h heat capacity; other power plants, including CHP owned by sugar plants with an installed capacity of 97.5 MW operating on natural gas and residual fuel oil, built during 1956-1981. In recent years, renewable energy sources of small power are being developed. Their total capacity in 2015 represented 5 MW of electric power, while in 2016 – circa 6.9 МW. In the RM, within 1990-2016, the share of liquid fuels (petroleum products) from total fuel consumption within category 1A1a decreased from 32.6 per cent to circa 0.8 per cent. Within the current inventory cycle, GHG emission under the Sector 1 ‘Energy’ were estimated for the first time separately for the RBDR and LBDR.
Equation(Describe variables for method used)
Emissions GHG, fuel = Fuel Consumption fuel • Emission factor GHG, fuel (Equation 2.1)Where:
Emissions GHG, fuel – emission of the greenhouse gases by type of fuel (kg GHG);Fuel Consumption fuel – amount of fuel consumed (TJ);Emission factor GHG, fuel – default emission factor of a given greenhouse gases by type of fuel (kg gas/TJ). For CO2, it includes the carbon oxidation factor, assumed to be 1.
Methodology: Tier 1
Reference2006 IPCC Guidelines for National Greenhouse Gas Inventories, Volume 2: Energy, Chapter 2: Stationary Combustion, p. 2.11 (available on: https://www.ipcc-nggip.iges.or.jp/public/2006gl/pdf/2_Volume2/V2_2_Ch2_Stationary_Combustion.pdf).National Inventory Report: 1990-2016. Greenhouse Gas Sources and Sinks in the Republic of Moldova (2018).
Describe How and Why this Method Was Chosen The Tier 1 method has been chosen because the CS EFs are not available.
Type and source of activity data
Quantity of fuel (TJ) – activity data from Energy Balances of the Republic of Moldova and Quantity of fuel (t) – Statistical Yearbooks of the ATULBD, NCV for Residual Fuel Oil (40.2 TJ/kt). Quantity of fuel consumed is reported in the Table 3-54 from National Inventory Report: 1990-2016. Greenhouse Gas Sources and Sinks in the Republic of Moldova.
Type and source of EF and OF
IPCC Default EF from 2006 IPCC Guidelines for National Greenhouse Gas Inventories, Volume 2: Energy, Chapter 2: Stationary Combustion, page 2.16, Table 2.2.Fuel type CO2 Emission Factor UnitGas/Diesel Oil 74.100 t CO2 /TJResidual Fuel Oil 77.400 t CO2 /TJOther Petroleum Products 73.300 t CO2 /TJ
Uncertainty of AD and source ±5%, expert judgementUncertainty of EF and source ±5%, expert judgement
Potential Improvements Potential improvements within the 1A1 ‘Energy Industries’ category could be possible once new AD regarding the fuel consumption for electricity and heat generation on the territory of the LBDR are available (filling the gaps for certain years). Also, another potential improvement could be identifying additional AD sources or updating AD from official statistical publications.
Table 2.1.1.5: Information on source category 1A1a Main activity electricity and heat production, liquid fuels / CH4, N2OSector EnergyCategory 1A1 Energy IndustriesSource / Fuel / Gas 1A1a Main activity electricity and heat production, liquid fuels / CH4, N2OKey Category? No
Category Description / Defini-tion
Sum of emissions from main activity producers of electricity generation, combined heat and power generation, and heat plants. Main activity producers (formerly known as public utilities) are defined as those undertakings whose primary activity is to supply the public. They may be in public or private ownership. Emissions from own on-site use of fuel should be included. Emissions from autoproducers should be assigned to the sector where they were generated and not under 1A1a.

Chapter 2: Methods and Data Documentation
2 - 6
Country Detail
In the Republic of Moldova electricity generation capacity include: Moldavian Thermal Power Plant (MTPP) in Dnestrovsk (on the left bank of the Dniester River) with an installed capacity of 2,520 MW; CHP-2 Chisinau, with an installed capacity of 240 MW and 1,200 Gcal/h heat capacity; CHP-1 Chisinau, with an installed capacity of 66 MW and 254 Gcal/h heat capacity; CHP-North Balti, with an installed capacity of 24 MW and 200 Gcal/h heat capacity; other power plants, including CHP owned by sugar plants with an installed capacity of 97.5 MW operating on natural gas and residual fuel oil, built during 1956-1981. In recent years, renewable energy sources of small power are being developed. Their total capacity in 2015 represented 5 MW of electric power, while in 2016 – circa 6.9 МW. In the RM, within 1990-2016, the share of liquid fuels (petroleum products) from total fuel consumption within category 1A1a decreased from 32.6 per cent to circa 0.8 per cent. Within the current inventory cycle, GHG emission under the Sector 1 ‘Energy’ were estimated for the first time separately for the RBDR and LBDR.
Equation(Describe variables for method used)
Emissions GHG, fuel = Fuel Consumption fuel • Emission factor GHG, fuel (Equation 2.1)Where:
Emissions GHG, fuel – emission of the greenhouse gases by type of fuel (kg GHG);Fuel Consumption fuel – amount of fuel consumed (TJ);Emission factor GHG, fuel – default emission factor of a given greenhouse gases by type of fuel (kg gas/TJ).
Methodology: Tier 1
Reference2006 IPCC Guidelines for National Greenhouse Gas Inventories, Volume 2: Energy, Chapter 2: Stationary Combustion, p. 2.11 (available on: https://www.ipcc-nggip.iges.or.jp/public/2006gl/pdf/2_Volume2/V2_2_Ch2_Stationary_Combustion.pdf).National Inventory Report: 1990-2016. Greenhouse Gas Sources and Sinks in the Republic of Moldova (2018).
Describe How and Why this Method Was Chosen Due to the unavailability of country specific emission factors, the Tier 1 methodology has been used.
Type and source of activity data Quantity of fuel (TJ) – activity data from Energy Balances of the Republic of Moldova and Quantity of fuel (t) – Statistical Yearbooks of the ATULBD, NCV for Residual Fuel Oil (40.2 TJ/kt). Quantity of fuel consumed is reported in the Table 3-54 from National Inventory Report: 1990-2016. Greenhouse Gas Sources and Sinks in the Republic of Moldova.
Type and source of EF and OF
IPCC Default EF from 2006 IPCC Guidelines for National Greenhouse Gas Inventories, Volume 2: Energy, Chapter 2: Stationary Combustion, page 2.16, Table 2.2.
Fuel type CH4 Emission Factor N2O Emission factor
kg/TJGas/Diesel Oil 3.0 0.6 Residual Fuel Oil 3.0 0.6 Other Petroleum Products 3.0 0.6
Uncertainty of AD and source ± 5%, expert judgementUncertainty of EF and source ± 50%, expert judgement
Potential Improvements Potential improvements within the 1A1 ‘Energy Industries’ category could be possible once new AD regarding the fuel consumption for electricity and heat generation on the territory of the LBDR are available (filling the gaps for certain years). Also, another potential improvement could be identifying additional AD sources or updating AD from official statistical publications.
Table 2.1.1.6: Information on source category 1A1a Main activity electricity and heat production, liquid fuels / NOx, CO, NMVOC and SO2Sector EnergyCategory 1A1 Energy IndustriesSource / Fuel / Gas 1A1a Main activity electricity and heat production, liquid fuels / NOx, CO, NMVOC and SO2
Key Category? Not applicable for pollutant emissions.
Category Description / Defini-tion
Sum of emissions from main activity producers of electricity generation, combined heat and power generation, and heat plants. Main activity producers (formerly known as public utilities) are defined as those undertakings whose primary activity is to supply the public. They may be in public or private ownership. Emissions from own on-site use of fuel should be included. Emissions from autoproducers should be assigned to the sector where they were generated and not under 1A1a.
Country Detail
In the Republic of Moldova electricity generation capacity include: Moldavian Thermal Power Plant (MTPP) in Dnestrovsk (on the left bank of the Dniester River) with an installed capacity of 2,520 MW; CHP-2 Chisinau, with an installed capacity of 240 MW and 1,200 Gcal/h heat capacity; CHP-1 Chisinau, with an installed capacity of 66 MW and 254 Gcal/h heat capacity; CHP-North Balti, with an installed capacity of 24 MW and 200 Gcal/h heat capacity; other power plants, including CHP owned by sugar plants with an installed capacity of 97.5 MW operating on natural gas and residual fuel oil, built during 1956-1981. In recent years, renewable energy sources of small power are being developed. Their total capacity in 2015 represented 5 MW of electric power, while in 2016 – circa 6.9 МW. In the RM, within 1990-2016, the share of liquid fuels (petroleum products) from total fuel consumption within category 1A1a decreased from 32.6 per cent to circa 0.8 per cent. Within the current inventory cycle, GHG emission under the Sector 1 ‘Energy’ were estimated for the first time separately for the RBDR and LBDR.

Chapter 2: Methods and Data Documentation
2 - 7
Equation(Describe variables for method used)
E pollutant = AR fuel, consumption • EF pollutant (Equation 1)Where:
E pollutant – Annual emission of pollutant;AR fuel, consumption – Activity rate by fuel consumption;EF pollutant – Emission factor of pollutant.
Methodology: Tier 1
ReferenceEEA (2016), EMEP/EEA air pollutant emission inventory guidebook 2016.1.A.1 Energy industries, page 15 (available on: https://www.eea.europa.eu/publications/emep-eea-guidebook-2016/part-b-sectoral-guidance-chapters/1-energy/1-a-combustion/1-a-1-energy-industries/view).National Inventory Report: 1990-2016. Greenhouse Gas Sources and Sinks in the Republic of Moldova (2018).
Describe How and Why this Method Was Chosen Due to the unavailability of country specific emission factors, the Tier 1 methodology has been used.
Type and source of activity data Quantity of fuel (TJ) – activity data from Energy Balances of the Republic of Moldova and Quantity of fuel (t) – Statistical Yearbooks of the ATULBD, NCV for Residual Fuel Oil (40.2 TJ/kt). Quantity of fuel consumed is reported in the Table 3-54 from National Inventory Report: 1990-2016. Greenhouse Gas Sources and Sinks in the Republic of Moldova.
Type and source of EF and OF
EMEP/EEA air pollutant emission inventory guidebook 2016. 1.A.1 Energy industries, page 19-20, Table 3-5, 3-6.
Fuel typeNOx CO NMVOC SO2
kg/TJ
Heavy Fuel Oil 142 (70-300)
15.1 (9.06-21.1)
2.3(1.4-3.2)
495(146-1700)
Gas oil 65(22-195)
16.2(4-65)
0.8 (0.48-1.28)
46.5(4.65-465)
Uncertainty of AD and source ±5%, expert judgementUncertainty of EF and source See the 95% confidence interval in the table above (in the brackets, lower-upper).
Potential Improvements Potential improvements within the 1A1 ‘Energy Industries’ category could be possible once new AD regarding the fuel consumption for electricity and heat generation on the territory of the LBDR are available (filling the gaps for certain years). Also, another potential improvement could be identifying additional AD sources or updating AD from official statistical publications.
Table 2.1.1.7: Information on source category 1A1a Main activity electricity and heat production, gaseous fuels / CO2Sector EnergyCategory 1A1 Energy IndustriesSource / Fuel / Gas 1A1a Main activity electricity and heat production, gaseous fuels / CO2
Key Category? Tier 1: Yes: 1990 (L), 2016 (L, T); Tier 2: Yes: 1990 (L), 2016 (L, T) (1A1 Energy Industries – aggregated)
Category Description / Defini-tion
Sum of emissions from main activity producers of electricity generation, combined heat and power generation, and heat plants. Main activity producers (formerly known as public utilities) are defined as those undertakings whose primary activity is to supply the public. They may be in public or private ownership. Emissions from own on-site use of fuel should be included. Emissions from autoproducers should be assigned to the sector where they were generated and not under 1A1a.
Country Detail
In the RM electricity generation capacity include: Moldavian Thermal Power Plant (MTPP) in Dnestrovsk (on the left bank of the Dniester River) with an installed capacity of 2,520 MW; CHP-2 Chisinau, with an installed capacity of 240 MW and 1,200 Gcal/h heat capacity; CHP-1 Chisinau, with an installed capacity of 66 MW and 254 Gcal/h heat capacity; CHP-North Balti, with an installed capacity of 24 MW and 200 Gcal/h heat capacity; other power plants, including CHP owned by sugar plants with an installed capacity of 97.5 MW operating on natural gas and residual fuel oil, built during 1956-1981. In recent years, renewable energy sources of small power are being developed. Their total capacity in 2015 represented 5 MW of electric power, while in 2016 – circa 6.9 МW. In the RM, within 1990-2016, the share of gaseous fuels (natural gases) from total fuel consumption within category 1A1a increased from 44.4 per cent to 97.6 per cent. In 2016 was made the transition from an average NCV to an annual average NCV for natural gases, based on the information provided by ‘Moldovagaz.’ Within the current inventory cycle, GHG emission under the Sector 1 ‘Energy’ were estimated for the first time separately for the RBDR and LBDR.

Chapter 2: Methods and Data Documentation
2 - 8
Equation(Describe variables for method used)
Emissions GHG, fuel = Fuel Consumption fuel • Emission factor GHG, fuel (Equation 2.1)Where:
Emissions GHG, fuel – emission of the greenhouse gases by type of fuel (kg GHG);Fuel Consumption fuel – amount of fuel consumed (TJ);Emission factor GHG, fuel – default emission factor of a given greenhouse gases by type of fuel (kg gas/TJ). For CO2, it includes the carbon oxidation factor, assumed to be 1.
Methodology: Tier 1
Reference2006 IPCC Guidelines for National Greenhouse Gas Inventories, Volume 2: Energy, Chapter 2: Stationary Combustion, p. 2.11 (available on: https://www.ipcc-nggip.iges.or.jp/public/2006gl/pdf/2_Volume2/V2_2_Ch2_Stationary_Combustion.pdf).National Inventory Report: 1990-2016. Greenhouse Gas Sources and Sinks in the Republic of Moldova (2018).
Describe How and Why this Method Was Chosen The Tier 1 method has been chosen because the CS EFs are not available.
Type and source of activity data Quantity of fuel (TJ) – activity data from Energy Balances and Quantity of fuel (m3) – activity data from J.S.C. “Moldovagaz, NCV of natural gas – CS data pertaining to annual average NCV. Quantity of fuel consumed is reported in the Table 3-54 from National Inventory Report: 1990-2016. Greenhouse Gas Sources and Sinks in the Republic of Moldova.
Type and source of EF and OF
IPCC Default EF from 2006 IPCC Guidelines for National Greenhouse Gas Inventories, Volume 2: Energy, Chapter 2: Stationary Combustion, page 2.17, Table 2.2.
Type of fuel CO2 Emission Factor UnitNatural Gas 56.100 t CO2 /TJGas Biomass 54.600 t CO2 /TJ
Uncertainty of AD and source ± 5%, expert judgementUncertainty of EF and source ± 5%, expert judgement
Potential Improvements Potential improvements within the 1A1 ‘Energy Industries’ category could be possible once new AD regarding the fuel consumption for electricity and heat generation on the territory of the LBDR are available (filling the gaps for certain years). Also, another potential improvement could be identifying additional AD sources or updating AD from official statistical publications.
Table 2.1.1.8: Information on source category 1A1a Main activity electricity and heat production, gaseous fuels / CH4, N2OSector EnergyCategory 1A1 Energy IndustriesSource / Fuel / Gas 1A1a Main activity electricity and heat production, gaseous fuels / CH4, N2OKey Category? No
Category Description / Defini-tion
Sum of emissions from main activity producers of electricity generation, combined heat and power generation, and heat plants. Main activity producers (formerly known as public utilities) are defined as those undertakings whose primary activity is to supply the public. They may be in public or private ownership. Emissions from own on-site use of fuel should be included. Emissions from autoproducers should be assigned to the sector where they were generated and not under 1A1a.
Country Detail
In the RM electricity generation capacity include: Moldavian Thermal Power Plant (MTPP) in Dnestrovsk (on the left bank of the Dniester River) with an installed capacity of 2,520 MW; CHP-2 Chisinau, with an installed capacity of 240 MW and 1,200 Gcal/h heat capacity; CHP-1 Chisinau, with an installed capacity of 66 MW and 254 Gcal/h heat capacity; CHP-North Balti, with an installed capacity of 24 MW and 200 Gcal/h heat capacity; other power plants, including CHP owned by sugar plants with an installed capacity of 97.5 MW operating on natural gas and residual fuel oil, built during 1956-1981. In recent years, renewable energy sources of small power are being developed. Their total capacity in 2015 represented 5 MW of electric power, while in 2016 – circa 6.9 МW. In the RM, within 1990-2016, the share of gaseous fuels (natural gases) from total fuel consumption within category 1A1a increased from 44.4 per cent to 97.6 per cent. In 2016 was made the transition from an average NCV to an annual average NCV for natural gases, based on the information provided by ‘Moldovagaz’. Within the current inventory cycle, GHG emission under the Sector 1 ‘Energy’ were estimated for the first time separately for the RBDR and LBDR.
Equation(Describe variables for method used)
Emissions GHG, fuel = Fuel Consumption fuel • Emission factor GHG, fuel (Equation 2.1)Where:
Emissions GHG, fuel – emission of the greenhouse gases by type of fuel (kg GHG);Fuel Consumption fuel – amount of fuel consumed (TJ);Emission factor GHG, fuel – default emission factor of a given greenhouse gases by type of fuel (kg gas/TJ).
Methodology: Tier 1

Chapter 2: Methods and Data Documentation
2 - 9
Reference2006 IPCC Guidelines for National Greenhouse Gas Inventories, Volume 2: Energy, Chapter 2: Stationary Combustion, p. 2.11 (available on: https://www.ipcc-nggip.iges.or.jp/public/2006gl/pdf/2_Volume2/V2_2_Ch2_Stationary_Combustion.pdf). National Inventory Report: 1990-2016. Greenhouse Gas Sources and Sinks in the Republic of Moldova (2018).
Describe How and Why this Method Was Chosen Due to the unavailability of country specific emission factors, the Tier 1 methodology has been used.
Type and source of activity data Quantity of fuel (TJ) – activity data from Energy Balances and Quantity of fuel (m3) – activity data from J.S.C. “Moldovagaz, NCV of natural gas – CS data pertaining to annual average NCV. Quantity of fuel consumed is reported in the Table 3-54 from National Inventory Report: 1990-2016. Greenhouse Gas Sources and Sinks in the Republic of Moldova.
Type and source of EF and OF
IPCC Default EF from 2006 IPCC Guidelines for National Greenhouse Gas Inventories, Volume 2: Energy, Chapter 2: Stationary Combustion, page 2.17, Table 2.2
Fuel typeCH4 Emission Factor N2O Emission Factor
kg/TJNatural Gas 1.0 0.1 Gas Biomass 1.0 0.1
Uncertainty of AD and source ± 5%, expert judgementUncertainty of EF and source ± 50%, expert judgement
Potential Improvements Potential improvements within the 1A1 ‘Energy Industries’ category could be possible once new AD regarding the fuel consumption for electricity and heat generation on the territory of the LBDR are available (filling the gaps for certain years). Also, another potential improvement could be identifying additional AD sources or updating AD from official statistical publications.
Table 2.1.1.9: Information on source category 1A1a Main activity electricity and heat production, gaseous fuels / NOx, CO, NMVOC and SO2Sector EnergyCategory 1A1 Energy IndustriesSource / Fuel / Gas 1A1a Main activity electricity and heat production, gaseous fuels / NOx, CO, NMVOC and SO2
Key Category? Not applicable for pollutant emissions.
Category Description / Defini-tion
Sum of emissions from main activity producers of electricity generation, combined heat and power generation, and heat plants. Main activity producers (formerly known as public utilities) are defined as those undertakings whose primary activity is to supply the public. They may be in public or private ownership. Emissions from own on-site use of fuel should be included. Emissions from autoproducers should be assigned to the sector where they were generated and not under 1A1a.
Country Detail
In the RM electricity generation capacity include: Moldavian Thermal Power Plant (MTPP) in Dnestrovsk (on the left bank of the Dniester River) with an installed capacity of 2,520 MW; CHP-2 Chisinau, with an installed capacity of 240 MW and 1,200 Gcal/h heat capacity; CHP-1 Chisinau, with an installed capacity of 66 MW and 254 Gcal/h heat capacity; CHP-North Balti, with an installed capacity of 24 MW and 200 Gcal/h heat capacity; other power plants, including CHP owned by sugar plants with an installed capacity of 97.5 MW operating on natural gas and residual fuel oil, built during 1956-1981. In recent years, renewable energy sources of small power are being developed. Their total capacity in 2015 represented 5 MW of electric power, while in 2016 – circa 6.9 МW. In the RM, within 1990-2016, the share of gaseous fuels (natural gases) from total fuel consumption within category 1A1a increased from 44.4 per cent to 97.6 per cent. In 2016 was made the transition from an average NCV to an annual average NCV for natural gases, based on the information provided by ‘Moldovagaz’. Within the current inventory cycle, GHG emission under the Sector 1 ‘Energy’ were estimated for the first time separately for the RBDR and LBDR.
Equation(Describe variables for method used)
E pollutant = AR fuel, consumption • EF pollutant (Equation 1)Where:
E pollutant – Annual emission of pollutant;AR fuel, consumption – Activity rate by fuel consumption;EF pollutant – Emission factor of pollutant.
Methodology: Tier 1
ReferenceEEA (2016), EMEP/EEA air pollutant emission inventory guidebook 2016.1.A.1 Energy industries, page 15 (available on: https://www.eea.europa.eu/publications/emep-eea-guidebook-2016/part-b-sectoral-guidance-chapters/1-energy/1-a-combustion/1-a-1-energy-industries/view). National Inventory Report: 1990-2016. Greenhouse Gas Sources and Sinks in the Republic of Moldova (2018).
Describe How and Why this Method Was Chosen Due to the unavailability of country specific emission factors, the Tier 1 methodology has been used.

Chapter 2: Methods and Data Documentation
2 - 10
Type and source of activity data Quantity of fuel (TJ) – activity data from Energy Balances and Quantity of fuel (m3) – activity data from J.S.C. “Moldovagaz, NCV of natural gas – CS data pertaining to annual average NCV. Quantity of fuel consumed is reported in the Table 3-54 from National Inventory Report: 1990-2016. Greenhouse Gas Sources and Sinks in the Republic of Moldova.
Type and source of EF and OF
EMEP/EEA air pollutant emission inventory guidebook 2016.1.A.1 Energy industries, page 18, Table 3-4.
Fuel typeNOx CO NMVOC SO2
kg/TJGaseous fuels 89 (15—185) 39 (20-60) 2.6 (0.65-10.4) 0.281 (0.169-0.393)
Uncertainty of AD and source ±5%, expert judgementUncertainty of EF and source See the 95% confidence interval in the table above (in the brackets, lower-upper).
Potential Improvements Potential improvements within the 1A1 ‘Energy Industries’ category could be possible once new AD regarding the fuel consumption for electricity and heat generation on the territory of the LBDR are available (filling the gaps for certain years). Also, another potential improvement could be identifying additional AD sources or updating AD from official statistical publications.
Table 2.1.1.10: Information on source category 1A1a Main activity electricity and heat production, biomass / CO2Sector EnergyCategory 1A1 Energy IndustriesSource / Fuel / Gas 1A1a Main activity electricity and heat production, biomass / CO2
Key Category? No
Category Description / Defini-tion
CO2 emissions from biomass under source category 1A1a ‘Main activity electricity and heat production’ has to be reported under the Memo Items (CO2 emissions from biomass). Sum of emissions from main activity producers of electricity generation, combined heat and power generation, and heat plants. Main activity producers (formerly known as public utilities) are defined as those undertakings whose primary activity is to supply the public. They may be in public or private ownership. Emissions from own on-site use of fuel should be included. Emissions from autoproducers should be assigned to the sector where they were generated and not under 1A1a.
Country Detail
In the Republic of Moldova electricity generation capacity include: Moldavian Thermal Power Plant (MTPP) in Dnestrovsk (on the left bank of the Dniester River) with an installed capacity of 2,520 MW; CHP-2 Chisinau, with an installed capacity of 240 MW and 1,200 Gcal/h heat capacity; CHP-1 Chisinau, with an installed capacity of 66 MW and 254 Gcal/h heat capacity; CHP-North Balti, with an installed capacity of 24 MW and 200 Gcal/h heat capacity; other power plants, including CHP owned by sugar plants with an installed capacity of 97.5 MW operating on natural gas and residual fuel oil, built during 1956-1981. In recent years, renewable energy sources of small power are being developed. Their total capacity in 2015 represented 5 MW of electric power, while in 2016 – circa 6.9 МW. In the RM, within 1990-2016, share of biofuels from total fuel consumption within category 1A1a increased from 0.02 per cent to 1.09 per cent of the total (biofuels consumption recorded a significant growth, in particular between 2000 and 2016, from circa 59 TJ to 753 TJ). Within the current inventory cycle, GHG emission under the Sector 1 ‘Energy’ were estimated for the first time separately for the RBDR and LBDR.
Equation(Describe variables for method used)
Emissions GHG, fuel = Fuel Consumption fuel • Emission factor GHG, fuel (Equation 2.1)Where:
Emissions GHG, fuel – emission of the greenhouse gases by type of fuel (kg GHG);Fuel Consumption fuel – amount of fuel consumed (TJ);Emission factor GHG, fuel – default emission factor of a given greenhouse gases by type of fuel (kg gas/TJ). For CO2, it includes the carbon oxidation factor, assumed to be 1.
Methodology: Tier 1
Reference2006 IPCC Guidelines for National Greenhouse Gas Inventories, Volume 2: Energy, Chapter 2: Stationary Combustion, p. 2.11 (available on: https://www.ipcc-nggip.iges.or.jp/public/2006gl/pdf/2_Volume2/V2_2_Ch2_Stationary_Combustion.pdf).National Inventory Report: 1990-2016. Greenhouse Gas Sources and Sinks in the Republic of Moldova (2018).
Describe How and Why this Method Was Chosen The Tier 1 method has been chosen because the CS EFs are not available.
Type and source of activity data Quantity of fuel (TJ) – activity data from Energy Balances of the Republic of Moldova. Quantity of fuel consumed is reported in the Table 3-54 from National Inventory Report: 1990-2016. Greenhouse Gas Sources and Sinks in the Republic of Moldova.
Type and source of EF and OF
IPCC Default EF from 2006 IPCC Guidelines for National Greenhouse Gas Inventories, Volume 2: Energy, Chapter 2: Stationary Combustion, page 2.17, Table 2.2Fuel type CO2 Emission Factor UnitWood / Wood Waste 112 000 kg CO2 /TJOther Primary Solid Biomass 100 000 kg CO2 /TJ

Chapter 2: Methods and Data Documentation
2 - 11
Uncertainty of AD and source ± 5%, expert judgementUncertainty of EF and source ± 5%, expert judgement
Potential Improvements Potential improvements within the 1A1 ‘Energy Industries’ category could be possible once new AD regarding the fuel consumption for electricity and heat generation on the territory of the LBDR are available (filling the gaps for certain years). Also, another potential improvement could be identifying additional AD sources or updating AD from official statistical publications.
Table 2.1.1.11: Information on source category 1A1a Main activity electricity and heat production, biomass / CH4, N2OSector EnergyCategory 1A1 Energy IndustriesSource / Fuel / Gas 1A1a Main activity electricity and heat production, biomass / CH4, N2OKey Category? No
Category Description / Defini-tion
Sum of emissions from main activity producers of electricity generation, combined heat and power generation, and heat plants. Main activity producers (formerly known as public utilities) are defined as those undertakings whose primary activity is to supply the public. They may be in public or private ownership. Emissions from own on-site use of fuel should be included. Emissions from autoproducers should be assigned to the sector where they were generated and not under 1A1a.
Country Detail
In the Republic of Moldova electricity generation capacity include: Moldavian Thermal Power Plant (MTPP) in Dnestrovsk (on the left bank of the Dniester River) with an installed capacity of 2,520 MW; CHP-2 Chisinau, with an installed capacity of 240 MW and 1,200 Gcal/h heat capacity; CHP-1 Chisinau, with an installed capacity of 66 MW and 254 Gcal/h heat capacity; CHP-North Balti, with an installed capacity of 24 MW and 200 Gcal/h heat capacity; other power plants, including CHP owned by sugar plants with an installed capacity of 97.5 MW operating on natural gas and residual fuel oil, built during 1956-1981. In recent years, renewable energy sources of small power are being developed. Their total capacity in 2015 represented 5 MW of electric power, while in 2016 – circa 6.9 МW. In the RM, within 1990-2016, share of biofuels from total fuel consumption within category 1A1a increased from 0.02 per cent to 1.09 per cent of the total (biofuels consumption recorded a significant growth, in particular between 2000 and 2016, from circa 59 TJ to 753 TJ). Within the current inventory cycle, GHG emission under the Sector 1 ‘Energy’ were estimated for the first time separately for the RBDR and LBDR.
Equation(Describe variables for method used)
Emissions GHG, fuel = Fuel Consumption fuel • Emission factor GHG, fuel (Equation 2.1)Where:
Emissions GHG, fuel – emission of the greenhouse gases by type of fuel (kg GHG);Fuel Consumption fuel – amount of fuel consumed (TJ);Emission factor GHG, fuel – default emission factor of a given greenhouse gases by type of fuel (kg gas/TJ).
Methodology: Tier 1
Reference2006 IPCC Guidelines for National Greenhouse Gas Inventories, Volume 2: Energy, Chapter 2: Stationary Combustion, p. 2.11 (available on: https://www.ipcc-nggip.iges.or.jp/public/2006gl/pdf/2_Volume2/V2_2_Ch2_Stationary_Combustion.pdf).National Inventory Report: 1990-2016. Greenhouse Gas Sources and Sinks in the Republic of Moldova (2018).
Describe How and Why this Method Was Chosen Due to the unavailability of country specific emission factors, the Tier 1 methodology has been used.
Type and source of activity data Quantity of fuel (TJ) – activity data from Energy Balances of the Republic of Moldova. Quantity of fuel consumed is reported in the Table 3-54 from National Inventory Report: 1990-2016. Greenhouse Gas Sources and Sinks in the Republic of Moldova.
Type and source of EF and OF
IPCC Default EF from 2006 IPCC Guidelines for National Greenhouse Gas Inventories, Volume 2: Energy, Chapter 2: Stationary Combustion, page 2.17, Table 2.2.
Fuel typeCH4 Emission Factor N2O Emission Factor
kg/TJWood / Wood Waste, Other Primary Solid Biomass 30 4
Uncertainty of AD and source ± 5%, expert judgementUncertainty of EF and source ±50%, expert judgement
Potential Improvements Potential improvements within the 1A1 ‘Energy Industries’ category could be possible once new AD regarding the fuel consumption for electricity and heat generation on the territory of the LBDR are available (filling the gaps for certain years). Also, another potential improvement could be identifying additional AD sources or updating AD from official statistical publications.

Chapter 2: Methods and Data Documentation
2 - 12
Table 2.1.1.12: Information on source category 1A1a Main activity electricity and heat production, biomass / NOx, CO, NMVOC and SO2Sector EnergyCategory 1A1 Energy IndustriesSource / Fuel / Gas 1A1a Main activity electricity and heat production, biomass / NOx, CO, NMVOC and SO2
Key Category? Not applicable for pollutant emissions.
Category Description / Defini-tion
Sum of emissions from main activity producers of electricity generation, combined heat and power generation, and heat plants. Main activity producers (formerly known as public utilities) are defined as those undertakings whose primary activity is to supply the public. They may be in public or private ownership. Emissions from own on-site use of fuel should be included. Emissions from autoproducers should be assigned to the sector where they were generated and not under 1A1a.
Country Detail
In the Republic of Moldova electricity generation capacity include: Moldavian Thermal Power Plant (MTPP) in Dnestrovsk (on the left bank of the Dniester River) with an installed capacity of 2,520 MW; CHP-2 Chisinau, with an installed capacity of 240 MW and 1,200 Gcal/h heat capacity; CHP-1 Chisinau, with an installed capacity of 66 MW and 254 Gcal/h heat capacity; CHP-North Balti, with an installed capacity of 24 MW and 200 Gcal/h heat capacity; other power plants, including CHP owned by sugar plants with an installed capacity of 97.5 MW operating on natural gas and residual fuel oil, built during 1956-1981. In recent years, renewable energy sources of small power are being developed. Their total capacity in 2015 represented 5 MW of electric power, while in 2016 – circa 6.9 МW. In the RM, within 1990-2016, share of biofuels from total fuel consumption within category 1A1a increased from 0.02 per cent to 1.09 per cent of the total (biofuels consumption recorded a significant growth, in particular between 2000 and 2016, from circa 59 TJ to 753 TJ). Within the current inventory cycle, GHG emission under the Sector 1 ‘Energy’ were estimated for the first time separately for the RBDR and LBDR.
Equation(Describe variables for method used)
E pollutant = AR fuel, consumption • EF pollutant (Equation 1)Where:
E pollutant – Annual emission of pollutant;AR fuel, consumption – Activity rate by fuel consumption;EF pollutant – Emission factor of pollutant.
Methodology: Tier 1
ReferenceEEA (2016), EMEP/EEA air pollutant emission inventory guidebook 2016.1.A.1 Energy industries, page 15 (available on: https://www.eea.europa.eu/publications/emep-eea-guidebook-2016/part-b-sectoral-guidance-chapters/1-energy/1-a-combustion/1-a-1-energy-industries/view).National Inventory Report: 1990-2016. Greenhouse Gas Sources and Sinks in the Republic of Moldova (2018).
Describe How and Why this Method Was Chosen Due to the unavailability of country specific emission factors, the Tier 1 methodology has been used.
Type and source of activity data Quantity of fuel (TJ) – activity data from Energy Balances of the Republic of Moldova. Quantity of fuel consumed is reported in the Table 3-54 from National Inventory Report: 1990-2016. Greenhouse Gas Sources and Sinks in the Republic of Moldova.
Type and source of EF and OF
EMEP/EEA air pollutant emission inventory guidebook 2016.1.A.1 Energy industries, page 20, Table 3-7.
Fuel typeNOx CO NMVOC SO2
kg/TJ
Biomass 81 (40 -160)
90(45 -180)
7.3(2.44-21.9)
10.8(6.45-15.1)
Uncertainty of AD and source ± 5%, expert judgementUncertainty of EF and source See the 95% confidence interval in the table above (in the brackets, lower-upper).
Potential Improvements Potential improvements within the 1A1 ‘Energy Industries’ category could be possible once new AD regarding the fuel consumption for electricity and heat generation on the territory of the LBDR are available (filling the gaps for certain years). Also, another potential improvement could be identifying additional AD sources or updating AD from official statistical publications.
Table 2.1.1.13: Information on source category 1A1b Petroleum refining / Liquid / CO2Sector EnergyCategory 1A1 Energy IndustriesSource / Fuel / Gas 1A1b Petroleum refining / CO2
Key Category? No

Chapter 2: Methods and Data Documentation
2 - 13
Category Description / Defini-tion All combustion activities supporting the refining of petroleum products including on-site combustion for the generation of electricity and heat for own use.
Country Detail
GHG emissions from source category 1A1b ‘Petroleum Refining’ were estimated within the Sector 1 ‘Energy’ for the first time in the current inventory cycle. The AD for 2003-2016 time series are available in the EBs of the RM in energy units (TJ) for 5 types of fuel: petroleum, gasoline, diesel, residual fuel oil, other petroleum products and other hydrocarbons In the Republic of Moldova there are two operational companies in this sector: the first (“Valiexchimp” LTD) is involved in oil extraction on the oil fields near Valeni village, Cahul district, and the second one (Arnaut Petrol J.S.C.) owns an oil refinery with a small capacity in the city of Comrat (ATU Gagauzia). The needed information is available within Chapter “Transformation”, categories “Petroleum installations” and “Petrol Refineries” from Energy Balances of the RM. National Inventory Report: 1990-2016. Greenhouse Gas Sources and Sinks in the Republic of Moldova, Table 3-66.
Equation(Describe variables for method used)
Emissions GHG, fuel = Fuel Consumption fuel • Emission factor GHG, fuel (Equation 2.1)Where:
Emissions GHG, fuel – emission of the greenhouse gases by type of fuel (kg GHG);Fuel Consumption fuel – amount of fuel consumed (TJ);Emission factor GHG, fuel – default emission factor of a given greenhouse gases by type of fuel (kg gas/TJ).
Methodology: Tier 1
Reference 2006 IPCC Guidelines for National Greenhouse Gas Inventories, Volume 2: Energy, Chapter 2: Stationary Combustion, p. 2.11 (available on: https://www.ipcc-nggip.iges.or.jp/public/2006gl/pdf/2_Volume2/V2_2_Ch2_Stationary_Combustion.pdf).
Describe How and Why this Method Was Chosen Due to the unavailability of country specific emission factors, the Tier 1 methodology has been used
Type and source of activity data The needed information is available within Chapter “Transformation”, categories “Petroleum installations” and “Petrol Refineries” from Energy Balances of the RM.National Inventory Report: 1990-2016. Greenhouse Gas Sources and Sinks in the Republic of Moldova, Tables 3-66 and 3-67.
Type and source of EF and OF
2006 IPCC Guidelines, Table 2.2. IPCC default emission factors for stationary combustion in the energy industriesFuel type CO2 Emission Factor UnitPetroleum 73 300 kg CO2 /TJDiesel oil 74 100 kg CO2 /TJResidual fuel oil 77 400 kg CO2 /TJOther petroleum products 73 300 kg CO2 /TJOther hydrocarbons 73 300 kg CO2 /TJLubricants 73 300 kg CO2 /TJGasoline 69 300 kg CO2 /TJFuel for oven 74 100 kg CO2 /TJEngine fuels 74 100 kg CO2 /TJ
Uncertainty of AD and source ± 5%, expert judgementUncertainty of EF and source ± 5%, expert judgementPotential Improvements Category 1A1b calculated for the first time. Improvements are possible when using additional data sources.
Table 2.1.1.14: Information on source category 1A1b Petroleum refining / Liquid / CH4, N2OSector EnergyCategory 1A1 Energy IndustriesSource / Fuel / Gas 1A1b Petroleum refining / CH4, N2OKey Category? NoCategory Description / Defini-tion All combustion activities supporting the refining of petroleum products including on-site combustion for the generation of electricity and heat for own use.

Chapter 2: Methods and Data Documentation
2 - 14
Country Detail
GHG emissions from source category 1A1b ‘Petroleum Refining’ were estimated within the Sector 1 ‘Energy’ for the first time in the current inventory cycle. The AD for 2003-2016 time series are available in the EBs of the RM in energy units (TJ) for 5 types of fuel: petroleum, gasoline, diesel, residual fuel oil, other petroleum products and other hydrocarbons In the Republic of Moldova there are two operational companies in this sector: the first (“Valiexchimp” LTD) is involved in oil extraction on the oil fields near Valeni village, Cahul district, and the second one (Arnaut Petrol J.S.C.) owns an oil refinery with a small capacity in the city of Comrat (ATU Gagauzia). The needed information is available within Chapter “Transformation”, categories “Petroleum installations” and “Petrol Refineries” from Energy Balances of the RM. National Inventory Report: 1990-2016. Greenhouse Gas Sources and Sinks in the Republic of Moldova, Table 3-66.
Equation(Describe variables for method used)
Emissions GHG, fuel = Fuel Consumption fuel • Emission factor GHG, fuel (Equation 2.1)Where:
Emissions GHG, fuel – emission of the greenhouse gases by type of fuel (kg GHG);Fuel Consumption fuel – amount of fuel consumed (TJ);Emission factor GHG, fuel – default emission factor of a given greenhouse gases by type of fuel (kg gas/TJ).
Methodology: Tier 1
Reference 2006 IPCC Guidelines for National Greenhouse Gas Inventories, Volume 2: Energy, Chapter 2: Stationary Combustion, p. 2.11 (available on: https://www.ipcc-nggip.iges.or.jp/public/2006gl/pdf/2_Volume2/V2_2_Ch2_Stationary_Combustion.pdf).
Describe How and Why this Method Was Chosen Due to the unavailability of country specific emission factors, the Tier 1 methodology has been used.
Type and source of activity data The needed information is available within Chapter “Transformation”, categories “Petroleum installations” and “Petrol Refineries” from Energy Balances of the RM.National Inventory Report: 1990-2016. Greenhouse Gas Sources and Sinks in the Republic of Moldova, Table 3-66 and 3-67.
Type and source of EF and OF
2006 IPCC Guidelines, Table 2.2. IPCC default emission factors for stationary combustion in the energy industries.
Fuels CH4 Emission Factor N2O Emission Factorkg/TJ
Petroleum, Residual Fuel Oil, Other Petroleum Products 3 0.6Diesel Oil, Gasoline, Engine Fuels, Fuel for Oven 3 0.6Lubricants, Other Hydrocarbons 3 0.6
Uncertainty of AD and source ± 5%, expert judgementUncertainty of EF and source ± 50%, expert judgement (see also 2006 IPCC Guidelines, Stationary Combustion, Table 2.14, p. 2.40).Potential Improvements Category 1A1b calculated for the first time. Improvements are possible when using additional data sources.
Table 2.1.1.15: Information on source category 1A1b Petroleum refining / Liquid / NOx, CO, NMVOC and SO2Sector EnergyCategory 1A1 Energy IndustriesSource / Fuel / Gas 1A1b Petroleum refining / NOx, CO, NMVOC and SO2
Key Category? Not applicable for pollutant emissionsCategory Description / Defini-tion All combustion activities supporting the refining of petroleum products including on-site combustion for the generation of electricity and heat for own use.
Country Detail
GHG emissions from source category 1A1b ‘Petroleum Refining’ were estimated within the Sector 1 ‘Energy’ for the first time in the current inventory cycle. The AD for 2003-2016 time series are available in the EBs of the RM in energy units (TJ) for 5 types of fuel: petroleum, gasoline, diesel, residual fuel oil, other petroleum products and other hydrocarbons In the Republic of Moldova there are two operational companies in this sector: the first (“Valiexchimp” LTD) is involved in oil extraction on the oil fields near Valeni village, Cahul district, and the second one (Arnaut Petrol J.S.C.) owns an oil refinery with a small capacity in the city of Comrat (ATU Gagauzia). The needed information is available within Chapter “Transformation”, categories “Petroleum installations” and “Petrol Refineries” from Energy Balances of the RM. National Inventory Report: 1990-2016. Greenhouse Gas Sources and Sinks in the Republic of Moldova, Table 3-66.
Equation(Describe variables for method used)
E pollutant = AR fuel, consumption • EF pollutant (Equation 1)Where:
E pollutant – Annual emission of pollutant;AR fuel, consumption – Activity rate by fuel consumption;EF pollutant – Emission factor of pollutant.
Methodology: Tier 1

Chapter 2: Methods and Data Documentation
2 - 15
ReferenceEEA (2016), EMEP/EEA air pollutant emission inventory guidebook 2016.1.A.1 Energy industries, page 15 (available on: https://www.eea.europa.eu/publications/emep-eea-guidebook-2016/part-b-sectoral-guidance-chapters/1-energy/1-a-combustion/1-a-1-energy-industries/view).National Inventory Report: 1990-2016. Greenhouse Gas Sources and Sinks in the Republic of Moldova (2018).
Describe How and Why this Method Was Chosen Due to the unavailability of country specific emission factors, the Tier 1 methodology has been used.
Type and source of activity data The needed information is available within Chapter “Transformation”, categories “Petroleum installations” and “Petrol Refineries” from Energy Balances of the RM.National Inventory Report: 1990-2016. Greenhouse Gas Sources and Sinks in the Republic of Moldova, Tables 3-66 and 3-67.
Type and source of EF and OF
The values of direct GHG emissions were taken from EMEP/EEA air pollutant emission inventory guidebook 2016.1.A.1 Energy industries, Table 3-5. Heavy fuel oil, page 19, and Table 3-6 Gas oil, p. 20. Table 3-5 Tier 1 emission factors for source category 1.A.1.a using heavy fuel oil – for petroleum and residual fuel oil. Table 3-6 Tier 1 EFs for source category 1.A.1.a using gas oil – for other fuels (there are no special tables of EFs for gasoline and other liquid fuels, therefore the coefficients for diesel fuel are used for them).
FuelsNOx CO NMVOC SO2
g / GJPetroleum, Residual Fuel Oil 142 (70-300) 15.1 (9.06-21.1) 2.3(1.4-3.2) 495 (146-1700)Diesel Oil, Gasoline, Engine Fuels, Fuel for Oven
65 (22-195) 16.2 (4-65) 0.8 (0.48-1.28) 46.5 (4.65-465)
Lubricants, Other Hydrocarbons, Other Petroleum Products
65 (22-195) 16.2 (4-65) 0.8 (0.48-1.28) 46.5 (4.65-465)
Uncertainty of AD and source ± 5% expert judgementUncertainty of EF and source See the 95% confidence interval in the table above (in the brackets, lower-upper).Potential Improvements Category 1A1b calculated for the first time. Improvements are possible when using additional data sources.
Table 2.1.1.16: Information on source category 1A1c Manufacturing of solid fuels and other energy industries / Biomass / CO2Sector EnergyCategory 1A1 Energy IndustriesSource / Fuel / Gas 1A1c Manufacturing of solid fuels and other energy industries / CO2
Key Category? No
Category Description / Defini-tion
CO2 emissions from biomass under source category 1A1c ‘Manufacturing of solid fuels and other energy industries’ has to be reported under the Memo Items (CO2 emissions from biomass). Combustion emis-sions from fuel use during the manufacture of secondary and tertiary products from solid fuels including production of charcoal. Emissions from own on-site fuel use should be included. Also includes combustion for the generation of electricity and heat for own use in these industries.
Country Detail The source category 1A1c ‘Manufacture of Solid Fuels and Other Energy Industries’ includes two sources (1A1ci ‘Manufacture of Solid Fuels’ and 1A1cii ‘Other Energy Industries’)
Equation(Describe variables for method used)
Emissions GHG, fuel = Fuel Consumption fuel • Emission factor GHG, fuel (Equation 2.1)Where:
Emissions GHG, fuel – emission of the greenhouse gases by type of fuel (kg GHG);Fuel Consumption fuel – amount of fuel consumed (TJ);Emission factor GHG, fuel – default emission factor of a given greenhouse gases by type of fuel (kg gas/TJ).
Methodology: Tier 1
Reference 2006 IPCC Guidelines for National Greenhouse Gas Inventories, Volume 2: Energy, Chapter 2: Stationary Combustion, p. 2.11 (available on: https://www.ipcc-nggip.iges.or.jp/public/2006gl/pdf/2_Volume2/V2_2_Ch2_Stationary_Combustion.pdf).
Describe How and Why this Method Was Chosen Due to the unavailability of country specific emission factors, the Tier 1 methodology has been used
Type and source of activity data The Energy Balances for 2012-2016 time series represent the primary sources of reference for the AD used (production of charcoal, in energy units).National Inventory Report: 1990-2016. Greenhouse Gas Sources and Sinks in the Republic of Moldova, Tables 3-71, 3-72 and 3-73.

Chapter 2: Methods and Data Documentation
2 - 16
Type and source of EF and OF2006 IPCC Guidelines, Table 2.2, default emission factors for stationary combustion in the energy industriesFuel type CO2 Emission Factor UnitCharcoal 112 000 kg CO2 /TJ
Uncertainty of AD and source ± 5%, expert judgementUncertainty of EF and source ± 5%, expert judgementPotential Improvements Category 1A1c was calculated for the first time. Improvements are possible when using additional data sources.
Table 2.1.1.17: Information on source category 1A1c Manufacturing of solid fuels and other energy industries / Biomass / CH4, N2OSector EnergyCategory 1A1 Energy IndustriesSource / Fuel / Gas 1A1c Manufacturing of solid fuels and other energy industries / CH4, N2OKey Category? NoCategory Description / Defini-tion
Combustion emissions from fuel use during the manufacture of secondary and tertiary products from solid fuels including production of charcoal. Emissions from own on-site fuel use should be included. Also includes combustion for the generation of electricity and heat for own use in these industries.
Country Detail The source category 1A1c ‘Manufacture of Solid Fuels and Other Energy Industries’ includes two sources (1A1ci ‘Manufacture of Solid Fuels’ and 1A1cii ‘Other Energy Industries’).
Equation(Describe variables for method used)
Emissions GHG, fuel = Fuel Consumption fuel • Emission factor GHG, fuel (Equation 2.1)Where:
Emissions GHG, fuel – emission of the greenhouse gases by type of fuel (kg GHG);Fuel Consumption fuel – amount of fuel consumed (TJ);Emission factor GHG, fuel – default emission factor of a given greenhouse gases by type of fuel (kg gas/TJ).
Methodology: Tier 1
Reference 2006 IPCC Guidelines for National Greenhouse Gas Inventories, Volume 2: Energy, Chapter 2: Stationary Combustion, p. 2.11 (available on: https://www.ipcc-nggip.iges.or.jp/public/2006gl/pdf/2_Volume2/V2_2_Ch2_Stationary_Combustion.pdf).
Describe How and Why this Method Was Chosen Due to the unavailability of country specific emission factors, the Tier 1 methodology has been used
Type and source of activity data The Energy Balances for 2012-2016 time series represent the primary sources of reference for the AD used (production of charcoal, in energy units).National Inventory Report: 1990-2016. Greenhouse Gas Sources and Sinks in the Republic of Moldova, Tables 3-71, 3-72 and 3-73.
Type and source of EF and OF
2006 IPCC Guidelines, Table 2.2, default emission factors for stationary combustion in the energy industries.
FuelCH4 N2O
kg/TJCharcoal 30 4
Uncertainty of AD and source ± 5%, expert judgementUncertainty of EF and source ± 50%, expert judgement (see also 2006 IPCC Guidelines, Stationary Combustion, Table 2.14, p. 2.40).Potential Improvements Category 1A1c calculated for the first time. Improvements are possible when using additional data sources.
Table 2.1.1.18: Information on source category 1A1c Manufacturing of solid fuels and other energy industries / Biomass / NOx, CO, NMVOC and SO2Sector EnergyCategory 1A1 Energy IndustriesSource / Fuel / Gas 1A1c Manufacturing of solid fuels and other energy industries / NOx, CO, NMVOC and SO2
Key Category? Not applicable for pollutant emissions

Chapter 2: Methods and Data Documentation
2 - 17
Category Description / Defini-tion
Combustion emissions from fuel use during the manufacture of secondary and tertiary products from solid fuels including production of charcoal. Emissions from own on-site fuel use should be included. Also includes combustion for the generation of electricity and heat for own use in these industries.
Country Detail The source category 1A1c ‘Manufacture of Solid Fuels and Other Energy Industries’ includes two sources (1A1ci ‘Manufacture of Solid Fuels’ and 1A1cii ‘Other Energy Industries’).Equation(Describe variables for method used)
E pollutant = AR fuel, consumption • EF pollutant (Equation 1)Where:
E pollutant – Annual emission of pollutant;AR fuel, consumption – Activity rate by fuel consumption;EF pollutant – Emission factor of pollutant.
Methodology: Tier 1Reference EEA (2016), EMEP/EEA air pollutant emission inventory guidebook 2016.1.A.1 Energy industries, page 15 (available on: https://www.eea.europa.eu/publications/emep-eea-guidebook-2016/part-b-sectoral-
guidance-chapters/1-energy/1-a-combustion/1-a-1-energy-industries/view).National Inventory Report: 1990-2016. Greenhouse Gas Sources and Sinks in the Republic of Moldova (2018).
Describe How and Why this Method Was Chosen Due to the unavailability of country specific emission factors, the Tier 1 methodology has been used.
Type and source of activity data The Energy Balances for 2012-2016 time series represent the primary sources of reference for the AD used (production of charcoal, in energy units).National Inventory Report: 1990-2016. Greenhouse Gas Sources and Sinks in the Republic of Moldova, Tables 3-71, 3-72 and 3-73.
Type and source of EF and OF EMEP/EEA air pollutant emission inventory guidebook 2016, 1.A.1 Energy industries, Table 3-7 Biomass, p. 20.
FuelNOx CO NMVOC SO2
g/GJ
Charcoal 81 (40-160)
90(45-180)
7.31(2.44-21.9)
10.6 (6.45-15.1)
Uncertainty of AD and source ± 5% expert judgementUncertainty of EF and source See the 95% confidence interval in the table above (in the brackets, lower-upper)Potential Improvements Category 1A1c calculated for the first time. Improvements are possible when using additional data sources.
2.1.2. Category 1A2 ‘Manufacturing Industries and Constructions’Tables 2.1.2.1 – 2.1.2.12 below comprise relevant information on source categories comprised within the inventory, including description of each source by type of fuel allocated to category 1A2 ‘Manufacturing Industries and Construction’.
Table 2.1.2.1: Information on source category 1A2 Manufacturing industries and construction, solid fuels / CO2Sector EnergyCategory / Fuel / Gas 1A2 Manufacturing industries and constructionSource / Fuel / Gas 1A2 a-m, solid fuels / CO2
Key Category? No
Category Description / Defini-tion
Emissions from combustion of fuels in industry. Also includes combustion for the generation of electricity and heat for own use in these industries. Emissions from fuel combustion in coke ovens within the iron and steel industry should be reported under 1A1c and not within manufacturing industry. Emissions from the industry sector should be specified by sub-categories that correspond to the International Standard Industrial Classification of all Economic Activities (ISIC). Energy used for transport by industry should not be reported here but under Transport (1A3). Emissions arising from off road and other mobile machinery in industry should, if possible, be broken out as a separate subcategory. For each country, the emissions from the largest fuel-consuming industrial categories ISIC should be reported, as well as those from significant emitters of pollutants.

Chapter 2: Methods and Data Documentation
2 - 18
Country Detail
GHG emissions from 1A2 ‘Manufacturing Industries and Construction’ are a result of fuel combustion within the manufacturing industries of the Republic of Moldova (except for emissions from technological pro-cesses taken into account under the Sector 2 ‘IPPU’). Direct GHG emissions from 1A2 “Manufacturing industries and construction’ are being monitored within the following source categories (which, correspond to the ISIC Rev. 3.12 Registry - International Standard Industrial Classification of all Economic Activities): 1A2a ‘Iron and Steel’ (ISIC Group 271, Class 2731); 1A2b ‘Non-Ferrous Metals’ (ISIC Group 272, Class 2732); 1A2c ‘Chemicals’ (ISIC Division 24); 1A2d ‘Pulp, Paper and Print’ (ISIC Divisions 21 and 22); 1A2e ‘Food Processing, Beverages and Tobacco’ (ISIC Divisions 15 and 16); 1A2f ‘Non-Metallic Minerals’ (glass, ceramic, ce-ment) (ISIC Division 26); 1A2g ‘Transport Equipment’ (ISIC Divisions 34 and 35); 1A2h ‘Machinery’ (ISIC Divisions 28, 29, 30, 31 and 32); 1A2i ‘Mining (excluding fuels) and Quarrying’ (ISIC Divisions 13 and 14); 1A2j ‘Wood and Wood Products’ (ISIC Division 20); 1A2k ‘Construction’ (ISIC Division 45); 1A2l ‘Textile and Leather’ (ISIC Divisions 17, 18 and 19); 1A2m ‘Non-specified Industry’ (not included above) (ISIC Divisions 25, 33, 36 and 37). As the AD are incomplete of the LBDR, in order to fill the existing gaps associated with fuel consumption, these were generated indirectly by considering the industrial production on the territory of the LBDR, respectively, the share of each sector in the total structure of industrial production. National Inventory Report: 1990-2016. Greenhouse Gas Sources and Sinks in the Republic of Moldova (2018) (Table 3-101).
Equation(Describe variables for method used)
Emissions GHG, fuel = Fuel Consumption fuel • Emission factor GHG, fuel (Equation 2.1)Where:
Emissions GHG, fuel – emission of the greenhouse gases by type of fuel (kg GHG)Fuel Consumption fuel – amount of fuel consumed (TJ)Emission factor GHG, fuel – default emission factor of a given greenhouse gases by type of fuel (kg gas/TJ).
Methodology: Tier 1Reference 2006 IPCC Guidelines, Vol. 2, Chapter 2, p. 2.11Describe How and Why this Method Was Chosen Due to the unavailability of country specific emission factors, the Tier 1 methodology has been used.
Type and source of activity data Quantity of fuel (TJ) – activity data from Energy Balances of the Republic of Moldova and Quantity of fuel (t), NCV Other Bituminous Coal (25.44 TJ/kt) – Statistical Yearbooks of the ATULBD, National Inventory Report: 1990-2016. Greenhouse Gas Sources and Sinks in the Republic of Moldova (2018).
Type and source of EF and OF
2006 IPCC GL, page 2.18, Table 2.3. IPCC Default Emission Factors for Stationary Combustion in Manufacturing Industries and Construction.Fuels CO2 Emission Factor Unit
Other Bituminous Coal 94 600 (89 500 – 99 700) kg CO2 / TJAnthracite 98 300 (94 600 – 101 000) kg CO2 / TJLignite 101 000 (90 900 – 115 000) kg CO2 / TJBrown Coal Briquettes 97 500 (87 300 – 109 000) kg CO2 / TJCoke Oven Coke and Lignite Coke 107 000 (95 700 – 119 000) kg CO2 / TJ
Uncertainty of AD and source ±5% - expert judgementUncertainty of EF and source ±5% - expert judgement
Potential Improvements Potential improvements within the 1A2 ‘Manufacturing Industries and Construction’ category could be possible once the updated AD regarding the fuel consumption with energy purposes for the territory on the LBDR are available, thus filling the gaps for certain years. In the next inventory cycle, emissions will be presented not only by category, but also by type of fuel (solid, liquid, gaseous, and biofuels).
Table 2.1.2.2: Information on source category 1A2 Manufacturing industries and construction, solid fuels / CH4, N2O12
Sector EnergyCategory 1A2 Manufacturing industries and constructionSource / Fuel / Gas 1A2 a-m, solid fuels / CH4, N2OKey Category? No
Category Description / Defini-tion
Emissions from combustion of fuels in industry. Also includes combustion for the generation of electricity and heat for own use in these industries. Emissions from fuel combustion in coke ovens within the iron and steel industry should be reported under 1A1c and not within manufacturing industry. Emissions from the industry sector should be specified by sub-categories that correspond to the International Standard Industrial Classification of all Economic Activities (ISIC). Energy used for transport by industry should not be reported here but under Transport (1A3). Emissions arising from off road and other mobile machinery in industry should, if possible, be broken out as a separate subcategory. For each country, the emissions from the largest fuel-consuming industrial categories ISIC should be reported, as well as those from significant emitters of pollutants.
21ISIC Rev.3.1 (International Standard Industrial Classification of All Economic Activities, Rev.3.1) (<https://unstats.un.org/unsd/cr/registry/regcst.asp?Cl=17>).2 ISIC Rev.3.1 (International Standard Industrial Classification of All Economic Activities, Rev.3.1) (<https://unstats.un.org/unsd/cr/registry/regcst.asp?Cl=17>).
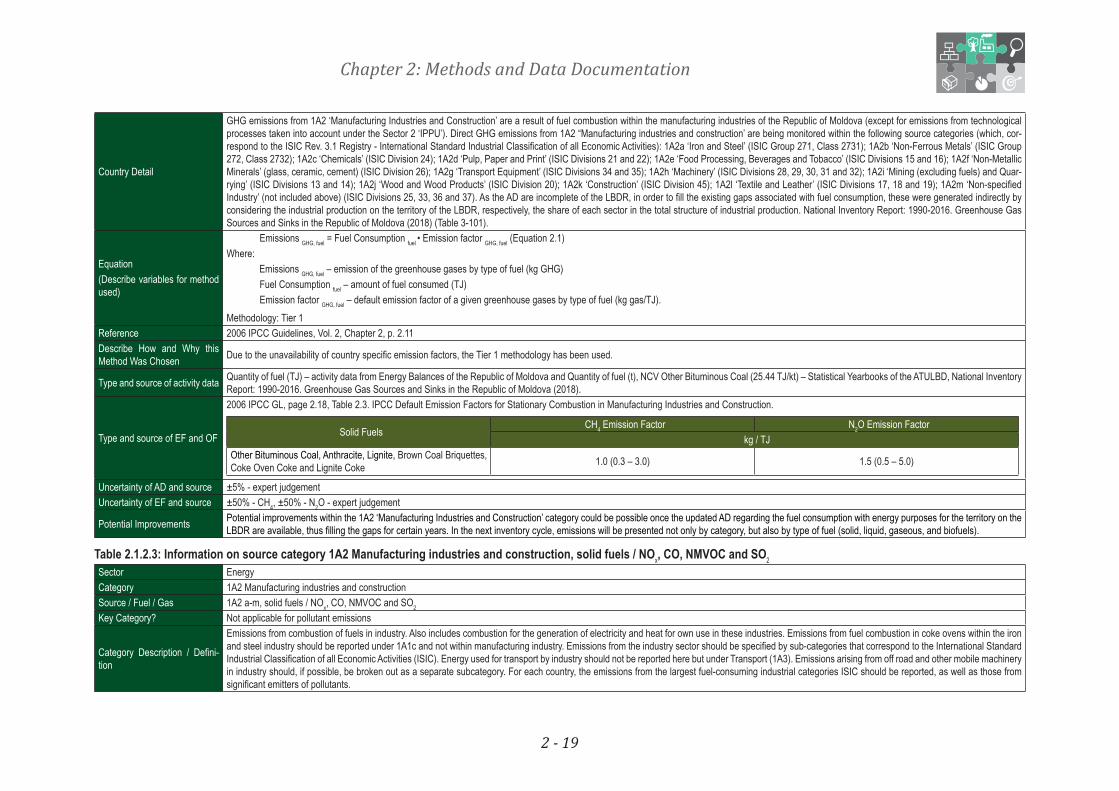
Chapter 2: Methods and Data Documentation
2 - 19
Country Detail
GHG emissions from 1A2 ‘Manufacturing Industries and Construction’ are a result of fuel combustion within the manufacturing industries of the Republic of Moldova (except for emissions from technological processes taken into account under the Sector 2 ‘IPPU’). Direct GHG emissions from 1A2 “Manufacturing industries and construction’ are being monitored within the following source categories (which, cor-respond to the ISIC Rev. 3.1 Registry - International Standard Industrial Classification of all Economic Activities): 1A2a ‘Iron and Steel’ (ISIC Group 271, Class 2731); 1A2b ‘Non-Ferrous Metals’ (ISIC Group 272, Class 2732); 1A2c ‘Chemicals’ (ISIC Division 24); 1A2d ‘Pulp, Paper and Print’ (ISIC Divisions 21 and 22); 1A2e ‘Food Processing, Beverages and Tobacco’ (ISIC Divisions 15 and 16); 1A2f ‘Non-Metallic Minerals’ (glass, ceramic, cement) (ISIC Division 26); 1A2g ‘Transport Equipment’ (ISIC Divisions 34 and 35); 1A2h ‘Machinery’ (ISIC Divisions 28, 29, 30, 31 and 32); 1A2i ‘Mining (excluding fuels) and Quar-rying’ (ISIC Divisions 13 and 14); 1A2j ‘Wood and Wood Products’ (ISIC Division 20); 1A2k ‘Construction’ (ISIC Division 45); 1A2l ‘Textile and Leather’ (ISIC Divisions 17, 18 and 19); 1A2m ‘Non-specified Industry’ (not included above) (ISIC Divisions 25, 33, 36 and 37). As the AD are incomplete of the LBDR, in order to fill the existing gaps associated with fuel consumption, these were generated indirectly by considering the industrial production on the territory of the LBDR, respectively, the share of each sector in the total structure of industrial production. National Inventory Report: 1990-2016. Greenhouse Gas Sources and Sinks in the Republic of Moldova (2018) (Table 3-101).
Equation(Describe variables for method used)
Emissions GHG, fuel = Fuel Consumption fuel • Emission factor GHG, fuel (Equation 2.1)Where:
Emissions GHG, fuel – emission of the greenhouse gases by type of fuel (kg GHG)Fuel Consumption fuel – amount of fuel consumed (TJ)Emission factor GHG, fuel – default emission factor of a given greenhouse gases by type of fuel (kg gas/TJ).
Methodology: Tier 1Reference 2006 IPCC Guidelines, Vol. 2, Chapter 2, p. 2.11Describe How and Why this Method Was Chosen Due to the unavailability of country specific emission factors, the Tier 1 methodology has been used.
Type and source of activity data Quantity of fuel (TJ) – activity data from Energy Balances of the Republic of Moldova and Quantity of fuel (t), NCV Other Bituminous Coal (25.44 TJ/kt) – Statistical Yearbooks of the ATULBD, National Inventory Report: 1990-2016. Greenhouse Gas Sources and Sinks in the Republic of Moldova (2018).
Type and source of EF and OF
2006 IPCC GL, page 2.18, Table 2.3. IPCC Default Emission Factors for Stationary Combustion in Manufacturing Industries and Construction.
Solid FuelsCH4 Emission Factor N2O Emission Factor
kg / TJ Other Bituminous Coal, Anthracite, Lignite, Brown Coal Briquettes, Coke Oven Coke and Lignite Coke 1.0 (0.3 – 3.0) 1.5 (0.5 – 5.0)
Uncertainty of AD and source ±5% - expert judgementUncertainty of EF and source ±50% - CH4, ±50% - N2O - expert judgement
Potential Improvements Potential improvements within the 1A2 ‘Manufacturing Industries and Construction’ category could be possible once the updated AD regarding the fuel consumption with energy purposes for the territory on the LBDR are available, thus filling the gaps for certain years. In the next inventory cycle, emissions will be presented not only by category, but also by type of fuel (solid, liquid, gaseous, and biofuels).
Table 2.1.2.3: Information on source category 1A2 Manufacturing industries and construction, solid fuels / NOx, CO, NMVOC and SO2Sector EnergyCategory 1A2 Manufacturing industries and constructionSource / Fuel / Gas 1A2 a-m, solid fuels / NOx, CO, NMVOC and SO2
Key Category? Not applicable for pollutant emissions
Category Description / Defini-tion
Emissions from combustion of fuels in industry. Also includes combustion for the generation of electricity and heat for own use in these industries. Emissions from fuel combustion in coke ovens within the iron and steel industry should be reported under 1A1c and not within manufacturing industry. Emissions from the industry sector should be specified by sub-categories that correspond to the International Standard Industrial Classification of all Economic Activities (ISIC). Energy used for transport by industry should not be reported here but under Transport (1A3). Emissions arising from off road and other mobile machinery in industry should, if possible, be broken out as a separate subcategory. For each country, the emissions from the largest fuel-consuming industrial categories ISIC should be reported, as well as those from significant emitters of pollutants.

Chapter 2: Methods and Data Documentation
2 - 20
Country Detail
GHG emissions from 1A2 ‘Manufacturing Industries and Construction’ are a result of fuel combustion within the manufacturing industries of the Republic of Moldova (except for emissions from technological processes taken into account under the Sector 2 ‘IPPU’). Direct GHG emissions from 1A2 “Manufacturing industries and construction’ are being monitored within the following source categories (which, cor-respond to the ISIC Rev. 3.1 Registry - International Standard Industrial Classification of all Economic Activities): 1A2a ‘Iron and Steel’ (ISIC Group 271, Class 2731); 1A2b ‘Non-Ferrous Metals’ (ISIC Group 272, Class 2732); 1A2c ‘Chemicals’ (ISIC Division 24); 1A2d ‘Pulp, Paper and Print’ (ISIC Divisions 21 and 22); 1A2e ‘Food Processing, Beverages and Tobacco’ (ISIC Divisions 15 and 16); 1A2f ‘Non-Metallic Minerals’ (glass, ceramic, cement) (ISIC Division 26); 1A2g ‘Transport Equipment’ (ISIC Divisions 34 and 35); 1A2h ‘Machinery’ (ISIC Divisions 28, 29, 30, 31 and 32); 1A2i ‘Mining (excluding fuels) and Quar-rying’ (ISIC Divisions 13 and 14); 1A2j ‘Wood and Wood Products’ (ISIC Division 20); 1A2k ‘Construction’ (ISIC Division 45); 1A2l ‘Textile and Leather’ (ISIC Divisions 17, 18 and 19); 1A2m ‘Non-specified Industry’ (not included above) (ISIC Divisions 25, 33, 36 and 37). As the AD are incomplete of the LBDR, in order to fill the existing gaps associated with fuel consumption, these were generated indirectly by considering the industrial production on the territory of the LBDR, respectively, the share of each sector in the total structure of industrial production. National Inventory Report: 1990-2016. Greenhouse Gas Sources and Sinks in the Republic of Moldova (2018) (Table 3-101).
Equation(Describe variables for method used)
Epolluant = ∑fuelARfuel consumtion *EFfuel,polluant (Equation 1),Where:
E pollutant – emissions of pollutant (kg), AR fuel consumption – fuel used in the industrial combustion (TJ) for each fuel, EF fuel, pollutant – an average emission factor (EF) for each pollutant for each unit of fuel type used (kg/TJ).
Methodology: Tier 1Reference EMEP/EEA air pollutant emission inventory guidebook 2016, 1.A.2 Manufacturing industries and construction (combustion), page 14.Describe How and Why this Method Was Chosen Due to the unavailability of country specific emission factors, the Tier 1 methodology has been used.
Type and source of activity data Quantity of fuel (TJ) – activity data from Energy Balances of the Republic of Moldova and Quantity of fuel (t), NCV Other Bituminous Coal (25.44 TJ/kt) – Statistical Yearbooks of the ATULBD, National Inventory Report: 1990-2016. Greenhouse Gas Sources and Sinks in the Republic of Moldova (2018)
Type and source of EF and OF
EMEP/EEA air pollutant emission inventory guidebook 2016, 1.A.2 Manufacturing industries and construction (combustion), page 15, Tables 3-1 and 3-2.
FuelsNOx CO SO2 NMVOC
g / GgSolid fuels: (Associated Fuel Types – Other Bituminous Coal, Anthracite, Lignite, Brown Coal Briquettes, Coke Oven Coke and Lignite Coke)
173(150 – 200)
931(150 – 2000)
900(450 – 1000)
88.8(10 – 300)
Uncertainty of AD and source 5% - expert judgementUncertainty of EF and source See the 95% confidence interval in the table above.
Potential Improvements Potential improvements within the 1A2 ‘Manufacturing Industries and Construction’ category could be possible once the updated AD regarding the fuel consumption with energy purposes for the territory on the LBDR are available, thus filling the gaps for certain years. In the next inventory cycle, emissions will be presented not only by category, but also by type of fuel (solid, liquid, gaseous, and biofuels).
Table 2.1.2.4: Information on source category 1A2 Manufacturing industries and construction, liquid fuels / CO2Sector EnergyCategory 1A2 Manufacturing industries and constructionSource / Fuel / Gas 1A2 a-m, liquid fuels / CO2
Key Category? Tier 1: Yes: 1990 (L), 2016 (L) (1A2 Manufacturing industries and construction – aggregated)
Category Description / Defini-tion
Emissions from combustion of fuels in industry. Also includes combustion for the generation of electricity and heat for own use in these industries. Emissions from fuel combustion in coke ovens within the iron and steel industry should be reported under 1A1c and not within manufacturing industry. Emissions from the industry sector should be specified by sub-categories that correspond to the International Standard Industrial Classification of all Economic Activities (ISIC). Energy used for transport by industry should not be reported here but under Transport (1A3). Emissions arising from off road and other mobile machinery in industry should, if possible, be broken out as a separate subcategory. For each country, the emissions from the largest fuel-consuming industrial categories ISIC should be reported, as well as those from significant emitters of pollutants.
•

Chapter 2: Methods and Data Documentation
2 - 21
Country Detail
GHG emissions from 1A2 ‘Manufacturing Industries and Construction’ are a result of fuel combustion within the manufacturing industries of the Republic of Moldova (except for emissions from technological pro-cesses taken into account under the Sector 2 ‘IPPU’). Direct GHG emissions from 1A2 “Manufacturing industries and construction’ are being monitored within the following source categories (which, correspond to the ISIC Rev. 3.1 Registry - International Standard Industrial Classification of all Economic Activities): 1A2a ‘Iron and Steel’ (ISIC Group 271, Class 2731); 1A2b ‘Non-Ferrous Metals’ (ISIC Group 272, Class 2732); 1A2c ‘Chemicals’ (ISIC Division 24); 1A2d ‘Pulp, Paper and Print’ (ISIC Divisions 21 and 22); 1A2e ‘Food Processing, Beverages and Tobacco’ (ISIC Divisions 15 and 16); 1A2f ‘Non-Metallic Minerals’ (glass, ceramic, cement) (ISIC Division 26); 1A2g ‘Transport Equipment’ (ISIC Divisions 34 and 35); 1A2h ‘Machinery’ (ISIC Divisions 28, 29, 30, 31 and 32); 1A2i ‘Mining (excluding fuels) and Quarrying’ (ISIC Divisions 13 and 14); 1A2j ‘Wood and Wood Products’ (ISIC Division 20); 1A2k ‘Construction’ (ISIC Division 45); 1A2l ‘Textile and Leather’ (ISIC Divisions 17, 18 and 19); 1A2m ‘Non-specified Industry’ (not included above) (ISIC Divisions 25, 33, 36 and 37). As the AD are incomplete of the LBDR, in order to fill the existing gaps associated with fuel consumption, these were generated indirectly by considering the industrial production on the territory of the LBDR (Table 3-101), respectively, the share of each sector in the total structure of industrial production. National Inventory Report: 1990-2016. Greenhouse Gas Sources and Sinks in the Republic of Moldova (2018) (Table 3-101).
Equation(Describe variables for method used)
Emissions GHG, fuel = Fuel Consumption fuel • Emission factor GHG, fuel (Equation 2.1)Where:
Emissions GHG, fuel - emission of the greenhouse gases by type of fuel (kg GHG)Fuel Consumption fuel - amount of fuel consumed (TJ)Emission factor GHG, fuel - default emission factor of a given greenhouse gases by type of fuel (kg gas/TJ).
Methodology: Tier 1Reference 2006 IPCC Guidelines, Vol. 2, Chapter 2, p. 2.11.Describe How and Why this Method Was Chosen Due to the unavailability of country specific emission factors, the Tier 1 methodology has been used.
Type and source of activity data Quantity of fuel (TJ) – activity data from Energy Balances of the Republic of Moldova and Quantity of fuel (t) – Statistical Yearbooks of the ATULBD, National Inventory Report: 1990-2016. Greenhouse Gas Sources and Sinks in the Republic of Moldova (2018).
Type and source of EF and OF
2006 IPCC GL, page 2.18, Table 2.3, IPCC default EFs.Fuels CO2 Emission Factor Unit
Aviation Gasoline 70 000 (67 500 – 73 000) kg CO2 / TJMotor Gasoline 69 300 (67 500 – 73 000) kg CO2 / TJJet Kerosene 71 500 (69 700 – 74 400) kg CO2 / TJOther Kerosene 71 900 (70 800 – 73 700) kg CO2 / TJLPG 63 100 (61 600 – 65 600) kg CO2 / TJDiesel Oil 74 100 (72 600 – 74 800) kg CO2 / TJResidual Fuel Oil 77 400 (75 500 – 78 800) kg CO2 / TJOther Petroleum Products 73 300 (72 200 – 74 400) kg CO2 / TJ
Uncertainty of AD and source ±5% - expert judgementUncertainty of EF and source ±5% - expert judgement
Potential Improvements Potential improvements within the 1A2 ‘Manufacturing Industries and Construction’ category could be possible once the updated AD regarding the fuel consumption with energy purposes for the territory on the LBDR are available, thus filling the gaps for certain years. In the next inventory cycle, emissions will be presented not only by category, but also by type of fuel (solid, liquid, gaseous, and biofuels).
Table 2.1.2.5: Information on source category 1A2 Manufacturing industries and construction, liquid fuels / CH4, N2OSector EnergyCategory 1A2 Manufacturing industries and constructionSource / Fuel / Gas 1A2 a-m, liquid fuels / CH4, N2OKey Category? No

Chapter 2: Methods and Data Documentation
2 - 22
Category Description / Defini-tion
Emissions from combustion of fuels in industry. Also includes combustion for the generation of electricity and heat for own use in these industries. Emissions from fuel combustion in coke ovens within the iron and steel industry should be reported under 1A1c and not within manufacturing industry. Emissions from the industry sector should be specified by sub-categories that correspond to the International Standard Industrial Classification of all Economic Activities (ISIC). Energy used for transport by industry should not be reported here but under Transport (1A3). Emissions arising from off road and other mobile machinery in industry should, if possible, be broken out as a separate subcategory. For each country, the emissions from the largest fuel-consuming industrial categories ISIC should be reported, as well as those from significant emitters of pollutants.
Country Detail
GHG emissions from 1A2 ‘Manufacturing Industries and Construction’ are a result of fuel combustion within the manufacturing industries of the Republic of Moldova (except for emissions from technological pro-cesses taken into account under the Sector 2 ‘IPPU’). Direct GHG emissions from 1A2 “Manufacturing industries and construction’ are being monitored within the following source categories (which, correspond to the ISIC Rev. 3.1 Registry - International Standard Industrial Classification of all Economic Activities): 1A2a ‘Iron and Steel’ (ISIC Group 271, Class 2731); 1A2b ‘Non-Ferrous Metals’ (ISIC Group 272, Class 2732); 1A2c ‘Chemicals’ (ISIC Division 24); 1A2d ‘Pulp, Paper and Print’ (ISIC Divisions 21 and 22); 1A2e ‘Food Processing, Beverages and Tobacco’ (ISIC Divisions 15 and 16); 1A2f ‘Non-Metallic Minerals’ (glass, ceramic, cement) (ISIC Division 26); 1A2g ‘Transport Equipment’ (ISIC Divisions 34 and 35); 1A2h ‘Machinery’ (ISIC Divisions 28, 29, 30, 31 and 32); 1A2i ‘Mining (excluding fuels) and Quarrying’ (ISIC Divisions 13 and 14); 1A2j ‘Wood and Wood Products’ (ISIC Division 20); 1A2k ‘Construction’ (ISIC Division 45); 1A2l ‘Textile and Leather’ (ISIC Divisions 17, 18 and 19); 1A2m ‘Non-specified Industry’ (not included above) (ISIC Divisions 25, 33, 36 and 37). As the AD are incomplete of the LBDR, in order to fill the existing gaps associated with fuel consumption, these were generated indirectly by considering the industrial production on the territory of the LBDR (Table 3-101), respectively, the share of each sector in the total structure of industrial production. National Inventory Report: 1990-2016. Greenhouse Gas Sources and Sinks in the Republic of Moldova (2018) (Table 3-101).
Equation(Describe variables for method used)
Emissions GHG, fuel = Fuel Consumption fuel • Emission factor GHG, fuel (Equation 2.1)Where:
Emissions GHG, fuel - emission of the greenhouse gases by type of fuel (kg GHG)Fuel Consumption fuel - amount of fuel consumed (TJ)Emission factor GHG, fuel - default emission factor of a given greenhouse gases by type of fuel (kg gas/TJ).
Methodology: Tier 1Reference 2006 IPCC Guidelines, Vol. 2, Chapter 2, p. 2.11.Describe How and Why this Method Was Chosen Due to the unavailability of country specific emission factors, the Tier 1 methodology has been used.
Type and source of activity data Quantity of fuel (TJ) – activity data from Energy Balances of the Republic of Moldova and Quantity of fuel (t) – Statistical Yearbooks of the ATULBD, National Inventory Report: 1990-2016. Greenhouse Gas Sources and Sinks in the Republic of Moldova (2018).
Type and source of EF and OF
2006 IPCC GL, page 2.18, Table 2.3, IPCC default EFs.
FuelsCH4 N2O
kg / TJ Aviation Gasoline, Motor Gasoline, Jet Kerosene, Other Kerosene, Diesel Oil, Residual Fuel Oil, Other Petroleum Products 3.0 (1.0 – 10.0) 0.6 (0.2 – 2.0)LPG 1.0 (0.3 – 3.0) 0.1 (0.03 – 0.3)
Uncertainty of AD and source ±5% - expert judgement Uncertainty of EF and source ±50% - CH4, ±50% - N2O - expert judgement
Potential Improvements Potential improvements within the 1A2 ‘Manufacturing Industries and Construction’ category could be possible once the updated AD regarding the fuel consumption with energy purposes for the territory on the LBDR are available, thus filling the gaps for certain years. In the next inventory cycle, emissions will be presented not only by category, but also by type of fuel (solid, liquid, gaseous, and biofuels).
Table 2.1.2.6: Information on source category 1A2 Manufacturing industries and construction, liquid fuels / NOx, CO, NMVOC and SO2Sector EnergyCategory 1A2 Manufacturing industries and constructionSource / Fuel / Gas 1A2 a-m, liquid fuels / NOx, CO, NMVOC and SO2
Key Category? Not applicable for pollutant emissions

Chapter 2: Methods and Data Documentation
2 - 23
Category Description / Defini-tion
Emissions from combustion of fuels in industry. Also includes combustion for the generation of electricity and heat for own use in these industries. Emissions from fuel combustion in coke ovens within the iron and steel industry should be reported under 1A1c and not within manufacturing industry. Emissions from the industry sector should be specified by sub-categories that correspond to the International Standard Industrial Classification of all Economic Activities (ISIC). Energy used for transport by industry should not be reported here but under Transport (1A3). Emissions arising from off road and other mobile machinery in industry should, if possible, be broken out as a separate subcategory. For each country, the emissions from the largest fuel-consuming industrial categories ISIC should be reported, as well as those from significant emitters of pollutants.
Country Detail
GHG emissions from 1A2 ‘Manufacturing Industries and Construction’ are a result of fuel combustion within the manufacturing industries of the Republic of Moldova (except for emissions from technological pro-cesses taken into account under the Sector 2 ‘IPPU’). Direct GHG emissions from 1A2 “Manufacturing industries and construction’ are being monitored within the following source categories (which, correspond to the ISIC Rev. 3.1 Registry - International Standard Industrial Classification of all Economic Activities): 1A2a ‘Iron and Steel’ (ISIC Group 271, Class 2731); 1A2b ‘Non-Ferrous Metals’ (ISIC Group 272, Class 2732); 1A2c ‘Chemicals’ (ISIC Division 24); 1A2d ‘Pulp, Paper and Print’ (ISIC Divisions 21 and 22); 1A2e ‘Food Processing, Beverages and Tobacco’ (ISIC Divisions 15 and 16); 1A2f ‘Non-Metallic Minerals’ (glass, ceramic, cement) (ISIC Division 26); 1A2g ‘Transport Equipment’ (ISIC Divisions 34 and 35); 1A2h ‘Machinery’ (ISIC Divisions 28, 29, 30, 31 and 32); 1A2i ‘Mining (excluding fuels) and Quarrying’ (ISIC Divisions 13 and 14); 1A2j ‘Wood and Wood Products’ (ISIC Division 20); 1A2k ‘Construction’ (ISIC Division 45); 1A2l ‘Textile and Leather’ (ISIC Divisions 17, 18 and 19); 1A2m ‘Non-specified Industry’ (not included above) (ISIC Divisions 25, 33, 36 and 37). As the AD are incomplete of the LBDR, in order to fill the existing gaps associated with fuel consumption, these were generated indirectly by considering the industrial production on the territory of the LBDR (Table 3-101), respectively, the share of each sector in the total structure of industrial production. National Inventory Report: 1990-2016. Greenhouse Gas Sources and Sinks in the Republic of Moldova (2018) (Table 3-101).
Equation(Describe variables for method used)
Epolluant= ∑fuelARfuel consumtion • EFfuel,polluant (Equation 1),Where:
E pollutant - emissions of pollutant (kg), AR fuel consumption - fuel used in the industrial combustion (TJ) for each fuel, EF fuel,pollutant - an average emission factor (EF) for each pollutant for each unit of fuel type used (kg/TJ).
Methodology: Tier 1Reference EMEP/EEA air pollutant emission inventory guidebook 2016, 1.A.2 Manufacturing industries and construction (combustion), page 14.Describe How and Why this Method Was Chosen Due to the unavailability of country specific emission factors, the Tier 1 methodology has been used.
Type and source of activity data Quantity of fuel (TJ) – activity data from Energy Balances of the Republic of Moldova and Quantity of fuel (t) – Statistical Yearbooks of the ATULBD, National Inventory Report: 1990-2016. Greenhouse Gas Sources and Sinks in the Republic of Moldova (2018).
Type and source of EF and OF
EMEP/EEA air pollutant emission inventory guidebook 2016, 1.A.2 Manufacturing industries and construction (combustion), page 17, Table 3.4.
FuelsNOx CO SO2 NMVOC
g / GgLiquid fuels: (Associated Fuel Types - Residual Fuel Oil, Other Petroleum Products, Diesel Oil, LPG, Other Kerosene, Jet Kerosene, Motor Gasoline, Aviation Gasoline)
513(308 – 718)
66(40 – 93)
47(28 – 66)
25(15 – 35)
Uncertainty of AD and source ±5% - expert judgementUncertainty of EF and source See the 95% confidence interval in the table above.
Potential Improvements Potential improvements within the 1A2 ‘Manufacturing Industries and Construction’ category could be possible once the updated AD regarding the fuel consumption with energy purposes for the territory on the LBDR are available, thus filling the gaps for certain years. In the next inventory cycle, emissions will be presented not only by category, but also by type of fuel (solid, liquid, gaseous, and biofuels).
Table 2.1.2.7: Information on source category 1A2 Manufacturing industries and construction, gaseous fuels / CO2Sector EnergyCategory 1A2 Manufacturing industries and constructionSource / Fuel / Gas 1A2 a-m, gaseous fuels / CO2
Key Category? Tier 1: Yes: 1990 (L), 2016 (L, T) (1A2 Manufacturing industries and construction – aggregated)

Chapter 2: Methods and Data Documentation
2 - 24
Category Description / Defini-tion
Emissions from combustion of fuels in industry. Also includes combustion for the generation of electricity and heat for own use in these industries. Emissions from fuel combustion in coke ovens within the iron and steel industry should be reported under 1A1c and not within manufacturing industry. Emissions from the industry sector should be specified by sub-categories that correspond to the International Standard Industrial Classification of all Economic Activities (ISIC). Energy used for transport by industry should not be reported here but under Transport (1A3). Emissions arising from off road and other mobile machinery in industry should, if possible, be broken out as a separate subcategory. For each country, the emissions from the largest fuel-consuming industrial categories ISIC should be reported, as well as those from significant emitters of pollutants.
Country Detail
GHG emissions from 1A2 ‘Manufacturing Industries and Construction’ are a result of fuel combustion within the manufacturing industries of the Republic of Moldova (except for emissions from technological pro-cesses taken into account under the Sector 2 ‘IPPU’). Direct GHG emissions from 1A2 “Manufacturing industries and construction’ are being monitored within the following source categories (which, correspond to the ISIC Rev. 3.1 Registry - International Standard Industrial Classification of all Economic Activities): 1A2a ‘Iron and Steel’ (ISIC Group 271, Class 2731); 1A2b ‘Non-Ferrous Metals’ (ISIC Group 272, Class 2732); 1A2c ‘Chemicals’ (ISIC Division 24); 1A2d ‘Pulp, Paper and Print’ (ISIC Divisions 21 and 22); 1A2e ‘Food Processing, Beverages and Tobacco’ (ISIC Divisions 15 and 16); 1A2f ‘Non-Metallic Minerals’ (glass, ceramic, cement) (ISIC Division 26); 1A2g ‘Transport Equipment’ (ISIC Divisions 34 and 35); 1A2h ‘Machinery’ (ISIC Divisions 28, 29, 30, 31 and 32); 1A2i ‘Mining (excluding fuels) and Quarrying’ (ISIC Divisions 13 and 14); 1A2j ‘Wood and Wood Products’ (ISIC Division 20); 1A2k ‘Construction’ (ISIC Division 45); 1A2l ‘Textile and Leather’ (ISIC Divisions 17, 18 and 19); 1A2m ‘Non-specified Industry’ (not included above) (ISIC Divisions 25, 33, 36 and 37). As the AD are incomplete of the LBDR, in order to fill the existing gaps associated with fuel consumption, these were generated indirectly by considering the industrial production on the territory of the LBDR (Table 3-101), respectively, the share of each sector in the total structure of industrial production. National Inventory Report: 1990-2016. Greenhouse Gas Sources and Sinks in the Republic of Moldova (2018) (Table 3-101).
Equation(Describe variables for method used)
Emissions GHG, fuel = Fuel Consumption fuel • Emission factor GHG, fuel (Equation 2.1)Where:
Emissions GHG, fuel - emission of the greenhouse gases by type of fuel (kg GHG)Fuel Consumption fuel - amount of fuel consumed (TJ)Emission factor GHG, fuel - default emission factor of a given greenhouse gases by type of fuel (kg gas/TJ).
Methodology: Tier 1Reference 2006 IPCC Guidelines, Vol. 2, Chapter 2, p. 2.11.Describe How and Why this Method Was Chosen Due to the unavailability of country specific emission factors, the Tier 1 methodology has been used.
Type and source of activity data Quantity of fuel (TJ) – activity data from Energy Balances of the Republic of Moldova and Quantity of fuel (t) – Statistical Yearbooks of the ATULBD, National Inventory Report: 1990-2016. Greenhouse Gas Sources and Sinks in the Republic of Moldova (2018).
Type and source of EF and OF2006 IPCC GL, page 2.19, Table 2.3, default EF.
Fuel CO2 Emission Factor UnitNatural Gas 56 100 (54 300 – 58 300) kg CO2 / TJ
Uncertainty of AD and source ±5% - expert judgementUncertainty of EF and source ±5% - expert judgement
Potential Improvements Potential improvements within the 1A2 ‘Manufacturing Industries and Construction’ category could be possible once the updated AD regarding the fuel consumption with energy purposes for the territory on the LBDR are available, thus filling the gaps for certain years. In the next inventory cycle, emissions will be presented not only by category, but also by type of fuel (solid, liquid, gaseous, and biofuels).
Table 2.1.2.8: Information on source category 1A2 Manufacturing industries and construction, gaseous fuels / CH4, N2OSector EnergyCategory 1A2 Manufacturing industries and constructionSource / Fuel / Gas 1A2 a-m / gaseous fuels / CH4, N2OKey Category? No
Category Description / Defini-tion
Emissions from combustion of fuels in industry. Also includes combustion for the generation of electricity and heat for own use in these industries. Emissions from fuel combustion in coke ovens within the iron and steel industry should be reported under 1A1c and not within manufacturing industry. Emissions from the industry sector should be specified by sub-categories that correspond to the International Standard Industrial Classification of all Economic Activities (ISIC). Energy used for transport by industry should not be reported here but under Transport (1A3). Emissions arising from off road and other mobile machinery in industry should, if possible, be broken out as a separate subcategory. For each country, the emissions from the largest fuel-consuming industrial categories ISIC should be reported, as well as those from significant emitters of pollutants.

Chapter 2: Methods and Data Documentation
2 - 25
Country Detail
GHG emissions from 1A2 ‘Manufacturing Industries and Construction’ are a result of fuel combustion within the manufacturing industries of the Republic of Moldova (except for emissions from technological pro-cesses taken into account under the Sector 2 ‘IPPU’). Direct GHG emissions from 1A2 “Manufacturing industries and construction’ are being monitored within the following source categories (which, correspond to the ISIC Rev. 3.1 Registry - International Standard Industrial Classification of all Economic Activities): 1A2a ‘Iron and Steel’ (ISIC Group 271, Class 2731); 1A2b ‘Non-Ferrous Metals’ (ISIC Group 272, Class 2732); 1A2c ‘Chemicals’ (ISIC Division 24); 1A2d ‘Pulp, Paper and Print’ (ISIC Divisions 21 and 22); 1A2e ‘Food Processing, Beverages and Tobacco’ (ISIC Divisions 15 and 16); 1A2f ‘Non-Metallic Minerals’ (glass, ceramic, cement) (ISIC Division 26); 1A2g ‘Transport Equipment’ (ISIC Divisions 34 and 35); 1A2h ‘Machinery’ (ISIC Divisions 28, 29, 30, 31 and 32); 1A2i ‘Mining (excluding fuels) and Quarrying’ (ISIC Divisions 13 and 14); 1A2j ‘Wood and Wood Products’ (ISIC Division 20); 1A2k ‘Construction’ (ISIC Division 45); 1A2l ‘Textile and Leather’ (ISIC Divisions 17, 18 and 19); 1A2m ‘Non-specified Industry’ (not included above) (ISIC Divisions 25, 33, 36 and 37). As the AD are incomplete of the LBDR, in order to fill the existing gaps associated with fuel consumption, these were generated indirectly by considering the industrial production on the territory of the LBDR (Table 3-101), respectively, the share of each sector in the total structure of industrial production. National Inventory Report: 1990-2016. Greenhouse Gas Sources and Sinks in the Republic of Moldova (2018) (Table 3-101).
Equation(Describe variables for method used)
Emissions GHG, fuel = Fuel Consumption fuel • Emission factor GHG, fuel (Equation 2.1)Where:
Emissions GHG, fuel - emission of the greenhouse gases by type of fuel (kg GHG)Fuel Consumption fuel - amount of fuel consumed (TJ)Emission factor GHG, fuel - default emission factor of a given greenhouse gases by type of fuel (kg gas/TJ).
Methodology: Tier 1Reference 2006 IPCC Guidelines, Vol. 2, Chapter 2, p. 2.11.Describe How and Why this Method Was Chosen Due to the unavailability of country specific emission factors, the Tier 1 methodology has been used.
Type and source of activity data Quantity of fuel (TJ) – activity data from Energy Balances of the Republic of Moldova and Quantity of fuel (t) – Statistical Yearbooks of the ATULBD, National Inventory Report: 1990-2016. Greenhouse Gas Sources and Sinks in the Republic of Moldova (2018).
Type and source of EF and OF
2006 IPCC GL, page 2.19, Table 2.3, default EFs.
FuelCH4 N2O
kg / TJNatural Gas 1.0 (0.3 – 3.0) 0.1 (0.03 – 0.3)
Uncertainty of AD and source ±3% - expert judgement Uncertainty of EF and source ±50% - CH4, ±50% - N2O - expert judgement
Potential Improvements Potential improvements within the 1A2 ‘Manufacturing Industries and Construction’ category could be possible once the updated AD regarding the fuel consumption with energy purposes for the territory on the LBDR are available, thus filling the gaps for certain years. In the next inventory cycle, emissions will be presented not only by category, but also by type of fuel (solid, liquid, gaseous, and biofuels).
Table 2.1.2.9: Information on source category 1A2 Manufacturing industries and construction, gaseous fuels / NOx, CO, NMVOC and SO2
Sector EnergyCategory 1A2 Manufacturing industries and constructionSource / Fuel / Gas 1A2 a-m / gaseous fuels / NOx, CO, NMVOC and SO2
Key Category? Not applicable for pollutant emissions
Category Description / Defini-tion
Emissions from combustion of fuels in industry. Also includes combustion for the generation of electricity and heat for own use in these industries. Emissions from fuel combustion in coke ovens within the iron and steel industry should be reported under 1A1c and not within manufacturing industry. Emissions from the industry sector should be specified by sub-categories that correspond to the International Standard Industrial Classification of all Economic Activities (ISIC). Energy used for transport by industry should not be reported here but under Transport (1A3). Emissions arising from off road and other mobile machinery in industry should, if possible, be broken out as a separate subcategory. For each country, the emissions from the largest fuel-consuming industrial categories ISIC should be reported, as well as those from significant emitters of pollutants.

Chapter 2: Methods and Data Documentation
2 - 26
Country Detail
GHG emissions from 1A2 ‘Manufacturing Industries and Construction’ are a result of fuel combustion within the manufacturing industries of the Republic of Moldova (except for emissions from technological processes taken into account under the Sector 2 ‘IPPU’). Direct GHG emissions from 1A2 “Manufacturing industries and construction’ are being monitored within the following source categories (which, cor-respond to the ISIC Rev. 3.1 Registry – International Standard Industrial Classification of all Economic Activities): 1A2a ‘Iron and Steel’ (ISIC Group 271, Class 2731); 1A2b ‘Non-Ferrous Metals’ (ISIC Group 272, Class 2732); 1A2c ‘Chemicals’ (ISIC Division 24); 1A2d ‘Pulp, Paper and Print’ (ISIC Divisions 21 and 22); 1A2e ‘Food Processing, Beverages and Tobacco’ (ISIC Divisions 15 and 16); 1A2f ‘Non-Metallic Minerals’ (glass, ceramic, cement) (ISIC Division 26); 1A2g ‘Transport Equipment’ (ISIC Divisions 34 and 35); 1A2h ‘Machinery’ (ISIC Divisions 28, 29, 30, 31 and 32); 1A2i ‘Mining (excluding fuels) and Quar-rying’ (ISIC Divisions 13 and 14); 1A2j ‘Wood and Wood Products’ (ISIC Division 20); 1A2k ‘Construction’ (ISIC Division 45); 1A2l ‘Textile and Leather’ (ISIC Divisions 17, 18 and 19); 1A2m ‘Non-specified Industry’ (not included above) (ISIC Divisions 25, 33, 36 and 37). As the AD are incomplete of the LBDR, in order to fill the existing gaps associated with fuel consumption, these were generated indirectly by considering the industrial production on the territory of the LBDR (Table 3-101), respectively, the share of each sector in the total structure of industrial production. National Inventory Report: 1990-2016. Greenhouse Gas Sources and Sinks in the Republic of Moldova (2018) (Table 3-101).
Equation(Describe variables for method used)
Epolluant= ∑fuelARfuel consumtion *EFfuel,polluant (Equation 1),Where:
E pollutant - emissions of pollutant (kg), AR fuel consumption - fuel used in the industrial combustion (TJ) for each fuel, EF fuel, pollutant - an average emission factor (EF) for each pollutant for each unit of fuel type used (kg/TJ).
Methodology: Tier 1Reference EMEP/EEA air pollutant emission inventory guidebook 2016, 1.A.2 Manufacturing industries and construction (combustion), page 14.Describe How and Why this Method Was Chosen Due to the unavailability of country specific emission factors, the Tier 1 methodology has been used.
Type and source of activity data
Quantity of fuel (TJ) – activity data from Energy Balances of the Republic of Moldova and Quantity of fuel (t) – Statistical Yearbooks of the ATULBD, National Inventory Report: 1990-2016. Greenhouse Gas Sources and Sinks in the Republic of Moldova (2018).
Type and source of EF and OF
EMEP/EEA air pollutant emission inventory guidebook 2016, 1.A.2 Manufacturing industries and construction (combustion), page 16, Tables 3-1 and 3-3.
FuelNOx CO SO2 NMVOC
g / GgNatural Gas 74 (46 – 103) 29 (21 –48) 0.67 (0.40 – 0.94) 23 (14 – 33)
Uncertainty of AD and source ±5% - expert judgementUncertainty of EF and source See the 95% confidence interval in the table above.
Potential Improvements Potential improvements within the 1A2 ‘Manufacturing Industries and Construction’ category could be possible once the updated AD regarding the fuel consumption with energy purposes for the territory on the LBDR are available, thus filling the gaps for certain years. In the next inventory cycle, emissions will be presented not only by category, but also by type of fuel (solid, liquid, gaseous, and biofuels).
Table 2.1.2.10: Information on source category 1A2 Manufacturing industries and construction, biomass / CO2Sector EnergyCategory 1A2 Manufacturing industries and constructionSource / Fuel / Gas 1A2 a-m, biomass / CO2
Key Category? No
Category Description / Defini-tion
CO2 emissions from biomass under the source category 1A2 ‘Manufacturing industries and construction’ have to be reported under the Memo Items (CO2 emissions from biomass). Emissions from combustion of fuels in industry. Also includes combustion for the generation of electricity and heat for own use in these industries. Emissions from fuel combustion in coke ovens within the iron and steel industry should be reported under 1A1c and not within manufacturing industry. Emissions from the industry sector should be specified by sub-categories that correspond to the International Standard Industrial Classification of all Economic Activities (ISIC). Energy used for transport by industry should not be reported here but under Transport (1A3). Emissions arising from off road and other mobile machinery in industry should, if possible, be broken out as a separate subcategory. For each country, the emissions from the largest fuel-consuming industrial categories ISIC should be reported, as well as those from significant emitters of pollutants.
•

Chapter 2: Methods and Data Documentation
2 - 27
Country Detail
GHG emissions from 1A2 ‘Manufacturing Industries and Construction’ are a result of fuel combustion within the manufacturing industries of the Republic of Moldova (except for emissions from technological pro-cesses taken into account under the Sector 2 ‘IPPU’). Direct GHG emissions from 1A2 “Manufacturing industries and construction’ are being monitored within the following source categories (which, correspond to the ISIC Rev. 3.1 Registry – International Standard Industrial Classification of all Economic Activities): 1A2a ‘Iron and Steel’ (ISIC Group 271, Class 2731); 1A2b ‘Non-Ferrous Metals’ (ISIC Group 272, Class 2732); 1A2c ‘Chemicals’ (ISIC Division 24); 1A2d ‘Pulp, Paper and Print’ (ISIC Divisions 21 and 22); 1A2e ‘Food Processing, Beverages and Tobacco’ (ISIC Divisions 15 and 16); 1A2f ‘Non-Metallic Minerals’ (glass, ceramic, cement) (ISIC Division 26); 1A2g ‘Transport Equipment’ (ISIC Divisions 34 and 35); 1A2h ‘Machinery’ (ISIC Divisions 28, 29, 30, 31 and 32); 1A2i ‘Mining (excluding fuels) and Quarrying’ (ISIC Divisions 13 and 14); 1A2j ‘Wood and Wood Products’ (ISIC Division 20); 1A2k ‘Construction’ (ISIC Division 45); 1A2l ‘Textile and Leather’ (ISIC Divisions 17, 18 and 19); 1A2m ‘Non-specified Industry’ (not included above) (ISIC Divisions 25, 33, 36 and 37). As the AD are incomplete of the LBDR, in order to fill the existing gaps associated with fuel consumption, these were generated indirectly by considering the industrial production on the territory of the LBDR (Table 3-101), respectively, the share of each sector in the total structure of industrial production. National Inventory Report: 1990-2016. Greenhouse Gas Sources and Sinks in the Republic of Moldova (2018) (Table 3-101).
Equation(Describe variables for method used)
Emissions GHG, fuel = Fuel Consumption fuel • Emission factor GHG, fuel (Equation 2.1)Where:
Emissions GHG, fuel - emission of the greenhouse gases by type of fuel (kg GHG)Fuel Consumption fuel - amount of fuel consumed (TJ)Emission factor GHG, fuel - default EF of a given greenhouse gases by type of fuel (kg gas/TJ). For CO2, it includes the carbon oxidation factor, assumed to be 1.
Methodology: Tier 1Reference 2006 IPCC Guidelines, Vol. 2, Chapter 2, p. 2.11.Describe How and Why this Method Was Chosen Due to the unavailability of country specific emission factors, the Tier 1 methodology has been used.
Type and source of activity data Quantity of fuel (TJ) – activity data from Energy Balances of the Republic of Moldova and Quantity of fuel (t) – Statistical Yearbooks of the ATULBD, National Inventory Report: 1990-2016. Greenhouse Gas Sources and Sinks in the Republic of Moldova (2018).
Type and source of EF and OF
2006 IPCC GL, page 2.19, Table 2.3, IPCC default EFs.
Fuels CO2 Emission Factor UnitFuel Wood, Wood Waste, Charcoal 112 000 (95 000 – 132 000) kg CO2 / TJOther Types of Solid Biomass 100 000 (84 700 – 117 000) kg CO2 / TJ
Uncertainty of AD and source ±5% - expert judgementUncertainty of EF and source ±5% - expert judgement
Potential Improvements Potential improvements within the 1A2 ‘Manufacturing Industries and Construction’ category could be possible once the updated AD regarding the fuel consumption with energy purposes for the territory on the LBDR are available, thus filling the gaps for certain years. In the next inventory cycle, emissions will be presented not only by category, but also by type of fuel (solid, liquid, gaseous, and biofuels).
Table 2.1.2.11: Information on source category 1A2 Manufacturing industries and construction, biomass / CH4, N2OSector EnergyCategory 1A2 Manufacturing industries and constructionSource / Fuel / Gas 1A2 a-m, biomass / CH4, N2OKey Category? No
Category Description / Defini-tion
Emissions from combustion of fuels in industry. Also includes combustion for the generation of electricity and heat for own use in these industries. Emissions from fuel combustion in coke ovens within the iron and steel industry should be reported under 1A1c and not within manufacturing industry. Emissions from the industry sector should be specified by sub-categories that correspond to the International Standard Industrial Classification of all Economic Activities (ISIC). Energy used for transport by industry should not be reported here but under Transport (1A3). Emissions arising from off road and other mobile machinery in industry should, if possible, be broken out as a separate subcategory. For each country, the emissions from the largest fuel-consuming industrial categories ISIC should be reported, as well as those from significant emitters of pollutants.

Chapter 2: Methods and Data Documentation
2 - 28
Country Detail
GHG emissions from 1A2 ‘Manufacturing Industries and Construction’ are a result of fuel combustion within the manufacturing industries of the Republic of Moldova (except for emissions from technological pro-cesses taken into account under the Sector 2 ‘IPPU’). Direct GHG emissions from 1A2 “Manufacturing industries and construction’ are being monitored within the following source categories (which, correspond to the ISIC Rev. 3.1 Registry – International Standard Industrial Classification of all Economic Activities): 1A2a ‘Iron and Steel’ (ISIC Group 271, Class 2731); 1A2b ‘Non-Ferrous Metals’ (ISIC Group 272, Class 2732); 1A2c ‘Chemicals’ (ISIC Division 24); 1A2d ‘Pulp, Paper and Print’ (ISIC Divisions 21 and 22); 1A2e ‘Food Processing, Beverages and Tobacco’ (ISIC Divisions 15 and 16); 1A2f ‘Non-Metallic Minerals’ (glass, ceramic, cement) (ISIC Division 26); 1A2g ‘Transport Equipment’ (ISIC Divisions 34 and 35); 1A2h ‘Machinery’ (ISIC Divisions 28, 29, 30, 31 and 32); 1A2i ‘Mining (excluding fuels) and Quarrying’ (ISIC Divisions 13 and 14); 1A2j ‘Wood and Wood Products’ (ISIC Division 20); 1A2k ‘Construction’ (ISIC Division 45); 1A2l ‘Textile and Leather’ (ISIC Divisions 17, 18 and 19); 1A2m ‘Non-specified Industry’ (not included above) (ISIC Divisions 25, 33, 36 and 37). As the AD are incomplete of the LBDR, in order to fill the existing gaps associated with fuel consumption, these were generated indirectly by considering the industrial production on the territory of the LBDR (Table 3-101), respectively, the share of each sector in the total structure of industrial production. National Inventory Report: 1990-2016. Greenhouse Gas Sources and Sinks in the Republic of Moldova (2018) (Table 3-101).
Equation(Describe variables for method used)
Emissions GHG, fuel = Fuel Consumption fuel • Emission factor GHG, fuel (Equation 2.1)Where:
Emissions GHG, fuel - emission of the greenhouse gases by type of fuel (kg GHG)Fuel Consumption fuel - amount of fuel consumed (TJ)Emission factor GHG, fuel - default emission factor of a given greenhouse gases by type of fuel (kg gas/TJ).
Methodology: Tier 1Reference 2006 IPCC Guidelines, Vol. 2, Chapter 2, p. 2.11.Describe How and Why this Method Was Chosen Due to the unavailability of country specific emission factors, the Tier 1 methodology has been used.
Type and source of activity data Quantity of fuel (TJ) – activity data from Energy Balances of the Republic of Moldova and Quantity of fuel (t) – Statistical Yearbooks of the ATULBD, National Inventory Report: 1990-2016. Greenhouse Gas Sources and Sinks in the Republic of Moldova (2018).
Type and source of EF and OF
2006 IPCC GL, page 2.19, Table 2.3, IPCC default EFs.
FuelsCH4 Emission Factor N2O Emission Factor
kg / TJ Fuel Wood, Wood Waste, Charcoal, Other Types of Solid Biomass 30.0 (10.0 – 100.0) 4.0 (1.5– 15.0)
Uncertainty of AD and source ±5% - expert judgement Uncertainty of EF and source ±50% - CH4, ±50% - N2O - expert judgement
Potential Improvements Potential improvements within the 1A2 ‘Manufacturing Industries and Construction’ category could be possible once the updated AD regarding the fuel consumption with energy purposes for the territory on the LBDR are available, thus filling the gaps for certain years. In the next inventory cycle, emissions will be presented not only by category, but also by type of fuel (solid, liquid, gaseous, and biofuels).
Table 2.1.2.12: Information on source category 1A2 Manufacturing industries and construction, biomass / NOx, CO, NMVOC and SO2Sector EnergyCategory 1A2 Manufacturing industries and constructionSource / Fuel / Gas 1A2 a-m / NOx, CO, NMVOC and SO2
Key Category? Not applicable for pollutant emissions
Category Description / Defini-tion
Emissions from combustion of fuels in industry. Also includes combustion for the generation of electricity and heat for own use in these industries. Emissions from fuel combustion in coke ovens within the iron and steel industry should be reported under 1A1c and not within manufacturing industry. Emissions from the industry sector should be specified by sub-categories that correspond to the International Standard Industrial Classification of all Economic Activities (ISIC). Energy used for transport by industry should not be reported here but under Transport (1A3). Emissions arising from off road and other mobile machinery in industry should, if possible, be broken out as a separate subcategory. For each country, the emissions from the largest fuel-consuming industrial categories ISIC should be reported, as well as those from significant emitters of pollutants.

Chapter 2: Methods and Data Documentation
2 - 29
Country Detail
GHG emissions from 1A2 ‘Manufacturing Industries and Construction’ are a result of fuel combustion within the manufacturing industries of the Republic of Moldova (except for emissions from technological pro-cesses taken into account under the Sector 2 ‘IPPU’). Direct GHG emissions from 1A2 “Manufacturing industries and construction’ are being monitored within the following source categories (which, correspond to the ISIC Rev. 3.1 Registry – International Standard Industrial Classification of all Economic Activities): 1A2a ‘Iron and Steel’ (ISIC Group 271, Class 2731); 1A2b ‘Non-Ferrous Metals’ (ISIC Group 272, Class 2732); 1A2c ‘Chemicals’ (ISIC Division 24); 1A2d ‘Pulp, Paper and Print’ (ISIC Divisions 21 and 22); 1A2e ‘Food Processing, Beverages and Tobacco’ (ISIC Divisions 15 and 16); 1A2f ‘Non-Metallic Minerals’ (glass, ceramic, cement) (ISIC Division 26); 1A2g ‘Transport Equipment’ (ISIC Divisions 34 and 35); 1A2h ‘Machinery’ (ISIC Divisions 28, 29, 30, 31 and 32); 1A2i ‘Mining (excluding fuels) and Quarrying’ (ISIC Divisions 13 and 14); 1A2j ‘Wood and Wood Products’ (ISIC Division 20); 1A2k ‘Construction’ (ISIC Division 45); 1A2l ‘Textile and Leather’ (ISIC Divisions 17, 18 and 19); 1A2m ‘Non-specified Industry’ (not included above) (ISIC Divisions 25, 33, 36 and 37). As the AD are incomplete of the LBDR, in order to fill the existing gaps associated with fuel consumption, these were generated indirectly by considering the industrial production on the territory of the LBDR (Table 3-101), respectively, the share of each sector in the total structure of industrial production. National Inventory Report: 1990-2016. Greenhouse Gas Sources and Sinks in the Republic of Moldova (2018) (Table 3-101).
Equation(Describe variables for method used)
Epolluant= ∑fuelARfuel consumtion *EFfuel,polluant(Equation 1),Where:
E pollutant - emissions of pollutant (kg), AR fuel consumption - fuel used in the industrial combustion (TJ) for each fuel, EF fuel, pollutant - an average emission factor (EF) for each pollutant for each unit of fuel type used (kg/TJ).
Methodology: Tier 1Reference EMEP/EEA air pollutant emission inventory guidebook 2016, 1.A.2 Manufacturing industries and construction (combustion), page 14.Describe How and Why this Method Was Chosen Due to the unavailability of country specific emission factors, the Tier 1 methodology has been used.
Type and source of activity data Quantity of fuel (TJ) – activity data from Energy Balances of the Republic of Moldova and Quantity of fuel (t) – Statistical Yearbooks of the ATULBD, National Inventory Report: 1990-2016. Greenhouse Gas Sources and Sinks in the Republic of Moldova (2018).
Type and source of EF and OF
EMEP/EEA air pollutant emission inventory guidebook 2016, 1.A.2 Manufacturing industries and construction (combustion), page 18, Tables 3-1 and 3-5.
FuelsNOx CO SO2 NMVOC
g / GgBiomass: (Associated Fuel Types – Fuel Wood and Wood Waste, Other Solid Biomass, Charcoal)
91(20 – 120)
570(50 – 4000)
11.0(8.0 – 40.0)
300(5 – 500)
Uncertainty of AD and source ±5% - expert judgementUncertainty of EF and source See the 95% confidence interval in the table above.
Potential Improvements Potential improvements within the 1A2 ‘Manufacturing Industries and Construction’ category could be possible once the updated AD regarding the fuel consumption with energy purposes for the territory on the LBDR are available, thus filling the gaps for certain years. In the next inventory cycle, emissions will be presented not only by category, but also by type of fuel (solid, liquid, gaseous, and biofuels).
2.1.3. Category 1A3 ‘Transport’
Tables 2.1.3.1 – 2.1.3.21 below comprise relevant information on source categories comprised within the inventory, including description of each source by type of fuel allocated to category 1A3 ‘Transport’.
Table 2.1.3.1: Information on source category 1A3ai ‘International Aviation’, liquid fuels / CO2 Sector EnergyCategory 1A3 TransportSource / Fuel / Gas 1A3ai ‘International Aviation’, liquid fuels / CO2
Key Category? No
•

Chapter 2: Methods and Data Documentation
2 - 30
Category Description / Defini-tion
CO2 emissions from source category 1A3ai ‘International Aviation’ are reported under ‘Memo Items’ (International Bunkers) and include emissions from flights that depart in one country and arrive in a different country. Include take-offs and landings for these flight stages. Emissions from international military aviation can be included as a separate subcategory of international aviation provided that the same definitional distinction is applied and data are available to support the definition.
Country Detail
GHG emissions from source category 1A3ai ‘International Aviation’ comes from the combustion of jet fuel used in the international air transport (in case of aircrafts which operate international flights, emissions are allocated to the country in which the aircraft was fueled). In the Republic of Moldova, international aviation includes jet propelled aircrafts using jet kerosene. The aviation fleet in the RM includes different types of aircrafts produced in foreign countries and CIS countries: large commercial jet aircrafts: A-319, 320, 321, 300-600; Boeing-707, 737, 739, 747, 757; EMB-120, 135, 145, 170, 190; Fokker 70, 100; MD-81, 82, 83; RJ-85, 100; CRJ, Rombac-561 Rc; turbo-propelled aircrafts for short and medium distances: Saab-340, 2000; L410, DHC8, ATR-42; light turbo-propelled aircrafts: X-32 Becas; small jet aircrafts: Falcon-2000EX, Learjet-35. The aircrafts produced in the CIS countries include: TU-134, 154; AN-2, 12, 24, 26, 28, 32, 72, 74; IL-18, 76; YAK-18, 40, 42; and helicopters Mi-8, 17, 26; Ka-26, 32. Operation of aircrafts is divided into two phases: (i) Landing/Take-Off (LTO) occurring at altitudes lower than 914 meters and (ii) Cruise (C), occurring at altitudes higher than 914 meters. The largest share in the total GHG emissions from international aviation is covered by CO2 (circa 70 per cent).
Equation(Describe variables for method used)
The basic equations used to estimate emissions are as follows: Total Emissions = LTO Emissions + Cruise EmissionsLTO Emissions = Number of LTOs • Emission Factor LTO LTO Fuel Consumption = Number of LTOs • Fuel Consumption per LTOCruise Emissions = (Total Fuel Consumption – LTO Fuel Consumption) • Emission Factor Cruise
Tier 2b method
Reference 2006 IPCC Guidelines for National Greenhouse Gas Inventories, Chapter 3: Mobile Combustion, Equations 3.6.2.-3.6.5, p. 3.59. Revised 1996 IPCC Guidelines, Vol. 3, Table 1-52, Page 1.98. National Inven-tory Report: 1990-2016. Greenhouse Gas Sources and Sinks in the Republic of Moldova (2018).
Describe How and Why this Method Was Chosen
Due to the availability of specific data for this source, the Tier 2 methodology has been used. The number of aircraft departures are available for the period 1995-2016. The results for 1990-1994 were restored using the partial overlapping method, while for 1995-2016 – by using a Tier 2b approach available in the 2006 IPCC Guidelines.
Type and source of activity dataThe number of aircraft departures (units) and Amount of fuel consumption (thousand tons): Civil Aeronautical Authority of the RM through Official Letters No. 3978 dated 02.10.2006 and No. 1328 dated 13.09.2011; No. 474 dated 13.02.2014 and No. 366 dated 02.03.2015 and No.1156 dated 27.05.2016 and No. 4040 dated 28.12.2017. National Inventory Report: 1990-2016. Greenhouse Gas Sources and Sinks in the Republic of Moldova (2018), Section 3.8.2, Tables 3-190, 3-191 and 3-192.
Type and source of EF and OFCO2 Emission Factors for representative aircrafts according to the 2006 IPCC Guidelines, Vol. 2, Ch. 3, Tab. 3.6.3, 3.6.9. p. 2.63 and p. 3.70. New and old aircraft types: LTO (kg/LTO); all aircraft types: cruise phase of flight (kg/t): Revised 1996 IPCC Guidelines, Vol. 3, Table 1-52, Page 1.98. National Inventory Report: 1990-2016. Greenhouse Gas Sources and Sinks in the Republic of Moldova (2018), Tables 3-187 and 3-188.
Uncertainty of AD and source ±5%, expert judgementUncertainty of EF and source ±5%, expert judgement
Potential ImprovementsWithin the 1A3ai ‘International Aviation’ source category, potential improvements could be achieved once a higher methodology is used (for example, a Tier 3 approach available in the EMEP/EEA Air Pollut-ant Emission Inventory Guidebook (2016), which considers the real values of emissions for each type of aircraft depending on the flight distance. Also, it could be used the emission calculator available in the updated version of the EMEP/EEA Air Pollutant Emission Inventory Guidebook (July 2017).
Table 2.1.3.2: Information on source category 1A3ai ‘International Aviation’, liquid fuels / CH4, N2OSector EnergyCategory 1A3 TransportSource / Fuel / Gas 1A3ai ‘International Aviation’, liquid fuels / CH4, N2OKey Category? No
Category Description / Defini-tion
CH4 and N2O emissions from source category 1A3ai ‘International Aviation’ are reported under ‘Memo Items’ (International Bunkers) and include emissions from flights that depart in one country and arrive in a different country. Include take-offs and landings for these flight stages. Emissions from international military aviation can be included as a separate subcategory of international aviation provided that the same definitional distinction is applied and data are available to support the definition.

Chapter 2: Methods and Data Documentation
2 - 31
Country Detail
GHG emissions from 1A3ai ‘International Aviation’ comes from the combustion of jet fuel used in the international air transport (in case of aircrafts which operate international flights, emissions are allocated to the country in which the aircraft was fueled). In the Republic of Moldova, international aviation includes jet propelled aircrafts using jet kerosene. The aviation fleet in the RM includes different types of aircrafts produced in foreign countries and CIS countries: large commercial jet aircrafts: A-319, 320, 321, 300-600; Boeing-707, 737, 739, 747, 757; EMB-120, 135, 145, 170, 190; Fokker 70, 100; MD-81, 82, 83; RJ-85, 100; CRJ, Rombac-561 Rc; turbo-propelled aircrafts for short and medium distances: Saab-340, 2000; L410, DHC8, ATR-42; light turbo-propelled aircrafts: X-32 Becas; small jet aircrafts: Falcon-2000EX, Learjet-35. The aircrafts produced in the CIS countries include: TU-134, 154; AN-2, 12, 24, 26, 28, 32, 72, 74; IL-18, 76; YAK-18, 40, 42; and helicopters Mi-8, 17, 26; Ka-26, 32. Operation of aircrafts is divided into two phases: (i) Landing/Take-Off (LTO) occurring at altitudes lower than 914 meters and (ii) Cruise (C), occurring at altitudes higher than 914 meters. The share of methane and nitrous oxide emissions is insignificant (it is considered that modern engines emit little or no CH4, in particular, during the cruise cycle).
Equation(Describe variables for method used)
The basic equations used to estimate emissions are as follows: Total Emissions = LTO Emissions + Cruise EmissionsLTO Emissions = Number of LTOs • Emission Factor LTO LTO Fuel Consumption = Number of LTOs • Fuel Consumption per LTOCruise Emissions = (Total Fuel Consumption – LTO Fuel Consumption) • Emission Factor Cruise
Tier 2b method
Reference 2006 IPCC Guidelines for National Greenhouse Gas Inventories, Chapter 3: Mobile Combustion, Equations 3.6.2.-3.6.5, p. 3.59. National Inventory Report: 1990-2016. Greenhouse Gas Sources and Sinks in the Republic of Moldova (2018).
Describe How and Why this Method Was Chosen
Due to the availability specific data for this source, the Tier 2 methodology has been used. The number of aircraft departures are available for the period 1995-2016. The results for 1990-1994 were restored using the partial overlapping method, while for 1995-2016 – by using a Tier 2b approach available in the 2006 IPCC Guidelines.
Type and source of activity data
The number of aircraft departures (units) and Amount of fuel consumption (thousand tons): Civil Aeronautical Authority of the RM through Official Letters No. 3978 dated 02.10.2006 and No. 1328 dated 13.09.2011; No. 474 dated 13.02.2014 and No. 366 dated 02.03.2015 and No.1156 dated 27.05.2016 and No. 4040 dated 28.12.2017. National Inventory Report: 1990-2016. Greenhouse Gas Sources and Sinks in the Republic of Moldova (2018), Section 3.8.2, Tables 3-190, 3-191 and 3-192.
Type and source of EF and OF Default EFs used to estimate GHG emissions from 1A3ai ‘International Aviation’ source category. Emission Factors for representative aircrafts according to the 2006 IPCC Guidelines, Vol. 2, Ch. 3, Tab. 3.6.3, 3.6.9. p.2.63 and p. 3.70. National Inventory Report: 1990-2016. Greenhouse Gas Sources and Sinks in the Republic of Moldova (2018), Tables 3-187 and 3-188.
Uncertainty of AD and source ±5%, expert judgement
Uncertainty of EF and source ±10% for CH4, expert judgement ±100% for N2O, expert judgement
Potential ImprovementsWithin the 1A3ai ‘International Aviation’ source category, potential improvements could be achieved once a higher methodology is used (for example, a Tier 3 approach available in the EMEP/EEA Air Pollutant Emission Inventory Guidebook (2016), which considers the real values of emissions for each type of aircraft depending on the flight distance. Also, it could be used the emission calculator available in the updated version of the EMEP/EEA Air Pollutant Emission Inventory Guidebook (July 2017).
Table 2.1.3.3: Information on source category 1A3ai ‘International Aviation’, liquid fuels / NOx, CO, NMVOC and SO2Sector EnergyCategory 1A3 TransportSource / Fuel / Gas 1A3ai ‘International Aviation’, liquid fuels / NOx, CO, NMVOC and SOx
Key Category? Not applicable for pollutant emissions.
Category Description / Defini-tion
NOx, CO, NMVOC and SO2 emissions from source category 1A3ai ‘International Aviation’ are reported under ‘Memo Items’ (International Bunkers) and include emissions from flights that depart in one country and arrive in a different country. Include take-offs and landings for these flight stages. Emissions from international military aviation can be included as a separate subcategory of international aviation provided that the same definitional distinction is applied and data are available to support the definition.

Chapter 2: Methods and Data Documentation
2 - 32
Country Detail
GHG emissions from 1A3ai ‘International Aviation’ comes from the combustion of jet fuel used in the international air transport (in case of aircrafts which operate international flights, emissions are allocated to the country in which the aircraft was fueled). In the Republic of Moldova, international aviation includes jet propelled aircrafts using jet kerosene. The aviation fleet in the RM includes different types of aircrafts produced in foreign countries and CIS countries: large commercial jet aircrafts: A-319, 320, 321, 300-600; Boeing-707, 737, 739, 747, 757; EMB-120, 135, 145, 170, 190; Fokker 70, 100; MD-81, 82, 83; RJ-85, 100; CRJ, Rombac-561 Rc; turbo-propelled aircrafts for short and medium distances: Saab-340, 2000; L410, DHC8, ATR-42; light turbo-propelled aircrafts: X-32 Becas; small jet aircrafts: Falcon-2000EX, Learjet-35. The aircrafts produced in the CIS countries include: TU-134, 154; AN-2, 12, 24, 26, 28, 32, 72, 74; IL-18, 76; YAK-18, 40, 42; and helicopters Mi-8, 17, 26; Ka-26, 32. Operation of aircrafts is divided into two phases: (i) Landing/Take-Off (LTO) occurring at altitudes lower than 914 meters and (ii) Cruise (C), occurring at altitudes higher than 914 meters. less than 30 per cent of the total emissions are covered by water vapors and as little as circa 1 per cent by other gases (NOx, CO, NMVOC, SO2).
Equation(Describe variables for method used)
The basic equations used to estimate emissions are as follows: Total Emissions = LTO Emissions + Cruise EmissionsLTO Emissions = Number of LTOs • Emission Factor LTO LTO Fuel Consumption = Number of LTOs • Fuel Consumption per LTOCruise Emissions = (Total Fuel Consumption – LTO Fuel Consumption) • Emission Factor Cruise
Tier 2b method
Reference 2006 IPCC Guidelines for National Greenhouse Gas Inventories, Chapter 3: Mobile Combustion, Equations 3.6.2.-3.6.5, p. 3.59.National Inventory Report: 1990-2016. Greenhouse Gas Sources and Sinks in the Republic of Moldova (2018).
Describe How and Why this Method Was Chosen
Due to the availability specific data for this source, the Tier 2 methodology has been used. The number of aircraft departures are available for the period 1995-2016. The results for 1990-1994 were restored using the partial overlapping method, while for 1995-2016 – by using a Tier 2b approach available in the 2006 IPCC Guidelines.
Type and source of activity dataThe number of aircraft departures (units) and Amount of fuel consumption (thousand tons): Civil Aeronautical Authority of the RM through Official Letters No. 3978 dated 02.10.2006 and No. 1328 dated 13.09.2011; No. 474 dated 13.02.2014 and No. 366 dated 02.03.2015 and No.1156 dated 27.05.2016 and No. 4040 dated 28.12.2017. National Inventory Report: 1990-2016. Greenhouse Gas Sources and Sinks in the Republic of Moldova (2018), Section 3.8.2, Tables 3-190, 3-191 and 3-192.
Type and source of EF and OFDefault EFs for CO, NMVOC and SO2 available in the 2006 IPCC Guidelines: representative aircrafts according to the 2006 IPCC Guidelines, Vol. 2, Ch. 3, Tab. 3.6.3, 3.6.9. p. 3.63 and p.3.70. Emission Fac-tors for representative aircrafts according to the 2006 IPCC Guidelines, Vol. 2, Ch. 3, Tab. 3.6.3, 3.6.9. p. 2.63 and p. 3.70. National Inventory Report: 1990-2016. Greenhouse Gas Sources and Sinks in the Republic of Moldova (2018), Tables 3-187 and 3-188.
Uncertainty of AD and source ±5%, expert judgement (see also 2006 IPCC Guidelines for National Greenhouse Gas Inventories, Chapter 3: Mobile Combustion, Section 3.6.1.7 ‘Uncertainty Assessment’).
Uncertainty of EF and source
EMEP/EEA air pollutant emission inventory guidebook, July 2017, 1.A.3.a, 1.A.5.b Aviation, p. 36, Section 4.4 ‘Uncertainty Assessment’. The uncertainties related to the estimated aircraft emissions are closely associated with the emission factors assigned to the estimations. The CO2 emissions (and fuel use) are generally determined with a higher accuracy than the other pollutants. According to Section 4.4.1 ‘Tier 1 approach’, the accuracy of the distribution of fuel between domestic and international will depend on the national conditions. The use of ‘representative’ emission factors may contribute significantly to the uncertainty. In terms of the factors relating to the LTO activities, the accuracy is better than for CCD (because of the origin of the factors from which the average values are derived). It would be hard to calculate a quantitative uncertainty estimate. The uncertainty may however lie between 20 and 30% for LTO factors and 20 and 45% for the CCD factors. According to Section 4.4.2 ‘Tier 2 approach’ the accuracy of the distribution of fuel between domestic and international will depend on the national conditions. The uncertainties lie mainly in the origin of the emission factors. There is a high uncertainty associated with the CCD emission factors. According to Section 4.4.3 ‘Tier 3 approach’ the uncertainties lie in the emission factors for the engines. ICAO (1995) estimated that the uncertainties of the different LTO factors are approximately 5–10%. For CCD, the uncertainties are assumed to be 15–40%.
Potential ImprovementsWithin the 1A3ai ‘International Aviation’ source category (reported under the memo Items (International Bunkers), potential improvements could be achieved once a higher methodology is used (for example, a Tier 3 approach available in the EMEP/EEA Air Pollutant Emission Inventory Guidebook (July 2017), which considers the real values of emissions for each type of aircraft depending on the flight distance. Also, it could be used the emission calculator available in the updated version of the EMEP/EEA Air Pollutant Emission Inventory Guidebook (July 2017).
Table 2.1.3.4: Information on source category 1A3aii ‘Domestic aviation’, liquid fuels / CO2Sector EnergyCategory 1A3 TransportSource / Fuel / Gas 1A3aii ‘Domestic aviation’, liquid fuels / CO2
Key Category? No
Category Description / Defini-tion
Emissions from domestic civil aviation, including take-offs and landings. Comprises civil commercial use of airplanes, including: scheduled and charter traffic for passengers and freight, air taxiing, and general aviation. The international/domestic split should be determined on the basis of departure and landing locations for each flight stage and not by the nationality of the airline. Exclude use of fuel at airports for ground transport which is reported under 1A3e Other Transportation. Also exclude fuel for stationary combustion at airports; report this information under the appropriate stationary combustion category.
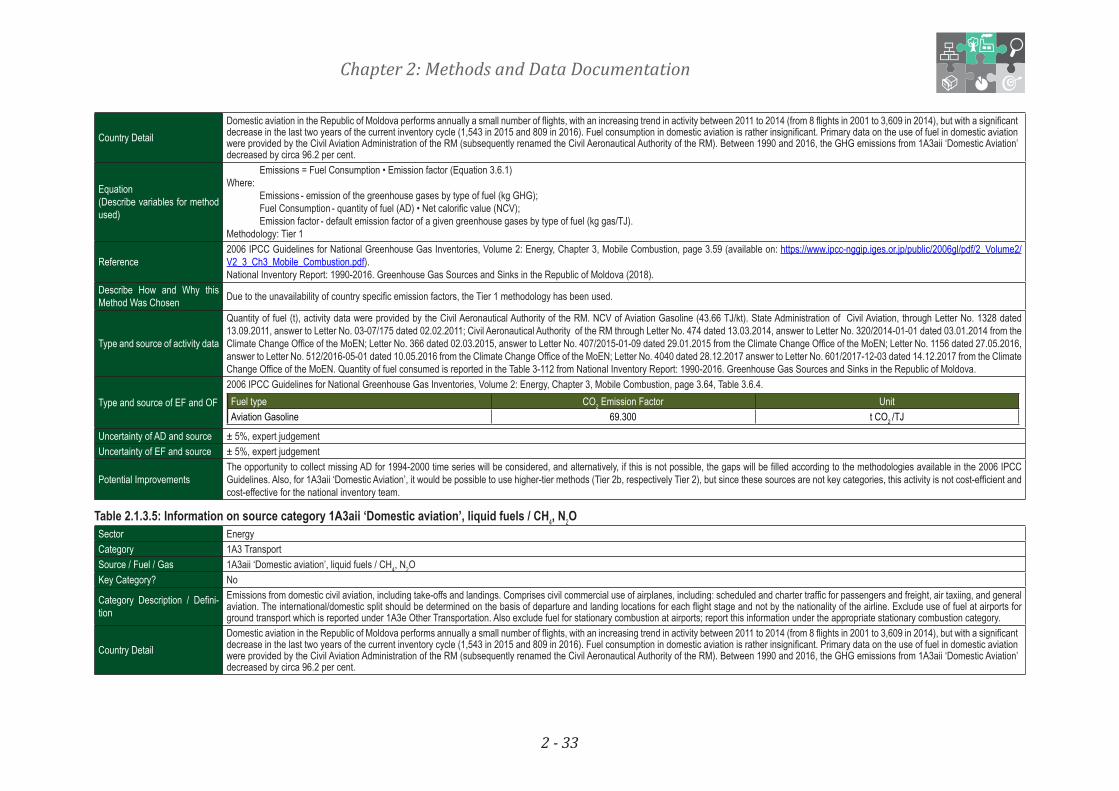
Chapter 2: Methods and Data Documentation
2 - 33
Country Detail Domestic aviation in the Republic of Moldova performs annually a small number of flights, with an increasing trend in activity between 2011 to 2014 (from 8 flights in 2001 to 3,609 in 2014), but with a significant decrease in the last two years of the current inventory cycle (1,543 in 2015 and 809 in 2016). Fuel consumption in domestic aviation is rather insignificant. Primary data on the use of fuel in domestic aviation were provided by the Civil Aviation Administration of the RM (subsequently renamed the Civil Aeronautical Authority of the RM). Between 1990 and 2016, the GHG emissions from 1A3aii ‘Domestic Aviation’ decreased by circa 96.2 per cent.
Equation(Describe variables for method used)
Emissions = Fuel Consumption • Emission factor (Equation 3.6.1)Where:
Emissions - emission of the greenhouse gases by type of fuel (kg GHG);Fuel Consumption - quantity of fuel (AD) • Net calorific value (NCV);Emission factor - default emission factor of a given greenhouse gases by type of fuel (kg gas/TJ).
Methodology: Tier 1
Reference2006 IPCC Guidelines for National Greenhouse Gas Inventories, Volume 2: Energy, Chapter 3, Mobile Combustion, page 3.59 (available on: https://www.ipcc-nggip.iges.or.jp/public/2006gl/pdf/2_Volume2/V2_3_Ch3_Mobile_Combustion.pdf). National Inventory Report: 1990-2016. Greenhouse Gas Sources and Sinks in the Republic of Moldova (2018).
Describe How and Why this Method Was Chosen Due to the unavailability of country specific emission factors, the Tier 1 methodology has been used.
Type and source of activity data
Quantity of fuel (t), activity data were provided by the Civil Aeronautical Authority of the RM. NCV of Aviation Gasoline (43.66 TJ/kt). State Administration of Civil Aviation, through Letter No. 1328 dated 13.09.2011, answer to Letter No. 03-07/175 dated 02.02.2011; Civil Aeronautical Authority of the RM through Letter No. 474 dated 13.03.2014, answer to Letter No. 320/2014-01-01 dated 03.01.2014 from the Climate Change Office of the MoEN; Letter No. 366 dated 02.03.2015, answer to Letter No. 407/2015-01-09 dated 29.01.2015 from the Climate Change Office of the MoEN; Letter No. 1156 dated 27.05.2016, answer to Letter No. 512/2016-05-01 dated 10.05.2016 from the Climate Change Office of the MoEN; Letter No. 4040 dated 28.12.2017 answer to Letter No. 601/2017-12-03 dated 14.12.2017 from the Climate Change Office of the MoEN. Quantity of fuel consumed is reported in the Table 3-112 from National Inventory Report: 1990-2016. Greenhouse Gas Sources and Sinks in the Republic of Moldova.
Type and source of EF and OF2006 IPCC Guidelines for National Greenhouse Gas Inventories, Volume 2: Energy, Chapter 3, Mobile Combustion, page 3.64, Table 3.6.4.Fuel type CO2 Emission Factor UnitAviation Gasoline 69.300 t CO2 /TJ
Uncertainty of AD and source ± 5%, expert judgementUncertainty of EF and source ± 5%, expert judgement
Potential ImprovementsThe opportunity to collect missing AD for 1994-2000 time series will be considered, and alternatively, if this is not possible, the gaps will be filled according to the methodologies available in the 2006 IPCC Guidelines. Also, for 1A3aii ‘Domestic Aviation’, it would be possible to use higher-tier methods (Tier 2b, respectively Tier 2), but since these sources are not key categories, this activity is not cost-efficient and cost-effective for the national inventory team.
Table 2.1.3.5: Information on source category 1A3aii ‘Domestic aviation’, liquid fuels / CH4, N2OSector EnergyCategory 1A3 TransportSource / Fuel / Gas 1A3aii ‘Domestic aviation’, liquid fuels / CH4, N2OKey Category? No
Category Description / Defini-tion
Emissions from domestic civil aviation, including take-offs and landings. Comprises civil commercial use of airplanes, including: scheduled and charter traffic for passengers and freight, air taxiing, and general aviation. The international/domestic split should be determined on the basis of departure and landing locations for each flight stage and not by the nationality of the airline. Exclude use of fuel at airports for ground transport which is reported under 1A3e Other Transportation. Also exclude fuel for stationary combustion at airports; report this information under the appropriate stationary combustion category.
Country Detail Domestic aviation in the Republic of Moldova performs annually a small number of flights, with an increasing trend in activity between 2011 to 2014 (from 8 flights in 2001 to 3,609 in 2014), but with a significant decrease in the last two years of the current inventory cycle (1,543 in 2015 and 809 in 2016). Fuel consumption in domestic aviation is rather insignificant. Primary data on the use of fuel in domestic aviation were provided by the Civil Aviation Administration of the RM (subsequently renamed the Civil Aeronautical Authority of the RM). Between 1990 and 2016, the GHG emissions from 1A3aii ‘Domestic Aviation’ decreased by circa 96.2 per cent.

Chapter 2: Methods and Data Documentation
2 - 34
Equation(Describe variables for method used)
Emissions = Fuel Consumption • Emission factor (Equation 3.6.1)Where:
Emissions - emission of the greenhouse gases by type of fuel (kg GHG);Fuel Consumption - quantity of fuel (AD) • Net calorific value (NCV);Emission factor - default emission factor of a given greenhouse gases by type of fuel (kg gas/TJ).
Methodology: Tier 1
Reference2006 IPCC Guidelines for National Greenhouse Gas Inventories, Volume 2: Energy, Chapter 3, Mobile Combustion, page 3.59 (available on: https://www.ipcc-nggip.iges.or.jp/public/2006gl/pdf/2_Volume2/V2_3_Ch3_Mobile_Combustion.pdf). National Inventory Report: 1990-2016. Greenhouse Gas Sources and Sinks in the Republic of Moldova (2018).
Describe How and Why this Method Was Chosen Due to the unavailability of country specific emission factors, the Tier 1 methodology has been used.
Type and source of activity data
Quantity of fuel (t), activity data were provided by the Civil Aeronautical Authority of the RM. NCV of Aviation Gasoline (43.66 TJ/kt). State Administration of Civil Aviation, through Letter No. 1328 dated 13.09.2011, answer to Letter No. 03-07/175 dated 02.02.2011; Civil Aeronautical Authority of the RM through Letter No. 474 dated 13.03.2014, answer to Letter No. 320/2014-01-01 dated 03.01.2014 from the Climate Change Office of the MoEN; Letter No. 366 dated 02.03.2015, answer to Letter No. 407/2015-01-09 dated 29.01.2015 from the Climate Change Office of the MoEN; Letter No. 1156 dated 27.05.2016, answer to Letter No. 512/2016-05-01 dated 10.05.2016 from the Climate Change Office of the MoEN; Letter No. 4040 dated 28.12.2017 answer to Letter No. 601/2017-12-03 dated 14.12.2017 from the Climate Change Office of the MoEN. Quantity of fuel consumed is reported in the Table 3-112 from National Inventory Report: 1990-2016. Greenhouse Gas Sources and Sinks in the Republic of Moldova.
Type and source of EF and OF
2006 IPCC Guidelines for National Greenhouse Gas Inventories, Volume 2: Energy, Chapter 3, Mobile Combustion, page 3.64, Table 3.6.5.
Fuel typeCH4 Emission Factor N2O Emission Factor
kg/TJAviation Gasoline 0.5 2.0
Uncertainty of AD and source ± 5%, expert judgementUncertainty of EF and source ± 50%, expert judgement
Potential ImprovementsThe opportunity to collect missing AD for 1994-2000 time series will be considered, and alternatively, if this is not possible, the gaps will be filled according to the methodologies available in the 2006 IPCC Guidelines. Also, for 1A3aii ‘Domestic Aviation’, it would be possible to use higher-tier methods (Tier 2b, respectively Tier 2), but since these sources are not key categories, this activity is not cost-efficient and cost-effective for the national inventory team.
Table 2.1.3.6: Information on source category 1A3aii ‘Domestic aviation’, liquid fuels / NOx, CO, NMVOC and SO2Sector EnergyCategory 1A3 TransportSource / Fuel / Gas 1A3aii ‘Domestic aviation’, liquid fuels / NOx, CO, NMVOC and SO2
Key Category? Not applicable for pollutant emissions.
Category Description / Defini-tion
Emissions from domestic civil aviation, including take-offs and landings. Comprises civil commercial use of airplanes, including: scheduled and charter traffic for passengers and freight, air taxiing, and general aviation. The international/domestic split should be determined on the basis of departure and landing locations for each flight stage and not by the nationality of the airline. Exclude use of fuel at airports for ground transport which is reported under 1A3e Other Transportation. Also exclude fuel for stationary combustion at airports; report this information under the appropriate stationary combustion category.
Country Detail Domestic aviation in the Republic of Moldova performs annually a small number of flights, with an increasing trend in activity between 2011 to 2014 (from 8 flights in 2001 to 3,609 in 2014), but with a significant decrease in the last two years of the current inventory cycle (1,543 in 2015 and 809 in 2016). Fuel consumption in domestic aviation is rather insignificant. Primary data on the use of fuel in domestic aviation were provided by the Civil Aviation Administration of the RM (subsequently renamed the Civil Aeronautical Authority of the RM). Between 1990 and 2016, the GHG emissions from 1A3aii ‘Domestic Aviation’ decreased by circa 96.2 per cent.

Chapter 2: Methods and Data Documentation
2 - 35
Equation(Describe variables for method used)
E pollutant = AR fuel consumption • EF pollutant (Equation 1)Where:
E pollutant - the annual emission of pollutant;AR fuel consumption - the activity rate by fuel consumption;EF pollutant - the emission factor of pollutant.
Methodology: Tier 1
Reference EMEP/EEA air pollutant emission inventory guidebook, July 2017, 1.A.3.a, 1.A.5.b Aviation, page 20 (available on: https://www.eea.europa.eu/publications/emep-eea-guidebook-2016/part-b-sectoral-guidance-chapters/1-energy/1-a-combustion/1-a-3-a-aviation-2016/view). National Inventory Report: 1990-2016. Greenhouse Gas Sources and Sinks in the Republic of Moldova (2018).
Describe How and Why this Method Was Chosen Due to the unavailability of country specific emission factors, the Tier 1 methodology has been used.
Type and source of activity data
Quantity of fuel (t), activity data were provided by the Civil Aeronautical Authority of the RM. NCV of Aviation Gasoline (43.66 TJ/kt). State Administration of Civil Aviation, through Letter No. 1328 dated 13.09.2011, answer to Letter No. 03-07/175 dated 02.02.2011; Civil Aeronautical Authority of the RM through Letter No. 474 dated 13.03.2014, answer to Letter No. 320/2014-01-01 dated 03.01.2014 from the Climate Change Office of the MoEN; Letter No. 366 dated 02.03.2015, answer to Letter No. 407/2015-01-09 dated 29.01.2015 from the Climate Change Office of the MoEN; Letter No. 1156 dated 27.05.2016, answer to Letter No. 512/2016-05-01 dated 10.05.2016 from the Climate Change Office of the MoEN; Letter No. 4040 dated 28.12.2017 answer to Letter No. 601/2017-12-03 dated 14.12.2017 from the Climate Change Office of the MoEN. Quantity of fuel consumed is reported in the Table 3-112 from National Inventory Report: 1990-2016. Greenhouse Gas Sources and Sinks in the Republic of Moldova.
Type and source of EF and OF
EMEP/EEA air pollutant emission inventory guidebook, July 2017. 1. A.3.a, 1.A.5.b Aviation, page 21, Table 3.3.
Fuel typeNOx CO NMVOC SO2
kg/ton fuelAviation Gasoline 4 (2-8) 1200 (600-2400) 19 (9.5-38) 1 (0.5-2)
Uncertainty of AD and source ± 5%, expert judgementUncertainty of EF and source See the 95% confidence interval in the table above (in the brackets, lower-upper).
Potential ImprovementsThe opportunity to collect missing AD for 1994-2000 time series will be considered, and alternatively, if this is not possible, the gaps will be filled according to the methodologies available in the 2006 IPCC Guidelines. Also, for 1A3aii ‘Domestic Aviation’, it would be possible to use higher-tier methods (Tier 2b, respectively Tier 2), but since these sources are not key categories, this activity is not cost-efficient and cost-effective for the national inventory team.
Table 2.1.3.7: Information on source category 1A3b Road Transportation, liquid fuels / CO2Sector EnergyCategory 1A3 TransportSource / Fuel / Gas 1A3b Road transportation, liquid fuels / CO2
Key Category? Tier 1: Yes: 1990 (L), 2016 (L, T); Tier 2: Yes: 1990 (L), 2016 (L, T) (1A3b Road transportation – aggregated for all types of fuels)Category Description / Defini-tion All combustion and evaporative emissions arising from fuel use in road vehicles, including the use of agricultural vehicles on paved roads.
Country Detail
The park of road transport units in the RM is growing. The largest share in the total structure is represented by cars. For the RBDR, the AD associated with diesel oil and gasoline consumption within 1A3b ‘Road Transportation’ was collected from the Energy Balances of the RM (see Chapter S.2.1. ‘Consumed directly as fuel or energy’, in columns: ‘for transport operation’, ‘for agriculture’ and ‘sold to the population’). As the AD are incomplete, in order to fill the existing gaps associated with fuel consumption on the LBDR, information regarding diesel oil consumption were generated indirectly by considering the specific consumption per capita (it was determined fuel consumption per capita for the population on the RBDR between 1993 and 2016 and further this was extended to the population on the LBDR). During the current inventory cycle, GHG emissions from 1A3b ‘Road Transportation’ were estimated applying a Tier 3 approach (the COPERT 4.9 model program was tested), but this change was possible only for 2014-2016 time series. Between 1990 and 2016, the GHG emissions from 1A3b ‘Road Transportation’ decreased in the RM by circa 40.8 per cent.

Chapter 2: Methods and Data Documentation
2 - 36
Equation(Describe variables for method used)
Emissions = ∑a(Fuela • EFa)(Equation 3.2.1)Where:
Emissions - emission of CO2 (kg);Fuel a - fuel sold (TJ);EF a - emission factor (kg gas/TJ). This is equal to the carbon content of the fuel multiplied by 44/12;a - type of fuel (e.g. petrol, diesel, natural gas, LPG, etc.).
Methodology: Tier 1
Reference 2006 IPCC Guidelines for National Greenhouse Gas Inventories, Volume 2: Energy, Chapter 3, Mobile Combustion, page 3.12 (available on: https://www.ipcc-nggip.iges.or.jp/public/2006gl/pdf/2_Volume2/V2_3_Ch3_Mobile_Combustion.pdf). National Inventory Report: 1990-2016. Greenhouse Gas Sources and Sinks in the Republic of Moldova (2018).
Describe How and Why this Method Was Chosen Due to the importance of this source and availability of detailed data, the Tier 3 methodology has been tested.
Type and source of activity data Quantity of fuel (TJ) – activity data from Energy Balances of the Republic of Moldova. Quantity of fuel consumed is reported in the Tables 3-114 and 3-115 from National Inventory Report: 1990-2016. Green-house Gas Sources and Sinks in the Republic of Moldova.
Type and source of EF and OF
2006 IPCC Guidelines for National Greenhouse Gas Inventories, Volume 2: Energy, Chapter 3, Mobile Combustion, page 3.16, Table 3.2.1.Fuel type CO2 Emission Factor UnitGasoline 69.300 t CO2 /TJGas/Diesel Oil 74.100 t CO2 /TJ
Uncertainty of AD and source ± 5%, expert judgementUncertainty of EF and source ± 5%, expert judgement
Potential Improvements For 1A3b ‘Road Transportation’, potential improvements could be the result of collecting additional AD for 1990-2013 time series, required to use the COPERT 4.9 model. Due to their absence, for now it was possible to run the program only for 2014-2016 years.
Table 2.1.3.8: Information on source category 1A3b Road transportation, liquid fuels / CH4, N2OSector EnergyCategory 1A3 TransportSource / Fuel / Gas 1A3b Road transportation, liquid fuels / CH4, N2OKey Category? NoCategory Description / Defini-tion All combustion and evaporative emissions arising from fuel use in road vehicles, including the use of agricultural vehicles on paved roads.
Country Detail
The park of road transport units in the RM is growing. The largest share in the total structure is represented by cars For the RBDR, the AD associated with diesel oil and gasoline consumption within 1A3b ‘Road Transportation’ was collected from the Energy Balances of the RM (see Chapter S.2.1. ‘Consumed directly as fuel or energy’, in columns: ‘for transport operation’, ‘for agriculture’ and ‘sold to the population’). As the AD are incomplete, in order to fill the existing gaps associated with fuel consumption on the LBDR, information regarding diesel oil consumption were generated indirectly by considering the specific consumption per capita (it was determined fuel consumption per capita for the population on the RBDR between 1993 and 2016 and further this was extended to the population on the LBDR). During the current inventory cycle, GHG emissions from 1A3b ‘Road Transportation’ were estimated applying a Tier 3 approach (the COPERT 4.9 model program was tested), but this change was possible only for 2014-2016 time series. Between 1990 and 2016, the GHG emissions from 1A3b ‘Road Transportation’ decreased in the RM by circa 40.8 per cent.
Equation(Describe variables for method used)
Emission = ∑a(Fuela • EFa) (Equation 3.2.3)Where:
Emissions - emission in kg;Fuel a - fuel consumed, (TJ) (as represented by fuel sold);EF a - emission factor (kg gas/TJ);a - type of fuel (e.g. petrol, diesel, natural gas, LPG).
Methodology: Tier 1
(Equation 3.2.1)

Chapter 2: Methods and Data Documentation
2 - 37
Reference2006 IPCC Guidelines for National Greenhouse Gas Inventories, Volume 2: Energy, Chapter 3, Mobile Combustion, page 3.13 (available on: https://www.ipcc-nggip.iges.or.jp/public/2006gl/pdf/2_Volume2/V2_3_Ch3_Mobile_Combustion.pdf). National Inventory Report: 1990-2016. Greenhouse Gas Sources and Sinks in the Republic of Moldova (2018).
Describe How and Why this Method Was Chosen Due to the importance of this source and availability of detailed data, the Tier 3 methodology has been tested.
Type and source of activity data Quantity of fuel (TJ) – activity data from Energy Balances of the Republic of Moldova. Quantity of fuel consumed is reported in the Tables 3-114 and 3-115 from National Inventory Report: 1990-2016. Green-house Gas Sources and Sinks in the Republic of Moldova.
Type and source of EF and OF
2006 IPCC Guidelines for National Greenhouse Gas Inventories, Volume 2: Energy, Chapter 3, Mobile Combustion, page 3.21, Table 3.2.2.
Fuel typeCH4 N2O
kg/TJGasoline 33.0 3.2 Gas/Diesel Oil 3.9 3.9
Uncertainty of AD and source ± 5%, expert judgementUncertainty of EF and source ± 50%, expert judgement
Potential Improvements For 1A3b ‘Road Transportation’, potential improvements could be the result of collecting additional AD for 1990-2013 time series, required to use the COPERT 4.9 model. Due to their absence, for now it was possible to run the program only for 2014-2016 years.
Table 2.1.3.9: Information on source category 1A3b Road transportation, liquid fuels / NOx, CO, NMVOC and SO2Sector EnergyCategory 1A3 TransportSource / Fuel / Gas 1A3b Road transportation, liquid fuels / NOx, CO, NMVOC and SO2
Key Category? Not applicable for pollutant emissions.Category Description / Defini-tion All combustion and evaporative emissions arising from fuel use in road vehicles, including the use of agricultural vehicles on paved roads.
Country Detail
The park of road transport units in the RM is growing. The largest share in the total structure is represented by cars For the RBDR, the AD associated with diesel oil and gasoline consumption within 1A3b ‘Road Transportation’ was collected from the Energy Balances of the RM (see Chapter S.2.1. ‘Consumed directly as fuel or energy’, in columns: ‘for transport operation’, ‘for agriculture’ and ‘sold to the population’). As the AD are incomplete, in order to fill the existing gaps associated with fuel consumption on the LBDR, information regarding diesel oil consumption were generated indirectly by considering the specific consumption per capita (it was determined fuel consumption per capita for the population on the RBDR between 1993 and 2016 and further this was extended to the population on the LBDR). During the current inventory cycle, GHG emissions from 1A3b ‘Road Transportation’ were estimated applying a Tier 3 approach (the COPERT 4.9 model program was tested), but this change was possible only for 2014-2016 time series. Between 1990 and 2016, the GHG emissions from 1A3b ‘Road Transportation’ decreased in the RM by circa 40.8 per cent.
Equation(Describe variables for method used)
Ei = ∑j(∑m(FCj,m•EFi,j,m)) (Equation 1)Where:
E i - emission of pollutant i (g);FCj,m - fuel consumption of vehicle category j using fuel m (kg);EFi,j,m - fuel consumption - specific emission factor of pollutant i for vehicle category j and fuel m(g/kg).
Methodology: Tier 1
Reference EMEP/EEA air pollutant emission inventory guidebook, June 2017. 1A3.b.i-iv Road transport, page 21. National Inventory Report: 1990-2016. Greenhouse Gas Sources and Sinks in the Republic of Moldova (2018).
Describe How and Why this Method Was Chosen Due to the importance of this source and availability of detailed data, the Tier 3 methodology has been tested.
Type and source of activity data Quantity of fuel (TJ) and (t) – activity data from Energy Balances of the Republic of Moldova. Quantity of fuel consumed is reported in the Tables 3-114 and 3-115 from National Inventory Report: 1990-2016. Greenhouse Gas Sources and Sinks in the Republic of Moldova.
EFi,j,m)) (Equation 1)

Chapter 2: Methods and Data Documentation
2 - 38
Type and source of EF and OF
EMEP/EEA air pollutant emission inventory guidebook, June 2017. 1A3.b.i-iv Road transport, pages 22-23, Tables 3.5 and 3.6.
Fuel typeNOx CO NMVOC SO2
g/kg fuel kg/TJ
Gasoline 8.73 (4.48-29.89)
84.70 (49.0-269.5)
10.05 (5.55-34.42)
45.75 (depend on Sulphur content in fuel)
Gas/Diesel Oil 12.96 (11.20-13.88)
3.33 (2.05-8.19)
0.70 (0.41-1.88)
141.01 (depend on Sulphur content in fuel)
Note: For SO2 – Revised 1996 IPCC GL and software was also used. Uncertainty of AD and source ± 5%, expert judgementUncertainty of EF and source See the 95% confidence interval in the table above (in the brackets, lower-upper).
Potential Improvements For 1A3b ‘Road Transportation’, potential improvements could be the result of collecting additional AD for 1990-2013 time series, required to use the COPERT 4.9 model. Due to their absence, for now it was possible to run the program only for 2014-2016 years.
Table 2.1.3.10: Information on source category 1A3b Road Transportation, gaseous fuels / CO2
Sector EnergyCategory 1A3 TransportSource / Fuel / Gas 1A3b Road transportation, gaseous fuels / CO2
Key Category? Tier 1: Yes: 1990 (L), 2016 (L, T); Tier 2: Yes: 1990 (L), 2016 (L, T) (1A3b Road transportation – aggregated for all types of fuels)Category Description / Defini-tion All combustion and evaporative emissions arising from fuel use in road vehicles, including the use of agricultural vehicles on paved roads.
Country Detail
The park of road transport units in the RM is growing. The largest share in the total structure is represented by cars. For the RBDR, the AD associated with diesel oil and gasoline consumption within 1A3b ‘Road Transportation’ was collected from the Energy Balances of the RM (see Chapter S.2.1. ‘Consumed directly as fuel or energy’, in columns: ‘for transport operation’, ‘for agriculture’ and ‘sold to the population’). As the AD are incomplete, in order to fill the existing gaps associated with fuel consumption on the LBDR, information regarding diesel oil consumption were generated indirectly by considering the specific consumption per capita (it was determined fuel consumption per capita for the population on the RBDR between 1993 and 2016 and further this was extended to the population on the LBDR). During the current inventory cycle, GHG emissions from 1A3b ‘Road Transportation’ were estimated applying a Tier 3 approach (the COPERT 4.9 model program was tested), but this change was possible only for 2014-2016 time series. Between 1990 and 2016, the GHG emissions from 1A3b ‘Road Transportation’ decreased in the RM by circa 40.8 per cent.
Equation(Describe variables for method used)
Emissions = ∑a(Fuela • EFa) (Equation 3.2.1)Where:
Emissions - emission of CO2 (kg);Fuel a - fuel sold (TJ);EF a - emission factor (kg gas/TJ). This is equal to the carbon content of the fuel multiplied by 44/12;a - type of fuel (e.g. petrol, diesel, natural gas, LPG etc).
Methodology: Tier 1
Reference2006 IPCC Guidelines for National Greenhouse Gas Inventories, Volume 2: Energy, Chapter 3, Mobile Combustion, page 3.12 (available on: https://www.ipcc-nggip.iges.or.jp/public/2006gl/pdf/2_Volume2/V2_3_Ch3_Mobile_Combustion.pdf). National Inventory Report: 1990-2016. Greenhouse Gas Sources and Sinks in the Republic of Moldova (2018).
Describe How and Why this Method Was Chosen Due to the importance of this source and availability of detailed data, the Tier 3 methodology has been tested.
Type and source of activity data
Quantity of fuel (TJ) – activity data from Energy Balances of the Republic of Moldova and Quantity of fuel (m3) – NCV of natural gas country specific data pertaining to annual average net caloric, which are provided by J.S.C. “Moldovagaz”, through Letter No. 604 dated 01.04.1999 (for 1990-1998), No. 02-541 dated 28.05.2001 (for 1999-2000), No. 02-156 dated 06.02.2004 (for 2001-2002), No. 06-1253 dated 27.09.2006 (for 2003-2005) and No. 02/1-476 dated 23.02.2011 (for 2006-2010). Quantity of fuel consumed is reported in the Table 3-116 from National Inventory Report: 1990-2016. Greenhouse Gas Sources and Sinks in the Republic of Moldova.

Chapter 2: Methods and Data Documentation
2 - 39
Type and source of EF and OF
2006 IPCC Guidelines for National Greenhouse Gas Inventories, Volume 2: Energy, Chapter 3, Mobile Combustion, page 3.16, Table 3.2.1.
Fuel type CO2 Emission Factor UnitNatural Gas 56.100 t CO2 /TJLiquefied Petroleum Gases 63.100 t CO2 /TJ
Uncertainty of AD and source ± 5%, expert judgementUncertainty of EF and source ± 5%, expert judgement
Potential Improvements For 1A3b ‘Road Transportation’, potential improvements could be the result of collecting additional AD for 1990-2013 time series, required to use the COPERT 4.9 model. Due to their absence, for now it was possible to run the program only for 2014-2016 years.
Table 2.1.3.11: Information on source category 1A3b Road transportation, gaseous fuels / CH4, N2OSector EnergyCategory 1A3 TransportSource / Fuel / Gas 1A3b Road transportation, gaseous fuels / CH4, N2OKey Category? NoCategory Description / Defini-tion All combustion and evaporative emissions arising from fuel use in road vehicles, including the use of agricultural vehicles on paved roads.
Country Detail
The park of road transport units in the RM is growing. The largest share in the total structure is represented by cars. For the RBDR, the AD associated with diesel oil and gasoline consumption within 1A3b ‘Road Transportation’ was collected from the Energy Balances of the RM (see Chapter S.2.1. ‘Consumed directly as fuel or energy’, in columns: ‘for transport operation’, ‘for agriculture’ and ‘sold to the population’). As the AD are incomplete, in order to fill the existing gaps associated with fuel consumption on the LBDR, information regarding diesel oil consumption were generated indirectly by considering the specific consumption per capita (it was determined fuel consumption per capita for the population on the RBDR between 1993 and 2016 and further this was extended to the population on the LBDR). During the current inventory cycle, GHG emissions from 1A3b ‘Road Transportation’ were estimated applying a Tier 3 approach (the COPERT 4.9 model program was tested), but this change was possible only for 2014-2016 time series. Between 1990 and 2016, the GHG emissions from 1A3b ‘Road Transportation’ decreased in the RM by circa 40.8 per cent.
Equation(Describe variables for method used)
Emission = ∑a(Fuela• EFa) (Equation 3.2.3)Where:
Emissions - emission in kg;Fuel a - fuel consumed, (TJ) (as represented by fuel sold);EF a - emission factor (kg gas/TJ);a - type of fuel (e.g. petrol, diesel, natural gas, LPG).
Methodology: Tier 1
Reference2006 IPCC Guidelines for National Greenhouse Gas Inventories, Volume 2: Energy, Chapter 3, Mobile Combustion, page 3.13 (available on: https://www.ipcc-nggip.iges.or.jp/public/2006gl/pdf/2_Volume2/V2_3_Ch3_Mobile_Combustion.pdf). National Inventory Report: 1990-2016. Greenhouse Gas Sources and Sinks in the Republic of Moldova (2018).
Describe How and Why this Method Was Chosen Due to the importance of this source and availability of detailed data, the Tier 3 methodology has been tested.
Type and source of activity data
Quantity of fuel (TJ) – activity data from Energy Balances of the Republic of Moldova and Quantity of fuel (m3) – NCV of natural gas country specific data pertaining to annual average net caloric, which are provided by J.S.C. “Moldovagaz”, through Letter No. 604 dated 01.04.1999 (for 1990-1998), No. 02-541 dated 28.05.2001 (for 1999-2000), No. 02-156 dated 06.02.2004 (for 2001-2002), No. 06-1253 dated 27.09.2006 (for 2003-2005) and No. 02/1-476 dated 23.02.2011 (for 2006-2010). Quantity of fuel consumed is reported in the Table 3-116 from National Inventory Report: 1990-2016. Greenhouse Gas Sources and Sinks in the Republic of Moldova.

Chapter 2: Methods and Data Documentation
2 - 40
Type and source of EF and OF
2006 IPCC Guidelines for National Greenhouse Gas Inventories, Volume 2: Energy, Chapter 3, Mobile Combustion, page 3.21, Table 3.2.2.
Fuel typeCH4 N2O
kg/TJNatural Gas 90.0 3.0 Liquefied Petroleum Gases 62.0 0.2
Uncertainty of AD and source ± 5%, expert judgementUncertainty of EF and source ± 50%, expert judgement
Potential Improvements For 1A3b ‘Road Transportation’, potential improvements could be the result of collecting additional AD for 1990-2013 time series, required to use the COPERT 4.9 model. Due to their absence, for now it was possible to run the program only for 2014-2016 years.
Table 2.1.3.12: Information on source category 1A3b Road transportation, gaseous fuels / NOx, CO, NMVOC and SO2Sector EnergyCategory 1A3 TransportSource / Fuel / Gas 1A3b Road transportation, gaseous fuels / NOx, CO, NMVOC and SO2
Key Category? Not applicable for pollutant emissions.Category Description / Defini-tion All combustion and evaporative emissions arising from fuel use in road vehicles, including the use of agricultural vehicles on paved roads.
Country Detail
The park of road transport units in the RM is growing. The largest share in the total structure is represented by cars. For the RBDR, the AD associated with diesel oil and gasoline consumption within 1A3b ‘Road Transportation’ was collected from the Energy Balances of the RM (see Chapter S.2.1. ‘Consumed directly as fuel or energy’, in columns: ‘for transport operation’, ‘for agriculture’ and ‘sold to the population’). As the AD are incomplete, in order to fill the existing gaps associated with fuel consumption on the LBDR, information regarding diesel oil consumption were generated indirectly by considering the specific consumption per capita (it was determined fuel consumption per capita for the population on the RBDR between 1993 and 2016 and further this was extended to the population on the LBDR). During the current inventory cycle, GHG emissions from 1A3b ‘Road Transportation’ were estimated applying a Tier 3 approach (the COPERT 4.9 model program was tested), but this change was possible only for 2014-2016 time series. Between 1990 and 2016, the GHG emissions from 1A3b ‘Road Transportation’ decreased in the RM by circa 40.8 per cent.
Equation(Describe variables for method used)
Ei = ∑j(∑m(FCj,m• EFi,j,m)) (Equation 1)Where:
E i - emission of pollutant i (g);FCj,m - fuel consumption of vehicle category j using fuel m (kg);EFi,j,m - fuel consumption - specific emission factor of pollutant i for vehicle category j and fuel m(g/kg).
Methodology: Tier 1
Reference EMEP/EEA air pollutant emission inventory guidebook, June 2017. 1A3.b.i-iv Road transport, page 21. National Inventory Report: 1990-2016. Greenhouse Gas Sources and Sinks in the Republic of Moldova (2018).
Describe How and Why this Method Was Chosen Due to the importance of this source and availability of detailed data, the Tier 3 methodology has been tested.
Type and source of activity data
Quantity of fuel (TJ) – activity data from Energy Balances of the Republic of Moldova and Quantity of fuel (m3) – NCV of natural gas country specific data pertaining to annual average net caloric, which are provided by J.S.C. “Moldovagaz”, through Letter No. 604 dated 01.04.1999 (for 1990-1998), No. 02-541 dated 28.05.2001 (for 1999-2000), No. 02-156 dated 06.02.2004 (for 2001-2002), No. 06-1253 dated 27.09.2006 (for 2003-2005) and No. 02/1-476 dated 23.02.2011 (for 2006-2010). Quantity of fuel consumed is reported in the Table 3-116 from National Inventory Report: 1990-2016. Greenhouse Gas Sources and Sinks in the Republic of Moldova.

Chapter 2: Methods and Data Documentation
2 - 41
Type and source of EF and OF
EMEP/EEA air pollutant emission inventory guidebook, June 2017. 1A3.b.i-iv Road transport, page 22-23, Tables 3.5 and 3.6.
Fuel typeNOx CO NMVOC SO2
g/kg fuel kg/TJ
Natural Gas 13.00 (5.5 - 30)
5.70 (2.2-15)
0.26 (0.1-0.67) 0.00
Liquefied Petroleum Gases 15.20 (4.18-34.3)
84.70 (38.7-117)
13.64 (6.1-25.66)
130.26 (depend on Sulphur content in fuel)
Note: For SO2 – Revised 1996 IPCC GL and software was also used.Uncertainty of AD and source ± 5%, expert judgementUncertainty of EF and source See the 95% confidence interval in the table above (in the brackets, lower-upper).
Potential Improvements For 1A3b ‘Road Transportation’, potential improvements could be the result of collecting additional AD for 1990-2013 time series, required to use the COPERT 4.9 model. Due to their absence, for now it was possible to run the program only for 2014-2016 years.
Table 2.1.3.13: Information on source category 1A3c Railways, liquid fuels / CO2Sector EnergyCategory 1A3 TransportSource / Fuel / Gas 1A3c Railways, liquid fuels / CO2
Key Category? Tier 1: Yes: 1990 (L), 2016 (T)Category Description / Defini-tion Emissions from railway transport for both freight and passenger traffic routes.
Country Detail
The railway transport in the RM includes railways, locomotives, passenger and cargo trains, buildings and edifices. At the end of 2016 operated: diesel locomotives – 138, maneuvering locomotives – 67, diesel trains (sections) – 21, cargo wagons – 6741, passenger coaches – 346. Fuel consumption within railways transport decreases by every year due to reduced cargo and passenger transport activity, poor rail and main rolling stock conditions. For the LBDR, the AD associated with diesel oil consumption between 1993 and 2016 were calculated indirectly, based on specific consumption per capita (it was determined the diesel oil consumption average per capita for the population on the RBDR, and this was extended to the population on the LBDR). Between 1990 and 2016, the GHG emissions from 1A3c ‘Railways’ decreased in the RM by circa 87.8 per cent.
Equation(Describe variables for method used)
Emissions = ∑j(Fuelj • EFj) (Equation 3.4.1)Where:
Emissions - emission (kg);Fuel j - fuel type j consumed in (TJ);EF j - emission factor for fuel type j, (kg/TJ); j - fuel type.
Methodology: Tier 1
Reference2006 IPCC Guidelines for National Greenhouse Gas Inventories, Volume 2: Energy, Chapter 3, Mobile Combustion, page 3.41 (available on: https://www.ipcc-nggip.iges.or.jp/public/2006gl/pdf/2_Volume2/V2_3_Ch3_Mobile_Combustion.pdf). National Inventory Report: 1990-2016. Greenhouse Gas Sources and Sinks in the Republic of Moldova (2018).
Describe How and Why this Method Was Chosen The Tier 1 method has been chosen because the CS EFs are not available.
Type and source of activity data
Quantity of fuel (TJ) – activity data from Energy Balances of the Republic of Moldova. “Moldavian Railways” SOE through Letter dated 26 March 1999, No. 94/T; Letter dated 17 December 2003 No. H-4/993; Letter dated 19.09.2006 No. Nteh/338; Letter dated 28 February 2011 No. 54/Nteh; Letter dated 17.01.2014 No. H-4/147; Letter dated 02.03.2015 No.H-4/458; Letter dated 02.06.2016 No. H-4/1186 and Letter dated 02.01.2018 No. H-4/02. Quantity of fuel consumed is reported in the Tables 3-117, 3-118, 3-119 and 3-120 from National Inventory Report: 1990-2016. Greenhouse Gas Sources and Sinks in the Republic of Moldova.

Chapter 2: Methods and Data Documentation
2 - 42
Type and source of EF and OF
IPCC Default EF from 2006 IPCC Guidelines for National Greenhouse Gas Inventories, Volume 2: Energy, Chapter 3, Mobile Combustion, page 3.43, Table 3.4.1.
Fuel type CO2 Emission Factor UnitDiesel Oil 74.100 t CO2 / TJ
Uncertainty of AD and source ±5%, expert judgementUncertainty of EF and source ±5%, expert judgementPotential Improvements Potential improvements within the 1A3c ‘Railways’ could be possible once updating the available AD on real fuel consumption in the ATULBD for each source of emissions.
Table 2.1.3.14: Information on source category 1A3c Railways, liquid fuels / CH4, N2OSector EnergyCategory 1A3 TransportSource / Fuel / Gas 1A3c Railways, liquid fuels / CH4, N2OKey Category? NoCategory Description / Defini-tion Emissions from railway transport for both freight and passenger traffic routes.
Country Detail
The railway transport in the RM includes railways, locomotives, passenger and cargo trains, buildings and edifices. At the end of 2016 operated: diesel locomotives – 138, maneuvering locomotives – 67, diesel trains (sections) – 21, cargo wagons – 6741, passenger coaches – 346. Fuel consumption within railways transport decreases by every year due to reduced cargo and passenger transport activity, poor rail and main rolling stock conditions. For the LBDR, the AD associated with diesel oil consumption between 1993 and 2016 were calculated indirectly, based on specific consumption per capita (it was determined the diesel oil consumption average per capita for the population on the RBDR, and this was extended to the population on the LBDR). Between 1990 and 2016, the GHG emissions from 1A3c ‘Railways’ decreased in the RM by circa 87.8 per cent.
Equation(Describe variables for method used)
Emissions = ∑j(Fuelj • EFj) (Equation 3.4.1)Where:
Emissions - emission (kg);Fuel j - fuel type j consumed in (TJ);EF j - emission factor for fuel type j, (kg/TJ); j - fuel type.
Methodology: Tier 1
Reference2006 IPCC Guidelines for National Greenhouse Gas Inventories, Volume 2: Energy, Chapter 3, Mobile Combustion, page 3.41 (available on: https://www.ipcc-nggip.iges.or.jp/public/2006gl/pdf/2_Volume2/V2_3_Ch3_Mobile_Combustion.pdf).National Inventory Report: 1990-2016. Greenhouse Gas Sources and Sinks in the Republic of Moldova (2018).
Describe How and Why this Method Was Chosen The Tier 1 method has been chosen because this category is not a key source category and also because not all enhanced characterization data are available.
Type and source of activity data
Quantity of fuel (TJ) - activity data from Energy Balances of the Republic of Moldova. “Moldavian Railways” SOE through Letter dated 26 March 1999, No. 94/T; Letter dated 17 December 2003 No. H-4/993; Letter dated 19.09.2006 No. Nteh/338; Letter dated 28 February 2011 No. 54/Nteh; Letter dated 17.01.2014 No. H-4/147; Letter dated 02.03.2015 No.H-4/458; Letter dated 02.06.2016 No. H-4/1186 and Let-ter dated 02.01.2018 No. H-4/02. Quantity of fuel consumed is reported in the Tables 3-117, 3-118, 3-119 and 3-120 from National Inventory Report: 1990-2016. Greenhouse Gas Sources and Sinks in the Republic of Moldova.
Type and source of EF and OF
2006 IPCC Guidelines for National Greenhouse Gas Inventories, Volume 2: Energy, Chapter 3, Mobile Combustion, page 3.43, Table 3.4.1.
Fuel typeCH4 Emission Factor N2O Emission Factor
kg/TJDiesel Oil 4.15 28.6

Chapter 2: Methods and Data Documentation
2 - 43
Uncertainty of AD and source ±5%, expert judgementUncertainty of EF and source ±50%, expert judgementPotential Improvements Potential improvements within the 1A3c ‘Railways’ could be possible once updating the available AD on real fuel consumption in the ATULBD for each source of emissions.
Table 2.1.3.15: Information on source category 1A3c Railways, liquid fuels / NOx, CO, NMVOC and SO2
Sector EnergyCategory 1A3 TransportSource / Fuel / Gas 1A3c Railways, liquid fuels / NOx, CO, NMVOC and SO2
Key Category? Not applicable for pollutant emissionsCategory Description / Defini-tion Emissions from railway transport for both freight and passenger traffic routes.
Country Detail
The railway transport in the RM includes railways, locomotives, passenger and cargo trains, buildings and edifices. At the end of 2016 operated: diesel locomotives – 138, maneuvering locomotives – 67, diesel trains (sections) – 21, cargo wagons – 6741, passenger coaches – 346. Fuel consumption within railways transport decreases by every year due to reduced cargo and passenger transport activity, poor rail and main rolling stock conditions. For the LBDR, the AD associated with diesel oil consumption between 1993 and 2016 were calculated indirectly, based on specific consumption per capita (it was determined the diesel oil consumption average per capita for the population on the RBDR, and this was extended to the population on the LBDR). Between 1990 and 2016, the GHG emissions from 1A3c ‘Railways’ decreased in the RM by circa 87.8 per cent.
Equation(Describe variables for method used)
Ei = ∑mFCm • EFi,m) (Equation 1)Where:
Ei - emission of pollutant i for the period concerned in the inventory (kg or g);FCm - fuel consumption of fuel type m for the period and area considered (tons);EFi - emission factor of pollutant i for each unit of fuel type m used, (kg/tons); M - fuel type (diesel, gas oil).
Methodology: Tier 1
ReferenceEMEP/EEA air pollutant emission inventory guidebook 2016. 1.A.3.c Railways, page 6 (available on: https://www.eea.europa.eu/publications/emep-eea-guidebook-2016/part-b-sectoral-guidance-chapters/1-energy/1-a-combustion/1-a-3-c-railways-2016/view). National Inventory Report: 1990-2016. Greenhouse Gas Sources and Sinks in the Republic of Moldova (2018).
Describe How and Why this Method Was Chosen The Tier 1 method has been chosen because this category is not a key source category and also because not all enhanced characterization data are available.
Type and source of activity dataQuantity of fuel (TJ/tonne) - activity data from Energy Balances of the Republic of Moldova. “Moldavian Railways” SOE through Letter dated 26 March 1999, No. 94/T; Letter dated 17 December 2003 No. H-4/993; Letter dated 19.09.2006 No. Nteh/338; Letter dated 28 February 2011 No. 54/Nteh; Letter dated 17.01.2014 No. H-4/147; Letter dated 02.03.2015 No.H-4/458; Letter dated 02.06.2016 No. H-4/1186 and Letter dated 02.01.2018 No. H-4/02. Quantity of fuel consumed is reported in the Tables 3-117, 3-118, 3-119 and 3-120 from National Inventory Report: 1990-2016. Greenhouse Gas Sources and Sinks in the Republic of Moldova.
Type and source of EF and OF
EMEP/EEA air pollutant emission inventory guidebook 2016. 1. A.3.c Railways, page 8, Table 3.1.
Fuel typeNOx CO NMVOC SO2
kg/ton fuel kg/TJ
Diesel Oil 52.4(25-93)
10.7 (6-19)
4.65(2-8)
141.04 (depend on Sulphur content in fuel)
Note: For SO2 – Revised 1996 IPCC GL and software was also used.Uncertainty of AD and source ± 5%, expert judgementUncertainty of EF and source See the 95% confidence interval in the table above (in the brackets, lower-upper).Potential Improvements Potential improvements within the 1A3c ‘Railways’ could be possible once updating the available AD on real fuel consumption in the ATULBD for each source of emissions.

Chapter 2: Methods and Data Documentation
2 - 44
Table 2.1.3.16: Information on source category 1A3d Water-borne navigation, liquid fuels / CO2
Sector EnergyCategory 1A3 TransportSource / Fuel / Gas 1A3d Water-borne navigation, liquid fuels / CO2
Key Category? NoCategory Description / Defini-tion
Emissions from fuels used to propel water-borne vessels, including hovercraft and hydrofoils, but excluding fishing vessels. The international/domestic split should be determined on the basis of port of depar-ture and port of arrival, and not by the flag or nationality of the ship.
Country Detail Water-borne navigation in the RM includes a small number of ships, the fuel consumption being equally insignificant (for a great number of years, for example for: 1993-2003, 2005 and 2009, in the EBs of the RM, fuel consumption for water-borne navigation was indicated as zero). Under these circumstances, the main source of information on diesel oil consumption for water-borne navigation was the Ministry of Transport and Road Infrastructure. Between 1990 and 2016, the GHG emissions from 1A3d ‘Water-borne Navigation’ decreased in the RM by circa 98.9 per cent.
Equation(Describe variables for method used)
Emissions = ∑(Fuel Consumedad • Emission Factorab) (Equation 3.5.1)Where:
a - Fuel type (diesel, gasoline, LPG, bunker, etc.);b - Water-borne navigation type (i.e., ship or boat, and possibly engine type) (only at Tier 2 is the fuel used differentiated by type of vessel so b can be ignored at Tier 1).
Methodology: Tier 1
Reference2006 IPCC Guidelines for National Greenhouse Gas Inventories, Volume 2: Energy, Chapter 3, Mobile Combustion, page 3.47 (available on: https://www.ipcc-nggip.iges.or.jp/public/2006gl/pdf/2_Volume2/V2_3_Ch3_Mobile_Combustion.pdf). National Inventory Report: 1990-2016. Greenhouse Gas Sources and Sinks in the Republic of Moldova (2018).
Describe How and Why this Method Was Chosen Due to the unavailability of country specific emission factors, the Tier 1 methodology has been used.
Type and source of activity data
Quantity of fuel (t), activity data were provided by the Ministry of Transport and Road Infrastructure. NCV of Diesel Oil (42.54 TJ/kt). Official Letters from the Ministry of Transport and Communications dated 31.03.1999 No. 03-5-2/2-32; Ministry of Transport and Road Infrastructure dated 02.10.2006 No. 04-01-3/754; Ministry of Transport and Road Infrastructure dated 12.03.2011 No. 04/2-2-05; dated 21.01.2014 No. 03-02-5/52; dated 20.02.2015 No. 03-02-5/102; and dated 07.06.2016, No. 03-02-5/424; Energy Balances of the RM for 1990 and 1993-2016. Quantity of fuel consumed is reported in the Table 3-121 from National Inventory Report: 1990-2016. Greenhouse Gas Sources and Sinks in the Republic of Moldova.
Type and source of EF and OF2006 IPCC Guidelines for National Greenhouse Gas Inventories, Volume 2: Energy, Chapter 3, Mobile Combustion, page 3.50, Table 3.5.2.Fuel type CO2 Emission Factor UnitDiesel Oil 74.100 t CO2 /TJ
Uncertainty of AD and source ±5%, expert judgementUncertainty of EF and source ±5%, expert judgementPotential Improvements Potential improvements within the 1A3d ‘Water-borne Navigation” category could be possible once updating the available AD on real fuel consumption in the ATULBD for each source of emissions.
Table 2.1.3.17: Information on source category 1A3d Water-borne navigation, liquid fuels / CH4, N2OSector EnergyCategory 1A3 TransportSource / Fuel / Gas 1A3d Water-borne navigation, liquid fuels / CH4, N2OKey Category? NoCategory Description / Defini-tion
Emissions from fuels used to propel water-borne vessels, including hovercraft and hydrofoils, but excluding fishing vessels. The international/domestic split should be determined on the basis of port of depar-ture and port of arrival, and not by the flag or nationality of the ship.
Country Detail Water-borne navigation in the RM includes a small number of ships, the fuel consumption being equally insignificant (for a great number of years, for example for: 1993-2003, 2005 and 2009, in the EBs of the RM, fuel consumption for water-borne navigation was indicated as zero). Under these circumstances, the main source of information on diesel oil consumption for water-borne navigation was the Ministry of Transport and Road Infrastructure. Between 1990 and 2016, the GHG emissions from 1A3d ‘Water-borne Navigation’ decreased in the RM by circa 98.9 per cent.

Chapter 2: Methods and Data Documentation
2 - 45
Equation(Describe variables for method used)
Emissions = ∑(Fuel Consumedad • Emission Factorab) (Equation 3.5.1)Where:
a - Fuel type (diesel, gasoline, LPG, bunker, etc.);b - Water-borne navigation type (i.e., ship or boat, and possibly engine type) (only at Tier 2 is the fuel used differentiated by type of vessel so b can be ignored at Tier 1).
Methodology: Tier 1
Reference2006 IPCC Guidelines for National Greenhouse Gas Inventories, Volume 2: Energy, Chapter 3, Mobile Combustion, page 3.47 (available on: https://www.ipcc-nggip.iges.or.jp/public/2006gl/pdf/2_Volume2/V2_3_Ch3_Mobile_Combustion.pdf). National Inventory Report: 1990-2016. Greenhouse Gas Sources and Sinks in the Republic of Moldova (2018).
Describe How and Why this Method Was Chosen Due to the unavailability of country specific emission factors, the Tier 1 methodology has been used.
Type and source of activity data
Quantity of fuel (t), activity data were provided by the Ministry of Transport and Road Infrastructure. NCV of Diesel Oil (42.54 TJ/kt). Official Letters from the Ministry of Transport and Communications dated 31.03.1999 No. 03-5-2/2-32; Ministry of Transport and Road Infrastructure dated 02.10.2006 No. 04-01-3/754; Ministry of Transport and Road Infrastructure dated 12.03.2011 No. 04/2-2-05; dated 21.01.2014 No. 03-02-5/52; dated 20.02.2015 No. 03-02-5/102; and dated 07.06.2016, No. 03-02-5/424; Energy Balances of the RM for 1990 and 1993-2016. Quantity of fuel consumed is reported in the Table 3-121 from National Inventory Report: 1990-2016. Greenhouse Gas Sources and Sinks in the Republic of Moldova.
Type and source of EF and OF
2006 IPCC Guidelines for National Greenhouse Gas Inventories, Volume 2: Energy, Chapter 3, Mobile Combustion, page 3.50, Table 3.5.3.
Fuel typeCH4 Emission Factor N2O Emission Factor
kg/TJDiesel Oil 7 2
Uncertainty of AD and source ±5%, expert judgementUncertainty of EF and source ±50%, expert judgementPotential Improvements Potential improvements within the 1A3d ‘Water-borne Navigation” category could be possible once updating the available AD on real fuel consumption in the ATULBD for each source of emissions.
Table 2.1.3.18: Information on source category 1A3d Water-borne navigation, liquid fuels / NOx, CO, NMVOC and SO2Sector EnergyCategory 1A3 TransportSource / Fuel / Gas 1A3d Water-borne navigation, liquid fuels / NOx, CO, NMVOC and SO2
Key Category? Not applicable for pollutant emissionsCategory Description / Defini-tion
Emissions from fuels used to propel water-borne vessels, including hovercraft and hydrofoils, but excluding fishing vessels. The international/domestic split should be determined on the basis of port of depar-ture and port of arrival, and not by the flag or nationality of the ship.
Country Detail Water-borne navigation in the RM includes a small number of ships, the fuel consumption being equally insignificant (for a great number of years, for example for: 1993-2003, 2005 and 2009, in the EBs of the RM, fuel consumption for water-borne navigation was indicated as zero). Under these circumstances, the main source of information on diesel oil consumption for water-borne navigation was the Ministry of Transport and Road Infrastructure. Between 1990 and 2016, the GHG emissions from 1A3d ‘Water-borne Navigation’ decreased in the RM by circa 98.9 per cent.
Equation(Describe variables for method used)
Ei = ∑mFCm • EFi,m) (Equation 1)Where:
Ei - emission of pollutant i in kilogramsFCm - mass of fuel type m sold in the country for navigation (tons);EFi - fuel consumption - specific emission factor of pollutant i and fuel type m, (kg/ton); m - fuel type (bunker fuel oil, marine diesel oil, marine gas oil, gasoline).
Methodology: Tier 1

Chapter 2: Methods and Data Documentation
2 - 46
Reference
EMEP/EEA air pollutant emission inventory guidebook 2016. 1.A.3.d.i, 1.A.3.d.ii, 1.A.4.c.iii International maritime and inland navigation, national navigation, national fishing, recreational boats International maritime navigation, international inland navigation, national navigation (shipping), national fishing, page 12 (available on: https://www.eea.europa.eu/publications/emep-eea-guidebook-2016/part-b-sectoral-guidance-chapters/1-energy/1-a-combustion/1-a-3-d-navigation/view). National Inventory Report: 1990-2016. Greenhouse Gas Sources and Sinks in the Republic of Moldova (2018).
Describe How and Why this Method Was Chosen Due to the unavailability of country specific emission factors, the Tier 1 methodology has been used.
Type and source of activity data
Quantity of fuel (t), activity data were provided by the Ministry of Transport and Road Infrastructure. NCV of Diesel Oil (42.54 TJ/kt). Official Letters from the Ministry of Transport and Communications dated 31.03.1999 No. 03-5-2/2-32; Ministry of Transport and Road Infrastructure dated 02.10.2006 No. 04-01-3/754; Ministry of Transport and Road Infrastructure dated 12.03.2011 No. 04/2-2-05; dated 21.01.2014 No. 03-02-5/52; dated 20.02.2015 No. 03-02-5/102; and dated 07.06.2016, No. 03-02-5/424; Energy Balances of the RM for 1990 and 1993-2016. Quantity of fuel consumed is reported in the Table 3-121 from National Inventory Report: 1990-2016. Greenhouse Gas Sources and Sinks in the Republic of Moldova.
Type and source of EF and OF
EMEP/EEA air pollutant emission inventory guidebook 2016. 1.A.3.d.i, 1.A.3.d.ii, 1.A.4.c.iii International maritime and inland navigation, national navigation, national fishing, recreational boats International maritime navigation, international inland navigation, national navigation (shipping), national fishing, page 13, Table 3.1.
Fuel typeNOx CO NMVOC SO2
kg/ton fuelDiesel Oil 79.3 7.4 2.7 20.0
Uncertainty of AD and source ± 5%, expert judgement
Uncertainty of EF and source
EMEP/EEA air pollutant emission inventory guidebook 2016. 1.A.3.d.i, 1.A.3.d.ii, 1.A.4.c.iii International maritime and inland navigation, national navigation, national fishing, recreational boats International mari-time navigation, international inland navigation, national navigation (shipping), national fishing. 4.3.1 Uncertainties, Table 4-1: Estimated uncertainties given as percentage related to the emission factors, p.31.Parameter At sea Maneuvering In portNOx ±20% ±40% ±30%SO2 ±10% ±20% ±20%NMVOC ±25% ±50% ±40%
Potential Improvements Potential improvements within the 1A3d ‘Water-borne navigation” category could be possible once updating the available AD on real fuel consumption.
Table 2.1.3.19: Information on source category 1A3e ‘Other Transportation’, gaseous fuels / CO2Sector EnergyCategory 1A3 TransportSource / Fuel / Gas 1A3e Other transportation, gaseous fuels / CO2
Key Category? NoCategory Description / Defini-tion
Combustion related emissions from the operation of pump stations and maintenance of pipelines. Transport via pipelines includes transport of gases, liquids, slurry and other commodities via pipelines. Distribu-tion of natural or manufactured gas, water or steam from the distributor to final users is excluded.
Country Detail The RM has a developed natural gas transportation and distribution network. AD associated with fuel consumption for pipeline transport are available in the Energy Balances of the RM (Chapter S.2.3. “Con-sumed directly as fuel or energy for transportation”, column “Pipeline Transportation”. Between 1990 and 2016, the GHG emissions from 1A3e ‘Other Transportation’ (Pipeline Transport) decreased in the RM by circa 84.0 per cent.
Equation(Describe variables for method used)
Emissions GHG, fuel = Fuel Consumption fuel • Emission factor GHG, fuel (Equation 2.1)Where:
Emissions GHG, fuel - emission of the greenhouse gases by type of fuel (kg GHG);Fuel Consumption fuel - amount of fuel consumed (TJ);Emission factor GHG, fuel - default emission factor of a given greenhouse gases by type of fuel (kg gas/TJ). For CO2, it includes the carbon oxidation factor, assumed to be 1.
Methodology: Tier 1

Chapter 2: Methods and Data Documentation
2 - 47
Reference2006 IPCC Guidelines for National Greenhouse Gas Inventories, Volume 2: Energy, Chapter 2: Stationary Combustion, p. 2.11 (available on: https://www.ipcc-nggip.iges.or.jp/public/2006gl/pdf/2_Volume2/V2_2_Ch2_Stationary_Combustion.pdf). National Inventory Report: 1990-2016. Greenhouse Gas Sources and Sinks in the Republic of Moldova (2018).
Describe How and Why this Method Was Chosen Due to the unavailability of country specific emission factors, the Tier 1 methodology has been used.
Type and source of activity data Quantity of fuel (TJ) – activity data from Energy Balances of the Republic of Moldova. Quantity of fuel consumed is reported in the Table 3-123 from National Inventory Report: 1990-2016. Greenhouse Gas Sources and Sinks in the Republic of Moldova.
Type and source of EF and OF2006 IPCC Guidelines for National Greenhouse Gas Inventories, Volume 2: Energy, Chapter 2: Stationary Combustion, page 2.17, Table 2.2.Fuel type CO2 Emission Factor UnitNatural Gas 56.100 t CO2 / TJ
Uncertainty of AD and source ± 5%, expert judgementUncertainty of EF and source ± 5%, expert judgementPotential Improvements Potential improvements within the 1A3e ‘Other transportation’ category could be possible once updating the available AD on real fuel consumption in the ATULBD for each source of emissions.
Table 2.1.3.20: Information on source category 1A3e ‘Other transportation’, gaseous fuels / CH4, N2OSector EnergyCategory 1A3 TransportSource / Fuel / Gas 1A3e Other transportation, gaseous fuels / CH4, N2OKey Category? NoCategory Description / Defini-tion
Combustion related emissions from the operation of pump stations and maintenance of pipelines. Transport via pipelines includes transport of gases, liquids, slurry and other commodities via pipelines. Distribu-tion of natural or manufactured gas, water or steam from the distributor to final users is excluded.
Country Detail The RM has a developed natural gas transportation and distribution network. AD associated with fuel consumption for pipeline transport are available in the Energy Balances of the RM (Chapter S.2.3. “Con-sumed directly as fuel or energy for transportation”, column “Pipeline Transportation”. Between 1990 and 2016, the GHG emissions from 1A3e ‘Other Transportation’ (Pipeline Transport) decreased in the RM by circa 84.0 per cent.
Equation(Describe variables for method used)
Emissions GHG, fuel = Fuel Consumption fuel • Emission factor GHG, fuel (Equation 2.1)Where:
Emissions GHG, fuel - emission of the greenhouse gases by type of fuel (kg GHG);Fuel Consumption fuel - amount of fuel consumed (TJ);Emission factor GHG, fuel - default emission factor of a given greenhouse gases by type of fuel (kg gas/TJ).
Methodology: Tier 1
Reference2006 IPCC Guidelines for National Greenhouse Gas Inventories, Volume 2: Energy, Chapter 2: Stationary Combustion, p. 2.11 (available on: https://www.ipcc-nggip.iges.or.jp/public/2006gl/pdf/2_Volume2/V2_2_Ch2_Stationary_Combustion.pdf). National Inventory Report: 1990-2016. Greenhouse Gas Sources and Sinks in the Republic of Moldova (2018).
Describe How and Why this Method Was Chosen Due to the unavailability of country specific emission factors, the Tier 1 methodology has been used.
Type and source of activity data Quantity of fuel (TJ) – activity data from Energy Balances of the Republic of Moldova. Quantity of fuel consumed is reported in the Table 3-123 from National Inventory Report: 1990-2016. Greenhouse Gas Sources and Sinks in the Republic of Moldova.
Type and source of EF and OF
2006 IPCC Guidelines for National Greenhouse Gas Inventories, Volume 2: Energy, Chapter 2: Stationary Combustion, page 2.17, Table 2.2.
Fuel typeCH4 Emission Factor N2O Emission Factor
kg/TJNatural Gas 1.0 0.1

Chapter 2: Methods and Data Documentation
2 - 48
Uncertainty of AD and source ± 5%, expert judgementUncertainty of EF and source ± 50%, expert judgementPotential Improvements Potential improvements within the 1A3e ‘Other transportation’ category could be possible once updating the available AD on real fuel consumption in the ATULBD for each source of emissions.
Table 2.1.3.21: Information on source category 1A3e ‘Other transportation’, gaseous fuels / NOx, CO, NMVOC and SO2Sector EnergyCategory 1A3 TransportSource / Fuel / Gas 1A3e Other transportation, gaseous fuels / NOx, CO, NMVOC and SO2
Key Category? Not applicable for pollutant emissions.Category Description / Defini-tion
Combustion related emissions from the operation of pump stations and maintenance of pipelines. Transport via pipelines includes transport of gases, liquids, slurry and other commodities via pipelines. Distribu-tion of natural or manufactured gas, water or steam from the distributor to final users is excluded.
Country Detail The RM has a developed natural gas transportation and distribution network. AD associated with fuel consumption for pipeline transport are available in the Energy Balances of the RM (Chapter S.2.3. “Con-sumed directly as fuel or energy for transportation”, column “Pipeline Transportation”. Between 1990 and 2016, the GHG emissions from 1A3e ‘Other Transportation’ (Pipeline Transport) decreased in the RM by circa 84.0 per cent.
Equation(Describe variables for method used)
E pollutant = AR fuel consumption • EF pollutant (Equation 1)Where:
E pollutant - the emission of the specified pollutant;AR fuel consumption - the activity rate for fuel consumption;EF pollutant - the emission factor for this pollutant.
Methodology: Tier 1
ReferenceEMEP/EEA air pollutant emission inventory guidebook 2016 - Last update July 2017. 1.A.4.a.i, 1.A.4.b.i., 1.A.4.c.i, 1.A.5.a Small combustion, page 34 (available on: https://www.eea.europa.eu/publications/emep-eea-guidebook-2016/part-b-sectoral-guidance-chapters/1-energy/1-a-combustion/1-a-4-small-combustion-2016/view). National Inventory Report: 1990-2016. Greenhouse Gas Sources and Sinks in the Republic of Moldova (2018).
Describe How and Why this Method Was Chosen Due to the unavailability of country specific emission factors, the Tier 1 methodology has been used.
Type and source of activity data Quantity of fuel (TJ) – activity data from Energy Balances of the Republic of Moldova. Quantity of fuel consumed is reported in the Table 3-123 from National Inventory Report: 1990-2016. Greenhouse Gas Sources and Sinks in the Republic of Moldova.
Type and source of EF and OF
EMEP/EEA air pollutant emission inventory guidebook, July 2017, 1.A.4.a.i, 1.A.4.b.i, 1.A.4.c.i, 1.A.5.a Small combustion, page 41, Table 3.8.
Fuel type NOx CO NMVOC SO2
kg/TJNatural Gas 74 (46-103) 29 (21-48) 23 (14-33) 0.67 (0.40-0.94)
Uncertainty of AD and source ± 5%, expert judgementUncertainty of EF and source See the 95% confidence interval in the table above (in the brackets, lower-upper).Potential Improvements Potential improvements within the 1A3e Other transportation category could be possible once updating the available AD on real fuel consumption in the ATULBD for each source of emissions
2.1.4. Category 1A4 ‘Other sectors’Tables 2.1.4.1 – 2.1.4.39 below comprise relevant information on source categories comprised within the inventory, including description of each source by type of fuel allocated to category 1A4 ‘Other sectors’.

Chapter 2: Methods and Data Documentation
2 - 49
Table 2.1.4.1: Information on source category 1A4a Commercial/Institutional, solid fuels / CO2Sector EnergyCategory 1A4 Other sectorsSource / Fuel / Gas 1A4a Commercial/Institutional, solid fuels / CO2
Key Category? Tier 1: Yes: 1990 (L), 2016 (L, T); Tier 2: Yes: 1990 (L), 2016 (L, T) (1A4a Commercial/Institutional – aggregated for all types of fuels)Category Description / Defini-tion Emissions from fuel combustion in commercial and institutional buildings
Country Detail AD on fuel consumption are available in the EB of the RM, http://www.statistica.md/pageview.php?l=ro&idc=263&id=2197 and the statistical publications “Socio-economic development of the ATULBD”, http://mer.gospmr.org/gosudarstvennaya-sluzhba-statistiki/informacziya/o-soczialno-ekonomicheskom-polozhenii-pmr.html.
Equation(Describe variables for method used)
CO2 Emissions = Σ (Fuel Consumption j • Emission Factor j)Where:
j – type of fuelMethodology: Tier 1
Reference 2006 IPCC Guidelines, Volume 2, Chapter 2, https://www.ipcc-nggip.iges.or.jp/public/2006gl/pdf/2_Volume2/V2_2_Ch2_Stationary_Combustion.pdf.Describe How and Why this Method Was Chosen Due to the unavailability of country specific emission factors, the Tier 1 methodology has been used.
Type and source of activity data Quantity of fuel kt and TJ, from Energy Balances of the Republic of Moldova and Statistical Yearbooks of the ATULBD.National Inventory Report: 1990-2016. Greenhouse Gas Sources and Sinks in the Republic of Moldova (2018), Tables 3-141, 3-142 and 3-143.
Type and source of EF and OF
2006 IPCC Guidelines, Volume 2, Chapter 2, Table 2.4, page 2.20.Fuels СO2 Emission Factor UnitAnthracite 98 300 kg CO2 / TJOther Bituminous Coal 94 600 kg CO2 / TJ
Uncertainty of AD and source ±5% - expert judgementUncertainty of EF and source ±5% - expert judgement
Potential Improvements Potential improvements within the 1A4 ‘Other Sectors’ category could be possible by updating the available AD on fuel consumption on the territory of the LBDR and filling the existing gaps for certain years. GHG emissions will be reported by fuel types in the next inventory cycle.
Table 2.1.4.2: Information on source category 1A4a Commercial/Institutional, solid fuels / CH4, N2OSector EnergyCategory 1A4 Other sectorsSource / Fuel / Gas 1A4a Commercial/Institutional, solid fuels / CH4, N2OKey Category? NoCategory Description / Defini-tion Emissions from fuel combustion in commercial and institutional buildings
Country Detail AD on fuel consumption are available in the EB of the RM, http://www.statistica.md/pageview.php?l=ro&idc=263&id=2197 and the statistical publications “Socio-economic development of the ATULBD”, http://mer.gospmr.org/gosudarstvennaya-sluzhba-statistiki/informacziya/o-soczialno-ekonomicheskom-polozhenii-pmr.html.
Equation(Describe variables for method used)
CH4, N2O Emissions = Σ (Fuel Consumption j • Emission Factor j)Where:
j – type of fuelMethodology: Tier 1
Reference 2006 IPCC Guidelines, Volume 2, Chapter 2, https://www.ipcc-nggip.iges.or.jp/public/2006gl/pdf/2_Volume2/V2_2_Ch2_Stationary_Combustion.pdf.

Chapter 2: Methods and Data Documentation
2 - 50
Describe How and Why this Method Was Chosen Due to the unavailability of country specific emission factors, the Tier 1 methodology has been used.
Type and source of activity data Quantity of fuel kt and TJ, from Energy Balances of the Republic of Moldova and Statistical Yearbooks of the ATULBD.National Inventory Report: 1990-2016. Greenhouse Gas Sources and Sinks in the Republic of Moldova (2018), Tables 3-141, 3-142 and 3-143.
Type and source of EF and OF2006 IPCC Guidelines, Volume 2, Chapter 2, Table 2.4, page 2.20.Fuels CH4, kg/ TJ N2O, kg / TJAnthracite, Bituminous Coal 10 1.5
Uncertainty of AD and source ±5 - expert judgementUncertainty of EF and source ±50% - expert judgement
Potential Improvements Potential improvements within the 1A4 ‘Other Sectors’ category could be possible by updating the available AD on fuel consumption on the territory of the LBDR and filling the existing gaps for certain years. GHG emissions will be reported by fuel type in the next inventory cycle.
Table 2.1.4.3: Information on source category 1A4a Commercial/Institutional, solid fuels / NOx, CO, NMVOC and SO2Sector EnergyCategory 1A4 Other sectorsSource / Fuel / Gas 1A4a Commercial/Institutional, solid fuels / NOx, CO, NMVOC and SO2
Key Category? Not applicable for pollutant emissions.Category Description / Defini-tion Emissions from fuel combustion in commercial and institutional buildings
Country Detail AD on fuel consumption are available in the EB of the RM, http://www.statistica.md/pageview.php?l=ro&idc=263&id=2197 and the statistical publications “Socio-economic development of the ATULBD”, http://mer.gospmr.org/gosudarstvennaya-sluzhba-statistiki/informacziya/o-soczialno-ekonomicheskom-polozhenii-pmr.html.
Equation(Describe variables for method used)
NOx, CO, NMVOC and SO 2 Emissions = Σ (Fuel Consumption j • Emission Factor j)Where:
j – type of fuelMethodology: Tier 1
Reference EMEP/EEA Guidebook (July 2017), 1A4 Small combustion. Table 3.7, page 40, https://www.eea.europa.eu/publications/emep-eea-guidebook-2016/part-b-sectoral-guidance-chapters/1-energy/1-a-combustion/1-a-4-small-combustion-2016/view.
Describe How and Why this Method Was Chosen Due to the unavailability of country specific emission factors, the Tier 1 methodology has been used.
Type and source of activity data Quantity of fuel kt and TJ, from Energy Balances of the Republic of Moldova and Statistical Yearbooks of the ATULBD.National Inventory Report: 1990-2016. Greenhouse Gas Sources and Sinks in the Republic of Moldova (2018), Tables 3-141, 3-142 and 3-143.
Type and source of EF and OFEMEP/EEA Guidebook (July 2017), 1A4 Small combustion. Table 3.7, page 40. Tier 1 emission factors for NFR source category 1.A.4.a/c, 1.A.5.a, Hard and Brown CoalFuels NOx, kg / TJ CO, kg / TJ NMVOC, kg / TJ SO2, kg / TJSolid fuels 173 (150-200) 931 (150-2000) 88.8 (10-300) 840 (450-1000)
Uncertainty of AD and source ±5% - expert judgementUncertainty of EF and source See the 95% confidence interval in the table above (in the brackets, lower-upper).
Potential Improvements Potential improvements within the 1A4 ‘Other Sectors’ category could be possible by updating the available AD on fuel consumption on the territory of the ATULBD and filling the existing gaps for certain years. GHG emissions will be reported by fuel types in the next inventory cycle.

Chapter 2: Methods and Data Documentation
2 - 51
Table 2.1.4.4: Information on source category 1A4a Commercial/Institutional, liquid fuels / CO2Sector EnergyCategory 1A4 Other sectorsSource / Fuel / Gas 1A4a Commercial/Institutional, liquid fuels / CO2
Key Category? NoCategory Description / Defini-tion Emissions from fuel combustion in commercial and institutional buildings
Country Detail AD on fuel consumption are available in the EB of the RM, http://www.statistica.md/pageview.php?l=ro&idc=263&id=2197 and the statistical publications “Socio-economic development of the ATULBD”, http://mer.gospmr.org/gosudarstvennaya-sluzhba-statistiki/informacziya/o-soczialno-ekonomicheskom-polozhenii-pmr.html.
Equation(Describe variables for method used)
CO2 Emissions = Σ (Fuel Consumption j • Emission Factor j)Where:
j – type of fuelMethodology: Tier 1
Reference 2006 IPCC Guidelines, Volume 2, Chapter 2, https://www.ipcc-nggip.iges.or.jp/public/2006gl/pdf/2_Volume2/V2_2_Ch2_Stationary_Combustion.pdf.Describe How and Why this Method Was Chosen Due to the unavailability of country specific emission factors, the Tier 1 methodology has been used.
Type and source of activity data Quantity of fuel kt and TJ, from Energy Balances of the Republic of Moldova and Statistical Yearbooks of the ATULBD.National Inventory Report: 1990-2016. Greenhouse Gas Sources and Sinks in the Republic of Moldova (2018), Tables 3-141, 3-142 and 3-143.
Type and source of EF and OF
2006 IPCC Guidelines, Volume 2, Chapter 2, Table 2.4, page 2.20.Fuels СO2 Emission Factor UnitMotor Gasoline 69 300 kg CO2 / TJGas/Diesel Oil 74 100 kg CO2 / TJResidual Fuel Oil 77 400 kg CO2 / TJLPG 63 100 kg CO2 / TJOther Petroleum Products 73 300 kg CO2 / TJ
Uncertainty of AD and source ±5% - expert judgementUncertainty of EF and source ±5% - expert judgement
Potential Improvements Potential improvements within the 1A4 ‘Other Sectors’ category could be possible by updating the available AD on fuel consumption on the territory of the ATULBD and filling the existing gaps for certain years. GHG emissions will be reported by fuel types in the next inventory cycle.
Table 2.1.4.5: Information on source category 1A4a Commercial/Institutional, liquid fuels / CH4, N2OSector EnergyCategory 1A4 Other sectorsSource / Fuel / Gas 1A4a Commercial/Institutional, liquid fuels / CH4, N2OKey Category? NoCategory Description / Defini-tion Emissions from fuel combustion in commercial and institutional buildings
Country Detail AD on fuel consumption are available in the EB of the RM, http://www.statistica.md/pageview.php?l=ro&idc=263&id=2197 and the statistical publications “Socio-economic development of the ATULBD”, http://mer.gospmr.org/gosudarstvennaya-sluzhba-statistiki/informacziya/o-soczialno-ekonomicheskom-polozhenii-pmr.html.

Chapter 2: Methods and Data Documentation
2 - 52
Equation(Describe variables for method used)
CH4, N2O Emissions = Σ (Fuel Consumption j • Emission Factor j)Where:
j – type of fuelMethodology: Tier 1
Reference 2006 IPCC Guidelines, Volume 2, Chapter 2, https://www.ipcc-nggip.iges.or.jp/public/2006gl/pdf/2_Volume2/V2_2_Ch2_Stationary_Combustion.pdf.Describe How and Why this Method Was Chosen Due to the unavailability of country specific emission factors, the Tier 1 methodology has been used
Type and source of activity data Quantity of fuel kt and TJ, from Energy Balances of the Republic of Moldova and Statistical Yearbooks of the ATULBD.National Inventory Report: 1990-2016. Greenhouse Gas Sources and Sinks in the Republic of Moldova (2018), Tables 3-141, 3-142 and 3-143.
Type and source of EF and OF
2006 IPCC Guidelines, Volume 2, Chapter 2, Table 2.4, page 2.20.Fuels CH4, kg / TJ N2O, kg / TJ
LPG 5 0.1Liquid Fuels 10 0.6
Uncertainty of AD and source ±5% - expert judgementUncertainty of EF and source ±50% - expert judgement
Potential Improvements Potential improvements within the 1A4 ‘Other Sectors’ category could be possible by updating the available AD on fuel consumption on the territory of the ATULBD and filling the existing gaps for certain years. GHG emissions will be reported by fuel types in the next inventory cycle.
Table 2.1.4.6: Information on source category 1A4a Commercial/Institutional, liquid fuels / NOx, CO, NMVOC and SO2Sector EnergyCategory 1A4 Other sectorsSource / Fuel / Gas 1A4a Commercial/Institutional, liquid fuels / NOx, CO, NMVOC and SO2
Key Category? Not applicable for pollutant emissionsCategory Description / Defini-tion Emissions from fuel combustion in commercial and institutional buildings
Country Detail AD on fuel consumption are available in the EB of the RM, http://www.statistica.md/pageview.php?l=ro&idc=263&id=2197 and the statistical publications “Socio-economic development of the ATULBD”, http://mer.gospmr.org/gosudarstvennaya-sluzhba-statistiki/informacziya/o-soczialno-ekonomicheskom-polozhenii-pmr.html.
Equation(Describe variables for method used)
NOx, CO, NMVOC and SO2 Emissions = Σ (Fuel Consumption j • Emission Factor j)Where:
j – type of fuelMethodology: Tier 1
Reference EMEP/EEA Guidebook (July 2017), 1A4 Small combustion. Table 3.9, page 42, https://www.eea.europa.eu/publications/emep-eea-guidebook-2016/part-b-sectoral-guidance-chapters/1-energy/1-a-combustion/1-a-4-small-combustion-2016/view.
Describe How and Why this Method Was Chosen Due to the unavailability of country specific emission factors, the Tier 1 methodology has been used.
Type and source of activity data Quantity of fuel kt and TJ, from Energy Balances of the Republic of Moldova and Statistical Yearbooks of the ATULBD.National Inventory Report: 1990-2016. Greenhouse Gas Sources and Sinks in the Republic of Moldova (2018), Tables 3-141, 3-142 and 3-143.
Type and source of EF and OFEMEP/EEA Guidebook (July 2017), 1A4 Small combustion. Table 3.9, page 42. Tier 1 emission factors for NFR source category 1.A.4.a/c, 1.A.5.a, Using Liquid FuelsFuels NOx, kg / TJ CO, kg / TJ NMVOC, kg / TJ SO2, kg / TJLiquid fuels 306 (50-1319) 93 (2-200) 20 (0.018-70) 94 (28-140)

Chapter 2: Methods and Data Documentation
2 - 53
Uncertainty of AD and source ±5% - expert judgementUncertainty of EF and source See the 95% confidence interval in the table above (in the brackets, lower-upper).
Potential Improvements Potential improvements within the 1A4 ‘Other Sectors’ category could be possible by updating the available AD on fuel consumption on the territory of the ATULBD and filling the existing gaps for certain years. GHG emissions will be reported by fuel types in the next inventory cycle.
Table 2.1.4.7: Information on source category 1A4a Commercial/Institutional, gaseous fuels / CO2Sector EnergyCategory 1A4 Other SectorsSource / Fuel / Gas 1A4a Commercial/Institutional, gaseous fuels / CO2
Key Category? NoCategory Description / Defini-tion Emissions from fuel combustion in commercial and institutional buildings
Country Detail AD on fuel consumption are available in the EB of the RM, http://www.statistica.md/pageview.php?l=ro&idc=263&id=2197 and the statistical publications “Socio-economic development of the ATULBD”, http://mer.gospmr.org/gosudarstvennaya-sluzhba-statistiki/informacziya/o-soczialno-ekonomicheskom-polozhenii-pmr.html. A part of the information used was provided by the J.S.C. “Moldovagaz”.
Equation(Describe variables for method used)
CO2 Emissions = Σ (Fuel Consumption j • Emission Factor j)Where:
j – type of fuelMethodology: Tier 1
Reference 2006 IPCC Guidelines, Volume 2, Chapter 2, https://www.ipcc-nggip.iges.or.jp/public/2006gl/pdf/2_Volume2/V2_2_Ch2_Stationary_Combustion.pdf.Describe How and Why this Method Was Chosen Due to the unavailability of country specific emission factors, the Tier 1 methodology has been used.
Type and source of activity data Quantity of fuel mil m3 and TJ, from Energy Balances of the Republic of Moldova and Statistical Yearbooks of the ATULBD.National Inventory Report: 1990-2016. Greenhouse Gas Sources and Sinks in the Republic of Moldova (2018), Tables 3-141, 3-142 and 3-143.
Type and source of EF and OF2006 IPCC Guidelines, Volume 2, Chapter 2, Table 2.4, page 2.21.
Fuel CO2 Emission Factor UnitNatural Gas 56 100 kg CO2/TJ
Uncertainty of AD and source ±5% expert judgementUncertainty of EF and source ±5%- expert judgement
Potential Improvements Potential improvements within the 1A4 ‘Other Sectors’ category could be possible by updating the available AD on fuel consumption on the territory of the ATULBD and filling the existing gaps for certain years. GHG emissions will be reported by fuel types in the next inventory cycle.
Table 2.1.4.8: Information on source category 1A4a Commercial/Institutional, gaseous fuels / CH4, N2OSector EnergyCategory 1A4 Other sectorsSource / Fuel / Gas 1A4a Commercial/Institutional, gaseous fuels / CH4, N2OKey Category? NoCategory Description / Defini-tion Emissions from fuel combustion in commercial and institutional buildings
Country Detail AD on fuel consumption are available in the EB of the RM, http://www.statistica.md/pageview.php?l=ro&idc=263&id=2197 and the statistical publications “Socio-economic development of the ATULBD”, http://mer.gospmr.org/gosudarstvennaya-sluzhba-statistiki/informacziya/o-soczialno-ekonomicheskom-polozhenii-pmr.html. A part of the information used was provided by the J.S.C. “Moldovagaz”.

Chapter 2: Methods and Data Documentation
2 - 54
Equation(Describe variables for method used)
CH4, N2O Emissions = Σ (Fuel Consumption j • Emission Factor j)Where:
j – type of fuelMethodology: Tier 1
Reference 2006 IPCC Guidelines, Volume 2, Chapter 2, https://www.ipcc-nggip.iges.or.jp/public/2006gl/pdf/2_Volume2/V2_2_Ch2_Stationary_Combustion.pdf.Describe How and Why this Method Was Chosen Due to the unavailability of country specific emission factors, the Tier 1 methodology has been used.
Type and source of activity data Quantity of fuel mil m3 and TJ, from Energy Balances of the Republic of Moldova and Statistical Yearbooks of the ATULBD.National Inventory Report: 1990-2016. Greenhouse Gas Sources and Sinks in the Republic of Moldova (2018), Tables 3-141, 3-142 and 3-143.
Type and source of EF and OF2006 IPCC Guidelines, Volume 2, Chapter 2, Table 2.4, page 2.21.
Fuel CH4, kg / TJ N2O, kg / TJNatural Gas 5 0.1
Uncertainty of AD and source ±5% - expert judgementUncertainty of EF and source ±50% - expert judgement
Potential Improvements Potential improvements within the 1A4 ‘Other Sectors’ category could be possible by updating the available AD on fuel consumption on the territory of the ATULBD and filling the existing gaps for certain years. GHG emissions will be reported by fuel types in the next inventory cycle.
Table 2.1.4.9: Information on source category 1A4a Commercial/Institutional, gaseous fuels / NOx, CO, NMVOC and SO2Sector EnergyCategory 1A4 Other sectorsSource / Fuel / Gas 1A4a Commercial/Institutional, gaseous fuels / NOx, CO, NMVOC and SO2
Key Category? NoCategory Description / Defini-tion Emissions from fuel combustion in commercial and institutional buildings
Country Detail AD on fuel consumption are available in the EB of the RM http://www.statistica.md/pageview.php?l=ro&idc=263&id=2197 and the statistical publications “Socio-economic development of the ATULBD” http://mer.gospmr.org/gosudarstvennaya-sluzhba-statistiki/informacziya/o-soczialno-ekonomicheskom-polozhenii-pmr.html. A part of the information used was provided by the J.S.C. “Moldovagaz”.
Equation(Describe variables for method used)
NOx, CO, NMVOC and SO 2 Emissions = Σ (Fuel Consumption j • Emission Factor j)Where:
j – type of fuelMethodology: Tier 1
Reference EMEP/EEA Guidebook (July 2017), 1A4 Small combustion. Table 3.8, page 41, https://www.eea.europa.eu/publications/emep-eea-guidebook-2016/part-b-sectoral-guidance-chapters/1-energy/1-a-combustion/1-a-4-small-combustion-2016/view.
Describe How and Why this Method Was Chosen Due to the unavailability of country specific emission factors, the Tier 1 methodology has been used.
Type and source of activity data Quantity of fuel mil m3 and TJ, from Energy Balances of the Republic of Moldova and Statistical Yearbooks of the ATULBD.National Inventory Report: 1990-2016. Greenhouse Gas Sources and Sinks in the Republic of Moldova (2018), Tables 3-141, 3-142 and 3-143.
Type and source of EF and OFEMEP/EEA Guidebook (July 2017), 1A4 Small combustion. Table 3.8, page 41. Tier 1 emission factors for NFR source category 1.A.4.a/c, 1.A.5.a, Using Gaseous Fuels
Fuels NOx, kg / TJ CO, kg / TJ NMVOC, kg / TJ SO2, kg / TJNatural Gas, LPG 74 (46-103) 29 (21-48) 23 (14-33) 0.67 (0.4-0.94)
Uncertainty of AD and source ±5%

Chapter 2: Methods and Data Documentation
2 - 55
Uncertainty of EF and source See the 95% confidence interval in the table above (in the brackets, lower-upper).
Potential Improvements Potential improvements within the 1A4 ‘Other Sectors’ category could be possible by updating the available AD on fuel consumption on the territory of the ATULBD and filling the existing gaps for certain years. GHG emissions will be reported by fuel types in the next inventory cycle.
Table 2.1.4.10: Information on source category 1A4a Commercial/Institutional, biomass / CO2Sector EnergyCategory 1A4 Other SectorsSource / Fuel / Gas 1A4a Commercial/Institutional, biomass / CO2
Key Category? NoCategory Description / Defini-tion
CO2 emissions from biomass under the source category 1A4a Commercial/Institutional, has to be reported under the Memo Items (CO2 emissions from biomass). Emissions from fuel combustion in commercial and institutional buildings.
Country Detail AD on fuel consumption are available in the EB of the RM.
Equation(Describe variables for method used)
CO2 Emissions = Σ (Fuel Consumption j • Emission Factor j)Where:
j – type of fuelMethodology: Tier 1
Reference 2006 IPCC Guidelines, Volume 2, Chapter 2, https://www.ipcc-nggip.iges.or.jp/public/2006gl/pdf/2_Volume2/V2_2_Ch2_Stationary_Combustion.pdf.Describe How and Why this Method Was Chosen Due to the unavailability of country specific emission factors, the Tier 1 methodology has been used.
Type and source of activity data Quantity of fuel TJ, from Energy Balances of the Republic of Moldova.National Inventory Report: 1990-2016. Greenhouse Gas Sources and Sinks in the Republic of Moldova (2018), Tables 3-141, 3-142 and 3-143.
Type and source of EF and OF
2006 IPCC Guidelines, Volume 2, Chapter 2, Table 2.4, page 2.21.Fuels CO2 Emission Factor Unit
Wood/ Wood Waste, Charcoal 112 000 kg CO2 / TJOther Primary Solid Biomass 100 000 kg CO2 / TJ
Uncertainty of AD and source ±5% - expert judgementUncertainty of EF and source ±5% - expert judgementPotential Improvements Potential improvements within the 1A4 ‘Other Sectors’ category could be possible by updating the available AD on fuel consumption on the territory of the ATULBD and filling the existing gaps for certain years.
Table 2.1.4.11: Information on source category 1A4a Commercial/Institutional, biomass / CH4, N2OSector EnergyCategory 1A4 Other sectorsSource / Fuel / Gas 1A4a Commercial/Institutional, biomass / CH4, N2OKey Category? NoCategory Description / Defini-tion Emissions from fuel combustion in commercial and institutional buildings
Country Detail AD on fuel consumption are available in the EB of the RM.

Chapter 2: Methods and Data Documentation
2 - 56
Equation(Describe variables for method used)
CH4 and N2O Emissions = Σ (Fuel Consumption j • Emission Factor j)Where:
j – type of fuelMethodology: Tier 1
Reference 2006 IPCC Guidelines, Volume 2, Chapter 2, https://www.ipcc-nggip.iges.or.jp/public/2006gl/pdf/2_Volume2/V2_2_Ch2_Stationary_Combustion.pdf.Describe How and Why this Method Was Chosen Due to the unavailability of country specific emission factors, the Tier 1 methodology has been used
Type and source of activity data Quantity of fuel TJ, from Energy Balances of the Republic of Moldova.National Inventory Report: 1990-2016. Greenhouse Gas Sources and Sinks in the Republic of Moldova (2018), Tables 3-141, 3-142 and 3-143.
Type and source of EF and OF
2006 IPCC Guidelines, Volume 2, Chapter 2, Table 2.4, page 2.21.Fuels CH4, kg / TJ N2O, kg / TJ
Wood / Wood Waste, Other Primary Solid Biomass 300 4Charcoal 200 1
Uncertainty of AD and source ±5% - expert judgementUncertainty of EF and source ±50% - expert judgement
Potential Improvements Potential improvements within the 1A4 ‘Other Sectors’ category could be possible by updating the available AD on fuel consumption on the territory of the ATULBD and filling the existing gaps for certain years. GHG emissions will be reported by fuel types in the next inventory cycle.
Table 2.1.4.12: Information on source category 1A4a Commercial/Institutional, biomass / NOx, CO, NMVOC and SO2Sector EnergyCategory 1A4 Other SectorsSource / Fuel / Gas 1A4a Commercial/Institutional, biomass / NOx, CO, NMVOC and SO2
Key Category? Not applicable for pollutant emissionsCategory Description / Defini-tion Emissions from fuel combustion in commercial and institutional buildings
Country Detail AD on fuel consumption are available in the EB of the RM.
Equation(Describe variables for method used)
NOx, CO, NMVOC and SO2 Emissions = Σ (Fuel Consumption j • Emission Factor j)Where:
j – type of fuelMethodology: Tier 1
Reference EMEP/EEA Guidebook (July 2017), 1A4 Small combustion. Table 3.10, page 43, https://www.eea.europa.eu/publications/emep-eea-guidebook-2016/part-b-sectoral-guidance-chapters/1-energy/1-a-combustion/1-a-4-small-combustion-2016/view.
Describe How and Why this Method Was Chosen Due to the unavailability of country specific emission factors, the Tier 1 methodology has been used.
Type and source of activity data Quantity of fuel TJ, from Energy Balances of the Republic of Moldova.National Inventory Report: 1990-2016. Greenhouse Gas Sources and Sinks in the Republic of Moldova (2018), Tables 3-141, 3-142 and 3-143.
Type and source of EF and OFEMEP/EEA Guidebook (July 2017), 1A4 Small combustion. Table 3.10, page 43. Tier 1 emission factors for NFR source category 1.A.4.a/c, 1.A.5.a, Solid biomass.
Fuels NOx, kg / TJ CO, kg / TJ NMVOC, kg / TJ SO2, kg / TJSolid Biomass 91 (20-120) 570 (50-4000) 300 (5-500) 11 (8-40)
Uncertainty of AD and source ±5%, expert judgement

Chapter 2: Methods and Data Documentation
2 - 57
Uncertainty of EF and source See the 95% confidence interval in the table above (in the brackets, lower-upper).Potential Improvements Potential improvements within the 1A4 ‘Other Sectors’ category could be possible by updating the available AD on fuel consumption on the territory of the ATULBD and filling the existing gaps for certain years.
Table 2.1.4.13: Information on source category 1A4b Residential, solid fuels / CO2Sector EnergyCategory 1A4 Other sectorsSource / Fuel / Gas 1A4b Residential, solid fuels / CO2
Key Category? Tier 1: Yes: 1990 (L), 2016 (L, T); Tier 2: Yes: 1990 (L), 2016 (L, T) (1A4 Other sectors – aggregated for all types of fuels and sources)Category Description / Defini-tion All emissions from fuel combustion in households.
Country Detail AD on fuel consumption are available in the EB of the RM, http://www.statistica.md/pageview.php?l=ro&idc=263&id=2197.
Equation(Describe variables for method used)
CO2 Emissions = Σ (Fuel Consumption j • Emission Factor j)Where:
j – type of fuelMethodology: Tier 1
Reference 2006 IPCC Guidelines, Volume 2, Chapter 2, https://www.ipcc-nggip.iges.or.jp/public/2006gl/pdf/2_Volume2/V2_2_Ch2_Stationary_Combustion.pdf.Describe How and Why this Method Was Chosen Due to the unavailability of country specific emission factors, the Tier 1 methodology has been used.
Type and source of activity data Quantity of fuel kt and TJ, from Energy Balances of the Republic of Moldova. National Inventory Report: 1990-2016. Greenhouse Gas Sources and Sinks in the Republic of Moldova (2018), Tables 3-144, 3-145 and 3-146.
Type and source of EF and OF
2006 IPCC Guidelines, Volume 2, Chapter 2, Table 2.5, page 2.22.Fuels CO2 Emission Factor UnitAnthracite 98 300 kg CO2 / TJOther Bituminous Coal 94 600 kg CO2 / TJLignite 101 000 kg CO2 / TJ
Uncertainty of AD and source ±5% - expert judgementUncertainty of EF and source ±5% - expert judgementPotential Improvements Potential improvements within the 1A4 ‘Other Sectors’ category could be possible by updating the available AD on fuel consumption on the territory of the ATULBD and filling the existing gaps for certain years.
Table 2.1.4.14: Information on source category 1A4b Residential, solid fuels / CH4, N2OSector EnergyCategory 1A4 Other sectorsSource / Fuel / Gas 1A4b Residential, solid fuels / CH4, N2OKey Category? For CH4 – Yes: Tier 1 & 2 (L) (1A4 Other sectors – aggregated for all types of fuels and sources)Category Description / Defini-tion All emissions from fuel combustion in households.
Country Detail AD on fuel consumption are available in the EB of the RM http://www.statistica.md/pageview.php?l=ro&idc=263&id=2197.
Equation(Describe variables for method used)
CH4, N2O Emissions = Σ (Fuel Consumption j • Emission Factor j)Where:
j – type of fuelMethodology: Tier 1

Chapter 2: Methods and Data Documentation
2 - 58
Reference 2006 IPCC Guidelines, Volume 2, Chapter 2, https://www.ipcc-nggip.iges.or.jp/public/2006gl/pdf/2_Volume2/V2_2_Ch2_Stationary_Combustion.pdf.Describe How and Why this Method Was Chosen Due to the unavailability of country specific emission factors, the Tier 1 methodology has been used.
Type and source of activity data Quantity of fuel kt and TJ, from Energy Balances of the Republic of Moldova. National Inventory Report: 1990-2016. Greenhouse Gas Sources and Sinks in the Republic of Moldova (2018), Tables 3-144, 3-145 and 3-146.
Type and source of EF and OF2006 IPCC Guidelines, Volume 2, Chapter 2, Table 2.5, page 2.23.
Fuels CH4, kg / TJ N2O, kg / TJSolid fuels 300 1.5
Uncertainty of AD and source ±5% - expert judgementUncertainty of EF and source ±50% - expert judgement
Potential Improvements Potential improvements within the 1A4 ‘Other Sectors’ category could be possible by updating the available AD on fuel consumption on the territory of the ATULBD and filling the existing gaps for certain years. GHG emissions will be reported by fuel types in the next inventory cycle.
Table 2.1.4.15: Information on source category 1A4b Residential, solid fuels / NOx, CO, NMVOC and SO2Sector EnergyCategory 1A4 Other sectorsSource / Fuel / Gas 1A4b Residential, solid fuels / NOx, CO, NMVOC and SO2
Key Category? Not applicable for pollutant emissionsCategory Description / Defini-tion All emissions from fuel combustion in households.
Country Detail AD on fuel consumption are available in the EB of the RM, http://www.statistica.md/pageview.php?l=ro&idc=263&id=2197.
Equation(Describe variables for method used)
NOx, CO, NMVOC and SO2 Emissions = Σ (Fuel Consumption j • Emission Factor j)Where:
j – type of fuelMethodology: Tier 1
Reference EMEP/EEA Guidebook (July 2017), 1A4 Small combustion. Table 3.3, page 36, https://www.eea.europa.eu/publications/emep-eea-guidebook-2016/part-b-sectoral-guidance-chapters/1-energy/1-a-combustion/1-a-4-small-combustion-2016/view.
Describe How and Why this Method Was Chosen Due to the unavailability of country specific emission factors, the Tier 1 methodology has been used.
Type and source of activity data Quantity of fuel kt and TJ, from Energy Balances of the Republic of Moldova. National Inventory Report: 1990-2016. Greenhouse Gas Sources and Sinks in the Republic of Moldova (2018), Tables 3-144, 3-145 and 3-146.
Type and source of EF and OFEMEP/EEA Guidebook (July 2017), 1A4 Small combustion. Table 3.3, page 36. Tier 1 emission factors for NFR source category 1.A.4.b, Hard Coal and Brown Coal.
Fuels NOx, kg / TJ CO, kg / TJ NMVOC, kg / TJ SO2, kg / TJHard Coal and Brown Coal 110 (36-200) 4600 (3000-7000) 484 (250-840) 900 (300-1000)
Uncertainty of AD and source ±5%, expert judgementUncertainty of EF and source See the 95% confidence interval in the table above (in the brackets, lower-upper).
Potential Improvements Potential improvements within the 1A4 ‘Other Sectors’ category could be possible by updating the available AD on fuel consumption on the territory of the ATULBD and filling the existing gaps for certain years. GHG emissions will be reported by fuel types in the next inventory cycle.

Chapter 2: Methods and Data Documentation
2 - 59
Table 2.1.4.16: Information on source category 1A4b Residential, liquid fuels / CO2Sector EnergyCategory 1A4 Other sectorsSource / Fuel / Gas 1A4b Residential, liquid fuels / CO2
Key Category? Tier 1: Yes: 1990 (L), 2016 (L, T); Tier 2: Yes: 1990 (L), 2016 (L, T) (1A4 Other sectors – aggregated for all types of fuels and sources)Category Description / Defini-tion All emissions from fuel combustion in households.
Country Detail AD on fuel consumption are available in the EB of the RM, http://www.statistica.md/pageview.php?l=ro&idc=263&id=2197 and the statistical publications “Socio-economic development of the ATULBD” http://mer.gospmr.org/gosudarstvennaya-sluzhba-statistiki/informacziya/o-soczialno-ekonomicheskom-polozhenii-pmr.html. A part of the information used was provided by the J.S.C. “Moldovagaz”.
Equation(Describe variables for method used)
CO2 Emissions = Σ (Fuel Consumption j • Emission Factor j)Where:
j – type of fuelMethodology: Tier 1
Reference 2006 IPCC Guidelines, Volume 2, Chapter 2, https://www.ipcc-nggip.iges.or.jp/public/2006gl/pdf/2_Volume2/V2_2_Ch2_Stationary_Combustion.pdf.Describe How and Why this Method Was Chosen Due to the unavailability of country specific emission factors, the Tier 1 methodology has been used.
Type and source of activity data Quantity of fuel kt and TJ, from Energy Balances of the Republic of Moldova and Statistical Yearbooks of the ATULBD. A part of the information used was provided by the J.S.C. “Moldovagaz”. National Inventory Report: 1990-2016. Greenhouse Gas Sources and Sinks in the Republic of Moldova (2018), Tables 3-144, 3-145 and 3-146.
Type and source of EF and OF
2006 IPCC Guidelines, Volume 2, Chapter 2, Table 2.5, page 2.22.Fuels CO2 Emission Factor Unit
Residual Fuel Oil 77 400 kg CO2 / TJOther Kerosene 71 900 kg CO2 / TJDiesel Oil 74 100 kg CO2 / TJ
Uncertainty of AD and source ±5%, expert judgementUncertainty of EF and source ±5%, expert judgement
Potential Improvements Potential improvements within the 1A4 ‘Other Sectors’ category could be possible by updating the available AD on fuel consumption on the territory of the ATULBD and filling the existing gaps for certain years. GHG emissions will be reported by fuel types in the next inventory cycle.
Table 2.1.4.17: Information on source category 1A4b Residential, liquid fuels / CH4, N2OSector EnergyCategory 1A4 Other sectorsSource / Fuel / Gas 1A4b Residential, liquid fuels / CH4, N2OKey Category? For CH4 – Yes: Tier 1 & 2 (L) (1A4 Other sectors – aggregated for all types of fuels and sources)Category Description / Defini-tion All emissions from fuel combustion in households.
Country Detail AD on fuel consumption are available in the EB of the RM, http://www.statistica.md/pageview.php?l=ro&idc=263&id=2197 and the statistical publications “Socio-economic development of the ATULBD”, http://mer.gospmr.org/gosudarstvennaya-sluzhba-statistiki/informacziya/o-soczialno-ekonomicheskom-polozhenii-pmr.html. A part of the information used was provided by the J.S.C. “Moldovagaz”.
Equation(Describe variables for method used)
CH4, N2O Emissions = Σ (Fuel Consumption j • Emission Factor j)Where:
j – type of fuelMethodology: Tier 1

Chapter 2: Methods and Data Documentation
2 - 60
Reference 2006 IPCC Guidelines, Volume 2, Chapter 2, https://www.ipcc-nggip.iges.or.jp/public/2006gl/pdf/2_Volume2/V2_2_Ch2_Stationary_Combustion.pdf.Describe How and Why this Method Was Chosen Due to the unavailability of country specific emission factors, the Tier 1 methodology has been used.
Type and source of activity data Quantity of fuel kt and TJ, from Energy Balances of the Republic of Moldova and Statistical Yearbooks of the ATULBD. A part of the information used was provided by the J.S.C. “Moldovagaz”. National Inventory Report: 1990-2016. Greenhouse Gas Sources and Sinks in the Republic of Moldova (2018), Tables 3-144, 3-145 and 3-146.
Type and source of EF and OF2006 IPCC Guidelines, Volume 2, Chapter 2, Table 2.5, page 2.22.
Fuel CH4, kg / TJ N2O, kg / TJResidual Fuel Oil, Other Kerosene, Diesel Oil 10 0.6
Uncertainty of AD and source ±5%, expert judgementUncertainty of EF and source ±50%, expert judgement
Potential Improvements Potential improvements within the 1A4 ‘Other Sectors’ category could be possible by updating the available AD on fuel consumption on the territory of the ATULBD and filling the existing gaps for certain years. GHG emissions will be reported by fuel types in the next inventory cycle.
Table 2.1.4.18: Information on source category 1A4b Residential, liquid fuels / NOx, CO, NMVOC and SO2Sector EnergyCategory 1A4 Other sectorsSource / Fuel / Gas 1A4b Residential, liquid fuels / NOx, CO, NMVOC and SO2
Key Category? Not applicable for pollutant emissions.Category Description / Defini-tion All emissions from fuel combustion in households.
Country Detail AD on fuel consumption are available in the EB of the RM, http://www.statistica.md/pageview.php?l=ro&idc=263&id=2197 and the statistical publications “Socio-economic development of the ATULBD”, http://mer.gospmr.org/gosudarstvennaya-sluzhba-statistiki/informacziya/o-soczialno-ekonomicheskom-polozhenii-pmr.html. A part of the information used was provided by the J.S.C. “Moldovagaz”.
Equation(Describe variables for method used)
NOx, CO, NMVOC and SO2 Emissions = Σ (Fuel Consumption j • Emission Factor j)Where:
j – type of fuelMethodology: Tier 1
Reference EMEP/EEA Guidebook (July 2017), 1A4 Small combustion. Table 3.4, page 35, https://www.eea.europa.eu/publications/emep-eea-guidebook-2016/part-b-sectoral-guidance-chapters/1-energy/1-a-combustion/1-a-4-small-combustion-2016/view.
Describe How and Why this Method Was Chosen Due to the unavailability of country specific emission factors, the Tier 1 methodology has been used.
Type and source of activity data Quantity of fuel kt and TJ, from Energy Balances of the Republic of Moldova and Statistical Yearbooks of the ATULBD.
Type and source of EF and OFEMEP/EEA Guidebook (July 2017), 1A4 Small combustion. Table 3.4, page 35. Tier 1 emission factors for NFR source category 1.A.4.b, Gaseous fuels
Fuels NOx, kg / TJ CO, kg / TJ NMVOC, kg / TJ SO2, kg / TJLiquid fuels 51 (31-71) 26 (18-42) 1.9 (1.1-2.6) 0.3 (0.2-0.4)
Uncertainty of AD and source ±5%, expert judgementUncertainty of EF and source See the 95% confidence interval in the table above (in the brackets, lower-upper)
Potential Improvements Potential improvements within the 1A4 ‘Other Sectors’ category could be possible by updating the available AD on fuel consumption on the territory of the ATULBD and filling the existing gaps for certain years. GHG emissions will be reported by fuel types in the next inventory cycle.

Chapter 2: Methods and Data Documentation
2 - 61
Table 2.1.4.19: Information on source category 1A4b Residential, gaseous fuels / CO2Sector EnergyCategory 1A4 Other SectorsSource / Fuel / Gas 1A4b Residential, gaseous fuels / CO2
Key Category? Tier 1: Yes: 1990 (L), 2016 (L, T); Tier 2: Yes: 1990 (L), 2016 (L, T) (1A4 Other sectors – aggregated for all types of fuels and sources)Category Description / Defini-tion All emissions from fuel combustion in households.
Country Detail AD on fuel consumption are available in the EB of the RM, http://www.statistica.md/pageview.php?l=ro&idc=263&id=2197 and in the statistical publications “Socio-economic development of the ATULBD”, http://mer.gospmr.org/gosudarstvennaya-sluzhba-statistiki/informacziya/o-soczialno-ekonomicheskom-polozhenii-pmr.html. A part of the information used was provided by the J.S.C. “Moldovagaz”.
Equation(Describe variables for method used)
CO2 Emissions = Σ (Fuel Consumption j • Emission Factor j)Where:
j – type of fuelMethodology: Tier 1
Reference 2006 IPCC Guidelines, Volume 2, Chapter 2, https://www.ipcc-nggip.iges.or.jp/public/2006gl/pdf/2_Volume2/V2_2_Ch2_Stationary_Combustion.pdf.Describe How and Why this Method Was Chosen Due to the unavailability of country specific emission factors, the Tier 1 methodology has been used.
Type and source of activity data Quantity of fuel mil m3 and TJ, from Energy Balances of the Republic of Moldova and Statistical Yearbooks of the ATULBD.National Inventory Report: 1990-2016. Greenhouse Gas Sources and Sinks in the Republic of Moldova (2018), Tables 3-144, 3-145 and 3-146.
Type and source of EF and OF2006 IPCC Guidelines, Volume 2, Chapter 2, Table 2.5, page 2.23.
Fuel CO2 Emission Factor UnitNatural Gas 56 100 kg / TJ
Uncertainty of AD and source ±5%, expert judgementUncertainty of EF and source ±5%, expert judgement
Potential Improvements Potential improvements within the 1A4 ‘Other Sectors’ category could be possible by updating the available AD on fuel consumption on the territory of the ATULBD and filling the existing gaps for certain years. Greenhouse gas emissions will be presented by fuel type in the next inventory cycle.
Table 2.1.4.20: Information on source category 1A4b Residential, gaseous fuels / CH4, N2OSector EnergyCategory 1A4 Other sectorsSource / Fuel / Gas 1A4b Residential, gaseous fuels / CH4, N2OKey Category? For CH4 – Yes: Tier 1 & 2 (L) (1A4 Other sectors – aggregated for all types of fuels and sources)Category Description / Defini-tion All emissions from fuel combustion in households.
Country Detail AD on fuel consumption are available in the EB of the RM, http://www.statistica.md/pageview.php?l=ro&idc=263&id=2197 and the statistical publications “Socio-economic development of the ATULBD”, http://mer.gospmr.org/gosudarstvennaya-sluzhba-statistiki/informacziya/o-soczialno-ekonomicheskom-polozhenii-pmr.html. A part of the information used was provided by the J.S.C. “Moldovagaz”.
Equation(Describe variables for method used)
CH4, N2O Emissions = Σ (Fuel Consumption j • Emission Factor j)Where:
j – type of fuelMethodology: Tier 1
Reference 2006 IPCC Guidelines, Volume 2, Chapter 2, https://www.ipcc-nggip.iges.or.jp/public/2006gl/pdf/2_Volume2/V2_2_Ch2_Stationary_Combustion.pdf.

Chapter 2: Methods and Data Documentation
2 - 62
Describe How and Why this Method Was Chosen Due to the unavailability of country specific emission factors, the Tier 1 methodology has been used.
Type and source of activity data Quantity of fuel mil m3 and TJ, from Energy Balances of the Republic of Moldova and Statistical Yearbooks of the ATULBD.National Inventory Report: 1990-2016. Greenhouse Gas Sources and Sinks in the Republic of Moldova (2018), Tables 3-144, 3-145 and 3-146.
Type and source of EF and OF2006 IPCC Guidelines, Volume 2, Chapter 2, Table 2.4, page 2.21.
Fuel CH4, kg / TJ N2O, kg / TJNatural gas 5 0.1
Uncertainty of AD and source ±5%, expert judgementUncertainty of EF and source ±50%, expert judgement
Potential Improvements Potential improvements within the 1A4 ‘Other Sectors’ category could be possible by updating the available AD on fuel consumption on the territory of the ATULBD and filling the existing gaps for certain years. GHG emissions will be reported by fuel types in the next inventory cycle.
Table 2.1.4.21: Information on source category 1A4b Residential, gaseous fuels / NOx, CO, NMVOC and SO2
Sector EnergyCategory 1A4 Other sectorsSource / Fuel / Gas 1A4b Residential, gaseous fuels / NOx, CO, NMVOC and SO2
Key Category? Not applicable for pollutant emissions.Category Description / Defini-tion All emissions from fuel combustion in households.
Country Detail AD on fuel consumption are available in the EB of the RM, http://www.statistica.md/pageview.php?l=ro&idc=263&id=2197 and the statistical publications “Socio-economic development of the ATULBD”, http://mer.gospmr.org/gosudarstvennaya-sluzhba-statistiki/informacziya/o-soczialno-ekonomicheskom-polozhenii-pmr.html. A part of the information used was provided by the J.S.C. “Moldovagaz”.
Equation(Describe variables for method used)
NOx, CO, NMVOC and SO2 Emissions = Σ (Fuel Consumption j • Emission Factor j)Where:
j – type of fuelMethodology: Tier 1
Reference EMEP/EEA Guidebook (July 2017), 1A4 Small combustion. Table 3.4, page 37, https://www.eea.europa.eu/publications/emep-eea-guidebook-2016/part-b-sectoral-guidance-chapters/1-energy/1-a-combustion/1-a-4-small-combustion-2016/view.
Describe How and Why this Method Was Chosen Due to the unavailability of country specific emission factors, the Tier 1 methodology has been used.
Type and source of activity data Quantity of fuel mil m3 and TJ, from Energy Balances of the Republic of Moldova and Statistical Yearbooks of the ATULBD.National Inventory Report: 1990-2016. Greenhouse Gas Sources and Sinks in the Republic of Moldova (2018), Tables 3-144, 3-145 and 3-146.
Type and source of EF and OFEMEP/EEA Guidebook (July 2017), 1A4 Small combustion. Tables 3.4, page 37. Tier 1 emission factors for NFR source category 1.A.4.b, Using Gaseous Fuels
Fuels NOx, kg / TJ CO, kg / TJ NMVOC, kg / TJ SO2, kg / TJGaseous Fuels 51 (31-71) 26 (18-42) 1.9 (1.1-2.6) 0.3 (0.2-0.4)
Uncertainty of AD and source ±5%, expert judgementUncertainty of EF and source See the 95% confidence interval in the table above (in the brackets, lower-upper)
Potential Improvements Potential improvements within the 1A4 ‘Other Sectors’ category could be possible by updating the available AD on fuel consumption on the territory of the ATULBD and filling the existing gaps for certain years. GHG emissions will be reported by fuel types in the next inventory cycle.

Chapter 2: Methods and Data Documentation
2 - 63
Table 2.1.4.22: Information on source category 1A4b Residential, biomass / CO2
Sector EnergyCategory 1A4 Other SectorsSource / Fuel / Gas 1A4b Residential, biomass / CO2
Key Category? NoCategory Description / Defini-tion CO2 emissions from biomass under the source category 1A4b ‘Residential’ have to be reported under the memo Items (CO2 emissions from biomass). All emissions from fuel combustion in households.
Country Detail AD on fuel consumption are available in the EB of the RM, http://www.statistica.md/pageview.php?l=ro&idc=263&id=2197 and the statistical publications “Socio-economic development of the ATULBD”, http://mer.gospmr.org/gosudarstvennaya-sluzhba-statistiki/informacziya/o-soczialno-ekonomicheskom-polozhenii-pmr.html.
Equation(Describe variables for method used)
CO2 Emissions = Σ (Fuel Consumption j • Emission Factor j)Where:
j – type of fuelMethodology: Tier 1
Reference 2006 IPCC Guidelines, Volume 2, Chapter 2, https://www.ipcc-nggip.iges.or.jp/public/2006gl/pdf/2_Volume2/V2_2_Ch2_Stationary_Combustion.pdf.Describe How and Why this Method Was Chosen Due to the unavailability of country specific emission factors, the Tier 1 methodology has been used.
Type and source of activity data Quantity of fuel mil m3 and TJ, from Energy Balances of the Republic of Moldova and Statistical Yearbooks of the ATULBD.National Inventory Report: 1990-2016. Greenhouse Gas Sources and Sinks in the Republic of Moldova (2018), Tables 3-144, 3-145 and 3-146.
Type and source of EF and OF
2006 IPCC Guidelines, Volume 2, Chapter 2, Table 2.5, page 2.23.Fuels CO2 Emission Factor Unit
Wood / Wood Waste, Charcoal 112 000 kg CO2 / TJOther Primary Solid Biomass 100 000 kg CO2 / TJ
Uncertainty of AD and source ±5%, expert judgementUncertainty of EF and source ±5%, expert judgement
Potential Improvements Potential improvements within the 1A4 ‘Other Sectors’ category could be possible by updating the available AD on fuel consumption on the territory of the ATULBD and filling the existing gaps for certain years. Greenhouse gas emissions will be presented by fuel type in the next inventory cycle.
Table 2.1.4.23: Information on source category 1A4b Residential, biomass / CH4, N2OSector EnergyCategory 1A4 Other sectorsSource / Fuel / Gas 1A4b Residential, biomass / CH4, N2OKey Category? NoCategory Description / Defini-tion All emissions from fuel combustion in households.
Country Detail AD on fuel consumption are available in the EB of the RM, http://www.statistica.md/pageview.php?l=ro&idc=263&id=2197 and the statistical publications “Socio-economic development of the ATULBD”, http://mer.gospmr.org/gosudarstvennaya-sluzhba-statistiki/informacziya/o-soczialno-ekonomicheskom-polozhenii-pmr.html.
Equation(Describe variables for method used)
CH4, N2O Emissions = Σ (Fuel Consumption j • Emission Factor j)Where:
j – type of fuelMethodology: Tier 1
Reference 2006 IPCC Guidelines, Volume 2, Chapter 2, https://www.ipcc-nggip.iges.or.jp/public/2006gl/pdf/2_Volume2/V2_2_Ch2_Stationary_Combustion.pdf.

Chapter 2: Methods and Data Documentation
2 - 64
Describe How and Why this Method Was Chosen Due to the unavailability of country specific emission factors, the Tier 1 methodology has been used.
Type and source of activity data Quantity of fuel mil m3 and TJ, from Energy Balances of the Republic of Moldova and Statistical Yearbooks of the ATULBD.National Inventory Report: 1990-2016. Greenhouse Gas Sources and Sinks in the Republic of Moldova (2018), Tables 3-144, 3-145 and 3-146.
Type and source of EF and OF
2006 IPCC Guidelines, Volume 2, Chapter 2, Table 2.5, page 2.23.Fuels CH4, kg / TJ N2O, kg / TJ
Wood / Wood Waste, Other Primary Solid Biomass 300 4 Charcoal 200 1
Uncertainty of AD and source ±5%, expert judgementUncertainty of EF and source ±50%, expert judgement
Potential Improvements Potential improvements within the 1A4 ‘Other Sectors’ category could be possible by updating the available AD on fuel consumption on the territory of the ATULBD and filling the existing gaps for certain years. GHG emissions will be reported by fuel types in the next inventory cycle.
Table 2.1.4.24: Information on source category 1A4b Residential, biomass / NOx, CO, NMVOC and SO2Sector EnergyCategory 1A4 Other SectorsSource / Fuel / Gas 1A4b Residential, biomass / NOx, CO, NMVOC and SO2
Key Category? Not applicable for pollutant emissions.Category Description / Defini-tion All emissions from fuel combustion in households.
Country Detail AD on fuel consumption are available in the EB of the RM, http://www.statistica.md/pageview.php?l=ro&idc=263&id=2197 and the statistical publications “Socio-economic development of the ATULBD”, http://mer.gospmr.org/gosudarstvennaya-sluzhba-statistiki/informacziya/o-soczialno-ekonomicheskom-polozhenii-pmr.html.
Equation(Describe variables for method used)
NOx, CO, NMVOC and SO2 Emissions = Σ (Fuel Consumption j • Emission Factor j)Where:
j – type of fuelMethodology: Tier 1
Reference EMEP/EEA Guidebook (July 2017), 1A4 Small combustion. Table 3.6, page 39, https://www.eea.europa.eu/publications/emep-eea-guidebook-2016/part-b-sectoral-guidance-chapters/1-energy/1-a-combustion/1-a-4-small-combustion-2016/view.
Describe How and Why this Method Was Chosen Due to the unavailability of country specific emission factors, the Tier 1 methodology has been used.
Type and source of activity data Quantity of fuel mil m3 and TJ, from Energy Balances of the Republic of Moldova and Statistical Yearbooks of the ATULBD.National Inventory Report: 1990-2016. Greenhouse Gas Sources and Sinks in the Republic of Moldova (2018), Tables 3-144, 3-145 and 3-146.
Type and source of EF and OF EMEP/EEA Guidebook (July 2017), 1A4 Small combustion. Table 3.6, page 39. Tier 1 emission factors for NFR source category 1.A.4.b, Using Biomass.
Fuels kg NOx / TJ kg CO / TJ kg NMVOC / TJ kg SO2 / TJBiomass fuels 50 (30-150) 4000 (1000-10000) 600 (20-3000) 11 (8-40)
Uncertainty of AD and source ±5%, expert judgementUncertainty of EF and source See the 95% confidence interval in the table above (in the brackets, lower-upper)
Potential Improvements Potential improvements within the 1A4 ‘Other Sectors’ category could be possible by updating the available AD on fuel consumption on the territory of the ATULBD and filling the existing gaps for certain years. GHG emissions will be reported by fuel types in the next inventory cycle.

Chapter 2: Methods and Data Documentation
2 - 65
Table 2.1.4.25: Information on source category 1A4c ‘Agriculture/Forestry/Fishing’, 1A4ci ‘Stationary’, solid fuels / CO2Sector EnergyCategory 1A4 Other sectorsSource / Fuel / Gas 1A4c Agriculture/Forestry/Fishing, 1A4ci ‘Stationary’, solid fuels / CO2
Key Category? NoCategory Description / Defini-tion Emissions from fuels combusted in pumps, grain drying, horticultural greenhouses and other agriculture, forestry or stationary combustion in the fishing industry.
Country Detail AD on fuel consumption are available in the EB of the RM, http://www.statistica.md/pageview.php?l=ro&idc=263&id=2197 and the statistical publications “Socio-economic development of the ATULBD”, http://mer.gospmr.org/gosudarstvennaya-sluzhba-statistiki/informacziya/o-soczialno-ekonomicheskom-polozhenii-pmr.html.
Equation(Describe variables for method used)
CO2 Emissions = Σ (Fuel Consumption j • Emission Factor j)Where:
j – type of fuelMethodology: Tier 1
Reference 2006 IPCC Guidelines, Volume 2, Chapter 2, https://www.ipcc-nggip.iges.or.jp/public/2006gl/pdf/2_Volume2/V2_2_Ch2_Stationary_Combustion.pdf.Describe How and Why this Method Was Chosen Due to the unavailability of country specific emission factors, the Tier 1 methodology has been used.
Type and source of activity data Quantity of fuel kt and TJ, from Energy Balances of the Republic of Moldova and Statistical Yearbooks of the ATULBD.National Inventory Report: 1990-2016. Greenhouse Gas Sources and Sinks in the Republic of Moldova (2018), Tables 3-147, 3-148 and 3-149.
Type and source of EF and OF
2006 IPCC Guidelines, Volume 2, Chapter 2, Table 2.5, page 2.22.Fuels CO2 Emission Factor Unit
Anthracite 98 300 kg CO2 / TJOther Bituminous Coal 94 600 kg CO2 / TJ
Uncertainty of AD and source ±5%, expert judgementUncertainty of EF and source ±5%, expert judgement
Potential Improvements Potential improvements within the 1A4 ‘Other Sectors’ category could be possible by updating the available AD on fuel consumption on the territory of the ATULBD and filling the existing gaps for certain years. Greenhouse gas emissions will be presented by fuel type in the next inventory cycle.
Table 2.1.4.26: Information on source category 1A4c ‘Agriculture/Forestry/Fishing’, 1A4ci ‘Stationary’, solid fuels / CH4, N2OSector EnergyCategory 1A4 Other sectorsSource / Fuel / Gas 1A4c Agriculture/Forestry/Fishing, 1A4ci ‘Stationary’, solid fuels / CH4, N2OKey Category? NoCategory Description / Defini-tion Emissions from fuels combusted in pumps, grain drying, horticultural greenhouses and other agriculture, forestry or stationary combustion in the fishing industry.
Country Detail AD on fuel consumption are available in the EB of the RM, http://www.statistica.md/pageview.php?l=ro&idc=263&id=2197 and the statistical publications “Socio-economic development of the ATULBD”, http://mer.gospmr.org/gosudarstvennaya-sluzhba-statistiki/informacziya/o-soczialno-ekonomicheskom-polozhenii-pmr.html.
Equation(Describe variables for method used)
CH4, N2O Emissions = Σ (Fuel Consumption j • Emission Factor j)Where:
j – type of fuelMethodology: Tier 1
Reference 2006 IPCC Guidelines, Volume 2, Chapter 2, https://www.ipcc-nggip.iges.or.jp/public/2006gl/pdf/2_Volume2/V2_2_Ch2_Stationary_Combustion.pdf.

Chapter 2: Methods and Data Documentation
2 - 66
Describe How and Why this Method Was Chosen Due to the unavailability of country specific emission factors, the Tier 1 methodology has been used.
Type and source of activity data Quantity of fuel in kt and TJ, from the Energy Balances of the Republic of Moldova and Statistical Yearbooks of the ATULBD.National Inventory Report: 1990-2016. Greenhouse Gas Sources and Sinks in the Republic of Moldova (2018), Tables 3-147, 3-148 and 3-149.
Type and source of EF and OF2006 IPCC Guidelines, Volume 2, Chapter 2, Table 2.5, page 2.23.
Fuels CH4, kg / TJ N2O, kg / TJAnthracite, Other Bituminous Coal 300 1.5
Uncertainty of AD and source ±5%, expert judgementUncertainty of EF and source ±50%, expert judgement
Potential Improvements Potential improvements within the 1A4 ‘Other Sectors’ category could be possible by updating the available AD on fuel consumption on the territory of the ATULBD and filling the existing gaps for certain years. GHG emissions will be reported by fuel types in the next inventory cycle.
Table 2.1.4.27: Information on source category 1A4c ‘Agriculture/Forestry/Fishing’, 1A4ci ‘Stationary’, solid fuels / NOx, CO, NMVOC and SO2Sector EnergyCategory 1A4 Other sectorsSource / Fuel / Gas 1A4c Agriculture/Forestry/Fishing, 1A4ci ‘Stationary’, solid fuels / NOx, CO, NMVOC and SO2
Key Category? Not applicable for pollutant emissions.Category Description / Defini-tion Emissions from fuels combusted in pumps, grain drying, horticultural greenhouses and other agriculture, forestry or stationary combustion in the fishing industry.
Country Detail AD on fuel consumption are available in the EB of the RM, http://www.statistica.md/pageview.php?l=ro&idc=263&id=2197 and the statistical publications “Socio-economic development of the ATULBD”, http://mer.gospmr.org/gosudarstvennaya-sluzhba-statistiki/informacziya/o-soczialno-ekonomicheskom-polozhenii-pmr.html.
Equation(Describe variables for method used)
NOx, CO, NMVOC and SO2 Emissions = Σ (Fuel Consumption j • Emission Factor j)Where:
j – type of fuelMethodology: Tier 1
Reference EMEP/EEA Guidebook (July 2017), 1A4 Small combustion. Table 3.7, page 40, https://www.eea.europa.eu/publications/emep-eea-guidebook-2016/part-b-sectoral-guidance-chapters/1-energy/1-a-combustion/1-a-4-small-combustion-2016/view.
Describe How and Why this Method Was Chosen Due to the unavailability of country specific emission factors, the Tier 1 methodology has been used.
Type and source of activity data Quantity of fuel in kt and TJ, from the Energy Balances of the Republic of Moldova and Statistical Yearbooks of the ATULBD.National Inventory Report: 1990-2016. Greenhouse Gas Sources and Sinks in the Republic of Moldova (2018), Tables 3-147, 3-148 and 3-149.
Type and source of EF and OFEMEP/EEA Guidebook 2016, 1A4 Small combustion. Table 3.7, page 38. Tier 1 emission factors for NFR source category 1.A.4.a/c, 1.A.5.a, Hard and Brown Coal
Fuels NOx, kg / TJ CO, kg / TJ NMVOC, kg / TJ SO2, kg / TJSolid Fuels 173 (150-200) 931 (150-2000) 88.8 (10-300) 900 (450-1000)
Uncertainty of AD and source ±5%Uncertainty of EF and source See the 95% confidence interval in the table above (in the brackets, lower-upper)
Potential Improvements Potential improvements within the 1A4 ‘Other Sectors’ category could be possible by updating the available AD on fuel consumption on the territory of the ATULBD and filling the existing gaps for certain years. GHG emissions will be reported by fuel types in the next inventory cycle.

Chapter 2: Methods and Data Documentation
2 - 67
Table 2.1.4.28: Information on source category 1A4c ‘Agriculture/Forestry/Fishing’, 1A4ci ‘Stationary’, liquid fuels / CO2Sector EnergyCategory 1A4 Other sectors Source / Fuel / Gas 1A4c Agriculture/Forestry/Fishing, 1A4ci ‘Stationary’, liquid fuels / CO2
Key Category? NoCategory Description / Defini-tion Emissions from fuels combusted in pumps, grain drying, horticultural greenhouses and other agriculture, forestry or stationary combustion in the fishing industry.
Country Detail AD on fuel consumption are available in the EB of the RM, http://www.statistica.md/pageview.php?l=ro&idc=263&id=2197.
Equation(Describe variables for method used)
CO2 Emissions = Σ (Fuel Consumption j • Emission Factor j)Where:
j – type of fuelMethodology: Tier 1
Reference 2006 IPCC Guidelines, Volume 2, Chapter 2, https://www.ipcc-nggip.iges.or.jp/public/2006gl/pdf/2_Volume2/V2_2_Ch2_Stationary_Combustion.pdf.Describe How and Why this Method Was Chosen Due to the unavailability of country specific emission factors, the Tier 1 methodology has been used.
Type and source of activity data Quantity of fuel in kt and TJ, from the Energy Balances of the Republic of Moldova. National Inventory Report: 1990-2016. Greenhouse Gas Sources and Sinks in the Republic of Moldova (2018), Tables 3-147, 3-148 and 3-149.
Type and source of EF and OF
2006 IPCC Guidelines, Volume 2, Chapter 2, Table 2.5, page 2.22.Fuels CO2 Emission Factor Unit
Diesel Oil 74 100 kg CO2 / TJResidual Fuel Oil 77 400 kg CO2 / TJ UnitOther Kerosene 71 900 kg CO2 / TJOther Petroleum Products 73 300 kg CO2 / TJ Unit
Uncertainty of AD and source ±5%, expert judgementUncertainty of EF and source ±5%, expert judgement
Potential Improvements Potential improvements within the 1A4 ‘Other Sectors’ category could be possible by updating the available AD on fuel consumption on the territory of the ATULBD and filling the existing gaps for certain years. GHG emissions will be reported by fuel types in the next inventory cycle.
Table 2.1.4.29: Information on source category 1A4c ‘Agriculture/Forestry/Fishing’, 1A4cii ‘Mobile’, liquid fuels / CO2Sector EnergyCategory 1A4 Other sectors Source / Fuel / Gas 1A4c Agriculture/Forestry/Fishing, 1A4cii ‘Mobile’ (‘Off-Road Vehicles and Other Machinery’), liquid fuels / CO2
Key Category? Tier 1: Yes: 1990 (L), 2016 (L, T); Tier 2: Yes: 1990 (L), 2016 (L, T) (1A4c Agriculture/Forestry/Fishing – aggregated for all types of fuels)Category Description / Defini-tion Emissions from fuels combusted in traction vehicles on farmland and in forests.
Country Detail AD on fuel consumption are available in the EB of the RM, http://www.statistica.md/pageview.php?l=ro&idc=263&id=2197 and Press Release “The State of Housing and Communal Services of the ATULBD”, http://mer.gospmr.org/gosudarstvennaya-sluzhba-statistiki/informacziya/sostoyanie-zhkx.html.
Equation(Describe variables for method used)
CO2 Emissions = Σ (Fuel Consumption j • Emission Factor j)Where:
j – type of fuelMethodology: Tier 1

Chapter 2: Methods and Data Documentation
2 - 68
Reference 2006 IPCC Guidelines, Volume 2, Chapter 3, Mobile Combustion, https://www.ipcc-nggip.iges.or.jp/public/2006gl/pdf/2_Volume2/V2_3_Ch3_Mobile_Combustion.pdf.Describe How and Why this Method Was Chosen Due to the unavailability of country specific emission factors, the Tier 1 methodology has been used.
Type and source of activity data Quantity of fuel in kt and TJ (NCV Gasoline – 43.72 TJ/ kt; Gas/Diesel Oil – 42.54 TJ/ kt) from Energy Balances of the Republic of Moldova and Statistical Yearbooks of the ATULBD. National Inventory Report: 1990-2016. Greenhouse Gas Sources and Sinks in the Republic of Moldova (2018), Tables 3-150, 3-151 and 3-152.
Type and source of EF and OF
2006 IPCC Guidelines, Volume 2, Chapter 3, Table 3.2.1, page 3.16.Fuels CO2 Emission Factor Unit
Motor Gasoline 69 300 kg CO2 / TJGas/Diesel Oil 74 100 kg CO2 / TJ UnitLPG 63 100 kg CO2 / TJ
Uncertainty of AD and source ±5%, expert judgementUncertainty of EF and source ±5%, expert judgement
Potential Improvements Potential improvements within the 1A4 ‘Other Sectors’ category could be possible by updating the available AD on fuel consumption on the territory of the ATULBD and filling the existing gaps for certain years. GHG emissions will be reported by fuel types in the next inventory cycle.
Table 2.1.4.30: Information on source category 1A4c ‘Agriculture/Forestry/Fishing’, 1A4ci ‘Stationary’, liquid fuels / CH4, N2OSector EnergyCategory 1A4 Other sectorsSource / Fuel / Gas 1A4c Agriculture/Forestry/Fishing, 1A4ci ‘Stationary’, liquid fuels / CH4, N2OKey Category? NoCategory Description / Defini-tion Emissions from fuels combusted in pumps, grain drying, horticultural greenhouses and other agriculture, forestry or stationary combustion in the fishing industry.
Country Detail AD on fuel consumption are available in the EB of the RM, http://www.statistica.md/pageview.php?l=ro&idc=263&id=2197.
Equation(Describe variables for method used)
CH4, N2O Emissions = Σ (Fuel Consumption j • Emission Factor j)Where:
j – type of fuelMethodology: Tier 1
Reference 2006 IPCC Guidelines, Volume 2, Chapter 2, https://www.ipcc-nggip.iges.or.jp/public/2006gl/pdf/2_Volume2/V2_2_Ch2_Stationary_Combustion.pdf.Describe How and Why this Method Was Chosen Due to the unavailability of country specific emission factors, the Tier 1 methodology has been used.
Type and source of activity data Quantity of fuel in kt and TJ, from the Energy Balances of the Republic of Moldova. National Inventory Report: 1990-2016. Greenhouse Gas Sources and Sinks in the Republic of Moldova (2018), Tables 3-147, 3-148 and 3-149.
Type and source of EF and OF2006 IPCC Guidelines, Volume 2, Chapter 2, Table 2.5, page 2.22.
Fuels CH4, kg / TJ N2O, kg / TJDiesel Oil, Residual Fuel Oil, Other Kerosene, Other Petroleum Products 10 0.6
Uncertainty of AD and source ±5%, expert judgementUncertainty of EF and source ±50%, expert judgement
Potential Improvements Potential improvements within the 1A4 ‘Other Sectors’ category could be possible by updating the available AD on fuel consumption on the territory of the ATULBD and filling the existing gaps for certain years. GHG emissions will be reported by fuel types in the next inventory cycle.

Chapter 2: Methods and Data Documentation
2 - 69
Table 2.1.4.31: Information on source category 1A4c ‘Agriculture/Forestry/Fishing’, 1A4cii ‘Mobile’, liquid fuels / CH4, N2OSector EnergyCategory 1A4 Other sectors Source / Fuel / Gas 1A4c Agriculture/Forestry/Fishing, 1A4cii ‘Mobile’ (‘Off-Road Vehicles and Other Machinery’), liquid fuels / CH4, N2OKey Category? NoCategory Description / Defini-tion Emissions from fuels combusted in traction vehicles on farmland and in forests.
Country Detail AD on fuel consumption are available in the EB of the RM, http://www.statistica.md/pageview.php?l=ro&idc=263&id=2197 and Press Release “The State of Housing and Communal Services of the ATULBD”, http://mer.gospmr.org/gosudarstvennaya-sluzhba-statistiki/informacziya/sostoyanie-zhkx.html.
Equation(Describe variables for method used)
CH4, N2O Emissions = Σ (Fuel Consumption j • Emission Factor j)Where:
j – type of fuelMethodology: Tier 1
Reference 2006 IPCC Guidelines, Volume 2, Chapter 3, Mobile Combustion, https://www.ipcc-nggip.iges.or.jp/public/2006gl/pdf/2_Volume2/V2_3_Ch3_Mobile_Combustion.pdf.Describe How and Why this Method Was Chosen Due to the unavailability of country specific emission factors, the Tier 1 methodology has been used
Type and source of activity data Quantity of fuel in kt and TJ (NCV Gasoline – 43.72 TJ/ kt; Gas/Diesel Oil – 42.54 TJ/ kt) from the Energy Balances of the Republic of Moldova and Statistical Yearbooks of the ATULBD. National Inventory Report: 1990-2016. Greenhouse Gas Sources and Sinks in the Republic of Moldova (2018), Tables 3-150, 3-151 and 3-152.
Type and source of EF and OF
2006 IPCC Guidelines, Volume 2, Chapter 3, Table 3.2.2, page 3.21.Fuels CH4, kg / TJ N2O, kg / TJ
Motor Gasoline 33 3.2Gas/Diesel Oil 3.9 3.9LPG 62 0.1
Uncertainty of AD and source ±5%, expert judgementUncertainty of EF and source ±50%, expert judgement
Potential Improvements Potential improvements within the 1A4 ‘Other Sectors’ category could be possible by updating the available AD on fuel consumption on the territory of the ATULBD and filling the existing gaps for certain years. GHG emissions will be reported by fuel types in the next inventory cycle.
Table 2.1.4.32: Information on source category 1A4c ‘Agriculture/Forestry/Fishing’, 1A4ci ‘Stationary’, liquid fuels / NOx, CO, NMVOC and SO2Sector EnergyCategory 1A4 Other sectorsSource / Fuel / Gas 1A4c Agriculture/Forestry/Fishing, 1A4ci ‘Stationary’, liquid fuels / NOx, CO, NMVOC and SO2
Key Category? Not applicable for pollutant emissions.Category Description / Defini-tion Emissions from fuels combusted in pumps, grain drying, horticultural greenhouses and other agriculture, forestry or stationary combustion in the fishing industry.
Country Detail AD on fuel consumption are available in the EB of the RM, http://www.statistica.md/pageview.php?l=ro&idc=263&id=2197.
Equation(Describe variables for method used)
NOx, CO, NMVOC and SO 2 Emissions = Σ (Fuel Consumption j • Emission Factor j)Where:
j – type of fuelMethodology: Tier 1

Chapter 2: Methods and Data Documentation
2 - 70
Reference EMEP/EEA Guidebook (July 2017), 1A4 Small combustion. Table 3.9, page 42, https://www.eea.europa.eu/publications/emep-eea-guidebook-2016/part-b-sectoral-guidance-chapters/1-energy/1-a-combustion/1-a-4-small-combustion-2016/view.
Describe How and Why this Method Was Chosen Due to the unavailability of country specific emission factors, the Tier 1 methodology has been used
Type and source of activity data Quantity of fuel in kt and TJ, from the Energy Balances of the Republic of Moldova. National Inventory Report: 1990-2016. Greenhouse Gas Sources and Sinks in the Republic of Moldova (2018), Tables 3-147, 3-148 and 3-149.
Type and source of EF and OFEMEP/EEA Guidebook (July 2017), 1A4 Small Combustion. Tables 3.9, page 42. Tier 1 Emission Factors for NFR Source Category 1.A.4.a/c, 1.A.5.a, Using Liquid Fuels
Fuels NOx, kg / TJ CO, kg / TJ NMVOC, kg / TJ SO2, kg / TJLiquid Fuels 306 (50-1319) 93 (2-200) 20 (0.018-70) 94 (28-140)
Uncertainty of AD and source ±5% - expert judgementUncertainty of EF and source See the 95% confidence interval in the table above (in the brackets, lower-upper)
Potential Improvements Potential improvements within the 1A4 ‘Other Sectors’ category could be possible by updating the available AD on fuel consumption on the territory of the ATULBD and filling the existing gaps for certain years. GHG emissions will be reported by fuel types in the next inventory cycle.
Table 2.1.4.33: Information on source category 1A4c ‘Agriculture/Forestry/Fishing’, 1A4cii ‘Mobile’, liquid fuels / NOx, CO and NMVOC Sector EnergyCategory 1A4 Other sectors Source / Fuel / Gas 1A4c Agriculture/Forestry/Fishing, 1A4cii ‘Mobile’ (‘Off-Road Vehicles and Other Machinery’), liquid fuels / NOx, CO and NMVOC Key Category? Not applicable for pollutant emissions.Category Description / Defini-tion Emissions from fuels combusted in traction vehicles on farmland and in forests.
Country Detail AD on fuel consumption are available in the EB of the RM, http://www.statistica.md/pageview.php?l=ro&idc=263&id=2197 and Press Release “The State of Housing and Communal Services of the ATULBD”, http://mer.gospmr.org/gosudarstvennaya-sluzhba-statistiki/informacziya/sostoyanie-zhkx.html.
Equation(Describe variables for method used)
NOx, CO, NMVOC and SO 2 Emissions = Σ (Fuel Consumption j • Emission Factor j)Where:
j – type of fuelMethodology: Tier 1
Reference EMEP/EEA Guidebook (May 2017), 1.A.4 Non Road Mobile Machinery, Tables 3-1, pages 23-24, https://www.eea.europa.eu/publications/emep-eea-guidebook-2016/part-b-sectoral-guidance-chapters/1-energy/1-a-combustion/1-a-4-non-road-1/view
Describe How and Why this Method Was Chosen Due to the unavailability of country specific emission factors, the Tier 1 methodology has been used.
Type and source of activity data Quantity of fuel in kt and TJ from the Energy Balances of the Republic of Moldova and Statistical Yearbooks of the ATULBD.National Inventory Report: 1990-2016. Greenhouse Gas Sources and Sinks in the Republic of Moldova (2018), Tables 3-150, 3-151 and 3-152.
Type and source of EF and OF
EMEP/EEA Guidebook (May 2017), 1.A.4 Non-road mobile machinery, Tables 3-1, pages 23-24. Fuels NOx, kg / kt CO, kg / kt NMVOC, kg / kt
Motor Gasoline 7 117 770 368 18 893 Gas/Diesel Oil 34 457 11 469 3 542 LPG 28 571 4 823 6 720
Uncertainty of AD and source ±5%

Chapter 2: Methods and Data Documentation
2 - 71
Uncertainty of EF and source Specialized uncertainty detailing is available for this sector. “EMEP/EEA Guidebook (May 2017), 1.A.4 Non road mobile machinery, 1.A.2.f ii; 1.A.4.a.ii, 1.A.4.b ii; 1.A.4.c ii; 1.A.4.c iii; 1.A.5.b, Table 4-1 ‘Uncer-tainty estimates for input data required to apply the proposed methodologies’.
Potential Improvements Potential improvements within the 1A4 ‘Other Sectors’ category could be possible by updating the available AD on fuel consumption on the territory of the ATULBD and filling the existing gaps for certain years. GHG emissions will be reported by fuel types in the next inventory cycle.
Table 2.1.4.34: Information on source category 1A4c ‘Agriculture/Forestry/Fishing’, 1A4ci ‘Stationary’, gaseous fuels / CO2Sector EnergyCategory 1A4 Other SectorsSource / Fuel / Gas 1A4c Agriculture/Forestry/Fishing, 1A4c i ‘Stationary’, gaseous fuels / CO2
Key Category? NoCategory Description / Defini-tion Emissions from fuels combusted in pumps, grain drying, horticultural greenhouses and other agriculture, forestry or stationary combustion in the fishing industry.
Country Detail AD on fuel consumption are available in the EB of the RM, http://www.statistica.md/pageview.php?l=ro&idc=263&id=2197 and the statistical publications “Socio-economic development of the ATULBD”, http://mer.gospmr.org/gosudarstvennaya-sluzhba-statistiki/informacziya/o-soczialno-ekonomicheskom-polozhenii-pmr.html.
Equation(Describe variables for method used)
CO2 Emissions = Σ (Fuel Consumption j • Emission Factor j)Where:
j – type of fuelMethodology: Tier 1
Reference 2006 IPCC Guidelines, Volume 2, Chapter 2, https://www.ipcc-nggip.iges.or.jp/public/2006gl/pdf/2_Volume2/V2_2_Ch2_Stationary_Combustion.pdf.Describe How and Why this Method Was Chosen Due to the unavailability of country specific emission factors, the Tier 1 methodology has been used.
Type and source of activity data Quantity of fuel mil m3 and TJ, from Energy Balances of the Republic of Moldova and Statistical Yearbooks of the ATULBD.National Inventory Report: 1990-2016. Greenhouse Gas Sources and Sinks in the Republic of Moldova (2018), Table 3-147, 3-148 and 3-149.
Type and source of EF and OF2006 IPCC Guidelines, Volume 2, Chapter 2, Table 2.4, page 2.21.
Fuels CO2 Emission Factor UnitNatural Gas 56 100 kg CO2 / TJ
Uncertainty of AD and source ±5% - expert judgementUncertainty of EF and source ±5% - expert judgement
Potential Improvements Potential improvements within the 1A4 ‘Other Sectors’ category could be possible by updating the available AD on fuel consumption on the territory of the ATULBD and filling the existing gaps for certain years. GHG emissions will be reported by fuel types in the next inventory cycle.
Table 2.1.4.35: Information on source category 1A4c ‘Agriculture/Forestry/Fishing’, 1A4ci ‘Stationary’, gaseous fuels / CH4, N2OSector EnergyCategory 1A4 Other sectorsSource / Fuel / Gas 1A4c Agriculture/Forestry/Fishing, 1A4ci ‘Stationary’, gaseous fuels / CH4, N2OKey Category? NoCategory Description / Defini-tion Emissions from fuels combusted in pumps, grain drying, horticultural greenhouses and other agriculture, forestry or stationary combustion in the fishing industry.
Country Detail AD on fuel consumption are available in the EB of the RM, http://www.statistica.md/pageview.php?l=ro&idc=263&id=2197 and the statistical publications “Socio-economic development of the ATULBD”, http://mer.gospmr.org/gosudarstvennaya-sluzhba-statistiki/informacziya/o-soczialno-ekonomicheskom-polozhenii-pmr.html.

Chapter 2: Methods and Data Documentation
2 - 72
Equation(Describe variables for method used)
CH4, N2O Emissions = Σ (Fuel Consumption j • Emission Factor j)Where:
j – type of fuelMethodology: Tier 1
Reference 2006 IPCC Guidelines, Volume 2, Chapter 2, https://www.ipcc-nggip.iges.or.jp/public/2006gl/pdf/2_Volume2/V2_2_Ch2_Stationary_Combustion.pdf.Describe How and Why this Method Was Chosen Due to the unavailability of country specific emission factors, the Tier 1 methodology has been used.
Type and source of activity data Quantity of fuel mil m3 and TJ, from Energy Balances of the Republic of Moldova and Statistical Yearbooks of the ATULBD.National Inventory Report: 1990-2016. Greenhouse Gas Sources and Sinks in the Republic of Moldova (2018), Table 3-147, 3-148 and 3-149.
Type and source of EF and OF2006 IPCC Guidelines, Volume 2, Chapter 2, Table 2.4, page 2.21.
Fuels CH4, kg / TJ N2O, kg / TJNatural Gas 5 0.1
Uncertainty of AD and source ±5%, expert judgementUncertainty of EF and source ±50%, expert judgement
Potential Improvements Potential improvements within the 1A4 ‘Other Sectors’ category could be possible by updating the available AD on fuel consumption on the territory of the ATULBD and filling the existing gaps for certain years. GHG emissions will be reported by fuel types in the next inventory cycle.
Table 2.1.4.36: Information on source category 1A4c ‘Agriculture/Forestry/Fishing’, 1A4ci ‘Stationary’, gaseous fuels / NOx, CO, NMVOC and SO2Sector EnergyCategory 1A4 Other sectorsSource / Fuel / Gas 1A4c Agriculture/Forestry/Fishing, 1A4ci ‘Stationary’, gaseous fuels / NOx, CO, NMVOC and SO2
Key Category? Not applicable for pollutant emissionsCategory Description / Defini-tion Emissions from fuels combusted in pumps, grain drying, horticultural greenhouses and other agriculture, forestry or stationary combustion in the fishing industry.
Country Detail AD on fuel consumption are available in the EB of the RM, http://www.statistica.md/pageview.php?l=ro&idc=263&id=2197 and the statistical publications “Socio-economic development of the ATULBD”, http://mer.gospmr.org/gosudarstvennaya-sluzhba-statistiki/informacziya/o-soczialno-ekonomicheskom-polozhenii-pmr.html.
Equation(Describe variables for method used)
NOx, CO, NMVOC and SO 2 Emissions = Σ (Fuel Consumption j • Emission Factor j)Where:
j – type of fuelMethodology: Tier 1
Reference EMEP/EEA Guidebook (July 2017), 1A4 Small combustion. Table 3.8, page 41, https://www.eea.europa.eu/publications/emep-eea-guidebook-2016/part-b-sectoral-guidance-chapters/1-energy/1-a-combustion/1-a-4-small-combustion-2016/view.
Describe How and Why this Method Was Chosen Due to the unavailability of country specific emission factors, the Tier 1 methodology has been used.
Type and source of activity data Quantity of fuel mil m3 and TJ, from Energy Balances of the Republic of Moldova and Statistical Yearbooks of the ATULBD.National Inventory Report: 1990-2016. Greenhouse Gas Sources and Sinks in the Republic of Moldova (2018), Table 3-147, 3-148 and 3-149.
Type and source of EF and OFEMEP/EEA Guidebook (July 2017), 1A4 Small combustion. Table 3.8, page 41. Tier 1 emission factors for NFR source category 1.A.4.a/c, 1.A.5.a, Using Gaseous Fuels
Fuels NOx, kg / TJ CO, kg / TJ NMVOC, kg / TJ SO2, kg / TJGaseous fuels 74 (46-103) 29 (21-48) 23 (14-33) 0.67 (0.4-0.94)
Uncertainty of AD and source ±5%

Chapter 2: Methods and Data Documentation
2 - 73
Uncertainty of EF and source See the 95% confidence interval in the table above (in the brackets, lower-upper)
Potential Improvements Potential improvements within the 1A4 ‘Other Sectors’ category could be possible by updating the available AD on fuel consumption on the territory of the ATULBD and filling the existing gaps for certain years. GHG emissions will be reported by fuel types in the next inventory cycle.
Table 2.1.4.37: Information on source category 1A4c ‘Agriculture/Forestry/Fishing’, 1A4ci ‘Stationary’, biomass / CO2Sector EnergyCategory 1A4 Other SectorsSource / Fuel / Gas 1A4c Agriculture/Forestry/Fishing, 1A4ci ‘Stationary’, biomass / CO2
Key Category? NoCategory Description / Defini-tion
CO2 emissions from biomass under the source category 1A4c ‘Agriculture/Forestry/Fishing’ have to be reported under the Memo Items (CO2 emissions from biomass). Emissions from fuels combusted in pumps, grain drying, horticultural greenhouses and other agriculture, forestry or stationary combustion in the fishing industry.
Country Detail AD on fuel consumption are available in the EB of the RM, http://www.statistica.md/pageview.php?l=ro&idc=263&id=2197.
Equation(Describe variables for method used)
CO2 Emissions = Σ (Fuel Consumption j • Emission Factor j)Where:
j – type of fuelMethodology: Tier 1
Reference 2006 IPCC Guidelines, Volume 2, Chapter 2, https://www.ipcc-nggip.iges.or.jp/public/2006gl/pdf/2_Volume2/V2_2_Ch2_Stationary_Combustion.pdf.Describe How and Why this Method Was Chosen Due to the unavailability of country specific emission factors, the Tier 1 methodology has been used.
Type and source of activity data Quantity of TJ, from Energy Balances of the Republic of Moldova. National Inventory Report: 1990-2016. Greenhouse Gas Sources and Sinks in the Republic of Moldova (2018), Table 3-147, 3-148 and 3-149.
Type and source of EF and OF
2006 IPCC Guidelines, Volume 2, Chapter 2, Table 2.5, page 2.23.Fuels CO2 Emission Factor Unit
Wood / Wood Waste, Charcoal 112 000 kg CO2 / TJOther Primary Solid Biomass 100 000 kg CO2 / TJ
Uncertainty of AD and source ±5% - expert judgementUncertainty of EF and source ±5% - expert judgement
Potential Improvements Potential improvements within the 1A4 ‘Other Sectors’ category could be possible by updating the available AD on fuel consumption on the territory of the ATULBD and filling the existing gaps for certain years. GHG emissions will be reported by fuel types in the next inventory cycle.
Table 2.1.4.38: Information on source category 1A4c Agriculture/Forestry/Fishing, 1A4ci ‘Stationary’, biomass / CH4, N2OSector EnergyCategory 1A4 Other sectorsSource / Fuel / Gas 1A4c Agriculture/Forestry/Fishing, 1A4c i ‘Stationary’, biomass / CH4, N2OKey Category? NoCategory Description / Defini-tion Emissions from fuels combusted in pumps, grain drying, horticultural greenhouses and other agriculture, forestry or stationary combustion in the fishing industry.
Country Detail AD on fuel consumption are available in the EB of the RM, http://www.statistica.md/pageview.php?l=ro&idc=263&id=2197.

Chapter 2: Methods and Data Documentation
2 - 74
Equation(Describe variables for method used)
CH4, N2O Emissions = Σ (Fuel Consumption j • Emission Factor j)Where:
j – type of fuelMethodology: Tier 1
Reference 2006 IPCC Guidelines, Volume 2, Chapter 2, https://www.ipcc-nggip.iges.or.jp/public/2006gl/pdf/2_Volume2/V2_2_Ch2_Stationary_Combustion.pdf.Describe How and Why this Method Was Chosen Due to the unavailability of country specific emission factors, the Tier 1 methodology has been used.
Type and source of activity data Quantity of fuel TJ, from Energy Balances of the Republic of Moldova. National Inventory Report: 1990-2016. Greenhouse Gas Sources and Sinks in the Republic of Moldova (2018), Table 3-147, 3-148 and 3-149.
Type and source of EF and OF2006 IPCC Guidelines, Volume 2, Chapter 2, Table 2.5, page 2.23.
Fuels CH4, kg / TJ N2O, kg / TJWood / Wood Waste, Other Primary Solid Biomass 300 4
Uncertainty of AD and source ±5%, expert judgementUncertainty of EF and source ±50%, expert judgement
Potential Improvements Potential improvements within the 1A4 ‘Other Sectors’ category could be possible by updating the available AD on fuel consumption on the territory of the ATULBD and filling the existing gaps for certain years. GHG emissions will be reported by fuel types in the next inventory cycle.
Table 2.1.4.39: Information on source category 1A4c Agriculture/Forestry/Fishing, 1A4ci ‘Stationary’, biomass / NOx, CO, NMVOC and SO2Sector EnergyCategory 1A4 Other SectorsSource / Fuel / Gas 1A4c Agriculture/Forestry/Fishing, 1A4ci ‘Stationary’, biomass / NOx, CO, NMVOC and SO2
Key Category? Not applicable for pollutant emissionsCategory Description / Defini-tion Emissions from fuels combusted in pumps, grain drying, horticultural greenhouses and other agriculture, forestry or stationary combustion in the fishing industry.
Country Detail AD on fuel consumption are available in the EB of the RM, http://www.statistica.md/pageview.php?l=ro&idc=263&id=2197.
Equation(Describe variables for method used)
NOx, CO, NMVOC and SO 2 Emissions = Σ (Fuel Consumption j • Emission Factor j)Where:
j – type of fuelMethodology: Tier 1
Reference EMEP/EEA Guidebook (July 2017), 1A4 Small combustion. Table 3.10, page 43, https://www.eea.europa.eu/publications/emep-eea-guidebook-2016/part-b-sectoral-guidance-chapters/1-energy/1-a-combustion/1-a-4-small-combustion-2016/view.
Describe How and Why this Method Was Chosen Due to the unavailability of country specific emission factors, the Tier 1 methodology has been used.
Type and source of activity data Quantity of fuel TJ, from Energy Balances of the Republic of Moldova.National Inventory Report: 1990-2016. Greenhouse Gas Sources and Sinks in the Republic of Moldova (2018), Table 3-147, 3-148 and 3-149.
Type and source of EF and OFEMEP/EEA Guidebook (July 2017), 1A4 Small combustion. Table 3.10, page 43. Tier 1 emission factors for NFR source category 1.A.4.a/c, 1.A.5.a, Using Solid Biomass
Fuels kg NOx / TJ kg CO / TJ kg NMVOC / TJ kg SO2 / TJSolid biomass 91 (20-120) 570 (50-4000) 300 (5-500) 11 (8-40)
Uncertainty of AD and source ±5%, expert judgementUncertainty of EF and source See the 95% confidence interval in the table above (in the brackets, lower-upper)

Chapter 2: Methods and Data Documentation
2 - 75
Potential Improvements Potential improvements within the 1A4 ‘Other Sectors’ category could be possible by updating the available AD on fuel consumption on the territory of the ATULBD and filling the existing gaps for certain years. GHG emissions will be reported by fuel types in the next inventory cycle.
2.1.5. Category 1A5 ‘Other’
Tables 2.1.5.1 – 2.1.5.15 below comprise relevant information on source categories comprised within the inventory, including description of each source by type of fuel allocated to category 1A5 ‘Other’.
Table 2.1.5.1: Information on source category 1A5 ‘Other’, 1A5a ‘Stationary’, solid fuels / CO2Sector EnergyCategory 1A5 Other Source / Fuel / Gas 1A5a Stationary, solid fuels / CO2
Key Category? NoCategory Description / Defini-tion Emissions from fuel combustion in stationary sources that are not specified elsewhere.
Country Detail
The Energy Balances of the RM (Chapter S.2.1 “Consumed as Fuel or Energy” and columns: “For Other Works and Needs” and “Used for other purposes”) represented the main source of reference for AD associated to fuel consumption on the territory of the RBDR. Another relevant source of reference was the Ministry of Defense of the RM, which provides information on fuel combustion for military transport. The activity data pertaining to the fuel consumption on the territory of the LBDR were collected from the Statistical Yearbooks of the ATULBD (these are available for certain types of fuels (residual fuel oil and coal) only for 2008-2016 time series). Between 1990 and 2016, the GHG emissions from 1A5 ‘Other’ category decreased in the RM by circa 98.2 per cent. By 2016 the share of emissions from station-ary combustion increased up to circa 42.6 per cent.
Equation(Describe variables for method used)
Emissions GHG, fuel = Fuel Consumption fuel • Emission factor GHG, fuel (Equation 2.1)Where:
Emissions GHG, fuel - emission of the greenhouse gases by type of fuel (kg GHG);Fuel Consumption fuel - amount of fuel consumed (TJ);Emission factor GHG, fuel - default emission factor of a given greenhouse gases by type of fuel (kg gas/TJ). For CO2, it includes the carbon oxidation factor, assumed to be 1.
Methodology: Tier 1
Reference2006 IPCC Guidelines for National Greenhouse Gas Inventories, Volume 2: Energy, Chapter 2: Stationary Combustion, p. 2.11 (available on: https://www.ipcc-nggip.iges.or.jp/public/2006gl/pdf/2_Volume2/V2_2_Ch2_Stationary_Combustion.pdf).National Inventory Report: 1990-2016. Greenhouse Gas Sources and Sinks in the Republic of Moldova (2018).
Describe How and Why this Method Was Chosen Due to the unavailability of country specific emission factors, the Tier 1 methodology has been used.
Type and source of activity data Quantity of fuel (TJ) – activity data from Energy Balances of the Republic of Moldova and Quantity of fuel (t) – Statistical Yearbooks of the ATULBD, NCV of Other Bituminous Coal (25.44 TJ/kt). Quantity of fuel consumed is reported in the Table 3-168 from National Inventory Report: 1990-2016. Greenhouse Gas Sources and Sinks in the Republic of Moldova.
Type and source of EF and OF
2006 IPCC Guidelines for National Greenhouse Gas Inventories, Volume 2: Energy, Chapter 2: Stationary Combustion, page 2.16, Table 2.2.Fuel type CO2 Emission Factor Unit
Other Bituminous Coal 94.600 t CO2 / TJAnthracite 98.300 t CO2 / TJ
Uncertainty of AD and source ± 5%, expert judgementUncertainty of EF and source ± 5%, expert judgement
Potential Improvements For the next inventory cycle, potential improvements in 1A5 ‘Other’ category could be performed if new AD on fuel consumption would be available for the territory on the LBDR and filling the existing gaps for certain years.

Chapter 2: Methods and Data Documentation
2 - 76
Table 2.1.5.2: Information on source category 1A5 ‘Other’, 1A5a ‘Stationary’, solid fuels / CH4, N2OSector EnergyCategory 1A5 Other Source / Fuel / Gas 1A5a Stationary, solid fuels / CH4, N2OKey Category? NoCategory Description / Defini-tion Emissions from fuel combustion in stationary sources that are not specified elsewhere.
Country Detail
The Energy Balances of the RM (Chapter S.2.1 “Consumed as Fuel or Energy” and columns: “For Other Works and Needs” and “Used for other purposes”) represented the main source of reference for AD associated to fuel consumption on the territory of the RBDR. Another relevant source of reference was the Ministry of Defense of the RM, which provides information on fuel combustion for military transport. The activity data pertaining to the fuel consumption on the territory of the LBDR were collected from the Statistical Yearbooks of the ATULBD (these are available for certain types of fuels (residual fuel oil and coal) only for 2008-2016 time series). Between 1990 and 2016, the GHG emissions from 1A5 ‘Other’ category decreased in the RM by circa 98.2 per cent. By 2016 the share of emissions from station-ary combustion increased up to circa 42.6 per cent.
Equation(Describe variables for method used)
Emissions GHG, fuel = Fuel Consumption fuel • Emission factor GHG, fuel (Equation 2.1)Where:
Emissions GHG, fuel - emission of the greenhouse gases by type of fuel (kg GHG);Fuel Consumption fuel - amount of fuel consumed (TJ);Emission factor GHG, fuel - default emission factor of a given greenhouse gases by type of fuel (kg gas/TJ).
Methodology: Tier 1
Reference2006 IPCC Guidelines for National Greenhouse Gas Inventories, Volume 2: Energy, Chapter 2: Stationary Combustion, p. 2.11 (available on: https://www.ipcc-nggip.iges.or.jp/public/2006gl/pdf/2_Volume2/V2_2_Ch2_Stationary_Combustion.pdf).National Inventory Report: 1990-2016. Greenhouse Gas Sources and Sinks in the Republic of Moldova (2018).
Describe How and Why this Method Was Chosen Due to the unavailability of country specific emission factors, the Tier 1 methodology has been used.
Type and source of activity data Quantity of fuel (TJ) – activity data from Energy Balances of the Republic of Moldova and Quantity of fuel (t) – Statistical Yearbooks of the ATULBD, NCV of Other Bituminous Coal (25.44 TJ/kt). Quantity of fuel consumed is reported in the Table 3-168 from National Inventory Report: 1990-2016. Greenhouse Gas Sources and Sinks in the Republic of Moldova.
Type and source of EF and OF
2006 IPCC Guidelines for National Greenhouse Gas Inventories, Volume 2: Energy, Chapter 2: Stationary Combustion, page 2.16, Table 2.2.
Fuel typeCH4 N2O
kg/TJOther Bituminous Coal, Anthracite 1.0 1.5
Uncertainty of AD and source ± 5%, expert judgementUncertainty of EF and source ± 50%, expert judgement
Potential Improvements For the next inventory cycle, potential improvements in 1A5 ‘Other’ category could be performed if new AD on fuel consumption would be available for the territory on the LBDR and filling the existing gaps for certain years.
Table 2.1.5.3: Information on source category 1A5 ‘Other’, 1A5a ‘Stationary’, solid fuels / NOx, CO, NMVOC and SO2Sector EnergyCategory 1A5 Other Source / Fuel / Gas 1A5a Stationary, solid fuels / NOx, CO, NMVOC and SO2
Key Category? Not applicable for pollutant emissionsCategory Description / Defini-tion Emissions from fuel combustion in stationary sources that are not specified elsewhere.

Chapter 2: Methods and Data Documentation
2 - 77
Country Detail
The Energy Balances of the RM (Chapter S.2.1 “Consumed as Fuel or Energy” and columns: “For Other Works and Needs” and “Used for other purposes”) represented the main source of reference for AD associated to fuel consumption on the territory of the RBDR. Another relevant source of reference was the Ministry of Defense of the RM, which provides information on fuel combustion for military transport. The activity data pertaining to the fuel consumption on the territory of the LBDR were collected from the Statistical Yearbooks of the ATULBD (these are available for certain types of fuels (residual fuel oil and coal) only for 2008-2016 time series). Between 1990 and 2016, the GHG emissions from 1A5 ‘Other’ category decreased in the RM by circa 98.2 per cent. By 2016 the share of emissions from station-ary combustion increased up to circa 42.6 per cent.
Equation(Describe variables for method used)
E pollutant = AR fuel consumption • EF pollutant (Equation 1)Where:
E pollutant - the emission of the specified pollutant;AR fuel consumption - the activity rate for fuel consumption;EF pollutant - the emission factor for this pollutant.
Methodology: Tier 1
ReferenceEMEP/EEA air pollutant emission inventory guidebook 2016- Last update July 2017,1.A.4.a.i, 1.A.4.b.i, 1.A.4.c.i, 1.A.5.a Small combustion, page 34 (available on:https://www.eea.europa.eu/publications/emep-eea-guidebook-2016/part-b-sectoral-guidance-chapters/1-energy/1-a-combustion/1-a-4-small-combustion-2016/view).National Inventory Report: 1990-2016. Greenhouse Gas Sources and Sinks in the Republic of Moldova (2018).
Describe How and Why this Method Was Chosen Due to the unavailability of country specific emission factors, the Tier 1 methodology has been used.
Type and source of activity data Quantity of fuel (TJ) – activity data from Energy Balances of the Republic of Moldova and Quantity of fuel (t) – Statistical Yearbooks of the ATULBD, NCV of Other Bituminous Coal (25.44 TJ/kt). Quantity of fuel consumed is reported in the Table 3-168 from National Inventory Report: 1990-2016. Greenhouse Gas Sources and Sinks in the Republic of Moldova.
Type and source of EF and OF
EMEP/EEA air pollutant emission inventory guidebook, July 2017. 1A4 Small combustion, page 40, Table 3.7.
Fuel typeNOx CO NMVOC SO2
kg/TJHard Coal and Brown Coal 173 (150-200) 931 (150-2000) 88.8 (10-300) 840 (450-1000)
Uncertainty of AD and source ± 5%, expert judgementUncertainty of EF and source See the 95% confidence interval in the table above (in the brackets, lower-upper).
Potential Improvements For the next inventory cycle, potential improvements in 1A5 ‘Other’ category could be performed if new AD on fuel consumption would be available for the territory on the LBDR and filling the existing gaps for certain years.
Table 2.1.5.4: Information on source category 1A5 ‘Other’, 1A5a ‘Stationary’, liquid fuels / CO2Sector EnergyCategory 1A5 Other Source / Fuel / Gas 1A5a Stationary, liquid fuels / CO2
Key Category? NoCategory Description / Defini-tion Emissions from fuel combustion in stationary sources that are not specified elsewhere.
Country Detail
The Energy Balances of the RM (Chapter S.2.1 “Consumed as Fuel or Energy” and columns: “For Other Works and Needs” and “Used for other purposes”) represented the main source of reference for AD associated to fuel consumption on the territory of the RBDR. Another relevant source of reference was the Ministry of Defense of the RM, which provides information on fuel combustion for military transport. The activity data pertaining to the fuel consumption on the territory of the LBDR were collected from the Statistical Yearbooks of the ATULBD (these are available for certain types of fuels (residual fuel oil and coal) only for 2008-2016 time series). Between 1990 and 2016, the GHG emissions from 1A5 ‘Other’ category decreased in the RM by circa 98.2 per cent. By 2016 the share of emissions from station-ary combustion increased up to circa 42.6 per cent.

Chapter 2: Methods and Data Documentation
2 - 78
Equation(Describe variables for method used)
Emissions GHG, fuel = Fuel Consumption fuel • Emission factor GHG, fuel (Equation 2.1)Where:
Emissions GHG, fuel - emission of the greenhouse gases by type of fuel (kg GHG);Fuel Consumption fuel - amount of fuel consumed (TJ);Emission factor GHG, fuel - default emission factor of a given greenhouse gases by type of fuel (kg gas/TJ). For CO2, it includes the carbon oxidation factor, assumed to be 1.
Methodology: Tier 1
Reference2006 IPCC Guidelines for National Greenhouse Gas Inventories, Volume 2: Energy, Chapter 2: Stationary Combustion, p. 2.11 (available on: https://www.ipcc-nggip.iges.or.jp/public/2006gl/pdf/2_Volume2/V2_2_Ch2_Stationary_Combustion.pdf).National Inventory Report: 1990-2016. Greenhouse Gas Sources and Sinks in the Republic of Moldova (2018).
Describe How and Why this Method Was Chosen Due to the unavailability of country specific emission factors, the Tier 1 methodology has been used.
Type and source of activity data Quantity of fuel (TJ) – activity data from Energy Balances of the Republic of Moldova. Quantity of fuel consumed is reported in the Table 3-168 from National Inventory Report: 1990-2016. Greenhouse Gas Sources and Sinks in the Republic of Moldova.
Type and source of EF and OF
2006 IPCC Guidelines for National Greenhouse Gas Inventories, Volume 2: Energy, Chapter 2: Stationary Combustion, page 2.16, Table 2.2.Fuel type CO2 Emission Factor Unit
Residual Fuel Oil 77.400 t CO2 /TJOther Kerosene 71.900 t CO2 /TJ
Uncertainty of AD and source ± 5%, expert judgementUncertainty of EF and source ± 5%, expert judgement
Potential Improvements For the next inventory cycle, potential improvements in 1A5 ‘Other’ category could be performed if new AD on fuel consumption would be available for the territory on the LBDR and filling the existing gaps for certain years.
Table 2.1.5.5: Information on source category 1A5 ‘Other’, 1A5a ‘Stationary’, liquid fuels / CH4, N2OSector EnergyCategory 1A5 Other Source / Fuel / Gas 1A5a Stationary, liquid fuels / CH4, N2OKey Category? NoCategory Description / Defini-tion Emissions from fuel combustion in stationary sources that are not specified elsewhere.
Country Detail
The Energy Balances of the RM (Chapter S.2.1 “Consumed as Fuel or Energy” and columns: “For Other Works and Needs” and “Used for other purposes”) represented the main source of reference for AD associated to fuel consumption on the territory of the RBDR. Another relevant source of reference was the Ministry of Defense of the RM, which provides information on fuel combustion for military transport. The activity data pertaining to the fuel consumption on the territory of the LBDR were collected from the Statistical Yearbooks of the ATULBD (these are available for certain types of fuels (residual fuel oil and coal) only for 2008-2016 time series). Between 1990 and 2016, the GHG emissions from 1A5 ‘Other’ category decreased in the RM by circa 98.2 per cent. By 2016 the share of emissions from station-ary combustion increased up to circa 42.6 per cent.
Equation(Describe variables for method used)
Emissions GHG, fuel = Fuel Consumption fuel • Emission factor GHG, fuel (Equation 2.1)Where:
Emissions GHG, fuel - emission of the greenhouse gases by type of fuel (kg GHG);Fuel Consumption fuel - amount of fuel consumed (TJ);Emission factor GHG, fuel - default emission factor of a given greenhouse gases by type of fuel (kg gas/TJ).
Methodology: Tier 1
Reference2006 IPCC Guidelines for National Greenhouse Gas Inventories, Volume 2: Energy, Chapter 2: Stationary Combustion, p. 2.11 (available on: https://www.ipcc-nggip.iges.or.jp/public/2006gl/pdf/2_Volume2/V2_2_Ch2_Stationary_Combustion.pdf).National Inventory Report: 1990-2016. Greenhouse Gas Sources and Sinks in the Republic of Moldova (2018).

Chapter 2: Methods and Data Documentation
2 - 79
Describe How and Why this Method Was Chosen Due to the unavailability of country specific emission factors, the Tier 1 methodology has been used.
Type and source of activity data Quantity of fuel (TJ) – activity data from Energy Balances of the Republic of Moldova. Quantity of fuel consumed is reported in the Table 3-168 from National Inventory Report: 1990-2016. Greenhouse Gas Sources and Sinks in the Republic of Moldova.
Type and source of EF and OF
2006 IPCC Guidelines for National Greenhouse Gas Inventories, Volume 2: Energy, Chapter 2: Stationary Combustion, page 2.16, Table 2.2.
Fuel typeCH4 N2O
kg/TJResidual Fuel Oil, Other Kerosene 3.0 0.6
Uncertainty of AD and source ± 5%, expert judgementUncertainty of EF and source ± 50%, expert judgement
Potential Improvements For the next inventory cycle, potential improvements in 1A5 ‘Other’ category could be performed if new AD on fuel consumption would be available for the territory on the LBDR and filling the existing gaps for certain years.
Table 2.1.5.6: Information on source category 1A5 ‘Other’, 1A5a ‘Stationary’, liquid fuels / NOx, CO, NMVOC and SO2Sector EnergyCategory 1A5 Other Source / Fuel / Gas 1A5a Stationary, liquid fuels / NOx, CO, NMVOC and SO2
Key Category? Not applicable for pollutant emissionsCategory Description / Defini-tion Emissions from fuel combustion in stationary sources that are not specified elsewhere.
Country Detail
The Energy Balances of the RM (Chapter S.2.1 “Consumed as Fuel or Energy” and columns: “For Other Works and Needs” and “Used for other purposes”) represented the main source of reference for AD associated to fuel consumption on the territory of the RBDR. Another relevant source of reference was the Ministry of Defense of the RM, which provides information on fuel combustion for military transport. The activity data pertaining to the fuel consumption on the territory of the LBDR were collected from the Statistical Yearbooks of the ATULBD (these are available for certain types of fuels (residual fuel oil and coal) only for 2008-2016 time series). Between 1990 and 2016, the GHG emissions from 1A5 ‘Other’ category decreased in the RM by circa 98.2 per cent. By 2016 the share of emissions from station-ary combustion increased up to circa 42.6 per cent.
Equation(Describe variables for method used)
E pollutant = AR fuel consumption • EF pollutant (Equation 1)Where:
E pollutant - the emission of the specified pollutant;AR fuel consumption - the activity rate for fuel consumption;EF pollutant - the emission factor for this pollutant.
Methodology: Tier 1
ReferenceEMEP/EEA air pollutant emission inventory guidebook 2016- Last update July 2017,1.A.4.a.i, 1.A.4.b.i, 1.A.4.c.i, 1.A.5.a Small combustion, page 34 (available on:https://www.eea.europa.eu/publications/emep-eea-guidebook-2016/part-b-sectoral-guidance-chapters/1-energy/1-a-combustion/1-a-4-small-combustion-2016/view).National Inventory Report: 1990-2016. Greenhouse Gas Sources and Sinks in the Republic of Moldova (2018).
Describe How and Why this Method Was Chosen Due to the unavailability of country specific emission factors, the Tier 1 methodology has been used.
Type and source of activity data Quantity of fuel (TJ) – activity data from Energy Balances of the Republic of Moldova. Quantity of fuel consumed is reported in the Table 3-168 from National Inventory Report: 1990-2016. Greenhouse Gas Sources and Sinks in the Republic of Moldova.

Chapter 2: Methods and Data Documentation
2 - 80
Type and source of EF and OF
EMEP/EEA air pollutant emission inventory guidebook, July 2017. 1A4 small combustion, page 42, Table 3.9.
Fuel type NOx CO NMVOC SO2
kg/TJLiquid Fuels 306 (50-1319) 93 (2-200) 20 (0.018-70) 94 (28-140)
Uncertainty of AD and source ± 5%, expert judgementUncertainty of EF and source See the 95% confidence interval in the table above (in the brackets, lower-upper).
Potential Improvements For the next inventory cycle, potential improvements in 1A5 ‘Other’ category could be performed if new AD on fuel consumption would be available for the territory on the LBDR and filling the existing gaps for certain years.
Table 2.1.5.7: Information on source category 1A5 ‘Other’, 1A5a ‘Stationary’, gaseous fuels / CO2Sector EnergyCategory 1A5 Other Source / Fuel / Gas 1A5a Stationary, gaseous fuels / CO2
Key Category? NoCategory Description / Defini-tion Emissions from fuel combustion in stationary sources that are not specified elsewhere.
Country Detail
The Energy Balances of the RM (Chapter S.2.1 “Consumed as Fuel or Energy” and columns: “For Other Works and Needs” and “Used for other purposes”) represented the main source of reference for AD associated to fuel consumption on the territory of the RBDR. Another relevant source of reference was the Ministry of Defense of the RM, which provides information on fuel combustion for military transport. The activity data pertaining to the fuel consumption on the territory of the LBDR were collected from the Statistical Yearbooks of the ATULBD (these are available for certain types of fuels (residual fuel oil and coal) only for 2008-2016 time series). Between 1990 and 2016, the GHG emissions from 1A5 ‘Other’ category decreased in the RM by circa 98.2 per cent. By 2016 the share of emissions from station-ary combustion increased up to circa 42.6 per cent.
Equation(Describe variables for method used)
Emissions GHG, fuel = Fuel Consumption fuel • Emission factor GHG, fuel (Equation 2.1)Where:
Emissions GHG, fuel - emission of the greenhouse gases by type of fuel (kg GHG);Fuel Consumption fuel - amount of fuel consumed (TJ);Emission factor GHG, fuel - default emission factor of a given greenhouse gases by type of fuel (kg gas/TJ). For CO2, it includes the carbon oxidation factor, assumed to be 1.
Methodology: Tier 1
Reference2006 IPCC Guidelines for National Greenhouse Gas Inventories, Volume 2: Energy, Chapter 2: Stationary Combustion, p. 2.11 (available on: https://www.ipcc-nggip.iges.or.jp/public/2006gl/pdf/2_Volume2/V2_2_Ch2_Stationary_Combustion.pdf).National Inventory Report: 1990-2016. Greenhouse Gas Sources and Sinks in the Republic of Moldova (2018).
Describe How and Why this Method Was Chosen Due to the unavailability of country specific emission factors, the Tier 1 methodology has been used.
Type and source of activity data Quantity of fuel (TJ) – activity data from Energy Balances of the Republic of Moldova. Quantity of fuel consumed is reported in the Table 3-168 from National Inventory Report: 1990-2016. Greenhouse Gas Sources and Sinks in the Republic of Moldova.
Type and source of EF and OF
2006 IPCC Guidelines for National Greenhouse Gas Inventories, Volume 2: Energy, Chapter 2: Stationary Combustion, page 2.17, Table 2.2.Fuel type CO2 Emission Factor Unit
Natural Gas 56.100 t CO2 /TJLiquefied Petroleum Gases 63.100 t CO2 /TJ
Uncertainty of AD and source ± 5%, expert judgementUncertainty of EF and source ± 5%, expert judgement

Chapter 2: Methods and Data Documentation
2 - 81
Potential Improvements For the next inventory cycle, potential improvements in 1A5 ‘Other’ category could be performed if new AD on fuel consumption would be available for the territory on the LBDR and filling the existing gaps for certain years.
Table 2.1.5.8: Information on source category 1A5 ‘Other’, 1A5a ‘Stationary’, gaseous fuels / CH4, N2OSector EnergyCategory 1A5 Other Source / Fuel / Gas 1A5a Stationary, gaseous fuels / CH4, N2OKey Category? NoCategory Description / Defini-tion Emissions from fuel combustion in stationary sources that are not specified elsewhere.
Country Detail
The Energy Balances of the RM (Chapter S.2.1 “Consumed as Fuel or Energy” and columns: “For Other Works and Needs” and “Used for other purposes”) represented the main source of reference for AD associated to fuel consumption on the territory of the RBDR. Another relevant source of reference was the Ministry of Defense of the RM, which provides information on fuel combustion for military transport. The activity data pertaining to the fuel consumption on the territory of the LBDR were collected from the Statistical Yearbooks of the ATULBD (these are available for certain types of fuels (residual fuel oil and coal) only for 2008-2016 time series). Between 1990 and 2016, the GHG emissions from 1A5 ‘Other’ category decreased in the RM by circa 98.2 per cent. By 2016 the share of emissions from station-ary combustion increased up to circa 42.6 per cent.
Equation(Describe variables for method used)
Emissions GHG, fuel = Fuel Consumption fuel • Emission factor GHG, fuel (Equation 2.1)Where:
Emissions GHG, fuel - emission of the greenhouse gases by type of fuel (kg GHG);Fuel Consumption fuel - amount of fuel consumed (TJ);Emission factor GHG, fuel - default emission factor of a given greenhouse gases by type of fuel (kg gas/TJ).
Methodology: Tier 1
Reference2006 IPCC Guidelines for National Greenhouse Gas Inventories, Volume 2: Energy, Chapter 2: Stationary Combustion, p. 2.11 (available on: https://www.ipcc-nggip.iges.or.jp/public/2006gl/pdf/2_Volume2/V2_2_Ch2_Stationary_Combustion.pdf).National Inventory Report: 1990-2016. Greenhouse Gas Sources and Sinks in the Republic of Moldova (2018).
Describe How and Why this Method Was Chosen Due to the unavailability of country specific emission factors, the Tier 1 methodology has been used.
Type and source of activity data Quantity of fuel (TJ) – activity data from Energy Balances of the Republic of Moldova. Quantity of fuel consumed is reported in the Table 3-168 from National Inventory Report: 1990-2016. Greenhouse Gas Sources and Sinks in the Republic of Moldova.
Type and source of EF and OF
2006 IPCC Guidelines for National Greenhouse Gas Inventories, Volume 2: Energy, Chapter 2: Stationary Combustion, page 2.17, Table 2.2.
Fuel typeCH4 N2O
kg/TJNatural Gas, Liquefied Petroleum Gases 1.0 0.1
Uncertainty of AD and source ± 5%, expert judgementUncertainty of EF and source ± 50%, expert judgement
Potential Improvements For the next inventory cycle, potential improvements in 1A5 ‘Other’ category could be performed if new AD on fuel consumption would be available for the territory on the LBDR and filling the existing gaps for certain years.
Table 2.1.5.9: Information on source category 1A5 ‘Other’, 1A5a ‘Stationary’, gaseous fuels / NOx, CO, NMVOC and SO2Sector EnergyCategory 1A5 Other Source / Fuel / Gas 1A5a Stationary, gaseous fuels / NOx, CO, NMVOC and SO2

Chapter 2: Methods and Data Documentation
2 - 82
Key Category? Not applicable for pollutant emissionsCategory Description / Defini-tion Emissions from fuel combustion in stationary sources that are not specified elsewhere.
Country Detail
The Energy Balances of the RM (Chapter S.2.1 “Consumed as Fuel or Energy” and columns: “For Other Works and Needs” and “Used for other purposes”) represented the main source of reference for AD associated to fuel consumption on the territory of the RBDR. Another relevant source of reference was the Ministry of Defense of the RM, which provides information on fuel combustion for military transport. The activity data pertaining to the fuel consumption on the territory of the LBDR were collected from the Statistical Yearbooks of the ATULBD (these are available for certain types of fuels (residual fuel oil and coal) only for 2008-2016 time series). Between 1990 and 2016, the GHG emissions from 1A5 ‘Other’ category decreased in the RM by circa 98.2 per cent. By 2016 the share of emissions from station-ary combustion increased up to circa 42.6 per cent.
Equation(Describe variables for method used)
E pollutant = AR fuel consumption • EF pollutant (Equation 1)Where:
E pollutant - the emission of the specified pollutant;AR fuel consumption - the activity rate for fuel consumption;EF pollutant - the emission factor for this pollutant.
Methodology: Tier 1
ReferenceEMEP/EEA air pollutant emission inventory guidebook 2016- Last update July 2017,1.A.4.a.i, 1.A.4.b.i, 1.A.4.c.i, 1.A.5.a Small combustion, page 34 (available on:https://www.eea.europa.eu/publications/emep-eea-guidebook-2016/part-b-sectoral-guidance-chapters/1-energy/1-a-combustion/1-a-4-small-combustion-2016/view).National Inventory Report: 1990-2016. Greenhouse Gas Sources and Sinks in the Republic of Moldova (2018).
Describe How and Why this Method Was Chosen Due to the unavailability of country specific emission factors, the Tier 1 methodology has been used.
Type and source of activity data Quantity of fuel (TJ) – activity data from Energy Balances of the Republic of Moldova. Quantity of fuel consumed is reported in the Table 3-168 from National Inventory Report: 1990-2016. Greenhouse Gas Sources and Sinks in the Republic of Moldova.
Type and source of EF and OF
EMEP/EEA air pollutant emission inventory guidebook, July 2017. 1A4 small combustion, page 41, Table 3.8.
Fuel typeNOx CO NMVOC SO2
kg/TJGaseous Fuels 74 (46-103) 29 (21-48) 23 (14-33) 0.67 (0.40-0.94)
Uncertainty of AD and source ± 5%, expert judgementUncertainty of EF and source See the 95% confidence interval in the table above (in the brackets, lower-upper).
Potential Improvements For the next inventory cycle, potential improvements in 1A5 ‘Other’ category could be performed if new AD on fuel consumption would be available for the territory on the LBDR and filling the existing gaps for certain years.
Table 2.1.5.10: Information on source category 1A5 ‘Other’, 1A5a ‘Stationary’, biomass / CO2Sector EnergyCategory 1A5 Other Source / Fuel / Gas 1A5a Stationary, biomass / CO2
Key Category? NoCategory Description / Defini-tion Emissions from fuel combustion in stationary sources that are not specified elsewhere.
Country Detail
The Energy Balances of the RM (Chapter S.2.1 “Consumed as Fuel or Energy” and columns: “For Other Works and Needs” and “Used for other purposes”) represented the main source of reference for AD associated to fuel consumption on the territory of the RBDR. Another relevant source of reference was the Ministry of Defense of the RM, which provides information on fuel combustion for military transport. The activity data pertaining to the fuel consumption on the territory of the LBDR were collected from the Statistical Yearbooks of the ATULBD (these are available for certain types of fuels (residual fuel oil and coal) only for 2008-2016 time series). Between 1990 and 2016, the GHG emissions from 1A5 ‘Other’ category decreased in the RM by circa 98.2 per cent. By 2016 the share of emissions from station-ary combustion increased up to circa 42.6 per cent.

Chapter 2: Methods and Data Documentation
2 - 83
Equation(Describe variables for method used)
Emissions GHG, fuel = Fuel Consumption fuel • Emission factor GHG, fuel (Equation 2.1)Where:
Emissions GHG, fuel - emission of the greenhouse gases by type of fuel (kg GHG);Fuel Consumption fuel - amount of fuel consumed (TJ);Emission factor GHG, fuel - default emission factor of a given greenhouse gases by type of fuel (kg gas/TJ). For CO2, it includes the carbon oxidation factor, assumed to be 1.
Methodology: Tier 1
Reference 2006 IPCC Guidelines for National Greenhouse Gas Inventories, Volume 2: Energy, Chapter 2: Stationary Combustion, p. 2.11 (available on: https://www.ipcc-nggip.iges.or.jp/public/2006gl/pdf/2_Volume2/V2_2_Ch2_Stationary_Combustion.pdf). National Inventory Report: 1990-2016. Greenhouse Gas Sources and Sinks in the Republic of Moldova (2018).
Describe How and Why this Method Was Chosen Due to the unavailability of country specific emission factors, the Tier 1 methodology has been used.
Type and source of activity data Quantity of fuel (TJ) – activity data from Energy Balances of the Republic of Moldova. Quantity of fuel consumed is reported in the Table 3-168 from National Inventory Report: 1990-2016. Greenhouse Gas Sources and Sinks in the Republic of Moldova.
Type and source of EF and OF
2006 IPCC Guidelines for National Greenhouse Gas Inventories, Volume 2: Energy, Chapter 2: Stationary Combustion, page 2.17, Table 2.2.Fuel type CO2 Emission Factor Unit
Wood / Wood Waste 112 t CO2 /TJOther Primary Solid Biomass 100 t CO2 /TJ
Uncertainty of AD and source ± 5%, expert judgementUncertainty of EF and source ± 5%, expert judgement
Potential Improvements For the next inventory cycle, potential improvements in 1A5 ‘Other’ category could be performed if new AD on fuel consumption would be available for the territory on the LBDR and filling the existing gaps for certain years.
Table 2.1.5.11: Information on source category 1A5 ‘Other’, 1A5a ‘Stationary’, biomass / CH4, N2OSector EnergyCategory 1A5 Other Source / Fuel / Gas 1A5a Stationary, biomass / CH4, N2OKey Category? NoCategory Description / Defini-tion Emissions from fuel combustion in stationary sources that are not specified elsewhere.
Country Detail
The Energy Balances of the RM (Chapter S.2.1 “Consumed as Fuel or Energy” and columns: “For Other Works and Needs” and “Used for other purposes”) represented the main source of reference for AD associated to fuel consumption on the territory of the RBDR. Another relevant source of reference was the Ministry of Defense of the RM, which provides information on fuel combustion for military transport. The activity data pertaining to the fuel consumption on the territory of the LBDR were collected from the Statistical Yearbooks of the ATULBD (these are available for certain types of fuels (residual fuel oil and coal) only for 2008-2016 time series). Between 1990 and 2016, the GHG emissions from 1A5 ‘Other’ category decreased in the RM by circa 98.2 per cent. By 2016 the share of emissions from station-ary combustion increased up to circa 42.6 per cent.
Equation(Describe variables for method used)
Emissions GHG, fuel = Fuel Consumption fuel • Emission factor GHG, fuel (Equation 2.1)Where:
Emissions GHG, fuel - emission of the greenhouse gases by type of fuel (kg GHG);Fuel Consumption fuel - amount of fuel consumed (TJ);Emission factor GHG, fuel - default emission factor of a given greenhouse gases by type of fuel (kg gas/TJ).
Methodology: Tier 1
Reference2006 IPCC Guidelines for National Greenhouse Gas Inventories, Volume 2: Energy, Chapter 2: Stationary Combustion, p. 2.11 (available on: https://www.ipcc-nggip.iges.or.jp/public/2006gl/pdf/2_Volume2/V2_2_Ch2_Stationary_Combustion.pdf). National Inventory Report: 1990-2016. Greenhouse Gas Sources and Sinks in the Republic of Moldova (2018).

Chapter 2: Methods and Data Documentation
2 - 84
Describe How and Why this Method Was Chosen Due to the unavailability of country specific emission factors, the Tier 1 methodology has been used.
Type and source of activity data Quantity of fuel (TJ) – activity data from Energy Balances of the Republic of Moldova. Quantity of fuel consumed is reported in the Table 3-168 from National Inventory Report: 1990-2016. Greenhouse Gas Sources and Sinks in the Republic of Moldova.
Type and source of EF and OF
2006 IPCC Guidelines for National Greenhouse Gas Inventories, Volume 2: Energy, Chapter 2: Stationary Combustion, page 2.17, Table 2.2.
Fuel type CH4 N2Okg/TJ
Wood / Wood Waste, Other Primary Solid Biomass 30 4
Uncertainty of AD and source ± 5%, expert judgementUncertainty of EF and source ± 50%, expert judgement
Potential Improvements For the next inventory cycle, potential improvements in 1A5 ‘Other’ category could be performed if new AD on fuel consumption would be available for the territory on the LBDR and filling the existing gaps for certain years.
Table 2.1.5.12: Information on source category 1A5 ‘Other’, 1A5a ‘Stationary’, biomass / NOx, CO, NMVOC and SO2Sector EnergyCategory 1A5 Other Source / Fuel / Gas 1A5a Stationary, biomass / NOx, CO, NMVOC and SO2
Key Category? Not applicable for pollutant emissionsCategory Description / Defini-tion Emissions from fuel combustion in stationary sources that are not specified elsewhere.
Country Detail
The Energy Balances of the RM (Chapter S.2.1 “Consumed as Fuel or Energy” and columns: “For Other Works and Needs” and “Used for other purposes”) represented the main source of reference for AD associated to fuel consumption on the territory of the RBDR. Another relevant source of reference was the Ministry of Defense of the RM, which provides information on fuel combustion for military transport. The activity data pertaining to the fuel consumption on the territory of the LBDR were collected from the Statistical Yearbooks of the ATULBD (these are available for certain types of fuels (residual fuel oil and coal) only for 2008-2016 time series). Between 1990 and 2016, the GHG emissions from 1A5 ‘Other’ category decreased in the RM by circa 98.2 per cent. By 2016 the share of emissions from station-ary combustion increased up to circa 42.6 per cent.
Equation(Describe variables for method used)
E pollutant = AR fuel consumption • EF pollutant (Equation 1)Where:
E pollutant - the emission of the specified pollutant;AR fuel consumption - the activity rate for fuel consumption;EF pollutant - the emission factor for this pollutant.
Methodology: Tier 1
ReferenceEMEP/EEA air pollutant emission inventory guidebook 2016- Last update July 2017,1.A.4.a.i, 1.A.4.b.i, 1.A.4.c.i, 1.A.5.a Small combustion, page 34 (available on:https://www.eea.europa.eu/publications/emep-eea-guidebook-2016/part-b-sectoral-guidance-chapters/1-energy/1-a-combustion/1-a-4-small-combustion-2016/view).National Inventory Report: 1990-2016. Greenhouse Gas Sources and Sinks in the Republic of Moldova (2018).
Describe How and Why this Method Was Chosen Due to the unavailability of country specific emission factors, the Tier 1 methodology has been used.
Type and source of activity data Quantity of fuel (TJ) – activity data from Energy Balances of the Republic of Moldova. Quantity of fuel consumed is reported in the Table 3-168 from National Inventory Report: 1990-2016. Greenhouse Gas Sources and Sinks in the Republic of Moldova.
Type and source of EF and OF
EMEP/EEA air pollutant emission inventory guidebook, July 2017. 1A4 Small combustion, page 43, Table 3.10.
Fuel type NOx CO NMVOC SO2
kg/TJSolid biomass 91 (20-120) 570 (50-4000) 300 (5-500) 11 (8-40)

Chapter 2: Methods and Data Documentation
2 - 85
Uncertainty of AD and source ± 5%, expert judgementUncertainty of EF and source See the 95% confidence interval in the table above (in the brackets, lower-upper).
Potential Improvements For the next inventory cycle, potential improvements in 1A5 ‘Other’ category could be performed if new AD on fuel consumption would be available for the territory on the LBDR and filling the existing gaps for certain years.
Table 2.1.5.13: Information on source category 1A5 ‘Other’, 1A5b ‘Mobile’, liquid fuels / CO2Sector EnergyCategory 1A5 Other Source / Fuel / Gas 1A5b Mobile, liquid fuels / CO2
Key Category? NoCategory Description / Defini-tion
All remaining emissions from fuel combustion from vehicles and other machinery, marine and aviation that are not specified elsewhere. Include emissions from fuel delivered to the country’s military as well as fuel delivered within that country but used by the militaries of other countries that are not engaged in multilateral operations.
Country Detail
The Energy Balances of the RM (Chapter S.2.1 “Consumed as Fuel or Energy” and columns: “For Other Works and Needs” and “Used for other purposes”) represented the main source of reference for AD associated to fuel consumption on the territory of the RBDR. Another relevant source of reference was the Ministry of Defense of the RM, which provides information on fuel combustion for military transport. The activity data pertaining to the fuel consumption on the territory of the LBDR were collected from the Statistical Yearbooks of the ATULBD (these are available for certain types of fuels (residual fuel oil and coal) only for 2008-2016 time series). Between 1990 and 2016, the GHG emissions from 1A5 ‘Other’ category decreased in the RM by circa 98.2 per cent. By 2016 the share of emissions from mobile combustion decreased to circa 57.4 per cent.
Equation(Describe variables for method used)
Emissions = (Equation 3.2.1)Where:
Emissions - emission of CO2 (kg);Fuel a - fuel sold (TJ);EF a - emission factor (kg gas/TJ). This is equal to the carbon content of the fuel multiplied by 44/12;a - type of fuel (e.g. petrol, diesel, natural gas, LPG).
Methodology: Tier 1
Reference2006 IPCC Guidelines for National Greenhouse Gas Inventories, Volume 2: Energy, Chapter 3: Mobile Combustion, page 3.12 (available on: https://www.ipcc-nggip.iges.or.jp/public/2006gl/pdf/2_Volume2/V2_3_Ch3_Mobile_Combustion.pdf. National Inventory Report: 1990-2016. Greenhouse Gas Sources and Sinks in the Republic of Moldova (2018).
Describe How and Why this Method Was Chosen Due to the unavailability of country specific emission factors, the Tier 1 methodology has been used.
Type and source of activity data Quantity of fuel (TJ) and (t), NCV Gasoline (43.72 TJ/kt), NCV Diesel Oil (42.54 TJ/kt), NCV Aviation Gasoline (43.66 TJ/kt), NCV Jet Kerosene (43.13 TJ/kt). Quantity of fuel consumed is reported in the Table 3-168 from National Inventory Report: 1990-2016. Greenhouse Gas Sources and Sinks in the Republic of Moldova.
Type and source of EF and OF
2006 IPCC GL, page 3.16, Table 3.2.1; page 3.64, Table 3.6.4.Type of fuel CO2 Emission Factor Unit
Gasoline, Aviation Gasoline 69.300 t CO2 /TJJet Kerosene 71.500 t CO2 /TJGas/Diesel Oil 74.100 t CO2 /TJ
Uncertainty of AD and source ± 5%, expert judgementUncertainty of EF and source ± 5%, expert judgement
Potential Improvements For the next inventory cycle, potential improvements in 1A5 ‘Other’ category could be performed if new AD on fuel consumption would be available for the territory on the LBDR and filling the existing gaps for certain years.
Σa (Fuela • EFa) (Equation 3.2.1)

Chapter 2: Methods and Data Documentation
2 - 86
Table 2.1.5.14: Information on source category 1A5 ‘Other’, 1A5b ‘Mobile’, liquid fuels / CH4, N2OSector EnergyCategory 1A5 Other Source / Fuel / Gas 1A5b Mobile, liquid fuels / CH4, N2OKey Category? NoCategory Description / Defini-tion
All remaining emissions from fuel combustion from vehicles and other machinery, marine and aviation that are not specified elsewhere. Include emissions from fuel delivered to the country’s military as well as fuel delivered within that country but used by the militaries of other countries that are not engaged in multilateral operations.
Country Detail
The Energy Balances of the RM (Chapter S.2.1 “Consumed as Fuel or Energy” and columns: “For Other Works and Needs” and “Used for other purposes”) represented the main source of reference for AD associated to fuel consumption on the territory of the RBDR. Another relevant source of reference was the Ministry of Defense of the RM, which provides information on fuel combustion for military transport. The activity data pertaining to the fuel consumption on the territory of the LBDR were collected from the Statistical Yearbooks of the ATULBD (these are available for certain types of fuels (residual fuel oil and coal) only for 2008-2016 time series). Between 1990 and 2016, the GHG emissions from 1A5 ‘Other’ category decreased in the RM by circa 98.2 per cent. By 2016 the share of emissions from mobile combustion decreased to circa 57.4 per cent.
Equation(Describe variables for method used)
Emission = ∑a(Fuela • EFa) (Equation 3.2.3)Where:
Emissions - emission in kg;Fuel a - fuel consumed, (TJ) (as represented by fuel sold);EF a - emission factor (kg gas/TJ);a - type of fuel (e.g. petrol, diesel, natural gas, LPG).
Methodology: Tier 1
Reference2006 IPCC Guidelines for National Greenhouse Gas Inventories, Volume 2: Energy, Chapter 3: Mobile Combustion, page 3.13 (available on: https://www.ipcc-nggip.iges.or.jp/public/2006gl/pdf/2_Volume2/V2_3_Ch3_Mobile_Combustion.pdf. National Inventory Report: 1990-2016. Greenhouse Gas Sources and Sinks in the Republic of Moldova (2018).
Describe How and Why this Method Was Chosen Due to the unavailability of country specific emission factors, the Tier 1 methodology has been used.
Type and source of activity data Quantity of fuel (TJ) and (t), NCV Gasoline (43.72 TJ/kt), NCV Diesel Oil (42.54 TJ/kt), NCV Aviation Gasoline (43.66 TJ/kt), NCV Jet Kerosene (43.13 TJ/kt). Quantity of fuel consumed is reported in the Table 3-168 from National Inventory Report: 1990-2016. Greenhouse Gas Sources and Sinks in the Republic of Moldova.
Type and source of EF and OF
2006 IPCC Guidelines for National Greenhouse Gas Inventories, Volume 2: Energy, Chapter 3, page 3.21, Table 3.2.2, page 3.64, Table 3.6.5.
Fuel typeCH4 N2O
kg/TJGasoline 33.0 3.2 Gas/Diesel Oil 3.9 3.9 Aviation Gasoline, Jet Kerosene 0.5 2.0
Uncertainty of AD and source ± 5%, expert judgementUncertainty of EF and source ± 50%, expert judgement
Potential Improvements For the next inventory cycle, potential improvements in 1A5 ‘Other’ category could be performed if new AD on fuel consumption would be available for the territory on the LBDR and filling the existing gaps for certain years.
Table 2.1.5.15: Information on source category 1A5 ‘Other’, 1A5b ‘Mobile’, liquid fuels / NOx, CO, NMVOC and SO2Sector EnergyCategory 1A5 Other Source / Fuel / Gas 1A5b Mobile, liquid fuels / NOx, CO, NMVOC and SO2

Chapter 2: Methods and Data Documentation
2 - 87
Key Category? Not applicable for pollutant emissions.Category Description / Defini-tion
All remaining emissions from fuel combustion from vehicles and other machinery, marine and aviation that are not specified elsewhere. Include emissions from fuel delivered to the country’s military as well as fuel delivered within that country but used by the militaries of other countries that are not engaged in multilateral operations.
Country Detail
The Energy Balances of the RM (Chapter S.2.1 “Consumed as Fuel or Energy” and columns: “For Other Works and Needs” and “Used for other purposes”) represented the main source of reference for AD associated to fuel consumption on the territory of the RBDR. Another relevant source of reference was the Ministry of Defense of the RM, which provides information on fuel combustion for military transport. The activity data pertaining to the fuel consumption on the territory of the LBDR were collected from the Statistical Yearbooks of the ATULBD (these are available for certain types of fuels (residual fuel oil and coal) only for 2008-2016 time series). Between 1990 and 2016, the GHG emissions from 1A5 ‘Other’ category decreased in the RM by circa 98.2 per cent. By 2016 the share of emissions from mobile combustion decreased to circa 57.4 per cent.
Equation(Describe variables for method used)
Ei = ∑j(∑m(FCj,m • EFi,j,m)) (Equation 1)Where:
E i - emission of pollutant i (g);FC j, m - fuel consumption of vehicle category j using fuel m (kg);EF i, j, m - fuel consumption- specific emission factor of pollutant i for vehicle category j and fuel m (g/kg).
Methodology: Tier 1Reference EMEP/EEA air pollutant emission inventory guidebook, June 2017. 1A3.b.i-iv Road transport, page 21.Describe How and Why this Method Was Chosen Due to the unavailability of country specific emission factors, the Tier 1 methodology has been used.
Type and source of activity data Quantity of fuel (TJ) and (t), NCV Gasoline (43.72 TJ/kt), NCV Diesel Oil (42.54 TJ/kt), NCV Aviation Gasoline (43.66 TJ/kt), NCV Jet Kerosene (43.13 TJ/kt). Quantity of fuel consumed is reported in the Table 3-168 from National Inventory Report: 1990-2016. Greenhouse Gas Sources and Sinks in the Republic of Moldova.
Type and source of EF and OF
EMEP/EEA air pollutant emission inventory guidebook, June 2017, 1A3.b.i-iv Road transport, page 22-23, Tables 3.5 and 3.6.
Fuel typeNOx CO NMVOC SO2
g/kg fuel kg/TJGasoline 8.73 (4.48-29.89) 84.7 (49.0-269.5) 10.05 (5.55-34.42) 45.75 (depend on sulphur content in fuel)Gas/Diesel Oil 33.37 (28.34-38.29) 7.58 (5.73-10.57) 1.92 (1.33-3.77) 141.01 (depend on sulphur content in fuel)
Note: for SO2 the Revised 1996 IPCC GL and software was also used.
EMEP/EEA air pollutant emission inventory guidebook, July 2017, 1.A.3.a, 1.A.5.b Aviation, page 21, Table 3.3.
Fuel typeNOx CO NMVOC SO2
kg/tone fuelJet Gasoline and Aviation Gasoline 4.0 (2-8) 1200 (600-2400) 19 (9.5-38) 1 (0.5-2)
Uncertainty of AD and source ± 5%, expert judgementUncertainty of EF and source See the 95% confidence interval in the table above (in the brackets, lower-upper).
Potential Improvements For the next inventory cycle, potential improvements in 1A5 ‘Other’ category could be performed if new AD on fuel consumption would be available for the territory on the LBDR and filling the existing gaps for certain years.
2.1.6. Category 1B2 ‘Fugitive Emissions from Oil and Natural Gas’
Tables 2.1.6.1 – 2.1.6.10 below comprise relevant information on source categories comprised within the inventory, including description of each source by type of fuel allocated to category 1B2 ‘Fugitive Emissions from Oil and Natural Gas’.

Chapter 2: Methods and Data Documentation
2 - 88
Table 2.1.6.1: Information on source category 1B2 ‘Fugitive Emissions from Oil and Natural Gas’, 1B2a.iii.1 ‘Exploration’, 1B2a.iii.2 ‘Production and Upgrading’, liquid fuels / CO2, CH4, N2O, NMVOC Sector EnergyCategory 1B2 Fugitive Emissions from Oil and Natural GasSource / Fuel / Gas 1B2.a.iii.1 ‘Exploration’, 1B2.a.iii.2 ‘Production and Upgrading’, liquid fuels / CO2, CH4, N2O, NMVOC Key Category? CН4: Tier 1: Yes: 1990 (L), 2016 (L, T) (1B2 Fugitive Emissions from Oil and Natural Gas – aggregated for all sources)
Category Description / Defini-tion
1B2.a.iii.1 ‘Exploration’: Fugitive emissions (excluding venting and flaring) from oil well drilling, drill stem testing, and well completions 1B2.a.iii.2 ‘Production and Upgrading’: Fugitive emissions from oil produc-tion (excluding venting and flaring) occur at the oil wellhead or at the oil sands or shale oil mine through to the start of the oil transmission system. This includes fugitive emissions related to well servicing, oil sands or shale oil mining, transport of untreated production (i.e., well effluent, emulsion, oil shale and oilsands) to treating or extraction facilities, activities at extraction and upgrading facilities, associated gas re-injection systems and produced water disposal systems.
Country Detail
Оil extraction is performed nearby Valeni village, Cahul district, on the territory of national reservation “Prutul de Jos”. The estimated amount of oil reserves in oil fields of Valeni is circa 2-3 million tons, of which about 0.5-1.0 million tons are available reserves. After removing the water, oil is pumped through pipelines into storage tanks, from where it is transported in tanks to the refinery owned by Arnaut Petrol J.S.C. (Comrat, ATU Gagauzia), with a processing capacity of about 35 kt annually. The following types of secondary fuels are produced at the respective refinery: gasoline, diesel oil, residual fuel oil and other petroleum products. About 30 wells were drilled in the oil fields of Valeni. Extraction takes place only on some of them, the rest being preserved. Between 2003 and 2005, 8 wells were operational, 5 being in service. In 2006-2012 time series, 10 wells were servicing, while starting with 2013 – circa 15 wells. During the period under review, the amount of extracted oil varied between 1 and 17 kt annually or between 1 and 18 thousand m3 annually.
Equation(Describe variables for method used)
E gas, industry segment = A industry segment • EF gas, industry segmentE gas = Σ E gas, industry segment
Where:E gas, industry segment – annual emissions (kt);A industry segment: Oil Wells Oil Wells (Drilling, Testing, Servicing) (well units) EF gas, industry segment – emission factor (kt/activity unit).
Methodology: Tier 1Reference 2006 IPCC Guidelines for National Greenhouse Gas Inventories, V2_4_Ch4_Fugitive_Emissions, Section 4.2.2.2, page 4.41, equation 4.2.1.Describe How and Why this Method Was Chosen It is not a key source; data for determination of CS EF are not available.
Type and source of activity data Oil Extraction: Energy Balances of the RM for 2003-2016. Report by State Ecological Inspectorate, 2015. National Inventory Report: 1990-2016. Greenhouse Gas Sources and Sinks in the Republic of Moldova (2018), Table 3-170.
Type and source of EF and OF
2006 IPCC, V2_4_Ch4_Fugitive_Emissions, Table 4.2.5, page 4.55, average CO2, kg / per well CH4, kg / per well N2O, kg / per well NMVOC, kg / per well
Drilling 900 (-12.5 +800%)
296.5 (-12.5 +800%)
- 7.935(-12.5 +800%)
Testing 79500 (-12.5 +800%)
490.5 (-12.5 +800%)
0.584 (--10 to +1000%)
106(-12.5 +800%)
Servicing 17 (-12.5 +800%)
955 (-12.5 +800%)
- 1408.5(-12.5 +800%)
Uncertainty of AD and source ± 25%, expert judgement (see also as reference 2006 IPCC, V2_4_Ch4_Fugitive_Emissions, Section 4.2.2.7.2, page 4.72).Uncertainty of EF and source ± 25%, expert judgement (see also as reference IPCC, V2_4_Ch4_Fugitive_Emissions, Table 4.2.5, p. 4.55). See the confidence intervals in the table above.
Potential Improvements
Potential improvements within the 1B2 ‘Fugitive Emissions from Oil and Natural Gas’ source category could be possible regarding the availability of new data related to fugitive leaks from oil and natural gas distribution networks (from the infrastructure needed to produce, collect, process, refine and distribute oil products and natural gases for the final consumers; from equipment functioning, evaporation and flashing losses, flaring, accidental releases from pipeline dig-ins, etc.), respectively in the case of adopting a higher-ranking assessment methodology. Improvements are also possible when presenting each category separately and for each region.

Chapter 2: Methods and Data Documentation
2 - 89
Table 2.1.6.2: Information on source category 1B2 ‘Fugitive Emissions from Oil and Natural Gas’, 1B2.a i ‘Oil Production’, liquid fuels / CO2, CH4, N2O, NMVOCSector EnergyCategory 1B2 Fugitive Emissions from Oil and Natural GasSource / Fuel / Gas 1B2.a i ‘Oil Production’, liquid fuels / CO2, CH4, N2O, NMVOC Key Category? CН4: Tier 1: Yes: 1990 (L), 2016 (L, T) (1B2 Fugitive Emissions from Oil and Natural Gas – aggregated for all sources)
Category Description / Defini-tion
1B2.a i ‘Oil Production’: fugitive emissions from oil production (excluding venting and flaring) occur at the oil wellhead or at the oil sands or shale oil mine through to the start of the oil transmission system. This includes fugitive emissions related to well servicing, oil sands or shale oil mining, transport of untreated production (i.e., well effluent, emulsion, oil shale and oilsands) to treating or extraction facilities, activities at extraction and upgrading facilities, associated gas re-injection systems and produced water disposal systems.
Country Detail
Оil extraction is performed nearby Valeni village, Cahul district, on the territory of national reservation “Prutul de Jos”. The estimated amount of oil reserves in oil fields of Valeni is circa 2-3 million tons, of which about 0.5-1.0 million tons are available reserves. After removing the water, oil is pumped through pipelines into storage tanks, from where it is transported in tanks to the refinery owned by Arnaut Petrol J.S.C. (Comrat, ATU Gagauzia), with a processing capacity of about 35 kt annually. The following types of secondary fuels are produced at the respective refinery: gasoline, diesel oil, residual fuel oil and other petroleum products. About 30 wells were drilled in the oil fields of Valeni. Extraction takes place only on some of them, the rest being preserved. Between 2003 and 2005, 8 wells were operational, 5 being in service. In 2006-2012 time series, 10 wells were servicing, while starting with 2013 – circa 15 wells. During the period under review, the amount of extracted oil varied between 1 and 17 kt annually or between 1 and 18 thousand m3 annually.
Equation(Describe variables for method used)
E gas, industry segment = A industry segment • EF gas, industry segmentE gas = Σ E gas, industry segment
Where:E gas, industry segment – annual emissions (kt);A industry segment: Oil Production (103 m3) EF gas, industry segment – emission factor (kt/103 m3).
Methodology: Tier 1Reference 2006 IPCC Guidelines for National Greenhouse Gas Inventories, V2_4_Ch4_Fugitive_Emissions, Section 4.2.2.2, page 4.41, equation 4.2.1.Describe How and Why this Method Was Chosen Due to the lower importance of this emission source and unavailability of country specific emission factors, the Tier 1 methodology has been used.
Type and source of activity data Oil Production, in kt, is available in the Energy Balances of the RM. The oil density is available in the Report produced by the State Ecological Inspectorate, 2015. National Inventory Report: 1990-2016. Greenhouse Gas Sources and Sinks in the Republic of Moldova (2018), Section 3.7.1, Table 3-170.
Type and source of EF and OF
2006 IPCC, V2_4_Ch4_Fugitive_Emissions, Table 4.2.5, page 4.57, average CO2 CH4 NMVOC
Emission Factors, kg / 103 m3
Oil Production 2 150 (-12.5 to +800%)
30 000 ( -12.5 to +800%)
37 500.9 (-12.5 to +800%)
Uncertainty of AD and source ± 25% expert judgement (see also 2006 IPCC GL, V2_4_Ch4_Fugitive_Emissions, Section 4.2.2.7.2, page 4.72).Uncertainty of EF and source ± 25% expert judgement (see also 2006 IPCC GL, V2_4_Ch4_Fugitive_Emissions, Table 4.2.5, p. 4.55). The confidence interval is available in the table above.
Potential Improvements
Potential improvements within the 1B2 ‘Fugitive Emissions from Oil and Natural Gas’ source category could be possible regarding the availability of new data related to fugitive leaks from oil and natural gas distribution networks (from the infrastructure needed to produce, collect, process, refine and distribute oil products and natural gases for the final consumers; from equipment functioning, evaporation and flashing losses, flaring, accidental releases from pipeline dig-ins, etc.), respectively in the case of adopting a higher-ranking assessment methodology. Improvements are also possible when presenting each category separately and for each region.
Table 2.1.6.3: Information on source category 1B2 Fugitive Emissions from Oil and Natural Gas, 1B2.a i ‘Oil Venting’, liquid fuels / CO2, CH4, N2O, NMVOC Sector EnergyCategory 1B2 Fugitive Emissions from Oil and Natural GasSource / Fuel / Gas 1B2.a i ‘Oil Venting’, liquid fuels / CO2, CH4, N2O, NMVOC

Chapter 2: Methods and Data Documentation
2 - 90
Key Category? CН4: Tier 1: Yes: 1990 (L), 2016 (L, T) (1B2 Fugitive Emissions from Oil and Natural Gas – aggregated for all sources)Category Description / Defini-tion Emissions from venting of associated gas and waste gas/vapor streams at oil facilities.
Country Detail
Oil extraction is performed nearby Valeni village, Cahul district, on the territory of national reservation “Prutul de Jos”. The estimated amount of oil reserves in oil fields of Valeni is circa 2-3 million tons, of which about 0.5-1.0 million tons are available reserves. After removing the water, oil is pumped through pipelines into storage tanks, from where it is transported in tanks to the refinery owned by Arnaut Petrol J.S.C. (Comrat, ATU Gagauzia), with a processing capacity of about 35 kt annually. The following types of secondary fuels are produced at the respective refinery: gasoline, diesel oil, residual fuel oil and other petroleum products. About 30 wells were drilled in the oil fields of Valeni. Extraction takes place only on some of them, the rest being preserved. Between 2003 and 2005, 8 wells were operational, 5 being in service. In 2006-2012 time series, 10 wells were servicing, while starting with 2013 – circa 15 wells. During the period under review, the amount of extracted oil varied between 1 and 17 kt annually or between 1 and 18 thousand m3 annually.
Equation(Describe variables for method used)
E gas, industry segment = A industry segment • EF gas, industry segmentE gas = Σ E gas, industry segment
Where:E gas, industry segment – annual emissions (kt);A industry segment: Oil Production (103 m3) EF gas, industry segment – emission factor (kt/103 m3).
Methodology: Tier 1Reference 2006 IPCC Guidelines for National Greenhouse Gas Inventories, V2_4_Ch4_Fugitive_Emissions, Section 4.2.2.2, page 4.41, equation 4.2.1.Describe How and Why this Method Was Chosen It is not a key source; data for determination of CS EF are not available
Type and source of activity data Oil Production, in kt, is available in the Energy Balances of the RM. The oil density is available in the Report produced by the State Ecological Inspectorate, 2015. National Inventory Report: 1990-2016. Greenhouse Gas Sources and Sinks in the Republic of Moldova (2018), Section 3.7.1, Table 3-170.
Type and source of EF and OF
2006 IPCC, V2_4_Ch4_Fugitive_Emissions, Table 4.2.5, page 4.57, average CO2 CH4 NMVOC
Emission Factors, kg / 103 m3
Oil Production 112.5 (±75%) 855 (±75%) 510 (±75%)
Uncertainty of AD and source ± 25% expert judgement (see also 2006 IPCC GL, V2_4_Ch4_Fugitive_Emissions, Section 4.2.2.7.2, page 4.72).Uncertainty of EF and source ± 25% expert judgement (see also 2006 IPCC GL, V2_4_Ch4_Fugitive_Emissions, Table 4.2.5, p. 4.55).
Potential Improvements
Potential improvements within the 1B2 ‘Fugitive Emissions from Oil and Natural Gas’ source category could be possible regarding the availability of new data related to fugitive leaks from oil and natural gas distribution networks (from the infrastructure needed to produce, collect, process, refine and distribute oil products and natural gases for the final consumers; from equipment functioning, evaporation and flashing losses, flaring, accidental releases from pipeline dig-ins, etc.), respectively in the case of adopting a higher-ranking assessment methodology. Improvements are also possible when presenting each category separately and for each region.
Table 2.1.6.4: Information on source category 1B2 Fugitive Emissions from Oil and Natural Gas, 1B2.a i ‘Oil Transport’ (Tanker, Trucks), liquid fuels / CO2, CH4, N2O, NMVOC Sector EnergyCategory 1B2 Fugitive Emissions from Oil and Natural GasSource / Fuel / Gas 1B2.a i ‘Oil Transport’ (Tanker, Trucks), liquid fuels / CO2, CH4, N2O, NMVOC Key Category? CН4: Tier 1: Yes: 1990 (L), 2016 (L, T) (1B2 Fugitive Emissions from Oil and Natural Gas – aggregated for all sources)Category Description / Defini-tion
Fugitive emissions (excluding venting and flaring) related to the transport of marketable crude oil (including conventional, heavy and synthetic crude oil and bitumen) to upgraders and refineries. The transporta-tion systems may comprise pipelines, marine tankers, tank trucks and rail cars.
Country Detail The transportation systems comprise pipelines, tank trucks and rail cars.

Chapter 2: Methods and Data Documentation
2 - 91
Equation(Describe variables for method used)
E gas, industry segment = A industry segment • EF gas, industry segmentE gas = Σ E gas, industry segment
Where:E gas, industry segment – annual emissions (kt);A industry segment: Oil Production (103 m3) EF gas, industry segment – emission factor (kt/103 m3).
Methodology: Tier 1Reference 2006 IPCC Guidelines for National Greenhouse Gas Inventories, V2_4_Ch4_Fugitive_Emissions, Section 4.2.2.2, page 4.41, equation 4.2.1.Describe How and Why this Method Was Chosen It is not a key source; data for determination of CS EF are not available.
Type and source of activity data Oil Production, in kt, is available in the Energy Balances of the RM. The oil density is available in the Report produced by the State Ecological Inspectorate, 2015. National Inventory Report: 1990-2016. Greenhouse Gas Sources and Sinks in the Republic of Moldova (2018), Section 3.7.1, Table 3-170.
Type and source of EF and OF
2006 IPCC, V2_4_Ch4_Fugitive_Emissions, Table 4.2.5, page 4.61. CO2 CH4 NMVOC
Emission Factors, kg / 103 m3
Oil Production 2.3
(-50 to +200%)
25
(-50 to +200%)
250
(-50 to +200%)
Uncertainty of AD and source ± 25% expert judgement (see also 2006 IPCC GL, V2_4_Ch4_Fugitive_Emissions, Section 4.2.2.7.2, page 4.72).Uncertainty of EF and source ± 25% expert judgement (see also 2006 IPCC GL, V2_4_Ch4_Fugitive_Emissions, Table 4.2.5, p. 4.55). The confidence interval is available in the table above.
Potential Improvements
Potential improvements within the 1B2 ‘Fugitive Emissions from Oil and Natural Gas’ source category could be possible regarding the availability of new data related to fugitive leaks from oil and natural gas distribution networks (from the infrastructure needed to produce, collect, process, refine and distribute oil products and natural gases for the final consumers; from equipment functioning, evaporation and flashing losses, flaring, accidental releases from pipeline dig-ins, etc.), respectively in the case of adopting a higher-ranking assessment methodology. Improvements are also possible when presenting each category separately and for each region.
Table 2.1.6.5: Information on source category 1B2 ‘Fugitive Emissions from Oil and Natural Gas’, 1B2b.ii.2 ‘Natural Gas – Production’, Gaseous fuels / CO2, CH4, NMVOCSector 1 EnergyCategory 1B2 Fugitive emissions Source / Fuel / Gas 1B2b.ii.2 ‘Natural Gas – Production’ / CO2, CH4, NMVOCKey Category? CН4: Tier 1: Yes: 1990 (L), 2016 (L, T) (1B2 Fugitive Emissions from Oil and Natural Gas – aggregated for all sources)Category Description / Defini-tion
Fugitive emissions (excluding venting and flaring) from the gas wellhead through to the inlet of gas processing plants, or, where processing is not required, to the tie-in points on gas transmission systems. This includes fugitive emissions related to well servicing, gas gathering, processing and associated waste water and acid gas disposal activities.
Country Detail
The methane content reaches circa 86-92 per cent. The natural gas explored at Victorovca field is supplied to the following nearby settlements: Ciobaclia, Suhata, Baimaclia, Flocoasa and Victorovca. The supply is made both from the natural gas fields in Victorovca, in particular during the warm period of the year, when the natural gas consumption in the respective localities is reduced, as well as through the national gas distribution and transportation network, especially during the cold season of the year, when natural gas consumption is increased (during this time of the year, the capacities of the Victorovca reservoir cannot meet the needs of the population in these localities).
Equation(Describe variables for method used)
E gas, industry segment = A industry segment • EF gas, industry segmentE gas = Σ E gas, industry segment
Where:E gas, industry segment – annual emissions (kt);A industry segment: Gas Production (106 m3) EF gas, industry segment – emission factor (kg106 m3).
Methodology: Tier 1

Chapter 2: Methods and Data Documentation
2 - 92
Reference 2006 IPCC Guidelines for National Greenhouse Gas Inventories, V2_4_Ch4_Fugitive_Emissions, Section 4.2.2.2, page 4.41, equation 4.2.1.Describe How and Why this Method Was Chosen It is not a key source; data for determination of CS EF are not available.
Type and source of activity data
Natural gas production (TJ): Energy Balance. Natural gas consumption (106 m3) and NCV: AO “Moldovagaz” J.S.C. through Official Letters No. 604 dated 01.04.1999, answer to Letter No. 02-541 dated 28.05.2001; No. 02-156 dated 06.02.2004, answer to Letter No. 257-01-07 dated 26.01.2004; No. 06-1253 dated 27.09.2006, answer to Letter No.01-07/1400 dated 25.08.2006; No. 07-730 dated 6.6.2007, answer to Letter No. 47/21-103 dated 31.05.2007; No. 02/1-476 dated 23.02.2011, answer to Letter No. 03-07/175 dated 02.02.2011; No. 02/1-288 dated 22.01.2014, answer to Letter No. 320/2014-01-01 dated 03.01.2014; No. 02/1-507 dated 10.02.2015, answer to Letter No. 407/2015-01-09 dated 29.01.2015; No. 02/1-2183 dated 03.06.2016, answer to Letter No. 512/2016-05-01 dated 10.05.2016; No. 03/2-74 dated 12.01.2018, answer to Letter No. 601/2017-12-03 dated 14.12.2017. National Inventory Report: 1990-2016. Greenhouse Gas Sources and Sinks in the Republic of Moldova (2018), Section 3.7.1, Tables 3-171 and 3-172.
Type and source of EF and OF
2006 IPCC GL, V2_4_Ch4_Fugitive_Emissions, Table 4.2.5, page 4.57, average. CO2 CH4 NMVOC
Emission Factors, kg / 106 m3
Gas Production 97 (-10 +1000%)
12 190(-10 +1000%)
645.5(-10 +1000%)
Uncertainty of AD and source ± 25%, expert judgement (see also 2006 IPCC GL, V2_4_Ch4_Fugitive_Emissions, Section 4.2.2.7.2, page 4.72).Uncertainty of EF and source ± 25%, expert judgement (see also 2006 IPCC GL, V2_4_Ch4_Fugitive_Emissions, Table 4.2.5, p. 4.55). The confidence interval is available in the table above.
Potential Improvements
Potential improvements within the 1B2 ‘Fugitive Emissions from Oil and Natural Gas’ source category could be possible regarding the availability of new data related to fugitive leaks from oil and natural gas distribution networks (from the infrastructure needed to produce, collect, process, refine and distribute oil products and natural gases for the final consumers; from equipment functioning, evaporation and flashing losses, flaring, accidental releases from pipeline dig-ins, etc.), respectively in the case of adopting a higher-ranking assessment methodology. Improvements are also possible when presenting each category separately and for each region.
Table 2.1.6.6: Information on source category 1B2 Fugitive Emissions from Oil and Natural Gas, 1B2b.ii.2 ‘Natural Gas - Wells Servicing’, gaseous fuels / CO2, CH4, NMVOCSector 1 EnergyCategory 1B2 Fugitive emissions Source / Fuel / Gas 1B2b.ii.2 ‘Natural Gas - Wells Servicing’ / CO2, CH4, NMVOCKey Category? CН4: Tier 1: Yes: 1990 (L), 2016 (L, T) (1B2 Fugitive Emissions from Oil and Natural Gas – aggregated for all sources)
Category Description / Defini-tion
Fugitive emissions from oil production (excluding venting and flaring) occur at the oil wellhead or at the oil sands or shale oil mine through to the start of the oil transmission system. This includes fugitive emis-sions related to well servicing, oil sands or shale oil mining, transport of untreated production (i.e., well effluent, emulsion, oil shale and oilsands) to treating or extraction facilities, activities at extraction and upgrading facilities, associated gas re-injection systems and produced water disposal systems.
Country Detail
The natural gas explored at Victorovca field is supplied to the following nearby settlements: Ciobaclia, Suhata, Baimaclia, Flocoasa and Victorovca. The supply is made both from the natural gas fields in Victorovca, in particular during the warm period of the year, when the natural gas consumption in the respective localities is reduced, as well as through the national gas distribution and transportation network, especially during the cold season of the year, when natural gas consumption is increased (during this time of the year, the capacities of the Victorovca reservoir cannot meet the needs of the population in these localities).
Equation(Describe variables for method used)
2006 IPCC Guidelines for National Greenhouse Gas Inventories, V2_4_Ch4_Fugitive_Emissions, Section 4.2.2.2, page 4.41, equation 4.2.1.E gas, industry segment = A industry segment • EF gas, industry segmentE gas = Σ E gas, industry segment
Where:E gas, industry segment – annual emissions (kt);A industry segment: Gas Wells Servicing (well units) EF gas, industry segment – emission factor (kg / per well).
Methodology: Tier 1Reference 2006 IPCC Guidelines for National Greenhouse Gas Inventories, V2_4_Ch4_Fugitive_Emissions, Section 4.2.2.2, page 4.41, equation 4.2.1.

Chapter 2: Methods and Data Documentation
2 - 93
Describe How and Why this Method Was Chosen It is not a key source; data for determination of CS EF are not available.
Type and source of activity data Number of Gas Wells Servicing – J.S.C. “Valiexchimp”.
Type and source of EF and OF
2006 IPCC GL, V2_4_Ch4_Fugitive_Emissions, Table 4.2.5, page 4.57, average. CO2 CH4 NMVOC
Emission Factors, kg / per well
Gas Production 17 (-10 +1000%)
955(-10 +1000%)
1408.5(-10 +1000%)
Uncertainty of AD and source ± 25%, expert judgement (see also 2006 IPCC GL, V2_4_Ch4_Fugitive_Emissions, Section 4.2.2.7.2, page 4.72).Uncertainty of EF and source ± 25%, expert judgement (see also 2006 IPCC GL, V2_4_Ch4_Fugitive_Emissions, Table 4.2.5, p. 4.55). The confidence interval is available in the table above.
Potential Improvements
Potential improvements within the 1B2 ‘Fugitive Emissions from Oil and Natural Gas’ source category could be possible regarding the availability of new data related to fugitive leaks from oil and natural gas distribution networks (from the infrastructure needed to produce, collect, process, refine and distribute oil products and natural gases for the final consumers; from equipment functioning, evaporation and flashing losses, flaring, accidental releases from pipeline dig-ins, etc.), respectively in the case of adopting a higher-ranking assessment methodology. Improvements are also possible when presenting each category separately and for each region.
Table 2.1.6.7: Information on source category 1B2 ‘Fugitive Emissions from Oil and Natural Gas’, 1B2b.iii.4 ‘Gas Transmission and Storage’, gaseous fuels / CO2, CH4, NMVOCSector 1 EnergyCategory 1B2 Fugitive emissions Source / Fuel / Gas 1B2b.iii.4 ‘Gas Transmission and Storage’ / CO2, CH4, NMVOCKey Category? CН4: Tier 1: Yes: 1990 (L), 2016 (L, T) (1B2 Fugitive Emissions from Oil and Natural Gas – aggregated for all sources)Category Description / Defini-tion
Fugitive emissions from systems used to transport processed natural gas to market (i.e., to industrial consumers and natural gas distribution systems). Fugitive emissions from natural gas storage systems should also be included in this category.
Country Detail The natural gas transport system in the RM currently includes: high, medium and low-pressure main gas pipelines. Natural gas supply is operated by the J.S.C. “Moldovagaz”, which distributes natural gas to consumers in the country and performs the transit of Russian natural gas to South-Eastern European countries. Information on natural gas consumption is available separately for RBDR and LBDR.
Equation(Describe variables for method used)
E gas, industry segment = A industry segment • EF gas, industry segmentE gas = Σ E gas, industry segment
Where:E gas, industry segment – annual emissions (kt);A industry segment: Gas Transmission (106 m3)EF gas, industry segment – emission factor (kg/103 m3)
Methodology: Tier 1Reference 2006 IPCC Guidelines for National Greenhouse Gas Inventories, V2_4_Ch4_Fugitive_Emissions, Section 4.2.2.2, page 4.41, equation 4.2.1.Describe How and Why this Method Was Chosen It is not a key source; data for determination of CS EF are not available
Type and source of activity data
Amount of transit gas (106 m3) and length of the transmission pipelines: “Moldovagaz” J.S.C. through Official Letters No. 604 dated 01.04.1999, answer to Letter No. 02-541 dated 28.05.2001; No. 02-156 dated 06.02.2004, answer to Letter No. 257-01-07 dated 26.01.2004; No. 06-1253 dated 27.09.2006, answer to Letter No.01-07/1400 dated 25.08.2006; No. 07-730 dated 6.6.2007, answer to Letter No. 47/21-103 dated 31.05.2007; No. 02/1-476 dated 23.02.2011, answer to Letter No. 03-07/175 dated 02.02.2011; No. 02/1-288 dated 22.01.2014, answer to Letter No. 320/2014-01-01 dated 03.01.2014; No. 02/1-507 dated 10.02.2015, answer to Letter No. 407/2015-01-09 dated 29.01.2015; No. 02/1-2183 dated 03.06.2016, answer to Letter No. 512/2016-05-01 dated 10.05.2016; No. 03/2-74 dated 12.01.2018, answer to Letter No. 601/2017-12-03 dated 14.12.2017. National Inventory Report: 1990-2016. Greenhouse Gas Sources and Sinks in the Republic of Moldova (2018), Section 3.7.1, Table 3-172.

Chapter 2: Methods and Data Documentation
2 - 94
Type and source of EF and OF
2006 IPCC GL, V2_4_Ch4_Fugitive_Emissions, Table 4.2.5, page 4.57, average. CO2 CH4 NMVOC
Emission Factors, kg / 106 m3
Gas Transmission 1.44 (-10 +1000%) 633 (-10 +1000%) 11.5 (-10 +1000%)
Uncertainty of AD and source ± 25%, expert judgement (see also 2006 IPCC GL, V2_4_Ch4_Fugitive_Emissions, Section 4.2.2.7.2, page 4.72).Uncertainty of EF and source ± 25%, expert judgement (2006 IPCC GL, V2_4_Ch4_Fugitive_Emissions, Table 4.2.5, p. 4.55). The confidence interval is available in the table above.
Potential Improvements
Potential improvements within the 1B2 ‘Fugitive Emissions from Oil and Natural Gas’ source category could be possible regarding the availability of new data related to fugitive leaks from oil and natural gas distribution networks (from the infrastructure needed to produce, collect, process, refine and distribute oil products and natural gases for the final consumers; from equipment functioning, evaporation and flashing losses, flaring, accidental releases from pipeline dig-ins, etc.), respectively in the case of adopting a higher-ranking assessment methodology. Improvements are also possible when presenting each category separately and for each region.
Table 2.1.6.8: Information on source category 1B2 ‘Fugitive Emissions from Oil and Natural Gas’, 1B2b.ii.5 ‘Gas Distribution’, gaseous fuels / CO2, CH4, NMVOCSector 1 EnergyCategory 1B2 Fugitive emissions Source / Fuel / Gas 1B2b.ii.5 ‘Gas Distribution’ / CO2, CH4, NMVOCKey Category? CН4: Tier 1: Yes: 1990 (L), 2016 (L, T) (1B2 Fugitive Emissions from Oil and Natural Gas – aggregated for all sources)Category Description / Defini-tion Fugitive emissions (excluding venting and flaring) from the distribution of natural gas to end users.
Country Detail The natural gas transport system in the RM currently includes: high, medium and low-pressure main gas pipelines. Natural gas supply is operated by the J.S.C. “Moldovagaz”, which distributes natural gas to consumers in the country. Information on natural gas consumption is available separately for RBDR and LBDR.
Equation(Describe variables for method used)
E gas, industry segment = A industry segment • EF gas, industry segmentE gas = Σ E gas, industry segment
Where:E gas, industry segment – annual emissions (kt);A industry segment: Gas Distribution (106 m3)EF gas, industry segment – emission factor (kg/103 m3)
Methodology: Tier 1
Reference 2006 IPCC Guidelines for National Greenhouse Gas Inventories, V2_4_Ch4_Fugitive_Emissions, Section 4.2.2.2, page 4.41, equation 4.2.1.National Inventory Report: 1990-2016. Greenhouse Gas Sources and Sinks in the Republic of Moldova (2018).
Describe How and Why this Method Was Chosen It is not a key source; data for determination of CS EF are not available
Type and source of activity data
Amount of transit gas (106 m3) and length of the transmission pipelines: “Moldovagaz” J.S.C. through Official Letters No. 604 dated 01.04.1999, answer to Letter No. 02-541 dated 28.05.2001; No. 02-156 dated 06.02.2004, answer to Letter No. 257-01-07 dated 26.01.2004; No. 06-1253 dated 27.09.2006, answer to Letter No.01-07/1400 dated 25.08.2006; No. 07-730 dated 6.6.2007, answer to Letter No. 47/21-103 dated 31.05.2007; No. 02/1-476 dated 23.02.2011, answer to Letter No. 03-07/175 dated 02.02.2011; No. 02/1-288 dated 22.01.2014, answer to Letter No. 320/2014-01-01 dated 03.01.2014; No. 02/1-507 dated 10.02.2015, answer to Letter No. 407/2015-01-09 dated 29.01.2015; No. 02/1-2183 dated 03.06.2016, answer to Letter No. 512/2016-05-01 dated 10.05.2016; No. 03/2-74 dated 12.01.2018, answer to Letter No. 601/2017-12-03 dated 14.12.2017. National Inventory Report: 1990-2016. Greenhouse Gas Sources and Sinks in the Republic of Moldova (2018), Section 3.7.2, Table 3-180.
Type and source of EF and OF
2006 IPCC GL, V2_4_Ch4_Fugitive_Emissions, Table 4.2.5, page 4.57, average. CO2 CH4 NMVOC
Emission Factors, kg / 106 m3
Gas Distribution 95.5 (-10 +1000%) 1800 (-10 +1000%) 26 (-10 +1000%)
Uncertainty of AD and source ± 25%, expert judgement, 2006 IPCC GL, V2_4_Ch4_Fugitive_Emissions, Section 4.2.2.7.2, page 4.72.

Chapter 2: Methods and Data Documentation
2 - 95
Uncertainty of EF and source ± 25%, expert judgement (2006 IPCC GL, V2_4_Ch4_Fugitive_Emissions, Table 4.2.5, p. 4.55). The confidence interval is available in the table above.
Potential Improvements
Potential improvements within the 1B2 ‘Fugitive Emissions from Oil and Natural Gas’ source category could be possible regarding the availability of new data related to fugitive leaks from oil and natural gas distribution networks (from the infrastructure needed to produce, collect, process, refine and distribute oil products and natural gases for the final consumers; from equipment functioning, evaporation and flashing losses, flaring, accidental releases from pipeline dig-ins, etc.), respectively in the case of adopting a higher-ranking assessment methodology. Improvements are also possible when presenting each category separately and for each region.
Table 2.1.6.9: Information on source category 1B2 ‘Fugitive Emissions from Oil and Natural Gas’, 1B2b.i ‘Natural Gas – Venting’, gaseous fuels / CO2, CH4, NMVOCSector 1 EnergyCategory 1B2 Fugitive emissions Source / Fuel / Gas 1B2b.i ‘Natural Gas – Venting’ / CO2, CH4, NMVOCKey Category? CН4: Tier 1: Yes: 1990 (L), 2016 (L, T) (1B2 Fugitive Emissions from Oil and Natural Gas – aggregated for all sources)Category Description / Defini-tion Emissions from venting of natural gas and waste gas/vapor streams at gas facilities.
Country Detail The natural gas transport system in the RM currently includes: high, medium and low-pressure main gas pipelines. Natural gas supply is operated by the J.S.C. “Moldovagaz”, which distributes natural gas to consumers in the country and performs the transit of Russian natural gas to South-Eastern European countries. Information on natural gas consumption is available separately for RBDR and LBDR.
Equation(Describe variables for method used)
E gas, industry segment = A industry segment • EF gas, industry segmentE gas = Σ E gas, industry segment
Where:E gas, industry segment – annual emissions (Gg);A industry segment: Gas Transmission (106 m3)EF gas, industry segment – emission factor (kg/103 m3)
Methodology: Tier 1Reference 2006 IPCC Guidelines for National Greenhouse Gas Inventories, V2_4_Ch4_Fugitive_Emissions, Section 4.2.2.2, page 4.41, equation 4.2.1.Describe How and Why this Method Was Chosen The Tier 1 method has been chosen because not all enhanced characterization data are available.
Type and source of activity data Amount of Gas Distributed (106 m3) – AO “Moldovagaz”. National Inventory Report: 1990-2016. Greenhouse Gas Sources and Sinks in the Republic of Moldova (2018), Section 3.7.2, Table 3-180.
Type and source of EF and OF2006 IPCC GL, V2_4_Ch4_Fugitive_Emissions, Table 4.2.5, page 4.57, average.
CO2, kg / 106 m3 CH4, kg / 106 m3 NMVOC, kg / 106 m3
Gas Transmission 5.2 392 7.8
Uncertainty of AD and source ± 25%, expert judgement (see also 2006 IPCC GL, V2_4_Ch4_Fugitive_Emissions, Section 4.2.2.7.2, page 4.72).Uncertainty of EF and source ± 25%, expert judgement (2006 IPCC GL, V2_4_Ch4_Fugitive_Emissions, Table 4.2.5, p. 4.55).
Potential Improvements
Potential improvements within the 1B2 ‘Fugitive Emissions from Oil and Natural Gas’ source category could be possible regarding the availability of new data related to fugitive leaks from oil and natural gas distribution networks (from the infrastructure needed to produce, collect, process, refine and distribute oil products and natural gases for the final consumers; from equipment functioning, evaporation and flashing losses, flaring, accidental releases from pipeline dig-ins, etc.), respectively in the case of adopting a higher-ranking assessment methodology. Improvements are also possible when presenting each category separately and for each region.
Table 2.1.6.10: Information on source category 1B2 ‘Fugitive Emissions from Oil and Natural Gas’, 1B2a.iii.3 ‘Natural Gas and Liquefied Natural Gas Transport’, gaseous fuels / CO2, N2OSector 1 EnergyCategory 1B2 Fugitive emissions Source / Fuel / Gas 1B2a.iii.3 ‘Natural Gas and LPG Transport’ / CO2, N2OKey Category? No

Chapter 2: Methods and Data Documentation
2 - 96
Category Description / Defini-tion
Fugitive emissions related to the transport of LPG with tank and trucks. This includes fugitive emissions related to storage, filling and unloading LPG and evaporation from equipment.
Country Detail Emissions from LPG transport. Information on LPG amounts are available for the territory on the RBDR for the entire period under review, while for the LBDR, only for 2011-2016 time series.
Equation(Describe variables for method used)
E gas, industry segment = A industry segment • EF gas, industry segmentE gas = Σ E gas, industry segment
Where:E gas, industry segment – annual emissions (kt);A industry segment: LPG consumption (103 m3)EF gas, industry segment – emission factor (kg/103 m3)
Methodology: Tier 1Reference 2006 IPCC Guidelines for National Greenhouse Gas Inventories, V2_4_Ch4_Fugitive_Emissions, Section 4.2.2.2, page 4.41, equation 4.2.1.Describe How and Why this Method Was Chosen It is not a key source; data for determination of CS EF are not available.
Type and source of activity data LPG consumption (kt) - Energy Balances of the RM. National Inventory Report: 1990-2016. Greenhouse Gas Sources and Sinks in the Republic of Moldova (2018), Section 3.7.1, Table 3-173.
Type and source of EF and OF2006 IPCC GL, V2_4_Ch4_Fugitive_Emissions, Table 4.2.5, page 4.57.
CO2, kg / 103 m3 N2O, kg / 103 m3
Liquefied Petroleum Gas 430 0.0022
Uncertainty of AD and source ± 25%, expert judgement (see also 2006 IPCC GL, V2_4_Ch4_Fugitive_Emissions, Section 4.2.2.7.2, page 4.72).Uncertainty of EF and source ± 25%, expert judgement.
Potential Improvements
Potential improvements within the 1B2 ‘Fugitive Emissions from Oil and Natural Gas’ source category could be possible regarding the availability of new data related to fugitive leaks from oil and natural gas distribution networks (from the infrastructure needed to produce, collect, process, refine and distribute oil products and natural gases for the final consumers; from equipment functioning, evaporation and flashing losses, flaring, accidental releases from pipeline dig-ins, etc.), respectively in the case of adopting a higher-ranking assessment methodology. Improvements are also possible when presenting each category separately and for each region.
2.2. Industrial Processes and Product Use Sector
Relevant information on categories comprised within the inventory, including description of each category allocated to Sector 2 ‘Industrial Processes and Prod-uct Use’ is provided below.
2.2.1. Category 2A ‘Mineral Industry’
Tables 2.2.1.1 – 2.2.1.9 below comprise relevant information on source categories comprised within the inventory, including description of each source by gas allocated to category 2A ‘Mineral Industry’.
Table 2.2.1.1: Information on Source Category 2A1 ‘Cement Production’ – CO2Sector Industrial Processes and Product UseCategory 2A Mineral IndustrySource / Gas 2A1 Cement Production / CO2
Key Category? Tier 1: Yes: 1990 (L), 2016 (L, T)Category Description / Defini-tion
Emissions of CO2 occur during the production of clinker that is an intermediate component in the cement manufacturing process. During the production of clinker, limestone, which is mainly (95%) calcium carbonate (CaCO3), is heated (calcined) to produce lime (CaO) and CO2 as a by-product. The limestone, which is a source of CaO, normally has an admixture of dolomite, which introduces MgO into the system.

Chapter 2: Methods and Data Documentation
2 - 97
Country Detail
There have been two cement factories in the Republic of Moldova in the period 1990-2016, one on the right bank of Dniester river (Lafarge Cement (Moldova) J.S.C. in Rezina) and another one on the left bank of Dniester river (Cement and Slate Combined Works in Ribnita). Emissions of CO2 have been calculated from the amount of clinker produced and content of CaO and MgO in clinker. Composition of clinker comprises about 65% CaO and 2% MgO. Cement kiln dust (CKD) is also accounted in emission calculation. To be noted that default CKD correction factor is 1.02, and in the Republic of Moldova its value varied during 1990-2016 from a maximum of 1.013 to a minimum of 1.0002.
Equation(Describe variables for method used)
Tier 2 methodology is applied.2006 IPCC Guidelines for National Greenhouse Gas Inventories, Volume 3, Chapter 2: Mineral Industry Emissions, Equation 2.2, pages 2.9-2.10.
CO2 emissions = EF clinker • Clinker Production • CKD Correction Factor EF clinker = Content CaO • stoichiometric ratio CO2/CaO + Content MgO • stoichiometric ratio CO2/MgOEF = 0.785 • CaO content +1.092 • MgO content
Reference 2006 IPCC Guidelines for National Greenhouse Gas Inventories, Volume 3, Chapter 2: Mineral Industry Emissions.National Inventory Report: 1990-2016. Greenhouse Gas Sources and Sinks in the Republic of Moldova (2018).
Describe How and Why this Method Was Chosen Due to the importance of this source and availability of the plant specific data, the Tier 2 methodology has been used.
Type and source of activity data
Quantity of cement and clinker produced is reported in the Table 4-12 from National Inventory Report: 1990-2016. Greenhouse Gas Sources and Sinks in the Republic of Moldova. CS values of the CaO and MgO content (weight fraction) in clinker are reported in the Table 4-10 of the National Inventory Report: 1990-2016. Greenhouse Gas Sources and Sinks in the Republic of Moldova. In case of Lafarge Cement (Moldova) J.S.C. in Rezina, the source of information is as following: Official Letter No. 780 dated 22.12.2017, as a response to the request of the Climate Change Office, the Ministry of Agriculture, Regional Development and Environment No. 601/2017-12-03 dated 14.12.2017; Official Letter No. 395 dated 24.05.2016, as a response to the request of the Climate Change Office, the Ministry of Environment No. 512/2016-05-01 dated 10.05.2016; Official Letter No. 82 dated 18.02.2015, as a response to the request of the Climate Change Office, the Ministry of Environment No. 407/2015-01-09 dated 29.01.2015; Official Letter No. 67 dated 06.02.2014, as a response to the request of the Climate Change Office, the Ministry of Environment No. 320/2014-01-01 dated 03.01.2014; Official Letter No. 74 dated 02.03.2011, as a response to the request of the Ministry of Environment No. 03-07/175 dated 02.02.2011; as well as Official Letter No. 186 dated 18.04.2007, as a response to the request of the Institute of Ecology and Geography No. 84 dated 26.03.2007. In the case of Cement and Slate Combined Works in Ribnita the source of information is as following: Statistical Yearbooks of the ATULBD for 1998 (page 176), 2000 (page 99), 2002 (page 103), 2005 (page 94), 2006 (page 93), 2007 (page 92), 2009 (page 92), 2010 (page 93), 2011 (page 94), 2012 (page 98), 2013 (page 99), 2014 (page 88), 2015 (page 88), 2016 (page 98), 2017 (page 101).
Type and source of EF and OF
CS values of EF clinker is provided in Table 4-10 of the National Inventory Report: 1990-2016. Greenhouse Gas Sources and Sinks in the Republic of Moldova. Coefficients 1990 1995 2000 2005 2010 2013 2014 2015 2016
CaO fraction 0.6576 0.6577 0.6569 0.6591 0.6550 0.6551 0.6569 0.6565 0.6602CO2/CaO stoichiometric ratio 0.7848 0.7848 0.7848 0.7848 0.7848 0.7848 0.7848 0.7848 0.7848MgO fraction 0.0160 0.0160 0.0160 0.0160 0.0160 0.0156 0.0158 0.0166 0.0166CO2/MgO stoichiometric ratio 1.0919 1.0919 1.0919 1.0919 1.0919 1.0919 1.0919 1.0919 1.0919CKD fraction 1.0110 1.0130 1.0120 1.0060 1.0040 1.0003 1.0002 1.0002 1.0002EFclinker 0.5394 0.5406 0.5394 0.5379 0.5336 0.5313 0.5329 0.5335 0.5363
Uncertainty of AD and source 2% - expert judgementUncertainty of EF and source 3% - expert judgement
Potential Improvements Potential improvements under the 2A1 Cement Production source category aim at collecting plant specific activity data from Cement Plant in Ribnita, on the left bank of Dniester river for the whole reporting period.
Table 2.2.1.2: Information on Source Category 2A1 ‘Cement Production’ – Pollutant EmissionsSector Industrial Processes and Product UseCategory 2A Mineral IndustrySource / Gas 2A1 Cement Production / Pollutant emissionsKey Category? Not applicable for pollutant emissions.

Chapter 2: Methods and Data Documentation
2 - 98
Category Description / Defini-tion
Cement manufacture is a major mineral commodity industry. During the manufacturing process, natural raw materials are finely ground and then transformed into cement clinker in a kiln system at high tem-peratures. The clinkers are cooled and ground together with additions into a fine powder known as cement. Cement is a hydraulic binder, i.e. it hardens when mixed with water. Cement is used to bind sand and gravel together in concrete. Releases from the cement kiln system come from the physical and chemical reactions of the raw materials and the fuels. The main constituents of the exit gases are nitrogen and excess oxygen from the combustion air, and carbon dioxide and water from the raw materials and the combustion process. The exit gases also contain small quantities of dust, sulphur dioxide, nitrogen oxides, carbon monoxide, chlorides, fluorides, ammonia, and still smaller quantities of organic compounds and heavy metals.
Country Detail There have been two cement factories in the Republic of Moldova in the period 1990-2016, one on the right bank of Dniester river (Lafarge Cement (Moldova) J.S.C. in Rezina) and another one on the left bank of Dniester river (Cement and Slate Combined Works in Ribnita).
Equation(Describe variables for method used)
The Tier 2 approach for pollutant emissions from cement uses the general equation (2) from the EMEP/EEA Air Pollution Emission Inventory Guidebook 2016, NFR 2.A.1 Cement production, page 11, section 3.3 ‘Tier 2 technology-specific approach’:
E technology, pollutant = AR production, technology • EF technology, pollutantWhere:
E technology, pollutant is the emission of a pollutant (kg);AR production, technology is the annual production of cement (tons);EF technology, pollutant is the emission factor of the relevant pollutant (kg pollutant / ton cement).
Reference
EEA (2016), EMEP/EEA Air Pollution Emission Inventory Guidebook 2016, Technical guidance to prepare national emission inventories. European Environment Agency, Technical report No 21/2016. Copen-hagen, Denmark, (available on: http://www.eea.europa.eu//publications/emep-eea-guidebook-2016).European Commission (2013), Joint Research Centre – Institute for Institute for Prospective Technological Studies, 2013. Integrated Pollution Prevention and Control (IPPC), Reference Document on Best Available Techniques (BREF) for the Production of Cement, Lime and Magnesium Oxide. Industrial Emissions Directive 2010/75/EU Integrated Pollution Prevention and Control. Available at http://eippcb.jrc.ec.europa.eu/reference/BREF/CLM_Published_def.pdf.European Commission (2010), Integrated Pollution Prevention and Control (IPPC), Reference Document on Best Available Techniques (BREF) in the Cement and Lime Manufacturing Industries. May, 2010. Available at http://eippcb.jrc.es.
Describe How and Why this Method Was Chosen A Tier 2 methodology has been used due to availability of technology-specific emission factors.
Type and source of activity data
In case of Lafarge Cement (Moldova) J.S.C. in Rezina, the source of information is as following: Official Letter No. 780 dated 22.12.2017, as a response to the request of the Climate Change Office, the Ministry of Agriculture, Regional Development and Environment No. 601/2017-12-03 dated 14.12.2017; Official Letter No. 395 dated 24.05.2016, as a response to the request of the Climate Change Office, the Ministry of Environment No. 512/2016-05-01 dated 10.05.2016; Official Letter No. 82 dated 18.02.2015, as a response to the request of the Climate Change Office, the Ministry of Environment No. 407/2015-01-09 dated 29.01.2015; Official Letter No. 67 dated 06.02.2014, as a response to the request of the Climate Change Office, the Ministry of Environment No. 320/2014-01-01 dated 03.01.2014; Official Letter No. 74 dated 02.03.2011, as a response to the request of the Ministry of Environment No. 03-07/175 dated 02.02.2011; as well as Official Letter No. 186 dated 18.04.2007, as a response to the request of the Institute of Ecology and Geography No. 84 dated 26.03.2007. In the case of Cement and Slate Combined Works in Ribnita the source of information is as following: Statistical Yearbooks of the ATULBD for 1998 (page 176), 2000 (page 99), 2002 (page 103), 2005 (page 94), 2006 (page 93), 2007 (page 92), 2009 (page 92), 2010 (page 93), 2011 (page 94), 2012 (page 98), 2013 (page 99), 2014 (page 88), 2015 (page 88), 2016 (page 98), 2017 (page 101).
Type and source of EF and OF
Default Emission Factors for ‘Cement Production’ Source Category (‘Installation for the production of cement clinker in rotary kilns’) Code Name
NFR source category 2.A.1 1.A.2.f.i
Cement productionStationary combustion in manufacturing industry and construction: other
SNAP 040612030311
CementCement
Fuel Coal /Pet. Coke / Gas / Oil / Recovery waste

Chapter 2: Methods and Data Documentation
2 - 99
Type and source of EF and OF
Pollutant Value Unit95% confidence interval
Reference Lower Upper
Tier 2 default emission factors from combustion emissionsNOx 1.241 kg/t clinker 0.330 4.670 European Commission (2010) CO 1.455 kg/t clinker 0.460 4.600 European Commission (2010) NMVOC 0.018 kg/t clinker 0.023 0.138 European Commission (2010) SO2 0.374 kg/t clinker 0.020 11.12 European Commission (2010)
Source: EMEP/EEA Atmospheric Emissions Inventory Guidebook, November 2016, Code SNAP 030311 Cement, Category 1.A.2.f.i, Table 3-24, Page 31; and Code SNAP 040612 Cement, Category 2.A.1, Table 3-1, page 10.
Uncertainty of AD and source 2% - expert judgementUncertainty of EF and source See the 95% confidence interval in the table above.
Table 2.2.1.3: Information on Source Category 2A2 ‘Lime Production’ – CO2Sector Industrial Processes and Product UseCategory 2A Mineral IndustrySource / Gas 2A2 Lime Production / CO2
Key Category? Tier 1: 2016 (T)
Category Description / Defini-tion
Lime (CaO) is the high-temperature product of the calcination of limestone. The production occurs in vertical and rotary kilns fired by coal, oil or natural gas. Calcium limestone contains 97–98% calcium carbonate on a dry basis. The rest includes magnesium carbonate, aluminium oxide, iron oxide and silica. However, some limestone contains as much as 35–45% magnesium carbonate and is classified as dolomite. Lime production emits CO2 through the thermal decomposition (calcination) of the calcium carbonate (CaCO3) in limestone to produce quicklime (CaO), or through the decomposition of dolomite (CaCO3·MgCO3) to produce dolomitic ‘quick’ lime (CaO·MgO).
Country Detail
The only lime producing plant on the right bank of Dniester river was located in Vatra (“Var-Nest” JSC), currently is not operating. On the left bank of Dniester river, lime is produced at Cement and Slate Combined Works in Ribnita. Lime is produced also at sugar mills, it used to activate earlier in ’90s of 20th century 9 sugar plants in the Republic of Moldova, from which only 5 sugar plants are currently activat-ing (Drochia, Floresti, Donduseni, Cupcini and Glodeni). According to the information provided by the National Bureau of Statistics, the lime production has decreased on the right bank of Dniester river from 114.3 kt in 1990 to 0.05 kt in 2016, while according to the Statistical Yearbooks of the Administrative-Territorial Units on the Left bank of Dniester River, the production of lime has decreased on the left bank of Dniester river from 90.0 kt in 1990 to 4.02 kt in 2016. A certain amount of lime needed for domestic consumption is imported. According to the data provided by the Custom Service of the Republic of Moldova during 1995-2016 period the lime imports increased by circa 84 times, from 0.063 kt in 1995 to 5.330 kt in 2016.Concomitently, lime is produced also by at Sugar Mills. Since 1990 to 2016 the amount of lime produced at sugar mills decreased from 108.95 kt to 25.00 kt.
Equation(Describe variables for method used)
Tier 2 methodology is applied. 2006 IPCC Guidelines for National Greenhouse Gas Inventories, Volume 3, Chapter 2: Mineral Industry Emissions, Equation 2.6, page 2.21.Total l = Pi • FE lime, i • correction factor (LKD)
Where:Total l – CO2 emissions from type i lime production (kt/yr);Pi – production of lime of type i (kt/yr); EF lime, i – emission factor for lime of type i (0.7456 t CO2/t high-calcium lime and 0.7763 t CO2/t dolomitic lime);LKD – correction factor, the default value used is 1.02, the country specific value is unknown.
Reference 2006 IPCC Guidelines for National Greenhouse Gas Inventories, Volume 3, Chapter 2: Mineral Industry Emissions.National Inventory Report: 1990-2016. Greenhouse Gas Sources and Sinks in the Republic of Moldova (2018).
Describe How and Why this Method Was Chosen Due to the importance of this source, the Tier 2 methodology has been used.

Chapter 2: Methods and Data Documentation
2 - 100
Type and source of activity data
Quantity of lime produced is reported in the Table 4-15 from National Inventory Report: 1990-2016. Greenhouse Gas Sources and Sinks in the Republic of Moldova. Activity data for the right bank of Dniester river are based on information provided by the National Bureau of Statistics of the Republic of Moldova through the Statistical Yearbooks for 1994 (page 286), 1999 (page 302), 2003 (page 392), 2006 (page 312); as well as through the Statistical Reports PRODMOLD-A „Total production, as a natural expression, in the Republic, by product type for 2005-2016” (are produced only since 2005 year). Activity data for the left bank of Dniester river are available in the Statistical Yearbooks of the ATULBD for 1998 (page 176), 2000 (page 99), 2002 (page 103), 2005 (page94), 2006 (page 93), 2007 (page 92), 2009 (page 92), 2011 (page 94), 2012 (page 98), 2013 (page 99), 2014 (page 88), 2015 (page 88), 2016 (page 98), 2017 (page 101). Activity data on lime production at sugar mills have been calculated indirectly based on information sugar production from sugar beet (250 kg of lime per ton of sugar produced). Activity data on sugar production on the right bank of Dniester river are based on the information available in the Statistical Yearbooks of the Republic of Moldova for 1994 (page 289), 1999 (page 304), 2003 (page 393), 2006 (page 310), as well as in the Statistical Reports PRODMOLD-A ‘Total production, as a natural expression, in the Republic, by product type, for 2005-2016’. Activity data for the left bank of Dniester river are available in the Statistical Yearbooks of the ATULBD for 1998 (page 177), 2000 (page 100), 2002 (page 104), 2005 (page 94).
Type and source of EF and OF
Basic Parameters for Estimating EFs from 2A2 ‘Lime Production’
Type of lime Stoichiometric Ratio(1)
Range of CaO Content(%)
Range of MgO Content(%)
Default Values for CaO/CaO.
MgO Content(2)
Default EF,t CO2/t lime
(1) . (2)High-calcium lime 0.7848 93-98 0.3-2.5 0.95 0.7456Dolomitic lime 0.9132 55-57 38-41 0.85 0.7763Hydraulic lime 0.7848 65-92 0.75 0.5886
Source: 2006 IPCC Guidance, Chapter 2.3 ‘Lime Production’, Table 2.4, page 2.22.Uncertainty of AD and source 10% - expert judgementUncertainty of EF and source 2% - expert judgementPotential Improvements No potential improvements are planned to be implemented in the next inventory cycle for source category 2A2 ‘Lime production’.
Table 2.2.1.4: Information on Source Category 2A2 ‘Lime Production’ – Pollutant EmissionsSector Industrial Processes and Product UseCategory 2A Mineral IndustrySource / Gas 2A2 Lime Production / Pollutant emissionsKey Category? Not applicable for pollutant emissions.
Category Description / Defini-tion
Lime (CaO) is the high-temperature product of the calcination of limestone. The production occurs in vertical and rotary kilns fired by coal, oil or natural gas. Calcium limestone contains 97–98% calcium carbonate on a dry basis. The rest includes magnesium carbonate, aluminum oxide, iron oxide and silica. However, some limestone contains as much as 35–45% magnesium carbonate and is classified as dolomite. Atmospheric emissions in the lime manufacturing industry include particulate emissions from the mining, handling, crushing, screening and calcining of the limestone and emissions of air pollutants generated during fuel combustion in kilns. These emissions are not very significant on a global or even regional scale. However, lime works can be an important emission source of air pollutants on a local scale. The production of lime causes emissions from both processes and combustion. The main pollutants released are: sulphur oxides (SOx), nitrogen oxides (NOx), non-methane volatile organic compounds (NMVOC) and particulate matter.
Country Detail The only lime producing plant on the right bank of Dniester river was located in Vatra (“Var-Nest” JSC), currently is not operating. On the left bank of Dniester river, lime is produced at Cement and Slate Com-bined Works in Ribnita. Lime is produced also at sugar mills, it used to activate earlier in ’90s of 20th century 9 sugar plants in the Republic of Moldova, from which only 5 sugar plants are currently activating (Drochia, Floresti, Donduseni, Cupcini and Glodeni).
Equation(Describe variables for method used)
The Tier 2 approach for pollutant emissions from lime production uses the general equation (2) from the EMEP/EEA Air Pollution Emission Inventory Guidebook 2016, NFR 2.A.2 Lime production, page 9, section 3.3 ‘Tier 2 technology-specific approach’:
E technology, pollutant = AR production, technology • EF technology, pollutantWhere:
E technology, pollutant is the emission of a pollutant (kg);AR production, technology is the annual production of lime (tons);EF technology, pollutant is the emission factor of the relevant pollutant (kg pollutant / ton lime).

Chapter 2: Methods and Data Documentation
2 - 101
Reference
EEA (2016), EMEP/EEA Air Pollution Emission Inventory Guidebook 2016, Technical guidance to prepare national emission inventories. European Environment Agency, Technical report No 21/2016. Copen-hagen, Denmark, (available on: http://www.eea.europa.eu//publications/emep-eea-guidebook-2016).European Commission (2013), Joint Research Centre – Institute for Institute for Prospective Technological Studies, 2013. Integrated Pollution Prevention and Control (IPPC), Reference Document on Best Available Techniques (BREF) for the Production of Cement, Lime and Magnesium Oxide. Industrial Emissions Directive 2010/75/EU Integrated Pollution Prevention and Control. Available at http://eippcb.jrc.ec.europa.eu/reference/BREF/CLM_Published_def.pdf.European Commission (2010), Integrated Pollution Prevention and Control (IPPC), Reference Document on Best Available Techniques (BREF) in the Cement and Lime Manufacturing Industries. May, 2010. Available at http://eippcb.jrc.es.
Describe How and Why this Method Was Chosen A Tier 2 methodology has been used due to availability of technology-specific emission factors.
Type and source of activity data
Quantity of lime produced is reported in the Table 4-15 from National Inventory Report: 1990-2016. Greenhouse Gas Sources and Sinks in the Republic of Moldova. Activity data for the right bank of Dniester river are based on information provided by the National Bureau of Statistics of the Republic of Moldova through the Statistical Yearbooks for 1994 (page 286), 1999 (page 302), 2003 (page 392), 2006 (page 312); as well as through the Statistical Reports PRODMOLD-A „Total production, as a natural expression, in the Republic, by product type for 2005-2016” (are produced only since 2005 year). Activity data for the left bank of Dniester river are available in the Statistical Yearbooks of the ATULBD for 1998 (page 176), 2000 (page 99), 2002 (page 103), 2005 (page94), 2006 (page 93), 2007 (page 92), 2009 (page 92), 2011 (page 94), 2012 (page 98), 2013 (page 99), 2014 (page 88), 2015 (page 88), 2016 (page 98), 2017 (page 101). Activity data on lime production at sugar mills have been calculated indirectly based on information sugar production from sugar beet (250 kg of lime per ton of sugar produced). Activity data on sugar production on the right bank of Dniester river are based on the information available in the Statistical Yearbooks of the Republic of Moldova for 1994 (page 289), 1999 (page 304), 2003 (page 393), 2006 (page 310), as well as in the Statistical Reports PRODMOLD-A ‘Total production, as a natural expression, in the Republic, by product type, for 2005-2016’. Activity data for the left bank of Dniester river are available in the Statistical Yearbooks of the ATULBD for 1998 (page 177), 2000 (page 100), 2002 (page 104), 2005 (page 94).
Type and source of EF and OF
Default emission factors for source category ‘Lime production’ (installation for the production of lime in rotary kilns) – Uncontrolled Abatement TechnologiesCode Name
NFR source category 2.A.2 1.A.2.f.i
Lime productionStationary combustion in manufacturing industry and construction: other
SNAP 040614030312
Lime (decarbonizing)Lime
Technologies/Practices Typical emissions from some types of lime kilnAbatement technologies UncontrolledFuel Coal / Gas / Oil
Pollutant Value Unit95 % confidence interval
Reference Lower Upper
Tier 2 default emission factors from combustion emissionsNOx 1.369 kg/t lime 0.15 12.5 European Commission (2010) CO 1.940 kg/t lime 0.30 12.5 European Commission (2010) SO2 0.316 kg/t lime 0.01 10.0 European Commission (2010)
Source: EMEP/EEA Atmospheric Emissions Inventory Guidebook, November 2016, Code SNAP 030312 Lime, Category 1.A.2.f.i, Table 3-23, Page 30; and Code SNAP 040614 Lime, Category 2.A.2, Table 3-1, page 8.
Uncertainty of AD and source 10% - expert judgementUncertainty of EF and source See the 95% confidence interval in the tables above.
Table 2.2.1.5: Information on Source Category 2A3 ‘Glass Production’ – CO2Sector Industrial Processes and Product UseCategory 2A Mineral IndustrySource / Gas 2A3 Glass Production / CO2

Chapter 2: Methods and Data Documentation
2 - 102
Key Category? No
Category Description / Defini-tion
Under this source category are covered GHG emissions originated from the production of different types of glass (flat window glass, multi-layer insulating glass, glassware, glass for recipients (containers), glass for tableware, specialty glass etc.). Glass is produced from a raw material mix containing silica (SiO2), sodium (Na2O), lime (CaO) or other carbonates (CaCO3, CaMg(CO3)2, Na2CO3, BaCO3, K2CO3, SrCO3 etc.), with small admixture of aluminum (Al2O3) and alkaline substances, plus other minor ingredients. Glass production process allows for a small quantity of recycled glass (cullet) to be used (its share can vary between 10-80 per cent of the total raw material used). The melting process for glass of different types is similar. Glass production process implies the following phases: selection and preparation of the raw material; melting, moulding, hardening, quenching and finishing.
Country Detail Four glass plants used to produce glass in the RM: the SOE ‘Chisinau Glass Factory’ and ‘Glass Container Company’ (since 1997) in Chisinau, ‘Cristal-Flor’ Glass Factory in Floresti and the Glass Factory in Tiraspol (ATULBD), but the last two plants ceased their activity.
Equation(Describe variables for method used)
Tier 2 methodology is applied. 2006 IPCC Guidelines for National Greenhouse Gas Inventories, Volume 3, Chapter 2: Mineral Industry Emissions, Equation 2.11, page 2.28.Total CO2 = Σ [Mg, i • FE g, i • (1 - CRi)]
Where:Total – CO2 emissions from glass production (kt/yr);Mg, i – mass of melted glass of type i (kt/yr);FEi – emission factor for manufacturing of glass of type i (t CO2/t glass melted);CRi – cullet ratio for manufacturing of glass of type i, fraction.
Reference 2006 IPCC Guidelines for National Greenhouse Gas Inventories, Volume 3, Chapter 2: Mineral Industry Emissions.National Inventory Report: 1990-2016. Greenhouse Gas Sources and Sinks in the Republic of Moldova (2018).
Describe How and Why this Method Was Chosen Due to the importance of this source, the Tier 2 methodology has been used.
Type and source of activity data
The amount of glass produced is reported in the Table 4-21 from National Inventory Report: 1990-2016. Greenhouse Gas Sources and Sinks in the Republic of Moldova. Activity data for the right bank of Dnies-ter river are based on information provided by the National Bureau of Statistics of the Republic of Moldova through the Statistical Yearbooks of the RM for 1988 (page 228), 1994 (page 287), 1999 (page 303), 2003 (page 393), 2004 (page 443), 2005 (pages 321-322), 2006 (page 312); as well as through the Statistical Reports PRODMOLD-A “Total production, as a natural expression, in the Republic, by product type for 2005-2016” (are produced only since 2005 year). Activity data for the left bank of Dniester river are available in the Statistical Yearbooks of the ATULBD for 1998 (page 180), 2000 (page 100), 2002 (page 104), 2005 (page 94), 2007 (page 93), 2010 (page 93). Plant specific information has been provided by SOE ‘Chisinau Glass Factory’ through Official Letter No. 31 dated 21.02.2011, as a response to the request No. 03-07/175 dated 02.02.2011; Official Letter No. 9/01-01 dated 16.01.2014, as a response to the request No. 320/2014-01-01 dated 03.01.2014; Official Letter No. 16 dated 12.02.2015, as a response to the request No. 407/2015-01-09 dated 29.01.2015; Of-ficial Letter No. 86 dated 19.05.2016, as a response to the request No. 512/2016-05-01 dated 10.05.2016; and by ‘Glass Container Company Chisinau’ though Official Letter dated 28.02.2011, as a response to the request No. 03-07/175 dated 02.02.2011; Official Letter No. 01-1C-78 dated 19.02.2014, as a response to the request No. 320/2014-01-01 dated 03.01.2014; Official Letter No. 01-3C-63 dated 30.03.2015, as a response to the request No. 407/2015-01-09 dated 29.01.2015; Official Letter dated 23.05.2016, as a response to the request No. 512/2016-05-01 dated 10.05.2016; Official Letter No. 23.02.2018, as a response to the request No. 601/2017-12-03 dated 14.12.2017.
Type and source of EF and OF
Default EF Used to Estimate CO2 Emissions from Glass Production are available in the 2006 IPCC Guidelines for National Greenhouse Gas Inventories, Volume 3, Chapter 2.4, Table 2.6, Page 2.30. The Country Specific Emission Factors Used to Estimate CO2 Emissions from Glass Production (glass jars, glass containers and bottles) in the RM within the 1990-2016 periods are reported in the Table 4-22 of the National Inventory Report: 1990-2016. Greenhouse Gas Sources and Sinks in the Republic of Moldova (2018).
1990 1995 2000 2005 2010 2013 2014 2015 2016Average value of CR in the production process of glass jars, glass containers and bottles % 49.7 77.8 51.2 45.4 32.6 24.4 22.9 19.0 19.3CS EF, kg CO2/t glass used for the production of glass jars, glass containers and bottles 105.6 46.7 102.4 114.7 141.6 158.7 161.9 170.2 169.5
Uncertainty of AD and source 15% - expert judgementUncertainty of EF and source 10% - expert judgementPotential Improvements No potential improvements are planned to be implemented in the next inventory cycle for source category 2A3 ‘Glass production’.
Table 2.2.1.6: Information on Source Category 2A3 ‘Glass Production’ – Pollutant EmissionsSector Industrial Processes and Product UseCategory 2A Mineral Industry

Chapter 2: Methods and Data Documentation
2 - 103
Source / Gas 2A3 Glass Production / Pollutant EmissionsKey Category? Not applicable for pollutant emissions.
Category Description / Defini-tion
Under this source category are covered pollutant emissions originated from the production of different types of glass (flat window glass, multi-layer insulating glass, glassware, glass for recipients (containers), glass for tableware, specialty glass etc.). Glass is produced from a raw material mix containing silica (SiO2), sodium (Na2O), lime (CaO) or other carbonates (CaCO3, CaMg(CO3)2, Na2CO3, BaCO3, K2CO3, SrCO3 etc.), with small admixture of aluminum (Al2O3) and alkaline substances, plus other minor ingredients. Glass production process allows for a small quantity of recycled glass (cullet) to be used (its share can vary between 10-80 per cent of the total raw material used). The melting process for glass of different types is similar. Glass production process implies the following phases: selection and preparation of the raw material; melting, moulding, hardening, quenching and finishing. The main emission from the production of glass is carbon dioxide, originating mainly from the carbonization process. Other emitted pollutants include micro pollutants, heavy metals, black carbon and dust. Emission factors are given for process and combustion emissions together, since it is not straightforward to separate the two. However, large variations may apply depending on the glass composition, fuel type and furnace type and care should be taken in applying these factors.
Country Detail Four glass plants used to produce glass in the RM: the SOE ‘Chisinau Glass Factory’ and ‘Glass Container Company’ (since 1997) in Chisinau, ‘Cristal-Flor’ Glass Factory in Floresti and the Glass Factory in Tiraspol (ATULBD), but the last two plants ceased their activity.
Equation(Describe variables for method used)
The Tier 2 approach for pollutant emissions from glass production uses the general equation (2) from the EMEP/EEA Air Pollution Emission Inventory Guidebook 2016, NFR 2.A.3 Glass production, page 15, section 3.3 ‘Tier 2 technology-specific approach’:
E technology, pollutant = AR production, technology • EF technology, pollutantWhere:
E technology, pollutant is the emission of a pollutant (kg);AR production, technology is the annual production of glass (tons);EF technology, pollutant is the emission factor of the relevant pollutant (kg pollutant / ton glass).
Reference
EEA (2016), EMEP/EEA Air Pollution Emission Inventory Guidebook 2016, Technical guidance to prepare national emission inventories. European Environment Agency, Technical report No 21/2016. Copen-hagen, Denmark, (available on: http://www.eea.europa.eu//publications/emep-eea-guidebook-2016).European Commission (2008), Integrated Pollution Prevention and Control (IPPC), Revised reference Document on Best Available Technologies (BREF) in the Glass Manufacturing Industry. European Com-mission. February, 2008.European Commission (2013), Joint Research Centre – Institute for Institute for Prospective Technological Studies, 2013. Integrated Pollution Prevention and Control (IPPC), Authors: SCALET Bianca Maria, GARCIA MUÑOZ Marcos, SISSA Aivi Querol, ROUDIER Serge, DELGADO SANCHO Luis. Reference Document on Best Available Techniques (BREF) for the Manufacture of Glass. Industrial Emissions Directive 2010/75/EU Integrated Pollution Prevention and Control (available on: http://eippcb.jrc.ec.europa.eu/reference/BREF/GLS_Adopted_03_2012.pdf).
Describe How and Why this Method Was Chosen A Tier 2 methodology has been used due to availability of technology-specific emission factors.
Type and source of activity data
The amount of glass produced is reported in the Table 4-21 from National Inventory Report: 1990-2016. Greenhouse Gas Sources and Sinks in the Republic of Moldova. Activity data for the right bank of Dniester river are based on information provided by the National Bureau of Statistics of the Republic of Moldova through the Statistical Yearbooks of the RM for 1988 (page 228), 1994 (page 287), 1999 (page 303), 2003 (page 393), 2004 (page 443), 2005 (pages 321-322), 2006 (page 312); as well as through the Statistical Reports PRODMOLD-A „Total production, as a natural expression, in the Republic, by product type for 2005-2016” (are produced only since 2005 year). Activity data for the left bank of Dniester river are available in the Statistical Yearbooks of the ATULBD for 1998 (page 180), 2000 (page 100), 2002 (page 104), 2005 (page 94), 2007 (page 93), 2010 (page 93). Plant specific information has been provided by SOE ‘Chisinau Glass Factory’ through Official Letter No. 31 dated 21.02.2011, as a response to the request No. 03-07/175 dated 02.02.2011; Official Letter No. 9/01-01 dated 16.01.2014, as a response to the request No. 320/2014-01-01 dated 03.01.2014; Official Letter No. 16 dated 12.02.2015, as a response to the request No. 407/2015-01-09 dated 29.01.2015; Official Letter No. 86 dated 19.05.2016, as a response to the request No. 512/2016-05-01 dated 10.05.2016; and by ‘Glass Container Company Chisinau’ though Official Letter dated 28.02.2011, as a response to the request No. 03-07/175 dated 02.02.2011; Official Letter No. 01-1C-78 dated 19.02.2014, as a response to the request No. 320/2014-01-01 dated 03.01.2014; Official Letter No. 01-3C-63 dated 30.03.2015, as a response to the request No. 407/2015-01-09 dated 29.01.2015; Official Letter dated 23.05.2016, as a response to the request No. 512/2016-05-01 dated 10.05.2016; Official Letter No. 23.02.2018, as a response to the request No. 601/2017-12-03 dated 14.12.2017.
Type and source of EF and OF
Default emission factors for source category ‘Glass production’ (installation for the manufacture of glass, including glass fiber)Code Name
NFR source category 2.A.3 1.A.2.f.i
Glass productionStationary combustion in manufacturing industry and construction: other
SNAP (if applicable) 0406130303
GlassProcesses with contact (glass: flat, container, domestic, special, cont. filament glass fiber)
Fuel Gas / Oil

Chapter 2: Methods and Data Documentation
2 - 104
Type and source of EF and OF
Pollutant Value Unit95 % confidence interval
Reference Lower Upper
Tier 2 default emission factors from combustion emissionsNOx 2.93 kg/t glass 0.22 14.7 European Commission (2008) CO 0.00613 kg/t glass 0.00307 0.258 European Commission (2008) SO2 1.96 kg/t glass 0.118 15.1 European Commission (2008)
Source: EMEP/EEA Atmospheric Emissions Inventory Guidebook, November 2016, Code SNAP 030314-030317 Glass, Category 1.A.2.f.i, Table 3-26 Page 32; Code SNAP 040613 Glass, Category 1.A.3, Table 3.1, page 14.
Uncertainty of AD and source 15% - expert judgementUncertainty of EF and source See the 95% confidence interval in the table above.
Table 2.2.1.7: Information on Source Category 2A4a ‘Ceramics’ – CO2Sector Industrial Processes and Product UseCategory 2A Mineral IndustrySource / Gas 2A4a Ceramics / CO2
Key Category? NoCategory Description / Defini-tion
Within the process of ceramics production, CO2 emissions result from the calcination of the raw material used. Similar to the cement and lime production processes, carbonates are heated to high temperatures in a kiln, producing CO2 emissions, which can be estimated by multiplying the annual data on the amounts of carbonates used with a specific emission factor that takes into account the CaO and MgO content.
Country Detail Three large bricks plants used to produce ceramics in the RM: the Macon JSC in Chisinau, ‘ANCHIR’ JSC in Chirca village, Anenii Noi district and the Bricks Factory in Tiraspol (ATULBD). There is also a number of smaller size bricks plants which periodically seize their activity. The Macon JSC in Chisinau is producing also expendable clay since 2001.
Equation(Describe variables for method used)
Tier 2 methodology is applied. 2006 IPCC Guidelines for National Greenhouse Gas Inventories, Volume 3, Chapter 2: Mineral Industry Emissions, Equation 2.15, page 2.34.CO2 Emissions = Mc • EFc,
Where:Mc – mass of carbonate consumed for bricks and ceramics production (tons);EFc – emission factor for carbonates calcination (t CO2 / t).
During the calcination of the carbonates in the clay, each mole of CaO and respectively, MgO forms one mole of CO2. This principle was used for developing countries specific values of emission factors. EF = Stoichiometric Ratio (CO2/CaO) • Content of CaO in Clay + Stoichiometric Ratio (CO2/MgO) • Content of MgO in Clay
In the RM the content of CaO in clay varies between 6-9 per cent, while the content of MgO, respectively between 2-4 per cent. In conformity with the information provided by ‘MACON’ J.S.C., the average content of CaO in clay extracted in Purcel quarry is circa 8.44 per cent, in Pruncul quarry – 8.22 per cent, in Micauti – 6.70 per cent, in Haruza Mica – 6.66 per cent; while the average content of MgO in clay extracted in Purcel quarry is 3.03 per cent, in Pruncul – 3.57 per cent, in Micautil – 2.93 per cent, and in Haruza Mica – 2.60 per cent.
Reference 2006 IPCC Guidelines for National Greenhouse Gas Inventories, Volume 3, Chapter 2: Mineral Industry Emissions.National Inventory Report: 1990-2016. Greenhouse Gas Sources and Sinks in the Republic of Moldova (2018).
Describe How and Why this Method Was Chosen Due to availability of the plant specific data, the Tier 2 methodology has been used.
Type and source of activity data
The information on bricks production (in million conventional units) is reported in the Table 4-27 from National Inventory Report: 1990-2016. Greenhouse Gas Sources and Sinks in the Republic of Moldova. Activity data for the right bank of Dniester river are based on information provided by the National Bureau of Statistics of the Republic of Moldova through the Statistical Yearbooks of the RM for 1988 (page 228), 1994 (page 287), 1999 (page 303), 2005 (page 322), 2010 (page 305); as well as through the Statistical Reports PRODMOLD-A „Total production, as a natural expression, in the Republic, by product type for 2005-2016” (are produced only since 2005 year). Activity data for the left bank of Dniester river are available in the Statistical Yearbooks of the ATULBD for 1998 (page 177), 2000 (page 99), 2002 (page 103), 2005 (page 94), 2006 (page 93), 2007 (page 92), 2009 (page 92), 2010 (page 93), 2011 (page 94), 2012 (page 98), 2013 (page 99), 2014 (page 88), 2015 (page 88), 2016 (page 98), 2017 (page 101). Plant specific information has been provided periodically by ‘Macon’ J.S.C. through Official Letters as response to the requests from Climate Change Office.To convert the activity data in metric mass units (kilotons), conversion coefficients were used based on the data available on the web pages of national and foreign construction companies. According to those, one conventional brick piece represents: 250 x 120 x 65 mm, with a specific density variation between 1500 and 1900 kg/m3 (in the RM - between 1020 and 1869 kg/m3). Under these circumstances, the volume of a conventional brick is - 0.25 • 0.12 • 0.065 = 0.00195 m3; the minimum weight – 1020 • 0.00195/1 = 1.989 kg; the maximum weight – 1869 • 0.00195/1 = 3.644 kg; the average weight – 1444.5 • 0.00195/1

Chapter 2: Methods and Data Documentation
2 - 105
Type and source of activity data
= 2.817 kg; this particular value was used in order to calculate the weight in tons of the national bricks production. At the same time, for estimating the mass of carbonates used for brick production, it was used the method recommended by the 2006 IPCC Guidelines; the mass of clay used for brick production is determined by multiplying total brick production (in kilotons) by the default factor – 1.1 (Volume 3, Chapter 2.5, Page 2.36). The activity data on the amount of clay used in brick production in the Republic of Moldova within 1990-2016 is reported in Table 4-28 of the National Inventory Report: 1990-2016. Greenhouse Gas Sources and Sinks in the Republic of Moldova (2018). The activity data on the amount of clay used in expanded clay production in the Republic of Moldova within 2001-2016 periods as provided by ‘Macon’ JSC the only producer in the Republic of Moldova, is reported in Table 4-29 of the National Inventory Report: 1990-2016. Greenhouse Gas Sources and Sinks in the Republic of Moldova (2018). While the activity data regarding the production of ceramics in the 2005-2016 periods as provided by the National Bureau of Statistics through the Statistical Reports PRODMOLD-A “Total production, as a natural expression, in the Republic, by product type”, is reported in the Table 4-30 of the National Inventory Report: 1990-2016. Greenhouse Gas Sources and Sinks in the Republic of Moldova (2018).
Type and source of EF and OF
Default EF used to estimate CO2 emissions from ceramic production are available in the 2006 IPCC Guidelines for National Greenhouse Gas Inventories, Volume 3, Chapter 2.1, Table 2.1, Page 2.7. The country specific emission factors used to estimate CO2 emissions from ceramic production in the RM within the 1990-2016 periods are reported in the Table 4-26 of the National Inventory Report: 1990-2016. Greenhouse Gas Sources and Sinks in the Republic of Moldova (2018). As the Table 4-26 reveals, the annual values of the EF varied between 1990 and 2016 from a minimum of 72.9 kg CO2 per ton of clay used (in 2007) and a maximum of 103.5 kg CO2 per ton of clay used (between 1997-2000). According to the 2006 IPCC Guidelines (Volume 3, Chapter 2.5, Page 2.34), the default EF represents 100 kg CO2 per ton of clay used or 10 per cent of carbonate content used as raw material.
Indicators 1990 1995 2000 2005 2010 2013 2014 2015 2016Content of CaO in clay used 0.0844 0.0844 0.0822 0.0535 0.0787 0.0668 0.0668 0.0666 0.0667Stoichiometric Ratio CO2/CaO 0.7848 0.7848 0.7848 0.7848 0.7848 0.7848 0.7848 0.7848 0.7848EF, t CO2/t clay used (only CaO) 0.0662 0.0662 0.0645 0.0420 0.0618 0.0524 0.0524 0.0523 0.0524Content of MgO in clay used 0.0303 0.0303 0.0357 0.0302 0.0326 0.0285 0.0286 0.0288 0.0287Stoichiometric Ratio CO2/MgO 1.0919 1.0919 1.0919 1.0919 1.0919 1.0919 1.0919 1.0919 1.0919EF, t CO2/t clay used (only MgO) 0.0331 0.0331 0.0390 0.0330 0.0356 0.0311 0.0312 0.0314 0.0313EF, t CO2/t clay used (total) 0.0993 0.0993 0.1035 0.0750 0.0974 0.0835 0.0836 0.0837 0.0837
Uncertainty of AD and source 20% - expert judgementUncertainty of EF and source 5% - expert judgementPotential Improvements No potential improvements are planned to be implemented in the next inventory cycle for source category 2A4a ‘Ceramics’.
Table 2.2.1.8: Information on Source Category 2A4a ‘Ceramics’ – Pollutant EmissionsSector Industrial Processes and Product UseCategory 2A Mineral IndustrySource / Gas 2A4a Ceramics / Pollutant EmissionsKey Category? Not applicable for pollutant emissions.
Category Description / Defini-tion
The main emission from the other process uses of carbonates is carbon dioxide, originating mainly from the carbonization process. Particulate matter is another main substance emitted from clay and brick product manufacturing. Substances such as oxides of nitrogen, sulphur dioxide, carbon monoxide, hydrogen fluoride, and calcium fluoride, are likely to be emitted from the combustion processes. Smaller quantities of volatile organic compounds (VOCs), ammonia, chlorine, and hydrochloric acid may also be emitted. Other emissions might include NPI listed metals and organic compounds generated from the fuel and raw materials used, or as products of incomplete combustion. Emission factors are given for process and combustion emissions together, since it is not straightforward to separate the two. However, large variations may apply depending on the carbonates composition, fuel type and furnace type and care should be taken in applying these factors.
Country Detail Three large bricks plants used to produce ceramics in the RM: the Macon JSC in Chisinau, ‘ANCHIR’ JSC in Chirca village, Anenii Noi district and the Bricks Factory in Tiraspol (ATULBD). There is also a number of smaller size bricks plants which periodically seize their activity. The Macon JSC in Chisinau is producing also expendable clay since 2001.
Equation(Describe variables for method used)
The Tier 2 approach for pollutant emissions from ceramic production uses the general equation (2) from the EMEP/EEA Air Pollution Emission Inventory Guidebook 2016, NFR 2.A.4 Other process uses of carbonates, section 3.3 ‘Tier 2 technology-specific approach’:
E technology, pollutant = AR production, technology • EF technology, pollutantWhere:
E technology, pollutant is the emission of a pollutant (kg);AR production, technology is the annual production of ceramics (tons);EF technology, pollutant is the emission factor of the relevant pollutant (kg pollutant / ton ceramic).

Chapter 2: Methods and Data Documentation
2 - 106
Reference
European Commission (2007), Reference Document on Best Available Technologies (BAT) in the Ceramic Manufacturing Industry. European Integrated Pollution Prevention and Control (IPPC) Bureau at the Institute for Prospective Technological Studies. August 2007 (Available on: http://eippcb.jrc.ec.europa.eu/reference/BREF/cer_bref_0807.pdf).EEA (2016), EMEP/EEA Air Pollution Emission Inventory Guidebook 2016, Technical guidance to prepare national emission inventories. European Environment Agency, Technical report No 21/2016. Copen-hagen, Denmark (Available on: http://www.eea.europa.eu//publications/emep-eea-guidebook-2016).
Describe How and Why this Method Was Chosen A Tier 2 methodology has been used due to availability of technology-specific emission factors.
Type and source of activity data
The information on bricks production (in million conventional units) is reported in the Table 4-27 from National Inventory Report: 1990-2016. Greenhouse Gas Sources and Sinks in the Republic of Moldova. Activity data for the right bank of Dniester river are based on information provided by the National Bureau of Statistics of the Republic of Moldova through the Statistical Yearbooks of the RM for 1988 (page 228), 1994 (page 287), 1999 (page 303), 2005 (page 322), 2010 (page 305); as well as through the Statistical Reports PRODMOLD-A „Total production, as a natural expression, in the Republic, by product type for 2005-2016” (are produced only since 2005 year). Activity data for the left bank of Dniester river are available in the Statistical Yearbooks of the ATULBD for 1998 (page 177), 2000 (page 99), 2002 (page 103), 2005 (page 94), 2006 (page 93), 2007 (page 92), 2009 (page 92), 2010 (page 93), 2011 (page 94), 2012 (page 98), 2013 (page 99), 2014 (page 88), 2015 (page 88), 2016 (page 98), 2017 (page 101). Plant specific information has been provided periodically by ‘Macon’ J.S.C. through Official Letters as response to the requests from Climate Change Office.To convert the activity data in metric mass units (kilotons), conversion coefficients were used based on the data available on the web pages of national and foreign construction companies. According to those, one conventional brick piece represents: 250 x 120 x 65 mm, with a specific density variation between 1500 and 1900 kg/m3 (in the RM - between 1020 and 1869 kg/m3). Under these circumstances, the volume of a conventional brick is - 0.25 • 0.12 • 0.065 = 0.00195 m3; the minimum weight – 1020 • 0.00195/1 = 1.989 kg; the maximum weight – 1869 • 0.00195/1 = 3.644 kg; the average weight – 1444.5 • 0.00195/1 = 2.817 kg; this particular value was used in order to calculate the weight in tons of the national bricks production. At the same time, for estimating the mass of carbonates used for brick production, it was used the method recommended by the 2006 IPCC Guidelines; the mass of clay used for brick production is determined by multiplying total brick production (in kilotons) by the default factor – 1.1 (Volume 3, Chapter 2.5, Page 2.36). The activity data on the amount of clay used in brick production in the Republic of Moldova within 1990-2016 is reported in Table 4-28 of the National Inventory Report: 1990-2016. Greenhouse Gas Sources and Sinks in the Republic of Moldova (2018). The activity data on the amount of clay used in expanded clay production in the Republic of Moldova within 2001-2016 periods as provided by ‘Macon’ JSC the only producer in the Republic of Moldova, is reported in Table 4-29 of the National Inventory Report: 1990-2016. Greenhouse Gas Sources and Sinks in the Republic of Moldova (2018). While the activity data regarding the production of ceramics in the 2005-2016 periods as provided by the National Bureau of Statistics through the Statistical Reports PRODMOLD-A “Total production, as a natural expression, in the Republic, by product type”, is reported in the Table 4-30 of the National Inventory Report: 1990-2016. Greenhouse Gas Sources and Sinks in the Republic of Moldova (2018).
Type and source of EF and OF
Default emission factors for source category ‘Ceramic production’ (installation for the manufacture of ceramic product by firing, in particular roofing tiles, bricks, refractory bricks, tiles, stoneware of porcelain (with a production capacity of 75 ton/day or with a kiln capacity of 4m3 and with a setting density per kiln of 300 kg/m3)
Code Name
NFR source category 2.A.4 1.A.2.f.i
Other processes use of carbonatesStationary combustion in manufacturing industry and construction: other
SNAP 030319 Bricks and tiles productionFuel Gas / Oil / Coal
Pollutant Value Unit95 % confidence interval
Reference Lower Upper
Tier 2 default emission factors from combustion emissionsNOx 0.184 kg/t 0.049 0.255 European Commission (2007) SOx 0.0396 kg/t 0.0245 2.55 European Commission (2007) CO 0.189 kg/t 0.155 0.800 European Commission (2007)
Sources: European Commission (2007), Reference Document on Best Available Techniques in the Ceramic Manufacturing Industry. August 2007. The document is available on: http://eippcb.jrc.ec.europa.eu/reference/BREF/cer_bref_0807.pdf. See Table 3.5, Page 99; EEA (2016), EMEP/EEA Air Pollution Emission Inventory Guidebook 2016, Technical guidance to prepare national emission inventories. European Environment Agency, Technical report No 21/2016. Copenhagen, Denmark. The document is available on: http://www.eea.europa.eu//publications/emep-eea-guidebook-2016). See category 1.A.2 Manufactur-ing industries and construction (combustion), Table 3-28, Page 33.
Uncertainty of AD and source 20% - expert judgementUncertainty of EF and source See the 95% confidence interval in the table above.

Chapter 2: Methods and Data Documentation
2 - 107
Table 2.2.1.9: Information on Source Category 2A4b ‘Other Uses of Soda Ash’ – CO2Sector Industrial Processes and Product UseCategory 2A Mineral IndustrySource / Gas 2A4b Other Uses of Soda Ash / CO2
Key Category? NoCategory Description / Defini-tion
Soda ash (Na2CO3) is used as a raw material in a variety of industrial processes. It is applied in glass production, soaps and detergents, flue gas desulphurisation, chemicals, pulp and paper and other common consumer products. CO2 process-related emissions in this sector result only from the calcination of soda ash use that are not included elsewhere. Soda ash used for glass is reported in 2A3.
Country Detail CO2 emissions from use of soda ash have been calculated from consumption of soda ash and default emission factor for soda ash. Amount of soda ash consumed has been estimated from data on import and export as provided by the Custom Service of the Republic of Moldova. Consumption of soda ash in glass production is subtracted.
Equation(Describe variables for method used)
Tier 1 methodology was applied. Methodological issues regarding estimation of CO2 emissions from soda ash production and use are addressed in the 2006 IPCC Guidelines for National Greenhouse Gas Inventories, Volume 3, Chapter 2: Mineral Industry Emissions, specifically in Chapter 2.1, Table 2.1, Page 2.7, respectively in Chapter 2.5, Pages 2.32-2.40 (equation 2.14 on page 2.34):
Total sa = Asa • EFsaWhere:
Total sa – CO2 emissions from soda ash use (kt);Asa – soda ash consumption (kt); EFsa – default EF for CO2 emissions from soda ash use (t CO2/t of soda ash).
Reference 2006 IPCC Guidelines for National Greenhouse Gas Inventories, Volume 3, Chapter 2: Mineral Industry Emissions.National Inventory Report: 1990-2016. Greenhouse Gas Sources and Sinks in the Republic of Moldova (2018).
Describe How and Why this Method Was Chosen Due to the lower importance of this emission source and unavailability of country specific emission factors, the Tier 1 methodology has been used.
Type and source of activity data The information on soda ash import is reported in the Table 4-33, while the activity data on soda ash consumption is reported in Table 4-34 from National Inventory Report: 1990-2016. Greenhouse Gas Sources and Sinks in the Republic of Moldova. The information of soda ash import and export was provided by the Custom Service of the Republic of Moldova, through the Official Letter No. 28/07-612 dated 12.01.2018, as a response to the request of the CCO of the MARDE No. 601/2017-12-03 dated 14.12.2017; Official Letter No. 28/07-8785 dated 26.05.2016, as a response to the request of the CCO of the MoEN No. 512/2016-05-01 dated 10.05.2016; Official Letter No. 28/07-2231 dated 26.02.2015, as a response to the request of the CCO of the MoEN No. 407/2015-01-09 dated 29.01.2015; Official Letter No.15-03-05 dated 24.01.2014, as a response to the request of the CCO of the MoEN No. 320/2014-01-01 dated 03.01.2014; Official Letter No. 28/07-1893 dated 23.02.2011, as a response to the request of the MoEN No. 03-07/175 dated 02.02.2011.
Type and source of EF and OF Methodological issues regarding estimation of CO2 emissions from soda ash production and use are addressed in the 2006 IPCC Guidelines for National Greenhouse Gas Inventories, Volume 3, Chapter 2: Mineral Industry Emissions, specifically in Chapter 2.1, Table 2.1, Page 2.7. The emission factor used to calculate CO2 emissions from soda ash use was estimated using the stoichiometry of the chemical processes and the following equation: EFsa = 44.0099 g/mole CO2 / 106.0685 g/mole Na2CO3 = 0.41492 t CO2 / t Na2CO3.
Uncertainty of AD and source 20% - expert judgementUncertainty of EF and source 5% - expert judgementPotential Improvements No potential improvements are planned to be implemented in the next inventory cycle for source category 2A4b ‘Other Uses of Soda Ash’.
2.2.2. Category 2B ‘Chemical Industry’
Tables 2.2.2.1 – 2.2.2.3 below comprise relevant information on source categories comprised within the inventory, including description of each source by gas allocated to category 2B ‘Chemical Industry’.
Table 2.2.2.1: Information on Source Category 2B10 ‘Other’ (Polyethylene Production) – Pollutant Emissions Sector Industrial Processes and Product UseCategory 2B Chemical IndustrySource / Gas 2B10 Other / Polyethylene Production / Pollutant Emissions

Chapter 2: Methods and Data Documentation
2 - 108
Key Category? Not applicable for pollutant emissions.Category Description / Defini-tion
Three types of polyethylene are produced: low density polyethylene (LDPE), linear low-density polyethylene (LLDPE) and high-density polyethylene (HDPE). Polyethylene is a polymer of ethylene and has the general empirical formula (-CH2CH2-)n. The manufacturing process used depends upon the type of polymer produced. LDPE is a tough waxy polymer, with approximately 2 per cent branching between polymer chains and has a density of about 0.92 t/m3. LDPE is generally produced by high pressure and high temperature catalytic polymerization of ethylene in a tubular or autoclave reactor. LLDPE is a crystalline polymer with no chain branching and a density comparable to that of LDPE. A low-pressure method is generally used in which ethylene and a co-monomer such as butane or hexane is catalytically polymerized. HDPE is a crystalline polymer with no chain branching and a density of about 0.96t/m3. HDPE is produced by low pressure polymerization of ethylene in a reactor containing a liquid hydrocarbon diluent and in the presence of Ziegler catalysts. The polymer produces slurry as it forms and is filtered from the solvent. NMVOCs are emitted primarily through leakages, and may be production time dependent rather than production dependent. Control techniques are primarily through replacement of leaking valves etc., and regular maintenance.
Country Detail Polyethylene is produced on both banks of Dniester river. No plant specific data are available so far.Equation(Describe variables for method used)
The Tier 1 approach for process emissions from polyethylene production uses the general equation (1) from the EMEP/EEA Air Pollution Emission Inventory Guidebook 2016, NFR 2.B.5.a Other chemical industry, section 3.2 ‘Tier 1 default approach’:
E pollutant = AR production • EF pollutantWhere:
E pollutant is the emission of a pollutant (kg);AR production is the annual production of polyethylene (tons);EF pollutant is the emission factor of the relevant pollutant (kg pollutant / ton polyethylene).
Reference EEA (2016), EMEP/EEA Air Pollution Emission Inventory Guidebook 2016, Technical guidance to prepare national emission inventories. European Environment Agency, Technical report No 21/2016. Copen-hagen, Denmark (Available on: http://www.eea.europa.eu//publications/emep-eea-guidebook-2016).National Inventory Report: 1990-2016. Greenhouse Gas Sources and Sinks in the Republic of Moldova (2018).
Describe How and Why this Method Was Chosen Due to the lower importance of this emission source and unavailability of country specific emission factors, the Tier 1 methodology has been used.
Type and source of activity data The information on polyethylene production is reported in the Table 4-45 from National Inventory Report: 1990-2016. Greenhouse Gas Sources and Sinks in the Republic of Moldova. Activity data for the right bank of Dniester river are based on information provided by the National Bureau of Statistics of the Republic of Moldova through the Statistical Yearbooks of the RM for 1994 (page 284), 1999 (page 302), 2005 (page 391), 2011 (page 305); as well as through the Statistical Reports PRODMOLD-A „Total production, as a natural expression, in the Republic, by product type for 2005-2016” (are produced only since 2005 year). Activity data for the left bank of Dniester river are available in the Statistical Yearbooks of the ATULBD for 1998 (page 176), 2002 (page 103), 2005 (page 94), 2007 (page 92), 2010 (page 95), 2012 (page 100), 2014 (page 90), 2017 (page 103).
Type and source of EF and OF Default EF Used to Estimate NMVOC Emissions from Polyethylene Production
Source SNAP Description NMVOC Emissions, kg / t95% confidence interval
Lower Upper
Other Chemical Products 040506040507
LDPE ProductionHDPE Production
2.42.3
1.01.9
4.55.8
Source: EMEP/EEA Atmospheric Emissions Inventory Guidebook, November 2016, Code SNAP 040506 LDPE Production, Category 2.B.5.a, Table 3.39, page 37. Code SNAP 040507 HDPE Production, Category 2.B.5.a, Table 3.40, page 37.
Uncertainty of AD and source 5% - expert judgementUncertainty of EF and source See the 95% confidence interval in the table above.
Table 2.2.2.2: Information on Source Category 2B10 ‘Other’ (Acrylonitrile Butadiene Styrene Resins Production) – Pollutant Emissions Sector Industrial Processes and Product UseCategory 2B Chemical IndustrySource / Gas 2B10 Other / Acrylonitrile Butadiene Styrene Resins (ABS) Production / Pollutant EmissionsKey Category? Not applicable for pollutant emissions.

Chapter 2: Methods and Data Documentation
2 - 109
Category Description / Defini-tion
Acrylonitrile Butadiene Styrene (ABS) is a combination of a graft copolymer and a polymer mixture (graft copolymer – a polymer with a ‘backbone’ of one type of monomer and with ‘ribs’ of copolymers of two other monomers). ABS can be produced in three ways: (1) emulsion polymerization: it is a two-step process; in the first step a rubber latex is made, usually in a batch process; in the second step, which can be operated as batch and continuous, styrene and acrylonitrile are polymerized in the rubber latex solution to form an ABS latex; the ABS polymer is recovered through coagulation of the ABS latex by adding a destabilizing agent; the resulting slurry is filtered or centrifuged to recover the ABS resin; the ABS resin is then dried; (2) mass polymerization: two or more continuous flow reactors are used in this process; rubber is dissolved in the monomers, being styrene and acrylonitrile; during the reaction the dissolved rubber is replaced by the Styrene Acrylonitrile Copolymer (SAN) and forms discrete rubber particles; part of the SAN is grafted on the rubber particles, while another part is occluded in the particles; the reaction mixture contains several additives, these are needed in the polymerization; the product is devolatilized to remove unreacted monomer, which are recycled to the reactor, and then pelletized; (3) mass suspension: this batch process starts with a mass polymerization which is stopped at a monomer conversion of 15-30 per cent; then a suspension reaction completes the polymerization; for this reaction the mixture of polymer and monomer is suspended in water using a suspending agent and then the polymerization is continued; unreacted monomers are stripped, then the product is centrifuged and dried. NMVOC emissions of acrylonitrile butadiene styrene resins plants can be subdivided as follows: leakage losses from appendages, pumps, and other leakage. The losses due to leakage can be limited by use of certain types of seals and application of double seals near pumps.
Country Detail Acrylonitrile Butadiene Styrene (ABS) used to be produced on both banks of Dniester River until 1994, since 1995 it is produced only on the left bank of Dniester river.
Equation(Describe variables for method used)
The Tier 1 approach for process emissions from ABS resin production uses the general equation (1) from the EMEP/EEA Air Pollution Emission Inventory Guidebook 2016, NFR 2.B.5.a Other chemical industry, section 3.2 ‘Tier 1 default approach’:
E pollutant = AR production • EF pollutantWhere:
E pollutant is the emission of a pollutant (kg);AR production is the annual production of ABS resin (tons);EF pollutant is the emission factor of the relevant pollutant (kg pollutant / ton ABS resin).
ReferenceEEA (2016), EMEP/EEA Air Pollution Emission Inventory Guidebook 2016, Technical guidance to prepare national emission inventories. European Environment Agency, Technical report No 21/2016. Copen-hagen, Denmark (Available on: http://www.eea.europa.eu//publications/emep-eea-guidebook-2016).National Inventory Report: 1990-2016. Greenhouse Gas Sources and Sinks in the Republic of Moldova (2018).
Describe How and Why this Method Was Chosen Due to the lower importance of this emission source and unavailability of country specific emission factors, the Tier 1 methodology has been used.
Type and source of activity data
The information on ABS resin production is reported in the Table 4-47 from National Inventory Report: 1990-2016. Greenhouse Gas Sources and Sinks in the Republic of Moldova. Activity data for the right bank of Dniester river are based on information provided by the National Bureau of Statistics of the Republic of Moldova through the Statistical Yearbook of the RM for 1994 (page 284). Activity data for the left bank of Dniester river are available in the Statistical Yearbooks of the ATULBD for 1998 (page 176), 2002 (page 103), 2005 (page 94), 2007 (page 92), 2010 (page 95), 2012 (page 100), 2014 (page 90), 2017 (page 101).
Type and source of EF and OF
Default EF Used to Estimate NMVOC Emissions from Acrylonitrile Butadiene Styrene Production
Source SNAP Description NMVOC Emissions, kg / t95% confidence interval
Lower UpperOther Chemical Products 040515 Production of ABS Resins 3.0 1.0 25
Source: EMEP/EEA Atmospheric Emissions Inventory Guidebook, November 2016, Code SNAP 040515 Production of ABS resins, Category 2.B.5.a, Table 3.51, page 45.Uncertainty of AD and source 5% - expert judgementUncertainty of EF and source See the 95% confidence interval in the table above.
Table 2.2.2.3: Information on Source Category 2B10 ‘Other’ (Polystyrene Production) – Pollutant Emissions Sector Industrial Processes and Product UseCategory 2B Chemical IndustrySource / Gas 2B10 Other / Polystyrene Production / Pollutant EmissionsKey Category? Not applicable for pollutant emissions.

Chapter 2: Methods and Data Documentation
2 - 110
Category Description / Defini-tion
Polystyrene is made by polymerising styrene monomer and is rigid plastic material, transparent or opaque, having a high refractive index (1.59) and a specific low weight (1.054). It is a polymer in which the high molecular weight hydrocarbon (C8H8)n is predominant, with the value of n between 500 and 2000. The polymer also contains small amounts of styrene, ethyl-benzene, traces of catalysts and low molecular weight polymers, in shares that vary according to the polymerization process used. The styrene homopolymer, the copolymers and their components are thermoplastic materials with a predominantly amorphous structure. The molecular weight distribution influences polystyrene properties and in particular the tensile strength, shock resistance, viscosity and the so important flow during moulding through injection or extrusion. The low molecular weight component of the polymer also influences the flow, light stability, electrical properties, chemical stability etc. Low molecular weight components can be: unpolymerized styrene, saturated or non-polymerizable substances such as aldehydes, ethyl-benzene and di-, tri-, tetramers etc. Styrene polymerization at the industrial scale is carried out on the basis of the radical mechanism. The conjugated double vinyl bond and benzene nucleus give the styrene a particular reactivity as a monomer in the radical polymerization and, at the same time, a low activity of the respective radical. The initiation of radical styrene polymeriza-tion can be done thermally, photochemically, radiochemically or with initiators. Thermal polymerization is a consequence of the high reactivity of this monomer. Styrene polymerization can also be initiated by a large number of substances capable of decomposing into radicals under the action of heat. Peroxides, hydroperoxides or nitrocombinations are commonly used. Styrene polymerization can be carried out in block, solution, emulsion and suspension. Bulk polymerization is more widespread and can be conducted in the presence of initiators or under the influence of temperature. The use of initiators can lead to an uncontrolled process or to oxidation reactions, which lead to yellowing of the polymer. For this reason, on industrial scale it is applied thermal initiation, at 150-260°C. Such high temperatures are due to the fact that at 100°C, the reaction rate is low (conversions of 2 per cent per hour), and at the end (at conversions higher than 90 per cent) the polymerization rate drops greatly and only when temperature rises at 220-260°C it can lead to a polymer with a monomer content of less than 1 per cent. On industrial scale, bulk polymerization can take place in discontinuous or continuous installations, the latter being the most used. The main difficulty in this process is to increase the viscosity of the environment, making it difficult to remove the reaction heat. Discontinuous mass polymerization consists in introducing previously purified styrene in glass forms, which, under heat, in the presence or absence of initiators, in an air or inert gas environment is transformed into a hard mass taking the shape of the glass form. The continuous mass polymerization allows the production of a polymer free of monomer traces, characterized by a high molecular mass. This is carried out in polymerization towers or vacuum drying chambers. In order to overcome certain drawbacks, different types of reactors were used, with the following bulk polymerization installations being known: with a tubular displacement reactor, with shaking tubular reactors, rolling mill and horizontal reactors.
Country Detail Polystyrene is produced in the Republic of Moldova since 2005. No plant specific information is available so far.
Equation(Describe variables for method used)
The Tier 1 approach for process emissions from polystyrene production uses the general equation (1) from the EMEP/EEA Air Pollution Emission Inventory Guidebook 2016, NFR 2.B.5.a Other chemical industry, section 3.2 ‘Tier 1 default approach’:
E pollutant = AR production • EF pollutantWhere:
E pollutant is the emission of a pollutant (kg);AR production is the annual production of polystyrene (tons);EF pollutant is the emission factor of the relevant pollutant (kg pollutant / ton polystyrene).
ReferenceEEA (2016), EMEP/EEA Air Pollution Emission Inventory Guidebook 2016, Technical guidance to prepare national emission inventories. European Environment Agency, Technical report No 21/2016. Copen-hagen, Denmark (Available on: http://www.eea.europa.eu//publications/emep-eea-guidebook-2016).National Inventory Report: 1990-2016. Greenhouse Gas Sources and Sinks in the Republic of Moldova (2018).
Describe How and Why this Method Was Chosen Due to the lower importance of this emission source and unavailability of country specific emission factors, the Tier 1 methodology has been used.
Type and source of activity dataThe information on polyethylene production is reported in the Table 4-49 from National Inventory Report: 1990-2016. Greenhouse Gas Sources and Sinks in the Republic of Moldova. Activity data for the right bank of Dniester river are based on information provided by the National Bureau of Statistics of the Republic of Moldova through the Statistical Reports PRODMOLD-A „Total production, as a natural expression, in the Republic, by product type for 2005-2016” (are produced from 2005 year).
Type and source of EF and OF
Default EF Used to Estimate NMVOC Emissions from Polystyrene Production
Source SNAP Description NMVOC Emissions, g / t
95% confidence intervalLower Upper
Other Chemical Products 040511
Production of general-purpose polystyrene (GPPS)Production of high impact polystyrene (HIPS)Production of expandable polystyrene (EPS)
1201203.2
50501.6
300100011.5
Source: EMEP/EEA Atmospheric Emissions Inventory Guidebook, November 2016, Code SNAP 040511 Polystyrene, Category 2.B.5.a, Tables 3.45-3.47, page 42.Uncertainty of AD and source 5% - expert judgementUncertainty of EF and source See the 95% confidence interval in the table above.

Chapter 2: Methods and Data Documentation
2 - 111
2.2.3. Category 2C ‘Metal Industry’Tables 2.2.3.1 – 2.2.3.2 below comprise relevant information on source categories comprised within the inventory, including description of each source by gas allocated to category 2C ‘Metal Industry’.Table 2.2.3.1: Information on Source Category 2C1 ‘Iron and Steel Production’ – CO2Sector Industrial Processes and Product UseCategory 2C Metal IndustrySource / Gas 2C1 Iron and Steel Production / CO2
Key Category? No
Category Description / Defini-tion
Iron and steel production can occur at primary integrated facilities, by reducing the iron ore with metallurgical coke; and at secondary facilities, in particular, by melting the recycled steel scrap using electrical energy imparted to the charge through carbon electrodes. Primary facilities are: open hearth furnaces (OHFs) accounting for circa 4 per cent of the world iron and steel production, and basic oxygen steelmaking furnaces (BOFs), accounting for circa 63 per cent of the world iron and steel production. The metallurgical coke used in furnaces and ovens is oxidized to CO2 and then emitted into the atmosphere (a certain amount of carbon is retained in iron). Secondary steelmaking most often occurs in electric arc furnaces (EAFs) accounting for circa 33 per cent of the world iron and steel production. Electric arc furnaces are equipped with carbon electrodes (usually made from graphite with a carbon content of circa 97 per cent). Through carbon electrodes electricity is added to the scrap in the furnace, thus raising the temperature to 1700ºC. Lime, anthracite and pig-iron are also added. Depending on the desired quality of the steel, chromium, magnesium, molybdenum or vanadium compounds can be added as well. CO2 emissions from steel production in electric arc furnaces are determined by carbon losses in electrodes, as well as from carbonates use. When electrodes are placed above the melted metal, the electric arc oxidizes the carbon to CO or CO2. Sometimes, electrodes are immersed in the melted metal to increase carbon concentration in steel, thus contributing to additional CO2 emissions.
Country Detail
Metal Integrated Works in Ribnita on the left bank of Dniester river is one of the two mini-metallurgical works (the second is located in Jlobino, Belarus) bought by the USSR in the early 80’s of the twentieth century on „dollar for oil” account. These plants were, at the time, at the level of Western European plants, well provided with advanced equipment and efficient technologies. Production capacity at the launch in 1985 year represented about 684 kt of steel and 500 kt of rolling mills. By 2004/2005, steel production reached 1 million tons of steel and 800 thousand tons of rolling mills. The Metal Integrated Works in Ribnita uses scrap metal collected mainly in the Republic of Moldova, but also from the neighboring countries, especially from Ukraine. At the same time, there are a number of enterprises on the right bank of Dniester River (such as: “Incomaș” J.S.C., Plant “Fiting” J.S.C., Pipe Plant “Protos” J.S.C. owned by the company IM ‘Orvento Metall Trading Co’ Ltd., etc.) that use low-capacity electric arc furnaces (less than 50 tones). The steel production of these enterprises is insignificant compared to that of the Metal Integrated Works in Ribnita. Between 1990 and 2016 years, CO2 emissions from the source category 2C1 ‘Iron and Steel Production’ decreased in the Republic of Moldova by circa 81.7 per cent. To be noted that the economic crisis in 2009 has significantly affected the metal industry in the Republic of Moldova, with steel production declining between 2008 and 2009 by circa 52 per cent, and the same trend was observed in the following year: between 2009 and 2010 steel production decreased with another 43 per cent. In 2010-2015 years, there was a tendency to increase the metal production, for example, between 2013 and 2014, it increased by 80.2 per cent, while between 2014 and 2015, by another 24.8 per cent. Concomitantly, between 2015 and 2016, the CO2 emissions from metal industry decreased by 70 per cent, this evolution being caused by the unfavorable situation on the traditional markets for Moldovan steel production.
Equation(Describe variables for method used)
CO2 emissions from 2C1 ‘Iron and Steel Production’ source category was estimated using a Tier 2 methodology, based on carbon track through the production process. Total CO2 emission from 2C1 ‘Iron and Steel Production’ source category were estimated using equation 4.9 from the 2006 IPCC Guidelines for National Greenhouse Gas Inventories, Volume 3, Chapter 4: Metal Industry Emissions, Chapter 4.2: Iron & Steel and metallurgical Coke production, page 4.22. Below is the simplified version of this equation, adapted to national circumstances.
ECO2= [L • CL+ D • CD+ CE • CCE - S • CS] • 44/12 Where:
E CO2 – total CO2 emissions from steel production, tones;L – quantity of limestone consumed in steel production, tones;CL – carbon content in limestone consumed in steel production, tC/t limestone;D – quantity of dolomite consumed in steel production, tones;CD – carbon content in dolomite consumed in steel production, tC/t dolomite;CE – quantity of carbon electrodes consumed in EAFs, tones;CCE – carbon content in electrodes consumed in EAFs, tC/t electrodes;S – quantity of steel produced, tones;CS – carbon content in steel produced, tC/t steel;44/12 – stoichiometric ratio CO2/C.
Reference 2006 IPCC Guidelines for National Greenhouse Gas Inventories, Volume 3, Chapter 4: Metal Industry Emissions.National Inventory Report: 1990-2016. Greenhouse Gas Sources and Sinks in the Republic of Moldova (2018).
Describe How and Why this Method Was Chosen Due to the importance of this source, the Tier 2 methodology has been used.

Chapter 2: Methods and Data Documentation
2 - 112
Type and source of activity data
The amount of steel produced is reported in the Table 4-53, while the amount of rolling mills produced is reported in the Table 4-54 from the National Inventory Report: 1990-2016. Greenhouse Gas Sources and Sinks in the Republic of Moldova. Activity data for the right bank of Dniester river are based on information provided by the National Bureau of Statistics of the Republic of Moldova through the Statistical Yearbooks of the RM for 1994 (page 224), 1999 (page 302), 2003 (page 391), 2004 (page 441), 2010 (page 305); as well as through the Statistical Reports PRODMOLD-A „Total production, as a natural expression, in the Republic, by product type for 2005-2016” (are produced only since 2005 year). Activity data for the left bank of Dniester river are available in the Statistical Yearbooks of the ATULBD for 1998 (page 178), 2000 (page 99), 2002 (page 103), 2006 (page 93), 2007 (page 92), 2010 (page 93), 2013 (page 99), 2017 (page 101).
Type and source of EF and OF
In the Republic of Moldova, the content of carbon in crude steel represents circa 0.25 per cent (according to the information provided by producer, the content of carbon in crude steel varies between 0.17 and 0.33 per cent) (Metal Integrated Works from Ribnita, <http://www.aommz.com/pls/webus/webus.main.show>). According to the 2006 IPCC Guidelines, depending of steel type and quality, the content of carbon in crude steel varies between 0.5 and 2 per cent, the default value used is 1 per cent (Volume 3, Chapter 4.2, Table 4.3, page 4.27). Other relevant coefficients used to estimate CO2 emissions from steel production are presented in the table below.Carbon Content of Various Materials Used in Steel Production
Raw Material Carbon content, default values, t C / t Raw Material Carbon content values used at the national level, t C / t
Limestone 0.12 Lime with high calcium content 0.2142Dolomite 0.13 Dolomite lime 0.2492Carbon electrodes from petroleum coke for EAF 0.82Carbon electrodes from coal coke for EAF 0.83 Graphite electrodes for EAF 0.97Scrap metal 0.04 Steel 0.01 Steel 0.0025
In order to estimate CO2 emissions from steel production it was also considered the specific consumption of raw materials and graphite electrodes for producing 1 ton of steel, this information being identified in the literature in the field and on the web pages of the metallurgical companies. Thus, for example, the consumption of graphite electrodes in electric arc furnaces with a capacity of 30-50 tones, specific to enterprises on the right bank of Dniester River, was agreed to be 7 kg/t of steel produced (<http://metal-archive.ru/tyazhelye-metally/1468-vyplavka-stali-v-dugovyh-pechah.html>). The specific consumption of graphite electrodes in electric furnaces with higher capacity (such as that from the Metal Integrated Works in Ribnita with a capacity of 120 tons) (<http://www.aommz.com/pls/web/web.main.show?main_id=10&m_id=11>) was agreed to be 1.3 kg/t of steel produced (<http://elar.urfu.ru/bitstream/10995/40661/1/978-5-7996-1725-7_2016.pdf>). The specific consumption of lime with high calcium content and/or dolomite lime is considered to be 55 kg/ton of steel produced (<https://rep.bntu.by/bitstream/handle/data/6984/%D0%A1.%20128-130.pdf?sequence=1>) (representing 45 kg of lime with high calcium content, respectively 10 kg of dolomite lime).
Uncertainty of AD and source 5% - expert judgementUncertainty of EF and source 10% - expert judgement
Potential Improvements Potential improvements under the 2C1 ‘Iron and steel production’ source category aim at updating the activity data regarding the consumption of raw materials per ton of production, as well as the specific consumption of electrodes per ton of steel produced by the national enterprises.
Table 2.2.3.2: Information on Source Category 2C1 ‘Iron and Steel Production’ – Pollutant EmissionsSector Industrial Processes and Product UseCategory 2C Metal IndustrySource / Gas 2C1 Iron and Steel Production / Pollutant EmissionsKey Category? Not applicable for pollutant emissions.Category Description / Defini-tion
Iron and steel production can occur at primary integrated facilities, by reducing the iron ore with metallurgical coke; and at secondary facilities, in particular, by melting the recycled steel scrap using electrical energy imparted to the charge through carbon electrodes. Primary facilities are: open hearth furnaces (OHFs) accounting for circa 4 per cent of the world iron and steel production, and basic oxygen steelmaking furnaces (BOFs), accounting for circa 63 per cent of the world iron and steel production. Secondary steelmaking most often occurs in electric arc furnaces (EAFs) accounting for circa 33 per cent of the world iron and steel production. Electric arc furnaces are equipped with carbon electrodes (usually made from graphite with a carbon content of circa 97 per cent). Through carbon electrodes electricity is added to the scrap in the furnace, thus raising the temperature to 1700ºC. Lime, anthracite and pig-iron are also added. Depending on the desired quality of the steel, chromium, magnesium, molybdenum or vanadium compounds can be added as well.

Chapter 2: Methods and Data Documentation
2 - 113
Country Detail Metal Integrated Works in Ribnita on the left bank of Dniester river is one of the two mini-metallurgical works (the second is located in Jlobino, Belarus) bought by the USSR in the early 80’s of the twentieth century on „dollar for oil” account. These plants were, at the time, at the level of Western European plants, well provided with advanced equipment and efficient technologies. Production capacity at the launch in 1985 year represented about 684 kt of steel and 500 kt of rolling mills. By 2004/2005, steel production reached 1 million tons of steel and 800 thousand tons of rolling mills. The Metal Integrated Works in Ribnita uses scrap metal collected mainly in the Republic of Moldova, but also from the neighbouring countries, especially from Ukraine. At the same time, there are a number of enterprises on the right bank of Dniester River (such as: “Incomaș” J.S.C., Plant “Fiting” J.S.C., Pipe Plant “Protos” J.S.C. owned by the company IM ‘Orvento Metall Trading Co’ Ltd., etc.) that use low-capacity electric arc furnaces (less than 50 tones). The steel production of these enterprises is insignificant compared to that of the Metal Integrated Works in Ribnita.
Equation(Describe variables for method used)
The Tier 2 approach for process emissions from iron and steel production uses the general equation (1) from the EMEP/EEA Air Pollution Emission Inventory Guidebook 2016, NFR 2.C.1 Iron and steel produc-tion, section 3.3 ‘Tier 2 technology-specific approach’:
E pollutant = AR production technology • EF technology pollutantWhere:
E pollutant is the emission of a pollutant (kg);AR production technology is the annual production of iron and steel (tons);EF technology pollutant is the emission factor of the relevant pollutant (kg pollutant / ton iron and steel).
Reference EEA (2016), EMEP/EEA Air Pollution Emission Inventory Guidebook 2016, Technical guidance to prepare national emission inventories. European Environment Agency, Technical report No 21/2016. Copen-hagen, Denmark (Available on: http://www.eea.europa.eu//publications/emep-eea-guidebook-2016).National Inventory Report: 1990-2016. Greenhouse Gas Sources and Sinks in the Republic of Moldova (2018).
Describe How and Why this Method Was Chosen A Tier 2 methodology has been used due to availability of technology specific information on iron and steel production in the Republic of Moldova.
Type and source of activity data The amount of steel produced is reported in the Table 4-53, while the amount of rolling mills produced is reported in the Table 4-54 from the National Inventory Report: 1990-2016. Greenhouse Gas Sources and Sinks in the Republic of Moldova. Activity data for the right bank of Dniester river are based on information provided by the National Bureau of Statistics of the Republic of Moldova through the Statistical Yearbooks of the RM for 1994 (page 224), 1999 (page 302), 2003 (page 391), 2004 (page 441), 2010 (page 305); as well as through the Statistical Reports PRODMOLD-A „Total production, as a natural expression, in the Republic, by product type for 2005-2016” (are produced only since 2005 year). Activity data for the left bank of Dniester river are available in the Statistical Yearbooks of the ATULBD for 1998 (page 178), 2000 (page 99), 2002 (page 103), 2006 (page 93), 2007 (page 92), 2010 (page 93), 2013 (page 99), 2017 (page 101).
Type and source of EF and OF Default EF Used to Estimate Pollutant Emissions from Steel Production in Electric Arc Furnaces (EAF)
Source DescriptionNOx CO NMVOC SO2
g / t
Steel Production in Electric Arc Furnaces (EAF)Steel Production1 130 (120-140) 1700 (740-3900) 46 (16-130) 60 (24-30)Production of Rolling Mills 2 7 (2-20)
Source: EMEP/EEA Atmospheric Emissions Inventory Guidebook, November 2016, 1 2.C.1 Steel Production, 040207 – Steel Production in Electric Arc Furnaces, Table 3.19, page 43; 2 2.C.1 Steel Production, 040208 – Production of Rolling Mills, Table 3.22, page 45.
Uncertainty of AD and source 5% - expert judgementUncertainty of EF and source See the 95% confidence interval in the table above (in the brackets, lower-upper).
2.2.4. Category 2D ‘Non-Energy Products from Fuels and Solvents Use’
Tables 2.2.4.1 – 2.2.4.29 below comprise relevant information on source categories comprised within the inventory, including description of each source by gas allocated to category 2D ‘Non-Energy Products from Fuels and Solvents Use’.
Table 2.2.4.1: Information on Source Category 2D1 ‘Lubricant Use’ – CO2Sector Industrial Processes and Product UseCategory 2D Non-Energy Products from Fuels and Solvents UseSource / Gas 2D1 Lubricant Use / CO2

Chapter 2: Methods and Data Documentation
2 - 114
Key Category? NoCategory Description / Defini-tion
Lubricants are mostly used in industrial and transportation applications. The use of lubricants in engines is primarily for their lubricating properties and associated emissions are therefore considered as non-combustion emissions to be reported in the Sector 2 ‘IPPU’ and not in the Sector 1 ‘Energy’.
Country Detail In line with the recommendations in the 2006 IPCC Guidelines, where statistical data on lubricant consumption are aggregated without the possibility of delimiting oil and grease consumption, it is recommended to consider that 90 per cent of total lubricants are oils and 10 per cent – grease.
Equation(Describe variables for method used)
The methodology used to estimate CO2 emissions from lubricant use is a Tier 1 methodological approach. CO2 emissions are calculated according to 2006 IPCC Guidelines for National Greenhouse Gas Inventories, Volume 3: Industrial Processes and Product Use, Chapter 5: Non-Energy Products from Fuels and Solvent Use, Chapter 5.2: Lubricant Use, Equation 5.2, Page 5.7.
CO2 Emissions = LC • CC Lubricant • ODU Lubricant • 44/12Where:
CO2 emissions – emissions from lubricants, t CO2;LC – total lubricant consumption, TJ;CC Lubricant – carbon content of lubricant, t C/TJ;ODU Lubricant – ODU factor (oxidized during use);44/12 – mass ratio of CO2/C.
Reference 2006 IPCC Guidelines for National Greenhouse Gas Inventories, Volume 3: Industrial Processes and Product Use, Chapter 5: Non-Energy Products from Fuels and Solvent Use.National Inventory Report: 1990-2016. Greenhouse Gas Sources and Sinks in the Republic of Moldova (2018).
Describe How and Why this Method Was Chosen Due to the lower importance of this source and unavailability of all detailed data, the Tier 1 methodology has been used.
Type and source of activity data
The amount of lubricant (oil and grease) use (in TJ) within 1990-2016 periods is reported in the Table 4-60 from the National Inventory Report: 1990-2016. Greenhouse Gas Sources and Sinks in the Republic of Moldova. Activity data for the right bank of Dniester river are based on information provided by the National Bureau of Statistics of the Republic of Moldova through the Energy Balances of the Republic of Moldova for 1990, 1993-2016. Activity data for the left bank of Dniester river are available in the Socio-economic Development of the TMR, 2016 (final data). / State Statistical Service of the TMR - Тiraspol, 2017 – 81p.; Socio-economic Development of the TMR, 2015 (final data). / State Statistical Service of the TMR - Тiraspol, 2016 – 81p.; Socio-economic Development of the TMR, 2014 (final data). / State Statistical Service of the TMR - Тiraspol, 2015 – 81p.; Socio-economic Development of the TMR, 2013 (final data). / State Statistical Service of the Ministry of Economic Development of the TMR - Тiraspol, 2014 – 88p.; Socio-economic Development of the TMR, 2012. / State Statistical Service of the Ministry of Economic Development of the TMR - Тiraspol, 2013 – 85p.; Socio-economic Development of the TMR, 2011. / State Statistical Service of the Ministry of Economic Development of the TMR - Тiraspol, 2012 – 85p.; Socio-economic Development of the TMR, 2010. / State Statistical Service of the Ministry of Eco-nomic Development of the TMR - Тiraspol, 2011 – 79p.; Socio-economic Development of the TMR, 2009. / State Statistical Service of the Ministry of Economic Development of the TMR - Тiraspol, 2010 – 75p.
Type and source of EF and OF
CC Lubricant – carbon content of lubricant, t C/TJ; the default value used represents 20 t C/TJ (2006 IPCC Guidelines for National Greenhouse Gas Inventories, Volume 3: Industrial Processes and Product Use, Chapter 5: Non-Energy Products from Fuels and Solvent Use, Chapter 5.2: Lubricant Use, page 5.9).ODU Lubricant – ODU factor (oxidized during use); the default value used represents 20 per cent for oil and 5 per cent for grease (2006 IPCC Guidelines for National Greenhouse Gas Inventories, Volume 3: Industrial Processes and Product Use, Chapter 5: Non-Energy Products from Fuels and Solvent Use, Chapter 5.2: Lubricant Use, Tab.5.2, page 5.9).
Uncertainty of AD and source 5% - expert judgementUncertainty of EF and source 50% - expert judgementPotential Improvements No potential improvements are planned to be implemented in the next inventory cycle for source category 2D1 ‘Lubricant Use’.
Table 2.2.4.2: Information on Source Category 2D2 ‘Paraffin Wax Use’ – CO2Sector Industrial Processes and Product UseCategory 2D Non-Energy Products from Fuels and Solvents UseSource / Gas 2D2 Paraffin Wax Use / CO2
Key Category? NoCategory Description / Defini-tion
Within this category, CO2 emissions from the use of different products are monitored: petroleum jelly, paraffin waxes and other waxes, including ozokerite. Waxes are used in a number of various applications. Paraffin waxes are used in applications such as candles, corrugated boxes, for paper coating, food production, wax polishes, surfactants (as used in detergents) and many others.

Chapter 2: Methods and Data Documentation
2 - 115
Country Detail The AD regarding paraffin wax consumption are available in the Energy Balances of the Republic of Moldova only since 2004. For 1990-2003 time series the paraffin wax consumption was estimated indirectly based on lubricants consumption. In contrast to the previous inventory cycle, in the current cycle paraffin wax use on the left bank of Dniester River (in the ATULBD) was also estimated: it was considered that the share of paraffin was consumption on the left bank of Dniester River from the total national consumption is similar to the share of lubricants consumption in the ATULBD from the total national.
Equation(Describe variables for method used)
A Tier 1 methodological approach was used to estimate CO2 emissions from paraffin wax use.CO2 emissions are calculated according to 2006 IPCC Guidelines for National Greenhouse Gas Inventories, Volume 3: Industrial Processes and Product Use, Chapter 5: Non-Energy Products from Fuels and Solvent Use, Chapter 5.3: Paraffin Wax Use, Equation 5.4, Page 5.11.
CO2 Emissions = PW • CC Wax • ODU Wax • 44/12Where:
CO2 Emissions – emissions from waxes, t CO2;PW – total wax consumption, TJ;CC Wax – carbon content of paraffin wax, t C/ TJ;ODU Wax – ODU factor (oxidized during use) for paraffin wax, fraction;44/12 – mass ratio of CO2/C.
Reference 2006 IPCC Guidelines for National Greenhouse Gas Inventories, Volume 3: Industrial Processes and Product Use, Chapter 5: Non-Energy Products from Fuels and Solvent Use.National Inventory Report: 1990-2016. Greenhouse Gas Sources and Sinks in the Republic of Moldova (2018).
Describe How and Why this Method Was Chosen Due to the lower importance of this source and unavailability of all detailed data, the Tier 1 methodology has been used.
Type and source of activity data The amount of paraffin wax use (in TJ) within 1990-2016 periods is reported in the Table 4-61 from the National Inventory Report: 1990-2016. Greenhouse Gas Sources and Sinks in the Republic of Moldova.
Type and source of EF and OF
CC Wax – carbon content of paraffin wax, t C/ TJ; the default value used represents 20 t C / TJ (2006 IPCC Guidelines for National Greenhouse Gas Inventories, Volume 3: Industrial Processes and Product Use, Chapter 5: Non-Energy Products from Fuels and Solvent Use, Chapter 5.3: Paraffin Wax Use, Page 5.12).ODU Wax – ODU factor (oxidized during use) for paraffin wax, fraction; the default value used represents 20 per cent (2006 IPCC Guidelines for National Greenhouse Gas Inventories, Volume 3: Industrial Processes and Product Use, Chapter 5: Non-Energy Products from Fuels and Solvent Use, Chapter 5.3: Paraffin Wax Use, Page 5.12).
Uncertainty of AD and source 20% - expert judgementUncertainty of EF and source 100% - expert judgementPotential Improvements No potential improvements are planned to be implemented in the next inventory cycle for source category 2D2 ‘Paraffin Wax Use’.
Table 2.2.4.3: Information on Source Category 2D3a ‘Domestic Solvent Use’ – CO2Sector Industrial Processes and Product UseCategory 2D Non-Energy Products from Fuels and Solvents UseSource / Gas 2D3 Solvent Use / 2D3a Domestic Solvent Use / CO2
Key Category? NoCategory Description / Defini-tion This category includes indirect CO2 emissions from domestic solvent use.
Country Detail
In the Republic of Moldova there are no recorded statistical data on domestic solvent use. AD for certain applications can be generated indirectly based on the information on production, import and export of domestic products containing solvents. To be noted, that the domestic solvent production within the country is relatively low (see Table 4-63 from the National Inventory Report: 1990-2016. Greenhouse Gas Sources and Sinks in the Republic of Moldova). It should also be noted that the Statistical Reports PRODMOLD-A “Total production, as a natural expression, in the Republic, by product type” include relevant data only for 2005-2016 periods and thus cannot be considered complete for the entire period under review. Also, activity data are not always available in tons or liters thus requesting the use of conversion factors. Customs Service of the Republic of Moldova is a primary source of information on national import operations (see Table 4-64 from the National Inventory Report: 1990-2016. Greenhouse Gas Sources and Sinks in the Republic of Moldova). Though AD on the production and imports of certain household products are available, the solvents share in these products is unknown.

Chapter 2: Methods and Data Documentation
2 - 116
Equation(Describe variables for method used)
Indirect CO2 emissions were estimated based on the carbon content in NMVOC emissions. The default value used represents 60% per cent (2006 IPCC Guidelines for National Greenhouse Gas Inventories, Volume 3: Industrial Processes and Product Use, Chapter 5: Non-Energy Products from Fuels and Solvent Use, Chapter 5.5: Solvent Use, Section 5.5.4 ‘Uncertainty assessment’, Page 5.17). By oxidizing, this carbon converts into CO2 in atmosphere (it is assumed that all solvents from household waste products are of fossil origin).CO2 emissions from domestic solvents use were estimated using the following equation:
CO2 emissions = NMVOC • CC • 44/12Where:
CO2 emissions – carbon dioxide emissions from domestic solvents use, kt/yr;NMVOC – total NMVOC emissions within the respective category, kt/yr;CC – carbon content in NMVOC, fraction;44/12 – stoichiometric ratio CO2/C.
Reference2006 IPCC Guidelines for National Greenhouse Gas Inventories, Volume 3: Industrial Processes and Product Use, Chapter 5: Non-Energy Products from Fuels and Solvent Use, Chapter 5.5: Solvent Use, Section 5.5.4 ‘Uncertainty assessment’, Page 5.17.National Inventory Report: 1990-2016. Greenhouse Gas Sources and Sinks in the Republic of Moldova (2018).
Describe How and Why this Method Was Chosen Due to the lower importance of this source and unavailability of all detailed data, the Tier 1 methodology has been used.
Type and source of activity data The information on the population of the Republic of Moldova within 1990-2016 periods is reported in the Table 4-66 from the National Inventory Report: 1990-2016. Greenhouse Gas Sources and Sinks in the Republic of Moldova.
Type and source of EF and OF CC – carbon content in NMVOC, fraction (the default value used represents 60 per cent, with a margin of 50-70 per cent; 2006 IPCC Guidelines for National Greenhouse Gas Inventories, Volume 3: Industrial Processes and Product Use, Chapter 5: Non-Energy Products from Fuels and Solvent Use, Chapter 5.5: Solvent Use, Section 5.5.4 ‘Uncertainty assessment’, Page 5.17).
Uncertainty of AD and source 5% - expert judgementUncertainty of EF and source 20% - expert judgementPotential Improvements No potential improvements are planned to be implemented in the next inventory cycle for source category 2D3a ‘Domestic Solvent Use’.
Table 2.2.4.4: Information on Source Category 2D3a ‘Domestic Solvent Use’ – NMVOC Sector Industrial Processes and Product UseCategory 2D Non-Energy Products from Fuels and Solvents UseSource / Gas 2D3 Solvent Use / 2D3a Domestic Solvent Use / NMVOCKey Category? Not applicable for pollutant emissions.Category Description / Defini-tion This category includes pollutant emissions from domestic solvent use.
Country Detail
In the Republic of Moldova there are no recorded statistical data on domestic solvent use. AD for certain applications can be generated indirectly based on the information on production, import and export of domestic products containing solvents. To be noted, that the domestic solvent production within the country is relatively low (see Table 4-63 from the National Inventory Report: 1990-2016. Greenhouse Gas Sources and Sinks in the Republic of Moldova). It should also be noted that the Statistical Reports PRODMOLD-A “Total production, as a natural expression, in the Republic, by product type” include relevant data only for 2005-2016 periods and thus cannot be considered complete for the entire period under review. Also, activity data are not always available in tons or liters thus requesting the use of conversion factors. Customs Service of the Republic of Moldova is a primary source of information on national import operations (see Table 4-64 from the National Inventory Report: 1990-2016. Greenhouse Gas Sources and Sinks in the Republic of Moldova). Though AD on the production and imports of certain household products are available, the solvents share in these products is unknown.
Equation(Describe variables for method used)
The Tier 1 approach for NMVOC emissions from domestic solvent use uses the general equation (1) from the EMEP/EEA Air Pollution Emission Inventory Guidebook 2016, NFR 2.D.3.a Domestic solvent use including fungicides, section 3.1 ‘Tier 1 default approach’:
E pollutant = (P • EF pollutant) / 103
Where:E pollutant – Pollutant gas emissions from domestic solvents use, t/yr;P – Population, thousand inhabitants/yr;EF pollutant – Emission Factor for this pollutant gas, kg/person/yr.

Chapter 2: Methods and Data Documentation
2 - 117
ReferenceEEA (2016), EMEP/EEA Air Pollution Emission Inventory Guidebook 2016, Technical guidance to prepare national emission inventories. European Environment Agency, Technical report No 21/2016. Copen-hagen, Denmark (Available on: http://www.eea.europa.eu//publications/emep-eea-guidebook-2016).National Inventory Report: 1990-2016. Greenhouse Gas Sources and Sinks in the Republic of Moldova (2018).
Describe How and Why this Method Was Chosen Due to the lower importance of this source and unavailability of all detailed data, the Tier 1 methodology has been used.
Type and source of activity data The information on the population of the Republic of Moldova within 1990-2016 periods is reported in the Table 4-66 from the National Inventory Report: 1990-2016. Greenhouse Gas Sources and Sinks in the Republic of Moldova.
Type and source of EF and OF
Tier 1 Default Emission factors used to Estimate NMVOC Emissions from 2D3a ‘Domestic Solvents Use’ Source Category NMVOC Emission Factor (Other European Countries, excluding Western Europe) Unit
Domestic Solvent Use 1.2 (0.5-1.7) kg/person/yrSource: EMEP/EEA Air Pollutant Emission Inventory Guidebook (November 2016), Category 2.D.3.a ‘Domestic Solvent Use’ (including fungicides), Chapter 3.1, Table 3.1, page 8.
Uncertainty of AD and source 5% - expert judgementUncertainty of EF and source See the 95% confidence interval in the table above (in the brackets, lower-upper).
Table 2.2.4.5: Information on Source Category 2D3b ‘Road Paving with Asphalt’ – CO2Sector Industrial Processes and Product UseCategory 2D Non-Energy Products from Fuels and Solvents UseSource / Gas 2D3 Solvent Use / 2D3b Road Paving with Asphalt / CO2
Key Category? NoCategory Description / Defini-tion This category includes indirect CO2 emissions from road paving with asphalt.
Country Detail In the Republic of Moldova, the data related to asphalt production were provided by the Ministry of Transport and Roads Infrastructure for 1990-2002 periods, respectively by the National Bureau of Statistics for 2003-2016 periods (see Table 4-68 from the National Inventory Report: 1990-2016. Greenhouse Gas Sources and Sinks in the Republic of Moldova).
Equation(Describe variables for method used)
Indirect CO2 emissions were estimated based on the carbon content in NMVOC emissions. The default fossil carbon content fraction of NMVOC from asphalt production and use for road paving varies between 40 to 50 percent by mass (2006 IPCC Guidelines for National Greenhouse Gas Inventories, Volume 3: Industrial Processes and Product Use, Chapter 5: Non-Energy Products from Fuels and Solvent Use, Chapter 5.4: Asphalt Production and Use, Section 5.4.4 ‘Uncertainty assessment’, Page 5.16). By oxidizing, this carbon converts into CO2 in atmosphere (it is assumed that all solvents from asphalt are of fossil origin).CO2 emissions from road paving with asphalt were estimated using the following equation:
CO2 emissions = NMVOC • CC • 44/12Where:
CO2 emissions – carbon dioxide emissions from road paving with asphalt, kt/yr;NMVOC – total NMVOC emissions within the respective category, kt/yr;CC – carbon content in NMVOC, fraction;44/12 – stoichiometric ratio CO2/C.
Reference2006 IPCC Guidelines for National Greenhouse Gas Inventories, Volume 3: Industrial Processes and Product Use, Chapter 5: Non-Energy Products from Fuels and Solvent Use, Chapter 5.4: Asphalt Produc-tion and Use, Section 5.4.4 ‘Uncertainty assessment’, Page 5.16.National Inventory Report: 1990-2016. Greenhouse Gas Sources and Sinks in the Republic of Moldova (2018).
Describe How and Why this Method Was Chosen Due to the lower importance of this source and unavailability of all detailed data, the Tier 1 methodology has been used.

Chapter 2: Methods and Data Documentation
2 - 118
Type and source of activity data
The information on the amount of asphalt production for road paving in the Republic of Moldova within 1990-2016 periods is reported in the Table 4-68 from the National Inventory Report: 1990-2016. Green-house Gas Sources and Sinks in the Republic of Moldova. The information is based on activity data provided by the Ministry of Transport and Roads Infrastructure through the Official Letter No. 03-5-2/2-32 dated 31.03.1999, as a response to the request of the Ministry of Environment No. 01-7/172 dated 12.03.1999; Official Letter No. 04-02-3/101 dated 18.02.2004, as a response to the request of the Ministry of Ecology No. 257-01-07 dated 26.01.2004; Official Letter No. 04-01-3/754 dated 2.10.2006, as a response to the request of the Ministry of Ecology and Natural Resources No. 01-07/1400 dated 25.08.2006; as well as based on information provided by the National Bureau of Statistics of the RM through the Official Letter No. 06-39/08 dated 23.02.2011, as a response to the request of the Ministry of Environment No. 03-07/175 dated 02.02.2011 and through the Statistical Reports PRODMOLD-A „Total production, as a natural expression, in the Republic of Moldova, by product type, for 2005-2016”.
Type and source of EF and OFCC – carbon content in NMVOC, fraction (the default fossil carbon content fraction of NMVOC from asphalt production and use for road paving varies between 40 to 50 percent by mass; 2006 IPCC Guidelines for National Greenhouse Gas Inventories, Volume 3: Industrial Processes and Product Use, Chapter 5: Non-Energy Products from Fuels and Solvent Use, Chapter 5.4: Asphalt Production and Use, Section 5.4.4 ‘Uncertainty assessment’, Page 5.16).
Uncertainty of AD and source 5% - expert judgementUncertainty of EF and source 20% - expert judgementPotential Improvements No potential improvements are planned to be implemented in the next inventory cycle for source category 2D3b ‘Road paving with asphalt’.
Table 2.2.4.6: Information on Source Category 2D3b ‘Road Paving with Asphalt’ – Pollutant EmissionsSector Industrial Processes and Product UseCategory 2D Non-Energy Products from Fuels and Solvents UseSource / Gas 2D3 Solvent Use / 2D3b Road Paving with Asphalt / Pollutant EmissionsKey Category? Not applicable for pollutant emissions.Category Description / Defini-tion This category includes pollutant emissions from road paving with asphalt.
Country Detail In the Republic of Moldova, the data related to asphalt production were provided by the Ministry of Transport and Roads Infrastructure for 1990-2002 periods, respectively by the National Bureau of Statistics for 2003-2016 periods (see Table 4-68 from the National Inventory Report: 1990-2016. Greenhouse Gas Sources and Sinks in the Republic of Moldova).
Equation(Describe variables for method used)
The Tier 1 approach for emissions from road paving with asphalt uses the general equation (1) from the EMEP/EEA Air Pollution Emission Inventory Guidebook 2016, NFR 2.D.3.b ‘Road paving with asphalt’, section 3.1 ‘Tier 1 default approach’:
E pollutant = (A • EF pollutant) / 106
Where:E pollutant – NMVOC, CO, NOx and SOx emissions, kt/yr;A – Annual production of asphalt, kt/an;EF pollutant – Default Emission Factor, g/t.
ReferenceEEA (2016), EMEP/EEA Air Pollution Emission Inventory Guidebook 2016, Technical guidance to prepare national emission inventories. European Environment Agency, Technical report No 21/2016. Copen-hagen, Denmark (Available on: http://www.eea.europa.eu//publications/emep-eea-guidebook-2016).National Inventory Report: 1990-2016. Greenhouse Gas Sources and Sinks in the Republic of Moldova (2018).
Describe How and Why this Method Was Chosen Due to the lower importance of this source and unavailability of all detailed data, the Tier 1 methodology has been used.
Type and source of activity data
The information on the amount of asphalt production for road paving in the Republic of Moldova within 1990-2016 periods is reported in the Table 4-68 from the National Inventory Report: 1990-2016. Green-house Gas Sources and Sinks in the Republic of Moldova. The information is based on activity data provided by the Ministry of Transport and Roads Infrastructure through the Official Letter No. 03-5-2/2-32 dated 31.03.1999, as a response to the request of the Ministry of Environment No. 01-7/172 dated 12.03.1999; Official Letter No. 04-02-3/101 dated 18.02.2004, as a response to the request of the Ministry of Ecology No. 257-01-07 dated 26.01.2004; Official Letter No. 04-01-3/754 dated 2.10.2006, as a response to the request of the Ministry of Ecology and Natural Resources No. 01-07/1400 dated 25.08.2006; as well as based on information provided by the National Bureau of Statistics of the RM through the Official Letter No. 06-39/08 dated 23.02.2011, as a response to the request of the Ministry of Environment No. 03-07/175 dated 02.02.2011 and through the Statistical Reports PRODMOLD-A „Total production, as a natural expression, in the Republic of Moldova, by product type, for 2005-2016”.

Chapter 2: Methods and Data Documentation
2 - 119
Type and source of EF and OF
Default Emission Factors used to estimate Pollutant Emissions from Asphalt Production and Use for Road Paving with Asphalt
Description NOx CO SO2 NMVOC
g / t kg / t
Roadstone Coating with Asphalt / Asphalt Concrete Plants1 35.6(12.5-60)
200(100-300)
17.7(2.3-44) -
Road Paving with Asphalt (Liquified Asphalt, Cutback Asphalt, Uncontrolled Abatement Technologies)2 - - - 30
(10-100)Source: EMEP/EEA Atmospheric Emissions Inventory Guidebook, November 2016. 1 Code SNAP 030313 Asphalt Concrete Plants, Category 1.A.2.f.i, Table 3-25, Page 32. 2 Code SNAP 040611 Road Paving with Asphalt, Category 2.D.3.b, Table 3.4, Page 11.
Uncertainty of AD and source 5% - expert judgementUncertainty of EF and source See the 95% confidence interval in the table above (in the brackets, lower-upper).
Table 2.2.4.7: Information on Source Category 2D3c ‘Asphalt Roofing’ – CO2Sector Industrial Processes and Product UseCategory 2D Non-Energy Products from Fuels and Solvents UseSource / Gas 2D3 Solvent Use / 2D3c Asphalt Roofing / CO2
Key Category? NoCategory Description / Defini-tion This category includes indirect CO2 emissions from asphalt roofing.
Country Detail In the Republic of Moldova, the data related to asphalt roofing production were provided by the National Bureau of Statistics for 2003-2016 periods (see Table 4-70 from the National Inventory Report: 1990-2016. Greenhouse Gas Sources and Sinks in the Republic of Moldova). Before 2003, no domestic asphalt roofing production was recorded in the Republic of Moldova, the respective production being imported.
Equation(Describe variables for method used)
Indirect CO2 emissions were estimated based on the carbon content in NMVOC emissions. The default fossil carbon content fraction of NMVOC from asphalt roofing is about 80 percent by mass (2006 IPCC Guidelines for National Greenhouse Gas Inventories, Volume 3: Industrial Processes and Product Use, Chapter 5: Non-Energy Products from Fuels and Solvent Use, Chapter 5.4: Asphalt Production and Use, Section 5.4.4 ‘Uncertainty assessment’, Page 5.16). By oxidizing, this carbon converts into CO2 in atmosphere (it is assumed that all solvents from asphalt used for roofing are of fossil origin).CO2 emissions from asphalt roofing were estimated using the following equation:
CO2 emissions = NMVOC • CC • 44/12Where:
CO2 emissions – carbon dioxide emissions from asphalt roofing, kt/yr;NMVOC – total NMVOC emissions within the respective category, kt/yr;CC – carbon content in NMVOC, fraction;44/12 – stoichiometric ratio CO2/C.
Reference2006 IPCC Guidelines for National Greenhouse Gas Inventories, Volume 3: Industrial Processes and Product Use, Chapter 5: Non-Energy Products from Fuels and Solvent Use, Chapter 5.4: Asphalt Produc-tion and Use, Section 5.4.4 ‘Uncertainty assessment’, Page 5.16.National Inventory Report: 1990-2016. Greenhouse Gas Sources and Sinks in the Republic of Moldova (2018).
Describe How and Why this Method Was Chosen Due to the lower importance of this source and unavailability of all detailed data, the Tier 1 methodology has been used.
Type and source of activity data
The information on the amount of asphalt roofing production in the Republic of Moldova within 2003-2016 periods is reported in the Table 4-70 from the National Inventory Report: 1990-2016. Greenhouse Gas Sources and Sinks in the Republic of Moldova. The information is based on activity data provided by the National Bureau of Statistics of the RM through the Official Letter No. 06-39/08 dated 23.02.2011, as a response to the request of the Ministry of Environment No. 03-07/175 dated 02.02.2011 and through the Statistical Reports PRODMOLD-A “Total production, as a natural expression, in the Republic of Moldova, by product type, for 2005-2016”.
Type and source of EF and OF CC – carbon content in NMVOC, fraction (the default fossil carbon content fraction of NMVOC from asphalt roofing is about 80 percent by mass; 2006 IPCC Guidelines for National Greenhouse Gas Inventories, Volume 3: Industrial Processes and Product Use, Chapter 5: Non-Energy Products from Fuels and Solvent Use, Chapter 5.4: Asphalt Production and Use, Section 5.4.4 ‘Uncertainty assessment’, Page 5.16).

Chapter 2: Methods and Data Documentation
2 - 120
Uncertainty of AD and source 5% - expert judgementUncertainty of EF and source 20% - expert judgementPotential Improvements No potential improvements are planned to be implemented in the next inventory cycle for source category 2D3c ‘Asphalt Roofing’.
Table 2.2.4.8: Information on Source Category 2D3c ‘Asphalt Roofing’ – Pollutant EmissionsSector Industrial Processes and Product UseCategory 2D Non-Energy Products from Fuels and Solvents UseSource / Gas 2D3 Solvent Use / 2D3c Asphalt Roofing / Pollutant Emissions Key Category? Not applicable for pollutant emissions.Category Description / Defini-tion This category includes pollutant emissions from asphalt roofing.
Country Detail In the Republic of Moldova, the data related to asphalt roofing production were provided by the National Bureau of Statistics for 2003-2016 periods (see Table 4-70 from the National Inventory Report: 1990-2016. Greenhouse Gas Sources and Sinks in the Republic of Moldova). Before 2003, no domestic asphalt roofing production was recorded in the Republic of Moldova, the respective production being imported.
Equation(Describe variables for method used)
The Tier 1 approach for emissions from asphalt roofing production uses the general equation (1) from the EMEP/EEA Air Pollution Emission Inventory Guidebook 2016, NFR 2.D.3.c ‘Asphalt Roofing’, section 3.1 ‘Tier 1 default approach’:
E pollutant = (A • EF pollutant) / 106
Where:E pollutant – pollutant emissions, kt/yr;A – annual production of asphalt roofing, kt/an;EF pollutant – default emission factor, g/t.
ReferenceEEA (2016), EMEP/EEA Air Pollution Emission Inventory Guidebook 2016, Technical guidance to prepare national emission inventories. European Environment Agency, Technical report No 21/2016. Copen-hagen, Denmark (Available on: http://www.eea.europa.eu//publications/emep-eea-guidebook-2016).National Inventory Report: 1990-2016. Greenhouse Gas Sources and Sinks in the Republic of Moldova (2018).
Describe How and Why this Method Was Chosen Due to the lower importance of this source and unavailability of all detailed data, the Tier 1 methodology has been used.
Type and source of activity data
The information on the amount of asphalt roofing production in the Republic of Moldova within 2003-2016 periods is reported in the Table 4-70 from the National Inventory Report: 1990-2016. Greenhouse Gas Sources and Sinks in the Republic of Moldova. The information is based on activity data provided by the National Bureau of Statistics of the RM through the Official Letter No. 06-39/08 dated 23.02.2011, as a response to the request of the Ministry of Environment No. 03-07/175 dated 02.02.2011 and through the Statistical Reports PRODMOLD-A “Total production, as a natural expression, in the Republic of Moldova, by product type, for 2005-2016”.
Type and source of EF and OF
Default Emission factors used to estimate Pollutant Emissions from Asphalt Roofing
Source CategoryCO NMVOC
g / tAsphalt Roofing 9.5 (3-30) 130 (40-400)
Source: EMEP/EEA Atmospheric Emissions Inventory Guidebook, November 2016, Code SNAP 040610 Asphalt Roofing, Category 2.D.3.c, Table 3.1, Page 7.Uncertainty of AD and source 5% - expert judgementUncertainty of EF and source See the 95% confidence interval in the table above (in the brackets, lower-upper).
Table 2.2.4.9: Information on Source Category 2D3d ‘Paint Application’ – CO2Sector Industrial Processes and Product UseCategory 2D Non-Energy Products from Fuels and Solvents UseSource / Gas 2D3 Solvent Use / 2D3d Paint Application / CO2

Chapter 2: Methods and Data Documentation
2 - 121
Key Category? No
Category Description / Defini-tion
Under this category there are reported emissions from decorative coating application, in particular in construction (SNAP 060103) and domestic paint application (SNAP 060104); industrial coating application, in particular from manufacture of automobiles (SNAP 060101), car repairing (SNAP 060102), coil coating (SNAP 060105), painting ships and boats (SNAP 060106), wood treatment and painting (SNAP 060107), other industrial application (painting aircrafts, carriages, steel bridges, military vehicles, engines, pumps, tanks, office equipment, plastic articles, toys etc.) (SNAP 060108); respectively, other non-industrial paint application’ (paint or varnish application to protect large metal construction from corrosion, for road marking etc.) (SNAP 060109). For most activities involving paint application, no statistics is available for activity data. Under such circumstances, it was considered that the share of paints in decorative coating application represents 50 per cent of the total national consumption, the share of paints in industrial coating application – 40 per cent, while the share in other coating application – 10 per cent
Country Detail Since the breakdown of AD on paint and varnish consumption in the RM by sectors was not possible, the respective emissions were aggregated at national level.
Equation(Describe variables for method used)
Indirect CO2 emissions were estimated based on the carbon content in NMVOC emissions. The default value used represents 60% per cent (2006 IPCC Guidelines for National Greenhouse Gas Inventories, Volume 3: Industrial Processes and Product Use, Chapter 5: Non-Energy Products from Fuels and Solvent Use, Chapter 5.5: Solvent Use, Section 5.5.4 ‘Uncertainty assessment’, Page 5.17). By oxidizing, this carbon converts into CO2 in atmosphere (it is assumed that all solvents from paint application products are of fossil origin). CO2 emissions from paints application were estimated using the following equation:
CO2 emissions = NMVOC • CC • 44/12Where:
CO2 emissions – carbon dioxide emissions from paint application, kt/yr;NMVOC – total NMVOC emissions within the respective category, kt/yr;CC – carbon content in NMVOC, fraction;44/12 – stoichiometric ratio CO2/C.
Reference2006 IPCC Guidelines for National Greenhouse Gas Inventories, Volume 3: Industrial Processes and Product Use, Chapter 5: Non-Energy Products from Fuels and Solvent Use, Chapter 5.5: Solvent Use, Section 5.5.4 ‘Uncertainty assessment’, Page 5.17.National Inventory Report: 1990-2016. Greenhouse Gas Sources and Sinks in the Republic of Moldova (2018).
Describe How and Why this Method Was Chosen Due to the lower importance of this source and unavailability of all detailed data, the Tier 1 methodology has been used.
Type and source of activity data
The information on the amount of varnishes and paints production in the Republic of Moldova within 1990-2016 periods is reported in the Table 4-73 from the National Inventory Report: 1990-2016. Greenhouse Gas Sources and Sinks in the Republic of Moldova. The information is based on activity data provided by the National Bureau of Statistics of the RM through the Official Letter No. 06-39/08 dated 23.02.2011, as a response to the request No. 03-07/175 dated 02.02.2011, from the MoEN; Official Letter No. 06-39/38 dated 22.09.2011, as a response to the request No. 101/2011-09-01 dated 02.09.2011, from the CCO of the MoEN; Official Letter No. 15-03/05 dated 24.01.2014, as a response to the request No. 320/2014-01-01 dated 03.01.2014, from the CCO, the MoEN; Official Letter No. 15-03-09 dated 13.02.2015, as a response to the request No. 407/2015-01-09 dated 29.01.2015, from the CCO of the MoEN; as well as through the Statistical Reports PRODMOLD-A “Total production, as a natural expression, in the Republic of Moldova, by product type, for 2005-2016”. The activity data on import of varnishes and paints in the republic of Moldova within 1990-2016 periods is reported in the Table 4-74 from the National Inventory Report: 1990-2016. Greenhouse Gas Sources and Sinks in the Republic of Moldova. The information is based on activity data provided by the Customs Service of the Republic of Moldova through Official Letter No. 28/07-1893 dated 23.02. 2011, as a response to the request No. 03-07/175 dated 02.02.2011, from the Ministry of Environment; Official Letter No. 15-03-05 dated 24.01.2014, as a response to the request No. 320/2014-01-01 dated 03.01.2014, from the CCO of the MoEN; Official Letter No. 28/07-2231 dated 26.02.2015, as a response to the request No. 407/2015-01-09 dated 29.01.2015, from the CCO of the MoEN; Official Letter No. 28/07-8785 dated 26.05.2016, as a response to the request No. 512/2016-05-01 dated 10.05.2016, from the CCO of the MoEN; Official Letter No. 28/07-612 dated 12.01.2018, as a response to the request No. 601/2017-12-03 dated 14.12.2017, from the CCO of the Ministry of Agriculture, Regional Development and Environment.
Type and source of EF and OF CC – carbon content in NMVOC, fraction (the default value used represents 60 per cent, with a margin of 50-70 per cent; 2006 IPCC Guidelines for National Greenhouse Gas Inventories, Volume 3: Industrial Processes and Product Use, Chapter 5: Non-Energy Products from Fuels and Solvent Use, Chapter 5.5: Solvent Use, Section 5.5.4 ‘Uncertainty assessment’, Page 5.17).
Uncertainty of AD and source 5% - expert judgementUncertainty of EF and source 20% - expert judgementPotential Improvements No potential improvements are planned to be implemented in the next inventory cycle for source category 2D3d ‘Paint Application’.
Table 2.2.4.10: Information on Source Category 2D3d ‘Paint Application’ – NMVOC Sector Industrial Processes and Product UseCategory 2D Non-Energy Products from Fuels and Solvents UseSource / Gas 2D3 Solvent Use / 2D3d Paint Application / NMVOC Key Category? Not applicable for pollutant emissions.

Chapter 2: Methods and Data Documentation
2 - 122
Category Description / Defini-tion
Under this category there are reported emissions from decorative coating application, in particular in construction (SNAP 060103) and domestic paint application (SNAP 060104); industrial coating application, in particular from manufacture of automobiles (SNAP 060101), car repairing (SNAP 060102), coil coating (SNAP 060105), painting ships and boats (SNAP 060106), wood treatment and painting (SNAP 060107), other industrial application (painting aircrafts, carriages, steel bridges, military vehicles, engines, pumps, tanks, office equipment, plastic articles, toys etc.) (SNAP 060108); respectively, other non-industrial paint application’ (paint or varnish application to protect large metal construction from corrosion, for road marking etc.) (SNAP 060109). For most activities involving paint application, no statistics is available for activity data. Under such circumstances, it was considered that the share of paints in decorative coating application represents 50 per cent of the total national consumption, the share of paints in industrial coating application – 40 per cent, while the share in other coating application – 10 per cent
Country Detail Since the breakdown of AD on paint and varnish consumption in the RM by sectors was not possible, the respective emissions were aggregated at national level.
Equation(Describe variables for method used)
The Tier 1 approach for NMVOC emissions from paint application uses the general equation (1) from the EMEP/EEA Air Pollution Emission Inventory Guidebook 2016, NFR 2.D.3.d ‘Paint Application’, section 3.2 ‘Tier 1 default approach’:
E pollutant = (AR product • EF pollutant) / 103
Where:E pollutant – the emission of the specified pollutant, t/yr;AR product – the activity rate for the coating application (consumption of paint), t/yr;EF pollutant – the emission factor for the pollutant, kg/t.
ReferenceEEA (2016), EMEP/EEA Air Pollution Emission Inventory Guidebook 2016, Technical guidance to prepare national emission inventories. European Environment Agency, Technical report No 21/2016. Copen-hagen, Denmark (Available on: http://www.eea.europa.eu//publications/emep-eea-guidebook-2016).National Inventory Report: 1990-2016. Greenhouse Gas Sources and Sinks in the Republic of Moldova (2018).
Describe How and Why this Method Was Chosen Due to the lower importance of this source and unavailability of all detailed data, the Tier 1 methodology has been used.
Type and source of activity data
The information on the amount of varnishes and paints production in the Republic of Moldova within 1990-2016 periods is reported in the Table 4-73 from the National Inventory Report: 1990-2016. Greenhouse Gas Sources and Sinks in the Republic of Moldova. The information is based on activity data provided by the National Bureau of Statistics of the RM through the Official Letter No. 06-39/08 dated 23.02.2011, as a response to the request No. 03-07/175 dated 02.02.2011, from the MoEN; Official Letter No. 06-39/38 dated 22.09.2011, as a response to the request No. 101/2011-09-01 dated 02.09.2011, from the CCO of the MoEN; Official Letter No. 15-03/05 dated 24.01.2014, as a response to the request No. 320/2014-01-01 dated 03.01.2014, from the CCO, the MoEN; Official Letter No. 15-03-09 dated 13.02.2015, as a response to the request No. 407/2015-01-09 dated 29.01.2015, from the CCO of the MoEN; as well as through the Statistical Reports PRODMOLD-A “Total production, as a natural expression, in the Republic of Moldova, by product type, for 2005-2016”. The activity data on import of varnishes and paints in the republic of Moldova within 1990-2016 periods is reported in the Table 4-74 from the National Inventory Report: 1990-2016. Greenhouse Gas Sources and Sinks in the Republic of Moldova. The information is based on activity data provided by the Customs Service of the Republic of Moldova through Official Letter No. 28/07-1893 dated 23.02. 2011, as a response to the request No. 03-07/175 dated 02.02.2011, from the Ministry of Environment; Official Letter No. 15-03-05 dated 24.01.2014, as a response to the request No. 320/2014-01-01 dated 03.01.2014, from the CCO of the MoEN; Official Letter No. 28/07-2231 dated 26.02.2015, as a response to the request No. 407/2015-01-09 dated 29.01.2015, from the CCO of the MoEN; Official Letter No. 28/07-8785 dated 26.05.2016, as a response to the request No. 512/2016-05-01 dated 10.05.2016, from the CCO of the MoEN; Official Letter No. 28/07-612 dated 12.01.2018, as a response to the request No. 601/2017-12-03 dated 14.12.2017, from the CCO of the Ministry of Agriculture, Regional Development and Environment.
Type and source of EF and OF
Default Tier 1 Emission factors for the 2D3d ‘Paint Application’ source categorySource NMVOC Emission Factor Unit
Decorative Coating Application 150 (100-400) g/kg paint appliedIndustrial Coating Application 400 (100-800) g/kg paint appliedOther Coating Application 200 (4-1000) g/kg paint applied
Source: EMEP/EEA Atmospheric Emissions Inventory Guidebook, (2016), Category 2.D.3.d ‘Coating Application’, Tables 3-1, 3-2 and 3-3, page 17. Uncertainty of AD and source 5% - expert judgementUncertainty of EF and source See the 95% confidence interval in the table above (in the brackets, lower-upper).
Table 2.2.4.11: Information on Source Category 2D3e ‘Degreasing’ – CO2Sector Industrial Processes and Product UseCategory 2D Non-Energy Products from Fuels and Solvents UseSource / Gas 2D3 Solvent Use / 2D3e Degreasing / CO2

Chapter 2: Methods and Data Documentation
2 - 123
Key Category? No
Category Description / Defini-tion
Within the 2D3e ‘Degreasing’ source category there are monitored the indirect CO2 emissions from solvent use in industry, especially for metal degreasing – SNAP 060201; electronic components manufac-turing – SNAP 060203, as well as other industrial cleaning – SNAP 060204. Typically, the solvents used for degreasing are obtained by distillation of fossil fuels. For example, chlorinated solvents, including trichloroethylene (TRI) (code 2903 22 000), tetrachloroethylene (PER) (code 2903 23 000) and dichloromethane (MC) (code 2903 12 000) are widely used in the industrial sector for cleaning metal articles, electronic products and other industrial products (in closed type cleaning equipment). Previously, 1,1,1-trichloroethane (TCA) (2903 19 100) was particularly used until recently when it was replaced by trichlo-roethylene (TRI). As for the open type cleaning equipment, the most commonly used solvents are those obtained from white-spirit (code 2710 11 210) and alcohols, such as propylene glycol 2905 32 000).
Country Detail To be noted that for most activities involving use of organic solvents for degreasing in the RM there are no statistical data. Under such circumstances, the total consumption of solvents used for degreasing was estimated based on information on import of solvents (internal production of solvents is insignificant, also it was assumed that such substances are not re-exported). Since the same substances are widely used for both degreasing and dry cleaning, it was accepted that out of the total amount consumed, 65 per cent were used for degreasing, while 35 per cent – for dry cleaning.
Equation(Describe variables for method used)
Indirect CO2 emissions were estimated based on the carbon content in NMVOC emissions. The default value used represents 60% per cent (2006 IPCC Guidelines for National Greenhouse Gas Inventories, Volume 3: Industrial Processes and Product Use, Chapter 5: Non-Energy Products from Fuels and Solvent Use, Chapter 5.5: Solvent Use, Section 5.5.4 ‘Uncertainty assessment’, Page 5.17). By oxidizing, this carbon converts into CO2 in atmosphere (it is assumed that all solvents from degreasing products are of fossil origin).In order to estimate indirect CO2 emissions, the following equation was used:
CO2 Emissions = NMVOC • CC • 44/12Where:
CO2 Emissions – carbon dioxide emissions from degreasing, kt/yr;NMVOC – total NMVOC emissions within the respective category, kt/yr;CC – carbon content in NMVOC;44/12 – stoichiometric ratio CO2/C.
Reference2006 IPCC Guidelines for National Greenhouse Gas Inventories, Volume 3: Industrial Processes and Product Use, Chapter 5: Non-Energy Products from Fuels and Solvent Use, Chapter 5.5: Solvent Use, Section 5.5.4 ‘Uncertainty assessment’, Page 5.17.National Inventory Report: 1990-2016. Greenhouse Gas Sources and Sinks in the Republic of Moldova (2018).
Describe How and Why this Method Was Chosen Due to the lower importance of this source and unavailability of all detailed data, the Tier 1 methodology has been used.
Type and source of activity data
The information on the consumption of solvents used in degreasing in the RM within 1990-2016 periods is reported in the Table 4-78 from the National Inventory Report: 1990-2016. Greenhouse Gas Sources and Sinks in the Republic of Moldova. The information is based on activity data provided by the Custom Service through the Official Letter No. 28/07-1893 dated 23.02.2011, as a response to the request No. 03-07/175 dated 02.02.2011, from the MoEN; Official Letter No. 15-03-05 dated 24.01.2014, as a response to the request No. 320/2014-01-01 dated 03.01.2014, from the CCO of the MoEN; Official Letter No. 28/07-2231 dated 26.02.2015, as a response to the request No. 407/2015-01-09 dated 29.01.2015, from the CCO of the MoEN; Official Letter No. 28/07-8785 dated 26.05.2016, as a response to the request No. 512/2016-05-01 dated 10.05.2016, from the CCO of the MoEN; Official Letter No. 28/07-612 dated 12.01.2018, as a response to the request No. 601/2017-12-03 dated 14.12.2017, from the CCO of the Ministry of Agriculture, Regional Development and Environment. Since the same substances are widely used for both degreasing and dry cleaning, it was accepted that out of the total amount consumed, 65 per cent were used for degreasing, while 35 per cent – for dry cleaning (see Table 4-79 from the National Inventory Report: 1990-2016. Greenhouse Gas Sources and Sinks in the Republic of Moldova).
Type and source of EF and OF CC – carbon content in NMVOC, fraction (the default value used represents 60 per cent, with a margin of 50-70 per cent; 2006 IPCC Guidelines for National Greenhouse Gas Inventories, Volume 3: Industrial Processes and Product Use, Chapter 5: Non-Energy Products from Fuels and Solvent Use, Chapter 5.5: Solvent Use, Section 5.5.4 ‘Uncertainty assessment’, Page 5.17).
Uncertainty of AD and source 20% - expert judgementUncertainty of EF and source 20% - expert judgementPotential Improvements No potential improvements are planned to be implemented in the next inventory cycle for source category 2D3e ‘Degreasing’.
Table 2.2.4.12: Information on Source Category 2D3e ‘Degreasing’ – NMVOC Sector Industrial Processes and Product UseCategory 2D Non-Energy Products from Fuels and Solvents UseSource / Gas 2D3 Solvent Use / 2D3e Degreasing / NMVOC Key Category? Not applicable for pollutant emissions.

Chapter 2: Methods and Data Documentation
2 - 124
Category Description / Defini-tion
Within the 2D3e ‘Degreasing’ source category there are monitored the NMVOC emissions from solvent use in industry, especially for metal degreasing – SNAP 060201; electronic components manufacturing – SNAP 060203, as well as other industrial cleaning – SNAP 060204. Typically, the solvents used for degreasing are obtained by distillation of fossil fuels. For example, chlorinated solvents, including trichloro-ethylene (TRI) (code 2903 22 000), tetrachloroethylene (PER) (code 2903 23 000) and dichloromethane (MC) (code 2903 12 000) are widely used in the industrial sector for cleaning metal articles, electronic products and other industrial products (in closed type cleaning equipment). Previously, 1,1,1-trichloroethane (TCA) (2903 19 100) was particularly used until recently when it was replaced by trichloroethylene (TRI). As for the open type cleaning equipment, the most commonly used solvents are those obtained from white-spirit (code 2710 11 210) and alcohols, such as propylene glycol 2905 32 000).
Country Detail To be noted that for most activities involving use of organic solvents for degreasing in the RM there are no statistical data. Under such circumstances, the total consumption of solvents used for degreasing was estimated based on information on import of solvents (internal production of solvents is insignificant, also it was assumed that such substances are not re-exported). Since the same substances are widely used for both degreasing and dry cleaning, it was accepted that out of the total amount consumed, 65 per cent were used for degreasing, while 35 per cent – for dry cleaning.
Equation(Describe variables for method used)
The Tier 1 approach for NMVOC emissions from degreasing uses the general equation (1) from the EMEP/EEA Air Pollution Emission Inventory Guidebook 2016, NFR 2.D.3.e ‘Degreasing’, section 3.2 ‘Tier 1 default approach’:
E pollutant = (AR product • EF pollutant) / 103
Where:E pollutant – the emission of the specified pollutant, t/yr;AR product – the activity rate for the use of solvents for degreasing, t/yr;EF pollutant – the emission factor for this pollutant technology, kg/t.
ReferenceEEA (2016), EMEP/EEA Air Pollution Emission Inventory Guidebook 2016, Technical guidance to prepare national emission inventories. European Environment Agency, Technical report No 21/2016. Copen-hagen, Denmark (Available on: http://www.eea.europa.eu//publications/emep-eea-guidebook-2016).National Inventory Report: 1990-2016. Greenhouse Gas Sources and Sinks in the Republic of Moldova (2018).
Describe How and Why this Method Was Chosen Due to the lower importance of this source and unavailability of all detailed data, the Tier 1 methodology has been used.
Type and source of activity data
The information on the consumption of solvents used in degreasing in the Republic of Moldova within 1990-2016 periods is reported in the Table 4-78 from the National Inventory Report: 1990-2016. Green-house Gas Sources and Sinks in the Republic of Moldova. The information is based on activity data provided by the Custom Service through the Official Letter No. 28/07-1893 dated 23.02.2011, as a response to the request No. 03-07/175 dated 02.02.2011, from the MoEN; Official Letter No. 15-03-05 dated 24.01.2014, as a response to the request No. 320/2014-01-01 dated 03.01.2014, from the CCO of the MoEN; Official Letter No. 28/07-2231 dated 26.02.2015, as a response to the request No. 407/2015-01-09 dated 29.01.2015, from the CCO of the MoEN; Official Letter No. 28/07-8785 dated 26.05.2016, as a response to the request No. 512/2016-05-01 dated 10.05.2016, from the CCO of the MoEN; Official Letter No. 28/07-612 dated 12.01.2018, as a response to the request No. 601/2017-12-03 dated 14.12.2017, from the CCO of the Ministry of Agriculture, Regional Development and Environment. Since the same substances are widely used for both degreasing and dry cleaning, it was accepted that out of the total amount consumed, 65 per cent were used for degreasing, while 35 per cent – for dry cleaning (see Table 4-79 from the National Inventory Report: 1990-2016. Greenhouse Gas Sources and Sinks in the Republic of Moldova).
Type and source of EF and OF
Tier 1 Default EFs for Estimating NMVOC Emissions from 2D3e ‘Degreasing’Source Category NMVOC Emission Factor Unit
Degreasing 460 (20-700) g/kg of degreased productsSource: EMEP/EEA Atmospheric Emissions Inventory Guidebook, (2016), Category 2.D.3.e “Degreasing”, Table 3-1, page 8.
Uncertainty of AD and source 20% - expert judgementUncertainty of EF and source See the 95% confidence interval in the table above (in the brackets, lower-upper).
Table 2.2.4.13: Information on Source Category 2D3f ‘Dry Cleaning’ – CO2Sector Industrial Processes and Product UseCategory 2D Non-Energy Products from Fuels and Solvents UseSource / Gas 2D3 Solvent Use / 2D3f Dry Cleaning / CO2
Key Category? No
Category Description / Defini-tion
Within the 2D3f ‘Dry Cleaning’ there are monitored the indirect CO2 emissions from solvent use in dry cleaning of clothes and other textiles from animal grease, oils, wax, resin, etc. (SNAP 060202). Tetra-chloroethylene (PER) (code 2903 23 000) is the most widely used solvent for dry cleaning. Previously, 1,1,1-trichloroethane (TCA) (2903 19 100) was particularly used until recently when it was replaced by trichloroethylene (TRI).

Chapter 2: Methods and Data Documentation
2 - 125
Country Detail To be noted that for most activities involving use of organic solvents for dry cleaning in the RM there are no statistical data. Under such circumstances, the total consumption of solvents used for dry cleaning was estimated based on information on import of solvents in the RM (internal production of solvents is insignificant, also it was assumed that such substances are not re-exported). Since the same substances are widely used for both degreasing and dry cleaning, it was accepted that out of the total amount consumed, 65 per cent were used for degreasing, while 35 per cent – for dry cleaning.
Equation(Describe variables for method used)
Indirect CO2 emissions were estimated based on the carbon content in NMVOC emissions. The default value used represents 60% per cent (2006 IPCC Guidelines for National Greenhouse Gas Inventories, Volume 3: Industrial Processes and Product Use, Chapter 5: Non-Energy Products from Fuels and Solvent Use, Chapter 5.5: Solvent Use, Section 5.5.4 ‘Uncertainty assessment’, Page 5.17). By oxidizing, this carbon converts into CO2 in atmosphere (it is assumed that all solvents from dry cleaning products are of fossil origin).In order to estimate indirect CO2 emissions, the following equation was used:
CO2 Emissions = NMVOC • CC • 44/12Where:
CO2 Emissions – carbon dioxide emissions from dry cleaning, kt/yr;NMVOC – total NMVOC emissions within the respective category, kt/yr;CC – carbon content in NMVOC;44/12 – stoichiometric ratio CO2/C.
Reference2006 IPCC Guidelines for National Greenhouse Gas Inventories, Volume 3: Industrial Processes and Product Use, Chapter 5: Non-Energy Products from Fuels and Solvent Use, Chapter 5.5: Solvent Use, Section 5.5.4 ‘Uncertainty assessment’, Page 5.17.National Inventory Report: 1990-2016. Greenhouse Gas Sources and Sinks in the Republic of Moldova (2018).
Describe How and Why this Method Was Chosen Due to the lower importance of this source and unavailability of all detailed data, the Tier 1 methodology has been used.
Type and source of activity data
The information on the consumption of solvents used in dry cleaning in the Republic of Moldova within 1990-2016 periods is reported in the Table 4-81 from the National Inventory Report: 1990-2016. Green-house Gas Sources and Sinks in the Republic of Moldova. The information is based on activity data provided by the Custom Service through the Official Letter No. 28/07-1893 dated 23.02.2011, as a response to the request No. 03-07/175 dated 02.02.2011, from the MoEN; Official Letter No. 15-03-05 dated 24.01.2014, as a response to the request No. 320/2014-01-01 dated 03.01.2014, from the CCO of the MoEN; Official Letter No. 28/07-2231 dated 26.02.2015, as a response to the request No. 407/2015-01-09 dated 29.01.2015, from the CCO of the MoEN; Official Letter No. 28/07-8785 dated 26.05.2016, as a response to the request No. 512/2016-05-01 dated 10.05.2016, from the CCO of the MoEN; Official Letter No. 28/07-612 dated 12.01.2018, as a response to the request No. 601/2017-12-03 dated 14.12.2017, from the CCO of the Ministry of Agriculture, Regional Development and Environment. Since the same substances are widely used for both degreasing and dry cleaning, it was accepted that out of the total amount consumed, 65 per cent were used for degreasing, while 35 per cent – for dry cleaning (see Table 4-81 from the National Inventory Report: 1990-2016. Greenhouse Gas Sources and Sinks in the Republic of Moldova).
Type and source of EF and OF CC – carbon content in NMVOC, fraction (the default value used represents 60 per cent, with a margin of 50-70 per cent; 2006 IPCC Guidelines for National Greenhouse Gas Inventories, Volume 3: Industrial Processes and Product Use, Chapter 5: Non-Energy Products from Fuels and Solvent Use, Chapter 5.5: Solvent Use, Section 5.5.4 ‘Uncertainty assessment’, Page 5.17).
Uncertainty of AD and source 20% - expert judgementUncertainty of EF and source 20% - expert judgementPotential Improvements No potential improvements are planned to be implemented in the next inventory cycle for source category 2D3f ‘Dry cleaning’.
Table 2.2.4.14: Information on Source Category 2D3f ‘Dry Cleaning’ – NMVOC Sector Industrial Processes and Product UseCategory 2D Non-Energy Products from Fuels and Solvents UseSource / Gas 2D3 Solvent Use / 2D3f Dry Cleaning / NMVOC Key Category? Not applicable for pollutant emissions.
Category Description / Defini-tion
Within the 2D3f ‘Dry Cleaning’ there are monitored the NMVOC emissions from solvent use in dry cleaning of clothes and other textiles from animal grease, oils, wax, resin, etc. (SNAP 060202). Tetrachlo-roethylene (PER) (code 2903 23 000) is the most widely used solvent for dry cleaning. Previously, 1,1,1-trichloroethane (TCA) (2903 19 100) was particularly used until recently when it was replaced by trichloroethylene (TRI).
Country Detail To be noted that for most activities involving use of organic solvents for dry cleaning in the RM there are no statistical data. Under such circumstances, the total consumption of solvents used for dry cleaning was estimated based on information on import of solvents in the RM (internal production of solvents is insignificant, also it was assumed that such substances are not re-exported). Since the same substances are widely used for both degreasing and dry cleaning, it was accepted that out of the total amount consumed, 65 per cent were used for degreasing, while 35 per cent – for dry cleaning.

Chapter 2: Methods and Data Documentation
2 - 126
Equation(Describe variables for method used)
The Tier 1 approach for NMVOC emissions from dry cleaning uses the general equation (1) from the EMEP/EEA Air Pollution Emission Inventory Guidebook 2016, NFR 2.D.3.f ‘Dry Cleaning’, section 3.2 ‘Tier 1 default approach’:
E pollutant = (AR product • EF pollutant) / 103
Where:E pollutant – the emission of the specified pollutant, t/yr;AR product – the activity rate for the use of solvents for dry cleaning, t/yr;EF pollutant – the emission factor for this pollutant technology, kg/t.
ReferenceEEA (2016), EMEP/EEA Air Pollution Emission Inventory Guidebook 2016, Technical guidance to prepare national emission inventories. European Environment Agency, Technical report No 21/2016. Copen-hagen, Denmark (available on: http://www.eea.europa.eu//publications/emep-eea-guidebook-2016).National Inventory Report: 1990-2016. Greenhouse Gas Sources and Sinks in the Republic of Moldova (2018).
Describe How and Why this Method Was Chosen Due to the lower importance of this source and unavailability of all detailed data, the Tier 1 methodology has been used.
Type and source of activity data
The information on the consumption of solvents used in dry cleaning in the RM within 1990-2016 periods is reported in the Table 4-81 from the National Inventory Report: 1990-2016. Greenhouse Gas Sources and Sinks in the Republic of Moldova. The information is based on activity data provided by the Custom Service through the Official Letter No. 28/07-1893 dated 23.02.2011, as a response to the request No. 03-07/175 dated 02.02.2011, from the MoEN; Official Letter No. 15-03-05 dated 24.01.2014, as a response to the request No. 320/2014-01-01 dated 03.01.2014, from the CCO of the MoEN; Official Letter No. 28/07-2231 dated 26.02.2015, as a response to the request No. 407/2015-01-09 dated 29.01.2015, from the CCO of the MoEN; Official Letter No. 28/07-8785 dated 26.05.2016, as a response to the request No. 512/2016-05-01 dated 10.05.2016, from the CCO of the MoEN; Official Letter No. 28/07-612 dated 12.01.2018, as a response to the request No. 601/2017-12-03 dated 14.12.2017, from the CCO of the MARDE. Since the same substances are widely used for both degreasing and dry cleaning, it was accepted that out of the total amount consumed, 65 per cent were used for degreasing, while 35 per cent – for dry cleaning (see Table 4-81 from the National Inventory Report: 1990-2016. Greenhouse Gas Sources and Sinks in the Republic of Moldova).
Type and source of EF and OF
Tier 1 Default EFs for Estimating NMVOC Emissions from 2D3f ‘Dry Cleaning’Source Category NMVOC Emission Factor Unit
Dry Cleaning 40 (10-200) g/kg of degreased productsSource: EMEP/EEA Atmospheric Emissions Inventory Guidebook, (2016), Category 2.D.3.f “Dry Cleaning”, Table 3-1, page 7.
Uncertainty of AD and source 20% - expert judgementUncertainty of EF and source See the 95% confidence interval in the table above (in the brackets, lower-upper).
Table 2.2.4.15: Information on Source Category 2D3g ‘Chemical Products’ – CO2Sector Industrial Processes and Product UseCategory 2D Non-Energy Products from Fuels and Solvents UseSource / Gas 2D3 Solvent Use / 2D3g Chemical Products / CO2
Key Category? No
Category Description / Defini-tion
Under the 2D3g ‘Chemical Products’ there are reported indirect CO2 emissions from polyester processing (SNAP 060301); polyurethane foam processing (SNAP 060303) and polystyrene foam processing (SNAP 060304); rubber processing (SNAP 060305); pharmaceutical products manufacturing (SNAP 060306); paints manufacturing (SNAP 060307); inks manufacturing (SNAP 060308); glues and adhesive products manufacturing (SNAP 060309); asphalt blowing (SNAP 060310); adhesive, magnetic tapes, films and photographs (SNAP 060311); textile finishing (SNAP 060312); leather tanning (SNAP 060313).
Country Detail
Statistical publications of the RM provide activity data on manufacturing different industrial commodities, including: polyurethane and polystyrene products, refurbished tires and rubber soles, paints and varnishes, glues, inks, pharmaceutical products, shoes (see Table 4-83 from the National Inventory Report: 1990-2016. Greenhouse Gas Sources and Sinks in the Republic of Moldova). Customs Service of the Republic of Moldova is a primary source of information on import-export operations regarding primary polyurethane products (code 3909 50); polyurethane products (code 3921 13); primary polystyrene products (code 3903 11), respectively styrene polymers products (code 3921 11). In order to convert AD in mass metric units (tones), the following conversion coefficients were used: a car tire weights about 7.1 kg; a minibus and small tonnage truck tire – about 11.1 kg; bus and heavy truck tire – 46.0 kg; a tractor tire – about 69.9 kg).

Chapter 2: Methods and Data Documentation
2 - 127
Equation(Describe variables for method used)
Indirect CO2 emissions were estimated based on the carbon content in NMVOC emissions. The default value used represents 60% per cent (2006 IPCC Guidelines for National Greenhouse Gas Inventories, Volume 3: Industrial Processes and Product Use, Chapter 5: Non-Energy Products from Fuels and Solvent Use, Chapter 5.5: Solvent Use, Section 5.5.4 ‘Uncertainty assessment’, Page 5.17). By oxidizing, this carbon converts into CO2 in atmosphere (it is assumed that all solvents from chemical products are of fossil origin).In order to estimate indirect CO2 emissions, the following equation was used:
CO2 Emissions = NMVOC • CC • 44/12Where:
CO2 Emissions – carbon dioxide emissions from chemical products, kt/yr;NMVOC – total NMVOC emissions within the respective category, kt/yr;CC – carbon content in NMVOC;44/12 – stoichiometric ratio CO2/C.
Reference2006 IPCC Guidelines for National Greenhouse Gas Inventories, Volume 3: Industrial Processes and Product Use, Chapter 5: Non-Energy Products from Fuels and Solvent Use, Chapter 5.5: Solvent Use, Section 5.5.4 ‘Uncertainty assessment’, Page 5.17.National Inventory Report: 1990-2016. Greenhouse Gas Sources and Sinks in the Republic of Moldova (2018).
Describe How and Why this Method Was Chosen Due to the lower importance of this source and unavailability of all detailed data, the Tier 1 methodology has been used.
Type and source of activity data
The activity data on manufacturing industrial commodities in the RM within 1990-2016 periods are reported in the Table 4-83 from the National Inventory Report: 1990-2016. Greenhouse Gas Sources and Sinks in the Republic of Moldova. The information is based on activity data provided by the NBS through the Statistical Yearbooks for 1994 (pages 284, 288, 291), 1995 (pages 253, 257, 260), 1997 (pages 320, 322, 324), 1999 (pages 302, 304, 306), 2003 (pages 391, 393, 395), 2006 (page 311), 2011 (page 305), 2014 (page 302), as well as through the Statistical Reports PRODMOLD-A „Total production, as a natural expression, in the Republic of Moldova, by product type, for 2005-2016”. Customs Service of the Republic of Moldova is the primary source of information on import-export operations regarding primary polyurethane products (code 3909 50); polyurethane products (code 3921 13); primary polystyrene products (code 3903 11), respectively styrene polymers products (code 3921 11), the information being pro-vided through the Official Letter No. 28/07-1893 dated 23.02.2011, as a response to the request No. 03-07/175 dated 02.02.2011, from the MoEN; Official Letter No. 15-03-05 dated 24.01.2014, as a response to the request No. 320/2014-01-01 dated 03.01.2014, from the CCO of the MoEN; Official Letter No. 28/07-2231 dated 26.02.2015, as a response to the request No. 407/2015-01-09 dated 29.01.2015, from the CCO of the MoEN; Official Letter No. 28/07-8785 dated 26.05.2016, as a response to the request No. 512/2016-05-01 dated 10.05.2016, from the CCO of the MoEN; Official Letter No. 28/07-612 dated 12.01.2018, as a response to the request No. 601/2017-12-03 din 14.12.2017, from the CCO of the MARDE.
Type and source of EF and OF CC – carbon content in NMVOC, fraction (the default value used represents 60 per cent, with a margin of 50-70 per cent; 2006 IPCC Guidelines for National Greenhouse Gas Inventories, Volume 3: Industrial Processes and Product Use, Chapter 5: Non-Energy Products from Fuels and Solvent Use, Chapter 5.5: Solvent Use, Section 5.5.4 ‘Uncertainty assessment’, Page 5.17).
Uncertainty of AD and source 20% - expert judgementUncertainty of EF and source 20% - expert judgementPotential Improvements No potential improvements are planned to be implemented in the next inventory cycle for source category 2D3g ‘Chemical Products’.
Table 2.2.4.16: Information on Source Category 2D3g ‘Chemical Products’ – NMVOC Sector Industrial Processes and Product UseCategory 2D Non-Energy Products from Fuels and Solvents UseSource / Gas 2D3 Solvent Use / 2D3g Chemical Products / NMVOC Key Category? Not applicable for pollutant emissions.
Category Description / Defini-tion
Under the 2D3g ‘Chemical Products’ there are reported NMVOC emissions from polyester processing (SNAP 060301); polyurethane foam processing (SNAP 060303) and polystyrene foam processing (SNAP 060304); rubber processing (SNAP 060305); pharmaceutical products manufacturing (SNAP 060306); paints manufacturing (SNAP 060307); inks manufacturing (SNAP 060308); glues and adhesive products manufacturing (SNAP 060309); asphalt blowing (SNAP 060310); adhesive, magnetic tapes, films and photographs (SNAP 060311); textile finishing (SNAP 060312); leather tanning (SNAP 060313).
Country Detail
Statistical publications of the RM provide activity data on manufacturing different industrial commodities, including: polyurethane and polystyrene products, refurbished tires and rubber soles, paints and varnishes, glues, inks, pharmaceutical products, shoes (see Table 4-83 from the National Inventory Report: 1990-2016. Greenhouse Gas Sources and Sinks in the Republic of Moldova). Customs Service of the Republic of Moldova is a primary source of information on import-export operations regarding primary polyurethane products (code 3909 50); polyurethane products (code 3921 13); primary polystyrene products (code 3903 11), respectively styrene polymers products (code 3921 11). In order to convert AD in mass metric units (tones), the following conversion coefficients were used: a car tire weights about 7.1 kg; a minibus and small tonnage truck tire – about 11.1 kg; bus and heavy truck tire – 46.0 kg; a tractor tire – about 69.9 kg).

Chapter 2: Methods and Data Documentation
2 - 128
Equation(Describe variables for method used)
The Tier 2 approach for NMVOC emissions from chemical products uses the general equation (2) from the EMEP/EEA Air Pollution Emission Inventory Guidebook 2016, NFR 2.D.3.g ‘Chemical Products’, section 3.3 ‘Tier 2 technology-specific approach’:
E pollutant = (AR use, technology • EF technology, pollutant) / 103
Where:E technology, pollutant – the emission of the technology and the specified pollutant, t/yr;AR use, technology – the activity rate for the use of specific chemical product, t/yr;EF pollutant – the emission factor for this pollutant technology, kg/t.
ReferenceEEA (2016), EMEP/EEA Air Pollution Emission Inventory Guidebook 2016, Technical guidance to prepare national emission inventories. European Environment Agency, Technical report No 21/2016. Copen-hagen, Denmark (Available on: http://www.eea.europa.eu//publications/emep-eea-guidebook-2016).National Inventory Report: 1990-2016. Greenhouse Gas Sources and Sinks in the Republic of Moldova (2018).
Describe How and Why this Method Was Chosen A Tier 2 methodology has been used due to availability of technology-specific emission factors.
Type and source of activity data
The activity data on manufacturing industrial commodities in the RM within 1990-2016 periods are reported in the Table 4-83 from the National Inventory Report: 1990-2016. Greenhouse Gas Sources and Sinks in the Republic of Moldova. The information is based on activity data provided by the NBS through the Statistical Yearbooks for 1994 (pages 284, 288, 291), 1995 (pages 253, 257, 260), 1997 (pages 320, 322, 324), 1999 (pages 302, 304, 306), 2003 (pages 391, 393, 395), 2006 (page 311), 2011 (page 305), 2014 (page 302), as well as through the Statistical Reports PRODMOLD-A „Total production, as a natural expression, in the Republic of Moldova, by product type, for 2005-2016”. Customs Service of the Republic of Moldova is the primary source of information on import-export operations regarding primary polyurethane products (code 3909 50); polyurethane products (code 3921 13); primary polystyrene products (code 3903 11), respectively styrene polymers products (code 3921 11), the information being pro-vided through the Official Letter No. 28/07-1893 dated 23.02.2011, as a response to the request No. 03-07/175 dated 02.02.2011, from the MoEN; Official Letter No. 15-03-05 dated 24.01.2014, as a response to the request No. 320/2014-01-01 dated 03.01.2014, from the CCO of the MoEN; Official Letter No. 28/07-2231 dated 26.02.2015, as a response to the request No. 407/2015-01-09 dated 29.01.2015, from the CCO of the MoEN; Official Letter No. 28/07-8785 dated 26.05.2016, as a response to the request No. 512/2016-05-01 dated 10.05.2016, from the CCO of the MoEN; Official Letter No. 28/07-612 dated 12.01.2018, as a response to the request No. 601/2017-12-03 din 14.12.2017, from the CCO of the MARDE.
Type and source of EF and OF
Tier 2 EFs for Estimating NMVOC Emissions from 2D3g ‘Chemical Products’Source Category NMVOC Emission Factor Unit
SNAP 060301, Polystyrene processing 50 (10-100) g/kg monomer SNAP 060303, Polyurethane processing 120 (40-400) g/kg foamSNAP 060304, Polystyrene foam processing 60 (30-100) g/kg foamSNAP 060305, Rubber processing 8 (5-21) g/kg rubberSNAP 060306, Pharmaceutical products manufacturing 300 (200-400) g/kg solventSNAP 060307, Paints manufacturing, SNAP 060308, Inks manufacturing, SNAP 060309, Glues manufacturing 11 (7-15) g/kg productSNAP 060310, Asphalt blowing 27.2 (10-100) kg/t asphaltSNAP 060310, Saturated asphalt blowing 0.66 (0.07-7.0) kg/t asphaltSNAP 060310, Asphalt (in layers) blowing 1.71 (0.17-17) kg/t asphaltSNAP 060314, Tire production 10 (6-14) g/kg tireAdhesive tapes manufacturing 3 (0.0-5.5) g/m2Shoes manufacture 0.045 (0.02-0.06) kg/pair of shoes
Source: EMEP/EEA Atmospheric Emissions Inventory Guidebook (2016), Category 2.D.3.g “Chemical Products”, Tables 3-2 – 3-13, pages 17-22Uncertainty of AD and source 20% - expert judgementUncertainty of EF and source See the 95% confidence interval in the table above (in the brackets, lower-upper).
Table 2.2.4.17: Information on Source Category 2D3h ‘Printing’ – CO2Sector Industrial Processes and Product UseCategory 2D Non-Energy Products from Fuels and Solvents UseSource / Gas 2D3 Solvent Use / 2D3h Printing / CO2

Chapter 2: Methods and Data Documentation
2 - 129
Key Category? No
Category Description / Defini-tion
The printing industry is an important manufacturing industry in most European countries. Printing processes convert original text and pictures into an image on a carrier and the main process types are named according to how this image is carried. The main processes in the printing industry are described in the process description. In this document, the following printing categories are identified: heat set offset printing; publication packaging and rotogravure and flexography. Printing involves the use of inks which may contain a proportion of organic solvents. These inks may then be subsequently diluted before use. Different inks have different proportions of organic solvents and require dilution to different extents. Printing can also require the use of cleaning solvents and organic dampeners. Ink solvents, diluents, cleaners and dampeners may all make a significant contribution to emissions from industrial printing.
Country Detail
No statistical data on solvents and/or printing inks used are available in the RM. In such conditions, the total inks consumption was estimated considering statistical data on production (see Table 4-83 from the National Inventory Report: 1990-2016. Greenhouse Gas Sources and Sinks in the Republic of Moldova), import and export (see Table 4-85 from the National Inventory Report: 1990-2016. Greenhouse Gas Sources and Sinks in the Republic of Moldova) (according to the Statistical Reports PRODMOLD-A “Total production, as a natural expression, by product type, for 2005-2016” inks were produced only during 2011-2013; there are no information on the export of inks during the period of reference).
Equation(Describe variables for method used)
Indirect CO2 emissions were estimated based on the carbon content in NMVOC emissions. The default value used represents 60% per cent (2006 IPCC Guidelines for National Greenhouse Gas Inventories, Volume 3: Industrial Processes and Product Use, Chapter 5: Non-Energy Products from Fuels and Solvent Use, Chapter 5.5: Solvent Use, Section 5.5.4 ‘Uncertainty assessment’, Page 5.17). By oxidizing, this carbon converts into CO2 in atmosphere (it is assumed that all solvents are of fossil origin).In order to estimate indirect CO2 emissions, the following equation was used:
CO2 Emissions = NMVOC • CC • 44/12Where:
CO2 Emissions – carbon dioxide emissions from solvents used in printing, kt/yr;NMVOC – total NMVOC emissions within the respective category, kt/yr;CC – carbon content in NMVOC;44/12 – stoichiometric ratio CO2/C.
Reference2006 IPCC Guidelines for National Greenhouse Gas Inventories, Volume 3: Industrial Processes and Product Use, Chapter 5: Non-Energy Products from Fuels and Solvent Use, Chapter 5.5: Solvent Use, Section 5.5.4 ‘Uncertainty assessment’, Page 5.17.National Inventory Report: 1990-2016. Greenhouse Gas Sources and Sinks in the Republic of Moldova (2018).
Describe How and Why this Method Was Chosen Due to the lower importance of this source and unavailability of all detailed data, the Tier 1 methodology has been used.
Type and source of activity data
The activity data on manufacturing industrial commodities in the RM within 1990-2016 periods are reported in the Table 4-83 from the National Inventory Report: 1990-2016. Greenhouse Gas Sources and Sinks in the Republic of Moldova. The information is based on activity data provided by the NBS through the Statistical Yearbooks for 1994 (pages 284, 288, 291), 1995 (pages 253, 257, 260), 1997 (pages 320, 322, 324), 1999 (pages 302, 304, 306), 2003 (pages 391, 393, 395), 2006 (page 311), 2011 (page 305), 2014 (page 302), as well as through the Statistical Reports PRODMOLD-A „Total production, as a natural expression, in the Republic of Moldova, by product type, for 2005-2016”. Customs Service of the Republic of Moldova is the primary source of information on import-export operations (including for ‘printing, writing or drawing’, as well as ‘other inks’ – code 3215 10-90; paints for ‘artistic painting, educational use, firms painting, amusement, as well as similar paints’ – code 3213 10-90), the information being provided through the Official Letter No. 28/07-1893 dated 23.02.2011, as a response to the request No. 03-07/175 dated 02.02.2011, from the MoEN; Official Letter No. 15-03-05 dated 24.01.2014, as a response to the request No. 320/2014-01-01 dated 03.01.2014, from the CCO of the MoEN; Official Letter No. 28/07-2231 dated 26.02.2015, as a response to the request No. 407/2015-01-09 dated 29.01.2015, from the CCO of the MoEN; Official Letter No. 28/07-8785 dated 26.05.2016, as a response to the request No. 512/2016-05-01 dated 10.05.2016, from the CCO of the MoEN; Official Letter No. 28/07-612 dated 12.01.2018, as a response to the request No. 601/2017-12-03 din 14.12.2017, from the CCO of the MARDE.
Type and source of EF and OF CC – carbon content in NMVOC, fraction (the default value used represents 60 per cent, with a margin of 50-70 per cent; 2006 IPCC Guidelines for National Greenhouse Gas Inventories, Volume 3: Industrial Processes and Product Use, Chapter 5: Non-Energy Products from Fuels and Solvent Use, Chapter 5.5: Solvent Use, Section 5.5.4 ‘Uncertainty assessment’, Page 5.17).
Uncertainty of AD and source 20% - expert judgementUncertainty of EF and source 20% - expert judgementPotential Improvements No potential improvements are planned to be implemented in the next inventory cycle for source category 2D3h ‘Printing’.
Table 2.2.4.18: Information on Source Category 2D3h ‘Printing’ – NMVOC Sector Industrial Processes and Product UseCategory 2D Non-Energy Products from Fuels and Solvents UseSource / Gas 2D3 Solvent Use / 2D3h Printing / NMVOC

Chapter 2: Methods and Data Documentation
2 - 130
Key Category? Not applicable for pollutant emissions.
Category Description / Defini-tion
The printing industry is an important manufacturing industry in most European countries. Printing processes convert original text and pictures into an image on a carrier and the main process types are named according to how this image is carried. The main processes in the printing industry are described in the process description. In this document, the following printing categories are identified: heat set offset printing; publication packaging and rotogravure and flexography. Printing involves the use of inks which may contain a proportion of organic solvents. These inks may then be subsequently diluted before use. Different inks have different proportions of organic solvents and require dilution to different extents. Printing can also require the use of cleaning solvents and organic dampeners. Ink solvents, diluents, cleaners and dampeners may all make a significant contribution to emissions from industrial printing.
Country Detail
No statistical data on solvents and/or printing inks used are available in the RM. In such conditions, the total inks consumption was estimated considering statistical data on production (see Table 4-83 from the National Inventory Report: 1990-2016. Greenhouse Gas Sources and Sinks in the Republic of Moldova), import and export (see Table 4-85 from the National Inventory Report: 1990-2016. Greenhouse Gas Sources and Sinks in the Republic of Moldova) (according to the Statistical Reports PRODMOLD-A “Total production, as a natural expression, by product type, for 2005-2016” inks were produced only during 2011-2013; there are no information on the export of inks during the period of reference).
Equation(Describe variables for method used)
The Tier 1 approach for NMVOC emissions from printing uses the general equation (1) from the EMEP/EEA Air Pollution Emission Inventory Guidebook 2016, NFR 2.D.3.h ‘Printing’, section 3.2 ‘Tier 1 default approach’:
E pollutant = (AR product • EF pollutant) / 103
Where:E pollutant – the emission of the specified pollutant, t/yr;AR product – the activity rate for the use of solvents for printing, t/yr;EF pollutant – the emission factor for this pollutant technology, kg/t.
ReferenceEEA (2016), EMEP/EEA Air Pollution Emission Inventory Guidebook 2016, Technical guidance to prepare national emission inventories. European Environment Agency, Technical report No 21/2016. Copen-hagen, Denmark (Available on: http://www.eea.europa.eu//publications/emep-eea-guidebook-2016).National Inventory Report: 1990-2016. Greenhouse Gas Sources and Sinks in the Republic of Moldova (2018).
Describe How and Why this Method Was Chosen Due to the lower importance of this source and unavailability of all detailed data, the Tier 1 methodology has been used.
Type and source of activity data
The activity data on manufacturing industrial commodities in the RM within 1990-2016 periods are reported in the Table 4-83 from the National Inventory Report: 1990-2016. Greenhouse Gas Sources and Sinks in the Republic of Moldova. The information is based on activity data provided by the NBS through the Statistical Yearbooks for 1994 (pages 284, 288, 291), 1995 (pages 253, 257, 260), 1997 (pages 320, 322, 324), 1999 (pages 302, 304, 306), 2003 (pages 391, 393, 395), 2006 (page 311), 2011 (page 305), 2014 (page 302), as well as through the Statistical Reports PRODMOLD-A „Total production, as a natural expression, in the Republic of Moldova, by product type, for 2005-2016”. Customs Service of the Republic of Moldova is the primary source of information on import-export operations (including for ‘printing, writing or drawing’, as well as ‘other inks’ – code 3215 10-90; paints for ‘artistic painting, educational use, firms painting, amusement, as well as similar paints’ – code 3213 10-90), the information being provided through the Official Letter No. 28/07-1893 dated 23.02.2011, as a response to the request No. 03-07/175 dated 02.02.2011, from the MoEN; Official Letter No. 15-03-05 dated 24.01.2014, as a response to the request No. 320/2014-01-01 dated 03.01.2014, from the CCO of the MoEN; Official Letter No. 28/07-2231 dated 26.02.2015, as a response to the request No. 407/2015-01-09 dated 29.01.2015, from the CCO of the MoEN; Official Letter No. 28/07-8785 dated 26.05.2016, as a response to the request No. 512/2016-05-01 dated 10.05.2016, from the CCO of the MoEN; Official Letter No. 28/07-612 dated 12.01.2018, as a response to the request No. 601/2017-12-03 din 14.12.2017, from the CCO of the MARDE.
Type and source of EF and OF
Tier 1 Default EFs for 2D3h ‘Printing’Source Category NMVOC Emission Factor Unit
Printing 500 (30-2100) kg/t inkSource: EMEP/EEA Atmospheric Emissions Inventory Guidebook (2016), Category 2.D.3.h ‘Printing’, Table 3-1, page 11.
Uncertainty of AD and source 20% - expert judgementUncertainty of EF and source See the 95% confidence interval in the table above (in the brackets, lower-upper).
Table 2.2.4.19: Information on Source Category 2D3i ‘Other Solvent and Product Use’ (Seed Oil Extraction) – CO2
Sector Industrial Processes and Product UseCategory 2D Non-Energy Products from Fuels and Solvents UseSource / Gas 2D3 Solvent Use / 2D3i Other Solvent and Product Use (Seed Oil Extraction) / CO2
Key Category? No

Chapter 2: Methods and Data Documentation
2 - 131
Category Description / Defini-tion
A certain amount of solvents, hexane in particular, is used in extracting oil from seeds (mechanical extraction does not require the use of solvents). The cleaned and prepared seeds are washed several times in warm hexane solvent until all the oil is extracted, while the remaining seeds residue is treated with steam to capture the solvent and oil that remains in it. After drying, the remaining seed residue may be used as animal feed (it has a content rich in proteins and mineral salts). The oil is separated from the oil-enriched wash solvent and from the steamed-out solvent. The solvent (hexane) is recovered and re-used. Recovery efficiency is quite high, although it is dictated by some economic aspects specific to the enterprises in this branch. The oil is further refined.
Country Detail In order to estimate emissions, statistical data on the amount of oil extracted at the Moldovan enterprises are used. At the national level, there are over 100 enterprises specialized in oil production, the largest being ‘Floarea-Soarelui’ J.S.C. in Balti. Current technologies used in seed oil extraction by use of solvents allow obtain around 450 kg of oil per one tone of seeds. This particular conversion factor was used to estimate the quantity of seeds consumed for oil extraction (see the Table 4-87 from the National Inventory Report: 1990-2016. Greenhouse Gas Sources and Sinks in the Republic of Moldova).
Equation(Describe variables for method used)
Indirect CO2 emissions were estimated based on the carbon content in NMVOC emissions. The default value used represents 60% per cent (2006 IPCC Guidelines for National Greenhouse Gas Inventories, Volume 3: Industrial Processes and Product Use, Chapter 5: Non-Energy Products from Fuels and Solvent Use, Chapter 5.5: Solvent Use, Section 5.5.4 ‘Uncertainty assessment’, Page 5.17). By oxidizing, this carbon converts into CO2 in atmosphere (it is assumed that all solvents are of fossil origin).In order to estimate indirect CO2 emissions, the following equation was used:
CO2 Emissions = NMVOC • CC • 44/12Where:
CO2 Emissions – carbon dioxide emissions from solvents used in seed oil extraction, kt/yr;NMVOC – total NMVOC emissions within the respective category, kt/yr;CC – carbon content in NMVOC;44/12 – stoichiometric ratio CO2/C.
Reference2006 IPCC Guidelines for National Greenhouse Gas Inventories, Volume 3: Industrial Processes and Product Use, Chapter 5: Non-Energy Products from Fuels and Solvent Use, Chapter 5.5: Solvent Use, Section 5.5.4 ‘Uncertainty assessment’, Page 5.17.National Inventory Report: 1990-2016. Greenhouse Gas Sources and Sinks in the Republic of Moldova (2018).
Describe How and Why this Method Was Chosen Due to the lower importance of this source and unavailability of all detailed data, the Tier 1 methodology has been used.
Type and source of activity data
The activity data on oil production and quantity of seeds used for oil extraction in the Republic of Moldova within 1990-2016 periods are provided in the Table 4-87 from the National Inventory Report: 1990-2016. Greenhouse Gas Sources and Sinks in the Republic of Moldova. The information is provided by the National Bureau of Statistics through the Official Letter No. 06-39/08 dated 23.02.2011, as a response to the request No. 03-07/175 dated 02.02.2011 from the MoEN; Official Letter No. 06-39/38 dated 22.09.2011, as a response to the request No. 101/2011-09-01 dated 02.09.2011 from the CCO of the MoEN; as well as through the Statistical Reports PRODMOLD-A „Total production, as a natural expression, in the Republic of Moldova, by product type, for 2005-2015”; information for the territory on the left bank of Dniester river is available in the Statistical Yearbooks of the ATULBD for 1998 (page 183), 2000 (page 100), 2002 (page 104), 2003 (page 99), 2006 (page 94), 2007 (page 93), 2009 (page 93), 2011 (page 95), 2013 (page 100), 2017 (page 102).
Type and source of EF and OF CC – carbon content in NMVOC, fraction (the default value used represents 60 per cent, with a margin of 50-70 per cent; 2006 IPCC Guidelines for National Greenhouse Gas Inventories, Volume 3: Industrial Processes and Product Use, Chapter 5: Non-Energy Products from Fuels and Solvent Use, Chapter 5.5: Solvent Use, Section 5.5.4 ‘Uncertainty assessment’, Page 5.17).
Uncertainty of AD and source 20% - expert judgementUncertainty of EF and source 20% - expert judgementPotential Improvements No potential improvements are planned to be implemented in the next inventory cycle for source category 2.D.3.i ‘Other Solvent and Product Use’ (Seed Oil Extraction).
Table 2.2.4.20: Information on Source Category 2D3i ‘Other Solvent and Product Use’ (Seed Oil Extraction) – Pollutant Emissions Sector Industrial Processes and Product UseCategory 2D Non-Energy Products from Fuels and Solvents UseSource / Gas 2D3 Solvent Use / 2D3i Other Solvent and Product Use (Seed Oil Extraction) / Pollutant EmissionsKey Category? Not applicable for pollutant emissions.
Category Description / Defini-tion
This activity includes solvent extraction of edible oils from oilseeds and drying of leftover seeds before resale as animal feed. The extraction of oil from oil seeds is performed either mechanically or through the use of solvents, or both. Where solvent is used, it is generally recovered and cleaned for reuse. The seed may be subjected to solvent treatment many times before all the oil is extracted. The remaining seed residue is then dried and may be used as an animal feed.

Chapter 2: Methods and Data Documentation
2 - 132
Country Detail In order to estimate emissions, statistical data on the amount of oil extracted at the Moldovan enterprises are used. At the national level, there are over 100 enterprises specialized in oil production, the largest being ‘Floarea-Soarelui’ J.S.C. in Balti. Current technologies used in seed oil extraction by use of solvents allow obtain around 450 kg of oil per one tone of seeds. This particular conversion factor was used to estimate the quantity of seeds consumed for oil extraction (see the Table 4-87 from the National Inventory Report: 1990-2016. Greenhouse Gas Sources and Sinks in the Republic of Moldova).
Equation(Describe variables for method used)
The Tier 2 approach for pollutant emissions from using solvents in the seed oil extraction uses the general equation (2) from the EMEP/EEA Air Pollution Emission Inventory Guidebook 2016, NFR 2.D.3.i ‘Other Solvent and Product Use’, section 3.3 ‘Tier 2 technology-specific approach’:
E pollutant = (AR use, technology • EF technology, pollutant) / 103
Where:E technology, pollutant – the emission of the technology and the specified pollutant, t/yr;AR use, technology – the activity rate for the use of solvents for seed oil extraction, t/yr;EF pollutant – the emission factor for this pollutant technology, kg/t.
ReferenceEEA (2016), EMEP/EEA Air Pollution Emission Inventory Guidebook 2016, Technical guidance to prepare national emission inventories. European Environment Agency, Technical report No 21/2016. Copen-hagen, Denmark (available on: http://www.eea.europa.eu//publications/emep-eea-guidebook-2016).National Inventory Report: 1990-2016. Greenhouse Gas Sources and Sinks in the Republic of Moldova (2018).
Describe How and Why this Method Was Chosen A Tier 2 methodology has been used due to availability of technology-specific emission factors.
Type and source of activity data
The activity data on oil production and quantity of seeds used for oil extraction in the Republic of Moldova within 1990-2016 periods are provided in the Table 4-87 from the National Inventory Report: 1990-2016. Greenhouse Gas Sources and Sinks in the Republic of Moldova. The information is provided by the National Bureau of Statistics through the Official Letter No. 06-39/08 dated 23.02.2011, as a response to the request No. 03-07/175 dated 02.02.2011 from the MoEN; Official Letter No. 06-39/38 dated 22.09.2011, as a response to the request No. 101/2011-09-01 dated 02.09.2011 from the CCO of the MoEN; as well as through the Statistical Reports PRODMOLD-A ”Total production, as a natural expression, in the Republic of Moldova, by product type, for 2005-2015”; information for the territory on the left bank of Dniester river is available in the Statistical Yearbooks of the ATULBD for 1998 (page 183), 2000 (page 100), 2002 (page 104), 2003 (page 99), 2006 (page 94), 2007 (page 93), 2009 (page 93), 2011 (page 95), 2013 (page 100), 2017 (page 102).
Type and source of EF and OF
Tier 2 Default EFs for Estimating Pollutant Emissions from Seed Oil ExtractionSource Category NMVOC Emission Factor Unit
Seed Oil Extraction 1.57 (0.33-2.81) g/kg seedsSource: EMEP/EEA Atmospheric Emissions Inventory Guidebook (2016), Category 2.D.3.i ‘Other Solvent and Product Use’, SNAP 060404, Table 3-4, page 14.
Uncertainty of AD and source 20% - expert judgementUncertainty of EF and source See the 95% confidence interval in the table above (in the brackets, lower-upper).
Table 2.2.4.21: Information on Source Category 2D3i ‘Other Solvent and Product Use’ (Use of Glues and Other Adhesives) – CO2Sector Industrial Processes and Product UseCategory 2D Non-Energy Products from Fuels and Solvents UseSource / Gas 2D3 Solvent Use / 2D3i Other Solvent and Product Use (Use of Glues and Other Adhesives) / CO2
Key Category? No
Category Description / Defini-tion
Sectors using adhesives are very diverse. Production processes and application techniques are also very different. Relevant sectors are the production of adhesive tapes, composite foils, the transportation sector (passenger cars, commercial vehicles, mobile homes, rail vehicles and aircrafts), the manufacture of shoes and leather goods and the wood material and furniture industry. Adhesive tape consists of a substrate, a coupling agent, a pressure-sensitive adhesive and releasing agents. The selection of the adhesive system depends on the technical application of the adhesive tape. At a European level, packaging adhesive tapes have a proportion of 74% and coating adhesive tapes only 10%. Solvent-based adhesives (acrylate for double-sided adhesive tapes, natural rubber for packaging and cover adhesive tapes) have a proportion of 49% in the European adhesive-tape production. Hot melts (acrylate for double-sided adhesive tapes and synthetic rubber for packaging, cover and double-sided tapes) have a proportion of 33% and dispersions (acrylate for double-sided and packaging adhesive tapes), 18%.
Country Detail For most activities related to other solvent and product use in the Republic of Moldova, there are no reliable statistical sources of reference. Under such circumstances, the total consumption of glues and other adhesives was estimated based on information on production, import and export. To be noted that production of glues and other adhesives in the Republic of Moldova was insignificant and is recorded starting only with 2003, though it increased in the recent years (see Table 4-89 from the National Inventory Report: 1990-2016. Greenhouse Gas Sources and Sinks in the Republic of Moldova).

Chapter 2: Methods and Data Documentation
2 - 133
Equation(Describe variables for method used)
Indirect CO2 emissions were estimated based on the carbon content in NMVOC emissions. The default value used represents 60% per cent (2006 IPCC Guidelines for National Greenhouse Gas Inventories, Volume 3: Industrial Processes and Product Use, Chapter 5: Non-Energy Products from Fuels and Solvent Use, Chapter 5.5: Solvent Use, Section 5.5.4 ‘Uncertainty assessment’, Page 5.17). By oxidizing, this carbon converts into CO2 in atmosphere (it is assumed that all solvents are of fossil origin).In order to estimate indirect CO2 emissions, the following equation was used:
CO2 Emissions = NMVOC • CC • 44/12Where:
CO2 Emissions – carbon dioxide emissions from solvents used in glues and other adhesives, kt/yr;NMVOC – total NMVOC emissions within the respective category, kt/yr;CC – carbon content in NMVOC;44/12 – stoichiometric ratio CO2/C.
Reference2006 IPCC Guidelines for National Greenhouse Gas Inventories, Volume 3: Industrial Processes and Product Use, Chapter 5: Non-Energy Products from Fuels and Solvent Use, Chapter 5.5: Solvent Use, Section 5.5.4 ‘Uncertainty assessment’, Page 5.17.National Inventory Report: 1990-2016. Greenhouse Gas Sources and Sinks in the Republic of Moldova (2018).
Describe How and Why this Method Was Chosen Due to the lower importance of this source and unavailability of all detailed data, the Tier 1 methodology has been used.
Type and source of activity data
The production of glues and other adhesives in the RM was insignificant and is recorded starting only with 2003, though it increased in the recent years (see Table 4-89 from the National Inventory Report: 1990-2016. Greenhouse Gas Sources and Sinks in the Republic of Moldova) (information is available through the Statistical Reports PRODMOLD-A „Total production, as a natural expression, in the Republic of Moldova, by product type, for 2005-2016”). Under such circumstances, the total consumption of glues and other adhesives was estimated based on information on production, import and export. Customs Service of the Republic of Moldova is the primary source of information on national import and export operations (no data on glue and other adhesives exports was recorded during the period under review), information on import operations being provided through the Official Letter No. 28/07-1893 dated 23.02.2011, as a response to the request No. 03-07/175 dated 02.02.2011, from the MoEN; Official Letter No. 15-03-05 dated 24.01.2014, as a response to the request No. 320/2014-01-01 dated 03.01.2014, from the CCO of the MoEN; Official Letter No. 28/07-2231 dated 26.02.2015, as a response to the request No. 407/2015-01-09 dated 29.01.2015, from the CCO of the MoEN; Official Letter No. 28/07-8785 dated 26.05.2016, as a response to the request No. 512/2016-05-01 dated 10.05.2016, from the CCO of the MoEN; Official Letter No. 28/07-612 dated 12.01.2018, as a response to the request No. 601/2017-12-03 dated 14.12.2017, from the CCO of the MARDE.
Type and source of EF and OF CC – carbon content in NMVOC, fraction (the default value used represents 60 per cent, with a margin of 50-70 per cent; 2006 IPCC Guidelines for National Greenhouse Gas Inventories, Volume 3: Industrial Processes and Product Use, Chapter 5: Non-Energy Products from Fuels and Solvent Use, Chapter 5.5: Solvent Use, Section 5.5.4 ‘Uncertainty assessment’, Page 5.17).
Uncertainty of AD and source 20% - expert judgementUncertainty of EF and source 20% - expert judgementPotential Improvements No potential improvements are planned to be implemented in the next inventory cycle for source category 2.D.3.i ‘Other Solvent and Product Use’ (Use of Glues and Other Adhesives).
Table 2.2.4.22: Information on Source Category 2D3i ‘Other Solvent and Product Use’ (Use of Glues and Other Adhesives) – NMVOC Sector Industrial Processes and Product UseCategory 2D Non-Energy Products from Fuels and Solvents UseSource / Gas 2D3 Solvent Use / 2D3i Other Solvent and Product Use (Use of Glues and Other Adhesives) / NMVOC Key Category? Not applicable for pollutant emissions.
Category Description / Defini-tion
Sectors using adhesives are very diverse. Production processes and application techniques are also very different. Relevant sectors are the production of adhesive tapes, composite foils, the transportation sector (passenger cars, commercial vehicles, mobile homes, rail vehicles and aircrafts), the manufacture of shoes and leather goods and the wood material and furniture industry. Adhesive tape consists of a substrate, a coupling agent, a pressure-sensitive adhesive and releasing agents. The selection of the adhesive system depends on the technical application of the adhesive tape. At a European level, packaging adhesive tapes have a proportion of 74% and coating adhesive tapes only 10%. Solvent-based adhesives (acrylate for double-sided adhesive tapes, natural rubber for packaging and cover adhesive tapes) have a proportion of 49% in the European adhesive-tape production. Hot melts (acrylate for double-sided adhesive tapes and synthetic rubber for packaging, cover and double-sided tapes) have a proportion of 33% and dispersions (acrylate for double-sided and packaging adhesive tapes), 18%.
Country Detail For most activities related to other solvent and product use in the Republic of Moldova, there are no reliable statistical sources of reference. Under such circumstances, the total consumption of glues and other adhesives was estimated based on information on production, import and export. To be noted that production of glues and other adhesives in the Republic of Moldova was insignificant and is recorded starting only with 2003, though it increased in the recent years (see Table 4-89 from the National Inventory Report: 1990-2016. Greenhouse Gas Sources and Sinks in the Republic of Moldova).

Chapter 2: Methods and Data Documentation
2 - 134
Equation(Describe variables for method used)
The Tier 2 approach for pollutant emissions from use of glues and other adhesives uses the general equation (2) from the EMEP/EEA Air Pollution Emission Inventory Guidebook 2016, NFR 2.D.3.i ‘Other Solvent and Product Use’, section 3.3 ‘Tier 2 technology-specific approach’:
E pollutant = (AR use, technology • EF technology, pollutant) / 103
Where:E technology, pollutant – the emission of the technology and the specified pollutant, t/yr;AR use, technology – the activity rate for the use of glues and other adhesives, t/yr;EF pollutant – the emission factor for this pollutant technology, kg/t.
ReferenceEEA (2016), EMEP/EEA Air Pollution Emission Inventory Guidebook 2016, Technical guidance to prepare national emission inventories. European Environment Agency, Technical report No 21/2016. Copen-hagen, Denmark (Available on: http://www.eea.europa.eu//publications/emep-eea-guidebook-2016).National Inventory Report: 1990-2016. Greenhouse Gas Sources and Sinks in the Republic of Moldova (2018).
Describe How and Why this Method Was Chosen A Tier 2 methodology has been used due to availability of technology-specific emission factors.
Type and source of activity data
The production of glues and other adhesives in the RM was insignificant and is recorded starting only with 2003, though it increased in the recent years (see Table 4-89 from the National Inventory Report: 1990-2016. Greenhouse Gas Sources and Sinks in the Republic of Moldova) (information is available through the Statistical Reports PRODMOLD-A „Total production, as a natural expression, in the Republic of Moldova, by product type, for 2005-2016”). Under such circumstances, the total consumption of glues and other adhesives was estimated based on information on production, import and export. Customs Service of the Republic of Moldova is the primary source of information on national import and export operations (no data on glue and other adhesives exports was recorded during the period under review), information on import operations being provided through the Official Letter No. 28/07-1893 dated 23.02.2011, as a response to the request No. 03-07/175 dated 02.02.2011, from the MoEN; Official Letter No. 15-03-05 dated 24.01.2014, as a response to the request No. 320/2014-01-01 dated 03.01.2014, from the CCO of the MoEN; Official Letter No. 28/07-2231 dated 26.02.2015, as a response to the request No. 407/2015-01-09 dated 29.01.2015, from the CCO of the MoEN; Official Letter No.. 28/07-8785 dated 26.05.2016, as a response to the request No. 512/2016-05-01 dated 10.05.2016, from the CCO of the MoEN; Official Letter No. 28/07-612 dated 12.01.2018, as a response to the request No. 601/2017-12-03 dated 14.12.2017, from the CCO of the MARDE.
Type and source of EF and OF
Tier 2 Default EFs for 2D3i ‘Other Solvent and Product Use’ (‘Use of Glues and Other Adhesives’)Source Category NMVOC Emission Factors Unit
Use of Glues and Other Adhesives 522 (200-900)562 (350-900)
g/kg glue and/or adhesivesg/kg solvent
Source: EMEP/EEA Atmospheric Emissions Inventory Guidebook (2016), Category 2.D.3.i ‘Other Solvent and Product Use’, SNAP 060405, Table 3-11, page 18. Uncertainty of AD and source 20% - expert judgementUncertainty of EF and source See the 95% confidence interval in the table above (in the brackets, lower-upper).
Table 2.2.4.23: Information on Source Category 2D3i ‘Other Solvent and Product Use’ (Preservation of Wood) – CO2Sector Industrial Processes and Product UseCategory 2D Non-Energy Products from Fuels and Solvents UseSource / Gas 2D3 Solvent Use / 2D3i Other Solvent and Product Use (Preservation of Wood) / CO2
Key Category? No
Category Description / Defini-tion
This activity considers industrial processes for the impregnation with, or immersion of timber to protect it against fungal and insect attack and also against weathering. There are three main types of preserva-tive: creosote, organic solvent-based (often referred to as ‘light organic solvent-based preservatives (LOSP)’) and water-borne. Wood preservatives may be supplied for both industrial and domestic use. This activity only covers industrial use and does not include domestic use of wood preservatives, which is covered under NFR source category ‘Domestic solvent use’. Most of the information currently available on emissions relates to the industrial use of wood preservatives. (1) Creosote is an oil prepared from coal tar distillation. Creosote contains a high proportion of aromatic compounds such as polycyclic aromatic hydrocarbons (PAHs). Levels of benzo[a]pyrene in some types of creosote are restricted in the EU to 500 ppm for industrial use (14th amendment to the Marketing and Use Directive — Creosote (96/60/EEC)). Creosote is the oldest form of wood preservative and is used for external applications such as telegraph poles and railway sleepers. Creosote preservatives: timber is treated in a chamber which may be pressurized with air. The chamber is flooded with hot creosote for one to three hours. After draining, a vacuum is applied to draw off excess creosote. The timber is then left to dry in the open air. Creosote is gradually being replaced by water-borne preservatives. Creosote may be mixed with petroleum fractions to produce carbolinium. This can be brushed onto the surface of the wood and is mainly for private use. (2) Water-borne preservatives consist of solutions of inorganic salts in water. Copper, chromium and arsenic (CCA) types are the most widely used. These are usually based on copper oxide, chromium trioxide and arsenic pentoxide. Water-borne preservatives are applied in the same way as creosote. (3) Organic solvent-borne preservatives consist of approximately 10% active ingredient including insecticides and fungicides such as dinitrophenol, pentachlorophenol, chloronaphthalenes, chlorobenzenes, lindane, dieldrin, organophosphorous and carbamate compounds, and copper/zinc naphthenates. The preservatives also have 90 % organic solvent, usually white spirit or other petroleum-based hydrocarbons. In the case of organic solvent-borne preservatives timber is treated in a chamber which is subsequently evacuated.

Chapter 2: Methods and Data Documentation
2 - 135
Category Description / Defini-tion
The chamber is flooded with preservative and pressurized for 5 to 20 minutes. After draining the chamber, a final vacuum is applied to draw off excess preservative. The timber is left to dry in the open air. About 15–25% of the solvent remains in the wood which leaves the treatment plant. A large part of this residual solvent is likely to evaporate over the life of the product. The application efficiency of the vacuum process, dipping and brushing is close to 90%. Spraying has a much lower efficiency of around 50%
Country Detail The literature in the field reveals that about 50 per cent of the total timber is used in construction, 15 per cent in the furniture industry and other finished wood products, 15 per cent in the packaging industry and 20 per cent in other uses. Since the share of timber treated with preservatives is unknown (it is assumed that in the RM, the preservatives are creosote based) it is admitted that this corresponds to the share of timber used in the furniture industry and other finished wood products (15 per cent of the total).
Equation(Describe variables for method used)
Indirect CO2 emissions were estimated based on the carbon content in NMVOC emissions. The default value used represents 60% per cent (2006 IPCC Guidelines for National Greenhouse Gas Inventories, Volume 3: Industrial Processes and Product Use, Chapter 5: Non-Energy Products from Fuels and Solvent Use, Chapter 5.5: Solvent Use, Section 5.5.4 ‘Uncertainty assessment’, Page 5.17). By oxidizing, this carbon converts into CO2 in atmosphere (it is assumed that all solvents are of fossil origin).In order to estimate indirect CO2 emissions, the following equation was used:
CO2 Emissions = NMVOC • CC • 44/12Where:
CO2 Emissions – carbon dioxide emissions from solvents used in preservation of wood, kt/yr;NMVOC – total NMVOC emissions within the respective category, kt/yr;CC – carbon content in NMVOC;44/12 – stoichiometric ratio CO2/C.
Reference2006 IPCC Guidelines for National Greenhouse Gas Inventories, Volume 3: Industrial Processes and Product Use, Chapter 5: Non-Energy Products from Fuels and Solvent Use, Chapter 5.5: Solvent Use, Section 5.5.4 ‘Uncertainty assessment’, Page 5.17.National Inventory Report: 1990-2016. Greenhouse Gas Sources and Sinks in the Republic of Moldova (2018).
Describe How and Why this Method Was Chosen Due to the lower importance of this source and unavailability of all detailed data, the Tier 1 methodology has been used.
Type and source of activity data
The statistical data on the total amount of timber produced at the Moldovan enterprises is reported in the Table 4-91 of the National Inventory Report: 1990-2016. Greenhouse Gas Sources and Sinks in the Republic of Moldova (2018), being based on information available in the Statistical Yearbooks of the Republic of Moldova for 1994 (page 273), 1999 (page 273), 2003 (page 273), 2006 (page 273); Statistical Reports PRODMOLD-A „Total production, as a natural expression, in the Republic of Moldova, by product type, for 2005-2016”; as well as in the Statistical Yearbooks of the ATULBD for 2000 (page 99), 2003 (page 98), 2006 (page 93), 2009 (page 92), 2011 (page 95), 2012 (page 98), 2017 (page 101).Current technologies for preservation of wood by creosote impregnation imply the use of circa 75 kg of creosote in order to treat one cubic meter of wood, while for the same volume of wood, 24 kg of organic solvents can be used (EMEP/EEA Air Pollutant Emission Inventory Guidebook (2016), source category 2.D.3.i ‘Other Solvent and Product Use’, SNAP 060406 ‘Preservation of Wood’, page 14). The respective conversion factor was used to estimate the amount of creosote used in timber treatment at the Moldovan enterprises (see Table 4-92 from the National Inventory Report: 1990-2016. Greenhouse Gas Sources and Sinks in the Republic of Moldova).
Type and source of EF and OF CC – carbon content in NMVOC, fraction (the default value used represents 60 per cent, with a margin of 50-70 per cent; 2006 IPCC Guidelines for National Greenhouse Gas Inventories, Volume 3: Industrial Processes and Product Use, Chapter 5: Non-Energy Products from Fuels and Solvent Use, Chapter 5.5: Solvent Use, Section 5.5.4 ‘Uncertainty assessment’, Page 5.17).
Uncertainty of AD and source 20% - expert judgementUncertainty of EF and source 20% - expert judgementPotential Improvements No potential improvements are planned to be implemented in the next inventory cycle for source category 2.D.3.i ‘Other Solvent and Product Use’ (Preservation of Wood).
Table 2.2.4.24: Information on Source Category 2D3i ‘Other Solvent and Product Use’ (Preservation of Wood) – NMVOC Sector Industrial Processes and Product UseCategory 2D Non-Energy Products from Fuels and Solvents UseSource / Gas 2D3 Solvent Use / 2D3i Other Solvent and Product Use (Preservation of Wood) / NMVOC Key Category? Not applicable for pollutant emissions.
Category Description / Defini-tion
This activity considers industrial processes for the impregnation with, or immersion of timber to protect it against fungal and insect attack and also against weathering. There are three main types of preservative: creosote, organic solvent-based (often referred to as ‘light organic solvent-based preservatives (LOSP)’) and water-borne. Wood preservatives may be supplied for both industrial and domestic use. This activity only covers industrial use and does not include domestic use of wood preservatives, which is covered under NFR source category ‘Domestic solvent use’. Most of the information currently available on emissions relates to the industrial use of wood preservatives. (1) Creosote is an oil prepared from coal tar distillation. Creosote contains a high proportion of aromatic compounds such as polycyclic aromatic hydrocarbons (PAHs). Levels of benzo[a]pyrene in some types of creosote are restricted in the EU to 500 ppm for industrial use (14th amendment to the Marketing and Use Directive — Creosote (96/60/EEC)). Creosote is the oldest form of wood

Chapter 2: Methods and Data Documentation
2 - 136
Category Description / Defini-tion
This activity considers industrial processes for the impregnation with, or immersion of timber to protect it against fungal and insect attack and also against weathering. There are three main types of preservative: creosote, organic solvent-based (often referred to as ‘light organic solvent-based preservatives (LOSP)’) and water-borne. Wood preservatives may be supplied for both industrial and domestic use. This activity only covers industrial use and does not include domestic use of wood preservatives, which is covered under NFR source category ‘Domestic solvent use’. Most of the information currently available on emissions relates to the industrial use of wood preservatives. (1) Creosote is an oil prepared from coal tar distillation. Creosote contains a high proportion of aromatic compounds such as polycyclic aromatic hydrocarbons (PAHs). Levels of benzo[a]pyrene in some types of creosote are restricted in the EU to 500 ppm for industrial use (14th amendment to the Marketing and Use Directive — Creosote (96/60/EEC)). Creosote is the oldest form of wood
Country Detail The literature in the field reveals that about 50 per cent of the total timber is used in construction, 15 per cent in the furniture industry and other finished wood products, 15 per cent in the packaging industry and 20 per cent in other uses. Since the share of timber treated with preservatives is unknown (it is assumed that in the RM, the preservatives are creosote based) it is admitted that this corresponds to the share of timber used in the furniture industry and other finished wood products (15 per cent of the total).
Equation(Describe variables for method used)
The Tier 2 approach for pollutant emissions from preservation of wood uses the general equation (2) from the EMEP/EEA Air Pollution Emission Inventory Guidebook 2016, NFR 2.D.3.i ‘Other Solvent and Product Use’, section 3.3 ‘Tier 2 technology-specific approach’:
E pollutant = (AR use, technology • EF technology, pollutant) / 103
Where:E technology, pollutant – the emission of the technology and the specified pollutant, t/yr;AR use, technology – the activity rate for the use of solvents in preservation of wood, t/yr;EF pollutant – the emission factor for this pollutant technology, kg/t.
ReferenceEEA (2016), EMEP/EEA Air Pollution Emission Inventory Guidebook 2016, Technical guidance to prepare national emission inventories. European Environment Agency, Technical report No 21/2016. Copen-hagen, Denmark (Available on: http://www.eea.europa.eu//publications/emep-eea-guidebook-2016).National Inventory Report: 1990-2016. Greenhouse Gas Sources and Sinks in the Republic of Moldova (2018).
Describe How and Why this Method Was Chosen A Tier 2 methodology has been used due to availability of technology-specific emission factors.
Type and source of activity data
The statistical data on the total amount of timber produced at the Moldovan enterprises is reported in the Table 4-91 of the National Inventory Report: 1990-2016. Greenhouse Gas Sources and Sinks in the Republic of Moldova (2018), being based on information available in the Statistical Yearbooks of the Republic of Moldova for 1994 (page 273), 1999 (page 273), 2003 (page 273), 2006 (page 273); Statistical Reports PRODMOLD-A „Total production, as a natural expression, in the Republic of Moldova, by product type, for 2005-2016”; as well as in the Statistical Yearbooks of the ATULBD for 2000 (page 99), 2003 (page 98), 2006 (page 93), 2009 (page 92), 2011 (page 95), 2012 (page 98), 2017 (page 101).
Current technologies for preservation of wood by creosote impregnation imply the use of circa 75 kg of creosote in order to treat one cubic meter of wood, while for the same volume of wood, 24 kg of organic solvents can be used (EMEP/EEA Air Pollutant Emission Inventory Guidebook (2016), source category 2.D.3.i ‘Other Solvent and Product Use’, SNAP 060406 ‘Preservation of Wood’, page 14). The respective conversion factor was used to estimate the amount of creosote used in timber treatment at the Moldovan enterprises (see Table 4-92 from the National Inventory Report: 1990-2016. Greenhouse Gas Sources and Sinks in the Republic of Moldova).
Type and source of EF and OF
Tier 2 Default EFs for Estimating NMVOC Emissions from ‘Preservation of Wood’Source Category NMVOC Emission Factors Unit
‘Preservation of Wood’105 (70-160) g/kg creosote
945 (900-1000) g/kg preservative on base of organic solvents5 (0.5-7.0) g/kg waterborne preservative
Source: EMEP/EEA Atmospheric Emissions Inventory Guidebook (2016), Category 2.D.3.i ‘Other Solvent and Product Use’, SNAP 060406, Tables 3-5 – 3-7, pages 15-16.If preservative consumption data is not available then it can be calculated by using the ‘quantity of wood preserved’ combined with the following assumptions and equation by using:
• quantity of preservative used = [Volume of wood impregnated (m3)] x [kg of wood preservative per m3];• 1 m3 of wood requires 75 kg of creosote;• 1 m3 of wood requires 24 kg of solvent borne preservative;• 1 m3 of wood is approximately 1 Mg.
The NMVOC emission factors in the table above are derived from IIASA (2008), recalculated in terms of g/kg creosote used using the above figure of 75 kg creosote/m3 wood.Uncertainty of AD and source 20% - expert judgementUncertainty of EF and source See the 95% confidence interval in the table above (in the brackets, lower-upper).

Chapter 2: Methods and Data Documentation
2 - 137
Table 2.2.4.25: Information on Source Category 2D3i ‘Other Solvent and Product Use’ (Underseal Treatment and Conservation of Vehicles) – CO2Sector Industrial Processes and Product UseCategory 2D Non-Energy Products from Fuels and Solvents UseSource / Gas 2D3 Solvent Use / 2D3i Other Solvent and Product Use (Underseal Treatment and Conservation of Vehicles) / CO2
Key Category? No
Category Description / Defini-tion
This category addresses the application of protective coatings to the undersides of cars. This is only a very small source of emissions and can nowadays be considered negligible. The following description of the processes and controls is based on discussions with the Society of Motor Manufacturers and Traders (SMMT) (SMMT, 1997), the Association of European Automobile Manufacturers (ACEA) (ACEA, 1997) and Ford Europe (Ford Europe, 1997). The application of coatings to the underside of car bodies can be divided into the original equipment manufacture (OEM) sector and the aftermarket (repair) sector. For the OEM sector a coating of PVC plastisol (1) is applied during manufacture to the underneath of car bodies at the same time as the primer. The body is then heated in an oven at 135 °C for about five minutes to cure both the primer and the PVC coating. This coating is applied for protection from stone chips and for sound deadening. The PVC coating is 97 % 99 % solids and is an integral part of the vehicles coating 137package. Any emission during manufacture will be included in any estimate of the emission from painting during vehicle manufacture (SNAP 060101 Paint application: manufacture of automobiles, included in chapter 3.A, Paint application). In the aftermarket sector, coatings are applied to the underside of cars only during repair of damaged bodywork. This coating is the same type as in the OEM sector. These emissions will be included in car repairing (chapter 3.A, Paint application). Before the early 1980s, car manufacturers did not apply any coating to the underside of their cars. If a car owner wanted to protect their car against rust and stone chip damage, they had to pay to have their car ‘undersealed’ at a garage or workshop. This involved the application of a bituminous coating. The market for this service is no longer very large in much of Western Europe. It may still occur in Eastern Europe, in countries having cold climatic conditions and during the restoration and maintenance of vintage cars. This market is thus considered small. Where it is carried out emissions could be reduced by: using alternative non-solvent containing materials; carrying out the coating operation in a cabin with an extract system leading to abatement plant. Atmospheric emissions from the application of transport protective coverings can be eliminated by the use of non-solvent containing products such as self-adhesive plastic film. The major European car manufacturers are already changing over to this method and within a few years it is expected that all will have done so.
Country Detail Since the amount of underseal agent and/or solvent used for underseal treatment and conservation of vehicles is unknown, AD on the number of the population were used (see the Table 4-66 from the National Inventory Report: 1990-2016. Greenhouse Gas Sources and Sinks in the Republic of Moldova).
Equation(Describe variables for method used)
Indirect CO2 emissions were estimated based on the carbon content in NMVOC emissions. The default value used represents 60% per cent (2006 IPCC Guidelines for National Greenhouse Gas Inventories, Volume 3: Industrial Processes and Product Use, Chapter 5: Non-Energy Products from Fuels and Solvent Use, Chapter 5.5: Solvent Use, Section 5.5.4 ‘Uncertainty assessment’, Page 5.17). By oxidizing, this carbon converts into CO2 in atmosphere (it is assumed that all solvents are of fossil origin).In order to estimate indirect CO2 emissions, the following equation was used:
CO2 Emissions = NMVOC • CC • 44/12Where:
CO2 Emissions – carbon dioxide emissions from solvents used in underseal treatment and conservation of vehicles, kt/yr;NMVOC – total NMVOC emissions within the respective category, kt/yr;CC – carbon content in NMVOC;44/12 – stoichiometric ratio CO2/C.
Reference2006 IPCC Guidelines for National Greenhouse Gas Inventories, Volume 3: Industrial Processes and Product Use, Chapter 5: Non-Energy Products from Fuels and Solvent Use, Chapter 5.5: Solvent Use, Section 5.5.4 ‘Uncertainty assessment’, Page 5.17.National Inventory Report: 1990-2016. Greenhouse Gas Sources and Sinks in the Republic of Moldova (2018).
Describe How and Why this Method Was Chosen Due to the lower importance of this source and unavailability of all detailed data, the Tier 1 methodology has been used.
Type and source of activity data Since the amount of underseal agent and/or solvent used for underseal treatment and conservation of vehicles is unknown, AD on the number of the population were used (see the Table 4-66 from the National Inventory Report: 1990-2016. Greenhouse Gas Sources and Sinks in the Republic of Moldova).
Type and source of EF and OF CC – carbon content in NMVOC, fraction (the default value used represents 60 per cent, with a margin of 50-70 per cent; 2006 IPCC Guidelines for National Greenhouse Gas Inventories, Volume 3: Industrial Processes and Product Use, Chapter 5: Non-Energy Products from Fuels and Solvent Use, Chapter 5.5: Solvent Use, Section 5.5.4 ‘Uncertainty assessment’, Page 5.17).
Uncertainty of AD and source 5% - expert judgementUncertainty of EF and source 20% - expert judgementPotential Improvements No potential improvements are planned to be implemented in the next inventory cycle for source category 2.D.3.i ‘Other Solvent and Product Use’ (Underseal Treatment and Conservation of Vehicles).

Chapter 2: Methods and Data Documentation
2 - 138
Table 2.2.4.26: Information on Source Category 2D3i ‘Other Solvent and Product Use’ (Underseal Treatment and Conservation of Vehicles) – NMVOC Sector Industrial Processes and Product UseCategory 2D Non-Energy Products from Fuels and Solvents UseSource / Gas 2D3 Solvent Use / 2D3i Other Solvent and Product Use (Underseal Treatment and Conservation of Vehicles) / NMVOC Key Category? Not applicable for pollutant emissions.
Category Description / Defini-tion
This category addresses the application of protective coatings to the undersides of cars. This is only a very small source of emissions and can nowadays be considered negligible. The following description of the processes and controls is based on discussions with the Society of Motor Manufacturers and Traders (SMMT) (SMMT, 1997), the Association of European Automobile Manufacturers (ACEA) (ACEA, 1997) and Ford Europe (Ford Europe, 1997). The application of coatings to the underside of car bodies can be divided into the original equipment manufacture (OEM) sector and the aftermarket (repair) sector. For the OEM sector a coating of PVC plastisol (1) is applied during manufacture to the underneath of car bodies at the same time as the primer. The body is then heated in an oven at 135 °C for about five minutes to cure both the primer and the PVC coating. This coating is applied for protection from stone chips and for sound deadening. The PVC coating is 97% 99% solids and is an integral part of the vehicles coating 138package. Any emission during manufacture will be included in any estimate of the emission from painting during vehicle manufacture (SNAP 060101 Paint application: manufacture of automobiles, included in chapter 3.A, Paint application). In the aftermarket sector, coatings are applied to the underside of cars only during repair of damaged bodywork. This coating is the same type as in the OEM sector. These emissions will be included in car repairing (chapter 3.A, Paint application). Before the early 1980s, car manufacturers did not apply any coating to the underside of their cars. If a car owner wanted to protect their car against rust and stone chip damage, they had to pay to have their car ‘undersealed’ at a garage or workshop. This involved the application of a bituminous coating. The market for this service is no longer very large in much of Western Europe. It may still occur in Eastern Europe, in countries having cold climatic conditions and during the restoration and maintenance of vintage cars. This market is thus considered small. Where it is carried out emissions could be reduced by: using alternative non-solvent containing materials; carrying out the coating operation in a cabin with an extract system leading to abatement plant. Atmospheric emissions from the application of transport protective coverings can be eliminated by the use of non-solvent containing products such as self-adhesive plastic film. The major European car manufacturers are already changing over to this method and within a few years it is expected that all will have done so.
Country Detail Since the amount of underseal agent and/or solvent used for underseal treatment and conservation of vehicles is unknown, AD on the number of the population were used (see the Table 4-66 from the National Inventory Report: 1990-2016. Greenhouse Gas Sources and Sinks in the Republic of Moldova).
Equation(Describe variables for method used)
The Tier 2 approach for pollutant emissions from underseal treatment and conservation of vehicles uses the general equation (2) from the EMEP/EEA Air Pollution Emission Inventory Guidebook 2016, NFR 2.D.3.i ‘Other Solvent and Product Use’, section 3.3 ‘Tier 2 technology-specific approach’:
E pollutant = (AR use, technology • EF technology, pollutant) / 103
Where:E technology, pollutant – the emission of the technology and the specified pollutant, t/yr;AR use, technology – the activity rate for the use of solvents in underseal treatment and conservation of vehicles, t/yr;EF pollutant – the emission factor for this pollutant technology, kg/t.
ReferenceEEA (2016), EMEP/EEA Air Pollution Emission Inventory Guidebook 2016, Technical guidance to prepare national emission inventories. European Environment Agency, Technical report No 21/2016. Copen-hagen, Denmark (Available on: http://www.eea.europa.eu//publications/emep-eea-guidebook-2016).National Inventory Report: 1990-2016. Greenhouse Gas Sources and Sinks in the Republic of Moldova (2018).
Describe How and Why this Method Was Chosen A Tier 2 methodology has been used due to availability of technology-specific emission factors.
Type and source of activity data Since the amount of underseal agent and/or solvent used for underseal treatment and conservation of vehicles is unknown, AD on the number of the population were used (see the Table 4-66 from the National Inventory Report: 1990-2016. Greenhouse Gas Sources and Sinks in the Republic of Moldova).
Type and source of EF and OF
Tier 2 Default EFs for Estimating NMVOC Emissions from ‘Underseal Treatment and Conservation of Vehicles’Source Category NMVOC Emission Factors Unit
‘Underseal Treatment and Conservation of Vehicles’0.20 (0.01-0.20) kg/person636 (300-900) g/kg underseal agent
950 (900-1000) g/kg solvent Source: EMEP/EEA Atmospheric Emissions Inventory Guidebook (2016), Category 2.D.3.i ‘Other Solvent and Product Use’, SNAP 060407, Table 3-10, page 17.
Uncertainty of AD and source 5% - expert judgementUncertainty of EF and source See the 95% confidence interval in the table above (in the brackets, lower-upper).

Chapter 2: Methods and Data Documentation
2 - 139
Table 2.2.4.27: Information on Source Category 2D3i ‘Other Solvent and Product Use’ (Vehicles Dewaxing) – CO2Sector Industrial Processes and Product UseCategory 2D Non-Energy Products from Fuels and Solvents UseSource / Gas 2D3 Solvent Use / 2D3i Other Solvent and Product Use (Vehicles Dewaxing) / CO2
Key Category? NoCategory Description / Defini-tion
This category considers the removal from cars of temporary coverings that are applied to protect the car’s paint work during transport. This is only a very small source of emissions and nowadays can be considered negligible. The following description of the processes and controls is based on discussions with SMMT (SMMT, 1997), ACEA (ACEA, 1997) and Ford Europe (Ford Europe, 1997). Some new cars have a protective covering applied to their bodies after painting to provide protection during transport. In the UK, this is usually done only on cars destined for export. Removal of the coating is usually done only at import centers. Cars produced for the home market are not usually given a protective covering unless there is a specific reason, for example problems at their storage location. In continental Europe, cars are transported long distances on land as well as being imported from overseas, so the driving forces affecting the use of such coatings may be different. Transport protection coverings are not applied to the whole car body, but only to regions of the body considered vulnerable to damage during transport. The pattern of application varies from one manufacturer to another. Some manufacturers do only the bumper, some do only the drivers door, some do the horizontal surfaces and some do the sides as well. There are a number of methods for applying coverings for protection during transport. Traditionally, a hydrocarbon wax was used which had to be removed using a mixture of hot water, kerosene and detergent. Recently, two alternative methods have been introduced. The first of these is a water-soluble wax which can be removed with hot water alone without the need for the kerosene. The second is a self-adhesive polyethylene film called ‘Wrap Guard’. This can be peeled off by hand and disposed of as ordinary commercial waste. Most European car manufacturers are currently either already using self-adhesive polyethylene film or are evaluating it. It is expected that within a few years all European manufacturers will be using self-adhesive polyethylene film as their only method of applying transportation protective coverings, as has been the situation in the US for a number of years already. Consequently, it is recommended that the volatile organic compounds (VOC) emission from this source is assumed to be rapidly approaching zero.
Country Detail No vehicles are produced in the Republic of Moldova. Customs Service is a primary source of information on national import operations.Equation(Describe variables for method used)
Indirect CO2 emissions were estimated based on the carbon content in NMVOC emissions. The default value used represents 60% per cent (2006 IPCC Guidelines for National Greenhouse Gas Inventories, Volume 3: Industrial Processes and Product Use, Chapter 5: Non-Energy Products from Fuels and Solvent Use, Chapter 5.5: Solvent Use, Section 5.5.4 ‘Uncertainty assessment’, Page 5.17). By oxidizing, this carbon converts into CO2 in atmosphere (it is assumed that all solvents are of fossil origin).In order to estimate indirect CO2 emissions, the following equation was used:
CO2 Emissions = NMVOC • CC • 44/12Where:
CO2 Emissions – carbon dioxide emissions from solvents used in vehicles dewaxing, kt/yr;NMVOC – total NMVOC emissions within the respective category, kt/yr;CC – carbon content in NMVOC;44/12 – stoichiometric ratio CO2/C.
Reference 2006 IPCC Guidelines for National Greenhouse Gas Inventories, Volume 3: Industrial Processes and Product Use, Chapter 5: Non-Energy Products from Fuels and Solvent Use, Chapter 5.5: Solvent Use, Section 5.5.4 ‘Uncertainty assessment’, Page 5.17.National Inventory Report: 1990-2016. Greenhouse Gas Sources and Sinks in the Republic of Moldova (2018).
Describe How and Why this Method Was Chosen Due to the lower importance of this source and unavailability of all detailed data, the Tier 1 methodology has been used.
Type and source of activity data The AD on new cars import in the Republic of Moldova within 1990-2016 periods are reported in the Table 4-95 from the National Inventory Report: 1990-2016. Greenhouse Gas Sources and Sinks in the Republic of Moldova (2018). Information was provided by the Custom Service through the Official Letter No 28/07-1893 dated 23.02.2011, as a response to the request No. 03-07/175 dated 02.02.2011, from the MoEN; Official Letter No. 15-03-05 dated 24.01.2014, as a response to the request No. 320/2014-01-01 dated 03.01.2014, from the CCO of the MoEN; Official Letter No. 28/07-2231 dated 26.02.2015, as a response to the request No. 407/2015-01-09 dated 29.01. 2015, from the CCO of the MoEN; Official Letter No 28/07-8785 dated 26.05.2016, as a response to the request No. 512/2016-05-01 dated 10.05.2016, from the CCO of the MoEN; Official Letter No. 28/07-612 dated 12.01.2018, as a response to the request No. 601/2017-12-03 dated 14.12.2017, from the CCO of the MARDE.
Type and source of EF and OF CC – carbon content in NMVOC, fraction (the default value used represents 60 per cent, with a margin of 50-70 per cent; 2006 IPCC Guidelines for National Greenhouse Gas Inventories, Volume 3: Industrial Processes and Product Use, Chapter 5: Non-Energy Products from Fuels and Solvent Use, Chapter 5.5: Solvent Use, Section 5.5.4 ‘Uncertainty assessment’, Page 5.17).
Uncertainty of AD and source 5% - expert judgementUncertainty of EF and source 20% - expert judgementPotential Improvements No potential improvements are planned to be implemented in the next inventory cycle for source category 2.D.3.i ‘Other Solvent and Product Use’ (Vehicles Dewaxing).

Chapter 2: Methods and Data Documentation
2 - 140
Table 2.2.4.28: Information on Source Category 2D3i ‘Other Solvent and Product Use’ (Vehicles Dewaxing) – NMVOC Sector Industrial Processes and Product UseCategory 2D Non-Energy Products from Fuels and Solvents UseSource / Gas 2D3 Solvent Use / 2D3i Other Solvent and Product Use (Vehicles Dewaxing) / NMVOC Key Category? Not applicable for pollutant emissions.
Category Description / Defini-tion
This category considers the removal from cars of temporary coverings that are applied to protect the car’s paint work during transport. This is only a very small source of emissions and nowadays can be considered negligible. The following description of the processes and controls is based on discussions with SMMT (SMMT, 1997), ACEA (ACEA, 1997) and Ford Europe (Ford Europe, 1997). Some new cars have a protective covering applied to their bodies after painting to provide protection during transport. In the UK, this is usually done only on cars destined for export. Removal of the coating is usually done only at import centers. Cars produced for the home market are not usually given a protective covering unless there is a specific reason, for example problems at their storage location. In continental Europe, cars are transported long distances on land as well as being imported from overseas, so the driving forces affecting the use of such coatings may be different. Transport protection coverings are not applied to the whole car body, but only to regions of the body considered vulnerable to damage during transport. The pattern of application varies from one manufacturer to another. Some manufacturers do only the bumper, some do only the drivers door, some do the horizontal surfaces and some do the sides as well. There are a number of methods for applying coverings for protection during transport. Traditionally, a hydrocarbon wax was used which had to be removed using a mixture of hot water, kerosene and detergent. Recently, two alternative methods have been introduced. The first of these is a water-soluble wax which can be removed with hot water alone without the need for the kerosene. The second is a self-adhesive polyethylene film called ‘Wrap Guard’. This can be peeled off by hand and disposed of as ordinary commercial waste. Most European car manufacturers are currently either already using self-adhesive polyethylene film or are evaluating it. It is expected that within a few years all European manufacturers will be using self-adhesive polyethylene film as their only method of applying transportation protective coverings, as has been the situation in the US for a number of years already. Consequently, it is recommended that the volatile organic compounds (VOC) emission from this source is assumed to be rapidly approaching zero.
Country Detail No vehicles are produced in the Republic of Moldova. Customs Service is a primary source of information on national import operations.
Equation(Describe variables for method used)
The Tier 2 approach for pollutant emissions from vehicle dewaxing uses the general equation (2) from the EMEP/EEA Air Pollution Emission Inventory Guidebook 2016, NFR 2.D.3.i ‘Other Solvent and Product Use’, section 3.3 ‘Tier 2 technology-specific approach’:
E pollutant = (AR use, technology • EF technology, pollutant) / 103
Where:E technology, pollutant – the emission of the technology and the specified pollutant, t/yr;AR use, technology – the activity rate for the use of solvents in vehicles dewaxing, t/yr;EF pollutant – the emission factor for this pollutant technology, kg/t.
ReferenceEEA (2016), EMEP/EEA Air Pollution Emission Inventory Guidebook 2016, Technical guidance to prepare national emission inventories. European Environment Agency, Technical report No 21/2016. Copen-hagen, Denmark (Available on: http://www.eea.europa.eu//publications/emep-eea-guidebook-2016).National Inventory Report: 1990-2016. Greenhouse Gas Sources and Sinks in the Republic of Moldova (2018).
Describe How and Why this Method Was Chosen A Tier 2 methodology has been used due to availability of technology-specific emission factors.
Type and source of activity data
The AD on new cars import in the Republic of Moldova within 1990-2016 periods are reported in the Table 4-95 from the National Inventory Report: 1990-2016. Greenhouse Gas Sources and Sinks in the Republic of Moldova (2018). Information was provided by the Custom Service through the Official Letter No 28/07-1893 dated 23.02.2011, as a response to the request No. 03-07/175 dated 02.02.2011, from the MoEN; Official Letter No. 15-03-05 dated 24.01.2014, as a response to the request No. 320/2014-01-01 dated 03.01.2014, from the CCO of the MoEN; Official Letter No. 28/07-2231 dated 26.02.2015, as a response to the request No. 407/2015-01-09 dated 29.01.2015, from the CCO of the MoEN; Official Letter No 28/07-8785 dated 26.05.2016, as a response to the request No. 512/2016-05-01 dated 10.05.2016, from the CCO of the MoEN; Official Letter No. 28/07-612 dated 12.01.2018, as a response to the request No. 601/2017-12-03 dated 14.12.2017, from the CCO of the MARDE.
Type and source of EF and OF
Tier 2 Default Emission Factors for 2D3i ‘Vehicles Dewaxing’Source Category NMVOC Emission Factor Unit
Vehicles Dewaxing 1.0 (0.1-10) kg/vehicleSource: EMEP/EEA Atmospheric Emissions Inventory Guidebook (2016), Category 2.D.3.i ‘Other Solvent and Product Use’, SNAP 060409, Table 3-9, page 17.
Uncertainty of AD and source 5% - expert judgementUncertainty of EF and source See the 95% confidence interval in the table above (in the brackets, lower-upper).

Chapter 2: Methods and Data Documentation
2 - 141
Table 2.2.4.29: Information on Source Category 2D4 ‘Other’ (Use of Urea-Based Catalysts) – CO2Sector Industrial Processes and Product UseCategory 2D Non-Energy Products from Fuels and Solvents UseSource / Gas 2D4 Other (Use of Urea-Based Catalysts) / CO2
Key Category? NoCategory Description / Defini-tion This category includes CO2 emissions from the use of urea-based catalysts.
Country Detail Over the periods 1990 through 2016, the CO2 emissions from the use of urea-based catalysts decreased in the RM by circa 44.9 per cent to the decrease of diesel oil consumption.Equation(Describe variables for method used)
The methodology used to estimate CO2 emissions from use of urea-based catalysts, available in the 2006 IPCC Guidelines for National Greenhouse Gas Inventories (Volume 2: Energy, Chapter 3: Mobile Combustion, Chapter 3.2: Road Transportation, page 3.12), is represented by the following equation:
E = A • 12/60 • Purity • 44/12Where:
E – CO2 emissions from urea-based additive in catalytic converters, kt/yr;A – Amount of urea-based additive consumed for use in catalytic converters, kt/yr;12/60 – Stoichiometric ratio between carbon (C) and urea (CO(NH2)2;Purity – Mass fraction of urea in the urea-based additive (the default value used represents 32.5 per cent);44/12 – stoichiometric ratio between Carbon (C) and CO2.
Reference 2006 IPCC Guidelines for National Greenhouse Gas Inventories, Volume 2, Chapter 3: Mobile Combustion, Chapter 3.2: Road Transportation.National Inventory Report: 1990-2016. Greenhouse Gas Sources and Sinks in the Republic of Moldova (2018).
Describe How and Why this Method Was Chosen Due to the lower importance of this source and unavailability of all detailed data, the Tier 1 methodology has been used.
Type and source of activity data AD on the amount of urea-based additive used in catalytic converters are determined indirectly from national diesel oil consumption (on the average, the activity level is 1 to 3 per cent of diesel oil consumption by the vehicle). Activity data on diesel oil consumption are available in the EBs of the RM for 1990 and 1993-2015 periods (in 1991 and 1992 the EBs were not elaborated, but the information for the respective years was provided by the NBS through Official Letter No. 05-96-08 dated 10.03.1999, as a response to the request of the Ministry of Environment No. 01-7/138 dated 24.02.1999. The statistical information is available for the entire territory of the country only for 1990 and 1991, while for the rest of the period, it covers only the right bank of Dniester River. In order to generate data on diesel oil consumption on ATULBD, it was used information on specific consumption of diesel oil per capita for the territory to the right of Dniester, the number of the population in the ATULBD was multiplied by the specific consumption of diesel oil per capita (for 1990 and 1991 the information was representative for the entire country). The amount of urea-based additive in catalytic converters was determined indirectly based on the total consumption of diesel oil, considering that additive consumption represents 2 per cent of the total amount of diesel oil consumed in the RM.
Type and source of EF and OF The EF used to estimate CO2 emissions from use of urea-based catalysts, is available in the 2006 IPCC Guidebook (Volume 2, Chapter 3.2, page 3.12), the default value for the mass fraction of urea in the urea-based additive (purity) was accepted to be 32.5 per cent.
Uncertainty of AD and source 20% - expert judgementUncertainty of EF and source 2% - expert judgementPotential Improvements No potential improvements are planned to be implemented in the next inventory cycle for source category 2D4 Other (Use of Urea-Based Catalysts).
2.2.5. Category 2F ‘Product Uses as Substitutes for ODS’Tables 2.2.5.1 – 2.2.5.3 below comprise relevant information on source categories comprised within the inventory, including description of each source by gas allocated to category 2F ‘Product Uses as Substitutes for ODS’.Table 2.2.5.1: Information on Source Category 2F1 ‘Refrigeration and Air Conditioning’ – HFCs Sector Industrial Processes and Product UseCategory 2F Product Use as Substitutes for ODSSource / Gas 2F1 Refrigeration and Air Conditioning / HFCsKey Category? Tier 1: Yes: 2016 (T); Tier 2: Yes: 2016 (T)

Chapter 2: Methods and Data Documentation
2 - 142
Category Description / Defini-tion
Refrigeration and air-conditioning (RAC) systems may be classified in up to six sub-application domains. These categories correspond to sub-applications that may differ by location and purpose, and are listed below:
(i) Domestic (i.e., household) refrigeration, (ii) Commercial refrigeration including different types of equipment, from vending machines to centralized refrigeration systems in supermarkets, (iii) Industrial processes including chillers, cold storage, and industrial heat pumps used in the food, petrochemical and other industries, (iv) Transport refrigeration including equipment and systems used in refrigerated trucks, containers, reefers, and wagons, (v) Stationary air conditioning including air-to-air systems, heat pumps, and chillers for building and residential applications, (vi) Mobile air-conditioning systems used in passenger cars, truck cabins, buses, and trains.
Country Detail
The gases have been used in the pure form and most often in the following blends: R-404a, R-406a, R-407a, R-407b, R-407c, R-407d, R-407f, R-408a, R-410a, R-422d and R-507a. For the purpose of the GHG inventory all blends have been transformed to the pure F-gases using the Table 7.8 ‘Blends (many containing HFCs and/or PFCs)’ from 2006 IPCC Guidelines for National Greenhouse Gas Inventories, Volume 3, Chapter 7 ‘Emissions of fluorinated substitutes for ozone depleting substances’, Section 7.5 ‘Refrigeration and air conditioning’, Page 7.44. As 1995 is the base year for HFC emissions no data have been collected for the years before. The emission sources, the time period and the gases included in the GHG inventory are presented below:
• domestic refrigeration: − refrigerators: since 1997-present – HFC-134a; − freezers: since 1997-present – HFC-134a; R-404a; since 2003-present – R-507c;
• commercial refrigeration: 1997-present – HFC-134a, R-404a, R-507a; since 2003-present – R-407c; since 1997-to 2004 – R-408a; since 2005-present – R-290;• industrial refrigeration: 1997-present – HFC-134a, R-404a; since 2005-present – R-407c, R-507a;• transport refrigeration: 1995-present – R-404a;• stationary air conditioning: since 1997-present – R-410a; since 2003-present – R-407c;• mobile air conditioning: since 1995-present – HFC-134a.
The process of collecting activity data on consumption of alternative substances to chlorofluorocarbons is extremely difficult in the Republic of Moldova. The primary difficulty is due to the fact that import, export, re-export and circulation of these substances on the market is not regulated at the national level (like, for example, the ODS starting with 01.01.2013). Import of substitutes for ODS in bulk, as well as products and equipment charged with halocarbons does not require a license and/or environmental authorization, being allowed to practically any legal entity or individual. Secondly, there are difficulties in monitoring the import of disaggregated HFCs by type of substance, as ODS and its alternatives are aggregated in the Nomenclature of Goods of the RM in several tariff positions (2903 79 110 – 2903 79 190; 3824 71 000; 3824 74 000 and 3824 78 000). Another difficulty is that halocarbons may be imported both in “standard” packaging of 10-15 kg, and in small containers (300-500 g), which can be imported practically by any individual. In these circumstances, HFCs emissions from the source category 2F1 Refrigeration and Air Conditioning were estimated based on assessment methodologies available in 2006 IPCC Guidelines, considering data on import and consumption of halocarbons provided by the economic agents, including through the Annual Reports submitted by enterprises to the Ozone Office (to be noted that between 2003-2015, only a limited number of enterprises were licensed to import, export, re-export, transit and placing ODS and equipment containing ODS on the market: ‘Frigoinds’ Ltd., ‘Ecolux’ Ltd, ‘Frio-Dins’ Ltd, ‘York Regrigerent’ Ltd, ”Dina Cociug” Ltd.). In addition, were also used the Generalized Reports on the production, consumption, import/export of ozone-depleting substances regulated by the Montreal Protocol in the RM between 2001 and 2008 ac-cording to the Statistical Report No. 1-Ozone, provided by the NBS (from 2009 through 2016 the responsibility for collecting statistical information according to the Statistical Report No. 1-Ozone was kept by the Inspectorate for Environmental Protection, but due to lack of capacities, this information was not collected). It should be noted that the Republic of Moldova does not produce HFCs, and before 1995 these substances had a relatively narrow use, being imported in insignificant amounts.
Equation(Describe variables for method used)
Greenhouse gas emissions generated from consumption of halocarbons in this category were estimated using the Tier 2a approach (2006 IPCC Guidelines for National Greenhouse Gas Inventories, Volume 3, Chapter 7.5, Equation 7.10, page 7.49).
E total, t = E containers, t + E charge, t + E lifetime, t + E end-of-life, tWhere:
E containers, t – emissions related to the refrigerant container management;E charge, t – emissions related to the charging process of refrigerant: connecting and disconnecting the refrigerant container to and from the equipment when it is initially charged;E lifetime, t – annual leakage from the refrigerant bank during lifetime (operation and servicing);E end-of-life, t – emissions at end-of-life, at system disposal.
The assessment process involves several steps, using the following equations. Step 1: Management of refrigerant containersThe emissions related to the refrigerant container management comprises all the emissions related to the refrigerant transfer from bulk containers (typically 40 tones) down to small capacities where the mass varies from 0.5 kg to 1 ton. The emissions are estimated using Equation 7.11 from the IPCC 2006 Guidelines (Volume 3, Chapter 7.5, page 7.49).

Chapter 2: Methods and Data Documentation
2 - 143
Equation(Describe variables for method used)
E containers, t = RM t • (c / 100) Where:
RM t – HFC market for new equipment and servicing of all refrigeration application in year t, kg;c – EF of HFC container management of the current refrigerant market, % (varies between 2 and 10 per cent of the refrigerant market; on average, circa 6 per cent).
Step 2: Refrigerant charge emissions of new equipmentThe emissions of refrigerant due to the charging process of new equipment are related to the process of connecting and disconnecting the refrigerant container to and from the equipment when it is initially charged. The respective emissions are estimated using Equation 7.12 from the 2006 IPCC Guidelines (Volume 3, Chapter 7.5, page 7.50).
Equation(Describe variables for method used)
E charge, t = M t • (k / 100) Where:
M t – amount of HFC charged into the new equipment in year t per sub-application (including those that are produced for export) kg; to be noted, systems that are imported pre-charged are not been taking into consideration;k – emission factor of assembly losses of the HFC charged into new equipment (per sub-application), % (varies from 0.1 to 3 per cent).
Step 3: Emissions during lifetime (operation and servicing) Annual leakage from the refrigerant bank during lifetime represent fugitive emissions and are estimated using Equation 7.13 from the 2006 IPCC Guidelines (Volume 3, Chapter 7.5, page. 7.50).
E lifetime, t = B t • (x / 100) Where:
B t – amount of HFC banked in existing systems in year t (per sub-application), kg;x – annual emission rate (i.e., emission factor) of HFC of each sub-application bank during operation, accounting for average annual leakage and average annual emissions during servicing, %.
Step 4: Emissions at end-of-life Emissions at system disposal are estimated using Equation 7.14 from the 2006 IPCC Guidelines (Volume 3, Chapter 7.5, page 7.51).
E end-of-life, t = M t-d • (p / 100) • (1 – η rec,d / 100) Where:
M t-d – amount of HFC emitted at system disposal in year t, kg;p – residual charge of HFC in equipment being disposed of expressed in percentage of full charge, %;η rec,d – recovery efficiency at disposal, which is the ratio of recovered HFC referred to the HFC contained in the system, %.
Reference2006 IPCC Guidelines for National Greenhouse Gas Inventories, Volume 3, Chapter 7 ‘Emissions of fluorinated substitutes for ozone depleting substances’, Section 7.5 ‘Refrigeration and air conditioning’, Pages 7.43-7.71. National Inventory Report: 1990-2016. Greenhouse Gas Sources and Sinks in the Republic of Moldova (2018).
Describe How and Why this Method Was Chosen Due to the increase use of F-gases, Tier 2a methodology have been used.
Type and source of activity data
AD used to estimate HFC emissions from consumption of hydrofluorocarbons charged into refrigeration and air conditioning equipment were provided by the Customs Service of the RM through the Official Letter No. 28/07-1893 dated 23.02.2011, as a response to the request from the MoEN No. 03-07/175 dated 02.02.2011; Official Letter No 15-03-05 dated 24.01.2014, as a response to the request from the CCO of the MoEN No. 320/2014-01-01 dated 03.01.2014; Official Letter No. 28/07-2231 dated 26.02.2015, as a response to the request from the CCO of the MoEN No. 407/2015-01-09 dated 29.01.2015; Official Letter No. 28/07-8785 dated 26.05.2016, as a response to the request from the CCO of the MoEN No. 512/2016-05-01 dated 10.05.2016; Official Letter No. 28/07-612 dated 12.01.2018, as a response to the request from the CCO of the MARDE No. 601/2017-12-03 dated 14.12.2017. The share of refrigerants charged into the refrigeration and air conditioning equipment in the Republic of Moldova within 1995-2016 was provided by the Republican Association of Refrigeration Technicians of the Republic of Moldova. The AD used to estimate HFC emissions from consumption of hydrofluorocarbons charged into mobile air-conditioning equipment were provided by the NBS of the RM (through the Statistical Yearbooks of the RM before 2000, respectively through the Bank for Statistical Data after 2000), as well as by the State Enterprise “State Information Resources Centre “Register” (SE “CRIS “Register”) (for 1995-2013 time series), respectively by the Public Services Agency of the RM (for 2014-2016 years) based on the information included in the State Transport Register. Activity data on the total amount of freons imported in the country were provided also through the annual reports submitted by the companies ‘Frigoinds’ Ltd., ‘Ecolux’ Ltd, ‘Frio-Dins’ Ltd, ‘York Regrigerent’ Ltd, ‘Dina Cociug’ Ltd to the Ozone Office and Climate Change Office of the Ministry of Agriculture, Regional Development and Environment. In addition, were also used the Generalized Reports on the production, consumption, import/export of ozone-depleting substances regulated by the Montreal Protocol in the RM between 2001 and 2008 according to the Statistical Report No. 1-Ozone, provided by the NBS (from 2009 through 2016 the responsibility for collecting statistical information according to the Statistical Report No. 1-Ozone was kept by the Inspectorate for Environmental Protection, but due to lack of capacities, this information was not collected). It should be noted that the Republic of Moldova does not produce HFCs, and before 1995 these substances had a relatively narrow use, being imported in insignificant amounts.

Chapter 2: Methods and Data Documentation
2 - 144
Type and source of EF and OF
EFs and Parameters Used to Estimate HFC Emissions from Refrigeration and Air Conditioning Equipment Imported in the Republic of Moldova
Equipment Type (sub-application) Charge, kg(marge and value used)
Lifetime, years (marge and value
used)
EF,% of the initial charge/ year End-of-Life Emissions (%)
Initial Emissions Lifetime Emissions Recovery efficiency Residual chargeFactors in equations (M) (d) (k) (x) (η rec, d) (p)
Domestic refrigeration 0.05 ≤ M ≤ 0.50.10
12 ≤ d ≤ 2016
0.2 ≤ k ≤ 10.6
0.1 ≤ x ≤ 0.50.5
0 < η rec, d < 700
0 < p < 8050
Chest freezers 0.05 ≤ M ≤ 0.50.20
12 ≤ d ≤ 2016
0.2 ≤ k ≤ 10.6
0.1 ≤ x ≤ 0.50.5
0 < η rec, d < 700
0 < p < 8050
Upright freezers 0.05 ≤ M ≤ 0.50.18
12 ≤ d ≤ 2016
0.2 ≤ k ≤ 10.6
0.1 ≤ x ≤ 0.50.5
0 < η rec, d < 700
0 < p < 8050
Stand-alone commercial application 0.2 ≤ M ≤ 60.4
10 ≤ d ≤ 1512
0.5 ≤ k ≤ 31.5
1 ≤ x ≤ 1516.8
0 < η rec, d < 7030
0 < p < 8050
Medium commercial refrigeration 3 ≤ M ≤ 306
10 ≤ d ≤ 1512
0.5 ≤ k ≤ 31.5
1 ≤ x ≤ 1516.8
0 < η rec, d < 7030
0 < p < 8050
Large commercial refrigeration 100 ≤ M ≤ 200150
10 ≤ d ≤ 1512
0.5 ≤ k ≤ 31.5
1 ≤ x ≤ 1516.8
0 < η rec, d < 7050
0 < p < 8050
Industrial refrigeration 10 ≤ M ≤ 10000150
15 ≤ d ≤ 3020
0.5 ≤ k ≤ 31.5
7 ≤ x ≤ 2516
0 < η rec, d < 9050
50 < p < 10075
Residential and Commercial A/C, including Heat Pumps
0.5 ≤ M ≤ 1000.6
10 ≤ d ≤ 2012
0.2 ≤ k ≤ 10.6
1 ≤ x ≤ 105
0 < η rec, d < 800
0 < p < 8050
Mobile A/C – personal cars 0.4 ≤ M ≤ 0.80.6
9 ≤ d ≤ 1616
0.2 ≤ k ≤ 0.50.5
10 ≤ x ≤ 2015
0 < η rec, d < 500
0 < p < 5050
Mobile A/C – buses, trains, passenger wagons 10 ≤ M ≤ 2012
9 ≤ d ≤ 1612
0.2 ≤ k ≤ 0.50.5
10 ≤ x ≤ 2015
0 < η rec, d < 5030
0 < p < 5050
Mobile A/C – minibuses 0.5 ≤ M ≤ 1.51.2
9 ≤ d ≤ 1612
0.2 ≤ k ≤ 0.50.5
10 ≤ x ≤ 2015
0 < η rec, d < 5030
0 < p < 5050
Mobile A/C – trucks 0.5 ≤ M ≤ 1.51
9 ≤ d ≤ 1612
0.2 ≤ k ≤ 0.50.5
10 ≤ x ≤ 2015
0 < η rec, d < 5030
0 < p < 5050
Refrigeration vehicles 3 ≤ M ≤ 87
6 ≤ d ≤ 99
0.2 ≤ k ≤ 10.6
15 ≤ x ≤ 5030
0 < η rec, d < 7030
0 < p < 5050
Source: 2006 IPCC Guidelines, Volume 3, Chapter 7.5, Table 7.9, page 7.52. Republican Association of Refrigeration Technicians of the Republic of Moldova and Annual Reports submitted by companies to the Ozone Office of the Ministry of Agriculture, Regional Development and Environment.
Uncertainty of AD and source 20% - expert judgementUncertainty of EF and source 50% - expert judgement
Potential ImprovementsPotential improvements could include capacity building activities by setting up an on-line information system for collecting AD from companies that import, use, dispose, recover and recycle freons and refriger-ant equipment. This information system will provide the Ozone Office and Climate Change Office more accurate AD that could potentially help reduce uncertainties in estimating GHG emissions from the 2F1 ‘Refrigeration and Air Conditioning Equipment’ source category in the Republic of Moldova.
Table 2.2.5.2: Information on Source Category 2F2 ‘Foam Blowing Agents’ Sector Industrial Processes and Product UseCategory 2F Product Use as Substitutes for ODS

Chapter 2: Methods and Data Documentation
2 - 145
Source / Gas 2F2 Foam Blowing Agents / HFCsKey Category? Tier 1: Yes: 2016 (L, T); Tier 2: Yes: 2016 (L, T)
Category Description / Defini-tion
Increasingly, HFCs are being used as replacements for CFCs and HCFCs in foams and particularly in insulation applications. Compounds that are being used include HFC-245fa, HFC-365mfc, HFC-227ea, HFC-134a, and HFC-152a. The division of foams into open-cell or closed-cell relates to the way in which blowing agent is lost from the products. For open-cell foam, emissions of HFCs used as blowing agents are likely to occur during the manufacturing process and shortly thereafter. In closed-cell foam, only a minority of emissions occur during the manufacturing phase. Emissions therefore extend into the in-use phase, with often the majority of emission not occurring until end-of-life (de-commissioning losses). Accordingly, emissions from closed cell foams can occur over a period of 50 years or even longer from the date of manufacture. Open-celled foams are used for applications such as household furniture cushioning, mattresses, automotive seating and for molded products such as car steering wheels and office furniture. Closed-cell foams, on the other hand, are primarily used for insulating applications where the gaseous thermal conductivity of the chosen blowing agent (lower than air) is used to contribute to the insulating performance of the product throughout its lifetime.
Country Detail In the Republic of Moldova, foams are produced since 2005. It is unknown which blowing agents are used in the production of foam blowing products, but since the production is relatively recent, also as since 2007, the use of F-gases for polyurethane OCF has been prohibited by the EU legislation, it was considered that the polystyrene in primary forms are ethanol and CO2 based, while the polyurethane in primary forms are based on pentane (C,I,N). Foams produced as well as imported ones are mostly closed cell foams (the emissions from these last longer, for about 20 years).
Equation(Describe variables for method used)
HFC emissions from foam blowing consumption (in particular closed cell foams) used in insulation, cushioning and packaging with blowing agents such as HFC-245fa, HFC-365mfc, HFC-134a and HFC-152a, were estimated using the Tier 2a approach. The IPCC 2006 Guidelines suggests that HFC emissions from closed cell foams should be calculated separately from open-celled foams. For open-celled foams, HFCs used as blowing agents are likely to occur during the manufacturing process and shortly thereafter. Since no open-cell foams are produced in the RM, respectively no emissions are recorded from this category. Emissions from closed-cell foam occur at three distinct points:
1) First year losses from foam manufacture and installation, these emissions occur where the product is manufactured; 2) Annual losses (in situ losses from foam use); closed-cell foam will lose a fraction of their initial charge each year until decommissioning; 3) Decommissioning losses: emissions upon decommissioning also occur where the product is used.
Emissions from closed cell foam were estimated following Equation 7.7 from the 2006 IPCC Guidelines (Volume 3, Chapter 7.4, page 7.33).Emissions t = M t • EF FYL + Bank • EF AL + DL t – RD t
Where:Emissions t – emissions from closed-cell foam in year t, tones;M t – total HFC used in manufacturing new closed-cell foam in t, tones;EF FYL – first year loss emission factor, fraction (%);Bank t – HFC charge blown into closed-cell foam manufacturing between year t and year t-n, tones;EF AL – annual loss emission factor, fraction (%);DL t – decommissioning losses in year t = remaining losses of chemical at the end of service life that occur when the product/equipment is scrapped, calculated from the amount of remaining chemical and the end-of-life loss factor which depends on the type of end-of-life treatment adopted, tones;RD t – HFC emissions prevented by recovery and destruction of foams and their blowing agents in year t, tones;n – product lifetime of closed-cell foam;t – current year;(t-n) – the total period over which HFCs used in foams could still be present.
This equation should be applied to each chemical and major foam application individually. Total emissions expressed in CO2 equivalent are equal to the sum of CO2 equivalent emissions of each combination of chemical type and foam application.
Reference2006 IPCC Guidelines for National Greenhouse Gas Inventories, Volume 3, Chapter 7 ‘Emissions of fluorinated substitutes for ozone depleting substances’, Section 7.4 ‘Foam Blowing Agents’, Pages 7.32-7.42. National Inventory Report: 1990-2016. Greenhouse Gas Sources and Sinks in the Republic of Moldova (2018).
Describe How and Why this Method Was Chosen Due to the prohibited HFCs use in foam blowing only emissions from use have been estimated with the Tier 2a approach.

Chapter 2: Methods and Data Documentation
2 - 146
Type and source of activity data
The AD on imported foam blowing products in the country are provided by the Customs Service of the Republic of Moldova through the Official Letter No. 28/07-1893 dated 23.02.2011, as a response to the request from the MoEN No. 03-07/175 dated 02.02.2011; Official Letter No 15-03-05 dated 24.01.2014, as a response to the request from the CCO of the MoEN No. 320/2014-01-01 dated 03.01.2014; Official Letter No. 28/07-2231 dated 26.02.2015, as a response to the request from the CCO of the MoEN No. 407/2015-01-09 dated 29.01.2015; Official Letter No. 28/07-8785 dated 26.05.2016, as a response to the request from the CCO of the MoEN No. 512/2016-05-01 dated 10.05.2016; Official Letter No. 28/07-612 dated 12.01.2018, as a response to the request from the CCO of the MARDE No. 601/2017-12-03 dated 14.12.2017.The most frequently used blowing agents in polyurethane and polystyrene foam manufacturing can be considered HFC-134a, HFC-152a, HFC-245fa, HFC-365mfc, Pentane (C,I,N) and CO2/ethanol. Since the share of blowing agents in foam products in total imports is unknown, it has been decided to determine it considering the expert opinions, taking into consideration, the European and international experience regarding HFC emissions inventory process within the respective category, as well as, the last years trend among the producers of foam blowing products to decrease the use of HFC as blowing agents, fol-lowing the international commitments to phasing out F-gas consumption, especially when there already are competitive alternative technologies on the foam blowing market3,4. The volume of blowing agents in foam products imported in the RM was identified based on the information available in the literature in the field, with the assumption that for the polyurethane products HCFC-22, HCFC-141b and HFC-134a have a volume of circa 6 per cent of the total5, HFC-365mfc – 9 per cent, HFC-254fa – 10 per cent, and Pentane (C,I,N) – 7.5 per cent25; as for the polystyrene products HFC-134a has a volume of circa 13 per cent of the total, HFC-152a – 8 per cent, HCFC-22 and HFCF-142b – 12 per cent, and CO2 + ethanol – 6 per cent of the total6.
Type and source of EF and OF
If country specific data are not available, default emission factors can be used. Default EFs for 2F2 ‘Foam Blowing Agents’
Emission Factor Default ValuesProduct Lifetime n = 20 yearsFirst Year Losses 10% of the original HFC charge/yearAnnual Losses 4.5% of the original HFC charge/year
Source: 2006 IPCC Guidelines, Volume 3, Chapter 7.4, Table 7.5, page 7.35.Uncertainty of AD and source 30% - expert judgementUncertainty of EF and source 30% - expert judgementPotential Improvements No potential improvements are planned to be implemented in the next inventory cycle for source category 2F2 ‘Foam Blowing Agents’.
Table 2.2.5.3: Information on Source Category 2F4 ‘Aerosols’ (Metered Dose Aerosols) – HFCs 3456
Sector Industrial Processes and Product UseCategory 2F Product Use as Substitutes for ODSSource / Gas 2F4 Aerosols (Metered Dose Aerosols) / HFCsKey Category? No
Category Description / Defini-tion
Most aerosol packages contain hydrocarbon (HC) as propellants but, in a small fraction of the total, HFCs and PFCs may be used as propellants or solvents. Emissions from aerosols usually occur shortly after production, on average six months after sale. However, the period between manufacture and sale could vary significantly depending on the sub application involved. During the use of aerosols, 100 percent of the chemical is emitted. The 5 main sub-applications are as follows:
(i) Metered Dose Inhalers (MDIs); (ii) Personal Care Products (e.g., hair care, deodorant, shaving cream); (iii) Household Products (e.g., air-fresheners, oven and fabric cleaners); (iv) Industrial Products (e.g., special cleaning sprays such as those for operating electrical contact, lubricants, pipe-freezers); (v) Other General Products (e.g., silly string, tire inflators, klaxons).
Country Detail The Republic of Moldova began to use HFC-134a in the MDI in 2003 as replacement for the CFCs. No other uses of HFCs in aerosols is evidenced.
3 Natural Foam Blowing Agents, Sustainable Ozone- and Climate-Friendly Alternatives to HCFCs (2012), PROKLIMA International Programme of the Deutsche Gesellschaft für Internationale Zusammenarbeit (GIZ) GmbH, commissioned by the Federal Ministry for Economic Cooperation and Development (BMZ) Environment and Sustainable Use of Natural Resources Division. Eschborn, September 2012. P.1784 Danish Ministry of the Environment, Environment Protection Agency (2010), Greenhouse Gases HFCs, PFCs and SF6, Danish Consumption and Emissions, 2008, Environmental Project No. 1323 2010, <http://www2.mst.dk/udgiv/publications/2010/978-87-92617-66-8/pdf/978-87-92617-67-5.pdf>.5 EMEP/EEA Emission Inventory Guidebook 2009, Category 3.C‚ Chemical products’, 3.3.2.2 ’Polyurethane foam processing’ and Chapter 3.3.2.3 ’Polystyrene processing’, page 17.6 Natural Foam Blowing Agents, Sustainable Ozone- and Climate-Friendly Alternatives to HCFCs (2012), PROKLIMA International Programme of the Deutsche Gesellschaft für Internationale Zusammenarbeit (GIZ) GmbH, commissioned by the Federal Ministry for Economic Cooperation and Development (BMZ) Environment and Sustainable Use of Natural Resources Division. Eschborn, September 2012. P.178.

Chapter 2: Methods and Data Documentation
2 - 147
Equation(Describe variables for method used)
HFC emissions from consumption of aerosol (in particular – metered dose aerosols, where HFC-134a is used as propellant) were estimated using the Tier 2a approach. It is considered that during the use of aerosols, 100 per cent of the chemical is emitted into the atmosphere. The respective emissions occur within 1-2 years after sales and should be estimated using the Equation 7.6 from the 2006 IPCC Guidelines (Volume 3, Chapter 7.3 ‘Aerosols’ (Propellants and Solvents), page 7.28).
Emissions t = St • EF + S t-1 • (1 – EF)Where:
Emissions t – emissions in year t, tones;St – quantity of HFC and PFC contained in aerosol products sold in year t, tones;EF – emission factor = fraction of chemical emitted during the first year, fraction (%);S t-1– quantity of HFC and PFC contained in aerosol products sold in year t-1, tones.
Reference2006 IPCC Guidelines for National Greenhouse Gas Inventories, Volume 3, Chapter 7 ‘Emissions of fluorinated substitutes for ozone depleting substances’, Section 7.3 ‘Aerosols’ (Propellants and Solvents), Pages 7.28-7.31. National Inventory Report: 1990-2016. Greenhouse Gas Sources and Sinks in the Republic of Moldova (2018).
Describe How and Why this Method Was Chosen Due to availability of sub-application level information, the Tier 2a approach have been used.
Type and source of activity data
The activity data on the amount of medical substances imported in the Republic of Moldova (metered dose inhalers used in asthma and chronicle pulmonary diseases treatment, including tuberculosis) were provided for 2003-2015 periods by the former Ministry of Health through the Official Letter No. 019/550 from 1 March 2011, as a response to the request from the MoEN No. 03-07/175 dated 02.02.2011, re-garding the period 2003-2010; Official Letter No. 019/2045, dated September 14, 2011, as a response to the request from the MoEN No. 05-07/1321 dated 05.08.2011, regarding the period 2005-2010; Official Letter No. 01-9/220, dated 05.02.2014 as a response to the request from the CCO of the MoEN No. 320/2014-01-01 dated 03.01.2014, regarding the period 2011-2012; Official Letter No. 01-10/315, dated 04.03.2015, as a response to the request from the CCO of the MoEN No. 407/2015-01-09 dated 29.01.2015, regarding the period 2013-2014; Official Letter No. 01-10/483, dated 30.05.2016, as a response to the request from the CCO of the MoEN No. 512/2016-05-01 dated 10.05.2016, regarding 2015 year; as well as by the Agency for Medicines and Medical Devices through the Official Letter No. A07.PS01.Rg02-359, dated 26.01.2018, as a response to the request from the CCO of the MARDE No. 612/2018-01-02 dated 10.01.2018, regarding 2016 year.
Type and source of EF and OF It is considered that during the use of aerosols, 100 per cent of the chemical is emitted into the atmosphere. The respective emissions occur within 1-2 years after sales.Uncertainty of AD and source 5% - expert judgementUncertainty of EF and source 5% - expert judgementPotential Improvements No potential improvements are planned to be implemented in the next inventory cycle for source category 2F4 ‘Aerosols’ (Metered Dose Aerosols).
2.2.6. Category 2G ‘Other Product Manufacture and Use’
Tables 2.2.6.1 – 2.2.6.6 below comprise relevant information on source categories comprised within the inventory, including description of each source by gas allocated to category 2G ‘Other Product Manufacture and Use’.
Table 2.2.6.1: Information on Source Category 2G1 ‘Electrical Equipment’ – SF6 and PFCsSector Industrial Processes and Product UseCategory 2G Other Product Manufacture and UseSource / Gas 2G1 Electrical Equipment / SF6 and PFCsKey Category? No
Category Description / Defini-tion
Sulphur hexafluoride (SF6) and PFCs are used for electrical insulation and current interruption in equipment used in the transmission and distribution of electricity. Emissions occur at each phase of the equip-ment life cycle, including manufacturing, installation, use, servicing, and disposal. Most of the SF6 and PFCs used in electrical equipment is used in gas insulated switchgear and substations (GIS) and in gas circuit breakers (GCB), though some SF6 is used in high voltage gas-insulated lines (GIL), outdoor gas-insulated instrument transformers and other equipment. The emissions from this category depend not only on the installed (banked) or consumed quantities of SF6, but also very much on the tightness of the products and the handling processes applied.
Country Detail
SF6 insulated switchgear and circuit breakers were first used in the Republic of Moldova in 2003, while PFCs in 2006. A general increasing trend can be observed, and particularly since 2006, the use of equip-ment with SF6 as insulating gas has increased strongly. This type of equipment is not produced in the Republic of Moldova and there is no export of SF6 and PFCs in equipment. Thus, starting with 2003, the Moldavian companies initiated the use of medium-tension electrical circuit breakers (10 and 35 kV) and high-tension electrical circuit breakers (110 kV, 330 kV and 400 V), the SF6 charge in each case varying between 0.95 and 45.0 kg. In conformity with the manufacturer’s technical log, the first repairs shall take place after 35 years of operation.

Chapter 2: Methods and Data Documentation
2 - 148
Emissions from use of sulphur hexafluoride and PFCs as insulation medium in high and medium tension electrical circuit breakers were estimated based on Tier 1 estimation methodology (2006 IPCC Guide-lines, Volume 3, Chapter 8.1, Equation 8.1, page 8.8).
Total Emissions = M • EF + EI • EF + EU • EF + ED • EFWhere:
Total Emissions – emissions from use of SF6 and PFCs as insulation medium in high and medium tension electrical circuit breakers, tones;M – manufacturing emissions, tones;EF – manufacturing EF, fraction SF6 and PFCs consumption by manufacturers; default emission factors: 7 per cent for sealed pressure electrical equipment (MV switchgear) containing SF6 (2006 IPCC Guidelines, Volume 3, Chapter 8.1, Table 8.2, page 8.15) and 8.5 per cent for closed pressure electrical equipment (HV switchgear) containing SF6 (2006 IPCC Guidelines, Volume 3, Chapter 8.1, Table 8.3, page 8.16);.
Equation(Describe variables for method used)
EI – installation emissions, tones;EF – installation EF, total nameplate capacity of new equipment filled on site;EU – equipment use emissions, tones;EF – equipment use EF; total nameplate capacity of installed equipment (includes emissions due to leakage, servicing, and maintenance as well as failures); default emission factors: 0.2 per cent for sealed pressure electrical equipment (MV switchgear) containing SF6 (2006 IPCC Guidelines, Volume 3, Chapter 8.1, Table 8.2, page 8.15) and 2.6 per cent for closed pressure electrical equipment (HV switchgear) containing SF6 (2006 IPCC Guidelines, Volume 3, Chapter 8.1, Table 8.3, page 8.16);ED– equipment disposal emissions, tones;EF – equipment disposal EF; total nameplate capacity of retiring equipment, fraction of SF6 and PFC remaining at retirement (the life expectancy of the equipment in European countries is over 35 years); default emission factors: 93 per cent for sealed pressure electrical equipment (MV switchgear) containing SF6 (2006 IPCC Guidelines, Volume 3, Chapter 8.1, Table 8.2, page 8.15) and 95 per cent for closed pressure electrical equipment (HV switchgear) containing SF6 (2006 IPCC Guidelines, Volume 3, Chapter 8.1, Table 8.3, page 8.16).
Reference 2006 IPCC Guidelines for National Greenhouse Gas Inventories, Volume 3, Chapter 8 ‘Other product manufacture and use’, Section 8.2 ‘Emissions of SF6 and PFCs from electrical equipment’, Pages 8.6-8.22. National Inventory Report: 1990-2016. Greenhouse Gas Sources and Sinks in the Republic of Moldova (2018).
Describe How and Why this Method Was Chosen Due to the lower importance of this emission source and unavailability of country specific emission factors, the Tier 1 methodology has been used.
Type and source of activity data
The dynamic of high-tension electrical circuit breakers installation process, as well as the number of available units in bulk at the end of calendar year is provided in Table 4-161, respectively in Tables 4-162 and 4-163 of the National Inventory Report: 1990-2016. Greenhouse Gas Sources and Sinks in the Republic of Moldova (2018). Information was provided by Red Union Fenosa J.S.C. through the Official Letter No. 0201/65392 dated 15.08.2011, as a response to the request from the MoEN No. 03-07/1337 dated 08.08.2011, regarding the period 2005-2010; Official Letter from 13.01.2014, as a response to the request from the CCO, MoEN No. 320/2014-01-01 dated 03.01.2014, regarding the period 2011-2012; Official Letter dated 10.05.2016, as a response to the request from the CCO No. 512/2016-05-09 dated 10.05.2016, re-garding 2015; Official Letter dated 23.01.2018, as a response to the request from the CCO No. 601/2017-12-03 dated 14.12.2017, regarding 2016 year; as well as by ‘MOLDELECTRICA’ S.O.E. though the Official Letter No 46-47/1795 dated 23.08.2011, as a response to the request from the MoEN No. 03-07/1337 din 08.08.2011, regarding the period 2003-2010; Official Letter No 46-47/112 dated 17.01.2014, as a response to the request from the CCO of the MoEN No. 320/2014-01-01 dated 03.01.2014, regarding the period 2011-2013; Official Letter No. 46-74/937 dated 25.05.2016, as a response to the request from the CCO No. 512/2016-05-01 dated 10.05.2016, regarding 2015 year; Official Letter No. 46-74/1 dated 03.01.2018, as a response to the request from the CCO No. 601/2017-12-03 dated 14.12.2017, regarding 2016 year.
Type and source of EF and OF
− Manufacturing EF, fraction SF6 and PFCs consumption by manufacturers; default emission factors: 7 per cent for sealed pressure electrical equipment (MV switchgear) containing SF6 (2006 IPCC Guidelines, Volume 3, Chapter 8.1, Table 8.2, page 8.15) and 8.5 per cent for closed pressure electrical equipment (HV switchgear) containing SF6 (2006 IPCC Guidelines, Volume 3, Chapter 8.1, Table 8.3, page 8.16);
− Equipment use EF; total nameplate capacity of installed equipment (includes emissions due to leakage, servicing, and maintenance as well as failures); default emission factors: 0.2 per cent for sealed pres-sure electrical equipment (MV switchgear) containing SF6 (2006 IPCC Guidelines, Volume 3, Chapter 8.1, Table 8.2, page 8.15) and 2.6 per cent for closed pressure electrical equipment (HV switchgear) containing SF6 (2006 IPCC Guidelines, Volume 3, Chapter 8.1, Table 8.3, page 8.16);
− Equipment disposal EF; total nameplate capacity of retiring equipment, fraction of SF6 and PFC remaining at retirement (the life expectancy of the equipment in European countries is over 35 years); default emission factors: 93 per cent for sealed pressure electrical equipment (MV switchgear) containing SF6 (2006 IPCC Guidelines, Volume 3, Chapter 8.1, Table 8.2, page 8.15) and 95 per cent for closed pressure electrical equipment (HV switchgear) containing SF6 (2006 IPCC Guidelines, Volume 3, Chapter 8.1, Table 8.3, page 8.16).
Uncertainty of AD and source 5% - expert judgementUncertainty of EF and source 20% - expert judgementPotential Improvements No potential improvements are planned to be implemented in the next inventory cycle for source category 2G1 ‘Electrical Equipment’.

Chapter 2: Methods and Data Documentation
2 - 149
Table 2.2.6.2: Information on Source Category 2G3 ‘N2O from Product Uses’ Sector Industrial Processes and Product UseCategory 2G Other Product Manufacture and UseSource / Gas 2G3 N2O from Product Uses (N2O for anaesthetic use in medical application) / N2OKey Category? NoCategory Description / Defini-tion
This source covers evaporative emissions of nitrous oxide (N2O) that arise from medical applications (anaesthetic use, analgesic use and veterinary use). N2O is used during anesthesia for two reasons: (a) as an anaesthetic andanalgesic and as (b) a carrier gas for volatile fluorinatedhydrocarbon anaesthetic such as isoflurane, sevofluraneand desflurane.
Country Detail N2O emissions in this sector arising from the use of N2O in the health service within 1990-2007 time series. In conformity with the response of the Ministry of Health to the last Letter of the Ministry of Environ-ment dated 1st of March 2011, since 2007 in the Republic of Moldova N2O is not used in anaesthesia anymore.
Equation(Describe variables for method used)
2006 IPCC Guidelines for National Greenhouse Gas Inventories, Volume 3, Chapter 8: Other product manufacture and Use, page 8.37.N2O Emissions = N2O consumption (AD) * Emission factor (EF)
Methodology: Tier 1
Reference 2006 IPCC Guidelines for National Greenhouse Gas Inventories, Volume 3, Chapter 8 ‘Other product manufacture and use’, Section 8.4 ‘N2O from product uses’, Pages 8.35-8.40. National Inventory Report: 1990-2016. Greenhouse Gas Sources and Sinks in the Republic of Moldova (2018).
Describe How and Why this Method Was Chosen Due to the lower importance of this source and unavailability of all detailed data, the Tier 1 methodology has been used.
Type and source of activity data Consumption of N2O as provided by the Ministry of Health through the Official Letter No. 01-9/2513 dated 9.11.2007, as a response to Official Letter No. 01-07/1608 dated 15.10.2007 from the MENR; Official Letter No. 01-9/550 dated 01.03.2011, as a response to Official Letter No. 03-07/175 dated 02.02.2011 from the MoEN.
Type and source of EF and OF Default, 100 per cent of the whole amount of N2O used in anesthesia is deemed to be emitted into the atmosphere.Uncertainty of AD and source 5% - expert judgementUncertainty of EF and source 3% - expert judgementPotential Improvements No potential improvements are planned to be implemented in the next inventory cycle for source category 2G3 ‘N2O from Product Uses’.
Table 2.2.6.3: Information on Source Category 2G4 ‘Other’ (Tobacco Combustion) – CO2Sector Industrial Processes and Product UseCategory 2G Other Product Manufacture and UseSource / Gas 2G4 Other (Tobacco Combustion) / CO2
Key Category? NoCategory Description / Defini-tion This category comprises emissions arising from the combustion (smoking) of tobacco.
Country Detail Statistical data regarding cigars and cigarettes production are available in the Statistical Yearbooks of the RM, the Statistical Reports PRODMOLD-A ‘Total production, as a natural expression, in the Republic of Moldova, by product type, for 2005-2016’, as well as in the statistical database which can be accessed on-line on the NBS website. It has been considered that cigarettes represent 95 per cent of the total market, while cigars – 5 per cent.
Equation(Describe variables for method used)
Indirect CO2 emissions were estimated based on the carbon content in NMVOC emissions. The default value used represents 60% per cent (2006 IPCC Guidelines for National Greenhouse Gas Inventories, Volume 3: Industrial Processes and Product Use, Chapter 5: Non-Energy Products from Fuels and Solvent Use, Chapter 5.5: Solvent Use, Section 5.5.4 ‘Uncertainty assessment’, Page 5.17). By oxidizing, this carbon converts into CO2 in atmosphere (it is assumed that all solvents are of fossil origin).CO2 emissions from tobacco combustion use were estimated using the following equation:
CO2 emissions = NMVOC • CC • 44/12Where:
CO2 emissions – carbon dioxide emissions from tobacco combustion, kt/yr;NMVOC – total NMVOC emissions within the respective category, kt/yr;CC – carbon content in NMVOC, fraction;44/12 – stoichiometric ratio CO2/C.
•

Chapter 2: Methods and Data Documentation
2 - 150
Reference2006 IPCC Guidelines for National Greenhouse Gas Inventories, Volume 3: Industrial Processes and Product Use, Chapter 5: Non-Energy Products from Fuels and Solvent Use, Chapter 5.5: Solvent Use, Section 5.5.4 ‘Uncertainty assessment’, Page 5.17.National Inventory Report: 1990-2016. Greenhouse Gas Sources and Sinks in the Republic of Moldova (2018).
Describe How and Why this Method Was Chosen Due to the lower importance of this source and unavailability of all detailed data, the Tier 1 methodology has been used.
Type and source of activity data
Statistical data regarding cigars and cigarettes production are available in the Statistical Yearbooks for 1994 (page 290), 1999 (page 305), 2003 (page 395), 2006 (page 311), 2007 (page 310), 2008 (page 306), 2009 (page 303), 2010 (page 303), 2011 (page 304), 2012 (page 307), 2013 (page 305), 2014 (page 301); as well as in the Statistical Reports PRODMOLD-A ‘Total production, as a natural expression, in the Republic of Moldova, by product type, for 2005-2016”. According to the EMEP/EEA Air Pollutant Emission Inventory Guidebook (2016) (2.D.3.i „Other solvent and product use”, SNAP 060602, page 21), one cigar contains 5 g of tobacco, while one cigarette – only 1 g. In order to estimate the share of fermented tobacco (see Table 4-169 from the National Inventory Report: 1990-2016. Greenhouse Gas Sources and Sinks in the Republic of Moldova), it is considered that cigarettes represent 95 per cent of the total market, while cigars – 5 per cent.
Type and source of EF and OF CC – carbon content in NMVOC, fraction (the default value used represents 60 per cent, with a margin of 50-70 per cent; 2006 IPCC Guidelines for National Greenhouse Gas Inventories, Volume 3: Industrial Processes and Product Use, Chapter 5: Non-Energy Products from Fuels and Solvent Use, Chapter 5.5: Solvent Use, Section 5.5.4 ‘Uncertainty assessment’, Page 5.17).
Uncertainty of AD and source 5% - expert judgementUncertainty of EF and source 50% - expert judgementPotential Improvements No potential improvements are planned to be implemented in the next inventory cycle for source category 2G4 ‘Other’ (Tobacco Combustion).
Table 2.2.6.4: Information on Source Category 2G4 ‘Other’ (Tobacco Combustion) – NOx, CO and NMVOCSector Industrial Processes and Product UseCategory 2G Other Product Manufacture and UseSource / Gas 2G4 Other (Tobacco Combustion) / NOx, CO and NMVOCKey Category? Not applicable for pollutant emissions.Category Description / Defini-tion This category comprises emissions arising from the combustion (smoking) of tobacco.
Country Detail Statistical data regarding cigars and cigarettes production are available in the Statistical Yearbooks of the RM, the Statistical Reports PRODMOLD-A ‘Total production, as a natural expression, in the Republic of Moldova, by product type, for 2005-2016’, as well as in the statistical database which can be accessed on-line on the NBS website. It has been considered that cigarettes represent 95 per cent of the total market, while cigars – 5 per cent.
Equation(Describe variables for method used)
The Tier 2 approach for pollutant emissions from tobacco combustion uses the general equation (2) from the EMEP/EEA Air Pollution Emission Inventory Guidebook 2016, NFR 2.D.3.i ‘Other Solvent and Product Use’, section 3.3 ‘Tier 2 technology-specific approach’:
E pollutant = (AR use, technology • EF technology, pollutant) / 103
Where:E technology, pollutant – the emission of the technology and the specified pollutant, t/yr;AR use, technology – the activity rate for the tobacco combustion, t/yr;EF pollutant – the emission factor for this pollutant technology, kg/t.
ReferenceEEA (2016), EMEP/EEA Air Pollution Emission Inventory Guidebook 2016, Technical guidance to prepare national emission inventories. European Environment Agency, Technical report No 21/2016. Copen-hagen, Denmark (Available on: http://www.eea.europa.eu//publications/emep-eea-guidebook-2016).National Inventory Report: 1990-2016. Greenhouse Gas Sources and Sinks in the Republic of Moldova (2018).
Describe How and Why this Method Was Chosen A Tier 2 methodology has been used due to availability of technology-specific emission factors.
Type and source of activity data
Statistical data regarding cigars and cigarettes production are available in the Statistical Yearbooks for 1994 (page 290), 1999 (page 305), 2003 (page 395), 2006 (page 311), 2007 (page 310), 2008 (page 306), 2009 (page 303), 2010 (page 303), 2011 (page 304), 2012 (page 307), 2013 (page 305), 2014 (page 301); as well as in the Statistical Reports PRODMOLD-A ‘Total production, as a natural expression, in the Republic of Moldova, by product type, for 2005-2016”. According to the EMEP/EEA Air Pollutant Emission Inventory Guidebook (2016) (2.D.3.i „Other solvent and product use”, SNAP 060602, page 21), one cigar contains 5 g of tobacco, while one cigarette – only 1 g. In order to estimate the share of fermented tobacco (see Table 4-169 from the National Inventory Report: 1990-2016. Greenhouse Gas Sources and Sinks in the Republic of Moldova), it is considered that cigarettes represent 95 per cent of the total market, while cigars – 5 per cent.

Chapter 2: Methods and Data Documentation
2 - 151
Type and source of EF and OF
Tier 2 Default EF for 2G4 ‘Other’ (‘Tobacco Combustion’)Source Category Pollutants EF Unit
2G4 ‘Other’ (Tobacco Combustion)NOxCO
NMVOC
1.8 (1.7-1.9)55.1 (53-57)
4.84 (2.4-9.7)kg/t of tobacco
Source: EMEP/EEA Air Pollutant Emission Inventory Guidebook (2016), Category 2.D.3.i „Other solvent and product use”, SNAP 060602, Table 3-14, page 20. Uncertainty of AD and source 5% - expert judgementUncertainty of EF and source See the 95% confidence interval in the table above (in the brackets, lower-upper).
Table 2.2.6.5: Information on Source Category 2G4 ‘Other’ (Use of Shoes) – CO2Sector Industrial Processes and Product UseCategory 2G Other Product Manufacture and UseSource / Gas 2G4 Other (Use of Shoes) / CO2
Key Category? NoCategory Description / Defini-tion This category comprises emissions arising from the use of shoes.
Country Detail Statistical data regarding shoes production are available in the Statistical Yearbooks of the RM, the Statistical Reports PRODMOLD-A ‘Total production, as a natural expression, in the Republic of Moldova, by product type, for 2005-2016’, as well as in the statistical database which can be accessed on-line on the NBS website.
Equation(Describe variables for method used)
Indirect CO2 emissions were estimated based on the carbon content in NMVOC emissions. The default value used represents 60% per cent (2006 IPCC Guidelines for National Greenhouse Gas Inventories, Volume 3: Industrial Processes and Product Use, Chapter 5: Non-Energy Products from Fuels and Solvent Use, Chapter 5.5: Solvent Use, Section 5.5.4 ‘Uncertainty assessment’, Page 5.17). By oxidizing, this carbon converts into CO2 in atmosphere (it is assumed that all solvents are of fossil origin).CO2 emissions from use of shoes use were estimated using the following equation:
CO2 emissions = NMVOC • CC • 44/12Where:
CO2 emissions – carbon dioxide emissions from use of shoes, kt/yr;NMVOC – total NMVOC emissions within the respective category, kt/yr;CC – carbon content in NMVOC, fraction;44/12 – stoichiometric ratio CO2/C.
Reference2006 IPCC Guidelines for National Greenhouse Gas Inventories, Volume 3: Industrial Processes and Product Use, Chapter 5: Non-Energy Products from Fuels and Solvent Use, Chapter 5.5: Solvent Use, Section 5.5.4 ‘Uncertainty assessment’, Page 5.17.National Inventory Report: 1990-2016. Greenhouse Gas Sources and Sinks in the Republic of Moldova (2018).
Describe How and Why this Method Was Chosen Due to the lower importance of this source and unavailability of all detailed data, the Tier 1 methodology has been used.
Type and source of activity dataStatistical data regarding shoes production (see Table 4-171 from the National Inventory Report: 1990-2016. Greenhouse Gas Sources and Sinks in the Republic of Moldova) are available in the Statistical Yearbooks of the ATULBD for 1998-2017; Statistical Yearbooks of the RM for 1990-2017, as well as in the Statistical Reports PRODMOLD-A ‘Total production, as a natural expression, in the Republic of Moldova, by product type, for 2005-2016.
Type and source of EF and OF CC – carbon content in NMVOC, fraction (the default value used represents 60 per cent, with a margin of 50-70 per cent; 2006 IPCC Guidelines for National Greenhouse Gas Inventories, Volume 3: Industrial Processes and Product Use, Chapter 5: Non-Energy Products from Fuels and Solvent Use, Chapter 5.5: Solvent Use, Section 5.5.4 ‘Uncertainty assessment’, Page 5.17).
Uncertainty of AD and source 5% - expert judgementUncertainty of EF and source 50% - expert judgementPotential Improvements No potential improvements are planned to be implemented in the next inventory cycle for source category 2G4 ‘Other’ (Use of Shoes).

Chapter 2: Methods and Data Documentation
2 - 152
Table 2.2.6.6: Information on Source Category 2G4 ‘Other’ (Use of Shoes) – NMVOCSector Industrial Processes and Product UseCategory 2G Other Product Manufacture and UseSource / Gas 2G4 Other (Use of Shoes) / NMVOCKey Category? Not applicable for pollutant emissions.Category Description / Defini-tion This category comprises emissions arising from the use of shoes.
Country Detail Statistical data regarding shoes production are available in the Statistical Yearbooks of the RM, the Statistical Reports PRODMOLD-A ‘Total production, as a natural expression, in the Republic of Moldova, by product type, for 2005-2016’, as well as in the statistical database which can be accessed on-line on the NBS website.
Equation(Describe variables for method used)
The Tier 2 approach for pollutant emissions from use of shoes uses the general equation (2) from the EMEP/EEA Air Pollution Emission Inventory Guidebook 2016, NFR 2.D.3.i ‘Other Solvent and Product Use’, section 3.3 ‘Tier 2 technology-specific approach’:
E pollutant = (AR use, technology • EF technology, pollutant) / 103
Where:E technology, pollutant – the emission of the technology and the specified pollutant, t/yr;AR use, technology – the activity rate for the use of shoes, t/yr;EF pollutant – the emission factor for this pollutant technology, kg/t.
ReferenceEEA (2016), EMEP/EEA Air Pollution Emission Inventory Guidebook 2016, Technical guidance to prepare national emission inventories. European Environment Agency, Technical report No 21/2016. Copen-hagen, Denmark (Available on: http://www.eea.europa.eu//publications/emep-eea-guidebook-2016).National Inventory Report: 1990-2016. Greenhouse Gas Sources and Sinks in the Republic of Moldova (2018).
Describe How and Why this Method Was Chosen A Tier 2 methodology has been used due to availability of technology-specific emission factors.
Type and source of activity dataStatistical data regarding shoes production (see Table 4-171 from the National Inventory Report: 1990-2016. Greenhouse Gas Sources and Sinks in the Republic of Moldova) are available in the Statistical Yearbooks of the ATULBD for 1998-2017; Statistical Yearbooks of the RM for 1990-2017, as well as in the Statistical Reports PRODMOLD-A ‘Total production, as a natural expression, in the Republic of Moldova, by product type, for 2005-2016.
Type and source of EF and OF
Tier 2 Default EF for 2G4 ‘Other’ (‘Use of Shoes’)Source Category Pollutant EF Unit
2G4 ‘Other’ (Use of Shoes) NMVOC 60 (30-120) g/pair of shoesSource: EMEP/EEA Air Pollutant Emission Inventory Guidebook (2016), Category 2.D.3.i „Other solvent and product use”, SNAP 060603, Table 3-15, page 21.
Uncertainty of AD and source 5% - expert judgementUncertainty of EF and source See the 95% confidence interval in the table above (in the brackets, lower-upper).
2.2.7. Category 2H ‘Other’
Tables 2.2.7.1 – 2.2.7.2 below comprise relevant information on source categories comprised within the inventory, including description of each source by gas allocated to category 2H ‘Other’.
Table 2.2.7.1: Information on Source Category 2H2 ‘Food and Beverages Industry’ (Bread Making and Other Food) – NMVOCSector Industrial Processes and Product UseCategory 2H Other Source / Gas 2H2 Food and Beverages Industry (Bread Making and Other Food) / NMVOCKey Category? Not applicable for pollutant emissions.

Chapter 2: Methods and Data Documentation
2 - 153
Category Description / Defini-tion
This category comprises emissions arising from food manufacturing, which may involve the heating of fats and oils and foodstuffs containing them, the baking of cereals, flour and beans, fermentation in the making of bread, the cooking of vegetables and meats, and the drying of residues. These processes may occur in sources varying in size from domestic households to manufacturing plants.
Country Detail Statistical data regarding food manufacturing are available in the Statistical Yearbooks of the ATULBD, Statistical Yearbooks of the RM, the Statistical Reports PRODMOLD-A ‘Total production, as a natural expression, in the Republic of Moldova, by product type, for 2005-2016’, as well as in the statistical database which can be accessed on-line on the NBS website.
Equation(Describe variables for method used)
The Tier 2 approach for pollutant emissions from food manufacturing uses the general equation (2) from the EMEP/EEA Air Pollution Emission Inventory Guidebook 2016, NFR 2.H.2 ‘Food and beverages’, section 3.3 ‘Tier 2 technology-specific approach’:
E technology, pollutant = (AR use, technology • EF technology, pollutant) / 103
Where:E technology, pollutant – the emission of the technology and the specified pollutant, t/yr;AR use, technology – the activity rate for food manufacturing, t/yr;EF pollutant – the emission factor for this pollutant technology, kg/t.
ReferenceEEA (2016), EMEP/EEA Air Pollution Emission Inventory Guidebook 2016, Technical guidance to prepare national emission inventories. European Environment Agency, Technical report No 21/2016. Copen-hagen, Denmark (Available on: http://www.eea.europa.eu//publications/emep-eea-guidebook-2016).National Inventory Report: 1990-2016. Greenhouse Gas Sources and Sinks in the Republic of Moldova (2018).
Describe How and Why this Method Was Chosen A Tier 2 methodology has been used due to availability of technology-specific emission factors.
Type and source of activity data
Statistical data regarding bread making and other food in the RM within 1990-2016 time periods (see Table 4-179 from the National Inventory Report: 1990-2016. Greenhouse Gas Sources and Sinks in the Republic of Moldova) are available in the Statistical Yearbooks of the Republic of Moldova for 1994 (pages 289-290), 1999 (pages 304-305), 2003 (pages 393-394), 2006 (pages 309-310), 2010 (pages 301-303), 2014 (pages 299-301); Statistical Reports PRODMOLD-A „Total production, as a natural expression, in the Republic of Moldova, by product type, for 2005-2016”; as well as in the Statistical Yearbooks of the ATULBD for 1998 (page 177), 2000 (page 100), 2002 (page 104), 2005 (page 94), 2007 (page 93), 2009 (page 93), 2011 (page 95), 2014 (page 89), 2017 (page 102).
Type and source of EF and OF
Default Emission Factors Used to Estimate NMVOC Emissions from Bread Making and Other FoodSource Bread Making and Other Food NMVOC Emission Factor, kg / t
Bread Making and Other Food
Animal renderingMeat, fish and poultryFish meal processingGrain dryingSugar; margarine and solid cooking fats BreadSponge-dough breadWhite bread White bread shortened processWholemeal bread and light rye breadCakes, biscuits and breakfast cereals; animal feed
0.33 (0.11-0.98)0.30 (0.03-3)1.0 (0.35-3.1)1.3 (0.13-13)
10 (1-100)4.5 (0.45-45)
8 (2.7-24)4.5 (1.5-14)
2 (0.7-6)3 (1-9)
1 (0.1-10)Source: EMEP/EEA Atmospheric Emissions Inventory Guidebook (2016), 2.H.2 Food and Beverages Industry, SNAP 040605 – Bread, Tables 3-2, 3-3, 3-4, 3-11, 3-18, 3-19, 3-20, 3-21, 3-22. Pages 10-20.
Uncertainty of AD and source 5% - expert judgementUncertainty of EF and source See the 95% confidence interval in the table above (in the brackets, lower-upper).
Table 2.2.7.2: Information on Source Category 2H2 ‘Food and Beverages Industry’ (Alcoholic Beverages) – NMVOCSector Industrial Processes and Product UseCategory 2H Other Source / Gas 2H2 Food and Beverages Industry (Alcoholic Beverages) / NMVOCKey Category? Not applicable for pollutant emissions.

Chapter 2: Methods and Data Documentation
2 - 154
Category Description / Defini-tion
This category comprises emissions arising from beverages industry. When making any alcoholic beverage, sugar is converted into ethanol by yeast. This is fermentation. The sugar comes from fruit, cereals or other vegetables. These materials may need to be processes before fermentation. For example, in the manufacture of beer, cereals are allowed to germinate, then roasted and boiled before fermentation. To make spirits, the fermented liquid is then distilled. Alcoholic beverages, particularly spirits and wine, may be stored for a number of years before consumption.
Country Detail Statistical data regarding beverages industry are available in the Statistical Yearbooks of the ATULBD, Statistical Yearbooks of the RM, the Statistical Reports PRODMOLD-A ‘Total production, as a natural expression, in the Republic of Moldova, by product type, for 2005-2016’, as well as in the statistical database which can be accessed on-line on the NBS website.
Equation(Describe variables for method used)
The Tier 2 approach for pollutant emissions from beverages industry uses the general equation (2) from the EMEP/EEA Air Pollution Emission Inventory Guidebook 2016, NFR 2.H.2 ‘Food and beverages’, section 3.3 ‘Tier 2 technology-specific approach’:
E technology, pollutant = (AR use, technology • EF technology, pollutant) / 103
Where:E technology, pollutant – the emission of the technology and the specified pollutant, hl/yr;AR use, technology – the activity rate for beverages industry, hl/yr;EF pollutant – the emission factor for this pollutant technology, kg/hl.
ReferenceEEA (2016), EMEP/EEA Air Pollution Emission Inventory Guidebook 2016, Technical guidance to prepare national emission inventories. European Environment Agency, Technical report No 21/2016. Copen-hagen, Denmark (Available on: http://www.eea.europa.eu//publications/emep-eea-guidebook-2016).National Inventory Report: 1990-2016. Greenhouse Gas Sources and Sinks in the Republic of Moldova (2018).
Describe How and Why this Method Was Chosen A Tier 2 methodology has been used due to availability of technology-specific emission factors.
Type and source of activity data
Statistical data regarding beverages industry in the RM within 1990-2016 time periods (see Table 4-182 from the National Inventory Report: 1990-2016. Greenhouse Gas Sources and Sinks in the Republic of Moldova) are available in the Statistical Yearbooks of the Republic of Moldova for 1994 (pages 289-290), 1999 (pages 304-305), 2003 (pages 393-394), 2006 (pages 309-310), 2010 (pages 301-303), 2014 (pages 299-301); Statistical Reports PRODMOLD-A ‘Total production, as a natural expression, in the Republic of Moldova, by product type, for 2005-2016’; as well as in the Statistical Yearbooks of the ATULBD for 1998 (page 177), 2000 (page 100), 2002 (page 104), 2005 (page. 94), 2007 (page. 93), 2009 (page 93), 2011 (page 95), 2014 (page. 89), 2017 (page 102).
Type and source of EF and OF
Default EFs Used to Calculate NMVOC Emissions from Alcoholic BeveragesSource Alcoholic beverages NMVOC Emission Factor, kg / hl
Alcoholic Beverages
Red wineWhite wine, beerSpirits (unspecified)Whisky / grain whisky / vodkaDivin (cognac) / brandyOther spirits
0.080 (0.03-0.24)0.035 (0.012-0.11)
15.0 (1.5-150)7.5 (3.8-15)3.5 (1.2-11)
0.4 (0.13-1.2)Source: EMEP/EEA Atmospheric Emissions Inventory Guidebook, (2016), 2.H.2 Food and Beverages Industry, SNAP 040606 – Wine, SNAP 040607 – Beer, SNAP 040608 – Spirits, Tables 3-24, 3-25, 3-26, 3-27, 3-28, 3-30, 3-31, 3-32. Pages 21-25.
Uncertainty of AD and source 5% - expert judgementUncertainty of EF and source See the 95% confidence interval in the table above (in the brackets, lower-upper).
2.3. Agriculture Sector
Relevant information on categories comprised within the inventory, including description of each category allocated to Sector 3 ‘Agriculture’ is provided below.
2.3.1. Category 3A ‘Enteric Fermentation’
Tables 2.3.1.1 – 2.3.1.2 below comprise relevant information on source categories comprised within the inventory, including description of each source by gas allocated to category 3A ‘Enteric Fermentation’.

Chapter 2: Methods and Data Documentation
2 - 155
Table 2.3.1.1: Information on Source Category 3A ‘Enteric Fermentation’ (Dairy Cattle, Non-Dairy Cattle, Sheep, Goat) – CH4Sector Agriculture Category 3A Enteric FermentationSource / Gas Dairy Cattle, Non-Dairy Cattle, Sheep, Goat / CH4
Key Category? Tier 1: Yes: 1990 (L), 2016 (L, T); Tier 2: Yes: 1990 (L), 2016 (L) (Category 3A Enteric Fermentation – aggregated for all source)Category Description / Defini-tion
Methane is produced in herbivores as a by-product of enteric fermentation, a digestive process by which carbohydrates are broken down by microorganisms into simple molecules for absorption into the bloodstream. The amount of methane that is released depends on the type of digestive tract, age, and weight of the animal, and the quality and quantity of the feed consumed.
Country Detail
Dairy cows include mature cows that are producing milk in commercial quantities for human consumption. Following definition in the 2006 IPCC GL, the dairy cow category does not include cows kept principally to produce calves. Non-dairy cattle populations is further classified into subcategories based on animal and feed characteristics: calves and heifers up to 1 year; heifers between 12 and 18 months; heifers between 18 and 24 months, heifers of 24 months and more; breeding males and work bullocks. Sheep include mature ewes (inclusive, breeding ewes for production of offspring and wool production and milking ewes where commercial milk production is the primary purpose), other mature sheep (>1 year) and growing lambs (intact males, castrates and females).
Equation(Describe variables for method used)
Tier 2 Methodology2006 IPCC GL, page 10.28, equations 10.19 and 10.20:
Total CH4 enteric = Σi Ei [EF (T) • (N(T)/106)]Where:
Total CH4 enteric – total CH4 emissions from Enteric Fermentation, kt CH4/yr;Ei – is the emissions for the i livestock categories and sub-categories;EF (T) – emission factor for the defined livestock population, kg CH4/head/yr;N(T) – the number of head of livestock species/category T in the country;T – species/category of livestock.
The emission factors for each category of livestock are estimated based on, equation 10.21 from page 10.31: EF = [GE • (Ym/100) • 365/55.65]
Where:EF – emission factor, kg CH4/head/yr;GE – gross energy intake, MJ/head/day;Ym – methane conversion factor, % of gross energy in feed converted to methane;55.65 MJ/kg CH4 – the energy content of methane.
The gross energy intake data are obtained using the approach described in Section 10.2.
Reference 2006 IPCC Guidelines for national Greenhouse Gas Inventories, Volume 4: Agriculture, Forestry and Other Lan Use, Chapter 10: Emissions from Livestock and Manure Management.National Inventory Report: 1990-2016. Greenhouse Gas Sources and Sinks in the Republic of Moldova (2018).
Describe How and Why this Method Was Chosen Due to the importance of this source the Tier 2 methodology has been used
Type and source of activity data
Animal population (thousand heads) and data necessary for calculation of Gross Energy (GE), inclusive: Weight (W) and Mature Weight (MW) in livestock and poultry (kg); Average Daily Weight Gain per Day (WG) (grams); Average Daily and Annual Milk Production per One Cow, One Sheep and One Goat (kg); Average Wool Production per Sheep (kg); Percentage of females that give birth in a year (claves from cows and lambs from sheep giving birth) (%), Number of Offspring – data are provided by the National Bureau of Statistics through Statistical Annual Report No. 24-agr „Animal Breeding Sector”. The Number of Livestock and Poultry in all Households Categories as of 1st of January (Annual Reports for 1990-2016) and the Basic Indicators of Animal Breeding Sector Development in all Households Categories in the Republic of Moldova (Annual Reports for 1990-2016). Statistical Yearbooks of Administrative-Territorial Units on Left Bank of Dniester River (ATULBD) for 1998 (page 224), 2002 (page 118), 2006 (page 109), 2010 (page 110), 2014 (page 104), 2017 (page 117).Methane Conversion Factor (Ym): Ym – 0.03 for feedlot fed cattle (young animals) and Ym – 0.065 for dairy cows and other cattle (2006 IPCC Guidelines, Volume 4, Chapter 10, Table 10.12, Pages 10.30 and Tables 10A-1 and 10A-2, Pages 10.72-10.73); for sheep and goats: Ym – 0.045 for lambs and kids and Ym – 0.065 for mature rams, ewes and goats (2006 IPCC Guidelines, Volume 4, Chapter 10, Table 10.13, Page 10.31).Other data, necessary for calculation of GE we provided by Scientific-Practical Institute of Biotechnology in Animal Breeding and Veterinary Medicine (Maximovca village, Anenii Noi District, Republic of Moldova).
− feeding situation: confined, grazing, pasture conditions; − fat content in milk (%); and − feed digestibility (%).

Chapter 2: Methods and Data Documentation
2 - 156
Type and source of EF and OF
Country Specific EFs for Dairy Cattle, Non-Dairy Cattle, Sheep and Goat - Scientific-Practical Institute of Biotechnology in Animal Breeding and Veterinary Medicine (Maximovca village, Anenii Noi District), the latest data were published in the National Inventory Report: 1990-2016. Greenhouse Gas Sources and Sinks in the Republic of Moldova (2018) (see also Table 5-22 for CS EFs for dairy cattle and non-dairy cattle and Table 5-23 for CS EFs for sheep and goat).CS Emission Factors for Enteric Fermentation, Calculated for Cattle Population in the Republic of Moldova following a Tier 2 methodology, kg CH4/head/year
1990 1995 2000 2005 2010 2013 2014 2015 2016Dairy cows 104.8 90.9 91.1 98.0 101.3 103.3 109.0 108.6 108.1Other cattle (average) 50.5 52.6 55.0 55.2 51.9 52.0 53.0 51.3 55.0…Calves and heifers up to 1 year 42.7 33.5 32.2 37.0 37.1 37.6 38.8 37.0 41.0…Heifers between 12 and 18 months 55.9 54.3 49.0 55.5 51.4 51.7 52.8 50.9 54.8…Heifers between 18 and 24 months 66.8 62.4 58.0 63.6 61.7 61.9 62.9 61.7 62.9…Heifers between 24 months and more 71.3 68.3 64.8 70.9 65.5 65.7 66.8 65.5 66.8…Breeding males 88.6 80.3 76.0 76.1 77.0 77.0 78.7 77.0 76.6…Work bullocks 77.8 79.7 74.7 78.5 79.0 79.0 83.0 79.0 78.4
CS Emission Factors for Enteric Fermentation, Calculated for Sheep and Goat Populations in the Republic of Moldova following a Tier 2 Methodology, kg CH4/head/year1990 1995 2000 2005 2010 2013 2014 2015 2016
Sheep (average), including: 6.9 6.4 6.2 6.5 6.7 7.0 7.5 7.1 7.4…Mature ewes and Ewe lambs ≥ 1 year 7.4 6.8 6.7 7.0 7.2 7.8 8.3 7.9 8.2…Breeding rams 10.6 9.9 9.5 9.1 9.1 9.1 9.1 9.0 9.0…Growing lambs up to 1 year 3.9 3.6 3.1 3.2 3.4 3.2 3.7 3.5 3.6Goats (average), including: 6.4 6.1 5.8 5.8 6.4 6.4 6.4 6.1 6.4…Mature females ≥ 1 year 7.1 7.2 6.5 6.5 7.3 7.7 7.5 7.4 7.6…Breeding males 7.1 6.3 6.9 6.4 6.7 6.0 6.5 6.2 6.3…Growing kids up to 1 year 2.8 2.4 2.7 2.5 2.5 2.2 2.4 2.3 2.4
Uncertainty of AD and source ± 10%, expert judgementUncertainty of EF and source ± 20% for Tier 2, 2006 IPCC GL, page 10.33, chapter 10.3.4 ‘Uncertainty assessment’
Potential Improvements Planned improvements could include updating the AD and productivity indicators used to estimate CH4 emissions within this source category following a Tier 2 methodology, in particular for cattle and sheep, the animal categories that account for the largest share in the structure of total methane emissions originated from the 3A ‘Enteric Fermentation’ category.
Table 2.3.1.2: Information on Source Category 3A ‘Enteric Fermentation’ (Swine, Horses, Asses and Mules, Rabbits) – CH4Sector Agriculture Category 3A Enteric FermentationSource / Gas Swine, Horses, Asses and Mules, Rabbits / CH4
Key Category? NoCategory Description / Defini-tion
Methane is produced in herbivores as a by-product of enteric fermentation, a digestive process by which carbohydrates are broken down by microorganisms into simple molecules for absorption into the bloodstream. The amount of methane that is released depends on the type of digestive tract, age, and weight of the animal, and the quality and quantity of the feed consumed.
Country Detail Following definition in the 2006 IPCC GL, the mature swine include sows in gestation, sows which have farrowed and are nursing young and boars that are used for breeding purposes, while the growing swine include nursery, finishing, gilts that will be used for breeding purposes and growing boars that will be used for breeding purposes.

Chapter 2: Methods and Data Documentation
2 - 157
Equation(Describe variables for method used)
Methodology: Tier 1 2006 IPCC GL, page 10.28, equations 10.19 and 10.20:
Total CH4 enteric = Σi Ei [EF (T) • (N(T)/106)]Where:
Total CH4 enteric – total CH4 emissions from Enteric Fermentation, kt CH4/yr;Ei – is the emissions for the i livestock categories and sub-categories;EF (T) – emission factor for the defined livestock population, kg CH4/head/yr;N(T) – the number of head of livestock species/category T in the country;T – species/category of livestock.
Reference 2006 IPCC Guidelines for national Greenhouse Gas Inventories, Volume 4: Agriculture, Forestry and Other Lan Use, Chapter 10: Emissions from Livestock and Manure Management.National Inventory Report: 1990-2016. Greenhouse Gas Sources and Sinks in the Republic of Moldova (2018).
Describe How and Why this Method Was Chosen Due to the importance of this source the Tier 2 methodology has been used
Type and source of activity data
Animal population (thousand heads) – data are provided by the National Bureau of Statistics through Statistical Annual Report No. 24-agr „Animal Breeding Sector”. The Number of Livestock and Poultry in all Households Categories as of 1st of January (Annual Reports for 1990-2016) and the Basic Indicators of Animal Breeding Sector Development in all Households Categories in the Republic of Moldova (Annual Reports for 1990-2016). Statistical Yearbooks of Administrative-Territorial Units on Left Bank of Dniester River (ATULBD) for 1998 (page 224), 2002 (page 118), 2006 (page 109), 2010 (page 110), 2014 (page 104), 2017 (page 117).
Type and source of EF and OFIPCC Default EF for developed countries from 2006 IPCC GL, page 10.28, Table 10.10: for Swine – 1.5 kg CH4/head/yr; Horses – 18 kg CH4/head/yr; Mules and Asses – 10 kg CH4/head/yr. Country Specific (Russian Federation) EF for Rabbits – 0.59 kg CH4/head/yr (see more information on https://unfccc.int/documents/65719, National Inventory Report of Russian Federation for 1990 – 2016 period, Chapter 5, Table 5.6, Page 168).
Uncertainty of AD and source ± 10%, expert judgementUncertainty of EF and source ± 30% for Tier 1, 2006 IPCC GL, page 10.33, chapter 10.3.4 ‘Uncertainty assessment’Potential Improvements No potential improvements are planned to be implemented in the next inventory cycle for these animal categories under 3A ‘Enteric Fermentation’ category.
2.3.2. Category 3B ‘Manure Management’
Tables 2.3.2.1 – 2.3.2.4 below comprise relevant information on source categories comprised within the inventory, including description of each source by gas allocated to category 3B ‘Manure Management’.
Table 2.3.2.1: Information on Source Category 3B ‘Manure Management’ (Dairy Cattle, Non-Dairy Cattle, Swine) – CH4Sector Agriculture Category 3B Manure ManagementSource / Gas Dairy Cattle, Non-Dairy Cattle, Swine / CH4
Key Category? Tier 1: Yes: 1990 (L), 2016 (L, T); Tier 2: Yes: 1990 (L), 2016 (L, T) (Category 3B Manure Management – aggregated for all sources)
Category Description / Defini-tion
The decomposition of manure under anaerobic conditions (i.e., in absence of oxygen), during storage and treatment, produces CH4. These conditions occur most readily when large numbers of animals are managed in a confined area (e.g., dairy farms, beef feedlots, and swine and poultry farms), and where manure is disposed of in liquid-based systems. The term ‘manure’ is used here collectively to include both dung and urine (i.e., the solids and the liquids) produced by livestock.
Country Detail
Dairy cows include mature cows that are producing milk in commercial quantities for human consumption. Following definition in the 2006 IPCC GL, the dairy cow category does not include cows kept principally to produce calves. Non-dairy cattle populations is further classified into subcategories based on animal and feed characteristics: calves and heifers up to 1 year; heifers between 12 and 18 months; heifers between 18 and 24 months, heifers of 24 months and more; breeding males and work bullocks. The mature swine include sows in gestation, sows which have farrowed and are nursing young and boars that are used for breeding purposes, while the growing swine include nursery, finishing, gilts that will be used for breeding purposes and growing boars that will be used for breeding purposes.

Chapter 2: Methods and Data Documentation
2 - 158
Equation(Describe variables for method used)
Tier 2 Methodology 2006 IPCC GL, page 10.37, equation 10.22
CH4 emissions = Σ(T) [(EF(T) • N(T))/106] Where:
CH4 emissions – CH4 from manure management, for a defined population, kt CH4/yr;EF(T) – emission factor for the defined livestock population, kg CH4 /head/yr;N(T) – the number of head of livestock species/category T in the country;T – species/category of livestock.
The emission factors for each category of livestock are estimated based on equation 10.23 from page 10.41:
EF(T)= (VS(T) • 365) • [B0(T) • 0.67 kg/m3 • Σ (S, k) (MCF(S, k) / 100) • MS (T,S, k)] Where:
EF(T) – annual CH4 emission factor for livestock category T, kg CH4/animal/yr;VS(T) – daily volatile solid excreted for livestock category T, kg dm/animal/day;B0(T) – maximum methane producing capacity for manure produced by livestock category T, m3 CH4/kg of VS excreted; 0.67 – conversion factor (CF) of m3 CH4 to kilograms CH4; MCF(S, k) – methane conversion factors for each manure management system S by climate region k, %;MS (T,S,k) – fraction of livestock category T’s manure handled using management system S in climate region k, dimensionless.
The volatile solid is calculated using the equation 10.24 and default values for all parameters except GE and DE, which is taken from the calculation of CH4 emissions from enteric fermentation.VS = [GE • (1 – DE%/100) + (UE • GE)] • [(1 – ASH/18.45)]
Where:VS – volatile solid excretion per day on a dry-organic matter basis, kg VS/day (see Country Specific values in Table 5-28, National Inventory Report: 1990-2016. Greenhouse Gas Sources and Sinks in the Republic of Moldova (2018));GE – gross energy intake, MJ/day; the same values as those used under the 3A ‘Enteric Fermentation’ category;DE – digestibility of the feed in per cent; for cattle the same values were used as under the 3A ‘Enteric Fermentation’; for fattening swine, DE – 85 per cent, while for market swine DE – 75 per cent;(UE • GE) – urinary energy expressed as fraction of gross energy (GE); typically, this value is 0.04GE for cattle and 0.02GE for swine;ASH – the ash content of manure calculated as a fraction of the dry matter feed intake; values used by Austria into its NIR for 1990-2016 were used, 11 per cent for dairy cows, 11.5 per cent for other cattle, the default value of 2 per cent was used for swine (2006 IPCC Guidelines);18.45 – conversion factor (CF) for dietary GE in MJ per kg of dry matter; this value is relatively constant across a wide range of forage and grain-based feeds commonly consumed by livestock.
Reference 2006 IPCC Guidelines for national Greenhouse Gas Inventories, Volume 4: Agriculture, Forestry and Other Lan Use, Chapter 10: Emissions from Livestock and Manure Management.National Inventory Report: 1990-2016. Greenhouse Gas Sources and Sinks in the Republic of Moldova (2018).
Describe How and Why this Method Was Chosen The Tier 2 methodology has been used because this is key source category.
Type and source of activity data
Animal population (thousand heads) and data necessary for calculation of Gross Energy (GE), inclusive: Weight (W) and Mature Weight (MW) in livestock and poultry (kg); Average Daily Weight Gain per Day (WG) (grams); Average Daily and Annual Milk Production per One Cow (kg); Percentage of females that give birth in a year (claves from cows and pigs from sows) (%), Number of Offspring – data are provided by the National Bureau of Statistics through Statistical Annual Report No. 24-agr „Animal Breeding Sector”. The Number of Livestock and Poultry in all Households Categories as of 1st of January (Annual Reports for 1990-2016) and the Basic Indicators of Animal Breeding Sector Development in all Households Categories in the Republic of Moldova (Annual Reports for 1990-2016). Statistical Yearbooks of Administrative-Territorial Units on Left Bank of Dniester River (ATULBD) for 1998 (page 224), 2002 (page 118), 2006 (page 109), 2010 (page 110), 2014 (page 104), 2017 (page 117).
Other parameters are taken from 2006 IPCC GL and National Inventory Report of Austria for 1990-2016 (2018):− MCF for cool climate (T ≤ 10°C) are taken from 2006 IPCC GL, page 10.44-47, Table 10.17 − urinary energy (UE) is 0.04 GE for cattle and 0.02 for swine;− ash content of manure (ASH) is 0.11 for dairy cows, 0.115 for other cattle and 0.02 for swine − Bo 0.24 m3 CH4 / kg VS for dairy cattle (page 10.77, table 10A-4); 0.18 m3 CH4 / kg VS for other cattle (page 10.78, Table 10A-5); 0.45 m3 CH4 / kg VS for market swine and breeding swine (pages
10.80-10-81, Tables 10A7-10A-8)

Chapter 2: Methods and Data Documentation
2 - 159
Type and source of EF and OF Country Specific EFs for Dairy Cattle, Non-Dairy Cattle and Swine - Scientific-Practical Institute of Biotechnology in Animal Breeding and Veterinary Medicine (Maximovca village, Anenii Noi District), the latest data were published in the National Inventory Report: 1990-2016. Greenhouse Gas Sources and Sinks in the Republic of Moldova (2018) (see also CS EFs for dairy cattle, non-dairy cattle and swine in Table 5-37).CS EFs for the 3B ‘Manure Management’, calculated following a Tier 2 Methodology for Cattle and Swine Population in the Republic of Moldova, kg CH4/head/year
1990 1995 2000 2005 2010 2013 2014 2015 2016Dairy cows 13.5 6.7 4.4 4.9 4.8 4.9 5.2 5.1 5.1Other cattle (average) 5.8 3.2 2.3 2.6 2.3 2.3 2.4 2.3 2.5Swine (average) 5.1 3.7 2.1 2.0 2.0 2.7 2.6 2.6 2.5 Market swine 7.8 5.5 3.0 3.0 2.2 2.8 2.7 2.8 2.6 Fattening piglets 4.9 3.5 1.9 1.9 3.2 4.2 4.1 4.1 3.9
Uncertainty of AD and source ± 10%, expert judgementUncertainty of EF and source ± 30%, expert judgement (± 30% for Tier 1 and ± 20% for Tier 2, 2006 IPCC GL, page 10.48, chapter 10.3.4 ‘Uncertainty assessment’)Potential Improvements Planned improvements could include updating the AD and productivity indicators used to estimate CH4 emissions within this source category following a Tier 2 methodology, in particular for cattle and swine,
the animal categories that account for the largest share in the structure of total methane emissions originated from the 3B ‘Manure Management’ category.
Table 2.3.2.2: Information on Source Category 3B ‘Manure Management’ (Sheep, Goat, Horses, Mules and Asses, Poultry, Rabbit) – CH4Sector Agriculture Category 3B Manure ManagementSource / Gas Sheep, Goat, Horses, Mules and Asses, Poultry, Rabbit / CH4
Key Category? No
Category Description / Defini-tion
The decomposition of manure under anaerobic conditions (i.e., in absence of oxygen), during storage and treatment, produces CH4. These conditions occur most readily when large numbers of animals are managed in a confined area (e.g., dairy farms, beef feedlots, and swine and poultry farms), and where manure is disposed of in liquid-based systems. The term ‘manure’ is used here collectively to include both dung and urine (i.e., the solids and the liquids) produced by livestock.
Country Detail
Sheep include mature ewes (inclusive, breeding ewes for production of offspring and wool production and milking ewes where commercial milk production is the primary purpose), other mature sheep (>1 year) and growing lambs (intact males, castrates and females). Poultry include chickens (including, broiler chickens grown for producing meat, layer chickens for producing eggs, where manure is managed in dry systems, layer chickens for producing eggs, where manure is managed in wet systems and chickens under free-range conditions for egg and meat production), turkeys (including, breeding turkeys in confinement systems, turkeys grown for producing meat in confinement systems and turkey under free-range conditions for meat production), ducks (including, breeding ducks and ducks grown for producing meat), geese (including, breeding geese and geese grown for producing meat).
Equation(Describe variables for method used)
Tier 1 Methodology 2006 IPCC GL, page 10.37, equation 10.22
CH4 emissions = Σ(T) [(EF(T) • N(T))/106] Where:
CH4 emissions – CH4 from manure management, for a defined population, kt CH4/yr;EF(T) – emission factor for the defined livestock population, kg CH4 /head/yr;N(T) – the number of head of livestock species/category T in the country;T – species/category of livestock.
Reference 2006 IPCC Guidelines for national Greenhouse Gas Inventories, Volume 4: Agriculture, Forestry and Other Lan Use, Chapter 10: Emissions from Livestock and Manure Management.National Inventory Report: 1990-2016. Greenhouse Gas Sources and Sinks in the Republic of Moldova (2018).
Describe How and Why this Method Was Chosen The Tier 1 method has been chosen because this category is not a key source category and also because not all enhanced characterization data are available.
Type and source of activity dataAnimal population (thousand heads) – data are provided by the National Bureau of Statistics through Statistical Annual Report No. 24-agr „Animal Breeding Sector”. The Number of Livestock and Poultry in all Households Categories as of 1st of January (Annual Reports for 1990-2016) and the Basic Indicators of Animal Breeding Sector Development in all Households Categories in the Republic of Moldova (Annual Reports for 1990-2016). Statistical Yearbooks of Administrative-Territorial Units on Left Bank of Dniester River (ATULBD) for 1998 (page 224), 2002 (page 118), 2006 (page 109), 2010 (page 110), 2014 (page 104), 2017 (page 117).

Chapter 2: Methods and Data Documentation
2 - 160
Type and source of EF and OF IPCC Default EF for developed countries and cool climate (T < 15°C) from 2006 IPCC GL, pages 10.40-10.41, Tables 10.15-10.16: sheep – 0.19 kg CH4/head/yr; goat – 0.13 kg CH4/head/yr; horses – 1.56 kg CH4/head/yr; mules and asses – 0.76 kg CH4/head/yr; chicken – 0.03 kg CH4/head/yr; broiler – 0.02 kg CH4/head/yr; turkeys – 0.09 kg CH4/head/yr; ducks – 0.02 kg CH4/head/yr; rabbits – 0.08 kg CH4/head/yr.
Uncertainty of AD and source ± 10%, expert judgementUncertainty of EF and source ± 30%, for Tier 1 (2006 IPCC GL, page 10.48, chapter 10.3.4 ‘Uncertainty assessment’)Potential Improvements No potential improvements are planned to be implemented in the next inventory cycle for these animal categories under 3B ‘Manure Management’ category.
Table 2.3.2.3: Information on Source Category 3B ‘Manure Management’ (All Animal Types) – Direct Emissions – N2OSector Agriculture Category 3B Manure ManagementSource / Gas 3Ba. Direct emissions / All animal types / N2OKey Category? Tier 1: Yes: 1990 (L), 2016 (L); Tier 2: Yes: 1990 (L), 2016 (L, T) (Category 3Ba Direct N2O Emissions from Manure Management – aggregated)
Category Description / Defini-tion
Direct N2O emissions occur via combined nitrification and denitrification of nitrogen contained in the manure. The emission of N2O from manure during storage and treatment depends on the nitrogen and carbon content of manure, and on the duration of the storage and type of treatment. Nitrification (the oxidation of ammonia nitrogen to nitrate nitrogen) is a necessary prerequisite for the emission of N2O from stored animal manures. Nitrification is likely to occur in stored animal manures provided there is a sufficient supply of oxygen. Nitrification does not occur under anaerobic conditions. Nitrites and nitrates are transformed to N2O and dinitrogen during the naturally occurring process of denitrification, an anaerobic process.
Country Detail
Dairy cows include mature cows that are producing milk in commercial quantities for human consumption. Following definition in the 2006 IPCC GL, the dairy cow category does not include cows kept principally to produce calves. Non-dairy cattle population is further classified into subcategories based on animal and feed characteristics: calves and heifers up to 1 year; heifers between 12 and 18 months; heifers between 18 and 24 months, heifers of 24 months and more; breeding males and work bullocks. Sheep include mature ewes (inclusive, breeding ewes for production of offspring and wool production and milking ewes where commercial milk production is the primary purpose), other mature sheep (>1 year) and growing lambs (intact males, castrates and females). The mature swine include sows in gestation, sows which have farrowed and are nursing young and boars that are used for breeding purposes, while the growing swine include nursery, finishing, gilts that will be used for breeding purposes and growing boars that will be used for breeding purposes. Poultry include chickens (including, broiler chickens grown for producing meat, layer chickens for producing eggs, where manure is managed in dry systems, layer chickens for producing eggs, where manure is managed in wet systems and chickens under free-range conditions for egg and meat production), turkeys (including, breeding turkeys in confinement systems, turkeys grown for producing meat in confinement systems and turkey under free-range conditions for meat production), ducks (including, breeding ducks and ducks grown for producing meat), geese (including, breeding geese and geese grown for producing meat).
Equation(Describe variables for method used)
Tier 2 Methodology 2006 IPCC GL, Volume 4, Chapter 10, page 10.54, equation 10.25:
N2O D (mm) = [ ∑(S) [∑(T) (N(T) • Nex(T) • MS(T, S) )] • FE3(S)] • 44/28 Where:
N2O D (mm) – direct N2O emissions from category 3B Manure Management in the country (kg N2O/yr);N(T) – number of head of livestock species/category T in the country;Nex(T) – annual average N excretion per head of species/category T in the country (kg N/animal/yr);MS(T, S) – fraction of total annual nitrogen excretion for each livestock species/category T that is managed in manure management system S in the country, dimensionless; FE3(S) – emission factor for direct N2O emissions from manure management system S in the country, (kg N2O-N/kg N in manure management system S); S – manure management system;T – species/category of livestock.44/28 – conversion of (N2O-N) (mm) emissions to N2O (mm) emissions.
The calculation of the average N excretion rates Nex(T) is based on equation 10.30, page 10.57:Nex(T) = N rate(T) • (TAM /1000) • 365
Where:Nex (T) – annual N excretion for livestock category T (kg N/animal/yr);Nrate (T) – default N excretion rate (kg N (1000 kg animal mass)/day); TAM (T) – typical animal mass for livestock category T (kg/animal/yr).
Rates of annual N excretion for each livestock species/category Nex (T) were estimates using equation 10.31, page 10.58:Nex(T) = N intake (T) • (1 – N retention (T))
Where:N intake (T) – the annual N intake per head of animal of species/category T, (kg N/animal/yr);N retention (T) – fraction of annual N intake that is retained by animal of species/category T, dimensionless.

Chapter 2: Methods and Data Documentation
2 - 161
Reference 2006 IPCC Guidelines for national Greenhouse Gas Inventories, Volume 4: Agriculture, Forestry and Other Lan Use, Chapter 10: Emissions from Livestock and Manure Management.National Inventory Report: 1990-2016. Greenhouse Gas Sources and Sinks in the Republic of Moldova (2018).
Describe How and Why this Method Was Chosen The Tier 2 methodology has been used because this is a key source category.
Type and source of activity data
Animal population (thousand heads) and data necessary for calculation of the average N excretion rates Nex(T), inclusive: Weight (W) and Mature Weight (MW) in livestock and poultry (kg) – data are provided by the National Bureau of Statistics through Statistical Annual Report No. 24-agr „Animal Breeding Sector”. The Number of Livestock and Poultry in all Households Categories as of 1st of January (Annual Reports for 1990-2016) and the Basic Indicators of Animal Breeding Sector Development in all Households Categories in the Republic of Moldova (Annual Reports for 1990-2016). Statistical Yearbooks of Administrative-Territorial Units on Left Bank of Dniester River (ATULBD) for 1998 (page 224), 2002 (page 118), 2006 (page 109), 2010 (page 110), 2014 (page 104), 2017 (page 117).The Average Annual Nex(T) Excretion by Main Livestock and Poultry Categories (kg N/head/year) in the Republic of Moldova within 1990-2016 periods are provided in Table 5-44 of the National Inventory Report: 1990-2016. Greenhouse Gas Sources and Sinks in the Republic of Moldova (2018). The information on the Manure Management Systems Usage (MS%) in the RM within 1989-2016 periods is based on a study developed in May-June 2015 by the specialists from the Scientific-Practical Insti-tute of Biotechnology in Animal Breeding and Veterinary Medicine and the National Agency for Food Security (Cosman et al., 2015). In the process of carrying out this study, dairy cows and other cattle farms with a herd of more than 5 heads were inspected, as well as pig farms with more than 30 heads and the largest poultry farms in the country. The study comprised all districts of the country. In total, manure management systems from 179 farms were inspected, of which 96 cattle farms, 66 pig farms and 17 poultry farms (see also information provided in Tables 5-34 and 5-35 from the National Inventory Report: 1990-2016. Greenhouse Gas Sources and Sinks in the Republic of Moldova (2018).
Type and source of EF and OF IPCC default EFs for direct N2O emissions from manure management are from 2006 IPCC GL, pages 10.62-10.64, Table 10.21.Uncertainty of AD and source ± 30 %, expert judgementUncertainty of EF and source ± 100%, 2006 IPCC GL, page 10.66, section 10.5.4 ‘Uncertainty assessment’.
Potential Improvements The planned improvements could include collecting additional data, in particular on country specific manure management systems (historical data, starting with 1990, as well as recent information, for every 3 years), as well as those related to country specific N excreted rates (kg N/head/year) for different animal categories.
Table 2.3.2.4: Information on Source Category 3B ‘Manure Management’ (All Animal Types) – Indirect Emissions – N2OSector Agriculture Category 3B Manure ManagementSource / Gas 3Bb. Indirect emissions / All animal types / N2OKey Category? Tier 2: Yes: 1990 (L), 2016 (L) (Category 3Bb Indirect N2O Emissions from Manure Management – aggregated)
Category Description / Defini-tion
Indirect emissions result from volatile nitrogen losses that occur primarily in the forms of ammonia and NOx. The fraction of excreted organic nitrogen that is mineralized to ammonia nitrogen during manure collection and storage depends primarily on time, and to a lesser degree temperature. Simple forms of organic nitrogen such as urea and uric acid are rapidly mineralized to ammonia nitrogen, which is highly volatile and easily diffused into the surrounding air. Nitrogen losses begin at the point of excretion in houses and other animal production areas and continue through on-site management in storage and treat-ment systems (i.e., manure management systems). Nitrogen is also lost through runoff and leaching into soils from the solid storage of manure at outdoor areas, in feedlots and where animals are grazing in pastures. Pasture losses are considered separately in Chapter 11, Section 11.2, N2O Emissions from Managed Soils, as emissions of nitrogen compounds from grazing livestock.
Country Detail
Dairy cows include mature cows that are producing milk in commercial quantities for human consumption. Following definition in the 2006 IPCC GL, the dairy cow category does not include cows kept principally to produce calves. Non-dairy cattle populations is further classified into subcategories based on animal and feed characteristics: calves and heifers up to 1 year; heifers between 12 and 18 months; heifers between 18 and 24 months, heifers of 24 months and more; breeding males and work bullocks. Sheep include mature ewes (inclusive, breeding ewes for production of offspring and wool production and milking ewes where commercial milk production is the primary purpose), other mature sheep (>1 year) and growing lambs (intact males, castrates and females). The mature swine include sows in gestation, sows which have farrowed and are nursing young and boars that are used for breeding purposes, while the growing swine include nursery, finishing, gilts that will be used for breeding purposes and growing boars that will be used for breeding purposes. Poultry include chickens (including, broiler chickens grown for producing meat, layer chickens for producing eggs, where manure is managed in dry systems, layer chickens for producing eggs, where manure is managed in wet systems and chickens under free-range conditions for egg and meat production), turkeys (including, breeding turkeys in confinement systems, turkeys grown for producing meat in confinement systems and turkey under free-range conditions for meat production), ducks (including, breeding ducks and ducks grown for producing meat), geese (including, breeding geese and geese grown for producing meat).

Chapter 2: Methods and Data Documentation
2 - 162
Equation(Describe variables for method used)
Tier 2 Methodology
2006 IPCC GL, Volume 4, Chapter 10, equation10.26 on page 10.54 and equation 10.27 on page 10.56:N2OG(mm) = [∑(S) [∑(T) (N(T) • Nex(T) • MS(T, S)) • (FracGasMS /100) (T, S)] • FE4 • 44/28
Where:N2OG(mm) – indirect N2O emissions due to volatilization of N from Manure Management in the country (kg N2O/yr);N(T) – number of head of livestock species/category T in the country;Nex (T) – annual average N excretion per head of species/category T in the country (kg N/animal/yr);MS(T,S) – fraction of total annual nitrogen excretion for each livestock species/category T that is managed in manure management system S in the country, dimensionless; Frac GasMS – per cent of managed manure nitrogen for livestock category T that volatilizes as NH3 and NOx in the manure management system S, per cent (see in Table 10.22, page 10.65, Chapter 10, Volume 4, 2006 IPCC Guidelines); FE4 – emission factor for N2O emissions from atmospheric deposition of nitrogen on soils and water surfaces, the default value is 0.01 kg N2O-N/kg NH3-N+NOx-N volatilized (see Table 11.3, page 11.24, Chapter 11, Volume 4, 2006 IPCC Guidelines); S – manure management system; T – species/category of livestock.44/28 – conversion of (N2O-N)(mm) emissions to N2O (mm) emissions.
2006 IPCC GL, Volume 4, Chapter 10, equation10.28 on page 10.56 and equation 10.29 on page 10.57:N2O L(mm) = [∑(S) [∑(T) (N(T) • Nex(T) • MS(T, S) ) • (Frac leach MS /100) (T, S)] • FE5 • 44/28
Where:N2O L(mm) – indirect N2O emissions due to N leaching and runoff (kg N2O/yr);N(T) – number of head of livestock species/category T in the country;Nex (T) – annual average N excretion per head of species/category T in the country (kg N/animal/yr);MS (T, S) – fraction of total annual nitrogen excretion for each livestock species/category T that is managed in manure management system S in the country, dimensionless; Frac leach MS – per cent of managed manure nitrogen losses for livestock category T due to runoff and leaching during solid and liquid storage of manure (typical range 1-20 per cent); FE5 – emission factor for N2O emissions from nitrogen leaching and runoff, kg N2O-N/kg N leaching/runoff (default: 0.0075 kg N2O-N/kg N leaching/runoff) (see Table 11.3, page 11.24, Chapter 11, Volume 4, 2006 IPCC Guidelines); S – manure management system;T – species/category of livestock;44/28 – conversion of (N2O-N)L(mm) emissions to N2OL(mm) emissions.
2006 IPCC GL, Volume 4, Chapter 10, equation10.34 on page 10.65:N MMS_Avb = ∑(S) {∑(T) [(N(T) • Nex(T) • MS(T, S)) • (1-Frac Loss MS /100)]+ [N(T) • Nex(T) • Nbending MS]}
Where:NMMS_Avb – amount of managed manure nitrogen available for application to managed soils or for feed, fuel, or construction purposes, kg N/yr;N(T) – number of head of livestock species/category T in the country;Nex(T) – annual average N excretion per animal of species/category T in the country, kg N/animal/yr;MS(T, S) – fraction of total annual nitrogen excretion for each livestock species/category T that is managed in manure management system S in the country, dimensionless; FracLoss MS – amount of managed manure nitrogen for livestock category T that is lost in the manure management system S, per cent (see Table 10.23, page 10.67, Chapter 10, Volume 4, 2006 IPCC Guidelines); N bedding MS – amount of nitrogen from bedding (to be applied for solid storage and deep bedding MMS if known organic bedding usage), kg N/animal/year; S – manure management system;T – species/category of livestock.
Reference2006 IPCC Guidelines for national Greenhouse Gas Inventories, Volume 4: Agriculture, Forestry and Other Lan Use, Chapter 10: Emissions from Livestock and Manure Management and Chapter 11: N2O Emissions from managed Soils, and CO2 Emissions from Lime and Urea Application.National Inventory Report: 1990-2016. Greenhouse Gas Sources and Sinks in the Republic of Moldova (2018).

Chapter 2: Methods and Data Documentation
2 - 163
Describe How and Why this Method Was Chosen The Tier 2 methodology has been used because this is a key source category.
Type and source of activity data
Animal population (thousand heads) and data necessary for calculation of the average N excretion rates Nex(T), inclusive: Weight (W) and Mature Weight (MW) in livestock and poultry (kg) – data are provided by the National Bureau of Statistics through Statistical Annual Report No. 24-agr „Animal Breeding Sector”. The Number of Livestock and Poultry in all Households Categories as of 1st of January (Annual Reports for 1990-2016) and the Basic Indicators of Animal Breeding Sector Development in all Households Categories in the Republic of Moldova (Annual Reports for 1990-2016). Statistical Yearbooks of Administrative-Territorial Units on Left Bank of Dniester River (ATULBD) for 1998 (page 224), 2002 (page 118), 2006 (page 109), 2010 (page 110), 2014 (page 104), 2017 (page 117). The Average Annual Nex(T) Excretion by Main Livestock and Poultry Categories (kg N/head/year) in the Republic of Moldova within 1990-2016 periods are provided in Table 5-44 of the National Inventory Report: 1990-2016. Greenhouse Gas Sources and Sinks in the Republic of Moldova (2018). The information on the Manure Management Systems Usage (MS%) in the RM within 1989-2016 periods is based on a study developed in May-June 2015 by the specialists from the Scientific-Practical Institute of Biotechnology in Animal Breeding and Veterinary Medicine and the National Agency for Food Security (Cosman et al., 2015). In the process of carrying out this study, dairy cows and other cattle farms with a herd of more than 5 heads were inspected, as well as pig farms with more than 30 heads and the largest poultry farms in the country. The study comprised all districts of the country. In total, manure management systems from 179 farms were inspected, of which 96 cattle farms, 66 pig farms and 17 poultry farms (see also information provided in Tables 5-34 and 5-35 from National Inventory Report: 1990-2016. Greenhouse Gas Sources and Sinks in the Republic of Moldova (2018).
Type and source of EF and OF IPCC default EFs for indirect N2O emissions from manure management are from 2006 IPCC GL, Volume 4, Chapter 10, pages 10.65-10.67, Tables 10.22 and 10.23, respectively from Chapter 11, page 11.24, Table 11.3.
Uncertainty of AD and source ± 30 %, expert judgementUncertainty of EF and source ± 150%, 2006 IPCC GL, Chapter 10, page 10.67, section 10.5.4 ‘Uncertainty assessment’ and Chapter 11, page 11.24, section 11.2.2.4 ‘Uncertainty assessment’.
Potential Improvements The planned improvements could include collecting additional data, in particular on country specific manure management systems (historical data, starting with 1990, as well as recent information, for every 3 years), as well as those related to country specific N excreted rates (kg N/head/year) for different animal categories.
2.3.3. Category 3D ‘Agricultural Soils’
Tables 2.3.3.1 – 2.3.3.2 below comprise relevant information on source categories comprised within the inventory, including description of each source by gas allocated to category 3D ‘Agricultural Soils’.
Table 2.3.3.1: Information on Source Category 3D ‘Agricultural Soils’ – Direct Soil Emissions – N2OSector Agriculture Category 3D Agricultural SoilsSource / Gas 3Da. Direct N2O Soil Emissions / N2OKey Category? Tier 1: Yes: 1990 (L), 2016 (L, T); Tier 2: Yes: 1990 (L), 2016 (L, T) (Category 3Da Direct N2O Soil Emissions – aggregated for all sources)
Category Description / Defini-tion
In most soils, an increase in available N enhances nitrification and denitrification rates which then increase the production of N2O. Increases in available N can occur through human-induced N additions or change of land-use and/or management practices that mineralize soil organic N. The following N sources are included in the methodology for estimating direct N2O emissions from managed soils: − synthetic N fertilizers (FSN); − organic N applied as fertilizer (e.g., animal manure, compost, sewage sludge, rendering waste) (FON); − urine and dung N deposited on pasture, range and paddock by grazing animals (FPRP); − N in crop residues including from N-fixing crops and from forages during pasture renewal (FCR); − N mineralization associated with loss of soil organic matter (FSOM); and − drainage/management of organic soils (i.e., histosols) (FOS).
Country Detail
The main sources of direct N2O soil emissions in the Republic of Moldova are as following – in 1990: synthetic fertilizers (40.0%), organic N applied as fertilizers (24.1%), N mineralization associated with loss of soil organic matter (15.7%) and N in crop residues including from N-fixing crops and from forages during pasture renewal (15.1%), while in 2016: N mineralization associated with loss of soil organic matter (57.1%), synthetic fertilizers (19.4%), N in crop residues including from N-fixing crops and from forages during pasture renewal (11.4%) and organic N applied as fertilizers (7.4%). Fertilizers that are not ap-propriate for agricultural production (mineral fertilizers for balcony flowers, lawns and similar) are not included.

Chapter 2: Methods and Data Documentation
2 - 164
Equation(Describe variables for method used)
Tier 1 Methodology 2006 IPCC GL, Volume 4, Chapter 11, equation11.1 on pages 11.7 and 11.10:
N2O DIRECT = N2OSN + N2OON + N2OCR + N2OPRP + N2OSOMandN2O DIRECT = [ (N2O-N N inputs + N2O-N PRP)] • 44/28
Where:N2O-N N inputs = (FSN + FON + FCR + FSOM) • EF1 N2O-N PRP = FPRP • EF3
When:N2OSN = FSN • EF1 • 44/28
Where:N2O SN – N2O emissions from applied inorganic nitrogen fertilizers (kt/yr);FSN – annual amount of inorganic nitrogen fertilizers applied to soils (kg N/yr);EF1 – emission factor for N2O emissions from N inputs; default: 0.01 kg N2O-N/kg N applied; range: 0.003-0.03 kg N2O-N/kg N (see also Table 11.1, page 11.11);[44/28] – stoichiometric ratio of nitrogen content in N2O-N and N2O. N2OON = FON • EF1 • 44/28
Where:N2O ON – N2O emissions from applied organic N fertilizers (kt/yr);F ON = (FAM + FSEW + FCOMP + FOOA), total annual amount of organic N fertilizers applied to soils other than by grazing animals (kg N/yr);F AM – annual amount of animal manure N applied to soils (kg N/yr);F SEW – annual amount of total sewage N that is applied to soils (kg N/yr);F COMP – annual amount of total compost N applied to soils (kg N/yr);F OOA – annual amount of other organic amendments used as fertilizer (kg N/yr);EF1 – default EF: 0.01 kg N2O-N/kg N applied (range: 0.003-0.03 kg N2O-N/kg N) (see also Table 11.1, page 11.11);[44/28] – stoichiometric ratio of nitrogen content in N2O-N and N2O. N2OPRP = FPRP • EF3 PRP • 44/28
Where:N2O PRP – N2O emissions from urine and dung deposited by grazing animals;F PRP – annual amount of urine and dung N deposited by grazing animals on pasture, range and paddock (kg N/yr); FPRP = ∑ (s) [(N (T) • Nex (T)) • MS (T, PRP)]
Where:N (T) – number of head of livestock species/category T in the country (see 3A source category);Nex (T) – annual average N excretion per animal of species/category T in the country (kg N/animal/yr) (see 3B source category);MS(T, PRP) – fraction of annual amount of urine and dung N deposited by grazing animals on pasture, range and paddock/number of head of livestock species/category T (see 3B source category);EF3(PRP) – default emission factor values are: 0.02 kg N2O-N/kg N for cattle, swine and poultry; 0.01 kg N2O-N/kg N for other animal categories (see Table 11.1, page 11.11);[44/28] – stoichiometric ratio of nitrogen content in N2O-N and N2O. N2OCR = FCR • EF1 • 44/28
Where:FCR – annual amount of N in crop residues returned to soils annually, t N/yr;EF1 – default value of emission factor is 0.01 kg N2O-N/kg N (see also Table 11.1, page 11.11);[44/28] – stoichiometric ratio of nitrogen content in N2O-N and N2O.
When: FCR = (Crop (T) • RAG (T) • (1-Frac Remove (T)) + Crop (T) • RBG (T)) • (PCR/102) • (k6/102)
Where: Crop (T) – harvested annual dry matter yield for crop T t.d.m./ha; Crop(T) = Yield Fresh (T) • DRY

Chapter 2: Methods and Data Documentation
2 - 165
Equation(Describe variables for method used)
Yield Fresh (T) – harvested fresh yield for crop T, t/ha; DRY – dry matter fraction of harvested crop T, kg dm/t of yield (see Table 6-62 from the National Inventory Report: 1990-2016. Greenhouse Gas Sources and Sinks in the Republic of Moldova; see also Table 11.2, page 11.17, Chapter 11, Volume 4, 2006 IPCC Guidelines);
RAG (T) – ratio of above-ground residues dry matter to harvested yield for crop T (Crop(T)), t.d.mAG/t.d.m (see Table 5-70 from National Inventory Report: 1990-2016. Greenhouse Gas Sources and Sinks in the Republic of Moldova; information is based on Nicolaev N., Boincean B., Sidorov M., Vanicovici Gh., Coltun V. (2006), Agrotechnics. Ministry of Education and Youth of the RM – Balti: Presa universitara balteană, 2006, P. 298);RBG (T) – ratio of below-ground residues to harvested yield for crop T, t.d.mBG/t dm (see Table 5-70 from National Inventory Report: 1990-2016. Greenhouse Gas Sources and Sinks in the Republic of Moldova; see also Table 11.2, page 11.17, Chapter 11, Volume 4, 2006 IPCC Guidelines);Frac Remove (T) – fraction of above-ground residues of crop T removed and used for other purposes (see Table 5-70 from National Inventory Report: 1990-2016. Greenhouse Gas Sources and Sinks in the Republic of Moldova; see also Table 11.2, page 11.17, Chapter 11, Volume 4, 2006 IPCC Guidelines);PCR = amount of nitrogen in crop residues (% a.s.) (Table 5-71 from National Inventory Report: 1990-2016. Greenhouse Gas Sources and Sinks in the Republic of Moldova);k6 = coefficient reflecting the N in crop residues (Banaru, 2002) (see Table 5-71 from National Inventory Report: 1990-2016. Greenhouse Gas Sources and Sinks in the Republic of Moldova; information is based on Banaru A. (2002), Methodological Guidelines to Determine Humus Balance in Arable Soils, Ministry of Agriculture and Food Industry of the RM, Institute of Pedology, Agrochemistry and Soil Protection „Nicolae Dimo” and TACIS FDMOL 9901 Project ‘Support to Developing Education, Research and Extension Services in Agriculture’, Chisinau, 2002, 23 pages).
N2OSOM = FSOM • EF1 • 44/28Where:
EF1 – default 0.01 kg N2O-N/kg N applied (range: 0.003-0.03 kg N2O-N/kg N) (see also Table 11.1, page 11.11);[44/28] – stoichiometric ratio between the content of nitrogen in N2O-N and N2O;FSOM – the net annual amount of N mineralized in mineral soils as a result of loss of soil carbon through change in land use or management (t N/yr);
F (SOM) was estimated using equation 11.8, page 11.16, Chapter 11, Volume 4, 2006 IPCC Guidelines:FSOM = ∑ [(ΔC mineral • 1/R)]
Where:R – carbon and nitrogen ratio in the soil organic matter (C : N); the 2006 IPCC Guidelines default value of 10 (range from 8 to 15) is used for arable soils; according the national scientific sources (Krupenikov, Ganenko, 1984), the C : N ratio in the soil organic matter in the Republic of Moldova is around 10.7 (range from 10.1 to 11.3);ΔC mineral – annual change in carbon stocks in mineral soils, (t C/yr) (see Table 5-78 from the National Inventory Report: 1990-2016. Greenhouse Gas Sources and Sinks in the Republic of Moldova; was estimated using the “Methodology for determining the carbon balance in agricultural lands for estimating GHG emissions” (which is based on Banaru, Anatol (2000), Methodology to Calculate CO2 Emissions from Agricultural Soils, In the collection of papers „Climate Change: Research, Studies, Solutions, Ministry of Environment / UNDP Moldova. „Bons Offices” S.R.L. Chisinau, 2000. P. 115-123), see more details in the Annex A3-4.2 of the National Inventory Report: 1990-2016. Greenhouse Gas Sources and Sinks in the Republic of Moldova).
References
2006 IPCC Guidelines for national Greenhouse Gas Inventories, Volume 4: Agriculture, Forestry and Other Lan Use, Chapter 11: N2O Emissions from managed Soils, and CO2 Emissions from Lime and Urea Application.National Inventory Report: 1990-2016. Greenhouse Gas Sources and Sinks in the Republic of Moldova (2018) (in English).Banaru Anatol (2000), Methodology to Calculate CO2 Emissions from Agricultural Soils, In the collection of papers „Climate Change: Research, Studies, Solutions, Ministry of Environment / UNDP Moldova. „Bons Offices” S.R.L. Chisinau, 2000. P. 115-123 (in Rumanian).Banaru A. (2002), Methodological Guidelines to Determine Humus Balance in Arable Soils, Ministry of Agriculture and Food Industry of the RM, Institute of Pedology, Agrochemistry and Soil Protection „Nicolae Dimo” and TACIS FDMOL 9901 Project ‘Support to Developing Education, Research and Extension Services in Agriculture’, Chisinau, 2002, 23 pages (in Rumanian).Кrupenikov I.А., Ganenco V.P. (1984), Chernozems: Comparative Features, Genesis. Humus Conditions. In the book ‘Soils of Moldova’. V.1, Chisinau, 1984, pp. 86-96 (in Russian).
Describe How and Why this Method Was Chosen The Tier 1 method has been chosen because the CS EFs are not available.

Chapter 2: Methods and Data Documentation
2 - 166
Type and source of activity data
− Synthetic and Organic N fertilizers – National Bureau of Statistics through the Statistical Yearbooks of the RM for 1988 (page 280), 1994 (page 239), 1999 (page 330), 2003 (page 442), 2006 (page 352), 2011 (page 345) 2014 (page 345) and 2017 (page 306); Statistical Yearbooks of the Administrative-Territorial Units on the Left Bank of Dniester for 1998 (page 230), 2000 (page 107), 2002 (page 111), 2006 (page 108), 2009 (page 107), 2012 (page 114), 2017 (page 110). The National Bureau of Statistics is collecting statistical data on the amount of synthetic and organic N fertilizers applied to soils through Questionnaire no. 9-agr “The use of phytosanitary products and the introduction of synthetic and organic fertilizers in the crop yield of year…”. This questionnaire is submitted annually to the territorial statistical institution, by December 5, by agricultural enterprises and organizations irrespective of the organizational-legal and property forms (including individual farms with a total area of 50 ha and more) depending on the location of the land. Individual farms with an area less than 50 ha are not required to report the data related to the type of fertilizers applied to soil. Considering that most of the livestock and poultry population is included in individual farms which, also do not report to the territorial statistical institution, it is obvious that the statistical data on the organic N fertilizers reported in the statistical yearbooks is much underestimated.
− Organic N fertilizers – following the above-mentioned information, within the latest inventory cycle, the amount of organic N fertilizers applied to soils was estimated based on the information on the total amount of excreted nitrogen (Nex(T)) in all manure management systems and the amount managed manure nitrogen available for application to managed soils (NMMS_Avb) (see the information provided in Table 5-54 of the National Inventory Report: 1990-2016. Greenhouse Gas Sources and Sinks in the Republic of Moldova);
− Urine and dung N deposited on pasture, range and paddock by grazing animals – in order to estimate the amount of nitrogen from urine and dung deposited by grazing animals (see Table 5-67 from National Inventory Report: 1990-2016. Greenhouse Gas Sources and Sinks in the Republic of Moldova), there were used activity data on the total population of livestock and poultry from the Statistical Annual Report No. 24-agr ‘Animal Breeding Sector’: ‘The Number of Livestock and Poultry in all Households Categories as of 1st of January’ (annually for 1990-2016 periods), the Statistical Yearbooks of the ATULBD (identical AD to those used under the 3A ‘Enteric Fermentation’ and 3B ‘Manure Management’), country specific data on nitrogen excretion rate Nex(T) (in kg N/head/yr) and country specific values of the different manure management systems usage in the Republic of Moldova (identical to those used under the 3B ‘Manure Management’);
− N in crop residues – National Bureau of Statistics on-line database, Section ‘Sown Area, crops average yield and harvest within 1980-2016: <http://statbank.statistica.md/pxweb/Database/RO/16%20AGR/AGR02/AGR02.asp>; Statistical Yearbooks for ATULBD: 1998 (page 218-223), 2000 (page 109-113), 2002 (page 113-117), 2003 (page 106-109), 2006 (page 101-104),2009 (page 97-99), 2011 (page 100-102), 2014 (page 94-96), 2017 (page 111-114).
− N mineralization associated with loss of soil organic matter – calculated by the specialist of the Institute of Pedology, Agrochemistry and Soil Protection “Nicolae Dimo” (see details above with reference to N2OSOM).
Type and source of EF and OF
IPCC Default EFs from 2006 IPCC GL, page 11.11, table 11.1:− EF1 for N additions from mineral fertilizers, organic amendments, crop residues, and N mineralized from mineral soils as a result of loss of soil carbon – 0.01 kg N2O-N/kg N;− EF3 PRP, CPP for cattle (dairy, non-dairy and buffalo), poultry and pigs – 0.02 kg N2O-N/kg N;− EF3 PRP, SO for sheep and ‘other animals’ – 0.01 kg N2O-N/kg N.
Uncertainty of AD and source
− synthetic N fertilizers ± 5%, expert judgment; − organic N applied as fertilizer (e.g., animal manure, compost, sewage sludge, rendering waste) ± 30%, expert judgment; − urine and dung N deposited on pasture, range and paddock by grazing animals ± 30%, expert judgment; − N in crop residues including from N-fixing crops and from forages during pasture renewal ± 5%, expert judgment; − N mineralization associated with loss of soil organic matter ± 5%, expert judgment.
Uncertainty of EF and source
− synthetic N fertilizers ± 6%, expert judgment; − organic N applied as fertilizer (e.g., animal manure, compost, sewage sludge, rendering waste) ± 6%, expert judgment; − urine and dung N deposited on pasture, range and paddock by grazing animals ± 50%, expert judgment; − N in crop residues including from N-fixing crops and from forages during pasture renewal ± 25%, expert judgment; − N mineralization associated with loss of soil organic matter ± 25%, expert judgment.
Potential Improvements Potential improvements could include activities focused on obtaining more precise activity data and country specific coefficients and parameters used to estimate direct N2O emissions from nitrogen mineraliza-tion associated with loss of soil carbon as a result of land-use or management change under the 3D ‘Agriculture Soils’ category.
Table 2.3.3.2: Information on Source Category 3D ‘Agricultural Soils’ – Indirect Soil Emissions – N2OSector Agriculture Category 3D Agricultural SoilsSource / Gas 3Db. Indirect N2O Soil Emissions / N2OKey Category? Tier 1: Yes: 1990 (L), 2016 (L, T); Tier 2: Yes: 1990 (L), 2016 (L, T) (Category 3Db Indirect N2O Soil Emissions – aggregated for all sources)

Chapter 2: Methods and Data Documentation
2 - 167
Category Description / Defini-tion
Indirect emissions consist from two pathways. The first of these pathways is the volatilization of N as NH3 and oxides of N (NOx), and the deposition of these gases and their products NH4+ and NO3
- onto soils and the surface of lakes and other waters. The second pathway is the leaching and runoff from land of N from synthetic and organic fertilizer additions, crop residues, mineralization of N associated with loss of soil C in mineral and drained/managed organic soils through land-use change or management practices, and urine and dung deposition from grazing animals. This methodology described addresses the following N sources of indirect N2O emissions from managed soils arising from agricultural inputs of N: − synthetic N fertilizers (FSN); − organic N applied as fertilizer (e.g., animal manure, compost, sewage sludge, rendering waste) (FON); − urine and dung N deposited on pasture, range and paddock by grazing animals (FPRP); − N in crop residues including from N-fixing crops and from forages during pasture renewal (FCR); and− N mineralization associated with loss of soil organic matter (FSOM).
Country Detail The main sources of indirect N2O soil emissions in the Republic of Moldova are as following – in 1990: N2O emissions from leaching and runoff from managed soils in regions where leaching and runoff occurs (70.0%) and N2O emissions from atmospheric deposition of N volatilized from managed soils (30.0%), while in 2016: N2O emissions from leaching and runoff from managed soils in regions where leaching and runoff occurs (84.5%) and N2O emissions from atmospheric deposition of N volatilized from managed soils (15.5%).
Equation(Describe variables for method used)
Tier 1 Methodology 2006 IPCC GL, Volume 4, Chapter 11, equation11.9 on page 11.21:
N2O ATD = {(FSN • Frac GASF) + ((FON + FPRP) • Frac GASM)} • EF4 • 44/28Where:
N2O ATD – N2O emissions from atmospheric deposition of N volatilized from managed soils; F SN – annual amount of inorganic N fertilizers applied to soils (t N/yr);Frac GASF – fraction of inorganic fertilizers N that volatilizes as NH3 and NOx, t N volatilized (the default value is 0.1 t NH3-N + NOx-N/t N in inorganic N fertilizers applied to soils) (range from 0.03-0.3 t NH3-N + NOx-N/t N in inorganic N fertilizers applied to soils) (see also Table 11.3, page 11.24);F ON – annual amount of managed animal manure, compost, sewage sludge and other organic N additions applied to soils (t N/yr);F PRP – annual amount of urine and dung N deposited by grazing animals on pasture, range and paddock (t N/yr);Frac GASM – fraction of applied organic N fertilizers materials (FON) and of urine and dung N deposited by grazing animals (FPRP) that volatilizes as NH3 and NOx, (the default value is 0.2 t NH3-N + NOx-N/t N in manure) (range from 0.05 to 0.5 t NH3-N + NOx-N/t N in manure) (see also Table 11.3, page 11.24);EF4 – emission factor for N2O emissions from atmospheric deposition of N on soils and water surfaces (the default value is 0.01 t N2O-N/t NH3-N + NOx-N volatilized) (range from 0.002 to 0.05 t N2O-N/t NH3-N and NOx-N volatilized) (see also table 11.3, page 11.24);[44/28] – stoichiometric ratio of nitrogen content in N2O-N and N2O.
2006 IPCC GL, Volume 4, Chapter 11, equation11.10 on page 11.21:
N2OL = {(FSN + FON + FPRP + FCR+ FSOM) • Frac LEACH-(H))} • EF5 • 44/28Where:
N2OL – N2O emissions from leaching and runoff from managed soils in regions where leaching and runoff occurs; F SN – annual amount of inorganic nitrogen fertilizers applied to soils (t N/yr);F ON – annual amount of managed animal manure, compost, sewage sludge and other organic nitrogen applied to soils (t N/yr);F PRP – annual amount of urine and dung nitrogen deposited by grazing animals on pasture, range and paddock (t N/yr);FCR – nitrogen in crop residues (above- and below-ground), including N-fixing crops and forage/pasture renewal returned to soils (t N/yr);F SOM – annual amount of nitrogen mineralized in mineral soils associated with loss of soil carbon from soil organic matter as a result of changes to land use or management (t N/yr);Frac LEACH – fraction of all nitrogen added to/mineralized in managed soils that is lost through leaching and run-off, kg N: the default value is 0.3 kg N/kg N additions or deposited by grazing animals (range: 0.1-0.8 t N/t N) (see also Table 11.3, page 11.24);EF5 – emission factor for N2O emissions from nitrogen leaching and run-off (the default value is 0.0075 t N2O-N/t N leaching/runoff) (range: 0.0005-0.025 t N2O-N/t N leaching / runoff) (see also Table 11.3, page 11.24); [44/28] – stoichiometric ratio of nitrogen content in N2O-N and N2O.
Reference 2006 IPCC Guidelines for national Greenhouse Gas Inventories, Volume 4: Agriculture, Forestry and Other Lan Use, Chapter 11: N2O Emissions from managed Soils, and CO2 Emissions from Lime and Urea Application.

Chapter 2: Methods and Data Documentation
2 - 168
Describe How and Why this Method Was Chosen The Tier 1 method has been chosen because the CS EFs are not available.
Type and source of activity data The activity data are the same as for source category 3Da Direct N2O Soil Emissions.
Type and source of EF and OF
IPCC Default EFs are from 2006 IPCC GL, page 11.24, table 11.3:− EF4 (N volatilization and re-deposition): 0.01 kg N2O-N / kg NH3-N + NOx-N volatilized;− EF5 (leaching / runoff): 0.0075 kg N2O-N / kg N leaching/runoff;− Frac GASF (volatilization from synthetic fertilizer): 0.10 kg NH3-N + NOx-N / kg N in synthetic fertilizers applied to soils;− Frac GASM (volatilization from all organic N fertilizers applied and dung and urine deposited by grazing animals): 0.20 kg NH3-N + NOx-N / kg N applied or deposited;− Frac LEACH (N losses by leaching/runoff for regions where Σ (rain in rainy season) – Σ (PE in same period) > soil water holding capacity, or where irrigation (except drip irrigation) is employed): 0.3 kg
N/kg N additions or deposited by grazing animals.
Uncertainty of AD and source − atmospheric deposition of N volatilized from managed soils ± 70%, expert judgment; − N leaching and runoff from managed soils in regions where leaching and runoff occurs ± 75%, expert judgment
Uncertainty of EF and source − atmospheric deposition of N volatilized from managed soils ± 150%, expert judgment; − N leaching and runoff from managed soils in regions where leaching and runoff occurs ± 150%, expert judgment
Potential Improvements No potential improvements are planned to be implemented in the next inventory cycle for source category 3Db ‘Indirect N2O Soil Emissions’.
2.3.4. Category 3H ‘Urea Application’
Table 2.3.4.1 below comprises relevant information on source allocated to category 3H ‘Urea Application’.
Table 2.3.4.1: Information on Source Category 3H ‘Urea Application’ – CO2Sector Agriculture Category 3H Urea ApplicationSource / Gas Urea Application / CO2
Key Category? NoCategory Description / Defini-tion
Adding urea to soils during fertilization leads to a loss of CO2 that was fixed in the industrial production process. Urea (CO(NH2)2) is converted into ammonium (NH4+), hydroxyl ion (OH-), and bicarbonate (HCO3
-
), in the presence of water and urease enzymes. Similar to the soil reaction following addition of lime, bicarbonate that is formed evolves into CO2 and water. Country Detail No urea is produced in the Republic of Moldova. The urea consumption increased significantly since 1995 (82.7 tons) to 2016 (16,738.2 tons).
Equation(Describe variables for method used)
Tier 1 Methodology
2006 IPCC GL, Volume 4, Chapter 11, equation11.13 on page 11.32:
CO2 = M • EF • 44/12Where:
CO2 – annual CO2 emissions from urea application (kt/yr);M – annual amount of urea fertilization (kt urea/yr);EF – emission factor, tons C/tons urea (default value: 0.20 t C/t urea) (see on page 11.32, section 11.4.1 ‘Choice of method’, Chapter 11, Volume 4, 2006 IPCC Guidelines);[44/12] – stoichiometric ratio of carbon content in CO2-C and CO2.
Reference 2006 IPCC Guidelines for national Greenhouse Gas Inventories, Volume 4: Agriculture, Forestry and Other Lan Use, Chapter 11: N2O Emissions from managed Soils, and CO2 Emissions from Lime and Urea Application.

Chapter 2: Methods and Data Documentation
2 - 169
Describe How and Why this Method Was Chosen The Tier 1 method has been chosen because this category is not a key source category and also because a CS EF is not available.
Type and source of activity data Data on urea import in the Republic of Moldova are provided by the Custom Service of the Republic of Moldova.
Type and source of EF and OF The IPCC default emission factor (0.20 t C / t urea) is from 2006 IPCC Guidelines (see on page 11.32, section 11.4.1 ’Choice of method’, Chapter 11: N2O Emissions from managed Soils, and CO2 Emissions from Lime and Urea Application.
Uncertainty of AD and source ± 30%, expert judgmentUncertainty of EF and source ± 50%, expert judgment
Potential Improvements Potential improvements could include updating AD used to estimate CO2 emissions from urea application in the Republic of Moldova based on alternative sources of information (other than those provided by the Custom Service of the Republic of Moldova).
2.4. Land Use, Land-Use Change and Forestry Sector
Relevant information on categories comprised within the inventory, including description of each source and/or sink category allocated to Sector 4 ‘LULUCF’ is provided below.
2.4.1. Category 4A ‘Forest Land’
Tables 2.4.1.1 – 2.4.1.3 below comprise relevant information on source and/or sink categories comprised within the inventory, including description of each source and/or sink by gas allocated to category 4A ‘Forest Land’.
Table 2.4.1.1: Information on Category 4A ‘Forest Land’ – CO27
Sector LULUCFCategory 4A Forest LandSource and/or Sink Category / Gas 4A1 Forest Land Remaining Forest Land – CO2
Key Category? Tier 1: Yes: 1990 (L), 2016 (L, T); Tier 2: Yes: 1990 (L), 2016 (L, T)
Category Description / Defini-tion
According to the national definition, ‘forest’ is an element of geographical landscape, a functional unit of the biosphere, composed of the totality of forest vegetation (dominated by trees and shrubbery), live layers, animals and microorganisms which are interdependent in their biological development and affect their habitat. Lands covered with forest vegetation occupying areas over 0.25 ha are regarded as forests. The minimal consistency of trees and shrubbery for the lands with forest vegetation to be considered forests should reach an operational level of 30 per cent. The consistency requirement should apply only to trees and shrubbery with a natural potential to reach a minimum height of 5 meters at maturity.
Country Detail
The 4A1 “Forest Lands Remaining Forest Lands” category covers estimation of CO2 emissions/removals from the Republic of Moldova’s forests, including above-ground and below-ground biomass (biomass increments in forests, losses from authorized and illegal harvesting etc.). In the Republic of Moldova, the areas covered with forests are 386.5 thousand ha in 2016 or circa 11.8 per cent of the country’s territory. In order to ensure a constant ecological equilibrium and a stronger effect on the climate and hydrological conditions, enhance productivity of agricultural lands, forest lands should occupy at least 15 percent of the country’s territory. The total volume of standing wood mass in the forests of the Republic of Moldova is circa 45.4 million m3, on average 118 m3 per hectare. The average forest increment is 3.8 m3/year/ha, and the total average increment is circa 1,468.7 thousand m3/year.
7 Dry Matter

Chapter 2: Methods and Data Documentation
2 - 170
Equation(Describe variables for method used)
Methodology: Tier 2. Equations 2.7-2.14 from the 2006 IPCC Guidelines (Volume 4, Chapter 2, Pages 2.12-2.18):1. Annual changes in carbon stocks due to biomass increment in forest land remaining forest land (in stem, branches, leaves, roots), using the following equation:
∆CG = ∑ (A • G total • CF)Where:
∆CG – annual changes in carbon stocks due to biomass increment in forest land remaining forest land, t C/yr;A – area of forest land remaining forest land, ha;CF – carbon fraction of dry matter;G total – annual biomass increment above and below-ground (t d.m.7/yr/ha), calculated using the following equation:
G total = ∑ {Iv • BCEFI • (1 + R)}Where:
Iv – net annual increment of growing stock, m3/yr/ha;R – below-ground biomass to above-ground biomass ratios;BCEFI – biomass conversion and expansion factors.
In above-ground biomass increment for the appropriate group of species/vegetation (t of above-ground biomass increment/m3 total current increments), estimated by formula:
BCEFI = BEFI • DWhere:
BEFI – biomass expansion factors for conversion of annual net increment to above-ground tree biomass increment;D – basic wood density, t MC/m3 volume for standing wood.
2. Annual decrease in carbon mass through biomass removals (from authorized felling and illegal logging, disturbances etc.), estimated by the following formula:
∆CL = L felling + L fuelwood + L perturbationsWhere:
∆CL – annual decrease in carbon stocks due to biomass loss (felling and other losses), t C/yr;L felling – annual carbon loss due to commercial felling, t C/yr; L fuelwood – annual carbon loss due to fuel wood gathering, t C/yr;L perturbations – annual carbon loss due to loss of biomass affected by disturbances (diseases and pests, natural calamities, mass droughts etc.), t C/yr.
The respective indicators were estimated by the following formula:L felling = {H • BCEFR • (1+R)} • CF
Where:H – annual wood removals, m3;BCEF
R – biomass conversion and expansion factors for extracted round wood (t of biomass extracted /m3 extractions), which can be estimated by the following formula:
BCEFR = D • BEFR Where:
D – basic wood density (t MC/m3 volume for standing wood);BEFR – biomass expansion factor for extracted round wood;
L fuelwood = [{FG trees • BCEFR • (1+R)} + FG parts of trees • D] • CFWhere:
FG trees – annual volume of fuelwood removal of whole trees, m3;FG parts of trees – annual volume of fuelwood removal as parts of trees, m3;BCEFR – biomass conversion and expansion factors for extracted fuelwood (t of biomass extracted /m3 extractions), which can be estimated by the following formula:BCEFR = D • BEFR
Where:D – basic wood density (t d.m/m3 volume for standing wood);BEFR – biomass expansion factor for fuel wood removals;

Chapter 2: Methods and Data Documentation
2 - 171
Equation(Describe variables for method used)
L perturbations = {A perturbations • BW • (1 + R) • CF • fd}Where:
Aperturbations – areas affected by disturbances (diseases and pests, natural calamities, mass droughts etc.), ha/yr;BW – average of above-ground biomass of forest areas affected by disturbances, t d.m/ha;R – below-ground biomass to above-ground biomass ratios;CF – carbon fraction of dry matter;
fd – fraction of above-ground biomass lost in disturbance, t d.m/ha;Reference 2006 IPCC Guidelines (Volume 4, Chapter 2, Pages 2.12-2.18)Describe How and Why this Method Was Chosen
In principle, for both stages, the methodologies described in the 2006 IPCC Guidelines are applicable under the conditions of the RM. At the same time, country specific emission/removals factors were used, regarding annual biomass increment, the share of carbon in biomass etc., as well as sectorial activity data (forest land areas by species/categories of species, afforestation, wood mass harvesting etc.).
Type and source of activity data
Data on the areas of forest land in the Republic of Moldova, in the time series from 1990 through 2016, available into a series of national/sectorial reports on forestry resources (National Report on Forestry Resources of the Republic of Moldova (2011); General Land Cadasters for 1990-2017 periods; OSC Report on updating basic indicators for forest and other types of forest vegetation in the Republic of Moldova (2016); General Land Cadasters for 1990-2017 periods; Land Use and Land Use-Change Matrix for 1970-2016 periods.. beginning with 2013, information on the distribution of predominant forest species were taken from Forestry Research and Management Institute (ICAS) database.The volume of commercial timber, as well as the quantity of fuel wood gathered in the RM, revealed illegal logging (on other owners lands, inclusively), data being provided by the “Moldsilva” Agency, and the Inspectorate for Environmental Protection, as well as data available in the Statistical Yearbooks of the ATULBD on fuel wood harvests in forests on the left bank of Dniester river: Statistical Records/Reports of “Moldsilva” Agency and of the State Ecological Inspectorate for the 1990-2016 time series; D. Galupa, I. Talmaci, L. Spitoc, Study for the Republic of Moldova “Ensuring sustainability of forests and liveli-hoods through improving governance and control of illegal logging”. Chisinau, Editorial Center of UASM, 2005, 116 pages; Statistical Yearbooks of the ATULBD (2000-2017); Galupa Dumitru, Ciobanu Anatol, Scobioala Marian et al. (2011), Illegal logging of forest vegetation in the Republic of Moldova. Analytical study, Chisinau, “Moldsilva” Agency, 38 pages.
Type and source of EF and OF
For to estimate annual biomass increments and losses, country specific emission factors were calculated/developed, were used production tables, data on actual productivity of stands, according to the forest planning records (Оsadcev.G. Ivankov P.Т., Sergovskii P.S. et al. (1955), Guidebook on Woodworking (for Forest Farms Consumer Goods Manufacturing Workshops). Moscow, 1955 (in Russian); Giurgiu V., Decei I., Armasescu S. Biometriy of Trees and Stands in Romania, 1972; Shvidenko A.Z., Savich J.N. (1987), Reference Materials for Evaluation of Forests in Ukraine and Moldova. Kiev, Urozhai, 1987 (in Rus-sian); Kapp G., Velsen-Zerweck M., Horst A., Horn L., Galupa D. Talmaci I. et al.: The Baseline Study for the Soil Conservation Project in Moldova, 2003; Vanin S. I. (1949), Wood Science, Moscow (in Russian).
Species Average annual net increments, m3/ha
Basic wood density, t.d.m./m3 fresh volume
Biomass expansion factor for current incre-
ments, BEF1
Biomass expansion factor for commercial felling harvest, BEFR
Root-shoot ratio appro-priate to increments
Carbon fraction of dry matter
Fraction of biomass left to decay in forest,%
Quercus spp. 3.9 0.835 1.20 1.20 0.40 0.50 0.05Carpinus spp. 5.0 0.85 1.20 1.10 0.35 0.50 0.05Fraxinus spp. 4.4 0.72 1.20 1.20 0.28 0.49 0.05Acer spp. 2.3 0.75 1.20 1.15 0.28 0.49 0.05Ulmus spp. 2.9 0.70 1.20 1.15 0.28 0.49 0.05Tilia spp. 6.4 0.55 1.20 1.15 0.21 0.50 0.05Salix spp. 6.5 0.38 1.20 1.20 0.21 0.49 0.05Pinus spp. 4.7 0.535 1.15 1.10 0.46 0.51 0.05Populus spp. 5.2 0.51 1.20 1.20 0.21 0.50 0.05Robinia spp. 3.2 0.78 1.20 1.20 0.28 0.49 0.05Other species 3.0 0.70 1.20 1.15 0.28 0.50 0.05
Uncertainty of AD and source ±15%, expert judgmentUncertainty of EF and source ±5%, expert judgmentPotential Improvements Data regarding the actual consumption of fuel wood from the managed forest land of the RM, as well as updating national emission/removal factors (basic wood density, biomass expansion factors etc.).

Chapter 2: Methods and Data Documentation
2 - 172
Table 2.4.1.2: Information on Category 4A ‘Forest Land’ – CO2Sector LULUCFCategory 4A Forest LandSource and/or Sink Category / Gas 4A2 Land Converted to Forest Land – CO2
Key Category? Tier 1: Yes: 1990 (L), 2016 (L, T); Tier 2: Yes: 1990 (L), 2016 (L, T)Category Description / Defini-tion
This category includes land (degraded land, non-productive agricultural land, etc.) subject to conversion to forests (afforestation). The category includes above-ground and below-ground biomass (biomass increment in new forests; losses / gains of biomass due to conversion), carbon losses (carbon losses / gains due to conversion).
Country Detail
The conversion to forest land included afforestation under the Moldova Soil Conservation Project (MSCP) and Moldova Community Forestry Development Project (MCFDP). Both projects are implemented under the Clean Development Mechanism (CDM) of the Kyoto Protocol, and have completed all national and international validation and registration procedures. Several goals are achieved within the respec-tive projects: restoration of degraded land, improvement of local population supply with forest products and GHG absorption gain. The total area planted within these projects represent circa 28.8 thousand ha. The net CO2 emissions reduction into the atmosphere will account for circa 4.8 million tons (MSCP – 3.6 million t; MCFDP – 1.2 million t).
Equation(Describe variables for method used)
Methodology: Tier 2 and Tier 3. For estimate CO2 removals from 4A2 “Land Converted to Forest Land” is establishing current biomass increments (according to the results from the international monitoring and certification of MSCP and MCFDP). For estimations it was used Equation 2.15 from the 2006 IPCC Guidelines (Volume 4, Chapter 2, Page 2.20):
ΔCB = ΔCG + ΔCConversion – ΔCLWhere:
ΔC B – annual change in carbon stocks in biomass on land converted to forest land, t C/yr;ΔC G – annual increase in carbon stocks in biomass due to growth on land converted to forest land, t C/yr;ΔC Conversion – initial change in carbon stocks in biomass resulting from the land-use conversion, t C/yr; ΔC L – annual decrease in biomass carbon stocks due to losses from harvesting, fuel wood gathering and disturbances on land converted to forest land, disturbances t C/yr
Initial changes in carbon stocks in biomass on land converted to forest land (ΔC Conversion) were estimated using Equation 2.16 from the 2006 IPCC Guidelines (Volume 4, Chapter 2, Page 2.20):ΔCConversion = ∑{(BAfter − BBefore) • ΔATO OTHERS} • CF
Where:B After – biomass stocks on land immediately after the conversion, t d.m./ha;B Before – biomass stocks on land before the conversion, t d.m./ha;ΔA TO OTHERS – area of land-use converted to forest land in a certain year, ha/yr;CF – carbon fraction of dry matter.
Reference 2006 IPCC Guidelines (Volume 4, Chapter 2, Page 2.20)Describe How and Why this Method Was Chosen
The estimation process considered increases in dead wood (litter) and in organic soil carbon since afforestation is primarily done on degraded land with a low fertility, with forest vegetation contributing sub-stantially to carbon gain.
Type and source of activity data General Land Cadasters for 1970-2017 periods; Land Use and Land Use-Change Matrix for 1970-2016 periods. PDD for MSCP and MCFDP; Annual Reports from “Moldsilva” Agency to the World Bank for 2004-2015 time series; Monitoring Reports from “Moldsilva” Agency for MSCP and MCFDP (2012; 2013; 2017; 2018).
Type and source of EF and OF
Country specific emission factors have been used (Monitoring Reports from “Moldsilva” Agency for MSCP and MCFDP (2012; 2013; 2017; 2018)Indicators Units Value
Annual average carbon gains in biomass (trees and shrubs) Mg C/ha/yr 1.74Annual average carbon gains in dead wood (litter) Mg C/ha/yr 0.41Annual average organic carbon gains in soil Mg C/ha/yr 0.32Conversion period years 20
Uncertainty of AD and source ±15%, expert judgmentUncertainty of EF and source ±5%, expert judgmentPotential Improvements N/A.

Chapter 2: Methods and Data Documentation
2 - 173
Table 2.4.1.3: Information on Category 4A ‘Forest Land’ – CH4, N2O, NOx and COSector LULUCFCategory 4A Forest LandSource and/or Sink Category / Gas 4A2 Land Converted to Forest Land – CH4, N2O, NOx and CO
Key Category? NoCategory Description / Defini-tion
This category includes forests affected by different spontaneous or human-generated fires. Due to the specific features of local forests (predominance of deciduous species), this phenomenon is relatively limited.
Country Detail Most fires are located in young forests or stands, in particular in the vicinity of croplands.
Equation(Describe variables for method used)
The methodology used to estimate non-CO2 emissions is a Tier 1 method (2006 IPCC Guidelines), applying the following formula:Lfire = A • MB • Cf • Gef • 10-3
Where:Lfire – amount of GHG emissions (including non-CO2) from fires, t/yr;A – area burnt, ha/yr;MB – mass of fuel available for combustion, t/ha;Cf – combustion factor, the default value used is 0.45 (2006 IPCC Guidelines, Volume 4, Chapter 2, Table 2.6, Page 2.48);MB • Cf – the amount of fuel actually burnt, its value, according to MSCP and MCFDP estimates is 32 632.6 kg d.m./ha;
Gef – emission factor, kg/t d.m. burnt.Reference 2006 IPCC Guidelines, Volume 4, Chapter 2: Tables 2.5-2.6, Pages 2.47-2.48; Monitoring Reports from “Moldsilva” Agency for MSCP and MCFDP (2012-2013; 2017-2018).Describe How and Why this Method Was Chosen The methodology described in the IPCC 2006 Guideline is fully applicable to the Republic of Moldova, covering the entire calculation process.
Type and source of activity dataActivity data on forest land affected by fires are available in Statistical Yearbooks of the RM and those of the ATULBD (Statistical Yearbooks of the RM for 1994 (page 38), 1999 (page 20), 2007 (page 22), 2011 (page 22), 2014 (page 22), 2015 (page 22); NBS, Statistics for Geography and Environment (Forest Fires, as of November 1 (2010-2016); Statistical Yearbooks of the ATULBD for 2000 (page 88), 2002 (page 91), 2007 (page 81), 2009 (page 80), 2011 (page 82), 2014 (page 78), 2015 (page 88), 2016 (page 88), 2017 (page 91).
Type and source of EF and OF EFs for different forest types, kg GHG / t d.m (2006 IPCC Guidelines, Volume 4, Chapter 2, Table 2.5, Page 2.47)
CO CH4 N2O NOx
Temperate Forests 107 4.7 0.26 3.0
Uncertainty of AD and source ±10%, expert judgmentUncertainty of EF and source ±30%, expert judgmentPotential Improvements For the next inventory cycles, it will be considered to improve emission factors from forest fires.
2.4.2. Category 4B ‘Cropland’Tables 2.4.2.1 – 2.4.2.3 below comprise relevant information on source and/or sink categories comprised within the inventory, including description of each source and/or sink by gas allocated to category 4B ‘Cropland’.
Table 2.4.2.1: Information on Category 4B ‘Cropland’ – CO2Sector LULUCFCategory 4B CroplandSource and/or Sink Category / Gas 4B1 Cropland Remaining Cropland (4B1.1 Cropland Covered with Woody Vegetation and 4B1.2 Annual Change in Carbon Stocks in Mineral Soils) – CO2
Key Category? Tier 1: Yes: 1990 (L), 2016 (L, T); Tier 2: Yes: 1990 (L), 2016 (L, T)

Chapter 2: Methods and Data Documentation
2 - 174
Category Description / Defini-tion
The 4B “Cropland” category includes a wide range of arable lands with the primary goal of cultivating different types of crops and/or protecting them against unfavorable climatic factors. Thus, within this cat-egory the following types of arable lands are included: perennial plantations (vineyards and orchards, including fruit trees nurseries, woody vegetation in individual gardens); other forest vegetation, including forest protection stripes and green areas; arable soils.
Country Detail
Under the 4B category there are reported CO2 emissions/removals estimates originated from two sub-categories: 4B1 “Cropland Remaining Cropland”. For a clearer exposition of the calculation exercise for the 4B1 “Cropland Remaining Cropland” category, the obtained results are presented separately for three subcategories: 4B1.1 “Cropland Covered with Woody Vegetation”, 4B1.2 “Annual Change in Carbon Stocks in Mineral Soils”.The 4B1.1 “Cropland Covered with Woody Vegetation” category comprises CO2 removals/emissions from cropland covered with woody vegetation, including above-ground and below-ground biomass in protec-tion forest strips, trees and shrubs plantations, other types of forest vegetation, as well as from perennial plantations: orchards, vineyards, trees from private gardens etc.Under the 4B1.2 “Annual Change in Carbon Stocks in Mineral Soils” category there are reported CO2 emissions from mineral soils. This source has a significant share in the total emissions from the sector 4 ‘LULUCF’, as according the General Land Cadaster of the Republic of Moldova (standing as of 01.01.2017), this source includes arable lands with a share of over 55.1 per cent of the total, which is 1866.05 thousand ha. It should be mentioned that over the period from 1990 through 2016, the areas of arable lands remained relatively constant, increasing only by 7 per cent.
Equation(Describe variables for method used)
Methodology: Tier 2 For estimating CO2 removals/emissions within the source 4B1.1 “Cropland Covered with Woody Vegetation” under the 4B1 “Cropland Remaining Cropland”, it was necessary to determine current biomass increments in woody vegetation not included in forestry resources and perennial plantations, according to production tables, forest planning, scientific sources, data from “Moldova Agricultural Competitiveness Project” (MACP). The calculation was done based on annual change in carbon stocks as a result of perennial woody crops growth (in stem, shoots, leaves and roots), by using Equations 2.9 – 2.14 from the 2006 IPCC Guidelines (pages 2.14 – 2.18). The process had two steps:
1. Annual change in carbon stocks as a result of perennial woody crops growth (in stem, shoots, leaves and roots), using the general equation: ∆CG = ∑ (A • G total • CF)
Where:∆CG – annual increase in biomass carbon stocks due to biomass growth in land remaining in the same land-use category (perennial plantations), t C/yr;A – area of perennial plantations remaining in the same land-use category, ha;CF – carbon fraction of dry matter;G total – total annual biomass growth (t d.m./yr/ha).
2. Annual decrease in carbon stocks due to biomass losses (from wood removal (harvest)/authorized and illegal logging), using the general equation:∆CL = L felling + L fuelwood + L perturbations
Where:∆CL – annual decrease in carbon stocks due to biomass loss (harvesting/felling and other types of removals), t C/yr;L felling – annual biomass loss due to wood removals, t C/yr; L fuelwood – annual biomass carbon loss due to fuelwood removals, t C/yr;L perturbations – annual biomass carbon loss due to disturbances (diseases, pests, natural disasters, mass droughts etc.), t C/yr.
In order to estimate emissions within the category 4B1.2 “Annual Change in Carbon Stocks in Mineral Soils” it was used a Tier 2 approach and Equation 2.25 from the 2006 IPCC Guidelines (Volume 4, Chapter 2, Page 2.30):
ΔC Mineral = (SOC0 – SOC(0-T)) / D Where,
ΔC Mineral – annual change in carbon stocks in mineral soils, t C/yr; SOC0 – soil organic carbon stock in the last year of an inventory period, t C;SOC(0-T) – soil organic carbon stock at the beginning of the inventory time period, t C; D – time dependence of stock change factors which is the default time period for transition from equilibrium SOC values, yr (T is used in this equation if T ≥ 20 years, where T represents number of years over a single inventory time period).
In order to estimate CO2 emissions from annual change in carbon stocks in mineral soils the following equation was used:CO2 = ΔC Mineral • 44/12
Where,CO2 – emissions from carbon losses in mineral soils due to land-use change for cropland and soil management practices, Gg/yr;, [44/12] – stoichiometric ration between carbon content in CO2 and C
Reference 2006 IPCC Guidelines (Volume 4, Chapter 2, Pages 2.14 – 2.18, Page 2.30, Pages 2.40-2.49)

Chapter 2: Methods and Data Documentation
2 - 175
Describe How and Why this Method Was Chosen
The calculation methods used to estimate CO2 removals/emissions from 4B1 “Cropland Remaining Cropland” were those available in the 2006 IPCC Guidelines. At the same time, country specific emission/removal factors were used regarding the annual biomass increments, the share of carbon in biomass etc., as well as AD by sector (area covered with forest stripes, trees and shrubs plantations, orchards, vineyards, wood harvesting, area of mineral soils used for agriculture).
Type and source of activity data General Land Cadasters for 1970-2016 periods; Land Use and Land Use-Change Matrix for 1970-2016 periods. The evidences of Inspectorate for Environmental Protection. Data from “Moldova Agricultural Competitiveness Project” (MACP). Evolution of Wood Harvested from Other Types of Woody Vegetation in the RM within 1990-2016 periods.
Type and source of EF and OF
In order to estimate annual biomass increments and losses in perennial woody crops, country specific emission factors were developed. Calculation of such factors was based on production tables, data on productivity of protection forest belts taken from data accounting and forest planning records, as well as data from scientific literature on perennial plantations management (Ukrainian Forest Management Service: Forestry Resources of the Moldavian Soviet Socialist Republic, standing as of 1.01.1988, Irpeni, 1988; Gh. Vdovii, D. Galupa et al. (1997), National Report on Forestry Resources of the Republic of Moldova, Giurgiu V., Decei I., Armasescu S. Biometry of Trees and Stands in Romania, 1972; Kapp G., Velsen-Zerweck M., Horst A., Horn L., Galupa D. Talmaci I. et al.: The Baseline Study for the Moldova Soils Conservation Project, 2003; National GHG Inventory Report for Hungary, 2014).
Land Category Annual Biomass Increments, t C/yr/ha Biomass Losses due to Conversion, t C/yr/haOther types of forest vegetation 1.42 -24.8Perennial plantations 0.32 -4.43
Country specific emission factors were developed for lands subject to internal conversion within 4B1.1 category.
Internal Conversion Indicators Period, years Units Indicators Value8
Perennial plantations to cropland Annual average carbon increments in biomass year 1 Mg C/ha/yr 0.57Annual average carbon increments in DOM and SOC years 1-20 Mg C/ha/yr 0.00
Forest vegetation to croplandAnnual average carbon increments in biomass year 1 Mg C/ha/yr -24.80Annual average carbon increments in dead organic matter (litter/DOM) year 1 Mg C/ha/yr -1.15Annual average increments in soil organic carbon (SOC/SOM) years 1-20 Mg C/ha/yr -1.1988
Cropland to forest vegetation
Annual average carbon increments in biomass (trees and shrubs) year 1 Mg C/ha/yr -3.26Annual average carbon increments in biomass (trees and shrubs) years 2-20 Mg C/ha/yr 1.74Annual average carbon increments in dead organic matter (litter/DOM) years 1-20 Mg C/ha/yr 0.41Annual average increments in soil organic carbon (SOC/SOM) years 1-20 Mg C/ha/yr 0.32
Cropland to perennial plantations
Annual average carbon increments in biomass (trees and shrubs) year 1 Mg C/ha/yr -4.68Annual average carbon increments in biomass (trees and shrubs) years 2-20 Mg C/ha/yr 0.32Annual average carbon increments in dead organic matter (litter/DOM) years 1-20 Mg C/ha/yr 0.00Annual average increments in soil organic carbon (SOC/SOM) years 1-20 Mg C/ha/yr 0.00
Uncertainty of AD and source ±10, expert judgmentUncertainty of EF and source ±10, expert judgment
Potential Improvements For the next inventory cycle it will be considered the possibility to improve records pertaining to actual volume of wood from forest stripes management as well as other types of forest vegetation and also activities aimed at verification of emission/removal factors specific to perennial plantations (current biomass increments, biomass harvesting during the cleaning cuttings).
Table 2.4.2.2: Information on Category 4B ‘Cropland’ – CO28
Sector LULUCFCategory 4B CroplandSource and/or Sink Category / Gas 4B2 Land Converted to Cropland – CO2
Key Category? Tier 1: Yes: 1990 (L), 2016 (L, T); Tier 2: Yes: 1990 (L), 2016 (L)
8 Where used the „minus” sign, it is consider to be losses.

Chapter 2: Methods and Data Documentation
2 - 176
Category Description / Defini-tion
The 4B “Cropland” category includes a wide range of arable lands with the primary goal of cultivating different types of crops and/or protecting them against unfavorable climatic factors. Thus, within this cat-egory the following types of arable lands are included: perennial plantations (vineyards and orchards, including fruit trees nurseries, woody vegetation in individual gardens); other forest vegetation, including forest protection stripes and green areas; arable soils.
Country Detail For a clearer exposition of the calculation exercise for the 4B2 “Land Converted to Cropland” subcategory includes lands subject to conversion which previously had a certain volume of biomass (forests, grasslands, perennial plantations, forest stripes) or lacked vegetation (settlements, wetlands).The 4B2 “Land Converted to Cropland” subcategory includes lands subject to conversion which previously had a certain volume of biomass (forests, grasslands, perennial plantations, forest stripes) or lacked vegetation (settlements, wetlands).
Equation(Describe variables for method used)
Methodology: Tier 2 In order to estimate CO2 removals/emissions from the 4B2 “Land Converted to Cropland” category there were calculated carbon stock in biomass (losses and increments) due to the conversion of land from natural conditions and other uses to cropland, including deforestation, conversion of pasture and grazing lands as well as perennial plantations to cropland etc. At the same time, estimates for this category also included N2O emissions resulting from conversion of grassland to cropland. In the process of assessing the annual change in carbon stocks due to the conversion of different types of land to cropland Equation 2.15 from the 2006 IPCC Guidelines (Volume 4, Chapter 2, Page 2.20) was used:
ΔCB = ΔCG + ΔCConversion – ΔCL Where:
ΔC B – annual change in carbon stocks in biomass on land converted to cropland, t C/yr;ΔC G – annual increase in carbon stocks in biomass due to growth on land converted to cropland, t C/yr;ΔC Conversion – initial change in carbon stocks in biomass resulting from the land-use conversion, t C/yr; ΔC L – annual decrease in biomass carbon stocks due to the conversion to cropland, t C/yr.
Initial changes in carbon stocks in biomass on land converted to forest land (ΔC Conversion) were estimated using Equation 2.16 from the 2006 IPCC Guidelines (Volume 4, Chapter 2, Page 2.20):ΔCConversion = ∑{(BAfter − BBefore) • ΔATO OTHERS} • CF
Where:B After – biomass stocks on land immediately after the conversion, t d.m.//ha;B Before – biomass stocks on land before the conversion, t d.m./ha;ΔA TO OTHERS – area of land-use converted to cropland in a certain year, ha/yr;CF – carbon fraction of dry matter.
At the same time, the estimation process considered increases in dead wood (litter) and in organic soil carbon, since the change in land-use category has a major impact on the respective stocks. Non-CO2 emissions (N2O) resulting from the conversion of grassland to cropland were estimated using Equation 11.8 from the 2006 IPCC Guidelines (Volume 4, Chapter 11, page 11.16):
FSOM = ∑LU [(ΔCMineral,LU • 1/R) • 1000]Where:
FSOM – the net annual amount of N mineralized in mineral soils as a result of loss of soil carbon through change in land use or management, kg N;ΔCMineral,LU – average annual loss of soil carbon for each land-use type (LU), tones C; R – C:N ratio of the soil organic matter. A default value of 15 for the C:N ratio (R) may be used for situations involving land-use change from Forest Land or Grassland to Cropland, in the absence of more specific data for the area. A default value of 10 may be used for situations involving management changes on Cropland Remaining Cropland; LU – land-use and/or management system type.
AD on areas subject to conversion to this category are available in the General Land Cadaster of the RM, and are included in the Land Use and Land Use-Change Matrix for 1970-2016 periods. The main types of land converted to cropland are grassland and settlements.
Reference 2006 IPCC Guidelines (Volume 4, Chapter 2, Pages 2.14 – 2.18, Page 2.30, Pages 2.40-2.49)
Describe How and Why this Method Was Chosen
The calculation methods used to estimate CO2 removals/emissions were those available in the 2006 IPCC Guidelines. At the same time, country specific emission/removal factors were used regarding the annual biomass increments, the share of carbon in biomass etc., as well as AD by sector (area covered with forest stripes, trees and shrubs plantations, orchards, vineyards, wood harvesting, area of mineral soils used for agriculture).
Type and source of activity data General Land Cadasters for 1970-2016 periods; Land Use and Land Use-Change Matrix for 1970-2016 periods. The evidences of Inspectorate for Environmental Protection. Data from “Moldova Agricultural Competitiveness Project” (MACP). Evolution of Wood Harvested from Other Types of Woody Vegetation in the RM within 1990-2016 periods

Chapter 2: Methods and Data Documentation
2 - 177
Type and source of EF and OF
Country specific EFs were calculated/developed in order to establish the annual increments/losses of biomass and carbon stocks in soil on lands subject to conversion to cropland. Calculation of such factors was based on production tables including data on productivity of protection forest belts taken from data accounting and forest planning records, “Moldsilva” Agency Monitoring Reports on MSCP and MCFDP from 2012; 2013; 2017; 2018, as well as data from scientific literature on biomass increments and perennial plantations management (“Soil Quality Monitoring in the Republic of Moldova (database, conclu-sions, forecasts, recommendations), 2010; Miron A., Vedutenco D. et al., Report on drafting management plans for grasslands in Orhei National Park, 2014; National GHG Inventory Report for Hungary, 2014; “Moldsilva” Agency Reports on MSCP and MCFDP monitoring from 2012; 2013; 2017; 2018).
Conversion Indicators Period, years Units Indicators Value
Grassland to croplandAnnual average carbon increments in biomass year 1 Mg C/ha/yr 1.22Annual average carbon increments in dead organic matter (litter/DOM) year 1 Mg C/ha/yr 0.00Annual average increments in soil organic carbon (SOC/SOM) years 1-20 Mg C/ha/yr -2.2650
Grassland to forest vegetation
Annual average carbon increments in biomass (trees and shrubs) year 1 Mg C/ha/yr -2.69Annual average carbon increments in biomass (trees and shrubs) years 2-20 Mg C/ha/yr 1.74Annual average carbon increments in dead organic matter (litter/DOM) years 1-20 Mg C/ha/yr 0.41Annual average increments in soil organic carbon (SOC/SOM) years 1-20 Mg C/ha/yr 0.32
Grassland to perennial planta-tions
Annual average carbon increments in biomass (trees and shrubs) year 1 Mg C/ha/yr -3.46Annual average carbon increments in biomass (trees and shrubs) years 2-14, 16-20 Mg C/ha/yr 0.32Annual average carbon increments in biomass (trees and shrubs) year 15 Mg C/ha/yr -4.43Annual average carbon increments in dead organic matter (litter/DOM) years 1-20 Mg C/ha/yr 0.00Annual average increments in soil organic carbon (SOC/SOM) years 1-20 Mg C/ha/yr -2.2650
Wetlands to croplandAnnual average carbon increments in biomass (trees and shrubs) year 1 Mg C/ha/yr 0,8Annual average carbon increments in dead organic matter (litter/DOM) year 1 Mg C/ha/yr 0.0Annual average increments in soil organic carbon (SOC/SOM) year 1 Mg C/ha/yr -2.2650
Settlements to croplandAnnual average carbon increments in biomass year 1 Mg C/ha/yr 5.00Annual average carbon increments in dead organic matter (litter/DOM) year 1 Mg C/ha/yr 0.00Annual average increments in soil organic carbon (SOC/SOM) years 1-20 Mg C/ha/yr 0.2168
Other land to croplandAnnual average carbon increments in biomass year 1 Mg C/ha/yr 5.00Annual average carbon increments in dead organic matter (litter/DOM) year 1 Mg C/ha/yr 0.00Annual average increments in soil organic carbon (SOC/SOM) year 1 Mg C/ha/yr 0.0108
Uncertainty of AD and source ±10, expert judgmentUncertainty of EF and source ±10, expert judgment
Potential Improvements It is planned to carry out activities aimed at reducing uncertainties associated with the results obtained under the respective source category, including by improving the country specific methodology (Banaru, 2000) and improving the quality of used activity data, in order to make possible estimation of CO2 emissions/removals from “Annual Change in Carbon Stocks in Mineral Soils”.
Table 2.4.2.3: Information on Category 4B ‘Cropland’ – CH4, N2O, NOx, COSector LULUCFCategory 4B CroplandSource and/or Sink Category / Gas 4B1.3. Non-CO2 Emissions from Post-Harvest Field Burning of Crop Residues (stubble fields burning)
Key Category? No.Category Description / Defini-tion
Under the 4B1.3. “Non-CO2 Emissions from Post-Harvest Field Burning of Agricultural Residues (Stubble Fields Burning)” only non-CO2 emissions (CH4, N2O, NOx and CO) are monitored under this category (as CO2 emissions are not regarded as a source of emissions, carbon emitted in atmosphere is considered to be re-absorbed in the following agricultural cycle).

Chapter 2: Methods and Data Documentation
2 - 178
Country Detail
4B1.3 “Non-CO2 Emissions from Post-Harvest Field Burning of Agricultural Residues (stubble fields burning)”. The activity data on areas sown with grain crops (wheat and barley) are available in the Statistical Yearbooks of the Republic of Moldova and those of ATULBD. The information on post-harvest field burning of crop residues (stubble fields burning) cases in the RM is reported annually by the State Ecological Inspectorate’s territorial inspectors. The activity data on the amount of crop residues available to be combusted on field were inferred from information on average crop yield per hectare, by multiplying it to the dry matter fraction in the basic yield of the respective crop (default value is 0.89). While estimating the amount of agricultural residues available for combustion on site, a mean arithmetic value between wheat and barley was used which is closely related to the average yield per hectare, actually reported in the Republic of Moldova over the reference period.
Equation(Describe variables for method used)
Non-CO2 emissions from post-harvest field burning of crop residues (stubble fields burning) within the 4B “Cropland” were estimated by using a Tier 1 methodology (2006 IPCC Guidelines, Vol. 4, Chapter 2.4, Pages 2.40-2.49).
L fire = A • MB • Cf • Gef • 10-3
Where:L fire – amount of non-CO2 greenhouse gas emissions from vegetation fires (field burning of crop residues or stubble fields burning), t/yr;A – area burnt, ha/yr;MB – mass of fuel available for combustion, t/ha;Cf – combustion factor; IPCC default value is 0.90 (2006 IPCC Guidelines);MB • Cf – amount of fuel actually burnt; default for “Crop Residues” (post-harvest field burning), in particular, for wheat and barley residues, which are more frequently burned in the Republic of Moldova, is 4 t.d.m./ha; Gef – default EF (g/kg d.m.)
Reference 2006 IPCC Guidelines (Volume 4, Chapter 2, Pages 2.40-2.49); Statistical Yearbooks of the Republic of Moldova and those of ATULBD.
Describe How and Why this Method Was Chosen
The amount of crops residues vary in different years, and depend on crops and management technologies. It should be noted that though burning of stubble fields is prohibited by law, this practice still persists in the RM. Crop residues are burnt in fields to clear the stubble fields from the straw left after reaping (in the RM, stubble fields are most often burnt after reaping of wheat and barley) and to prepare the fields for the next agricultural cycle.
Type and source of activity dataActivity data on forest land affected by fires are available in Statistical Yearbooks of the RM and those of the ATULBD (Statistical Yearbooks of the RM for 1994 (page 38), 1999 (page 20), 2007 (page 22), 2011 (page 22), 2014 (page 22), 2015 (page 22); NBS, Statistics for Geography and Environment (Forest Fires, as of November 1 (2010-2016); Statistical Yearbooks of the ATULBD for 2000 (page 88), 2002 (page 91), 2007 (page 81), 2009 (page 80), 2011 (page 82), 2014 (page 78), 2015 (page 88), 2016 (page 88), 2017 (page 91).
Type and source of EF and OFEFs for Field Burning of Crop Residues, g/kg d.m. (2006 IPCC Guidelines (Volume 4, Chapter 2, Table 2.5, Page 2.47):
Category CO CH4 N2O NOx
Field Burning of Agricultural Residues 92 2.7 0.07 2.5
Uncertainty of AD and source ±10%, expert judgmentUncertainty of EF and source ±50%, expert judgmentPotential Improvements No improvements are planned for this category.
2.4.3. Category 4C ‘Grassland’
Tables 2.4.3.1 – 2.4.3.2 below comprise relevant information on source and/or sink categories comprised within the inventory, including description of each source and/or sink by gas allocated to category 4C ‘Grassland’.
Table 2.4.3.1: Information on Category 4C ‘Grassland’ – CO2Sector LULUCFCategory 4C GrasslandSource and/or Sink Category / Gas 4C1 Grassland Remaining Grassland – CO2
Key Category? No

Chapter 2: Methods and Data Documentation
2 - 179
Category Description / Defini-tion
Subcategory 4C1 “Grassland Remaining Grassland” includes land which has always been covered with perennial herbaceous vegetation and used as pastures or hayfields, land covered with perennial herba-ceous vegetation from other categories of use (land under improvement and fertility restoration; landslides) as well as land transformed into pastures more than 20 years ago.
Country Detail
Based on the inventory surveys of the grasslands from the National Park Orhei (EU/UNDP “Clima East” Project, 2014-2016), Soroca and Stefan Voda districts (“Integration of Biodiversity Conservation Priorities into Territorial Planning Policies and Land Use Practices in Moldova, 2015-2016” Project) it is observed that grasslands (pastures and hayfields) in these areas, like most in the RM are managed traditionally in an extensive and unsystematic way. The practiced system is characterized by minimal care work, or even by total lack and by the lack of correlation between the production capacity of grasslands and their loading with animals. For this reason, grasslands cannot be fully used due to under-exploitation/sub-loading with animals (which is why the invasion of grassland with spontaneous shrubby vegetation occurs) or can be overloaded, failing to provide sufficient food for the entire livestock.
Equation(Describe variables for method used)
Methodology: Tier 1. The Tier 1 approach from the 2006 IPCC Guidelines does not imply the use of equations.
Reference 2006 IPCC Guidelines (Volume 4, Chapter 6, Page 6.7) Describe How and Why this Method Was Chosen
For the grasslands with a relatively constant productivity over time, where has been no intervention in order to increase the productivity, the Tier 1 approach from the 2006 IPCC Guidelines considers the biomass stock in balance, respectively, the stock does not change in time and space on a national scale. Thus, CO2 emissions/removals from grassland remaining grassland are not estimated.
Type and source of activity data The main source of references for the areas of these lands is the General Land Cadaster of the RM for the reporting period.
Type and source of EF and OF
Country specific EFs have been used (Forest Research and Management Institute Reports (2014-2016) on Grassland Inventory within the Orhei National Park)Categories Productivity Annual Biomass Growth, t d.m./ha/yr
Meadowshigh 3.2
medium 2.0low 1.2
Grasslands on slopeshigh 2.8
medium 1.8low 1.2
Landslides low 1.2
Uncertainty of AD and source ± 15%, expert judgmentUncertainty of EF and source ± 10%, expert judgment
Potential Improvements The possibility to improve the cadastral records (as the main reference sources for AD) pertaining to specification of land use categories to which converted lands are transferred to, will be considered for the next inventory cycles in the Republic of Moldova.
Table 2.4.3.2: Information on Category 4C ‘Grassland’ – CO2Sector LULUCFCategory 4C GrasslandSource and/or Sink Category / Gas 4C2 Land Converted to Grassland – CO2
Key Category? Tier 1: Yes: 1990 (L), 2016 (L, T); Tier 2: Yes: 1990 (L), 2016 (L, T)Category Description / Defini-tion
The “Land Converted to Grassland” category includes land with forest vegetation, arable land, perennial plantations (vineyards and orchards), as well as wetlands (marshes, wetlands saturated by water), settlements converted to grasslands in the last 20 years.
Country Detail Conversion of cropland to grassland is a regular process over the past 50 years in the Republic of Moldova, because a considerable part of cropland is severely affected by erosion and reached to an extremely low level of economic efficiency of cropping.

Chapter 2: Methods and Data Documentation
2 - 180
Equation(Describe variables for method used)
Methodology: Tier 2. Equation 2.15 from the 2006 IPCC Guidelines (Volume 4, Chapter 2, Page 2.20):ΔCB = ΔCG + ΔCConversion – ΔCL
Where:ΔCB – annual change in carbon stocks in biomass on land converted to grassland, t C/yr;ΔCG – annual increase in carbon stocks in biomass due to growth on land converted to grassland, t C/yr;ΔC Conversion – initial change in carbon stocks in biomass on land converted to grassland, t C/yr; ΔCL – annual decrease in biomass carbon stocks on land converted to grassland, due to grass/biomass harvest, disturbances t C/yr.
Initial changes in carbon stocks in biomass on land converted to grassland (ΔC Conversion) were estimated using Equation 2.16 from the 2006 IPCC Guidelines (Volume 4, Chapter 2, Page 2.20):ΔCConversion = ∑{(BAfter − BBefore) • ΔATO OTHERS} • CF
Where:BAfter – biomass stocks on land immediately after the conversion, t d.m.//ha;BBefore – biomass stocks on land before the conversion, t d.m./ha;ΔATO OTHERS – area of land-use converted to land use category in a certain year, ha/yr;CF – carbon fraction of dry matter.
Reference 2006 IPCC Guidelines, (Volume 4, Chapter 2, Page 2.20)
Describe How and Why this Method Was Chosen
GHG emissions/removals from this category result from land-use change, changes in land management thus eliminating the existing vegetation and its replacement with grassland vegetation. GHG inven-tory for land categories converted to grassland includes the assessment of changes in carbon stocks for the following carbon pools: biomass, litter, soil. In order to estimate CO2 removals in biomass on land converted to grassland, the annual increments in perennial herbaceous vegetation on newly-formed grasslands, as well as the differences of initial biomass for land previously covered with forest vegetation were established, according to the available data at national level.
Type and source of activity data
In order to estimate CO2 emissions/removals from the conversion of different land categories in grassland, from the General Land Cadaster of the RM, as well as the Reports of the “Moldsilva” Agency and the Reports of the Inspectorate for Environmental Protection, have been taken the areas of cropland and wetlands converted to grassland, as well as forest areas and other types of forest vegetation destroyed by illegal logging.Conversion Indicators Period, years Units Indicators Value
Cropland Converted to Grassland Annual average carbon increments in biomass year 1 Mg C/ha/yr -1.22Annual average carbon increments in dead organic matter (litter/DOM) year1 Mg C/ha/yr 0.00Annual average increments in soil organic carbon (SOC/SOM) years 1-20 Mg C/ha/yr 2.2650
Forest Land Converted to GrasslandAnnual average carbon increments in biomass year 1 Mg C/ha/yr -26.02Annual average carbon increments in dead organic matter (litter/DOM) year1 Mg C/ha/yr -1.15Annual average increments in soil organic carbon (SOC/SOM) years 1-20 Mg C/ha/yr 1.0662
Perennial Plantations Converted to Grassland
Annual average carbon increments in biomass year 1 Mg C/ha/yr -0.65Annual average carbon increments in dead organic matter (litter/DOM) year1 Mg C/ha/yr 0.00Annual average increments in soil organic carbon (SOC/SOM) years 1-20 Mg C/ha/yr 2.2650
Wetlands Converted to GrasslandAnnual average carbon increments in biomass year 1 Mg C/ha/yr 0.00Annual average carbon increments in dead organic matter (litter/DOM) year1 Mg C/ha/yr 0.00Annual average increments in soil organic carbon (SOC/SOM) years 1-20 Mg C/ha/yr 2.4818
Settlements Converted to GrasslandAnnual average carbon increments in biomass year 1 Mg C/ha/yr 3.78Annual average carbon increments in dead organic matter (litter/DOM) year1 Mg C/ha/yr 0.00Annual average increments in soil organic carbon (SOC/SOM) years 1-20 Mg C/ha/yr 0.1241
Type and source of EF and OFCountry specific emission factors have been used (Giurgiu V., Decei I., Armasescu S. Biometry of Trees and Rammels in Romania, 1972; Kapp G., Velsen-Zerweck M., Horst A., Horn L., Galupa D. Talmaci I. et al.: The baseline study for the „Soils Conservation Project in Moldova”, 2003; Official Monitor Nr. 46-49, Government Resolution Nr. 367 from 13.04.2000, ‘On approval the National Program to Combat Desertification 2000’; National GHG Inventory Report for Hungary, 2014; “Soil Quality Monitoring in the Republic of Moldova (database, conclusions, forecasts, recommendations)”, 2010)
Uncertainty of AD and source ± 15%, expert judgment

Chapter 2: Methods and Data Documentation
2 - 181
Uncertainty of EF and source ± 10%, expert judgment
Potential Improvements The possibility to improve the cadastral records (as the main reference sources for AD) pertaining to specification of land use categories to which converted lands are transferred to, will be considered for the next inventory cycles in the Republic of Moldova.
2.4.4. Category 4D ‘Wetlands’Tables 2.4.4.1 – 2.4.4.2 below comprise relevant information on source and/or sink categories comprised within the inventory, including description of each source and/or sink by gas allocated to category 4D ‘Wetlands’.
Table 2.4.4.1: Information on Category 4D ‘Wetlands’ – CO2Sector LULUCFCategory 4D WetlandsSource and/or Sink Category / Gas 4D1 Wetlands Remaining Wetlands – CO2
Key Category? No
Category Description / Defini-tion
The 4D1 “Wetlands Remaining Wetlands” category include any land that is covered or saturated by water for all or only a part of the year (for example, marshes), and does not fall into the Forest Land, Cropland, Grassland or Settlements categories. It also includes storage water reservoirs - managed ponds, as well as unmanaged natural lakes and rivers and lands subject to internal conversion, not generating essential changes in carbon stocks, maintaining a steady balance.
Country Detail Due to the particularities of lands in the RM included in the 4D1 “Wetlands Remaining Wetlands” category (land without forest/herbaceous vegetation and/or no management activities contributing to essential changes in carbon stocks) a neutral balance was established in the main carbon stocks (above- and below-ground biomass, dead organic matter, soils).
Equation(Describe variables for method used)
The Tier 1 approach from the 2006 IPCC Guidelines does not imply the use of equations.
Reference 2006 IPCC Guidelines (Volume 4, Chapter 7, Page 7.20) Describe How and Why this Method Was Chosen A neutral balance was established in the main carbon stocks (above- and below-ground biomass, dead organic matter, soils).
Type and source of activity data AD on areas within this category are available in the General Land Cadaster of the RM and are also included in the Land Use and Land Use-Change Matrix for 1970-2016 periods.Type and source of EF and OF No emission factors were used.Uncertainty of AD and source ± 10%, expert judgmentUncertainty of EF and source ± 10%, expert judgment
Potential Improvements The possibility to improve the cadastral records (as the main reference sources for AD) pertaining to specification of initial land use categories from which they were converted to wetlands, will be considered for the next inventory cycles in the Republic of Moldova.
Table 2.4.4.2: Information on Category 4D ‘Wetlands’ – CO2Sector LULUCFCategory 4D WetlandsSource and/or Sink Category / Gas 4D2 Land Converted to Wetlands – CO2
Key Category? Tier 1: Yes: 1990 (L), 2016 (L, T); Tier 2: Yes: 1990 (L), 2016 (T)Category Description / Defini-tion
Category 4D2 “Land Converted to Wetlands” include different land types which were previously covered by a certain amount of biomass and other land without initial vegetation converted to wetlands. The main land categories converted to wetlands are croplands and grasslands.

Chapter 2: Methods and Data Documentation
2 - 182
Country Detail Category of biomass loss was establish due to conversion of different land types which were previously covered by a certain amount of biomass (forest vegetation, grassland, perennial plantations etc.). At the same time, were estimated biomass increments due to conversion of different land types without initial vegetation (other land).
Equation(Describe variables for method used)
Methodology: Tier 2. The calculation process of CO2 removals/emissions is based on the annual increments in carbon stocks due to current biomass growth, and uses Equation 2.15 from the 2006 IPCC Guidelines (Volume 4, Chapter 2, Page 2.20):
ΔCB = ΔCG + ΔCConversion – ΔCLWhere:
ΔCB – annual change in carbon stocks in biomass on land converted to wetlands, t C/yr;ΔCG – annual increase in carbon stocks in biomass due to growth on land converted to wetlands, t C/yr;ΔC Conversion – initial change in carbon stocks in biomass on land converted to wetlands, t C/yr;ΔCL – annual decrease in biomass carbon stocks on land converted to wetlands, due to grass/biomass harvest, disturbances t C/yr.
Initial changes in carbon stocks in biomass on land converted to wetlands (ΔC Conversion) were estimated using Equation 2.16 from the 2006 IPCC Guidelines (Volume 4, Chapter 2, Page 2.20):ΔCConversion = ∑{(BAfter − BBefore) • ΔATO OTHER} • CF
Where:BAfter – biomass stocks on land immediately after the conversion, t d.m./ha;BBefore – biomass stocks on land before the conversion, t d.m./ha;ΔATO OTHERS – area of land-use converted to land use category in a certain year, ha/yr;CF – carbon fraction of dry matter.
Reference 2006 IPCC Guidelines, (Volume 4, Chapter 2, Page 2.20; Chapter 7, Page 7.20). Describe How and Why this Method Was Chosen
In order to estimate CO2 removals/emissions a biomass loss was establish due to conversion of different land types which were previously covered by a certain amount of biomass (forest vegetation, grassland, perennial plantations etc.). At the same time, were estimated biomass increments due to conversion of different land types without initial vegetation (other land).
Type and source of activity data AD on areas subject to conversion within this category are available in the General Land Cadaster of the RM and are also included in the Land Use and Land Use-Change Matrix for 1970-2016 periods.
Type and source of EF and OF
Country specific emission factors have been usedConversion Indicators Period, years Units Indicators Value
Grassland to WetlandsAnnual average carbon increments in biomass (herbaceous cover) year 1 Mg C/ha/yr 0.0Annual average carbon increments in dead organic matter (litter) year 1 Mg C/ha/yr 0.0Annual average increments in soil organic carbon years 1-20 Mg C/ha/yr 0.0
Other land to WetlandsAnnual average carbon increments in biomass (herbaceous cover) year 1 Mg C/ha/yr 4.2Annual average carbon increments in dead organic matter (litter) year 1 Mg C/ha/yr 0.0Annual average increments in soil organic carbon years 1-20 Mg C/ha/yr 2.4818
Uncertainty of AD and source ± 10%, expert judgmentUncertainty of EF and source ± 10%, expert judgment
Potential Improvements The possibility to improve the cadastral records (as the main reference sources for AD) pertaining to specification of initial land use categories from which they were converted to wetlands, will be considered for the next inventory cycles in the Republic of Moldova.
2.4.5. Category 4E ‘Settlements’Tables 2.4.5.1 – 2.4.5.3 below comprise relevant information on source and/or sink categories comprised within the inventory, including description of each source and/or sink by gas allocated to category 4E ‘Settlements’.
Table 2.4.5.1: Information on Category 4E ‘Settlements’ – CO2Sector LULUCFCategory 4E Settlements

Chapter 2: Methods and Data Documentation
2 - 183
Source and/or Sink Category / Gas 4E1 Settlements Remaining Settlements – CO2.
Key Category? NoCategory Description / Defini-tion
The category include all developed land (constructions, streets, yards, markets and parks, roads etc.), including transportation infrastructure and all size settlements if they are not accounted in another land-use category.
Country Detail Basically, this category include areas covered with vegetation. Depending on the type of vegetation, a part of land inside settlements was included in 4B “Cropland” (parks, public gardens, green areas, perennial plantations etc.) and 4C “Grassland” (pastures and hayfields) categories.
Equation(Describe variables for method used)
Methodology: Tier 1 The 4E1 “Settlements Remaining Settlements” category includes lands without forest/herbaceous vegetation and/or no management activities contributing to essential changes in carbon stocks); thus, a neutral balance was established in the main carbon stocks (above- and below-ground biomass, dead organic matter, soils).
Reference IPCC Guidelines (Volume 4, Chapter 2, Page 2.20); Describe How and Why this Method Was Chosen
This approach was applied because the methodology proposed by the IPCC Guidance 2006 is currently the only relevant solution for RM. A neutral balance was established in the main carbon stocks (above- and below-ground biomass, dead organic matter, soils).
Type and source of activity data AD on areas within this category are available in the General Land Cadaster of the RM and are also included in the Land Use and Land Use-Change Matrix for 1970-2016 periods. Type and source of EF and OF N/AUncertainty of AD and source ±10%, expert judgmentUncertainty of EF and source N/APotential Improvements The possibility to improve the cadastral records (as the main reference sources for AD) will be considered for the next inventory cycles in the Republic of Moldova.
Table 2.4.5.2: Information on Category 4E ‘Settlements’ – CO2Sector LULUCFCategory 4E SettlementsSource and/or Sink Category / Gas 4E2 Land Converted to Settlements – CO2.
Key Category? Tier 1: Yes: 1990 (L), 2016 (L, T); Tier 2: Yes: 1990 (L), 2016 (L, T)Category Description / Defini-tion
This category include a biomass loss of carbon in soils was established due to conversion of different land types which were previously covered by a certain amount of biomass (forest vegetation, grassland, perennial plantations etc.). The calculation process of CO2 removals/emissions is based on the annual increments in carbon stocks due to current biomass growth.
Country Detail In the RM the conversion of land to settlements has their priority cropland, grassland and other land.
Equation(Describe variables for method used)
Methodology: Tier 2. From calculations uses Equation 2.15 from the 2006 IPCC Guidelines (Volume 4, Chapter 2, Page 2.20):ΔCB = ΔCG + ΔCConversion – ΔCL
Where:ΔCB – annual change in carbon stocks in biomass on land converted to settlements, t C/yr;ΔCG – annual increase in carbon stocks in biomass due to growth on land converted to settlements, t C/yr;ΔC Conversion – initial change in carbon stocks in biomass on land converted to settlements, t C/yr;ΔCL – annual decrease in biomass carbon stocks on land converted to settlements, due to grass/biomass harvest, disturbances t C/yr.
Initial changes in carbon stocks in biomass on land converted to settlements (ΔC Conversion) were estimated using Equation 2.16 from the 2006 IPCC Guidelines (Volume 4, Chapter 2, Page 2.20):ΔCConversion = ∑{(BAfter − BBefore) • ΔATO OTHERS} • CF
Where:BAfter – biomass stocks on land immediately after the conversion, t d.m.//ha;BBefore – biomass stocks on land before the conversion, t d.m./ha;ΔATO OTHERS – area of land-use converted to land use category in a certain year, ha/yr;CF – carbon fraction of dry matter.
Reference IPCC Guidelines (Volume 4, Chapter 2, Page 2.20);

Chapter 2: Methods and Data Documentation
2 - 184
Describe How and Why this Method Was Chosen The methodology described in the IPCC 2006 Guideline is fully applicable to the Republic of Moldova, covering the entire calculation process.
Type and source of activity data AD on areas within this category are available in the General Land Cadaster of the RM and are also included in the Land Use and Land Use-Change Matrix for 1970-2016 periods.
Type and source of EF and OF
Country specific emission factors were developed (within EU/UNDP “Clima East” Project, respectively based on two other CDM Projects: MSCP and MCFDP, as well as from other relevant information) in order to estimate annual biomass increments / losses on land converted to settlements.
Conversion Indicators Period, years Units Indicators Value
Cropland to SettlementsAnnual average carbon increments in biomass (crops) year 1 Mg C/ha/yr -5.0Annual average carbon increments in dead organic matter (litter) year 1 Mg C/ha/yr 0.0Annual average increments in soil organic carbon years 1-20 Mg C/ha/yr -0.2168
Grassland to SettlementsAnnual average carbon increments in biomass (herbaceous cover) year 1 Mg C/ha/yr -3.78Annual average carbon increments in dead organic matter (litter) year 1 Mg C/ha/yr 0.0Annual average increments in soil organic carbon years 1-20 Mg C/ha/yr -2.4818
Other land to SettlementsAnnual average carbon increments in biomass (herbaceous cover) year 1 Mg C/ha/yr 0.0Annual average carbon increments in dead organic matter (litter) year 1 Mg C/ha/yr 0.0Annual average increments in soil organic carbon years 1-20 Mg C/ha/yr 0.0
Uncertainty of AD and source ±10%, expert judgmentUncertainty of EF and source ±10%, expert judgment
Potential Improvements The possibility to improve the cadastral records (as the main reference sources for AD) pertaining to specification of initial land use categories from which they were converted to settlements, will be considered for the next inventory cycles in the Republic of Moldova.
Table 2.4.5.3: Information on Category 4E ‘Settlements’ – N2OSector LULUCFCategory 4E SettlementsSource and/or Sink Category / Gas 4E2 Land Converted to Settlements – N2O
Key Category? NoCategory Description / Defini-tion This category estimates non-CO2 emissions from the conversion of different land categories to the 4E ‘Settlements’ category.
Country Detail For this category of inventory on the RM, non-CO2 emissions come from the conversion of grassland to settlements.
Equation(Describe variables for method used)
Non-CO2 emissions (N2O) resulting from the conversion of grassland to settlements were estimated using Equation 11.8 from the 2006 IPCC Guidelines (Volume 4, Chapter 11, page 11.16):FSOM = ∑LU [(ΔCMineral,LU • 1/R) • 1000
Where,FSOM – the net annual amount of N mineralized in mineral soils as a result of loss of soil carbon through change in land use or management, kg N;ΔCMineral, LU – average annual loss of soil carbon for each land-use type (LU), tones C; R – C:N ratio of the soil organic matter. A default value of 15 for the C:N ratio (R) may be used for situations involving land-use change from Forest Land or Grassland to Cropland, in the absence of more specific data for the area. A default value of 10 may be used for situations involving management changes on Cropland Remaining Cropland; LU – land-use and/or management system type.
Reference 2006 IPCC Guidelines (Volume 4, Chapter 11, page 11.16).Describe How and Why this Method Was Chosen
Country specific emission factors were developed (within EU/UNDP “Clima East” Project, respectively based on two other CDM Projects: MSCP and MCFDP, as well as from other relevant information) in order to estimate annual biomass increments / losses on land converted to settlements.

Chapter 2: Methods and Data Documentation
2 - 185
Type and source of activity data AD on areas subject to conversion within this category are available in the General Land Cadaster and are also included in the Land Use and Land Use-Change Matrix for 1970-2016 periods. The main land categories converted to settlements are croplands and grasslands.
Type and source of EF and OF There are default factors established according to the 2006 IPCC Guidelines (Volume 4, Chapter 11, page 11.16).Uncertainty of AD and source ±10%, expert judgmentUncertainty of EF and source ±30%, expert judgment
Potential Improvements The possibility to improve the cadastral records (as the main reference sources for AD) pertaining to specification of initial land use categories from which they were converted to settlements, will be considered for the next inventory cycles in the Republic of Moldova.
2.4.6. Category 4F ‘Other Land’Tables 2.4.6.1 – 2.4.6.2 below comprise relevant information on source and/or sink categories comprised within the inventory, including description of each source and/or sink by gas allocated to category 4F ‘Other Land’.Table 2.4.6.1: Information on Category 4F ‘Other Land’ – CO2Sector LULUCFCategory 4F Other LandSource and/or Sink Category / Gas 4F1 Other Land Remaining Other Land – CO2;
Key Category? NoCategory Description / Defini-tion
The 4F “Other Land” category includes in particular bare soil, ravines, pits, rock, etc., as well as all land that do not fall into any of the other categories 4A-4E (for example, river banks, rocks). This category is also used to close the sum of areas from the total official land of the country.
Country Detail N/A.Equation(Describe variables for method used)
Methodology: Tier 1. Due to the particularities of lands in the RM included in the 4F1 “Other Land Remaining Other Land” category (land without forest/herbaceous vegetation and/or no management activities contributing to essential changes in carbon stocks) a neutral balance was established in the main carbon stocks (above- and belowground biomass, dead organic matter, soil).
Reference 2006 IPCC Guidelines (Volume 4, Chapter 9, Page 9.4). Describe How and Why this Method Was Chosen A neutral balance was established in the main carbon stocks (above- and below-ground biomass, dead organic matter, soils).
Type and source of activity data AD on areas within this category are available in the General Land Cadaster of the RM and are also included in the Land Use and Land Use-Change Matrix for 1970-2016 periods.Type and source of EF and OF No emission factors were used.Uncertainty of AD and source ±10%, expert judgmentUncertainty of EF and source ±10%, expert judgmentPotential Improvements N/A.
Table 2.4.6.2: Information on Category 4F ‘Other Land’ – CO2Sector LULUCFCategory 4F Other LandSource and/or Sink Category / Gas 4F2 Land Converted to Other Land – CO2
Key Category? NoCategory Description / Defini-tion
The 4F2 “Land Converted to Other Land” category a biomass loss was establish due to conversion of different land types which were previously covered by a certain amount of biomass (forest vegetation, grassland, perennial plantations etc.).

Chapter 2: Methods and Data Documentation
2 - 186
Country Detail The main land categories converted to other land are forest lands, grasslands and croplands – arable soils.
Equation(Describe variables for method used)
Methodology: Tier 2. From calculation uses Equation 2.15 from the 2006 IPCC Guidelines (Volume 4, Chapter 2, Page 2.20):ΔCB = ΔCG + ΔCConversion – ΔCL
Where:ΔCB – annual change in carbon stocks in biomass on land converted to other land, t C/yr;ΔCG – annual increase in carbon stocks in biomass due to growth on land converted to other land, t C/yr;ΔC Conversion – initial change in carbon stocks in biomass on land converted to other land, t C/yr;ΔCL – annual decrease in biomass carbon stocks on land converted to other land, due to grass/biomass harvest, disturbances t C/yr.
Initial changes in carbon stocks in biomass on land converted to other land (ΔC Conversion) were estimated using Equation 2.16 from the 2006 IPCC Guidelines (Volume 4, Chapter 2, Page 2.20):ΔCConversion = ∑{(BAfter − BBefore) • ΔATO OTHERS} • CF
Where:BAfter – biomass stocks on land immediately after the conversion, t d.m.//ha;BBefore – biomass stocks on land before the conversion, t d.m./ha;ΔATO OTHERS – area of land-use converted to land use category in a certain year, ha/yr;CF – carbon fraction of dry matter.
Reference 2006 IPCC Guidelines (Volume 4, Chapter 2, Page 2.20; Chapter 9, Page 9.4-9.9)Describe How and Why this Method Was Chosen The calculation process of CO2 removals/emissions is based on the annual increments in carbon stocks due to current biomass growth.
Type and source of activity data AD on areas subject to conversion within this category are available in the General Land Cadaster of the RM and are also included in the Land Use and Land Use-Change Matrix for 1970-2016 periods.
Type and source of EF and OF
Country specific emission factors were developed within two CDM Projects: MSCP and MCFDP, as well as from other relevant information in order to estimate annual biomass increments/losses on land converted to other land:
Conversion Indicators Period, years Units Indicators Value
Forest Land to Other LandAnnual average carbon increments in biomass (trees and shrubs) year 1 Mg C/ha/yr -29.8Annual average carbon increments in dead organic matter (litter) year 1 Mg C/ha/yr -1.15Annual average increments in soil organic carbon years 1-20 Mg C/ha/yr -1.4156
Cropland to Other LandAnnual average carbon increments in biomass (crops) year 1 Mg C/ha/yr -5.0Annual average carbon increments in dead organic matter (litter) year 1 Mg C/ha/yr 0.0Annual average increments in soil organic carbon years 1-20 Mg C/ha/yr -0.2168
Grassland to Other LandAnnual average carbon increments in biomass (crops) year 1 Mg C/ha/yr -3.78Annual average carbon increments in dead organic matter (litter) year 1 Mg C/ha/yr 0.0Annual average increments in soil organic carbon years 1-20 Mg C/ha/yr -0.1241
Wetlands to Other LandAnnual average carbon increments in biomass (crops) year 1 Mg C/ha/yr -4.2Annual average carbon increments in dead organic matter (litter) year 1 Mg C/ha/yr 0.0Annual average increments in soil organic carbon years 1-20 Mg C/ha/yr -2.4818
Uncertainty of AD and source ± 10%, expert judgmentUncertainty of EF and source ± 10%, expert judgment
Potential ImprovementsThe possibility to improve the cadastral records (as the main reference sources for AD) pertaining to specification of initial land use categories from which they were converted to other land, will be considered for the next inventory cycles in the RM. At the same time, it is necessary to analyze the input and output process of land within the 4F “Other Land” category, including in terms of establishing the average conversion period.

Chapter 2: Methods and Data Documentation
2 - 187
2.4.7. Category 4G ‘Harvested Wood Products’Table 2.4.7.1 below comprise relevant information on source and/or sink categories comprised within the inventory, including description of each source and/or sink by gas allocated to category 4G ‘Harvested Wood Products’.Table 2.4.7.1: Information on Category 4G ‘Harvested Wood Products’ – CO2Sector LULUCFCategory 4G Harvested Wood ProductsSource and/or Sink Category / Gas 4G Harvested Wood Products – CO2
Key Category? Tier 1: Yes: 2016 (T); Tier 2: Yes: 2016 (T)Category Description / Defini-tion Category includes CO2 removals/emissions from wood products harvested/processed, imported or exported (rough round wood; saw logs, timber, wood panels) used in the national economy.
Country Detail In the RM, wood harvesting from forests takes place during the process of tending cutting (spacing, cleaning, thinning and hygiene cuts), final harvesting (regeneration cuts, preservation, hygiene) and ecologi-cal reconstruction.
Equation(Describe variables for method used)
For 4G “Harvested Wood Product” category a Tier 1 approach was used (2006 IPCC Guidelines), respectively default emission/removal factors. For the calculations, the IPCC „HWP Calculator” module (“Production Approach”) was used.
Reference 2006 IPCC Guidelines (Volume 4, Chapter 12, Page 12.29).Describe How and Why this Method Was Chosen This approach was selected due to deficiencies related to activity data, especially for the period 1961-1991.
Type and source of activity data AD regarding 1961-2016 time series on wood products included in 4G “Harvested Wood Products” are partly available in the official statistics of the RM, in particular for 1961-1993 periods. For 1994-2016 time series AD from FAOSTAT database were used.
Type and source of EF and OF
Emission/removal factors were used according to the 2006 IPCC Guidelines (Volume 4, Chapter 12, Table 12.2, Page 12.17)Categories Indicators Units Indicators Value
Period of useSolid wood products (timber, saw logs and veneer, rough round wood, wood panels etc.) years 30.0Paper products years 3.0
Conversion factorTimber, other types of round wood (saw logs and veneer, etc.) t C/m3 0.5Wood panels t C/m3 0.295Paper and cardboards t C/t 0.45
Uncertainty of AD and source ± 30%, expert judgmentUncertainty of EF and source ± 10%, expert judgment
Potential Improvements The possibility to improve the statistical records (as the main reference sources for AD) pertaining to wood products production/export/import will be considered for the next inventory cycles in the Republic of Moldova.
2.5. Waste SectorRelevant information on categories comprised within the inventory, including description of each category allocated to Sector 5 ‘Waste’ is provided below.
2.5.1. Category 5A ‘Solid Waste Disposal’Tables 2.5.1.1-2.5.1.2 below comprise relevant information on source categories comprised within the inventory, including description of each source by gas allocated to category 5A ‘Solid Waste Disposal’.

Chapter 2: Methods and Data Documentation
2 - 188
Table 2.5.1.1: Information on Category 5A ‘Solid Waste Disposal’ – CH4Sector WasteCategory 5A Solid Waste Disposal
Source / Gas5A1. Managed waste disposal sites – CH45A2. Unmanaged waste disposal sites – CH45A3. Uncategorized waste disposal sites – CH4
Key Category? Tier 1: Yes: 1990 (L), 2016 (L, T); Tier 2: Yes: 1990 (L), 2016 (L, T) (source category 5A Solid Waste Disposal – aggregated for all sources)
Category Description/Definition
Treatment and disposal of municipal, industrial and other solid waste produces significant amounts of methane (CH4). In addition to CH4, solid waste disposal sites (SWDS) also produce biogenic carbon dioxide (CO2) and non-methane volatile organic compounds (NMVOCs) as well as smaller amounts of nitrous oxide (N2O), nitrogen oxides (NOx) and carbon monoxide (CO). Decomposition of organic material derived from biomass sources (e.g., crops, wood) is the primary source of CO2 released from waste. These CO2 emissions are not included in national totals, because the carbon is of biogenic origin and net emissions are accounted for under the AFOLU Sector. Within the 5A1 Waste disposal sites is monitored CH4 emissions from solid waste disposal in landfills. The methane generating potential depends on the morphological composition of the MSW and on the disposal practices and type of landfills (managed or unmanaged).
Country Detail
The spreadsheet keeps a running total of the amount of decomposable DOC in the disposal site, taking account of the amount deposited each year and the amount remaining from previous years. This is used to calculate the amount of DOC decomposing to CH4 and CO2 each year. The model then calculates the amount of CH4 generated from the DDOCm, and subtracts the CH4 recovered and CH4 oxidized in the cover material to give the amount of CH4 emitted. Calculation is based on waste composition data. The amounts of each type of degradable waste material (food, garden and park waste, paper and cardboard, wood, textiles, etc.) in MSW are entered separately.
Equation(Describe variables for method used.)
Tier 3 methodological approach - the methane emissions estimation is based on the first-order decomposition method (IPCC FOD) method using a mix of default and CS parameters.Methane emissions were calculated according to Equation 3.1 of the IPCC 2006 Guidelines (Volume 5, Chapter 3, p. 3.8):
Emissions CH4 = [Σx CH4 generated x,T - RT] • (1-OXT)Where:
Emissions CH4 = Methane emissions in year T, thousand tons;T = year of inventory;x = category or type of waste;RT = methane recovered in the inventory year T, thousand tons;OXT = oxidation factor in year T (fraction).
Reference IPCC 2006 Guidelines for National Greenhouse Gas Inventories (IPCC, 2006), Volume 5, Chapter 3, pages 3.1-3.40.Describe How and Why this Method Was Chosen Due to the importance of this source and availability of CS parameters and EFs, the Tier 3 methodology has been used.
Type and source of activity data
Amount of waste generated and transported to landfills (kt) – National Statistical Bureau of the Republic of Moldova.Half-lives and k: IPCC default for wet and temperate climateCS values for DOC and DOCf values are provided in the table below:
DOC DOCf1986 0.2069 0.51781993 0.1891 0.52581996 0.1522 0.56671999 0.1091 0.63532001 0.1009 0.62072003 0.1201 0.62772005 0.1410 0.59352012 0.1405 0.49852016 0.1475 0.4204

Chapter 2: Methods and Data Documentation
2 - 189
Type and source of activity data
National values for fraction of methane are provided in the table below:C --> CH4 C --> CO2
1986 0.5315 0.46851993 0.5400 0.46001996 0.5453 0.45471999 0.5545 0.44552001 0.5510 0.44902003 0.5452 0.45482005 0.5563 0.44372012 0.5423 0.45772016 0.5524 0.4476
Delay time (months) = 6Methane conversion factor (MCF) = 1 (managed); 0.8 (unmanaged deep); 0.4 (unmanaged shallow)Oxidation factor = 0Methane recovery (MRj) - Annual Reports on the Activity of the National Agency for Energy Regulation, <http://anre.md/ro/reports/8>.Amount of waste generated and transported to landfills (kt) – National Statistical Bureau of the Republic of Moldova.Half-lives and k: IPCC default for wet and temperate climateCS values for DOC and DOCf values are provided in the table below:
DOC DOCf1986 0.2069 0.51781993 0.1891 0.52581996 0.1522 0.56671999 0.1091 0.63532001 0.1009 0.62072003 0.1201 0.62772005 0.1410 0.59352012 0.1405 0.49852016 0.1475 0.4204
National values for fraction of methane are provided in the table below:C --> CH4 C --> CO2
1986 0.5315 0.46851993 0.5400 0.46001996 0.5453 0.45471999 0.5545 0.44552001 0.5510 0.44902003 0.5452 0.45482005 0.5563 0.44372012 0.5423 0.45772016 0.5524 0.4476
Delay time (months) = 6Methane conversion factor (MCF) = 1 (managed); 0.8 (unmanaged deep); 0.4 (unmanaged shallow)Oxidation factor = 0Methane recovery (MRj) - Annual Reports on the Activity of the National Agency for Energy Regulation, <http://anre.md/ro/reports/8>.

Chapter 2: Methods and Data Documentation
2 - 190
Type and source of EF and OF Country Specific Emission Factors values, as reported in the Chapter 7 ‘Waste’ of the ‘National Inventory Report: 1990-2016. Greenhouse Gas Sources and Sinks in the Republic of Moldova’ (2018).Uncertainty of AD and source ± 30% - expert judgement (based on the 2006 IPCC GL)Uncertainty of EF and source ± 40% - expert judgement (based on the 2006 IPCC GL)
Potential Improvements
Among the main priorities is the need to foster improved statistical recording related to waste. Waste management will be essentially restructured. In this context it is appropriate to transpose the Commission Decision 2000/532 / EC on the list of waste, including hazardous waste. Other important document is the GD no. 501 of 29.05.2018 on approval the Instruction on evidence and transmission of data and information waste management and management. Adoption of the List of waste, including hazardous waste was done by GD nr. 99 of 30.01.2018. It will help to improve the national statistical records waste management according to EU requirements and will allow meeting the commitments the Republic of Moldova has made while ratifying international treaties on environmental protection and effective reporting on their coherent implementation. In this context, it is recommended to improve the quality of activity data related to industrial solid waste generation and storage. The Waste Management Strategy for 2013-2027 of the Republic of Moldova provides for the development of integrated municipal waste management systems by harmonizing the legal, institutional and regulatory framework with the EU standards, based on regional approach (geographical position, economic development, availability of access roads, soil and hydrogeological conditions, the number of population etc.). In line with this, it foresees the promotion and implementation of selective collection systems in all localities, both in residential and production sector, as well as facilities for sorting, recycling and composting; development of municipal waste disposal capacities by construction of seven regional SWDS and two mechanical-biological treatment plants.
Table 2.5.1.2: Information on Category 5A ‘Solid Waste Disposal’ – NMVOCSector WasteCategory 5A Solid Waste Disposal
Source / Gas5A1. Managed waste disposal sites – NMVOC5A2. Unmanaged waste disposal sites – NMVOC5A3. Uncategorized waste disposal sites – NMVOC
Key Category? Not applicable for pollutant emissions.Category Description / Defini-tion In addition to CH4, solid waste disposal sites (SWDS) also produce non-methane volatile organic compounds (NMVOCs), which are considered to be GHG precursors.
Country Detail NMVOC emissions from SWDS were estimated using the methodological approach available in the EMEP/EEA Air Pollutant Emission Inventory Guidebook (2016), based on default emission factors.
Equation(Describe variables for method used)
NMVOC Emissions were calculated according to the Equation 1, EMEP/EEA Air Pollutant Emission Inventory Guidebook 2016, Category 5A “Biological treatment of waste – solid waste disposal on land” (page 5):
NMVOC Emissions = W • EF • 10-6
Where: NMVOC Emissions – NMVOC emissions in inventory year, kt / yr; W – amount of solid waste disposed, kt / yr; EF – emission factor, kg NMVOC / kt of waste;10-6 – conversion factor, from kg to kt
Reference EMEP/EEA Air Pollutant Emission Inventory Guidebook (2016), Section 5.A ‘Biological treatment of waste – solid waste disposal on land’, pages 1-7Describe How and Why this Method Was Chosen Due to the lower importance of this source and unavailability of detailed data from measurements, the Tier 1 methodology has been used.
Type and source of activity data Amount of waste generated and transported to landfills (kt) – National Statistical Bureau of the Republic of Moldova.
Type and source of EF and OF EF default value used - 1.56 kg NMVOC/t of solid waste, as available in the EMEP/EEA Air Pollutant Emission Inventory Guidebook (2016), Category 5A “Biological treatment of waste – solid waste disposal on land”, Table 3-1, page 5.
Uncertainty of AD and source ± 30% - expert judgementUncertainty of EF and source ± 20% - expert judgement (based on EMEP/EEA Air Pollutant Emission Inventory Guidebook, 2016).
2.5.2. Category 5C ‘Incineration and Open Burning of Waste’
Tables 2.5.2.1-2.5.2.4 below comprise relevant information on source categories comprised within the inventory, including description of each source by gas allocated to category 5C ‘Incineration and Open Burning of Waste’.

Chapter 2: Methods and Data Documentation
2 - 191
Table 2.5.2.1: Information on Category 5C ‘Incineration and Open Burning of Waste’ – CO2Sector 5 WasteCategory 5C Incineration and Open Burning of WasteSource / Gas 5C2. Open burning of waste – CO2
Key Category? No
Category Description/Definition
Open burning of waste can be defined as the combustion of unwanted combustible materials such as paper, wood, plastics, textiles, rubber, waste oils and other debris in nature (open-air) or in open dumps, where smoke and other emissions are released directly into the air without passing through a chimney or stack. Open burning can also include incineration devices that do not control the combustion air to maintain an adequate temperature and do not provide sufficient residence time for complete combustion. This waste management practice is used in many developing countries while in developed countries open burning of waste may either be strictly regulated, or otherwise occur more frequently in rural areas than in urban areas. Only CO2 emissions resulting from oxidation, during incineration and open burning of carbon in waste of fossil origin (e.g., plastics, certain textiles, rubber, liquid solvents, and waste oil) are considered net emissions and should be included in the national CO2 emissions estimate. The CO2 emissions from combustion of biomass materials (e.g., paper, food, and wood waste) contained in the waste are biogenic emissions and should not be included in national total emission estimate.
Country Detail The incineration of waste practice is predominantly characteristic to rural areas, both in households and on landfills in order to reduce the volume of solid waste disposed, mainly by burning organic waste (paper, cardboard, plastics and vegetable waste).
Equation(Describe variables for method used.)
The CO2 emissions were calculated according to the Equation 5.2 of 2006 IPCC Guidelines, Vol. 5, page 5.7:
CO2 Emissions = MSW • Σj (WFj • dmj • CFj • FCFj • OFj) • 44/12Where:
CO2 Emissions – CO2 emissions in inventory year, kt/yr; MSW – total amount of municipal solid waste as wet weight incinerated or open-burned, kt/yr; WFj – fraction of waste type/material of component j in the MSW as wet weight incinerated or open-burned; dmj – dry matter content in the component j of the MSW incinerated or open-burned; CFj – fraction of carbon in the dry matter (carbon content) of component j;FCFj – fraction of fossil carbon in the total carbon of component j; OFj – oxidation factor; 44/12 – conversion factor from C to CO2.
When: ∑ WFj = 1, j – component of the MSW incinerated/open-burned such as paper and cardboard, textiles, food waste, wood, garden (yard) and park waste, disposable nappies, rubber and leather, plastics, metal, glass, other inert waste.
The amount of waste open-burned each year was estimated using Equation 5.7 from the 2006 IPCC Guidelines (Vol. 5, Chapter 5.3.2, page 5.16):
MSWB = P • P frac• MSWP • B frac • 365 • 10-6
Where:MSWB – total amount of municipal solid waste open-burned, kt/yr;P – population, capita; Pfrac – fraction of population burning waste (fraction);MSWP – per capita waste generation, kg waste/capita/day;Bfrac – fraction of the waste amount that is burned relative to the total amount of waste treated (fraction);365 – number of days per year10-6 – conversion factor from kg to kt
Methodology: Tier 1Reference 2006 IPCC Guidelines, Vol. 5, pages 5.5-5.11.Describe How and Why this Method Was Chosen Due to the lower importance of this source and unavailability of detailed data from measurements, the Tier 1 methodology has been used.

Chapter 2: Methods and Data Documentation
2 - 192
Type and source of activity dataPopulation number – National Statistical Bureau of the Republic of Moldova.Amount of clinical waste generated and burned – National Public Health Agency of the Ministry of Health of the Republic of Moldova.Daily ratio of generated MSW - Waste Management Strategy of the Republic of Moldova 2013-2027.
Type and source of EF and OF
EFs are calculated from default parameters from 2006 IPCC Guidelines, Vol. 5, Table 2.4 and 5.2Unit Wood and paper MSW Clinical waste Other industrial
dm (%) % 85 90 35 50CF % 50 3 60 50
FCF % 0 100 40 90OF % 100 100 100 100EF kg C/t waste 425 27 84 225
EF kg CO2/t waste = EF kg C/t waste • 44/12Uncertainty of AD and source ± 40% - expert judgement (based on 2006 IPCC Guidelines)Uncertainty of EF and source ± 25% - expert judgement (based on 2006 IPCC Guidelines)
Potential Improvements
Transposition of Commission Decision 2000/532/EC on the List of wastes, including hazardous waste, pursuant to the Waste Act, no. 209 of 29.07.2016 will create premises for improving waste management activity data. Thus, in the perspective of the coming years, the economic agents that treat the waste thermally will be obliged to report waste management data in an Automated Information System. It will therefore be possible to improve the quality of activity data used to assess emissions from source category 5C “Waste Incineration and Burning”. Other important document is the GD no 501 of 29.05.2018 on approval the Instruction on evidence and transmission of data and information waste management and management. Adoption of the List of waste, including hazardous waste was done by GD no 99 of 30.01.2018. It will help to improve the national statistical records waste management according to EU requirements and will allow meeting the commitments the Republic of Moldova has made while ratifying international treaties on environmental protection and effective reporting on their coherent implementation.
Table 2.5.2.2: Information on Category 5C ‘Incineration and Open Burning of Waste’ – CH4Sector WasteCategory 5C Incineration and Open Burning of WasteSource / Gas 5C2. Open burning of waste – CH4
Key Category? No
Category Description/Definition
Open burning of waste can be defined as the combustion of unwanted combustible materials such as paper, wood, plastics, textiles, rubber, waste oils and other debris in nature (open-air) or in open dumps, where smoke and other emissions are released directly into the air without passing through a chimney or stack. Open burning can also include incineration devices that do not control the combustion air to maintain an adequate temperature and do not provide sufficient residence time for complete combustion. This waste management practice is used in many developing countries while in developed countries open burning of waste may either be strictly regulated, or otherwise occur more frequently in rural areas than in urban areas. Methane emissions from incineration and open burning of waste are a result of incomplete combustion. Important factors affecting the emissions are temperature, residence time, and air ratio (air volume in relation to the waste amount).
Country Detail The incineration of waste practice is predominantly characteristic to rural areas, both in households and on landfills in order to reduce the volume of solid waste disposed, mainly by burning organic waste (paper, cardboard, plastics and vegetable waste).
Equation(Describe variables for method used.)
The CH4 emissions were calculated according to the Equation 5.4 of the 2006 IPCC Guidelines, Vol. 5, page 5.12:CH4 Emissions = Σi (IWi • EFi) •10-6
Where:CH4 Emissions – CH4 emissions in inventory year, kt / yr; IWi – amount of solid waste of type i incinerated or open-burned, kt / yr; EFi – aggregate CH4 emission factor, kg CH4 / kt waste type I;10-6 – conversion factor, from kg to kt; i – category or type of waste incinerated/open-burned, specified as follows: MSW – municipal solid waste; ISW: industrial solid waste; HW: hazardous waste; CW: clinical waste, SS: sewage sludge; others (to be specified).
The amount of municipal waste open-burned each year was estimated using Equation 5.7 from the 2006 IPCC Guidelines (Vol. 5, Chapter 5.3.2, page 5.16):

Chapter 2: Methods and Data Documentation
2 - 193
Equation(Describe variables for method used.)
MSWB = P • P frac• MSWP • B frac • 365 • 10-6
Where:MSWB – total amount of municipal solid waste open-burned, kt/yr;P – population, capita; Pfrac – fraction of population burning waste (fraction);MSWP – per capita waste generation, kg waste/capita/day;Bfrac – fraction of the waste amount that is burned relative to the total amount of waste treated (fraction);365 – number of days per year10-6 – conversion factor from kg to kt
Methodology: Tier 1Reference IPCC 2006 Guidelines, Vol. 5, pages 5.11-5.13.Describe How and Why this Method Was Chosen Due to the lower importance of this source and unavailability of detailed data from measurements, the Tier 1 methodology has been used.
Type and source of activity dataPopulation number – National Statistical Bureau of the Republic of Moldova.Amount of clinical waste – National Public Health Agency of the Ministry of Health of the Republic of Moldova.Daily ratio of generated MSW – Waste Management Strategy of the Republic of Moldova 2013-2027.
Type and source of EF and OF EFs default value used – 6.5 kg CH4/t MSW – available in the 2006 IPCC Guidelines, Vol. 5, Chapter 5, page 5.20.Uncertainty of AD and source ± 40% - expert judgement (based on IPCC 2006 Guidelines)Uncertainty of EF and source ± 50% - expert judgement (based on IPCC 2006 Guidelines)
Potential Improvements
Transposition of Commission Decision 2000/532/EC on the List of wastes, including hazardous waste, pursuant to the Waste Act, no. 209 of 29.07.2016 will create premises for improving waste management activity data. Thus, in the perspective of the coming years, the economic agents that treat the waste thermally will be obliged to report waste management data in an Automated Information System. It will therefore be possible to improve the quality of activity data used to assess emissions from source category 5C “Waste Incineration and Burning”. Other important document is the GD no 501 of 29.05.2018 on approval the Instruction on evidence and transmission of data and information waste management and management. Adoption of the List of waste, including hazardous waste was done by GD no 99 of 30.01.2018. It will help to improve the national statistical records waste management according to EU requirements and will allow meeting the commitments the Republic of Moldova has made while ratifying international treaties on environmental protection and effective reporting on their coherent implementation.
Table 2.5.2.3: Information on Category 5C ‘Incineration and Open Burning of Waste’ – N2OSector 5 WasteCategory 5C Incineration and Open Burning of WasteSource / Gas 5C2. Open burning of waste – N2OKey Category? No
Category Description/Definition
Open burning of waste can be defined as the combustion of unwanted combustible materials such as paper, wood, plastics, textiles, rubber, waste oils and other debris in nature (open-air) or in open dumps, where smoke and other emissions are released directly into the air without passing through a chimney or stack. Open burning can also include incineration devices that do not control the combustion air to maintain an adequate temperature and do not provide sufficient residence time for complete combustion. This waste management practice is used in many developing countries while in developed countries open burning of waste may either be strictly regulated, or otherwise occur more frequently in rural areas than in urban areas. Only CO2 emissions resulting from oxidation, during incineration and open burning of carbon in waste of fossil origin (e.g., plastics, certain textiles, rubber, liquid solvents, and waste oil) are considered net emissions and should be included in the national CO2 emissions estimate. The CO2 emissions from combustion of biomass materials (e.g., paper, food, and wood waste) contained in the waste are biogenic emissions and should not be included in national total emission estimate.
Country Detail The incineration of waste practice is predominantly characteristic to rural areas, both in households and on landfills in order to reduce the volume of solid waste disposed, mainly by burning organic waste (paper, cardboard, plastics and vegetable waste).

Chapter 2: Methods and Data Documentation
2 - 194
Equation(Describe variables for method used.)
The emission of N2O were calculated according to the Equation 5.5 of the IPCC 2006 Guidelines, Vol. 5, page 5.14, N2O Emissions = Σi (IWi • EFi) • 10-6
Where:N2O Emissions – N2O emissions in inventory year, kt/yr; IWi – amount of solid waste of type i incinerated or open-burned, kt/yr; EFi – N2O emission factor, kg N2O/kt waste type i;10-6 – conversion factor, from kg to kt; i – category or type of waste incinerated/open-burned, specified as follows: MSW – municipal solid waste; ISW: industrial solid waste; HW: hazardous waste; CW: clinical waste, SS: sewage sludge; others (to be specified).
The amount of municipal waste open-burned each year was estimated using Equation 5.7 from the 2006 IPCC Guidelines (Vol. 5, Chapter 5.3.2, page 5.16):MSWB = P • P frac• MSWP • B frac • 365 • 10-6
Where:MSWB – total amount of municipal solid waste open-burned, kt/yr;P – population, capita; Pfrac – fraction of population burning waste (fraction);MSWP – per capita waste generation, kg waste/capita/day;Bfrac – fraction of the waste amount that is burned relative to the total amount of waste treated (fraction);365 – number of days per year10-6 – conversion factor from kg to kt
Methodology: Tier 1Reference IPCC 2006 Guidelines, Vol. 5, pages 5.13-5.15.Describe How and Why this Method Was Chosen Due to the lower importance of this source and unavailability of detailed data from measurements, the Tier 1 methodology has been used.
Type and source of activity dataPopulation number – National Statistical Bureau of the Republic of Moldova.Amount of clinical waste – National Public Health Agency of the Ministry of Health of the Republic of Moldova.Daily ratio of generated MSW – Waste Management Strategy of the Republic of Moldova 2013-2027.
Type and source of EF and OF EFs default value used – 0.15 kg N2O/t of MSW – available in the 2006 IPCC Guidelines, Vol. 5, Chapter 5, Table 5.6, page 5.22.Uncertainty of AD and source ± 40% - expert judgement (based on 2006 IPCC Guidelines)Uncertainty of EF and source ± 100% - expert judgement (based on 2006 IPCC Guidelines)
Potential Improvements
Transposition of Commission Decision 2000/532/EC on the list of wastes, including hazardous waste, pursuant to the Waste Act, no. 209 of 29.07.2016 will create premises for improving waste management activity data. Thus, in the perspective of the coming years, the economic agents that treat the waste thermally will be obliged to report waste management data in an Automated Information System. It will therefore be possible to improve the quality of activity data used to assess emissions from source category 5C “Waste Incineration and Burning”. Other important document is the GD no 501 of 29.05.2018 on approval the Instruction on evidence and transmission of data and information waste management and management. Adoption of the List of waste, including hazardous waste was done by GD no 99 of 30.01.2018. It will help to improve the national statistical records waste management according to EU requirements and will allow meeting the commitments the Republic of Moldova has made while ratifying international treaties on environmental protection and effective reporting on their coherent implementation.
Table 2.5.2.4: Information on Category 5C ‘Incineration and Open Burning of Waste’ – NOx, CO, NMVOC, SO2Sector WasteCategory 5C Incineration and Open Burning of WasteSource / Gas 5C2. Open burning of waste – NOx, CO, NMVOC, SO2
Key Category? Not applicable for pollutant emissions.
Category Description / Defini-tion
Open burning of waste can be defined as the combustion of unwanted combustible materials such as paper, wood, plastics, textiles, rubber, waste oils and other debris in nature (open-air) or in open dumps, where smoke and other emissions are released directly into the air without passing through a chimney or stack. Open burning can also include incineration devices that do not control the combustion air to maintain an adequate temperature and do not provide sufficient residence time for complete combustion. This waste management practice is used in many developing countries while in developed countries open burning of waste may either be strictly regulated, or otherwise occur more frequently in rural areas than in urban areas. In many cases the open burning of waste may be slow and inefficient, and therefore emissions of carbon monoxide (CO) and volatile organic compounds (VOCs) will be more significant than emissions of oxides of nitrogen (NOx).

Chapter 2: Methods and Data Documentation
2 - 195
Country Detail The incineration of waste practice is predominantly characteristic to rural areas, both in households and on landfills in order to reduce the volume of solid waste disposed, mainly by burning organic waste (paper, cardboard, plastics and vegetable waste).
Equation(Describe variables for method used)
The indirect GHG emissions (NOx, CO, NMVOC and SO2) from open burning of waste were calculated according to the Equation 1 of the EMEP/EEA Air Pollutant Emission Inventory Guidebook (2016), Category 5.C.2 Open burning of waste, page 6:
Indirect GHG Emissions = Σi (IWi • EFi) • 10-6 Where:
Indirect GHG Emissions – indirect GHG emissions (NOx, CO, NMVOC and SO2) in inventory year, kt/yr; IWi – amount of solid waste of type i incinerated or open-burned, kt/yr; EFi – emission factor, kg indirect GHG/kt waste;10-6 – conversion factor, from kg to kt; i – category or type of waste incinerated/open-burned, specified as follows: MSW – municipal solid waste; ISW: industrial solid waste; HW: hazardous waste; CW: clinical waste, SS: sewage sludge; others (to be specified).
The amount of municipal waste open-burned each year was estimated using Equation 5.7 from the 2006 IPCC Guidelines (Vol. 5, Chapter 5.3.2, page 5.16):MSWB = P • P frac• MSWP • B frac • 365 • 10-6
Where:MSWB – total amount of municipal solid waste open-burned, kt/yr;P – population, capita; Pfrac – fraction of population burning waste (fraction);
Equation(Describe variables for method used)
MSWP – per capita waste generation, kg waste/capita/day;Bfrac – fraction of the waste amount that is burned relative to the total amount of waste treated (fraction);365 – number of days per year;10-6 – conversion factor from kg to kt.
Methodology: Tier 1Reference EMEP/EEA Air Pollutant Emission Inventory Guidebook (2016), Category 5.C.2 Open burning of waste, pages 3-12.Describe How and Why this Method Was Chosen Due to the lower importance of this source and unavailability of detailed data from measurements, the Tier 1 methodology has been used.
Type and source of activity dataPopulation number – National Statistical Bureau of the Republic of Moldova;Amount of clinical waste – National Public Health Agency of the Ministry of Health of the Republic of Moldova;Daily ratio of generated MSW – Waste Management Strategy of the Republic of Moldova 2013-2027.
Type and source of EF and OF
Default EFs for Estimating Indirect GHG Emissions from the EMEP/EEA Atmospheric Emissions Inventory Guidebook (2016), Source Category 5.C.2 “Open Burning of Waste”, Table 3-1, page 6 and EMEP/EEA Atmospheric Emissions Inventory Guidebook (2016), Source Category 5.C.1.b.iii “Clinical Waste Incineration”, Table 3-1, page 8.
NOx, kg/t of waste CO, kg/t of waste NMVOC, kg/t of waste SO2, kg/t of wasteSolid Waste 3.8 55.83 1.23 0.11Clinical waste 2.3 0.19 0.70 0.54
Uncertainty of AD and source ± 40% - expert judgement (based on 2006 IPCC Guidelines)Uncertainty of EF and source ± 50% - expert judgement (based on EMEP/EEA Air Pollutant Emission Inventory Guidebook, 2016)
2.5.3. Category 5D ‘Wastewater Treatment and Discharge’Tables 2.5.3.1-2.5.3.4 below comprise relevant information on source categories comprised within the inventory, including description of each source by gas allocated to category 5D ‘Wastewater Treatment and Discharge’.

Chapter 2: Methods and Data Documentation
2 - 196
Table 2.5.3.1: Information on Category 5D1 ‘Domestic wastewater’ – CH4Sector WasteCategory 5D. Wastewater Treatment and DischargeSource / Gas 5D1. Domestic wastewater – CH4
Key Category? Tier 1: Yes: 1990 (L), 2016 (L, T); Tier 2: Yes: 1990 (L), 2016 (L, T) (source category 5D. Wastewater Treatment and Discharge – aggregated for all sources)
Category Description/Definition
Wastewater can be a source of methane (CH4) when treated or disposed anaerobically. It can also be a source of nitrous oxide (N2O) emissions. Wastewater originates from a variety of domestic, commercial and industrial sources and may be treated on site (uncollected), sewered to a centralized plant (collected) or disposed untreated nearby or via an outfall. Domestic wastewater is defined as wastewater from household water use, while industrial wastewater is from industrial practices only. The degree of wastewater treatment varies in most developing countries. Domestic wastewater is treated in centralized plants, pit latrines, septic systems or disposed of in unmanaged lagoons or waterways, via open or closed sewers. The most common wastewater treatment methods in developed countries are centralized aerobic wastewater treatment plants and lagoons for both domestic and industrial wastewater. To avoid high discharge fees or to meet regulatory standards, many large industrial facilities pre-treat their wastewater before releasing it into the sewage system. Domestic wastewater may also be treated in on-site septic systems.
Country Detail In the Republic of Moldova, the industrial wastewater treatment is done by household wastewater treatment plants, thus it is treated together with household wastewater. After generation, the industrial waste-water is discharged into sewage systems for household wastewater and is treated together with domestic wastewater by wastewater treatment plants. From among all industries, manufacture contributes the most to generation of wastewater with a high content of biodegradable organic substances. The wastewater (a mixture of domestic and industrial wastewater) is subject to classical (mechanical and biological) treatment under aerobic conditions. However, due to incorrect exploitation of existing treatment plants, a part of the wastewater (around 20% of total) is treated under anaerobic conditions. Equation 6.3 from the 2006 IPCC Guidelines (Volume 5, Chapter 6, page 6.13):
TOW = P • BOD • 0.001• I • DWhere:
TOW – total organics in wastewater in inventory year, kg BOD/yr;P – country population in inventory year (person);
Equation(Describe variables for method used.)
BOD – country-specific per capita BOD in inventory year, g/person/day; 0.001 = conversion from grams BOD to kg BOD;I – correction factor for additional industrial BOD discharged into sewers (for collected the default is 1.25, for uncollected the default is 1.00); D – number of days in a calendar year (365 days in regular years and 366 days in leap years: 1992, 1996, 2000, 2004, 2008, 2012).
Equation 6.2 from the 2006 IPCC Guidelines (Volume 5, Chapter 6, page 6.12): EFj = B0 • MCFj
Where:EFj – emission factor, kg CH4/kg BOD5;j – each treatment/discharge pathway or system; B0 – maximum methane producing capacity, kg CH4/kg BOD5;MCFj – methane correction factor (fraction).
Equation 6.1 from the 2006 IPCC Guidelines (Volume 5, Chapter 6, page 6.11):CH4 Emissions = [∑ ij (Ui •Ti, j • EFj)] • (TOW-S)-R
Where: CH4 Emissions – methane emissions in inventory year, kg CH4/yr;TOW – total organics in wastewater in inventory year, kg BOD/yr;S – organic component removed as sludge in inventory year, kg BOD/yr;Ui – fraction of population in income group i, in inventory year (fraction); T i, j – degree of utilization of treatment/discharge pathway or system, j, for each income group fraction i, in inventory year (fraction); i – income group: rural – low income, urban - high income and urban - low income;j – each treatment/discharge pathway or system;EFj – emission factor, kg CH4/kg BOD;R – amount of methane recovered in inventory year, kg CH4/yr.
Methodology: Tier 1Reference 2006 IPCC Guidelines, Volume 5, Chapter 6, pages 6.9-6.12.Describe How and Why this Method Was Chosen Due to the lower importance of this source and unavailability of detailed data from measurements, the Tier 1 methodology has been used.

Chapter 2: Methods and Data Documentation
2 - 197
Type and source of activity dataPopulation (P) and share of different groups – National Statistical Bureau of the Republic of Moldova. Degradable organic component indicator (BOD) – in the Republic of Moldova the country-specific value is 60 BOD/person/day (SNIP G.03.02-2015, Table 7.1).Correction factor for additional industrial BOD discharged into sewers (I) – IPCC default value – for collected the default is 1.25, for uncollected the default is 1.00.
Type and source of EF and OF
Maximum methane producing capacity (B0) – IPCC default value – default value used is 0.6 (Volume 5, Chapter 6, Table 6.2, page 6.12).Methane correction factor (MCF) – IPCC default values (Volume 5, Chapter 6, Table 6.3, page 6.13).
Type of system Wastewater treatment systems and discharge pathways, j Bo, kg CH4/kg BOD5 MCF EF, kg CH4/kg BOD5
Untreated systemsSea, river and lake discharge without the preventive wastewater treatment 0.6 0.1 0.06Stagnant sewer 0.6 0.5 0.30Flowing sewer (open or closed) 0.6 0.0 0.0
Treated
systems
Centralized, aerobic treatment plant, well managed 0.6 0.1 0.6Centralized, aerobic treatment plant, not well managed 0.6 0.2 0.12Anaerobic digester for sludge 0.6 0.8 0.48Anaerobic shallow lagoon (<2 m) 0.6 0.2 0.12Anaerobic deep lagoon (>2 m) 0.6 0.8 0.48Septic system (half of BOD settles in anaerobic tank) 0.6 0.3 0.18Latrine, dry climate, ground water table lower than latrine, small family (3-5 persons) 0.6 0.1 0.06Latrine, dry climate, ground water table lower than latrine, communal (many users) 0.6 0.5 0.30Latrine, wet climate/flush water use, ground water table higher than latrine 0.6 0.7 0.42Latrine, regular sediment removal for fertilizer 0.6 0.1 0.06
Uncertainty of AD and source
Population – ± 5%, expert judgement (based on 2006 IPCC Guidelines)BOD – ± 30%, expert judgement (based on 2006 IPCC Guidelines)Fraction of population income group – ± 15%, expert judgement (based on 2006 IPCC Guidelines) Fraction of population devised depending on income level – ± 15%, expert judgement (based on 2006 IPCC Guidelines) Degree of utilization of treatment/discharge pathway or system for each income group – ± 15%, expert judgement (based on 2006 IPCC Guidelines)
Uncertainty of EF and source B0 – ± 30%, expert judgement (based on 2006 IPCC Guidelines)MCF for well managed plants – ± 10%, expert judgement (based on 2006 IPCC Guidelines)MCF for not well managed plants – ± 30%, expert judgement (based on 2006 IPCC Guidelines)MCF for latrines – ± 50%, expert judgement (based on 2006 IPCC Guidelines)
Potential Improvements
The Strategy on water supply and sanitation for 2014–2028 (Government Decision No. 199 as of 20.03.2014) has a general goal to ensure gradual access to quality water supply and sanitation services for all in the RM, contributing to the improvement of health, dignity and quality of life as well as to the economic development of the country. The Regulation on Wastewater Discharge in Water Bodies, approved through the Government Decision No. 802 as of 09.10.2013 aims to regulate the conditions of discharge, the introduction of specific substances into a body of surface water, groundwater or water fields. Thus, the Regulation indicates the emission limit values applicable to the discharge of wastewater from the industrial sectors (activities) into a body of surface water. At the regional level (Central, Southern and Northern Development Regions) there were created and approved Regional Sectoral Plans for Water and Sanitation Supply. All these actions will ensure improvements within the wastewater handling sector, by applying clearly defined regulatory, institutional and economic instruments. Currently, it entered into force the Action Plan for 2018-2028 on the regionalization of water supply and sanitation services, which includes actions to establish regional operators and, implicitly, to delegate the water supply and sewage systems management to the Agency, which represents an essential process for ensuring compliance with the acquis communautaire on offering access to quality water supply to the entire population as a fundamental human right. Another important goal is to optimize the number of operators, through their territorial grouping, in order to create viable regional operators by reducing the number of existing ones and establishing 5 major regional operators.
Table 2.5.3.2: Information on Category 5D2 ‘Industrial wastewater’ – CH4Sector WasteCategory 5D Wastewater Treatment and DischargeSource / Gas 5D2. Industrial wastewater – CH4
Key Category? Tier 1: Yes: 1990 (L), 2016 (L, T); Tier 2: Yes: 1990 (L), 2016 (L, T) (source category 5D. Wastewater Treatment and Discharge – aggregated for all sources)

Chapter 2: Methods and Data Documentation
2 - 198
Category Description/Definition
Industrial wastewater may be treated on site or released into domestic sewer systems. If it is released into the domestic sewer system, the emissions are to be included with the domestic wastewater emissions. This section deals with estimating CH4 emissions from on-site industrial wastewater treatment. Only industrial wastewater with significant carbon loading that is treated under intended or unintended anaerobic conditions will produce CH4. Organics in industrial wastewater are often expressed in terms of COD. In some cases industrial wastewater is discharged directly into bodies of water, while major industrial facilities may have comprehensive in-plant treatment.
Country Detail
In the Republic of Moldova, the industrial wastewater treatment is done by household wastewater treatment plants, thus it is treated together with household wastewater. After generation, the industrial waste-water is discharged into sewage systems for household wastewater and is treated together with domestic wastewater by wastewater treatment plants. From among all industries, manufacture contributes the most to generation of wastewater with a high content of biodegradable organic substances. The wastewater (a mixture of domestic and industrial wastewater) is subject to classical (mechanical and biological) treatment under aerobic conditions. However, due to incorrect exploitation of existing treatment plants, a part of the wastewater (around 20% of total) is treated under anaerobic conditions.
Equation(Describe variables for method used.)
Equation 6.6 from the 2006 IPCC Guidelines (Volume 5, Chapter 6, page 6.22):
TOWi = Pi • Wi • CODiWhere,
TOWi = total organically degradable material in wastewater for industry i, kg COD/yr;i = industrial sector;Pi = total industrial product for industrial sector i, t/yr; Wi = wastewater generated, m3/t product;CODi = chemical oxygen demand (industrial degradable organic component in wastewater), kg COD/m3.
Equation 6.2 from the 2006 IPCC Guidelines (Volume 5, Chapter 6, page 6.12):
EFj = B0 • MCFjWhere:
EFj – emission factor, kg CH4/kg COD;j – each treatment/discharge pathway or system;
Reference 2006 IPCC Guidelines, Volume 5, Chapter 6, pages 6.12-6.24.Describe How and Why this Method Was Chosen Due to the lower importance of this source and unavailability of detailed data from measurements, the Tier 1 methodology has been used.

Chapter 2: Methods and Data Documentation
2 - 199
Type and source of activity data
Industrial production and number of economic agents in territorial profile – National Statistical Bureau of the Republic of Moldova; Wastewater generated and COD – 2006 IPCC Guidelines, Volume 5, Chapter 6, Table 6.9, page 6.22; Mircea Gh. Negulescu et al. (1968), Industrial Wastewater Treatment, Technical Publishing House, Bucharest, 1968; СEC All Union Scientific Research Institute for Water Supply, Sew-age, Hydraulic Engineering Works and Engineering Hydrogeology (VNII VODGEO GOSSTROI of the USSR), 1982. Consolidated Norms in Water Supply and Water Disposal for Different Industries, Moscow, 1982; Sewage System for Populated Areas and Industrial Plants. Handbook. “Stroiizdat” Moscow, 1981.
Industry Production by Type COD i – industrial degradable organic component, kg COD/m3 W i – amount of wastewater generated per industrial production output unit, m3/t
Canned meat 4.1 13.0Canned vegetables and fruits 5.0 20.0Beer 2.9 6.3Wine and sparkling wine 1.5 23.0Cognac and brandy 11.0 24.0Meat and sausages 4.1 13.0Milk products 2.7 7.0Sugar 3.2 11.0Fish 2.5 13.0Vegetable oil and fats 0.8 3.1Soft drinks 1.0 3.8Corrugated cardboard 9.0 162.0Plastics and resins 3.7 0.6Paint and varnishes 3.0 67.0Detergents and soap 0.6 2.5Leather 7.0 4.2Textiles 1.0 42.6
Type and source of EF and OF Maximum methane producing capacity (B0) – default value used for industrial wastewater is 0.25 – 2006 IPCC Guidelines, Volume 5, Chapter 6, Table 6.2, page 6.12;Methane correction factor (MCF) – IPCC default values, 2006 IPCC Guidelines, Volume 5, Chapter 6, Table 6.3, page 6.13.
Uncertainty of AD and source Industrial production – ±25%, expert judgement (based on 2006 IPCC Guidelines)
Uncertainty of EF and source B0 – ±30%, expert judgement (based on 2006 IPCC Guidelines);MCF for well managed plants – ±10%, expert judgement (based on 2006 IPCC Guidelines);MCF for not well managed plants – ±30%, expert judgement (based on 2006 IPCC Guidelines).
Potential Improvements
The Strategy on water supply and sanitation for 2014–2028 (Government Decision No. 199 as of 20.03.2014) has a general goal to ensure gradual access to quality water supply and sanitation services for all in the RM, contributing to the improvement of health, dignity and quality of life as well as to the economic development of the country. The Regulation on Wastewater Discharge in Water Bodies, approved through the Government Decision No. 802 as of 09.10.2013 aims to regulate the conditions of discharge, the introduction of specific substances into a body of surface water, groundwater or water fields. Thus, the Regulation indicates the emission limit values applicable to the discharge of wastewater from the industrial sectors (activities) into a body of surface water. The Regulation on Requirements for Wastewater Collection, Treatment and Discharge in the Sewage System and/or in Water Basins for Urban and Rural Areas, approved through the Government Decision No. 950 as of 25.11.2013 provides for the maximum allowable limit values for pollutants in discharged water into natural water basins, which will contribute to a decrease of emissions.
Table 2.5.3.3: Information on Category 5D ‘Wastewater Treatment and Discharge’, 5D1 ‘Domestic wastewater’ – N2OSector WasteCategory 5D Wastewater Treatment and DischargeSource / Gas 5D1. Domestic wastewater – N2OKey Category? Tier 2: Yes: 2016 (T)

Chapter 2: Methods and Data Documentation
2 - 200
Category Description/Definition Nitrous oxide emissions can occur as direct emissions from treatment plants or from indirect emissions from wastewater after disposal of effluent into waterways, lakes or the sea. Direct emissions from nitrifica-tion and denitrification at wastewater treatment plants may be considered as a minor source. Typically, these emissions are much smaller than those from effluent and may only be of interest to countries that predominantly have advanced centralized wastewater treatment plants with nitrification and denitrification steps.
Country Detail N2O emissions from human sewage is comprised in this sector.
Equation(Describe variables for method used.)
Equation 6.7 from the 2006 IPCC Guidelines, Volume 5, Chapter 6, page 6.25: N2O Emissions = NEFFLUENT • EFEFFLUENT • 44/28
Where: N2O Emissions – N2O emissions in inventory year, kg N2O/yr;NEFFLUENT – total nitrogen in the effluent discharged to aquatic environments, kg N/yr;EFEFFLUENT – emission factor for N2O emissions from discharged to wastewater, kg N2O-N/kg N; [44/28] – stoichiometric ratio of N2O-N to N2O
Equation 6.8 from the 2006 IPCC Guidelines, Volume 5, Chapter 6, page 6.25: NEFFLUENT = (P • Protein • FNPR • FNON −CON • FIND−COM) − NSLUDGE
Where: NEFFLUENT – total annual amount of nitrogen in the wastewater effluent, kg N/yr;P – human population;Protein – annual per capita protein consumption, kg/person/yr;FNPR – fraction of nitrogen in protein, default = 0.16 kg N/kg protein FNON−CON – factor for non-consumed protein added to the wastewater FIND−COM – factor for industrial and commercial co-discharged protein into the sewer system NSLUDGE – nitrogen removed with sludge, kg N/yr.
Equation 6.9 from the 2006 IPCC Guidelines, Volume 5, Chapter 6, page 6.26:
N2O PLANT = P • TPLANT • FIND_COM • EFPLANT Where:
N2O PLANT – total N2O emissions from plants in inventory year, kg N2O/yr;P – human population;TPLANT – degree of utilization of modern, centralized WWT plants, %;FIND−COM – fraction of industrial and commercial co-discharged protein; EFPLANT – emission factor, 3.2 g N2O/person/year.
Methodology: Tier 1Reference 2006 IPCC Guidelines, Volume 5, Chapter 6, pages 6.24-6.27.Describe How and Why this Method Was Chosen Due to the lower importance of this source and unavailability of detailed data from measurements, the Tier 1 methodology has been used.
Type and source of activity data
Population (P) – National Statistical Bureau of the Republic of Moldova; Protein consumption (Protein) – United Nations Food and Agriculture Organization (FAO);Fraction of nitrogen in protein (FNPR) – default value 0.16 kg N/kg protein – 2006 IPCC Guidelines, Volume 5, Chapter 6, Table 6.11, page 6.27;Tplant – country-specific; FNON-CON – 1.1 for countries with no garbage disposals, 1.4 for countries with garbage disposals – 2006 IPCC Guidelines, Volume 5, Chapter 6, Table 6.11, page 6.27;FIND-COM – default value 1.25 – 2006 IPCC Guidelines, Volume 5, Chapter 6, Table 6.11, page 6.27.
Type and source of EF and OF EFEFFLUENT – default value used represent 0.005 kg N2O-N/kg N – 2006 IPCC Guidelines, Volume 5, Chapter 6, Table 6.11, page 6.27;EFPLANTS – default value, 3.2 g N2O/person/year – 2006 IPCC Guidelines, Volume 5, Chapter 6, Table 6.11, page 6.27.

Chapter 2: Methods and Data Documentation
2 - 201
Uncertainty of AD and source Population – ±5%, expert judgementProtein consumption – ±10%, expert judgement Tplant – ±20% , expert judgement
Uncertainty of EF and source ±25%, expert judgement
Potential Improvements
The Strategy on water supply and sanitation for 2014–2028 (Government Decision No. 199 as of 20.03.2014) has a general goal to ensure gradual access to quality water supply and sanitation services for all in the RM, contributing to the improvement of health, dignity and quality of life as well as to the economic development of the country. The Regulation on Wastewater Discharge in Water Bodies, approved through the Government Decision No. 802 as of 09.10.2013 aims to regulate the conditions of discharge, the introduction of specific substances into a body of surface water, groundwater or water fields. Thus, the Regulation indicates the emission limit values applicable to the discharge of wastewater from the industrial sectors (activities) into a body of surface water.
Table 2.5.3.4: Information on Category 5D ‘Wastewater Treatment and Discharge’, 5D1 ‘Domestic wastewater’ – NMVOCSector WasteCategory 5D Wastewater Treatment and DischargeSource / Gas 5D1. Domestic wastewater – NMVOCKey Category? Not applicable for pollutant emissions.
Category Description / Defini-tion
Wastewater can be a source of methane (CH4) when treated or disposed anaerobically. It can also be a source of nitrous oxide (N2O) emissions. Wastewater originates from a variety of domestic, commercial and industrial sources and may be treated on site (uncollected), sewered to a centralized plant (collected) or disposed untreated nearby or via an outfall. In urban areas, non-methane volatile organic com-pounds (NMVOC) emissions from waste water treatment plants will be of local importance.
Country Detail
In the Republic of Moldova, the industrial wastewater treatment is done by household wastewater treatment plants, thus it is treated together with household wastewater. After generation, the industrial waste-water is discharged into sewage systems for household wastewater and is treated together with domestic wastewater by wastewater treatment plants. From among all industries, manufacture contributes the most to generation of wastewater with a high content of biodegradable organic substances. The wastewater (a mixture of domestic and industrial wastewater) is subject to classical (mechanical and biological) treatment under aerobic conditions. However, due to incorrect exploitation of existing treatment plants, a part of the wastewater (around 20% of total) is treated under anaerobic conditions.
Equation(Describe variables for method used)
The NMVOC emissions were calculated according to the Equation 1, EMEP/EEA Air Pollutant Emission Inventory Guidebook (2016), Category 5.D ‘Wastewater handling’, page 6: NMVOC Emissions = AR • EF • 10-6
Where: NMVOC Emissions – NMVOC emissions in inventory year, kt/yr; AR – the activity rate for total wastewater discharged in inventory year, million m3/yr; EF – emission factor, mg NMVOC/m3 wastewater discharged;10-6 – conversion factor, from kg to kt.
Reference EMEP/EEA Air Pollutant Emission Inventory Guidebook (2016), Category 5.D ‘Wastewater handling’, pages 3-11.Describe How and Why this Method Was Chosen Due to the lower importance of this source and unavailability of detailed data from measurements, the Tier 1 methodology has been used.
Type and source of activity data Total wastewater discharged – National Statistical Bureau of the Republic of Moldova.Type and source of EF and OF Default emission factor – 15 kg NMVOC/million m3 wastewater discharged – EMEP/EEA Air Pollutant Emission Inventory Guidebook (2016), source category 5D “Wastewater Handling”, Table 3-1, page 7.Uncertainty of AD and source ±5%, expert judgement (based on the 2006 IPCC Guidelines)Uncertainty of EF and source ±20%, expert judgement (based on the EMEP/EEA Air Pollutant Emission Inventory Guidebook, 2016)

Chapter 3: Description of QA/QC Procedures
1: Institutional Arrangements
2: Methods and Data Documentation
3: Description of QA/QC Procedures
4: Description of Archiving System
5: Key Category Analysis
6: National Inventory Improvement Plan
Contact data of the Coordinator of the National Greenhous Gas Inventory
Country Republic of Moldova Postal address: 156A Mitropolit Dosoftei str., room 37, MD-2004, Chisinau, Republic of MoldovaName: Taranu Marius Telephone/Fax: +373 22 23 22 47Position: Coordinator of the National Greenhouse Gas Inventory E-mail: [email protected] Organization: Climate Change Office, Ministry of Agriculture, Regional Development and Environment URL: http://www.clima.md
3-1

Chapter 3: Description of QA/QC Procedures
3 - 2
3. Quality Assurance/Quality Control Procedures3.1. Background
Quality assurance and quality control measures are two distinct types of activities. The IPCC defines each as follows:• Quality Assurance (QA) – a planned system of review procedures conducted by personnel not directly involved in the inventory development process,
to verify whether data quality related objectives have been achieved, confirm that the inventory represents the best possible estimate of emissions and removals, given the available data and scientific knowledge. At the same time, it contributes to ensuring the quality control programs efficiency.
• Quality Control (QC) – a system of routine technical activities implemented by the inventory development team to measure and control the quality of the inventory as it is prepared. Quality control includes general methods such as data accuracy and estimates calculation control, as well as use of ap-proved standardized procedures for calculating emissions, measurements, uncertainties estimates, information archiving and reporting (Tier 1).
A higher tier QC includes technical review of key categories, activity data and emission factors, and estimation methods used.
Quality control ensures: i) constant and thorough inventory verification to confirm that the data are intact, accurate and complete; ii) identification and correction of errors or omissions; iii) documentation and archiving of all information underlying the inventory development and registration of all QC activities;
The Quality Assurance and Quality Control Plan contains the following elements:• List of personnel responsible for coordinating QA/QC;• General (Tier 1) QC procedures;• Source-specific (Tier 2) QC procedures;• QA review procedures;• Reporting, documentation and archiving procedures.
Each of these elements are described in more detail below.
3.2. Quality Assurance and Quality Control Plan
The written QA/QC Plan is a fundamental element of the National QA/QC System. This plan outlines QA/QC activities performed, the personnel responsible for these activities, and the schedule for completing these activities. The following sections describe the QA/QC Plan that the Republic of Moldova is following to ensure a high-quality national inventory.

Chapter 3: Description of QA/QC Procedures
3 - 3
3.3. Quality Assurance and Quality Control Personnel
The QA/QC Coordinator is the main person responsible for implementing the QA/QC Plan. In this role, the QA/QC Coordinator:• Clarifies and communicates QA/QC responsibilities to inventory members;• Develops and implements an overall QA/QC timeline and when external reviews will occur based on the GHG inventory schedule; • Develops and maintains QA/QC checklists appropriate to various inventory team member roles, and collects and reviews the accuracy of the checklists
and follow up when necessary to ensure that the required QA/QC procedures are implemented;• Ensure the timely and accurate completion of QA/QC checklists and the related activities; • Manages and delivers documentation of QA/QC activities to the inventory lead and archive coordinator;• Coordinates external reviews of the inventory document and ensures that comments are incorporated into the inventory;• Monitors the QA/QC procedures used during both the inventory development process and the compilation of information used in the inventory;• Communicates the progress and results of the QA/QC plan to all members of the team and to interested stakeholders;• Produces a partial report at the end of each phase of the inventory process and a final report scoring the resulting inventory in terms of QA/QC for
external audits.
In this role, the QA/QC Coordinator communicates with several other inventory members. Table 3.1 summarizes the key personnel responsible for QA/QC activities.
Table 3.1: Personnel Responsible for QA/QC ActivitiesTitle QA / QC Responsibility Name Organization Contact Information
Inventory Coordinator All aspects of the inventory program, cross-cutting QA/QC
Marius Taranu, MSc in Biology
Climate Change Office, Ministry of Agriculture, Regional Development and Environment
156A, Mitropolit Dosoftei Str., room 37, MD-2004, Chisinau, Repub-lic of MoldovaTel/Fax: +373-22-23-22-47, E-mail: [email protected], [email protected]
QA / QC Coordinator Implementing the overall QA / QC Plan Marius Taranu, MSc in Biology
Climate Change Office, Ministry of Agriculture, Regional Development and Environment
156A, Mitropolit Dosoftei Str., room 37, MD-2004, Chisinau, Repub-lic of MoldovaTel/Fax: +373-22-23-22-47, E-mail: [email protected], [email protected]
Energy Sector LeadImplement categories specific QA/QC procedures (Tier 1 and Tier 2 procedures listed in Tables 3.2 and 3.3 below) (Energy)
Elena Bicova, PhD in Power Engineering Institute of Power Engineering
5, Academiei Str., room 443, MD-2028, Chisinau, Republic of Mol-dova Tel.: +373-22-73-74-94, E-mail: [email protected]
Industrial Processes and Product Use Sector Lead
Implement categories specific QA / QC procedures (Tier 1 and Tier 2 procedures listed in Tables 3.2 and 3.3 below) (Industrial Processes and Product Use)
Anatolie Tarita, PhD in Biology Institute of Ecology and Geography
3, Academiei Str., room 437, MD-2028, Chisinau, Republic of Mol-dova Tel.: +373-22-71-89-38, +373-22-72-17-74, E-mail: [email protected]
Agriculture Sector LeadImplement categories specific QA / QC procedures (Tier 1 and Tier 2 procedures listed in Tables 3.2 and 3.3 below) (Agriculture)
Sergiu Cosman, PhD in Agriculture
Scientific Practical Institute for Bio-technology in Animal Husbandry and Veterinary Medicine
Maximovca village, Anenii-Noi district, MD-6525, Republic of Mol-dova Tel.: +373-22-35-93-57; +373-22-35-92-95, E-mail: [email protected]

Chapter 3: Description of QA/QC Procedures
3 - 4
Title QA / QC Responsibility Name Organization Contact Information
Land Use, Land-Use Change and For-estry Sector Lead
Implement categories specific QA / QC procedures (Tier 1 and Tier 2 procedures listed in Tables 3.2 and 3.3 below) (Land Use, Land-Use Change and For-estry)
Ion Talmaci, MSc in Biology
Forestry Research and Management Institute, Moldsilva Agency
69, Calea Iesilor Str., MD-2069, Chisinau, Republic of MoldovaTel.: +373-22-92-89-59, E-mail: [email protected]
Waste Sector LeadImplement categories specific QA / QC procedures (Tier 1 and Tier 2 procedures listed in Tables 3.2 and 3.3 below) (Waste)
Tatiana Tugui, PhD in Chemistry
Environmental Pollution Prevention Office, Ministry of Agriculture, Re-gional Development and Environment
156A, Mitropolit Dosoftei Str., room 310, MD-2004, Chisinau, Re-public of MoldovaTel./Fax: +373-22-22-25-42, E-mail: [email protected]
External Reviewer - Energy Sector
Review of the inventory by an expert who was not directly involved in compiling the GHG inventory (En-ergy Sector), to confirm that the inventory provides the best possible estimate of emissions and removals
Michael Tirsu, PhD in Power Engineering,Director
Institute of Power Engineering
5, Academiei Str., room 400, MD-2028, Chisinau, Republic of Moldova Tel.: +373-22-73-53-84, Fax: +373-22-73-53-82E-mail: [email protected]
External Reviewer - Industrial Processes and Product Use Sector
Review of the inventory by an expert who was not di-rectly involved in compiling the GHG inventory (Indus-trial Processes and Product Use Sector), to confirm that the inventory provides the best possible estimate of emissions and removals
Natalia Beglet, PhD in Power Engineering, Head of Program
Technical University of Moldova, Fac-ulty of Urbanism and Architecture, Program “Engineering of Heat, Gas and Climate Control Systems in Build-ings and Environment Protection”
78, 31 August 1989 Str., Building No.2, MD-2004, Chisinau, Republic of Moldova, Tel: +373-68-16-88-22E-mail: [email protected]
External Reviewer - Agriculture Sector (Animal Breeding)
Review of the inventory by an expert who was not directly involved in compiling the GHG inventory (Ag-riculture Sector – Animal Breeding, Categories 3A En-teric Fermentation and 3B Manure Management), to confirm that the inventory provides the best possible estimate of emissions and removals
Nicolae Bucataru, Prof., PhD Hab. in Agriculture Technical University of Moldova
8/1, Mircești Str., ap.71, Chisinau, Republic of MoldovaTel: +373-22-43-21-50E-mail: [email protected]
External Reviewer - Agriculture Sector (Agriculture Soils)
Review of the inventory by an expert who was not directly involved in compiling the GHG inventory (Agri-culture Sector – Agriculture Soils, Categories 3D Agri-cultural Soils and 3H Urea Application), to confirm that the inventory provides the best possible estimate of emissions and removals
Tamara Leah, Prof., PhD Agriculture, Deputy-Director
Institute of Soil Science, Agrochemis-try and Soil Protection “Nicolae Dimo”
100, Ialoveni Str., 1st floor, MD-2070, Chisinau, Republic of Moldova Tel: +373-22-28-48-43 / 28-48-62, Fax: +373-22-28-48-55E-mail: [email protected]
External Reviewer - Land Use, Land-Use Change and Forestry
Review of the inventory by an expert who was not di-rectly involved in compiling the GHG inventory (Land Use, Land-Use Change and Forestry Sector), to con-firm that the inventory provides the best possible esti-mate of emissions and removals
Liliana Spitoc, MSc in Biology, Head of Ser-vice
“Moldsilva” Agency, Forestry Re-search and Management Institute, Service for Prognoses, Monitoring, Programs and Strategies
69, Calea Iesilor Str., MD-2069, Chisinau, Republic of MoldovaTel.: +373-22-92-89-56E-mail: [email protected]
External Reviewer - Waste Sector
Review of the inventory by an expert who was not di-rectly involved in compiling the GHG inventory (Waste Sector), to confirm that the inventory provides the best possible estimate of emissions and removals
Ludmila Gofman, MSc in Envi-ronment Protection Independent consultant Tel: +373-69-06-23-39
E-mail: [email protected]
E-mail: [email protected]
E-mail: [email protected]

Chapter 3: Description of QA/QC Procedures
3 - 5
3.4. Communicating Quality Assurance and Quality Control Plan
The contents of the QA/QC Plan are communicated to inventory team members and outside experts so that the procedures can be effectively implemented, evaluated, and improved. The QA/QC Coordinator implements the following QA/QC procedures:
• Convene a meeting with all team members to develop and/or update the QA/QC Plan;• Distribute the QA/QC Plan to all team members required to perform QA/QC; • Conduct a “kick-off” meeting with all of those working on the inventory, introduce QA/QC Plan and distribute QC checklists;• Send written or electronic memos reminding team members of their QA/QC responsibilities and overall schedule.
3.5. General (Tier 1) QC Procedures for Source/Sink Category Leads
A minimum set of QC procedures are followed each inventory consecutive cycle for all categories to ensure that basic standards of quality are met. These standards focus on the processing, handling, documenting, archiving, and reporting procedures common to all categories. Table 3.2 lists the specific Tier 1 QC activities with indication of deadlines by when the activities were completed.
Table 3.2: General (Tier 1) QC Activities
QC activity Quality Control and Verification ProceduresTask completed Corrective action taken
Name Date Supporting documents DateData Gathering, Input, and Handling Checks
Check that assumptions and criteria for the selection of AD and EFs are docu-mented.
• Cross-check descriptions of activity data and emission factors with information on cat-egories and ensure that these are properly recorded and archived.
Elena BicovaAnatol TaritaSergiu CosmanIon TalmaciTatiana Tugui
28/02/2018 N/A N/A
Check for transcription errors in data in-put and reference.
• Confirm that bibliographical data references are properly cited in the internal docu-mentation (MDD report)
• Cross-check a sample of input data from each category (either measurements or pa-rameters used in calculations) for transcription errors.
• Utilize electronic data where possible to minimize transcription errors.• Check that spreadsheet features are used to minimize user/entry error:
o Avoid hardwiring factors into formulas.o Create automatic look-up tables for common values used throughout calcula-
tions.o Use cell protection so fixed data cannot accidentally be changed.o Build in automated checks, such as computational checks for calculations, or
range checks for input data.
Elena BicovaAnatol TaritaSergiu CosmanIon TalmaciTatiana Tugui
31/03/2018 N/A N/A
Check that emissions/removals are cal-culated correctly.
• Reproduce a representative sample of emissions/removals calculations.• If models are used, selectively mimic complex model calculations with abbreviated
calculations to judge relative accuracy.
Elena BicovaAnatol TaritaSergiu CosmanIon TalmaciTatiana Tugui
30/04/2018 N/A N/A

Chapter 3: Description of QA/QC Procedures
3 - 6
QC activity Quality Control and Verification ProceduresTask completed Corrective action taken
Name Date Supporting documents Date
Check that parameter and emission/re-moval units are correctly recorded and that appropriate conversion factors are used.
• Check that units are properly labelled in calculation sheets and (MDD template report)• Check that units are correctly carried through from beginning to end of calculations.• Check that conversion factors are correct.• Check that temporal and spatial adjustment factors are used correctly.
Elena BicovaAnatol TaritaSergiu CosmanIon TalmaciTatiana Tugui
30/04/2018 N/A N/A
Check the integrity of database files.
• Confirm that the appropriate data processing steps are correctly represented in the database.
• Confirm that data relationships are correctly represented in the database.• Ensure that data fields are properly labelled and have the correct design specifica-
tions.• Ensure that adequate documentation of database and model structure and operation
are archived.
Elena BicovaAnatol TaritaSergiu CosmanIon TalmaciTatiana Tugui
30/04/2018 N/A N/A
Check for consistency in data between categories.
• Identify parameters (e.g., activity data, constants) that are common to multiple catego-ries and confirm that there is consistency in the values used for these parameters in the emissions/removals calculations.
Elena BicovaAnatol TaritaSergiu CosmanIon TalmaciTatiana Tugui
30/04/2018 N/A N/A
Check that the movement of inventory data among processing steps is correct.
• Check that emissions/removals data are correctly aggregated from lower reporting levels to higher reporting levels when preparing summaries.
• Check that emissions/removals data are correctly transcribed between different inter-mediate products.
Elena BicovaAnatol TaritaSergiu CosmanIon TalmaciTatiana Tugui
30/04/2018 N/A N/A
Data Documentation
Review of internal documentation and archiving.
• Check that there is detailed internal documentation to support the estimates and en-able duplication of calculations.
• Check that every primary data element has a reference for the source of the data (via cell comments or another system of notation).
• Check that inventory data, supporting data, and inventory records are archived and stored to facilitate detailed review.
• Check that the archive is closed and retained in secure place following completion of the inventory
• Check integrity of any data archiving arrangements of outside organizations involved in inventory preparation.
Elena BicovaAnatol TaritaSergiu CosmanIon TalmaciTatiana Tugui
31/03/2018 N/A N/A
Calculation Checks
Check methodological and data chang-es resulting in recalculations.
• Check for temporal consistency in time series input data for each category. • Check for consistency in the algorithm/method used for calculations throughout the
time series. • Reproduce a representative sample of emission calculations to ensure mathematical
correctness.
Elena BicovaAnatol TaritaSergiu CosmanIon TalmaciTatiana Tugui
30/04/2018 N/A N/A

Chapter 3: Description of QA/QC Procedures
3 - 7
QC activity Quality Control and Verification ProceduresTask completed Corrective action taken
Name Date Supporting documents Date
Check time series consistency
• Check for temporal consistency in time series input data for each category.• Check for consistency in the algorithm/method used for calculations throughout the
time series.• Check methodological and data changes resulting in recalculations.• Check that the effects of mitigation activities have been appropriately reflected in time
series calculations.
Elena BicovaAnatol TaritaSergiu CosmanIon TalmaciTatiana Tugui
30/04/2018 N/A N/A
Check completeness
• Confirm that estimates are reported for all categories and for all years from the ap-propriate base year over the period of the current inventory.
• For subcategories, confirm that the entire category is being covered.• Proved clear definition of ‘Other’ type categories.• Check that known data gaps that result in incomplete category emissions/removals es-
timates are documented, including qualitative evaluation of the importance of the esti-mate in relation to total net emissions (e.g. subcategories classified as ‘not estimated’).
Elena BicovaAnatol TaritaSergiu CosmanIon TalmaciTatiana Tugui
30/06/2018 N/A N/A
Trend checks
• For each category, compare current inventory estimates to previous estimates, if avail-able. If there are significant changes or departures from expected trends, re-check estimates and explain any difference. Significant changes in emissions or removals from previous years may indicate possible input or calculation errors.
• Check value of implied emission factors (aggregate emissions/removals divided by ac-tivity data) across time series. Are changes in emissions or removals being captured?
• Check if there any unusual or unexplained trends noticed for activity data or other parameters across the time series.
Elena BicovaAnatol TaritaSergiu CosmanIon TalmaciTatiana Tugui
30/06/2018 N/A N/A
Source: This list has been adapted from the 2006 IPCC Guidelines for National GHG Inventories.
3.6. Category-Specific (Tier 2) Procedures
In addition to the Tier 1 QC procedures outlined in the preceding section, Tier 2 QC procedures, particularly for select key categories, were applied.
These key categories are:1) 1A1 - Fuel Combustion Activities - Energy Industries - CO2
2) 1A2 - Fuel Combustion Activities - Manufacturing Industries and Construction - CO2
3) 1A3b - Fuel Combustion Activities - Transport - Road transportation - CO2
4) 1A3c - Fuel Combustion Activities - Transport - Railways - CO2
5) 1A4 - Fuel Combustion Activities - Other Sectors - CH4
6) 1A4 - Fuel Combustion Activities - Other Sectors - CO2
7) 1B2 - Fugitive Emissions from Fuels - Oil and Natural Gas - CH4
8) 2A1 - Mineral industry - Cement Production - CO2
9) 2F1 - Product Uses as Substitutes for ODS - Refrigeration and Air Conditioning - HFCs10) 2F2 - Product Uses as Substitutes for ODS - Foam Blowing Agents - HFCs

Chapter 3: Description of QA/QC Procedures
3 - 8
11) 3A - Enteric Fermentation - CH4
12) 3B - Manure Management - CH4
13) 3Ba - Manure Management - N2O14) 3Bb - Indirect N2O Emissions from Manure Management - N2O15) 3Da - Direct N2O Emissions from Managed Soils - N2O16) 3Db - Indirect N2O Emissions from Managed Soils - N2O17) 4A1 - Forest Land Remaining Forest Land (Removals) - CO2
18) 4A2 - Land Converted to Forest Land (Removals) - CO2
19) 4B1 - Cropland Remaining Cropland (Emissions) - CO2
20) 4B2 - Land Converted to Cropland (Removals) - CO2
21) 4C2 - Land Converted to Grassland (Removals) - CO2
22) 4D2 - Land Converted to Wetlands (Removals) - CO2
23) 4E2 - Land Converted to Settlements (Emissions) - N2O24) 4G - Harvested Wood Products - CO2
25) 5A - Solid Waste Disposal - CH4
26) 5D - Wastewater Treatment and Discharge: Domestic - CH4
Specific procedures (Tier2) verification and QC procedures are listed in Table 3.3.
Table 3.3: Category-Specific (Tier 2) QC Procedures
QC activity Quality control and Verification ProceduresTask completed Corrective action taken
Name Date Supporting documents Date
Assess the applicability of IPCC default factors
• Evaluate whether national conditions are similar to those used to develop the IPCC default factors
• Compare default factors to site or plant-level factors• Consider options for obtaining country-specific factors• Document results of this assessment
Elena BicovaAnatol TaritaSergiu CosmanIon TalmaciTatiana Tugui
31/12/2017 N/A N/A
Review country-specific factors
• QC the data used to develop the country-specific factor• Assess whether secondary studies used to develop country-specific factors used Tier
1 QC activities• Compare country-specific factors to IPCC defaults; document any significant discrep-
ancies• Compare country-specific factors to site or plant-level factors• Compare to factors from other countries (using IPCC Emission Factor Database)• Document results of this assessment
Elena BicovaAnatol TaritaSergiu CosmanIon TalmaciTatiana Tugui
31/12/2017 N/A N/A

Chapter 3: Description of QA/QC Procedures
3 - 9
QC activity Quality control and Verification ProceduresTask completed Corrective action taken
Name Date Supporting documents Date
Review measurements
• Determine if national or international (e.g., ISO) standards were used in measure-ments
• Ensure measurement equipment is calibrated and maintained properly• Compare direct measurements with estimates using a factor; document any signifi-
cant discrepancies
Elena BicovaAnatol TaritaSergiu CosmanIon TalmaciTatiana Tugui
31/01/2018 N/A N/A
Evaluate time series consistency
• Review significant (> 10%) changes in year-over-year estimates for categories and sub-categories
• Compare top-down and bottom-up estimates for similar orders of magnitude• Conduct reference calculations that use stoichiometric ratios and conservation of
mass and land
Elena BicovaAnatol TaritaSergiu CosmanIon TalmaciTatiana Ţugui
28/02/2018 N/A N/A
Review national level activity data
• Determine the level of QC performed by the data collection agency. If inadequate, consider alternative data sources such as IPCC defaults and international data sets. Adjust the relevant uncertainty accordingly.
• Evaluate time series consistency• Compare activity data from multiple references if possible
Elena BicovaAnatol TaritaSergiu CosmanIon TalmaciTatiana Tugui
31/01/2018 N/A N/A
Review site-specific activity data
• Determine if national or international (e.g., ISO) standards were used in estimates• Compare aggregated site-specific data (e.g. production) to national statistics/data• Compare data across similar sites• Compare top-down and bottom-up estimates for similar orders of magnitude
Elena BicovaAnatol TaritaSergiu CosmanIon TalmaciTatiana Tugui
31/01/2018 N/A N/A
QC uncertainty estimates• Apply QC techniques to uncertainty estimates• Review uncertainty calculations• Document uncertainty assumptions and qualifications of any experts consulted
Elena BicovaAnatol TaritaSergiu CosmanIon TalmaciTatiana Tugui
31/03/2018 N/A N/A
Verify GHG estimates • Compare estimates to other national or international estimates at the national, gas, sector, or sub-sector level as available
Elena BicovaAnatol TaritaSergiu CosmanIon TalmaciTatiana Tugui
31/03/2018 N/A N/A
3.7. Quality Assurance (QA) Procedures Expert review offers the opportunity to uncover technical issues related to the application of methodologies, selection of activity data, and development and choice of emission factors. Because of their knowledge and experience in areas related to the inventory, the listed experts indicated in Table 3.4, below, have been included in the QA process. Their comments have been reviewed and addressed, as appropriate, prior to the submission of the Inventory of anthropo-genic GHG emissions by sources and sinks of CO2 in the current inventory cycle.

Chapter 3: Description of QA/QC Procedures
3 - 10
Table 3.4: External ReviewersName Organization Area of Expertise Contact Information Comment Summary
Michael Tirsu, PhD in Power Engineering,Director
Institute of Power Engineering Energy
5, Academiei Str., room 400, MD-2028, Chisinau, Republic of Moldova Tel.: +373-22-73-53-84, Fax: +373-22-73-53-82E-mail: [email protected]
Worked with Ms. Elena Bicova, Energy Sector Lead, to uncover sectoral technical issues relat-ed to the application of methodologies, selection of activity data, and development and choice of emission factors.
Natalia Beglet, PhD in Power Engineering, Head of Program
Technical University of Moldova, Faculty of Ur-banism and Architecture, Program “Engineer-ing of Heat, Gas and Climate Control Systems in Buildings and Environment Protection”
Engineering of Heat, Gas and Climate Control Systems in Buildings, Environment Protection, Industrial Processes
78, 31 August 1989 Str., Building No.2, MD-2004, Chisinau, Republic of Moldova, Tel: +373-68-16-88-22E-mail: [email protected]
Worked with Mr. Anatolie Tarita, IPPU Sector Lead, to uncover sectoral technical issues relat-ed to the application of methodologies, selection of activity data, and development and choice of emission factors.
Nicolae Bucataru, Prof., PhD Hab. in Agriculture Technical University of Moldova Biology, Genetics, Animal Breeding
8/1, Mircești Str., ap.71, Chisinau, Republic of MoldovaTel: +373-22-43-21-50E-mail: [email protected]
Worked with Mr. Sergiu Cosman, Agriculture Sector Lead, to uncover sectoral (animal breed-ing) technical issues related to the application of methodologies, selection of activity data, and development and choice of emission factors.
Tamara Leah, Prof., PhD Agriculture, Deputy-Director
Institute of Soil Science, Agrochemistry and Soil Protection “Nicolae Dimo” Biology, Pedology and Soil Protection
100, Ialoveni Str., 1st floor, MD-2070, Chisinau, Republic of Moldova Tel: +373-22-28-48-43 / 28-48-62, Fax: +373-22-28-48-55E-mail: [email protected]
Worked with Mr. Sergiu Cosman, Agriculture Sector Lead, to uncover sectoral (agricultural soils) technical issues related to the application of methodologies, selection of activity data, and development and choice of emission factors.
Liliana Spitoc, MSc in Biology,Head of Service
“Moldsilva” Agency, Forestry Research and Management Institute, Service for Prognoses, Monitoring, Programs and Strategies
Forestry
69, Calea Iesilor Str., MD-2069, Chisinau, Republic of MoldovaTel.: +373-22-92-89-56E-mail: [email protected]
Worked with Mr. Ion Talmaci, LULUCF Sector Lead, to uncover sectoral technical issues relat-ed to the application of methodologies, selection of activity data, and development and choice of emission factors.
Ludmila Gofman, MSc in Environment Protection Independent consultant Waste Management and Environment Protec-
tionTel: +373-69-06-23-39E-mail: [email protected]
Worked with Ms. Tatiana Tugui, Waste Sector Lead, to uncover sectoral technical issues relat-ed to the application of methodologies, selection of activity data, and development and choice of emission factors.
3.8. Supplemental QA/QC Checklists
Coordinator QA / QC Checklist
Activities Tasks completed
Name Date• Clarify and communicate QA/QC responsibilities to inventory team members. Marius Taranu 15.11.2017• Develop and QA/QC checklists appropriate to roles on the inventory team Marius Taranu 30.11.2017• Distribute QA/QC checklist to appropriate inventory team members and set deadline for completion. Marius Taranu 31.12.2017• Ensure the timely and accurate completion of QA/QC checklists and related activities by checking in with team members. Marius Taranu Continuous

Chapter 3: Description of QA/QC Procedures
3 - 11
Activities Tasks completed
Name Date• Collect completed QA/QC checklists and forms. Marius Taranu 30.06.2018• Review completed QA/QC checklists and forms for completeness and accuracy. Marius Taranu 30.09.2018• Deliver documentation of QA/QC activities to the inventory and archive coordinators. Marius Taranu 31.10.2018• Coordinate external reviews of the inventory document and ensure that comments are incorporated into the inventory. Steps to coordinating external
reviewers include:1. Identify external reviewers (e.g., through category leads).2. Set review schedule.3. Establish review format (e.g., digital mark-up in Word or Excel).4. Contact external reviewers informing them of the schedule and expectations. 5. Distribute Inventory draft for review.6. Collect and compile review comments. 7. Deliver compiled comments to inventory and archive coordinators.8. Update inventory, as appropriate based on comments.
Marius Taranu 30.11.2018
Inventory Lead Checklist: Cross-Cutting Checks for Overall Inventory Quality
Activities Task Completed
Name DateEmission Calculations Across GHG Emission and Removal Categories• Identify parameters that are common across categories (e.g. conversion factors, carbon content coefficients, etc.) and check for consistency Marius Taranu 31.03.2018• Check that using same data inputs (e.g. animal population data) report comparable values (i.e., analogous in magnitude) Marius Taranu 31.03.2018• Check across categories that same electronic data set is used for common data (e.g., linking animal population data to the enteric fermentation and
manure management calculations) Marius Taranu 31.03.2018
• Check that the number of significant digits or decimal places for common parameters, conversion factors, emission factors, or activity data is con-sistent across categories Marius Taranu 31.03.2018
• Check that total emissions are reported consistently (in terms of significant digits or decimal places) across categories Marius Taranu 30.04.2018• Check that emissions data are correctly aggregated from lower reporting levels to higher reporting levels Marius Taranu 30.04.2018Documentation• Check if internal documentation practices are consistent across categories Marius Taranu 30.06.2018Completeness• Check for completeness across categories and years Marius Taranu 30.06.2018• Check that data gaps are identified and reported as required Marius Taranu 30.06.2018• Compare current national inventory estimates with previous years’ Marius Taranu 30.06.2018Maintaining Master Inventory File: Spreadsheets and Inventory Document• Have file control procedures been followed? Marius Taranu 30.06.2018

Chapter 3: Description of QA/QC Procedures
3 - 12
Inventory Lead Checklist: Detailed Checklist for Inventory Document
Activities Task Completed
Name DateFront Section• Cover page has correct date, title, and contact address Marius Taranu 30.11.2018• Tables of contents/tables/figures are accurate: titles match document, pages match; numbers run consecutively and have correct punctuation Marius Taranu 30.11.2018• The Executive Summary and Introduction are updated with appropriate years and discussion of trends Marius Taranu 30.11.2018Tables and Figures• All numbers in tables match numbers in spread sheets Marius Taranu 30.11.2018• Check that all tables have correct number of significant digits Marius Taranu 30.11.2018• Check alignment in columns and labels Marius Taranu 30.11.2018• Check that table formatting is consistent Marius Taranu 30.11.2018• Check that all figures are updated with new data and referenced in the text Marius Taranu 30.11.2018• Check table and figure titles for accuracy and consistency with content Marius Taranu 30.11.2018Equations• Check for consistency in equations Marius Taranu 30.11.2018• Check that variables used in equations are defined following the equation Marius Taranu 30.11.2018References• Check consistency of references, and that in text citations and references match Marius Taranu 30.11.2018General Format• All acronyms are spelled out first time and not subsequent times throughout each chapter Marius Taranu 30.11.2018• All fonts in text, headings, titles, and subheadings are consistent Marius Taranu 30.11.2018• All highlighting, notes, and comments are removed from document Marius Taranu 30.11.2018• Size, style, and indenting of bullets are consistent Marius Taranu 30.11.2018• Spell check is complete Marius Taranu 30.11.2018Other Issues• Check that each section is updated with current year (or most recent year that inventory report includes) Marius Taranu 30.11.2018

Chapter 4: Description of Archiving System
1: Institutional Arrangements
2: Methods and Data Documentation
3: Description of QA/QC Procedures
4: Description of Archiving System
5: Key Category Analysis
6: National Inventory Improvement Plan
Contact data of the Coordinator of the National Greenhous Gas Inventory Country Republic of Moldova Postal address: 156A Mitropolit Dosoftei str., room 37, MD-2004, Chisinau, Republic of MoldovaName: Taranu Marius Telephone/Fax: +373 22 23 22 47Position: Coordinator of the National Greenhouse Gas Inventory E-mail: [email protected] Organization: Climate Change Office, Ministry of Agriculture, Regional Development and Environment URL: http://www.clima.md
4-1

Chapter 4: Description of Archiving System
4 - 2
4. Description of Archiving System4.1. Background
Archives refer to a collection of records that have been created during the development of the inventory (references, methodological choice, expert comments, revisions, etc.), as well as document the location where these records are kept. The Archiving System is a critical component of the inventory development process and is important for sustaining the National Inventory System of the Republic of Moldova. An Archiving System helps make a national inventory trans-parent and reproducible, and facilitates development of subsequent inventories by future inventory staff and sector/category leads (individuals responsible for developing estimates within a particular sector). Each new inventory cycle will benefit from effective data and document management during development of the previous inventory.
All information used to create the inventory is archived in a single location in both electronic and hard copy (paper) storage so that future inventory managers can reference all relevant files to respond to reviewer feedback including questions about methodologies. Archived information includes all emission factors and activity data at the most detailed level, and documentation of how these factors and data have been generated and aggregated for the preparation of the inventory. This information also includes internal documentation on QA/QC procedures, external and internal reviews, documentation of annual key categories and key category identification, and planned inventory improvements. Copies of archived documents are kept in multiple locations to reduce the risk of losing all records due to theft or disaster (e.g., fire, earthquake, or flooding).
4.2. Assess Existing Archiving Program and Procedures
Below are provided the archiving procedures applied for the documents and files available from the previous inventory cycle.• Documents and files available from the previous inventory cycle are stored both electronically and in hard copies.• The Inventory Coordinator, who acts also as Archiving System Coordinator has access to archived information, as well as the Manager of Climate Change
Office, Ministry of Agriculture, regional Development and Environment.• Most documents are kept both in draft and final versions.• Contact names are available as a List by category and sector of responsibility.
Further are provided the procedures used for archiving documents and files available from the latest inventory cycle.• Documents and files available from the current inventory cycle are stored both electronically and in hard copies.• The information is stored in the Climate Change Office at: #156A, Mitropolit Dosoftei Street, Office 37, MD 2004, Chisinau, Republic of Moldova. • The information is stored both on the hard drive and external memory support; the initially received information is usually available only on paper, then
it is scanned and stored also in electronic format.• The files are named based on the reference name document and date of receipt. • To reflect subsequent updates, the file names are changed by providing the date of last update.

Chapter 4: Description of Archiving System
4 - 3
Once filled in electronically, the 6 National System Templates are kept by the Archiving System Coordinator, including:• Template 1: “Institutional Arrangements” • Template 2: “Methods and Data Documentation” • Template 3 “Description of QA/QC Procedures “ • Template 4: “Description of Archiving System”. • Template 5: “Key Categories Analysis”. • Template 6: “National Inventory Improvement Plan”.
4.3. Archive System
The following sections describe the Archive System followed by the national entity designated with responsibility for developing national GHG inventory to ensure a high-quality national inventory based on an assessment of existing practices as described in section 4.2 above.
4.3.1. Archiving Coordinator Role and Responsibilities
The role of Archiving Coordinator is designated at the beginning of the inventory cycle. The Archiving Coordinator is responsible for ensuring that all archiving procedures are performed for the inventory and all supporting documents and spreadsheets are retained appropriately. The Archiving Coordinator is also responsible for clarifying who is responsible for carrying out archive procedures at various levels, as well as for ensuring that all team members know their archiving responsibilities, including which documents should be archived.
These responsibilities require that the Archiving Coordinator:• Communicates archiving system plan, procedures, and responsibilities to other staff;• Determines archiving tasks and assign tasks to staff, create a checklist of archiving procedures for team members; • Draws up a checklist of archiving procedures to be followed by inventory team members;• Ensures that the archive procedures (see section 4.3.2 below) are carried out effectively;• Serve as the keeper of the permanent archive and respond to future requests to view archive materials.
4.3.2. Archive Procedures
It is essential to outline each aspect of the archiving process so that these procedures can be effectively implemented. The archive plan developed by the Ar-chive Coordinator will take into account the following:
Management of Files
The Archiving Coordinator ensures the Sector Leads and their teams follow the appropriate file management procedures and naming conventions for version control outlined below:

Chapter 4: Description of Archiving System
4 - 4
• Titles of spreadsheet files containing GHG estimates include the IPCC category name, inventory year, and the date the file was last saved. For ex-ample, the naming convention includes the category and inventory year, such as: “1A3_Transport_2016 (30-06-2018).xls” spreadsheet or “1A3_Trans-port_2016_FINAL.xls”.
• Both the printed copies of documents and external memory supports exhibit a colored sticker according to the sector. There is also an identification methodology for the documents and folders which identifies the sector, type of report, and date. o Example: MD NGI EN FR 30-11-18 o The first 5 digits, MD NGI, mean: “Moldova National GHG Inventory” o The next 2 digits are the name of the sector:
• EN Energy red• IP Industrial Processes and Product Use blue • AG Agriculture yellow• LU Land Use, Land Use Change, and Forestry green• WA Waste brown
o The next 2 digits identify the type of report: • FR Final Report• PR Preliminary Report
o The next 6 identify the date of the report:• day-month-year dd-mm-yy
o All documentation exists on hard drives, external memory supports and, in extent possible, also in printed copies. The documentation will be kept at Climate Change Office of the Ministry of Agriculture, Regional Development and Environment, as well as at the key partner institutions (Institute of Power Engineering and the Forestry Research and Management Institute).
Data RetentionAt the end of each cycle inventory, spreadsheets and other electronic files used to create inventory estimates are provided to the Archiving Coordinator. The essential components of the archive are:
• Data and calculation spreadsheets and other electronic files for every category used to create inventory estimates.• QA/QC Plan with completed checklists.• Key category analysis spreadsheets. • Internal and external review comments and responses.• Latest draft and final electronic versions of the inventory document (National Inventory Report), in Romanian and English (for use as a starting point to
update the inventory in the future).

Chapter 4: Description of Archiving System
4 - 5
• Updated Template 1: “Institutional Arrangements” and Template 2: “Methods and data documentation”, which are used to list and check references.
The Archiving Coordinator will take the files listed above and archive the files on the hard drive as well as on an external memory support. The contents of the hard drive as well as the external memory support, is clearly labelled and organized into several subfolders for easy reference. Subfolders exist for each sec-tor and then contain several subfolders within each sector folder to catalogue, track and organize the archived materials. For example, each sector folder may contain subfolders for items such as data collection spreadsheets, calculation spreadsheets, written documents, and data sources.
Document Retention
Activity data and other reference documents used to create the inventory are collected and provided to the Archiving Coordinator by each Sector Lead. Vital infor-mation from publications, contacts, and other sources are also included in the documents provided to the Archiving Coordinator. This information includes, at a minimum, the title page with the name of the author(s), pages of actual data used, pages explaining data used, and pages describing methodologies used.
These documents include:• All new reference documents for the current year’s inventory records file, which is referred to as the inventory archive. The Archiving Coordinator is respon-
sible for reviewing the references cited in the inventory, collecting, and cataloguing all new documents. References that are already in the records file from the previous inventory cycle are not included.
• Draft versions (in both electronic and hard copy) used for the internal and external peer reviews, as well as the final submitted versions of the inventory. • The final version of the National Inventory System Report (compilation of completed templates including: ‘Institutional Arrangements’, ‘QA/QC Plan’, ‘De-
scription of Archiving System’, ‘Key Category Analysis’, and ‘National Inventory Improvement Plan’). o Each Sector Lead is responsible for documenting and completing their respective components of any distributed inventory template (e.g. sectoral
portion of ‘Institutional Arrangements’ template). Once completed, the templates are submitted to the Archiving Coordinator / Inventory Coordina-tor. Printed and electronic versions are stored with the Archiving Coordinator / Inventory Coordinator at the Climate Change Office of the MARDE.
• Documents created to address comments received during any official review periods or from expert reviews. These documents include both, comments received verbatim, as well as the response and subsequent actions taken by the inventory staff.
Storage Mechanisms All archive materials are duplicated, catalogued and placed in the archive. Duplicate copies of the archive files are stored in the Institute of Power Engineering, as well as in the Forestry Research and Management Institute. An index describing the contents of the archive is placed at the front. The Archiving Coordina-tor chooses a centralized and secure location (Climate Change Office, 156a Mitropolit Dosoftei Str., office 37, MD-2004, Chisinau, Republic of Moldova) for the placement of the hard copy and electronic archive.
4.3.3. Overall Archive Procedures Checklist
To ensure a successful archiving system, the Archiving Coordinator uses a comprehensive checklist. Checklists help to ensure that all archiving procedures occur in a timely and complete manner.

Chapter 4: Description of Archiving System
4 - 6
The final archiving task list and schedule show all archiving tasks, corresponding task leaders, and due dates. The Archiving Coordinator ensures that all tasks are outlined prior to the start of any archive procedure. The Archiving Coordinator is also responsible for assigning task leaders to accomplish each archive task prior to the due date. The Archiving Coordinator completes staffing for each task and date due at the beginning of the inventory cycle. Table 4.1 below provides the comprehensive checklist used by the Archiving Coordinator.
Table 4.1: Archive Tasks, Responsibilities and Schedule
Subtask Date Due Task Completed
Name: DateArchiving CoordinatorCommunicate archiving plan to all persons working on the inventory, especially the Sector Leads. Also ensure Sector Leads understand their specific responsibilities and cor-responding deadlines. November 2017 Marius Taranu 01.11.2017
Compile electronic versions of QA/QC checklists. November 2017 Marius Taranu 15.11.2017Compile electronic versions of spreadsheets used to estimate emissions by sector (draft, review, and final versions) to track progress and changes. January 2018 Marius Taranu 31.01.2018Create official archive by placing all paper copies with an index in a centrally located filing cabinet. November 2018 Marius Taranu 30.11.2018Catalogue all documents (references and comments) using a unique tracking number and index. November 2018 Marius Taranu 30.11.2018Collect copies of all references. November 2018 Marius Taranu 30.11.2018Request any references that are missing from the archive from those working on the inventory. Send reminders as needed. November 2018 Marius Taranu 30.11.2018Ensure that all paper materials are present in the official archive by reviewing the contents against the table of contents contained in the file drawer. November 2018 Marius Taranu 30.11.2018Compile electronic versions of Key Category Analysis. November 2018 Marius Taranu 30.11.2018Ensure that all electronic files listed above are contained on hard drive and on the external memory support and that the external memory support is placed together with other official archive materials. November 2018 Marius Taranu 30.11.2018
Save all electronic files on hard drive and external memory supports. December 2018 Marius Taranu 31.12.2018Collect copies of final versions of inventory document. December 2018 Marius Taranu 31.12.2018Compile electronic versions of draft and final versions of the inventory document. December 2018 Marius Taranu 31.12.2018Distribute electronic files at the start of next inventory update. November 2019 Marius Taranu 30.11.2019Sector Category Lead(s)
Send electronic versions of spreadsheets used to estimate emissions to Inventory Coordinator (using naming convention). April 2018
Elena BicovaAnatolie TaritaSergiu CosmanIon TalmaciTatiana Tugui
30.04.2018
Send summary or list of QA/QC steps and corrective actions (by category) to Inventory Coordinator. June 2018
Elena BicovaAnatolie TaritaSergiu CosmanIon TalmaciTatiana Tugui
30/06/2018
Create an index of documents and files for electronic and hardcopy storage. September 2018
Elena BicovaAnatolie TaritaSergiu CosmanIon TalmaciTatiana Tugui
30/09/2018

Chapter 4: Description of Archiving System
4 - 7
Subtask Date Due Task Completed
Name: Date
Save all final electronic files on an archive external memory support and label it as *FINAL* with name of source/sector, date, and contact information and send copy to Inventory Coordinator. October 2018
Elena BicovaAnatolie TaritaSergiu CosmanIon TalmaciTatiana Tugui
31/10/2018
4.4. Recommended Improvements to the Inventory Archive System
Table 4.2 provides a list of suggested improvements to the archive system. These improvements should be incorporated into the archive system in future years.
Table 4.2: Recommended Improvements to the Inventory Archive SystemImprovement # Archive System Task Recommended Improvement
1 Database Lead
Responsibilities need to be defined for a database lead. It is necessary to appoint a person responsible for the database who will ensure that all the inventory archival procedures, correspond-ing documents and supporting spreadsheets identified under the IPCC guidelines are accurately followed. He/she will also be responsible to ensure that all the members of the team know their responsibilities with regard to archiving. The most important points that the designated coordinator should take into account are the following: (i) ensure an effective archiving process; (ii) ensure that copies from all new reference documents are adequately archived; (iii) establish a checklist for the archiving procedures to be used by the members of the inventory team; (iv) to be responsible for the permanent archive and to respond to future request in regard to archiving materials.
2 Reference Document Lead
Responsibilities need to be defined for consultants responsible for collecting reference documents and corresponding cataloging. The responsibilities in regard to reference documents from specif-ic consultants (staff members that have the responsibility to develop GHG emission estimates for a particular sector) should be designated and notified from the beginning of the inventory process.

Chapter 5: Key Category Analysis
1: Institutional Arrangements
2: Methods and Data Documentation
3: Description of QA/QC Procedures
4: Description of Archiving System
5: Key Category Analysis
6: National Inventory Improvement Plan
Contact data of the Coordinator of the National Greenhous Gas Inventory
Country Republic of Moldova Postal address: 156A Mitropolit Dosoftei str., room 37, MD-2004, Chisinau, Republic of MoldovaName: Taranu Marius Telephone/Fax: +373 22 23 22 47Position: Coordinator of the National Greenhouse Gas Inventory E-mail: [email protected] Organization: Climate Change Office, Ministry of Agriculture, Regional Development and Environment URL: http://www.clima.md
5-1

Chapter 5: Key Category Analysis
5 - 2
5. Key Category Analysis5.1. BackgroundThe concept of “key categories” was created by the IPCC as a way to help countries prioritize resources for improving national greenhouse gas inventories9. Key categories have the greatest contribution to the overall level of national emissions. When an entire time series of emission estimates is prepared, key catego-ries can also be identified as those categories that have the largest influence on the trend of emissions over time10. In addition, when uncertainty estimates are incorporated into emission estimates, additional key categories are identified.
The results of the key category analysis provide a country with a list of their most important inventory categories. This list is a starting point from which a country can begin the process of improving their greenhouse gas inventory. To improve the national greenhouse gas inventory, it may be necessary to consider applying more accurate or higher tier methodologies, collect more detailed activity data, or develop country-specific emission factors. These activities all re-quire additional resources, and it is not possible to make improvements for every inventory category. The inventory category list resulting from this analysis can provide a quantitative framework for the national greenhouse gas inventory team to develop an inventory improvement plan. The key category analysis also provides more complete and transparent information for the National Communications and Biennial Update Reports.
This report presents the results of the IPCC Approach 1 and Approach 2 methodologies for determining key categories (referred to as Tier 1 and Tier 2 through-out this template). In the Tier 1 methodology, key categories are identified using a pre-determined cumulative emissions threshold, where key categories are those that, when summed together in descending order of magnitude, add up to 95% of the total level. The Tier 2 methodology to identify key categories can be used if category uncertainties or parameter uncertainties are available. Under the Tier 2 key category methodology, source or sink categories are sorted or ranked according to their contribution to uncertainty, and emissions are weighted by their combined uncertainty, in addition to contribution to total emissions.
5.2. Key Category SoftwareThe Key Categories Analysis was performed using the key categories calculation software developed by the US Environmental Protection Agency (US EPA’s Key Category Calculation Tool v2.5)11.
The completed key category file was saved as “EPA_KCA_Tool_2018_ FINAL.xls”. This spreadsheet exists on the Inventory Coordinator’s computer at the Cli-mate Change Office. An electronic copy was also submitted to the Archiving Coordinator and is stored within the KCA folder in the GHG Inventory archives. All results presented in this template come from this spreadsheet and the specific Excel spreadsheet tabs is referenced below each table in this template.
5.3. Tier 1 Current Year Level AnalysisWhen inventory categories are sorted in order of decreasing GHG magnitude, those that fall at the top of the list and cumulatively account for 95% of emissions are considered key categories. They are those inventory categories that contribute the most to overall national total emissions.9 The 1996 IPCC Guidelines refer to “key source categories” which has been revised in subsequent IPCC Guidelines to “key categories” since sinks are also included in the analysis.10 The 2006 IPCC Guidelines for National Greenhouse Gas Inventories (IPCC 2006) defines a key category as a “category that is prioritized within the national inventory system because its estimate has a significant influence on a country’s total inventory of greenhouse gases in terms of the absolute level, the trend, or the uncertainty in emissions and removals. Whenever the term key category is used, it includes both source and sink categories”. See Chapter 4, “Methodological Choice and Identification of Key Categories”, in IPCC 2006 for more information, <http://www.ipcc-nggip.iges.or.jp/public/2006gl/index.html>11 <https://19january2017snapshot.epa.gov/climatechange/national-ghg-inventory-capacity-building_.html>

Chapter 5: Key Category Analysis
5 - 3
Table 5.1 presents the results of the IPCC Tier 1 key category level analysis for the most recent or current year 2016. There is a total of 14 key categories based on the Tier 1 level assessment, without LULUCF.
Table 5.1: Key Categories Based on Contribution to Total National Emissions in 2016, without LULUCF
Key Categories from Tier 1 Current Year Level Assessment, without LULUCF Current Year Emissions Estimate (Gg CO2 Eq.) Level assessment Cumulative Sum (%)
1A1 - Fuel Combustion Activities - Energy Industries - CO2 4 518.97 0.31 31.0%1A3b - Fuel Combustion Activities - Transport - Road transportation - CO2 2 271.25 0.16 46.6%1A4 - Fuel Combustion Activities - Other Sectors - CO2 1 677.57 0.12 58.1%5A - Solid Waste Disposal - CH4 1 115.17 0.08 65.7%3Da - Direct N2O Emissions from Managed Soils - N2O 1 050.50 0.07 72.9%3A - Enteric Fermentation - CH4 649.27 0.04 77.4%1B2 - Fugitive Emissions from Fuels - Oil and Natural Gas - CH4 611.09 0.04 81.6%1A2 - Fuel Combustion Activities - Manufacturing Industries and Construction - CO2 500.70 0.03 85.0%2A1 - Mineral industry - Cement Production - CO2 433.90 0.03 88.0%3Ba - Manure Management - N2O 308.06 0.02 90.1%3Db - Indirect N2O Emissions from Managed Soils - N2O 275.35 0.02 92.0%5D - Wastewater Treatment and Discharge: Domestic - CH4 215.67 0.01 93.5%1A4 - Fuel Combustion Activities - Other Sectors - CH4 116.73 0.01 94.3%2F2 - Product Uses as Substitutes for ODS - Foam Blowing Agents - HFCs 104.82 0.01 95.0%
Table 5.2 presents the results of the IPCC Tier 1 key category level analysis for the most recent or current year 2016. There is a total of 20 key categories based on the Tier 1 level assessment, with LULUCF.
Table 5.2: Key Categories Based on Contribution to National Net Emissions in 2016, with LULUCFKey Categories from Tier 1 Current Year Level Assessment, with LULUCF Current Year Emissions Estimate
(Gg CO2 Eq.) Level assessment Cumulative Sum (%)
1A1 - Fuel Combustion Activities - Energy Industries - CO2 4 518.97 0.23 23.0%1A3b - Fuel Combustion Activities - Transport - Road transportation - CO2 2 271.25 0.12 34.6%4B1 - Cropland Remaining Cropland (Emissions) - CO2 1 775.41 0.09 43.7%1A4 - Fuel Combustion Activities - Other Sectors - CO2 1 677.57 0.09 52.2%4A1 - Forest Land Remaining Forest Land (Removals) - CO2 -1 451.33 0.07 59.6%5A - Solid Waste Disposal - CH4 1 115.17 0.06 65.3%3Da - Direct N2O Emissions from Managed Soils - N2O 1 050.50 0.05 70.6%4A2 - Land Converted to Forest Land (Removals) - CO2 -662.22 0.03 74.0%3A - Enteric Fermentation - CH4 649.27 0.03 77.3%1B2 - Fugitive Emissions from Fuels - Oil and Natural Gas - CH4 611.09 0.03 80.4%1A2 - Fuel Combustion Activities - Manufacturing Industries and Construction - CO2 500.70 0.03 83.0%

Chapter 5: Key Category Analysis
5 - 4
Key Categories from Tier 1 Current Year Level Assessment, with LULUCF Current Year Emissions Estimate (Gg CO2 Eq.) Level assessment Cumulative Sum (%)
2A1 - Mineral industry - Cement Production - CO2 433.90 0.02 85.2%4C2 - Land Converted to Grassland (Removals) - CO2 -402.37 0.02 87.3%4B2 - Land Converted to Cropland (Removals) - CO2 -382.17 0.02 89.2%3Ba - Manure Management - N2O 308.06 0.02 90.8%3Db - Indirect N2O Emissions from Managed Soils - N2O 275.35 0.01 92.2%5D - Wastewater Treatment and Discharge: Domestic - CH4 215.67 0.01 93.3%4E2 - Land Converted to Settlements - N2O 178.28 0.01 94.2%1A4 - Fuel Combustion Activities - Other Sectors - CH4 116.73 0.01 94.8%2F2 - Product Uses as Substitutes for ODS - Foam Blowing Agents - HFCs 104.82 0.01 95.3%
5.4. Tier 1 Base Year Level and Trend Analyses
When inventory categories are sorted in order of decreasing GHG magnitude, those that fall at the top of the list and cumulatively account for 95% of emissions are considered key categories. They are those inventory categories that contribute the most to overall national total emissions.
Table 5.3 presents the base year level results of the IPCC Tier 1 key category level analysis for the base year 1990. There is a total of 13 key categories based on the Tier 1 level assessment, without LULUCF.
Table 5.3: Key Categories Based on Contribution to Total National Emissions in 1990, without LULUCFKey Categories from Tier 1 Base Year Level Assessment, without LULUCF Base Year Emissions Estimate
(Gg CO2 Eq.) Level assessment Cumulative Sum (%)
1A1 - Fuel Combustion Activities - Energy Industries - CO2 21 244.31 0.47 47.3%1A4 - Fuel Combustion Activities - Other Sectors - CO2 7 372.26 0.16 63.7%1A3b - Fuel Combustion Activities - Transport - Road transportation - CO2 3 826.36 0.09 72.2%1A2 - Fuel Combustion Activities - Manufacturing Industries and Construction - CO2 2 204.85 0.05 77.1%3A - Enteric Fermentation - CH4 2 190.69 0.05 82.0%3Da - Direct N2O Emissions from Managed Soils - N2O 1 077.18 0.02 84.4%5A - Solid Waste Disposal - CH4 1 046.73 0.02 86.7%2A1 - Mineral industry - Cement Production - CO2 971.70 0.02 88.9%3Ba - Manure Management - N2O 871.91 0.02 90.8%1B2 - Fugitive Emissions from Fuels - Oil and Natural Gas - CH4 640.63 0.01 92.3%3B - Manure Management - CH4 495.10 0.01 93.4%1A3c - Fuel Combustion Activities - Transport - Railways - CO2 403.48 0.01 94.3%3Db - Indirect N2O Emissions from Managed Soils - N2O 340.41 0.01 95.0%
Table 5.4 presents the base year level results of the IPCC Tier 1 key category level analysis for the base year 1990. There is a total of 19 key categories based on the Tier 1 level assessment, with LULUCF.

Chapter 5: Key Category Analysis
5 - 5
Table 5.4: Key Categories Based on Contribution to National Net Emissions in 1990, with LULUCFKey Categories from Tier 1 Base Year Level Assessment, with LULUCF Base Year Emissions Estimate
(Gg CO2 Eq.) Level assessment Cumulative Sum (%)
1A1 - Fuel Combustion Activities - Energy Industries - CO2 21 244.31 0.40 40.5%1A4 - Fuel Combustion Activities - Other Sectors - CO2 7 372.26 0.14 54.5%1A3b - Fuel Combustion Activities - Transport - Road transportation - CO2 3 826.36 0.07 61.8%4B1 - Cropland Remaining Cropland (Emissions) - CO2 2 602.98 0.05 66.8%1A2 - Fuel Combustion Activities - Manufacturing Industries and Construction - CO2 2 204.85 0.04 71.0%3A - Enteric Fermentation - CH4 2 190.69 0.04 75.2%4A1 - Forest Land Remaining Forest Land (Removals) - CO2 -1 579.04 0.03 78.2%4C2 - Land Converted to Grassland (Removals) - CO2 -1 205.69 0.02 80.5%3Da - Direct N2O Emissions from Managed Soils - N2O 1 077.18 0.02 82.5%5A - Solid Waste Disposal - CH4 1 046.73 0.02 84.5%4A2 - Land Converted to Forest Land (Removals) - CO2 -984.39 0.02 86.4%2A1 - Mineral industry - Cement Production - CO2 971.70 0.02 88.2%3Ba - Manure Management - N2O 871.91 0.02 89.9%1B2 - Fugitive Emissions from Fuels - Oil and Natural Gas - CH4 640.63 0.01 91.1%4D2 - Land Converted to Wetlands (Removals) - CO2 -555.38 0.01 92.2%3B - Manure Management - CH4 495.10 0.01 93.1%1A3c - Fuel Combustion Activities - Transport - Railways - CO2 403.48 0.01 93.9%3Db - Indirect N2O Emissions from Managed Soils - N2O 340.41 0.01 94.6%1A4 - Fuel Combustion Activities - Other Sectors - CH4 289.60 0.01 95.1%
Table 5.5 presents the results of the IPCC key category trend analysis. The key categories are listed in order of decreasing contribution to the overall trend. Together they account for at least 95% of the overall trend in national total emissions. There is a total of 16 key categories based on the trend analysis, without LULUCF.
Table 5.5: Key Categories Based on Contribution to Overall Trend in Total National Emissions, without LULUCFKey Categories from Tier 1 Trend Assessment, without LULUCF Current Year Emissions Estimate
(Gg CO2 Eq.) Trend assessment Cumulative Sum (%)
1A1 - Fuel Combustion Activities - Energy Industries - CO2 4 518.97 0.05 32.0%1A3b - Fuel Combustion Activities - Transport - Road transportation - CO2 2 271.25 0.02 45.8%5A - Solid Waste Disposal - CH4 1 115.17 0.02 56.2%1A4 - Fuel Combustion Activities - Other Sectors - CO2 1 677.57 0.02 65.9%3Da - Direct N2O Emissions from Managed Soils - N2O 1 050.50 0.02 75.3%1B2 - Fugitive Emissions from Fuels - Oil and Natural Gas - CH4 611.09 0.01 80.7%1A2 - Fuel Combustion Activities - Manufacturing Industries and Construction - CO2 500.70 0.00 83.6%3Db - Indirect N2O Emissions from Managed Soils - N2O 275.35 0.00 85.8%5D - Wastewater Treatment and Discharge: Domestic - CH4 215.67 0.00 87.7%

Chapter 5: Key Category Analysis
5 - 6
Key Categories from Tier 1 Trend Assessment, without LULUCF Current Year Emissions Estimate (Gg CO2 Eq.) Trend assessment Cumulative Sum (%)
2A1 - Mineral industry - Cement Production - CO2 433.90 0.00 89.3%2F2 - Product Uses as Substitutes for ODS - Foam Blowing Agents - HFCs 104.82 0.00 90.7%3B - Manure Management - CH4 68.34 0.00 92.0%1A3c - Fuel Combustion Activities - Transport - Railways - CO2 45.48 0.00 93.1%2F1 - Product Uses as Substitutes for ODS - Refrigeration and Air Conditioning - HFCs 70.76 0.00 94.1%3A - Enteric Fermentation - CH4 649.27 0.00 94.9%2A2 - Mineral Industry - Lime Production - CO2 21.58 0.00 95.6%
Table 5.6 presents the results of the IPCC key category trend analysis. The key categories are listed in order of decreasing contribution to the overall trend. Together they account for at least 95% of the overall trend in national total emissions. There is a total of 20 key categories based on the trend analysis, with LULUCF.
Table 5.6: Key Categories Based on Contribution to Overall Trend in National Net Emissions, with LULUCFKey Categories from Tier 1 Trend Assessment, with LULUCF Current Year Emissions Estimate
(Gg CO2 Eq.) Trend assessment Cumulative Sum (%)
1A1 - Fuel Combustion Activities - Energy Industries - CO2 4 518.97 0.04 16.1%4C2 - Land Converted to Grassland (Removals) - CO2 -402.37 0.03 28.3%4A1 - Forest Land Remaining Forest Land (Removals) - CO2 -1 451.33 0.02 37.3%1A3b - Fuel Combustion Activities - Transport - Road transportation - CO2 2 271.25 0.02 45.2%4A2 - Land Converted to Forest Land (Removals) - CO2 -662.22 0.02 52.6%4B1 - Cropland Remaining Cropland (Emissions) - CO2 1 775.41 0.02 59.7%4D2 - Land Converted to Wetlands (Removals) - CO2 -82.79 0.02 66.1%5A - Solid Waste Disposal - CH4 1 115.17 0.01 71.9%3Da - Direct N2O Emissions from Managed Soils - N2O 1 050.50 0.01 77.2%1A4 - Fuel Combustion Activities - Other Sectors - CO2 1 677.57 0.01 82.0%1B2 - Fugitive Emissions from Fuels - Oil and Natural Gas - CH4 611.09 0.01 85.0%4B2 - Land Converted to Cropland (Removals) - CO2 -382.17 0.00 86.7%4G - Harvested Wood Products - CO2 0.88 0.00 88.2%1A2 - Fuel Combustion Activities - Manufacturing Industries and Construction - CO2 500.70 0.00 89.7%3Db - Indirect N2O Emissions from Managed Soils - N2O 275.35 0.00 90.9%5D - Wastewater Treatment and Discharge: Domestic - CH4 215.67 0.00 92.0%2A1 - Mineral industry - Cement Production - CO2 433.90 0.00 92.9%4E2 - Land Converted to Settlements (Emissions) - N2O 178.28 0.00 93.9%2F2 - Product Uses as Substitutes for ODS - Foam Blowing Agents - HFCs 104.82 0.00 94.7%3B - Manure Management - CH4 68.34 0.00 95.3%
5.5. Tier 2 Current Year Level Analysis
The Tier 2 approach to assessing key categories, as defined in the IPCC’s 2006 Guidelines (IPCC 2006), incorporates each source and sink category’s associated

Chapter 5: Key Category Analysis
5 - 7
uncertainty estimates into the equation to identify any additional key categories not already identified in the Tier 1 assessment. When inventory categories are sorted in order of decreasing GHG magnitude with the incorporated uncertainty, those that fall at the top of the list and cumulatively account for 90% of emissions are considered key categories.
Table 5.7 presents the results of the IPCC Tier 2 key category level analysis for the year 2016. There is a total of 13 key categories based on the Tier 2 current year level analysis, without LULUCF.
Table 5.7: Key Categories Based on Contribution to Total National Emissions with Incorporated Uncertainty in 2016, without LULUCF
Key Categories from Tier 2 Current Year Level Assessment, without LULUCF Current Year Emissions Estimate (Gg CO2 Eq.)
Relative level assessment with uncertainty Cumulative Sum (%)
5A - Solid Waste Disposal - CH4 1 115.17 0.18 17.5%3Db - Indirect N2O Emissions from Managed Soils - N2O 275.35 0.14 31.8%3Ba - Manure Management - N2O 308.06 0.10 42.0%1A1 - Fuel Combustion Activities - Energy Industries - CO2 4 518.97 0.10 52.0%3Da - Direct N2O Emissions from Managed Soils - N2O 1 050.50 0.08 60.4%1B2 - Fugitive Emissions from Fuels - Oil and Natural Gas - CH4 611.09 0.07 67.2%1A3b - Fuel Combustion Activities - Transport - Road transportation - CO2 2 271.25 0.05 72.3%3A - Enteric Fermentation - CH4 649.27 0.05 76.8%1A4 - Fuel Combustion Activities - Other Sectors - CO2 1 677.57 0.04 80.5%5D - Wastewater Treatment and Discharge: Domestic - CH4 215.67 0.03 83.9%3Bb - Indirect N2O Emissions from Manure Management - N2O 64.66 0.03 87.0%1A4 - Fuel Combustion Activities - Other Sectors - CH4 116.73 0.02 88.9%2F2 - Product Uses as Substitutes for ODS - Foam Blowing Agents - HFCs 104.82 0.01 90.3%
Table 5.8 presents the results of the IPCC Tier 2 key category level analysis for the year 2016. There is a total of 18 key categories based on the Tier 2 current year level analysis, with LULUCF.
Table 5.8: Key Categories Based on Contribution to National Net Emissions with Incorporated Uncertainty in 2016, with LULUCFKey Categories from Tier 2 Current Year Level Assessment, with LULUCF Current Year Emissions Estimate
(Gg CO2 Eq.)Relative level assessment with
uncertainty Cumulative Sum (%)
5A - Solid Waste Disposal - CH4 1 115.17 0.14 14.0%3Db - Indirect N2O Emissions from Managed Soils - N2O 275.35 0.11 25.5%3Ba - Manure Management - N2O 308.06 0.08 33.6%1A1 - Fuel Combustion Activities - Energy Industries - CO2 4 518.97 0.08 41.6%3Da - Direct N2O Emissions from Managed Soils - N2O 1 050.50 0.07 48.3%4B1 - Cropland Remaining Cropland (Emissions) - CO2 1 775.41 0.06 54.6%4A1 - Forest Land Remaining Forest Land (Removals) - CO2 -1 451.33 0.06 60.4%1B2 - Fugitive Emissions from Fuels - Oil and Natural Gas - CH4 611.09 0.05 65.8%1A3b - Fuel Combustion Activities - Transport - Road transportation - CO2 2 271.25 0.04 69.9%3A - Enteric Fermentation - CH4 649.27 0.04 73.5%

Chapter 5: Key Category Analysis
5 - 8
Key Categories from Tier 2 Current Year Level Assessment, with LULUCF Current Year Emissions Estimate (Gg CO2 Eq.)
Relative level assessment with uncertainty Cumulative Sum (%)
1A4 - Fuel Combustion Activities - Other Sectors - CO2 1 677.57 0.03 76.5%5D - Wastewater Treatment and Discharge: Domestic - CH4 215.67 0.03 79.2%4A2 - Land Converted to Forest Land (Removals) - CO2 -662.22 0.03 81.9%3Bb - Indirect N2O Emissions from Manure Management - N2O 64.66 0.02 84.3%4C2 - Land Converted to Grassland (Removals) - CO2 -402.37 0.02 86.2%1A4 - Fuel Combustion Activities - Other Sectors - CH4 116.73 0.01 87.6%4E2 - Land Converted to Settlements (Emissions) - N2O 178.28 0.01 89.1%4B2 - Land Converted to Cropland (Removals) - CO2 -382.17 0.01 90.4%
5.6. Tier 2 Base Year and Trend Analyses with Incorporated Uncertainty
Table 5.9 presents the results of the IPCC Tier 2 key category level analysis for the year 1990. There is a total of 13 key categories based on the Tier 2 base year level analysis, without LULUCF.
Table 5.9: Key Categories Based on Contribution to Total National Emissions with Incorporated Uncertainty in 1990, without LULUCFKey Categories from Tier 2 Base Year Level Assessment, without LULUCF Base Year Emissions Estimate
(Gg CO2 Eq.)Relative level assessment with
uncertainty Cumulative Sum (%)
1A1 - Fuel Combustion Activities - Energy Industries - CO2 21 244.31 0.22 22.2%3Ba - Manure Management - N2O 871.91 0.13 35.7%3Db - Indirect N2O Emissions from Managed Soils - N2O 340.41 0.08 44.0%5A - Solid Waste Disposal - CH4 1 046.73 0.08 51.8%1A4 - Fuel Combustion Activities - Other Sectors - CO2 7 372.26 0.08 59.5%3A - Enteric Fermentation - CH4 2 190.69 0.07 66.7%3Bb - Indirect N2O Emissions from Manure Management - N2O 244.71 0.06 72.3%3Da - Direct N2O Emissions from Managed Soils - N2O 1 077.18 0.04 76.3%1A3b - Fuel Combustion Activities - Transport - Road transportation - CO2 3 826.36 0.04 80.3%1B2 - Fugitive Emissions from Fuels - Oil and Natural Gas - CH4 640.63 0.03 83.7%3B - Manure Management - CH4 495.10 0.02 86.0%1A2 - Fuel Combustion Activities - Manufacturing Industries and Construction - CO2 2 204.85 0.02 88.3%1A4 - Fuel Combustion Activities - Other Sectors - CH4 289.60 0.02 90.5%
Table 5.10 presents the results of the IPCC Tier 2 key category level analysis for the year 1990. There is a total of 18 key categories based on the Tier 2 base year level analysis, with LULUCF.

Chapter 5: Key Category Analysis
5 - 9
Table 5.10: Key Categories Based on Contribution to National Net Emissions with Incorporated Uncertainty in 1990, with LULUCFKey Categories from Tier 2 Base Year Level Assessment, with LULUCF Base Year Emissions Estimate
(Gg CO2 Eq.)Relative level assessment with
uncertainty Cumulative Sum (%)
1A1 - Fuel Combustion Activities - Energy Industries - CO2 21 244.31 0.19 18.8%3Ba - Manure Management - N2O 871.91 0.11 30.3%3Db - Indirect N2O Emissions from Managed Soils - N2O 340.41 0.07 37.3%5A - Solid Waste Disposal - CH4 1 046.73 0.07 43.9%1A4 - Fuel Combustion Activities - Other Sectors - CO2 7 372.26 0.07 50.4%3A - Enteric Fermentation - CH4 2 190.69 0.06 56.6%3Bb - Indirect N2O Emissions from Manure Management - N2O 244.71 0.05 61.3%4B1 - Cropland Remaining Cropland (Emissions) - CO2 2 602.98 0.05 65.9%3Da - Direct N2O Emissions from Managed Soils - N2O 1 077.18 0.03 69.3%1A3b - Fuel Combustion Activities - Transport - Road transportation - CO2 3 826.36 0.03 72.7%4A1 - Forest Land Remaining Forest Land (Removals) - CO2 -1 579.04 0.03 75.9%1B2 - Fugitive Emissions from Fuels - Oil and Natural Gas - CH4 640.63 0.03 78.7%4C2 - Land Converted to Grassland (Removals) - CO2 -1 205.69 0.03 81.4%3B - Manure Management - CH4 495.10 0.02 83.4%1A2 - Fuel Combustion Activities - Manufacturing Industries and Construction - CO2 2 204.85 0.02 85.4%4A2 - Land Converted to Forest Land (Removals) - CO2 -984.39 0.02 87.3%1A4 - Fuel Combustion Activities - Other Sectors - CH4 289.60 0.02 89.1%5D - Wastewater Treatment and Discharge: Domestic - CH4 234.05 0.01 90.6%
Table 5.11 presents the results of the IPCC Tier 2 key category trend analysis. The key categories are listed in order of decreasing contribution to the overall trend when uncertainty in incorporated. Together they account for at least 90% of the overall trend in national total emissions. There is a total of 13 key cat-egories based on the trend analysis, without LULUCF.
Table 5.11: Key Categories Based on Contribution to Overall Trend in Total National Emissions with Incorporated Uncertainty, without LULUCFKey Categories from Tier 2 Trend Assessment, without LULUCF Current Year Emissions Estimate
(Gg CO2 Eq.)Relative Trend assessment with
uncertainty Cumulative Sum (%)
5A - Solid Waste Disposal - CH4 1 115.17 0.23 23.4%3Db - Indirect N2O Emissions from Managed Soils - N2O 275.35 0.16 39.9%3Da - Direct N2O Emissions from Managed Soils - N2O 1 050.50 0.11 50.7%1A1 - Fuel Combustion Activities - Energy Industries - CO2 4 518.97 0.10 60.9%1B2 - Fugitive Emissions from Fuels - Oil and Natural Gas - CH4 611.09 0.09 69.5%1A3b - Fuel Combustion Activities - Transport - Road transportation - CO2 2 271.25 0.04 73.9%5D - Wastewater Treatment and Discharge: Domestic - CH4 215.67 0.04 78.1%1A4 - Fuel Combustion Activities - Other Sectors - CO2 1 677.57 0.03 81.2%2F2 - Product Uses as Substitutes for ODS - Foam Blowing Agents - HFCs 104.82 0.03 83.9%2F1 - Product Uses as Substitutes for ODS - Refrigeration and Air Conditioning - HFCs 70.76 0.02 86.2%3B - Manure Management - CH4 68.34 0.02 87.9%

Chapter 5: Key Category Analysis
5 - 10
Key Categories from Tier 2 Trend Assessment, without LULUCF Current Year Emissions Estimate (Gg CO2 Eq.)
Relative Trend assessment with uncertainty Cumulative Sum (%)
3Ba - Manure Management - N2O 308.06 0.02 89.5%5D - Wastewater Treatment and Discharge - N2O 68.27 0.01 90.9%
Table 5.12 presents the results of the IPCC Tier 2 key category trend analysis. The key categories are listed in order of decreasing contribution to the overall trend when uncertainty in incorporated. Together they account for at least 90% of the overall trend in national total emissions. There is a total of 17 key cat-egories based on the trend analysis, with LULUCF.
Table 5.12: Key Categories Based on Contribution to Overall Trend in Total National Emissions with Incorporated Uncertainty, with LULUCFKey Categories from Tier 2 Trend Assessment, with LULUCF Current Year Emissions Estimate
(Gg CO2 Eq.)Relative Trend assessment with
uncertainty Cumulative Sum (%)
5A - Solid Waste Disposal - CH4 1 115.17 0.15 14.6%4C2 - Land Converted to Grassland (Removals) - CO2 -402.37 0.11 25.5%3Db - Indirect N2O Emissions from Managed Soils - N2O 275.35 0.10 35.8%4A1 - Forest Land Remaining Forest Land (Removals) - CO2 -1 451.33 0.07 42.9%3Da - Direct N2O Emissions from Managed Soils - N2O 1 050.50 0.07 49.6%4A2 - Land Converted to Forest Land (Removals) - CO2 -662.22 0.06 55.4%1A1 - Fuel Combustion Activities - Energy Industries - CO2 4 518.97 0.06 61.1%1B2 - Fugitive Emissions from Fuels - Oil and Natural Gas - CH4 611.09 0.05 66.5%4B1 - Cropland Remaining Cropland (Emissions) - CO2 1 775.41 0.05 71.5%4D2 - Land Converted to Wetlands (Removals) - CO2 -82.79 0.04 76.0%1A3b - Fuel Combustion Activities - Transport - Road transportation - CO2 2 271.25 0.03 78.8%5D - Wastewater Treatment and Discharge: Domestic - CH4 215.67 0.03 81.4%4G - Harvested Wood Products - CO2 0.88 0.02 83.8%1A4 - Fuel Combustion Activities - Other Sectors - CO2 1 677.57 0.02 85.5%2F2 - Product Uses as Substitutes for ODS - Foam Blowing Agents - HFCs 104.82 0.02 87.2%4E2 - Land Converted to Settlements (Emissions) - N2O 178.28 0.02 88.7%2F1 - Product Uses as Substitutes for ODS - Refrigeration and Air Conditioning - HFCs 70.76 0.01 90.1%
5.7. Methodology
The methodologies used in this report are taken from 2006 IPCC Guidelines for National Greenhouse Gas Inventories. More detailed descriptions of the meth-odologies can be found in these documents.
5.7.1. Tier 1 Level Assessment
For a Tier 1 Level Assessment of key categories, calculate the contribution of each inventory category’s emissions to the total national inventory level, accord-ing to Equation 1:

Chapter 5: Key Category Analysis
5 - 11
EQUATION 1
Key Category Level Assessment = |Source or Sink Category Estimate|Total Contribution
Lx,t = |Ex,t| Σy |Ey,t|
Where:
Lx,t = the level assessment for source or sink category x in year t
|Ex,t| = the absolute value of emission or removal estimate of source or sink category x in year t
Σy |Ey,t| = the total contribution, which is the sum of the absolute values of emissions and removals in year t calculated using the aggregation level chosen by the country for key category analysis. Because both emissions and removals are entered with positive sign, the total contribution/level can be larger than a country’s total emissions less removals.
This equation determines the contribution of each inventory category’s GHG emissions to the national total. Key categories are those that, when added to-gether in descending order of magnitude, constitute at least 95% of the total emissions for a given year.
5.7.2. Tier 1 Trend Assessment
The contribution of each category’s emission trend to the trend in the total inventory can be assessed if more than one year of inventory data are available, according to Equation 2:
EQUATION 2
|Ex,0| (Ex,t - Ex,0) (Σy Ey,t - Σy Ey,0)Tx,t = ________ • | _________ - ______________ | Σy |Ey,0| |Ex,0| |Σy Ey,0|
Where:
Tx,t = the trend assessment of source or sink category x in year t as compared to the base year (year 0)
|Ex,0| = the absolute value of emission or removal estimate of source or sink category x in year 0
Ex,t and Ex,0 = the real values of estimates of source or sink category x in years t and 0, respectively
Σy Ey,t and Σy Ey,0 = the total inventory estimates in years t and 0, respectively

Chapter 5: Key Category Analysis
5 - 12
The trend assessment for an individual source or sink category is the change in the category emission/removal over time, computed by subtracting the base year (year 0) estimate for source or sink category x from the current year (year t) estimate, and dividing by the current year estimate. The total trend is the change in the total inventory emissions over time, computed by subtracting the base year (year 0) estimate for the total inventory from the current year (year t) estimate, and dividing by the current year estimate.
The trend assessment will identify inventory categories that have a trend different from the trend of the overall inventory. As differences in trend are more sig-nificant to the overall inventory level for larger inventory categories, the result of the trend difference (i.e., the inventory category trend minus the total trend) is multiplied by the result of the level assessment from the base year (Lx,t from Equation 1) to provide appropriate weighting. Thus, key categories will be those where the inventory category trend diverges significantly from the total trend, weighted by the emission level of the inventory category.
This type of key category analysis is only applicable to those countries that have emission inventories for more than one year. Thus, key categories are those whose trend diverges significantly from the total trend, weighted by the level of emissions or removals of the category in the base year. Key categories are those that, when summed together in descending order of magnitude, add up to more than 95% of the total trend.
5.7.3. Tier 2 Level Assessment
The key category analysis is enhanced by incorporating the national source or sink category uncertainty estimates. The contribution of each source or sink category to the total national inventory level as weighted by their respective category percent uncertainty is calculated according to Equation 3:
EQUATION 3
LUx,t = Lx,t • Ux,t Σy [(Ly,t • Uy,t)]
Where:
LUx,t = the level assessment for category x in latest inventory year (year t) with uncertainty
Lx,t = the Tier 1 level assessment as computed in Equation 1
Ux,t = category percentage uncertainty in year t calculated according to the 2006 IPCC Guidelines Chapter 3. If the reported uncertainty is asymmetrical, the larger uncertainty should be used. The relative uncertainty will always have a positive sign.
This equation determines the contribution of each source or sink category’s GHG contribution to the national total as weighted by their respective uncertainty estimates. Key categories are those that, when added together in descending order of magnitude, constitute at least 90% of the total emissions for a given year.
5.7.4. Tier 2 Trend Assessment
The contribution of each source or sink category to the trend in the total inventory as weighted by their respective category percent uncertainty can be as-sessed if more than one year of inventory data is available, according to Equation 4.

Chapter 5: Key Category Analysis
5 - 13
EQUATION 4
TUx,t = (Tx,t • Ux,t)
Where:
TUx,t = the trend assessment for category x in latest inventory year (year t) with uncertainty
Tx,t = the Tier 1 trend assessment as computed in Equation 2
Ux,t = the category percent uncertainty in year t calculated according to the 2006 IPCC Guidelines Chapter 3. If the reported uncertainty is asymmetrical, the larger uncertainty should be used. The relative uncertainty will always have a positive sign.
This type of key category analysis is only applicable to those countries that have emission inventories for more than one year and uncertainty estimates for individual source and sink categories. Thus, key categories are those whose trend diverges significantly from the total trend, weighted by the uncertainty. Key categories are those that, when summed together in descending order of magnitude, add up at least 90% of the total trend.
5.8. References
IPCC (2006), Guidelines for National Greenhouse Gas Inventories. Intergovernmental Panel on Climate Change. Prepared by the National Greenhouse Gas Inventories Programme. Published by Institute for Global Environmental Strategies (IGES). Available from: <http://www.ipcc-nggip.iges.or.jp/public/2006gl/index.html>.

Chapter 6: National Inventory Improvement Plan
1: Institutional Arrangements
2: Methods and Data Documentation
3: Description of QA/QC Procedures
4: Description of Archiving System
5: Key Category Analysis
6: National Inventory Improvement Plan
Contact data of the Coordinator of the National Greenhous Gas Inventory
Country Republic of Moldova Postal address: 156A Mitropolit Dosoftei str., room 37, MD-2004, Chisinau, Republic of MoldovaName: Taranu Marius Telephone/Fax: +373 22 23 22 47Position: Coordinator of the National Greenhouse Gas Inventory E-mail: [email protected] Organization: Climate Change Office, Ministry of Agriculture, Regional Development and Environment URL: http://www.clima.md
6-1

Chapter 6: National Inventory Improvement Plan
6 - 2
6. National Inventory Improvement Plan 6.1. ObjectivesThis National Inventory Improvement Plan (NIIP) presents actions that the Republic of Moldova has identified to improve its national GHG inventory systems. The NIIP will guide future efforts to increase the transparency, consistency, comparability, completeness, and accuracy of future inventories. The plan ad-dresses many of the shortcomings of the previous inventory, and will inform future inventory teams of needed improvements. These improvements have been identified through documentation of existing institutional arrangements, category-by-category analyses of methods and data, QA/QC procedures, developing archiving systems, and an assessment of key categories in the Republic of Moldova.
6.2. Institutional Arrangement PrioritiesThe National Inventory System involves all of the institutional, legal, and procedural arrangements made by the Republic of Moldova for estimating anthropo-genic emissions and removals, as well as the reporting and archiving of inventory information. Identified within a National Inventory System is the designated government agency responsible for producing a national greenhouse gas inventory, the key organizations that contribute data and methods, estimates, and the end-users of the inventory.Preparing a comprehensive inventory requires establishing, identifying, and documenting all relevant contributors to the National Inventory. Assessing and documenting the status of existing institutional arrangements for inventory development will ensure continuity and integrity of the inventory, promote insti-tutionalization of the inventory process, and facilitate prioritization of future improvements.Table 6.1 lists the priority actions identified in the Chapter 1: Institutional Arrangements. Table 6.1: Priority Actions for the National Inventory System
Strengths of the National Inventory System Management Structure Potential Improvements of the National inventory System Management StructureThe key strengths in the management structure of the National Inven-tory System (NIS) are as follows:• The existence of regulatory provisions that establish the obligation
to submit data related to the inventory process of GHG emissions towards specific deadlines to the competent authority designated with responsibility for national inventory preparation;
• Existence of a group of qualified experts specializing in areas re-lated to the process of GHG emissions inventory with rich experi-ence gained over the years 1998-2018, starting from the first cycle of GHG emissions inventory conducted during preparation of the First National Communication of the Republic of Moldova to the UNFCCC (1997-2000) and ending with the latest inventory cycles conducted during preparation of the Forth National Communica-tion of the Republic of Moldova to UNFCCC (2014-2017) and of the Second Biennial Update Report of the Republic of Moldova under the UNFCCC (2017-2018);
While starting the most recent inventory cycle within the Project „Republic of Moldova: Enabling Activities for the Preparation of the Second Biennial Update Report under the United Nations Framework Convention on Climate Change” (2017-2018), it has been anticipated that by the end of 2018 year, the National System for Moni-toring and Reporting (NSMR) Greenhouse Gas Emissions and Other Information Relevant to Climate Change will be established through a Governmental Decision (since 20.07.2016 the draft GD was under the public consultation on the Climate Change Office website: http://clima.md/lib.php?l=en&idc=276, while since 07.02.2018 the draft GD was under the public consultation on the Governmental web platform: http://www.particip.gov.md/proiectview.php?l=ro&idd=4992).
Though establishing the NSMR it will be created the legal framework for enforcement the Article 15 of the Law on Environmental Protection No. 1515-XII of June 16, 1993 (Gazette of the Parliament of the Republic of Moldova No. 10 of January 10, 1993), the implementation of the provisions of the United Nations Framework Con-vention on Climate Change ratified by Parliament Decision No. 404-XIII of March 16, 1995 (Official Gazette of the Republic of Moldova No. 23 of April 27, 1995), the provisions of the Kyoto Protocol to which Moldova joined by Law No. 29 of February 13, 2003 (Official Gazette of the Republic of Moldova No. 48 of March 18, 2003); the provisions of the Association Agreement the Republic of Moldova - European Union (Title IV “Cooperation in the economic sector and other sectors”, Chapter 17 “Climate policies”), and the provisions of the Action Plan for implementation of the Environment Strategy for 2014 - 2023 regulated by Government Decision No. 301 of April 24, 2014 (Official Gazette of the Republic of Moldova No. 104-109, Art. 328 of June 05, 2014). By crating the NSMR it will be also partially transposed the Regulation (EU) No. 525/2013 of the European Parliament and of the Council of 21 May 2013 on a mechanism for monitoring and reporting greenhouse gas emissions and for reporting other information relevant to climate change at national and Union level and for repealing Decision No. 280/2004/EC.
The NSMR has been recently established through the Government Decision No. 1277 as of 26 December 2018 (http://lex.justice.md/index.php?action=view&view=doc&lang=1&id=379061)

Chapter 6: National Inventory Improvement Plan
6 - 3
Strengths of the National Inventory System Management Structure Potential Improvements of the National inventory System Management Structure• Possibilities for elucidation of quantitative and qualitative aspects
related to the inventory process from sectorial, national and inter-national statistical reports and publications;
• The existence of national studies in various sectorial areas, which allowed for the possibility in the near future to start using calcula-tion methodologies of higher tiers within the national inventory;
• The existence of a database of activity data related to the inven-tory process of GHG emissions, which is updated within each inventory cycle and is maintained institutionally starting from the first cycle of GHG emissions inventory.
• Experience gained in implementing quality verification, quality control and quality assurance measures for the national inventory of GHG emissions.
The estimations process of anthropogenic GHG emissions and removals could be also enhanced through the following potential improvements:• Enhancing the level of knowledge of national experts and institutions involved in developing the national GHG emission inventory by organizing a series of
thematic trainings; • Enhancing the professional skills of national experts and institutions involved in developing the inventory process, with the purpose of realizing the gradual
transition from default EFs and Tier 1 methodologies to country specific EFs and Tier 2 and 3 methodologies, particularly in the case of key categories;• Strengthening the data management system used in each inventory cycle, as well as the periodic archiving of the inventory and the documentation on which
inventory was drawn up, in order to comply with the principle of transparency.
Source: Chapter 1: Institutional Arrangements.
6.3. Summary of Key Categories
The concept of “key categories” was created by the IPCC as a way to help countries prioritize resources for improving national greenhouse gas inventories. Key categories have the greatest contribution to the overall level of national emissions. When an entire time series of emission estimates is prepared, key catego-ries can also be identified as those categories that have the largest influence on the trend of emissions over time. In addition, when uncertainty estimates are incorporated into emission estimates, additional key categories are identified.
The results of the key category analysis provide a country with a list of their most important inventory categories. This list is a starting point from which a country can begin the process of improving their greenhouse gas inventory. To improve the national greenhouse gas inventory, it may be necessary to con-sider applying more accurate or higher tier methodologies, collect more detailed activity data, or develop country-specific emission factors. These activities all require additional resources, and it is not possible to make improvements for every inventory category. Therefore, the Republic of Moldova has identified the categories listed in Table 6.2 as the most important categories contributing to national net emissions. Assessing the methods and data used to estimate emissions and/or removals from these key categories is integral to identifying priorities. These categories were identified through the Key Categories Analysis performed using the key categories calculation software developed by the US Environmental Protection Agency (US EPA’s Key Category Calculation Tool v2.5)12.
The summary results of the IPCC Approach 1 and Approach 2 methodologies for determining key categories (referred to as Tier 1 and Tier 2 throughout this report) are presented below. In the Tier 1 methodology, key categories have been identified using a pre-determined cumulative emissions threshold, where key categories are those that, when summed together in descending order of magnitude, add up to 95% of the total level. Under the Tier 2 key category methodol-ogy, source or sink categories have been sorted or ranked according to their contribution to uncertainty, and emissions have been weighted by their combined uncertainty, in addition to contribution to total emissions.
12 <https://19january2017snapshot.epa.gov/climatechange/national-ghg-inventory-capacity-building_.html>

Chapter 6: National Inventory Improvement Plan
6 - 4
Table 6.2 presents the summary overview of the key categories for the Republic of Moldova’s National GHG Inventory, 1990-2016, without LULUCF: based on the Tier 1 approach – 14 key categories by level (L) and 16 key categories by trend (T): based on a Tier 2 approach – 13 key categories by level (L) and 13 key categories by trend (T); with LULUCF: based on the Tier 1 approach – 20 key categories by level (L) and 20 key categories by trend (T), respective, based on a Tier 2 approach – 18 key categories by level (L) and 17 key categories by trend (T).
Table 6.2: Summary Overview of the Republic of Moldova’s Key Categories for 1990-2016, Based on a Tier 1 and Tier 2 Approaches
IPCC classifica-tion Key Categories Gas
Without LULUCF With LULUCFT1 T2 T1 T2
L T L T L T L T1A1 Energy Industries CO2 X X X X X X X X1A2 Manufacturing Industries and Construction CO2 X X X X X
1A3b Road Transportation CO2 X X X X X X X X1A3c Railways CO2 X X X1A4 Other Sectors CO2 X X X X X X X X1A4 Other Sectors CH4 X X X X1B2 Fugitive Emissions from Oil and Natural Gas CH4 X X X X X X X X2A1 Cement Production CO2 X X X X2A2 Lime Production CO2 X2F1 Product Uses as Substitutes for ODS – Refrigeration and Air Conditioning HFC X X X2F2 Product Uses as Substitutes for ODS – Foam Blowing HFC X X X X X X X3A Enteric Fermentation CH4 X X X X X3B Manure Management CH4 X X X X X X X
3Ba Direct N2O Emissions from Manure Management N2O X X X X X3Bb Indirect N2O Emissions from Manure Management N2O X X3Da Direct N2O Emissions from Managed Soils N2O X X X X X X X X3Db Indirect N2O Emissions from Managed Soils N2O X X X X X X X4A1 Forest Land Remaining Forest Land CO2 X X X X4A2 Land Converted to Forest Land CO2 X X X X4B1 Cropland Remaining Cropland CO2 X X X X4B2 Land Converted to Cropland CO2 X X X4C2 Land Converted to Grassland CO2 X X X X4D2 Land Converted to Wetlands CO2 X X X4E2 Land Converted to Settlements CO2 X X X X4G Harvested Wood Products CO2 X X5A Solid Waste Disposal CH4 X X X X X X X X
5Da Wastewater Treatment and Discharge – Domestic Wastewater CH4 X X X X X X X X5Da Wastewater Treatment and Discharge – Domestic Wastewater N2O X
Abbreviations: L – Level Assessment; T – Trend Assessment; T1 – Tier 1; T2 – Tier 2.

Chapter 6: National Inventory Improvement Plan
6 - 5
6.4. Potential Sector and Category Improvements Priority areas for potential sector and category level improvements are identified below. Table 6.3 lists the problems and potential improvements for categories within the Energy Sector.Table 6.3: Potential Improvements to the Methodology and Data Documentation Analysis in Energy Sector
Sector Potential Improvements
1. Energy
• Potential improvements within the 1A1 ‘Energy Industries’, 1A2 ‘Manufacturing Industries and Construction’, 1A3 ‘Transport’, 1A4 ‘Other Sectors’, 1A5 ‘Other’ and ‘CO2 emissions from biomass’ (Memo Items) catego-ries could be possible once the updated AD regarding the fuel consumption with energy purposes for the territory on the LBDR are available, thus filling the gaps for certain years. Also, another potential improvement could be identifying additional AD sources or updating AD from official statistical publications;
• Regarding the 1A3a ‘Civil Aviation’ (1A3ii ‘Domestic Aviation’), the opportunity to collect missing AD for 1994-2000 time series will be considered, and alternatively, if this is not possible, the gaps will be filled according to the methodologies available in the 2006 IPCC Guidelines;
• Also, for 1A3a ‘Civil Aviation’ and 1A3c ‘Railways’, it would be possible to use higher-tier methods (Tier 2b, respectively Tier 2), but since these sources are not key categories, this activity is not cost-efficient and cost-effective for the national inventory team;
• For 1A3b ‘Road Transportation’, potential improvements could be the result of collecting additional AD for 1990-2013 time series, required to use the COPERT 4.9 model. Due to their absence, for now it was possible to run the program only for 2014-2016 years;
• Potential improvements within the 1B2 ‘Fugitive Emissions from Oil and Natural Gas’ source category could be possible regarding the availability of new data related to fugitive leaks from oil and natural gas distribution networks (from the infrastructure needed to produce, collect, process, refine and distribute oil products and natural gases for the final consumers; from equipment functioning, evaporation and flashing losses, flaring, accidental releases from pipeline dig-ins), respectively in the case of adopting a higher-ranking assessment methodology. It will also be estimated the possibility to obtain AD associated to LPG consumption on the territory of the LBDR for the entire period under review;
• Within the ‘International Aviation’ (Memo Items) source category, potential improvements could be achieved once a higher methodology is used (for example, a Tier 3 approach available in the EMEP/EEA Air Pollutant Emission Inventory Guidebook (2016), which considers the real values of emissions for each type of aircraft depending on the flight distance. Also, it could be used the emission calculator available in the updated version of the EMEP/EEA Air Pollutant Emission Inventory Guidebook (July 2017);
• Potential improvements within the ‘CO2 emissions from biomass’ (Memo Items) could be achieved by expanding the more efficient method of recording the biomass consumption used in the „Research on household energy consumption” developed by the NBS of the Republic of Moldova with the support of the Energy Community experts in 2015 for the remaining years 1990-2009, allowing thus, the consistency of results under this source category for the entire period under review.
• Potential improvements within the Sector 1. ‘Energy’ might be achieved also through implementing, in extent possible, all recommendations contained in the “Report on the technical review of the National Greenhous Inventories of the Republic of Moldova for 1990-2016 periods – Energy Sector”, to be conducted by Dr. Veronica Ginzburg, Institute of Global Climate and Ecology, Roshidromet / Academy of Science of the Russian Federation within January-February 2019 periods.
Source: Chapter 2: Methods and Data Documentation.
Table 6.4 lists the problems and potential improvements to the categories within the Industrial Processes and Product Use Sector.Table 6.4: Potential Improvements to the Methodology and Data Documentation Analysis in the Industrial Processes and Product Use Sector
Sector Potential Improvements
2. Industrial Processes and Product Use
Monitoring the GHG emissions from the Sector 2 ‘Industrial Processes and Product Use’ is planned to be improved along with:• Updating the activity data used to estimate GHG emissions within 2A ‘Mineral Industry’, 2D ‘Non-Energy Products from Fuels and Solvent Use’ and 2G ‘Other Product Manufacture and Use’ for 1990-2016 categories
for 1990-2015 time series; • Updating the activity data regarding the consumption of raw materials per ton of production, as well as the specific consumption of electrodes per ton of steel produced (category 2C1 ‘Iron and Steel Production’) by
the national enterprises in the Republic of Moldova; • Setting up an on-line information system for collecting AD from companies that import, use, dispose, recover and recycle freons and refrigerant equipment; this information system will provide the Ozone Office and
Climate Change Office more accurate AD that could potentially help reduce uncertainties in estimating GHG emissions from the 2F ‘Product Uses as Substitutes for ODS’ category in the Republic of Moldova;• Collecting AD on fireworks products consumption (code 3604 10 000 – signaling and anti-hailing missiles and similar, firecrackers and other pyrotechnic articles, such as code 3604 90 000 – other articles for fireworks)
(SNAP 060601), to be considered additionally within category 2G ‘Other Product Manufacture and Use’.Source: Chapter 2: Methods and Data Documentation.

Chapter 6: National Inventory Improvement Plan
6 - 6
Table 6.5 lists the problems and potential improvements for categories within Agriculture Sector.
Table 6.5: Potential Improvements to the Methodology and Data Documentation Analysis in the Agriculture Sector Sector Potential Improvements
3. Agriculture
Monitoring the GHG emissions from the Sector 3 ‘Agriculture’ is planned to be improved along with:• Updating AD and productivity indicators used to estimate GHG emissions within category 3A ‘Enteric Fermentation’ following a Tier 2 methodology, in particular for cattle and sheep, the animal categories that account
for the largest share in the structure of total methane emissions originated from this source category;• Updating AD and productivity indicators used to estimate CH4 emissions from the 3B ‘Manure Management’, in particular for ‘cattle’ and ‘swine’ livestock categories accounting for the largest share in the structure of
total CH4 emissions originated from this category; as well as updating the values for the main parameters used to develop CS EFs for the respective animal categories following a Tier 2 method;• Estimate the share and usage of manure management systems in the Republic of Moldova (MS%) in order to enhance the accuracy of GHG inventory results within 3B ‘Manure Management’ (the activity will be similar
to that undertaken within May-June 2015 periods by the specialists from the Scientific-Practical Institute of Biotechnology in Animal Breeding and Veterinary Medicine as well as from the National Agency for Food Security, when dairy cows and other cattle farms with a herd of more than 5 heads were inspected, as well as pig farms with more than 30 heads and the largest poultry farms in the country; the inspections covered 36 districts of the country; in total, manure management systems from 179 farms have been inspected, of which 96 cattle farms, 66 pig farms and 17 poultry farms) and collecting other relevant data regarding N2O emissions from the 3B ‘Manure Management’ category, in particular those related to country specific N excreted rates for different categories (kg N/head/year);
• Updating activity data and country specific coefficients and parameters used to estimate direct N2O emissions from crop residues returned to soils under the 3D ‘Agriculture Soils’ category;• Updating activity data and country specific coefficients used to estimate direct N2O emissions from nitrogen mineralization associated with loss of soil carbon as a result of land-use or management change; • Updating activity data used to estimate CO2 emissions from urea application on managed soils.
Source: Chapter 2: Methods and Data Documentation.
Table 6.6 lists the problems and potential improvements to the categories within LULUCF sector.
Table 6.6: Potential Improvements to the Methodology and Data Documentation Analysis in Land Use, Land-Use Change and Forestry SectorSector Potential Improvements
4. LULUCF
Monitoring the CO2 emissions/removals from the Sector 4 ‘Land Use, Land-Use Change and Forestry’ is planned to be improved along with:• Implementing, in extent possible, all recommendations contained in the “Report on the technical review of the National Greenhouse Gas Inventories of the Republic of Moldova for 1990-2016 periods – LULUCF Sec-
tor”, to be conducted by Dr. Viorel Blujdea from the National Institute for Forestry Research and Development “Marin Dracea” (former ICAS Bucharest, Romania) in January-February 2019 periods;• Raising substantially the quality of GHG inventory in the LULUCF sector, through periodic (e.g., at least once in 5 years) ‘Forest Inventory’ to provide updated information, not only for the state of forest fund, but also for
private forest land or those under the administration of local authorities; also, new production tables and other forest relevant information are needed; to accomplish these imperatives, the inter-institutional collaborative effort, and the needed financial resources may be very significant; thus, it is imperative to identify as soon as possible opportunities for obtaining such a financial support from the international donors and/or partners;
• Improving data regarding the actual consumption of fuel wood from the managed forest land of the RM, as well as updating national emission/removal factors (basic wood density, biomass expansion factors, emission factors from forest fires etc.) (category 4A ‘Forest Land’);
• Improving records pertaining to actual volume of wood from forest stripes management as well as other types of forest vegetation and also activities aimed at verification of emission/removal factors specific to perennial plantations (current biomass increments, biomass harvesting during the cleaning cuttings) (source category 4B1.1 ‘Cropland Covered with Woody Vegetation’);
• Improving the country specific methodology (Banaru, 2000) and improving the quality of used activity data, in order to make possible estimation of CO2 emissions/removals from source category 4B1.2 ‘Annual Change in Carbon Stocks in Mineral Soils’; in collaboration with the specialists from the Institute of Pedology, Agrochemistry and Soil Protection „Nicolae Dimo” and Forestry Research and Management Institute of “Moldsilva” Agency, undertaking also a research study focused on identifying the soil organic carbon stocks (SOC0) in the most recent years to be covered by in the next inventory cycle; the content of humus in arable soils (the layer of 0-30 cm) has to be identified in representative cites in the northern part of the country (e.g., Napadova, Floresti district), in the southern part of the country (e.g., Lebedenco, Cahul district), as well as in the central part of the country (e.g., Ivancea, Orhei district); the results of the study will be used to estimate CO2 emissions from annual change in carbon stocks in mineral soils through a Tier 2 methodological approach;
• Improving the cadastral records (as the main reference sources for AD) pertaining to specification of initial land use categories to which converted lands are transferred to (categories 4A ‘Forest Land’, 4B ‘Cropland’, 4C ‘Grassland’, 4D ‘Wetlands’, 4E ‘Settlements’ and 4F ‘Other Land’);
• Also, analyzing the input and output process of lands within the 4F ‘Other Land’ category, inclusive in terms of establishing the average conversion period;• Improving the statistical records (as the main reference sources for AD) pertaining to wood products production/export/import from 4G ‘Harvested Wood Products’ category.
Source: Chapter 2: Methods and Data Documentation.
Table 6.7 lists the problems and potential improvements to the categories within Waste Sector.

Chapter 6: National Inventory Improvement Plan
6 - 7
Table 6.7: Potential Improvements to the Methodology and Data Documentation Analysis in the Waste SectorSector Potential Improvements
5. Waste
Monitoring the direct GHG emissions from the Sector 5 ‘Waste’ is planned to be improved along with:• Accomplishing, by the end of the next inventory cycle of an external independent technical evaluation of the GHG inventories – Waste Sector, by an international consultant with a good knowledge of the 2006 IPCC
Guidelines and with extensive expertise in assessing GHG inventories of the Annex I Parties;• Conducting a new study on determining the morphological composition of solid municipal waste deposited in various urban areas of the Republic of Moldova, in each locality at least 3 analyses per season (autumn,
winter, spring and summer);• Adopting a new approach needed to address the environmental issues in the RM, complying with the commitments under the ratified international conventions and agreements, respectively considering sustainable
development, as well as the EU integration perspective;• The need to promote statistical accounting of the generated waste and the essentially restructuration of the waste management in the Republic of Moldova taking into account international practice and EU standards
in municipal solid waste management; • Adoption of the Waste List, including hazardous waste, will contribute to improving national statistical records on waste management, to comply with the EU requirements, and will allow fulfilling the commitments
under the international environmental treaties, ratified by the Republic of Moldova, and efficient reporting on consistent implementation. In this context it is planned to improve the quality of activity data pertaining to the amount of generated and disposed municipal solid waste and industrial waste;
• The modernization of legal and regulatory framework for waste management, according to the Waste Management Strategy of the Republic of Moldova for 2013-2027 years, which foresees the development of integrated municipal waste management through the harmonization of legal, institutional and regulatory framework to the EU standards, based on a regional approach (geographical position, economic development, the existence of access roads, pedological and hydrogeological conditions, population, etc.). The goal is to promote and implement selective collection in all areas both in household sector and in the production sector, as well as sorting, composting and recycling facilities; and the development of waste disposal capacity by creating 7 new SWDS (landfills) at a regional level and 2 new mechanical-biological treatment plants;
• It is deemed appropriate to transpose the Resolution of the EU Commission 2000/532/EC regarding the waste list, including hazardous waste, according to the Law on Waste no. 209 from 29.07.2016 will contribute to improving national statistical records on waste management. Thus, in the next years, the economical agents that thermally treat wastes will be required to report the data on waste management practices in an automated information system. Therefore, it will be possible to improve the quality of activity data used to estimate the emissions from the 5C “Incineration and open burning of waste” category;
• Improving the population’s access to quality water supply and sanitation services, in the context of implementing the Government Decision No. 199 as of 20.03.2014 the Strategy on water supply and sanitation (2014-2028), ensuring gradual access to quality water supply and sanitation services for all in the Republic of Moldova, contributing to the improvement of health, dignity and quality of life as well as to the economic development of the country;
• To offer access to the entire population to improved sanitation systems by 2025, including up to 50 per cent to sewage systems; to increase the performance levels of collective systems of water supply, sanitation and other types; to increase the degree of implementation of good practices recognized in the field of integrated water management as well as water and sanitation supply; to decrease by 50 per cent the amount of untreated wastewater discharged as well as reduction of untreated rainwater discharged into natural receptors; to improve the sludge managements and the quality of treated wastewater from centralized sewage systems or other sanitation systems, in the context of fully implementing the Government Decision No. 1063 as of 16.09.2016 on approving the National Program for the Implementation of the Protocol on Water and Health in the Republic of Moldova for 2016-2025; the respective program also plans to establish several indicators to ensure the population’s access to improved sanitation systems, and a level of efficiency for manag-ing the collective sanitation systems as well as other systems; to ensure by 2025 effective collective sewage systems in 7 cities in the country, the application of good practices in the field of water supply management, water and sanitation management, to ensure sludge disposal or reuse from centralized collective sewage systems or other types of sewage systems;
• Regulate the conditions of discharge, the introduction of specific substances into a body of surface water, groundwater or water fields, in the context of implementing the Regulation on Wastewater Discharge in Water Bodies, approved through the Government Decision No. 802 as of 09.10.2013; the Regulation indicates the emission limit values applicable to the discharge of wastewater from the industrial sectors (activities) into a body of surface water. It is expected that this regulation will produce a positive effect on the quality of the AD and respectively, a decrease of emissions from source category 5D “Wastewater treatment and discharge”;
• Regulate the conditions for wastewater collection, treatment and discharge in the sewage system and/or in water basins, in the context of implementing the Regulation on Requirements for Wastewater Collection, Treatment and Discharge in the Sewage System and/or in Water Basins for Urban and Rural Areas, approved through the Government Decision No. 950 as of 25.11.2013; the Regulation provides for the maximum allowable limit values for pollutants in discharged water into natural water basins, which will contribute to a safe decrease of emissions within 5D “Wastewater treatment and discharge” category;
• Implementing Regional Sectoral Plans for Water and Sanitation Supply (Central, Southern and Northern Development Regions) by applying clearly defined regulatory, institutional and economic instruments: o Regulatory instruments - will focus on a set of normative laws (the Water Law No. 272 as of 23.12.2011 , Law No. 303 as of 13.12.2013 on Public Service for Water and Sanitation Supply , the Regulation on
Requirements for Wastewater Collection, Treatment and Discharge in the Sewage System and/or in Water Basins for Urban and Rural Areas, Government Decision No. 950 as of 25.11.2013 on the approval of the Regulation on Requirements for Wastewater Collection, Treatment and Discharge in the Sewage System and/or in Water Basins for Urban and Rural Areas, Regional Sectoral Plans related to water and sanitation and other). These regulatory instruments through their provisions will improve the quality of water and sanitation services, of wastewater, rain water and sludge management, improving thus, the quality of services within the sector);

Chapter 6: National Inventory Improvement Plan
6 - 8
Sector Potential Improvements
5. Waste
o Institutional instruments - will focus on the regionalization of services within this sector which will encourage the providers of water supply and sanitation services to group together and create regional companies, based on inter-municipal associations/enterprises or public-private partnerships (PPP) capable of becoming strong models of economically viable enterprises. The process of strengthening water-sanitation providers will be accompanied by tariff adjustment to ensure proper operation and maintenance of systems, for expanding the services to new users. Currently, it entered into force the Action Plan for 2018-2028 on the regionalization of water supply and sanitation services, created in order to implement the Strategy on water supply and sanitation for 2014-2028 and the National Program for the Implementation of the Protocol on Water and Health in the Republic of Moldova for 2016-2025. The Plan includes actions to establish regional operators and, implicitly, to delegate the water supply and sewage systems manage-ment to the Agency, which represents an essential process for ensuring compliance with the acquis communautaire on offering access to quality water supply to the entire population as a fundamental human right. One of the major objectives is to organize and strengthen the institutional capacity of the existing licensed operators by extending the area of water supply and sewage systems services to include other administrative-territorial units. Another important goal is to optimize the number of operators, through their territorial grouping, in order to create viable regional operators by reducing the number of existing ones and establishing 5 major regional operators, according to the following administrative-territorial criteria: North-West Operator – Briceni, Ocnita, Edinet, Donduseni, Glodeni, Falesti districts; Acva-North Operator – Rascani, Drochia, Sangerei, Telenesti, Floresti, Soroca, Soldanesti, Rezina districts and Balti municipality; Centre Operator – Chisinau municipality, Ungheni, Calarasi, Straseni, Orhei, Anenii Noi, Nisporeni, Ialoveni, Hancesti municipality; South-West Operator – Leova, Cimislia, Causeni, Stefan-Voda, Cantemir and Cahul districts; ATU Gagauzia Operator;
o Economic instruments - will focus on the concept of “sustainable recovery of cost services” with three main characteristics: an appropriate combination of tariffs, taxes and transfers to finance recurrent and capital costs and to boost other forms of funding; the predictability of public subsidies in order to facilitate investments (planning); tariff policies to make services accessible to all, including to the poorest citizens, while, at the same time, ensuring the sustainability of service providers.
• Planning the actions to achieve the harmonization of nation legislation on water with the EU Directives, represents a strong instrument enhancing the implementation of best practices, of wastewater and sludge handling technologies, which would allow capturing and sustainable using of methane emissions from sludge platforms (including for heat and electric power production);
• For the next inventory cycle, in order to estimate CH4 emissions, it is planned also to use country-specific information on BOD5 values in wastewater; on the fraction of BOD removed with the sludge, maximum methane producing capacity, methane correction factor and other relevant parameters within the 5D “Wastewater treatment and discharge” category.
Source: Chapter 2: Methods and Data Documentation.
6.5. Potential Improvements to QA/QC Procedures The existing quality assurance (QA) and quality control (QC) procedures (see Chapter 3: Description of QA/QC Procedures), basically, provide for the current needs. In this context, potential improvements to the QA/QC procedures are mostly aimed at improving the efficiency of application thereof, but also attracting experts of higher qualification from abroad and involving them into this exercise, especially for QA exercise.
Table 6.8: Potential Improvements to QA/QC Procedures
SectorPotential Improvements
QC QA
Energy
The existing verification and quality control procedures largely meet the current needs. The po-tential improvement is seen as improvements in the efficiency of applying specific procedures (Tier 2) verification and QC pro-cedures to as many key catego-ries from the energy sector as possible.
The existing quality assurance procedures, more or less meet the current needs. However, in the context of the undertaken transition to the reporting requirements of the 2006 IPCC Guidelines for National Greenhouse Gas Inventories and the fact that energy sector has the largest contribution to total national emissions (68.1% of the national total in 2016), the next inventory cycle will require more attention to the quality assurance procedures by attracting international consultants with extensive expertise in application of the 2006 IPCC Guidelines. In respective context, it has been agreed to organize within the period January-February 2019 the international technical evaluation of the energy sector GHG inventory, to be conducted by Dr. Veronica Ginzburg from the Institute of Global Climate and Ecology, Roshidromet / Academy of Science of the Russian Federation. Dr. Ginzburg has large experience in compiling the energy sector GHG Inventory in the Russian Federation and also has an extensive international experience (since 2005) in peer reviewing the energy sector GHG inventories of the UNFCCC Annex I Parties. Further improvements will emerge from improving the issues identified during this peer review, and respectively, based on recommendations formulated by Dr. Ginzburg in the “Report on the technical review of the National Greenhouse Gas Inventories of the Republic of Moldova for 1990-2016 periods – Energy Sector”. The national inventory team will take into account the recommendations made during the evaluation to the largest possible extent during the next inventory cycle.

Chapter 6: National Inventory Improvement Plan
6 - 9
SectorPotential Improvements
QC QA
LULUCF
The existing verification and quality control procedures largely meet the current needs. The po-tential improvement is seen as improvements in the efficiency of applying specific procedures (Tier 2) verification and QC pro-cedures to as many key catego-ries from the LULUCF sector as possible.
The existing quality assurance procedures, more or less meet the current needs. However, in the context of the undertaken transition to the reporting requirements of the 2006 IPCC Guidelines for National Greenhouse Gas Inventories and the fact that some key categories representing the LULUCF sector (e.g., 4A ‘Forest Land’, 4B ‘Cropland’ and 4C ‘Grassland’) greatly contribute to the total national emissions, the next inventory cycle will require greater attention to quality assurance procedures by attracting international consultants with extensive expertise in application of the 2006 IPCC Guidelines. In respective context, it has been agreed to organize within the period January-February 2019 the international technical evaluation of the LULUCF sector GHG inventory, to be conducted by the international consultant Dr. Viorel Blujdea from the National Forestry Research and Development Institute “Marin Dracea” (former ICAS Bucharest), responsible for compiling the LULUCF Sector GHG Inventory for Romania and who has an extensive expertise (since 2008) in implementation of annual com-pleteness check and QA/QC program for LULUCF sector of the submissions of EU 28 member states (MS) under EU GHG monitoring mechanism regulation (procedure is equivalent to UNFCCC review ensuring consistency of MS submissions to UNFCCC) and in the compilation of LULUCF sections in the European Union’s National Inventory Report and LULUCF cross-sectoral elements (between 2008 and 2014 Dr. Viorel Blujdea was a national detached expert to Joint Research Centre of the European Commission as a scientific/technical officer in charge with EU’s GHG inventory and supplementary submission to Kyoto Protocol for LULUCF sector, in charge with LULUCF sections in 6 annual submission from 2009 to 2014). Further improvements will emerge from improving the issues identified during this peer review, and respectively, based on recommendations formulated by Dr. Viorel Blujdea in the “Report on the technical review of the National Greenhouse Gas Inventories of the Republic of Moldova for 1990-2016 periods – LULUCF Sector”. The national inventory team will try take into account the recommendations made during the evaluation to the largest possible extent during the next inventory cycle.
6.6. Potential Archiving System Improvements
The existing national inventory archiving system procedures (see Chapter 4: Description of Archiving System) largely provide for the current needs. Table 6.9 identifies potential improvements needed to strengthen the inventory archiving system procedures, both by the competent authority responsible for managing the national inventory system (Climate Change Office of the Ministry of Environment) and by the partner institutions involved in compiling the GHG inventory at sector level (Energy, IPPU, Agriculture, LULUCF and Waste).
Table 6.9: Potential Improvements to the Archive SystemSector Potential Improvements
General
• Periodic assessment (at the end of each inventory cycle) of the existent Archiving Program and Procedures and of the Archive System Plan applied by the Climate Change Office aimed to identify improvement op-portunities.
• Periodic assessment (at the end of each inventory cycle) of the specific archiving procedures (file management, data storage, records keeping, storage mechanisms) applied by the Climate Change Office aimed to identify improvement opportunities.
• Responsibilities need to be defined for a database lead. It is necessary to appoint a person responsible for the database who will ensure that all the inventory archival procedures, corresponding documents and supporting spreadsheets identified under the IPCC guidelines are accurately followed. He/she will also be responsible to ensure that all the members of the team know their responsibilities with regard to archiving. The most important points that the designated coordinator should take into account are the following: (i) ensure an effective archiving process; (ii) ensure that copies from all new reference documents are adequately archived; (iii) establish a checklist for the archiving procedures to be used by the members of the inventory team; (iv) to be responsible for the permanent archive and to respond to future request in regard to archiving materials.
• Responsibilities need to be defined for consultants responsible for collecting reference documents and corresponding cataloging. The responsibilities in regard to reference documents from specific consultants (staff members that have the responsibility to develop GHG emission estimates for a particular sector) should be designated and notified from the beginning of the inventory process.

Chapter 6: National Inventory Improvement Plan
6 - 10
6.7. Communication, Outreach, and Training Priorities
It is important to communicate the purpose and results of the inventory to policymakers, academia and public society. To this end, various awareness activities are planned within each inventory cycle, such as:
• meetings, roundtables with stakeholders; • awareness raising events with policymakers, academia and public society at large on the efforts to be made to increase the quality of national GHG
inventory;• providing feedback to ministries, central public authorities, academia and public society at large;• communicating the inventory results to data providers, policymakers, academia and public society at large, including through posting relevant informa-
tion and inventory documents on the Climate Change Office website (<www.clima.md>); • improving relationships with all partner institutions.
At the same time, the Climate Change Office pays special attention to the continuous training of hiring inventory staff for acquiring best practices for the GHG emissions inventory compiling. Thus, for example, within the previous inventory cycle the following thematic trainings in the GHG inventories have been car-ried:
• Mr. Atsushi Sato (Japan), International Trainer in Applying the IPCC Inventory Software of the 2006 IPCC Guidelines for National Greenhouse Gas In-ventories – AFOLU Sector, provided a 3-days (7-9 June 2016) hands-on training workshop on applying the IPCC Inventory Software of the 2006 IPCC Guidelines for National Greenhouse Gas Inventories – AFOLU Sector. Detailed information of hands-on training agenda and outcomes are available on: http://clima.md/libview.php?l=en&id=3953&idc=93. Eleven national experts in GHG inventory, representing various institutions (Climate Change Office, Forest Research and Development Institute of the “Moldsilva” Agency, Institute of Pedology, Agrochemistry and Soil Protection “Nicolae Dimo” and the State Agricultural University of Moldova) have participated to respective hands-on training workshop;
• Mr. Jongikhaya Witi (South Africa), International Trainer in Applying the IPCC Inventory Software of the 2006 IPCC Guidelines for National Greenhouse Gas Inventories – Energy, IPPU and Waste Sectors, provided a 3-days (20-22 June 2016) hands-on training on applying the IPCC Inventory Software of the 2006 IPCC Guidelines for National Greenhouse Gas Inventories – Energy, Industrial Processes and Product Use and Waste Sectors. Detailed informa-tion of the hands-on training agenda and outcomes are available on the: http://clima.md/libview.php?l=en&id=3954&idc=93. Twelve national experts in GHG inventory, representing various institutions (Climate Change Office, Ozone Office, Environment Pollution Prevention Office, Institute of Power Engineering, Institute of Ecology and Geography, Technical University of Moldova and “TERMOELECTRICA” JSC) have participated to respective hands-on training workshop;
• Mr. Viorel Blujdea (Romania), International Consultant in National Greenhouse Gas (GHG) Inventories – Land Use, Land-Use Change and Forestry (LU-LUCF) Sector, provided two hands-on trainings in the second half of 2016 year:• Hands-on training workshop on developing a database and a land use matrix to be used for developing the national GHG inventory, held since 15
to 17 June 2016. In close cooperation with the National GHG Inventory Coordinator, LULUCF sector lead and national consultants, the international consultant leaded the process of (i) designing the structure and content of the database, as well as of the land use matrix afferent to the LULUCF sec-

Chapter 6: National Inventory Improvement Plan
6 - 11
tor, in accordance with the reporting requirements defined in the IPCC 2006 Guidelines and in the 2013 Supplement to the 2006 IPCC Guidelines for National Greenhouse Gas Inventories: Wetlands (Wetlands Supplement); (ii) defining and developing a detailed representation of land use categories with clear explanation on how to implement the land use categories classification in the Republic of Moldova, by considering the national circum-stances and existing statistical system in place; (iii) elaborating the list of data needed for being collected for the development of the database and land use matrix covering the 1970-2015 period; (iv) drafting the survey and questionnaire forms, by institutions, referring to the data and information to be collected for developing the database and the land use matrix for the period 1970-2015; (v) developing the database and the land use matrix to be used within the LULUCF sector, covering the period 1970-2015;
• Hands-on training workshop on developing and using the database and the land use matrix (held since 10 to 13 October 2016), to be used for de-veloping the national GHG inventory for 1990-2015 periods, included into the Fifth National Communication of the Republic of Moldova under the UNFCCC (2018). In close cooperation with the National GHG Inventory Coordinator, LULUCF sector lead and national consultants, the international consultant leaded the process of finalizing the database and the land use matrix covering the 1970-2015 period. As result of respective two hands-on trainings provided in June and October 2016, the targeted audience (the LULUCF sector inventory team members) have been able to collect the needed activity data and national-specific parameters, requested for building an inventory database and land use matrix covering the 1970-2015 period, used for developing the national GHG inventory for 1990-2015 time-series, in accordance with the reporting requirements defined in the 2006 IPCC Guidelines for National Greenhouse Gas Inventories.
6.8. Prioritized List of Potential Improvements
This section prioritizes the most critical improvements needed, based on an assessment of the relative importance of improvements identified for institutional arrangements, methods and data documentation, quality assurance and quality control procedures, archiving systems, key categories analysis and communica-tion issues, outreach and training (see above).
By addressing these potential improvements, the country can move toward producing a more complete and higher-quality inventory. Table 6.10 lists these potential improvements and identifies the priority level associated with each (High, Medium, or Low).
Table 6.10: National Inventory Improvement Priorities # Sector Priority Level Improvements Needed
1 General High Enhancing the professional capacities of national experts involved in the inventory process, specifically in the application of 2006 IPCC Guidelines and the associated GHG emissions calculation and reporting software, through thematic trainings with participation of international trainers.
2 General High Transitioning from default EFs and Tier 1 methodologies to country specific emission factors and Tier 2 and 3 methodologies, particularly focusing on key categories.3 General High Strengthening the data management system for tracking and archiving the inventory information used in each inventory cycle.
4 Energy HighImplementing in extent possible all recommendations contained in the “Report on the technical review of the National Greenhouse Gas Inventories of the Republic of Moldova for 1990-2016 periods – Energy Sector”, to be conducted by Dr. Veronica Ginzburg, Institute of Global Climate and Ecology, Roshidromet / Academy of Science of the Russian Federation within January-February 2019 periods.
5 Energy Medium Transitioning from default EFs and Tier 1 methodologies to country specific emission factors and Tier 2 and 3 methodologies, in particular for the following key categories: 1A3 Transport and 1B2 Fugitive Emissions from Oil and Natural Gas.

Chapter 6: National Inventory Improvement Plan
6 - 12
# Sector Priority Level Improvements Needed
6Industrial Pro-
cesses and Other Products
HighSetting up an on-line information system for collecting AD from companies that import, use, dispose, recover and recycle freons and refrigerant equipment; this information system will provide the Ozone Office and Climate Change Office more accurate AD that could potentially help reduce uncertainties in estimating GHG emissions from the 2F ‘Product Uses as Substi-tutes for ODS’ category in the Republic of Moldova
7 Agriculture High
Estimate the share and usage of manure management systems in the Republic of Moldova (MS%) in order to enhance the accuracy of GHG inventory results within 3B ‘Manure Manage-ment’ (the activity will be similar to that undertaken within May-June 2015 periods by the specialists from the Scientific-Practical Institute of Biotechnology in Animal Breeding and Veterinary Medicine as well as from the National Agency for Food Security, when dairy cows and other cattle farms with a herd of more than 5 heads were inspected, as well as pig farms with more than 30 heads and the largest poultry farms in the country; the inspections covered 36 districts of the country; in total, manure management systems from 179 farms have been inspected, of which 96 cattle farms, 66 pig farms and 17 poultry farms).
8 LULUCF HighImplementing in extent possible all recommendations contained in the “Report on the technical review of the National Greenhouse Gas Inventories of the Republic of Moldova for 1990-2016 periods – LULUCF Sector”, to be conducted by Dr. Viorel Blujdea from the National Institute for Forestry Research and Development “Marin Dracea” (former ICAS Bucharest, Romania) in January-February 2019 periods.
9 LULUCF High
Raising the quality of GHG inventory in the LULUCF sector, through periodic (e.g., at least once in 5 years) ‘Forest Inventory’ to provide updated information, not only for the state of for-est fund, but also for private forest land or those under the administration of local authorities; also, new production tables and other forest relevant information are needed; to accomplish these imperatives, the inter-institutional collaborative effort, and the needed financial resources may be very significant; thus, it is imperative to identify as soon as possible opportunities for obtaining such a financial support from the international donors and/or partners.
10 LULUCF Medium
In collaboration with the specialists from the Institute of Pedology, Agrochemistry and Soil Protection „Nicolae Dimo” and Forestry Research and Management Institute of “Moldsilva” Agency, undertake a research study focused on identifying the soil organic carbon stocks (SOC0) in the most recent years to be covered by in the next inventory cycle; the content of humus in arable soils (the layer of 0-30 cm) has to be identified in representative cites in the northern part of the country (e.g., Napadova, Floresti district), in the southern part of the country (e.g., Lebedenco, Cahul district), as well as in the central part of the country (e.g., Ivancea, Orhei district); the results of the study will be used to estimate CO2 emissions from annual change in carbon stocks in mineral soils through a Tier 2 methodological approach.
11 Waste High Accomplishing, by the end of the next inventory cycle of an external independent technical evaluation of the GHG inventories – Waste Sector, by an international consultant with a good knowledge of the 2006 IPCC Guidelines and with extensive expertise in assessing GHG inventories of the Annex I Parties.
12 Waste Medium Conducting a new study on determining the morphological composition of solid municipal waste deposited in various urban areas of the Republic of Moldova, in each locality at least 3 analyses per season (autumn, winter, spring and summer).

Chapter 6: National Inventory Improvement Plan
6 - 13