The potential role of natural gas flaring in meeting greenhouse ...
7
The potential role of natural gas flaring in meeting greenhouse gas mitigation targets Christopher D. Elvidge a, * , Morgan D. Bazilian b , Mikhail Zhizhin c, d , Tilottama Ghosh c , Kimberly Baugh c , Feng-Chi Hsu c a Earth Observation Group, NOAA National Centers for Environmental Information, United States b Payne Institute, Colorado School of Mines, United States c Cooperative Institute for Research in the Environmental Sciences, University of Colorado, United States d Russian Space Science Institute, Moscow, Russian Federation article info Article history: Received 2 May 2017 Received in revised form 22 December 2017 Accepted 29 December 2017 Available online 8 March 2018 Keywords: VIIRS Gas flaring Nightfire Nationally determined contributions UN climate agreement abstract In this paper, we compare 2015 satellite-derived natural gas (gas) flaring data with the greenhouse gas reduction targets presented by those countries in their nationally determined contributions (NDC) under the United Nations Framework Convention on Climate Change (UNFCCC) Paris Agreement. Converting from flaring to utilization is an attractive option for reducing emissions. The analysis rates the potential role of reduction of gas flaring in meeting country-specific NDC targets. The analysis includes three categories of flaring: upstream in oil and gas production areas, downstream at refineries and transport facilities, and industrial (e.g., coal mines, landfills, water treatment plants, etc.). Upstream flaring dom- inates with 90.6% of all flaring. Global flaring represents less than 2% of the NDC reduction target. However, most gas flaring is concentrated in a limited set of countries, leaving the possibility that flaring reduction could contribute a sizeable portion of the NDC targets for specific countries. States that could fully meet their NDC targets through gas flaring reductions include: Yemen (240%), Algeria (197%), and Iraq (136%). Countries which could meet a substantial portion of their NDC targets with gas flaring re- ductions include: Gabon (94%), Algeria (48%), Venezuela (47%), Iran (34%), and Sudan (33%). On the other hand, several countries with large flared gas volumes could only meet a small portion of their NDC targets from gas flaring reductions, including the Russian Federation (2.4%) and the USA (0.1%). These findings may be useful in guiding national level efforts to meet NDC greenhouse gas reduction targets. Published by Elsevier Ltd. This is an open access article under the CC BY license (http://creativecommons. org/licenses/by/4.0/). 1. Introduction There is wide consensus in the scientific community that anthropogenic greenhouse gas emissions have begun to impact the earth's climate, and that large reductions in those emissions is required to constrain the adverse impacts of climate change. Worldwide, the largest source of emissions comes from the burning fossil fuels, widely consumed for electricity, heat, and trans- portation. Fossil fuels widely consumed include coal, petroleum, and natural gas. The Paris Climate Agreement, developed under the United Na- tions Framework Convention on Climate Change (UNFCCC), came into force on November 4, 2016. Under the Agreement, countries have presented specific actions and targets to reduce greenhouse gas emissions. These commitments are referred to as Nationally Determined Contributions (NDCs). There are two types of NDC targets. Unconditional targets are those that countries have vol- unteered with no expectation for external financial and technical assistance. Conditional targets are reductions that a country lists as possible with external assistance. One of the methods for meeting NDC targets is the reduction of natural gas flaring. Flaring is a widely-used practice to dispose of natural gas in situations where there is insufficient infrastructure to use the gas locally or move it to market. The admissibility of gas flaring reductions to meet emission reduction targets traces back to the Kyoto Protocol's Clean Development Mechanism [1]. There are gas flares at oil and gas exploration and production facilities, refineries, liquid natural gas terminals, and industrial sites such as coal mines and landfills. A recent study [2] found that 90% * Corresponding author. E-mail addresses: [email protected] (C.D. Elvidge), mbazilian@worldbank. org (M.D. Bazilian). Contents lists available at ScienceDirect Energy Strategy Reviews journal homepage: www.ees.elsevier.com/esr https://doi.org/10.1016/j.esr.2017.12.012 2211-467X/Published by Elsevier Ltd. This is an open access article under the CC BY license (http://creativecommons.org/licenses/by/4.0/). Energy Strategy Reviews 20 (2018) 156e162
-
Upload
khangminh22 -
Category
Documents
-
view
1 -
download
0
Transcript of The potential role of natural gas flaring in meeting greenhouse ...

lable at ScienceDirect
Energy Strategy Reviews 20 (2018) 156e162
Contents lists avai
Energy Strategy Reviews
journal homepage: www.ees.elsevier .com/esr
The potential role of natural gas flaring in meeting greenhouse gasmitigation targets
Christopher D. Elvidge a, *, Morgan D. Bazilian b, Mikhail Zhizhin c, d, Tilottama Ghosh c,Kimberly Baugh c, Feng-Chi Hsu c
a Earth Observation Group, NOAA National Centers for Environmental Information, United Statesb Payne Institute, Colorado School of Mines, United Statesc Cooperative Institute for Research in the Environmental Sciences, University of Colorado, United Statesd Russian Space Science Institute, Moscow, Russian Federation
a r t i c l e i n f o
Article history:Received 2 May 2017Received in revised form22 December 2017Accepted 29 December 2017Available online 8 March 2018
Keywords:VIIRSGas flaringNightfireNationally determined contributionsUN climate agreement
* Corresponding author.E-mail addresses: [email protected] (C.D. Elv
org (M.D. Bazilian).
https://doi.org/10.1016/j.esr.2017.12.0122211-467X/Published by Elsevier Ltd. This is an open
a b s t r a c t
In this paper, we compare 2015 satellite-derived natural gas (gas) flaring data with the greenhouse gasreduction targets presented by those countries in their nationally determined contributions (NDC) underthe United Nations Framework Convention on Climate Change (UNFCCC) Paris Agreement. Convertingfrom flaring to utilization is an attractive option for reducing emissions. The analysis rates the potentialrole of reduction of gas flaring in meeting country-specific NDC targets. The analysis includes threecategories of flaring: upstream in oil and gas production areas, downstream at refineries and transportfacilities, and industrial (e.g., coal mines, landfills, water treatment plants, etc.). Upstream flaring dom-inates with 90.6% of all flaring. Global flaring represents less than 2% of the NDC reduction target.However, most gas flaring is concentrated in a limited set of countries, leaving the possibility that flaringreduction could contribute a sizeable portion of the NDC targets for specific countries. States that couldfully meet their NDC targets through gas flaring reductions include: Yemen (240%), Algeria (197%), andIraq (136%). Countries which could meet a substantial portion of their NDC targets with gas flaring re-ductions include: Gabon (94%), Algeria (48%), Venezuela (47%), Iran (34%), and Sudan (33%). On the otherhand, several countries with large flared gas volumes could only meet a small portion of their NDCtargets from gas flaring reductions, including the Russian Federation (2.4%) and the USA (0.1%). Thesefindings may be useful in guiding national level efforts to meet NDC greenhouse gas reduction targets.Published by Elsevier Ltd. This is an open access article under the CC BY license (http://creativecommons.
org/licenses/by/4.0/).
1. Introduction
There is wide consensus in the scientific community thatanthropogenic greenhouse gas emissions have begun to impact theearth's climate, and that large reductions in those emissions isrequired to constrain the adverse impacts of climate change.Worldwide, the largest source of emissions comes from the burningfossil fuels, widely consumed for electricity, heat, and trans-portation. Fossil fuels widely consumed include coal, petroleum,and natural gas.
The Paris Climate Agreement, developed under the United Na-tions Framework Convention on Climate Change (UNFCCC), came
idge), mbazilian@worldbank.
access article under the CC BY lice
into force on November 4, 2016. Under the Agreement, countrieshave presented specific actions and targets to reduce greenhousegas emissions. These commitments are referred to as NationallyDetermined Contributions (NDCs). There are two types of NDCtargets. Unconditional targets are those that countries have vol-unteered with no expectation for external financial and technicalassistance. Conditional targets are reductions that a country lists aspossible with external assistance.
One of the methods for meeting NDC targets is the reduction ofnatural gas flaring. Flaring is a widely-used practice to dispose ofnatural gas in situations where there is insufficient infrastructure touse the gas locally or move it to market. The admissibility of gasflaring reductions to meet emission reduction targets traces back tothe Kyoto Protocol's Clean Development Mechanism [1].
There are gas flares at oil and gas exploration and productionfacilities, refineries, liquid natural gas terminals, and industrial sitessuch as coal mines and landfills. A recent study [2] found that 90%
nse (http://creativecommons.org/licenses/by/4.0/).

1 Note that the CAIT and World Bank NDC data sets are now in a combined NDCPartnership tool: Climate Watch on: https://www.climatewatchdata.org/.
C.D. Elvidge et al. / Energy Strategy Reviews 20 (2018) 156e162 157
of the global flared gas volume occurs at upstream exploration andproduction facilities. This is referred to as “associated gas”, abyproduct of oil extraction, arising in part due to the change inpressure from deep underground reservoirs to the earth's surface.Natural gas dissolved in the oil at depth is released at the surface.Much of this associated gas is utilized or conserved because gov-ernments and oil companies have made substantial investments tocapture it; nevertheless, some of it is flared because of technical,regulatory, or economic constraints. As a result, thousands of gasflares at oil production sites around the globe burn approximately140 billion cubic meters (bcm) of natural gas annually, resulting innearly 300 million tons of carbon dioxide (CO2) to be emitted to theatmosphere. In terms of global warming potential, methane is28e36 times stronger than CO2. Therefore, flaring results in lesswarming impact than venting, the direct release of natural gas intothe atmosphere.
Methods for reducing gas flaring include transport as gas to amarket, conversion to a liquid fuel similar to gasoline, on-site uti-lization for heat or electric power, and reinjection into undergroundstrata. Reductions in gas flaring are an attractive option for steppingdown greenhouse gas emissions because the gas is a marketablecommodity. Utilization of the gas displaces other fossil fuels, thusreducing greenhouse gas emissions.
The World Bank supports a “zero routine flaring by 2030”initiative [3]. However, regulations on gas flaring are set at na-tional and sub-national levels. There is wide variation regardingthe permissibility of flaring, conditions under which flaring isallowed, and reporting requirements. Russian law requires theutilization of 95% of associated gas. Gas flaring is illegal inNigeria. Flaring is prohibited in Equatorial Guinea, though thegovernment can grant exemptions. Still, flaring is legal in theUSA, with state regulations setting conditions and reportingrequirements.
There is a relatively limited recent literature on satellite detec-tion of gas flaring [4e8]. There is a somewhat wider literaturelooking at the air pollution and emission impacts of flaring [9e17].And a further set of research focuses on alternatives to flaring[18e23]. NOAA's Earth Observation Group operates the only globalsatellite remote sensing program focused on gas flaring [2]. EOGproduces global flare detection data on 24 h increments usingnighttime data collected by the Visible Infrared Imaging Radiom-eter Suite (VIIRS) data. This is the VIIRS Nightfire (VNF) product[24], which was recently used to conclude that Islamic State oilproduction levels have been substantially lower than previouslyreported [25]. EOG distills full years of VNF data to estimate flaredgas volumes for individual flaring sites [2].
In this paper, we compare 2015 VIIRS-derived gas flaring esti-mates with the submitted NDC greenhouse gas reduction targets.The analysis is conducted for three types of flaring: upstream in oil/gas production, downstream at oil/gas processing and refineries,and industrial. The industrial category is defined as natural gasflaring detected outside of the upstream and downstream sets,including flaring at coal mines, landfills, water treatment plants,and ephemeral flaring in oil exploration areas. The results indicatethe potential role of gas flaring reduction in meeting country-specific targets. Section 2 describes the methods employed tosource the data. Section 3 presents results. Section 4 discusses el-ements of those results, and Section 5 concludes.
2. Methods
In this study, we use gas flaring estimates from 2015 derivedfrom data collected by the U.S National Oceanic and AtmosphericAdministration's (NOAA) Visible Infrared Imaging RadiometerSuite (VIIRS). The satellite collects both global daytime and
nighttime data at near 1 km2 resolution every 24 h. NighttimeVIIRS data are particularly well suited for detecting andmeasuringthe radiant emissions from natural gas flares due to the collectionof shortwave infrared (1.61 mm) data at night. This wavelengthcoincides with peak radiant emissions from gas flares and lies inone of the clearest atmospheric windows worldwide, ensuring ahigh degree of transmission from the flare to the satellite. Tem-perature, source size and radiant heat are calculated using phys-ical laws [24]. Gas flares can be separated from other IR emittersbased on temperature and persistence. Biomass burning and non-flaring industrial sites have temperatures in the 600e1500 Krange in VIIRS Nightfire (VNF) data. Flares have temperaturesranging from 1300 to 2200 K. If temperature ever exceeded 1600 Kthe site is labeled as a gas flare. If a site falls in the flaring tem-perature range and has two or more detections per year it is alsodeemed to be a gas flare. This persistence test filters out biomassburning, which can reach into the low temperature range of gasflares.
Flares were divided into three categories. Upstream sites weredefined as flaring sites in or near oil and gas fieldmaps from thePeace Research Institute Oslo (PRIO) [26]. Downstream flaring waslabeled primarily based on refinery and gas processing sites listedby the Oil and Gas Journal for 2015 [27]. The remaining operationalflaring sites were provisionally assigned to the industrial category,which includes gas flares at coal mines, landfills, water treatmentfacilities and other industrial sites. This labeling was confirmedthrough visual assessment of the high spatial resolution googleearth images (Fig. 1). The labels for the initial set of sites in theindustrial categoryweremodified and finalized based on this visualinspection. The 2015 analysis identified 13,605 flaring sitesworldwide, with 12,227 upstream sites, 861 downstream sites and517 industrial sites.
A calibration has been developed for estimating flared gas vol-umes in terms of methane equivalents [2] based on national levelestimates of flared gas volumes from Cedigaz [28]. The conversionfactor is derived assuming all flares have combustion efficiency of100%. Therefore, all carbon atoms in a methane (CH4) molecule areconverted to CO2 molecule. Under standard environment, which is1 atm and 25� Celsius (298 K), 1 BCM of CH4 gas is converted to1800.62 kilotons (kt) of CO2molecules. These estimates are listed asCO2 emission equivalents, the same reporting units as the NDCtargets.
NDC greenhouse gas emission targets were extracted from thesummaries extracted from two sources: the World ResourcesInstitute CAIT Climate Data Explorer [29] and the World Bank'sNationally Determined Contributions (NDCs) web site [30].1 TheNDCs indicate both unconditional and conditional greenhouse gasemission reduction targets in terms of a percentage relative to ayear in the past or a business-as-usual projection for a future year. Ifthe NDC listed the reference quantity, this number was used in ouranalysis. If the NDC did not list the reference quantity, the analysisis based on greenhouse gas emission quantities from EDGAR(Emission Database for Global Atmospheric Research) [31]. In eithercase, the target percentage was multiplied by the reference quan-tity to yield the target reduction quantity in kilotons of CO2e. Weare then able to compare the 2015 flaring versus the targetreduction quantities. This was performed for both the uncondi-tional NDC targets and the total (unconditional plus conditional)targets. For countries with flaring that do not have NDC targets, weperformed an analysis of flaring versus total greenhouse gasemissions.

Fig. 1. Examples of high spatial resolution images from the three categories of gas flares. Upstream site is in Algeria at 31.818 n, 6.232 e. Downstream site is on the southern edge ofHouston, Texas, USA at 29.717 n, 95.132 w. The image for the “industrial” category is a coal mine in China, located at 35.659 n, 112.179 e.
Fig. 2. Top 20 countries for total gas flaring in 2015.
Fig. 3. Percent of the unconditional NDC target that could be met with reductions inupstream flaring e top 20 countries.
Fig. 4. Percent of the total NDC target that could be met with reductions in upstreamflaring e top 20 countries.
Fig. 5. Percent of the unconditional NDC target that could be met with reductions indownstream flaring e top 20 countries.
C.D. Elvidge et al. / Energy Strategy Reviews 20 (2018) 156e162158
3. Results
3.1. Global flaring
Table 1 summarizes the global results on flaring emissionsversus NDC targets. Overall, upstream flaring accounts for 90.6% ofall flaring worldwide, downstream 8.4% and industrial 0.99%. This isin line with the findings from the 2015 study [2]. The estimatedtotal emissions from flaring in 2015 is 285,347 kt of CO2 equiva-lents. This represents 1.86% of the unconditional NDC target and1.46% of the total NDC target. The upstream flaring would cover
1.69% of the unconditional and 1.32% of the total NDC target.Downstream flaring could cover 0.16% of the unconditional and0.12% of the total NDC target. The industrial category could coveronly a very small part of the NDC targetse0.018% of the uncondi-tional and 0.01% of the total NDC target.
3.2. National results for upstream flaring
In 2015, upstream gas flaring was detected in 88 countries(Table 2). The vast majority of gas flaring is concentrated in alimited set of countries (Fig. 2). 85% of the 2015 flaring is

Fig. 6. Percent of the total NDC target that could be met with reductions in down-stream flaring e top 20 countries.
C.D. Elvidge et al. / Energy Strategy Reviews 20 (2018) 156e162 159
concentrated in twenty countries. Russia leads here, with 38,047 ktof emissions from flaring. There is a relatively rapid fall off for thenext eight countries e Iraq, Iran, USA, Venezuela, Algeria, Nigeria,Mexico and Angola. After this the next eleven countries are in the3000 to 6000 kt range (Kazakhstan, Malaysia, Egypt, Indonesia,Oman, Libya, India, Saudi Arabia, China, Turkmenistan and Canada).
The 2015 gas flaring emissions were compared against uncon-ditional and total NDC reduction targets. Fig. 3 shows that threecountries could meet 100% of their unconditional NDC targets byreducing upstream flaring e Yemen (230%), Algeria (166%) and Iraq(156%). Two countries could meet more than 90% of their uncon-ditional targets with upstream flaring e Iran (95%) and Gabon(94%). After this there is a 70% drop down to Ecuador, which couldmeet 24% of their unconditional target with upstream flaring.Countries that could meet 5e20% of their unconditional targetsinclude Uzbekistan, Kazakhstan, Cameroon, Tunisia, Chad, Angola,Nigeria, Ivory Coast and Malaysia.
The rankings change when the total NDC targets are considered- conditional and unconditional (Fig. 4). The leading countries hereare Oman (236%) and Equatorial Guinea (187%), countries that onlyhave conditional NDC targets. Iraq drops from 156% for uncondi-tional to 135% for the total NDC target. Gabon has no conditionaltarget, so its ranking stays at 94%. Countries that could meet asubstantial portion of their total NDC target from upstream flaringinclude Venezuela, Algeria, Sudan and Iran. Countries that couldmeet 5e20% of their total NDC target include Uzbekistan, Yemen,Cameroon, Congo, Ecuador, Kazakhstan and Ivory Coast.
Table 1Global results comparing gas flaring to NDC reduction targets.
Global emissions (ktCO2e) 45,366,440Conditional % 9.35%Unconditional % 33.80%Conditional reduction target (ktCO2e) 4,243,761Unconditional reduction target (ktCO2e) 15,335,069Total NDC reduction target (ktCO2e) 19,578,831Total flaring (ktCO2e) 285,347% of Total NDC target for total flaring 1.46%% of Unconditional NDC target for total flaring 1.86%Upstream flaring (ktCO2e) 258,579% of Total NDC target for upstream 1.32%% of Unconditional NDC target for upstream 1.69%Downstream (ktCO2e) 23,953% of Total NDC target for downstream 0.12%% of Unconditional NDC target for downstream 0.16%Industrial flaring (ktCO2e) 2814% Total NDC for industrial flaring 0.014%% Unconditional NDC for industrial flaring 0.018%
3.3. National results for downstream flaring
Only two countries could meet a substantial portion of theirunconditional NDC targets by reducing downstream gas flaringdYemen (40%) and Algeria (30%) (Fig. 5). Four countries couldmeet 2e8% of their unconditional targets with downstreamflaringdIran (8%), Senegal (6.4%), Sri Lanka (4.6%), Trinidad andTobago (2.7%).
When downstream flaring is considered vis-�a-vis the total NDCreduction targets all the numbers are less than 10% (Fig. 6). Theleading country in terms of meeting the total NDC target fromdownstream flaring is Equatorial Guinea (9.99%). This is followedby Algeria (7.2%), Venezuela (4.2%), Oman (3.4%), Yemen (2.9%), Iran(2.7%), Trinidad and Tobago (1.8%), and Iraq (1.5%).
3.4. National results for industrial flaring
Reductions in industrial flaring could meet about 4% of theunconditional reduction targets for two countries: Algeria (4.1%)and Bosnia and Herzegovina (3.8%) (Fig. 7). After these two, all ofthe other countries fall below 0.3%. For the total NDC targets (Fig. 8),only three countries fall near 1% - Bosnia and Herzegovina (1.5%),Algeria (1%), and Venezuela (0.86%). None of the other countriesreach 0.1%.
3.5. National results for total flaring
The greenhouse gas emissions for all flaring is calculated byadding the emission estimates for upstream, downstream and in-dustrial flaring. The results for unconditional NDC targets (Fig. 9)look quite similar to those from upstream flaring, with threecountries having the potential to exceed their targets throughflaring reduction e Yemen (271%), Algeria (200%) and Iraq (158%).Each of these is notched up from the upstream numbers because ofthe addition of a substantial amount of downstream flaring.
For the total NDC targets (Fig. 10), again the results are quitesimilar to the upstream flaring results. Countries with the potentialto meet their total NDC reduction targets from gas flaring re-ductions include Oman (240%), Equatorial Guinea (197%), Iraq(137%) and Iran (103%). Gabon (94%) comes close to having enoughgas flaring to meet their total NDC reduction target. Countries thatcouldmeet nearly half of their total reduction target include Algeria(48%) and Venezuela (47%). Countries that could meet one third oftheir total emission reduction targets with gas flaring reductionsinclude Iran (34%) and Sudan (34%). Countries that could meet5e20% of their total NDC target include Yemen (19%), Uzbekistan
Fig. 7. Percent of the unconditional NDC target that could be met with reductions inindustrial flaring e top 20 countries.

Fig. 8. Percent of the total NDC target that could be met with reductions in industrialflaring e top 20 countries.
Fig. 9. Percent of the unconditional NDC target that could be met with reductions intotal flaring e top 20 countries.
Fig. 10. Percent of the total NDC target that could be met with reductions in totalflaring e top 20 countries.
Fig. 11. Gas flaring as a percentage of total emissions for signatories who have notestablished NDC target levels.
C.D. Elvidge et al. / Energy Strategy Reviews 20 (2018) 156e162160
(19%), Cameroon (15%), Congo (11%), Ecuador (8%), Ivory Coast (7%)and Kazakhstan (7%).
3.6. Countries with no NDC
A limited set of the signatories have submitted NDCs withoutquantified emission targets, including several countries with
substantial flaring. By calculating the flared gas percentage of thereference emissions it is possible to examine the potential for thesecountries to reduce greenhouse gas emissions through utilizationof gas currently flared (Fig. 11). The three leading countries here areTimor Leste, Turkmenistan, and Libya. Even in these countries thepotential for meeting any future NDC target is modest, in the rangefrom seven to ten percent.
4. Discussion
There is wide variation in the percentage of the NDC targets thatcould be met by a reduction of gas flaring. Russia and the USA areamong the largest gas flaring nations, yet the flaring accounts forless than 2% of their NDC targets. In contrast, Iraq has the secondlargest flared gas volume, which could cover their NDC target morethan two times. Three variables go into the calculation, the totalgreenhouse gas emission in the reference year, the percentage ofthe NDC target, and flared gas emissions. For the 20 leading gasflaring countries, the percentage of the unconditional NDC target isa leading determiner of the percentage of the NDC target that canbe met with gas flaring reduction (Fig. 12). The oil-producingcountries with low NDC target percentages have the highest po-tential to meet those targets with gas flaring reductions. Russia is ina class of its own, committing to a 70% reduction in greenhouse gasemissions from a base year of 1990. As a result, the potentialcontribution of gas flaring reduction is quite low, only 1.52%,despite the fact that Russia is the leading country in terms of flaredgas volume. For the USA, with a 30% reduction target, gas flaringreduction potential contribution to the target is only a tenth of apercent.
5. Conclusions
Globally, flaring reductions could provide less than 2% of theemission reductions presented in the NDCs, 1.86% and 1.46% forunconditional and total NDC reduction targets respectively. Withinan individual country the potential to meet NDC targets varies as afunction of the flared gas volume, total projected emissions and theNDC goal as a % of total projected emissions. In general, gas flaringreduction has low potential to meet NDC targets in countries withhigh projected emissions, even if there are substantial amounts ofgas flaring. This includes leading gas flaring countries such asRussia and the USA. The converse to this is countries that havesubstantial amounts of gas flaring and low NDC target. Mostcountries will inevitably need to develop amix of reduction sources
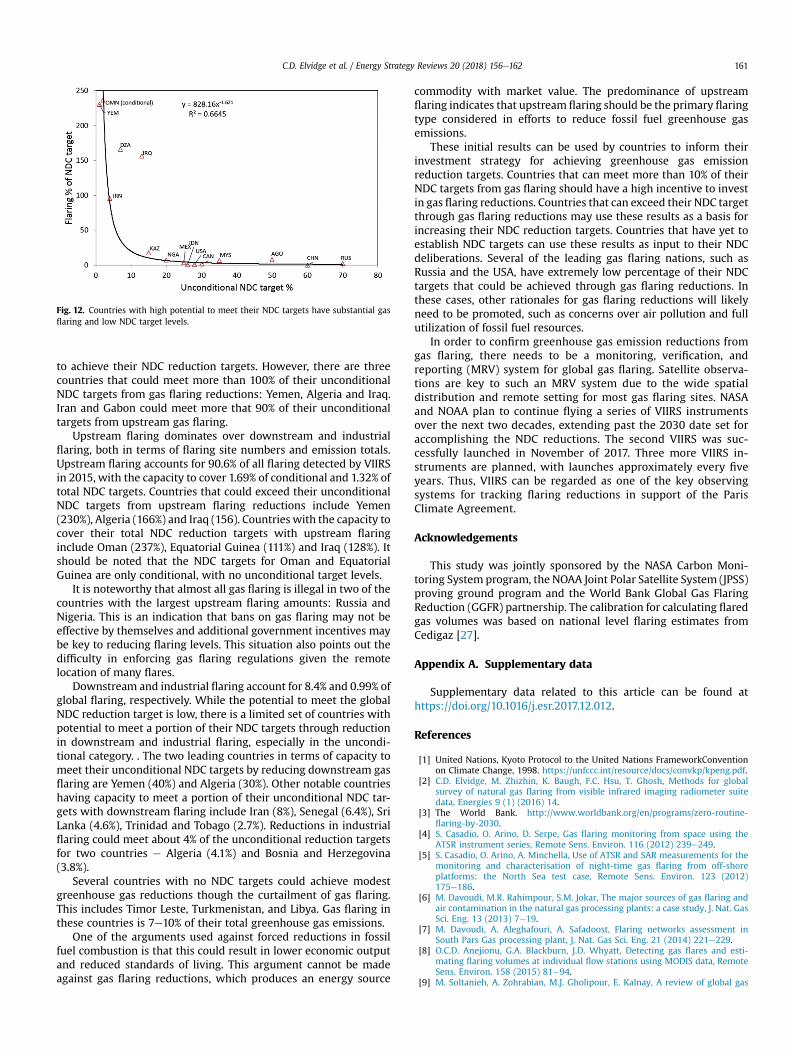
Fig. 12. Countries with high potential to meet their NDC targets have substantial gasflaring and low NDC target levels.
C.D. Elvidge et al. / Energy Strategy Reviews 20 (2018) 156e162 161
to achieve their NDC reduction targets. However, there are threecountries that could meet more than 100% of their unconditionalNDC targets from gas flaring reductions: Yemen, Algeria and Iraq.Iran and Gabon could meet more that 90% of their unconditionaltargets from upstream gas flaring.
Upstream flaring dominates over downstream and industrialflaring, both in terms of flaring site numbers and emission totals.Upstream flaring accounts for 90.6% of all flaring detected by VIIRSin 2015, with the capacity to cover 1.69% of conditional and 1.32% oftotal NDC targets. Countries that could exceed their unconditionalNDC targets from upstream flaring reductions include Yemen(230%), Algeria (166%) and Iraq (156). Countries with the capacity tocover their total NDC reduction targets with upstream flaringinclude Oman (237%), Equatorial Guinea (111%) and Iraq (128%). Itshould be noted that the NDC targets for Oman and EquatorialGuinea are only conditional, with no unconditional target levels.
It is noteworthy that almost all gas flaring is illegal in two of thecountries with the largest upstream flaring amounts: Russia andNigeria. This is an indication that bans on gas flaring may not beeffective by themselves and additional government incentives maybe key to reducing flaring levels. This situation also points out thedifficulty in enforcing gas flaring regulations given the remotelocation of many flares.
Downstream and industrial flaring account for 8.4% and 0.99% ofglobal flaring, respectively. While the potential to meet the globalNDC reduction target is low, there is a limited set of countries withpotential to meet a portion of their NDC targets through reductionin downstream and industrial flaring, especially in the uncondi-tional category. . The two leading countries in terms of capacity tomeet their unconditional NDC targets by reducing downstream gasflaring are Yemen (40%) and Algeria (30%). Other notable countrieshaving capacity to meet a portion of their unconditional NDC tar-gets with downstream flaring include Iran (8%), Senegal (6.4%), SriLanka (4.6%), Trinidad and Tobago (2.7%). Reductions in industrialflaring could meet about 4% of the unconditional reduction targetsfor two countries e Algeria (4.1%) and Bosnia and Herzegovina(3.8%).
Several countries with no NDC targets could achieve modestgreenhouse gas reductions though the curtailment of gas flaring.This includes Timor Leste, Turkmenistan, and Libya. Gas flaring inthese countries is 7e10% of their total greenhouse gas emissions.
One of the arguments used against forced reductions in fossilfuel combustion is that this could result in lower economic outputand reduced standards of living. This argument cannot be madeagainst gas flaring reductions, which produces an energy source
commodity with market value. The predominance of upstreamflaring indicates that upstream flaring should be the primary flaringtype considered in efforts to reduce fossil fuel greenhouse gasemissions.
These initial results can be used by countries to inform theirinvestment strategy for achieving greenhouse gas emissionreduction targets. Countries that can meet more than 10% of theirNDC targets from gas flaring should have a high incentive to investin gas flaring reductions. Countries that can exceed their NDC targetthrough gas flaring reductions may use these results as a basis forincreasing their NDC reduction targets. Countries that have yet toestablish NDC targets can use these results as input to their NDCdeliberations. Several of the leading gas flaring nations, such asRussia and the USA, have extremely low percentage of their NDCtargets that could be achieved through gas flaring reductions. Inthese cases, other rationales for gas flaring reductions will likelyneed to be promoted, such as concerns over air pollution and fullutilization of fossil fuel resources.
In order to confirm greenhouse gas emission reductions fromgas flaring, there needs to be a monitoring, verification, andreporting (MRV) system for global gas flaring. Satellite observa-tions are key to such an MRV system due to the wide spatialdistribution and remote setting for most gas flaring sites. NASAand NOAA plan to continue flying a series of VIIRS instrumentsover the next two decades, extending past the 2030 date set foraccomplishing the NDC reductions. The second VIIRS was suc-cessfully launched in November of 2017. Three more VIIRS in-struments are planned, with launches approximately every fiveyears. Thus, VIIRS can be regarded as one of the key observingsystems for tracking flaring reductions in support of the ParisClimate Agreement.
Acknowledgements
This study was jointly sponsored by the NASA Carbon Moni-toring System program, the NOAA Joint Polar Satellite System (JPSS)proving ground program and the World Bank Global Gas FlaringReduction (GGFR) partnership. The calibration for calculating flaredgas volumes was based on national level flaring estimates fromCedigaz [27].
Appendix A. Supplementary data
Supplementary data related to this article can be found athttps://doi.org/10.1016/j.esr.2017.12.012.
References
[1] United Nations, Kyoto Protocol to the United Nations FrameworkConventionon Climate Change, 1998. https://unfccc.int/resource/docs/convkp/kpeng.pdf.
[2] C.D. Elvidge, M. Zhizhin, K. Baugh, F.C. Hsu, T. Ghosh, Methods for globalsurvey of natural gas flaring from visible infrared imaging radiometer suitedata, Energies 9 (1) (2016) 14.
[3] The World Bank. http://www.worldbank.org/en/programs/zero-routine-flaring-by-2030.
[4] S. Casadio, O. Arino, D. Serpe, Gas flaring monitoring from space using theATSR instrument series, Remote Sens. Environ. 116 (2012) 239e249.
[5] S. Casadio, O. Arino, A. Minchella, Use of ATSR and SAR measurements for themonitoring and characterisation of night-time gas flaring from off-shoreplatforms: the North Sea test case, Remote Sens. Environ. 123 (2012)175e186.
[6] M. Davoudi, M.R. Rahimpour, S.M. Jokar, The major sources of gas flaring andair contamination in the natural gas processing plants: a case study, J. Nat. GasSci. Eng. 13 (2013) 7e19.
[7] M. Davoudi, A. Aleghafouri, A. Safadoost, Flaring networks assessment inSouth Pars Gas processing plant, J. Nat. Gas Sci. Eng. 21 (2014) 221e229.
[8] O.C.D. Anejionu, G.A. Blackburn, J.D. Whyatt, Detecting gas flares and esti-mating flaring volumes at individual flow stations using MODIS data, RemoteSens. Environ. 158 (2015) 81e94.
[9] M. Soltanieh, A. Zohrabian, M.J. Gholipour, E. Kalnay, A review of global gas

C.D. Elvidge et al. / Energy Strategy Reviews 20 (2018) 156e162162
flaring and venting and impact on the environment: case study of Iran, Int. J.Greenh. Gas Con 49 (2016) 488e509.
[10] V. Rao, R. Knight, Fugitive Methane and Emissions From Flaring, in:B.R. Thomas (Ed.), Sustainable Shale Oil and Gas, Elsevier, Amsterdam,Netherlands, 2016, pp. 9e27.
[11] G.E. Umukoro, O.S. Ismail, Modelling emissions from natural gas flaring, J KingSaud U. Eng Sci. 29 (2) (2017) 178e182.
[12] A. Hassan, R. Kouhy, Gas flaring in Nigeria: analysis of changes in its conse-quent carbon emission and reporting, Account. Forum 37 (2) (2013) 124e134.
[13] S.O. Giwa, O.O. Adama, O.O. Akinyemi, Baseline black carbon emissions for gasflaring in the Niger Delta region of Nigeria, J. Nat. Gas Sci. Eng. 20 (2014)373e379.
[14] O.C.D. Anejionu, J.D. Whyatt, G.A. Blackburn, C.S. Price, Contributions of gasflaring to a global air pollution hotspot: spatial and temporal variations, im-pacts and alleviation, Atmos. Environ. 118 (2015) 184e193.
[15] D.T. Allen, D. Smith, V.M. Torres, F.C. Saldana, Carbon dioxide, methane andblack carbon emissions from upstream oil and gas flaring in the United States,Curr. Opin. Chem. Eng 13 (2016) 119e123.
[16] O.G. Fawole, X.M. Cai, A.R. MacKenzie, Gas flaring and resultant air pollution: areview focusing on black carbon, Environ. Pollut. 216 (2016) 182e197.
[17] O.S. Ismail, G.E. Umukoro, Modelling combustion reactions for gas flaring andits resulting emissions, J. King Saud U. Eng. Sci. 28 (2) (2016) 130e140.
[18] M.R. Rahimpour, A. Ghorbani, A. Asiaee, A. Shariati, Conversion of refinerynatural purge gases to liquid hydrocarbons in GTL loop with hydrogen-permselective membranes: an alternative to gas flaring, J. Nat. Gas Sci. Eng.3 (3) (2011) 461e475.
[19] M.R. Rahimpour, S.M. Jokar, Feasibility of flare gas reformation to practicalenergy in Farashband gas refinery: No gas flaring, J. Hazard Mater. 209e210(2012) 204e217.
[20] J.S.P. Loe, O. Ladehaug, Reducing gas flaring in Russia: gloomy outlook in timesof economic insecurity, Energy Pol. 50 (2012) 507e517.
[21] Z. Ma, C. Trevisanut, C. Neagoe, D.C. Boffito, S.M. Jazayeri, C. Jagpal,G.S. Patience, A micro-refinery to reduce associated natural gas flaring, Sus-tain. Cities Soc. 27 (2016) 116e121.
[22] E. Ojijiagwo, C.F. Oduoza, N. Emekwuru, Economics of gas to wire technologyapplied in gas flare management, Eng. Sci. 19 (4) (2016) 2109e2118.
[23] N. Tahouni, M. Gholami, M.H. Panjeshahi, Integration of flare gas with fuel gasnetwork in refineries, Energy 111 (2016) 82e91.
[24] C.D. Elvidge, M. Zhizhin, F.-C. Hsu, K.E. Baugh, VIIRS Nightfire: satellite py-rometry at night, Rem. Sens. 5 (2013) 4423e4449.
[25] Q.-T. Do, J.N. Shapiro, C.D. Elvidge, M. Abdel-Jelil, D.P. Ahn, K. Baugh,J. Hansen-Lewis, M. Zhizhin, How much oil is the Islamic state Group Pro-ducing? : evidence from remote sensing, Policy Research Working Paper;No.8231, World Bank, Washington, DC, 2017. ©World Bank, https://openknowledge.worldbank.org/handle/10986/28617 License: CC BY 3.0 IGO.
[26] The Peace Research Institute Oslo (PRIO) Petroleum Dataset. https://www.prio.org/Data/Geographical-and-Resource-Datasets/Petroleum-Dataset/.
[27] Oil and Gas Journal, Worldwide refining and worldwide gas processing.http://www.ogj.com/ogj-survey-downloads.html, 2016.
[28] Cedigaz National Flared Gas Volumes. http://www.cedigaz.org/products/annual-surveys-2016.aspx. (Accessed 2 May 2017).
[29] World Resources Institute CAIT Climate Data Explorer. http://www.wri.org/resources/data-sets/cait-paris-contributions-data. (Accessed 2 May 2017).
[30] World Bank’s Nationally Determined Contributions (NDCs) web site. http://spappssecext.worldbank.org/sites/indc/Pages/INDCHome.aspx. (Accessed 2May 2017).
[31] J.G.J. Olivier, G. Janssens-Maenhout, M. Muntean, J.A.H.W. Peters, Trends inGlobal CO2 Emissions: 2016 Report, PBL Netherlands Environmental Assess-ment Agency, The Hague, PBL publication number: 2315. European Com-mission, Joint Research Centre, Directorate Energy, Transport & Climate, JRCScience for Policy Report: 103428, 2016.