Guidelines for Experimental Practice in Organic Greenhouse ...
12
Research Research COST is supported by the EU Framework Programme Horizon 2020 Edited by Martin Koller, Francis Rayns, Stella Cubison and Ulrich Schmutz Guidelines for Experimental Practice in Organic Greenhouse Horticulture
-
Upload
khangminh22 -
Category
Documents
-
view
1 -
download
0
Transcript of Guidelines for Experimental Practice in Organic Greenhouse ...

ResearchResearcResearcResearcResearcResearcResearcResearcResearchResearcResearchResearcResearcResearcCOST is supported bythe EU Framework ProgrammeHorizon 2020
Edited by Martin Koller, Francis Rayns, Stella Cubison and Ulrich Schmutz
Guidelines for Experimental Practice in Organic Greenhouse Horticulture

April 11, 2016
AcknowledgementThis book is based upon work from COST Action FA1105 BioGreenhouse, supported by COST (European Cooperation in Science and Technology).
The authors and editors wish to thank many colleagues for their assistance in providing the material for these guidelines. In addition Rob Meijer (Chair, COST Action FA1105 Biogreenhouse), Karin Postweiler (DLR Rheinpfalz, Germany), Birgit Rascher (LWG Bayern, Germany) and Catherine Mazollier (GRAB, France) provided critical comments on the text. We want to thank Ms. José Frederiks (Wageningen UR Greenhouse Horticulture) for processing layout and printing. We are grateful for financial support and the opportunity to build this network. Link to the Action: http://www.cost.eu/COST_Actions/fa/FA1105 and: http://www.biogreenhouse.org/
The Editorial Board This picture was taken at the final meeting to discuss these guidelines, held in Tori, Estonia in September 2015. A commercial organic greenhouse with a tomato crop is shown in the background. Left to Right: Pedro Gomez, Stella Cubison, Wolfgang Palme, Justine Dewitte, Martin Koller, Yüksel Tüzel, Francis Rayns, Ingrid Bender and Ulrich Schmutz.
Correct citation of this document:Koller, M., Rayns, F., Cubison, S. and Schmutz, U. (Editors) 2016. Guidelines for Experimental Practice in Organic Greenhouse Horticulture. BioGreenhouse COST Action FA 1105, www.biogreenhouse.org.
ISBN: 978-94-6257-534-9DOI (Digital Object Identifier): http://dx.doi.org/10.18174/373581
The guidelines were initially based on the following publication with many new chapters contributed by European and international authors:Lindner, Ulrike and Billmann, Bettina (Eds.) 2006. Planung, Anlage und Auswertung von Versuchen im Ökologischen Gemüsebau. Handbuch für die Versuchsanstellung [“Planning, Setup and Evaluation of Trials on Organic Vegetable Cultivation. An Experimental Design Manual“]. Forschungsinstitut für biologischen Landbau (FiBL), Frick, Schweiz und Frankfurt, Deutschland, ISBN 978-3-906081-97-7, http://orgprints.org/9863. PicturesAll pictures are by members of the Biogreenhouse COST Action FA1105. Contributors to the pictures (in alphabetical order) are: Ingrid Bender, Stella Cubison, Justine Dewitte, Pedro Gomez, Martin Koller, Carolyn Mitchell, Jérôme Lambion, Wolfgang Palme, Virginia Pinillos, Ulrich Schmutz, Yüksel Tüzel and Anja Vieweger.
DisclaimerThe information in these guidelines is based on the expert opinions of the various authors. Neither they, nor their employers, can accept any responsibility for loss or damage occurring as a result of following the information contained in these guidelines.

Guidelines for Experimental Practice | 13
2 Trials in Organic Horticulture
By Martin Koller, Francis Rayns and Ulrich Schmutz
Apre-conditionfortrialsconcerningorganicvegetableandfruitcropsistheEUregulation834/2007onorganicfarming, or any other equivalent regulation in countries outside the EU. Inside the EU, in addition to the public(legallybinding)EUstandard,privatestandardsofcertificationbodiesdefiningorganicorbio-dynamicproductionarealsorelevant.Researchshouldalwaysbeconductedonwell-establishedorganicland(ideallyconverted for at least 5 years), and the history of conversion should be documented in the Materials and Methods section of any report (for research studying the process of conversion this is obviously not applicable).
If the research involves methods and products which are currently not part of organic standards (public or private)theprotocolhastobediscussedwiththecertificationbodyfirst.Inthecaseofon-farmtrialsthefarmeralsoneedstobeinvolved.Priorapprovalfromthecertificationbodyandwrittendocumentationontheextentofthe trials and the new methods tested should always be kept.
2.1 Separation from conventional cropping
Inanyorganicresearchcarehastobetakentoavoidtheinfluenceofanyadjacentconventionalfarmingorhorticulture-forexamplespraydriftofherbicidesorotherpesticides.Foroutsidecroppingadistanceof10morahighphysicalbarrier(suchasamaturehedge,stonefieldwallorsolidwoodenfenceisacceptedassufficient).Theissueisoflesssignificanceinprotectedhorticulturebutconsiderationneedstobegiventothedangerofcontamination through windows open for ventilation etc.
2.2 Crop rotation and plant material
The guidance given in the organic standards on crop rotation, the use of green manures and other good practice in organic soil care should also be used for all organic research trials and this includes those in polytunnels and greenhouses. The full crop rotation history for at least 3 years, including any fallow periods should always described in the Materials and Methods of the trial reports. If trials use potted plants or nursery stock details of the origin and composition of the growing media are important. Seeds and transplants should be from an organic source.Ifnoneareavailableaderogationfromthecertificationbodyisoftenrequiredandconventionalseedswithout chemical seed treatments are usually acceptable.
The crop grown immediately before the trial should be as uniform as possible and any plants propagated for the trial should be equally treated under the same standardised nursery conditions as documented in the Materials and Methods. For organic fertiliser trials the land should be cropped for at least 2 years beforehand with high nutrient demanding crops (and the crop residues removed) in order to deplete the fertility.
Themicroclimatehasanimportanteffectoncropperformance.Thisisnotonlythecaseinthefieldbutisparticularly important in polytunnels and greenhouses. Factors include the effects of walls, heating pipes, positionoftheplants(inthemiddleorendofthehouse),generalsettingofthehouse(inanorth-southoreast-west direction), temperature of the irrigation water and radiation from different surface materials.
2.3 Trial designs
Thereisnormallyadistinctionbetween‘demonstration’and‘scientific’trials.Theformerareoftenunreplicatedand are therefore smaller, easier (and cheaper) to run and may be linked to open day events aimed at farmers or apilotstudyinadvanceformoredetailedwork.Resultsfromsuchtrialsarenotusuallyacceptableforscientificpublication where replication allows statistical analysis to be performed to show that any differences between treatments are not just due to random variations in the experimental area.

14 | Guidelines for Experimental Practice
Despite care full homogeneity can rarely be achieved and any known gradients should be incorporated into thetrialdesign.Thiscanbedonebyhavingrandomizedblockswithalltreatmentsplacedalongthegradientorgradientsofchange(seesection2.3.5).Ahighernumberofreplicationscanalsobeusedifthefieldorgreenhouse is very heterogenic.
Border plants, strips or plots (‘guard areas’) can be used to separate the research trial area from other land butalsotoseparatedifferenttreatments.Theappropriatesizeoftheborderdependsontheresearchquestion.Variety trials usually require no borders between treatments unless plants with different harvest times are tested.Forfertiliser,plantprotectionandirrigationtrials(especiallyifthesearerunforseveralyears)asufficientborder between treatments is necessary to avoid one plot affecting its neighbours (perhaps as a result of mixing of soil during cultivations).
2.3.1 Plots and treatments
A trial plot is the smallest unit of land to which a particular experimental treatment is applied. It can contain many plants, or in case of trees, may only include a few. The plots should be clearly labelled and a plan, with referencetoexternallandmarks,bekeptincasethefieldlabelsarelostordisplaced.
Ifbordersor‘guardareas’arenecessarytheplotconsistsofacore-plot(surroundedbytheborder)andthetotal-plot,whichincludestheborder.Theremaybeadditionaluncroppedpathwaysbetweentheplotsforaccess.Theplotyieldcanbemeasuredasthesumoftheindividualplantsinthecore-plotorasthetotalyieldofthecore-plotwithoutseparatingindividualplants.Insomecircumstancesmeasuringtheyieldofthetotal-plotmayalso useful to assess the effect the border had on the research design.
Therecommendationfortheminimumcore-plotsize(andthenumberofplantsitshouldcontain)isgivenforeachspeciesinChapter4.Thissizeisimportantandiftheresearcheffort/fundingislimitedthenumberoftreatmentsshouldbereducedrathertheminimumplotsizeorminimumnumberofreplications
Allplotsshouldideallybethesamesize.Ifthisisnotpossiblethedifferencesneedtobeincludedintheyield calculations and this should be clearly documented in the Material and Methods section of the report. In greenhousesandpoly-tunnelsplotscanbepositionedalongthemainhousedirectionoracrossit.Usuallylongnarrow plots are easier to work with especially for tomatoes, peppers and cucumbers.
A ‘treatment’ or ‘variant’ is the term used to describe each thing that is varied within an experiment. Experimental treatments could, for example, be different varieties or different rates of fertiliser application. Normally there are only one set of treatments in a trial – this is known as a monofactorial experiment. Multifactorial experiments are also possible but are more complicated, larger and so more expensive. An example of a multifactorial experiment would be one to compare both the type and application rate of fertilisers.
2.3.2 Controls and other comparisons
Controlsareusuallyun-treatedvariantsofatrial–theyareimportantasareferencepointandnecessaryinnearlyalltrialdesigns.Itmustbeclearlyspecifiedwhatuntreatedmeansinrelationtotheothertreatments.Acontrolcanbeastandardwell-knownvarietyorastandardfertiliserandthemeasuredeffectscanbecalculatedand presented in relation to the control. This gives farmers and growers a familiar reference point to relate the result to.
If the test product is applied in water or together with a surfactant or other additive the experiment should include a control with only water and a second control with water and surfactant (without the test product). Anywatershouldalsohavethesametemperatureandpre-treatment(e.g.stirring)tomakethetreatmentsascomparable as possible.

Guidelines for Experimental Practice | 15
2.3.3 Replications and randomisation
For statistical validity each variant or treatment should be replicated. A trial with no replications is called ‘demonstrationtrial’;itcanhavevalueasademonstrationtofarmersandgrowersandproof-of-conceptresearch;astatisticalanalysisisnotpossible.Croptrialshaveusually3-6replicationsandwithmorereplicationsmorestatisticallysignificantresultscanbemeasured.However,thecostofthetrialalsoincreasesasitbecomeslarger and more time consuming to conduct. For a one factorial trial four replicates may be considered typical. Statistical analysis is still possible with three replicates but more allows more subtle effects to be detected and gives a degree of security in case one of the replicates is unusable (e.g. due to pest damage). All variants are usually grouped in blocks. A complete block design has each variant once in the block, and the number of blocks is equivalent to the replications of the experiment. Within a block the treatments need to be randomised allocated – this can be done using an electronic random number generator or simply dice. The block locationitselfcanalsoberandomized.Ifthereisaknowngradientacrossthesite(e.g.ofsoilfertility)thentheblocks should be laid out at right angles to this.
2.3.4 Fully randomised design
This is illustrated in Figure 2.1. It is quite possible that two randomly allocated treatments will appear next to oneanother;thisisthecasefor3inthefirstcolumnofthisexample.Forfieldtrialsacompletelyrandomiseddesignisoftennotusefulasknowndifferencesarenotaccountedforineitherfieldsorglasshouses.Onlyintrialswith pot plants in uniform growth chambers is this not an issue.
3 III 5 II 6 IV 5 IV
1 II 4 I 6 I 1 III
4 II 3 IV 2 II 6 II
3 II 4 IV 2 I 5 I
3 I 2 III 1 IV 5 III
4 III 2 IV 6 III 1 I
Figure 2.1 Fully randomised design with 6 treatments (1-6) and 4 replications (I-IV).
2.3.5 Block design
Theblockdesignislikelytobethebestdesignformostresearchquestionsinagreenhouseorpoly-tunnel.Eachreplication block should have the same conditions inside the block and with a two way analysis of variance the ‘block-effect’canberemovedfromtheanalysis.
Thetreatmentsinsidetheblockshouldideallyberandomizedbutoften‘Block-1’isorderedsimplyfrom1to6asthis gives the advantage of having an easily understood demonstration row of plots for visitors (see Figure 2.2). Sometimesanon-randomisedblockdesignisused.Thisistypicalofplantvarietyandbreedingtrialswheretheremay be a lot of varieties (perhaps as many as 20) in each replication. In such a layout it is easier to keep track of the treatments but statistical analysis of the results is not so robust. Because the same treatments are always adjacenttheremaybeaninfluenceofposition(forexampleinavarietytrialifonevarietyismuchtallerthantheothers). An example of this design is shown in Figure 2.3.

16 | Guidelines for Experimental Practice
6 I 1 II 3 III 6 IV
5 I 3 II 2 III 1 IV
4 I 4 II 5 III 2 IV
3 I 6 II 4 III 5 IV
2 I 2 II 1 III 3 IV
1 I 5 II 6 III 4 IV
Block I Block II Block III Block IV
Figure 2.2 Block design with 6 treatments (1-6) and 4 replications (I-IV) randomised in Blocks II to IV.
6 I 5 II 4 III 3 IV
5 I 4 II 3 III 2 IV
4 I 3 II 2 III 1 IV
3 I 2 II 1 III 6 IV
2 I 1 II 6 III 5 IV
1 I 6 II 5 III 4 IV
Block I Block II Block III Block IV
Figure 2.3 Block design with 6 treatments (1-6) and 4 replications (I-IV) in a fixed order.
2.3.6 Latin Square design
The Latin square, or rectangle if plots are longer then wide, is a special form of block design. With this design the effect of both block and column can be measured. For a true Latin square the number of treatments should be the same as the number of replications. Then each treatment is found once in each block and each column. If the numberofreplicationislimitedtofoura‘modified’Latinsquareispossible,howeverthisalsolimitsthepowerofthe statistical analysis considering block and row effects. An example is shown in Figure 2.4.
Block IV 4 IV 3 IV 2 IV 5 IV
3 III 2 III 1 IV 6 IV
Block III 6 III 1 III 5 III 4 III
Block II 5 II 4 II 3 II 1 II
5 I 6 I 6 II 2 II
Block I 1 I 2 I 3 I 4 I
Column A Column B Column C Column D
Figure 2.4 'Modified' Latin square with 6 treatments and 4 replications, showing four blocks (I-IV) and four columns (A-D).
2.3.7 Split plot design
This allows for the testing of two factors in combination. These are known as the main effect and the split effect. An example might be the effect of different fertilisation effects on two different varieties of a glasshouse grown crop (see Figure 2.5). Because all the different treatment combinations are not fully randomised statistical tests requiretheretobebiggereffectsbeforetheycanbeshowntobesignificant.However,splitplotdesignscanbeeasier to manage than fully factorial layouts.
Guidelines for Experimental Practice | 17
Split effect 1 Main effect 1 Main effect 2 Main effect 3 Block 1
Split effect 2 Main effect 1 Main effect 2 Main effect 3
Split effect 1 Main effect 2 Main effect 1 Main effect 3 Block 2
Split effect 2 Main effect 2 Main effect 1 Main effect 3
Split effect 1 Main effect 3 Main effect 2 Main effect 1 Block 3
Split effect 2 Main effect 3 Main effect 2 Main effect 1
Split effect 1 Main effect 1 Main effect 3 Main effect2 Block 4
Split effect 2 Main effect 1 Main effect 3 Main effect2
Figure 2.5 Layout of a split plot design with 4 replications, three main effects and two split effects.
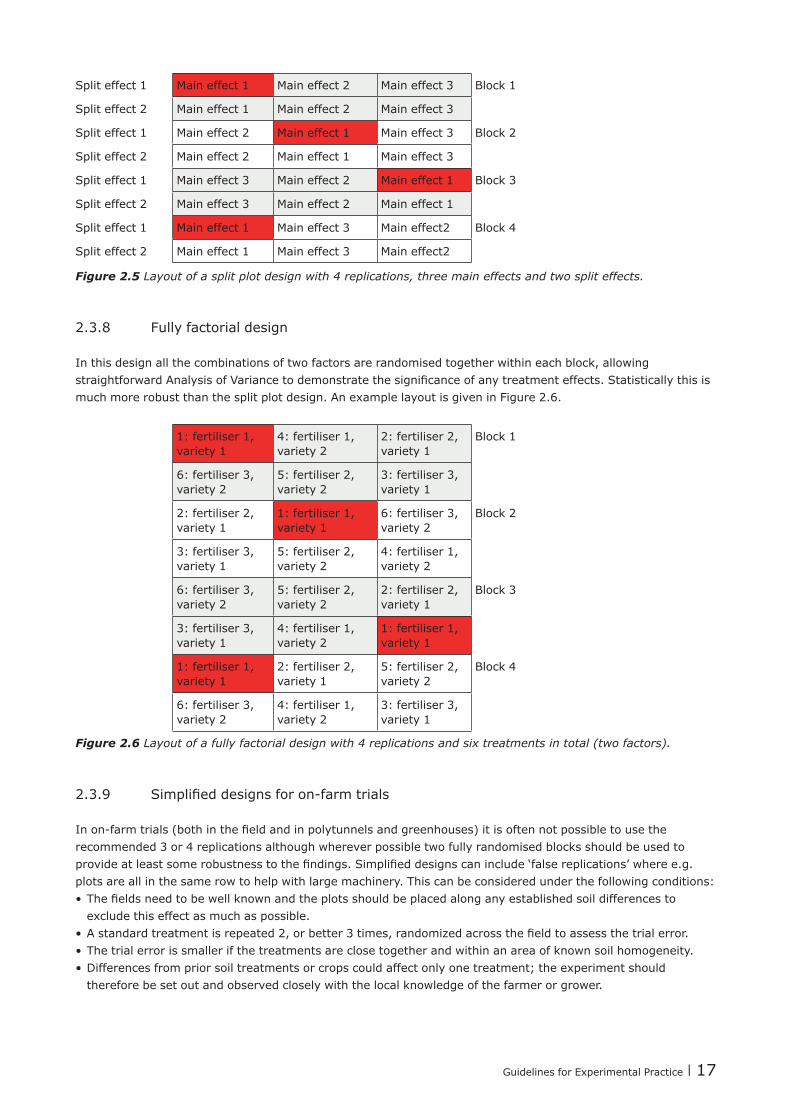
2.3.8 Fully factorial design
In this design all the combinations of two factors are randomised together within each block, allowing straightforwardAnalysisofVariancetodemonstratethesignificanceofanytreatmenteffects.Statisticallythisismuch more robust than the split plot design. An example layout is given in Figure 2.6.
1: fertiliser 1, variety 1
4: fertiliser 1, variety 2
2: fertiliser 2, variety 1
Block 1
6: fertiliser 3, variety 2
5: fertiliser 2, variety 2
3: fertiliser 3, variety 1
2: fertiliser 2, variety 1
1: fertiliser 1, variety 1
6: fertiliser 3, variety 2
Block 2
3: fertiliser 3, variety 1
5: fertiliser 2, variety 2
4: fertiliser 1, variety 2
6: fertiliser 3, variety 2
5: fertiliser 2, variety 2
2: fertiliser 2, variety 1
Block 3
3: fertiliser 3, variety 1
4: fertiliser 1, variety 2
1: fertiliser 1, variety 1
1: fertiliser 1, variety 1
2: fertiliser 2, variety 1
5: fertiliser 2, variety 2
Block 4
6: fertiliser 3, variety 2
4: fertiliser 1, variety 2
3: fertiliser 3, variety 1
Figure 2.6 Layout of a fully factorial design with 4 replications and six treatments in total (two factors).
2.3.9 Simplifieddesignsforon-farmtrials
Inon-farmtrials(bothinthefieldandinpolytunnelsandgreenhouses)itisoftennotpossibletousetherecommended 3 or 4 replications although wherever possible two fully randomised blocks should be used to provideatleastsomerobustnesstothefindings.Simplifieddesignscaninclude‘falsereplications’wheree.g.plots are all in the same row to help with large machinery. This can be considered under the following conditions:•Thefieldsneedtobewellknownandtheplotsshouldbeplacedalonganyestablishedsoildifferencesto
exclude this effect as much as possible.•Astandardtreatmentisrepeated2,orbetter3times,randomizedacrossthefieldtoassessthetrialerror.•The trial error is smaller if the treatments are close together and within an area of known soil homogeneity.•Differences from prior soil treatments or crops could affect only one treatment; the experiment should
therefore be set out and observed closely with the local knowledge of the farmer or grower.

18 | Guidelines for Experimental Practice
This approach is particularly suited to preliminary screening work, for example to see if a new crop will grow at allinaparticulararea.Iftheresultsarepromisingamoredetailedscientifictrialwithgraterreplicationcanbeset up later. During the data analysis the following considerations are important:•Analyse the repeated treatment separately. If the ‘false replications’ within one row are not statistically differentitcanbeassumedthatnomajorexternalinfluencefactorsexistandthatthedifferencesmeasuredindifferent treatments are mainly caused by the different treatments.
•Ifsignificantdifferencesarefoundbetween‘falsereplications’theinterpretationofthewholeon-farmexperiment has to be careful and descriptive, and all results of the statistical analysis have to be fully disclosed.
•If treatment data are presented in graphs the lack of a statistical analysis should be indicated in the description of the graph. If ‘false replications’ are used only mean values and standard deviation should be shown.
Additionalstatisticalanalysistoolscanbeusedifnon-replicatedon-farmtrialsareconductedovermanysitesandmultipleyears.Thisisalsothecasewhentreatmentsareincreasedinfixedsteps,e.g.compost:1t/ha,2 t/ha, 3 t/ha, 4 t/ha = four different treatments of compost with increasing tonnage per hectare. There is increasinginterestinresearchworkdoneusinga‘citizenscience’approach(seesection3.7)
2.4 Recording results
In the Materials and Methods section of any report all general information concerning the research trial must be documented. This can include location, site details (rainfall, altitude, water quality, nitrogen deposition through air, etc.), the organic status of the land, prior use, type of greenhouse, type of glass or plastic, research design, lengthandexactdatesoftrialandotherrelevantinformation.Soiltypeandresultsfromsoilsamples(macro-andmicro-nutrients)beforeandafterthetrialarealsoimportantifrelevanttotheresearchquestion.
Details on the weather conditions before and during the trial should also be provided and these include min/max soil and air temperature, sunshine hours, irradiation, humidity, wind speed. Within the greenhouse additional data on relative humidity, additional lighting type/amount, CO2 contents, heating type/source, and sun/heat screens usage are required.
For the crop cultivation as much information as possible should be recorded including, variety, rootstock, scion,sourceofplant,seed-treatments,seedingorplantingtime,typeofgrafting,plantdensity,plantingdateand further cultivation operations such as leaf pruning, weeding or pest control. Fertiliser additions should be recorded and the source, amount and method of application should be clearly documented. This also includes type of irrigation water used, any fertigation (supply of nutrients in the irrigation water), CO2 enrichments or climate control to enrich CO2.
2.4.1 Recording information
Plant records can be made by weighing, measuring heights or lengths, counting (e.g. number of stems of fruits per m² or per plant). They can also be done by rating against an agreed scale (e.g. pest per percentage of leaf area,orpercentageleafareawithsymptoms).Ratingisoftendoneonascaleof1-9(or1-5).Measurementsandratingsforaspecificrecordshouldalwaysbedonebythesamepersonforthewholetrial,asthisreducesthe overall measurement error.

Guidelines for Experimental Practice | 19
In ratings 1 is usually used for the lowest intensity of a trait and 9 for the highest. The optimal rating and the scaleused(e.g.ifshortenedto1-3-5-7-9)mustbedocumented.TheCommunityPlantVarietyOffice(CPVO, www.cpvo.europa.eu) and the International Union for the Protection of New Varieties of Plants (UPOV, www.upov.int) describes technical protocols for all the important horticultural species that include reference to such scales for a variety of characteristics. Information from both organisations is very similar but that from UPOV is available in more languages. Further details are given in the chapters for individual crops. For statistical analysis quantitative measurements are better than ratings but both give valuable information. However ratings should not be used to record information which could easily be collected by measurement (especially in the case of crop yields. Taking pictures can also help to illustrate differences. In some trials simple assessments ofphysicalparameters(e.g.fruitfirmness,colour)orchemicalparameters(e.g.sugarcontentmeasuredbyrefractometers) are worthwhile.
2.4.2 Missing values
A missing value can be the loss of a plant, a plot or even a whole block of the experiment. All missing values need to be recorded and honestly reported in the research report. The reasons for missing values can be manifoldandthemostcommononesareflooding,animalseatingcrops,applicationerrorsandlossofdata.Croplosses due to the actual treatments are not missing values.
If there are too many missing values the statistical analysis of the data is affected and a very large amount of missing values can make the whole experiment useless for statistical analysis. Under certain circumstances bordercropsoutsidethecore-plotcanbeusedintheanalysisasasubstitutebutthisisnotgoodpracticeandmust be clearly documented.
2.4.3 Harvest records
During the growing phase and at harvest all relevant biotic and abiotic stresses and damage to the plants need to be recorded. The harvest should include total yield and marketable yield, with details of the EU or other privateretailbasedtradeclassificationusedtomakethisdistinction.Themarketableyielddependsonthemarketchannelandusuallyfourtypesofmarketchannelareapplicabletoorganiccrops:directsales,small-scaleretail,supermarketsandprocessing.Whilefordirectsalesandprocessingnotradeclassificationapplies(totalyield=marketableyield)forotherchannelsthereareclearspecificationsanddifferentpricesforClass1 or Class 2 produce. It is important to record these differences as it is the marketable yield which interests farmers and growers most. Normally the whole trial should be harvested at the same time. There are exceptions however, for example if the harvest date itself is part of the research question.
2.4.4 Time measurement
If new processes or growing techniques are being researched measuring the time needed for application (including preparation time) needs to be recorded. This can be done by using stopwatches or smartphones and data can later be expressed in labour hours per m2 or hours/ha. It is important that only one person, or one team of people, makes these measurements in all the treatments.

20 | Guidelines for Experimental Practice
Example 1: Timing tomato harvest (in a trial with different plant densities)Measurements:•Harvest time (seconds)•Total number of harvested fruit•Shoots per treatment•Fruits per shoot•From this data the following can be calculated:•Harvest time per fruit (seconds)•Harvested fruit per hour•Harvested shoots per hour•Labour hours per hectare or m2
Example 2: Timingforweedcontroltreatment(inatrialtocomparefleeceversusuncoveredsoil)Measurements:•Hand weeding time (seconds)•Number of plants per plot•Number of weeds per plot•From this data the following can be calculated: •Hand weeded plants per hour•Removed weeds per hour•Labour hours per hectare or m2
For further agronomic and economic calculations data from reference material such as farm management handbookscanbeusedtoincludemachinerycosts,fertilisercostsandlabourcostsfor‘what-ifs’,i.e.ifdoneonacommercial scale and not in a plot scale. Further information on this can be found in the chapter on the economic evaluation of crop trials.
2.5 Data analysis and statistics
Data should be collected in clear record sheets (on paper or electronically) and all data must be correctly allocated to the particular treatment. Common problems are typing or reading errors, decimal points being accidently moved, double entries, missed records, rounding data or missing digits and a general lack of concentration. Human error in data recording and analysis cannot be eliminated but it can be minimised by good experimental practices.
Datacleaningandcheckingisbestdonewithinaspread-sheetsoftwareprogramme(e.g.MicrosoftExcel).Someofthemistakesdescribedabovecanbespottedinadatascreeningexercisewhereextremevaluesarecross-checked,anddatacanbesortedtofinddoubleentriesorotherunusualentries.Whenenteringdatainaspread-sheetitisusefultoimmediatelycalculatemean,median,standarddeviationandstandarderrorinpredefinedformulas, as this can give extra check on typing errors. This descriptive statistics can also give guidance on further statistical methods to be used during the analysis.
2.5.1 Plot values
Yielddatafromplotareashavetobeconvertedtostandardmetricareaunits-usually1m²,1000m²or1ha.Itisimportanttodistinguishbetweenthecore-plotareaandthetotal-plotarea.Bordersorpathwaysspecificallyassociated with an experiment have to be excluded when calculating commercial yields but access ways that are normally part of the cropping system (e.g. tractor wheelings) should be included. Usually yields per ha are appropriateforfieldcropsandsomepoly-tunnelsandyieldsperm²forgreenhousesandsomepolytunnels.

Guidelines for Experimental Practice | 21
2.5.2 Statistical analysis
The data from experimental trials are usually analysed with the ANalysis Of VAriance (ANOVA) methods. This is a collection of statistical methods to differentiate between treatment means and the variation among and betweentreatments.ThemethodwasdevelopedbyRonaldFisherandfirstpublishedinthe1920s.TheF-test,namedafterhim,isusedtofindoutifthevarianceofatreatmentisdifferenttothevarianceoftheremainder.Othertestsexistifthemeansarenot‘normally’distributed(e.g.theKruskal-Wallistest).Itmaybenecessarytomathematically‘transform’somedatasetstomakethemappropriatebeforeanalysis.FollowingontheF-test,furthertestsliketheTukey-testcanbeusedtofindmeansthataresignificantlydifferentfromeachother.Those differences are marked with different letters in graphs or tables. Further statistical tests, correlation and regression analysis are also possible if the data are suitable for such analysis.
If in doubt about the correct statistical analysis method to use it is worthwhile seeking the advice of a statistician.Thisshouldbedonebeforetheexperimenthasbeensetuptoconfirmthatthedesignisappropriateto generate the data needed to test the hypothesis.
Further informationGrafen A. And Hails R. (2002).
ModernStatisticsfortheLifeSciences.OxfordUniversitypress.ISBN978-0-19-925231-2Zar, J. H. (2010).
BiostatisticalAnalysis,5thed.,PearsonPrenticeHall,UpperSaddleRiver,NJ.ISBN:978-0-13-100846-5
2.6 Writing up an experimental report
Reportswillvarydependingontherequirementsoftheinstitutionandthefundingbodyandthesizeoftheproject;afinalreportofatrialrunningforseveralyearswillclearlycontainmoreinformationthananinterimreport. However, most reports will include the following sections that are also usually found in academic papers.
Introduction and backgroundThe focus of the introduction section of the report is the research question and how it is embedded in the background of existing knowledge. What is the framework of the research and which underlining assumptions have been made? What are the overall aims of the research, how can it contribute to new knowledge and who will use this knowledge (e.g. private companies, academic institutions, farmers and growers, consumers)?
Materials and methodsThe report should explain the choice of methods used to assess the research question and then describe the materialsandmethodsusedintheexperimentaltrialwithsufficientdetailtoenableittoberepeated:Trial design (e.g. block or Latin square), number of replications (usually called n=4 for 4 replications), plants per plot,plotsize,plantdensity,boardersandsizeofcore-plot,generalbackgroundonthesiteintermsoflocation,climate, soil, cropping history, organic status.Short but comprehensive summary of all trial details, treatments and operations including dates.Short,butcomprehensivesummaryofcropdatalikeplantvariety,propagation,pre-treatments,pruning,fertiliser etc. which could affect the results of the trial.Description of all assessment methodology. This is particularly important when there is chemical analysis of soil or plant materials as different techniques will give quite different results.
Results and discussionThe interpretation of results should be written in simple readable text with useful observations and descriptive data from scoring sheets and pictures. This qualitative description should be combined with the presentation of quantitativedatafromthestatisticalanalysis.Itisimportanttoreportthequantitativedataasun-biasedfirstand then offer an interpretation. The reason for this is that the reader may come to a different interpretation of the data than the author of the report. Authors sometimes have a selective view towards ‘good results’ they arehopingfor.However,anyresultisa‘goodresult’ifachievedwithapre-definedresearchmethodfollowingarigorous procedure. Graphs and tables are appropriate tools to present results clearly and compactly.

22 | Guidelines for Experimental Practice
Appropriate and clearly labelled scales are important (e.g. logarithmic for growth functions) and graph types should be chosen to avoid optical illusions. In a discussion sections the personal view and interpretation of the authors (called ‘expert knowledge’) are valuable information to the reader; they should however be clearly indicated as such and separated from the pure description of the results and this includes personal value judgements in the description of results like “treatment x had an ‘a much more important’ effect”. Methods and experiments that failed should also be described.
ConclusionsKeyfindingsortheresearchshouldbepresented.Thiswillshowhowtheresultscanbemadeuseofbygrowersand identify the need for any further research work.
Acknowledgements Acknowledgementsshouldincludeallstaffinvolved,frompicturecreditstofieldandgreenhousestaff,tolab,statisticalandproofreadingsupport.Iffarmergroupsorcitizenswereinvolvedinsettingtheresearchquestionor collecting results this should also be acknowledged.
ReferencesAll academic or ‘grey’ literature cited in the text should be clearly listed.
Summary or abstractAshort(oneortwopage)summaryoftheworkthatbrieflycoverswhatwasdoneandthemainfindingsisusefulfor people who do not have time to read the full version, especially for commercial producers for whom the resultsmayberelevant.Thismaybedistributedasaleafletormadeavailableonawebsite.Insuchacaseeveryeffort should be made to avoid unnecessary jargon.