Flaring management guidance - Ipieca
164
Advancing environmental and social performance www.ipieca.org Flaring management guidance for the oil and gas industry Climate change
-
Upload
khangminh22 -
Category
Documents
-
view
3 -
download
0
Transcript of Flaring management guidance - Ipieca

Advancing environmental and social performance
www.ipieca.org
��������������� ��������������������
Flaring management guidance for the oil and gas industry
Climate change

IOGP Report 467
© IPIECA-IOGP-GGFR 2021 All rights reserved.
No part of this publication may be reproduced, stored in a retrieval system, or transmitted in any form or by any means,
electronic, mechanical, photocopying, recording or otherwise, without the prior consent of IPIECA/IOGP/GGFR.
Cover photographs reproduced courtesy of the following: top: iStock/Curraheeshutter; center: iStock/Kapukdodds;
bottom left: iStock/Travelpixs; bottom right: iStock/Bjdizx.
This publication is intended for information purposes only. While every effort has been made to ensure the accuracy of the information contained in this publication, neither IPIECA, the Global Gas Flaring Partnership (GGFR), the International Association of Oil & Gas Producers (IOGP), ERM nor any of their members or employees past, present or future warrants its accuracy or will assume any liability (including negligence) for any foreseeable or unforeseeable use made of this publication. Consequently, such use is at the recipient’s own risk on the basis that any use by the recipient constitutes agreement to the terms of this disclaimer. The information contained in this publication is not intended to constitute professional advice from the various content contributors or to endorse any approach or solution described herein, and neither IPIECA, IOGP, GGFR nor their members or employees accept any responsibility whatsoever for the consequences arising from, or in connection with, the use or misuse of this publication. Reference herein to any specific commercial product, process or service by trade name, trademark, manufacturer or otherwise does not necessarily constitute or imply its endorsement. Further, this document does not claim to take into account the requirements of local legislation, and as such, nothing herein is intended to replace, amend, supersede or otherwise depart from such requirements of local legislation that may be applicable to the user. This publication does not constitute a mandatory commitment which members of IPIECA, IOGP and GGFR are obliged to adopt. The views and conclusions expressed herein do not necessarily reflect the views of all IPIECA, IOGP and GGFR members or the individuals, companies and institutions that contributed to this publication.
Acknowledgments
This document draws from a project originated by IPIECA, IOGP and GGFR. The development of this document benefitted significantly from the input and review of many stakeholders. IPIECA, IOGP and GGFR would like to thank the organizations and individuals that supported its creation. We are also grateful to the experts from the ERM Group who contributed to this report.

The World Bank’s Global Gas Flaring Reduction Partnership (GGFR) is a trust fund composed of governments, oil companies, and multilateral organizations committed to ending routine gas flaring and venting at oil production sites across the world. The Partnership helps identify solutions to the array of technical, financial, and regulatory barriers to flaring and venting reduction by developing country-specific flaring reduction programs, conducting research, sharing best practices, raising awareness, securing commitments to end routine flaring through the ‘Zero Routine Flaring by 2030’ global initiative, and advancing flare measurements and reporting.
The World Bank Group, 1818 H Street NW, Washington, DC 20433, USA E-mail: [email protected] Website: www.worldbank.org/ggfr
PROJECT PARTNERS
Flaring management guidance for the oil and gas industry
IPIECA is the global oil and gas industry association for advancing environmental and social performance. It convenes a significant portion of the oil and gas value chain and brings together the expertise of members and stakeholders to provide leadership for the industry on advancing climate action, environmental responsibility, social performance and mainstreaming sustainability.
Founded at the request of the UN Environment Programme in 1974, IPIECA remains the industry’s principal channel of engagement with the UN. Its unique position enables its members to support the energy transition and contribute to sustainable development.
IPIECA, 14th Floor, City Tower, 40 Basinghall Street, London EC2V 5DE, United Kingdom Telephone: +44 (0)20 7633 2388 E-mail: [email protected] Website: www.ipieca.org
The International Association of Oil & Gas Producers (IOGP) is the global voice of our industry, pioneering excellence in safe, efficient and sustainable energy supply—an enabling partner for a low-carbon future. Our Members operate around the globe, producing over 40% of the world’s oil and gas. Together, we identify and share knowledge and good practices to improve the industry in areas such as health, safety, the environment and efficiency.
London office 14th Floor, City Tower, 40 Basinghall Street, London EC2V 5DE, United Kingdom Telephone: +44 (0)20 3763 9700 E-mail: [email protected] Website: www.iogp.org
Brussels office Boulevard du Souverain 165, 4th Floor, B-1160 Brussels, Belgium Telephone: +32 (0)2 566 9150 E-mail: [email protected] Website: www.iogp.org
��������������� ��������������������

2 — Flaring managament guidance
One of the most critical challenges facing the world is transforming our energy systems to meet the needs of a growing global population while reducing greenhouse gas (GHG) emissions. The urgency and size of this challenge requires unprecedented collaboration across all sectors and countries. However, a healthy and prosperous future for our planet and the people on it is possible, but only if we work together to achieve it.
The oil and gas industry is playing an important role in the energy transition by working to provide affordable and reliable energy, which is needed to fuel growth and improved living conditions for all. The aim is to produce this energy with decreasing emissions to support a net-zero world.
By reducing or eliminating routine flaring, the industry can significantly reduce its climate impact, and by making use of the otherwise flared gas as an additional energy source, it can support sustainable growth.
Since the first edition of this guidance was produced by GGFR, IPIECA and IOGP in 2011, we have seen an increasing commitment from industry and government to eliminate routine flaring. This is reflected in the growing participation in the World Bank’s ‘Zero Routine Flaring by 2030’ initiative and flare reduction projects actively under implementation or under consideration. Between 2019 and 2020, it is estimated by the World Bank that annual global flaring from upstream oil and gas facilities decreased from 150 billion cubic meters (bcm) to 142 bcm. While progress is being made, the volume of flared gas in 2020 would be enough to power the entire sub-Saharan Africa, giving some idea of the scale of the challenge we are still facing.
Building a shared understanding of the wide range of potential benefits among all stakeholders — including owners, operators, financiers, regulators and governments — is key to encouraging them to work together and overcome the barriers to reducing flaring and using the gas as an energy source or to conserve it.
This guidance provides governments, industry and other stakeholders with a framework to continue the process of ending routine flaring. It details new flaring management and reduction developments, and
examines industry experiences with eliminating flaring, new technologies, business models, operational improvements and regulatory policy. It also features case studies and examples of positive change, showing how governments and companies have reduced flaring and put the gas to productive use.
Importantly, it also includes a section for governments and regulatory bodies, showing how they can encourage and incentivize the utilization of associated gas, demonstrating the climate, social and financial benefits that working together with industry on flare reduction can have for communities.
Recent reports from the Intergovernmental Panel on Climate Change (IPCC) and others make it clear that the need to reduce emissions across all sectors of an economy is critical. We encourage oil and gas companies, governments and development institutions around the world to endorse the ‘Zero Routine Flaring by 2030’ initiative and play their part in delivering the Paris Agreement commitments and achieving the United Nations (UN) Sustainable Development Goals.
Foreword
Brian Sullivan, IPIECA Executive Director
Iman Hill, IOGP Executive Director
Zubin Bamji, GGFR Program Manager, World Bank

3 — Flaring management guidance
Foreword 2
Executive summary 6
Section 1: Flaring management — an introduction 9
Fundamentals of gas flaring 11
Essential elements of associated gas and 12 flare gas
Monetization of the associated gas value chain 16
Flare gas-to-market options and principles 19
Economic and technical considerations for 22 flare gas reduction projects
Environmental and social aspects (the link with 26 the UN Sustainable Development Goals)
Global initiatives 27
Global Gas Flaring Reduction (GGFR) partnership 27
‘Zero Routine Flaring by 2030’ initiative 27
Section 2: Flaring management — a framework 29 for the oil and gas industry
Historical and current data gathering and analysis 30
Associated gas forecasts 30
Measurement versus estimation 31
Segregation of flare volumes 34
Establishing company flaring and venting 37 policy and procedures
Unconventional and shale operations 37
New field developments 41
Early development facilities 42
Well test and early production (first oil) flaring 43
Legacy flaring 43
Venting at upstream oil and gas facilities 44
Management of routine flares 45
Assessing local conditions and policies 45
Reviewing associated gas forecasts 46
Developing a utilization strategy 46
Technology and economic assessment 51
Green/climate change financing opportunities 52
Management of non-routine flares 55
Raising awareness, and visualization of 57 flared gas
Flare management during non-routine/ 58 upset scenarios
Review of operational controls and processes 58
Setting flaring targets at the station level 59
Framework for variance and waivers 59
Economic and technical risk assessment 60
Root cause analysis and identification of 61 ‘bad actors’
Focused strategy for addressing ‘bad actors’ 62
Rotating equipment and sparing strategy 63
Flaring from midstream operations — 64 Including LNG facilities
Midstream gas plants 64
Midstream transmission lines 64
LNG 65
Enhanced flaring measurements and monitoring 66
Research and development 67
Section 3: Flaring management — a framework 69 for governments and regulatory bodies
Institutional set-up 71
Internal and external stakeholder mapping 71
Organizational structure — design and 71 implementation
Capacity building 73
Contents

4 — Flaring management guidance
Contents
Regulatory framework approaches 74
Policies 74
Institutional arrangements 76
Regulations 77
Monitoring and enforcement 79
Lessons learned from international experience 79
Flaring and gas production data 85 management system
Project origination 86
Independent analysis of the potential for 86 commercializing flared gas
Studying the market for flare gas 87
Identification of project structures 88
Private sector participation framework 91
Definition of specific projects 93
Third-party funding opportunities 94
Private equity funds 94
Global infrastructure facility (GIF) 95
Climate and concessional funds 96
Appendix: Case studies 99
Eni Congo: Gas-to-power project 100
PETRONAS: Flaring reduction project 103
Qatargas: Jetty boil-off gas project 106
Shell: Oxygen reduction catalyst to 109 optimize flash gas recovery
Wintershall Dea: Well testing gas capture project 114
Annexes 119
Annex I: Associated gas cross-references to 120 the UN Sustainable Development Goals
Annex II: Flare flow measurement techniques 123 supplement
Annex III: ‘Zero Routine Flaring by 2030’ 125 initiative — example checklist for ‘OpCo’
Annex IV: Criteria, project screening, and 127 bankability
Annex V: Associated gas CDM projects 130
Annex VI: Typical non-routine flare sources 133
Annex VII: Good practice considerations for 134 operational design and control
Annex VIII: Example calculations for absolute, 136 rate-based and intensity targets
Annex IX: UNDP-identified functional 139 capacities for government ministerial agencies
Annex X: EU Fuel Quality Directive 140
Abbreviations and acronyms 143
References 147
5 — Flaring management guidance
LIST OF FIGURES, TABLES AND BOXES
Figures
Figure 1: Flare volumes for the top 30 flaring countries, 2016–2020 (sorted by flare volume)
Figure 2: The natural gas value chain
Figure 3: Government roles in gas monetization
Figure 4: Examples of onshore options to monetize associated gas
Figure 5: Examples of offshore options to monetize associated gas
Figure 6: Gas utilization options by project scale
Figure 7: Dependency on the distance to market
Figure 8: UN Sustainable Development Goals
Figure 9: A framework for addressing gas flaring
Figure 10: Horizontal wells in the US
Figure 11: Trend in quarterly flaring in the Permian Basin (November 2019 estimate)
Figure 12: Trend in increasing gas-to-oil ratio in the Bakken Region, 2007–2017
Figure 13: North Dakota gas capture rates and goals
Figure 14: Flare reduction planning cycle
Figure 15: Typical oil and gas production forecast
Figure 16: Conceptual illustration of associated gas tranches for a given oil production profile
Figure 17: Technical and economic evaluation of alternatives to gas flaring
Figure 18: Total global climate finance flows, 2013–2018
Figure 19: Flare control communication
Figure 20: Satellite image of flaring in the Permian Basin
Figure 21: Boil-off gas at LNG terminals
Figure 22: Framework for monetizing associated gas resources
Figure 23: The UNDP approach to capacity development
Figure 24: High-level policy options for developing programs
Figure 25: Alberta Directive 060 gas flaring/venting management framework
Figure 26: Risk tranches for associated gas volumes
Figure 27: Global climate finance flows
Figure 28: Global Infrastructure Facility organization
Figure 29: Variation in risk and cash flow over the typical project life cycle
Figure 30: The blended finance concept
Figure A1: Natural gas production and consumption in the Republic of Congo, 2003–2012
Figure A2: Gas flaring in the Republic of Congo, 2005–2019
Figure A3: Electricity generation by source in the Republic of Congo, 2005–2018
Figure A4: Supply and demand trend for LNG and pipeline gas in Malaysia, 1980–2016
Figure A5: Gas consumption in Malaysia in 2017
Figure A6: Gas production and export trends, 2010–2019
Figure A7: Historical gross gas production in the Permian Basin, 2008–2020
Figure A8: Typical application of the EcoVapor ZerO2 technology
Figure A9: Production of natural gas in Argentina, 2006–2020
Figure A10: Evaluation of gas monetization options
Tables
Table 1: Why is gas flared?
Table 2: Flaring categories as defined by the GGFR
Table 3: Key technical and economic considerations for flare gas reduction projects
Table 4: Production forecasting over time
Table 5: Common flaring situations
Table 6: Flare type characteristics
Table 7: Associated gas tranches related to associated gas monetization opportunities
Table 8: Key procedural steps in developing a gas utilization strategy
Table 9: Joint venture considerations
Table 10: References for associated gas utilization technologies
Table 11: Developing technologies for associated gas utilization
Table 12: Barriers and regulatory options
Table 13: General models for associated gas utilization projects
Table 14: Key commercial agreements
Table 15: Associated gas project high-level risk register
Table 16: Key decision criteria for selecting flaring reduction options
Table 17: The primary funds supporting climate mitigation (2003–2019, USD millions)
Boxes
Box 1: New technologies for small-scale LNG production
Box 2: Production decline in conventional vs unconventional operations
Box 3: The mathematics of equipment sparing
Box 4: Mature technologies for associated gas
Contents
6 — Flaring managament guidance
To tackle climate-related risks and meet the aim of the Paris Agreement, society needs to manage and mitigate CO2 and methane emissions. Our generation’s biggest struggle will be to maintain energy supply to meet demand while reducing GHG emissions. The role that oil and gas will play in this supply/demand challenge is a subject of much debate. According to projections from scenarios published by various institutions, global oil demand is expected to grow by mid-century. However, other scenarios have been produced which have a flat or declining profile. In either case, finding ways to reduce or eliminate GHG emissions will be of paramount importance. The objective of this document is to provide a broad guideline on flaring management that is relevant to governments and regulatory bodies as well as the oil and gas industry. Through this guidance, the IPIECA, IOGP and GGFR partnership has created a document which has the following specific objectives:
l Raising awareness, and increasing the understanding and adoption of natural gas flaring reduction best practices in the oil and gas industry and among external stakeholders, such as governments and regulatory agencies and financial institutions.
l Identifying and exploring options for the deployment of flaring reduction technology, including operational improvements and good practices developed by the industry on both routine and non-routine flaring management.
l Exploring market approaches and business models for monetizing associated gas, the barriers to commercial implementation, and the important lessons learned.
l Reviewing examples of regulatory approaches in different parts of the world and identifying principal features of an effective regulatory framework to facilitate reduced flaring.
l Documenting flaring reduction case studies and sharing best practices in the oil and gas industry, as well as in regulatory development scenarios in different countries.
This document incorporates learnings from companies and other organizations that have pursued the elimination of flaring. Sustaining progress towards zero routine flaring rests on a foundation of shared culture which recognizes that the implementation of projects that produce good environmental outcomes (i.e. zero or minimal flaring) can yield financial benefits. Historically, low-carbon initiatives were perceived as adding costs, and detrimental to the bottom line. In practice, this is not always the case. Low-carbon projects can be cash generators, and can also yield substantial, hard-to-quantify benefits, such as improved community relations, stronger ties to host governments, and positive investor relations. The work summarized in this guidance incorporates practical learnings, including the following:
l Many efficiencies are gained when there is a clear, consistent message from top management to the field about a commitment to a zero routine/minimal flaring ambition. This ensures that priorities remain consistent, especially across operating locations, business units and support staff departments.
l Reinforcing a top-level message with established key performance indicators (KPIs) to drive progress can be an effective motivator for operating units.
l Beginning with the end in mind when preparing field development plans can radically change the way associated gas is managed and monetized. Simply requiring that a plan be developed can lead to unanticipated positive results.
l Investing in technology (metering, tracking and data processing) to understand flare volumes cannot be overemphasized. Knowing the ‘size of the prize’ unleashes the creativity needed to find ways to convert a wasted resource into profit.
l Looking deeper into understanding the true nature and root cause of flaring can lead to breakthroughs. It is common for flaring to be attributed to the lack of midstream capacity, which makes it someone else’s responsibility. However, unbiased analysis can reveal root causes that are more closely linked to operational practices at the well or field level.
Executive summary

7 — Flaring management guidance
Executive summary
l Letting the problem drive the technology solution is effective. Rather than selecting a preferred technology solution and fitting it to every flaring situation, first define the problems and challenges. Then, pursue a fit-for-purpose resolution, such as aligning with midstream partners, eliminating bottlenecks or practices that prevent optimizing the full gas value chain, and deploying technologies as part of a comprehensive solution.
This Flaring management guidance is composed of the following three sections:
l Section 1: This introductory section presents core concepts and definitions, and provides context.
l Section 2: The focus of this section is on oil and gas operators, the challenges they face and the solution frameworks that can be employed.
l Section 3: The final section focuses on governments and regulatory bodies, and outlines the tools that they can consider when shaping a program to encourage the productive use of associated gas in lieu of flaring.
An Appendix presents case studies of successful flaring reduction projects registered under the Kyoto Protocol Clean Development Mechanism (CDM). This is followed by a series of Annexes which provide a range of additional technical support information. Finally, the document concludes with a list of abbreviations and acronyms, and an extensive list of source references.

This page is intentionally blank

9 — Flaring management guidance
Section 1
Flaring management — an introduction
This introductory section provides core concepts and definitions, and puts the overall concept of flare management into context.
iSto
ck/E
kton

������
���
���
��� ������ �
��� ���
� �� ��
��� ���
� ����
����
���
�� !�
����!���
"�!#�
��������� ��
��� ���
�����
� #$��%�����
&��'� ����
����
(���'����
)� �
�����
��� ��(
�����
��� ���
"������
*����
+�����
�!���
���������
%��� �,����
�- �����
���
���� � ��.
/0$1
20$1
2/$0
21
3$0
0$1
/$0
/124
��"
23$0
/1$1
//$0 /123 /125 /126 /1/1
10 — Flaring management guidance
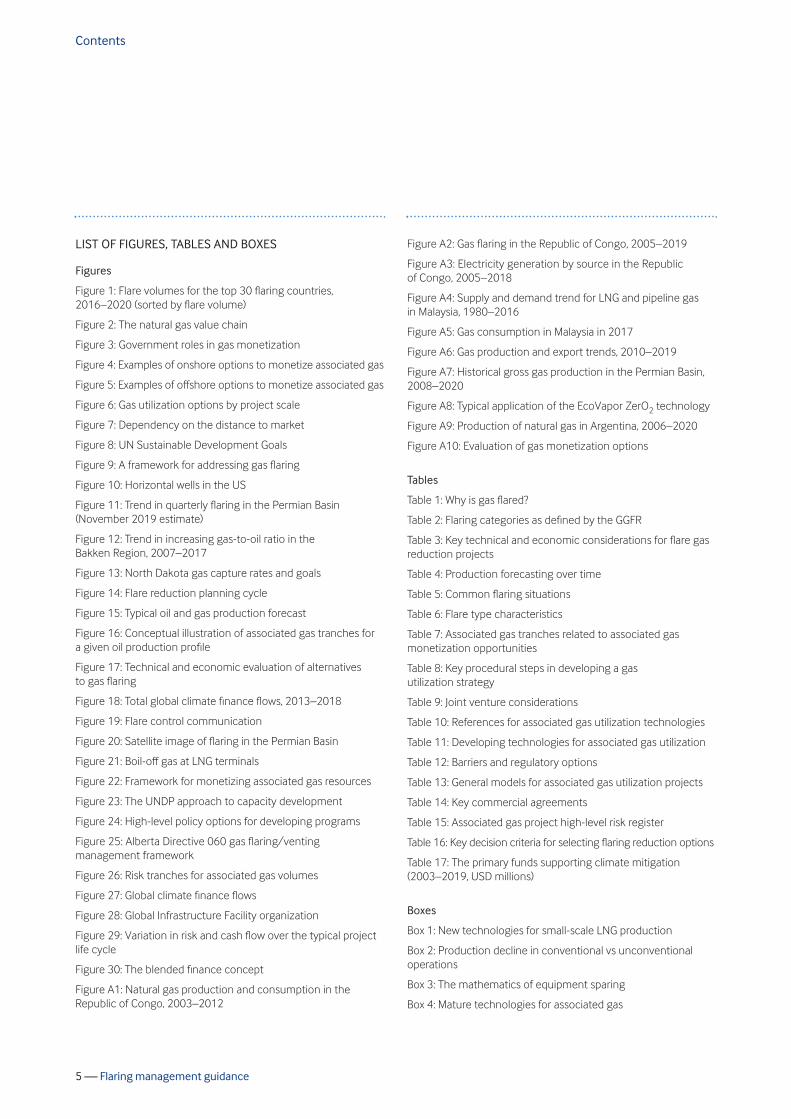
Associated gas is the natural gas that is produced as a co-product with oil during oil extraction. Significant volumes of associated gas are flared annually at oil production sites around the globe, contributing to climate change by releasing CO2 and CH4 into the atmosphere. Much of this flaring occurs on a routine1 (typically, continuous) basis. Flaring also occurs because of events that are non-routine in nature and lead to an unanticipated interruption of natural gas extraction, processing, transportation and downstream (e.g. liquefaction) operations. Some flaring is also attributable to emergency or safety incidents. Flaring wastes a valuable energy resource that could provide energy to support economic growth in many locations around the
world and help society make progress towards achieving the UN Sustainable Development Goals.2 However, flaring of natural gas is preferable to venting the gas without combustion in a flare (referred to as cold venting), because the release of methane is both a safety concern and a greater contributor to climate change.3 Globally, many companies and countries have successfully reduced flaring from production operations. This makes good environmental and business sense. However, there is still a significant level of routine flaring of associated gas on a global basis, as shown in Figure 1 for the top 30 flaring countries.
Section 1
Flaring management — an introduction
Figure 1 Flare volumes for the top 30 flaring countries, 2016–2020 (sorted by flare volume) [1]
1 See the Global Gas Flaring Partnership’s ‘Global Gas Flaring Data’ website: https://www.worldbank.org/en/programs/gasflaringreduction/global-flaring-data 2 See Environmental and social aspects (the link with the Sustainable Development Goals) on page 26. 3 Uncombusted methane has a significantly higher global warming potential than the CO2 created during combustion in a flare. Venting of associated
gas contributes to climate change because the primary constituent of natural gas is CH4, a potent GHG, with global warming impacts 28 times those of CO2, if measured over a 100-year period (based on the 5th Assessment Report of the UN Intergovernmental Panel on Climate Change — Climate Change 2013: The Physical Science Basis, Chapter 8, ‘Anthropogenic and Natural Radiative Forcing’, Table 8.7: https://www.ipcc.ch/site/assets/uploads/2018/02/WG1AR5_Chapter08_FINAL.pdf

11 — Flaring management guidance
It is estimated that global flaring decreased from 150 billion cubic meters (bcm) in 2019 to 142 bcm in 2020; this volume of flared gas is enough to power sub-Saharan Africa.[2] If this amount of gas was used for power generation, it could provide about 750 billion kWh of electricity 4— more than the African continent’s current annual electricity consumption. Significant barriers can impede progress in bringing flared natural gas to more effective use. Examples include a lack of infrastructure and/or the distance to market, capital constraints, gas ownership arrangements, and a lack of government project enablers, among other factors. However, gas flaring can be effectively mitigated when local operators and governments work together to overcome these barriers. This document addresses each of these barriers so that operators, owners, financiers and governments can proceed from a common understanding of the challenges that exist and the opportunities to be captured.
FUNDAMENTALS OF GAS FLARING
This section provides an overview of several important topics related to gas flaring, and includes a discussion of:
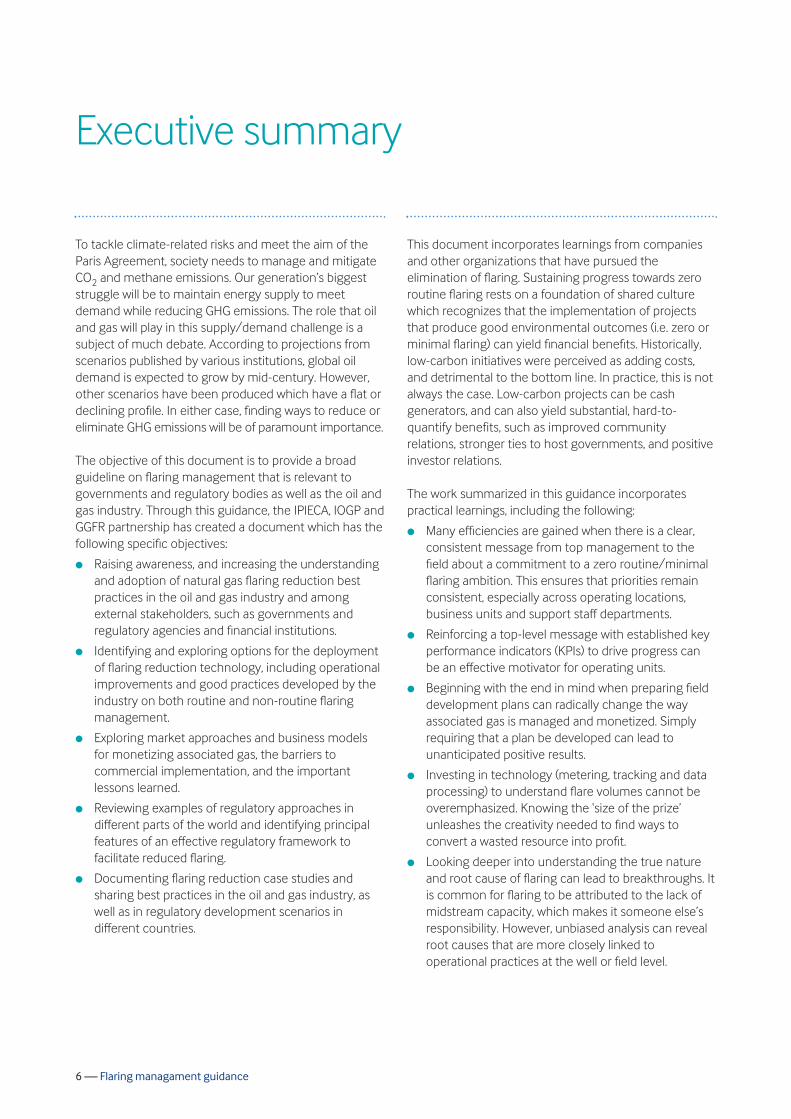
l the natural gas value chain (see Figure 2) and different reasons for flaring for different segments of the chain;
l monetization of associated gas from the perspective of the key participants and their respective roles in the decision processes;
l technology options for flare gas reduction and the market factors that should be considered for any project; and
l categorizing associated gas projects, including economic and technical drivers as well as environmental and social aspects.
Section 1 Flaring management — an introduction
Figure 2 The natural gas value chain[3]
4 Based on an average heat rate of 7.35 MMBtu/MWh for gas-fired combined cycle generators, as reported to the US Energy Information Administration (2015 data, https://www.eia.gov/electricity/data/eia923), and an assumed natural gas heating value of 1,036 Btu/cubic foot.
%��� 7, �
� �� � #������
���7���8 ��
� �9 ����
� �����
��8�-8 �.����������
�� �� #������
���#��� ����
#���
���� ����
8�� �:����:� ������ �
����������#����������-�);�.������
%����������
�);��#����!�#�������
#�# �� ����������
��)����#�# �� ��#����
������
��)�# �'��������
����������� �������#�!
������ ��� �
��)����#�# �� �#����
� ������#�8 �
������!
���� �����
� ��� ����
����#���

12 — Flaring management guidance
Essential elements of associated gas and flare gas
Natural gas value chain
To consider the potential opportunities for better utilization of associated natural gas, it is important to understand how natural gas moves from the well head to the customer. Figure 2 on page 11 illustrates the flow of gas along the value chain in those operations, from the oil or gas well head through gas processing, transportation, liquefaction or conversion of natural gas to fuels, chemicals or other derivative products, and end use. Beyond the logical left to right product movement, there are several attributes to consider:
l Often, the owner of the hydrocarbon resource is a separate party from the operator that explores for, and produces, that resource (see Monetization of the associated gas value chain on page 16).
l Due to the inherent price differential between hydrocarbon liquids and gases — even on an equivalent energy basis — the resource owner and the operator can (and often do) place priority on the crude oil produced versus the co-produced associated gas.
l Intermediaries in the middle section of the value chain, from the inlet separator to the gas processing plant and the final customer distribution network, add value through processing, upgrading, moving and distributing the natural gas or derivative products. Generally, the facilities and infrastructure in this ‘midstream’ section of the value chain tend to be capital intensive, capacity-limited and fixed in place.
l Except for agreements between end-use customers and local distribution companies (LDCs), commercial arrangements between parties are often long-lived and involve sophisticated provisions to deal with downside risk mitigation related to certainty of supply and fluctuations in commodity prices.
l For all customers, but especially for the industrial and electric utility plants and the exporters, there are no convenient, cost-effective substitutes for natural gas as an energy carrier, once a commitment to facilities and equipment that rely upon it has been made.
l There is often substantial government intervention through regulations, taxes and subsidies, land access and, in certain jurisdictions, involvement in contracts. These government actions can either incentivize or disincentivize the mitigation of gas flaring (refer to Section 3).
Each of these factors can, depending on the particular local conditions that exist, play an important and determinative role in defining the possible options for monetizing associated gas. In upstream operations, a range of factors may influence the potential to flare gas, from infrastructure limitations for associated gas operations to equipment reliability issues for non-associated gas operations. In associated gas operations, onshore operators typically allow for better matching of incremental capacity with production growth due to the relative ease of adding additional processing facilities.[4] Offshore, the process occurs in larger steps due to the significant logistical, construction and safety risk management challenges that exist. In either case, because the rates of associated gas production may not be well characterized prior to the start of operations, the development of gas handling infrastructure can lag, be capacity-limiting, or be financially unattractive. Further, some associated gas operations with low gas-to-oil ratios (GORs) have the added challenge of finding economically viable solutions to address low volumes of gas produced. The recent growth in production from onshore tight oilfields/shale oil reservoirs, where horizontal drilling and hydraulic fracturing are employed, presents a special challenge with respect to the management of associated gas. Refer to Unconventional and shale operations on page 37 for more details. In non-associated gas production, where production is focused on the natural gas product stream, a different set of challenges may exist which can lead to gas flaring. These challenges can include operational upsets, such as overpressure of equipment or pipelines, equipment shutdown or failures, and downstream capacity limitations, such as a processing plant shutdown. While these tend to be non-routine, i.e. they are temporary and non-continuous events, they can lead to large volumes of transient flaring. These same challenges may exist across the other segments of the natural gas value chain downstream of the production stage, including gas processing, transmission, downstream derivative production (e.g. liquefied natural gas (LNG) and compressed natural gas (CNG)), and end use.
Section 1 Flaring management — an introduction

However, sometimes the market value does not support a positive return on the investment needed to bring the associated gas from the producing field to a value-added consumptive use. In such cases, and even after considering the societal benefits of utilizing associated gas, routine flaring is often the outcome. While market value is a key driver, there are other key reasons why associated gas flaring occurs, as shown in Table 1.[5,6,7,8,9,10]
13 — Flaring management guidance
Why is gas flared?
Flaring can occur for many reasons, ranging from technical issues (e.g. initial start-up testing of a facility, unplanned equipment malfunctions, etc.) to market factors (e.g. insufficient demand, low gas prices, etc.). As a primary energy source in a world of consistently growing energy demand, associated gas has intrinsic value. Whether as pipeline-quality natural gas or some other derivative product, the market value of associated gas depends on a number of factors that arise along the value chain between the producer and the consumer.
Section 1 Flaring management — an introduction
Table 1 Why is gas flared?
l Distance from the production field to markets can limit the options for monetizing associated gas, making it economically infeasible to treat, pressurize, transport and distribute commercial quality gas, or to construct electricity power generation and transmission facilities.
l Obtaining access for long-distance transmission pipelines can involve long lead times and represent significant project risk due to landowner legal challenges and/or government permitting processes.
l In cases where the field producing the associated gas is close to a local market, the market may be too small to support development of a gas processing and distribution infrastructure.
l In some countries, associated gas is flared due to the structure of markets that limit new investments or the right to use existing infrastructure.
l Where existing gas processing and transmission infrastructure exists, the system may be at capacity, have unreliable equipment (e.g. compressors), or be subject to contractual limits that place new supplies of associated gas at an economic or other disadvantage.
l Third-party infrastructure failures may occur (e.g. due to unstable national grid or domestic gas infrastructures).
l For some short-cycle operations, such as shale oil produced through horizontal drilling and hydraulic fracturing, production can exhibit substantial variability due to high initial production rates followed by steep declines. This limits the economic sizing of downstream gas handling facilities to manage peak production.
l Typically, oil producers favor investments in additional liquids production over those projects that could monetize associated gas due to the higher returns that can be generated from incremental oil production. This can limit the pool of capital that is available to associated gas utilization projects.
ROOT CAUSE EXAMPLES OF WHY FLARING OCCURS
Market access constraints
Infrastructure constraints
Gas volume constraints
Capital constraints
continued …

14 — Flaring management guidance
Various analyses of the issue of how to monetize associated gas have identified a number of these factors which lead companies to a decision to flare. Considered together, these challenges suggest that there is a fundamental failure of the market to align the full volume of associated gas with the world’s aggregate demand for energy. Although any decision made by a company to flare associated gas to maintain liquids production reflects a value-adding outcome of a company-level optimization decision-making process, the sum of all such decisions results in a suboptimal outcome for society as a whole. This outcome — the intentional and persistent wastage, via routine flaring, of associated gas — creates an economic ‘opportunity cost’ consisting of lost energy resources and the generation of GHG and other emissions.
How is flaring categorized?
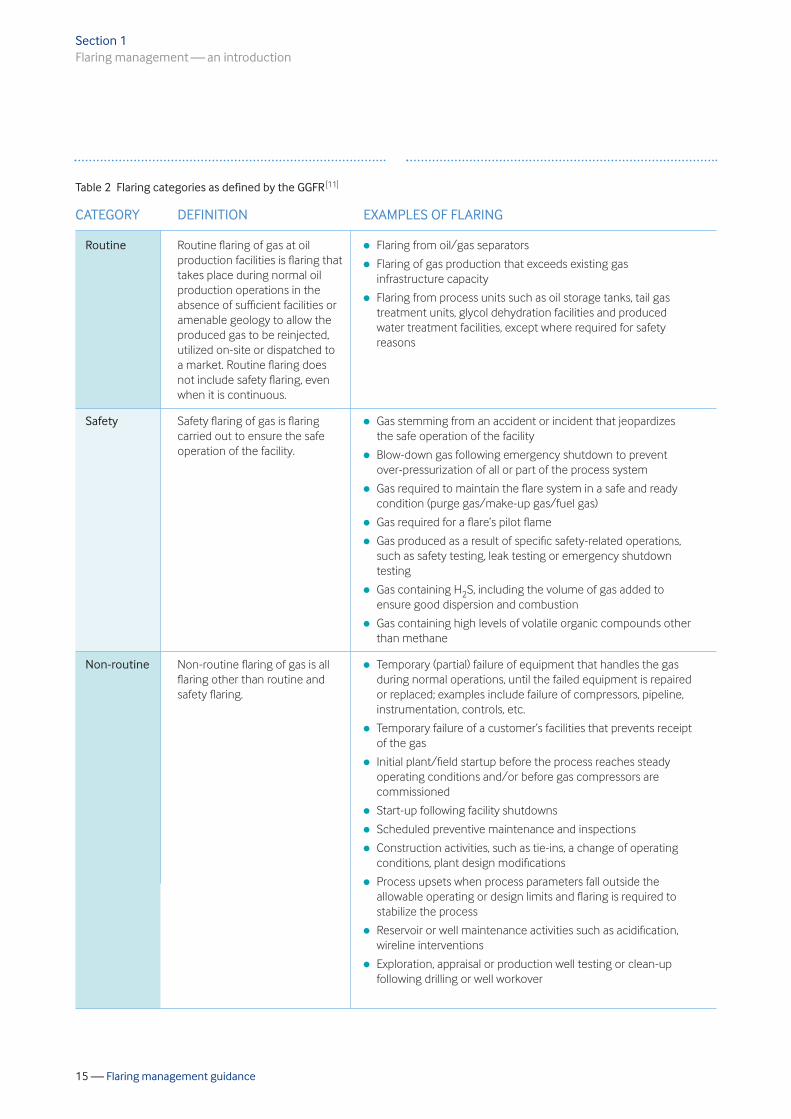
The GGFR partnership has developed a set of definitions for gas flaring, which are summarized in Table 2 on page 15. As shown, routine flaring, which can be continuous or intermittent, occurs during normal oil production operations when there are insufficient infrastructure, facilities or amenable geology to reinject the associated produced gas, utilize it on-site, or send it to a market. Safety flaring covers all situations where a flare is used to maintain the safe operation of oil and gas production facilities. Non-routine flaring is all flaring other than routine and safety flaring, which can be scheduled/ planned, such as a maintenance turnaround event, or unscheduled/unplanned, such as equipment failure. Distinguishing safety and non-routine flaring from routine flaring is critical to reducing overall flaring volumes as, globally, a large fraction of the flaring occurs because of economic conditions and choices, not for safety reasons.
Section 1 Flaring management — an introduction
Table 1 Why is gas flared? (continued)
l The absence of an efficient and effective legal, regulatory and fiscal framework or a functional authority to enforce regulations can signal a government’s lack of commitment to support a market that fosters investment in alternatives to flaring.
l Governments do not require, or stipulate in their new prospect offers, that field development plans for new oil fields incorporate sustainable utilization or conservation of the field’s associated gas without routine flaring.
l Pre-emptive rights of associated gas ownership held by host governments can undermine the basis for investments by upstream producers or other third parties in developing alternatives to associated gas flaring.
l A government-imposed artificially low price for pipeline gas or electricity can eliminate the incentive for private investment in alternatives to gas flaring.
l Government-sanctioned monopolies in the oil and gas sector can limit third-party access to gas pipelines, processing plants, gas distribution networks or export facilities.
l Safety-driven flaring occurs for several reasons, including process malfunctions, emergency shutdowns due to excess pressures, and high concentrations of hazardous constituents in the gas, e.g. hydrogen sulfide.
l Due to the nature of the oil reservoir, reinjection of associated gas is not always a technically feasible and/or economic option to increase oil production.
l Initial start-up flaring occurs during the commissioning and start-up phases of a plant or process unit, when gas and liquids are introduced into new facilities and equipment to test the production of the sales products (oil, gas, liquefied petroleum gas (LPG), condensate, etc.).
l Planned non-continuous production flaring may occur due to scheduled maintenance equipment shutdowns, well completions, workovers and liquids unloading, etc.
l Unplanned non-continuous production flaring may be caused by mechanical equipment failures, instrument failures, difficulty restarting well production, etc.
l In some regions, political unrest leading to sabotage of infrastructure may occur.
ROOT CAUSE EXAMPLES OF WHY FLARING OCCURS
Government constraints
Operational conditions
15 — Flaring management guidance
Section 1 Flaring management — an introduction
Table 2 Flaring categories as defined by the GGFR [11]
l Flaring from oil/gas separators
l Flaring of gas production that exceeds existing gas infrastructure capacity
l Flaring from process units such as oil storage tanks, tail gas treatment units, glycol dehydration facilities and produced water treatment facilities, except where required for safety reasons
l Gas stemming from an accident or incident that jeopardizes the safe operation of the facility
l Blow-down gas following emergency shutdown to prevent over-pressurization of all or part of the process system
l Gas required to maintain the flare system in a safe and ready condition (purge gas/make-up gas/fuel gas)
l Gas required for a flare’s pilot flame
l Gas produced as a result of specific safety-related operations, such as safety testing, leak testing or emergency shutdown testing
l Gas containing H2S, including the volume of gas added to ensure good dispersion and combustion
l Gas containing high levels of volatile organic compounds other than methane
l Temporary (partial) failure of equipment that handles the gas during normal operations, until the failed equipment is repaired or replaced; examples include failure of compressors, pipeline, instrumentation, controls, etc.
l Temporary failure of a customer’s facilities that prevents receipt of the gas
l Initial plant/field startup before the process reaches steady operating conditions and/or before gas compressors are commissioned
l Start-up following facility shutdowns
l Scheduled preventive maintenance and inspections
l Construction activities, such as tie-ins, a change of operating conditions, plant design modifications
l Process upsets when process parameters fall outside the allowable operating or design limits and flaring is required to stabilize the process
l Reservoir or well maintenance activities such as acidification, wireline interventions
l Exploration, appraisal or production well testing or clean-up following drilling or well workover
Routine flaring of gas at oil production facilities is flaring that takes place during normal oil production operations in the absence of sufficient facilities or amenable geology to allow the produced gas to be reinjected, utilized on-site or dispatched to a market. Routine flaring does not include safety flaring, even when it is continuous.
Safety flaring of gas is flaring carried out to ensure the safe operation of the facility.
Non-routine flaring of gas is all flaring other than routine and safety flaring.
CATEGORY DEFINITION EXAMPLES OF FLARING
Routine
Safety
Non-routine

16 — Flaring management guidance
The category descriptions and examples in Table 2 provide a consistent framework for analysis and will be used throughout this document. Regardless of how flaring is regulated, administered or controlled by government authorities, all flared gas scenarios are covered by these three definitions. There is no fourth definition that addresses government-approved flaring. Instead, determining how flaring operations align with compliance requirements established in local law and regulation is a separate question for the upstream operator to consider.
Monetization of the associated gas value chain
In a well-functioning market, associated gas would be valued on an energy-equivalent basis with other energy sources (e.g. the natural gas price indexed to crude oil price). Producers would find valuable uses within their own operations, or for-profit companies would provide facilities and services to capture the gas energy and deliver it to satisfy customers’ demand. This process would function because each participant along the value chain would recognize revenues in excess of the marginal cost of their products and services. The fact that the amount of gas flared has not declined substantially over the past ten years[12] indicates that markets are not always well-functioning. Instead, there are any number of factors that can (and do) distort valuations, sometimes enough to depress returns to levels that make economic justification of gas monetization difficult, in the absence of subsidies, carbon taxes, government policies or other incentives. Of those factors, a low gas price (whether because of excess supply or some form of price control) is the most difficult to overcome. When gas prices are robust, other opportunities to utilize the gas are incentivized.
Despite the challenges that lead to flaring, operators and other stakeholders can recognize benefits from utilizing associated gas, even if the projects do not generate a return that meets the company economic thresholds. Some examples of benefits include:
l improved reliability by using gas to generate electricity on-site, avoiding curtailments during periods of grid stress (e.g. renewable drop-offs, high summertime demand) or transmission line shutdowns due to natural disasters (e.g. wildfires, wind events);
l avoiding shut-ins caused by flaring above authorized amounts when downstream gas off-takers experience extended malfunctions or shutdowns;
l building company reputation or satisfying investor or other stakeholder expectations by demonstrating actions to reduce GHG emissions or achieve self-imposed goals, such as a commitment to the ‘Zero Routine Flaring by 2030’ initiative;[13]
l enhancing the attributes of a product, such as a ‘low-carbon’ crude or natural gas[14] by minimizing the GHG footprint of the production operations;
l diversifying product offerings by generating electricity, manufacturing gas-derived liquids for sale or producing LNG in small quantities; and
l creating a commercial advantage, such as preferred bidder status on other energy sector projects sponsored by a host government.
The gas value chain schematic (Figure 2, page 11) shows that there are a number of key participants with influential roles in the decision processes that can determine whether associated gas is monetized rather than flared. These are discussed below. Resource owner
Resource owners can be individuals, partnerships, companies, other private parties and governments (including, national oil companies5). Many resources are developed with multiple venture partners, and various equity and contractual arrangements. The nature of these arrangements may play a key role in how the resource is developed, and how partners view and influence investing in flare minimization.
Section 1 Flaring management — an introduction
5 Typically, national oil companies operate through production-sharing contracts, with the government retaining ownership of the hydrocarbon resources.

17 — Flaring management guidance
In almost every instance, a resource owner desires to realize royalty or other income from the production of the hydrocarbons in which it retains an ownership interest as quickly as possible. This desire is modulated by contracts, which typically provide that a lease or concession is granted to an oil or gas producer. The arrangement remains in place, with the production company controlling reservoir development as long as the owner derives royalty or sales income within a specified period.[15] While outside the scope of this document, the type of contract in place can disincentivize gas monetization and lead to flaring. Therefore, effective and informed contract negotiation with partners and government entities is an important element in addressing the flaring of associated gas. For the case where the resource owner is a government entity or national oil company (NOC) versus a private party (individual or company), the decision-making calculus can be different. A government/NOC owner has other factors to consider besides near-term profit maximization, such as national energy sector strategy goals, foreign relations, relationships with private parties operating within the country’s energy sector, domestic policy goals, etc. These considerations can take precedence over traditional oil and gas decision criteria. Additionally, where there is a high degree of coordination between government energy, finance, environmental, and tax departments, outcomes may not be the same as when a private party is subject to the independent oversight of such authorities. Production operator
The production operator is typically either the resource owner or an equity partner in the venture. Key challenges may arise where the contractual arrangement between the resource owner and production operator does not incentivize flaring minimization in order to stay profitable or cash flow positive in the venture. For example, production quotas for oil, and/or capital constraints, may disincentivize investments in capture, processing or conversion, and transmission and distribution facilities, which would otherwise create value by utilizing the associated gas. In cases where the production operator is the resource owner, such investment decisions are predicated upon the alignment of several factors (i.e. market demand, gas price, gas take-away infrastructure, etc.), many of which are outside the scope of the producer’s control. Offshore production has additional
challenges associated with the interconnectedness of offshore production facilities with multiple operators. As previously stated, economics may favor the production of oil along with the flaring of the associated gas or its reinjection to facilitate that production. Due to the low prices of natural gas liquids (NGLs) and natural gas, particularly in the Permian Basin in the southwestern part of the United States, 87% of revenues come from crude oil, with only 10% from NGLs and 3% from natural gas.[16]
The pressure on companies to deliver growth in liquids production and reserves can even lead to a weakening in a company’s financial metrics. For example, in 2014–2018, the oil market encouraged upstream companies to look for the most expedient route to deliver more crude production. Because many government jurisdictions were supportive of growing crude oil production (due to increasing jobs, taxes, royalty revenue, etc.), a substantial quantity of associated gas was flared.[17]
Section 1 Flaring management — an introduction
Oil
and
Gas
Pho
togr
aphe
r/Sh
utte
rsto
ck.c
om

��������� ������ ���� �����
������������ ��� �������� �����
<�������� ��, ����# ���� �
<���������, ���� �������
���� �������������
&����=#���!���� ������#��� ��7������ �������%����������
���� �������������> ������!��%���� ������ 9 ���, �> ������!> ;������#����> ������� ����!> &���#�� �!> ;� ����� ����!
���� �����������> ? %��������� ������ �> �##��,��> "�������,�������> � ���� � ������ #�����> ������������ %��� � �> ;� �������������
���������� ��������
����� ��������
18 — Flaring management guidance
Government authority/regulator
Government entities play a significant role in the gas value chain. Their actions have an influence in four key areas: upstream oil and gas legislation/regulation; commercial law and contractual practices; fiscal framework (e.g. royalties, taxes, subsidies and other financial incentives and penalties); and environmental and safety regulation (see Figure 3). For a description of the lessons learned from effective government policies and programs see Section 3 of this guidance. Midstream entities
The midstream segment consists of gathering, processing, and transportation facilities and services that connect upstream wells to downstream customers, converting a raw energy source to commercial product(s) to satisfy a demand. In some cases, the parties that operate in this segment are separate entities from the upstream production companies and the downstream customers. For those cases where the midstream segment is controlled by a government or state-run enterprise, or is specified in a concession agreement, commercial factors can play a minor role in the decision process for the management of associated gas. Offshore,
the ownership situation is project-specific. In some cases, the model resembles the onshore situation with independent third parties operating in the space. In other cases, the facilities are determined by the terms of the concession agreement with the host government. Where the commercial environment for the midstream segment relies on separate entities that engage in arms-length commercial transactions with upstream producers, monetization of associated gas occurs through the addition of processing and transmission capacity that meet the company’s financial return targets. Suppliers of gas and midstream entities negotiate terms that reflect positive outcomes for both parties. However, past data[19] suggest that midstream capacity additions often trail the growth of associated gas production due to limited competition, large initial investment requirements and, in the case of pipelines, the requirement for landowner access and regulatory approvals, as well as fluctuating market conditions or reliability of infrastructure. Processing and pipeline capacity limitations, even if temporary, can lead to flaring in the upstream operations.
Section 1 Flaring management — an introduction
Figure 3 Government roles in gas monetization [18]

19 — Flaring management guidance
Typically, additions of midstream gas processing facilities are made in combination with additions to gas transmission pipeline capacity, to ensure that both product streams (NGLs and pipeline quality gas) have market outlets. However, there could be a scenario (albeit less likely) where the demand for NGLs drives the construction and use of the separation facilities ahead of gas take-away capacity, in which case the gas could be flared. The quantity of associated gas flared routinely is usually a result of the gap between midstream capacity and the supply of associated gas.[19] Sellers of natural gas products
Depending on the geography and/or investor base, entities that market fuels (including gasoline, natural gas, LNG, etc.) represent an emerging stakeholder group that can have an indirect influence on the disposition of associated gas. This arises from customer expectations, industry standards and possible regulation regarding the
carbon footprint of fuels. As societal initiatives to limit GHG emissions grow, consumers, environmental groups and local community groups are using data that links flaring for individual oilfields to final products,[20,21,22] to put pressure on suppliers to minimize the footprint of the fuels that they supply.[23] The same information is being used to drive regulations,[24,25] to accomplish the same. From a market incentive perspective, an emerging trend towards carbon-neutral products, such as net-zero LNG, is expected to have a positive influence on incentivizing reductions in associated gas flaring.
Flare gas-to-market options and principles
A number of options for monetizing associated gas to reduce routine flaring are available in the market, as shown in Figures 4 and 5 for onshore and offshore operations, respectively.
Section 1 Flaring management — an introduction
Figure 4 Examples of onshore options to monetize associated gas [26]
������������������ ������-, �!������+��.�������� ������-�����+��.� ���������� ������-�, ��� �+��.��/�#��� ��� �������
�����/@�� ��, �!�-61A� ��� :�61B66A�#��#� ���������C@.�C@�� ��, �!�-D�01A�#��#� ���������E@.�0@�� ��, �!�- � � ���������� ��������' �.�)��
��� �������� ���?� � �;��#� �- ��'=�#."� �������!�����!�����7�����##�� �
����������)�!���� ���� ��,�� �� ��������� ��,�� �������
)��� �9 ����
��)����'��
)�����#�8 �
<��� �!�� ��
+�=%� �� ��#������� �� ������#����E1B51A��8����:� # ������� ����
;�8 ������� �����
;�8 ���������������
)��=#�8 � ��� ����������� �����F����=#�8 � �������=��� � ������ �����F������=%� �������� � ��������8����F �=%� ��� ��#�������� �� ������#����01B211A�� ����:�� # �������� ����
� ��
��!�
� %$7 �#$
�)�� ��, �!
�0@
�C@
+� � ���������� ����:��������#��� ��,����)��#�# �� ��������'
<��� �!�� ��
�� �����:�+���� # ������)��� ��, �!��#���
)������#�8 � ������) ����)&�=<& ����)&�=�& ������#��������
?� � ���#������
�!����
?� � ���#������
�����%��
)��:��� �� ���� �%� �:
� ����������� � �
)������� ����!�� ��
20 — Flaring management guidance
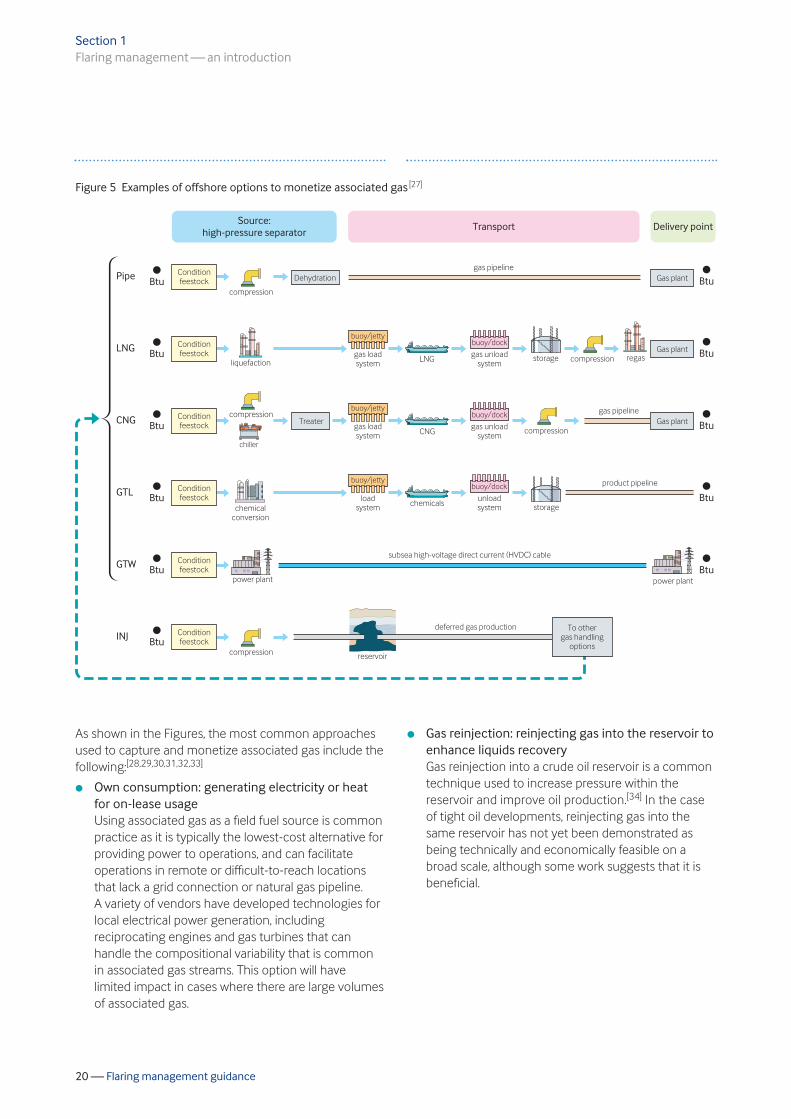
As shown in the Figures, the most common approaches used to capture and monetize associated gas include the following:[28,29,30,31,32,33]
l Own consumption: generating electricity or heat for on-lease usage Using associated gas as a field fuel source is common practice as it is typically the lowest-cost alternative for providing power to operations, and can facilitate operations in remote or difficult-to-reach locations that lack a grid connection or natural gas pipeline. A variety of vendors have developed technologies for local electrical power generation, including reciprocating engines and gas turbines that can handle the compositional variability that is common in associated gas streams. This option will have limited impact in cases where there are large volumes of associated gas.
l Gas reinjection: reinjecting gas into the reservoir to enhance liquids recovery Gas reinjection into a crude oil reservoir is a common technique used to increase pressure within the reservoir and improve oil production.[34] In the case of tight oil developments, reinjecting gas into the same reservoir has not yet been demonstrated as being technically and economically feasible on a broad scale, although some work suggests that it is beneficial.
Section 1 Flaring management — an introduction
Figure 5 Examples of offshore options to monetize associated gas [27]
� � �,���
�������% ����'����
���
���
���
���
�!
�"��
�"��
�"��
�"��
�"��
�"��
��� %�����
���#� ����
����� �
�� �������, ����
#�8 ��#���
���#� ����
���#� ����
? �!�������
"��
�"��
�"��
�"��
�"��
)���#���
)���#���
)���#���&� �� �
��!7���'����������!�� �
������ ���#� ���� � ���
&����� ������������#����
�������% ����'
�������% ����'
�������% ����'
�������% ����'
�������% ����'
��!79 ��!
���������!�� �
��!7���'����������!�� � ���#� ����
��!79 ��!
�����!�� �
��!7���'������!�� � ������
���������!�� �
��!79 ��!
����#�# ��
� % �� ������#��������
#�8 ��#���
#�������#�# ��
�� � ������=,����� ���� ������� ��-G�?�.��� �
����#�# ��
��)
��)
�� ������
#�����$%��%&����������������� ��������� '� �(��������

21 — Flaring management guidance
l Gas gathering system: installing gas gathering and compression (and NGL separation) facilities to feed a pipeline-quality natural gas network Typically, the export of associated gas via existing gas pipelines (after treatment to remove impurities or contaminants) is the base case, least-cost option for monetization. However, if the gas stream also contains NGLs, it will need to be pretreated to produce a dry gas with a heating value that meets the sales gas specification. The value of recovered NGLs can help to justify a gas monetization project if existing NGL processing capacity exists. If capacity in an existing NGL recovery plant is not available, the cost can be significant. The design of an NGL recovery plant is complex, driven by the feed gas composition, flow rate, location and available utilities, among other factors.
l CNG: producing compressed natural gas and transporting it to customers CNG, which is methane stored at high pressure, is typically used as a substitute for gasoline in motorized vehicles. At a well pad, technology can be installed to produce the CNG, which can then be transported by truck over relatively short distances for use as a fuel for oilfield activities, or to a central point where the gas can be put into a pipeline system. CNG requires treatment, including dehydration of the gas and, if applicable, removal of NGLs. For large volumes of associated gas, a regional distribution network and refueling stations (along with a fleet of CNG vehicles) would be needed to support the investment in infrastructure for this product. Studies conducted for the GGFR show that onshore CNG transportation could be financially viable for volumes of up to 5 million standard cubic feet (scf) per day. [35]
l LNG: converting gas to liquefied natural gas (micro-scale or world-class export) The typical scheme for monetizing associated gas via LNG requires facilities for gas collection, treatment, liquefaction, transport and regasification. World-class LNG projects, which can consume large volumes of associated gas, are highly capital-intensive and require close coordination among partners and prompt extensive government agency oversight, and involve many stakeholders. New technologies are making LNG production possible on a micro scale —at the field or well pad level (see Box 1) — where it can be produced and then transported to markets.
l Gas to liquids, gas to chemicals: converting gas to other products Conversion of associated gas to other products, such as gas to liquids (GTL) or gas to chemicals (GTC), relies on separation or other unit operations to create synthetic fuels or other high-value products (e.g. olefins, fertilizers, acids) from associated gas. Depending on the technology chosen, some processes, such as gas to methanol, are able to operate with rich gas feed, with less stringent constraints for gas pretreatment. Processes to convert natural gas to hydrogen, via steam methane reforming or other novel technologies, coupled with carbon capture and sequestration, are part of another emerging area of research into the use of methane resources.[37] Originally, GTL and GTC projects were typically large-scale, energy- and capital-intensive installations that required significant volumes of gas to be economical. Successful projects depended on a robust market demand and low gas price for the products produced. Beginning in 2010, smaller-scale systems (from 25 million scf/day down to 0.5 million scf/day) have been developed. Modularization, process intensification and the acceptance of slightly lower process efficiencies have contributed to GTL units becoming a viable option for the monetization of flare gas.
Section 1 Flaring management — an introduction
Box 1 New technologies for small-scale LNG production
Edge LNG[36] operates 42-foot by 12-foot LNG processing plants based on Galileo CryoboxTM technology (https://www.galileoar.com/us). These units are delivered by truck, with a footprint no bigger than a large trailer. LNG production can begin within hours of delivery. Produced LNG can be used on-site or delivered directly to the market. Each Cryobox unit can process up to 1 million cubic feet of gas per day, which yields about 10,000 gallons of LNG.
©Ed
ge L
NG

22 — Flaring management guidance
l Gas to wire: installing grid-scale electricity generation facilities A sufficiently large supply of associated gas can form the basis for a gas-to-wire (GTW) project, which includes electricity generation and transmission for the purpose of selling power to the grid. Typically, GTW projects consume large volumes of associated gas, are capital-intensive, require close coordination among partners, prompt extensive government agency oversight and involve many stakeholders.
l Gas to data centers: utilizing gas to power portable data centers Other emerging flare gas utilization applications are being introduced to the market, such as converting the gas to electricity to power a portable data center. A number of similar flare mitigation applications[38] are being utilized in US oilfields.
To select the best method for flared gas recovery and reduction, operators will need to have a good understanding of how the flared gas is produced, its quality, and the possible options for utilization. Many factors, as alluded to above, will influence the technical and economic feasibility of alternatives to monetize associated gas. In 2020 the GGFR published a document entitled GGFR Technology Overview – Utilization of Small-Scale Associated Gas [39] that provides details of the technical applicability of different technologies for the small-scale utilization of flared associated gas. Ultimately, the key question is which technology option offers the highest return over the project life when considered against market fluctuations, trade barriers, political changes, technical advances, etc. In addition to minimizing flaring, addressing venting of associated gas is important to minimize methane emissions. However, vented gas volumes tend to be much lower than flared volumes, thus limiting the applicable associated gas utilization options. Installing a vapor recovery unit (VRU) and utilizing the gas as fuel gas or sales gas is a preferred approach to reducing methane emissions, where possible. Other technologies for reducing methane emissions from venting are readily available, and tend to be source specific (e.g. instrument air-driven pneumatics, replacing high-bleed pneumatic controllers with low-bleed controllers, leak detection and repair (LDAR) programs to reduce fugitive leaks, etc.). Flaring is preferred over venting to the atmosphere from both a safety and GHG perspective, as the methane and
overall CO2 equivalent (CO2e) emissions are lower from flaring compared to venting.
Economic and technical considerations for flare gas reduction projects
The evaluation of gas monetization options is a multidimensional issue requiring a systematic approach to selecting the optimal option. There are many operational and technical considerations that must be weighed during the evaluation of possible gas utilization options. In addition to technical and environmental (e.g. GHG emissions avoided) considerations, commercial and logistical issues as well as market conditions play a key role in the evaluation process. The expected volumes of gas to be recovered, the distance to market, and the selling price of the gas (or gas-derived) product are among the most important financially-driven variables. There are a host of factors that have an impact on the selection of approaches and technologies. Upstream and downstream factors influence the selection of midstream processes and operating flexibility. The larger the project, the more complex the interrelationships and the need for collaborative solutions across multiple stakeholders. The key technical and economic considerations for flare gas reduction projects are summarized in Table 3 and described on the following pages.[40]
Section 1 Flaring management — an introduction
Table 3 Key technical and economic considerations for flare gas reduction projects
l Gas volume and forecast over the life of the project
l Gas composition and pretreatment requirements
l Gas pressure characteristics
l Distance to the market
l Access to infrastructure
l Project costs and other factors driving economics
l Market demand
l Contractual and financing arrangements
l Netback price
ASPECT KEY CONSIDERATIONS
Technical
Economic

23 — Flaring management guidance
Gas volume and forecast over the life of the project
The gas production volume profile reflects the cumulative effect of the natural decline in output from producing wells balanced by development plans to maintain or grow production in the field. The projected available volume has a strong influence on the types of gas utilization projects that are likely to be economical (see Associated gas forecasts on page 30). However, even after determining the preferred project alternative, uncertainty of how the production rate from the field will change over time presents a challenge for system and equipment sizing. Designs based on initial rates or long-term average production volume can have significant cost and flaring rate implications. To address the capacity challenge for certain types of projects, the system capacities can be adjusted to match the production profile by leasing equipment as volumes change or, preferably, in many cases employing small-scale modular installation solutions. This can mitigate the excess upfront capital costs associated with installing equipment that is oversized. Onshore operations are more amenable to this strategy than offshore installations. Figure 6 presents the various gas utilization options that are applicable by project scale, in terms of associated gas flare volume in bcm per year. The indicative associated gas volume ranges are < 0.1 bcm/year, 0.1–0.5 bcm/year and > 0.5 bcm/year for small-, medium- and large-scale projects, respectively.
Gas composition and pretreatment requirements
The composition of associated gas from wells can vary over time due to reservoir behavior, declining well production, recovery techniques and operating conditions. If the associated gas stream is a composite that comes from many sources, there can be substantial variations in gas composition and impurities as new wells come online or as other wells or production facilities are taken offline for maintenance. The changing composition of the gas makes it more challenging to design suitable facilities than it is for dry natural gas. All types of facilities are affected by compositional variability, and provisions to account for this variability should be considered. The gas throughput of gathering systems and pipelines can be reduced if liquid condensation occurs. Gas plants producing NGLs have unit operations that are designed based on expected ranges of C2–C5 and heavier hydrocarbons. Depending on the quality of the raw gas source, CNG and LNG facilities often require pretreatment to remove certain components, particularly contaminants such as CO2 and hydrogen sulfide (H2S). Gas-to-power units (especially in-field units) may also require some form of gas conditioning for stable turbine or engine operation. Gas-to-methanol processes and gas-to-liquids via the Fischer-Tropsch process, on the other hand, have the advantage of being able to operate with rich gas feed, without the need for gas pretreatment.
Section 1 Flaring management — an introduction
Figure 6 Gas utilization options by project scale[41]
����� �9 ����
��� ��%��� �����#�������
���� !�8��
���' �����%�������#��� �� ��#�������
���������� � ��������� ���� ����� ���# ��! ��
����)������*�������+��%������� ����(���,
������%���� ��� &��� ����
��%��� �������� �-������������
����������� ��������������.�������������
�������������*���� ���+� ����/��������������/����*(���/��������������������,
����&��� ������ &��� ����+���
������ �����������/����
��0������� �������0��� ��� �����������*���%���,
24 — Flaring management guidance
Gas pressure characteristics
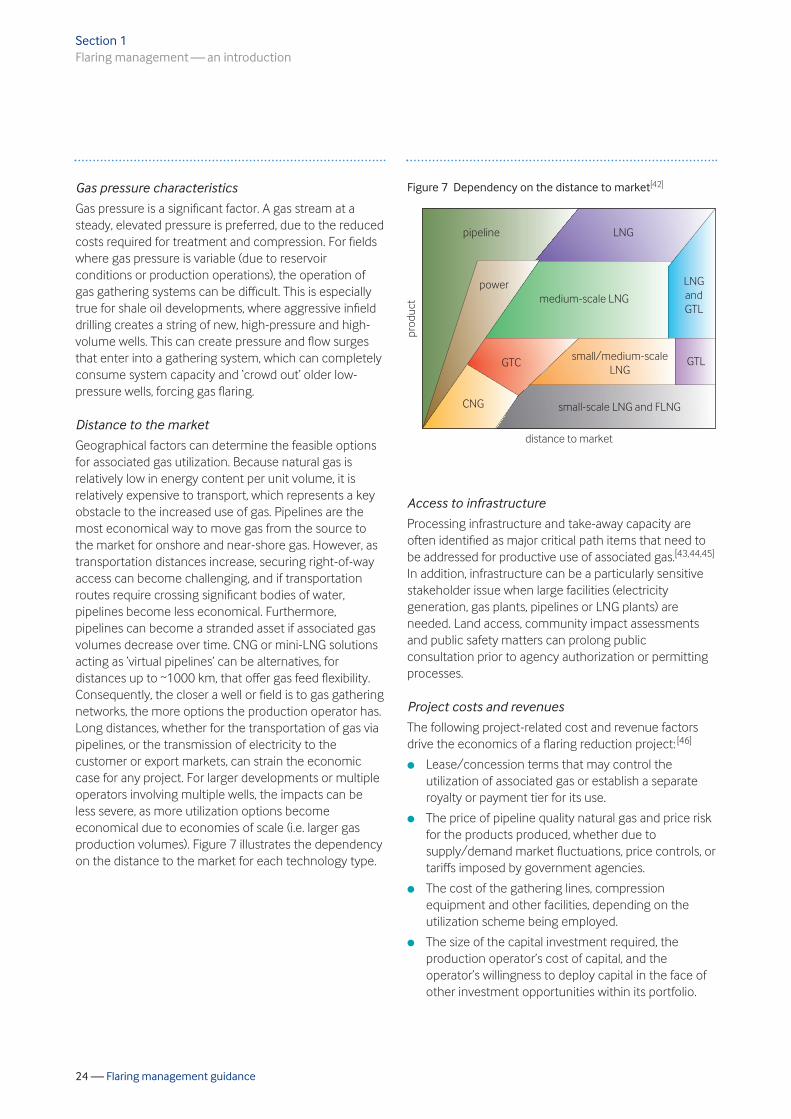
Gas pressure is a significant factor. A gas stream at a steady, elevated pressure is preferred, due to the reduced costs required for treatment and compression. For fields where gas pressure is variable (due to reservoir conditions or production operations), the operation of gas gathering systems can be difficult. This is especially true for shale oil developments, where aggressive infield drilling creates a string of new, high-pressure and high-volume wells. This can create pressure and flow surges that enter into a gathering system, which can completely consume system capacity and ‘crowd out’ older low-pressure wells, forcing gas flaring. Distance to the market
Geographical factors can determine the feasible options for associated gas utilization. Because natural gas is relatively low in energy content per unit volume, it is relatively expensive to transport, which represents a key obstacle to the increased use of gas. Pipelines are the most economical way to move gas from the source to the market for onshore and near-shore gas. However, as transportation distances increase, securing right-of-way access can become challenging, and if transportation routes require crossing significant bodies of water, pipelines become less economical. Furthermore, pipelines can become a stranded asset if associated gas volumes decrease over time. CNG or mini-LNG solutions acting as ‘virtual pipelines’ can be alternatives, for distances up to ~1000 km, that offer gas feed flexibility. Consequently, the closer a well or field is to gas gathering networks, the more options the production operator has. Long distances, whether for the transportation of gas via pipelines, or the transmission of electricity to the customer or export markets, can strain the economic case for any project. For larger developments or multiple operators involving multiple wells, the impacts can be less severe, as more utilization options become economical due to economies of scale (i.e. larger gas production volumes). Figure 7 illustrates the dependency on the distance to the market for each technology type.
Access to infrastructure
Processing infrastructure and take-away capacity are often identified as major critical path items that need to be addressed for productive use of associated gas.[43,44,45] In addition, infrastructure can be a particularly sensitive stakeholder issue when large facilities (electricity generation, gas plants, pipelines or LNG plants) are needed. Land access, community impact assessments and public safety matters can prolong public consultation prior to agency authorization or permitting processes. Project costs and revenues
The following project-related cost and revenue factors drive the economics of a flaring reduction project: [46]
l Lease/concession terms that may control the utilization of associated gas or establish a separate royalty or payment tier for its use.
l The price of pipeline quality natural gas and price risk for the products produced, whether due to supply/demand market fluctuations, price controls, or tariffs imposed by government agencies.
l The cost of the gathering lines, compression equipment and other facilities, depending on the utilization scheme being employed.
l The size of the capital investment required, the production operator’s cost of capital, and the operator’s willingness to deploy capital in the face of other investment opportunities within its portfolio.
Section 1 Flaring management — an introduction
Figure 7 Dependency on the distance to market[42]
#�# �� ��)
��)��)&�
#�8 �� ����=���� ���)
�����7� ����=���� ��)
)&�
�����=���� ���)����<��)��)
)&�
������ �������' �
#���
���
25 — Flaring management guidance
l If external financing is used for the project, the terms can weigh heavily on profitability and can introduce new forms of risk with which operators may not be familiar.
l Additional operating, processing or conversion costs associated with the monetization project.
l The cost of acquiring and maintaining land or rights-of-way for gas (or electricity) transmission.
l The potential technological risk of a given approach can be a significant consideration depending on the size of the upfront capital investment and the expected payback horizon — the longer the time frame, the greater the risk of technological obsolescence (or uncompetitive cost structures).
l The implications of regulatory oversight and schedule risk imposed by the involvement of natural resources agencies, health and safety ministries, environmental protection departments, public utility commissions, or other government entities that may be involved (such as in the case of large LNG export projects).
l Fiscal issues, including taxes and royalties, plus any unique terms that may be imposed by a host government or NOC.
l Market dynamics and competition can be significant factors when pursuing GTL or GTC projects due to the specialized nature of the products and (potentially) the limited customer base for any particular product.
l In countries with economies in transition, additional considerations[47] may include limited access to information and specialized contractor resources needed to complete the front-end engineering assessment. There can be difficulties in the local political context and cultural differences that require more planning and longer response times. In addition, local companies and partners may be hesitant to engage, or may lack the organizational capacity to fulfill commitments.
Market demand
In cases where the utilization of associated gas lies beyond the lease or concession, production operators seeking to monetize the gas resource rely on market indicators to determine whether there is sufficient demand for the produced volumes. The nearer (in terms of the value chain) the customers are to the producer, the easier it is for the producer to calibrate the market size and the likelihood for future growth. Longer chains involving multiple parties can attenuate the market
signal(s), but nonetheless remain practicable options. However, there is the potential for commercial hurdles and, with each intermediary, a reduction in profit opportunity for the producer. Contractual and financing options
Ultimately, the economic viability of any particular gas utilization approach depends on the nature of the contractual agreements between the production operator its partners/midstream off-takers, and the end user.[48] ‘Take-or-pay’ or ‘deliver-or-pay’ contract terms are typical provisions in contractual agreements, and are often subject to much negotiation. Imposition of significant monetary penalties to fulfill such provisions drives the use of sophisticated risk mitigation strategies. Several different business models are available to manage financial commitments and allocate business risks among parties, such as a fee for services, shared equity (e.g. joint venture), or third-party funding of a new gas-monetizing entity. Netback price
The producer of the associated gas will likely choose from among the available commercial alternatives based on the netback price for natural gas. The netback price is defined as a pricing assessment or formula based on the effective price to the producer/seller at a specific location or defined point. It will depend on: the likely product price in the target market compared with the energy equivalent of traditional fuel in use (e.g. diesel for power); the location of the market, transportation routes and related costs (tariffs, tax etc.); electricity import/ export tariffs; product losses through transportation; and other risks and issues. For example, LNG netback prices may be determined by the market price of natural gas at market destinations less the cost of the pipeline transportation, regasification, shipping and liquefaction.[49] The sections on Technology and economic assessment (page 51), and Economic and technical risk assessment (page 60) provide more details for assessing the technical and economic risks associated with routine and non-routine flare gas monetization projects, respectively.
Section 1 Flaring management — an introduction

26 — Flaring management guidance
ENVIRONMENTAL AND SOCIAL ASPECTS (THE LINK WITH THE UN SUSTAINABLE DEVELOPMENT GOALS)
In September 2015, the United Nations General Assembly adopted the 2030 Agenda for Sustainable Development, including the 17 Sustainable Development Goals (SDGs) that aim to address some of the world’s pressing economic, social and environmental challenges (Figure 8). UN member states are expected to use the SDGs to frame their development agendas, and there is a recognition that the private sector will play an important role in achieving them. The oil and gas industry’s operations and products intersect with a range of areas covered by the SDGs, including communities, ecosystems and economies. In 2017, IPIECA, the United Nations Development Programme (UNDP) and the International Finance Corporation (IFC) developed a shared understanding of the implications of the SDGs for the oil and gas industry and how the industry can most effectively contribute in the joint IPIECA/IFC/UNDP Mapping the oil and gas industry to the Sustainable Development Goals: an atlas.[50]
In 2021, IPIECA, with the World Business Council for Sustainable Development, launched Accelerating action: an SDG Roadmap for the oil and gas sector [51] (the Roadmap). The Roadmap aims to prioritize areas where the sector can
significantly contribute to SDG progress by identifying key impact opportunities for the most material SDG goals and targets, coordinating effort across the entire industry. The Roadmap includes specific actions on flaring. The oil and gas industry contributes to sustainable development in a number of ways. These include: generating direct and indirect jobs;6 supplying access to energy that enables economic activity and social development; contributing substantial tax and other types of revenue to governments; enabling the development of advanced technologies and products through investment in research and development; encouraging local content and entrepreneurship with associated capacity building benefits; investing in the long-term social and economic success of the communities in which the industry operates; and managing the impacts of its operations by emphasizing environmental protection, health and safety, and human rights. The SDGs also highlight sustainability challenges for the industry, where more can be done to mitigate the adverse impacts of oil and gas development, for example the industry’s environmental footprint, including climate change and its associated impacts on communities. Several SDGs and associated UN targets are particularly relevant in terms of the efforts needed to reduce and eliminate the flaring of associated gas. Details can be found in Annex I and in the joint publications mentioned above.
Section 1 Flaring management — an introduction
6 Referred to as ‘Country Benefit Analysis’ based on GDP, fiscal parameters, capex and other parameters used to calculate the induced jobs generated either during the construction period and during normal plant operation at steady state.
Figure 8 UN Sustainable Development Goals [52]

27 — Flaring management guidance
GLOBAL INITIATIVES
The perception of associated gas flaring has evolved. Once viewed as an operational solution to a site-specific problem of how to deal with an unwanted by-product of oil production, it is now recognized as an undesirable activity with global GHG impacts. Upstream operators, governments, financial institutions, non-governmental organizations (NGOs) and technology providers have undertaken initiatives aimed at raising awareness and facilitating beneficial uses of associated gas, with a goal of reducing the quantity of associated gas that is flared.
Global Gas Flaring Reduction (GGFR) partnership
The World Bank’s GGFR is a multi-donor trust fund composed of governments, oil companies and multilateral organizations working to end routine gas flaring at oil production sites across the world. An integral part of the GGFR’s strategy is the pursuit of shared prosperity with an aim towards ending poverty via a sustainable energy path and the wise use of natural gas resources.[53] The Partnership helps to identify solutions to the many technical and regulatory barriers to flaring reduction by developing country-specific flaring reduction programs, conducting research, sharing best practices, raising awareness, increasing the global commitments to end routine flaring, and advancing flare measurements and reporting. The GGFR works in a range of oil-producing countries including Ecuador, Egypt, Gabon, Indonesia, Iraq, Kazakhstan, Mexico, Nigeria, Russia and Senegal. The GGFR’s strategy is to support and assist governments as they develop policies and regulations that treat associated gas as an asset rather than an unwanted by-product of oil production. The partnership is now focusing more intently on helping governments to develop the institutional capacity and legal, regulatory, investment and operating environments to enable the utilization of associated gas. This will provide companies with the confidence and incentive to invest in flaring reduction projects. In some instances, this also means working with governments to develop the fundamentals, such as proper flare measurement practices, before the new policies and regulatory measures are developed. The GGFR prioritizes assistance to developing countries with high levels of routine gas flaring and low levels of energy access amongst its citizens, and those countries facing fragility, conflict and violence.
The GGFR regularly publishes estimates of global gas flaring from satellite data.[54] These data reveal that roughly 142 bcm of associated gas is flared each year, releasing about 400 million tonnes of CO2e emissions, while wasting enough natural gas to power Sub-Saharan Africa. The gas flaring estimates are based on data from a satellite launched in 2012 which detects the heat emitted by gas flares as infrared emissions at global upstream oil and gas facilities. The GGFR also conducts periodic technical studies,[55] and technology and service provider overviews, to assess the technical feasibility and economic viability of using flared gas for rural electrification or commercial/industrial purposes.
‘Zero Routine Flaring by 2030’ initiative
In 2015 the World Bank introduced the ‘Zero Routine Flaring by 2030’ initiative[56] which commits governments and oil companies to (a) avoiding the routine flaring of associated gas in any new oilfield development, and (b) seeking to implement economically viable solutions to eliminate legacy routine flaring (i.e. at existing oilfields) as soon as possible and no later than 2030. As of May 2021, there were 93 endorsers of the initiative, including many of the major development banks that have agreed to facilitate cooperation and consider the use of financial instruments to support flaring reduction projects. Other global organizations supporting the initiative include the European Union (EU), IPIECA, The Latin American Energy Organization (OLADE), The Organization of the Petroleum Exporting Countries (OPEC) and the World Petroleum Council. The initiative pertains to routine flaring and not to flaring for safety reasons or non-routine flaring which, nevertheless, should also be minimized. Routine flaring of gas is flaring that takes place during normal oil production operations in the absence of sufficient facilities or amenable geology to reinject the produced gas, utilize it on-site, or dispatch it to a market. Venting is not an acceptable substitute for flaring. The IEA analysis, The Oil and Gas Industry in Energy Transitions,[57] finds that the commitments from the World Bank’s ‘Zero Routine Flaring by 2030’ initiative will be an integral component of the path to ending routine flaring globally and the Paris Agreement goal of limiting global warming to well below 2°C above pre-industrial levels.
Section 1 Flaring management — an introduction

This page is intentionally blank

29 — Flaring management guidance
Section 2
Flaring management— a framework for the oil and gas industry
This section is aimed at oil and gas production operators, and presents a framework for the identification and management of solutions to successfully bring flared gas to more productive use.
Fact
ory
Easy
/Shu
tter
stoc
k.co
m

30 — Flaring management guidance
through historical production volumes, and then extrapolating the curve to predict future production. The larger the scope, the more data (e.g. production history, reservoir geology, completion designs, pressure history and other operational parameters) are required to make accurate predictions.
Section 2
Flaring management—a framework for the oil and gas industry
Figure 9 A framework for addressing gas flaring
1�������� �����������������%����������� ����
> ���, ������������� ��# ������> � 8�%� ���� , ��#� ��> "���!�� , ��#� ��%������� �> H ���� ������ ���!�#���������-%��������.�%�����> � ���!�%�����> � ��������#��� ��������������%������� �
> ��� �����������������������#����� �> � ,� 8����������� ������%�� �����> ? , ��#��������������������� �!> & ������!���� ���������� ��� �> )� 7������ ����� �%�������##������� �
> ��������8�� ������,�������������%�%��� �����> <���������� � ���������=����� 7�#� ���� �����
> � ,� 8��%��# �������������������#��� �� �> � �����%���������� �������� ��������� , �> <��� 8��'�%���,����� ����8��, ��> "����������� ����������'���� ��� �> ��������� ����!��������� ��%��������%�I ���������J> <���� ������� �!�%������� �����I ���������J> �������� ��#� ������#���������� �!
> �������� ������%�� �����> � ���� � ��, ����� ��������> � �� �������%�%��� �,���� �
2���0 ��%���������� ��������(�������� ���������������
3������������������ ����
3�������������&�������� ����
Addressing gas flaring rests on (a) the identification of project design solutions for new assets, and flare reduction projects for existing fields that can successfully bring the gas to more productive use, and (b) the expansion of potential solutions from those attainable by individual oilfield operators to solutions that fully employ the capabilities of operators and governments working together. For an individual production operator, it begins with a commitment to address the problem and then follow through with a disciplined approach of organization, planning and implementation following the framework shown in Figure 9 and elaborated in the text that follows. This section also includes supplemental information on flaring from midstream operations (including LNG facilities), and on enhanced flaring measurements and monitoring, together with a brief look at research and development.
HISTORICAL AND CURRENT DATA GATHERING AND ANALYSIS
Before making operational changes or capital investments to reduce flaring, it is imperative that a firm basis for action is established using actual data and reasonable estimates to forecast gas volumes over time and fill any data gaps. The essential elements that require consideration when making projections of associated gas volumes are discussed below.
Associated gas forecasts
Associated gas forecasting to predict the near- and longer-term supply of associated gas from a producing area is a critical aspect of determining the potential flare mitigation solutions that are viable. Gas volume estimates over the life of a potential associated gas monetization project is required in order to appropriately scale the project, select the optimal technology solution, and evaluate the project economics. Forecasting is often performed by reservoir modeling and simulation to predict future production profiles for wells or entire reservoirs. Another forecasting approach is decline curve analysis,[58] which involves fitting a curve

31 — Flaring management guidance
Reliable forecasts (those which contain a conservative expected value along with probabilistic upper and lower ranges) for associated gas availability over time are essential in the design, planning and ongoing management of an associated gas monetization project. Forecasting is an ongoing process rather than a one-time event, with the amount and quality of available data changing as development of the resource matures. Although the nature of the hydrocarbon resources, and whether the operation is onshore or offshore, informs the range of possible development concepts, the forecasting process evolves over the course of the development activities, as noted in Table 4.
Measurement versus estimation
Associated gas forecasts rely on historical data on gas flows (e.g. in-field use, reinjection, sales and gas flared) for existing operations, and on production forecasts for new development activities. In order to select and design optimal solutions to avoid flaring, an accurate quantification of the gas flow to flare is required. In general, measurement of gas flared is considered more accurate than estimation approaches, although flare gas metering can present unique challenges due to the fact that a flare system is designed to handle two very different operating scenarios, i.e. large emergency releases during an upset or blowdown condition, and low flow releases during ‘normal’ operating conditions.
Section 2 Flaring management—a framework for the oil and gas industry
Table 4 Production forecasting over time [59]
l To determine which development approach will be profitable
l Better definition of potential resources
l Feasibility screening of development concepts and expected timing
l To obtain approvals from authorities, partners and investors
l To further define resources, near-term production and growth
l To narrow down the development options, facilities and recovery methods
l To obtain production allowances from governmental authorities
l To reassess resource potential and better define geo-model blocks/production units
l To optimize recovery methods and facilities for maximization of economic recoveries
l Limited information available constrains potential forecasts
l Focus on too narrow a set of development options
l Underestimating capital costs and expenses
l Only initial production flowback from appraisal wells or production history from analogue fields
l Same issues as noted above
l Limited production history can lead to inaccurate simulations and unreliable predictions
l Pressure to satisfy partners and investors on limited performance data
l Underestimating timing and cost, ramp-up of production, and total resources
l Some fields may not have reliable well test data or pressure surveillance
l Underestimating total resources and the timing and cost of changes in the production concept
l As the field ages, there could be changes in associated gas composition (e.g. increasing H2S), which should be considered
PHASE PURPOSE OF FORECAST LIMITATIONS AND POTENTIAL ERRORS
Production forecasting at the exploration stage
Production forecasting during the appraisal phase
Production forecasting during early field life
Production forecasting during established field life

32 — Flaring management guidance
In complicated applications, including large pipe diameters, flow velocities that vary over wide ranges, variable gas composition, low pressures, and entrained liquids and solids, estimation approaches can be preferred over flare metering.[60,61] Two American Petroleum Institute (API) Standards offer comprehensive information on flare design[62] and measurement of flow to flares,[63] respectively. Direct measurement of flare gas volume
Accurate measurement of the vented and flared volumes is important when evaluating the applicability and economics of flare mitigation technologies. This section presents some of the common types of flow meters used for flare gas measurement, together with a comparison of the range, accuracy, calibration frequency and cost ranges. Supplemental material is provided in Annex II.
l Differential pressure flow meters Various types of differential pressure flow meters are available (e.g. orifice plate, V-cone,® pitot tubes/annubars), all of which operate on the principle of conservation of energy, i.e. the total energy of an isolated, steady flow system must remain the same over time. When a particular aspect of the system, such as pipe diameter, is modified, another aspect of the system must change to maintain the system’s energy. Differential pressure meters utilize this principle by analysing pressure differences in the system both upstream and downstream of the flow element. While differential pressure flow meters are the most common flow measurement devices utilized in upstream oil and gas operations, they have several disadvantages that make their use for flare gas metering difficult, such as the range of operation, downstream pressure loss and straight-line pipe requirements. A chapter in the API Manual of Petroleum Measurement Standards offers more detailed information on orifice meters.[64]
l Ultrasonic time-of-flight flow meters This type of meter determines the fluid flow rates based on flow velocity, flowing pressure, flowing temperature and composition of the gas. Ultrasonic meters operate by measuring the travel time of ultrasonic signals transmitted with, and against, the fluid flow. The difference in transmittal time of the ultrasonic signals is used to calculate the fluid velocity. Ultrasonic flow meters can be installed permanently or as portable clamp-on models. Ultrasonic devices typically have the highest turndown ratios of all flow
metering devices, require infrequent calibrations and can handle varying gas compositions. For this reason, ultrasonic meters are the most common type of measurement device used for flare gas streams. Permanent installations require a long run of straight line pipe, and clamp-on models are impractical for low pressures (< 80 psig) or for use near atmospheric flares. Ultrasonic meters are among the most expensive flow metering devices.
l Thermal mass anemometers This type of meter measures the mass flow rate of a stream, either by constant power or constant temperature approaches. Thermal mass meters are capable of continuous measurement and the many available models provide for a range of potential turndown ratios all at relatively reasonable costs. Drawbacks for thermal mass meters include their inability to handle fluids with increased levels of particulates, and their lack of suitability for use in wet gas streams where water or condensing hydrocarbons would distort the measurements obtained by the sensors.
l Coriolis flow meters The operation of this type of meter is based on the principle of the ‘Coriolis effect’. Coriolis meters offer accurate results and do not have any straight-line pipe requirements. However, they have limited applicably for flare gas streams, especially for pipe sizes greater than 6 inches (15 centimeters), and are also considered expensive. A chapter in the API Manual of Petroleum Measurement Standards offers more information on Coriolis flow meters.[65]
While each meter type has advantages and disadvantages, one of the key attributes for measuring vent and flare gas flow rates is the turndown ratio, or ability to measure accurately over a wide range of flow rates that will be encountered for most flares. Ultrasonic, thermal mass, and Coriolis meters have higher turndown ratios than differential pressure meters, but generally at higher cost. Portable external ultrasonic meters have the added advantage that they can be installed without shutting-in production, but they have a higher cost relative to other meters. Coriolis meters have a relatively high turndown ratio and do not require annual calibration, so these meters will have lower operating and maintenance costs, and the highest accuracy. API Technical Report 2571 offers comprehensive information on different equipment used in the measurement and reporting of fuel gas flow rates.[66]
Section 2 Flaring management—a framework for the oil and gas industry

33 — Flaring management guidance
Estimating flare gas volume
In the absence of continuous metering, estimation methods are likely to be the most common approach used by upstream producers to assess flare/vent volumes. These methods utilize: gas-to-oil ratios (GORs); mass balances; process simulations; monitoring valve positions for streams routed to flare; and, more recently, remote sensing. Such methods can provide acceptable alternatives to direct flow measurements where conditions are relatively stable and the required input activity data and factors are accurately known.
l Gas-to-oil ratio Where oil production at a facility is measured but gas production is not, flared volumes can be estimated using GOR data for the wells at the facility. Corrections need to be made for any on-site uses of the gas (e.g. fuel, source gas for pneumatic devices, etc.). GOR values vary with the crude oil production rate, change according to the extent of reservoir depletion, and may become erratic at certain critical flow rates (e.g. due to slug flow conditions, reciprocating pumping actions, gas breakthrough in the reservoir, and other effects). GOR values should be developed based on 24-hour tests at normal flow rates, and should be re-evaluated whenever noteworthy changes in production or pumping rates occur.[67]
l Mass balance The mass balance approach is a traditional chemical engineering technique that can be used to provide an estimate of flared gas flows at a facility level or at an equipment level.[67] Generally, this involves identifying the difference between the measured or calculated flow rate of all input and output gas and vapor streams, minus any uses and conversions. However, unless the flare gas flow rate is large relative to the absolute errors in the other data used in the calculation, mass balance may not yield an accurate estimate. This can be a particular problem for facility-level or field-level scenarios, due to measurement challenges with input streams that have varying compositions or unsteady flow rates. In addition, production accounting systems often use vented and flared gas as a single entry to balance differences that arise from totals obtained by sales or production meters. Mass balance accuracy is typically better when estimating the volume of gas released from a blowdown or depressurization event, where the internal volume of the vessels, piping and equipment being depressurized and their initial and final pressures and temperatures are known or are measurable.
l Process simulation Process simulations can be used to develop a more granular assessment of flows (i.e. around a particular tank battery or process unit) compared to a high-level mass balance approach. With measured input and output stream flow rates, stream composition data and process temperatures and pressures, commercial process simulators are typically able to predict flared overhead streams from individual process units with accuracies of within 5–10% for most oil and gas applications.[67] However, these simulations do not account for undocumented cross-connections or leakage into the flare systems that may be present in the actual field installation, and generally do not provide accurate estimates of intermittent flows.
l Valve position monitoring and estimation This method of quantifying flare gas flow rates involves monitoring the position and upstream/ downstream pressures of the flow across valves in streams that are routed to flare. In this case, algorithms are developed to quantify the flow across the valve at different valve opening positions and differential pressures. Monitoring of all streams routed to flare need to be performed, and the estimated flows aggregated to represent the total flow to the flare header. This is a hybrid approach that falls between direct measurement and estimation, and uncertainty is higher than with metered results.
l Remote sensing Remote sensing data have been used by a variety of agencies and scientists to generate estimates of gas flaring and venting flows.[68,69,70,71,72] This approach involves: the use of infrared imaging systems mounted on trucks, planes or drones; continuous monitoring with long-range laser systems combined with optical mirrors; and satellite imaging. A well-known effort is housed at the Colorado School of Mines (formerly at the US National Oceanic and Atmospheric Administration (NOAA)). The current data product from this group leverages raw data from the Visual-Infrared Imaging Radiometer Suite (VIIRS), an instrument developed by the US National Aeronautics and Space Administration (NASA). However, other investigators have used a variety of different remote sensing datasets that capture intensity of light at night to estimate the flaring rate at global oil and gas fields. Although satellite data have been used to provide country-level estimates of flaring rates,[73] using the resulting satellite flaring estimates for further analysis of the oil and gas industry has proven challenging.
Section 2 Flaring management—a framework for the oil and gas industry

34 — Flaring management guidance
Further work is aimed at developing better correlations with satellite data and field-level data reported by production operators to government agencies.[74]
Segregation of flare volumes
Flare and vent systems exist in all segments of the oil and gas industry, and are used for the disposal of intermittent and continuous waste gas streams. Some common examples of flaring are provided in this section as well as the distinction between sweet and sour gas composition. Routine versus non-routine flaring
The determination of the cause of a flaring event is important for enabling the identification and evaluation of flaring reduction alternatives, e.g. modification projects to reduce continuous or planned non-continuous production flaring, or to provide clear procedures to avoid future unplanned non-continuous flaring events. Previously, Table 1 described high-level reasons why gas is flared, and Table 2 introduced the flaring categories defined by the GGFR which provide a consistent framework for analysis and communication. The examples of flaring in Table 5 are illustrative of other incidences of flaring that can potentially occur, which are worthy of inclusion with regard to minimization and elimination. Routine flaring of associated gas represents the most significant source of GHG emissions from flaring at upstream production operations. Controlling this source of flaring is challenging and often requires major capital investments in new equipment and/or infrastructure to manage, process or export the gas, as well as viable markets to monetize the gas. Non-routine flaring is typically intermittent and of short duration, and can be either planned or unplanned. Good governance practice would include a documented justification for any non-routine flaring event, to enable analyses of root causes and identify mitigation options for such flaring. However, regardless of the cause or classification, the ultimate goal is to pursue gas capture solutions and operating regimes that eliminate the need for any type of flaring.
Atmospheric pressure flares versus low- and high-pressure flares
Generally, the gas streams that make the best candidates for a gas monetization project are those which are at high pressure. Low-pressure and atmospheric-pressure gas streams can be monetized, but it is likely that compression (and treatment to remove contaminants) would be required. A multitude of factors need to be evaluated when determining which gas streams to pursue in terms of eliminating flaring. Table 6 on page 36 provides some general characteristics for atmospheric-pressure flares, low-pressure flares and high-pressure flares, and the scenarios where they are used. More information on pressure-relieving and flare systems can be found in three API Standards covering selection, sizing and installation.[75,76,77] Sour versus sweet flares
Reservoir conditions determine whether H2S is present in crude oil and the associated gas.[78] Although H2S may originate from geochemical or biogenic sources, it has generally been thought that H2S concentrations will increase over time due to increased microbial activity, especially if water flooding has been employed. Designing mitigation options to address the flaring of sour associated gas requires consideration of the corrosive nature of sour gas.7 Additionally, safety management systems must be in place to prevent accidental releases of uncombusted sour gas, which could expose workers to dangerous level of H2S. For those reasons, monetizing sour gas streams in lieu of flaring typically requires that H2S removal be one of the first gas conditioning steps prior to any end use scenario. There are many options[79,80] for H2S removal, but the most common method is the use of an amine-based solvent.
Section 2 Flaring management—a framework for the oil and gas industry
7 Piping and equipment for sour gas streams containing H2S (and CO2, which is often a common ‘acid gas’ co-contaminant) must be specified with more expensive corrosive-resistant materials than that needed for sweet gas streams.

35 — Flaring management guidance
Section 2 Flaring management—a framework for the oil and gas industry
Table 5 Common flaring situations
l At existing wells — where gas production exceeds existing gas infrastructure (take-away pipeline or gas processing) capacity.
l At new wells — where there is insufficient infrastructure and facilities to utilize it on-site or send it to a market, or where the geology does not accommodate gas reinjection.
l Associated gas volume is very low (e.g. a low-GOR well) or where a well location is remote, making it uneconomical to route the gas to market.
l Initial design of a gas system or plant did not consider that the gas pressure was so low that a compressor was needed.
l Flaring of gas from process units, tanks or equipment (e.g. glycol flash drum, glycol gas stripping, acid gas from gas sweetening units, compressor seals, storage tanks, produced water handling facilities, natural gas pneumatic controllers, etc.).
l Continuous purge gas is added to the flare header system or to maintain the flare pilot. l Gas is added to increase the heat content of low-Btu flared gas, or to maintain the combustion efficiency
of flared gas containing high concentrations of inert components (e.g. CO2, H2S) or hard-to-combust organic compounds.
l Third-party gas off-taker declares indefinite force majeure due to capacity limitations resulting from mechanical failures, bankruptcy or other causes.
l Follows the failure of major equipment that handles gas during normal operations, where timely repair or replacement cannot be made.
l At new wells — where infrastructure and facilities are not present to utilize the gas on-site, send it to a market or reinject it, but where such facilities can be brought online expeditiously.
l Exploration-, appraisal- or production-well testing or clean-up following drilling or completions, where no gas handling equipment is on-site or before gas compressors are commissioned.
l Preventive maintenance (on compressors, drivers, etc.), replacement of equipment or regulatory inspections requires shutdown of the gas handling system.
l Preparation of a new plant (e.g. gas handling/control/instrumentation system checks) or the required shutdown of the gas handling system for work on existing field facilities or plant systems, tie-ins of new facilities, or phase-in of new operating conditions.
l Reservoir studies, gas injector well maintenance, or offloading of sensitive wells (where there are no facilities to recover low-pressure well-head gas).
l Safety-related activities (including leak testing and emergency shutdown system testing) at wells, field facilities, plants or pipelines.
l Production well clean-up, or immediately following workovers and recompletion activities, where the gas handling equipment on-site is not designed for temporary high-volume flows.
l Issues related to production dynamics, including start-up after facility or equipment shutdowns, off-specification gas issues, flow assurance problems (slugs, etc.), changes in hydrocarbon composition or flow, etc.
l Mechanical equipment failure (e.g. pumps, compressors, turbines, etc.), loss of piping integrity, or electrical system failures.
l Failure of automated control systems, safety systems or equipment protection instruments, or failures due to human factors (e.g. lack of preparation and procedures, non-compliance with an existing procedure, etc.).
l Failure of a gas-injector well, or difficulties restarting a producer well. l Temporary unavailability of gas-receiving facilities. l Emergency shutdown with depressurization. l Activities related to start-up following emergency shutdown, including purging lines with natural gas.
CLASS DESCRIPTION
Planned continuous flaring
Unplanned continuous flaring
Planned intermittent or short-duration flaring
Unplanned intermittent or short-duration flaring

36 — Flaring management guidance
Section 2 Flaring management—a framework for the oil and gas industry
Table 6 Flare type characteristics
l Reliable operation at both full load and partial load is possible
l Low investment and operational costs
l Low maintenance costs with the use of high grade alloys, and robust design
l Reliable and stable flaring in a wide range of operating conditions
l Large turn-down ratio
l Smokeless operation under a wide range of operating conditions
l Smokeless flaring of high molecular weight gases is possible
l Air cooling of the flare tip, resulting in longer lifetime and lower operation and maintenance costs
l Reduced radiant heat for a given capacity
l Smokeless operation under a wide range of operating conditions
l Smokeless flaring of high molecular weight gases is possible
l Long tip lifetime due to steam cooling resulting in lower operation and maintenance costs
l Reduced radiant heat for a given capacity
l Smokeless operation at low heat radiation
l Lower flare stack heights
l No need for any assist medium
l Suitable for smokeless combustion of waste gas with entrained liquids
l Possible to integrate a low-pressure flare with a high-pressure flare in a single flare tip
l Smokeless flaring of low-pressure gas is significantly more difficult than smokeless flaring of high-pressure gas
l Flash gas coming off a low-pressure separator — typically has higher molecular weight requiring more air for complete combustion
l If low-pressure gas is allowed to burn without sufficient outside air or steam, the flare is likely to smoke excessively
l The flame may impinge on the flare tip, causing damage
l Generally not economical when the gas volume is large
l Higher cost than atmospheric flare
l More complex and requires more maintenance than atmospheric flare
l Requires steam source
l Not suitable for remote field locations
l Higher cost than atmospheric and air-assist flare
l System is more complex and requires more maintenance than atmospheric flare
l Generally limited to gas streams that have a low heat content, burn readily, and require less air for complete combustion without producing smoke
l Upstream oil and gas sector
l LNG terminals and natural gas compression stations
l Upstream oil and gas sector
l Tank farms and terminals
l Pipeline transport
l LNG and natural gas terminals and compressor stations
l Midstream and downstream oil and gas sector
l Upstream oil and gas sector
l Pipeline transport
l LNG and natural gas terminals and compressor stations
FLARE TYPE ADVANTAGES DISADVANTAGES APPLICATION
Atmospheric flares, non- assisted
Air-assisted low-pressure flares
Steam-assisted low-pressure flares
High-pressure flares

37 — Flaring management guidance
Gas treatment can occur close to the well head —where the associated gas streams from several wells are combined and then sent through a modular gas sweetening unit — or at a large gas plant treating significant quantities of gas. In either case, an amine-based solvent in the sweetening unit absorbs H2S and CO2 in a packed tower contactor. The H2S-rich solvent is regenerated by driving off the acid gases (H2S and CO2) and the lean solvent is recycled back to the absorption tower. If there is sufficient quantity, such as at a gas plant, the high-H2S stream from the regeneration step can be converted to elemental sulfur. For smaller-scale operations at field processing facilities, an alternative to elemental sulfur recovery is the injection of the acid-rich gas stream into a suitable, authorized underground zone.
ESTABLISHING COMPANY FLARING AND VENTING POLICY AND PROCEDURES
This section provides a description of the various scenarios where associated gas flaring occurs, and the approaches that can prove helpful in reducing volumes flared.
Unconventional and shale operations
Unconventional hydrocarbon resources are those that are accessed via a variety of extraction techniques other than via traditional vertical wells. They include heavy oil, oil sands, tight oil, oil shale, shale gas, coal bed methane, and tight gas. Of these, the most significant growth in recent history has been in tight oil and gas production (sometimes referred to as shale oil and gas) due to the use of horizontal drilling and hydraulic fracturing, as shown in Figure 10.
Section 2 Flaring management—a framework for the oil and gas industry
Figure 10 Horizontal wells in the US [81] Notes: Vertical well production also includes wells created by directional drilling and by unknown drilling type. Tight oil volumes include liquid production from shale gas formations, and shale gas totals include natural gas volumes from the tight oil formations.
������
� ��� ���# ����!
�����
��� ���% ��# ����!
����
���
�8 ���
���%��� #%� ���� �� �����
/125121
41315161
2112212/1
01E1C1/1
/11E/1251
21
41
31
51
01
E1
C1
/1
/11E/1251
2
4
3
5
0
E
C
/
/11E
����������8 ���#��������
, �������8 ���#��������
����������8 ���#��������
, �������8 ���#�������� , �������8 ���
����������8 ���
������
���
���% ��# ����!
1
211
411
311
511
011
E11
C11
/11
2*22
2*2/
2*2C
2*2E
2*20
2*24
2*23
2*25
2*26
30/ Tight oil development has surged since 2010 in the Permian Basin and the Bakken region in the US. Along with this, the production of substantial volumes of associated gas and a corresponding increase in flaring have attracted significant attention. One perspective on the amount of gas flared in the Permian Basin is that, based on the flare rates in the third quarter of 2019, if all flared or vented gas was captured and liquefied, it could fill a Q-Max LNG carrier (the world’s largest carrier size) every 10 days.[83] Figure 11 shows the upward trend in the quarterly volumes of natural gas flared in the Permian Basin.
Figure 11 Trend in quarterly flaring in the Permian Basin (November 2019 estimate) [82]

38 — Flaring management guidance
Challenges faced when addressing flaring in unconventional operations
Several factors contribute to the growth in associated gas production from tight oil plays:
l In tight oil formations, such as in the Bakken region in Central North America, it is not unusual for the GOR (the ratio of natural gas to crude oil production) to gradually increase as wells mature. However, once pressure in the formation (or perhaps in a more localized section of the reservoir[84]) reaches the bubble point — where natural gas dissolved in crude separates naturally — gas production can begin to increase. Figure 12 illustrates this trend in increasing GOR in the Bakken region over time.
l Unconventional wells characteristically have a high initial production and steep decline curve. Consequently, to grow production from a field (or even just maintain production levels), new wells must be drilled and completed at a rate beyond that required in conventional fields; production growth therefore requires an ongoing, high level of drilling activity.
l It is a challenge for production operators and midstream entities to match equipment design with the high initial production and steep decline profiles for operating areas. The building of additional infrastructure to gather, process and transport associated gas and related liquids products often lags the growth in production of gas volumes.[87,88,89,90,91,92] A major reason cited for this disconnect is different planning and development horizons for production and midstream infrastructure. While it can take only 6 months to bring a well online, gas processing plants have lead times of 18–36 months (depending on the complexity of unit operations included), and it can take years to bring pipelines online, primarily to secure rights-of-way and complete government permitting processes. These downstream delays can be exacerbated if there is a contemporaneous erosion of natural gas prices as supply additions outpace demand growth, which can negatively affect returns on capital expenditures. Furthermore, midstream infrastructure investments are typically made with a 15-year economic horizon, while tight oil payback horizons can be in the 2–4 year range. The short-cycle wells make tight oil development highly cyclical depending on oil prices.[93] Producers may be hesitant to take the risk of making long-term commitments to minimum gas processing and transmission volumes because it will force capital outlays to grow production when oil prices are low.
Section 2 Flaring management—a framework for the oil and gas industry
Figure 12 Trend in increasing gas-to-oil ratio in the Bakken Region, 2007–2017 [85]
�� ���% ���%������������# �� ��� ���%����
/123
1
011
2:301
/:111
/:/01
2:011
2:/01
2:111
301
/113
/115
/116
/121
/122
/12/
/12C
/12E
/120
/124
/01
Box 2 Production decline in conventional vs unconventional operations
The Permian Basin provides a comparison between unconventional and conventional production decline. At the start of 2010, IHS Markit noted that production for the Permian Basin was approximately 880,000 barrels per day, with virtually all production coming from conventional operations. By the end of 2010, that group of wells produced 767,000 barrels per day — a decline of 110,000 barrels per day, or 14% of the production volume at the start of the year.
In 2019 most wells drilled in the Permian Basin were shale wells (hydraulically fractured), which decline much faster. At the start of the year, production stood at 3.8 million barrels per day, a million barrels per day higher than the year before. By the end of 2019, IHS Markit expected base production to decline by approximately 1.5 million barrels of oil per day —a 40% base decline rate.[86]
These two cases illustrate the challenge in relying on past practice to predict future performance, especially as new technology is applied and competitive pressures shift.

39 — Flaring management guidance
l A possible issue is that tight oil development has attracted short-term investors. Private equity funded exploration and production (E&P) companies are designed to be sold once reserves are booked. Such companies have less incentive for investing in gas infrastructure, particularly when gas flaring is an option. The impact of this phenomenon is illustrated in Figure 13 but may be temporary as the industry consolidates and short-term financial investors exit.[94]
Certain process steps and constraints unique to tight oil operations also contribute to the amount of gas flared:
l Flowback following hydraulic fracturing generates a mixed stream consisting of crude oil, completion fluid and produced water, solid particulates such as sand, and gas. Solids prevent the flowback stream from being processed through normal production facilities. Instead, the stream is sent through special temporary facilities for a period ranging from many days to weeks, to remove the solids and separate crude oil, water and gas, which is flared.
l Once a well is in production, failure of a level control device in a field gravity separator can allow all the liquid to drain from the unit and enable gas to flow unrestricted to a storage tank meant for liquids. Since the gas flow would overwhelm the system and could create a safety concern, automatic devices send the gas to a safety flare system. Failures of pump, flow rate and compressor controllers can also lead to similar safety concerns, hence the systems are designed to incorporate automatic relief valves which send gas to flares, or to a vent in the case of a sudden high-volume, high-pressure flow.
l Many planned maintenance activities can be performed without disrupting gas flows. However, for certain components in the production process the only option is to curtail production or send gas to a flare. Curtailing production carries the risk of damaging the wells and/or the pump system in the wells, thereby potentially delaying the recovery of the wells. Unplanned maintenance is often more challenging. If a component in a facility fails but does not cause a fail-safe device to trip, it may take time to obtain replacement parts and schedule repair crews. In such cases, flaring a small portion of the produced gas for a short time may be the best decision for all stakeholders even if the exact time frame for the repair is uncertain.[97]
l Water and natural gas liquids that condense in gas gathering systems can restrict capacity and create a safety hazard. Removal of these liquids is performed by sending a plunger-like device called a ‘pig’ through the pipeline to push the liquids and any solids out. Some ‘pigging’ operations cause a small amount of gas to be sent to a safety flare at the pig receiving location, but in some cases the accumulation can be unexpectedly large. When this occurs, safety flaring can cascade throughout the system, even at production facilities further upstream of the receiving site.[97]
Section 2 Flaring management—a framework for the oil and gas industry
Figure 13 North Dakota gas capture rates and goals [95, 96]
# �� ��� ��%�����������
01
31
211
51
/12E
/120
/124
/123
/125
/126
/1/1
/1/2
41
61
������?�'�������� ��#������� ����%��� �������������-���%�������� ������� �������.
��� ��#����/125
������?�'���J�������#��� �������� �� �����62A
����, � ��/1/1
��#��� ����� ��������#��� �
In 2014, the North Dakota Industrial Commission (NDIC) Order No. 24665 established a drilling permit policy that requires producers to submit a gas capture plan with every drilling permit application. Gas capture goals were also set. As shown in Figure 13, the state natural gas capture rate fell below target for a period of time, primarily due to insufficient natural gas processing capacity and lack of pipeline infrastructure, but has since recovered.

40 — Flaring management guidance
Commenters on a rule[98] proposed by the U.S. Bureau of Land Management noted many other obstacles that preclude immediate connectivity of new wells to gas infrastructure, some of which are summarized below:
l A natural gas gathering line/system must be permitted, installed and operational.
l A contractual right to flow into the gas gathering system must be agreed with the company that owns the gathering line.
l Necessary permits and rights-of-way must be obtained for the pipeline from the well site to the natural gas gathering system.
l The natural gas must meet the specifications of the natural gas gathering line.
l There must be adequate reservoir pressure to allow the gas to flow into the natural gas gathering line to clean up the well and not choke it.
l The natural gas gathering line must be operational at the time of the completion.
l A gas gathering system with sufficient capacity must be in place.
l Incomplete data on gas composition limits the ability to design the production equipment or pipeline before starting operations.
l The surface rights must be obtained for installing production equipment.
In the US, and potentially in other locations, mineral leases contain expiration clauses tied to specific milestones to encourage the development of a leasehold in a timely fashion. One typical milestone is the performance of a well completion by a specified date. If the date is missed, the lease expires, causing the mineral rights owner to lose the cost of the lease as well as the investment in assessing the lease and preparing to drill it. It is common for operators in a low-price natural gas environment to drill and complete a well prior to acquiring surface equipment or contracting for gathering system space. Delays due to the lack of available reduced emissions completion (REC) equipment create an additional risk that the operator could fail to complete certain steps specified in the contract; this could negate the contract and cause the operator to lose their rights to the minerals.
Addressing flaring in unconventional operations
Thoughtful planning prior to the start of operations can produce significant flare reduction benefits. The API has developed a comprehensive document[99] to guide the assessment and mitigation of potential environmental impacts in exploration and production operations, including those where hydraulic fracturing will be used. Some of the solutions that have been implemented by operators to address flaring are described below. Each of these should be considered in a company policy that addresses flaring from tight oil operations.
l Vapor recovery units (VRUs) VRUs are used on the majority of production facilities at leading companies, with some installing multiple units on tank batteries (regardless of the economics of recovered gas) to ensure 99+% capture efficiency. Some companies have chosen to make VRU capacities the limiting factor for new facility design —using measurements from several facilities to create a conservative benchmark for the amount of gas to be recovered per barrel of oil produced.[100]
l Scalable leased equipment for flare gas monetization A number of well service providers are offering equipment leasing options to address gas flaring at the well head or production area scale using portable, skid-mounted solutions, as described in Section 1. These include options such as flare gas to CNG and flare gas to data centers. The ability to scale using modular equipment to follow capacity declines (or increases) makes these leased equipment options attractive for addressing the most challenging flare gas utilization applications.
l Pre-planning for take-away To ensure that adequate take-away infrastructure is in place before bringing a well online, it is advisable to consider capacity as a manageable constraint that is factored into the well/field development plan. Just as time is required to overcome the constraint of securing a government agency well permit prior to drilling, so too is time required in the schedule for planning, communication and coordination to organize gas take-away capacity with midstream partners.[101] Some companies opt to own and operate proprietary gathering and compression systems to provide a higher level of control and ensure take-away.
Section 2 Flaring management—a framework for the oil and gas industry

41 — Flaring management guidance
l Up-front capacity agreements The NDIC issued an order in 2019 to encourage ‘firm’ service contractual agreements (essentially, a capacity guarantee) along natural gas gathering pipelines thus reducing the probability of well shut-ins and flaring.[102] Such contracts may provide a greater level of certainty to producers and encourage faster investment in gathering line infrastructure because economic risk is shared between natural gas producers and midstream companies.
l Operational upset resiliency Proactively increasing reliability within the operational supply chain can mitigate the duration and volume of gas flaring caused by an operational upset. Once an unplanned event occurs, practicing just-in-time planning and implementing escalation processes to ensure that decisions are made by an individual with appropriate authority and sufficient resources will be of considerable benefit. Timely actions to sanction overtime, expedite parts, move crews around and obtain temporary equipment such as rental compressors, can make a significant difference in reducing flared volumes prior to shutting in production, if necessary.[103]
l Monitoring and control capability Leading companies include emissions monitors and gas controls as non-discretionary elements in new facility designs. These tools facilitate real-time, automatic tracking of changes in operating pressure and flared volumes at the facility, route and foreman levels.[103] When considered during the initial facility design process, these types of monitors and controls are relatively inexpensive to install and integrate with supervisory control and data acquisition systems.
New field developments
For new oilfield development projects, the consideration of associated gas capture and monetization alternatives should be among the highest-priority tasks carried out at the earliest stages of planning. Since market, governmental and commercial aspects can present hurdles to associated gas projects, the planning cycle is often longer and more complex than for the crude oil production portion of the project. However, since there is wide latitude at the inception of a new oilfield development project, each of the options for gas utilization described in the section on Flare gas-to-market options and principles (page 19) should, along with newer technologies, receive a preliminary assessment.
The project analysis frameworks described under Technology and economic assessment on page 51 and Economic and technical risk assessment on page 60 can be applied to identify and evaluate technical and economic factors to screen possible design alternatives. Those that demonstrate a feasible business case can be advanced to a decision-making process — one that weighs relevant factors (e.g. the ability to consume available gas volumes, capital and operating costs, product pricing, profit, commercial risk, schedule, government approval, stakeholder acceptance, etc.) —to determine the most attractive option. If no alternatives satisfy the required criteria, consideration should be given to expanding the gas project boundary by engaging other producers, consumers and/or infrastructure owners. Alternatively, options aimed at modifying the economic approach or improving the fiscal incentives to enhance the viability of alternatives should be explored. A model approach for company policy should consider the following elements:
l The company should establish a goal of avoiding all planned routine flaring of gas, whether continuous or intermittent, even if such flaring is allowed by government regulations or agency-issued authorizations and permits. The only flaring capacity that would be designed into the system is that which is necessary for emergencies or disposal of gas that, due to its composition, is otherwise unusable.
l For new facilities, flare systems should be designed to handle high-pressure sources to recover gas during normal operation. Recovery of gas from flare systems handling low-pressure systems during normal operations should be considered.
l The development plan should include adequate take-away capacity, including contingent capacity — which may include shared capacity with other operators —for excess flows due to planned outages and maintenance activities, from the start of drilling operations. This approach would drive holistic decision-making across an entire field over its planned economic life, generating efficiencies in planning, investment and permitting activities, and increasing stakeholder transparency.
Section 2 Flaring management—a framework for the oil and gas industry

42 — Flaring management guidance
l Expenditures for gas production, gathering and processing infrastructure, including controls and monitoring systems for gas management and emergency flaring, should be considered in upfront project economic evaluation. Offshore operations present a special challenge since platform design and deck space must be sized to accommodate gas handling facilities, recognizing that volumes may grow during a field’s lifetime due to increasing GOR, gas souring, etc. Planned expenditures would consider the location and sequencing of infrastructure, from well head to gathering lines to processing facilities. This will synchronize midstream pipeline, compression and processing capacity as the drilling program advances and production volume grows over time.
l During the early development stage, consideration should be given to adequate spare capacity for the gas handling equipment, especially compressors, to avoid flaring due to equipment reliability issues.
l Where gas monetization options are not viable, consideration should be given to reinjecting the gas into depleted reservoirs through older wells as a potential flaring reduction opportunity.
Early development facilities
The development stage takes place after successfully completing the appraisal period and before the beginning of the field production. Work follows the development plan, which sets out the strategy and sequence of activities required to optimally develop a field. Well placement and design, including completions (including hydraulic fracturing), are key to maximizing the recovery of hydrocarbons. For onshore operations, production facilities such as gathering lines, field separators, processing units and tankage are added to process recovered oil and gas. Offshore, many of the structures are sized, built and placed ahead of development drilling. Commissioning of all equipment, field production facilities, gathering systems and processing plants is necessary to ensure safe and reliable operation. This includes testing of power systems, pipelines, tank integrity and, for offshore production platforms, the subsea lines as well as the onshore receiving facilities. Depending on the size of the facilities, many individual tests are needed to confirm operability. The gas used in testing and commissioning the gas handling components and systems is typically flared, but this
involves a minor volume of gas compared to the life-cycle throughput. Traditionally, the focus of early development has been to have systems ready to bring oil production online and to a sales point as quickly as possible. However, gas gathering, compression, processing and take-away should all be considered at the same time as the oil facilities are installed. A model approach for company policy covering commissioning might include the following elements:
l Philosophy: Gas flaring and venting during commissioning should be kept to the lowest level that is consistent with the safe and efficient commissioning of oil- and gas-related plant.
l Installation: All gas handing system processes (gathering, field separation and compression, central processing plant, product take-away) should be constructed, tested, commissioned and able to receive gas before the first flow of oil. Facilitating smooth acceptance testing begins at the project design phase when critical equipment, systems, instrumentation (including flare gas flow meters) and controls are evaluated and specified. To minimize flaring, preference is given to assets that have high operational reliability over those with lower initial cost. All equipment that can cause or contribute to gas flaring (e.g. pressure relief and blowdown valves) should be pre-tested and certified to operate as specified. Verification with the suppliers is managed by the project design and construction teams.
l Coordination: As soon as possible after the first flow of oil, all gas should be routed through the gas handling system. Temporary flares should be employed during the drilling and completion phase to avoid venting. The duration of flaring should be limited to the degree possible (e.g. between one and three months), and a maximum limit placed on the quantity of gas flared. A plan for reducing initial start-up flaring should be developed and communicated; this should outline a clear commissioning schedule, identify acceptable flaring activities during equipment testing and commissioning, and provide details of mitigation measures that should be used to minimize the amount of gas flared. Measures include: l the establishment of commissioning procedures
and a permit to work system which have been developed and reviewed by the commissioning and operations teams for safety and efficiency, and which address simultaneous operations;
Section 2 Flaring management—a framework for the oil and gas industry
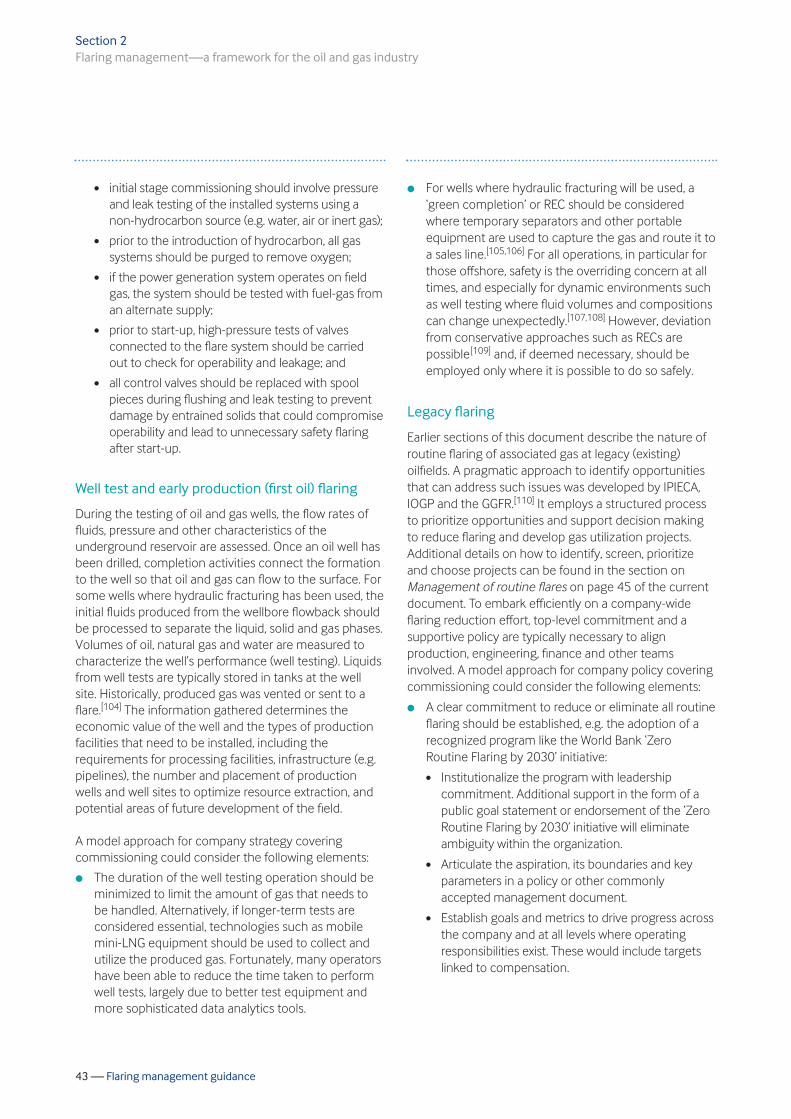
43 — Flaring management guidance
l initial stage commissioning should involve pressure and leak testing of the installed systems using a non-hydrocarbon source (e.g. water, air or inert gas);
l prior to the introduction of hydrocarbon, all gas systems should be purged to remove oxygen;
l if the power generation system operates on field gas, the system should be tested with fuel-gas from an alternate supply;
l prior to start-up, high-pressure tests of valves connected to the flare system should be carried out to check for operability and leakage; and
l all control valves should be replaced with spool pieces during flushing and leak testing to prevent damage by entrained solids that could compromise operability and lead to unnecessary safety flaring after start-up.
Well test and early production (first oil) flaring
During the testing of oil and gas wells, the flow rates of fluids, pressure and other characteristics of the underground reservoir are assessed. Once an oil well has been drilled, completion activities connect the formation to the well so that oil and gas can flow to the surface. For some wells where hydraulic fracturing has been used, the initial fluids produced from the wellbore flowback should be processed to separate the liquid, solid and gas phases. Volumes of oil, natural gas and water are measured to characterize the well’s performance (well testing). Liquids from well tests are typically stored in tanks at the well site. Historically, produced gas was vented or sent to a flare.[104] The information gathered determines the economic value of the well and the types of production facilities that need to be installed, including the requirements for processing facilities, infrastructure (e.g. pipelines), the number and placement of production wells and well sites to optimize resource extraction, and potential areas of future development of the field. A model approach for company strategy covering commissioning could consider the following elements:
l The duration of the well testing operation should be minimized to limit the amount of gas that needs to be handled. Alternatively, if longer-term tests are considered essential, technologies such as mobile mini-LNG equipment should be used to collect and utilize the produced gas. Fortunately, many operators have been able to reduce the time taken to perform well tests, largely due to better test equipment and more sophisticated data analytics tools.
l For wells where hydraulic fracturing will be used, a ‘green completion’ or REC should be considered where temporary separators and other portable equipment are used to capture the gas and route it to a sales line.[105,106] For all operations, in particular for those offshore, safety is the overriding concern at all times, and especially for dynamic environments such as well testing where fluid volumes and compositions can change unexpectedly.[107,108] However, deviation from conservative approaches such as RECs are possible[109] and, if deemed necessary, should be employed only where it is possible to do so safely.
Legacy flaring
Earlier sections of this document describe the nature of routine flaring of associated gas at legacy (existing) oilfields. A pragmatic approach to identify opportunities that can address such issues was developed by IPIECA, IOGP and the GGFR.[110] It employs a structured process to prioritize opportunities and support decision making to reduce flaring and develop gas utilization projects. Additional details on how to identify, screen, prioritize and choose projects can be found in the section on Management of routine flares on page 45 of the current document. To embark efficiently on a company-wide flaring reduction effort, top-level commitment and a supportive policy are typically necessary to align production, engineering, finance and other teams involved. A model approach for company policy covering commissioning could consider the following elements:
l A clear commitment to reduce or eliminate all routine flaring should be established, e.g. the adoption of a recognized program like the World Bank ‘Zero Routine Flaring by 2030’ initiative: l Institutionalize the program with leadership
commitment. Additional support in the form of a public goal statement or endorsement of the ‘Zero Routine Flaring by 2030’ initiative will eliminate ambiguity within the organization.
l Articulate the aspiration, its boundaries and key parameters in a policy or other commonly accepted management document.
l Establish goals and metrics to drive progress across the company and at all levels where operating responsibilities exist. These would include targets linked to compensation.
Section 2 Flaring management—a framework for the oil and gas industry

44 — Flaring management guidance
l A structured plan should be developed to facilitate implementation and focus attention. Later sections of this guidance document offer suggestions on project identification and approaches to prioritizing source reduction/elimination opportunities, screening technology options, developing use case alternatives and driving decision-making. Such topics should be included in the structured plan.
l Economics can present a significant hurdle for legacy flaring reduction projects, even when a good technological solution exists. Considering unconventional approaches to financing flaring reduction projects can help to overcome the ‘it does not meet our internal rate of return’ inertia and reduce the amount of capital that must be funded by the company.
l Implementing projects is a core competency for most oil and gas operators; this competency is completely transferable to the execution of projects where associated gas can be used to satisfy in-field needs. For other projects, the solutions may require non-traditional partnerships (e.g. gas to power) or proprietary technology (e.g. mini-LNG), or may involve an extended web of government ministries, financing entities, and local and regional stakeholders. In such cases the top level commitment to the goal of reduced flaring can help internal constituencies to recognize the imperative to make projects happen.
l Another key element is active monitoring of progress. This requires that robust flare gas accounting systems are deployed and maintained. Monitoring should begin with a consistent baseline of all flaring points, with volumes reported as routine flaring, non-routine flaring and safety flaring, as applicable. Accuracy can be improved with periodic (at least annual) updates. Goals and metrics should be tied to real data, with less reliance on estimates, especially as progress is disclosed publicly.
l A process should be established to allow questions to be raised, and to encourage all involved parties to work towards a common understanding of definitions and boundaries, to align understanding, eliminate conflicts and build support for the goals. Consideration should be given to the flaring categories defined in Table 2 (page 15) and the
examples provided in the section on Segregation of flare volumes (page 34) to help build a company-specific rulebook. An example ‘zero routine flaring checklist’ is provided in Annex III of this document.
Venting at upstream oil and gas facilities
Venting of associated gas is the controlled release of gases into the atmosphere in the course of oil and gas production operations, typically during upset or maintenance conditions, from unintentionally unlit flares or from other sources. Examples include:[111]
l crude, condensate, or water storage tanks operating without vapor recovery systems, especially where tank flashing losses occur;
l venting of natural gas diverted from oil and gas compression or processing equipment due to a system upset or emergency conditions, or equipment/pipeline blowdowns for maintenance;
l routine emissions from natural gas-driven pneumatic controllers and pumps;
l venting from compressor seals (both reciprocating and centrifugal compressors);
l routine emissions from glycol dehydrator regenerator and flash tanks, and amine natural gas sweetening units; and
l routine well venting during drilling and completions, workovers or liquids unloading activities.
Because venting results in higher emissions of methane than flaring, and therefore significantly higher GHG emissions, controlling methane emissions has been a focus for some time. Companies have made voluntary commitments (e.g. Methane Guiding Principles,8 Climate and Clean Air Coalition (CCAC) Oil & Gas Methane Partnership (OGMP),9 among others), industry associations have established challenging programs, and regulators have developed reporting programs and imposed specific operating practices. Many resources are available in the public domain to address methane emissions, including the Natural Gas STAR Program database[112] maintained by the United States Environmental Protection Agency (US EPA).
Section 2 Flaring management—a framework for the oil and gas industry
8 https://methaneguidingprinciples.org 9 https://www.ccacoalition.org/en/resources/oil-gas-methane-partnership-ogmp-overview

45 — Flaring management guidance
The largest sources of venting, such as uncontrolled flashing from storage tanks, can be addressed by the same solutions that have been discussed for associated gas flares. Even flaring is a preferred option over venting from a GHG emissions standpoint.
MANAGEMENT OF ROUTINE FLARES
The GGFR’s research has shown that the overwhelming majority of flared gas (and thus the largest contribution to GHG emissions from flaring) results from the continuous flaring of large amounts of associated gas as part of the regular operations of an oil production facility. Controlling this source of flaring often requires major capital investments in new equipment to manage, process or export the gas. Building upon the information presented under Historical and current data gathering and analysis (page 30) and Establishing company flaring and venting policy and procedures (page 37), the remainder of this section addresses certain key aspects of the assessment and review stages involved in the selection of flaring reduction and gas monetization opportunities. Other elements of the process that are needed to take a flare reduction project from concept to implementation are covered in
the 2011 guidance on flare management plans developed by IPIECA, IOGP and the GGFR[113] which describes a seven-step decision-making approach for flare reduction/gas utilization activities, as summarized in Figure 14. Readers are strongly encouraged to review this resource.
Assessing local conditions and policies
Constraints on allowable legal flaring activities, and conditions placed on the utilization of natural gas, are important considerations that frame any flaring reduction plan. Identifying and assessing these boundary conditions is an essential first step in the development of the plan. Compliance with local and regional regulations and policies covering environmental protection, safety/risk management, land access, etc. is essential. Such obligations can go beyond formal flaring reduction requirements mandated by local law. The applicable legal structures and commercial conditions covering gas resource and gas infrastructure ownership can significantly impact the choice of flaring reduction project activities. An understanding of the commercial environment affecting oil production and gas utilization is required to assess reduction options and facilitate the successful implementation of a project.
Section 2 Flaring management—a framework for the oil and gas industry
Figure 14 Flare reduction planning cycle [113]
#�2�45����� ��� ��������������� �������, ����%���������������������%��������������� �� ���$
#�2�6���, !����� ��������������%��� ,���� ������������������%� ��������������� ������������7
#�2�8���� ���� ���� ���%������������ ����� ��� ����������� �$�����������-�0�(� ��9���������)�����(� ���9� �������&��&�� �����9���/���������%���������7
#�2�: �������������������)����������������%���#������!������ �:����' !����� ���� ���� ���������� ��%��� � �����$
#�2�;5���������#����8������� �� ���$"���� ��##������� ��%���! ��� ���������� ������$? , ��#���##����#���%���#��9 ���������� ���' !� � ������ ���� ��$
#�2�<����������� ����(����������������������)����7�� ��%!��������������� ���� ���� ��:��������� ���� �8������� ����' ���� ���������� ����� �$
#�2�=#%����/�������������������� ���)����7�;� ����� :�� � ��� $
"� ��� �

46 — Flaring management guidance
Local stakeholders, NGOs and public expectations form another important context into which flaring reduction activities must fit. The API has developed guidance for effective engagement of local communities and other stakeholders.[114] Where the government or NOC is an owner of the gas resource, there may be other non-project-related requirements set by the host government that will need to be considered (e.g. public welfare, international trade, national security, etc.). Flare reduction projects may also be shaped by government incentives, carbon taxes, and/or goals that call for the utilization of a certain percentage of produced gas in support of local industry or to provide gas to local communities, sometimes at reduced prices. Successful planning requires consideration of all such relevant factors. Creating a thorough understanding of this context for flaring reduction in a region will lead to better choices in gas utilization and flaring reduction projects, and better prospects for successful implementation. The investments made to form or strengthen relationships with key partners, to build an understanding of issues and to create a climate of shared objectives, will drive successful flaring reduction programs.
Reviewing associated gas forecasts
As described in the section on Associated gas forecasts on page 30, the forecasting of associated gas is essential for developing an effective flaring reduction strategy. For legacy assets, knowing where to focus the activities of a flaring reduction program is key to achieving successful outcomes. Obtaining information on the different gas sources and flare points is essential, including mapping of all flared gas sources and volumes, compiling data on gas composition and pressures, and forecasting to understand the volume of gas flaring over time in order to justify the investment. However, there may be little direct measurement of flare gas volumes and compositions (especially in legacy operations), and many assumptions and estimates often need to be made when companies account for ‘waste’ gas, even for routine reports required by regulatory agencies. For most operations, and especially for tight oilfields, an understanding of drilling plans, decline rates and GOR data will need to be factored into the analysis. As noted on page 30, a decline curve analysis coupled with drilling plans will set the baseline for production growth, and will help to identify whether significant temporal variations in
gas production can be expected. GOR data can be used to determine the relative economic value of the gas and oil produced by a particular location, along with the value of the oil produced per unit of gas flared, as oilfields age or as new production techniques are employed. Finally, the application of current data analysis tools will often yield further insights and aid in determining the set of priority high-volume flaring sources that dominate the overall picture, as well as other less obvious opportunities. Focusing flaring reduction efforts on these most important sources is the preferred initial approach, rather than devoting limited time and manpower to addressing sources of lesser impact. A general template[115] is available for this type of identification process, which enables a large number of sources to be quickly and effectively broken down into a smaller number of distinct categories.
Developing a utilization strategy
With basic data on flaring volumes in-hand, identification of commercial project activities designed to address the priority sources of associated gas (based on the technology options described in the section on Flare gas-to-market options and principles on page 19) can proceed. For each combination of gas source and potential alternative use, information should be obtained to develop a preliminary scope (gas volume utilized and capital cost), expected timing and the high-level factors affecting successful completion of the project. A first step in the process of developing a flare gas utilization strategy is to understand the volumes of associated gas that are available for monetization, as previously discussed.
Section 2 Flaring management—a framework for the oil and gas industry

# �'�#����
�����-A.
1
E1
211
51
41
/1
! ���C1/0/120210
�# ������
;21
;01
;61
���7����%�� �����K
# �'�#����
�����-A.
1
E1
211
51
41
/1
! ���C1/0/120210
;21:��E
;C0:��C
;40:��/
;61:��2
>4
>6
>8
>:
;���� � ����#���������,���� ��, ����� K
47 — Flaring management guidance
Multiple levels of uncertainty and variability exist which, over time, make flare gas monetization challenging. Any oilfield’s production forecasts are statistically uncertain. This is recognized and is the reason why producers develop with P90, P50, P10 forecasts.[116] This uncertainty also translates to associated flare gas volumes. (See Figure 15.) Even at a set production level (e.g. P50), there is short-term variability in gas production, and over longer time frames, uncertainty. Figure 16 provides a conceptual associated gas production profile for a given oil
production profile, illustrating the tranches of possible gas production volume over time from most certain (P90, V1) to least certain (P10, V4). Only volume 1 (V1) is quasi certain and relatively constant over the life of the field and over the time period needed to amortize the investment in any gas capture and utilization project. Volumes V2–V4 become increasingly uncertain (and likely more variable) over time, making each tranche more challenging in terms of building a capture/utilization investment project.
Section 2 Flaring management—a framework for the oil and gas industry
Figure 15 Typical oil and gas production forecast [derived from 117]
Figure 16 Conceptual illustration of associated gas tranches for a given oil production profile [derived from 117]

48 — Flaring management guidance
The associated gas tranches (V1–V4) shown in Table 7 are important when developing a strategy for utilization that will be feasible and bankable. To achieve zero routine flaring, and given that only production volumes with higher certainties are typically bankable (i.e. can support external financing), it is important to develop commercial/marketing/financing structures to address (de-risk) specific fuel/feedstock supply uncertainties.
By further separating this effort into technology review, project economic estimates and financial analysis, key causal relationships and sensitivities can be isolated and modelled. The procedural steps for developing a gas utilization strategy are shown in Table 8 on page 49. After collecting data, and performing the analyses described above, it is helpful to construct a narrative or story for each of the cases using a common framework (example below). The process of synthesizing the information can reveal missing elements and hidden biases that a more granular analytical process sometimes misses. The two basic strategies for reducing associated gas flaring, other than shutting in high-GOR wells are: capturing the gas and utilizing it within the field, or sending the gas to market by growing sales volumes to existing outlets or developing new markets and/or products.
Section 2 Flaring management—a framework for the oil and gas industry
Table 7 Associated gas tranches related to associated gas monetization opportunities
Associated gas (V1) reserved for in-field use to facilitate oil production
Operator may commercialize gas using its internal financial means or offer and guarantee this flare gas volume (V2) to a third party with the right risk/reward structure
With a bankable transactional and commercial structure, the objective is to bring this volume (V3) to the market, including by means of third-party investment
Projects based on highly uncertain gas volumes (V4) must have company policy or government policy support and/or external financing, e.g.:
a. zero routine flaring commitment
b. concessional loans/grants
c. regulatory framework: ban on routine flaring or a punitive (i.e. high cost) flare payment
Not applicable — gas is used for producer’s own consumption
Operator investment solution or with possible external investor
Multi-party investment solution, with essential investment grade building blocks and incentives
Bankability is often challenging and requires creative business models and government/ private sector collaboration
TRANCHE DESCRIPTION BANKABILITY
V1
V2
V3
V4

49 — Flaring management guidance
Section 2 Flaring management—a framework for the oil and gas industry
Table 8 Key procedural steps for developing a gas utilization strategy
See Table 7 on page 48.
l What are the performance characteristics and risks of the technology?
l How mature is the technology and has it been commercially demonstrated (i.e. conduct a maturity level technology assessment)?
l How will it advance over time in terms of cost, performance and risk?
l How does it compare to other existing and near future competing technologies?
l What are the optimized configurations under likely use conditions?
l What are the expected products and output rates?
l What are the relevant supply chain impacts and business schemes from flared gas source to market/end users?
l What are the capital cost components, estimated values, sensitivities and uncertainties?
l What are the GHG reduction potential and sustainability key performance indicators (e.g.: benefits from substituting gas for fuels with higher CO2e footprints; CO2 avoided; cost-effectiveness in terms of USD/tonne CO2e reduced; aggregated sustainability index)?
l What are the fixed and variable operating and maintenance costs, including plant turnarounds?
l What are the expected product prices and revenue over the project lifetime?
l What are the internal rate of return, net present value and net cash flow sensitivities from identified project risks including market demand and regulatory changes?
l Is the project best executed by the production operator or by a third-party with special technology or more operating experience in gas utilization projects?
l What is the most likely method of financing the project (internal capital or external debt, equity or other financial sources)?
l What is the company’s hurdle rate or minimum acceptable rate of return?
l Which market conditions are necessary/sufficient for the technology to be deployed (product price, demand, growth, competition, regulations, global/national/industry economic growths, lending rates, risk perceptions, alternative investment opportunities)?
l Are carbon credits or tax credits available?
l Does an alternative case used for financial modeling include the impact of government mandated shut-in of oil production to reduce flaring?
l What government involvement or oversight is anticipated?
l Identify the important hurdles that can affect project schedule, including: governmental authorizations; environmental permitting; land access agreements; product sales agreements; long-distance transportation logistics (e.g. trans-border pipelines; LNG shipping); etc.
l What are the key stakeholder issues, mitigation options and costs?
l What value chain risks exist and can they be mitigated through business structures, contractual arrangements or financial instruments (e.g. insurance)?
l Are there opportunities to expand the boundaries of the project to include associated gas from other fields, even from those operated by other companies, to achieve economies of scale?
PROCEDURAL STEP CONSIDERATIONS
Step 1: Identify associated gas tranches
Step 2:Technology review
Step 3: Project economic estimates
Step 4: Financial analysis
Step 5: Other factors

50 — Flaring management guidance
Own consumption
Often, the least expensive options for flaring reduction are ones that can be carried out as part of the field’s operations, especially when the necessary equipment is available at the beginning of operations (e.g. reinjecting produced gas for pressure maintenance, gas lift or enhanced recovery, or using gas within the field for distributed electricity generation). Gas reinjection in oil reservoirs is used to increase pressure in the formation to enhance hydrocarbon production. Gas lift, which is an artificial lift method that is different from gas reinjection, may be another option to minimize associated gas flaring, but only if the produced gas is captured, recompressed and reused. Associated gas injection for miscible-gas-based enhanced oil recovery (EOR) is an emerging technique that apparently offers some oil recovery benefit.[118,119] In each of these use cases, the key determinant is the reservoir performance, with reservoir modellers and asset managers exercising judgement over the benefits of flaring reduction versus the potential operational and recovery risks of gas injection. Associated gas can be used to generate electricity for a site’s production and related facilities, or for a centralized power system across the field. However, power generation is often more efficient when at large scale; therefore, a consideration is the trade-off between using gas for a site’s own consumption versus incentivizing centralized power generation systems (e.g. government-owned power plants with dedicated agreements with international oil companies for the feedstock gas). In the case where a government resource owner or NOC is involved, the gas may be provided free of charge as part of the upstream production agreement. Electricity can be generated using small modular power units ranging from less than 1–3 MW capacity. If the production operations are dispersed over a wide geography, another option in lieu of pipelines is to compress the gas in field-based CNG units and then transport it by tankers to supply small-scale gas users (i.e. generators) elsewhere in the field. CNG reduces the volume of gas to be transported by 150–300 times that of gas at atmospheric pressure. However, logistics can be complex and costly for truck transport of CNG, absorbed natural gas, or virtual pipeline projects.
Flare gas to market
Strategies to monetize flare gas that go beyond use within the producer’s operations may involve significant capital expenditure, regulatory authorizations, coordination with downstream off-takers, stakeholder engagement and, sometimes, external financing. For such major projects, the producer may be the initiator and a key sponsor; however, when the flared gas transfer price at upstream facilities is low the project initiator and/or sponsor may be a third party. Production of dry gas that meets a regional or national pipeline specification is the base case alternative for almost every gas monetization study. Assuming there is a market demand for gas, the key factors are gas quality and distance to the main gas transmission pipeline or, if no transmission pipeline is available, the distance to the consuming market. Other than expanding in-field gas gathering and compression infrastructure to route gas to an existing (or new) gas transmission pipeline, opportunities include: CNG, NGLs, mini-LNG or GTL/GTC products. Alternatively, micro-scale technologies (e.g. micro-CNG, LNG, GTL) can be deployed at the well site or at central gathering facilities in the field. For larger, more comprehensive utilization projects (perhaps including more than one oilfield and/or production operator), substantial and consistent gas volumes are required. Such large-scale projects offer greater economies of scale and additional optionality, but require much larger financial commitments (e.g. USD billions) and involve greater commercial complexity. Because of large-scale project costs and complexity, the role of government in creating incentivizing frameworks to facilitate collaboration between producers is essential. Examples include world-scale LNG (typically for export), baseload gas-fired electricity generation (on a scale of hundreds of megawatts capacity or more) and chemical feedstock manufacturing (e.g. a USD 1 billion+ world-scale manufacturing plant).
Section 2 Flaring management—a framework for the oil and gas industry
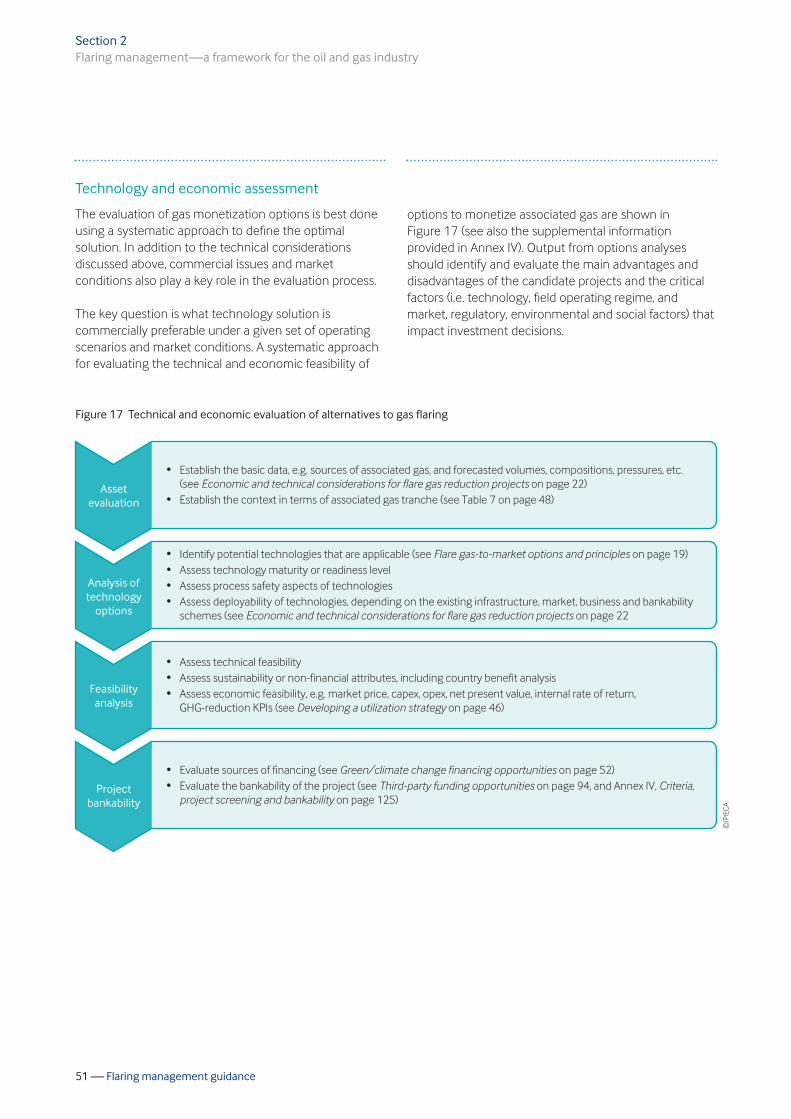
51 — Flaring management guidance
Technology and economic assessment
The evaluation of gas monetization options is best done using a systematic approach to define the optimal solution. In addition to the technical considerations discussed above, commercial issues and market conditions also play a key role in the evaluation process. The key question is what technology solution is commercially preferable under a given set of operating scenarios and market conditions. A systematic approach for evaluating the technical and economic feasibility of
options to monetize associated gas are shown in Figure 17 (see also the supplemental information provided in Annex IV). Output from options analyses should identify and evaluate the main advantages and disadvantages of the candidate projects and the critical factors (i.e. technology, field operating regime, and market, regulatory, environmental and social factors) that impact investment decisions.
Section 2 Flaring management—a framework for the oil and gas industry
Figure 17 Technical and economic evaluation of alternatives to gas flaring
5�����(� ������
5�� ���������%�� ���
�������
�����0� ������ ����
���)���0����0� ���
> "��� ������� � ���������:� $�$������ ���%��������� �����:����%�� ���� ��,���� �:����#�������:�#� ���� �:� ��$-� ��������������� ��������������������������������������������������#�� �//.
> "��� ������� ���� ������ �����%��������� ����������� �-� �&� � �3���#�� �E5.
> �� ��%!�#�� ������ ������� ��������� ��##���� � �-� �����������������������������������������#�� �26.> ��� ���� ������!��������!����� ��� ���� , �> ��� ���#��� �����% �!���# �����%�� ������� �> ��� ���� #��!� ����!��%�� ������� �:�� # �������� � ��������%���������� :����' �:� ��� ������ �'� ����!
��� � ��-� ��������������� ��������������������������������������������������#�� �//
> ",����� ������ ���%�%������-� ��������������� �����������������������������#�� �0/.> ",����� ��� � �'� ����!��%��� �#��9 ���-� �� �������������������������������#�� �6E:����� ����:�����������������������������������������#�� �2/0.
> ��� ���� �������% ��� ����!> ��� ���������� ����!�����=%������������ �� �:��������������!� %������!���> ��� ��� �������% ��� ����!:� $�$����' ��#��� :���# �:��# �:� ��#� � ��,��� :��� ������� ��%�� ���:
)G)=� �������(;���-� � �!��������������"���������������#�� �E4.©
IPIE
CA

52 — Flaring management guidance
Once options are identified, a screening process to reduce the number of options to a shortlist for a more in-depth analysis is undertaken. The screening process to shortlist (high grade) alternatives should identify the most important criteria to be considered in selecting the optimal solution. Typical decision criteria for screening alternatives may include, but are not limited to:
l technical feasibility and project complexity;
l capital and operating cost estimates for the specified technology solution;
l alternative uses of investment capital and the producer’s cost of capital;
l market demand and logistics for the gas or other products;
l natural gas pricing (or other product prices) and price risk;
l lease/concession terms and duration;
l regulatory constraints and other factors governing access to gas utilization and export facilities;
l proximity and capacities of regional and national pipelines;
l additional operating costs associated with natural gas production and gas processing for each of the utilization options;
l cost of land acquisition, and the cost and timing to obtain right-of-way approvals;
l environmental and community impact analysis;
l likelihood of legal challenges and concerns from stakeholder groups; and
l regulations that define allowable flaring and the likelihood of future changes.
The economics of flaring versus capture and sales of associated gas can be difficult to assess. Consideration must be given to: oilfield operating plans and associated gas forecasts; gas capture/utilization technology; design parameters; capital, operating and maintenance costs; and operational cash flows, among other elements. The larger the scope and the number of parties involved, the more complex the analysis becomes. The section on Economic and technical considerations for flare gas reduction projects on page 22 provides an overview of the technical and economic factors that are relevant for gas monetization projects. After the shortlisted options are determined, further economic, market and risk analyses will be required. Ultimately, after a thorough evaluation of the alternatives, the goal is to select a project that makes sustainable use of all (or part) of the associated gas production.
Green/climate change financing opportunities
For large projects, where the required investment cannot be funded solely by the producer or the resource owner, the proponents can choose to pursue external financing (typically a loan) to initiate construction. Commercial banks are a traditional source of project finance. Another source of funding is green finance,10 which is focused on funding projects with positive environmental outcomes, and a sub-sector known as climate finance.
Section 2 Flaring management—a framework for the oil and gas industry
10 Green finance is a colloquial term that encompasses the more precise ‘climate finance’ concept, but there is no agreed-upon definition for what counts as green finance. It is any structured financial activity that promotes a better environmental outcome and includes loans, debt mechanisms and investments that facilitate the development of environmentally beneficial projects or minimize the impact of regular projects on the climate. See: https://www.weforum.org/agenda/2020/11/what-is-green-finance and Glemarec, Y. (2011). Catalyzing Climate Finance: A Guidebook on Policy and Financing Options to Support Green, Low-Emission and Climate-Resilient Development – Version 1. United Nations Development Programme, http://www.undp.org/content/dam/aplaws/publication/en/publications/environment-energy/www-ee-library/environmental-finance/low-emission-climate-resilient-development/in-focus/catalyzing-climate-finance/UNDP-Financing-v3-web.pdf

53 — Flaring management guidance
Climate finance refers to local, national or transnational financing — drawn from public, private and alternative sources of financing — that seeks to support mitigation and adaptation actions that will address climate change. Climate finance is sourced either from capital markets or government budgets, and channelled through various multilateral and bilateral agencies and a multitude of private financial intermediaries. Annual flows of climate finance funds have reached more than USD 500 billion and the trend indicates a continuing increase, as shown in Figure 18. There is much innovation in the area of green finance, and new products are being developed to marry the desire to fund climate-focused projects while providing an attractive return for investors. The section on Third-party funding opportunities (page 94) provides an overview of other financial resources that may be available to a particular project. More detail on lender considerations are discussed in Annex IV. The use of green bonds to finance environmental projects has grown significantly.[120] For issuers, green bonds are a way to tap the USD 100 trillion pool of long-term private capital managed by global institutional fixed income investors. This shift to capital markets from banks is also having a beneficial add-on effect, in that it is
‘freeing up’ limited bank balance-sheet capacity for early-stage project financing and infrastructure lending.[122] However, because there is no single set of agreed-upon criteria describing the projects that qualify for green bond financing, projects that are based on hydrocarbons (such as flare gas capture to fuel electricity generation) may face headwinds. Nevertheless, a flaring reduction project has been linked with the issuance of green bonds,[123] and can serve as a guidepost for large-scale flaring reduction projects in particular circumstances. ‘Transition financing’ [124] is a term that has been used to categorize those instances where climate bonds have financed certain investments that can make a substantial contribution to halving global emissions levels by 2030 and reaching net zero by 2050. Another option for climate-related financing that has been used to monetize associated gas and reduce continuous flaring is the use of carbon credits.[125] These are tradable instruments based on emission reduction projects that are registered in voluntary or regulatory programs, and generate carbon credits that can be monetized to enhance the returns on a flaring reduction project, or retired to count towards meeting a company’s internal GHG reduction goals. Voluntary carbon credit registries include: the Gold Standard; Verra; the American Carbon Registry; the Joint Crediting Mechanism in Japan; and the Climate Action Registry in California.
Section 2 Flaring management—a framework for the oil and gas industry
Figure 18 Total global climate finance flows, 2013–2018 [121]
�����
���?
1
/11
311
E11
C11
211
/125/123/124/120/12E/12C
�����
�� �411
011

54 — Flaring management guidance
Another legacy carbon credit mechanism was set up under the CDM, which includes a specific methodology[126] for project activities that recover and utilize associated gas and/or gas-lift gas from oil wells, which would otherwise be flared or vented prior to the implementation of the project activity. A list of select, well-documented gas flaring reduction projects registered under the CDM is included in Annex V. Although not a viable mechanism for new projects, the CDM may be noteworthy as a foundation for carbon trading under Article 6 of the Paris Agreement, as the specific rules and modalities evolve.
Joint venture business model
Implementing a gas monetization/flaring reduction program at scale can challenge the internal resources of a single oil and gas producer. An approach that can facilitate the process involves partnering through a joint venture ( JV) with other companies that have the necessary resources and required expertise. Some of the reasons commonly cited for entering into a JV (upsides) and potential risks (downsides) are covered in Table 9.
Oilfield JVs focused on upstream production are a common model for sharing capital investment and risk. Monetization of associated gas offers a different opportunity for forming a special-purpose JV with another entity, especially where the production operator and NOC are in a JV for the purpose of exploiting an oilfield. The special-purpose JV for gas can include a technology provider (e.g. GTL, LNG and CNG) or a state-owned utility, such as in the case of a project to build a gas-fired electricity generation plant. In Ecuador, with the assistance of the GGFR, Petroamazonas EP has advanced conceptual engineering for monetizing stranded associated gas from multiple small sources. This innovative virtual pipeline project proposes to use a private-sector-driven solution that captures, stores, transports and offloads untreated gas from multiple flare sites to power generation and/or processing facilities using a network of specialized trucks referred to as a ‘virtual pipeline’. Ultimately, this gas will be used to displace diesel for power generation and/or to produce natural gas-derived products. A JV business model analysis is well-positioned to mobilize private sector financing for the virtual pipeline project.
Section 2 Flaring management—a framework for the oil and gas industry
Table 9 Joint venture considerations [127]
Pairs complementary players from different industry sectors
Economical long-term resource commitment with shared risks
Lower technology development costs
Knowledge sharing
Diminished political risk (e.g. government oversight, nationalization, political volatility)
Enhanced credibility for external financing
Faster time-to-market
Cultural differences between parties from different jurisdictions can lead to misunderstandings and inefficiencies
Misalignment or divergence of strategies can result in losses and a failure to achieve overall business objectives
Operational problems from strategic differences, production issues, management control issues or otherwise, can limit the effectiveness of the venture
Lack of trust between the parties can limit cooperation
Decision-making and dispute resolution processes can be lengthy and costly
Service and contribution agreements can create a dependency of the joint venture on a particular party
Exit upon termination can be expensive or difficult
UPSIDE DOWNSIDE

55 — Flaring management guidance
Third-party ‘design, build, own, operate and maintain’ model
An engineering, procurement and construction (EPC) project is a very common approach to adding major facilities to an oilfield operation. The EPC contractor is responsible for all activities from design, procurement and construction, to commissioning and handover of the deliverables to the owner or operator. This design-build model leverages crucial design know-how from the EPC contractor to improve the performance of a project during the development phases (i.e. design and construction). However, where there is a fragmented contracting strategy, with the project scope being split among different contractors at various phases of the project life cycle, management of the interfaces will be complex and often inefficient. In the absence of a commercial incentive for contractors to minimize costs for the subsequent phase of the project, the responsibility for optimizing costs during the project life cycle will fall with the owner/operator. Over the life of the facility, operations and maintenance expenses often far exceed the initial cost of a facility. Importantly, the decisions made early in a project have a strong effect on the life-cycle costs. Typically, owners/operators have the responsibility and incentive to see that operations and maintenance considerations are incorporated early in the design process. The traditional EPC project model can work well when the owner/operator has deep experience with the technologies and processes that comprise the capital project. For some flare gas reduction/gas monetization projects, especially those involving new technologies, knowledge can be heavily weighted to the technology provider. In such cases, an alternate project model may be better than the EPC model. For example, the design-build-own-operate-maintain model involves executing a single contract where a third-party is placed in a position of ownership (of the technology employed) and is made responsible for the design and construction, as well as the operation and maintenance of the installed solution. This model incentivizes the contractor to deliver an engineered solution that reduces the construction cost and minimizes operational and maintenance costs by ensuring that the contractor has a significant financial stake in the long-term performance of the solution. Such an arrangement better aligns the commercial interests of the contractor and operator. Essentially, the more gas
that can be managed through the solution, the higher the financial reward that accrues to the contractor. Turnkey solutions for GTL, GTC, small-scale LNG and distributed GTW, especially those that involve novel technologies, are amenable to such models. An alternative business scheme, where the technology provider is also part of a JV with the owner and/or producer(s), may be even more effective at sharing the risk amongst parties (see Joint venture business model on page 54). Another emerging business model is where a company acts as a unique and single source of project coordination and responsibility for execution of the technical project, selection of technology, and coordination of the EPC contractor, off-taker and seller of the products. The company can also assume the role of interfacing and liaison with the NOC and other company partners, and can provide project financing, as well as the finance structure of the project to make it bankable.
MANAGEMENT OF NON-ROUTINE FLARES
Non-routine flaring covers a wide spectrum of situations, related primarily to operational anomalies, unexpected outages or maintenance activities. Planned events leading to non-routine flaring, such as scheduled maintenance, periodic turnarounds and start-up of equipment, can often incorporate strategies to minimize the volume of gas sent to flare (e.g. use of nitrogen instead of gas for turbine starts). Although the timing of any particular unplanned event may be unpredictable, these types of events are foreseeable in that they have occurred at some time in the oil and gas industry. In fact, the longer any particular facility or production operation exists, the more historical data are available to identify the circumstances that underlie such events and the resulting flaring consequences. A process to establish these common causes of flaring, also referred to as root cause analysis (RCA), is one of the most important elements in a corporate program to enable effective reduction in non-routine and upset flaring. Even when a review of past data identifies opportunities to address the causes of non-routine flaring, it can sometimes be a challenging business case to do so, if the only criterion used is a cost/benefit analysis based on the gas recovered (unless oil production is also curtailed due to equipment reliability issues).
Section 2 Flaring management—a framework for the oil and gas industry

56 — Flaring management guidance
Often, the value of the associated gas flared is very small compared to the oil produced. This is especially true in a liquids-focused operation, where capital spent to prevent gas flaring can have a much higher return if used to drill an additional well or perform workovers on an existing production well. However, restricting the decision-making test to the value of gas recovered is considered too limiting in today’s operating environment. Consideration needs to be given to other factors, including: environmental performance; regulatory requirements; local community concerns; public reputation; preferred partner status; investor perception; and employee messaging. These factors can all affect a company’s ‘social license to operate.’ If non-routine flaring negatively impacts a company’s reputational profile to the point where it limits the company’s ability to continue to maintain or grow its oil production, the cost/benefit calculation can have a dramatically different outcome. The following sections describe an approach that can be used to assess non-routine flaring, with a view towards making strategic investments that will reduce it to as low as reasonably possible.[128] The approach begins by making the organization aware of the issue and the need
for it to be managed. The management-level goals that frame the desired outcome are then established, along with a strategy for achieving them, and specific targets. A basis for action is then developed by identifying operational practices that contribute to flaring, and any good practices that have been implemented to reduce equipment failures that lead to flaring (e.g. proper spare capacity). The implementation also includes a method to handle unexpected challenges, and an investigation and decision process to identify and prioritize those situations that require remedial action. A final aspect covers rotating equipment and equipment sparing. The API announced The Environmental Partnership in 2017 to accelerate improvements in environmental performance of operations across the US. More than 80 partner companies have committed to the responsible development of US energy resources while reducing emissions. An important component of the Partnership’s actions is a program that is focused on reducing flaring in upstream operations through advancing best practices to reduce flare volumes, promoting the beneficial use of associated gas, improving flare reliability and efficiency when flaring does occur, and collecting data to calculate flare intensity as the key metric to gauge progress from year to year.[129]
Section 2 Flaring management—a framework for the oil and gas industry
� ��������������������
������������ ������(����
?��������� ������ �
���%�� �������� �������(�
?����-���0������
> � ������������� �� !� ����� �� ����#
> ;����� ������� ������������ � � ��� � ��- $�$�##��,����%�#�� �%�������, ��/E������.
> ��������������#��� �#�������������� ��8��������� ��
> "��� ��� #�����> "��� �8����� ��������
> &����������� �� �8�� ����%�,���� ������� ������������� �����������
> ��� ���%������!�� ������ ��� ����=���� #���������� ��� ����!
> ��#� � ��#��� ����� ,����� �%������ , ��
> ��#��, ����������!�%��#�# ��
> "��� �� #������� ��� ����!
> )����� ��� �> ���#� ������� ��� �:��������� ��� ����!
��� = !=��� � ,��������%� %�����=�� � ������� �:� $�$K> �� �� �����#��� ����%����)������#���
> ��)�#���������%����=��� ��� ��������#���
> � �9 �����%��������� ���� % �� ��#��������
> �=��� �#�8 �� �����
���� � ��������8� %��������� � ����!�,��K> ��������� ��> � ��� �����=��� ��������
> �� ��%����������> � ������������> ���� �� �#�������
������(� ������ ������� 3����-���������
Figure 19 Flare control communication [130]

57 — Flaring management guidance
The Texas Methane and Flaring Coalition issued a report containing its preliminary recommendations for reducing flaring and improving environmental performance in the State of Texas. The Coalition’s development of ‘best practices’ was based on a chain of communication to evaluate operational and technical considerations related to flaring of gas, with the goal of minimizing flaring and, if it must occur, how best to manage flaring practices. This process (shown in Figure 19 on page 56) outlines a way to ensure a comprehensive review of flaring, and the identification and implementation of the most effective solutions for its reduction.[130]
Raising awareness, and visualization of flared gas
Non-routine flaring is distinguished from routine flaring by the cause, magnitude, frequency and duration of flaring events. Non-routine flaring is generally characterized by infrequent occurrence, high-emission rates and short event durations (each company has its own internal definition for the duration of a non-routine flaring event, ranging from sub-hourly to several days). By its very nature, non-routine operational flaring can be difficult to predict and track in the absence of adequate flare metering. Unexpected process upsets that are outside normal steady-state plant process and equipment operations, equipment breakdowns, and miscommunication between operations personnel and service providers are among the reasons why such flaring occurs, and can contribute to its unpredictability. Data for non-routine flaring events can be difficult to obtain, especially from unmanned or lightly instrumented locations. Where available, data can be obtained from process control system logs, data historians or production accounting systems. The duration of non-routine flare events is a key parameter and is often required for regulatory notifications. Accurate volumes can be estimated or calculated during or after the actual flare event, since they are often time-dependent and many variables are involved. If a total-flare-gas meter is available, an estimation of flare gas volumes will still be required to allocate flare volumes to individual flare sources if more than one flare source releases to flare during a specific flaring event.
The important information associated with non-routine flaring includes:
l the length of time the inlet process valve was open during a process overpressure situation;
l the length of downtime for required utilities (electricity or instrument air);
l the length of time required to identify which process should be isolated on a control system or in the case of instrument failure;
l the length of time required to identify and isolate a failed valve/component;
l whether a failed component can be automatically or manually isolated; and
l whether the event was caused by operator error. Many locations in the oilfield are unmanned and have only basic monitoring instruments, so flaring can go undetected for a period of time. However, advances in remote sensing by satellites have led to the development of tools that can be used to survey large areas and reveal instances of flaring.[131] Figure 20 shows flaring data in the Permian Basin. The visualization is based on data captured by VIIRS instruments onboard NOAA satellites, and collected by the Earth Observation Group, Payne Institute for Public Policy.[132]
Other organizations are using satellite data, aerial surveys and fixed ground monitoring stations to cross-reference instances of flaring. Analysis of data from the wells and facilities in the Permian Basin showed that 11% of flares were malfunctioning, including nearly 5% that were unlit.[134,135]
Section 2 Flaring management—a framework for the oil and gas industry
Figure 20 Satellite image of flaring in the Permian Basin [133]

58 — Flaring management guidance
To reinforce the need to address non-routine flaring, a company program focused on flaring reduction, including non-routine flares, should publish dashboards of information, including time-series charts and other visual graphics that plainly illustrate the volume of gas lost due to non-routine flaring for the company as a whole, as well as by key operating areas. Data can be sourced from production accounting systems and/or from flaring incident reports submitted to regulatory agencies. At a minimum, data should be presented in terms of absolute volume and intensity (i.e. non-routine flare gas volume divided by the volume of gas produced).
Flare management during non-routine/ upset scenarios
To be effective, any initiative to reduce non-routine flaring should be built upon a robust policy and management system to drive implementation. It should begin with a clear commitment from management to minimize, or aim for the complete elimination of, non-routine flaring, except for those instances that are safety-related. A signed statement that frames the goals and establishes a target date for implementation with interim milestones is a powerful motivator to the rest of the organization. This message should be communicated to the internal stakeholders that have the operations responsibility, and to the planning/finance sections along with critical support groups such as engineering, supply chain, information technology, asset reliability, and environment and safety staff. A senior operations manager should be named as the initiative sponsor. This person, supported by staff, will: provide focus; sanction targets for individual operating units and hold those units accountable for performance; oversee a waiver process for extraordinary situations; provide appropriate flare avoidance training to operators; ensure that the staff groups and line operations teams are in alignment; negotiate with planning groups and finance managers to obtain the necessary capital to fund the improvements; and communicate successes to encourage further achievements. Generally, the identification, screening and prioritization of operational enhancement projects can follow the approaches for routine flaring described earlier in this document. An important element to facilitate ongoing success is a thorough RCA process for non-routine and upset flaring, making certain that the process does not
stop at the first proximate equipment-related cause, but digs down into management systems and commercial matters (e.g. contracts with gas off-takers and suppliers of equipment and services). Finally, data system enhancement may be necessary to monitor and track performance and support the linkage between non-routine flaring reduction metrics and individual compensation.
Review of operational controls and processes
Non-routine flaring occurs at the well head as a result of drilling, completion and flowback activities. Flaring occurs at field locations, including gas gathering or processing facilities, due to planned maintenance and unplanned upsets or malfunctions. When components exceed design parameters such as allowable pressures, emergency relief devices automatically route the gas to a flare to maintain safety, usually for a period of minutes or hours. A compressor engine failure on a low-pressure gathering pipeline system can create unanticipated back-pressure in the system; this in turn can cause relief valves at upstream production facilities to send gas to flare automatically. Equipment failures and upsets at downstream gas plants can create non-routine flaring at distant upstream production locations because take-away capacity is reduced or completely shut in. The identification of potential flare source locations can be determined through a review of as-built piping and instrumentation drawings or on-site inspections. All process piping discharges into the flare header should be followed back to determine their origin. For example, process drains discharging into the flare knock-out vessel could also be a potential for flaring in the event of: a failure of one or more low liquid level alarms in the process vessels; drain valve leakage; or operator error with respect to manually operated liquid drain valves. A list of typical non-routine flare sources is provided in Annex VI. More detailed methods of tracing flaring to its sources include analysing alarms and other process anomalies (e.g. low/high flow, high pressure, etc.) from data historians, for distributed control systems or central control room systems. Maintenance management systems can be queried for work orders associated with flaring events to identify failed instrumentation or process equipment.
Section 2 Flaring management—a framework for the oil and gas industry

59 — Flaring management guidance
Sampling and analysis of flare gas composition may be able to help identify the sources of gas. Process hazard reviews or revalidations can identify whether as-built systems match the original design layouts. In reviewing processes and facilities, the design aspects that most affect the volume and duration of non-routine gas discharges to flare include: piping design; equipment sizing; equipment choice/specification; and instrumentation/control. Addressing these aspects can significantly improve the frequency, duration and volume of non-routine flaring. Further information on good design considerations for each of these aspects[136] is included in Annex VII.
Setting flaring targets at the station level
Field-level targets for non-routine flaring reduction at operational locations should be aligned with a company’s strategy, reflect the operational environment and competitive landscape, and should fit within the context of its culture. However, targets alone are not a strategy. Instead, targets flow from the strategy-setting process. The specific metrics chosen, and the levels to be attained by a certain time (i.e. the target), should be informed by the intent behind the strategy so as to drive an organization’s progress towards the desired goal. If the strategy is poorly developed, a set of targets cannot fill the gap. If the targets are not aligned with the goal, it is unlikely that the preferred outcome will be achieved. Flaring targets can be based on the volume flared for a given period (e.g. total volume), volumetric rate (e.g. volume/day) or volumetric intensity (e.g. volume/volume). Absolute targets are used to drive towards a new end state or operating regime. They tend to connote a transformation. Intensity targets drive progress in relation to the way things used to be. Relative targets connote gradual evolution. Because each has a specific purpose, combining multiple types of targets can yield a more effective outcome than using just one. Absolute target
Performance against an absolute target is easily measured; it is pass or fail. For existing producing assets, imposition of an absolute non-routine flaring target, where none had been in place before, can create organizational friction. To mitigate the understandable resistance, the target-setting process is best done in a collaborative manner with full engagement from the
operations team. Furthermore, establishing the target should account for its inherent shortcoming, namely, that it does not account for growth in the volume of gas handled, which is in direct proportion to the growth of oil production (and revenue). Consequently, a reasonable absolute target for flare volume should be adjusted annually to reflect changes in activity (i.e. oil and associated gas volume production) and reflect the ambition to reduce flaring to promote change. In addition, it should reflect the inherent reliability of the installed gas management/recovery system, any planned outages for safety or maintenance, and the historical incidence rate of unplanned outages of the production system that contribute to flaring. Typically, an asset team will recast an annual absolute target into a daily or weekly rate target to facilitate tracking and trending, and to inform daily/weekly/ monthly operations plans. Intensity target
Targets normalized on an operating parameter are less rigid than absolute targets and can offer an easier path to acceptance for an organization that is not accustomed to having targets for non-routine gas flaring. However, a normalized target does not cap the total volume flared, and hence it allows for production increases. A normalized flaring target uses the same structure presented above, but normalizes the allowable gas flared by the total gas throughput to transform the target into a simple parameter, i.e. percent flared. This parameter can be tracked easily and at any time by the asset team to determine conformance. Example calculations for absolute, rate-based and intensity targets are provided in Annex VIII.
Framework for variance and waivers
Flaring targets act as key performance indicators against which flaring volumes, rates and/or intensities at a flare location can be compared and tracked on a daily/weekly basis. Inevitably, there will be situations where flaring at a particular location trends above its target for a reason that was unforeseeable, or was beyond the ability of the operations team at that location to rectify the cause in a timely manner. In such cases, and for the right reasons, the organizational flaring policy should include a flaring waiver process.
Section 2 Flaring management—a framework for the oil and gas industry
60 — Flaring management guidance
A flare target waiver may be necessary for a variety of reasons, including: maintenance of safe operations, equipment and system reliability; failure of third-parties to perform (e.g. gas processors and other offtakers); delays in equipment repair or replacement beyond historical norms; a contractual or other legal obligation; etc. These are significant, weighty reasons that exceed the capacity of line operations to respond. Meeting production targets should not be the sole driving justification for a waiver. The structured process should be overseen by the senior operations manager who has been named as the organizational sponsor for the flaring initiative. This person can balance the impact on the company’s strategy and determine how such a waiver would affect the achievement of flaring reduction milestones. The waiver process should include:
l timely notification of an equipment upset or malfunction, or other situation that requires a target waiver;
l an estimate of the duration and volume of gas to be flared;
l a description of why the situation warrants a target waiver versus some other course of action, for example obtaining temporary equipment to handle the gas flow, a shut-in of oil production or a shutdown of gas processing facilities;
l an obligation imposed on the requestor (i.e. the operating location line manager) to perform a formal root cause analysis investigation to determine the causative factors that lead to the situation that the flare target waiver request is meant to address;
l an assessment of the resources and time required for implementation of temporary mitigations and permanent corrective actions; and
l a commitment by the location staff to resolve the problem according to a specified schedule.
Economic and technical risk assessment
A waiver of a target, which can be thought of as a management of change authorization, should be based on the proper assessment of risks, as well as the relief sought by the waiver request. One approach relies on the ‘as low as reasonably practicable’ (ALARP) assessment framework for decision making, which is
based on the principle that the residual risk shall be reduced as much as reasonably practicable. In the context of a flaring waiver, an ALARP analysis emphasizes the management of risk up to the point where the costs of risk elimination exceed its benefits. In oilfields where the necessary infrastructure exists to capture and utilize petroleum gas associated with oil, routine flaring is minimized. However, if there is a failure of this infrastructure, or some other situation that prompts a waiver request, there is a possibility of above-target non-routine flaring. In a business environment that favors ongoing oil production over gas conservation (because of price differentials), a decision to flare the associated gas may seem logical, especially if flaring is allowed under applicable laws and regulations. The positive revenue from additional oil production is a powerful driver for decision-making. However, in the absence of a robust cost-benefit analysis, such a choice can lead to the inappropriate management of risk, which includes loss of gas revenue and the creation of environmental and social impacts. If the decision is framed as one that pits the continuation of oil production (with gas sent to flare) versus shutting-in production from the affected wells or other operations, the apparent economics will almost always favor the continuation of oil production. It is only when a more robust assessment is conducted that other aspects may weigh more heavily. As noted earlier, consideration should be given to factors such as local community concerns and public perception. The allowance of non-routine flaring in the face of a public commitment to eliminate such practices could erode a company’s reputational profile to the point where it limits the company’s ability to continue to maintain or grow its oil production. Another issue that needs to be weighed is the impact of granting a waiver based on the internal perception (within the company) of the non-routine flaring strategy. Each waiver serves to weaken the belief that management is committed to its success, which could undermine the entire effort. Careful analysis of each of these factors during the waiver decision-making process will provide a richness to the cost-benefit calculation beyond one that is simply based on revenue.
Section 2 Flaring management—a framework for the oil and gas industry

61 — Flaring management guidance
Root cause analysis and identification of ‘bad actors’
A ‘bad actor’ program is designed to identify the operational factors and/or equipment that lead to recurrent upsets that result in non-routine flaring. It is based on the Pareto principle, i.e. 80% of the issues come from 20% of the causes. The strategy to identify ‘bad actors’ involves an RCA of production-related upsets based on the impact of each flaring event. RCA is the application of approaches, tools and techniques to uncover the causes of such events. The primary aim is to identify the factors that resulted in the flaring event, the nature of the occurrence, its magnitude (e.g. volume flared and lost production), the location, and the timing of the consequences. This information will allow a determination of the behaviors, actions, inactions or conditions that need to be changed to prevent the recurrence of similar outcomes. The results of the RCA are typically documented to provide a record of the incident investigation, corrective actions to be implemented, and details of lessons learned. With respect to non-routine flaring, the proximal reason why a particular flare event occurred may be obvious, for example a safety valve sending high pressure gas to a flare. However, the determination of the root cause of an event usually involves an investigation or engineering analysis of the circumstances leading up to the actual flare event. For example, the cause of the overpressure could be due to a disruption in the normal flows of material that causes a blockage or high-pressure zone in some part of the system. Although overpressure will be identified as the immediate cause in many (if not most) non-routine flaring events, the primary causative factors in a failure sequence that leads to an overpressure scenario include:
l initial production from a well being higher than anticipated;
l downstream take-away capacity is constrained;
l power failure;
l control system failure or set-point design error;
l relief valve failure or set-point design error;
l check valve failure;
l instrument air failure;
l vent gas system pressure imbalance;
l compressor failure;
l pump failure;
l ineffective liquid seal on the flare system;
l a blockage in piping or at the discharge point of a process or process equipment;
l unanticipated thermal expansion within a confined volume;
l leakage around valve seals;
l large slugs of liquids being sent to an inlet separator;
l a training gap; and
l other facility design and/or operational practice gaps. The investigation or engineering analysis of an event that results in flaring should consider the overall context, which is to enhance profitability while striving to maximize safety and on-stream production time through more reliable equipment and process systems. Consequently, an RCA should yield useful information when it is focused on equipment or systems that experience one or more unscheduled shutdowns or failures during a specified time period that lead to a flaring event. Targets for in-depth investigation can be identified through queries of maintenance management systems that look at classes of equipment for repair costs and the number of outages by equipment type. Flaring waiver requests can also evaluated. Graphical depictions (Pareto charts) can also be developed showing the frequency of flaring, the cost of repairs and the extent of lost production.[137] From this analysis the important ‘bad actors’ can be identified, and a more detailed action strategy can be developed to address them. The RCA should look for primary and contributing causal factors by examining:
l the inherent design of the equipment or system;
l a defect in the material of construction or a system component;
l faulty equipment build or system logic;
l errors in the way that the equipment or system was installed;
l inappropriate equipment or system for the operating conditions;
l inadequate maintenance procedures; and
l improper operation.
Section 2 Flaring management—a framework for the oil and gas industry

62 — Flaring management guidance
Common elements in most programs aimed at identifying ‘bad actors’ consist of the following:
1. Defining the scope of the analysis, either to consider the whole operation (entire field or gas plant) or limited portions (certain well sites or production facilities) over a selected time period. A broader scope requires more work, but is likely to identify unanticipated trends.
2. Obtaining flare event logs and work order histories from the computerized maintenance management system for all in-scope assets.
3. Performing data cleansing/validation to eliminate duplicate or false records, completing partial data records and obtaining maintenance and associated downtime/lost-production costs.
4. Preparing Pareto charts in which operations or equipment that cause larger flaring volumes and lost-production costs rank higher than others.
5. Selecting the top 20% from the dataset for further review — these are the ‘bad actors’.
Ultimately, the key to a good RCA program is to have a broad, knowledgeable team involved in performing the analysis, and the right data to review.
Focused strategy for addressing ‘bad actors’
Many studies have shown the cost of unplanned and emergency work is about four times the cost of planned work. This is due to pulling people off planned jobs to address emergencies, the lack of a response plan and spare parts, and higher spend rates due to overtime or premium pay and suboptimal sequencing of work. The interruption of planned work can cause employee performance to decline, and may put personnel at greater risk of injuries. Asset protection is also a major consideration. These risks all increase when equipment fails unexpectedly and there is pressure to restore operations. The strategy for addressing identified ‘bad actors’ to ensure lasting improvement is part technical, part managerial. The technical part involves analysing the contributing causes behind the ‘bad actors’; this is also known as failure mode classification. The failure modes are then compared against the procedures/activities that are already in-place to prevent such failures. If a preventive maintenance or operations procedure already exists for an identified bad actor failure mode, the
procedure will need to be reviewed and enhanced —either the frequency will need to be changed, a new feature(s) may need to be added, or the training curricula need improvement. If a failure mode is identified: l a new preventive maintenance or operations
procedure will need to be developed; or
l an engineering study will need to be undertaken to identify an appropriate replacement part, equipment or system for the one that has failed.
When recurrent issues are identified, a review of the equipment sparing philosophy or an increased inventory of key spare parts may be worthwhile. After a new solution is identified and a process design completed, the normal project workflow can be established (e.g. funding, planning, purchasing, installation and field commissioning). The key to an effective, lasting solution (for any of the cases noted above) is to conduct a performance evaluation of the implemented solution. It is equally important whether the RCA identifies equipment, or human factors or procedures, as being at the core of the bad actor issue. A final element — communicating successes — can create significant leverage and drive further progress in addressing non-routine flaring driven by ‘bad actors’. A managed program to communicate real examples of the positive work done to eliminate the underlying causes of flaring can have a multiplier effect throughout the organization. It can break down the silos that often arise, and which prevent operations teams from engaging with maintenance teams or with staff groups such as engineering or asset reliability personnel. Furthermore, when an organization sees a demonstrable commitment to upgrade systems and processes — whether by hiring specialized contractors to undertake analyses, or by spending capital to replace outdated or inferior equipment — rather than narrowly focusing only on production, this will foster a culture that does not tolerate upsets that lead to non-routine flaring.
Section 2 Flaring management—a framework for the oil and gas industry

63 — Flaring management guidance
Rotating equipment and sparing strategy
Rotating equipment is a term used in the oil and gas industry to describe a class of mechanical components that use kinetic energy to move fluids, gases and other process materials. Turbines and gas compressors are the most important examples employed in the management of associated gas. The operational reliability of compressors can determine the success of an associated gas capture and utilization project. Significant considerations involved in the choice of compression equipment include cost (i.e. capital, installation, operating and maintenance costs), operational flexibility, reliability and emissions. The capital cost for a project involving gas compression includes the driver and the compressor, along with their installation, as well as the necessary ancillary components and instrumentation systems. Spare units, including those used during start-up and commissioning, should also be considered. A gas capture project should consider the flexibility needed for different operating regimes and for scenarios that arise from failures of one or more systems. Operating conditions can vary due to changes in gas supply (e.g. depleted fields or new wells) and demand by downstream off-takers, or changes in gas composition. Using multiple smaller compressor units rather than one large unit can be another way to provide flexibility. The designed availability of equipment also needs to be factored into the project. Availability accounts for equipment downtime due to planned and unplanned events. It is often expressed as the ratio of run time to planned production time (where run time is the planned production time less any down time due to planned or unplanned stops). The cost associated with availability is directly related to the inability of the process to perform at the designed rate on an annualized basis, and this has a direct impact on the likelihood of a project earning its expected economic return. The unavailability of compression due to maintenance or an unexpected upset can cause significant loss in revenue in the gas utilization project. The installation of spare or standby units is an important consideration, despite the additional capital and installation costs. Although upsets or emergencies cannot be predicted, the scheduling of maintenance shutdowns can, and planned outages should be performed when lower capacities are required.
Spare units can be arranged such that each compressor station has one spare, but this can be costly where there are several processing plants in multiple fields. This prompts other considerations, including how to use the standby compressor. For example, a decision to operate with a dedicated spare, rather than operate both pieces of equipment at partial loads (inefficient), or to alternate units running at full load (frequent high-stress start-ups), ensures that a serviceable unit is immediately available when the other fails. It also means that it is unlikely that both units will reach the end of their lives at the same time. Another approach is the standardization of compressor makes, types and models across the entire operation of a company, such that one swappable standby spare is kept for several compressor stations. When the standby spare is used to replace a defective compressor at a particular station, the replaced compressor is repaired and then becomes the new standby spare for use if another compressor failure occurs at the same station or at another plant. This approach has the potential to significantly drive down the cost of standby sparing for compressors. The life-cycle cost comparison among strategies typically requires a statistical simulation based on historical data, which includes:
l failure consequence and occurrence rate to inform a criticality assessment;
l failure mode and effects analysis to identify dominant failure modes and possible risk mitigation tasks;
l the frequency and characteristics of each failure mode;
l maintenance data; and
l information on spares, i.e. purchase price, storage cost, lead time, depreciation, and categorization of logistical availability.
In determining whether to adopt a standby or a shared-spare philosophy, consideration should combine life-cycle costs with risk tolerance. For a standby philosophy, the initial number of compressors will be twice the number required for design rates, but the redundancy may be warranted where uptime is the driving factor. For a shared spare, the initial number of compressors will be lower, equal to the number required for design rates plus a certain number of spare units. With a higher risk tolerance for outages, the number of spares will be lower. The final number will depend on balancing the desire to minimize gas flaring with the cost of providing (and maintaining) shared spare compression capacity.
Section 2 Flaring management—a framework for the oil and gas industry

64 — Flaring management guidance
A study [139] of non-routine flaring incidents in different production stations located across Oman was performed to identify the ‘bad actors’ that contributed to the frequent equipment failures. The stations experienced high flaring frequency and volume compared with other stations. Analysis of historical data showed that the chiller compressor, gas recovery compressor and gas injection compressor were the most frequent failure cases.
FLARING FROM MIDSTREAM OPERATIONS —INCLUDING LNG FACILITIES
Midstream gas plants
Processing natural gas to achieve pipeline quality dry gas, and separating the NGL fractions, is complex and encompasses four main processes:
l Oil and condensate removal.
l Gas dehydration.
l Separation of NGLs.
l Removal of sulfur, CO2 and other impurities. Like any other complex hydrocarbon processing facility (e.g. a refinery), a midstream gas processing plant can experience operational upsets and equipment failures, such as a compressor outage. However, unlike a refinery with significant crude oil storage ahead of the processing units, a gas plant does not operate in an isolated fashion. It is linked directly to upstream facilities; there is no intermediate storage between the upstream producing facilities and the gas processing facilities. Scheduled and unscheduled maintenance or a process upset can shut down portions of a gas plant facility (e.g. the fractionation section). If this occurs, the affected section can be isolated, and feed gas sent to flare. Maintenance or an upset at the input side of the plant will likely require the stoppage of all gas flows into the facility. In this circumstance, the gas flows can be directed to the plant’s emergency flare system, or may cause flaring at upstream production locations as the shutdown cascades backwards through the low-pressure gathering pipeline system tied to upstream production facilities.
Midstream transmission lines
Water and natural gas liquids can condense in gas transmission pipelines, creating a safety hazard. Periodic clearing of the pipelines is therefore required. This is undertaken using a process referred to as ‘pigging’ (see page 39), which clears the liquids from the pipeline. During this process, the gas in the pipeline network is sent to a safety flare. It is considered good practice to recover flared gas from pigging operations into a lower-pressure fuel gas system. If a build-up of liquids in a gas gathering system is not cleared, and arrives unexpectedly at an intermediate midstream facility (e.g. a mainline compressor station), it can cause a significant upset at the facility and at upstream facilities.
Section 2 Flaring management—a framework for the oil and gas industry
Box 3 The mathematics of equipment sparing [138]
Spare units are not always mandatory because modern gas-turbine-driven compressor sets can achieve an availability of 97% and higher.
Case 1 A compressor station with two operating units and one standby unit has a station availability of 100 x (1−0.032) = 99.91%. Two units would have to fail at the same time to reduce the station throughput to 50%.
Case 2 A compressor station with one standby unit and one operating unit also yields a 99.91% station availability. In this case, failure of two units would shut down the entire station.
iSto
ck/M
sLig
htBo
x

65 — Flaring management guidance
LNG
Flaring in the LNG value chain is primarily associated with the evaporation of LNG. Evaporated LNG is commonly known as boil-off gas (BOG). It is generated during the production, storage, loading, transportation and unloading of LNG (see Figure 21). BOG losses in the one-way movement of LNG from loading to unloading can amount to more than 9% of the total LNG carried; with loading processes accounting for 2.7%, shipping for 2.7%, and unloading accounting for 4%.[140] At LNG plants and export terminals, BOG generation is caused by five main factors:[141]
1. Depressurization of LNG.
2. Heat leaks through containers and pipelines.
3. Tank breathing.
4. Heat added by equipment, e.g. pumps.
5. LNG-carrying vessels being hot before loading of LNG. BOG is also generated during transport in LNG carriers, and during offloading and storage as the LNG is introduced into de-inventoried tanks at the receiving and regasification terminal, plus losses similar to those seen at the export terminal. The rate at which BOG is generated is dependent on a variety of parameters: in addition to the operating conditions, these include the design and construction of the storage tanks, the composition (density) of the LNG, and the voyage time.[142,143] The API has developed several Standards that apply to the LNG value chain.[144,145,146,147]
Recovery and reuse of BOG, rather than sending it to flare, carries a significant economic incentive. Many newer LNG facilities are subject to stringent environmental regulations that prevent routine flaring of BOG. A common approach is to compress it for use as fuel gas to run a gas turbine generator with a waste heat recovery unit to supply process heating. Excess BOG can be recondensed and recycled back to the inlet of the liquefaction trains for reprocessing so that no flaring is required during LNG carrier loading operations. For existing facilities, adding a re-condenser, pre-cooler or BOG compressor, or the optimization of existing facilities to avoid flaring during LNG carrier unloading or reloading[149] are likely enhancement candidates. An engineering study is necessary to determine the economic options. Each LNG plant environment can differ in various ways, including jetty length, LNG storage capacity, loading rate and frequency, and available space for additional equipment. Similarly, plants can have different demands for fuel gas, desired product specifications and controllability issues, all of which affect BOG recovery strategies. Furthermore, since LNG loading/unloading are intermittent and unsteady processes, dynamic simulations are necessary to determine the rate of change of BOG generation, the effect of BOG recycling on plant performance and controllability, and system behaviors with respect to changes in different parameters.
Section 2 Flaring management—a framework for the oil and gas industry
���#��������
��)#��������
��)������
����������%���
+�)���#� ����
9 ��!+�)
��)������
������+�)
������� ����#���
��)����#��������� ����
��)����#����������
����
9 ��!�����'�� +�)
+�)���#� ����
��%���
���%� �����
#�# �� ��)� ����%��������)
�������
��)������
��%���
Figure 21 Boil-off gas at LNG terminals [148]

66 — Flaring management guidance
Other options to reduce flaring at LNG facilities include the following:
l Off-specification gas recycling Gas pretreatment trains remove impurities (i.e. water, CO2, heavy hydrocarbons, hydrogen sulfide and mercury) from the feed gas. During start-up, large quantities of off-specification gas are usually flared. Facilities should be available to recycle off-specification gas during and after start-up in a closed loop instead of flaring it.
l Propane and refrigerant recovery Before planned maintenance of compressors and other equipment, propane and mixed refrigerant should be removed from the system. Typically, these gases are flared. Good practice involves recovering propane and mixed refrigerant back to storage.
l Primary dry-gas-seal vent recovery Dry seals in refrigeration compressors prevent the process gas from migrating into the atmosphere but some of the sealing gas passes through the primary seal and is typically flared. A vent gas seal recovery system should be employed to send the recovered gas to the BOG system for compression and reuse.
l Improving dry-out procedures Typical practice has involved the use of natural gas to dry out equipment before LNG production can start. Substitution with nitrogen, wherever possible, will reduce ‘dry-out’ gas that is sent to flare.
l Improve cool-down procedures Typical start-up procedures include manually controlled pre-cooling with propane refrigerant followed by mixed refrigerant recirculation. The pre-cool-down step flares propane while final cool-down flares off-specification or warm LNG. New methods that eliminate the separate pre-cool-down step and use more sophisticated control of the mixed refrigerant and the feed can result in less flaring and faster, more consistent start-ups.[150]
ENHANCED FLARING MEASUREMENTS AND MONITORING
Accurate measurement of the vented and flared volumes is important when evaluating the applicability and economics of capture technologies. The flare gas flow rates can vary widely from low levels during routine, continuous operation to relatively high levels during upset conditions. With such a variation in flow rates, taking accurate measurements over the possible range of flow can prove challenging. As previously discussed, flow meters have been the chosen technology to determine flare gas measurement. In recent years, major technological advancements have allowed for the introduction of new tools that can be utilized to accurately measure and detect vented and flared gas volumes. These technologies include the following:
l Satellites are able to map flares or methane emissions across large areas, and take measurements at specific locations. The VIIRS instruments onboard NOAA satellites were discussed on pages 33 and 57. Another example is MethaneSAT, a subsidiary of EDF (the Environmental Defense Fund), which will provide data to oil and gas companies and countries to help them to manage leaks and other releases. This technology is scheduled for deployment in space by 2022 and will be made available to the public free of charge. The technology works by using a spectrometer to measure a narrow part of the short wave infrared spectrum where light is absorbed by methane, detecting concentrations as low as two parts per billion. The high spatial resolution and a 200-kilometer view span is intended to allow the satellite to track smaller emission sources across large areas.[151]
l A thermal imaging device is able to recognize the difference between the heat signature of a flare stack flame and the surrounding background (e.g. the sky or clouds). The camera’s spectral response and calibration allows it to see through moisture in the air to obtain a good quality image and a relative temperature reading of the flare stack or pilot flame. In addition to visual monitoring of the stack flame and smoke, this system has the ability to automatically control the ratio of assist gas to waste gas.[152]
Section 2 Flaring management—a framework for the oil and gas industry
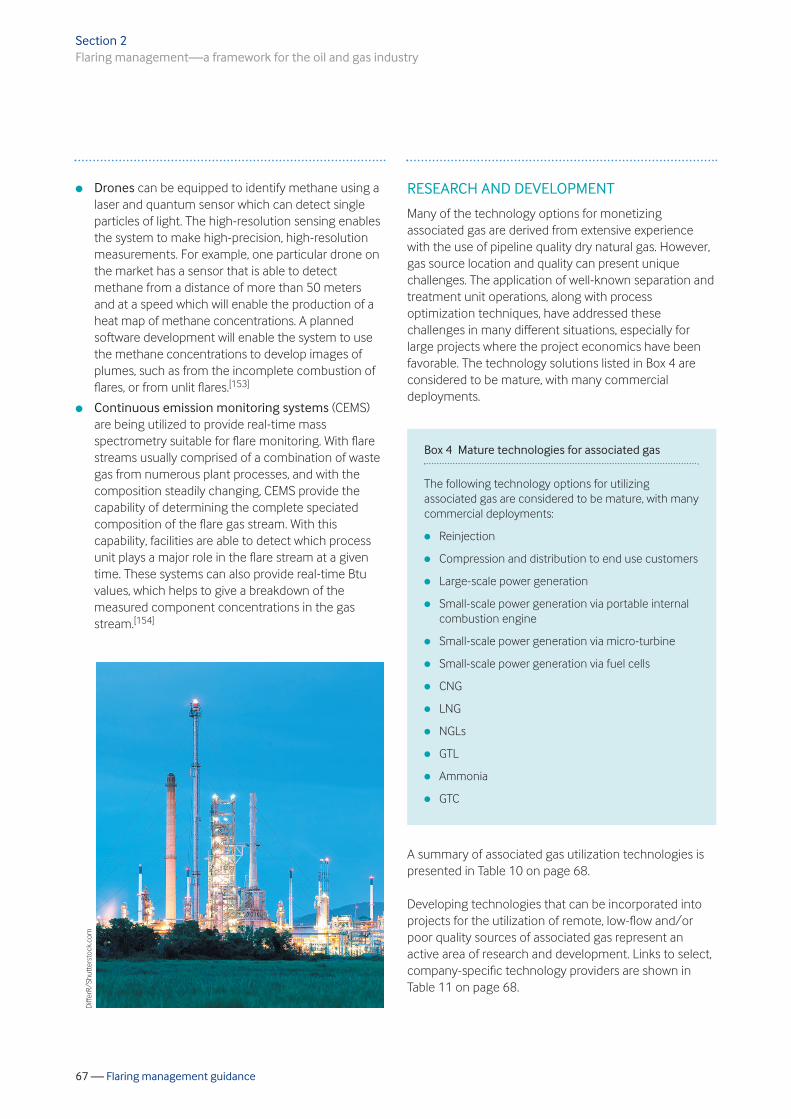
67 — Flaring management guidance
l Drones can be equipped to identify methane using a laser and quantum sensor which can detect single particles of light. The high-resolution sensing enables the system to make high-precision, high-resolution measurements. For example, one particular drone on the market has a sensor that is able to detect methane from a distance of more than 50 meters and at a speed which will enable the production of a heat map of methane concentrations. A planned software development will enable the system to use the methane concentrations to develop images of plumes, such as from the incomplete combustion of flares, or from unlit flares.[153]
l Continuous emission monitoring systems (CEMS) are being utilized to provide real-time mass spectrometry suitable for flare monitoring. With flare streams usually comprised of a combination of waste gas from numerous plant processes, and with the composition steadily changing, CEMS provide the capability of determining the complete speciated composition of the flare gas stream. With this capability, facilities are able to detect which process unit plays a major role in the flare stream at a given time. These systems can also provide real-time Btu values, which helps to give a breakdown of the measured component concentrations in the gas stream.[154]
RESEARCH AND DEVELOPMENT
Many of the technology options for monetizing associated gas are derived from extensive experience with the use of pipeline quality dry natural gas. However, gas source location and quality can present unique challenges. The application of well-known separation and treatment unit operations, along with process optimization techniques, have addressed these challenges in many different situations, especially for large projects where the project economics have been favorable. The technology solutions listed in Box 4 are considered to be mature, with many commercial deployments.
A summary of associated gas utilization technologies is presented in Table 10 on page 68. Developing technologies that can be incorporated into projects for the utilization of remote, low-flow and/or poor quality sources of associated gas represent an active area of research and development. Links to select, company-specific technology providers are shown in Table 11 on page 68.
Section 2 Flaring management—a framework for the oil and gas industry
Box 4 Mature technologies for associated gas
The following technology options for utilizing associated gas are considered to be mature, with many commercial deployments:
l Reinjection
l Compression and distribution to end use customers
l Large-scale power generation
l Small-scale power generation via portable internal combustion engine
l Small-scale power generation via micro-turbine
l Small-scale power generation via fuel cells
l CNG
l LNG
l NGLs
l GTL
l Ammonia
l GTC
Diff
erR/
Shut
ters
tock
.com

68 — Flaring management guidance
Section 2 Flaring management—a framework for the oil and gas industry
Table 10 References for associated gas utilization technologies
Company and technology overviews that are of interest to flaring reduction project developers
Flare reduction technology and solutions
Vendor-supplied technical and economic information regarding gas utilization technologies
https://www.worldbank.org/en/programs/gasflaringreduction#5)
https://www.ipieca.org/resources/energy-efficiency-solutions/flaring-and-venting/flaring-continuous-production/
https://www.ipieca.org/resources/energy-efficiency-solutions/flaring-and-venting/flaring-start-up-flaring/
https://www.ipieca.org/resources/energy-efficiency-solutions/flaring-and-venting/flaring-operational-non-continuous-production/
https://www.ipieca.org/resources/energy-efficiency-solutions/units-and-plants-practices/green-completions/
https://www.ipieca.org/resources/energy-efficiency-solutions/units-and-plants-practices/voc-recovery-systems/
https://www.ipieca.org/resources/energy-efficiency-solutions/efficient-use-of-power/ejectors/
https://www.ipieca.org/resources/energy-efficiency-solutions/units-and-plants-practices/passing-valves-leakage/
https://undeerc.org/flaring_solutions/Search.aspx
ORGANIZATION TOPIC WEBSITE
World Bank GGFR
IPIECA
University of North Dakota Energy & Environmental Research Center
Table 11 Developing technologies for associated gas utilization
Gas to computing power
CNG (small scale)
LNG (small scale)
GTL (small scale)
Flowback gas capture
Power as a service
https://www.crusoeenergy.com/
https://gev.com/
https://www.galileoar.com/us/historias/distributed-lng-production-galileo-flare-reduction-solution-for-bakken-shale-2/
http://www.greyrock.com/
https://www.ecovaporrs.com/leading-permian-basin-ep-company-uses-ecovapor-zero2-to-manage-emissions-and-flaring-during-flowback-operations/
https://www.soenergy.com/how-to-overcome-the-gas-flare-challenge/
TECHNOLOGY DEVELOPER WEBSITE
69 — Flaring management guidance
Section 3
Flaring management—a framework for governments and regulatory bodies
This section provides a framework to help national governments address routine flaring through legislation and incentives when sanctioning new hydrocarbon development projects. The framework will also be of benefit in promoting ideas for new initiatives that may encourage the development of gas monetization projects for existing operations.
Broc
reat
ive/
Shut
ters
tock
.com

70 — Flaring management guidance
This section provides a framework for national governments to address routine flaring of associated gas by structuring laws, programs and incentives to eliminate its use when new ‘greenfield’ hydrocarbon development projects are sanctioned. For legacy operations, the path to reducing, and eventually eliminating, associated gas flaring can be more challenging because it involves existing operations working under existing laws, contracts and financial incentives. Nevertheless, the concepts embedded in the framework can offer ideas on new government initiatives or practices that may catalyze the development of gas monetization projects.
The framework covers the following elements:
l Institutional set-up: An organizational structure with an agreed mandate and sufficient resources is essential to achieve a sustainable flaring reduction program.
l Regulations and guidelines: Rules are needed to define the transactional and commercial structure, and are supported by implementation guidelines.
l Flaring and production data management system: Actions by government entities, oil and gas operators, value chain partners and investors are driven by well-defined and transparent data.
l Flare gas-to-market project origination: Real progress on reducing flaring relies on a host of actors that come together to effectively execute in-field gas
utilization projects. Overall, this represents a new GGFR framework for
monetizing associated gas resources. The traditional model was a bottom-up approach,
initiated at the producer level. Projects that went beyond ‘own consumption’
of gas by the producer typically faced delays related to the creation of ‘first-of-their-kind’
commercial structures due to missing institutional elements or
unhelpful legal and regulatory provisions. The new model starts by assuring that a
conducive legal and regulatory framework exists, and that more standardized commercial structures, which leverage public finance and attract private capital, can be used to meet the risk/reward expectation of the market. These foundational elements create a defined and level playing field on which developers can delineate projects and attract investment. Figure 22 presents the key elements of the framework that are covered in more detail in this section. It illustrates how the key structural elements (set-up, regulatory framework and data management) support the process elements (project origination, project definition and funding) that produce beneficial outcomes.
Section 3
Flaring management—a framework for governments and regulatory bodies
Figure 22 Framework for monetizing associated gas resources
> )���#��������> <�����
'�����������>;����� �
>����������������� � ��
>� ��������
>������������ %��� � �
>� ������ �� �
���� �������������
>���' ���� ����##��
>���������������������
>��#����!� ������
������
�����
���&�
�
�%���&������������
'����������������������)����
;�� �����%������� ���������%��� �����
<��� ��������' ������!
�� ��%��������%�#��9 ���������� �
;��,�� �� �����#������#����%��� 8��'
���)��������������
;��,�� � ���!�%���)�� ����%����������
%������!������ ���
��� �������%���
©IP
IECA

71 — Flaring management guidance
INSTITUTIONAL SET-UP
The following sections discuss the key elements involved in establishing an effective national capacity to manage the beneficial utilization of a country’s associated gas resources.
Internal and external stakeholder mapping
Defining needs and priorities is among the most important first steps in instituting a national framework for associated gas management and utilization. To facilitate the identification of needs and priorities, a robust stakeholder identification and engagement process is invaluable. This exercise requires a thorough consideration of regional perspectives, requirements and constraints. It promotes a participatory process, captures ‘hidden’ stakeholders, and leverages professional, expert and other human and organizational resources. It includes the mapping of key partners to engage with in the capacity development process, and a discussion on development priorities. The primary in-country stakeholders include government ministries (such as those responsible for petroleum/ energy, finance and environmental protection), regulators (which may not be a part of the ministries)11 and other related development-focused ministries. The input from these key ministerial entities should drive the definition of needs and priorities. However, to validate assumptions from business and societal perspectives, supplemental input should be sought from others, including scientific and technological institutions, chambers of commerce or industry associations, and certain non-governmental organizations that represent large or otherwise important constituent populations. For example, these non-ministerial stakeholders can offer important feedback on how priorities and goals mesh with ongoing national progress on relevant SDGs. A country’s energy profile, including its consumption, owned resources and production/generation are rarely managed in isolation from the broader regional (if not global) context. Consequently, it is important that any effort to define needs and priorities looks beyond a county’s borders. Civil society organizations that operate
globally and promote good practices in areas such as investment, education, inclusiveness, competition, good governance, anti-corruption and fiscal policy can offer deep technical and policy experience and advice. Examples include the UNDP, the United Nations Environment Programme (UNEP), and the Organization for Economic Co-operation and Development (OECD). Also of importance are the international financial institutions and multilateral development banks that provide financial and other resources for energy development within the context of broader sustainable development goals. Examples of such institutions include the World Bank/International Finance Corporation (IFC), the European Bank for Reconstruction and Development (EBRD), the Asian Development Bank (ADB), among others. At the early stages of the stakeholder engagement process, it is important to establish accountability, i.e. who will do what, who will ensure that it gets done, and what the consequences will be if progress stalls. Ultimately, an effective capacity building process will encourage participation by all those involved. Engaging stakeholders who are directly affected creates shared ownership and allows for more effective decision-making. Ideally, accountability should flow both upwards and downwards through clearly stated goals and responsibilities, using local conventions and systems for ensuring accountability. However, if an external entity is involved in facilitating the engagement process, effort should be made to avoid creating parallel systems that undermine or compete with the local systems.[155]
Organizational structure—design and implementation
The UNDP considers the organizational level of a nation’s capacity (in any area) to be comprised of the internal policies, arrangements, procedures and frameworks that allow an organization to operate and deliver on its mandate, and that enable the coming together of individual capacities to work together and achieve goals.[155] With respect to associated gas flaring reduction and utilization, the section on Regulatory framework approaches on page 74 covers policies, arrangements and procedures.
Section 3 Flaring management—a framework for governments and regulatory bodies
11 Regulators can often be more accessible sources of information than ministries on matters such as price controls, local content requirements, permitting requirements, etc.

72 — Flaring management guidance
Fundamentally, there is no single best institutional alternative for how to effect control over flaring reduction. One approach is to create a durable and adaptable organization for associated gas flaring reduction within the nation’s state-sponsored oil company, oil ministry or environmental protection ministry. Another is to establish an interdisciplinary task force comprised of specialists from all relevant ministries. (Eventually, the task force could transition into a permanent structure after completing certain capacity building tasks.) Ultimately, however, the most important factor is likely to be the evaluation and implementation process employed. Each country is unique, with specific opportunities and challenges. External forces and numerous country-level characteristics, including political stability, resource base, trade, financial attractiveness, etc., will establish the context within which any work to redirect associated gas from flares to productive use will take place. Extending the work of the UNDP on general country-level capacity building[155] to the management of associated gas in particular, suggests that there should be a focus on strengthening existing core capabilities within a nation’s governance framework, rather than creating new entities or relationships simply because they work well for other nations. Some examples of specific questions relating to associated gas are listed below:
l Institutional arrangements — the policies, practices and systems that allow for effective functioning of an organization or group, wherever or however structured: l How is associated gas regulated? l How is it valued? l Are the contractual arrangements for associated
gas consistent across all concession holders? l How is routine flaring monitored and regulated? l Has the country endorsed the ‘Zero Routine Flaring
by 2030’ initiative? l Are producers, including the national oil company,
incentivized to find alternative uses for associated gas?
l Leadership — the ability to influence, inspire and motivate others to effect progress, and to anticipate and respond to change: l On the disposition of associated gas, do producers
receive mixed messages from the oil ministry and the environmental protection ministry?
l If so, which one carries more importance? Is the country’s position with respect to climate change consistent with its energy development strategy?
l What role does the national oil company play in setting county-level commitments on climate change?
l Does the country have a clear message on the importance of implementing the SDGs?
l Knowledge — the combination of facts, expertise, know-how and reasoning ability that people possess, and which can be shared within an organization: l Does the country maintain a data system for
managing associated gas and flaring? l Are there experts within the government that can
offer direction, guidance and other technical support for flare gas reduction projects?
l Does the country’s finance ministry have the capacity to support finance from external development institutions?
l Accountability — the condition that exists when responsibility for actions is accepted: l Are the regulations that apply to associated gas flaring enforced consistently?
l Does the oil ministry allow the national oil company or concession holders to delay implementation of agreed-to gas utilization projects?
l Is the national oil company treated in the same way as third-party concession holders if flaring reductions targets are not met?
Section 3 Flaring management—a framework for governments and regulatory bodies

73 — Flaring management guidance
Capacity building
The UNDP sees capacity development as a process to strengthen or maintain the government’s capabilities to set and achieve development objectives over time. The process should be generated and sustained from within the affected organizations, not by third parties or consultants. A five-step approach is often used as a model, as shown in Figure 23 and discussed below. Step 1: Engage stakeholders on capacity development
The stakeholder identification and engagement process, described under Internal and external stakeholder mapping on page 71 is a critical first step and a necessary supporting process throughout the full cycle. It includes the mapping of key partners to engage with in the capacity development process, and a discussion on development priorities. It often involves consensus-building on the need to establish capacity development as a political priority.[157]
Step 2: Assess capacity assets and needs
When developing an effective capacity building initiative, some fundamental questions need to be asked in the assessment phase. For example: What kinds of technical capacities related to flaring reduction and gas utilization/monetization are needed? Why is the capacity needed? What will be its purpose? What entities or organizations are responsible for maintaining the capacities? A systematic capacity assessment of desired capacities compared with existing capacities can help to determine which capacity efforts should be prioritized. In addition to the technical capacities, the assessment should also consider the functional (i.e. management) capacities that provide the foundation for a government organization’s ability to execute its technical mission. These functional capacities are summarized in Annex IX.
Step 3: Formulate a capacity development program
The findings of a capacity assessment can provide the starting point for formulating a capacity development response. This response involves an integrated set of deliberate and sequenced actions embedded in a program or project to address three guiding questions:
l Why more capacity? This concerns the priorities of capacity development.
l Capacity for whom? This addresses whose capacities need to be addressed, whether a ministry (or several), a department or a unit.
l Capacity for what? This addresses what capacities (both functional and technical) are to be developed.
A necessary part of the planning effort is the formulation of a set of indicators to monitor progress of the capacity development response. Each indicator should focus on intended outcomes — i.e. the desired change in capacity — and should have a baseline and target(s). Another necessary element is a budget that reflects the work to be done to facilitate the degree of capacity development that is desired.
Section 3 Flaring management—a framework for governments and regulatory bodies
#���4"���
���' ���� ������#����!
� , ��#� �
#���6��� ��
��#����!���� ����� ��
#���8<������� ����#����!
� , ��#� �#������
#���:��#� � �����#����!
� , ��#� �� �#��
#���;",����� ���#����!� , ��#� �
�5�5� �@'2>2�?�32��
��?�2##
Figure 23 The UNDP approach to capacity development [156]

74 — Flaring management guidance
Step 4: Implement a capacity development response
The execution of the response plan involves the work to turn intent into practice. Although this step is inherently outcome-focused, its success will require the opportunity for stakeholder feedback and mid-course adjustment loops. The indicators developed at the outset of the transformation process provide the guideposts to prevent drastic deviations. In addition, to ensure the sustainability of changes that are made — whether to strengthen existing capacities or build new ones —implementation should be managed through existing national systems and processes, rather than through new, parallel systems that would likely not be maintained. Step 5: Evaluate capacity development
Post-implementation, there will be a more effective national capacity to manage the beneficial utilization of a country’s associated gas resources. It is incumbent on the institutions and the affected stakeholders (e.g. production companies, other business partners, local communities) to assess whether the overall outcomes are delivering the desired advancements. Use of the SDGs can facilitate such an evaluation.
REGULATORY FRAMEWORK APPROACHES
It is important that the government sets out a clear resource management and environmental policy, in line with the country’s development goals. As part of developing a relevant policy, it is recommended that the government specifies the strategy for reducing flaring and venting of associated gas, and the role that this can play in achieving the overall environmental and resource management objectives. The organizational level of a nation’s capacity comprises the internal policies, arrangements, procedures and frameworks that allow an organization to operate and deliver on its mandate, and that enable the coming together of individual capacities to work together and achieve the required goals. If these exist, and are well resourced and well aligned, the capability of an organization to perform will be greater than that of the sum of its parts. This section offers a brief synopsis of the foundational concepts, including policies/legislation, institutional arrangements and regulatory practice. Also covered are effective practices that have been implemented by governments in addressing the flaring of associated gas. It leverages earlier work by the GGFR[158] and updates it with current developments.
Policies
Generally, countries establish separate primary legislation for natural resource management, including hydrocarbon production and environmental protection. This legislation can either address flaring of associated gas explicitly, or may do so indirectly by delegating the responsibility to regulatory agencies or ministerial bodies. These agencies, in turn, need to establish a framework to deal with gas flaring through secondary legal instruments such as regulations, codes, licenses and guidelines. The advantage of incorporating detailed gas flaring and venting regulations in secondary legal instruments, rather than in primary legislation, is that those instruments are more flexible and adaptable to changing conditions of oil production, natural resource management and environmental protection.
Section 3 Flaring management—a framework for governments and regulatory bodies

75 — Flaring management guidance
As an example, Algeria Law No. 19-13 prohibits flaring and venting unless a specific authorization is granted by the ministerial agency responsible for the development of hydrocarbon resources, or the activity qualifies for an exemption. It also establishes a non-deductible tax for each thousand cubic meters of gas flared, and delegates gas flaring regulation details to a ministerial agency. For those cases where a country’s policy framework is still developing, or where some components have not yet been finalized, certain options may work better than others in the local context. Figure 24 illustrates some of the high-level possibilities that deserve consideration. One element that should be incorporated into legislation governing new oil projects is a provision that requires associated gas utilization be included as an integral part of the field development planning process. Addressing flaring and venting retroactively is more costly and often more technically challenging than doing so at the inception of a new field development plan. In addition to policies addressing gas flaring, primary legislation, or in some cases a country’s constitution (or equivalent), specifies the legal ownership of associated gas resources. This has important implications for the latitude that individual companies — acting under some
form of a concession agreement — may exercise in monetizing associated gas streams. Where ownership of associated gas remains with the host government, use of the gas resource by the production operator is often limited to in-field consumption coincidental to the production of oil resources. Typical examples include use as fuel for well-site electricity generators or boilers/ heaters in gas processing plants, as an injectant to maintain reservoir pressure, or as the working fluid in gas lift operations or pneumatic control systems. Other options for utilizing associated gas typically require that the operator obtains approval from the national energy ministry. If the alternative creates or significantly expands basic infrastructure (e.g. gas distribution networks or the electricity grid), it is highly likely that other agencies will have a role to play in the approval process. In such cases, a critical review of primary legislation beyond the hydrocarbon sector may be necessary. Also needed is a determination of how legislation should address the price of associated gas. Often, associated gas, especially in situations of long-lived legacy flaring, cannot compete with non-associated gas on equal terms due to quality or deliverability factors. New or modified legislation may be needed to allow decoupling of the pricing structures and the implementation of market pricing for associated gas.
Section 3 Flaring management—a framework for governments and regulatory bodies
?�� ���� ��������%�����8� �
%�������� �������������, ��%��� #������������# ����������
��� ���
�������!��������:� #��������
#� ������������� �%������������� �����
����������� ��� � ���
%� ���� , ��#� �#���
"������������K��/������� �������:������ ��, ��%��
��#��� :��� �������������
� , ��� �#����!������� ��K
IL �������� �<����� !�/1C1J��������, :
�?��;����M�;&����
Figure 24 High-level policy options for developing programs
©IP
IECA

76 — Flaring management guidance
After the high-level market-enabling questions have been addressed, consideration will need to be given to financing and fiscal issues. If external financing (e.g. through a multilateral development bank — see the discussion in the section on Third-party funding opportunities on page 94) is required for the alternative use of associated gas, does the national government have the institutional capacity to qualify for, and/or manage, such funding? Regardless of the source of financing, there is a need to support the project’s financial viability, balancing the required capital expenditure and ongoing costs of the alternative use of associated gas with the anticipated revenue steam. Establishing laws that strengthen accounting frameworks or promote greater transparency may be needed. Amendments may also be required to deal with fiscal policy issues, including royalty payments, taxes and tax incentives. If a third party or a new JV partner are involved in commercializing an alternative use of associated gas, the existing legislative framework will need to be reviewed to determine how such an arrangement can be accommodated. Additional considerations are how the alternative use of gas helps to achieve progress on the country’s key SDGs and on any relevant country-specific GHG emission reduction target.
Institutional arrangements
In a mature governmental framework, agencies or ministries that regulate hydrocarbon production. and those that regulate the environmental impacts of gas flaring. exhibit the following characteristics: [158,159]
l They will have clearly defined responsibilities and are accountable for their fulfillment.
l They are independent from regulated operators.
l They adopt clear and efficient regulatory processes concerning gas flaring and venting.
l They will be properly staffed and financed to execute responsibilities and enforce compliance with regulations.
A country’s energy ministry establishes hydrocarbon production regulations for the exploitation of oil and gas resources to achieve a sustainable beneficial outcome for its citizens. This includes balancing the expectations of companies, landowners, resource owners and affected communities while also considering the natural environment. Generally, authority for flaring associated gas is derived from legislation authored by the energy ministry, but it is common for the environmental impacts from gas flaring to be regulated by the environmental protection ministry. In such cases, where the responsibilities are shared across two or more agencies, there is a need for clear definition of the respective roles and responsibilities of the institutional entities to ensure effective cooperation, and avoid overlapping or conflicting requirements or gaps in enforcement. Other institutional and structural conditions can enhance the prospects for productive use of associated gas resources and the reduction of environmental impacts caused by routine flaring. For countries where non-associated gas is readily available, to limit the unnecessary flaring of associated gas, special consideration could be given to prioritize the utilization of associated gas, as described below:
l Associated gas development should be integrated into the country’s energy sector strategy. For all new oilfield projects, the regulations governing the field development planning and authorization process should include requirements for the utilization of associated gas, with no authorization of routine flaring or venting.
l Promotion of critical local gas utilization projects is needed to ensure fast acceleration of the gas market. It is important for government to facilitate local gas utilization programs and policies.
l The development of local infrastructure, either by government, public/private partnerships, or private investors should be listed as a priority government objective. Regulations could be structured to allow multiple options for developing gas infrastructure, either by government, public/private partnerships (e.g. build-operate-transfer) or private investors.
Section 3 Flaring management—a framework for governments and regulatory bodies

77 — Flaring management guidance
l Incentivizing flaring reduction projects by proposing favorable fiscal policies such as reduced royalties, accelerated depreciation, investment credits, and tax credits or deferments could be used to encourage the consideration of all gas utilization options. In addition, external financing could be used to offset the impact of high up-front capital costs and help support investment returns.
l To de-incentivize the practice of gas flaring, consideration should be given to setting a volume-based fee on all gas that is routinely flared. Volumes flared for safety purposes could be exempted. Fee levels could be set so that investment in flare and vent reduction is more attractive than paying the fee.
l For flaring at legacy oilfields, reductions require a realistic flare/vent elimination deadline that is built on a cooperative approach in consultation with key stakeholders, particularly oilfield operators.
l Developers that advance projects to monetize gas, including gas export, should be granted open access to gas processing and transmission infrastructure, and the gas market should be based upon transparent, market-based pricing. For gas-to-power projects, there should be open access to the grid infrastructure to facilitate the sale and distribution of electricity.
l The finance ministry can actively lead efforts to modernize monetary and exchange rate governance and policies, strengthen the country’s ability to negotiate and implement agreements, improve the investment climate, reduce internal impediments to trade, and adopt growth-oriented development strategies that are consistent with the SDGs. Such efforts build confidence in prospective sources of external finance.
Regulations
The authority for secondary legal instruments such as regulations, codes, licenses and guidelines that address associated gas flaring is derived from primary legislation. Both the energy ministry and the environmental protection ministry can implement regulatory programs to complement a robust market framework, as long as they do so in a coordinated manner and give operators and investors confidence that there is a level playing field for all. Key issues are presented in Table 12.
Section 3 Flaring management—a framework for governments and regulatory bodies
Table 12 Barriers and regulatory options
Gas ownership
Access to flare gas
Access to existing infrastructure with spare capacity
Flare gas pricing
l Ownership of the associated gas and/or flare gas
l Differentiate between associated gas for own consumption, associated gas taken to market with producer’s investment, and flare gas that could be monetized by third parties
l Terms and conditions under which third parties can obtain access to flare gas
l Process to obtain permit/rights/ownership of flare gas
l Infrastructure interconnections terms and conditions between flare site and midstream flare monetization project
l Free access to existing infrastructure with spare capacity against fair and established compensation
l The associated gas price should be market-driven
l Consider the impact of subsidized fuels or derived products (such as electricity) on the demand for associate gas
l Where an abundant supply of non-associated gas is available, incentives to help prioritize utilization of associated gas should be considered
BARRIERS ISSUES THE REGULATORY FRAMEWORK SHOULD ADDRESS
78 — Flaring management guidance
Regulatory programs can follow one of several models:
l A prescriptive approach: This approach is based on specific and detailed regulatory requirements, procedures and operational processes. Creating detailed technical regulations is a challenging task for an agency, especially one with limited experience, and can involve a lengthy process of proposal, comment, review and finalization. Strict enforcement tools and penalties are often applied to promote compliance. A prescriptive approach can minimize the likelihood of failure to achieve the desired outcome (elimination of flaring by a certain date). However, the successful achievement of such a goal may come with high transactional costs because predetermined methods to achieve compliance may be inflexible, or technology implementation costs may be high.
l A performance-based approach: This relies on consensus and cooperation between operators and the regulator in setting objectives and targets. The operator then has the responsibility to define a program to achieve these targets and to provide evidence demonstrating that it is complying with the agreement. Typically, the enforcement authority focuses on compliance assistance rather than the imposition of penalties or other sanctions, unless progress on targets stalls. A performance-based approach affords a great deal of flexibility to regulated companies in achieving the desired outcome (elimination of flaring), but it does not guarantee that it will occur by a particular date, if at all. Company costs can be much lower than under a prescriptive regime, and there is greater opportunity for innovation in practices and technologies. However, there is a greater burden on agencies to review plans, monitor progress and provide technical assistance than under a prescriptive approach.
l An economic approach: This approach relies on pricing mechanisms that harness the economic self-interest of the various entities in the marketplace to achieve the desired policy outcome (elimination of flaring). To encourage actions, market forces are supplemented by fiscal policies such as tax credits, investment incentives or, in the case of flaring, a carbon emissions tax or carbon credit instrument. An economic approach can be an efficient way to achieve changes in behavior. If structured appropriately, with reliance placed on market pricing as the primary driver for change, it requires little oversight from agencies. However, if market pricing alone is insufficient to achieve the desired outcome,
or as the number and complexity of new fiscal instruments increases, so too does the level of oversight from government entities — from monitoring for fraud to administering new pseudo-market systems, e.g. carbon credit trading.
The following features will need to be addressed by the development of specific regulatory language (prescriptive approach) or as a required element of a flaring management plan (performance-based approach):
l Definitions and boundaries Because oil and gas production is a complex, multi-step process, the regulatory program should articulate which of these activities is subject to regulation. Definitions for equipment, systems operating conditions, monitoring methods and reporting requirements provide a common language and reliable basis for decision-making.
l Permits/authorizations/approvals/exemptions For new oilfield development projects, flaring is addressed more effectively, and at lower cost, if it is considered at the field development planning stage. Prior to obtaining ministerial approval for field development, operators should develop associated gas utilization options and commit to the construction of all necessary facilities. For existing fields, each operator should be required to develop a plan with clear targets for the cessation of routine flaring activities, including alignment with the ‘Zero Routine Flaring by 2030’ initiative. In the interim, agencies will need to grant authorizations (permits) on a flare-by-flare basis. Exemptions for flaring, for unavoidable technical reasons or to maintain safe operations, need to be specified.
l Measurement and reporting To enable government agencies to assess whether oil and gas is being produced in a manner that is aligned with resource extraction and environmental protection policies, operators will need to provide accurate information about gas flaring. Agencies must specify the protocols for measurement, monitoring and reporting to assure consistency across all operators. Metrics and indicators should be defined, such as the number of flaring incidents, duration of flaring, volumes of gas flared, and emissions. Tools should be established for reporting information to government authorities, and should specify the granularity of the data (e.g. a company roll-up versus site-by-site data), the frequency of reports, the data systems to be used, etc.
Section 3 Flaring management—a framework for governments and regulatory bodies

79 — Flaring management guidance
Monitoring and enforcement
The ministerial agencies responsible for regulating associated gas flaring need to have adequate monitoring and enforcement powers and corresponding tools. These elements establish a framework within which operators are encouraged to align operating practices with national goals. In addition, guidelines for practical implementation of regulatory provisions, including obtaining gas flaring permits and exemption criteria, flare gas measurement, data management and reporting obligations, royalty payments and tax reporting, etc., promote and facilitate operator compliance at the field level. Monitoring
l Effective agency oversight requires accurate information about the production, use and disposition of associated gas, including the nature, frequency and volumes of gas flared. The agencies should have the right of access to flaring sites and operational data. With this information, the energy ministry and the environmental protection ministry have a common basis for monitoring operator performance and taking enforcement actions if needed. (Operator reporting and agency management of the reported data are covered under Flaring and gas production data management system on page 85.)
l Authority for agency oversight of activities needs to be included in the legislation that addresses energy resources and environmental protection. Agency mandates should be broadly defined and include the right to perform on-site inspections and audits of operating records and underlying data.
l The obligation and procedures for operators to measure and report data on the production, use and disposition of associated gas should be included in the primary legislation that addresses energy resources and environmental protection, and/or in the corresponding secondary legal instruments, i.e. regulations, for each area. These obligations need to be enforceable.
Enforcement
l The legislation that addresses energy resources and environmental protection should include provisions to allow enforcement of all legal/regulatory obligations, giving agencies the power to impose penalties or fines, including termination of the operator’s production license, in cases of non-compliance.
l Enforcement proceedings should follow a structured, fact-based process, and will need to provide an opportunity for the operator to challenge allegations of non-compliance through administrative channels and in court.
Lessons learned from international experience
Generic lessons learned from experiences in oil producing countries, such as Algeria, Canada, Norway, the UK and the US were documented by the GGFR in 2009.[159] These include the following examples:
l Oil and gas legislation and concessions/licenses should be clear, comprehensive and unambiguous on the treatment of associated gas.
l Fiscal terms should encourage the consideration of all gas utilization options, including those projects where governmental incentives could mitigate the impact of high up-front capital costs and marginal returns.
l The gas market should be based upon transparent energy pricing that is market-based.
l Oil and gas producers should have the right to monetize gas, including gas exports, and have open access to infrastructure — including gas processing and transmission facilities, and electricity grids (to sell electricity produced on-site from associated gas).
l Flare and venting regulation should be clear, with effective monitoring and enforcement. Such regulations are necessary to complement a robust market framework that should include investment incentives to give operators and investors confidence that there is a level playing field for all.
l For new oilfield projects, the regulations governing the field development planning and authorization process should include requirements for the utilization of associated gas, with no open-ended option for routine flaring or venting. Associated gas development should be integrated into the country’s energy sector strategy for all new oilfield projects.
Section 3 Flaring management—a framework for governments and regulatory bodies
80 — Flaring management guidance
l For flaring at legacy oilfields, reductions require a comprehensive, measured approach that incorporates the foregoing elements, along with the establishment of a realistic flare/vent elimination deadline that is built on a cooperative approach in consultation with key stakeholders, particularly oilfield operators.
North America
l United States: In 2019, North Dakota and Texas together accounted for 85% (or 1.3 billion cubic feet (bcf) per day) of the reported US vented and flared natural gas. Venting is banned in North Dakota and restricted in Texas.[160] Despite a variety of US federal agency regulatory initiatives, legal challenges and court decisions during the 2016–2020 period, the primary regulations covering flaring of associated gas are those that exist at the state level.[161,162] State agencies in Texas and North Dakota have adopted regulatory requirements to drive gas utilization, and are working with oil producers to limit the need for flaring without shutting down or affecting crude oil production. In February 2021, the Texas Methane & Flaring Coalition12 issued a statement supporting a goal to eliminate routine flaring by 2030. In North Dakota, oil companies must capture a certain percentage (91% as of November 2020) of the gas produced by their operations. An agency order imposes flaring restrictions, and requires upstream firms to create gas capture plans prior to drilling, track and report their status, and draft improvement plans if goals are not being met. The order also seeks to improve midstream firm planning decisions by mandating semi-annual meetings, and by requiring upstream firms to provide production forecasts to midstream firms. In addition to the state-level regulations, the US EPA has developed a voluntary emission reduction program, the Natural Gas STAR Program, which is aimed at implementing methane-reducing technologies and practices, and encouraging organizations to voluntarily document their emission reduction activities. Through this voluntary program, the US EPA and the Natural Gas STAR Program partners are continuing to improve performance,
increasing natural gas supply, saving money and protecting the environment.[163] This program also provides recommended technologies to reduce methane emissions, and gives detailed fact sheets about the economic and environmental benefits of utilizing the technology. From the inception of the program through to 11 January 2021, partners to the program had eliminated 1,700 bcf of methane emissions by implementing 153 cost-effective technologies and practices. In 2020 alone, partner activities resulted in emission reductions of 21.2 bcf.[164] One of the technologies featured in the Natural Gas STAR Program is an electronic flare ignition device. This technology replaces the intermittently or continuously burning flare pilot with an electrical sparking pilot. These pilots require low electrical power that can be supplied from a solar-rechargeable battery in remote sites. The electrical sparking pilot alleviates methane emissions that occur from the leaking or venting of un-combusted natural gas through an unlit flare. A traditional flare would normally experience periods where the flare is unlit due to flare pilot flames occasionally being blown out by high winds. The primary economic justification for implementing this technology is the value of the fuel gas savings. Flare pilot flames require approximately 70 cubic feet of methane per hour, meaning that yearly fuel gas savings could reach 652,000 cubic feet, assuming that a single pilot is blown out for 24 hours per year and the methane content in the fuel gas is 94%. Based on these fuel gas savings and the ease of installation, the cost of using this technology could potentially be paid back in less than a year.[165]
l Canada: Gas flaring and venting in Canada is generally a matter of provincial jurisdiction meaning that, for example, the Alberta Ministry of Environment and Parks, a government body, is in charge of regulating emissions in the province and for setting air quality standards. These standards are then applied by the take-away Regulator (AER)13 to set upstream petroleum industry gas flaring and venting targets. The AER also allows and encourages the participation of industry, public, environmental non-governmental organizations (ENGOs) and regulators to help with
Section 3 Flaring management—a framework for governments and regulatory bodies
12 The Texas Methane & Flaring Coalition, which includes seven trade associations and more than 40 Texas operators, was formed to develop industry-led solutions designed to mitigate and reduce methane emissions and flaring. www.texasmethaneflaringcoalition.org
13 The AER is a successor to the Alberta Energy and Utilities Board (EUB).

81 — Flaring management guidance
assessing air quality issues and recommending management actions. The multi-stakeholder forum of CASA (Clean Air Strategic Alliance), established in 1994, is sponsored by the government of Alberta and helps to provide recommendations on policy and regulation related to air quality. Although the forum has no legislative authority, it works hand in hand with the AER, and actually initiated teams to make recommendations on gas flaring and venting management in 1998 and 2002. The EUB used CASA’s recommendations from 1998 and established a gas flaring reduction target for Alberta for 2001, which aimed at reducing flaring by 25% of the volume flared in 1996. By 2000 the actual reductions were more than double the target. In 2002, the EUB set a limit of 670 million cubic meters of gas flared in the year, and established that, if the limit was not met, the EUB would limit solution gas flaring at individual operating sites based on the
analysis of the most current annual data from each facility. With a limit set, and a firm target reduction of 50%, solution gas flaring in Alberta was actually reduced by 62% in 2002.[166] Since its formation, the AER has issued directives that require upstream oil and gas operators to reduce methane emissions from upstream oil and gas sites by 45% from 2014 levels by 2025. Most of the requirements have been developed in consultation with CASA. Directive 060: Upstream Petroleum Industry Flaring, Incinerating, and Venting,[167] contains the requirements for flaring, incinerating and venting at all upstream petroleum industry wells and facilities. The requirements adopt CASA’s objective hierarchy and its framework for managing routine solution gas flares (see Figure 25 and www.casahome.org) and has extended its application of the hierarchy to include flaring, incineration and venting of gas in general.
Section 3 Flaring management—a framework for governments and regulatory bodies
��� "������ �%�����:���� ���������, ���
?0)����(�%������%�> "������ ������ �%�����:���� ���������, �����%�� �� ����� �> � ��� ��� �,���� ��%�%��� �:���� ��� �����, � ����� �> ��#��, ��� � %%��� �!��%�%��� :���� ���������, ���!�� ��
� ��� �������� ���� ������,���� �
",����� ��#���� �##�!�� ��������
"������ � ��� ������ ���
� ��%��� :��� ��������, ��# �%����� � ��� � ��
�,��, �#� ���
) ���##��,�����#� � �
�%������� � � ����
",����� ����� � ��%��� 8��'���%���� ����� ��
Figure 25 Alberta Directive 060 gas flaring/venting management framework [167]

82 — Flaring management guidance
Europe
l United Kingdom: The Oil & Gas Authority (OGA)[168] is the regulator for flaring and venting under the Energy Act 1976 (as amended by the Energy Act 2016) and the Petroleum Act 1998. This legislation requires operators to have OGA-issued consents in place for the flaring and venting of hydrocarbons during production operations. The objective of the OGA flaring and venting regime for offshore operations (where most production occurs in the UK) is to eliminate any unnecessary or wasteful flaring and venting of gas, throughout the life cycle of a petroleum installation and relevant facilities such as terminals. Under model clauses used in offshore licenses, operators are required to demonstrate that all reasonable steps have been taken to keep flaring and venting to a minimum during operations, and that due consideration has been given to the application of appropriate technology and alternative uses for the gas. The OGA recognizes that some flaring and venting is unavoidable, but requires that these are kept to a technically and economically justified minimum. Operators are required to apply for OGA consent to flare and/or vent gas emitted from their installations. Before the UK left the EU (via the ‘Brexit’ process) in January 2020, certain offshore operations were also covered under the EU Emissions Trading System (ETS), a cap-and-trade system for GHG emission reductions. However, under the OGA and EU ETS, reductions in gas flaring from offshore operations stalled between 2015 and 2019.[169] The OGA has noted that flaring alone makes up a quarter of all UK offshore oil and gas production-related CO2 emissions.[170] Post-Brexit flaring-related emissions reductions will depend, in part, on the details of the new UK ETS and if/how it will link with the EU ETS. The OGA is exploring more stringent measures to eliminate unnecessary flaring and venting, and intends to integrate net zero considerations into its work, together with benchmarking of flaring and venting data, to drive improved performance across the industry.
l Norway: Routine flaring was banned in Norway in 1971. Emissions from flaring have continued to decrease, not only due to technology improvements but also as a result of incentives that have been created to encourage emissions reductions. Annual flare gas permits, which limit flaring volumes, must be obtained from the regulator. Oil and gas developers
are required to make gas utilization plans prior to any field development. These plans are facilitated by the extensive gas pipeline network which can quickly, and at low cost, tie in associated gas from new developments. Nearly all of the gas that is produced is used for production purposes, reinjected or sold (mainly exported). In 1991 the Norwegian government introduced a tax on CO2 emissions from offshore platforms, including gas flaring. The tax is assessed on the volume of gas flared, the volume of natural gas vented, and CO2 separated from petroleum and vented on platforms or other installations used for production or transportation of petroleum.[171] The tax rate, as of January 2021, is Norwegian Kroner (NOK) 800 or USD 94 per tonne of CO2 emitted. The government plans to increase the cost of CO2 emissions per tonne to a ceiling of NOK 2,000 or USD 235 by 2030.[172]
l EU Fuel Quality Directive: In addition to the country-level information discussed above, the EU Fuel Quality Directive, which is designed to reduce full life-cycle emissions for transport fuels, is seen as a further incentive to reduce the flaring-related GHG footprint of upstream activities. Further discussion is included in Annex X.
South and Central America
l Ecuador: The country has made progress on reducing flare volumes at its state oil company, Petroamazonas, through a program started in 2009 called Optimization of Electricity Generation and Energy Efficiency (OGE&EE). This program was mainly focused on reducing flare volumes in order to monetize the associated gases. Before the program began, Petroamazonas flared an average of 100 million cubic feet of gas per day. Implementation of the OGE&EE, although challenging due the range of gas volumes and compositions at the site, has achieved success, allowing the company to avoid flaring more than 26 bcf of natural gas by 2018. Following the reduction in flare volume, mobile generators were brought in to capture the gas so that it could be used as fuel, enabling the company to reduce its use of diesel and crude oil for generating power at its operations. This allowed the company to avoid using 647 million gallons of diesel between 2009 and 2019. In the second implementation phase of the project, the company connected its oilfield facilities to the national grid, which allowed it to
Section 3 Flaring management—a framework for governments and regulatory bodies

83 — Flaring management guidance
access other sources of power. In 2018, 11% of the company’s power was generated from hydroelectric sources, compared to 0% in 2009.[173]
l Brazil: The National Agency of Petroleum, Natural Gas and Biofuels (ANP) in Brazil is the regulatory body responsible for regulating natural gas flaring and venting. Resolution No. 806/2020 of the ANP establishes new procedures for the control and reduction of flaring, and losses of oil and natural gas in exploration and production activities. Among several new provisions is a requirement that the ANP shall annually approve the forecasts for flaring and associated natural gas losses. Petrobras is Latin America’s largest national oil company in terms of oil production. In a sustainability report released in 2018, Petrobras outlined a plan to reduce GHG emissions, which included pledging zero year-to-year growth of its operational emissions by 2025 compared to 2015 figures. The company also pledged to allocate USD 500 million to GHG mitigation projects between 2019 and 2023. In the most recent sustainability report, Petrobras will seek to decrease carbon intensity in its operations to address Scope 1 emissions by reducing gas flaring, improving efficiency in thermoelectric plants, reinjecting CO2 in its pre-salt fields, and developing pilot projects for renewable energy generation. By reducing flaring and increasing its use of natural gas, Petrobras has achieved a significant reduction in methane emissions. Flaring was cut by 74% between 2009 and 2015. As oil production continues to grow in the pre-salt areas, Petrobras will look to monetize the associated gas and avoid flaring. In its refining sector, Petrobras has implemented improved leak management systems and detection methods to improve flaring management. The company has also joined the World Bank’s ‘Zero Routine Flaring by 2030’ initiative, and is currently on track to meet the initiative’s objectives.[173]
Africa
l Nigeria: a comprehensive approach is taken to address associated gas flaring in Nigeria through the Nigerian Gas Flare Commercialisation Programme (NGFCP). Launched in 2016, the NGFCP envisioned achieving its target for eliminating flaring across more than 170 flare sites by 2020. It aimed to accomplish this through a strategy that provided a commercial approach to the elimination of routine gas flares while driving positive social, environmental and economic impacts in the Niger Delta, by mobilizing private sector capital towards flare gas capture projects. Also, the government has provided preferential treatment to gas producers over oil by providing fiscal incentives. Through lower taxes and royalties, Nigeria has helped to develop positive incentives to produce gas and develop downstream gas networks and markets.[174] Like Norway, Nigeria has also implemented a tax on gas that is flared. Under the ‘Flare Gas (Prevention of Waste and Pollution) Regulations’ of 2018, an operator that produces 10,000 or more barrels of oil per day must pay the government USD 2 for each 1,000 scf (28.317 cubic meters) of gas that is flared, regardless of whether the flaring is routine or non-routine. A small facility must pay USD 0.50 for every 28.317 cubic meters of methane flared.[175] The NGFCP focuses on technically and commercially sustainable gas projects developed by third-party investors who are invited to participate in a bid process. The bid process works by allowing these investors to bid on gas that would normally be flared, and the cost of the gas is defined by the highest bidder. The value put on the gas that would normally be flared creates an incentive for companies to capture the gas.[176]
l Algeria: the Algerian government has prohibited the flaring of gas since 1966. Enforcement of the prohibition began with the 2005 Hydrocarbon Law. A 2006 Ordinance maintained the prohibition but allowed authorization for limited periods of flaring at an operator’s request, which had to be granted by the National Agency for the Valorization of Hydrocarbon Reserves (ALNAFT). The combined effect was a significant reduction in flaring through 2012. Since then, however, flaring has been on an upward trend, suggesting that enforcement of the strong legal framework is challenged.
Section 3 Flaring management—a framework for governments and regulatory bodies

84 — Flaring management guidance
Contributing to this are: (1) a lack of investment in adequate infrastructure, which is hampered by a combination of fuel subsidies and low oil prices; (2) aging oilfields generating more associated gas; and (3) the lack of foreign investment.[177] ALNAFT is the primary regulatory agency in the oil and gas sector, and has the responsibilities for gas flaring matters. ALNAFT can grant temporary authorization for flaring in certain circumstances, including during well productivity assessments, at initial production wells, and during maintenance. An application must be prepared that includes a well location report providing the provisional date, duration and estimated volumes of gas to be flared. ALNAFT also has the responsibility for collecting penalties levied for flaring. If permitted to flare, a permittee is subject to a tax (20,000 dinars, or USD 150, per 1,000 normal cubic meters of gas flared in 2016). Flaring at new fields, which are typically operated by private companies, is prohibited; this appears to be strictly enforced, but the same may not be true for older fields operated by the Algerian NOC Sonatrach.[178] It is unclear whether any of these taxes had been paid. The actions taken by the Algerian government resulted in a significant reduction in CO2 emissions from flaring between 2009 and 2012. Since then, emissions have been on an upward trend, which can most probably be explained by the declining production at big oilfields where the GOR typically rises as the overall well pressure falls, and reinjected gas comes to the surface displacing some of the liquids being produced.[179] Algeria is the largest gas producer in Africa; oil and gas represents a significant portion of the country’s GDP and almost all of its export revenues. To encourage gas utilization investments, Articles 88 and 91 of the Hydrocarbon Law provide special fiscal treatment such as investment tax credits or a reduced rate of corporate tax for LNG, LPG and electricity generation projects. The oil and gas infrastructure is well-developed and extensive. There has been recent progress in building additional infrastructure to facilitate more productive use of gas resources. In 2020, Eni and Sonatrach announced the completion of a 16-inch pipeline with the capacity to transport 7 million standard cubic meters of gas per day.
Australia
l Australia is one of the world’s largest LNG exporters. Flaring of gas is typically covered by the relevant petroleum and environmental regulations in each State and Territory. The legislation that regulates flaring differs between jurisdictions. For example, the Queensland Petroleum and Gas (Production and Safety) Act 200414 requires that gas should be used commercially or on lease wherever possible, and flared if such uses are not technically or economically feasible. In addition, venting of gas is only allowed if it is not possible for the gas to be flared, or if it would be unsafe to do so. Before the regulatory agency will authorize flaring or venting, the operator is required to provide evidence of the likely impact that the flaring and venting will have on the environment. This information would be similar to that which is typically required in an environmental impact assessment (EIA), which would need to be submitted as part of the flare permit or field development application process. The EIA has become a part of the regulatory approval procedures and helps to set the conditions under which flaring and venting are authorized. For example, the use of flares was authorized in the Gorgon Gas Development project, but restricted to: commissioning, start-up, venting, draining, purging, and heating and cooling of equipment and/or piping; process upsets; emergencies; and, for the BOG flare system, emergency operational releases from the low-pressure LNG storage and loading system, and excess pressure in the LNG tanks beyond the capacity of the BOG compressor/recycle compressor.[180] Australia has also liberalized its gas markets, and encourages private participation and competition in gas supply. The regulatory institution is able to ensure that these pipeline operators are able to recover their investment costs through regulated transportation tariffs, and provides open access to pipeline networks for third parties. This sort of market liberalization has allowed the operator to market and sell the associated gas in the downstream market, which helps to improve the economics of associated gas and create opportunities for these operators to use the gas rather than flare or vent it.[181] According to the Australian Energy Market Commission, other than in the state of Victoria, pipelines operate on a
Section 3 Flaring management—a framework for governments and regulatory bodies
14 See https://www.legislation.qld.gov.au/view/html/inforce/current/act-2004-025#sec.151

85 — Flaring management guidance
contract carriage basis, where trading is voluntary. Access to such pipelines is allocated on the basis of contracts between the pipeline operator and the pipeline user. The terms and conditions of access are negotiated, and pipeline users are able to trade their contracted pipeline capacity on a secondary market. The primary and secondary market for capacity enables market led investment in pipelines.15
Saudi Arabia
l In 2020, the gas market in Saudi Arabia was among the world’s largest. A significant factor contributing to its position was the government’s decision in the 1970s to begin diversifying the economy and reducing the use of oil as a domestic power source. The Master Gas System (MGS) was initiated to enable the capture of associated gas that would previously have been flared, and use the gas in the domestic power generation sector. In 1975, Saudi Aramco began the work to design, develop and install a gas gathering, treating, processing and transmission system, which would collect gas from Saudi Aramco’s producing fields and take it to markets in the Kingdom. The MGS was unprecedented in scope, scale and cost, and became one of the most ambitious engineering projects undertaken in the region, requiring significant technology development. As new non-associated and unconventional gas fields were discovered, they were tied into the MGS for delivery to customers. By 1986 the MGS had been expanded to include offshore fields. System capacity reached 2 bcf/day and was supplying gas for power generation, NGL production and feedstock for petrochemical manufacturing, as well as supplying distribution networks for industrial, commercial and residential consumers. Plans include increasing the total capacity of the MGS network. Since the inception of the MGS, Saudi Aramco has recovered close to 99% of the total gas produced, nearly eliminated the flaring of associated gas, and is removing approximately 100 million tonnes of CO2e each year. Along with other initiatives, such as the Flaring Monitoring System used to monitor and
mitigate flaring in real time, a methane LDAR program, the installation of numerous flare gas recovery systems, and enhanced equipment maintenance standards across its operations, Saudi Aramco aims to achieve zero routine flaring by 2030.
FLARING AND GAS PRODUCTION DATA MANAGEMENT SYSTEM
Compliance with legislation and regulations that address utilization or flaring of associated gas resources requires a system for the measurement, management and reporting of the produced and vented/flared gas. Such a process is generally referred to as a gas production data management system (GPDMS), and should:
l facilitate the collection and management of data from production facilities (preferably over the internet using standardized data exchange methods to populate a government-established template);
l provide tools for data consolidation and analysis to allow monitoring of progress against goals, and the preparation of summary reports; and
l assist in the identification and quantification of environmental impacts and potential opportunities to commercialize flared gas streams.
Some specific outcomes include:
l Maintaining an accurate inventory and accountability system for the production and utilization of hydrocarbon resources.
l Creating a baseline of associated gas production, flared volumes, gas consumption for productive use (non-flare) and flaring reductions by source.
l Tracking flaring reductions by source/geography/ producing company.
l Linking with the national finance system to drive the collection of fees for flared gas (accounting for exemptions such as safety flaring).
l Creating a database that can support third-party funding of potential gas commercialization projects, including financing by multilateral development banks.
Section 3 Flaring management—a framework for governments and regulatory bodies
15 The Australian Energy Market Commission is the expert energy policy adviser to Australian governments, responsible for making the energy rules and providing advice. See https://www.aemc.gov.au/energy-system/gas/gas-markets

86 — Flaring management guidance
Important elements of a GPDMS are summarized below:
l All producers should use the GPDMS.
l Responsible agencies should establish the required frequency of reporting by production operators.
l A producer’s failure to report data accurately and timely is subject to enforcement and penalties.
l Producers should maintain a current inventory within the GPDMS of all locations where associated gas is produced, consumed, otherwise utilized, flared or vented.
l Producers should maintain, for a period specified by the responsible agency, daily logs, by source, of natural gas produced, consumed, otherwise utilized, flared and vented, and should maintain a daily log of each occurrence of gas flared or vented at its facilities.
l Key parameters for flaring logs are, for each flaring event: the date; time; duration; rates; volumes; and gas source or type.
l All data logs maintained by a producer should be available to an agency inspector at any time and be reconcilable with data reported into the GPDMS.
l For each source of associated gas that is flared or vented, producers report: l on a frequency specified by the responsible
agency — the temperature, pressure, GOR and compositional analysis; and
l annually — a 10-year forecast of gas production, with a reconciliation of actual volumes produced with the prior year’s forecast.
l All data reported into the GPDMS should conform to the standards and units specified by the responsible agency, including those for estimating volumes, measuring flow rates, and for calibrating flow measurement and gas testing equipment.
The GPDMS should be designed to support analysis and reporting, and should include the following:
l Validation of flared gas volume with gas production, in-field consumption by the producer, gas sold to third parties, gas converted to liquids and gas flared.
l Tools to perform data validation of actual and forecasted gas volumes reported versus oil production parameters and reservoir models.
l Analysis and consolidation of discrete sources of flared associated gas using geographic information system (GIS) tools.
l Demonstration of adherence to the ‘Zero Routine Flaring by 2030’ initiative, and other international commitments.
l The producer’s compliance with regulations and corresponding guidelines.
l Identification of opportunities to monetize associated gas still being flared.
PROJECT ORIGINATION
The work to create an effective institutional framework and the ministerial capacity to manage associated gas monetization projects bears rewards when flaring reduction opportunities are identified, projects are conceived, and in-field work is undertaken to bring gas that was formerly flared to a productive end use. The essential elements and work flow that facilitate these efforts are discussed below.
Independent analysis of the potential for commercializing flared gas
There are two independent sources of data upon which a flare gas commercialization strategy can be based: the volume of gas currently being flared; and the volume of gas reserves. The best approach to developing a baseline volume estimate combines both data sources. Flared volumes can be obtained from top-down estimates, such as from satellites, or from bottom-up estimates, such as annual production reporting or meters on flared gas lines. Regarding satellite data, there are weaknesses due to the intermittent nature of the data capture, filtering routines to eliminate spurious data and reliance on difficult-to corroborate correlations between captured data and flare volumes.
Section 3 Flaring management—a framework for governments and regulatory bodies
87 — Flaring management guidance
As for producer-reported data, weaknesses are introduced by lack of actual flow rate measurements, estimated data derived from GOR or other parameters, and accounting conventions that introduce systemic bias. Within a country’s borders, total gas reserves, including the portion that exists as associated gas, set the upper opportunity boundary for an overall program of gas utilization. On a field level, the quantity of associated gas establishes the potential scope for any particular project which aims to commercialize gas that is currently flared. A nation’s oil or energy ministry has access to country-level and field-by-field data that have been developed by the national oil company or by third-party producers operating in-country concessions. External sources of information (e.g. the IEA, US Energy Information Agency, bp (Statistical Review of World Energy), Wood Mackenzie, Rystad Energy) provide independent assessments of data to generate outlooks for reserves and production. When combined together, these data sources can be used to develop a robust and reliable country-level baseline perspective on associated gas utilization opportunities and potential reductions in flare-related GHG emissions. Use of this baseline will enable the institutional entity charged with developing the framework for a country-level flaring reduction program to conduct its work. Within the context of national needs and SDG plans, assessments can be made of the positive environmental and gas savings effects of strategic themes (e.g. gas to power, LNG export, etc.). Identification of obvious gaps in critical infrastructure, institutional capacity or other enabling aspects can also occur. This information will enable remedial work to begin on the foundations needed to support the most promising options. These might include legal, economic or fiscal reforms, readiness assessments to secure and manage multilateral financial support, or major infrastructure work (e.g. roads, ports, electrical grid).
Studying the market for flare gas
The outcome from the baseline work is an opportunity horizon that shows the best thematic options for significant use of associated gas resources. It also indicates those options that are likely to face significant hurdles or that do not have sufficient scale to make a difference. However, the baseline work product generally does not provide sufficient information to enable an assessment of specific project concepts that lie on the opportunity horizon. More granular data would be needed for such an assessment. Flare gas market studies for each of the high-potential gas utilization options should be conducted. The audience for such studies is the national government, in-country oil and gas producers, and prospective third-party project developers looking to obtain access to associated gas resources. As discussed in Section 1, the objective of the value chain feasibility studies is to characterize the source of the associated gas, its final disposition and each of the intermediate links along the chain. These comprehensive studies, which rely on field-level information and selected gas utilization technologies, determine the feasibility, attractiveness and sustainability of projects. Analyses include options for rates of gas utilization, capital expenditures, operating and maintenance costs, market demand and pricing for end products. Risk analyses and sensitivity studies are performed for each of the key parameters. The level of detail and specificity enables an evaluation of potential emission reductions, the potential scale of revenue and tax generation, contributions to GDP growth and an assessment of multiplier potential. One option for performing market feasibility studies is for the national flaring reduction entity to work with a multilateral development bank (MDB) — see footnote16 and the section on Third-party funding opportunities on page 94.
Section 3 Flaring management—a framework for governments and regulatory bodies
16 A multilateral development bank (MDB) is an international financial institution chartered by two or more countries for the purpose of encouraging economic development in poorer nations. MDBs consist of member nations from developed and developing countries. Unlike commercial banks, MDBs do not seek to maximize profits for their shareholders. Instead, they prioritize development goals, such as ending extreme poverty and reducing economic inequality. They often lend at low or no interest or provide grants to fund projects in infrastructure, energy, education, environmental sustainability, and other areas that promote development. See: https://www.investopedia.com/terms/m/multilateral_development_bank.asp
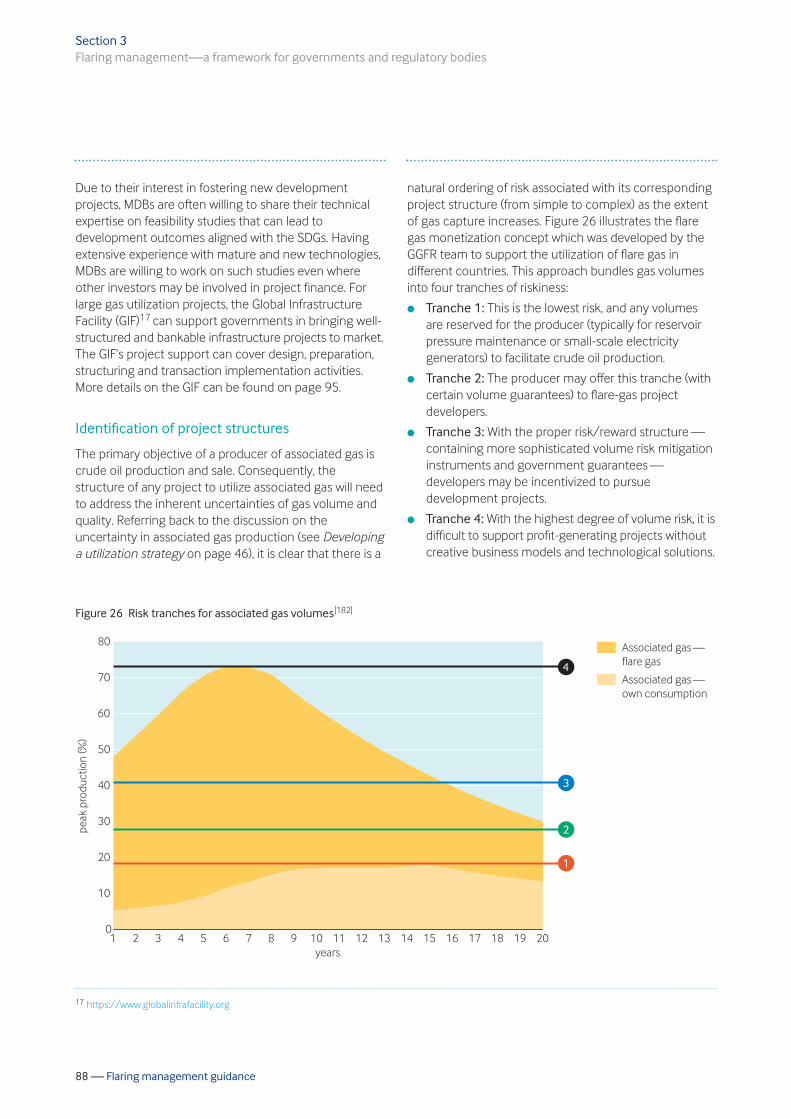
88 — Flaring management guidance
Due to their interest in fostering new development projects, MDBs are often willing to share their technical expertise on feasibility studies that can lead to development outcomes aligned with the SDGs. Having extensive experience with mature and new technologies, MDBs are willing to work on such studies even where other investors may be involved in project finance. For large gas utilization projects, the Global Infrastructure Facility (GIF)17 can support governments in bringing well-structured and bankable infrastructure projects to market. The GIF’s project support can cover design, preparation, structuring and transaction implementation activities. More details on the GIF can be found on page 95.
Identification of project structures
The primary objective of a producer of associated gas is crude oil production and sale. Consequently, the structure of any project to utilize associated gas will need to address the inherent uncertainties of gas volume and quality. Referring back to the discussion on the uncertainty in associated gas production (see Developing a utilization strategy on page 46), it is clear that there is a
natural ordering of risk associated with its corresponding project structure (from simple to complex) as the extent of gas capture increases. Figure 26 illustrates the flare gas monetization concept which was developed by the GGFR team to support the utilization of flare gas in different countries. This approach bundles gas volumes into four tranches of riskiness:
l Tranche 1: This is the lowest risk, and any volumes are reserved for the producer (typically for reservoir pressure maintenance or small-scale electricity generators) to facilitate crude oil production.
l Tranche 2: The producer may offer this tranche (with certain volume guarantees) to flare-gas project developers.
l Tranche 3: With the proper risk/reward structure —containing more sophisticated volume risk mitigation instruments and government guarantees —developers may be incentivized to pursue development projects.
l Tranche 4: With the highest degree of volume risk, it is difficult to support profit-generating projects without creative business models and technological solutions.
Section 3 Flaring management—a framework for governments and regulatory bodies
Figure 26 Risk tranches for associated gas volumes [182]
# �'�#����
�����-A.
1
E1
51
31
41
/1
! ���40EC/2
�������� �����N�8������#���
�������� �����N%��� ����
01
C1
21
3 5 6 21 22 2/ 2C 2E 20 24 23 25 26 /1
:
8
6
4
17 https://www.globalinfrafacility.org
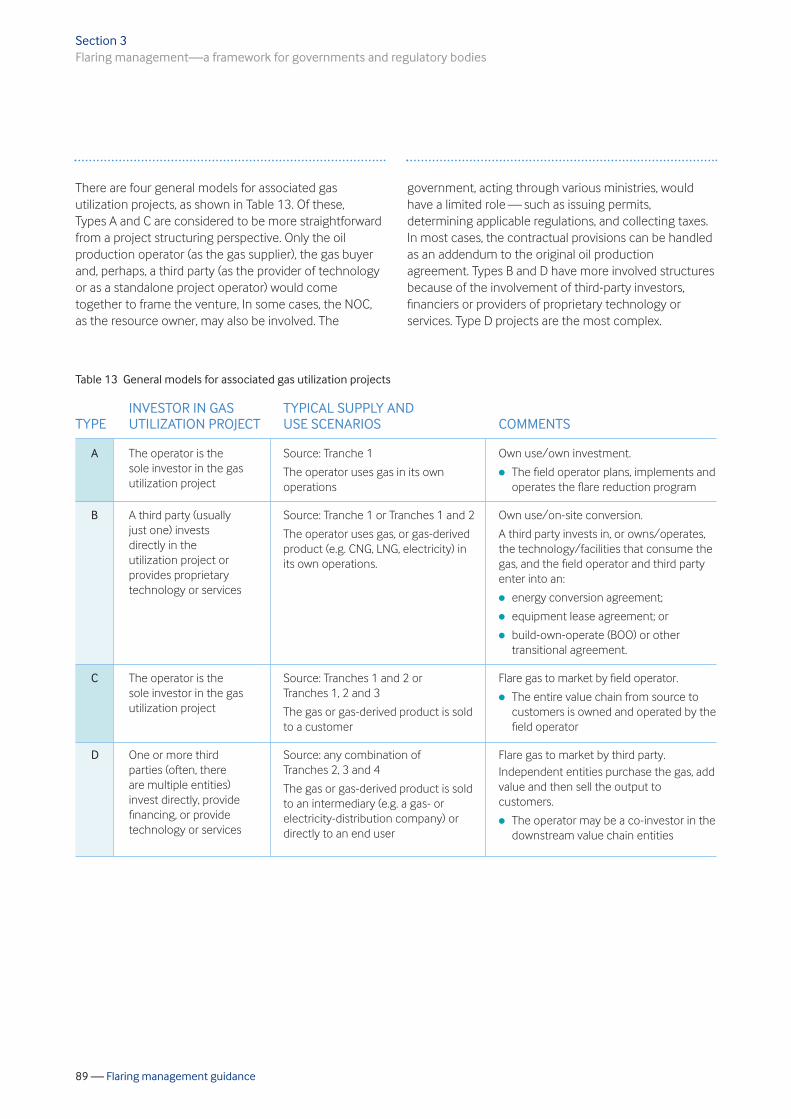
89 — Flaring management guidance
There are four general models for associated gas utilization projects, as shown in Table 13. Of these, Types A and C are considered to be more straightforward from a project structuring perspective. Only the oil production operator (as the gas supplier), the gas buyer and, perhaps, a third party (as the provider of technology or as a standalone project operator) would come together to frame the venture, In some cases, the NOC, as the resource owner, may also be involved. The
government, acting through various ministries, would have a limited role — such as issuing permits, determining applicable regulations, and collecting taxes. In most cases, the contractual provisions can be handled as an addendum to the original oil production agreement. Types B and D have more involved structures because of the involvement of third-party investors, financiers or providers of proprietary technology or services. Type D projects are the most complex.
Section 3 Flaring management—a framework for governments and regulatory bodies
Table 13 General models for associated gas utilization projects
A
B
C
D
The operator is the sole investor in the gas utilization project
A third party (usually just one) invests directly in the utilization project or provides proprietary technology or services
The operator is the sole investor in the gas utilization project
One or more third parties (often, there are multiple entities) invest directly, provide financing, or provide technology or services
Source: Tranche 1
The operator uses gas in its own operations
Source: Tranche 1 or Tranches 1 and 2
The operator uses gas, or gas-derived product (e.g. CNG, LNG, electricity) in its own operations.
Source: Tranches 1 and 2 or Tranches 1, 2 and 3
The gas or gas-derived product is sold to a customer
Source: any combination of Tranches 2, 3 and 4
The gas or gas-derived product is sold to an intermediary (e.g. a gas- or electricity-distribution company) or directly to an end user
Own use/own investment.
l The field operator plans, implements and operates the flare reduction program
Own use/on-site conversion.
A third party invests in, or owns/operates, the technology/facilities that consume the gas, and the field operator and third party enter into an:
l energy conversion agreement;
l equipment lease agreement; or
l build-own-operate (BOO) or other transitional agreement.
Flare gas to market by field operator.
l The entire value chain from source to customers is owned and operated by the field operator
Flare gas to market by third party. Independent entities purchase the gas, add value and then sell the output to customers.
l The operator may be a co-investor in the downstream value chain entities
TYPE
INVESTOR IN GAS UTILIZATION PROJECT
TYPICAL SUPPLY AND USE SCENARIOS
COMMENTS

90 — Flaring management guidance
A number of factors influence the choice of project structure, especially for Type D projects.[183] Key factors include the following:
l Legal regime and taxes: The host country’s legal regime and local taxes often have a major impact on project structure. Regulations (e.g. local content requirements) and tax rates for the upstream sector may be different from the sector applicable to the associated gas project.
l Governance: A typical oil production operation receives oversight from the host national government through its oil ministry and day-to-day direction through an operating committee. For an associated gas project, the governance arrangement may need to be broadened to include local stakeholders, lenders and key customers.
l Efficient use of project facilities: The associated gas project structure should encourage efficient use of all project facilities, by the project owners and by third parties. The structure should encourage sharing of common facilities, open access for third parties to utilize spare capacity and reduction of unnecessary facilities and their related costs, thereby making the project more profitable for all stakeholders.
l Flexibility in ownership: There may be a desire by the government, other local stakeholders, and lenders to have a direct ownership interest in all, or specified portions of, the project. The choice of a particular structure can enable different levels of ownership in the different components of the project.
l Risk management: All projects carry some risk. The more complex the technology, the greater the number of participants in the value chain, the more layered the financing, and the more untested the regulatory and fiscal structures are, the greater the risk to successful execution of the project. Each aspect can be managed (‘de-risked’) through contractual terms or financial instruments. Where a third party is involved in a venture, the decision drivers and thresholds may be different, as it may have a lower hurdle rate for investment than the oil producer, or a different perspective regarding risk.
l Desire for limited recourse financing: If the project intends to attract limited recourse project financing, a special purpose corporate entity will generally need to be set up as the finance partner.
l Marketing arrangements: The marketer of the final gas or derivative products can be different from the producer, depending on the project structure.
l Transfer price: The transfer price is the price of gas sold by the upstream gas producer to the utilization project entity. Pricing is often a contentious issue, since the major sponsors of the utilization project must negotiate benefit sharing with the upstream gas producer. When the gas is moved from the upstream (production) to the downstream (e.g. LNG) sector, an ‘arm’s length’ price may be difficult to negotiate. Each segment of the gas value chain may fall under a different fiscal regime. The overall profit of the sponsor will be influenced by determining where the economic value is captured.
One other important consideration is the in-country gas distribution network or power grid readiness (e.g. physical infrastructure, such as transmission pipelines, grid management systems, and distribution networks), plus the management and administrative structures to support a major associated gas development project. Furthermore, the way in which markets are structured can have a significant effect on the likelihood and rate of implementation of any gas utilization project. The supply, wholesale, and retail market segments for natural gas and electricity can be structured as exclusive, competitive, or a hybrid with prices that are either regulated or market-based. Of critical importance in any energy market is a clear and dependable path through which end users pay for the gas or electricity received. The flow of energy from the gas developer through to the end user, and the flow of funds in the opposite direction, are the key features of any market and the critical facilitating features of any project. Establishing a creditworthy buyer can also present challenges in some countries. Due to the lack of buyers with a pre-existing credit position who are able to support financing requirements, project developers and lenders may need to examine the value chain down to the source of the cash flow, i.e. the end user of the gas or power produced. This is especially important in the case of traditional take-or-pay contracts. Guarantees and third-party risk sharing can be essential for ensuring that the market is structured to support the project. Where the government plays an important role in catalyzing a project, development of standard templates for key commercial agreements can foster a more productive review by prospective project developers and financiers.
Section 3 Flaring management—a framework for governments and regulatory bodies

91 — Flaring management guidance
Table 14 highlights several agreements that come from the experience of the Nigerian Gas Flare Commercialisation Programme.
Private sector participation framework
Creating an enabling environment for private sector participation in an associated gas project should involve most of the government’s ministries, and should take into account the following: [185]
l Aligned and consistent policies on ease of doing business need to be put in place. This includes registration of new businesses and, for foreign investors, ease of capital repatriation.
l The country’s creditworthiness is a fundamental requirement in encouraging project finance, including attracting offshore financing interests. Availability of local financing enables more attractive structuring of deals and lowers attendant financing costs.
l Frameworks should enable the aligned and smoother implementation of infrastructure; these include right-of-way laws, sectoral regulations and arbitration processes.
l There should be a clear indication of the sectors in which the government seeks private participation. This should be communicated consistently from the onset of planning. Major changes in government policies will almost certainly impact private sector confidence and commitment.
Associated gas utilization projects that have significant scale and scope, where there are multiple investors, and for which external finance is necessary, can sometimes get stuck at the conception phase. Often this is due to the perceptions of investors and project owners that the risk is too high and the returns too low versus alternative uses of capital. An example of a high-level risk register is shown in Table 15 on page 92.
Section 3 Flaring management—a framework for governments and regulatory bodies
Table 14 Key commercial agreements [184]
Milestone development agreement
Gas supply agreement
Connection agreement
Deliver or pay agreement
l Flare gas buyer (project proponent)
l Government or producer
l Flare gas buyer
l Government or producer
l Flare gas buyer
l Producer (and/or pipeline transporter)
l Producer
l Flare gas buyer
The buyer commits to implement the project according to a set of milestones. Buyer performance is encouraged by a bond or other surety instrument.
Involves transfer of gas ownership from government (or resource owner/producer) to buyer; take-or-pay terms apply.
Delivery terms and conditions, rules for the physical connection of facilities, and nomination procedures apply.
The producer guarantees that a specified volume of gas will be delivered or a fee will be paid by the producer to the buyer.
TYPE PARTIES DESCRIPTION
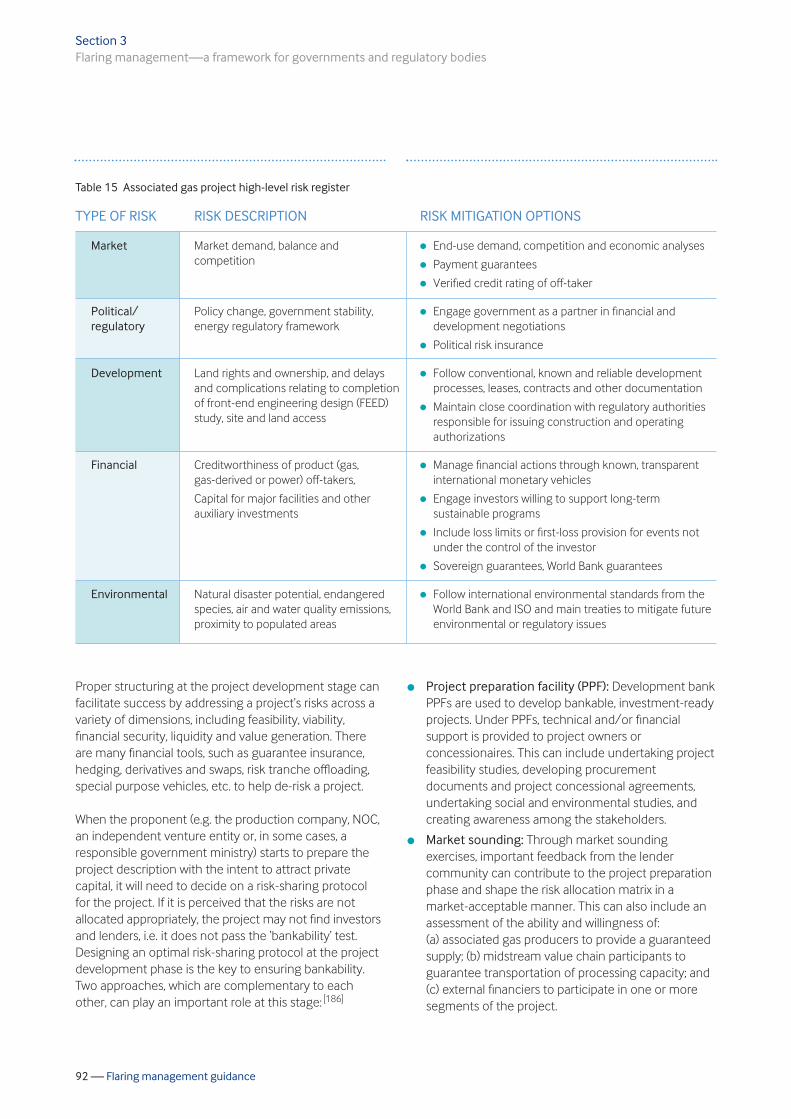
92 — Flaring management guidance
Proper structuring at the project development stage can facilitate success by addressing a project’s risks across a variety of dimensions, including feasibility, viability, financial security, liquidity and value generation. There are many financial tools, such as guarantee insurance, hedging, derivatives and swaps, risk tranche offloading, special purpose vehicles, etc. to help de-risk a project. When the proponent (e.g. the production company, NOC, an independent venture entity or, in some cases, a responsible government ministry) starts to prepare the project description with the intent to attract private capital, it will need to decide on a risk-sharing protocol for the project. If it is perceived that the risks are not allocated appropriately, the project may not find investors and lenders, i.e. it does not pass the ‘bankability’ test. Designing an optimal risk-sharing protocol at the project development phase is the key to ensuring bankability. Two approaches, which are complementary to each other, can play an important role at this stage: [186]
l Project preparation facility (PPF): Development bank PPFs are used to develop bankable, investment-ready projects. Under PPFs, technical and/or financial support is provided to project owners or concessionaires. This can include undertaking project feasibility studies, developing procurement documents and project concessional agreements, undertaking social and environmental studies, and creating awareness among the stakeholders.
l Market sounding: Through market sounding exercises, important feedback from the lender community can contribute to the project preparation phase and shape the risk allocation matrix in a market-acceptable manner. This can also include an assessment of the ability and willingness of: (a) associated gas producers to provide a guaranteed supply; (b) midstream value chain participants to guarantee transportation of processing capacity; and (c) external financiers to participate in one or more segments of the project.
Section 3 Flaring management—a framework for governments and regulatory bodies
Table 15 Associated gas project high-level risk register
Market
Political/ regulatory
Development
Financial
Environmental
Market demand, balance and competition
Policy change, government stability, energy regulatory framework
Land rights and ownership, and delays and complications relating to completion of front-end engineering design (FEED) study, site and land access
Creditworthiness of product (gas, gas-derived or power) off-takers,
Capital for major facilities and other auxiliary investments
Natural disaster potential, endangered species, air and water quality emissions, proximity to populated areas
l End-use demand, competition and economic analyses
l Payment guarantees
l Verified credit rating of off-taker
l Engage government as a partner in financial and development negotiations
l Political risk insurance
l Follow conventional, known and reliable development processes, leases, contracts and other documentation
l Maintain close coordination with regulatory authorities responsible for issuing construction and operating authorizations
l Manage financial actions through known, transparent international monetary vehicles
l Engage investors willing to support long-term sustainable programs
l Include loss limits or first-loss provision for events not under the control of the investor
l Sovereign guarantees, World Bank guarantees
l Follow international environmental standards from the World Bank and ISO and main treaties to mitigate future environmental or regulatory issues
TYPE OF RISK RISK DESCRIPTION RISK MITIGATION OPTIONS
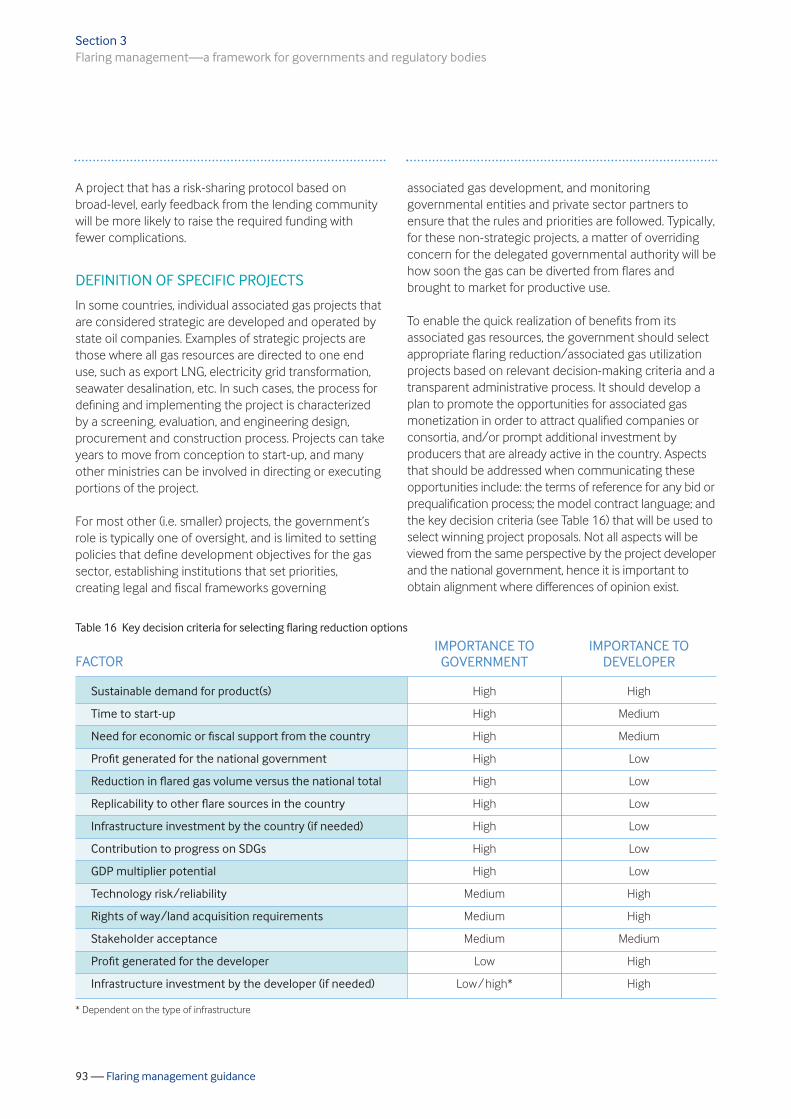
93 — Flaring management guidance
A project that has a risk-sharing protocol based on broad-level, early feedback from the lending community will be more likely to raise the required funding with fewer complications.
DEFINITION OF SPECIFIC PROJECTS
In some countries, individual associated gas projects that are considered strategic are developed and operated by state oil companies. Examples of strategic projects are those where all gas resources are directed to one end use, such as export LNG, electricity grid transformation, seawater desalination, etc. In such cases, the process for defining and implementing the project is characterized by a screening, evaluation, and engineering design, procurement and construction process. Projects can take years to move from conception to start-up, and many other ministries can be involved in directing or executing portions of the project. For most other (i.e. smaller) projects, the government’s role is typically one of oversight, and is limited to setting policies that define development objectives for the gas sector, establishing institutions that set priorities, creating legal and fiscal frameworks governing
associated gas development, and monitoring governmental entities and private sector partners to ensure that the rules and priorities are followed. Typically, for these non-strategic projects, a matter of overriding concern for the delegated governmental authority will be how soon the gas can be diverted from flares and brought to market for productive use. To enable the quick realization of benefits from its associated gas resources, the government should select appropriate flaring reduction/associated gas utilization projects based on relevant decision-making criteria and a transparent administrative process. It should develop a plan to promote the opportunities for associated gas monetization in order to attract qualified companies or consortia, and/or prompt additional investment by producers that are already active in the country. Aspects that should be addressed when communicating these opportunities include: the terms of reference for any bid or prequalification process; the model contract language; and the key decision criteria (see Table 16) that will be used to select winning project proposals. Not all aspects will be viewed from the same perspective by the project developer and the national government, hence it is important to obtain alignment where differences of opinion exist.
Section 3 Flaring management—a framework for governments and regulatory bodies
Table 16 Key decision criteria for selecting flaring reduction options
* Dependent on the type of infrastructure
Sustainable demand for product(s)
Time to start-up
Need for economic or fiscal support from the country
Profit generated for the national government
Reduction in flared gas volume versus the national total
Replicability to other flare sources in the country
Infrastructure investment by the country (if needed)
Contribution to progress on SDGs
GDP multiplier potential
Technology risk/reliability
Rights of way/land acquisition requirements
Stakeholder acceptance
Profit generated for the developer
Infrastructure investment by the developer (if needed)
High
High
High
High
High
High
High
High
High
Medium
Medium
Medium
Low
Low / high*
High
Medium
Medium
Low
Low
Low
Low
Low
Low
High
High
Medium
High
High
FACTORIMPORTANCE TO
GOVERNMENTIMPORTANCE TO
DEVELOPER

94 — Flaring management guidance
THIRD-PARTY FUNDING OPPORTUNITIES
Marrying the technological solution with the capital needed to construct the infrastructure and facilities is a critical step in any project that is designed to monetize associated gas that had previously been flared. The most expedient path is when the oil and gas producer can self-fund or self-finance the entirety of the project. However, this typically requires that the project: (a) meets the investment hurdle rates established by the company; (b) is required by law, regulation or an agreement with a host government; or (c) is driven by a company policy. For those cases where the oil and gas producer cannot support an entire associated gas flaring reduction/ monetization project, other (external) sources of finance will be required. Key among such funding sources are those that focus on ‘climate finance’, a broadly defined term that encompasses local, national or transnational financing that comes from public, private and alternative sources, and which seeks to support mitigation and adaptation actions that address climate change. In the two-year period from 2017–2018, annual climate finance flows reached USD 579 billion, representing an increase of USD 116 billion (25%) compared with the 2015–2016 period (see Figure 27). This rise in finance flows reflects increases in financing across nearly all types of investors.[187]
Not all external finance that falls under the umbrella of ‘climate finance’ is available to help support an associated gas monetization project. Some sources focus only on renewable energy projects. Others consider a broader portfolio of projects, but may still restrict or avoid investing in any initiative that involves fossil fuel assets, even where there is potential for significant GHG emissions reductions. The following sections describe the most likely sources of external assistance (including funding) for an associated gas monetization project —private equity funds, the GIF, and climate and concessional funds.
Private equity funds
Private equity (PE) is an investment class consisting of capital that is not listed on a public exchange. The private equity industry is comprised of institutional investors such as pension funds, and PE firms funded by accredited investors. Pension funds generally act as passive investors, whereas PE firms are often active investors, providing operational support to the management of the target company. Typically, PE firms have a higher risk tolerance (as compared to pension funds) and seek higher rates of return from their investments over shorter investment horizons of 4–7 years compared with other types of investors.
Section 3 Flaring management—a framework for governments and regulatory bodies
Figure 27 Global climate finance flows [187]
�����
���?
1
/11
311
E11
C11
211
/1207/124
#��,�� �������
#� ����������
/12C7/12E /1237/125
011
411
2E0
//1
C40
/20
/E6
E4C
/0C
C/4
036

95 — Flaring management guidance
A typical role for PE investors in addressing flaring reduction opportunities is to provide capital for developers of new gas utilization technologies or service companies. Equity investments can provide benefits to a project owner by offsetting certain costs (for example the capital cost of equipment) and spreading the risk to other parties. Lease financing is another option for some flaring reduction/gas monetization projects. In this approach, the project developer leases all or part of the project assets to a private equity investor. PE can also play a role in underwriting project finance for defined portions of large gas infrastructure or development projects such as compression and pipeline infrastructure, gas plants, LNG export terminals or other midstream/downstream ventures. Investors can also develop and own the flare reduction/gas monetization projects or provide portfolio equity and sell their equity shares over time. In such cases, it is not uncommon for PE to be part of a consortium of investors that includes other financial institutions, such as commercial banks.
Global Infrastructure Facility (GIF)
On a different end of the spectrum from PE funds lies the GIF — a global, open platform that facilitates the preparation and structuring of complex infrastructure public-private partnerships to enable the mobilization of private sector and institutional investor capital. The GIF does not fund projects directly. Instead, it works with client governments to support the development or enhancement of infrastructure assets. The projects are implemented primarily by privately-operated entities, or by public sector entities operating on a commercial basis. The key requirements for GIF involvement are that the project: (a) provides infrastructure as a public service; (b) has strong potential to achieve financial viability and sustainability; and (c) will attract long-term private capital. The GIF platform (Figure 28) coordinates and integrates the efforts of MDBs, private sector investors and financiers, and governments interested in infrastructure investment in emerging markets and developing economies (EMDEs). The GIF helps to develop EMDE infrastructure as an asset class that is attractive to the full range of private investors seeking diversification into long-term assets in faster growing economies. This approach enables collaboration and collective action on complex projects that no single institution could achieve alone.[188]
The GIF supports governments in bringing bankable infrastructure projects to market, focusing on those that are well-structured and able to attract a wide range of private investors. It leverages the expertise of its Advisory Partners, which include institutional investors, commercial banks, development finance institutions and banks and other organizations.
Section 3 Flaring management—a framework for governments and regulatory bodies
Figure 28 Global Infrastructure Facility organization
��������� ����
� ������ ����
?�����O�H�����+�'
�����������������
�������? , ��#�������!
� #� � ����, �
�������������������
�������� ���? , ��#� �
+�'�
�� ��!��"�������
������������, �����
���� �����O��, ��� �
+�'�
�%���������� �, ��� ��O
<��� �����������
� �3��������
����
? , ��# ��
#$����%&��������

96 — Flaring management guidance
The GIF’s project preparation and transaction support activities can include advisory support for client governments as needed through the following project stages:
l Project definition and enablement — preliminary work to prioritize investments and test a project concept through ‘pre-feasibility’ analysis, as well as support for legal, regulatory or institutional reforms as required to enable successful development and/or participation of long-term private capital in the financial structure of a particular project.
l Project preparation and investment feasibility —support for the full range of project preparation and appraisal activities required to bring the project to a point where the government is able to make an informed decision to proceed with a transaction.
l Transaction design and implementation — support in preparing transaction documentation and managing a competitive transaction process, including initial design of risk mitigation/credit enhancement packages.
l Post-transaction and financing — continued support provided to the client government as a project moves from commercial to financial close, including updates to pricing and fiscal analysis related to government contributions, as well as guidance on the selection of the most appropriate credit enhancements.
With regard to associated gas flaring reduction projects, the GIF’s project preparation and structuring activities have been approved for the feasibility analysis of a ‘virtual pipeline’ project in Ecuador that aims to capture, store and transport untreated gas from multiple oilfields to processing facilities using a network of specialized trucks. The gas is intended to be used for power generation or to produce natural gas-derived products.
Climate and concessional funds
Between PE funds and the GIF are many different organizations that exist to facilitate projects that generate positive climate outcomes. Fundamentally, they all exist to address the high cash flow demand/high-risk portion of a project’s life cycle noted in Figure 29. Climate-focused finance flows in diverse ways. Funding originates from different public and/or private sources, flows through a variety of multilateral, bilateral and national public or private channels, and is invested in various ways (on commercial or concessional terms) to satisfy activity- and recipient-specific needs and circumstances.
Section 3 Flaring management—a framework for governments and regulatory bodies
Figure 29 Variation in risk and cash flow over the typical project life cycle [189]
����������� ������������ ?��������
�����%��8
���'

97 — Flaring management guidance
MDBs are international financial institutions chartered by two or more countries for the purpose of encouraging economic development in poorer nations. They consist of member nations from developed and developing countries. Unlike commercial banks, MDBs do not seek to maximize profits for their shareholders. Instead, they prioritize development goals, including climate-related outcomes, and promote development. In 2019 MDBs reported a total of USD 46.6 billion in financial commitments to the mitigation of climate change. Investment loans are the most common financial instrument used by MDBs, often at low or no interest rates. The reduction of gas flaring in the oil and gas industry is an activity that is eligible for classification as climate mitigation finance under the Common Principles for Climate Mitigation Finance Tracking.[190] Among the global climate funds, those that are categorized as multilateral climate funds (MCFs) include the Green Climate Fund (GCF); the Global Environment Facility (GEF), which has responsibility for several subsidiary funds, and the Clean Technology Fund (CTF), which is part of the Climate Investment Funds (CIF).
These MCFs provide the majority of dedicated climate finance for mitigation activities (see Table 17) to support the development and deployment of technologies in fast growing countries. The cumulative amount of total finance approved for mitigation from all climate funds was USD 10.4 billion as of December 2019. Like all MCFs, these funds, which are administered by the World Bank, typically work though blended finance instruments (see page 98) but also provide direct loans and grants. The most common forms of climate finance provided by MCFs and MDBs are forms of concessional or ‘soft’ loans. These instruments are repayable loans provided on terms that are more favorable than those prevailing on the market, and include lower interest rates, longer terms, longer grace periods and reduced levels of collateral. Concessional loans of varying degree and type have been established as the main financing instruments through which bilateral and multilateral development banks provide support to public sector entities and local banks. In general, bilateral finance institutions and national finance institutions disburse a majority of their mitigation finance as concessional loans.
Section 3 Flaring management—a framework for governments and regulatory bodies
Table 17 The primary MCFs supporting climate mitigation (2003–2019, USD millions) [191]
CTF www.climateinvestmentfunds.org
GEF (funding cycles 4-7) www.thegef.org
GCF www.greenclimate.fund
Promotes scaled-up financing for demonstration, deployment and transfer of low-carbon technologies
Focuses on developing countries or those with economies in transition to meet the objectives of the international environmental conventions and agreements
Focuses on developing and vulnerable countries, in particular least-developed countries, Small Island Developing States, and African States
5,404
4,006
10,319
5,205
2,136
2,114
137
499
32
FUND FOCUS PLEDGED APPROVEDNUMBER OF
PROJECTS
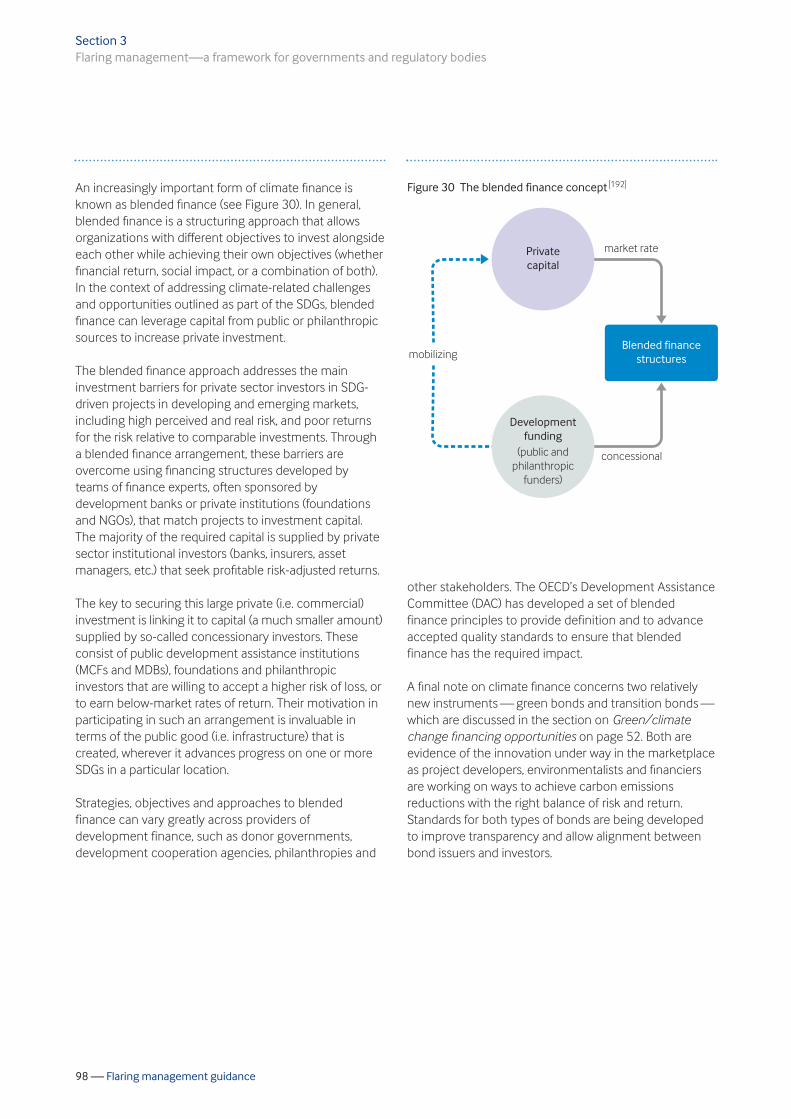
98 — Flaring management guidance
An increasingly important form of climate finance is known as blended finance (see Figure 30). In general, blended finance is a structuring approach that allows organizations with different objectives to invest alongside each other while achieving their own objectives (whether financial return, social impact, or a combination of both). In the context of addressing climate-related challenges and opportunities outlined as part of the SDGs, blended finance can leverage capital from public or philanthropic sources to increase private investment. The blended finance approach addresses the main investment barriers for private sector investors in SDG-driven projects in developing and emerging markets, including high perceived and real risk, and poor returns for the risk relative to comparable investments. Through a blended finance arrangement, these barriers are overcome using financing structures developed by teams of finance experts, often sponsored by development banks or private institutions (foundations and NGOs), that match projects to investment capital. The majority of the required capital is supplied by private sector institutional investors (banks, insurers, asset managers, etc.) that seek profitable risk-adjusted returns. The key to securing this large private (i.e. commercial) investment is linking it to capital (a much smaller amount) supplied by so-called concessionary investors. These consist of public development assistance institutions (MCFs and MDBs), foundations and philanthropic investors that are willing to accept a higher risk of loss, or to earn below-market rates of return. Their motivation in participating in such an arrangement is invaluable in terms of the public good (i.e. infrastructure) that is created, wherever it advances progress on one or more SDGs in a particular location. Strategies, objectives and approaches to blended finance can vary greatly across providers of development finance, such as donor governments, development cooperation agencies, philanthropies and
other stakeholders. The OECD’s Development Assistance Committee (DAC) has developed a set of blended finance principles to provide definition and to advance accepted quality standards to ensure that blended finance has the required impact. A final note on climate finance concerns two relatively new instruments — green bonds and transition bonds —which are discussed in the section on Green/climate change financing opportunities on page 52. Both are evidence of the innovation under way in the marketplace as project developers, environmentalists and financiers are working on ways to achieve carbon emissions reductions with the right balance of risk and return. Standards for both types of bonds are being developed to improve transparency and allow alignment between bond issuers and investors.
Section 3 Flaring management—a framework for governments and regulatory bodies
Figure 30 The blended finance concept [192]
�� ������
���(���������
'�(� ������������
-#� ������#��������#��%�� ��.
" ����������������������
���' �����
��� ������

99 — Flaring management guidance
Appendix: Case studies
l Eni Congo: Gas-to-power project 100
l PETRONAS: Flaring reduction project 103
l Qatargas: Jetty boil-off gas project 106
l Shell: Oxygen reduction catalyst to 109 optimize flash gas recovery
l Wintershall Dea: Well testing gas 114 capture project

100 — Flaring management guidance
ENI CONGO: GAS-TO-POWER PROJECT
In 2007 Eni signed an agreement with the government in the Republic of Congo to develop two electricity power stations in order to eliminate gas flaring. The agreement included the construction of the new Centrale Electrique du Congo (CEC) power station and the revamping of the existing Centrale Electrique de Djéno (CED) power station. By utilizing more than 70 million scf/day of gas (1.98 million cubic meters per day) that was previously flared, the power stations provide 60% of the country’s installed capacity and expand access to electricity for approximately 700,000 people.
Background
Historically, the vast majority of gross gas production in the Republic of Congo was not monetized, as shown in Figure A1. While flaring and venting of gas decreased by around 30% from its peak of 2.2 bcm in 2005 to 1.56 bcm in 2012,18 this trend was reversed in 2017, as shown in Figure A2 on page 101.
Appendix: Case studies
Figure A1 Natural gas production and consumption in the Republic of Congo, 2003–201219
18 Equivalent to 79 bcf in 2005, and 55 bcf in 2012.
19 https://www.eia.gov/international/analysis/country/COG
�����
��� ���% �
1
/11
E11
C11
211
/12//113/114/110/11E/11C
������#��������
���' � ��#��������
01
201
/01
C01
/115 /116 /121 /122
��!�#���������P�����#���
������������������� �9 �� ����������8 ���:
, � �����%��� �

101 — Flaring management guidance
The oil and gas industry is overseen by the Ministry of Hydrocarbons with resources managed by the state-owned company, Société Nationale des Pétroles du Congo (SNPC). A new hydrocarbons code enacted in 2016 represents the Ministry of Hydrocarbons’ strategy for the country. It encourages exploration and production activities by introducing provisions conducive to the recovery of investment by private companies, as well as more favorable fiscal and customs regimes. Certain taxes and fees are imposed for gas flaring. With respect to associated gas utilization, an earlier code, Decree 2007/294, prohibits systematic flaring by operating companies. Any flaring must be reported to the government. The Republic of Congo recently endorsed the ‘Zero Routine Flaring by 2030’ initiative. In 2019, Congo held 284 bcm of proven natural gas reserves, and the market production was 0.58 bcm.21 All of the marketed production was consumed domestically. A significant portion of the natural gas produced in Congo is reinjected into oil wells to assist recovery.
Société Nationale d’Electricité (SNE), the national electricity company, controls the electricity generation, transmission and distribution sectors. Power consumption is low in Congo because of the limited transmission system that mainly serves the country’s principal cities, Brazzaville and Point-Noire. In urban areas, the demand for electricity has increased over the past decade, and Congo has had to rely on power imports to satisfy domestic consumption. Hydropower accounts for a substantial portion of the country’s power generation. Honoring its public commitment to eliminate flaring, maintaining compliance with all applicable regulations and working as a trusted partner with resource owners are key drivers for Eni’s comprehensive approach to implementing flaring reduction projects. As an endorser of the ‘Zero Routine Flaring by 2030’ initiative, the company has established an internal policy and process to identify flare reduction and gas monetization/ utilization projects.
Appendix Case studies
Figure A2 Gas flaring in the Republic of Congo, 2005–201920
������
���
����
��
� �
�
���
���
����������������
���
���
���
���� ���� ���� ���� ���� ���� ���� ���� ���� ���� ����
20 Sources include:
• http://pubdocs.worldbank.org/en/503141595343850009/WB-GGFR-Report-July2020.pdf • https://www.worldbank.org/en/programs/gasflaringreduction/global-flaring-data • https://www.researchgate.net/publication/265335324 • https://www.eia.gov/international/analysis/country/COG
21 https://www.opec.org/opec_web/en/about_us/5090.htm

102 — Flaring management guidance
Operational enhancements in the company’s program to reduce associated gas flaring include: adding compression to move the gas to market; in-field generation of electricity using associated gas; direct measurement of the volumes of gas flared; managing process/equipment start-ups to reduce flaring; and enhancing the maintenance of equipment to improve reliability.
Project description
Following the acquisition of the existing M’Boundi onshore oilfield in 2007, Eni developed a large-scale energy access model in the country. In the same year the company launched an integrated project with the dual purpose of increasing electricity capacity and reducing gas flaring. In 2008, Eni began constructing two gas-fired power plants (CEC and CED), upgrading the energy transport infrastructure between Pointe-Noire and Brazzaville, and extending the electricity distribution network in the city of Pointe-Noire. In the first phase of this project, a 300 MW electricity production plant was built which started operating in March 2010. It supplies the town of Point Noire which has a population of approximately 700,000 people. At the end of 2011, the high voltage electricity line between Punta Nera and Brazzaville was put into operation. The project was designed to promote the country’s energy resources, maximize the use of gas for electricity production, improve the energy distribution system in the area and enhance the development of local markets. Prior to the project, the M’Boundi oilfield produced approximately 1.98 million cubic meters of associated gas per day, all of which was flared. The API gravity of oil produced (some by hydraulic fracturing) in the field is 34–49 and has a GOR of 86 cubic meters/bbl. The gas is approximately 75% methane and contains less than 3% pentanes plus higher carbon hydrocarbons (C5+) and less than 0.5% CO2, nitrogen and H2S.
The integrated M’Boundi gas valorization project, with a total cost of approximately USD 300 million, included the implementation of the following sub-projects aimed at recovering and utilizing the associated gas that was previously flared at the M’Boundi oilfield:
l M’Boundi gas gathering: a pipeline was constructed to transport recovered gas from M’Boundi to the Djéno area, where the power plants are located. Eni installed the necessary gas capture, treatment, compression and pipeline infrastructure, along with facilities for condensate recovery.
l CED re-powering: the capacity of the existing CED power plant was doubled to 50 MW via the installation of a second simple-cycle gas turbine.
l CEC construction: this involved the development of a new 300 MW power plant (open-cycle gas turbine) in the Djéno area near the CED facility. The power plant was commissioned in 2010. A third gas turbine, adding 170 MW, was commissioned in 2020. The CEC power station supplies energy to the entire municipality of Pointe-Noire, and the excess electricity is transmitted to the city of Brazzaville via a recently upgraded high-voltage network.
l Gas reinjection program: a program was developed to reinject excess gas while optimizing reserve recovery from the oilfield.
Outcomes
Flare reduction
The flaring reduction project of the M’Boundi field was completed during 2015, achieving the zero routine flaring target in the area. The key objective of the project was gas valorization through power generation and access to energy. In particular, the associated gas was fully monetized through a program of gas injection in order to optimize reserve recovery, and a long-term supply contract with power plants in the area including the CEC plant (Eni’s interest is 20%). The M’Boundi integrated project was a key part of Eni’s strategic objectives to reduce its gas flaring worldwide by 80% by 2015 with respect to a 2007 baseline.
Appendix Case studies
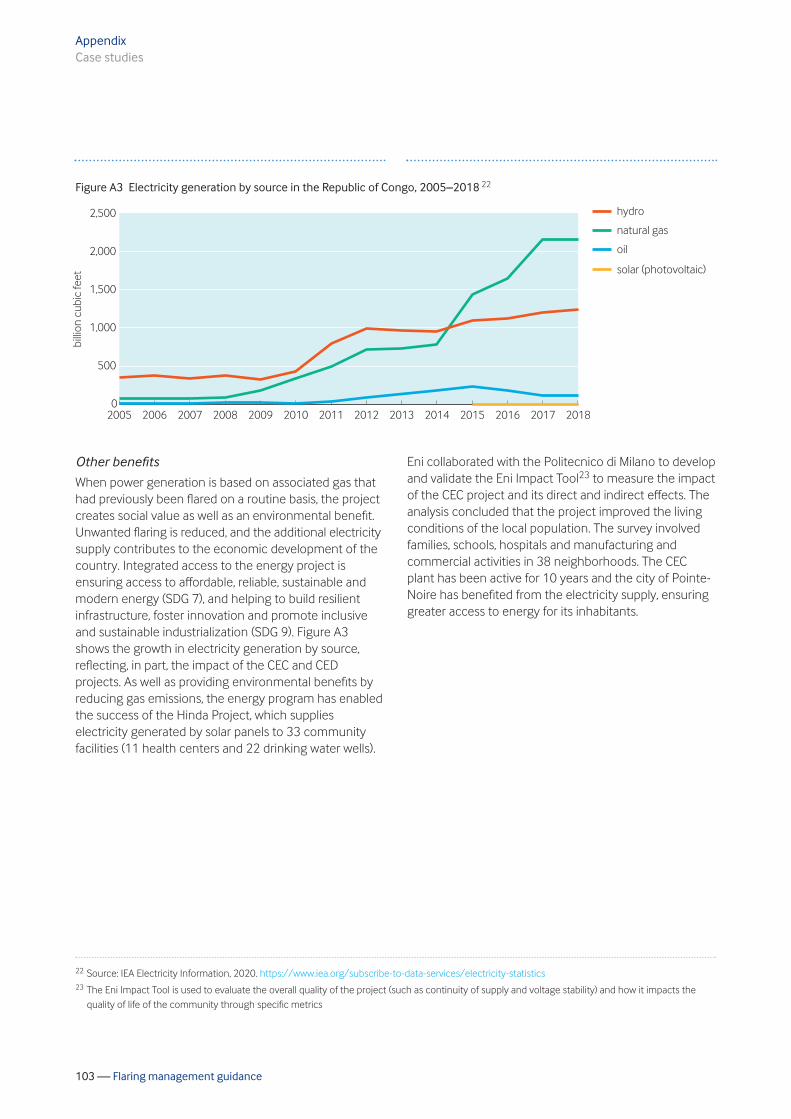
103 — Flaring management guidance
Eni collaborated with the Politecnico di Milano to develop and validate the Eni Impact Tool23 to measure the impact of the CEC project and its direct and indirect effects. The analysis concluded that the project improved the living conditions of the local population. The survey involved families, schools, hospitals and manufacturing and commercial activities in 38 neighborhoods. The CEC plant has been active for 10 years and the city of Pointe-Noire has benefited from the electricity supply, ensuring greater access to energy for its inhabitants.
Appendix Case studies
Figure A3 Electricity generation by source in the Republic of Congo, 2005–2018 22
�����
��� ���% �
1
/:111
2:111
/125/113/114/110
�!���
����������
011
2:011
/:011
/115 /116 /121 /122
���
/12C /12E /120 /124/12/ /123
������-#����,������.
22 Source: IEA Electricity Information, 2020. https://www.iea.org/subscribe-to-data-services/electricity-statistics 23 The Eni Impact Tool is used to evaluate the overall quality of the project (such as continuity of supply and voltage stability) and how it impacts the
quality of life of the community through specific metrics
Other benefits
When power generation is based on associated gas that had previously been flared on a routine basis, the project creates social value as well as an environmental benefit. Unwanted flaring is reduced, and the additional electricity supply contributes to the economic development of the country. Integrated access to the energy project is ensuring access to affordable, reliable, sustainable and modern energy (SDG 7), and helping to build resilient infrastructure, foster innovation and promote inclusive and sustainable industrialization (SDG 9). Figure A3 shows the growth in electricity generation by source, reflecting, in part, the impact of the CEC and CED projects. As well as providing environmental benefits by reducing gas emissions, the energy program has enabled the success of the Hinda Project, which supplies electricity generated by solar panels to 33 community facilities (11 health centers and 22 drinking water wells).

104 — Flaring management guidance
PETRONAS: FLARING REDUCTION PROJECT
Summary
In an existing offshore legacy field producing low-pressure associated gas, PETRONAS has implemented novel, low-cost surface jet pump (SJP) technology to recover flare gas, where the use of a conventional booster compressor had been commercially challenging due to limited deck space. The first-ever application of the SJP technology by PETRONAS began in 2019. Since then, it has been successfully tested for capturing 5–7 million scf/day of associated gas (100%) that had been flared routinely from the source wells.
Background
The gas industry in Malaysia incorporates all components of the complete value chain. Offshore, gas is produced by upstream companies under production-sharing arrangements with PETRONAS, the national oil and gas company. The downstream sector of Malaysia’s natural gas industry consists primarily of domestic consumption and exports of LNG. A Gas Master Plan Study commissioned by PETRONAS in 1981 set the roadmap for the development of a natural gas-based economy. It led to the implementation of the Peninsular Gas Utilization (PGU) transmission grid, which has facilitated the construction of more than 10,000 MW of installed power generating capacity, and enabled PETRONAS Chemicals to become one of South East Asia’s largest integrated gas-based chemicals producers. Further downstream, the PGU grid feeds into the Natural Gas Distribution System, where gas is piped to retail (mostly industrial) customers. Gas exports to Singapore also flow through the PGU grid. Embedded in the Malaysian government’s energy and economic policies is the view that the natural gas infrastructure and gas-based industries enable national growth and sustainable development. The Petroleum Development Act, 1974 vested in PETRONAS the ownership and exclusive rights of exploring petroleum in Malaysia, and provides PETRONAS with the rights to issue licenses for contractors to commence and continue any business or service pertaining to upstream activities.
Recently, as gas production has declined to a level that is unable to satisfy domestic demand in Peninsular Malaysia, steps have been taken to open the gas market in Malaysia. The government, via the New Energy Policy 2010, the 10th Malaysia Plan and the Economic Transformation Programme, introduced the concept of the ‘third-party access’ system. Aimed at enhancing the security, reliability and sustainability of the gas supply in Malaysia, the goal is to have gas consumers benefit from competitive prices, better services and enhanced sustainability that comes from third-party access to the gas infrastructure and from market competition. PETRONAS acts as the national regulatory body through Malaysia Petroleum Management, which is entrusted as the governing body for upstream activities in Malaysia. All operators must comply with the requirements stipulated by PETRONAS. Although there is no specific regulation by the national government on flare reduction, PETRONAS has imposed certain requirements. All new projects are required to operate a policy of zero continuous flaring and venting. For existing facilities, flaring and venting limits are applicable, and efforts to eliminate such activities must be pursued to achieve emissions targets. For both new and legacy operations, routine flaring is allowed temporarily (one day) and all flaring of associated gas must be reported to the government at a regular frequency, with volumes measured by flow meters. Natural gas plays an important role in Malaysia’s energy mix, accounting for more than 40% of the primary energy supply in 2018. However, Malaysia is among a small number of countries that both import and export LNG (see Figure A4 on page 105).
Appendix Case studies

105 — Flaring management guidance
In 2019 Malaysia exported 32.8 bcm from facilities located on the island of Borneo. It also imported 3.74 bcm of LNG to balance declining production from the gas fields around Peninsular Malaysia. This situation is the result of a geographical barrier; there is no pipeline connection between the LNG producing facilities and the regional demand markets.
Consumption of natural gas in Malaysia is spread across several sectors, with power generation being the largest (Figure A5, below).
Appendix Case studies
Figure A4 Supply and demand trend for LNG and pipeline gas in Malaysia, 1980–2016 24
24 Source: Gomes, I. (2020). The dilemma of gas importing and exporting countries. OIES Paper: NG 161. Oxford Institute for Energy Studies. https://www.oxfordenergy.org/wpcms/wp-content/uploads/2020/08/The-dilemma-of-gas-importing-and-exporting-countries-NG-161.pdf
25 Source: Malaysian Gas Association. https://malaysiangas.com/article-of-natural-gas
�����
��� ���� � ��
1
51
E1
/1242654265C2651
��)���#����
#�# �� ���#����
/1
41
211
2656 266/ 2660 2665
#��������
/11E /113 /121 /12C/112
��)� �#����
-/1.
-41.
-E1.
#�# �� � �#����
�����#���
Figure A5 Gas consumption in Malaysia in 2017 25
���� �������������# ����� ������
6AB �#����
���������:��� ��� ��������������� �����������4CB#�8 �
� �����;<B
;B
6A4=
CCA
25A
5A
/EA
6A
5A
�� ��#�������
<���:� , ��� ������� ����
��� ��
�� ������#�������
<� ����� ����� ������ ���
��=� ��������� ���

106 — Flaring management guidance
PETRONAS has deployed a broad spectrum of technologies to manage, recover and monetize gas resources, including in-field use within upstream operations, compression and distribution to gas consumers, power generation, and NGLs and gas-to-chemicals production. Despite a high level of awareness of such technologies, PETRONAS continues to seek new advances in associated gas utilization. This pursuit includes gathering outside (e.g. crowd-sourced) ideas for potential new solutions. For example, through a 2017 Technology Challenge presented to the global community, PETRONAS solicited ideas for the best economic solutions to monetize associated gas from offshore flaring facilities, and to reduce carbon footprint and intensity. More than 30 proposals were received.
Project description
Inevitably, as oilfields age, they experience a steady drop in reservoir pressure. This results in a reduced flow at the well head and, consequently, reduced production. In one particular offshore situation, the gas pressure was below the suction pressure of the existing compressor. To sustain production, the conventional approach would have been to lower the separator pressures, with the consequence of high flaring because of the compressor suction pressure limitation. Instead, PETRONAS implemented low-cost SJP technology to capture the produced gas. SJP technology can be both a low-cost and high-reliability solution, with a better value proposition and greater potential for carbon footprint reduction compared with a conventional booster compressor. Based on Bernoulli’s principle, SJPs use high-pressure fluid as the motive force to boost the pressure of produced gas. The high-pressure fluid passes through a nozzle, where part of the potential energy (pressure) is converted to kinetic energy (high velocity). The pressure of the fluid drops in front of the nozzle, and it is at this point where the low-pressure gas source connection is made.26
The project involved multiple offshore wells producing oil with an API gravity of 55–60 at a GOR above 10,000 scf/bbl. Total gas throughput was 5–7 million scf/day, with variations of up to 25%, as measured by a flow meter on the flared gas line. The gas was primarily methane, with < 2% higher-carbon hydrocarbons (C5+), low concentrations of inert components and no H2S. Commercial use of the first-ever application of the SJP solution began in 2019. It achieved a 100% reduction in flaring. Nearly all (99%) of the gas captured by the SJP is recycled back to main gas compressor suction from where it is then sent off-site as pipeline quality gas for sale to third parties. The remainder is used as fuel to provide field power. From inception to start-up, the project was implemented within 12 months, with half of that time being allocated to construction on the offshore platform. The total project commitment was less than USD 1 million, mostly capital, and was financed internally. Ongoing maintenance is expected to be minimal because no rotating machinery is involved. The company expected to achieve payback within one year. The project was driven by PETRONAS’ policy that seeks to eliminate all routine flaring and reduce overall GHG emissions. The first step in the project was the formation of a multidisciplinary working-level team of asset and subject matter experts within the organization for reviewing/studying present system performance with available offshore infrastructure. A key requirement was maintaining the capacity of the existing compressor on the platform. The team began by brainstorming, ‘solutioning’, simulating and evaluating various options. Those that were deemed to be infeasible included reinjection into the reservoir and greater in-field gas usage. After selecting the SJP solution, the project was sanctioned, and detailed design, installation and commissioning took place. Major project risks and mitigation strategies associated with the project were the availability of the motive gas pressure sourced from the compressor, uncertainty of the oil and gas sales price, and the suitability of the compressor performance curve.
Appendix Case studies
26 Carpenter, C. (2014). Surface Jet Pumps Enhance Production and Processing. Article published on the Journal of Petroleum Technology website on 31 October 2014. https://jpt.spe.org/surface-jet-pumps-enhance-production-and-processing

107 — Flaring management guidance
Outcomes
PETRONAS views this project as one that represents a breakthrough achievement. It is the first experience of using an SJP to recover the low-pressure gas into the main compressor suction and reduce flaring. It sets an example of how low-cost, high-reliability technology can be used to enhance oil production and facilitate the monetization of flared gas. The project is a testimony on sustainable development, where positive economic returns and beneficial environmental outcome (reduced carbon footprint as well as lower NOx and other emissions) go hand in hand. It supports SDG 12 (Responsible consumption and production), SDG 13 (Climate action) and SDG 9 (Industry, innovation and infrastructure).
QATARGAS: JETTY BOIL-OFF GAS PROJECT
Summary
In 2014, Qatargas commenced operations at the Jetty Boil-Off Gas (JBOG) Recovery Facility at Ras Laffan Port in Qatar. This facility collects BOG from LNG ship loading operations and compresses it at a central facility. The compressed gas is then sent to Qatargas LNG trains to be consumed as fuel or converted into LNG. As a result of the JBOG recovery facility, flaring at the Qatargas LNG loading berths was reduced by more than 90%, saving approximately 29 bcf of gas per year.
Background
Qatar has about 12% of the world’s proven reserves of natural gas. With the third largest reserves in the world, Qatar is committed to developing its natural gas resources for export markets. At the same time, the government, through the Qatar National Vision 2030, is pursuing economic diversification, renewable energy and environmental protection, among other significant initiatives. The Ministry of Energy Affairs exercises regulatory administration of the energy sector, covering both oil and gas production, operations and distribution. Qatar Petroleum (QP) is Qatar’s national oil company. QP’s affiliated gas operating company, Qatargas, manages all of Qatar’s 14 LNG trains with a total annual production capacity of 77 million tonnes. Qatargas is the largest LNG producer in the world. Article 29 of the 2003 Constitution provides that all natural wealth and resources, including oil and gas, belong to the state. The Ministry of Energy Affairs is the primary regulator of the oil and gas sector. Qatar has put into place numerous laws regulating its natural resources. Law No. 10 of 1974 (as amended by Law No. 15 of 1988) established QP as the national oil and gas company.
Appendix Case studies

108 — Flaring management guidance
QP acts as the commercial arm of the government with respect to its rights in exploration, development, production and transport agreements. Other important laws governing oil and gas and environmental protection are summarized below.27
l Law No. 4 of 1977 on the conservation of petroleum resources and the conduct of petroleum operations within Qatar (Preservation of Petroleum Wealth Law).
l Law No. 3 of 2007 addressing the exploitation of natural wealth and resources, which includes not only mining but also oil and gas, and any associated operations (Exploitation of Natural Resources Law).
l Decree Law No. 30 of 2002 for the protection of the environment (EP Law) addresses conservation of the environment, pollution prevention, and protection of biodiversity and human health. The EP Law is further supplemented by its Executive Regulations of 2005. The Ministry of Municipality and Environment (MME) is the regulator for the oil and gas sector and other industrial sectors in the State of Qatar. It is a regulatory requirement for Qatargas’ LNG jetty operations to recover a minimum of 90% of BOG flared during ship loading.
Natural gas plays an important role in Qatar’s energy mix, accounting for approximately 90% of the primary energy supply. Qatar produced more than 185 bcm of natural gas in 2019 and exported more than 135 bcm via LNG shipments and the Dolphin pipeline, which connects Qatar to demand markets in the UAE (see Figure A6). In addition to LNG and gas exports, Qatar has a well-integrated supply chain of gas processing facilities, which provide domestic gas for in-country industry and production of fuel additives, chemicals, fertilizers and petrochemicals. It has world-scale GTL facilities, as well as facilities for ammonia and urea production. The Qatargas Flare Reduction Programme is an over-arching program that governs flare reduction activities at Qatargas. It allows for the implementation of measures to keep flaring to a minimum while maintaining process safety. The main drivers in flare reduction stem from the company’s commitment to the Qatar National Vision 2030 and its Direction Statement. Multidisciplinary flare management teams have various roles, including: managing flaring data; conducting surveillance of ‘bad actors’, and raising, tracking and mitigating action items as necessary; revising and optimizing operational and reporting procedures where applicable; progressing operational reliability and maintenance-related initiatives where applicable; and assessing flare meter performance. Qatargas has invested in new projects utilizing existing systems, applied process and operational controls, and reduced flaring during turnarounds and trips. Some of the company’s major flare reduction initiatives include the JBOG recovery facility, purge gas reduction at LNG mega-trains, passing valves monitoring programs, and the installation of gas interconnections at some of the LNG mega-trains to help divert gas to other operating trains instead of allowing it to be flared. The above operational and engineering projects, including the JBOG recovery facility, implemented as part of the Qatargas Flare Reduction Programme, have resulted in a 76% reduction in flaring since 2011; this has resulted in annual gas savings of 55,000 million scf or the power consumption potential of more than 560,000 homes.
Appendix Case studies
27 Mahmood, S. and Early, M. (2019). Oil and gas regulation in Qatar: overview. Thompson Reuters Practical Law Country Q&A 5-525-5499 https://uk.practicallaw.thomsonreuters.com/5-525-5499?transitionType=Default&contextData=(sc.Default)&firstPage=true
28 Source: IEA. https://www.iea.org/countries/qatar
Figure A6 Gas production and export trends for Qatar, 2010–2019 28
�����
��� ���� � ��
1
241
E1
/126
/12/
/122
/121
#��������
�#����
51
251
/12C
/12E
/120
/124
/125
/123
/11
2E1
2/1
211
41
/1

109 — Flaring management guidance
Project description
Flaring during LNG operations is due to the fact that LNG evaporates when it encounters warm spaces or surfaces, generating BOG. At the Qatargas LNG loading berths, BOG is generated through vapor displacement from ship loading and vaporization. During the loading of an LNG cargo, a portion of the -160°C liquid vaporizes as it comes into contact with the warmer ship tank. Previously, this gas would be flared at the ship’s berth because there was no outlet for the low-pressure gas. Guided by Qatar’s National Vision to produce and supply clean energy to the world, Qatargas introduced the JBOG Recovery Project to recover the flared BOG. Front-end engineering design (FEED) work was awarded in late 2007. Following detailed engineering, a 55-month construction phase and subsequent commissioning, Qatargas com -menced operations at the JBOG recovery facility in 2014. During the loading of LNG tankers, around 1% of the -160°C LNG evaporates due to the difference in the temperature of the LNG and the ship’s tanks. The BOG, which is discharged from the ships at temperatures ranging between -80°C to -100°C, is collected via a large-diameter (34–60 inch) stainless steel header system. The gas is then routed to the heart of the JBOG facility — the central compression area (CCA). At the CCA, collected gas is compressed from 0.03 barg to 47.5 barg in two compressor trains (each with low-, medium- and high-pressure compressors) sized for 50% of the rated capacity of 163 tonnes of JBOG per hour. This is equivalent to the maximum amount of BOG generated by three ship loadings simultaneously. Low-pressure BOG collected from LNG ships is compressed at a central facility and then sent to LNG producers to be consumed as fuel or converted into LNG. With this installed capacity, the CCA can recover more than 90% of the total flared gases at LNG berths. One of the significant challenges was that the original design of the LNG terminal had not included sufficient space to install a compressor, driver and associated equipment. This constraint led to a change in the design of the plant, which involved relocating all of the compressors to a central location, some 5 km away. The new concept relied heavily on the ships’ BOG compressors to deliver the gas at a pressure high enough to enable the gas to be transported from the ships to the CCA.
Because the project was to be located in brownfield areas, construction logistics were difficult. About 1,500 piles had to be drilled to carry the load of the facilities. A laser scan survey of each area produced high resolution digital images, which were later incorporated into a 3D computer design model. This identified potential conflicts (especially those in the subsurface) and helped to streamline the project’s timeline, generating cost savings. Several other technical design innovations were implemented, as follows:
l Ultra-low differential pressure check valves: due to the considerable drop in pressure between the ship and the compressor, no existing check valve design was available that could handle the very low inlet pressures at temperatures ranging from -140°C to ambient temperature. A special tilting disk check valve was developed, which uses an ultra-light titanium disk shaped like an airfoil.
l Largest BOG compressor: the first stage BOG compressors, designed and built by GE Nuovo Pignone, are some of the largest in the world, and are capable of handling 163 tonnes per hour at very low suction pressures.
l Ultra-low temperature buckling pins: buckling pins are special pressure relieving devices used in applications where quick pressure relief is required. To protect the ship’s LNG tanks from an overpressure scenario, the JBOG design incorporated buckling pin valves capable of operating in cryogenic conditions, with special seals and mechanisms to ensure their reliability.
Outcomes
The JBOG facility is a landmark project for the State of Qatar, representing one of the cornerstones of Qatargas’ overall flare management strategy. Flaring due to JBOG operations was reduced by more than 90%, producing a net reduction of approximately 1.6 million tonnes of CO2 per year. In total, the facility saves 29 bcf/year which is enough to generate ~750 MW of energy, or the amount needed to power approximately 300,000 homes. As the largest environmental project of its kind in Qatar, with an investment of approximately USD 1 billion, the project is a tangible demonstration of progress on Qatar’s National Vision and National Development Strategy, and in achieving the expectations of SDG 13 (Climate action).
Appendix Case studies

110 — Flaring management guidance
SHELL: OXYGEN REDUCTION CATALYST TO OPTIMIZE FLASH GAS RECOVERY
Summary
SWEPI LP, an affiliate of the Shell group of companies operating in the Permian Basin, installed technology to reduce oxygen concentrations found in oil tank vapors, thereby upgrading the gas to a level that met pipeline quality specifications for off-site sales. This allowed the gas to be monetized, reducing the volume of gas flared by 40% compared to prior operations. Due to its field-proven performance, high reliability, low maintenance, modularity and attractive economics, Shell29 has continued to expand deployments of this technology.
Background
The Permian Basin is an oil and gas producing area located in West Texas and the adjoining area of south-eastern New Mexico. It covers an area that is approximately 250 miles wide and 300 miles long, and is composed of more than 7,000 fields in West Texas. Oil and natural gas is produced from depths ranging from a few hundred feet to five miles below the surface. The greater Permian Basin accounts for nearly 40% of all oil production in the United States, and nearly 15% of its natural gas production. The basin has historically experienced two significant increases in unconventional (horizontal) drilling activities, first in the 2011–2014 period and secondly during the oil price recovery in 2016–2018.
During late 2019, activity levels began to fall as fundamentals weakened and investor pressure led to operators shifting focus away from production growth.30 Oil and gas production rates and drilling activity began to recover in 2020 and the trend has continued into 2021. The Permian Basin has experienced a significant increase in natural gas flaring and venting in recent years, driven by a combination of higher activity levels, more production from areas with less-developed gas gathering infrastructure, and basin-wide take-away capacity bottlenecks. Flaring in the Permian Basin in Texas and New Mexico peaked in 2019, averaging more than 0.75 bcf/day.31 Flaring volumes subsequently declined as the effects of a global supply-demand imbalance worked their way through the oil markets. Within the Texas portion of the Permian Basin, event-driven flaring makes up more than 56% of total flaring. Temporary (< 1 year duration) routine flaring contributes 26%, long-term (> 1 year duration) routine flaring comprises 11%, and operational flaring from best-in-class operations accounts for the remaining 7%.32 This means that most flaring is the result of issues at the well site or in midstream facilities, and these events and the subsequent flaring multiply when the overall gas infrastructure is running at or near maximum capacity. Variations in flaring have been driven by a number of factors including operator economic considerations, insufficient midstream infrastructure capacity, and varying regulations.
Appendix Case studies
29 In this case study, ‘Shell’ refers to SWEPI LP, an affiliate of the Shell group of companies operating in the Permian Basin. 30 Rystad Energy and EDF (2021). Permian Basin Flaring Outlook. Condensed Report. January 2021.
http://blogs.edf.org/energyexchange/files/2021/01/20210120-Permian-flaring-report.pdf 31 https://www.houstonchronicle.com/business/energy/article/Permian-natural-gas-flaring-lowest-in-a-decade-as-15873536.php 32 Rystad Energy and EDF (2021). Permian Basin Flaring Outlook. Condensed Report. January 2021.
http://blogs.edf.org/energyexchange/files/2021/01/20210120-Permian-flaring-report.pdf
111 — Flaring management guidance
There have been a variety of US federal agency regulatory initiatives, legal challenges and court decisions regarding national-level control of venting and flaring during the 2016–2020 period.33,34 The net result is that the primary regulations covering flaring of associated gas are those that exist at the state level. In Texas, the Texas Railroad Commission (RRC) has jurisdiction over venting and flaring with respect to the prevention of waste of natural resources, and is the authority for granting requests by operators to flare associated gas.35 The Texas Commission on Environmental Quality holds the authority to issue permits36 for air emissions produced by flaring, and to establish technology requirements37 and options for new flares and vapor combustion operations. The RRC’s Statewide Rule 3238 allows an operator to flare gas while drilling a well, and to flare for up to 10 days after a well’s completion to conduct well-potential testing. Rule 32 also allows an operator to request an exception to flare gas in certain circumstances. The majority of requests for exceptions received by the Commission are for flaring associated with casinghead gas from oil wells. Flaring of casinghead gas for extended periods of time may be necessary if the well is drilled in areas new to exploration where pipeline connections are not typically constructed until after a well is completed and a determination is made about the well’s productive capability. Other reasons for flaring include gas plant shutdowns, compressor repairs, or maintenance being carried out on gas lines, wells or other facilities. In existing production areas, flaring may also be necessary because existing pipelines have reached capacity.
RRC staff issue flare exceptions for 45 days at a time, for a maximum limit of 180 days. Extensions beyond 180 days must be granted through an RRC Final Order. In 2019, 6,972 venting and flaring exceptions were issued statewide by the RRC, compared to 651 in 2011, which was before the widespread use of horizontal drilling and hydraulic fracturing began in the Permian Basin. Shell requested fewer than 50 short-term exceptions (< 60 days duration) in the 2018–2020 period; these were due to extended flowback operations or to complete mechanical repairs on vapor recovery systems. State agencies in Texas have adopted regulatory requirements to drive gas utilization, and are working with oil producers to limit the need for flaring without shutting down or affecting crude oil production. In February 2021, the Texas Methane & Flaring Coalition (TMFC)39 issued a report detailing a statement supporting a goal to eliminate routine flaring by 2030. Shell is a member of the TMFC and is supportive of the goal to eliminate routine flaring by 2030. Shell is also committed to the ‘Zero Routine Flaring by 2030’ initiative. The Permian Basin has experienced steady growth in gas production since the onset of the unconventional/ tight oil era (see Figure A7 on page 112).
Appendix Case studies
33 US EPA. Actions and Notices about Oil and Natural Gas Air Pollution Standards. https://www.epa.gov/controlling-air-pollution-oil-and-natural-gas-industry/actions-and-notices-about-oil-and-natural-gas
34 US Department of the Interior, Bureau of Land Management. Methane and Waste Prevention Rule. https://www.blm.gov/programs/energy-and-minerals/oil-and-gas/operations-and-production/methane-and-waste-prevention-rule
35 https://www.rrc.texas.gov/about-us/faqs/oil-gas-faqs/flaring-regulation/ 36 https://www.tceq.texas.gov/permitting/air/guidance/newsourcereview/flares/nsrauth_flares.html 37 https://www.tceq.texas.gov/permitting/air/guidance/newsourcereview/flares/nsr_fac_flares.html 38 Texas Administrative Code, Title 16, Part 1, Chapter 3, Rule §3.32. https://www.law.cornell.edu/regulations/texas/16-Tex-Admin-Code-3-32 39 The Texas Methane & Flaring Coalition, which includes seven trade associations and more than 40 Texas operators, was formed to develop industry-
led solutions designed to mitigate and reduce methane emissions and flaring. www.texasmethaneflaringcoalition.org

112 — Flaring management guidance
Gas production has grown significantly during the past 8 years, with average production volumes rising from approximately 3.2 bcf/day in 2012 to more than 12.6 bcf/day through 2020. Much of the growth is attributable to associated gas. Consumption of natural gas in Texas is spread across several sectors, with delivery to other states representing about 30%, industrial uses and power generation each representing about 21%, international exports 18% (and growing), and residential, commercial and other uses covering the remaining 10%. Shell employs a comprehensive approach to environmental protection. It operates its shale oil and gas assets with the goal of eliminating routine venting or flaring of associated gas that takes place due to limited market capacity, and minimizing the volume of gas flared for safety, environmental or emergency situations.
Based on corporate standards, sites are advised to provide equipment and facilities to export, reinject or use the associated gas to eliminate continuous flaring. All potential options for gas utilization are considered, including the direct measurement of flare or vent gas flows, compressor optimization, gas-to-electricity conversion, gas to NGLs, and LNG production where appropriate. Operational best practices such as reduced facility start-ups to reduce flaring, leak detection, enhanced maintenance, and improvements in flare headers are also pursued. While some flaring may still occur for safety or emergency purposes, or due to lack of pipeline capacity, sites follow a flaring and venting management action plan when such activities are necessary. Shell is part of the World Bank’s GGFR and has endorsed the ‘Zero Routine Flaring by 2030’ initiative. This commitment to end the disposal of gas by flaring informs Shell’s approach to identify ways to use associated gas from oil production to achieve positive outcomes for local communities.
Appendix Case studies
Figure A7 Historical gross gas production in the Permian Basin40
�����
��� ���% ��# ����!
1
5
/
/123/121/116/115
E
6
/122 /12/ /12C /12E /124/120
21
3
4
0
C
2
22
2/
2C
2E
/125 /126
2/:4E6
C:0/6
4:406
C:EC2C:00/C:10C C:26E C:01E
E:/4/
0:E3CE:65C
6:131
22:5C/
/1/1
40 Source: Texas Railroad Commission Production Data Query System https://www.rrc.state.tx.us/resource-center/research/research-queries/

113 — Flaring management guidance
Project description
For operations in the Permian Basin, tank storage of produced oil prior to sale can be found at multi-well pads, gathering facilities or central processing facilities. Many oil and gas producers have adopted the use of oil storage tanks with sealed hatches to help prevent the venting of emissions. In a sealed tank, vapors accumulate between the liquid surface and the top of the vessel, causing tank pressures to increase. This pressure presents a potential safety risk when hatches are opened and can also cause fugitive emissions from thief hatches, seals or connectors. Since the tank vapor is rich in hydrocarbons, it is often profitable to implement recovery options and sell the gas to market. Doing so enables the tank pressures to be reduced and mitigates safety risks. However, if the oxygen content of the tank vapor gas exceeds pipeline specifications, the gas must be flared. Collecting the hydrocarbon-rich vapor from the tank headspace and sending it to a flare or vapor combustion unit destroys the potential value of the gas and results in GHG and other emissions to the air. A commonly used alternative method is to recover a portion of the flash vapor in a low-pressure vapor recovery tower combined with a VRU. This system partially de-gases the produced oil prior to entering the storage tanks, and can reduce
flaring but may not consistently produce gas that meets the pipeline specifications for oxygen (typically a maximum of 10 ppm). As part of its commitment to flare minimization, Shell sought a more reliable and effective solution to reduce flaring and improve vapor recovery performance. It selected the EcoVapor ZerO2 technology to operate along with VRUs. The intent was to help reduce flaring and GHG emissions by capturing and monetizing the tank and loading truck flash gas. When added to a typical oil gathering and tank storage site, the ZerO2 system (see Figure A8) enables a low vapor pressure to be maintained in the storage tank systems without the need for a continuous flare. Using a precious metal catalyst in a reactor vessel, oxygen is converted to approximately equal parts of CO2 and H2O, which remain in the gas stream. The resulting low-oxygen, high-Btu gas can be injected into the gas sales line. EcoVapor estimates that, for a typical 2,800-Btu gas stream, the ZerO2 system results in 0.169 tonnes of CO2e captured per thousand scf processed at a cost of USD 0.81 per tonne. This nominal cost is offset by the increased sale of hydrocarbons (primarily NGLs), which are diverted from the flare and injected into the sales line.
Appendix Case studies
� #�������
����#�# �� ����#��� �����#���
����������
���������� � �
,�#���� ��, �!���
�������8�� ���'�
%��������8�����/
���� �
��� �����-������������� �.
������!� � �
Figure A8 Typical application of the EcoVapor ZerO2 technology41
41 Source: adapted from CEMS presentation: https://coems.org/wp-content/uploads/2021/01/2021-February-CEMS-Presentation-Notes.pdf
114 — Flaring management guidance
Features of the ZerO2 units that Shell found attractive include: l a significant reduction in oxygen concentration (from
3.5–5.0% inlet to 0–5 ppm outlet);
l the elimination of a continuous flare operation;
l a good (one-year) catalyst life, with a catalyst that can be regenerated;
l a 4:1 turndown ratio;
l a low pressure drop across the reactor unit, and low power consumption;
l a small footprint and quick installation; and
l simple maintenance (no moving parts) and high availability (a runtime of more than 99.5%).
In its initial work with EcoVapor in 2019, Shell chose operations with wells in the Delaware Basin portion of the Permian Basin. Oil produced from hydraulically fractured wells had an API gravity in the range of 42–52, with a GOR of approximately 100. The methane concentration of the associated gas was 15–30 mol%, and pentanes plus higher-carbon hydrocarbons (C5+) were in the range of 7–13%. Production in the asset was growing — the gas volume captured during the project was 3 million scf/day on an annualized basis. EcoVapor ZerO2 units were installed at multiple facilities over a two-year period. The total project commitment was approximately USD 10 million. Based on the success of the initial test, which included a 40+% incremental reduction in the volume of gas flared, Shell deployed additional units. By the end of 2019, a total of 32 ZerO2 units were in service, comprising a combination of small-capacity (0.3 million scf/day) and large-capacity (1.2 million scf/day) units.
Outcomes
At the Permian unconventional oil asset, Shell has carried out operational upgrades that remove flares from well pad design, and has invested in new technologies to improve the reliability of vapor recovery systems. Due to the field-proven performance, high reliability, low maintenance, modularity and attractive economics associated with the EcoVapor ZerO2 technology, Shell has continued to expand deployment of these units, incorporating the technology as a component of the standard design for central processing facilities in the Permian Basin. The solution gave Shell a scalable, efficient and reliable method for processing increasing volumes of flash gas generated from the continued development of its Permian Basin asset. By adopting this technology, Shell’s operations eliminate the flaring (or incineration) of flash gas by capturing 100% of tank vapors, compared to typical efficiency levels of 60–80% for competing solutions. As a result, field facilities are more easily able to meet federal and state air emission requirements; this allows more wells per pad to be completed under existing permits, and yields a better environmental outcome. Other benefits have also been realized, including:
l increased gas sales volumes and enhanced sales of liquids (due to the incorporation of high-value tank vapor), which were previously lost by flaring; and
l the active management of tank battery pressure, which yields safety benefits.
Appendix Case studies

115 — Flaring management guidance
WINTERSHALL DEA: WELL TESTING GAS CAPTURE PROJECT
Summary
In Argentina, Wintershall Dea has successfully conducted production pilot projects in the Aguada Federal and Bandurria Norte blocks, which are part of the onshore Vaca Muerta shale play in the central Argentine province of Neuquén. The initial program began in mid-2015 with the drilling of eight wells. As part of the field development, the company implemented a project to connect the extended (i.e. long-term) well-test facility in Aguada Federal to a third-party gas treatment plant, requiring the construction of gas compression facilities and new pipeline capacity to completely eliminate routine gas flaring. Wintershall Dea has a long presence in Argentina, where it produces gas and oil from about 20 onshore and offshore fields.
Background
Figure A9 shows the production trend for natural gas in Argentina. By the end of 2020, Argentina’s production of natural gas was 0.131 bcm/day, or 4.63 bcf/day. Shale gas production accounted for 0.0325 bcm/day (1.14 bcf/day) of the total and is growing. However, Argentina has relied on LNG imports to help satisfy the demand for natural gas in the winter season.
The government of Argentina follows a federal structure with national-level ministries and independent provincial-level jurisdictions (provinces plus the autonomous city of Buenos Aires). Each jurisdiction has its own constitution and laws. For oil and natural gas, the federal regulatory authority is part of the Secretariat of Energy (Secretaría de Energía). Each province has authority to administer hydrocarbon resources within its boundaries. Law No. 17.319 (1967), Law No. 26,197 (2006) and Law No. 27.007 (2014) contain the basic framework applicable to oil and gas exploration and production in Argentina. Due to declining production and increasing imports, Law No. 27.007 aimed to incentivize long-term foreign oil and gas investment, especially in shale oil and gas areas, such as the large Vaca Muerta reservoir in the Neuquén Province. Oil pricing is market-based, but there are provisions for reduced royalties when the business forecast for a given project indicates that production would not occur with standard royalties. Through Decree 892/2020, Argentina formalized a new ‘Gas Plan 2020–2024’ to increase domestic natural gas production to 30 bcm by 2024. Other expected benefits include substantial fiscal savings, reducing or eliminating LNG and liquid fuel imports in winter, achieving an energy balance surplus and establishing a transparent, competitive system with market-based pricing.
Appendix Case studies
Figure A9 Production of natural gas in Argentina , 2006–202042
1$15
1$2/
1$24
1$2E
1$21
/1/1/121/116/115/113/114
����#��������
2/=�������,���, ���
1$16
1$22
1$2C
1$20
/122 /12/ /12C /12E /120 /124 /123 /125 /126
�����
��� ���� � ���#
����!
42 Source: IAE (Argentine Energy Institute) Secretariat

116 — Flaring management guidance
Prior to the new Gas Plan, the government of Argentina set out the gas venting limits and requirements in Energy Secretariat Resolutions No. 236/1996 and No. 143/1998. The national rules encourage the utilization of associated gas, setting specific conditions on the allowable use of flares. Some provinces have issued other specific flare and vent rules. In Neuquén province, regulations prohibit gas venting in exploration wells and during production operations at gas wells, as well as limit emissions to air at oil wells. Flaring and venting activities are addressed by Provincial Law No. 2.175. For new fields, flaring and venting during the well testing and appraisal period is limited to three months. After that, wells with routine gas flaring must be shut in, unless specific permits are issued. Short-term exceptions are permitted under certain circumstances, and released gas must be incinerated. Longer exceptions are allowed for lower-pressure wells where operators have prepared a feasibility study with a schedule for abatement investments and made a financial commitment for those projects. The government imposes taxes/fees for routine and non-routine gas flaring. The government of Argentina requires operators to report gas flaring volumes based on measured flows. It also publishes statistical data on oil and gas production, GHG emissions and flares. The flare data are derived mainly from thermal satellite imagery, and are used to provide information related to undeclared (i.e. not authorized) flare points. Argentina is predominantly a natural gas-based economy; it is the leading source of energy, representing more than 50% of the total supply, and provides the majority of fuel used by power generation facilities. Well-developed electricity and oil and gas transportation systems cover the country. A specialized regulatory body — ENARGAS — is responsible for the transportation and distribution of natural gas. Under the new Gas Plan, the regulatory structure has been modernized. At the same time, and supported by the success of the Vaca Muerta play, Argentina has seen natural gas surpluses during the summer, which are mostly exported by pipelines.
In view of Argentina’s existing gas transportation infrastructure and a growing demand for pipeline quality gas, monetization via compression and pipeline transport was the most logical alternative to flaring. Other options (NGLs, direct power generation, LNG, etc.) entailed higher costs, more challenging logistics or unattractive business cases.
Project description
As part of the field development at the Vaca Muerta shale play, Wintershall Dea implemented a project to connect an extended (i.e. long-term) well-test facility to a third-party gas treatment plant to completely eliminate routine gas flaring. The testing facility handles multiple hydraulically fractured oil wells (API gravity = 45) at an average GOR of 140. Approximately 2.5 million scf/day of associated natural gas (70% CH4 with less than 5% C5+) is produced at ~45 psig. Prior to implementing the flare reduction project, no infrastructure (i.e. gathering system, compressors, pipeline, etc.) was in place to route the associated gas to a distribution pipeline system. Wintershall Dea constructed a new gas compressor and export pipeline to facilitate gas take-away. The project took 18 months from inception to start-up, with approximately half of that time used for construction of facilities and pipelines. The total project investment was between USD 10–15 million. More than 90% of the captured gas is eventually sold into the regional gas market. The remainder is used within the field. The new facilities are expected to have a long operational life; ongoing costs for routine compressor maintenance and pipeline pigging are expected to be minor. The project is an example of the company’s public commitment to end routine flaring and to the ‘Zero Routine Flaring by 2030’ initiative. Backed by an internal policy, and a specific process to identify flare reduction and gas monetization and utilization projects, Wintershall Dea has implemented flare reduction projects in its other operating locations, including gas to power for both captive use and for export, production of pipeline quality gas, and NGL production.
Appendix Case studies

117 — Flaring management guidance
Worldwide, the company has also undertaken steps to enhance operating practices, including direct measurement of flare or vent gas flows, balancing production and reducing start-up time to reduce flaring, adding compression and improving compressor reliability, reduced pilot or ignitor gas consumption, and optimized vent systems and flare headers.
Outcomes
With operators increasingly targeting oil production at the Vaca Muerta play, the production of associated gas is growing, creating a risk that gas volumes may surpass regional pipeline and midstream capacity. The Wintershall Dea early well testing gas-capture project is an exceptional example of how private companies can implement practical solutions that provide commercial and environmental benefits.
Appendix Case studies

This page is intentionally blank

119 — Flaring management guidance
Annexes
Annex I: Associated gas cross-references 120 to the UN Sustainable Development Goals
Annex II: Flare flow measurement 123 techniques supplement
Annex III: ‘Zero Routine Flaring by 2030 ’ 125 initiative — example checklist for ‘OpCo’
Annex IV: Criteria, project screening and 127 bankability
Annex V: Associated gas CDM projects 130
Annex VI: Typical non-routine flare sources 133
Annex VII: Good practice considerations for 134 operational design and control
Annex VIII: Example calculations for absolute, 136 rate-based and intensity targets
Annex IX: UNDP-identified functional 139 capacities for government ministerial agencies
Annex X: EU Fuel Quality Directive 140

120 — Flaring management guidance
Annexes
Annex I Associated gas cross-references to the UN Sustainable Development Goals
7.1 By 2030, ensure universal access to affordable, reliable and modern energy services.
7.2 By 2030, increase substantially the share of renewable energy in the global energy mix.
7.3 By 2030, double the global rate of improvement in energy efficiency.
7.b By 2030, expand infrastructure and upgrade technology for supplying modern and sustainable energy services for all in developing countries, in particular least developed countries and Small Island Developing States, and land-locked developing countries, in accordance with their respective programs of support.
9.1 Develop quality, reliable, sustainable and resilient infrastructure, including regional and transborder infrastructure, to support economic development and human well-being, with a focus on affordable and equitable access for all.
9.2 Promote inclusive and sustainable industrialization and, by 2030, significantly raise industry’s share of employment and gross domestic product, in line with national circumstances, and double its share in least developed countries.
9.4 By 2030, upgrade infrastructure and retrofit industries to make them sustainable, with increased resource-use efficiency and greater adoption of clean and environmentally sound technologies and industrial processes, with all countries taking action in accordance with their respective capabilities.
9.b Support domestic technology development, research and innovation in developing countries, including by ensuring a conducive policy environment for, inter alia, industrial diversification and value addition to commodities.
l Improve access to energy services through shared infrastructure.
l Grow the share of natural gas in the energy mix.
l Increase the share of alternative energies and technologies in the global energy mix.
l Improve energy efficiency in operations and production activities.
l Upgrade infrastructure and technology to make them sustainable.
l Evaluate potential opportunities for shared use infrastructure.
l Enhance technological capabilities and knowledge transfer.
l Expand off-grid energy access.
SUSTAINABLE DEVELOPMENT GOAL
UN TARGETS THAT ARE RELEVANT TO IMPROVING THE UTILIZATION OF ASSOCIATED GAS
OIL AND GAS INDUSTRY ACTIONS THAT CAN LEAD TO THE REDUCTION OF ASSOCIATED GAS FLARING
continued …

121 — Flaring management guidance
Annex I Associated gas cross-references to the Sustainable Development Goals
12.2 By 2030, achieve the sustainable management and efficient use of natural resources.
12.6 Encourage companies, especially large and transnational companies, to adopt sustainable practices and to integrate sustainability information into their reporting cycle.
12.a Support developing countries to strengthen their scientific and technological capacity to move towards more sustainable patterns of consumption and production.
12.c Rationalize inefficient fossil fuel subsidies that encourage wasteful consumption by removing market distortions, in accordance with national circumstances, including by restructuring taxation and phasing out those harmful subsidies, where they exist, to reflect their environmental impacts, taking fully into account the specific needs and conditions of developing countries, and minimizing the possible adverse impacts on their development in a manner that protects the poor and the affected communities.
13.2 Integrate climate change measures into national policies, strategies and planning.
13.3 Improve education, awareness-raising and human and institutional capacity on climate change mitigation, adaptation, impact reduction and early warning.
13.a Implement the commitment undertaken by developed-country parties to the United Nations Framework Convention on Climate Change to a goal of mobilizing jointly USD 100 billion annually by 2020 from all sources to address the needs of developing countries in the context of meaningful mitigation actions and transparency on implementation, and fully operationalize the Green Climate Fund through its capitalization as soon as possible.
l Increase energy efficiency, particularly in less-accessible and more energy-intensive operations.
l Understand and address the full environmental and social footprint of oil and gas products.
l Incorporate sustainability objectives into operations and encourage the same into the activities of suppliers, distributors and customers.
l Work with stakeholders (including governments and NGOs) to achieve consensus-based pathways to improve patterns of oil and gas consumption, inform regulatory standards, and coordinate approaches to address issues related to fuel-sustainable mobility and future fuel consumption options and their impacts.
l Plan strategically for a net-zero emissions future.
l Self-assess carbon resiliency.
l Strengthen resilience and adaptive capacity with regard to climate change impacts.
l Mitigate emissions within oil and gas operations.
l Partner in research and development and education outreach.
l Support effective policy measures.
l Help consumers lower their emissions.
SUSTAINABLE DEVELOPMENT GOAL
UN TARGETS THAT ARE RELEVANT TO IMPROVING THE UTILIZATION OF ASSOCIATED GAS
OIL AND GAS INDUSTRY ACTIONS THAT CAN LEAD TO THE REDUCTION OF ASSOCIATED GAS FLARING
continued …

122 — Flaring management guidance
Annex I Associated gas cross-references to the Sustainable Development Goals
17.1 Strengthen domestic resource mobilization, including through international support to developing countries, to improve domestic capacity for tax and other revenue collection.
17.3 Mobilize additional financial resources for developing countries from multiple sources.
17.7 Promote the development, transfer, dissemination and diffusion of environmentally sound technologies to developing countries on favorable terms, including on concessional and preferential terms, as mutually agreed.
17.16 Enhance the global partnership for sustainable development, complemented by multi-stakeholder partnerships that mobilize and share knowledge, expertise, technology and financial resources, to support the achievement of the sustainable development goals in all countries, in particular developing countries.
17.17 Encourage and promote effective public, public-private and civil society partnerships, building on the experience and resourcing strategies of partnerships.
l Help build government capacity.
l Develop and disseminate sustainable energy technologies.
l Partner with other stakeholders to leverage core competencies and promote investment, job creation, skills development, infrastructure expansion and technological innovation.
l Participate in dialogues with stakeholders, governments and NGOs to identify shared goals.
l Incorporate SDGs into company policies and practices.
SUSTAINABLE DEVELOPMENT
GOAL
UN TARGETS THAT ARE RELEVANT TO IMPROVING THE UTILIZATION OF ASSOCIATED GAS
OIL AND GAS INDUSTRY ACTIONS THAT CAN LEAD TO THE REDUCTION OF ASSOCIATED GAS FLARING

123 — Flaring management guidance
Annexes
Annex II Flare flow measurement techniques supplement
Installation typea
Measurement principle
Accuracy range
Turndown ratiob
Straight line pipe requirementsc
Calibration frequency
Line pressure lossd
Composition dependente
Suitability for wet/dirty gas
Mainline power required
Obstructs flow to flare header
Per meter cost (USD)
Example vendors
In-line
Differential pressure
± 2–4%
3–10:1
Up: 6–20 D Down: 2–40 D
Dependent on service type
High
Yes
High
No
Yes
500–2,000
Emerson,
Spirax Sarco
In-line
Differential pressure
± 0.5%
10:1
Up: 0–3 D Down: 0–1 D
None after
initial
Moderate
Yes
High
No
Yes
--
McCrometer
Insertion
Differential pressure
± 1–3%
3–30:1
Up: 10–25 D
Down: 5–10 D
Annual
Low
Yes
Low/moderate
No
No
500–2,000
Emerson,
Dwyer Instruments
Insertion or clamp-on
Ultrasonic pulse
± 2–5%
2,750:1
Up: 10–30 D
Down: 5–10 D
Annual
Low
No
Moderate
Yes
No
20,000–90,000
GE,
Fluenta
Insertion or in-line
Thermal conductivity
± 1–3%
100–1,000:1
Up: 8–10 D Down: 3D
Annual
Low
Yes
None
Yes
No
2,000–5,000
FCI,
Sierra Instruments
In-line
Coriolis effect
± 0.2–0.4%
100:1
Up: none
Down: none
When out
of tolerance
Moderate
No
Low
Yes
Not suitable for flare
5,000–20,000
Micromotion,
Siemens
METER TYPE
ORIFICE PLATE
V-CONE
PITOT TUBES AND ANNUBARS
ULTRASONIC
THERMAL MASS ANEMOMETER
CORIOLIS
Notes: a ‘In-line flow meters’ refers to those that are installed in the line of fluid flow, and have the potential to impede flow and reduce stream pressure downstream of the meter.
‘Insertion flow meters’ refers to those that are inserted into existing ports and/or pipes that do not impede flow above marginal rates. ‘Clamp-on flow meters’ are portable metering devices that clamp onto the outside of a pipe.
b Turndown ratio is the ratio of maximum and minimum flows where accuracy is certified to be maintained. For example, a meter guaranteed to remain accurate to ±1.5 % from 400 scf/hour to 100 scf/hour would have a turndown range of 4:1.
c ‘D’ refers to the pipe diameter; ‘Up’ refers to pipe length upstream from the flow meter; and ‘Down’ refers to pipe length downstream from the flow meter. d Line pressure loss is the expected magnitude of pressure drop in the fluid downstream of the installed meter. e ‘Compositional dependence’ represents the impact that fluid composition will have on meter performance. For example, thermal mass anemometers require the thermal
conductivity of a fluid to accurately calculate flow rates. If the fluid composition changes, so will the thermal conductivity. Hence, accurate compositional data are necessary. Composition dependence in this context refers to the meter’s need for compositional data (e.g. gas density, thermal conductivity, etc.) in order to calculate mass flow rates.

124 — Flaring management guidance
Sources
l API (2011). Technical Report 2571, Fuel Gas Measurement. 1st Edition, published 1 March, 2011. American Petroleum Institute. https://www.apiwebstore.org/publications/item.cgi?9f23c798-46f3-4a1a-bdb9-1bd315ade889
l GGFR (2011). Workshop on measurement/reporting of flare gas, Doha, Qatar, 8–9 May 2011. Global Gas Flaring Reduction partnership.
l Clearstone Engineering Ltd. (2008). Guidelines on Flare and Vent Measurement. Report number 71380. 18 September 2008. http://documents1.worldbank.org/curated/en/689451468158369316/pdf/713800WP0Box370are0Vent0Measurement.pdf
l Shell Global Solutions (2004). Draft Flare Waste Gas Flow Rate and Composition Measurement Methodologies Evaluation Document. http://www.tceq.texas.gov/assets/public/implementation/air/rules/Flare/Resource_6.pdf
l Bay Area Air Quality Management District (2003). Proposed Regulation 12, Rule 11: ‘Flare Monitoring at Petroleum Refineries’. Draft Staff Report.
l Sierra Instruments, Inc. (2013). Flare Gas Mass Flow Metering: Innovations Promise More Economical Choices. White paper reviewing flare gas flow measurement challenges and recent innovations in thermal mass flow sensor technology. https://www.sierrainstruments.com/library/whitepapers/flare-gas-mass-flow-metering
l McCrometer (website). Proven flow measurement solutions for the oil and gas industry. https://www.mccrometer.com/oil&gas/default.asp
l ‘Coriolis flow meters’ (2021). An overview, common specifications and the pros and cons of coriolis flow meters on the ‘eFunda’ website. http://www.efunda.com/designstandards/ sensors/flowmeters/flowmeter_cor.cfm
Additional technical references
l CAPP (2002). Estimation of Flaring and Venting Volumes from Upstream Oil and Gas Facilities. Canadian Association of Petroleum Producers. http://www.oilandgasbmps.org/docs/GEN23-techniquestomeasureupstreamflaringandventing.pdf
l Federal Government of Nigeria (2018). Guidelines for Flare Gas Measurement, Data Management and Reporting Obligations . Nigerian Gas Flare Commercialisation Programme, ‘Guideline 2’. Department of Petroleum Resources. https://ngfcp.dpr.gov.ng/resources/guidelines/guideline-2-guidelines-for-flare-gas-measurement-data-management-and-reporting-obligations
Annex II Flare flow measurement techniques supplement

125 — Flaring management guidance
What activities at existing fields are outside the scope of the commitment?
In existing fields that OpCo operates, all gas flaring must be reported. OpCo is not obligated to install equipment to end flaring by 31 December 2030, if OpCo: (i) does not own the gas; (ii) does not have exclusive control of capital decisions; (iii) is a service company (de facto operator); or (iv) if the gas owner or joint venture/working interest partner does not choose to implement such projects. In existing fields where OpCo is an owner but not the operator, OpCo has no responsibility for reducing flaring under the commitment and, accordingly, there is no requirement for tracking the volume of gas flared.
What is a ‘new’ oilfield?
A ‘new’ oilfield is a development project in a field where there is no existing OpCo-operated oil production. The following are not considered ‘new’ oilfields: (i) Adding new wells or increasing production in existing fields. (ii) New hydraulic fracturing programs in existing fields. (iii) Adding new tank batteries or other facilities in existing fields. (iv) Acquisition of other ongoing production operations.
What does ‘according to plans that incorporate sustainable utilization or conservation of the field’s associated gas’ mean?
Such plans can include any beneficial use of the associated gas, such as sales, reinjection, use as an injectant for EOR, use as an on-site fuel source, etc. The sustainable utilization or conservation solution must be implemented within 90 days from first oil.
What does ‘economically viable’ mean?
OpCo will implement projects to end routine flaring at existing operations (those commissioned prior to 1 January 2022) only when the investment meets OpCo’s normal capital expenditure financial criteria. For operations where partners are not willing to invest in projects, OpCo is not required to fund the flare reduction project.
How long can ‘safety’ flaring continue before being considered as ‘routine’ flaring?
For all safety flaring scenarios, flaring can continue for as long as necessary to maintain safe operations, i.e. there is no point at which legitimate ‘safety’ flaring must be reclassified as routine flaring.
continued …
Annexes
Annex III ‘Zero Routine Flaring by 2030’ initiative — example checklist for ‘OpCo’

126 — Flaring management guidance
How long can ‘non-routine’ flaring continue before being considered as ‘routine’ flaring?
The acceptable duration of ‘non-routine’ flaring extends from the time an issue causing ‘non-routine’ flaring begins until a determination is made that the issue is completely resolved. A documented justification is necessary for any ‘non-routine’ flaring that extends beyond one year.
Are flaring activities that are authorized by a government agency (e.g. by permit or regulation) exempt from the initiative?
No. Regardless of how flaring is regulated, administered or controlled by government authorities, all flared gas volumes are covered by the initiative and must be reported according to the definitions described therein.
Does the initiative include portable flares?
Yes. The initiative covers all flares, whether permanent, temporary or portable.
Does the commitment require measurement of flared gas volumes, or are estimates sufficient?
Measurements are preferred, but engineering estimates (e.g. mass balance calculations) are acceptable.
Does the initiative require reporting of gas flared by OpCo (as the operator) that OpCo does not own?
Yes. In existing fields where OpCo operates but does not own the gas, or fields where OpCo is a service company (de facto operator), all flared gas must be reported.
Can routine flaring continue beyond 31 December 2030?
Yes. For circumstances where there is no flare elimination project that can meet OpCo’s normal economic justification criteria (such as the capture of low-pressure, low-volume gas streams), flaring can continue.
What reporting obligations will exist after 31 December 2030?
Flaring beyond 31 December 2030 must be reported and classified as routine, safety or non-routine flaring.
What are the potential consequences if OpCo does not fulfill its commitment?
The commitment has high visibility among certain stakeholders, including investors. Failure to demonstrate progress against the commitment may create a significant reputational or credibility issue.
Is OpCo’s commitment to eliminate routine flaring by 31 December 2030 consistent with the World Bank’s ‘Zero Routine Flaring by 2030’ initiative?
The program goal, approach and definitions are consistent with the initiative.
Annex III ‘Zero Routine Flaring by 2030’ initiative — example checklist for ‘OpCo’
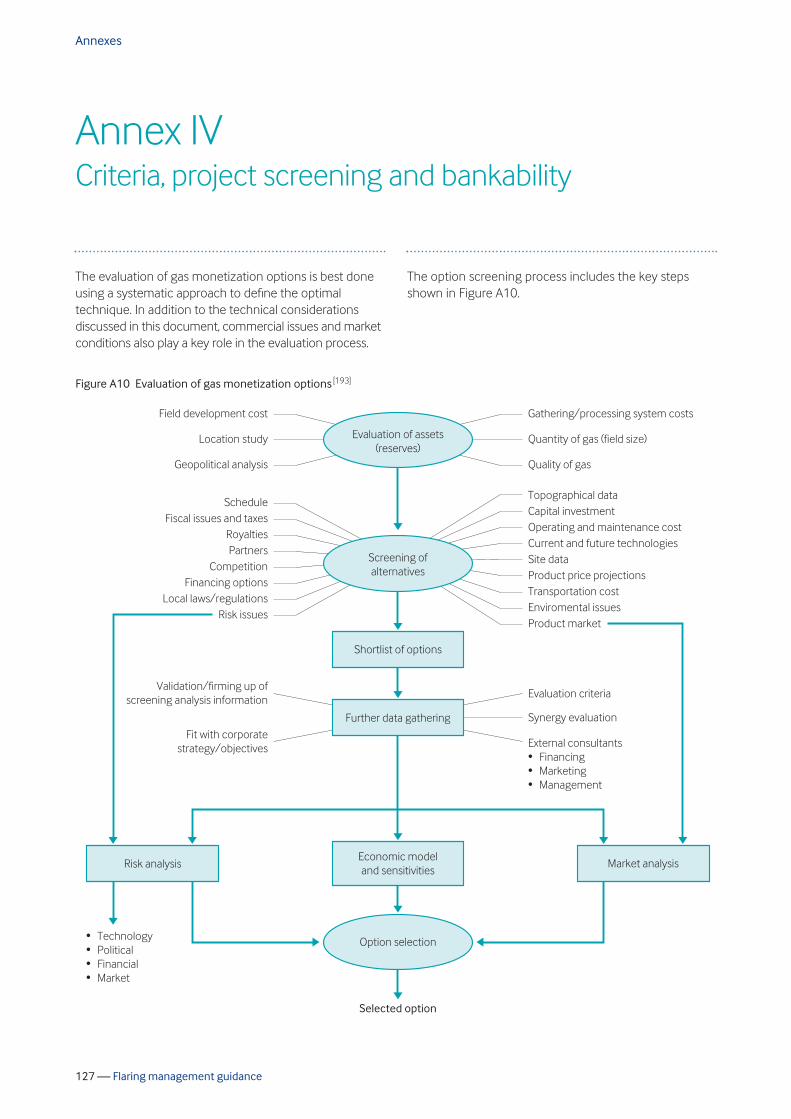
127 — Flaring management guidance
The evaluation of gas monetization options is best done using a systematic approach to define the optimal technique. In addition to the technical considerations discussed in this document, commercial issues and market conditions also play a key role in the evaluation process.
The option screening process includes the key steps shown in Figure A10.
Annexes
Annex IV Criteria, project screening and bankability
Figure A10 Evaluation of gas monetization options [193]
<� ���� , ��#� ������
������������!
) �#������������!���
��� ��� <���������� �������� �
��!���� �;��� ��
���# �����<�������#����
��������8�7� �����������'����� �
���������7%�������#��%��� ������!�����%�������
<���8�������#���� ����� �!7� 9 ���, �
> & ������!> ;��������> <������> ���' �
"�� �������������> <�����> ���' ���> ���� � �
",������������ ���
�! ��!� ,�������
&�#����#������������#������, ��� ��# ������������� �� ��������� �����%���� �� ������� ���� �����;�������#��� �#��9 �����&���#������������",���� �������� �;����������' �
)��� ���7#��� ������!�� �������
*�����!��%�����-%� ������ .
*�����!��%����
",���������%���� ��-� � �, �.
��� ����%��� ����, �
�����������%��#����
<���� ����������� ���
"���������� ����� ����,��� �
�#����� � ����
#� �����������
���'����!��� ���' �����!���

128 — Flaring management guidance
Once options are identified, a screening process is undertaken to reduce the number of options to a shortlist for more in-depth analysis. The screening process to shortlist, or grade, the alternative options should identify the most important criteria to be considered when selecting the optimal solution. Typical decision criteria for screening alternatives may include, but not be limited to:
l technical feasibility and project complexity;
l capital and operating cost estimates for the specified technology solution;
l alternative uses of investment capital and the producer’s cost of capital;
l market demand and logistics for the gas or other products;
l natural gas pricing (or other product prices) and price risk;
l lease/concession terms;
l regulatory constraints and other factors governing access to gas utilization and export facilities;
l proximity and capacities of regional and national pipelines;
l additional operating costs associated with natural gas production and gas processing for each of the utilization options;
l cost of land acquisition and the cost and timing to obtain right-of-way approvals;
l environmental and community impact analysis;
l likelihood of legal challenges and concerns raised by stakeholder groups; and
l regulations that define allowable flaring and the likelihood of future changes.
After the shortlisted options are determined, further economic, market and risk analysis will be required. Ultimately, after a thorough evaluation of the alternatives, the goal is to select a project that makes use of all (or most) of the associated gas production. For large projects, where the required investment cannot be funded solely by the producer or the resource owner, the proponents will need external financing (typically a loan) to initiate construction. Generally, lenders have taken the view that, compared to other sectors, loans to oil and gas projects carry greater exposure to higher and more complex risks. In addition, given the high debt levels associated with project finance, lenders normally
adopt a more conservative stance towards industry risks compared to project sponsors.[194] Sources of external finance (for large projects in developing countries, this may be a multilateral development bank) will perform a due diligence review of the project to determine whether or not it meets the institution’s project finance criteria. For a commercial bank, loan underwriting focuses on financial metrics which demonstrate that the project proponents will repay the loan principal with interest in accordance with the terms of the proposed lending agreement. For MDB project finance, the due diligence process looks at other factors. Factors that are of particular importance are listed below: [195,196,197,198]
l The project location should be suitable for the activities to be carried out. There should be assurances that the sponsors of the project have unrestricted ownership and/or access to the land. The land procurement process must be performed with integrity, following documented procedures, preferably with a high degree of transparency. This includes management of any relocation issues that can affect local communities.
l The project should be of strategic importance to the relevant host government and there should be the political will to support the project through the whole project life cycle. It is critical that the government is invested in, and committed to, the project and has the institutional capacity to satisfy its obligations under its guarantees. Political risks should be mitigated by appropriate investment treaties, and by changes in legal provisions and/or investment guarantees that protect investments against non-commercial risks.
l There should be strict adherence to the regulatory and policy regimes for equity funding, finance structures and operational practices, financial controls and risk management. Since uncertain legal frameworks, weak internal controls, and delayed tender processes and/or bid rounds can directly affect project bankability and dampen the interest of other investors and stakeholders, monitoring and management protocols should be established. Regulations for the issuance of equity (if any) and mandatory local content requirements must be followed.
Annex IV Criteria, project screening and bankability

129 — Flaring management guidance
l There should be a clear allocation of risk among the parties. This can be an especially intricate arrangement as the size, technical complexity and number of project participants grows. Interdependent financing, senior and subordinated loans to sponsors, joint ventures or other parties, and the use of special-purpose vehicles/entities complicate the management of risk. It is essential that the risks associated with each part of the value chain are fully understood and allocated appropriately between the various stakeholders, including: the host government; project developers; suppliers and contractors; other consortia; and project lenders. Project finance lenders will likely require detailed assurances from project sponsors that all technical and operational interface issues between the various project components have been addressed, such as construction completion, testing, commissioning and acceptance.
l A robust stakeholder engagement process should have been undertaken, ensuring that the most appropriate stakeholders have been selected, especially those representing local communities. Mechanisms should have been established to ensure follow-through on delivery of the project’s economic and social benefits (such as training programs, technology transfer and payment of dividends or royalties) to ensure that those communities who are affected by the project receive a sustainable economic benefit from the project. These efforts mitigate potential security and political risks.
Annex IV Criteria, project screening and bankability

130 — Flaring management guidance
Annexes
Annex V Associated gas CDM projects[199]
143,428
52,628
775,250
57,438
65,811
PROJECT
GHG REDUCTIONS (t CO2e/year)
6008: Recovery and utilization of associated gas at Pondok Tengah LPG plant — PT. Yudistira Energy (Indonesia)
https://cdm.unfccc.int/Projects/DB/LRQA%20Ltd1333528065.88/view
Project activities include the establishment and operation of a new LPG plant to recover and utilize the associated gas previously flared at Tambun and Pondok Tengah Gas Collection stations, and the installation of a new pipeline to connect the Pondok Tengah-Pertamina EP Station with Yudistira’s LPG Plant. The recovered gas is processed into LPG, condensate and lean gas.
6808: Recovery and utilization of associated gas at the Tugu Barat plant (Indonesia)
https://cdm.unfccc.int/Projects/DB/BVQI1343111376.1/view
The project involves the construction of facilities for the recovery and processing of associated gas previously flared at the Tugu Barat oilfields. The project also involves the transportation and processing of sour gas into sweet gas, and further processing into lean gas, LPG and condensate. Investments include a gas delivery pipeline, two gas compressors and an MDEA (methyldiethanolamine) gas treatment plant for the removal of CO2.
6817: Associated gas recovery and utilization at Block 9 in the Safa oilfield (Sultanate of Oman)
https://cdm.unfccc.int/Projects/DB/BVQI1343120764.64/view
The project involves the recovery and utilization of natural gas found in association with oil at Block 9 in the Safah oilfield. The gas recovery process comprises three main stages, including the separation, compression and processing to meet pipeline conditions for transportation to end users. The main equipment necessary for the proposed project activity comprises electric motor-driven reciprocating and screw compressors, and the pipelines for gas transportation.
8276: Oil Search Limited flare and vent gas conservation project (Papua New Guinea)
https://cdm.unfccc.int/Projects/DB/DNV-CUK1353303667.77/view
The project involves recovery of associated gas from Oil Search Limited’s operations in the Southern Highlands and Gulf Provinces, through the installation of a compression and blower system to collect gas from each low-pressure flare at the crude oil storage tanks and from the produced water system at the central processing facility (CPF), to deliver the gas to an existing booster compressor. A flow line will be installed from the refinery high pressure separator to deliver associated gas to an existing CPF booster compressor. The existing fuel gas blanketing system will be replaced with an inert gas system. Recovered associated gas will be compressed and transported to a sales gas pipeline.
8286: Gas flaring reduction at the Neelam and Heera asset (offshore Mumbai, India)
https://cdm.unfccc.int/Projects/DB/SGS-UKL1353319809.68/view
The Neelam and Heera process complexes comprise developed infrastructure including well head platforms, process platforms and interconnected pipelines. The project activity includes the installation of oil-flooded gas compressor packages at the processing complexes to increase the pressure of low-pressure gas for conversion into marketable products, e.g. LPG, C2, C3 and NGLs.

131 — Flaring management guidance
Annex V Associated gas CDM projects
301,731
57,904
2,603,226
41,463
288,147
PROJECT
GHG REDUCTIONS (t CO2e/year)
8598: Nanba associated gas processing plant and the auxiliary engineering (China)
https://cdm.unfccc.int/Projects/DB/BVQI1354796911.2/view
Activities include the recovery and utilization of associated gas from oil wells in the Second Oil Production Plant of the Sanan Oilfield, to be processed into dry gas and condensate. The project will involve construction of the associated gas recovery system, and processing and transportation infrastructure including gas collection facilities, a booster station, processing plant and pipelines.
8788: Tarim oil wells associated gas recovery and utilization project (CNG) (China)
https://cdm.unfccc.int/Projects/DB/ERM-CVS1355492331.84/view
Two skid-mounted associated gas recovery stations (movable) will be installed to recover the associated gas from remote and scattered oil wells. After low pressure separation, compression, dehydration and condensate separation, the dry gas will be compressed into CNG, transported to a decompressing plant and transported by pipeline to end users. Condensate will be transported to a processing plant.
8896: Jubilee oilfield associated gas recovery and utilization project (Republic of Ghana)
https://cdm.unfccc.int/Projects/DB/DNV-CUK1355897092.73/view
The project involves recovery of the associated gas that would otherwise have to be flared at the floating production, storage and offloading (FPSO) vessel in the Jubilee oilfield located within the Deepwater Tano and West Cape Three Points blocks in the Republic of Ghana, and to deliver it to shore where the wet gas will be processed. The project activity comprises gas recovery and pretreatment, all transportation pipelines, all compression facilities and a gas processing plant that will separate out the dry gas, LPG and condensate.
9023: Sukowati-Mudi (Tuban) LPG associated gas recovery and utilization project (Indonesia)
https://cdm.unfccc.int/Projects/DB/JCI1356078464.98/view
The project involves construction of a new facility to recover and utilize the flared associated gas located at the Mudi-Sukowati oilfields, East Java, Indonesia, to produce saleable lean gas, condensate and LPG. The project requires construction of a compressor, condensate recovery plant, amine plant, regenerative thermal oxidizers and gas processing plant.
9163: Recovery and utilization of associated gas from the Obodugwa and neighboring oilfields in Nigeria
https://cdm.unfccc.int/Projects/DB/RINA1356376663.73/view
Project activities include the provision of infrastructure to allow for the utilization of the associated gas that is currently flared from two oilfields in OML56 in Delta State, Nigeria. The infrastructure for the project activity consists of the compression and transport of the gas from the Obodugwa site to the domestic gas network.
continued …

132 — Flaring management guidance
Annex V Associated gas CDM projects
26,163
109,142
15,172
432,416
675,858
PROJECT
GHG REDUCTIONS (t CO2e/year)
9193: Sao Thian-A oilfield flare gas recovery and utilization project, Sukhothai, Thailand
https://cdm.unfccc.int/Projects/DB/BVQI1356466744.97/view
The project aims to recover and utilize the associated gas, by use of a separator at the STN-A permanent facility, and then use the recovered gas for internal demand and sale to another utility. The proposed project will include a fuel gas skid system and sale gas metering system.
9400: Flare gas reduction through the use of a spiking compressor at the Shah oilfield (Abu Dhabi)
https://cdm.unfccc.int/Projects/DB/TUEV-RHEIN1356771209.26/view
The project involves recovery and utilization of associated gas that is currently flared in the ADCO Shah oilfield. The recovered associated gases will be compressed in a spiking compressor. After dehydration, the gas will be sent to processing facilities where it will be converted into dry gas, NGL and condensate.
10108: Gas flaring reduction project at GGS, Chariali, Sibasagar, ONGC, Assam (India)
https://cdm.unfccc.int/Projects/DB/KBS_Cert1422689659.16/view
Oil and Natural Gas Corporation (ONGC) Limited of India will install gas compressors to recover associated gas for distribution and sale to customers or for on-site consumption in gas-based generator sets.
10584: Associated gas recovery and utilization at Khamilah oilfield area, at Block-27 in Wilayat lbri of the Sultanate of Oman
https://cdm.unfccc.int/Projects/DB/CTI1596441167.27/view
Project activities include the recovery and utilization of natural gas from the Khamilah oilfield area at Block-27 in Wilayat lbri. The gas recovery process comprises three main stages, including the separation, compression and processing to meet pipeline conditions for transportation to end users. The main equipment necessary for the proposed project activity comprises electric motor-driven reciprocating and screw compressors, and the pipelines for gas transportation.
0152 : Rang Dong oilfield associated gas recovery and utilization project (Vietnam)
https://cdm.unfccc.int/Projects/DB/DNV-CUK1133472308.56
Activities will include the recovery and utilization of gases produced as a by-product of oil production activities at the Rang Dong oilfield, located off the south-eastern coast of Vietnam. The project includes construction of a gas pipeline and compressor facilities. Recovered gas is processed into dry gas and condensate. Dry gas is supplied to nearby power plants and a local fertilizer plant, LPG is utilized as home cooking fuel, and condensate is used to produce gasoline.

133 — Flaring management guidance
Annexes
Annex VI Typical non-routine flare sources[200]
Pressure relief valve
Pressure relief valve
Level control valve, blowdown valve
Pressure relief valve
Blowdown valve
Blowdown valve
Emergency shutdown valve
Pressure relief valve
Pressure relief valve
Level control valve, blowdown valve
Pressure relief valve
Pressure relief valve
Pressure relief valve
Vent
Pressure relief valve
Blowdown valve
Blowdown valve
Emergency shutdown valve
Pressure relief valve
Pressure relief valve
Level control valve, blowdown valve
Pressure relief valve
Pressure relief valve
Pressure relief valve
Vent
Pressure relief valve
Blowdown valve
Blowdown valve
Pressure relief valve
Flow control valve
Pressure relief valve
Inlet separator
Treater
Process vessel liquid drains
Vapor recovery compressor
Equipment isolation: maintenance
Gas pipeline pigging
Inlet piping
Inlet separator
Process vessels containing vapor
Process vessel liquid drains
Compressor suction scrubber
Fuel gas scrubber
Compressor discharge
Compressor valve seals
Fired line heaters
Equipment isolation: maintenance
Gas pipeline pigging
Inlet piping
Inlet separator
Process vessels containing vapor
Process vessel liquid drains
Compressor suction scrubber
Fuel gas scrubber
Compressor discharge
Compressor valve seals
Fired line heaters
Equipment isolation: maintenance
Gas pipeline pigging
LPG storage vessels
Gas sweetening: off-spec product
Amine flash tank or vessel
FACILITY TYPE
PROCESS/EQUIPMENT
NON-ROUTINE FLARE SOURCES
Oil battery
Gas battery
Gas plant

134 — Flaring management guidance
Annexes
Annex VII Good practice considerations for operational design and control[200]
Add piping to divert blowdown gas from maintenance activities to fuel, low pressure source or gas recycle/recovery.
Add piping to divert non-emergency flare gas to low-pressure source such as compressor suction or gas recycle/recovery.
Add piping (compression as necessary) to allow recycling of off-specification sales gas.
Use hot tap procedure for making new piping connections versus depressurizing and flaring.
Any valves on a high pressure source that discharges to a low pressure source should be double blocked and bled.
Install a rupture disk (and pressure sensor) upstream of pressure relief valves (PRVs) that have chronic seat leakage to flare, or install spare PRVs and isolation valves to permit frequent servicing without shutdown.
Where the failure of a check valve could create pressures that exceed equipment design pressures, a secondary device should be installed to prevent flow reversal.
Any manually operated valve that can discharge from a high-pressure source to a lower-pressure source should be tagged and car-sealed closed.
Avoid overloading the flare knock-out drum with condensable hydrocarbons; instead, send to stream to a liquid recycle/recovery system.
Install flame resistant insulation and metal cladding (to 8 m above grade) on hydrocarbon vessels that could be exposed to flame impingement. Install a depressurizing system to isolate and transfer hydrocarbon liquid and vapor from vessels exposed to external fire.
Provide spare or redundant equipment in critical services in order to enable continuous operation (and avoid flaring) when equipment failure occurs.
Provide spare air compressor and sufficient air receiver/reservoir capacity in order to cycle all isolation valves at least three times.
For fractionation towers in series, size condensers large enough to handle the vapor load from upstream towers should loss of heat input from a preceding tower occur.
Size the compressor and system according to individual stream compositions and process parameters.
Design the shell and tube side of exchangers to the highest-pressure design specification, and provide pressure alarms and automatic isolation valves.
Consider replacing glycol dehydrators with desiccant dehydrators.
SYSTEM GOOD DESIGN PRACTICE
Piping
Valves
Flare system
Fire protection
Redundancy
Instrument air
Condensers
Vapor recovery
Heat exchangers
Gas dehydration
continued …

135 — Flaring management guidance
Annex VII Good practice considerations for operational design and control
Replace wet seals on compressors with dry seals.
Keep compressors pressurized when taken off-line for operational reasons or put on temporary standby.
Provide dedicated block valves for process or equipment isolation instead of relying on fail-closed control valves.
For emergency shutdown valves, the fail-safe condition must ensure that overpressure risk is addressed in the event of electrical power or instrument air failure.
Provide control logic and valves to allow for a controlled facility (or individual process) shutdown.
Where possible, use a strategy of relieve-and-hold versus total release-to-flare for controlled shutdowns.
For scenarios where there is localized equipment or control failure, the facility control logic should adjust process control parameters to the safe standby mode to prevent overpressure in related processes.
Provide high-temperature alarm and heat input shutdown where vapor overpressure is possible.
For engines and rotating equipment, install instrumentation to avoid run-to-failure scenarios.
Provide process alarms and automatic isolation in situations where operating temperatures or pressures outside intended process limits could cause runaway reactions and/or equipment overpressure/failure.
Install automated flow control at gas batteries to prevent/reduce flaring during upsets.
To prevent overpressure on a blocked-in pipe, valve or pump, install an automatic bypass to another process unit.
Install a high-pressure alarm on the flare knock-out drum liquid drain to detect gas flow/blow-by.
For facilities subject to power failures, provide auxiliary or self-generated emergency power for the process control computer, critical plant controls and safety-critical equipment.
SYSTEM GOOD DESIGN PRACTICE
Compressors
Shutdown controls

136 — Flaring management guidance
Annexes
Annex VIII Example calculations for absolute, rate-based and intensity targets
PARAMETER UNITS EXPRESSION DESCRIPTION
ABSOLUTE TARGET
Forecasted volume of associated gas produced
Design reliability of flare gas recovery system
Expected flaring volume due to design basis
Flaring days due to planned production system outages (i.e. shutdowns and maintenance) that contribute to flaring
Flaring days due to unplanned production system outages (i.e. process upsets and unplanned shutdowns and maintenance) that contribute to flaring
Flaring volume due to operational outages
Flaring target (absolute)
m3
%
m3
days
days
m3
m3
FGVA
DR
DBFVA = FGVA * (1 - DR/100)
POF
UPOF
OOFVA = FGVA * (POF + UPOF)/365
FTA = DBFVA + OOFVA
This value will change each year to reflect estimated production rates for the wells or facilities related to the flare point.
This value is fixed, but should be updated if equipment in the flare gas recovery system is replaced.
This is a calculated value.
This value will change each year to reflect planned outages for the wells or facilities related to the flare point.
This value will change each year to reflect the target for unplanned outages for the wells or facilities related to the flare point.
This is a calculated value.
This is a calculated value.
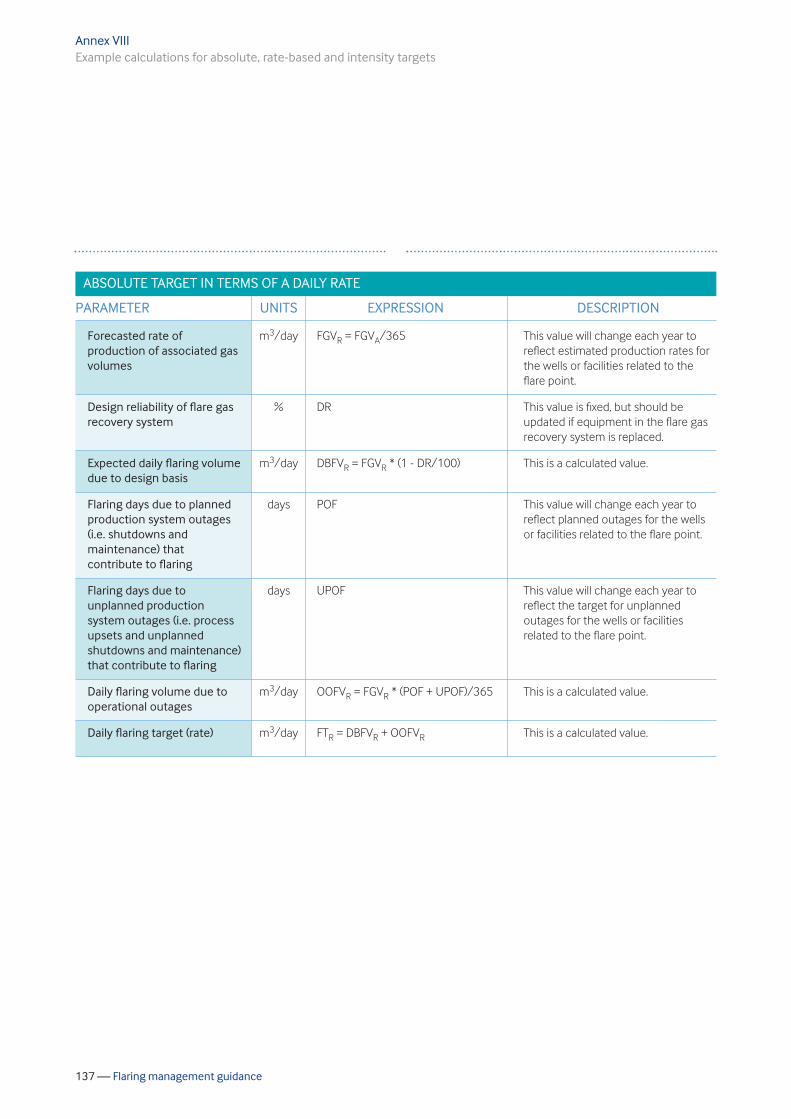
137 — Flaring management guidance
Annex VIII Example calculations for absolute, rate-based and intensity targets
PARAMETER UNITS EXPRESSION DESCRIPTION
ABSOLUTE TARGET IN TERMS OF A DAILY RATE
Forecasted rate of production of associated gas volumes
Design reliability of flare gas recovery system
Expected daily flaring volume due to design basis
Flaring days due to planned production system outages (i.e. shutdowns and maintenance) that contribute to flaring
Flaring days due to unplanned production system outages (i.e. process upsets and unplanned shutdowns and maintenance) that contribute to flaring
Daily flaring volume due to operational outages
Daily flaring target (rate)
m3/day
%
m3/day
days
days
m3/day
m3/day
FGVR = FGVA/365
DR
DBFVR = FGVR * (1 - DR/100)
POF
UPOF
OOFVR = FGVR * (POF + UPOF)/365
FTR = DBFVR + OOFVR
This value will change each year to reflect estimated production rates for the wells or facilities related to the flare point.
This value is fixed, but should be updated if equipment in the flare gas recovery system is replaced.
This is a calculated value.
This value will change each year to reflect planned outages for the wells or facilities related to the flare point.
This value will change each year to reflect the target for unplanned outages for the wells or facilities related to the flare point.
This is a calculated value.
This is a calculated value.

138 — Flaring management guidance
Annex VIII Example calculations for absolute, rate-based and intensity targets
PARAMETER UNITS EXPRESSION DESCRIPTION
INTENSITY TARGET
Design reliability of flare gas recovery system
Percentage of associated gas volume flared due to design basis
Flaring days due to planned production system outages (i.e. shutdowns and maintenance) that contribute to flaring
Flaring days due to unplanned production system outages (i.e. process upsets and unplanned shutdowns and maintenance) that contribute to flaring
Percentage of associated gas volume flared due to operational outages
Flaring target (intensity)
%
%
days
days
%
%
DR
DBFP = 100 - DR
POF
UPOF
OOPV = 100 * (POF + UPOF)/365
FTI = DBFP + OOPV
This value is fixed, but should be updated if equipment in the flare gas recovery system is replaced.
This is a calculated value.
This value will change each year to reflect planned outages for the wells or facilities related to the flare point.
This value will change each year to reflect the target for unplanned outages for the wells or facilities related to the flare point.
This is a calculated value.
This is a calculated value.

139 — Flaring management guidance
CAPACITY TO ENGAGE STAKEHOLDERS
l Identify, motivate and mobilize stakeholders.
l Create partnerships and networks.
l Promote engagement of civil society and the private sector.
l Manage large group processes and open dialogue.
l Mediate divergent interests.
l Establish collaborative mechanisms.
CAPACITY TO ASSESS A SITUATION, AND DEFINE A VISION AND MANDATE
l Access, gather and disaggregate data and information.
l Analyze and synthesize data and information.
l Articulate capacity assets and needs.
l Translate information into a vision and/or a mandate.
CAPACITY TO FORMULATE POLICIES AND STRATEGIES
l Explore different perspectives.
l Set objectives.
l Elaborate sectoral and cross-sectoral policies.
l Manage priority-setting mechanisms.
CAPACITY TO BUDGET, MANAGE AND IMPLEMENT
l Formulate, plan, manage and implement projects and programs; includes the capacity to prepare a budget and to estimate capacity development costs.
l Manage human and financial resources and procurement.
l Set indicators for monitoring and monitor progress.
CAPACITY TO EVALUATE
l Measure results and collect feedback to adjust policies.
l Codify lessons and promote learning.
l Ensure accountability to all relevant stakeholders.
Annexes
Annex IX UNDP-identified functional capacities for government ministerial agencies[201]
140 — Flaring management guidance
The fuels used for road transport throughout the EU need to meet strict quality requirements that help in protecting human health and the environment, and make sure that vehicles can operate safely when traveling from one country to another. Having common fuel quality rules helps to reduce GHG and air pollutant emissions, and to establish a single fuel market while ensuring that vehicles can operate anywhere in the EU on the basis of compatible fuels. The EU Fuel Quality Directive (FQD) requires a reduction in the GHG intensity of transport fuels by a minimum of 6% by 2020 (compared to a 2010 baseline). In addition, the Directive states that suppliers should respect the 6% target beyond 2020, and that the monitoring and reporting obligations relating to GHG emissions intensity also remain applicable after this date. [202] The GHG intensity of fuels is calculated on a life-cycle basis, covering emissions from extraction, processing and distribution. These emission reductions are calculated against a 2010 baseline of 94.1 g CO2e/megajoule (MJ). The 6% reduction target is likely to be achieved primarily through the use of biofuels, electricity, less carbon-intense fossil fuels and renewable fuels of non-biological origin. [202] To incentivize further reductions in GHG emissions, the savings claimed from upstream emission reductions (UERs), including from flaring and venting, are included in the calculation of suppliers’ life-cycle GHG emissions [203] which were adopted on 20 April 2015 under the FQD Implementing Directive (Directive EU 2015/652).
The Directive states that, in order for the UERs of fossil fuels to be eligible for the purposes of the reporting and calculation methodology, suppliers shall report the following information to the authority designated by the Member States:[203]
a) The starting date of the project, which must be after 1 January 2011.
b) The annual emission reductions in grams CO2e.
c) The duration for which the claimed reductions occurred.
d) The project location closest to the source of the emissions in latitude and longitude coordinates in degrees to the fourth decimal place.
e) The baseline annual emissions prior to installation of reduction measures and annual emissions after the reduction measures have been implemented in grams CO2e/MJ of feedstock produced.
f) The non-reusable certificate number uniquely identifying the scheme and the claimed GHG reductions.
g) The non-reusable number uniquely identifying the calculation method and the associated scheme.
h) Where the project relates to oil extraction, the average annual historical and reporting year GOR in solution, the reservoir pressure and depth, and the well production rate of the crude oil.
Annexes
Annex X EU Fuel Quality Directive

141 — Flaring management guidance
On 9 September 2015, Directive EU 2015/1513,[204] often referred to as the ‘ILUC Directive,’ was adopted. Some of the key elements of this Directive include:[205]
l tackling indirect land-use change emissions through a 7% cap on conventional biofuels, including biofuels produced from energy crops, to count towards the Renewable Energy Directive (RED) targets regarding final consumption of energy in transport in 2020. Member States have the possibility to set a lower cap;
l setting an indicative 0.5% target for advanced biofuels as a reference for national targets which will be set by EU countries in 2017;
l harmonizing the list of feedstocks for biofuels across the EU that would count double towards the 2020 target of 10% for renewable energy in transport (RED Annex IX);
l requiring that biofuels produced in new installations emit at least 60% fewer GHGs than fossil fuels;
l introducing stronger incentives for the use of renewable electricity in transport (by counting it more towards the 2020 target of 10% for renewable energy use in transport: 5x for renewable electricity in road transport and 2.5x for renewable electricity in rail);
l a number of additional reporting obligations for the fuel providers, EU countries and the European Commission; and
l a requirement for Member States to enact the legislation by 2017.
Annex X EU Fuel Quality Directive

This page is intentionally blank

143 — Flaring management guidance
Abbreviations and acronyms

144 — Flaring management guidelines
ADB Asian Development Bank
AER Alberta Energy Regulator
ALARP As low as reasonably practical
ALNAFT National Agency for the Valorization of Hydrocarbon Reserves (Algeria)
ANP National Agency of Petroleum, Natural Gas and Biofuels (Brazil)
API American Petroleum Institute
BCF Billion cubic feet
BCM Billion cubic meters
BOG Boil-off gas
Btu British thermal unit
Capex Capital expenditure
CASA Clean Air Strategic Alliance (Alberta)
CEMS Continuous emission monitoring systems
CH4 Methane
CIFs Climate Investment Funds
CNG Compressed natural gas
CO2 Carbon dioxide
CO2e CO2 equivalent
CTF Clean Technology Fund
DAC Development Assistance Committee (of the OECD)
E&P Exploration and production
EBRD European Bank for Reconstruction and Development
EIA Environmental impact assessment
EMDEs Emerging Markets and Developing Economies
ENGO Environmental non-governmental organization
EOR Enhanced oil recovery
EPC Engineering, procurement and construction
ERM The ERM Group, Inc. and its affiliates
EU European Union
EU ETS EU emissions trading system
EUB Energy and Utilities Board (Alberta, Canada)
Abbreviations and acronyms

145 — Flaring management guidelines
FLNG Floating liquefied natural gas
FPSO Floating production, storage and offloading (vessel)
FQD Fuel Quality Directive
GCF Green Climate Fund
GDP Gross domestic product
GEF Global Environment Facility
GGFR Global Gas Flaring Reduction (partnership)
GHG Greenhouse gas
GIF Global Infrastructure Facility
GOR Gas-to-oil ratio
GTC Gas to chemicals
GTL Gas to liquids
GTW Gas to wire (electricity)
H2S Hydrogen sulfide
HVDC High-voltage direct current (cable)
IDFC International Development Finance Club
IEA International Energy Agency
IFC International Finance Corporation
IOGP International Association of Oil & Gas Producers
KPI Key performance indicators
LDAR Leak detection and repair
LDCs Local distribution companies
LNG Liquefied natural gas
LPG Liquefied petroleum gas
MCFs Multilateral climate funds
MDB Multilateral Development Bank
MGS Master Gas System (Saudi Arabia)
MMBtu Million British thermal units
NASA National Aeronautics and Space Administration
NDIC North Dakota Industrial Commission
NGFCP Nigerian Gas Flare Commercialisation Programme
NGL Natural gas liquid
NGO Non-governmental organization
NOC National oil company
NOK Norwegian Kroner
Abbreviations and acronyms
146 — Flaring management guidelines
OECD Organization for Economic Co-operation and Development
OGA Oil & Gas Authority (UK)
OGE&EE Optimization of Electricity Generation and Energy Efficiency (Ecuador)
OLADE Latin American Energy Organization
OpCo Operating Company
OPEC Organization of the Petroleum Exporting Countries
PE Private equity
PPF Project preparation facility
psig Pressure (gauge) relative to ambient atmospheric pressure
RCA Root cause analysis
RED Renewable Energy Directive
SCFH Standard cubic feet per hour
SDGs Sustainable Development Goals
UNDP United Nations Development Programme
UNEP United Nations Environment Programme
UNFCCC United Nations Framework Convention on Climate Change
USD US dollar
US EPA United States Environmental Protection Agency
VIIRS Visual-infrared imaging radiometer suite
VRU Vapor recovery unit
Abbreviations and acronyms

147 — Flaring management guidelines
References

148 — Flaring management guidelines
1. GGFR (2021). Global Gas Flaring Tracker Report. Global Gas Flaring Reduction Partnership. https://thedocs.worldbank.org/en/doc/1f7221545bf1b7c89b850dd85cb409b0-0400072021/original/WB-GGFR-Report-Design-05a.pdf
2. World Bank (2021). ‘Global Gas Flaring Jumps to Levels Last Seen in 2009.’ Press Release No: 2021/003/EEX. https://www.worldbank.org/en/news/press-release/2020/07/21/global-gas-flaring-jumps-to-levels-last-seen-in-2009
3. EIA (2018). Natural Gas Market Module of the National Energy Modeling System: Model Documentation 2018. U.S. Energy Information Administration. https://www.eia.gov/outlooks/aeo/nems/documentation/ngmm/pdf/ngmm(2018).pdf
4. Penner, D. and Harness, J. (2014). Optimizing Hydrocarbon And Energy Management In Upstream Oil And Gas Operations. http://members.igu.org/old/IGU%20Events/igrc/igrc-2014/papers/wo4-1_penner.pdf/@@download/file/WO4-1_Penner.pdf
5. Buzcu-Guven, B., Harriss, R. and Hertzmark, D. (2010). Gas Flaring and Venting: Extent, Impacts, and Remedies. Rice University’s Baker Institute for Public Policy. https://www.bakerinstitute.org/research/gas-flaring-and-venting-extent-impacts-and-remedies
6. Svensson, B., Ríos, M. O. (2012). Unlocking the Value of Wasted Natural Gas. Global Gas Flaring Reduction Partnership. http://members.igu.org/html/wgc2009/papers/docs/wgcFinal00563.pdf
7. Agerton, M., Gilbert, B. and Upton, G. B. Jr. (2020). The Economics of Natural Gas Flaring in U.S. Shale: An Agenda for Research and Policy. Rice University’s Baker Institute for Public Policy. https://www.bakerinstitute.org/media/files/files/03160f6a/ces-agerton-etal-naturalgas-072420.pdf
8. Argonne National Laboratory (2017). Analysis of Potential Opportunities to Reduce Venting and Flaring on the OCS. Prepared by the Argonne Venting and Flaring Research Team for the U.S. Bureau of Safety and Environmental Enforcement. https://www.bsee.gov/sites/bsee.gov/files/5007aa.pdf
9. IOGP (2000). Flaring and venting in the oil and gas exploration and production industry. International Association of Oil & Gas Producers, Report 2.79/288. https://www.iogp.org/bookstore/product/flaring-and-venting-in-the-oil-and-gas-exploration-and-production-industry/
10. Carbon Limits AS. (2015). Improving utilization of associated gas in US tight oil fields. Report prepared for the Clean Air Task Force (CATF). https://www.catf.us/wp-content/uploads/2015/04/CATF_Pub_ PuttingOuttheFire.pdf
11. GGFR (2016). Gas Flaring Definitions. Global Gas Flaring Reduction — A Public-Private Partnership. http://documents1.worldbank.org/curated/en/755071467695306362/pdf/106662-NEWS-PUBLIC-GFR-Gas-Flaring-Definitions-29-June-2016.pdf
12. GGFR (2020). Global Gas Flaring Tracker Report. Global Gas Flaring Reduction Partnership. http://pubdocs.worldbank.org/en/503141595343850009/WB-GGFR-Report-July2020.pdf
13. World Bank (2021). ‘Zero Routine Flaring by 2030’ (website). The full text of the Initiative. https://www.worldbank.org/en/programs/zero-routine-flaring-by-2030
14. Collins, G. (2019). Reducing Oilfield Methane Emissions Can Create New US Gas Export Opportunities. Rice University’s Baker Institute for Public Policy, Issue Brief 11.19.19. https://www.bakerinstitute.org/media/files/files/9553353d/bi-brief-111919-ces-methane.pdf
15. Kleinberg, R. L., Paltsev, S., Ebinger, C. K. E., Hobbs, D. A. and Boersma, T. (2018). ‘Tight oil market dynamics: Benchmarks, breakeven points, and inelasticities.’ In Energy Economics, Vol. 70, February 2018. https://www.sciencedirect.com/science/article/pii/S0140988317304103
References
149 — Flaring management guidelines
16. Kah, M. (2020). ‘Columbia Global Energy Dialogue: Natural Gas Flaring Workshop Summary’ (website). Columbia/SIPA Center on Global Energy Policy. https://www.energypolicy.columbia.edu/research/global-energy-dialogue/columbia-global-energy-dialogue-natural-gas-flaring-workshop-summary
18. World Bank (2019). Gas flaring volumes 2014 - 18. Table listing the top 30 flaring countries. http://pubdocs.worldbank.org/en/887251581002821897/Revised-2014-2018-flare-volumes-estimates.pdf
18. GGFR (2009). Guidance on Upstream Flaring and Venting. Policy and Regulation. Global Gas Flaring Reduction Partnership. https://documents.worldbank.org/en/publication/documents-reports/documentdetail/200701468344636937/guidance-on-upstream-flaring-and-venting-policy-and-regulation
19. Agerton, M., Gilbert, B. and Upton, G. B. Jr. (2020). The Economics of Natural Gas Flaring in U.S. Shale: An Agenda for Research and Policy. Rice University’s Baker Institute for Public Policy. https://www.bakerinstitute.org/media/files/files/03160f6a/ces-agerton-etal-naturalgas-072420.pdf
20. Brandt, A. R., Yeskoo, T., McNally, S., Vafi, K., Cai, H. and Wang, M. Q. (2015). Energy Intensity and Greenhouse Gas Emissions from Crude Oil Production in the Bakken Formation: Input Data and Analysis Methods. https://greet.es.anl.gov/publication-bakken-oil
21. Garthwaite, J. (2018). ‘Stanford study finds stark differences in the carbon-intensity of global oil fields.’ Article published on the Stanford News website, 30 August 2018. https://news.stanford.edu/2018/08/30/measuring-crude-oils-carbon-footprint/
22. Masnadi, M. S., El-Houjeiri, H. M., Schunack, D and Li, Y. (2018). ‘Global carbon intensity of crude oil production.’ In Science, Vol. 361, Issue 6405, 31 August 2018. https://www.researchgate.net/publication/327328315_Global_carbon_intensity_of_crude_oil_production
23. Kah, M. (2020). ‘Columbia Global Energy Dialogue: Natural Gas Flaring Workshop Summary’ (website). Columbia/SIPA Center on Global Energy Policy. https://www.energypolicy.columbia.edu/research/global-energy-dialogue/columbia-global-energy-dialogue-natural-gas-flaring-workshop-summary
24. Abnett, K. (2020). ‘Exclusive: Draft EU methane strategy shies away from binding emissions standards.’ Report published on the Reuters website on 21 August 2020. https://www.reuters.com/article/us-eu-energy-methane-strategy-exclusive/exclusive-draft-eu-methane-strategy-shies-away-from-binding-emissions-standards-idUSKBN25H2BL
25. Belyi, A. (2020). ‘Gas flaring in focus again. Possible angle of EU methane emissions strategy.’ Article published on the Energy Central website on 20 October 2020. https://energycentral.com/c/og/gas-flaring-should-it-be-focus-new-methane-strategy
26. Carbon Limits AS. (2015). Improving utilization of associated gas in US tight oil fields. Report prepared for the Clean Air Task Force (CATF). https://www.catf.us/wp-content/uploads/2015/04/CATF_Pub_ PuttingOuttheFire.pdf
27. U.S. Department of Interior, Bureau of Safety and Environmental Enforcement (2003). Gas Handling Options for Associated Gas in Deepwater Developments in the Gulf of Mexico. https://www.bsee.gov/sites/bsee.gov/files/tap-technical-assessment-program//443aa.pdf
28. World Bank (2004). Flared Gas Utilization Strategy. Opportunities for Small-Scale Uses of Gas. The International Bank for Reconstruction and Development, May 2004. http://documents1.worldbank.org/curated/en/193801468779650307/pdf/295520Flared0G1on0Strategy01public1.pdf
29. PetroWiki (2021). ‘PEH: Monetizing Stranded Gas’ (website). https://petrowiki.spe.org/PEH:Monetizing_Stranded_Gas
References

150 — Flaring management guidelines
30. Alfarge, D., Alsaba, M., Wei, M. and Bai, B. (2018). Miscible Gases Based EOR in Unconventional Liquids Rich Reservoirs: What We Can Learn. Paper Number SPE-193748-MS presented at the SPE International Heavy Oil Conference and Exhibition, Kuwait City, Kuwait, December 2018. https://doi.org/10.2118/193748-MS
31. Ng, S. and Singh, H. (2018). Part II: gas monetisation, external economic and non-technical factors. Article published on the io consulting website on 5 July 2018. https://www.ioconsulting.com/post/part-ii-gas-monetisation-external-economic-and-non-technical-factors
32. Carbon Limits AS. (2015). Improving utilization of associated gas in US tight oil fields. Report prepared for the Clean Air Task Force (CATF). https://www.catf.us/wp-content/uploads/2015/04/CATF_Pub_ PuttingOuttheFire.pdf
33. U.S. Department of Interior, Bureau of Safety and Environmental Enforcement (2003). Gas Handling Options for Associated Gas in Deepwater Developments in the Gulf of Mexico. https://www.bsee.gov/sites/bsee.gov/files/tap-technical-assessment-program//443aa.pdf
34. Rigzone (2021). ‘How Does Gas Injection Work?’ (website). https://www.rigzone.com/training/insight.asp?insight_id=345&c_id=
35. GGFR (2018). GGFR Technology Overview – Utilization of Small-Scale Associated Gas. Global Gas Flaring Reduction Partnership. http://pubdocs.worldbank.org/en/801871519953431815/GGFR-Technology-MASTER-February-2018.pdf
36. Edge LNG (2021). A world-first solution to flaring, venting and stranded wells (website). https://edgelng.com/
37. Chen, L., Qi, Z., Zhang, S., Su, J. and Somorjai, G. A. (2020). ‘Catalytic Hydrogen Production from Methane: A Review on Recent Progress and Prospect.’ In Catalysts, Vol. 10, Issue 8. https://doi.org/10.3390/catal10080858
38. Malik, N. S. (2019). ‘Why Bitcoin Mining Is Being Touted as a Solution to Gas Flaring.’ Article published on the Bloomberg website on 6 December 2019. https://www.bloomberg.com/news/articles/2019-12-06/why-bitcoin-mining-is-being-touted-as-a-solution-to-gas-flaring
39. GGFR (2020). GGFR Technology Overview – Utilization of Small-Scale Associated Gas. Global Gas Flaring Reduction Partnership. http://pubdocs.worldbank.org/en/662151598037050211/GGFR-Small-scale-gas-utilization-technology-Summaries-September-2020.pdf
40. Carbon Limits AS. (2015). Improving utilization of associated gas in US tight oil fields. Report prepared for the Clean Air Task Force (CATF). https://www.catf.us/wp-content/uploads/2015/04/CATF_Pub_ PuttingOuttheFire.pdf
41. Carbon Limits AS. (2013). Associated Petroleum Gas Flaring Study for Russia, Kazakhstan, Turkmenistan and Azerbaijan. Report prepared for the European Bank for Reconstruction and Development. http://www.ebrd.com/documents/climate-finance/associated-gas-utilization-report-for-russia-kazakhstan-turkmenistan-azerbaijan.pdf
42. Ng, S. and Singh, H. (2018). Part II: gas monetisation, external economic and non-technical factors. Article published on the io consulting website on 5 July 2018. https://www.ioconsulting.com/post/part-ii-gas-monetisation-external-economic-and-non-technical-factors
43. Wilcox, A. (2019). Flaring Issues, Solutions & Technologies - 2019. Houston Advanced Research Center Report Number DOE-HARC-31691. https://doi.org/10.2172/1569027
44. Kah, M. (2020). ‘Columbia Global Energy Dialogue: Natural Gas Flaring Workshop Summary’ (website). Columbia/SIPA Center on Global Energy Policy. https://www.energypolicy.columbia.edu/research/global-energy-dialogue/columbia-global-energy-dialogue-natural-gas-flaring-workshop-summary
45. NMOGA (2020). Flaring in the Oilfield. Resources and strategies for understanding and reducing flaring. New Mexico Oil and Gas Association. https://www.nmoga.org/flaring
References
151 — Flaring management guidelines
46. Wilcox, A. et al. (2019). Flaring Issues, Solutions & Technologies – 2019. Houston Advanced Research Center, Report DE-FE0031691 prepared for the U.S. Department of Energy. https://www.osti.gov/servlets/purl/1569027
47. Clearstone Engineering Ltd. (2020). Best Practices for Catalysing Co-investment and Capacity-building. Report prepared for the Climate & Clean Air Coalition (CCAC) in relation to the CCAC technology demonstration project ‘Financing and Measuring Black Carbon Emission Reduction in the Oil and Gas Sector.’ https://ccacoalition.org/en/resources/best-practices-catalysing-co-investment-and-capacity-building-black-carbon-reduction
48. Agerton, M., Gilbert, B. and Upton, G. B. Jr. (2020). The Economics of Natural Gas Flaring in U.S. Shale: An Agenda for Research and Policy. Rice University’s Baker Institute for Public Policy. https://www.bakerinstitute.org/media/files/files/03160f6a/ces-agerton-etal-naturalgas-072420.pdf
49. Ng, S. and Singh, H. (2018). Part II: gas monetisation, external economic and non-technical factors. Article published on the io consulting website on 5 July 2018. https://www.ioconsulting.com/post/part-ii-gas-monetisation-external-economic-and-non-technical-factors
50. IPIECA, IFC, UNDP (2017). Mapping the Oil and Gas Industry to the Sustainable Development Goals: an Atlas. https://www.ipieca.org/resources/awareness-briefing/mapping-the-oil-and-gas-industry-to-the-sustainable-development-goals-an-atlas/
51. IPIECA, WBCSD (2021). Accelerating action: an SDG Roadmap for the oil and gas sector. https://www.ipieca.org/our-work/sustainability/supporting-the-sdgs/sdg-roadmap
52. UN DESA (2021). ‘The 17 Goals’ (website). United Nations Department of Economic and Social Affairs. https://sdgs.un.org/goals
53. World Bank (2021). ‘Global Gas Flaring Reduction Partnership (GGFR) — Overview’ (website). https://www.worldbank.org/en/programs/gasflaringreduction
54. World Bank (2021). ‘Global Gas Flaring Reduction Partnership (GGFR) — Gas flaring data’ (website). https://www.worldbank.org/en/programs/gasflaringreduction#7
55. World Bank (2021). ‘Global Gas Flaring Reduction Partnership (GGFR) — Resources (website). https://www.worldbank.org/en/programs/gasflaringreduction#5
56. World Bank (2021). ‘Zero Routine Flaring by 2030’ (website). The full text of the Initiative. https://www.worldbank.org/en/programs/zero-routine-flaring-by-2030
57. IEA (2020). The Oil and Gas Industry in Energy Transitions. Insights from IEA Analysis. International Energy Agency. https://www.iea.org/reports/the-oil-and-gas-industry-in-energy-transitions
58. PetroWiki (2021). ‘Production forecasting decline curve analysis’ (website). https://petrowiki.spe.org/Production_forecasting_decline_curve_analysis
59. PetroWiki (2021). ‘Production forecasting purpose’ (website). https://petrowiki.spe.org/Production_forecasting_purpose
60. Emam, E. (2015). ‘Gas Flaring in Industry: An Overview.’ In Petroleum & Coal, Vol. 57, Issue. 5, pp. 532-555. http://large.stanford.edu/courses/2016/ph240/miller1/docs/emam.pdf
61. Rivas, A. (2018). A review of best practices for Selection, Installation, Operation and Maintenance Of Gas meters for Flare Applications used for Managing facility mass balance and compliance. Fluenta. https://www.4cconference.com/wp-content/uploads/2018/03/Arnold-Rivas-Fluenta-4C-Preentation-2018-rev0.1.pdf
62. API (2017). Standard 537: Flare Details for Petroleum, Petrochemical, and Natural Gas Industries. 3rd Edition, March 2017 (includes all amendments and changes through Addendum 1, June 2020). This standard specifies requirements and provides guidance for the selection, design, specification, operation and maintenance of flares and related combustion and mechanical components used in pressure-relieving and vapor depressurizing systems for petroleum, petrochemical and natural gas industries. While this standard is primarily intended for onshore facilities, guidance related to offshore applications is included. https://www.api.org/products-and-services/standards
References

152 — Flaring management guidelines
63. API (2007). Manual of Petroleum Measurement Standards. Chapter 14.10: Measurement of Flow to Flares. 1st Edition , July 2007 (includes all amendments and changes through Reaffirmation Notice, June 2012). This chapter addresses measurement of flow to flares, and includes: application considerations; selection criteria and other considerations for flare meters and related instrumentation; installation considerations; limitations of flare measurement technologies; calibration; operation; uncertainty and propagation of error; and calculations. https://publications.api.org/publications-store.aspx
64. API (2012–2016). Manual of Petroleum Measurement Standards. Chapters 14.3.1–14.3.4: Concentric, Square-edged Orifice Meters. These chapters cover design and installation parameters, calibration, operation, uncertainty and propagation of error, and calculations for measurement of fluid flow using concentric, square-edged, flanged tapped orifice meters. https://publications.api.org/publications-store.aspx
65. API (2013). Manual of Petroleum Measurement Standards. Chapter 14.9: Measurement of Natural Gas by Coriolis Meter. 2nd Edition , February 2013. This chapter addresses the operation, calibration, installation, maintenance and calculations for Coriolis flow meters used to measure natural gas flows. https://publications.api.org/publications-store.aspx. (Also available as American Gas Association Report No. 11, Fundamentals of Coriolis Meters. http://asgmt.com/wp-content/uploads/pdf-docs/2013/1/002.pdf )
66. API (2011). Technical Report 2571, Fuel Gas Measurement. 1st Edition , March 2011. This document provides guidance in the selection of flow meter type; differential pressure, displacement, ultrasonic, Coriolis, vortex, turbine, thermal, and others. It also describes associated instrumentation for measuring fluid properties and flowing conditions, obtaining and use of gas composition or other analytical data, design and installation requirements of the measurement system, inspection, verification and calibration practices of flow meters and their associated accessory instrumentation, and simplified uncertainty calculations. https://www.api.org/products-and-services/standards
67. Clearstone Engineering Ltd. (2008). Guidelines on Flare and Vent Measurement. Report Number 71380 prepared for the Global Gas Flaring Reduction Partnership and the World Bank. http://documents1.worldbank.org/curated/en/689451468158369316/pdf/713800WP0Box370are0Vent0Measurement.pdf
68. Zhang, Y., Gautam, R., Pandey, S., Omara, M. et al. (2020). ‘Quantifying methane emissions from the largest oil-producing basin in the United States from space.’ In Science Advances, Vol. 6, No. 17, eaaz5120, 22 April 2020. https://advances.sciencemag.org/content/6/17/eaaz5120
69. AAAS (2011). Geospatial Technologies and Human Rights Project. Eyes on Nigeria: Technical Report. American Association for the Advancement of Science. https://www.aaas.org/resources/eyes-nigeria-technical-report/gas-flaring
70. EDF (2021). ‘Satellite data confirms Permian gas flaring is double what companies report’ (website). Environmental Defense Fund. http://blogs.edf.org/energyexchange/2019/01/24/satellite-data-confirms-permian-gas-flaring-is-double-what-companies-report/
71. Viani, L. O. (2019). ‘Study uses satellite data to pinpoint widespread oil industry ‘flaring.’ Article provided by the San Francisco State University and published on the Phys.org website. https://phys.org/news/2019-02-satellite-widespread-oil-industry-flaring.html
72. Elvidge, C. D., Brazilian, M. D., Zhizhin, M., Ghosh, T., Baugh, K. and Hsu, F-C. (2018). ‘The potential role of natural gas flaring in meeting greenhouse gas mitigation targets.’ In Energy Strategy Reviews, Vol. 20, April 2018, pp. 156-162. https://doi.org/10.1016/j.esr.2017.12.012
73. GGFR (2020). Global Gas Flaring Tracker Report. Global Gas Flaring Reduction Partnership. http://pubdocs.worldbank.org/en/503141595343850009/WB-GGFR-Report-July2020.pdf
74. Brandt, A. R. (2020). ‘Accuracy of satellite-derived estimates of flaring volume for offshore oil and gas operations in nine countries.’ In Environmental Research Communications, Vol. 2, No. 5. https://iopscience.iop.org/article/10.1088/2515-7620/ab8e17
References
153 — Flaring management guidelines
75. API (2020). Standard 520 Part 1: Sizing, Selection, and Installation of Pressure-Relieving Devices Part I — Sizing and Selection. 10th Edition, October 2020. This standard applies to the sizing and selection of pressure relief devices used in refineries and related industries for equipment that has a maximum allowable working pressure of 15 psig (103 kPag) or greater. It includes basic definitions and information about the operational characteristics and applications of various pressure relief devices. https://publications.api.org/publications-store.aspx
76. API (2020). Standard 520 Part 2: Sizing, Selection, and Installation of Pressure-Relieving Devices Part II — Installation . 7th Edition, October 2020. This standard covers pressure relief valves or rupture disks which may be used independently or in combination with each other to provide the required protection against excessive pressure accumulation. https://publications.api.org/publications-store.aspx
77. API (2020). Standard 521: Pressure-Relieving and Depressuring Systems . 7th Edition, June 2020. This standard applies to pressure-relieving and vapor depressuring systems in oil refineries, petrochemical facilities, gas plants, LNG facilities, and oil and gas production facilities. The information provided is designed to aid in the selection of the system that is most appropriate for the risks and circumstances involved in various installations. It specifies requirements and gives guidelines for examining the principal causes of overpressure, determining individual relieving rates, and selecting and designing disposal systems, including piping, vessels, flares and vent stacks. https://publications.api.org/publications-store.aspx
78. Gaspar, J., Davis, D., Camacho, C. and Alvarez, J. J. (2016). ‘Biogenic versus Thermogenic H2S Source Determination in Bakken Wells: Considerations for Biocide Application.’ in Environmental Science and Technology Letters. Vol. 3, Issue 4. https://doi.org/10.1021/acs.estlett.6b00075
79. Duissenov, D. (2013). Production and processing of sour crude and natural gas - challenges due to increasing stringent regulations. Norwegian University of Science and Technology. https://core.ac.uk/download/pdf/30858314.pdf
80. PetroWiki (2021). ‘Sour Gas Sweetening’ (website). https://petrowiki.spe.org/Sour_gas_sweetening
81. EIA (2019). ‘Horizontal wells dominate US tight formation production.’ Article published on the US Energy Information Agency website on 6 June 2019. https://www.eia.gov/todayinenergy/detail.php?id=39752
82. Rystad Energy (2019). Permian gas flaring reaches yet another high. Press Release, 5 November 2019. https://www.rystadenergy.com/newsevents/news/press-releases/permian-gas-flaring-reaches-yet-another-high/
83. Collins, G. (2019). Reducing Oilfield Methane Emissions Can Create New US Gas Export Opportunities. Issue Brief, 11.19.19. Rice University’s Baker Institute for Public Policy. https://www.bakerinstitute.org/media/files/files/9553353d/bi-brief-111919-ces-methane.pdf
84. Fulford, D. S. (2018). Multi-Phase Production Forecasting “Bubble Point Death?” Society of Petroleum Evaluation Engineers. https://spee.org/sites/spee.org/files/houston-2018-05-02-fulford.pdf
85. EIA (2017). ‘Natural gas production in Bakken region increases at a faster rate than oil production.’ Article published on the US Energy Information Agency website on 28 November 2017. https://www.eia.gov/todayinenergy/detail.php?id=33892
86. IHS Markit (2019). ‘ “Base Decline” Rate of Oil and Gas Output in Permian Basin has Increased Dramatically Because of Recent Growth; Operators Must Drill More Wells to Maintain Production Levels, IHS Markit Says’ (website). IHS Markit News Release, 12 December 2019. https://news.ihsmarkit.com/prviewer/release_only/slug/energy-base-decline-rate-oil-and-gas-output-permian-basin-has-increased-dramatically-b
87. Kah, M. (2020). ‘Columbia Global Energy Dialogue: Natural Gas Flaring Workshop Summary’ (website). Columbia/SIPA Center on Global Energy Policy. https://www.energypolicy.columbia.edu/research/global-energy-dialogue/columbia-global-energy-dialogue-natural-gas-flaring-workshop-summary
References

154 — Flaring management guidelines
88. US DOE (2019). Natural Gas Flaring and Venting: State and Federal Regulatory Overview, Trends, and Impacts. U.S. Department of Energy, Office of Oil and Natural Gas/Office of Fossil Energy. https://www.energy.gov/sites/prod/files/2019/08/f65/Natural%20Gas%20Flaring%20and%20Venting%20Report.pdf
89. Singer, T. (2020). Flaring in the Oilfield: A Closer Look. Western Environmental Law Center. https://westernlaw.org/wp-content/uploads/2020/08/2020.08.05-WELC-NM-Flaring-Report.pdf
90. Stewart, J. (2020). Tackling Flaring: Learnings from Leading Permian Operators. GaffneyCline. https://www.gaffneycline.com/sites/g/files/cozyhq681/files/2020-06/Tackling%20Flaring_Final.pdf
91. Kringstad, J. (2013). North Dakota Natural Gas. A Detailed Look At Natural Gas Gathering. North Dakota Pipeline Authority. https://ndpipelines.files.wordpress.com/2012/07/ndpa-detailed-look-at-gas-gathering-2013.pdf
92. Gould, T., McGlade, C. and Schulz, R. (2020). ‘Flaring Emissions.’ IEA tracking report (website). https://www.iea.org/reports/flaring-emissions
93. Kleinberg, R. L., Paltsev, S., Ebinger, C. K. E., Hobbs, D. A. and Boersma, T. (2018). ‘Tight oil market dynamics: Benchmarks, breakeven points, and inelasticities.’ In Energy Economics, Vol. 70, February 2018. https://www.sciencedirect.com/science/article/pii/S0140988317304103
94. Kah, M. (2020). ‘Columbia Global Energy Dialogue: Natural Gas Flaring Workshop Summary’ (website). Columbia/SIPA Center on Global Energy Policy. https://www.energypolicy.columbia.edu/research/global-energy-dialogue/columbia-global-energy-dialogue-natural-gas-flaring-workshop-summary
95. EIA (2020). ‘North Dakota flared 19% of its gas production in 2019.’ Article published on the US Energy Information Agency website on 22 April 2020. https://www.eia.gov/todayinenergy/detail.php?id=43435
96. North Dakota Industrial Commission (2021). Director’s Cut Archive (website and downloads). Department of Mineral Resources, State of North Dakota. https://www.dmr.nd.gov/oilgas/directorscut/directorscutarchive.asp
97. NMOGA (2020). Flaring in the Oilfield. Resources and strategies for understanding and reducing flaring. New Mexico Oil and Gas Association. https://www.nmoga.org/flaring
98. U.S. Bureau of Land Management (2016). Waste Prevention, Production Subject to Royalties, and Resource Conservation. Federal Register Vol. 81, No. 223. https://www.federalregister.gov/documents/2016/11/18/2016-27637/waste-prevention-production-subject-to-royalties-and-resource-conservation.
99. API (2015). Recommended Practice 100-2: Managing Environmental Aspects Associated with Exploration and Production Operations Including Hydraulic Fracturing. 1st Edition , August 2015 (includes all amendments and changes through Reaffirmation Notice, August 2020). This recommended practice is applicable to the planning and operation of wells, and hydraulically fractured wells. Topics covered include: recommendations for managing environmental aspects during planning; site selection; logistics; mobilization, rig-up, and demobilization; and stimulation operations. The document includes a section on air emissions and control technologies. https://www.api.org/products-and-services/standards
100. Stewart, J. (2020). Tackling Flaring: Learnings from Leading Permian Operators. GaffneyCline. https://www.gaffneycline.com/sites/g/files/cozyhq681/files/2020-06/Tackling%20Flaring_Final.pdf
101. NMOGA (2020). Flaring in the Oilfield. Resources and strategies for understanding and reducing flaring. New Mexico Oil and Gas Association. https://www.nmoga.org/flaring
102. EIA (2020). ‘North Dakota flared 19% of its gas production in 2019.’ Article published on the US Energy Information Agency website on 22 April 2020. https://www.eia.gov/todayinenergy/detail.php?id=43435
103. Stewart, J. (2020). Tackling Flaring: Learnings from Leading Permian Operators. GaffneyCline. https://www.gaffneycline.com/sites/g/files/cozyhq681/files/2020-06/Tackling%20Flaring_Final.pdf
References

155 — Flaring management guidelines
104. NMOGA (2020). Flaring in the Oilfield. Resources and strategies for understanding and reducing flaring. New Mexico Oil and Gas Association. https://www.nmoga.org/flaring
105. Methane Guiding Principles (2019). Synopsis. Reducing Methane Emissions: Best Practice Guide. Flaring. https://methaneguidingprinciples.org/best-practice-guides/flaring
106. IPIECA (2014). ‘Green Completions’ (website). https://www.ipieca.org/resources/energy-efficiency-solutions/units-and-plants-practices/green-completions
107. U.S. Minerals Management Service (2004). Guidance on Safety Of Well Testing. Report No. 4273776/DNV. https://www.bsee.gov/sites/bsee.gov/files/tap-technical-assessment-program//474aa.pdf
108. Selim, H. (2018). Case Study; Well Test Flow back Into the Hull of a DNV DRILL(N) Class Drillship. Presentation by Hussein Selim at EXPRO, 3 October 2018. https://www.spe-aberdeen.org/wp-content/uploads/2018/10/SPE-Simplified-Series-Hussein-Selim-Expro-October-2018.pdf
109. Argonne National Laboratory (2017). Analysis of Potential Opportunities to Reduce Venting and Flaring on the OCS. Prepared by the Argonne Venting and Flaring Research Team for the U.S. Bureau of Safety and Environmental Enforcement. https://www.bsee.gov/sites/bsee.gov/files/5007aa.pdf
110. IPIECA/IOGP/GGFR (2011). Preparing effective flare management plans. Guidance document for the oil and gas industry. https://www.ipieca.org/resources/good-practice/preparing-effective-flare-management-plans-guidance-document-for-the-oil-and-gas-industry
111. US DOE (2019). Natural Gas Flaring and Venting: State and Federal Regulatory Overview, Trends, and Impacts. U.S. Department of Energy, Office of Oil and Natural Gas/Office of Fossil Energy. https://www.energy.gov/sites/prod/files/2019/08/f65/Natural%20Gas%20Flaring%20and%20Venting%20Report.pdf
112. US EPA (2021). ‘Recommended Technologies to Reduce Methane Emissions’ (website). United States Environmental Protection Agency, Natural Gas STAR Program. https://www.epa.gov/natural-gas-star-program/recommended-technologies-reduce-methane-emissions
113. IPIECA/IOGP/GGFR (2011). Preparing effective flare management plans. Guidance document for the oil and gas industry. https://www.ipieca.org/resources/good-practice/preparing-effective-flare-management-plans-guidance-document-for-the-oil-and-gas-industry
114. API (2014). Community Engagement Guidelines. ANSI/API Bulletin 100-3, First Edition. This guidance document outlines what local communities and other key stakeholders can expect from operators. Both local stakeholders and operators can use the guidance to work through the challenges and impacts that occur during the industry’s presence in a given region. It provides flexible and adaptable strategies, recognizing that application will vary from operator to operator and community to community. https://www.api.org/oil-and-natural-gas/wells-to-consumer/ exploration-and-production/hydraulic-fracturing/community-engagement-guidelines
115. IPIECA/IOGP/GGFR (2011). Preparing effective flare management plans. Guidance document for the oil and gas industry. https://www.ipieca.org/resources/good-practice/preparing-effective-flare-management-plans-guidance-document-for-the-oil-and-gas-industry
116. PetroWiki (2021). ‘Uncertainty range in production forecasting’ (website). https://petrowiki.spe.org/Uncertainty_range_in_production_forecasting#:~:text=There%20should%20be%20at%20least,or%20exceed%20the%20best%20estimate
117. GGFR (2019). Global Gas Flaring Reduction Steering Committee Report, presented at the May 2019 meeting of the GGFR Steering Committee held in Milan, Italy.
118. Alfarge, D., Alsaba, M., Wei, M. and Bai, B. (2018). Miscible Gases Based EOR in Unconventional Liquids Rich Reservoirs: What We Can Learn. Paper Number SPE-193748-MS presented at the SPE International Heavy Oil Conference and Exhibition, Kuwait City, Kuwait, December 2018. https://doi.org/10.2118/193748-MS
119. Rigzone (2021). ‘How Does Gas Injection Work?’ (website). https://www.rigzone.com/training/insight.asp?insight_id=345&c_id
References

156 — Flaring management guidelines
120. Rossi, L., Gancheva, M. and O’Brien, S. (2017). Financing climate action: opportunities and challenges for local and regional authorities. European Union and the Committee of the Regions. https://climate-adapt.eea.europa.eu/metadata/publications/financing-climate-action-opportunities-and-challenges-for-local-and-regional-authorities/cor_2017_financing-climate-action-opportunities-and-challenges-for-lras.pdf
121. CPI (2019). Global Landscape of Climate Finance 2019. Climate Policy Initiative. https://www.climatepolicyinitiative.org/publication/global-landscape-of-climate-finance-2019
122. Carney, M. (2019). ‘Fifty Shades of Green.’ In Finance & Development, Vol. 56, No. 4, December 2019. https://www.imf.org/external/pubs/ft/fandd/2019/12/pdf/fd1219.pdf
123. Bloomberg NEF (2017). ‘First Green Bonds Sold by an Oil Giant Find Willing Investors’ (website). First published 22 May 2017. https://about.bnef.com/blog/first-green-bonds-sold-by-an-oil-giant-find-willing-investors/
124. Climate Bonds Initiative (2020). Financing credible transitions. How to ensure the transitional label has impact. https://www.climatebonds.net/transition-finance/fin-credible-transitions
125. Malins, C., Searle, S., Baral, A., Galarza, S. and Wang, H. (2014). Reduction of Upstream Greenhouse Gas Emissions from Flaring and Venting. International Council on Clean Transportation. https://theicct.org/publications/reduction-upstream-greenhouse-gas-emissions-flaring-and-venting
126. UNFCCC (2013). Recovery and utilization of gas from oil fields that would otherwise be flared or vented. Clean Development Mechanism report AM0009, Version 07.0. United Nations Framework Convention on Climate Change. https://cdm.unfccc.int/methodologies/DB/ET4NXMVXFQ5C2EJ5L1OF8YZIEVLVDA
127. Baker & McKenzie (2015). International Joint Ventures Handbook. https://www.bakermckenzie.com/-/ media/files/insight/publications/2015/09/bk_jointventureshandbook_15.pdf%203Fla%203Den
128. Agrawal, H., Al Shuayli, M. and Salmani, M. (2017). Reducing Operational Flaring Through ALARP Based Decision Making. Paper Number SPE-188748-MS presented at the Abu Dhabi International Petroleum Exhibition & Conference, Abu Dhabi, UAE, November 2017. https://www.onepetro.org/conference-paper/SPE-188748-MS
129. The Environmental Partnership (2021). The Environmental Partnership is comprised of companies in the US oil and natural gas industry committed to continuously improve the industry’s environmental performance (website). https://theenvironmentalpartnership.org/
130. Texas Methane & Flaring Coalition (2020). Flaring Recommendations and Best Practices. https://texasmethaneflaringcoalition.org/wp-content/uploads/2020/06/6-16-20-TMFC-Flaring-Recommendations-Best-Practices-Report.pdf
131. SkyTruth (2021). ‘Flaring Maps’ (website). https://skytruth.org/flaring/
132. Colorado School of Mines (2021). ‘VIIRS Nightfire (VNF)’ (website). https://payneinstitute.mines.edu/eog/
133. SkyTruth (2021). ‘Flaring Maps’ (website). https://skytruth.org/flaring/
134. ESRI (2021). ‘Permian Methane Analysis Project’ (website). https://data.permianmap.org/pages/flaring
135. EDF (2020). Methodology: Permian Methane Analysis Project (PermianMAP). Data Collection and Analysis. March 2020 update. Environmental Defense Fund. https://www.edf.org/sites/default/files/documents/PermianMapMethodology_1.pdf?view=table&sortOrder=desc&sortField=modified&folder=9d8436edf48d4792a38bcb33c80946f0#content
136. Michelussi, T. (2006). Best Management Practices for Facility Flare Reduction. Canadian Association of Petroleum Producers. http://docshare01.docshare.tips/files/20511/205115851.pdf
137. Khan, F. I. (2021). ‘Bad Actor Program’ (website). https://reliabilityweb.com/articles/entry/bad-actor-program#:~:text=A%20bad%20actor%20program%20is,maintenance%20cost%20and%20plant%20downtime
References

157 — Flaring management guidelines
138. Kurz, R., Lubomirski, M and Brun, K. (2012). ‘Gas Compressor Station Economic Optimization.’ In International Journal of Rotating Machinery, Vol. 2012, Article ID 715017. https://doi.org/10.1155/2012/715017
139. Al Kamali, M. M., Houache, O., Hasan, H. A., Abdul-Wahab, S. A. and Agrawal, H. (2019). Non Routine Flaring in Upstream Oil and Gas Industry Root Causes and Mitigations. Paper Number SPE-197357-MS presented at the Abu Dhabi International Petroleum Exhibition & Conference, Abu Dhabi, UAE, November 2019. https://www.onepetro.org/conference-paper/SPE-197357-MS
140. Rahmania, A. and Purwanto, W. W. (2020). Simulation of boil-off gas effect along LNG supply chain on quantity and quality of natural gas. AIP Conference Proceedings 2223, 040004, International Energy Conference ASTECHNOVA 2019. https://aip.scitation.org/doi/pdf/10.1063/5.0000853
141. Kurle, Y. and Xu, Q. (2015). Boil-Off Gas Minimization and Recovery Options at LNG Loading Terminals. Presentation given at the AIChE Spring Meeting and Global Congress on Process Safety, 28 April 2015. https://www.aiche.org/academy/videos/conference-presentations/boil-gas-minimization-and-recovery-options-lng-loading-terminals
142. Naji, S. Z., Abd, A. A. and Hashim, A. S. ‘Tracking boil off gas generation into liquefied natural gas supply chain using HYSYS simulator.’ In IOPC Conference Series: Materials Science and Engineering, 579 012019. https://iopscience.iop.org/article/10.1088/1757-899X/579/1/012019/pdf
143. Khan, M. S., Qyyum, M. A., Ali, W., Wazwaz, A., Ansari, K. B. and Lee, M. (2020) ‘Energy Saving through Efficient BOG Prediction and Impact of Static Boil-off-Rate in Full Containment-Type LNG Storage Tank.’ In Energies, Vol. 13, Issue 21, 5578. https://www.mdpi.com/1996-1073/13/21/5578/pdf
144. API (2020). Manual of Petroleum Measurement Standards, Chapter 8.6: Refrigerated Light Hydrocarbon Fluids — Sampling of Liquefied Natural Gas — Continuous and Intermittent Methods. 1st Edition, May 2020. This chapter outlines good procedural steps required to accurately measure LNG and convey this information along the supply chain. https://publications.api.org/publications-store.aspx
145. API (2014). Manual of Petroleum Measurement Standards, Chapter 17.1: Guidelines for Marine Inspection. 6th Edition, June 2014. This chapter outlines good procedural steps required to accurately measure LNG and convey this information along the supply chain. https://publications.api.org/publications-store.aspx
146. API (2013). Standard 620: Design and Construction of Large, Welded, Low-pressure Storage Tanks. 12th Edition, October 2013 (includes all amendments and changes through Addendum 2, April 2018). This standard covers the design and construction of large, welded, low-pressure carbon steel above-ground storage tanks (including flat-bottom tanks) that have a single vertical axis of revolution. https://www.api.org/products-and-services/standards
147. API (2010). Standard 625: Tank Systems for Refrigerated Liquefied Gas Storage. 1st Edition, August 2010 (includes all amendments and changes through Addendum 3, June 2018). This standard covers low pressure, above-ground, vertical and cylindrical tank systems storing liquefied gases requiring refrigeration. It provides general requirements on responsibilities, selection of storage concept, performance criteria, accessories/appurtenances, quality assurance, insulation and commissioning of tank systems. https://www.api.org/products-and-services/standards
148. Chaker, M., Meher-Homji, C. B., Pillai, P., Bhattacharya, D. and Messersmith, D. (2015). ‘Application of Boil Off Gas Compressors in Liquefied Natural Gas Plants.’ In Journal of Engineering for Gas Turbines and Power, Vol. 137. https://citeseerx.ist.psu.edu/viewdoc/download?doi=10.1.1.656.9391&rep=rep1&type=pdf
149. IGU (2018). Flexible LNG Facilities. IGU LNG Committee 2015-2018. International Gas Union. https://www.igu.org/resources/flexible-lng-facilities-2015-2018/
150. Sabram, T. M., Chen, F. and Dunn, J. P. (2019). Less Is More: Flare Minimization During Cooldown. Paper presented at the 19th International Conference & Exhibition on LNG, Shanghai, 1–5 April 2019. https://www.gti.energy/wp-content/uploads/2019/10/153-LNG19-03April2019-Sabram-Ted-paper.pdf
References

158 — Flaring management guidelines
References
151. Heddin, A. (2019). ‘How Methane Emissions May Be Tracked Via Satellite in Space.’ Carlsbad Current-Argus; published on the GT (Government Technology) website on 9 October 2009. https://www.govtech.com/products/How-Methane-Emissions-May-Be-Tracked-Via-Satellite-in-Space.html
152. Teledyne FLIR (2021). ‘Thermal Imaging Cameras for Flare Monitoring’ (website). https://www.flir.com/discover/instruments/gas-detection/thermal-imaging-cameras-for-flare-monitoring/
153. Jeffery, K. (2018). ‘Quantifying Methane Leaks and Flares from Gas Wells and Facilities.’ Finding Petroleum Special Report, 13 November 2018. http://83a7383a5e33475eed0e-e819cda5edf0a946af164bb0b2f2ae3c.r0.cf1.rackcdn.com/FPmethNov18.pdf
154. Extrel CMS, LLC (2021). ‘Monitoring Refinery Flare Emission with Single-Analyzer Solution’ (website). https://www.azom.com/article.aspx?ArticleID=12907
155. UNDP (2009). Supporting Capacity Development. The UNDP Approach. United Nations Development Programme, Bureau for Development Policy, Capacity Development Group. http://www.undp.org/content/dam/aplaws/publication/en/publications/capacity-development/support-capacity-development-the-undp-approach/CDG_Brochure_2009.pdf
156. UNDP (2009). Capacity Development: A UNDP Primer. United Nations Development Programme, Bureau for Development Policy, Capacity Development Group. https://www.adaptation-undp.org/resources/relevant-reports-and-publications/capacity-development-undp-primer#:~:text=It%20provides%20a%20simple%2C%20cogent,to%20national%20capacities%20for%20development
157. UNDP (2008). Capacity Development Practice Note. United Nations Development Programme, Bureau for Development Policy, Capacity Development Group. Ed.: Kanni Wignaraja. http://content-ext.undp.org/aplaws_publications/1449053/PN_Capacity_Development.pdf
158. GGFR (2004). Regulation of Associated Gas Flaring and Venting - A Global Overview and Lessons from International Experience. Global Gas Flaring Reduction Partnership. Report Number 3. World Bank Group. http://documents1.worldbank.org/curated/en/590561468765565919/pdf/295540Regulati1aring0no10301public1.pdf
159. GGFR (2009). Guidance on Upstream Flaring and Venting. Policy and Regulation. Global Gas Flaring Reduction Partnership. https://documents.worldbank.org/en/publication/documents-reports/documentdetail/200701468344636937/guidance-on-upstream-flaring-and-venting-policy-and-regulation
160. EIA (2019). ‘Natural gas venting and flaring in North Dakota and Texas increased in 2019.’ Article published on the US Energy Information Agency website on 8 December 2020. https://www.eia.gov/todayinenergy/detail.php?id=46176
161. US EPA (2021). ‘Actions and Notices about Oil and Natural Gas Air Pollution Standards’ (website). https://www.epa.gov/controlling-air-pollution-oil-and-natural-gas-industry/actions-and-notices-about-oil-and-natural-gas
162. U.S. Department of Interior, Bureau of Land Management. ‘Methane and Waste Prevention Rule’ (website). https://www.blm.gov/programs/energy-and-minerals/oil-and-gas/operations-and-production/methane-and-waste-prevention-rule
163. US EPA (2021). ‘Natural Gas STAR Program - Benefits.’ United States Environmental Protection Agency website. https://www.epa.gov/natural-gas-star-program/natural-gas-star-program
164. US EPA (2021). ‘Natural Gas STAR Program Accomplishments.’ United States Environmental Protection Agency website. https://edap.epa.gov/public/extensions/NGS/Accomplishments.html
165. Natural Gas STAR Program (2011). Install Electronic Flare Ignition Devices. Partner Reported Opportunities (PRO) Fact Sheet No. 903. United States Environmental Protection Agency. https://www.epa.gov/natural-gas-star-program/install-electronic-flare-ignition-devices

159 — Flaring management guidelines
166. GGFR (2004). Regulation of Associated Gas Flaring and Venting - A Global Overview and Lessons from International Experience. Global Gas Flaring Reduction Partnership. Report Number 3. World Bank Group. http://documents1.worldbank.org/curated/en/590561468765565919/pdf/295540Regulati1aring0no10301public1.pdf
167. AER (2020). Directive 060: Upstream Petroleum Industry Flaring, Incinerating, and Venting. Alberta Energy Regulator, 7 July 2020. https://static.aer.ca/prd/2020-10/Directive060.pdf
168. UK Oil & Gas Authority, (2021). ‘Flaring and venting’ (website). https://www.ogauthority.co.uk/licensing-consents/consents/flaring-and-venting/
169. Unearthed (2021) ‘Revealed: The North Sea oil giants fueling climate change with millions of tonnes in preventable emissions.’ Article by Lawrence Carter published on the Unearthed (Greenpeace) website on 1 February 2021. https://unearthed.greenpeace.org/2021/02/01/north-sea-oil-flaring-climate-change/
170. UK Oil & Gas Authority (2021). ‘UKCS Flaring and Venting 2020 Report’ (website). https://ogauthorityreports.wixsite.com/ukcs-f-v-report-2020
171. GGFR (2004). Regulation of Associated Gas Flaring and Venting - A Global Overview and Lessons from International Experience. Global Gas Flaring Reduction Partnership. Report Number 3. World Bank Group. http://documents1.worldbank.org/curated/en/590561468765565919/pdf/295540Regulati1aring0no10301public1.pdf
172. Helgesen, O. K. (2021). Norway oil sector braced for huge carbon tax hike as new climate plan hatched. Article published on the Upstream Energy Explored website on 8 January 2021. https://www.upstreamonline.com/environment/norway-oil-sector-braced-for-huge-carbon-tax-hike-as-new-climate-plan-hatched/2-1-941509
173. Viscidi, L., Phillips, S., Carvajal, P. and Sucre, C. (2020). Latin American State oil Companies and Climate Change. Decarbonization Strategies and Role in the Energy Transition. Published by The Dialogue and the Inter-American Development Bank. https://www.thedialogue.org/wp-content/uploads/2020/05/Latin-American-State-Oil-Companies-and-Climate-Change.pdf
174. NGFCP (2021). ‘Harnessing Nigeria’s flare gas for sustainable value & wealth creation’ (website). Nigerian Gas Flare Commercialisation Programme, Department of Petroleum Resources. https://ngfcp.dpr.gov.ng/
175. IEA (2020). ‘Flare Gas (Prevention of Waste and Pollution) Regulations 2018’ (website). International Energy Agency. https://www.iea.org/policies/8675-flare-gas-prevention-of-waste-and-pollution-regulations-2018
176. NGFCP (2021). ‘Harnessing Nigeria’s flare gas for sustainable value & wealth creation’ (website). Nigerian Gas Flare Commercialisation Programme, Department of Petroleum Resources. https://ngfcp.dpr.gov.ng/
177. Toledano, P. et al. (2017). Algeria Associated Gas Utilization Study. Columbia Center on Sustainable Investment. https://ccsi.columbia.edu/sites/default/files/content/docs/our%20focus/Algeria.pdf
178. CLN (2019). Study on Possible Reduction of Gas Flaring in Algeria. Report prepared by Carbon Limits (Nigeria) for the Federal Institute for Geosciences and Natural Resources (BGR). https://rue.bmz.de/en/releases/publications_new/topics/climate_environment_energy/BGR-Study_GasFlaring_Algeria.pdf
179. Toledano, P. et al. (2017). Algeria Associated Gas Utilization Study. Columbia Center on Sustainable Investment. https://ccsi.columbia.edu/sites/default/files/content/docs/our%20focus/Algeria.pdf
180. Chevron Australia Pty Ltd (2015). Gorgon Gas Development and Jansz Feed Gas Pipeline: Best Practice Pollution Control Design Report. https://australia.chevron.com/-/media/australia/our-businesses/documents/gorgon-emp-best-practice-pollution-control-design-report.pdf
References

160 — Flaring management guidelines
181. GGFR (2004). Regulation of Associated Gas Flaring and Venting - A Global Overview and Lessons from International Experience. Global Gas Flaring Reduction Partnership. Report Number 3. World Bank Group. http://documents1.worldbank.org/curated/en/590561468765565919/pdf/295540Regulati1aring0no10301public1.pdf
182. Federal Government of Nigeria (2019). Nigerian Gas Flare Commercialisation Programme. Programme Information Memorandum. January 2019, Rev. 1. https://ngfcp.dpr.gov.ng/resources/programme-information-memorandum
183. Adesina, E. et al. 2017. Understanding Natural Gas and LNG Options. Report prepared for, and updated by, the U.S. Department of Energy, Office of International Affairs. https://www.energy.gov/sites/prod/files/2017/11/f46/Understanding%20Natural%20Gas%20and%20Lng%20Options%20October%2011%202017_1.pdf
184. Derefaka, J. O. (2019). Climate Change Impact and The Role of Harnessing Nigeria’s Flare Gas in the Energy Mix Transition for Economic Development – Prospects & Opportunities. Presentation on behalf of the Nigerian Gas Flare Commercialisation Programme, Ministry of Petroleum Resources, at the Society of Petroleum Engineers (SPE) Oloibiri Lecture Series and Energy Forum, 25 April 2019. https://higherlogicdownload.s3.amazonaws.com/SPE/4e9ea2fc-118c-40ea-b32d-838dd330b863/UploadedImages/YEAR_2019/Final_SPE-NGFCP_Presentation_-_SPE_OLEF_2019_updated.pdf
185. Canilao, C. (2017). Bankability: More than de-risking projects. Article published on the World Bank Blogs website on 22 August 2017. https://blogs.worldbank.org/ppps/bankability-more-de-risking-projects
186. Rana, F. (2017). Preparing bankable infrastructure projects. Article published on the World Bank Blogs website on 26 September 2017. https://blogs.worldbank.org/ppps/preparing-bankable-infrastructure-projects
187. CPI (2019). Global Landscape of Climate Finance 2019. Climate Policy Initiative. https://www.climatepolicyinitiative.org/publication/global-landscape-of-climate-finance-2019
188 Global Infrastructure Facility (2015). Global Infrastructure Facility. A partnership platform for greater investment in the infrastructure of emerging markets and developing economies. http://pubdocs.worldbank.org/en/339111429200383235/GIF-BriefingNote.pdf
189. Meltzer, J. P. (2018). Blending Climate Funds to Finance Low-Carbon, Climate-Resilient Infrastructure. Global Economy & Development Working Paper 120. Brookings Institution. https://www.brookings.edu/wp-content/uploads/2018/06/Climate-Finance_Working-Paper.pdf
190. MDB-IDFC (2015). Common Principles for Climate Mitigation Finance Tracking. A voluntary joint initiative of the Multilateral Development Banks’ Climate Finance Tracking Working Group and the International Development Finance Club (IDFC). http://www.worldbank.org/content/dam/Worldbank/document/Climate/common-principles-for-climate-mitigation-finance-tracking.pdf
191. Watson, C. and Schalatek, L. (2020). Climate Finance Thematic Briefing: Mitigation Finance. Overseas Development Institute and Heinrich Böll Stiftung. https://climatefundsupdate.org/wp-content/uploads/2020/03/CFF4-2019-ENG-DIGITAL.pdf
192. Convergence (2021). ‘Blended Finance’ (website). https://www.convergence.finance/blended-finance
193. PetroWiki (2021). ‘PEH: Monetizing Stranded Gas’ (website). https://petrowiki.spe.org/PEH:Monetizing_Stranded_Gas
194. Clews, R. J. (2016). ‘Risk Analysis and Bankability for Oil and Gas Projects.’ In Project Finance for the International Petroleum Industry. https://www.researchgate.net/publication/301345174_Risk_Analysis_and_Bankability_for_Oil_and_Gas_Projects
References

161 — Flaring management guidelines
195. Baker McKenzie (2019). ‘Key Considerations in the Assessment of Project Bankability in Africa’ (website). https://www.lexology.com/library/detail.aspx?g=f65c6eb1-1fde-420d-a97e-51b002a68ae5
196. Szczetnikowicz, S. et al. (2018). Financing options in the oil and gas industry. Practical Law UK Practice Note w-007-9168. Milbank; Tweed, Hadley & McCloy LLP; Thomson Reuters Practical Law (Finance). https://www.milbank.com/images/content/9/7/v2/97930/Financing-options-in-the-oil-and-gas-industry.pdf
197. Kaminskaite-Salters, G. (2009). ‘Section 4 – Spending public finance to leverage private investment: specific instruments for specific challenges.’ In Meeting the Climate Challenge: Using Public Funds to Leverage Private Investment in Developing Countries. Grantham Institute for Climate Change and the Environment at the London School of Economics and Political Science. https://www.lse.ac.uk/granthaminstitute/publication/meeting-the-climate-challenge-using-public-funds-to-leverage-private-investment-in-developing-countries/
198. Clearstone Engineering Ltd. (2020). Best Practices for Catalysing Co-investment and Capacity-building. Report prepared for the Climate & Clean Air Coalition (CCAC) in relation to the CCAC technology demonstration project ‘Financing and Measuring Black Carbon Emission Reduction in the Oil and Gas Sector.’ https://ccacoalition.org/en/resources/best-practices-catalysing-co-investment-and-capacity-building-black-carbon-reduction
199. UNFCCC (2021). CDM Project Search (Use the ‘Advanced Search’ feature with the ‘Methodologies’ field set to ‘AM0009’). https://cdm.unfccc.int/Projects/projsearch.html
200. Michelussi, T. (2006). Best Management Practices for Facility Flare Reduction. Canadian Association of Petroleum Producers. http://docshare01.docshare.tips/files/20511/205115851.pdf
201. UNDP (2008). Capacity Development Practice Note. United Nations Development Programme, Bureau for Development Policy, Capacity Development Group. Ed.: Kanni Wignaraja. http://content-ext.undp.org/aplaws_publications/1449053/PN_Capacity_Development.pdf
202. European Commission (2021). ‘Fuel Quality’ (website). https://ec.europa.eu/clima/policies/transport/fuel_en
203. Council of the European Union (2015). ‘Council Directive (EU) 2015/652 of 20 April 2015, laying down calculation methods and reporting requirements pursuant to Directive 98/70/EC of the European Parliament and of the Council relating to the quality of petrol and diesel fuels.’ In Official Journal of the European Union, L 107/26. https://eur-lex.europa.eu/eli/dir/2015/652/oj/eng/pdfa1a
204. Council of the European Union (2015). ‘Council Directive (EU) 2015/1513 of 9 September 2015, amending Directive 98/70/EC relating to the quality of petrol and diesel fuels and amending Directive 2009/28/EC on the promotion of the use of energy from renewable sources.’ In Official Journal of the European Union, L 239/1. https://eur-lex.europa.eu/legal-content/EN/TXT/?uri=celex%3A32015L1513
205. Lonza, L., Deix, S., Maas, H., Caiado, C., Hamje, H. D. C. and Reid, A. (2016). EU renewable energy targets in 2020: 2015 Legislative update. Technical Report 2016, EUR 28170 EN. https://www.concawe.eu/wp-content/uploads/2017/03/jrc103306_103306_20161220_jec_ biofuels_study_pubsy.pdf
References

© IPIECA-IOGP-GGFR 2021 All rights reserved.
IPIECA 14th Floor, City Tower 40 Basinghall Street London EC2V 5DE United Kingdom
Tel: +44 (0)20 7633 2388 E-mail: [email protected] Website: www.ipieca.org
IPIECA
@IPIECA
IOGP 14th Floor, City Tower 40 Basinghall Street London EC2V 5DE United Kingdom
Tel: +44 (0)20 3763 9700 E-mail: [email protected] Website: www.iogp.org
IOGP
@IOGP_News
The International Association of Oil & Gas Producers (IOGP) is the global voice of our industry, pioneering excellence in safe, efficient and sustainable energy supply — an enabling partner for a low-carbon future. Our Members operate around the globe, producing over 40% of the world’s oil and gas. Together, we identify and share knowledge and good practices to improve the industry in areas such as health, safety, the environment and efficiency.
The World Bank’s Global Gas Flaring Reduction Partnership (GGFR) is a trust fund composed of governments, oil companies, and multilateral organizations committed to ending routine gas flaring and venting at oil production sites across the world. The Partnership helps identify solutions to the array of technical, financial, and regulatory barriers to flaring and venting reduction by developing country-specific flaring reduction programs, conducting research, sharing best practices, raising awareness, securing commitments to end routine flaring through the ‘Zero Routine Flaring by 2030’ global initiative, and advancing flare measurements and reporting.
��������������� ��������������������
IPIECA is the global oil and gas industry association for advancing environmental and social performance. It convenes a significant portion of the oil and gas value chain and brings together the expertise of members and stakeholders to provide leadership for the industry on advancing climate action, environmental responsibility, social performance and mainstreaming sustainability.
Founded at the request of the UN Environment Programme in 1974, IPIECA remains the industry’s principal channel of engagement with the UN. Its unique position enables its members to support the energy transition and contribute to sustainable development.
The World Bank Group 1818 H Street NW Washington, DC 20433 USA
E-mail: [email protected] Website: www.worldbank.org/ggfr
@WBG_Energy