NATIONAL GUIDANCE FOR PLASTIC POLLUTION ...
82
NATIONAL GUIDANCE FOR PLASTIC POLLUTION HOTSPOTTING AND SHAPING ACTION FINAL REPORT FOR MENORCA December 2020 Implemented with Funded by the Didier et Martine Primat Foundation
-
Upload
khangminh22 -
Category
Documents
-
view
2 -
download
0
Transcript of NATIONAL GUIDANCE FOR PLASTIC POLLUTION ...
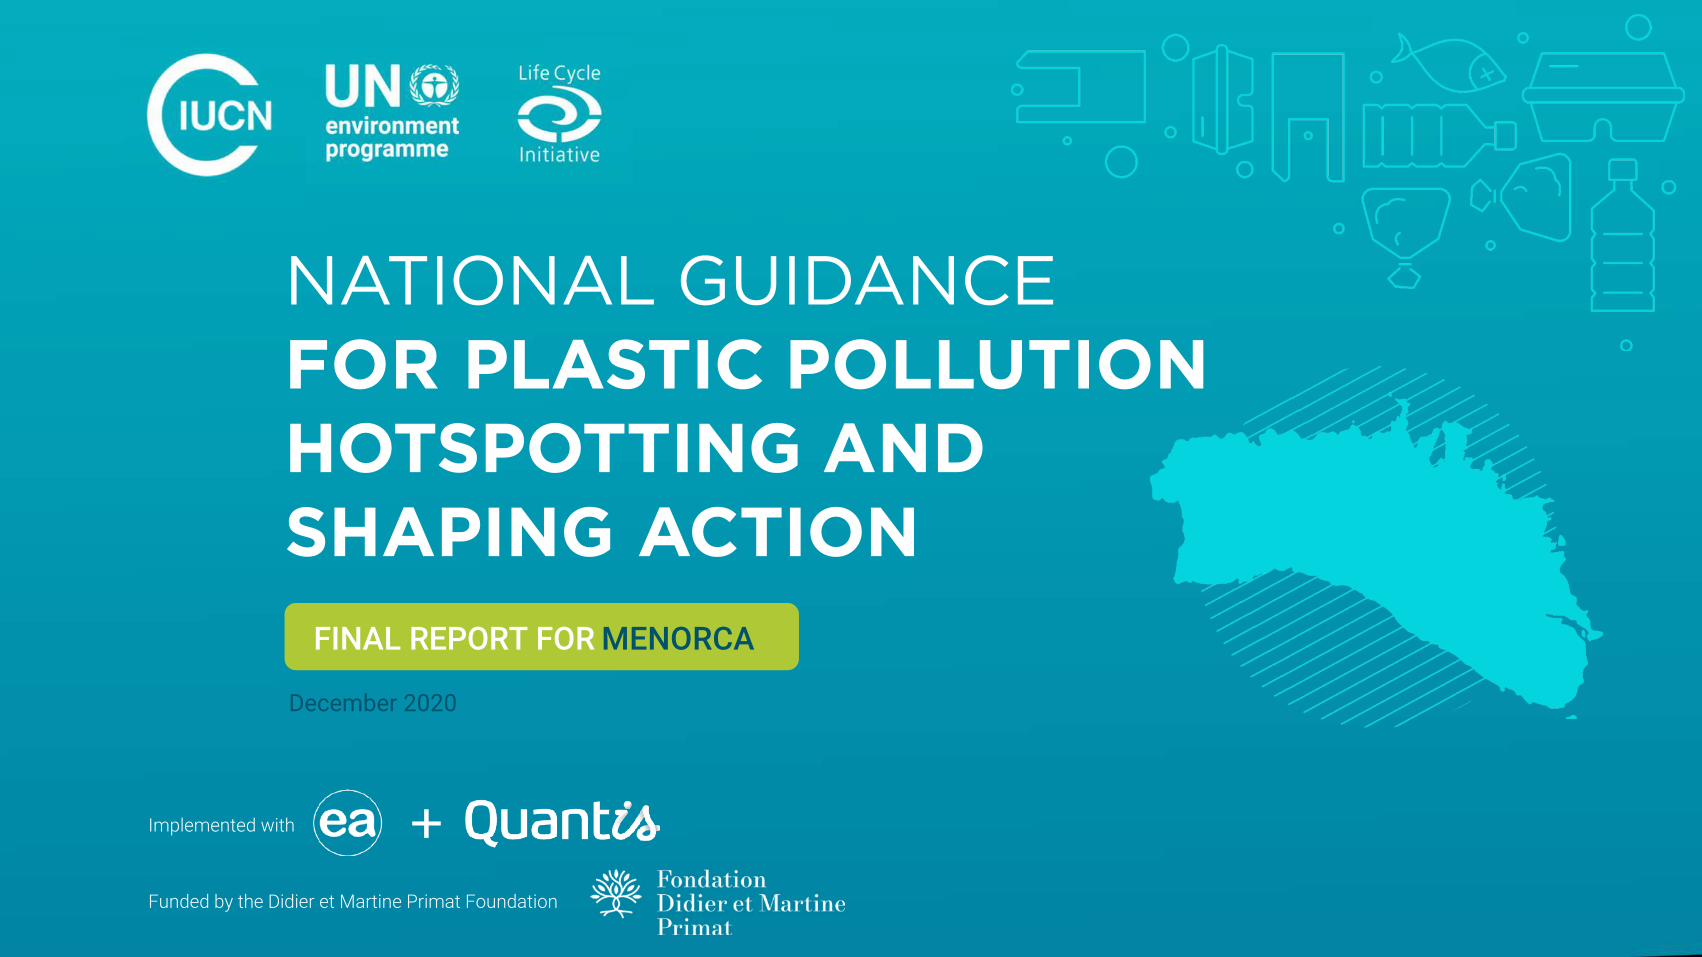
NATIONAL GUIDANCE FOR PLASTIC POLLUTION HOTSPOTTING AND SHAPING ACTION
FINAL REPORT FOR MENORCA
December 2020
Implemented with
Funded by the Didier et Martine Primat Foundation
Plastic pollution hotspots: Menorca 2
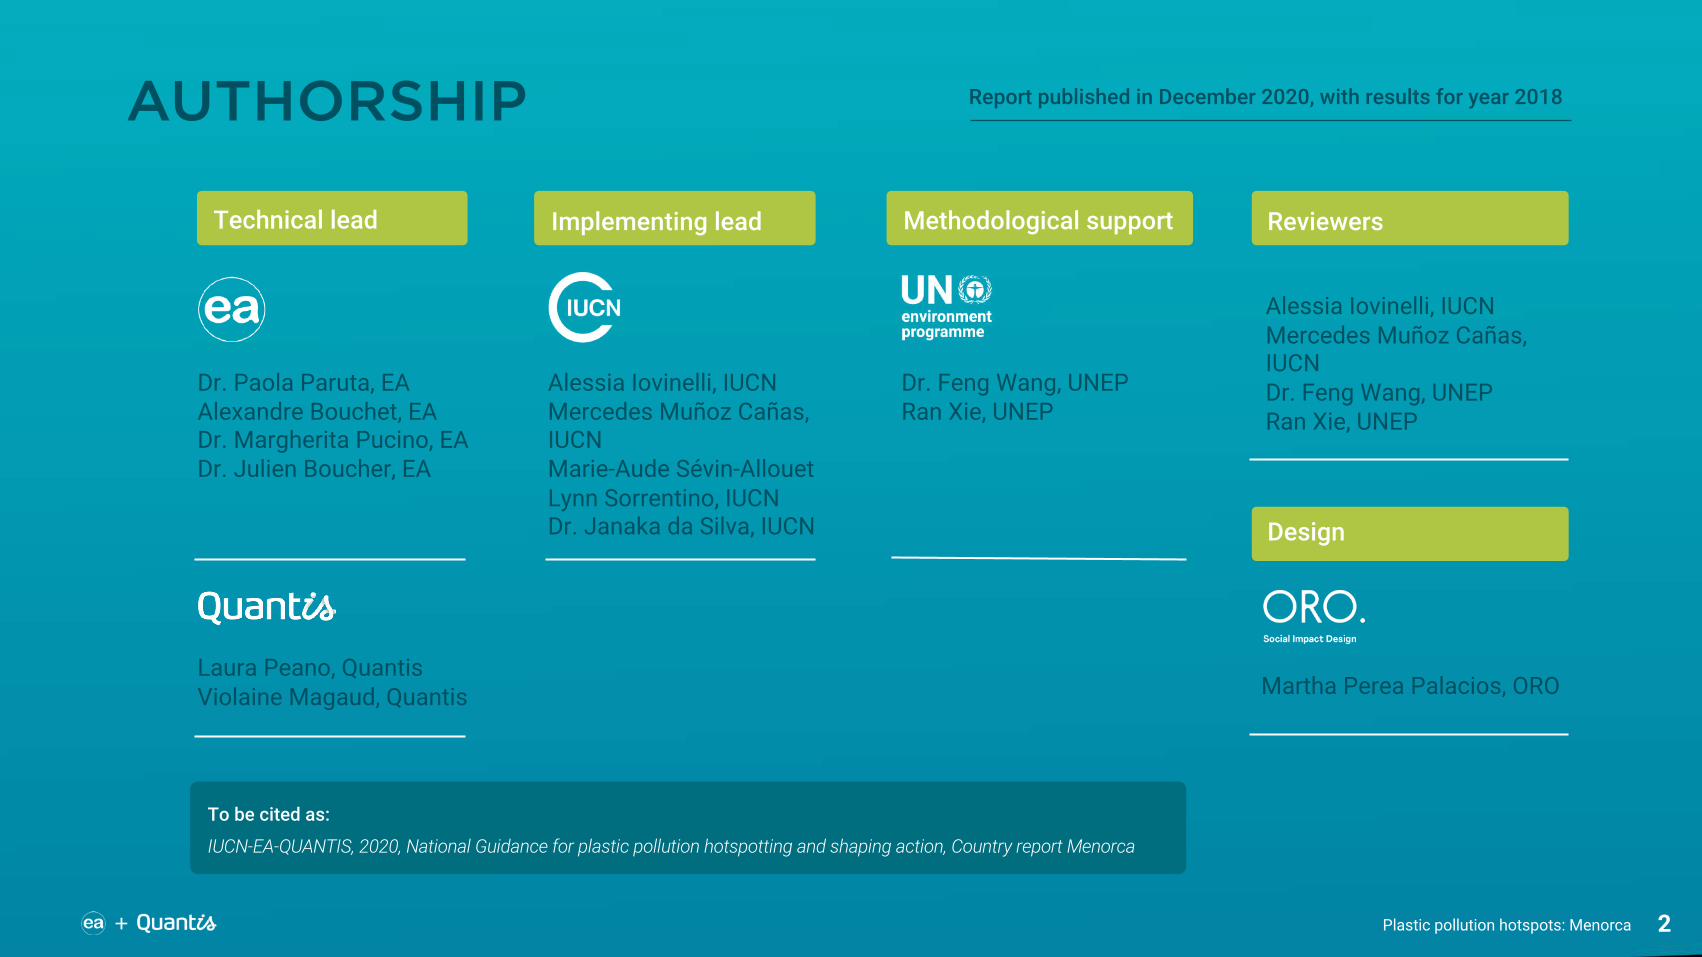
Report published in December 2020, with results for year 2018AUTHORSHIP
Dr. Paola Paruta, EAAlexandre Bouchet, EADr. Margherita Pucino, EA Dr. Julien Boucher, EA
Laura Peano, Quantis Violaine Magaud, Quantis
Alessia Iovinelli, IUCNMercedes Muñoz Cañas, IUCNMarie-Aude Sévin-AllouetLynn Sorrentino, IUCNDr. Janaka da Silva, IUCN
Dr. Feng Wang, UNEPRan Xie, UNEP
Alessia Iovinelli, IUCNMercedes Muñoz Cañas, IUCNDr. Feng Wang, UNEPRan Xie, UNEP
Martha Perea Palacios, ORO
Implementing lead Methodological support ReviewersTechnical lead
Design
To be cited as:
IUCN-EA-QUANTIS, 2020, National Guidance for plastic pollution hotspotting and shaping action, Country report Menorca

Plastic pollution hotspots: Menorca 3
ABOUT
IUCN is a membership Union uniquely composed of both government and civil society organisations. It provides public, private and non-governmental organisations with the knowledge and tools that enable human progress, economic development and nature conservation to take place together. Created in 1948, IUCN is now the world’s largest and most diverse environmental network, harnessing the knowledge, resources and reach of 1,400 Member organisations and some 15,000 experts. It is a leading provider of conservation data, assessments and analysis. Its broad membership enables IUCN to fill the role of incubator and trusted repository of best practices, tools and international standards. IUCN provides a neutral space in which diverse stakeholders including governments, NGOs, scientists, businesses, local communities, indigenous peoples’ organisations and others can work together to forge and implement solutions to environmental challenges and achieve sustainable development. Working with many partners and supporters, IUCN implements a large and diverse portfolio of conservation projects worldwide. Combining the latest science with the traditional knowledge of local communities, these projects work to reverse habitat loss, restore ecosystems and improve people’s well-being.
The IUCN Centre for Mediterranean Cooperation (IUCN-Med) opened in Malaga (Spain) in October 2001 with the core support of the Spanish Ministry of Environment and the regional Government of Junta de Andalucía. The Centre’s mission is to influence, encourage and assist Mediterranean societies to conserve and use sustainably the natural resources of the region and work with IUCN members and cooperate with all other agencies that share the objectives of IUCN. www.iucn.org/regions/mediterranean
EA is a research consultancy based in Switzerland, member of the European Network of Ecodesign Centres (ENEC). EA has developed a unique expertise in the field of marine plastic pollution and plastic footprinting. - www.e-a.earth
Quantis is a leading sustainability consulting firm specialized in supporting companies to measure, understand and manage the environmental impacts of their products, services and operations - www.quantis-intl.com
Plastic pollution hotspots: Menorca 4
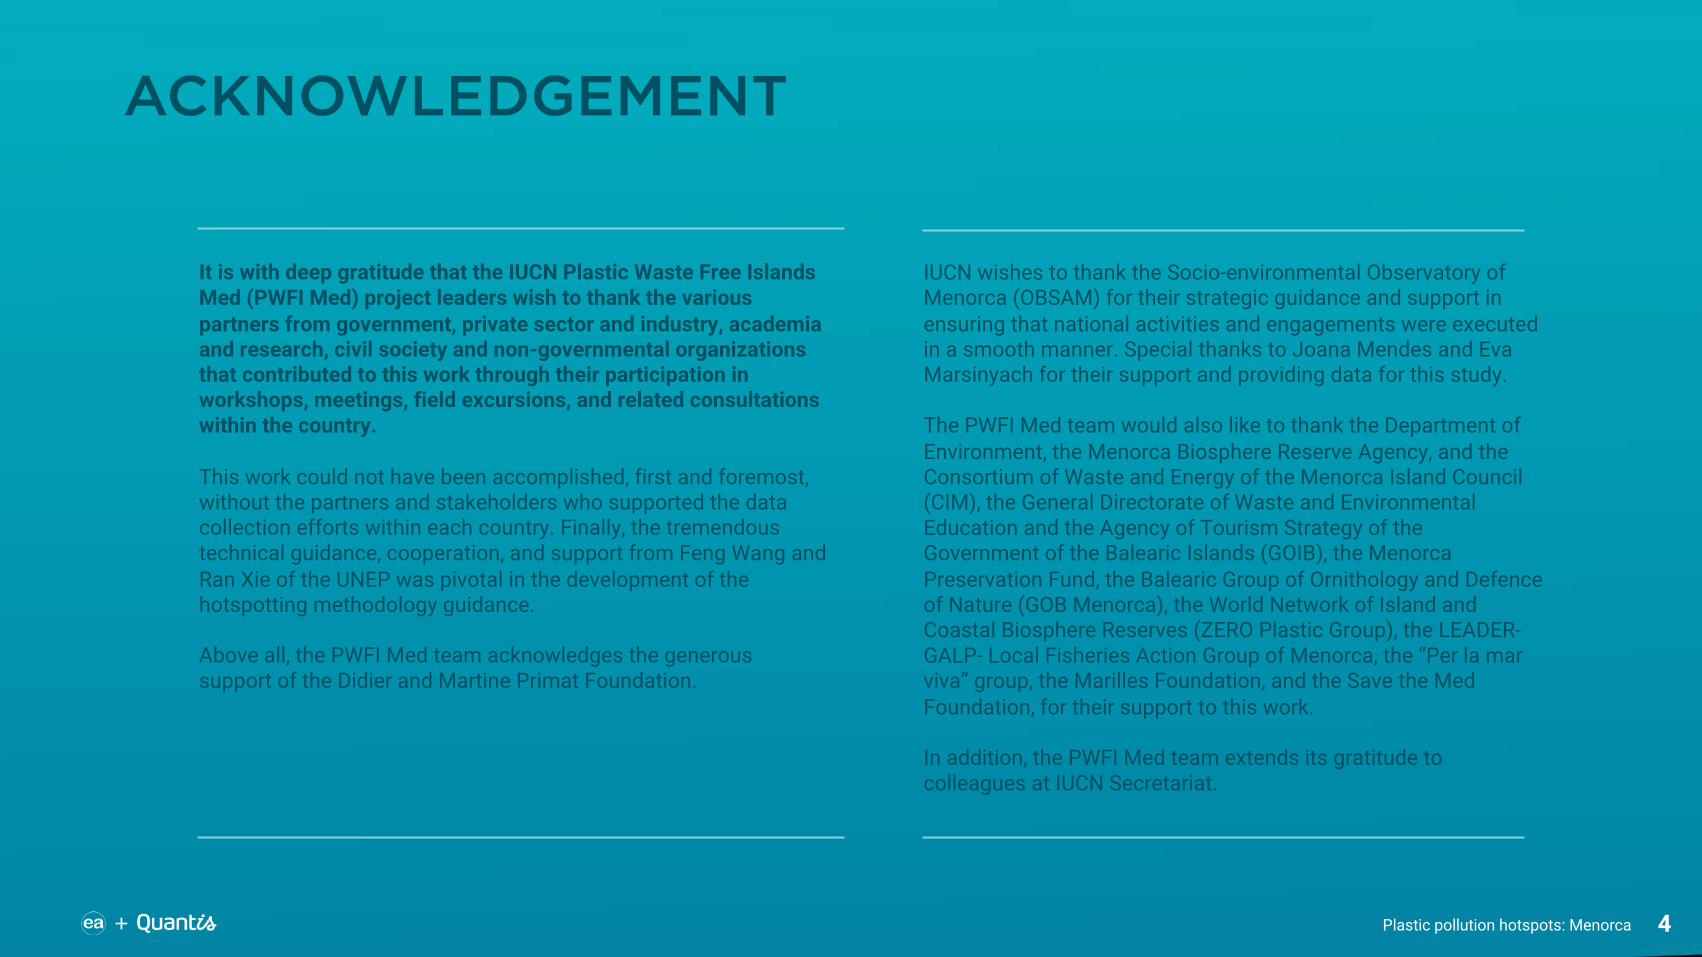
ACKNOWLEDGEMENT
It is with deep gratitude that the IUCN Plastic Waste Free Islands Med (PWFI Med) project leaders wish to thank the various partners from government, private sector and industry, academia and research, civil society and non-governmental organizations that contributed to this work through their participation in workshops, meetings, field excursions, and related consultations within the country.
This work could not have been accomplished, first and foremost, without the partners and stakeholders who supported the data collection efforts within each country. Finally, the tremendous technical guidance, cooperation, and support from Feng Wang and Ran Xie of the UNEP was pivotal in the development of the hotspotting methodology guidance.
Above all, the PWFI Med team acknowledges the generous support of the Didier and Martine Primat Foundation.
IUCN wishes to thank the Socio-environmental Observatory of Menorca (OBSAM) for their strategic guidance and support in ensuring that national activities and engagements were executed in a smooth manner. Special thanks to Joana Mendes and Eva Marsinyach for their support and providing data for this study.
The PWFI Med team would also like to thank the Department of Environment, the Menorca Biosphere Reserve Agency, and the Consortium of Waste and Energy of the Menorca Island Council (CIM), the General Directorate of Waste and Environmental Education and the Agency of Tourism Strategy of the Government of the Balearic Islands (GOIB), the Menorca Preservation Fund, the Balearic Group of Ornithology and Defence of Nature (GOB Menorca), the World Network of Island and Coastal Biosphere Reserves (ZERO Plastic Group), the LEADER-GALP- Local Fisheries Action Group of Menorca, the “Per la mar viva” group, the Marilles Foundation, and the Save the Med Foundation, for their support to this work.
In addition, the PWFI Med team extends its gratitude to colleagues at IUCN Secretariat.
Plastic pollution hotspots: Menorca 5
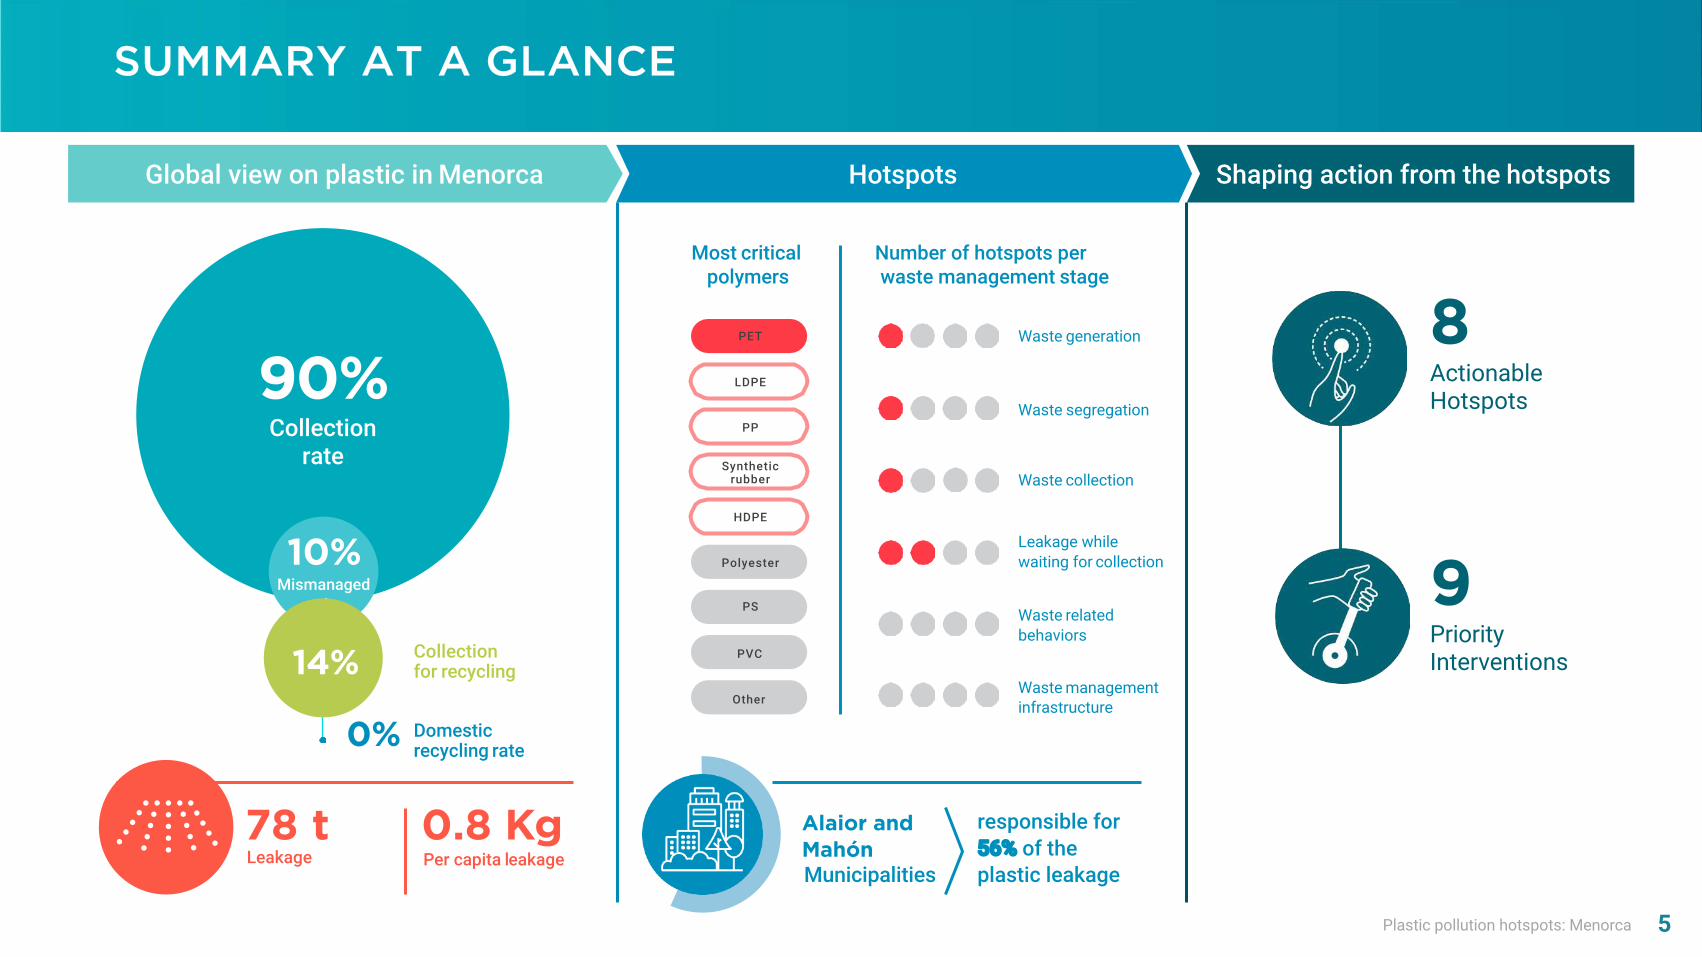
SUMMARY AT A GLANCE
Collection for recycling
Leakage78 t 0.8 Kg Alaior and
Mahón Municipalities
responsible for 56% of theplastic leakage
Per capita leakage
8ActionableHotspots
9PriorityInterventions
90%Collection
rate
10%Mismanaged
rate
Global view on plastic in Menorca Hotspots Shaping action from the hotspots
Domestic recycling rate0%
PP
LDPE
PET
HDPE
Polyester
PVC
Other
Most critical polymers
Number of hotspots perwaste management stage
Waste generation
Waste segregation
Waste collection
Leakage while waiting for collection
Waste related behaviors
Waste management infrastructure
PS
Synthetic rubber
14%

Plastic pollution hotspots: Menorca 6
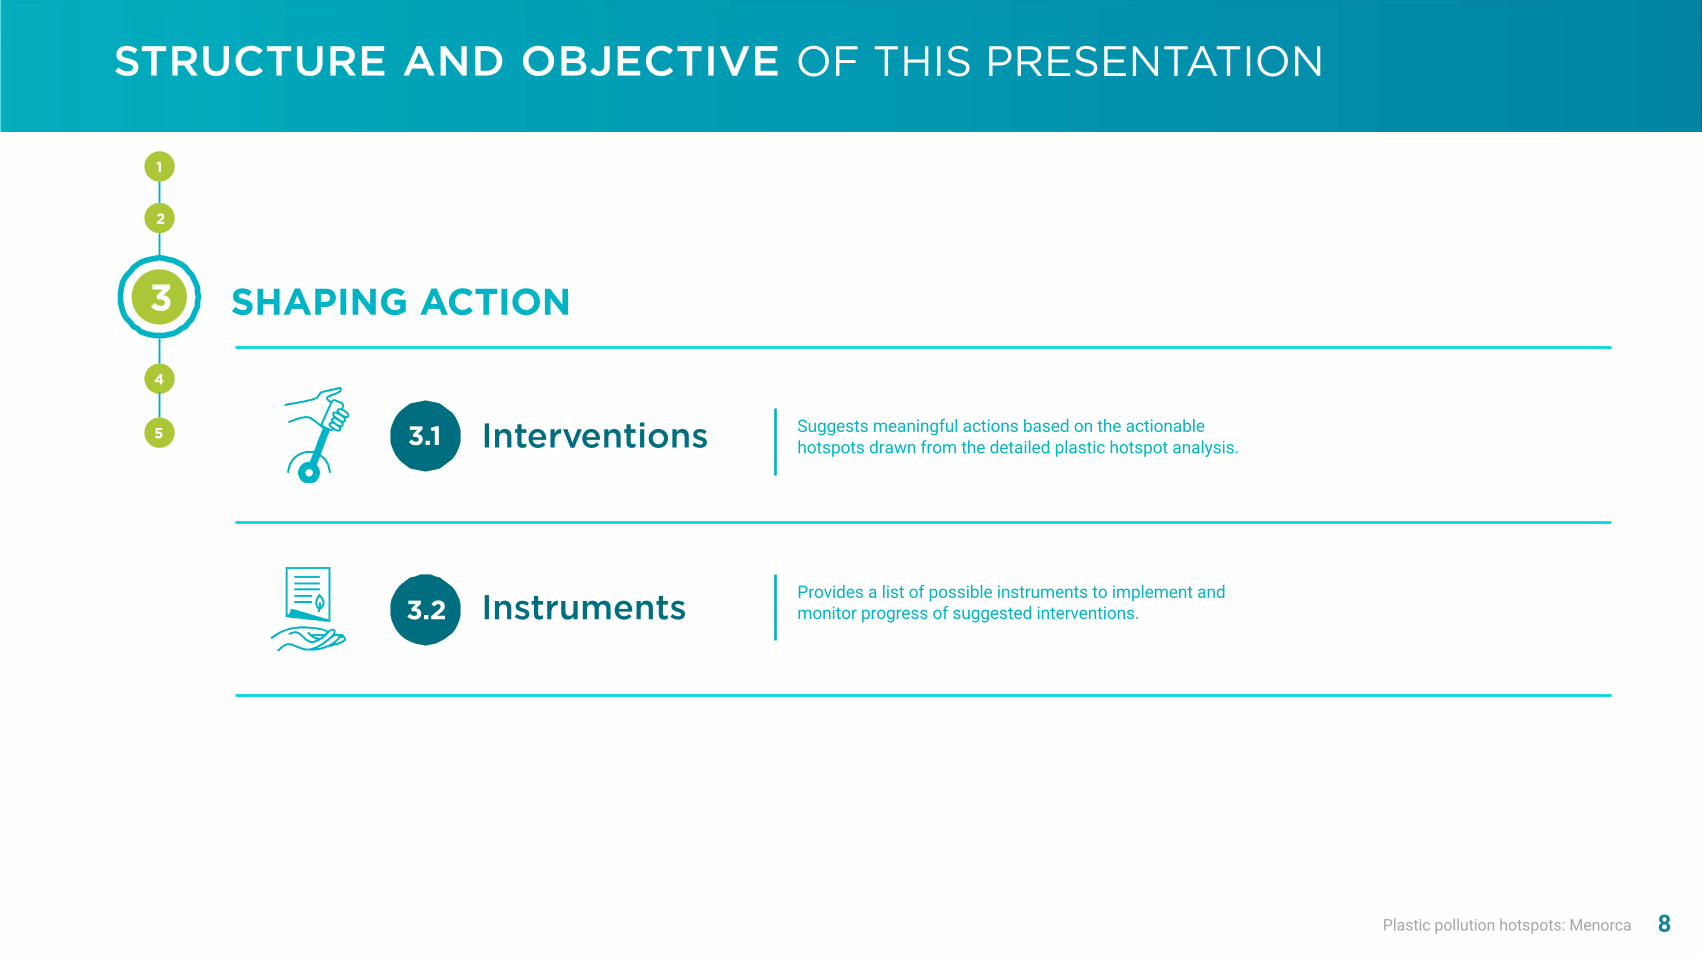
STRUCTURE AND OBJECTIVE OF THIS PRESENTATION
1
2
3
4
INTRODUCTION TO THE GUIDANCE
PLASTIC POLLUTION HOTSPOTS
SHAPING ACTION
APPENDICES
Provides the objectives of the Guidance, and introduces its associated workflow and main deliverables.
Provides a detailed assessment of plastic leakage across five distinct yet complementary hotspots categories and draws clear statements to help shape action.
Provides a preliminary set of possible interventions and instruments in line with the plastic pollution hotspots results.
Provides additional information including results data tables, hotspot score assessments and modelling assumptions.
BIBLIOGRAPHY5

Plastic pollution hotspots: Menorca 7
STRUCTURE AND OBJECTIVE OF THIS PRESENTATION
PLASTIC POLLUTION HOTSPOTS
A. Polymer Hotspots
D. Regional Hotspots
E. Waste Management Hotspots
B. Application Hotspots
C. Sector Hotspots
Country Overview2.1
2.2 Detailed Hotspots Results
2.3 Actionable Hotspots
Provides an outlook of the leakage assessment at the country level.
Provides a visual analysis and key interpretations across five complementary categories in which hotspots are prioritised based on a plastic leakage assessment.
Formulates clear statements based on the detailed hotspot analysis to help shape action towards plastic leakage abatement.
1
3
4
2
5
Plastic pollution hotspots: Menorca 8
STRUCTURE AND OBJECTIVE OF THIS PRESENTATION
Interventions3.1
3.2 Instruments
SHAPING ACTION
Suggests meaningful actions based on the actionable hotspots drawn from the detailed plastic hotspot analysis.
Provides a list of possible instruments to implement and monitor progress of suggested interventions.
1
4
3
2
5
Plastic pollution hotspots: Menorca 9
STRUCTURE AND OBJECTIVE OF THIS PRESENTATION
Data repository
4.1
Data Quality Assessment
APPENDICES
Provides data tables with the detailed figures behind the graphs.
Provides an in-depth analysis of the quality scores behind the graphs.
2
4
3
4.2
5 BIBLIOGRAPHY
1

Plastic pollution hotspots: Menorca 10
ICONS AND COLOUR CODE TO GUIDE THE READER
Learnings, that complement the key take aways with more details, of information that is not necessarily visible on the graph
Limitations of the study, can be inaccurate data or gap in the modelling
Things we foresee to unlock the limitations. They can serve as guidance for future studies
Methodology and appendices
Sections slides
Results and interpretations
Reference to the methodology (module/tool)
Reference to the appendices
Key take away as the main conclusion of a graph or result in a writen format

Plastic pollution hotspots: Menorca 11
KEY DEFINITIONS
Hotspots: They refer to the most relevant plastic polymers, applications, industrial sectors, regions or waste management stages causing the leakage of plastics into the environment (including land, air, water and marine environment), as well as associated impacts, through the life cycle of plastic products.
Interventions: They are tangible actions that can be taken to mitigate hotspots and are to be prioritised and designed to address the most influential hotspots in the plastic value chain.
Instruments: They are the ways an intervention may be practically implemented through specific regulatory, financial or informative measures, in light of context factors such as country dynamics and existing measures. As an illustrative example, a country may identify “mismanaged polyethylene bottles” as one of its hotspots. A relevant intervention may be an increase in bottle collection rate. A relevant instrument may be to instate a bottle return deposit scheme.
Properly disposed: Waste fraction that is disposed in a waste management system where no leakage is expected to occur, such as an incineration facility or a sanitary landfill. We define a sanitary landfill as a particular area where large quantities of waste are deliberately disposed in a controlled manner (e.g., waste being covered on a daily basis, as well as the bottom of the landfill designed in a way to prevent waste from leaching out). Landfilling is mainly the result of a formal collection sector.
Improperly disposed: Waste fraction that is disposed in a waste management system where leakage is expected to occur, such as a dumpsite or an unsanitary landfill. A dumpsite is a particular area where large quantities of waste are deliberately disposed in an uncontrolled manner, and can be the result of both the formal and informal sectors. A landfill is considered as unsanitary when waste management quality standards are not met, thus entailing a potential for leakage.
Littering: Incorrect disposal of small, one-off items, such as: throwing a cigarette, dropping a crisp packet, or a drink cup. Most of the time these items end-up on the road or side-ways. They may or may not be collected by municipal street cleaning.
Uncollected: Waste fraction (including littering) that is not collected by the formal sector.
Domestic waste: Waste generated within the country.
For additional definitions, please refer to the publication: United Nations Environment Programme (2020). National guidance for plastic pollution hotspotting and shaping action - Introductionreport. Boucher J.,; M. Zgola, et al. United Nations Environment Programme. Nairobi, Kenya. Definitions of formal and informal sector are taken from: United Nations Framework Convention OnClimate Change - Clean Development Mechanism (UNFCCC-CDM) , 2010, AMS-III.AJ. EB70, Annex 28 - Small-scale Methodology: Recovery and Recycling of Materials from Solid Wastes.
Mismanaged waste: It is defined as the sum of uncollected and improperly disposed waste. It is plastic that is prone to be released to the environment. The mismanaged waste index is the ratio of the mismanaged waste and the total waste. It is abbreviated as MWI and its value given in percentage.
Leakage: it is defined as the plastic released to the to rivers and oceans. The leakage rate is ratio between leakage and total waste generated, and its value is given in percentage.
Release rate: It is defined as the ratio between leakage and total mismanaged waste, and its value is given in percentage.
Macro-plastic: Large plastic waste readily visible and with dimensions larger than 5 mm, typically plastic packaging, plastic infrastructure or fishing nets.
Micro-plastic: Small plastic particulates below 5 mm in size and above 1 mm. Two types of micro-plastics are contaminating the world’s oceans: primary and secondary micro-plastics. In this study, we focus on primary micro-plastics which are are plastics directly released into the environment in the form of small particulates.
Mass balance: Mass balancing is a mathematical process aiming at equalising inputs and outputs of a given material flow across a system boundary. In our case, inputs consist of domestic production and imports while outputs consists of exports, waste generation and increase of stock. A mass balance allows to check data consistency and helps reconcile different datasets when needed.
Formal sector: Waste management activities planned, sponsored, financed, carried out or regulated and/or recognized by the local authorities or their agents, usually through contracts, licenses or concessions
Informal sector: Individuals or a group of individuals who are involved in waste management activities, but are not formally registered or formally responsible for providing waste management services. Newly established formalized organizations of such individuals; for example, cooperatives, social enterprises and programs led by non-governmental organizations (NGOs), can also be considered as the informal sector for the purpose of this methodology.

Plastic pollution hotspots: Menorca 12
WHAT WE MEAN BY PLASTIC LEAKAGE / IMPACTS
Leaked plastic stems from uncollected and improperly disposed waste.
Note that the rest of the uncollected and improperly disposed plastic may be leaking into other environmental compartments such as “soil”, “air” or “other terrestrial compartment” as defined in the Plastic Leak Project (PLP) guidance.
This information is not required to shape action but could be calculated using the PLP guidance.
• General waste management• Recycling• Wastewater and run-off water
management• Plastic consumption patterns• Population density• Value of the polymer• Size of application• Type of use• Distance to shore and rivers• Hydrological patterns
• Beach clean-up data• Size and shape of applications• Presence of toxic substances in
polymers or additives
By plastic leakage we refer to a quantity of plastic entering rivers and the oceans
By plastic impact we refer to a potential effect the leaked plastic may have on ecosystems and/or human health
A B
A
B
# Parameters ruling the leakage quantification in the model
# Parameters ruling qualitative impact assessment
LINK to the PLP guidance

Plastic pollution hotspots: Menorca 13
LEAKAGE PATHWAY AT A GLANCE
1. Mass of macroplastic waste
2. Collection 3. Waste management
4. Leakage to waterways and ocean
Land sources of plastic waste
(including imports and exports, domestic production and change of stock)
Collected
Uncollected
(through the formalwaste collection system or informal sector) Properly disposed
* Sanitary landfills* Incineration facilities
Collected for recycling
Leakage
Domestic recycling
Export of waste
Improperly disposed* Dumpsites* Unsanitary landfills
Mismanaged
Uncollected

Plastic pollution hotspots: Menorca 14
KEY ABBREVIATIONS AND UNITS
Polymer abbreviations Key units
NAME SYMBOL
Kilogram kg
Tonne t
Kilo tonne (or thousand tonne) kt
Mega tonne (or million tonne) Mt
Kilometer km
Square kilometer km2
NAME ABBREVIATION TYPICAL PRODUCTS
Polyethylene Terephthalate PET* bottles, food wrappings
Polypropylene PP hot food containers, sanitary pad liners
Low-density Polyethylene LDPE bags, container lids
High-density Polyethylene HDPE milk containers, shampoo bottles
Polystyrene PS food containers, disposable cups,
Polyvinyl Chloride PVC construction pipes, toys, detergent bottles
NAME ABBREVIATION
Mismanaged waste index MWI
Leakage rate LR
Release rate RR
Calculation variables*In this study, PET resins are distinguished from Polyester which includes polyester fibres, polyester films and polyester engineered resins.

Plastic pollution hotspots: Menorca 15
INTRODUCTION TO THEGUIDANCENational guidance for plastic pollution hotspotting and shaping action
1

Plastic pollution hotspots: Menorca 16
SCHEMATIC OF THE GUIDANCE
The guidance allows users to:
1. Generate country-specific plastic waste management datasets
2. Identify plastic leakage and pollution hotspots
3. Prioritise actions
LINK to theguidance

Plastic pollution hotspots: Menorca 17
RELATIONSHIP BETWEEN HOTSPOTS, INTERVENTIONS AND INSTRUMENTS
The guidance is built upon the backbone of three questions: where to act? (Hotspots), what to do? (Interventions) and how to do it? (Instruments)
A component of the system that directly or indirectly contributes to the magnitude of plastic leakage and/or its impacts.It can be a component of the system,a type of product/polymer or a region within the country.
An action that can be taken to mitigate the leakage from a given hotspot or reduce its impacts.
A practical way to implement the intervention and enable progress.
Examples
Single-use plastic bags
Low waste collection rate in rural areas
Implement better eco-design + chemical recycling
Reduce plastic bag use in the country
Increase waste collection
Develop funding mechanism through EPR scheme
Ban on plastic bags / introduce re-usable alternative
Help local waste pickers to create a revenue stream
Interventions
Hotspots
Instruments
Low recycling rate for flexible packaging
1
2
3
Plastic pollution hotspots: Menorca 18
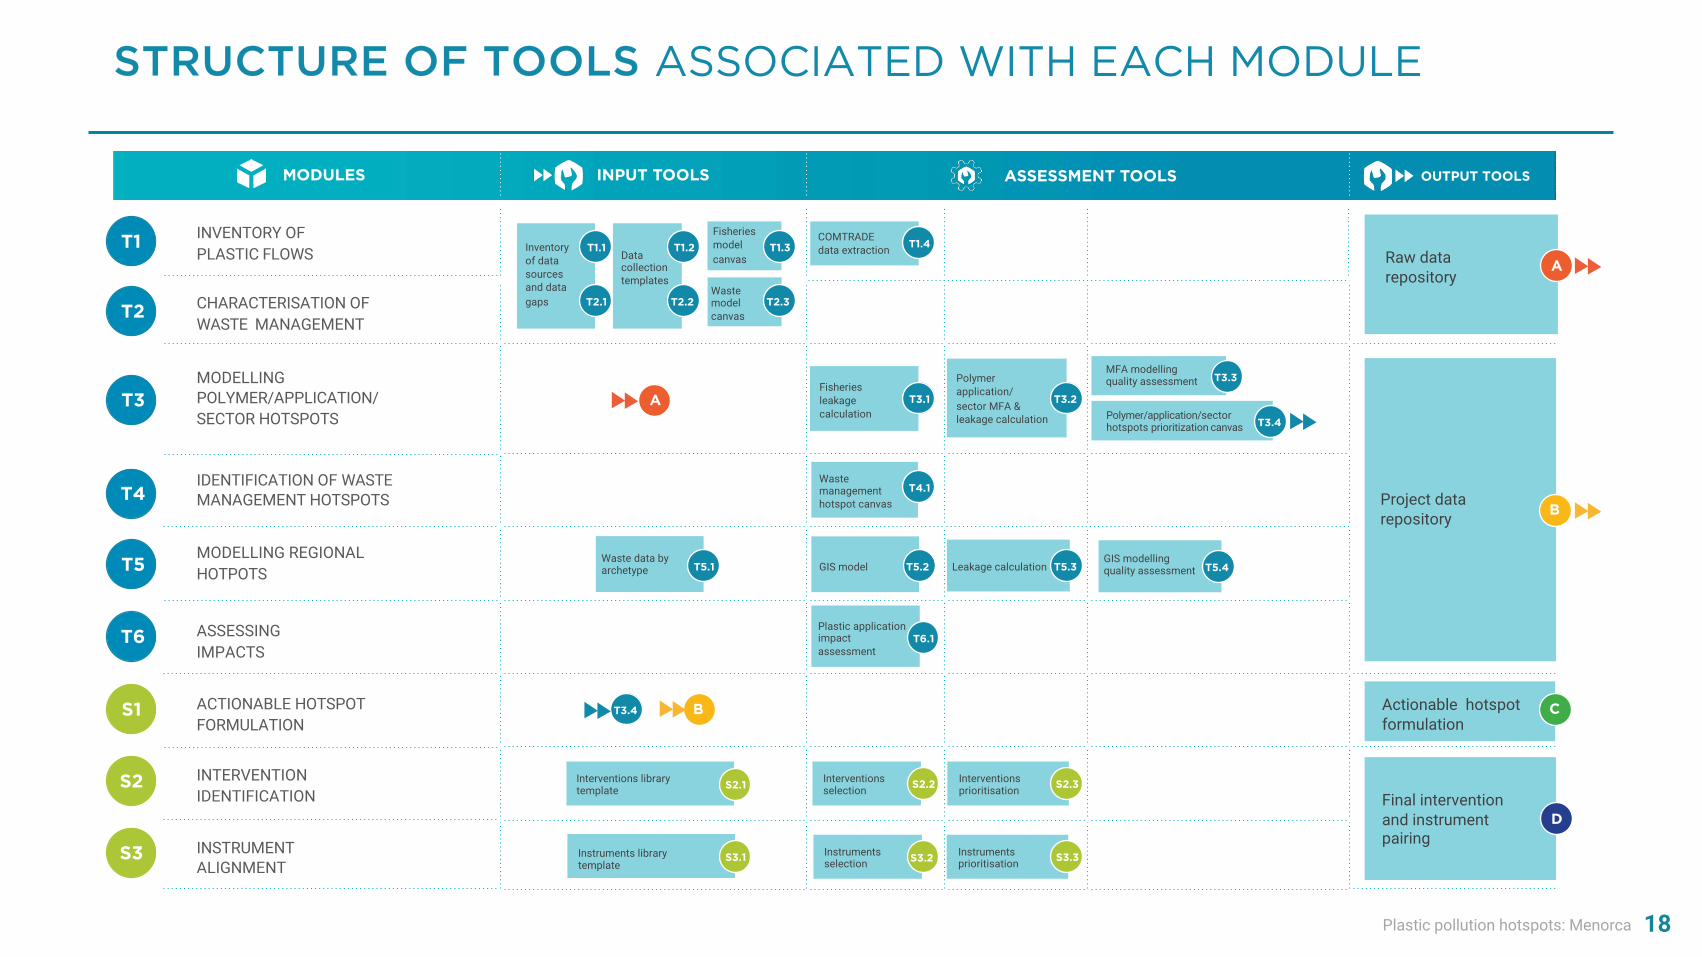
STRUCTURE OF TOOLS ASSOCIATED WITH EACH MODULE
OUTPUT TOOLS
INVENTORY OFPLASTIC FLOWS Data
collection templates
Wastemodelcanvas
Fisheriesmodelcanvas
COMTRADEdata extraction Raw data
repositoryCHARACTERISATION OFWASTE MANAGEMENT
MODELLINGPOLYMER/APPLICATION/ SECTOR HOTSPOTS
Fisheriesleakage calculation
Polymerapplication/sector MFA & leakage calculation Polymer/application/sector
hotspots prioritization canvas
MFA modelling quality assessment
Project data repository
IDENTIFICATION OF WASTE MANAGEMENT HOTSPOTS
Waste management hotspot canvas
MODELLING REGIONALHOTPOTS GIS model Leakage calculation
ASSESSINGIMPACTS
Plastic application impact assessment
ACTIONABLE HOTSPOTFORMULATION
Actionable hotspot formulation
INTERVENTIONIDENTIFICATION
Interventions selection
Interventions prioritisation
Final intervention and instrument pairingINSTRUMENT
ALIGNMENTInstruments library template
Instruments selection
Instruments prioritisation
Interventions library template
Inventoryof data sourcesand datagaps
T6.1
T5.2 T5.3
T4.1
T3.1 T3.2
T3.3
T3.4
T1.1
T2.1
T1.2
T2.2
T1.3
T2.3
T1.4
B
C
D
S2.1
S3.1
S2.2
S3.2
S2.3
S3.3
INPUT TOOLS ASSESSMENT TOOLSMODULES
T1
S3
S2
S1
T2
T3
T4
T5
T6
A
T3.4
Waste data by archetype T5.1
GIS modelling quality assessment T5.4
A
B

Plastic pollution hotspots: Menorca 19
DISCLAIMER
This report intends to present only the
results of the analysis and not the detailed modelling process.
Additional information on the methodology and modelling
process can be found directly in the modules and tools
associated with the guidance and highlighted by this icon.

Plastic pollution hotspots: Menorca 20
PLASTIC POLLUTIONHOTSPOTS
2
Plastic pollution hotspots: Menorca
Plastic pollution hotspots Shaping action3 Appendices4Introduction to the Guidance1 Bibliography52
21
COUNTRYOVERVIEW
2.1

Plastic pollution hotspots: Menorca 22
COUNTRY PLASTIC MATERIAL FLOW [ 2018 ]
Key take-aways
Summary of the results for all plastics in the country
• 10 220 tonnes of plastic waste generated in Menorca in 2018, from which 2476 tonnes (24%) are attributed to the tourism sector. Plastic waste generation per capita amounts to 111 kg/cap/year (including tourists on annual basis).
• 90% collection rate on average.
• 10% of plastic waste is mismanaged in Menorca (either littered or uncollected).
• 78 tonnes of plastic leak into waterways from Menorca in 2018, including 19 t (24%) attributed to the tourism sector. This corresponds to a 1% leakage rate and 0,8 kg/cap/year leakage per capita.
• No recycling facilities in Menorca. Around 14% of plastic waste is exported for recycling.
• 7734 tonnes of plastic waste are landfilled (assuming no incineration facility is in place).
Waste export
Properly disposed
Uncollected
Leakage00078
981
7734
1427
Tonn
es /
year
Note: For simplicity, in this figure, we removed a part of the “leakage” from the “uncollected” so that the “uncollected” value displayed corresponds to a post-leakage situation.
Waste: 10 220Domestic: 10 220Imported: 0
Plastic pollution hotspots: Menorca 23
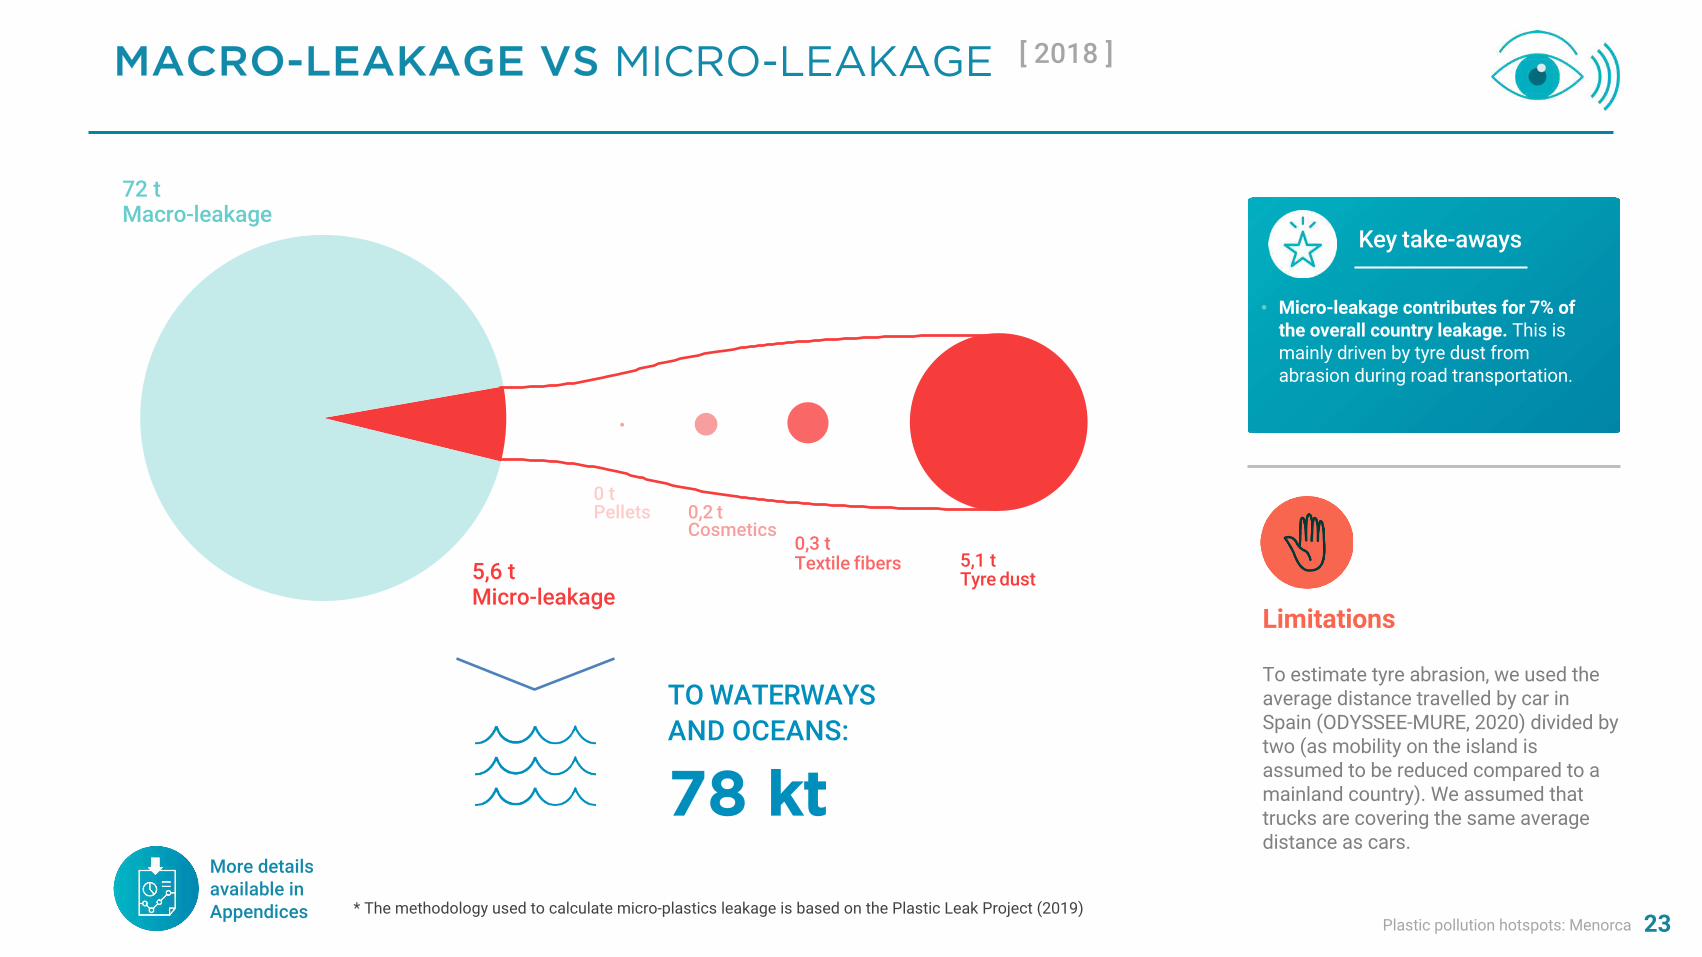
MACRO-LEAKAGE VS MICRO-LEAKAGE [ 2018 ]
Key take-aways
* The methodology used to calculate micro-plastics leakage is based on the Plastic Leak Project (2019)
More details available in Appendices
TO WATERWAYS AND OCEANS:
78 kt
0 t Pellets 0,2 t
Cosmetics0,3 tTextile fibers 5,1 t
Tyre dust5,6 tMicro-leakage
72 tMacro-leakage
• Micro-leakage contributes for 7% of the overall country leakage. This is mainly driven by tyre dust from abrasion during road transportation.
Limitations
To estimate tyre abrasion, we used the average distance travelled by car in Spain (ODYSSEE-MURE, 2020) divided by two (as mobility on the island is assumed to be reduced compared to a mainland country). We assumed that trucks are covering the same average distance as cars.
Plastic pollution hotspots: Menorca 24
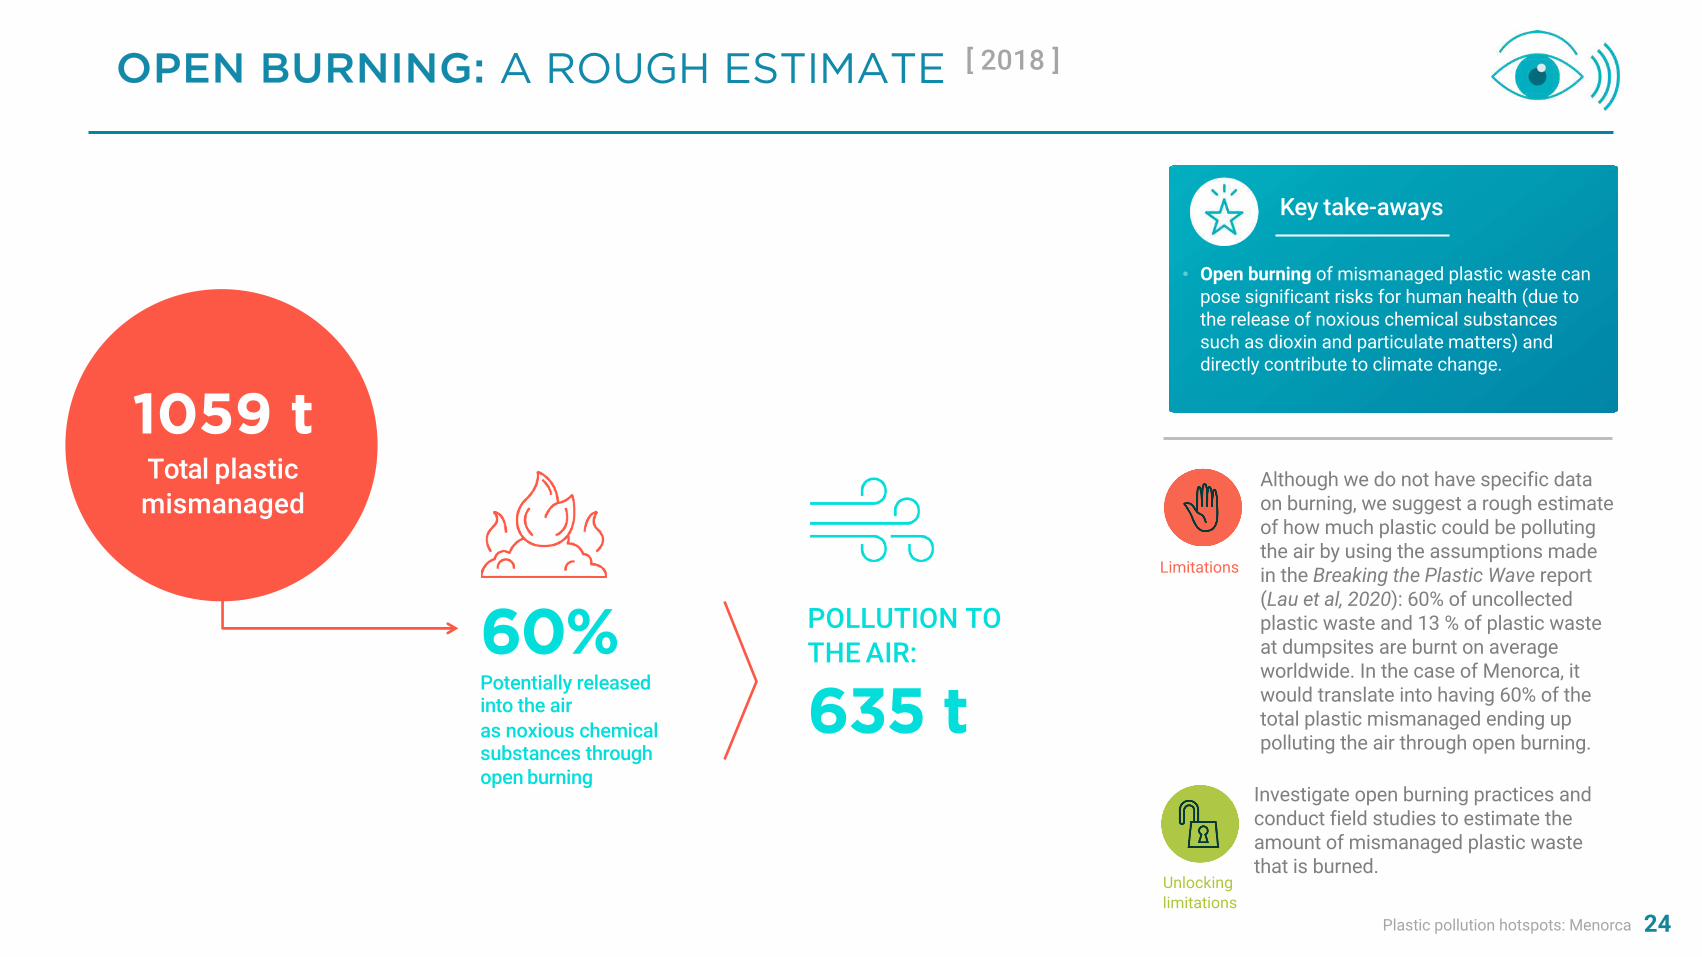
OPEN BURNING: A ROUGH ESTIMATE [ 2018 ]
• Open burning of mismanaged plastic waste can pose significant risks for human health (due to the release of noxious chemical substances such as dioxin and particulate matters) and directly contribute to climate change.
Key take-aways
Although we do not have specific data on burning, we suggest a rough estimate of how much plastic could be polluting the air by using the assumptions made in the Breaking the Plastic Wave report (Lau et al, 2020): 60% of uncollected plastic waste and 13 % of plastic waste at dumpsites are burnt on average worldwide. In the case of Menorca, it would translate into having 60% of the total plastic mismanaged ending up polluting the air through open burning.
Limitations
Investigate open burning practices and conduct field studies to estimate the amount of mismanaged plastic waste that is burned.
Unlocking limitations
POLLUTION TO THE AIR:
635 t60%Potentially released into the air as noxious chemical substances through open burning
1059 tTotal plastic mismanaged
Plastic pollution hotspots: Menorca
Plastic pollution hotspots Shaping action3 Appendices4Introduction to the Guidance1 Bibliography52
25
2.2 DETAILED HOTSPOTSRESULTS
Plastic pollution hotspots: Menorca 26
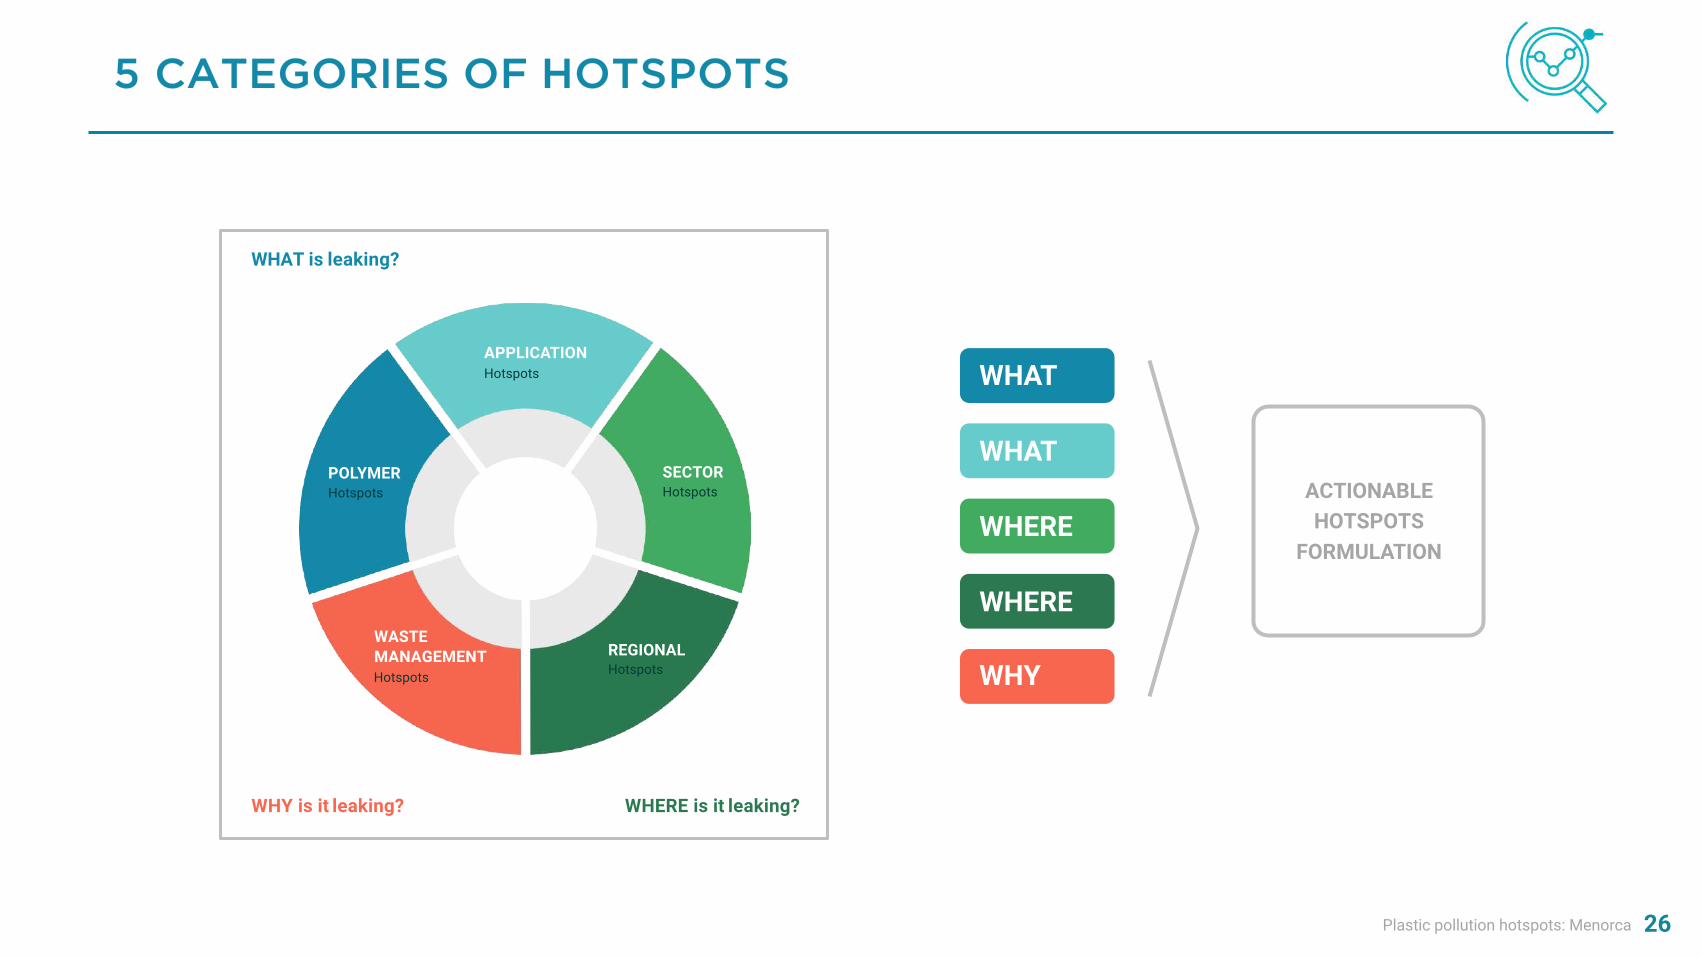
5 CATEGORIES OF HOTSPOTS
POLYMERHotspots
APPLICATIONHotspots
SECTORHotspots
REGIONALHotspots
WASTE MANAGEMENTHotspots
WHY is it leaking?
WHAT is leaking?
WHERE is it leaking?
WHY
WHAT
WHAT
WHERE
WHERE
ACTIONABLE HOTSPOTS
FORMULATION

Plastic pollution hotspots: MenorcaPlastic pollution hotspots: Menorca
Plastic pollution hotspots Shaping action3 Appendices4Introduction to the Guidance1 Bibliography52
27
A POLYMERHOTSPOTS
APPLICATIONHotspots
SECTORHotspots
REGIONALHotspots
WASTE MANAGEMENTHotspots
POLYMERHotspots

Plastic pollution hotspots: Menorca 28
OBJECTIVE AND INSTRUCTIONS
Key question answered:
Which polymers are most critical in the country regarding plastic leakage?
How to read the polymer hotspot graph?
What are the bar components of the polymer mass balance graph?
Waste Import
Net increase of stock
Waste Export
Export of primary and applications
Recycling
Properly disposed
Uncollected
Improperly disposed
Import of applications
Import and production of primary
(tho
usan
dto
nnes
/yea
r)
OUTPUTCOMPONENT
thou
sand
tonn
es
Polymer
For more details, please read the Methodology
INPUTCOMPONENT
MWI =Mismanaged
Waste
LR =LeakageWaste
11%12%
9%
5%
10%
0%
2%
4%
6%
8%
10%
12%
14%
0
20
40
60
80
100
120
140
LDPE PET PP Polyester HDPE
Leak
age
rate
thou
sand
tonn
es T3
PP
LDPE
PET
HDPE
Polyester
3 highest leakage contributors in absolute ORrelative value
Highest leakage contributors in absolute AND relative value
4. Assess the quality score of the results3. Select hotspots based on absolute and relative leakage
2. Focus on leakage and leakage rate1. Determine leakage from mismanaged waste
Waste
UncollectedWaste Improperly disposed Leaked
Mismanaged
+
Raw data
Modelling
Reliability
Geographic correlation
Temporal correlation
Granularity
Pedi
gree
mat
rix
2.01
23
4
5
ScoreCriteria
Plastic pollution hotspots: Menorca
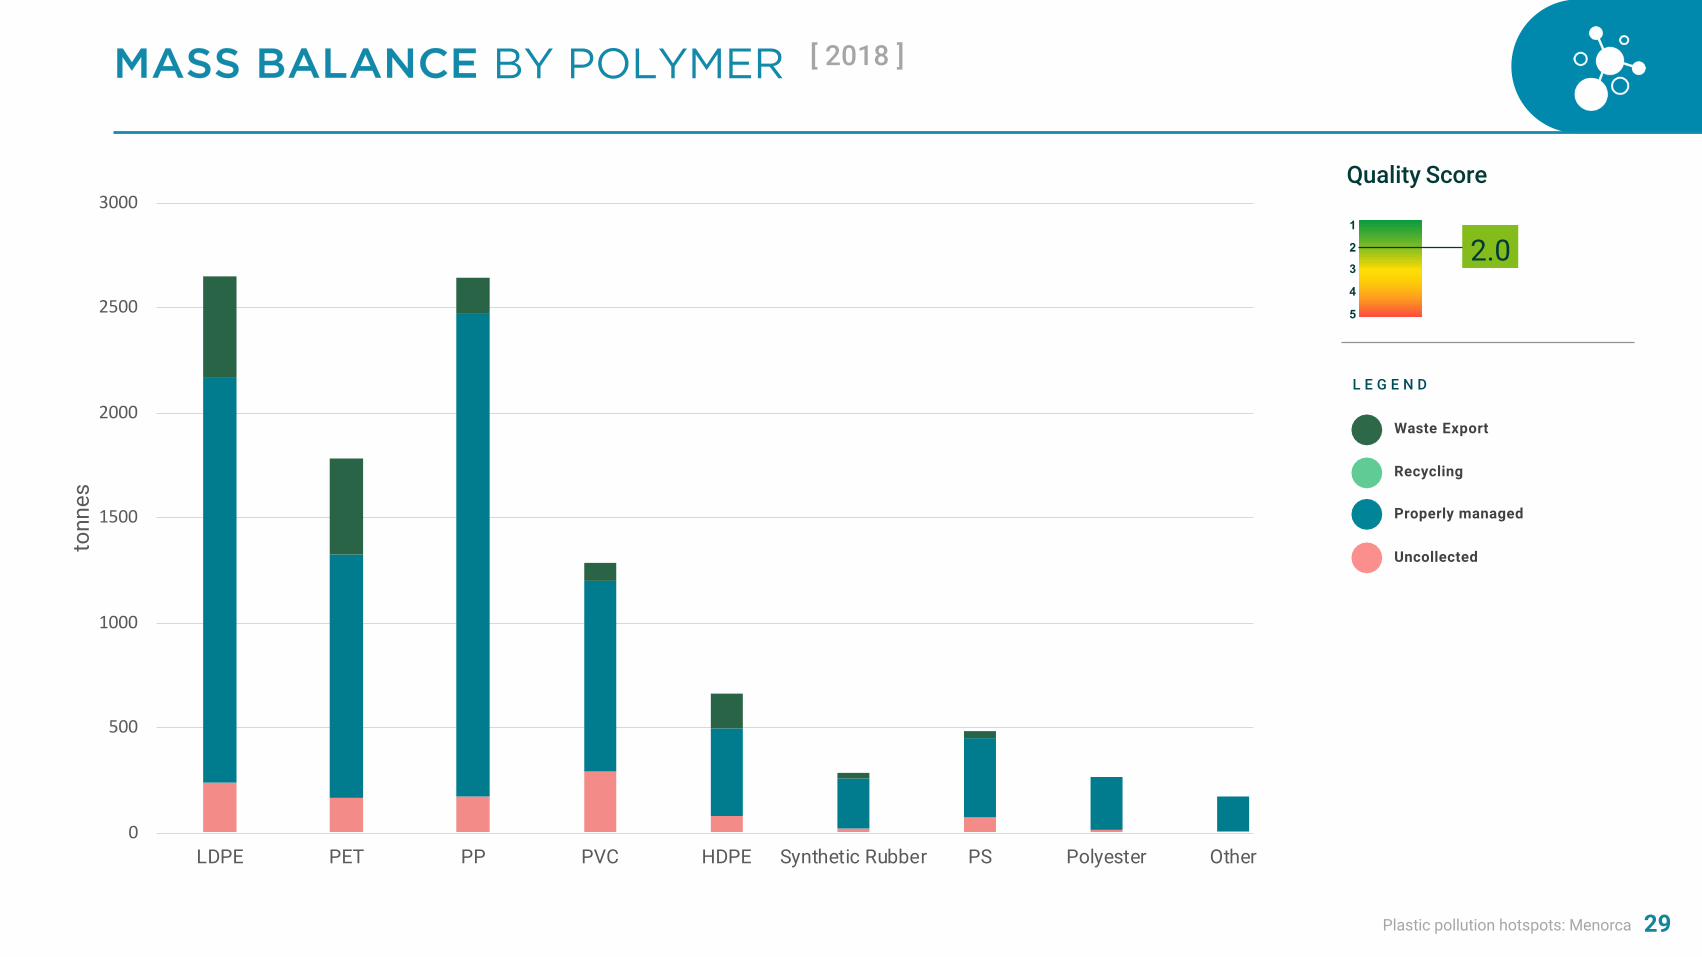
MASS BALANCE BY POLYMER [ 2018 ]
29
0
500
1000
1500
2000
2500
3000
LDPE PET PP PVC HDPE Synthetic Rubber PS Polyester Other
tonn
es
L E G E N D
Uncollected
Properly managed
Waste Export
Recycling
2.01
23
4
5
Quality Score
Plastic pollution hotspots: Menorca
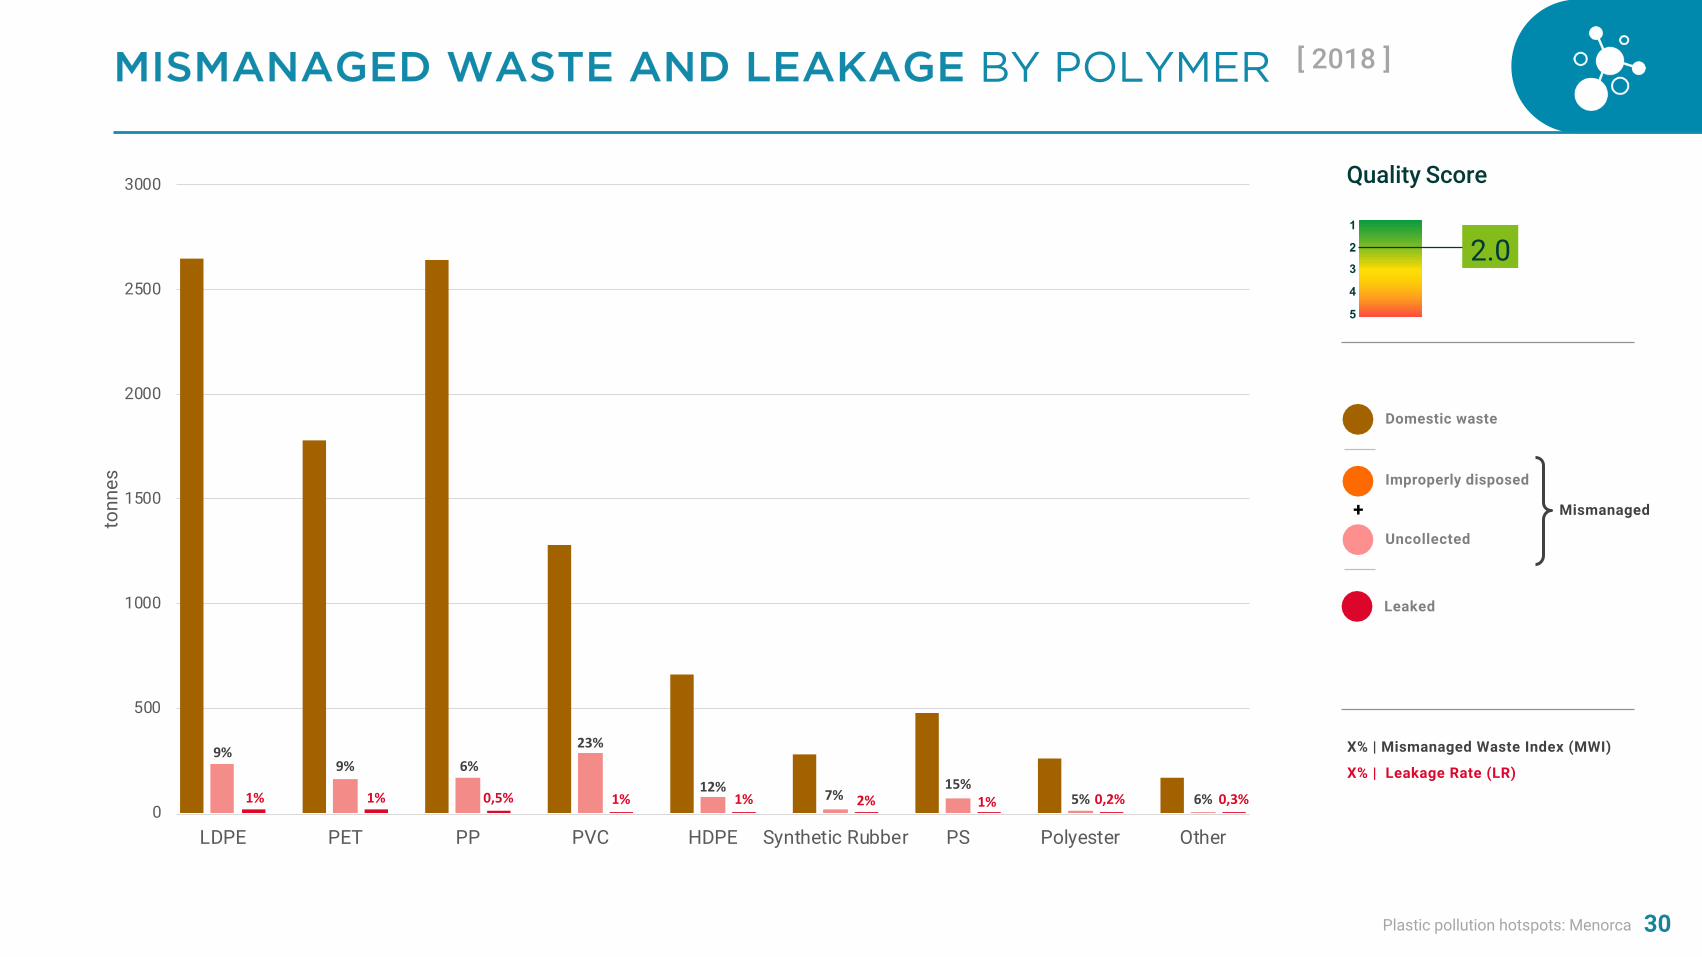
MISMANAGED WASTE AND LEAKAGE BY POLYMER [ 2018 ]
30
Uncollected
Domestic waste
Improperly disposed
Leaked
+ Mismanaged
X% | Mismanaged Waste Index (MWI)
X% | Leakage Rate (LR)
9%9% 6%
23%
12% 7%15%
5% 6%
1% 1% 0,5% 1% 1% 2% 1% 0,2% 0,3%0
500
1000
1500
2000
2500
3000
LDPE PET PP PVC HDPE Synthetic Rubber PS Polyester Other
tonn
es
2.01
23
4
5
Quality Score
Plastic pollution hotspots: Menorca
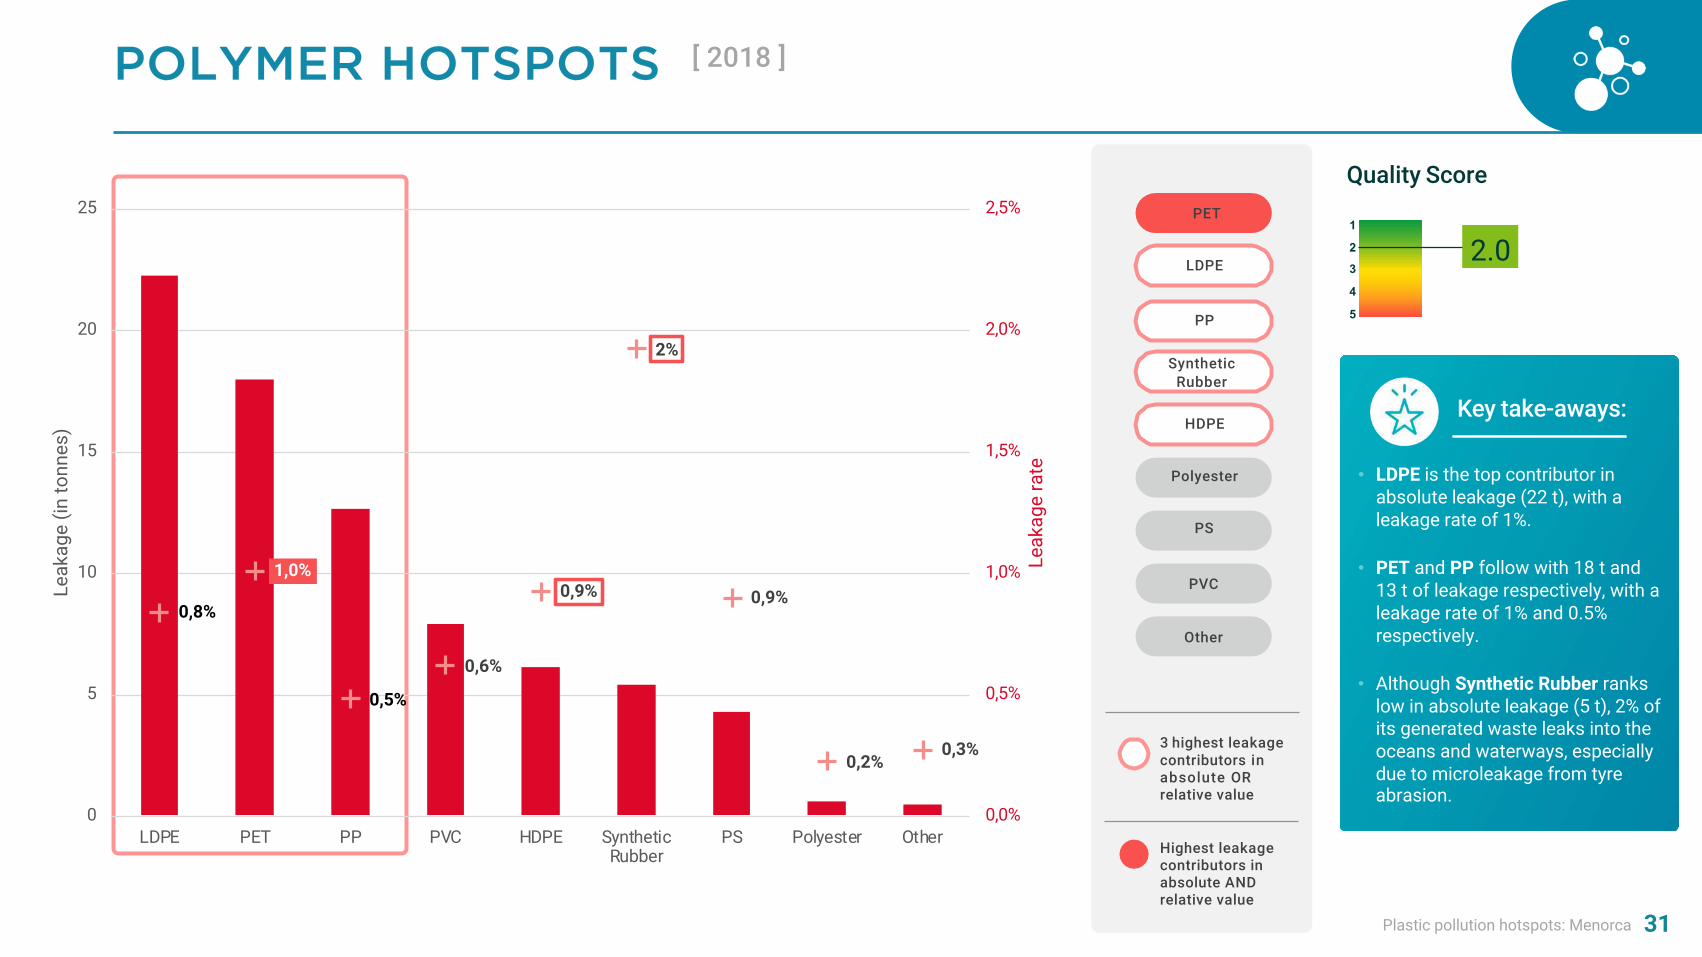
POLYMER HOTSPOTS [ 2018 ]
31
Key take-aways:
3 highest leakage contributors in absolute ORrelative value
Highest leakage contributors in absolute AND relative value
PET
LDPE
PP
Synthetic Rubber
HDPE
Polyester
PS
PVC
Other
• LDPE is the top contributor in absolute leakage (22 t), with a leakage rate of 1%.
• PET and PP follow with 18 t and 13 t of leakage respectively, with a leakage rate of 1% and 0.5% respectively.
• Although Synthetic Rubber ranks low in absolute leakage (5 t), 2% of its generated waste leaks into the oceans and waterways, especially due to microleakage from tyre abrasion.
0,8%
1,0%
0,5%
0,6%
0,9%
2%
0,9%
0,2%0,3%
0,0%
0,5%
1,0%
1,5%
2,0%
2,5%
0
5
10
15
20
25
LDPE PET PP PVC HDPE SyntheticRubber
PS Polyester Other
Leak
age
rate
Leak
age
(in to
nnes
)
2.01
23
4
5
Quality Score
Plastic pollution hotspots: Menorca
POLYMER HOTSPOTS:INTERPRETATION AND LIMITATIONS
32
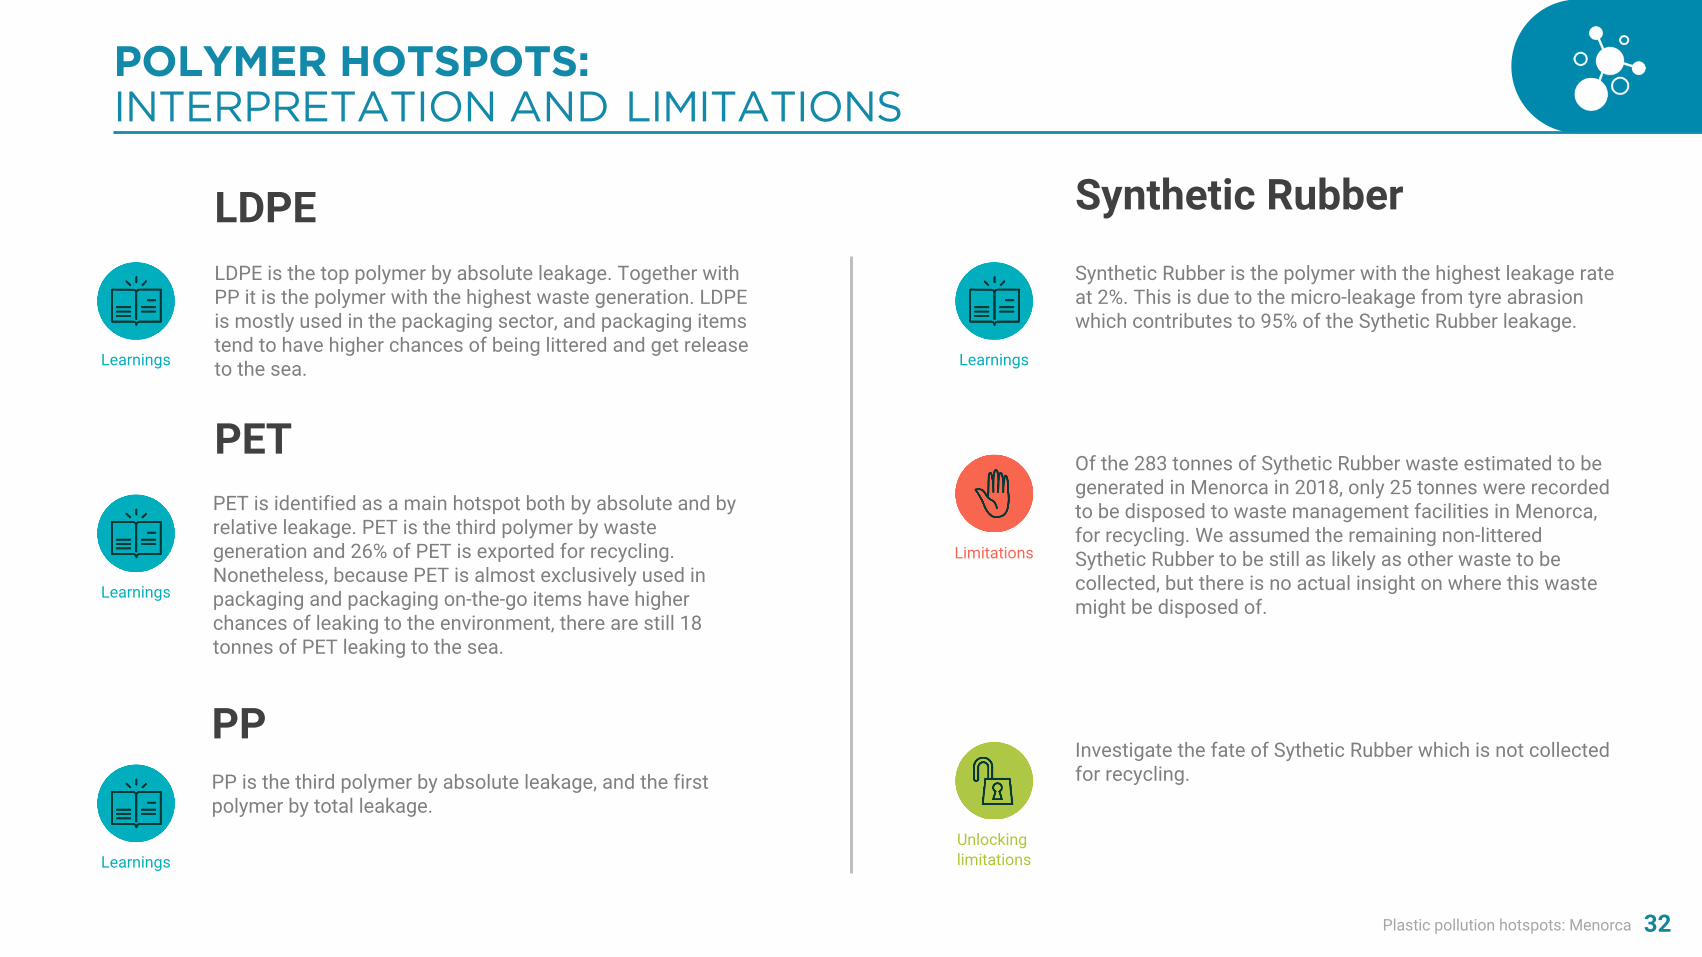
LDPELDPE is the top polymer by absolute leakage. Together with PP it is the polymer with the highest waste generation. LDPE is mostly used in the packaging sector, and packaging items tend to have higher chances of being littered and get release to the sea.
Synthetic RubberSynthetic Rubber is the polymer with the highest leakage rate at 2%. This is due to the micro-leakage from tyre abrasion which contributes to 95% of the Sythetic Rubber leakage.
Learnings
Investigate the fate of Sythetic Rubber which is not collected for recycling.
Learnings
Limitations
Unlocking limitations
Learnings
PETPET is identified as a main hotspot both by absolute and by relative leakage. PET is the third polymer by waste generation and 26% of PET is exported for recycling. Nonetheless, because PET is almost exclusively used in packaging and packaging on-the-go items have higher chances of leaking to the environment, there are still 18 tonnes of PET leaking to the sea.
PPPP is the third polymer by absolute leakage, and the first polymer by total leakage.
Learnings
Of the 283 tonnes of Sythetic Rubber waste estimated to be generated in Menorca in 2018, only 25 tonnes were recorded to be disposed to waste management facilities in Menorca, for recycling. We assumed the remaining non-littered Sythetic Rubber to be still as likely as other waste to be collected, but there is no actual insight on where this waste might be disposed of.
Plastic pollution hotspots: Menorca
POLYMER HOTSPOTS:INTERPRETATION AND LIMITATIONS
33
All polymers
The difference in leakage rate between the different polymers is of the order of 1%, therefore absolute leakage is a better indicator for hotspot selection in the case of Menorca.
Learnings
Limitations
Unlocking limitations
Waste generation by polymer was determined by scaling down the waste generation of Spain, the assumption being that the waste generation per capita is the same across Spain and Menorca.
Perform characterisation study of waste generation in Menorca at household level.

Plastic pollution hotspots: MenorcaPlastic pollution hotspots: Menorca
Plastic pollution hotspots Shaping action3 Appendices4Introduction to the Guidance1 Bibliography52
34
POLYMERHotspots
APPLICATIONHotspots
SECTORHotspots
REGIONALHotspots
WASTE MANAGEMENTHotspots
APPLICATIONHOTSPOTS
B
Plastic pollution hotspots: Menorca 35
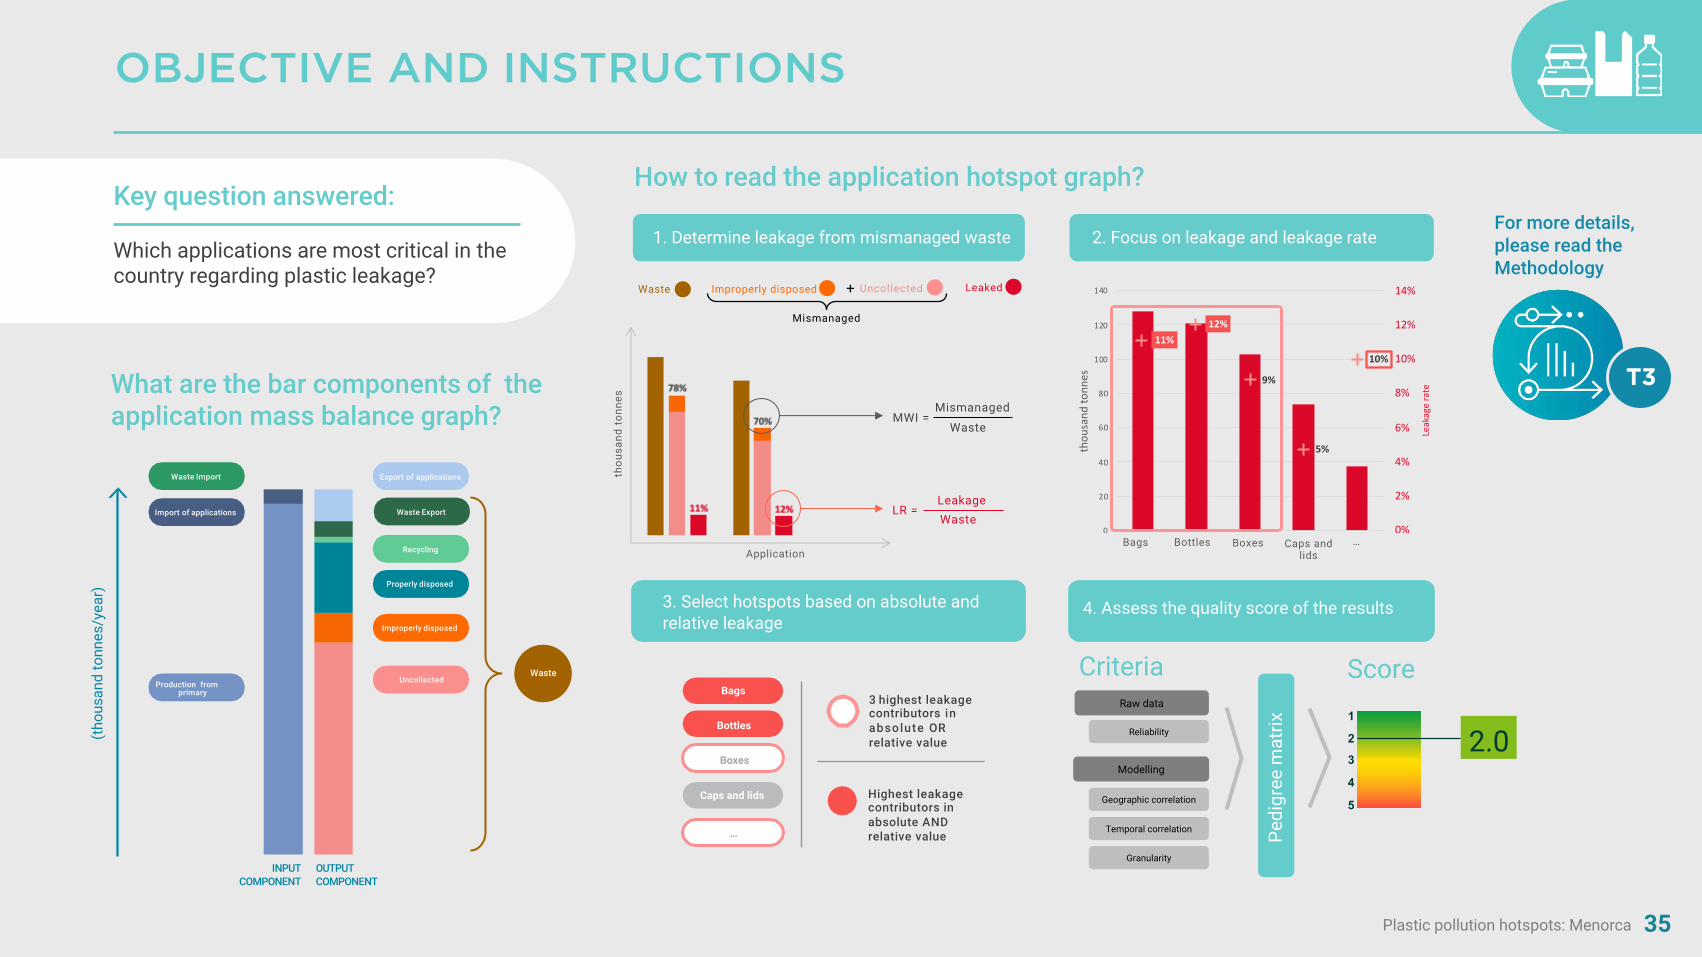
OBJECTIVE AND INSTRUCTIONS
Key question answered:
Which applications are most critical in the country regarding plastic leakage?
How to read the application hotspot graph?
What are the bar components of the application mass balance graph?
Waste Import
Waste Export
Export of applications
Recycling
Properly disposed
Uncollected
Improperly disposed
Import of applications
Production fromprimary
(tho
usan
dto
nnes
/yea
r)
OUTPUTCOMPONENT
thou
sand
tonn
es
Application
For more details, please read the Methodology
INPUTCOMPONENT
UncollectedWaste Improperly disposed Leaked
MWI =Mismanaged
Waste
LR =LeakageWaste
Mismanaged
T3
2. Focus on leakage and leakage rate1. Determine leakage from mismanaged waste
+
Waste
11%12%
9%
5%
10%
0%
2%
4%
6%
8%
10%
12%
14%
0
20
40
60
80
100
120
140
LDPE PET PP Polyester HDPE
Leak
age
rate
thou
sand
tonn
es
Bags Bottles Boxes Caps and lids
…
Boxes
Bags
Bottles
…
Caps and lids
3 highest leakage contributors in absolute ORrelative value
Highest leakage contributors in absolute AND relative value
4. Assess the quality score of the results3. Select hotspots based on absolute and relative leakage
Raw data
Modelling
Reliability
Geographic correlation
Temporal correlation
Granularity
Pedi
gree
mat
rix 2.01
23
4
5
ScoreCriteria

Plastic pollution hotspots: Menorca 36
NOT APPLICABLE WITH CURRENT DATA FOR MENORCA

Plastic pollution hotspots: MenorcaPlastic pollution hotspots: Menorca
Plastic pollution hotspots Shaping action3 Appendices4Introduction to the Guidance1 Bibliography52
C
POLYMERHotspots
APPLICATIONHotspots
SECTORHotspots
REGIONALHotspots
WASTE MANAGEMENTHotspots
SECTORHOTSPOTS
37
Plastic pollution hotspots: Menorca 38
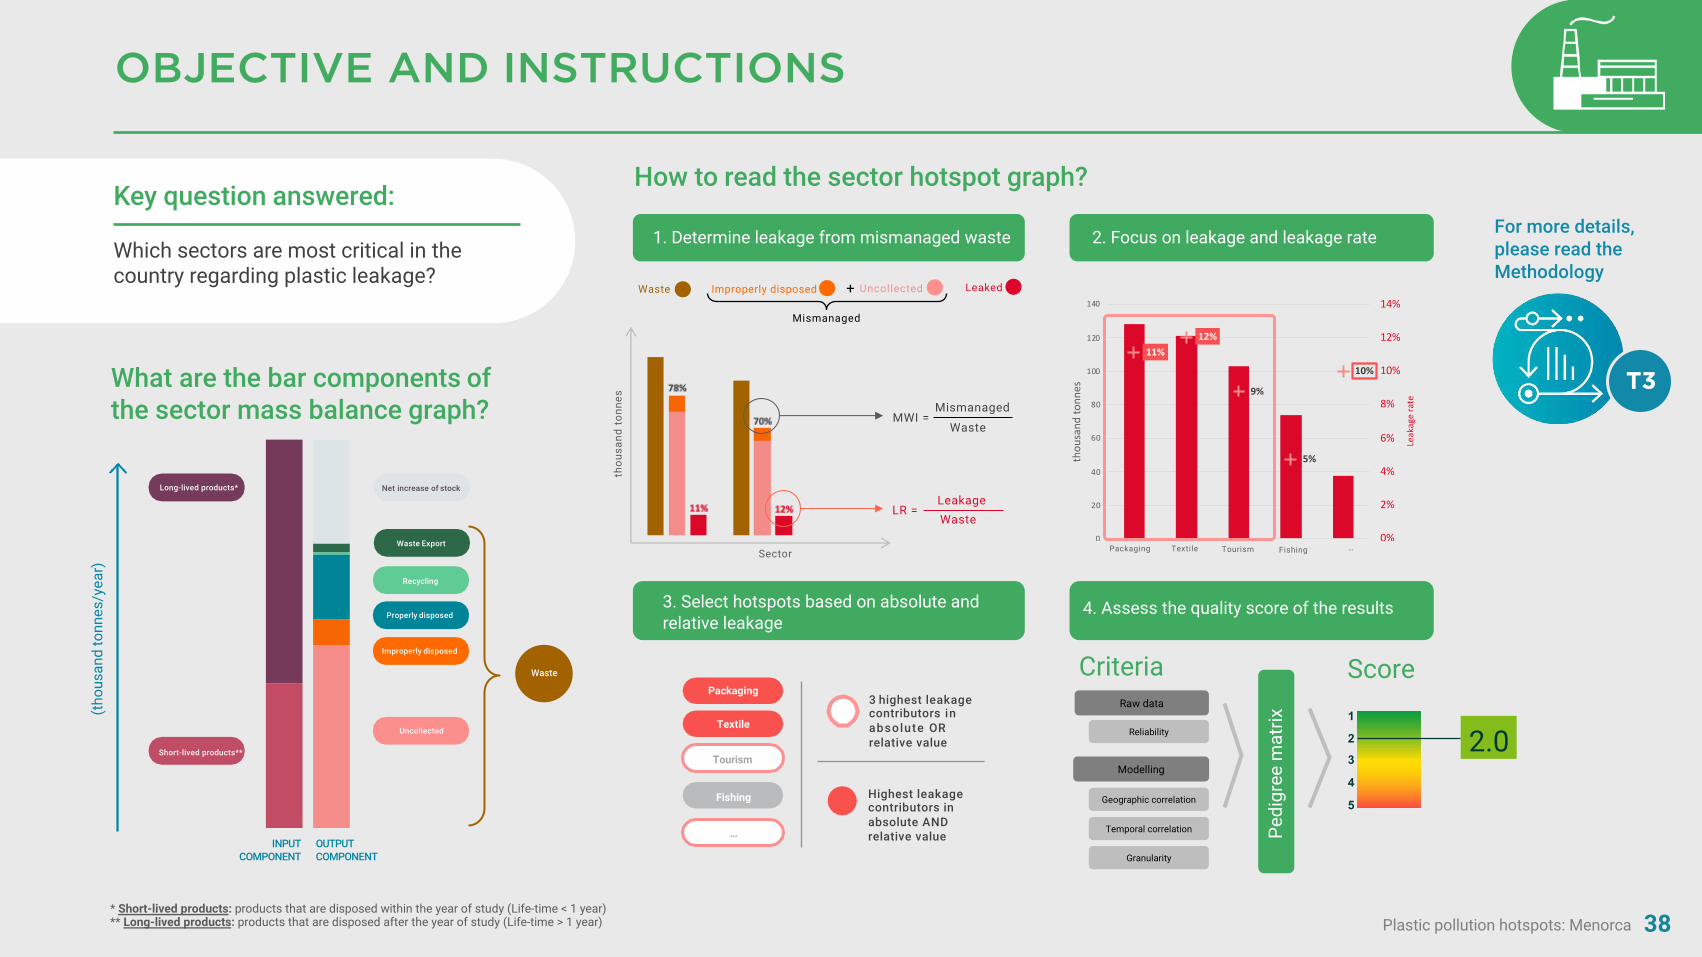
OBJECTIVE AND INSTRUCTIONS
Key question answered:
Which sectors are most critical in the country regarding plastic leakage?
How to read the sector hotspot graph?
What are the bar components of the sector mass balance graph?
Waste Export
Recycling
Properly disposed
Uncollected
Improperly disposed
Long-lived products*
Short-lived products**
(tho
usan
dto
nnes
/yea
r)
OUTPUTCOMPONENT
thou
sand
tonn
es
Sector
For more details, please read the Methodology
INPUTCOMPONENT
MWI =Mismanaged
Waste
LR =LeakageWaste
T3
2. Focus on leakage and leakage rate1. Determine leakage from mismanaged waste
Waste
11%12%
9%
5%
10%
0%
2%
4%
6%
8%
10%
12%
14%
0
20
40
60
80
100
120
140
LDPE PET PP Polyester HDPE
Leak
age
rate
thou
sand
tonn
es
Packaging Textile Tourism Fishing …
Net increase of stock
UncollectedWaste Improperly disposed Leaked
Mismanaged
+
* Short-lived products: products that are disposed within the year of study (Life-time < 1 year)** Long-lived products: products that are disposed after the year of study (Life-time > 1 year)
Tourism
Packaging
Textile
…
Fishing
3 highest leakage contributors in absolute ORrelative value
Highest leakage contributors in absolute AND relative value
4. Assess the quality score of the results3. Select hotspots based on absolute and relative leakage
Raw data
Modelling
Reliability
Geographic correlation
Temporal correlation
Granularity
Pedi
gree
mat
rix
2.01
23
4
5
ScoreCriteria
Plastic pollution hotspots: Menorca
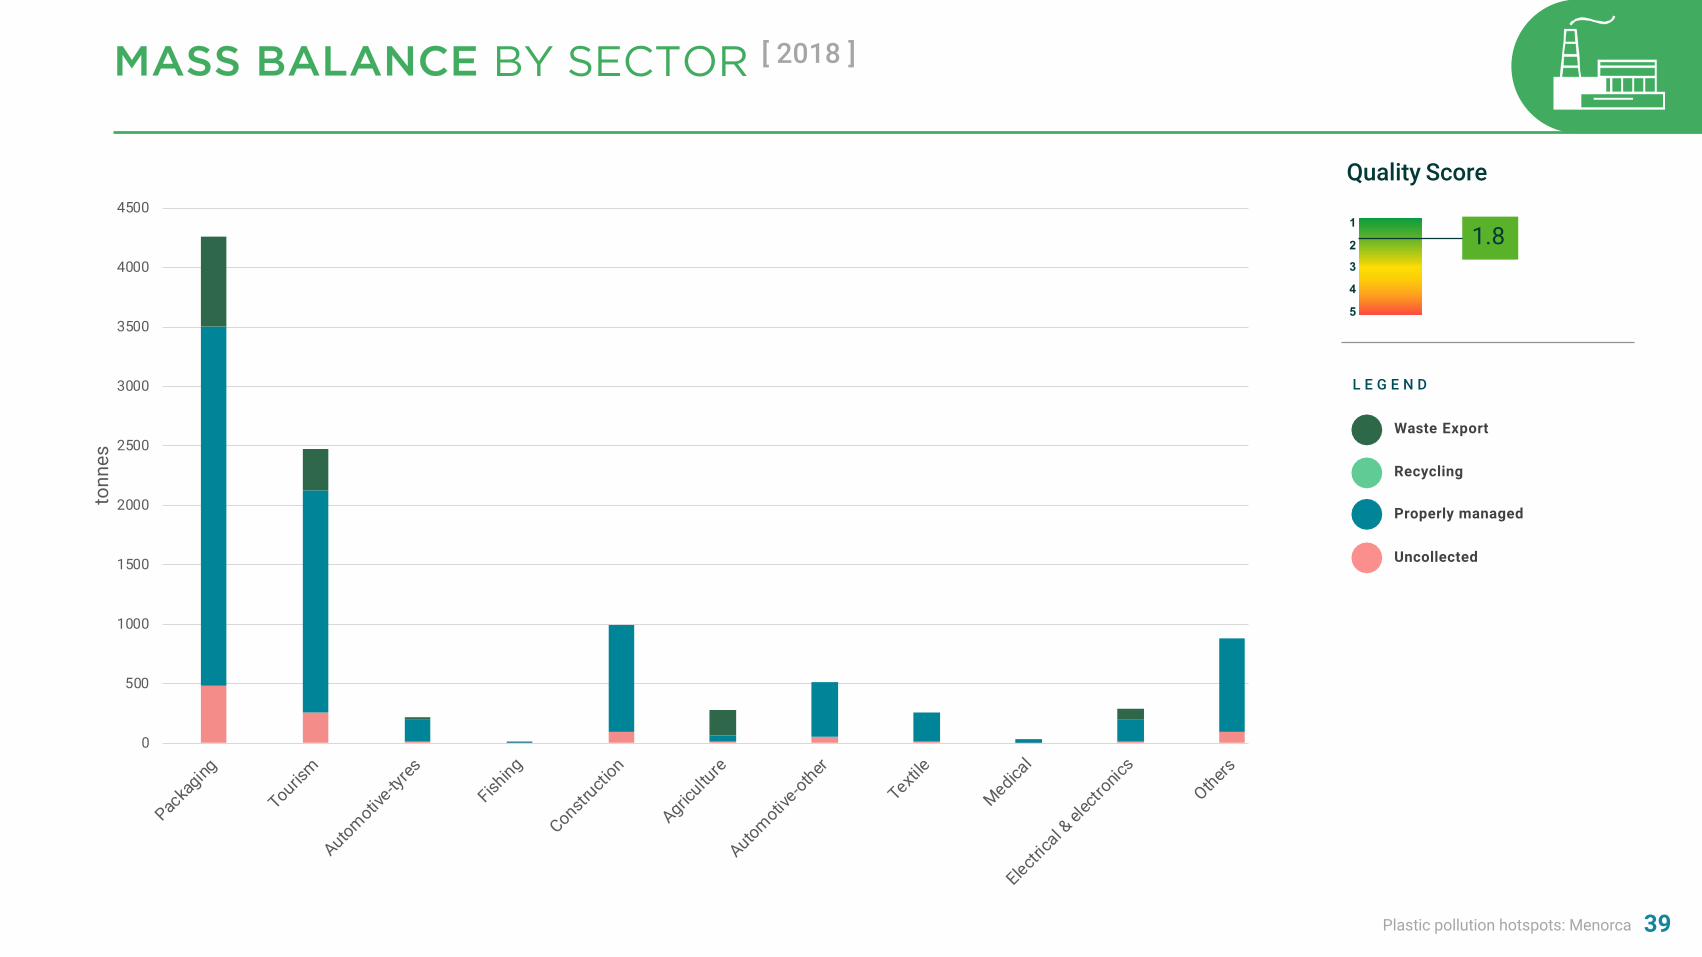
MASS BALANCE BY SECTOR [ 2018 ]
39
0
500
1000
1500
2000
2500
3000
3500
4000
4500
Packa
ging
Tourism
Automotive-ty
res
Fishing
Constructi
on
Agricultu
re
Automotive-other
Textile
Medical
Electrica
l & el
ectro
nics
Others
tonn
es
L E G E N D
Uncollected
Properly managed
Waste Export
Recycling
1
23
4
5
Quality Score
1.8

Plastic pollution hotspots: Menorca 40
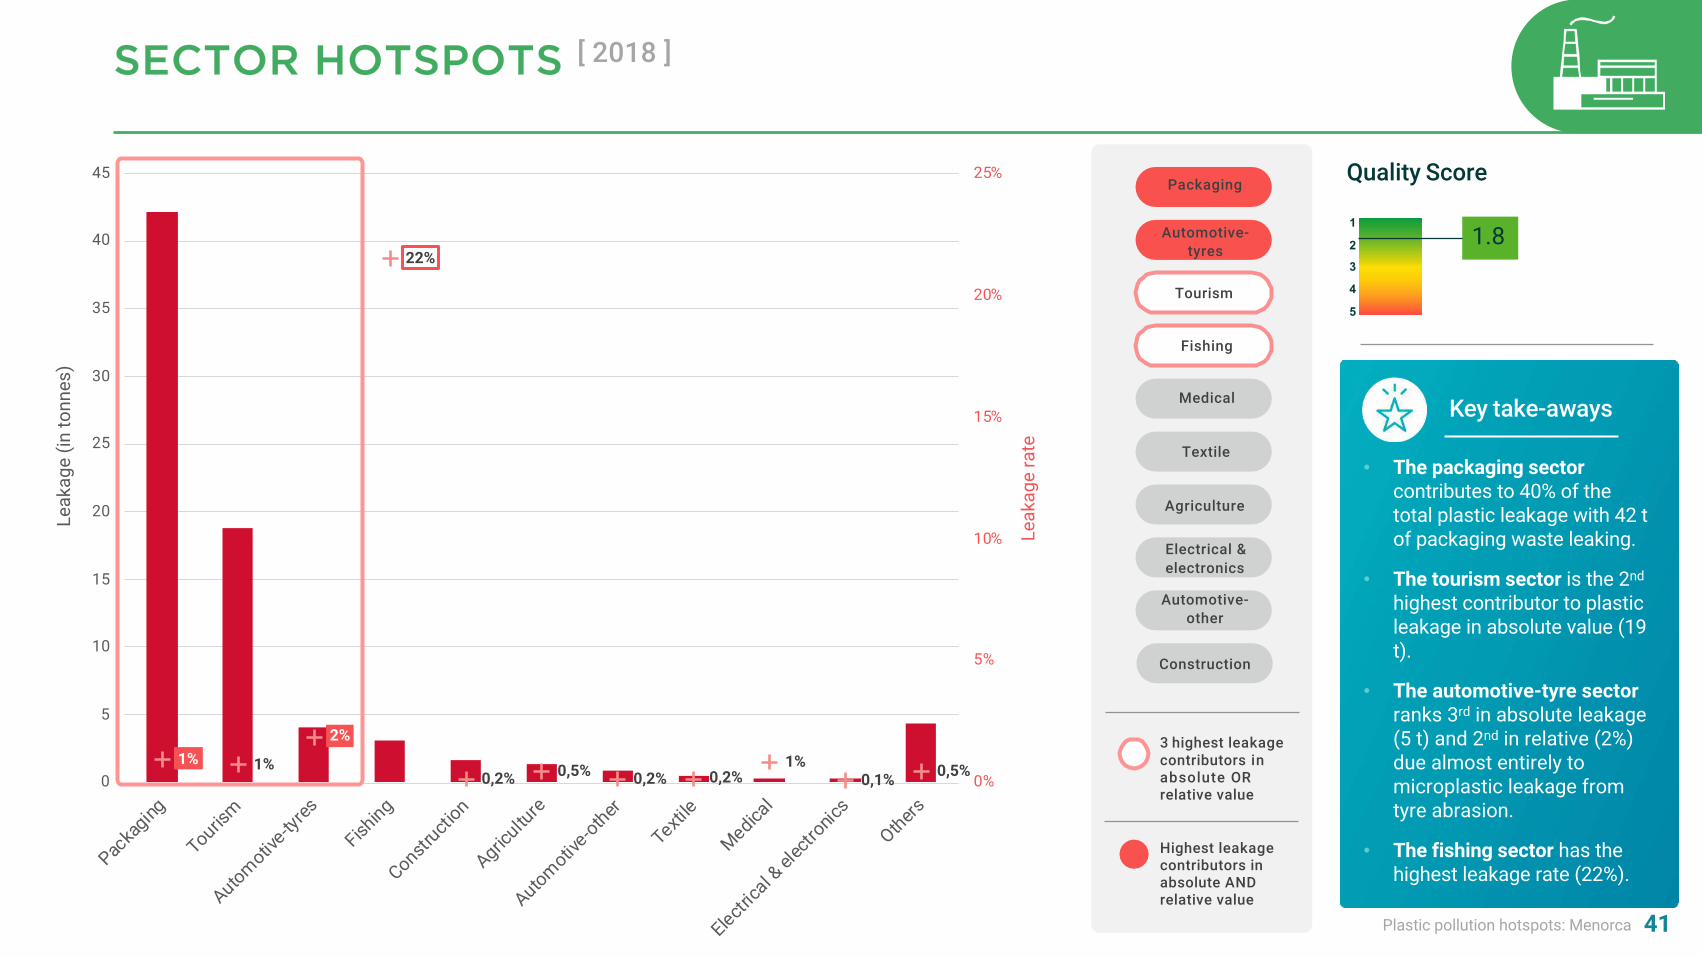
MISMANAGED WASTE AND LEAKAGE BY SECTOR [ 2018 ]
X% | Mismanaged Waste Index (MWI)
X% | Leakage Rate (LR)
Uncollected
Domestic waste
Improperly disposed
Leaked
+ Mismanaged
11%
10%
7% 9%10%
6% 10% 6% 10% 6% 11%
1% 1% 2% 22% 0,2% 0,5% 0,2% 0,2% 1% 0,1% 0,5%0
500
1000
1500
2000
2500
3000
3500
4000
4500
Packaging
Tourism
Automotive-ty
res
Fishing
Constructio
n
Agricultu
re
Automotive-other
Textile
Medical
Electrica
l & electr
onicsOthers
tonn
es
1
23
4
5
Quality Score
1.8
Plastic pollution hotspots: Menorca
3 highest leakage contributors in absolute ORrelative value
Highest leakage contributors in absolute AND relative value
Key take-aways
41
SECTOR HOTSPOTS [ 2018 ]
1% 1%
2%
22%
0,2% 0,5% 0,2% 0,2%1%
0,1% 0,5%0%
5%
10%
15%
20%
25%
0
5
10
15
20
25
30
35
40
45
Packa
ging
Tourism
Automotive-ty
res
Fishing
Constructi
on
Agricultu
re
Automotive-other
Textile
Medical
Electrica
l & el
ectro
nics
Others
Leak
age
rate
Leak
age
(in to
nnes
)
Automotive-tyres
Tourism
Fishing
Medical
Textile
Agriculture
Electrical & electronics
Automotive-other
• The packaging sector contributes to 40% of the total plastic leakage with 42 t of packaging waste leaking.
• The automotive-tyre sector ranks 3rd in absolute leakage (5 t) and 2nd in relative (2%) due almost entirely to microplastic leakage from tyre abrasion.
Construction
• The tourism sector is the 2nd
highest contributor to plastic leakage in absolute value (19 t).
Packaging
• The fishing sector has the highest leakage rate (22%).
1
23
4
5
Quality Score
1.8

Plastic pollution hotspots: Menorca 42
SECTOR HOTSPOTS:INTERPRETATION AND LIMITATIONS
Tourism Packaging
Learnings Learnings
Most of the plastic waste generation in Menorca comes from Packaging sector. 5618 tonnes of plastic waste from packaging were generated in Menorca in 2018 (22% of it has been attributed to the tourism sector). Due to the on-the go nature of packaging products, plastic from packaging has one of the highest MWI, with 11% of plastic estimated to be uncollected in Menorca.
The tourism sector makes up for 22% of the waste in Menorca, with almost 2500 tonnes of waste generated for tourist related activities.
Limitations
We assume that tourists have the same daily per capita plastic waste generation as resident population. Therefore, we attribute a share of the waste from all sector to the tourism sector, based on the tourist population. See the appendix for more details.
Studies could be conducted to identify tourists waste generation patterns.
Unlocking limitations
Fishing
Learnings
4 tonnes of fishing gears were estimated to be lost at sea in Menorca in 2018. This amounts to 6% of the total country leakage. More information on the fishing sector can be found in appendix.

Plastic pollution hotspots: MenorcaPlastic pollution hotspots: Menorca
Plastic pollution hotspots Shaping action3 Appendices4Introduction to the Guidance1 Bibliography52
43
D
POLYMERHotspots
APPLICATIONHotspots
SECTORHotspots
REGIONALHotspots
WASTE MANAGEMENTHotspots
REGIONALHOTSPOTS
Plastic pollution hotspots: Menorca 44
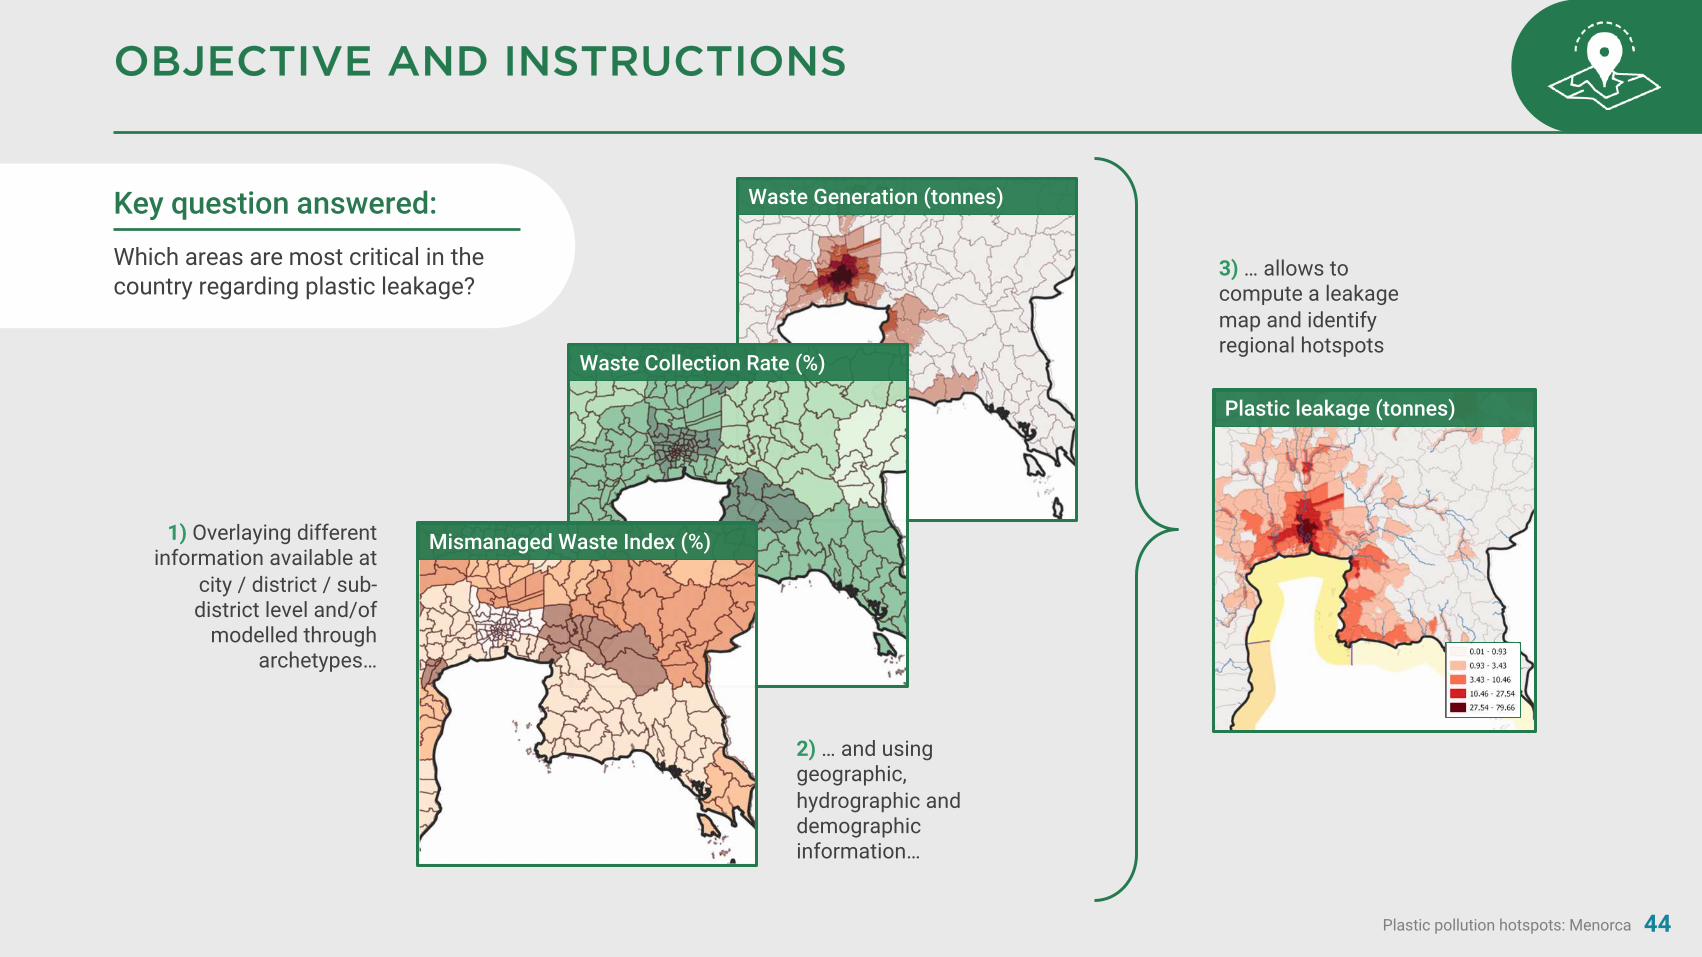
OBJECTIVE AND INSTRUCTIONS
Key question answered:
Which areas are most critical in the country regarding plastic leakage?
Waste Generation (tonnes)
Waste Collection Rate (%)
Mismanaged Waste Index (%)
2) … and using geographic, hydrographic and demographic information…
3) … allows to compute a leakage map and identify regional hotspots
Plastic leakage (tonnes)
1) Overlaying different information available at
city / district / sub-district level and/of
modelled through archetypes…
Plastic pollution hotspots: Menorca
WASTE GENERATION FROM RESIDENTS:MAP AND INTERPRETATIONS [ 2018 ]
45
Key take-aways
• Residents contribute to generating 78% of the total of waste generated in Menorca.
• 93% of it is generated in urban areas.
Unlocking limitations
Limitations
• The map does not show the waste generation distribution in rural areas. Only 7% of the total 7744 tonnes of waste generated by the resident population come from rural areas. Nonetheless, data on waste generation by the rural population per municipality are available in appendix.
If necessary, gather further information on geographical distribution of the rural population.More details
available in Appendices
Plastic waste generation from resident population
7744 tonnes/year
• 93% of the waste generated by the resident population comes from urban areas, because 93% of the population lives in urban areas. Mahón et Ciutadella de Menorca have the highest absolute waste generation, while urban nuclei in Es castell, Ferreries and Es Migjorn Gran have the highest waste generation per km2.
Learnings
Plastic pollution hotspots: Menorca
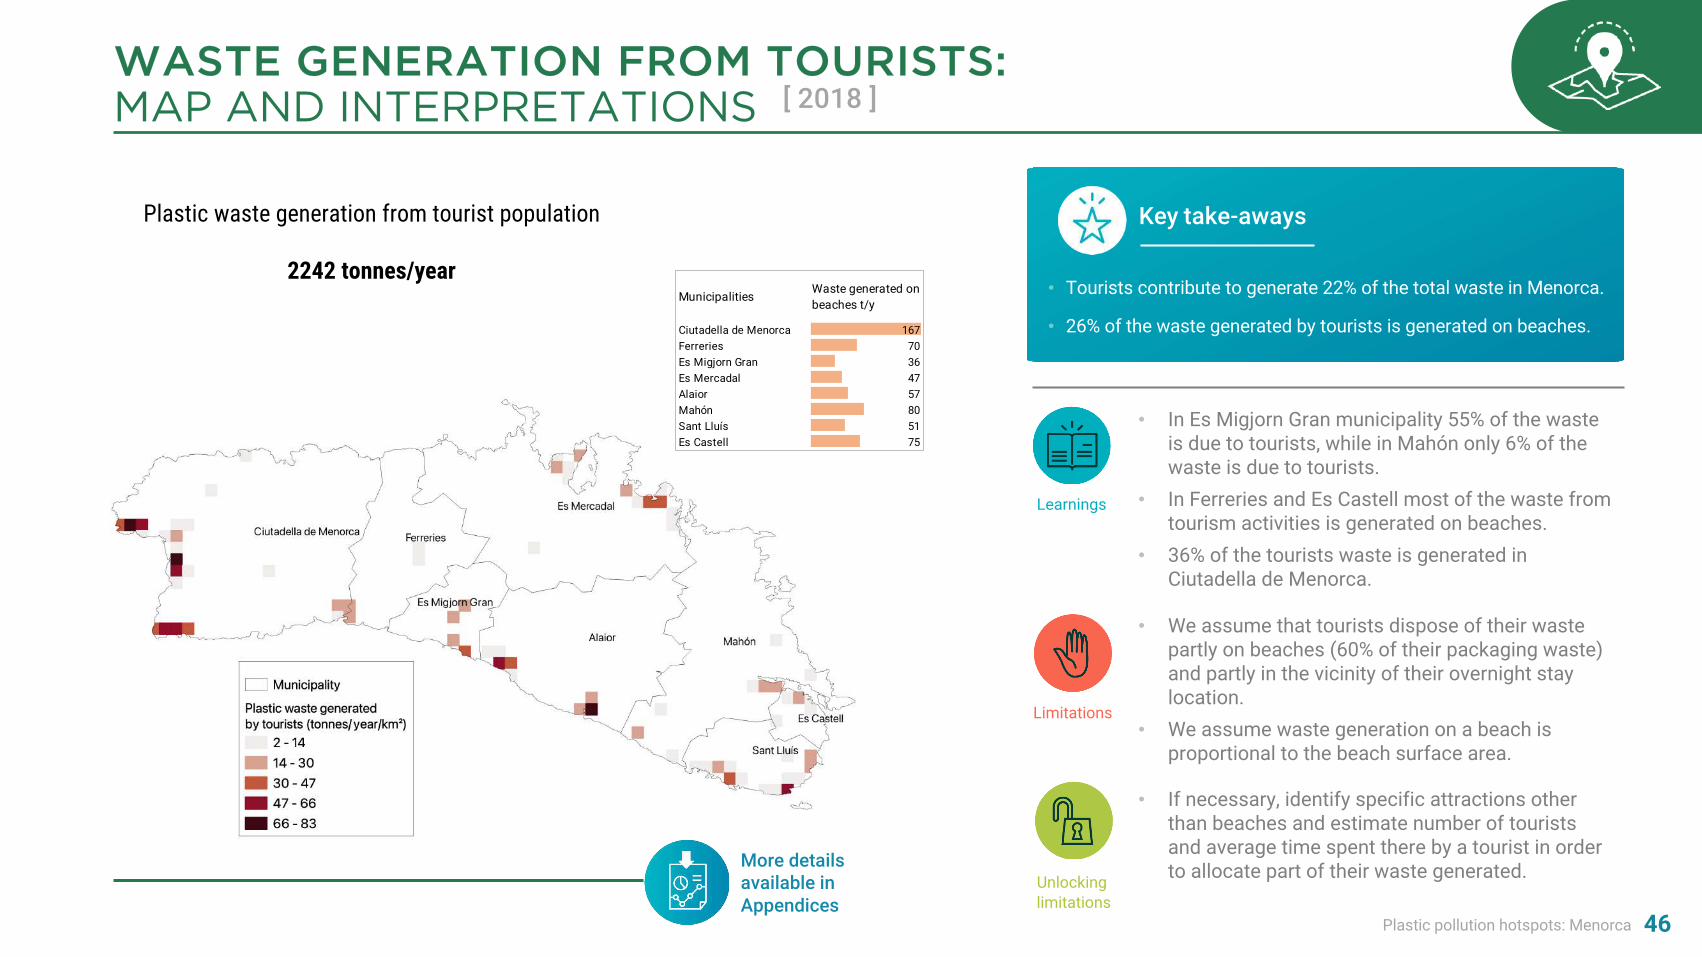
WASTE GENERATION FROM TOURISTS:MAP AND INTERPRETATIONS [ 2018 ]
46
Key take-aways
• Tourists contribute to generate 22% of the total waste in Menorca.
• 26% of the waste generated by tourists is generated on beaches.
Unlocking limitations
• In Es Migjorn Gran municipality 55% of the waste is due to tourists, while in Mahón only 6% of the waste is due to tourists.
• In Ferreries and Es Castell most of the waste from tourism activities is generated on beaches.
• 36% of the tourists waste is generated in Ciutadella de Menorca.
More details available in Appendices
Plastic waste generation from tourist population
2242 tonnes/yearMunicipalities
Waste generated on beaches t/y
Ciutadella de Menorca 167Ferreries 70Es Migjorn Gran 36Es Mercadal 47Alaior 57Mahón 80Sant Lluís 51Es Castell 75
Learnings
Limitations
• We assume that tourists dispose of their waste partly on beaches (60% of their packaging waste) and partly in the vicinity of their overnight stay location.
• We assume waste generation on a beach is proportional to the beach surface area.
• If necessary, identify specific attractions other than beaches and estimate number of tourists and average time spent there by a tourist in order to allocate part of their waste generated.
Plastic pollution hotspots: Menorca
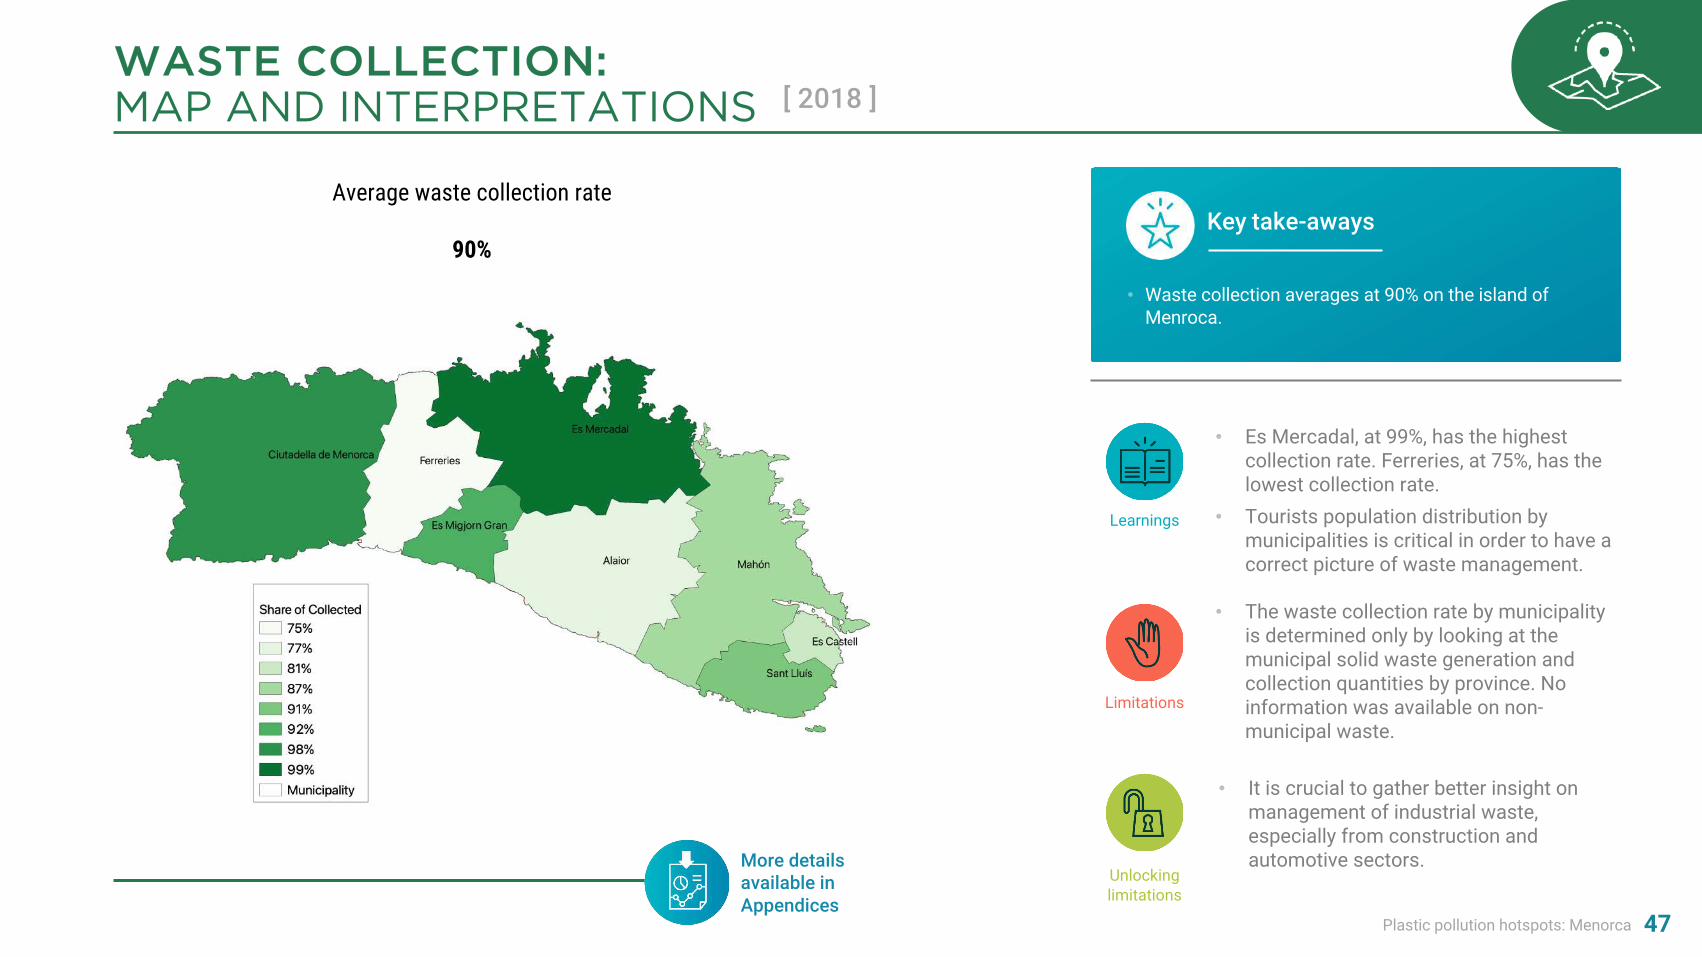
WASTE COLLECTION:MAP AND INTERPRETATIONS [ 2018 ]
47
Key take-aways
Unlockinglimitations
• Waste collection averages at 90% on the island of Menroca.
Learnings
Limitations
• The waste collection rate by municipality is determined only by looking at the municipal solid waste generation and collection quantities by province. No information was available on non-municipal waste.
• It is crucial to gather better insight on management of industrial waste, especially from construction and automotive sectors.More details
available in Appendices
Average waste collection rate
90%
• Es Mercadal, at 99%, has the highest collection rate. Ferreries, at 75%, has the lowest collection rate.
• Tourists population distribution by municipalities is critical in order to have a correct picture of waste management.

Plastic pollution hotspots: Menorca
MISMANAGED WASTE INDEX:MAP AND INTERPRETATIONS [ 2018 ]
48
Key take-aways
• The average MWI is 10% in Menorca.
• Waste mismanagement in Menorca is due to uncollected waste.
Unlockinglimitations
• Generally, mismanaged waste can come either from waste collected but improperly disposed (in open dumps or unsanitary landfills), or from uncollected waste. In Menorca there is no improper disposal of waste, therefore all mismanaged waste comes from uncollected waste.
Learnings
Limitations
More details available in Appendices
Average waste mismanagement rate
10%
• We are not accounting for mismanagement of waste exported for recycling in the country of destination.
• Gather better insight on the fate of waste exported for recycling. Spain, for example, exports waste primarly to Malaysia, Viet Nam, China, Thailand, where part of the waste is mismanaged.
Plastic pollution hotspots: Menorca
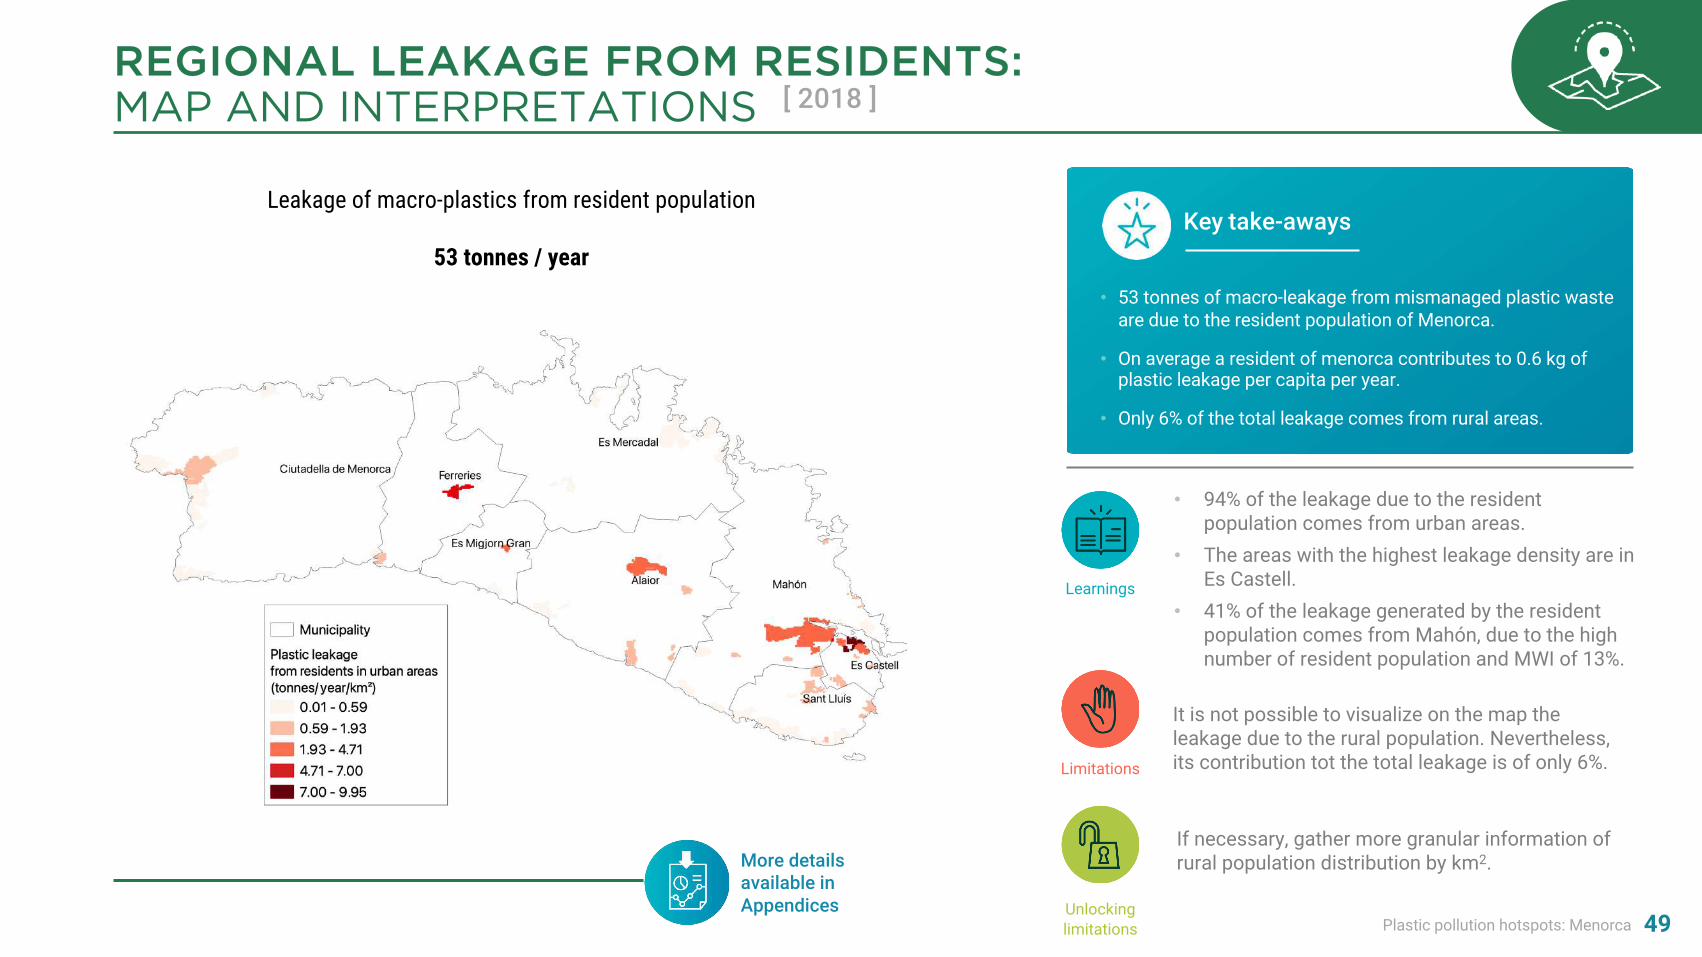
REGIONAL LEAKAGE FROM RESIDENTS:MAP AND INTERPRETATIONS [ 2018 ]
49
Key take-aways
• 53 tonnes of macro-leakage from mismanaged plastic waste are due to the resident population of Menorca.
• On average a resident of menorca contributes to 0.6 kg of plastic leakage per capita per year.
• Only 6% of the total leakage comes from rural areas.
Learnings
More details available in Appendices
Leakage of macro-plastics from resident population
53 tonnes / year
• 94% of the leakage due to the resident population comes from urban areas.
• The areas with the highest leakage density are in Es Castell.
• 41% of the leakage generated by the resident population comes from Mahón, due to the high number of resident population and MWI of 13%.
Limitations
It is not possible to visualize on the map the leakage due to the rural population. Nevertheless, its contribution tot the total leakage is of only 6%.
Unlockinglimitations
If necessary, gather more granular information of rural population distribution by km2.
Plastic pollution hotspots: Menorca
REGIONAL LEAKAGE FROM TOURISTS:MAP AND INTERPRETATIONS [ 2018 ]
50
Key take-aways
• Tourists cause the leakage of 15 tonnes of plastic/year, i.e. 23% of the total leakage.
• 33% of the tourists leakage comes from beaches.
Learnings
More details available in Appendices
Leakage from tourist population
15 tonnes / year MunicipalitiesLeakage from beaches t/y
Ciutadella de Menorca 0.3Ferreries 1.3Es Migjorn Gran 0.2Es Mercadal 0.02Alaior 1.0Mahón 0.8Sant Lluís 0.3Es Castell 1.1
• The municipalities with the most polluted beaches are Ferreries, Es Castell and Alaior, this is mostly caused by the lower collection rates in these municipalities.
• Most of the leakage from tourists in the vicinity of their overnight stay, comes from Alaior, with 4.3 t/y of leakage.
Plastic pollution hotspots: MenorcaPlastic pollution hotspots: Menorca
Plastic pollution hotspots Shaping action3 Appendices4Introduction to the Guidance1 Bibliography52
E
POLYMERHotspots
APPLICATIONHotspots
SECTORHotspots
REGIONALHotspots
WASTE MANAGEMENTHotspots
WASTE MANAGEMENT HOTSPOTS
51

Plastic pollution hotspots: Menorca 52
OBJECTIVE AND INSTRUCTIONS
Key question answered:
Which waste management stages are most critical in the country regarding plastic leakage?
1) We decided for each element* of the waste management system if its contribution to leakage mitigation is positive (coolspot), neutral or negative (hotspot)
2) Understand at a glance the status of the waste management system in the country with this dashboard
*For detailed element descriptions and methodology, refer to tool T4.1
T4

Plastic pollution hotspots: Menorca
Key take-aways
WASTE MANAGEMENT HOTSPOTS
53
Negative contribution to the leakage
Neutral contribution
Not assessed
Positive contribution
For more details and justifications, check tool T4.1
SOUR
CECO
LLEC
TIO
NEN
D-O
F-LI
FE
* Average plastic waste generation per capita values are derived from the What a Waste 2.0 database (Kaza et al., 2018)
• Plastic waste per capita generation (111 kg/cap/day) is well above the Western Europe average* (64 kg/cap day).
• Waste collection rate (90%) is below average in high income countries 96%.
• Waste bins design does not prevent from leakage while waiting for collection.
• Wind and rain are driving release of littered waste within different compartments of the environment.
• Littering is driven by the high tourist season.
WASTEGENERATION
Plastic waste import Plastic waste exportPlastic waste per capita
generationShare of plastic in waste
stream
WASTESEGREGATION
Segregation of compostable waste
Segregation of recyclable plastics
Segregation by the informal sector
Public infrastructure availability
WASTECOLLECTION
Formal collection of municipal waste
Formal collection of industrial waste
Value of recycled plastics
Value of non-recycled plastics
LEAKAGE WHILEWAITING FOR COLLECTION
Design of waste bins Frequency of collection Climatic conditions Other (e.g. animals)
WASTE RELATED BEHAVIOURS
Littering driven by cultural habits
Littering due to a lack of public waste bins
Frequency of fly-tippingFrequency of illegal
burning
WASTE MANAGEMENT
INFRASTRUCTURE
Share of waste in dumpsites
Share of waste in unsanitary landfills
Informal recycling Recycling capacity
POST-LEAKAGEMANAGEMENT
Frequency of city cleaning and sweeping
Frequency of waterway cleaning
Frequency of coastal clean-up
Frequency of other clean-up activities
WASTE WATER MANAGEMENT
Management of run-off waters
Waste water collectionWaste water treatment
efficiencyFate of WWTP sludges
• In 2018, compostable is still not segregated at source.
• Positive aspects include well-functioning infrastructures, decent cleaning frequency and efficient waste water management.

Plastic pollution hotspots: Menorca
Plastic pollution hotspots Shaping action3 Appendices4Introduction to the Guidance1 Bibliography52
54
ACTIONABLE HOTSPOTS2.3

Plastic pollution hotspots: Menorca
3 highest leakage contributorsin absolute OR relative value
Highest leakage contributors in absolute AND relative value
55
HOTSPOTS IN BRIEF
Polymer Application Sector Waste managementRegional
Negative contribution to the leakage
Neutral contribution
Positive contribution
Not assessed
PET
LDPE
PP
Synthetic Rubber
HDPE
Polyester
PS
PVC
Other
Packaging
Tourism
Fishing
Medical
Textile
Agriculture
Electrical & electronics
Automotive-other
Construction
Automotive-tyres
WASTEGENERATION
Plastic waste import Plastic waste exportPlastic waste per capita
generationShare of plastic in waste
stream
WASTESEGREGATION
Segregation of compostable waste
Segregation of recyclable plastics
Segregation by the informal sector
Public infrastructure availability
WASTECOLLECTION
Formal collection of municipal waste
Formal collection of industrial waste
Value of recycled plastics
Value of non-recycled plastics
LEAKAGE WHILEWAITING FOR COLLECTION
Design of waste bins Frequency of collection Climatic conditions Other (e.g. animals)
WASTE RELATED BEHAVIOURS
Littering driven by cultural habits
Littering due to a lack of public waste bins
Frequency of fly-tippingFrequency of illegal
burning
WASTE MANAGEMENT
INFRASTRUCTURE
Share of waste in dumpsites
Share of waste in unsanitary landfills
Informal recycling Recycling capacity
POST-LEAKAGEMANAGEMENT
Frequency of city cleaning and sweeping
Frequency of waterway cleaning
Frequency of coastal clean-up
Frequency of other clean-up activities
WASTE WATER MANAGEMENT
Management of run-off waters
Waste water collectionWaste water treatment
efficiencyFate of WWTP sludges
MunicipalitiesLeakage from beaches t/y
Ciutadella de Menorca 0.3Ferreries 1.3Es Migjorn Gran 0.2Es Mercadal 0.02Alaior 1.0Mahón 0.8Sant Lluís 0.3Es Castell 1.1
Plastic pollution hotspots: Menorca
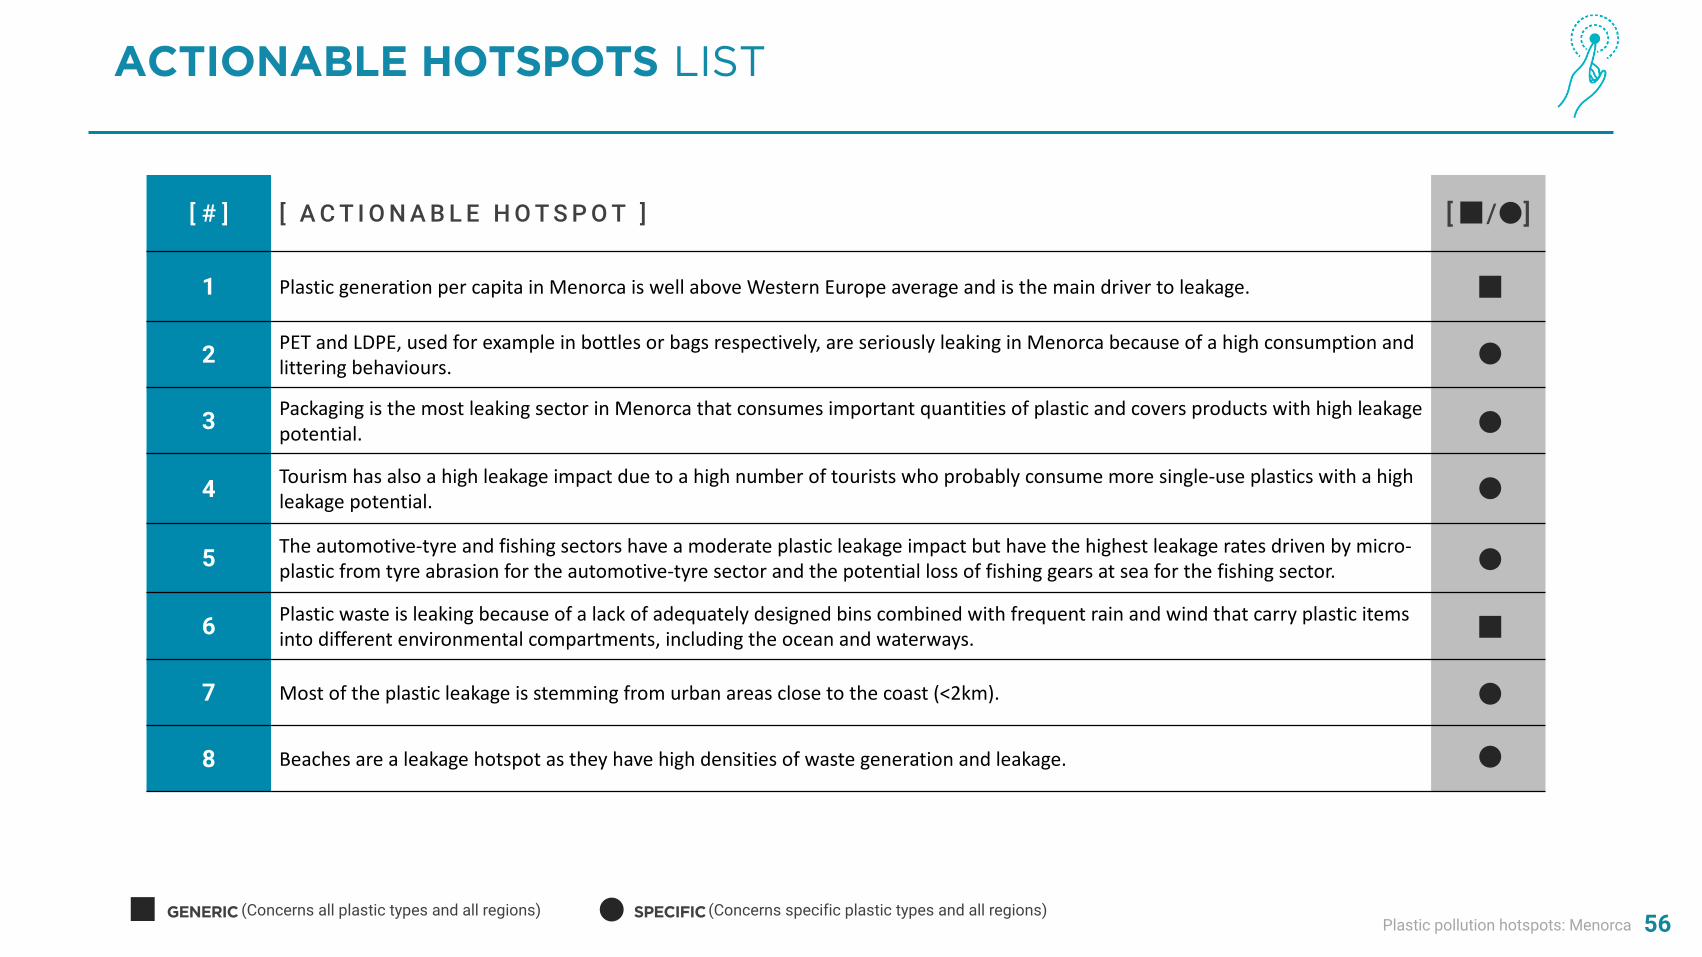
[ # ] [ A C T I O N A B L E H O T S P O T ] [ / ]
1 Plastic generation per capita in Menorca is well above Western Europe average and is the main driver to leakage.
2 PET and LDPE, used for example in bottles or bags respectively, are seriously leaking in Menorca because of a high consumption and littering behaviours.
3 Packaging is the most leaking sector in Menorca that consumes important quantities of plastic and covers products with high leakage potential.
4 Tourism has also a high leakage impact due to a high number of tourists who probably consume more single-use plastics with a high leakage potential.
5 The automotive-tyre and fishing sectors have a moderate plastic leakage impact but have the highest leakage rates driven by micro-plastic from tyre abrasion for the automotive-tyre sector and the potential loss of fishing gears at sea for the fishing sector.
6 Plastic waste is leaking because of a lack of adequately designed bins combined with frequent rain and wind that carry plastic items into different environmental compartments, including the ocean and waterways.
7 Most of the plastic leakage is stemming from urban areas close to the coast (<2km).
8 Beaches are a leakage hotspot as they have high densities of waste generation and leakage.
56
ACTIONABLE HOTSPOTS LIST
GENERIC (Concerns all plastic types and all regions) SPECIFIC (Concerns specific plastic types and all regions)

Plastic pollution hotspots: Menorca 57
ACTIONABLE HOTSPOTS CHARACTERISATION
COLLECTIONSOURCE
END-OF-LIFE
GENERIC (Concerns all plastic types and all regions)
SPECIFIC (Concerns specific plastic types or regions)
1
34
5
7 8
2
Each actionable hotspot can address plastic pollution at one or multiple stages along the plastic value
chain. We notice that the list of actionable hotspots for Menorca calls for interventions at both plastic
source and end-of-life stages.
6

Plastic pollution hotspots: Menorca 58
SHAPINGACTION
3

Plastic pollution hotspots: Menorca
Plastic pollution hotspots Shaping action Appendices4Introduction to the Guidance1 Bibliography52 3
59
INTERVENTIONS3.1

Plastic pollution hotspots: Menorca 60
METHODOLOGY FOR IDENTIFYING INTERVENTIONS
Actionable hotspots (AH)
AH 1AH 2AH 3
…AH x
Interventions (I) Leakage mitigation potential*
Unintended consequences**
I1
I2 medium medium
I3 high low
I4
I5
…
I79 medium high
I80
I81
I82 high medium
I83
* Leakage mitigation potential: high mitigation potential actions are those that contribute to meaningful reductions of plastic leakage and impacts.** Unintended consequences: highly consequential actions are those most likely to generate unintended environmental or socio-economic trade-offs (e.g., substitution from plastic to another material may generate additional environmental impacts such as GHG emissions).
STEP 1: choose up to 3 interventions for each actionable hotspot
STEP 2: assess criteria levels for each chosen intervention
STEP 3: visualise priority interventions in the top right corner of the chart
S2
Intervention 79
Intervention 82
Intervention 2
Intervention X
Intervention 3
Priority InterventionsMitigation Potential*
Unintended Consequences**
HIGHPlastic leakage
mitigation
MEDIUMPlastic leakage
mitigation
LOWPlastic leakage
mitigation
HIGHwith acute
environmental andsocio-economic
trade-off
MEDIUMwith potential
environmental and socio-economic
trade-off
LOWwith no
environmental and socio-economic
trade-off
Plastic pollution hotspots: Menorca 61
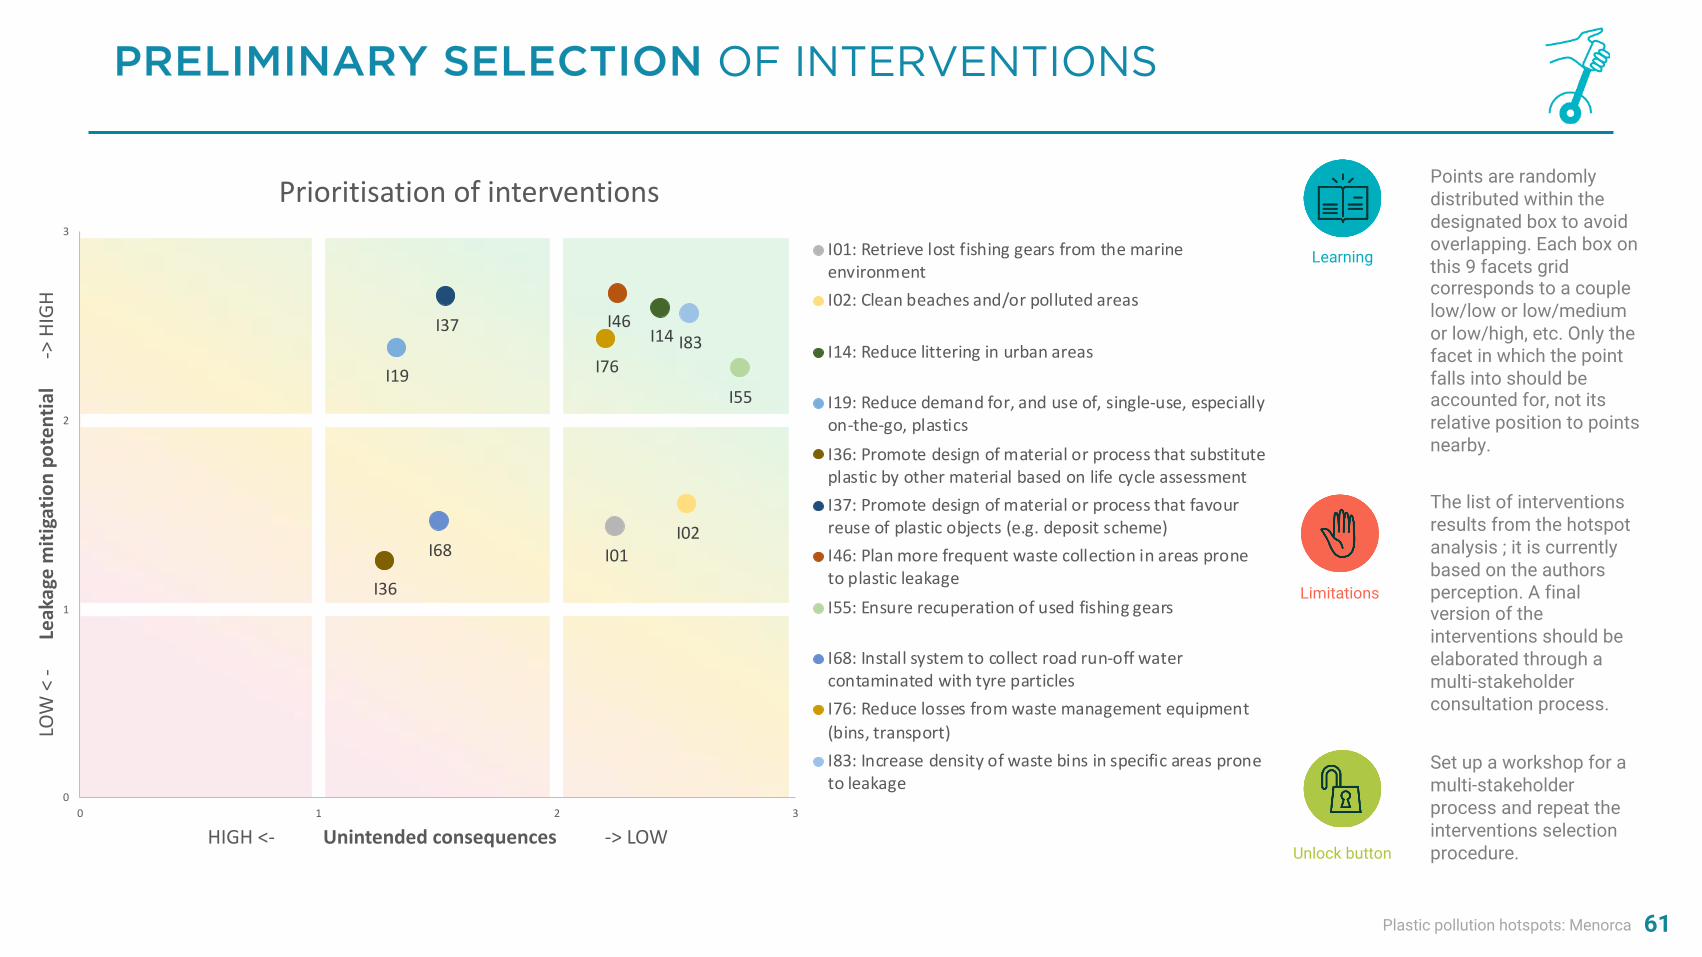
PRELIMINARY SELECTION OF INTERVENTIONS
Unlock button
Points are randomly distributed within the designated box to avoid overlapping. Each box on this 9 facets grid corresponds to a couple low/low or low/medium or low/high, etc. Only the facet in which the point falls into should be accounted for, not its relative position to points nearby.
Learning
Limitations
The list of interventions results from the hotspot analysis ; it is currently based on the authors perception. A final version of the interventions should be elaborated through a multi-stakeholder consultation process.
Set up a workshop for a multi-stakeholder process and repeat the interventions selection procedure.
I01I02
I14
I19
I36
I37 I46
I55
I68
I76I83
0
1
2
3
0 1 2 3
LOW
< -
Leak
age
miti
gatio
n po
tent
ial
->
HIG
H
HIGH <- Unintended consequences -> LOW
Prioritisation of interventions
I01: Retrieve lost fishing gears from the marineenvironment
I02: Clean beaches and/or polluted areas
I14: Reduce littering in urban areas
I19: Reduce demand for, and use of, single-use, especiallyon-the-go, plastics
I36: Promote design of material or process that substituteplastic by other material based on life cycle assessment
I37: Promote design of material or process that favourreuse of plastic objects (e.g. deposit scheme)
I46: Plan more frequent waste collection in areas proneto plastic leakage
I55: Ensure recuperation of used fishing gears
I68: Install system to collect road run-off watercontaminated with tyre particles
I76: Reduce losses from waste management equipment(bins, transport)
I83: Increase density of waste bins in specific areas proneto leakage
Plastic pollution hotspots: Menorca 62
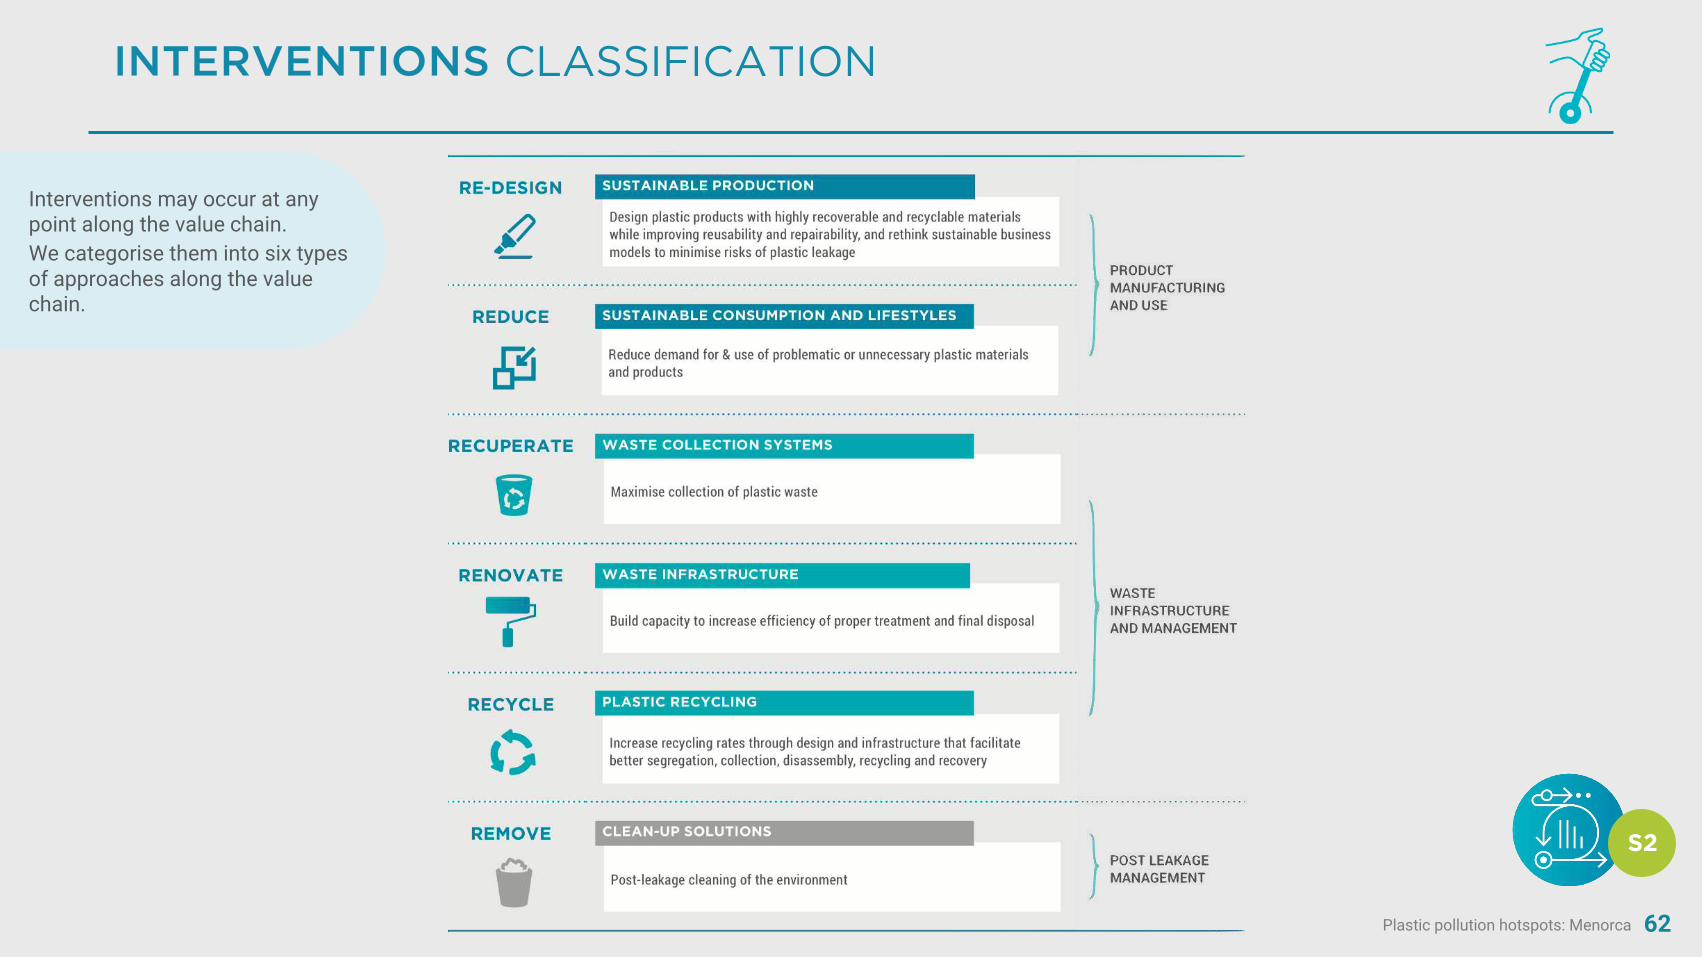
INTERVENTIONS CLASSIFICATION
S2
Interventions may occur at any point along the value chain.We categorise them into six types of approaches along the valuechain.
Plastic pollution hotspots: Menorca 63
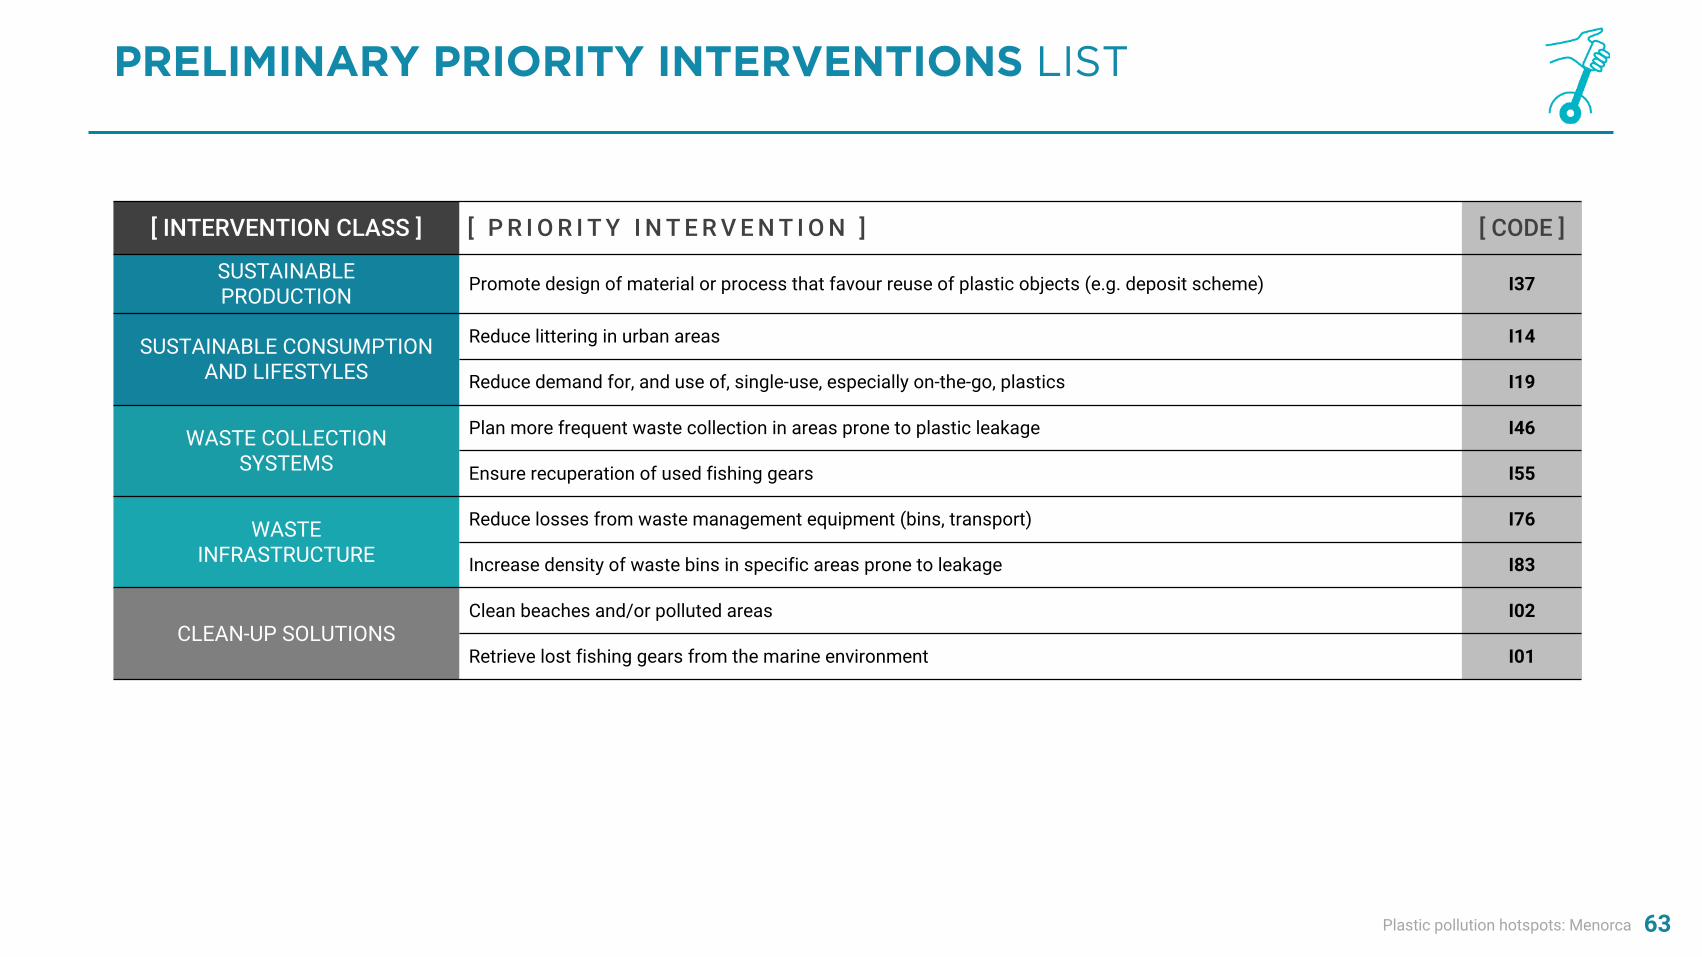
PRELIMINARY PRIORITY INTERVENTIONS LIST
[ INTERVENTION CLASS ] [ P R I O R I T Y I N T E R V E N T I O N ] [ CODE ]
SUSTAINABLEPRODUCTION Promote design of material or process that favour reuse of plastic objects (e.g. deposit scheme) I37
SUSTAINABLE CONSUMPTION AND LIFESTYLES
Reduce littering in urban areas I14
Reduce demand for, and use of, single-use, especially on-the-go, plastics I19
WASTE COLLECTION SYSTEMS
Plan more frequent waste collection in areas prone to plastic leakage I46
Ensure recuperation of used fishing gears I55
WASTE INFRASTRUCTURE
Reduce losses from waste management equipment (bins, transport) I76
Increase density of waste bins in specific areas prone to leakage I83
CLEAN-UP SOLUTIONSClean beaches and/or polluted areas I02
Retrieve lost fishing gears from the marine environment I01
Plastic pollution hotspots: Menorca
Plastic pollution hotspots Shaping action Appendices4Introduction to the Guidance1 Bibliography52 3
64
INSTRUMENTS3.2

Plastic pollution hotspots: Menorca 65
METHODOLOGY FOR IDENTIFYING INSTRUMENTS
Intervention (I)
I2I3…
I79I82
Instruments (J) Feasability* Synergies**
J1
J2 medium medium
J3 high high
J4
J5
…
J79 medium low
J80
J81
J82 high medium
J83
* Feasability: technical and socio-economic assessment of each instrument should be performed. We do not assert a method to perform the assessment as this is beyond the scope of the Guidance. The user can decide on the method to use based on resources available. A by default qualitative assessment with three levels is suggested.
** Synergies: Some instruments may be beneficial to multiple interventions, thus creating a positive synergetic effect. This criterion does not only evaluate the number of suggested interventions benefitting from an instrument, but also assess if the proposed instrument harmonises well with instruments already in place.
STEP 1: choose up to 3 instruments for each intervention selected in S2
STEP 2: assess criteria levels for each chosen instrument
STEP 3: visualise priority instruments in the top right corner of the chart
Instrument79
Instrument82
Instrument2
InstrumentX
Instrument3
Priority instrumentsSynergies**
Feasability*
HIGHMany interventions
are positively affectedby the instruments
and the latterharmonises well with
pre-existinginstruments
MEDIUMMany interventions
are positively affected by the
instrument
LOWOnly few
interventions are positively affected by the instrument
LOW MEDIUM HIGH
S3

Plastic pollution hotspots: Menorca 66
LIST OF POSSIBLE INSTRUMENT CATEGORIES
S3
Knowledge creation
Database
Mapping
Expertise
Businesses
Citizens
Waste sector
Partnership
Structuration
R&D SocialTechnology fisheries Technology microplastics Technology waste
Incentive
Informal sector
Investment
New business models Tax
Ban
Extended producer responsability (EPR)
Enforcement
Industry regulation
Municipality regulation
Trade regulation
Waste sector regulation
Standardisation
Monitoring
Awareness raising
INSTRUMENTS
Capacity building
Economic
Innovation
Policy / Regulatory
Plastic pollution hotspots: Menorca 67
APPENDICES4
Plastic pollution hotspots: Menorca
Plastic pollution hotspots Shaping action AppendicesIntroduction to the Guidance1 Bibliography52 3 4
68
DATAREPOSITORY
4.1
Plastic pollution hotspots: Menorca 69
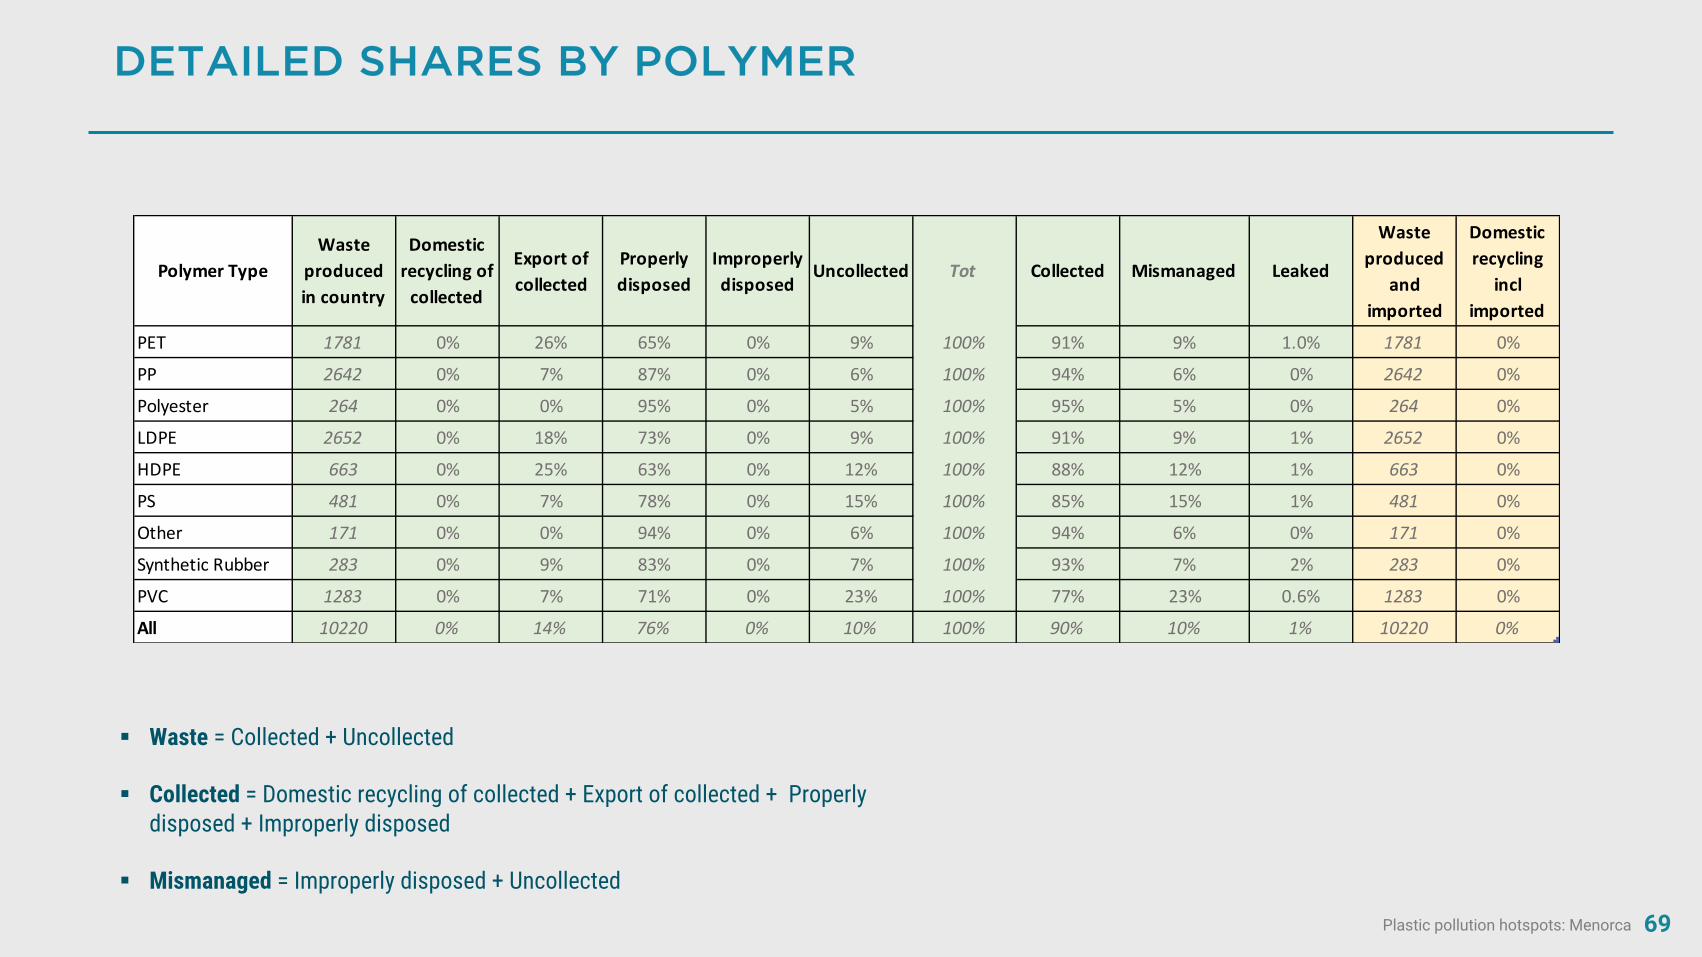
DETAILED SHARES BY POLYMER
§ Waste = Collected + Uncollected
§ Collected = Domestic recycling of collected + Export of collected + Properly disposed + Improperly disposed
§ Mismanaged = Improperly disposed + Uncollected
Polymer TypeWaste
produced in country
Domestic recycling of
collected
Export of collected
Properly disposed
Improperly disposed
Uncollected Tot Collected Mismanaged Leaked
Waste produced
and imported
Domestic recycling
incl imported
PET 1781 0% 26% 65% 0% 9% 100% 91% 9% 1.0% 1781 0%PP 2642 0% 7% 87% 0% 6% 100% 94% 6% 0% 2642 0%Polyester 264 0% 0% 95% 0% 5% 100% 95% 5% 0% 264 0%LDPE 2652 0% 18% 73% 0% 9% 100% 91% 9% 1% 2652 0%HDPE 663 0% 25% 63% 0% 12% 100% 88% 12% 1% 663 0%PS 481 0% 7% 78% 0% 15% 100% 85% 15% 1% 481 0%Other 171 0% 0% 94% 0% 6% 100% 94% 6% 0% 171 0%Synthetic Rubber 283 0% 9% 83% 0% 7% 100% 93% 7% 2% 283 0%PVC 1283 0% 7% 71% 0% 23% 100% 77% 23% 0.6% 1283 0%All 10220 0% 14% 76% 0% 10% 100% 90% 10% 1% 10220 0%
Plastic pollution hotspots: Menorca 70
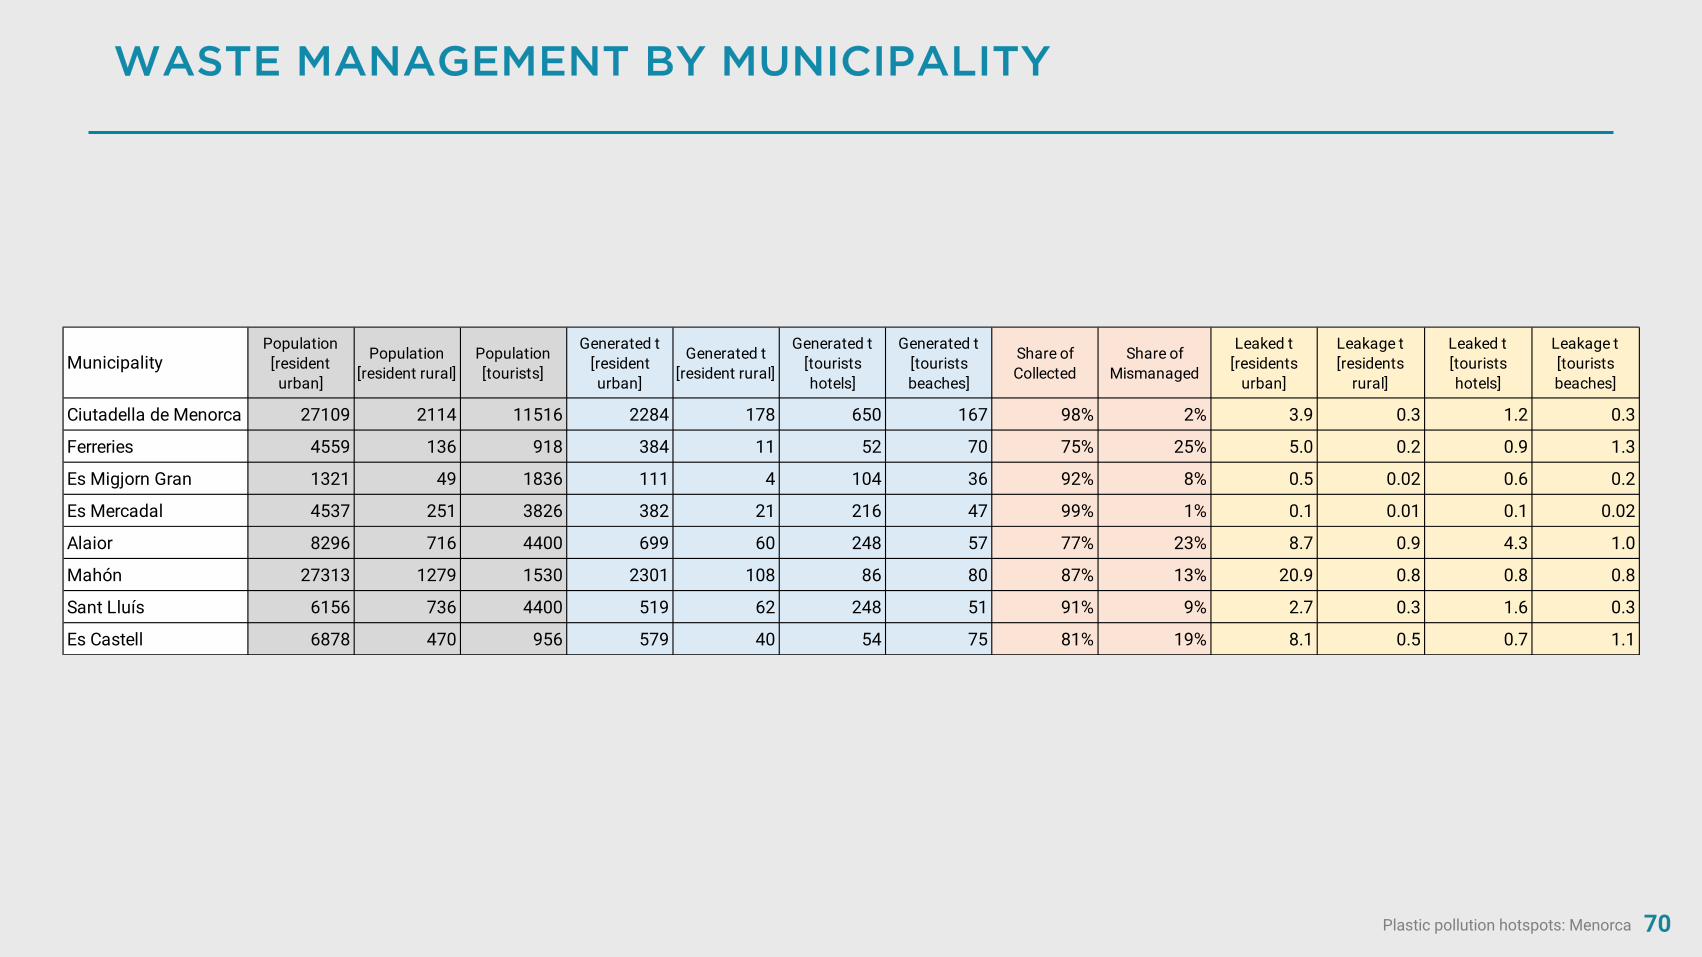
WASTE MANAGEMENT BY MUNICIPALITY
MunicipalityPopulation
[resident urban]
Population [resident rural]
Population [tourists]
Generated t [resident urban]
Generated t [resident rural]
Generated t[tourists hotels]
Generated t [tourists beaches]
Share of Collected
Share of Mismanaged
Leaked t [residents
urban]
Leakage t [residents
rural]
Leaked t[tourists hotels]
Leakage t[tourists beaches]
Ciutadella de Menorca 27109 2114 11516 2284 178 650 167 98% 2% 3.9 0.3 1.2 0.3
Ferreries 4559 136 918 384 11 52 70 75% 25% 5.0 0.2 0.9 1.3
Es Migjorn Gran 1321 49 1836 111 4 104 36 92% 8% 0.5 0.02 0.6 0.2
Es Mercadal 4537 251 3826 382 21 216 47 99% 1% 0.1 0.01 0.1 0.02
Alaior 8296 716 4400 699 60 248 57 77% 23% 8.7 0.9 4.3 1.0
Mahón 27313 1279 1530 2301 108 86 80 87% 13% 20.9 0.8 0.8 0.8
Sant Lluís 6156 736 4400 519 62 248 51 91% 9% 2.7 0.3 1.6 0.3
Es Castell 6878 470 956 579 40 54 75 81% 19% 8.1 0.5 0.7 1.1

Plastic pollution hotspots: Menorca
Plastic pollution hotspots Shaping action AppendicesIntroduction to the Guidance1 Bibliography52 3 4
71
DATAQUALITY ASSESSMENT
4.2
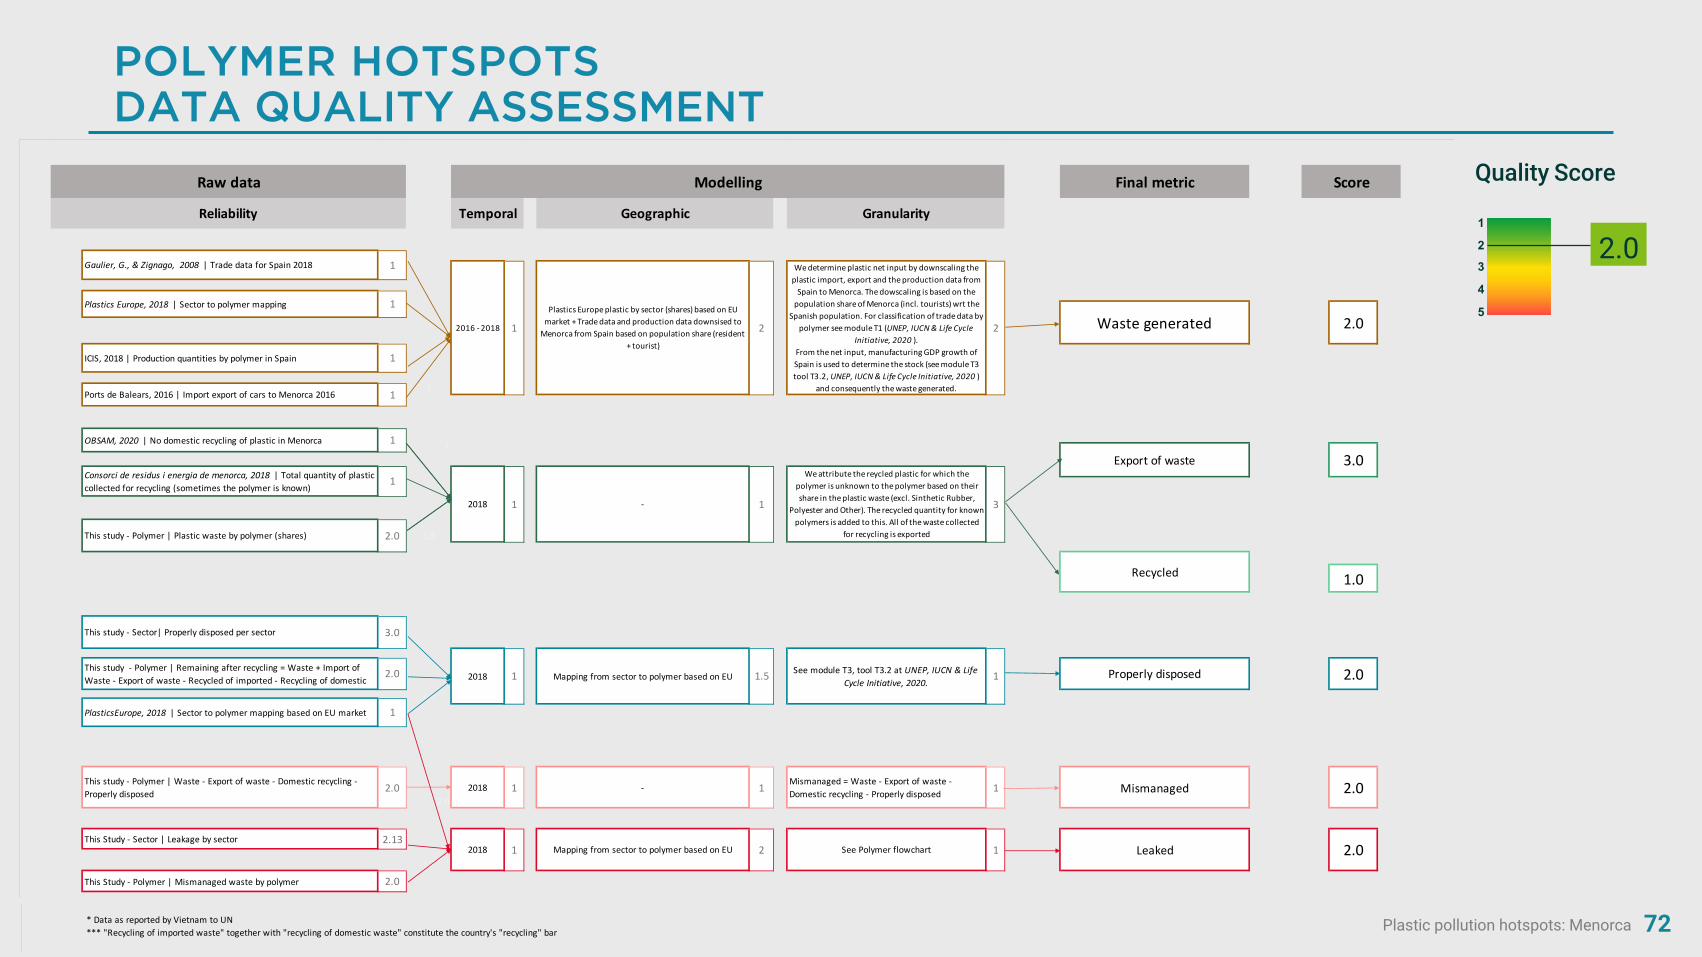
Plastic pollution hotspots: Menorca 72
POLYMER HOTSPOTSDATA QUALITY ASSESSMENT
2.01
23
4
5
Quality ScoreFinal metric
1
1.0
This study - Polymer | Waste - Export of waste - Domestic recycling - Properly disposed 2.0
2.02018 1 - 1 Mismanaged = Waste - Export of waste -
Domestic recycling - Properly disposed 1 Mismanaged 2.0
This Study - Sector | Leakage by sector 2.13
This Study - Polymer | Mismanaged waste by polymer 2.0
* Data as reported by Vietnam to UN*** "Recycling of imported waste" together with "recycling of domestic waste" constitute the country's "recycling" bar
1
Plastics Europe plastic by sector (shares) based on EU market + Trade data and production data downsised to
Menorca from Spain based on population share (resident + tourist)
22016 - 2018 1
Plastics Europe, 2018 | Sector to polymer mapping 1
2.0
ICIS, 2018 | Production quantities by polymer in Spain 1
Waste generated
We determine plastic net input by downscaling the plastic import, export and the production data from
Spain to Menorca. The dowscaling is based on the population share of Menorca (incl. tourists) wrt the
Spanish population. For classification of trade data by polymer see module T1 (UNEP, IUCN & Life Cycle
Initiative, 2020 ).From the net input, manufacturing GDP growth of Spain is used to determine the stock (see module T3 tool T3.2, UNEP, IUCN & Life Cycle Initiative, 2020 )
and consequently the waste generated.
OBSAM, 2020 | No domestic recycling of plastic in Menorca 1
Export of waste 3.0
Raw data Modelling Score
Reliability Temporal Geographic Granularity
Gaulier, G., & Zignago, 2008 | Trade data for Spain 2018 1
Ports de Balears, 2016 | Import export of cars to Menorca 2016 1
2
This study - Sector| Properly disposed per sector 3.0
Recycled
Consorci de residus i energia de menorca, 2018 | Total quantity of plastic collected for recycling (sometimes the polymer is known)
1
This study - Polymer | Plastic waste by polymer (shares) 2.0
We attribute the reycled plastic for which the polymer is unknown to the polymer based on their share in the plastic waste (excl. Sinthetic Rubber,
Polyester and Other). The recycled quantity for known polymers is added to this. All of the waste collected
for recycling is exported
3- 12018 1
1.3
Properly disposed 2.02.0
2018 1 Mapping from sector to polymer based on EU 1.5 See module T3, tool T3.2 at UNEP, IUCN & Life Cycle Initiative, 2020.
PlasticsEurope, 2018 | Sector to polymer mapping based on EU market 1
1This study - Polymer | Remaining after recycling = Waste + Import of Waste - Export of waste - Recycled of imported - Recycling of domestic
2.0
See Polymer flowchart 1 Leaked 2.01.7
2018 1 Mapping from sector to polymer based on EU 2
Final metric
1
1.0
This study - Polymer | Waste - Export of waste - Domestic recycling - Properly disposed 2.0
2.02018 1 - 1 Mismanaged = Waste - Export of waste -
Domestic recycling - Properly disposed 1 Mismanaged 2.0
This Study - Sector | Leakage by sector 2.13
This Study - Polymer | Mismanaged waste by polymer 2.0
* Data as reported by Vietnam to UN*** "Recycling of imported waste" together with "recycling of domestic waste" constitute the country's "recycling" bar
1
Plastics Europe plastic by sector (shares) based on EU market + Trade data and production data downsised to
Menorca from Spain based on population share (resident + tourist)
22016 - 2018 1
Plastics Europe, 2018 | Sector to polymer mapping 1
2.0
ICIS, 2018 | Production quantities by polymer in Spain 1
Waste generated
We determine plastic net input by downscaling the plastic import, export and the production data from
Spain to Menorca. The dowscaling is based on the population share of Menorca (incl. tourists) wrt the
Spanish population. For classification of trade data by polymer see module T1 (UNEP, IUCN & Life Cycle
Initiative, 2020 ).From the net input, manufacturing GDP growth of Spain is used to determine the stock (see module T3 tool T3.2, UNEP, IUCN & Life Cycle Initiative, 2020 )
and consequently the waste generated.
OBSAM, 2020 | No domestic recycling of plastic in Menorca 1
Export of waste 3.0
Raw data Modelling Score
Reliability Temporal Geographic Granularity
Gaulier, G., & Zignago, 2008 | Trade data for Spain 2018 1
Ports de Balears, 2016 | Import export of cars to Menorca 2016 1
2
This study - Sector| Properly disposed per sector 3.0
Recycled
Consorci de residus i energia de menorca, 2018 | Total quantity of plastic collected for recycling (sometimes the polymer is known)
1
This study - Polymer | Plastic waste by polymer (shares) 2.0
We attribute the reycled plastic for which the polymer is unknown to the polymer based on their share in the plastic waste (excl. Sinthetic Rubber,
Polyester and Other). The recycled quantity for known polymers is added to this. All of the waste collected
for recycling is exported
3- 12018 1
1.3
Properly disposed 2.02.0
2018 1 Mapping from sector to polymer based on EU 1.5 See module T3, tool T3.2 at UNEP, IUCN & Life Cycle Initiative, 2020.
PlasticsEurope, 2018 | Sector to polymer mapping based on EU market 1
1This study - Polymer | Remaining after recycling = Waste + Import of Waste - Export of waste - Recycled of imported - Recycling of domestic
2.0
See Polymer flowchart 1 Leaked 2.01.7
2018 1 Mapping from sector to polymer based on EU 2

Plastic pollution hotspots: Menorca 73
SECTOR HOTSPOTSDATA QUALITY ASSESSMENT
1
23
4
5
Quality Score
1.8
Final metric
1.5
1
This study - Sector | Export for recycling by sector 2
OBSAM, 2020 | There are some illegal dumpsites 1
This study - Sector | Waste - Export of waste - Domestic recycling - Properly disposed - Improperly disposed 1.8
1.42018 1 - 1
Uncollected = Waste - Export of waste - Domestic recycling - Properly disposed - Improperly disposed
1 Mismanaged 1.4
This Study - Sector | Mismanaged 1.4
Plastic Leak Project, 2019 | Release Rate by sector (base on product size and value for informal recyclers) 3
Leakage 2.1This Study - Regional | Total Macro-leakage 2
1
Consorci de residus i energia de menorca, 2018 | Plastic collected for recycling by sector
1Export of waste
- 1
1.0
2018 1 - 1
1
Raw data Modelling Score
Reliability Temporal Geographic Granularity
This study - Sector | Waste generated by sector 2.0
Consorci de residus i energia de menorca, 2018 | Total plastic in municipal waste being collected 1
This Study - Sector | Micro-leakage by sector (see additional notes) 2
Country specific littering habits are not accounted for. 2 See additional notes
Plastic Leak Project, 2019 | Littering rate by Sector (based on product size and type of usage)
3
2.0
3.02018 31 Properly disposed
Recycled
This study - polymer | Total plastic waste generated 2
OBSAM, 2020 | No domestic recycling of plastic in Menorca 1.0
Waste generated
2
For Micro-leakage computation see additional notes, for Macro-leakage see sector hotspot flowchart, except for fishing (see additional
notes)2.13
2018 1 - 1
2.0Plastics Europe, 2018 | Plastic by sector (shares) 1
1
2018 1 Plastics Europe plastic by sector (shares) based on EU market and not specific to Menorca 2
Mapping of waste generated by polymer to obtain waste generation by sector. See module
T3, tool T3.2 at UNEP, IUCN & Life Cycle Initiative, 2020.
1Consorci de residus i energia de menorca, 2018 | Plastic waste characterisation for electrical & electronics, automotive-tyres and agriculture sector
1
Plastic pollution hotspots: Menorca 74
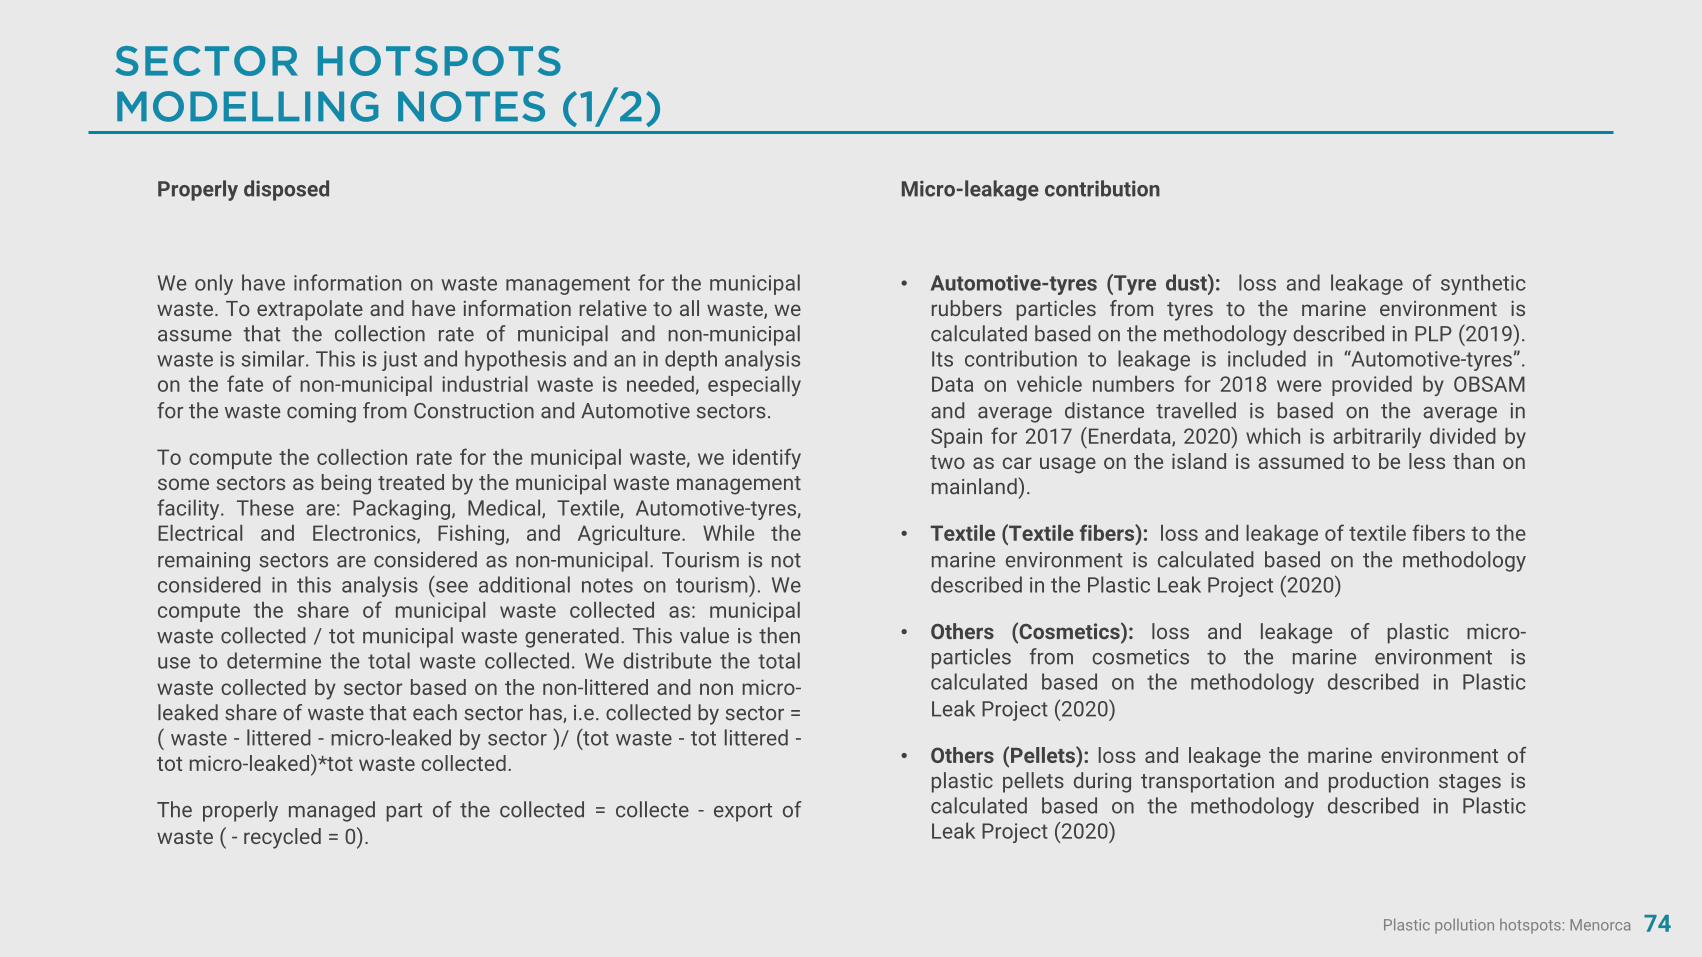
SECTOR HOTSPOTSMODELLING NOTES (1/2)
Properly disposed
We only have information on waste management for the municipalwaste. To extrapolate and have information relative to all waste, weassume that the collection rate of municipal and non-municipalwaste is similar. This is just and hypothesis and an in depth analysison the fate of non-municipal industrial waste is needed, especiallyfor the waste coming from Construction and Automotive sectors.
To compute the collection rate for the municipal waste, we identifysome sectors as being treated by the municipal waste managementfacility. These are: Packaging, Medical, Textile, Automotive-tyres,Electrical and Electronics, Fishing, and Agriculture. While theremaining sectors are considered as non-municipal. Tourism is notconsidered in this analysis (see additional notes on tourism). Wecompute the share of municipal waste collected as: municipalwaste collected / tot municipal waste generated. This value is thenuse to determine the total waste collected. We distribute the totalwaste collected by sector based on the non-littered and non micro-leaked share of waste that each sector has, i.e. collected by sector =( waste - littered - micro-leaked by sector )/ (tot waste - tot littered -tot micro-leaked)*tot waste collected.
The properly managed part of the collected = collecte - export ofwaste ( - recycled = 0).
Micro-leakage contribution
• Automotive-tyres (Tyre dust): loss and leakage of syntheticrubbers particles from tyres to the marine environment iscalculated based on the methodology described in PLP (2019).Its contribution to leakage is included in “Automotive-tyres”.Data on vehicle numbers for 2018 were provided by OBSAMand average distance travelled is based on the average inSpain for 2017 (Enerdata, 2020) which is arbitrarily divided bytwo as car usage on the island is assumed to be less than onmainland).
• Textile (Textile fibers): loss and leakage of textile fibers to themarine environment is calculated based on the methodologydescribed in the Plastic Leak Project (2020)
• Others (Cosmetics): loss and leakage of plastic micro-particles from cosmetics to the marine environment iscalculated based on the methodology described in PlasticLeak Project (2020)
• Others (Pellets): loss and leakage the marine environment ofplastic pellets during transportation and production stages iscalculated based on the methodology described in PlasticLeak Project (2020)

Plastic pollution hotspots: Menorca 75
SECTOR HOTSPOTSMODELLING NOTES (1/2)
Fishing: Data on number of fishing vessels (artisanal andcommercial) comes from OBSAM. We assume artisanal vesselshave one longline and one gillnet, while commercial vessel use onmidwater trawl. By default plastic weights by fishing gear typewere derived from technical designs found in multiplepublications including FAO and Nédélec et al., 1990. Combiningthese two pieces of information yields the net plastic input fromfishing gears. By estimating the lifetime of a fishing net and bylooking at the GDP growth of Spain, we estimate the amount offishing nets going to waste from previous years.
Medical: In order to know the amount of plastic going to wastefrom the medical sector we multiply the number of hospital bedsin Menorca (OBSAM, 2020) by the occupancy rate (80%), theamount of waste generated per bed per day (Minoglou et al.,2017), and the plastic share of medical waste (20%).
Tourism: Data on number of tourists and average stay lengthcomes OBSAM. We assume tourist and local population havethe same daily plastic waste generation. We assume thattourists contributes to waste generation in all sectors, not onlypackaging. For example, cars are made available for renting fortourists (automotive-tyres and automotive-others). We thereforecompute all waste management quantities for the tourismsector by computing the analysis without the tourism sectorand the allocating a share of each sector to the tourism basedon the tourist population share. The tourist population share iscomputed as = nb tourists*average lenghts of stay / 365 / totalresident population.
Plastic pollution hotspots: Menorca 76
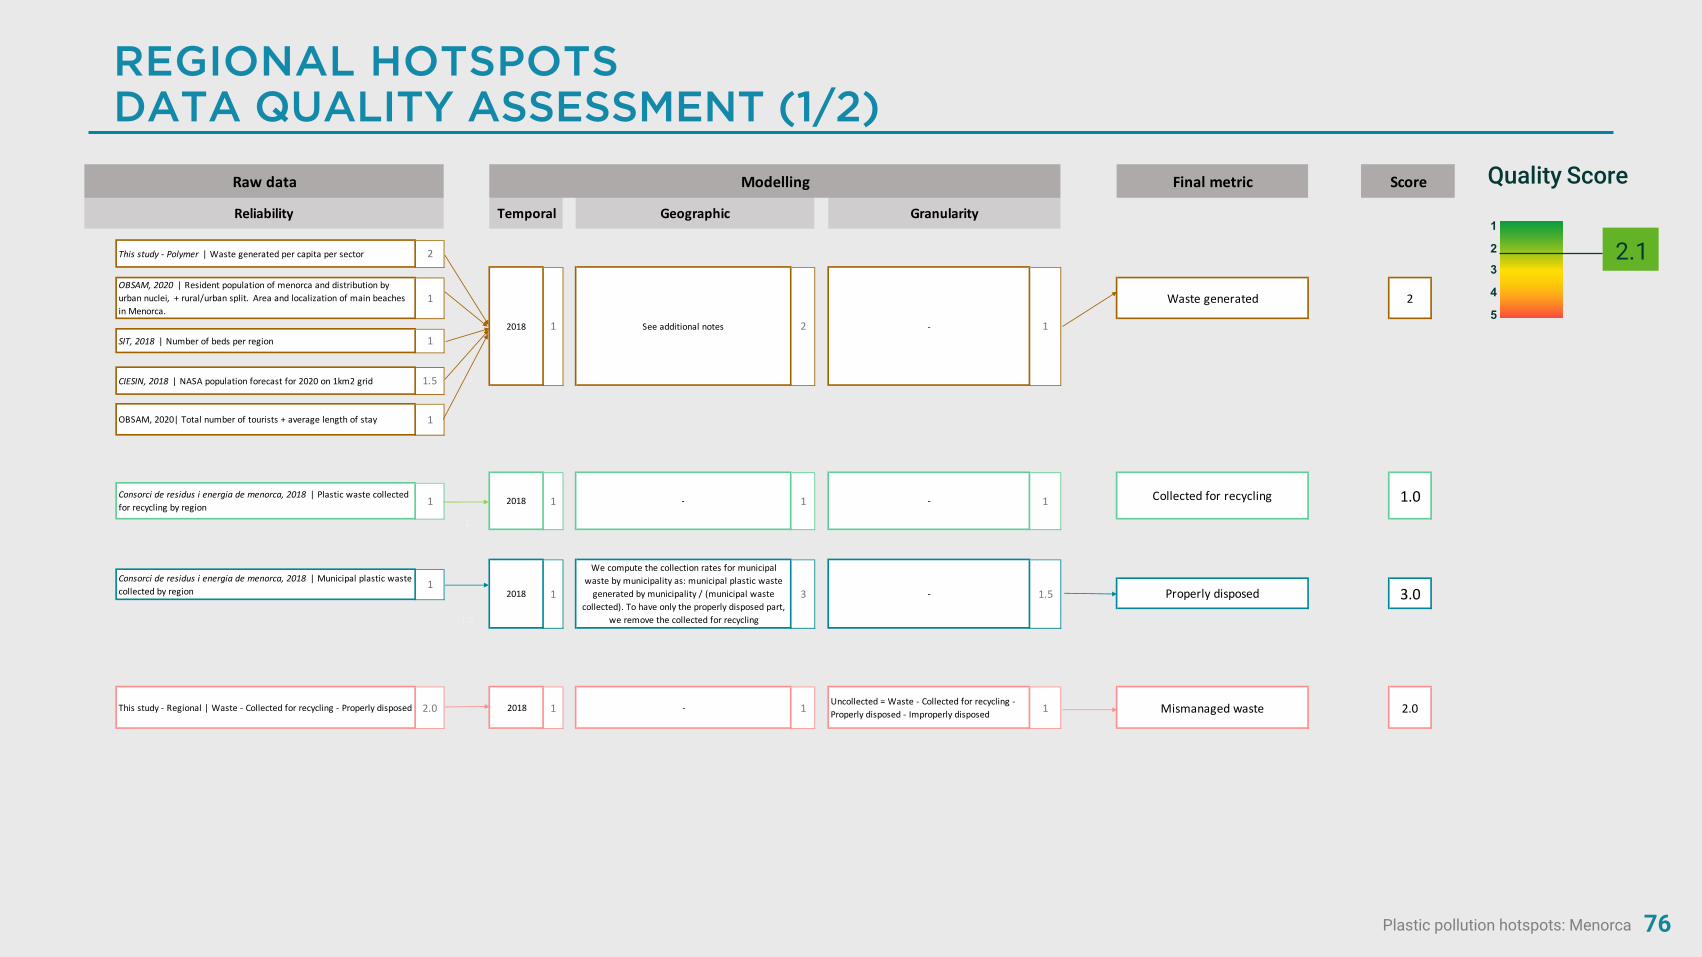
REGIONAL HOTSPOTSDATA QUALITY ASSESSMENT (1/2)
Final metric
This study - Regional | Waste - Collected for recycling - Properly disposed 2.0 2018 1 - 1 Uncollected = Waste - Collected for recycling -
Properly disposed - Improperly disposed1 Mismanaged waste 2.0
1
We compute the collection rates for municipal
waste by municipality as: municipal plastic waste
generated by municipality / (municipal waste
collected). To have only the properly disposed part,
we remove the collected for recycling
Waste generated 2
1.01 - 1 Collected for recycling1 -
Properly disposed 3.03 - 1.5
1
2018
1
1.0
2018
Consorci de residus i energia de menorca, 2018 | Plastic waste collected
for recycling by region 1
OBSAM, 2020 | Resident population of menorca and distribution by
urban nuclei, + rural/urban split. Area and localization of main beaches
in Menorca.
1
CIESIN, 2018 | NASA population forecast for 2020 on 1km2 grid 1.5
SIT, 2018 | Number of beds per region 12018 1 See additional notes
1.3
This study - Polymer | Waste generated per capita per sector 2
Score
Reliability Temporal Geographic Granularity
Raw data Modelling
Consorci de residus i energia de menorca, 2018 | Municipal plastic waste
collected by region
2 - 1
OBSAM, 2020| Total number of tourists + average length of stay 1
1
23
4
5
Quality Score
2.1
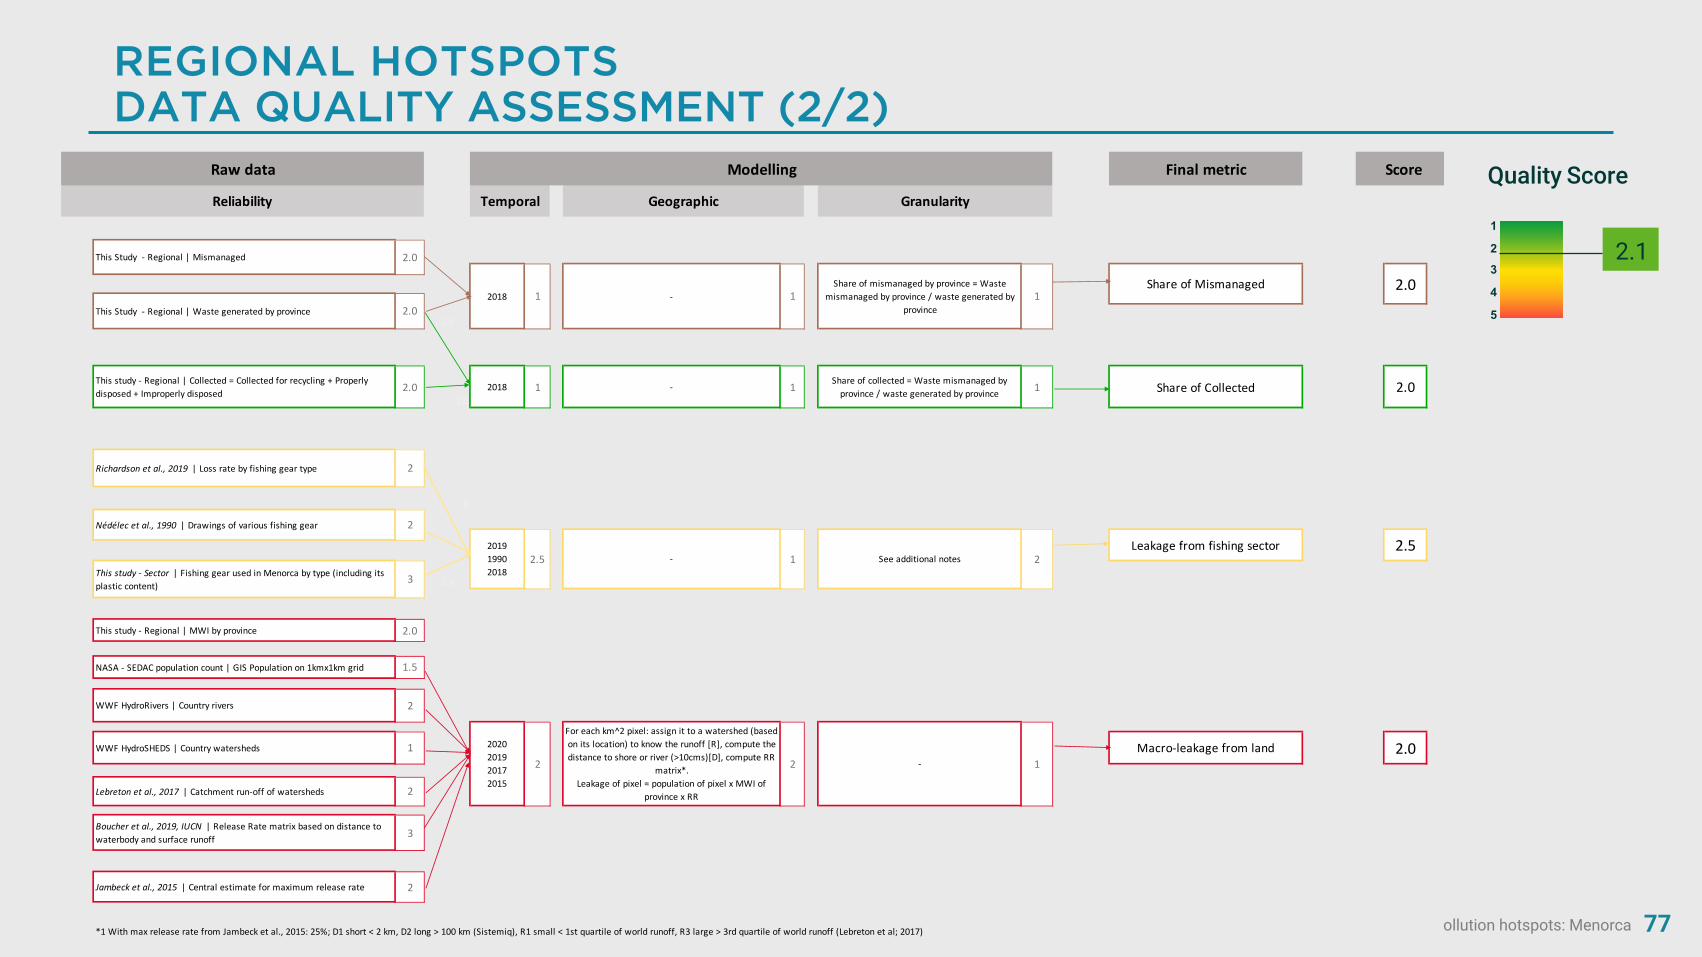
Plastic pollution hotspots: Menorca 77
REGIONAL HOTSPOTSDATA QUALITY ASSESSMENT (2/2)
1
23
4
5
Quality Score
2.1
Final metric
This study - Regional | Collected = Collected for recycling + Properly disposed + Improperly disposed 2.0
2.02018 1 - 1 Share of collected = Waste mismanaged by
province / waste generated by province 1 Share of Collected 2.0
0
This study - Regional | MWI by province 2.0
Boucher et al., 2019, IUCN | Release Rate matrix based on distance to waterbody and surface runoff 3
Jambeck et al., 2015 | Central estimate for maximum release rate 2
Richardson et al., 2019 | Loss rate by fishing gear type 2
This study - Sector | Fishing gear used in Menorca by type (including its plastic content)
3
For each km^2 pixel: assign it to a watershed (based on its location) to know the runoff [R], compute the distance to shore or river (>10cms)[D], compute RR
matrix*. Leakage of pixel = population of pixel x MWI of
province x RR
2020201920172015
2
*1 With max release rate from Jambeck et al., 2015: 25%; D1 short < 2 km, D2 long > 100 km (Sistemiq), R1 small < 1st quartile of world runoff, R3 large > 3rd quartile of world runoff (Lebreton et al; 2017)
2.5Nédélec et al., 1990 | Drawings of various fishing gear 2
2.3
201919902018
2.5 - 1 See additional notes 2Leakage from fishing sector
Lebreton et al., 2017 | Catchment run-off of watersheds
2
1.9
WWF HydroSHEDS | Country watersheds 1-2
Macro-leakage from land 2.01
NASA - SEDAC population count | GIS Population on 1kmx1km grid 1.5
WWF HydroRivers | Country rivers 2
Share of mismanaged by province = Waste mismanaged by province / waste generated by
province1
Share of Mismanaged 2.0
This Study - Regional | Mismanaged 2.0
2.0
2018 1This Study - Regional | Waste generated by province 2.0
- 1
Raw data Modelling Score
Reliability Temporal Geographic Granularity
Plastic pollution hotspots: Menorca 78
SECTOR HOTSPOTSMODELLING NOTES
Properly disposed
We identified 4 sources of waste generation: resident urbanpopulation, resident rural population, tourists at hotels, and touristson beaches.
We assume that urban resident population and rural resident havethe average per capita waste generation for Menorca. The averageper capita waste generation is computed as: tot plastic waste /(resident population + tourist population). Where the touristpopulation = nb tourists* average length of stay/365.
For the resident urban population, we have access on very detailspatial population distributions by urban nuclei within the differentmunicipalities. For the rural population instead we only have data bymunicipalities, but we lack a more granular spatial information.
For the tourist population we have information of hotel localizationand for each hotel we know the number of beds. The number oftourists by municipality is determined as : nb beds per municipality/tot nb of beds * tourist population. For the waste generation oftourists on beaches, we assume that the tourists presence on abeach is proportional to the area of the beach. Additionally weassume that tourists dispose on beaches 60% of their per capitaplastic packaging waste. The remaining per capita plastic waste isattributed to tourists at hotels.
This more elaborated and more granular split is done to reconciliatewaste management data for municipalities such as Es Mercadalwhere plastic waste collection is higher than plastic wastegenerated by the resident population and by the tourists at hotels.Only when considering the additional waste generated by thetourists activities on the beaches we are able to recover aconsistency between waste generation and waste collection
Fishing: Plastic leakage from fisheries can be divided into threecomponent:
1) Leakage due to gears lost at sea during fishing operations;
2) Leakage from gears discarded and mismanaged on land à set tozero for Menorca
3) Leakage from plastic waste littered overboard by some fishermenà set to zero for Menorca;
To know how many fishing gear by type see Additional notes ofsector hotspot analysis. Leakage due to gears lost at sea iscomputed using loss rates by fishing gear type provided byRichardson et al. (2019). For some fishing gears, loss is consideredfor fragments of the gear only, thus we had to make an assumptionon how big a fragment would be (10%, 50% or 90% of a gear unit).Our default calculation takes the assumption of a fragmentrepresenting 50% of a gear unit.

Plastic pollution hotspots: Menorca 79
BIBLIOGRAPHY5
Plastic pollution hotspots: Menorca 80
BIBLIOGRAPHY (1/2)
Autoritat Portuària De Balears (2016). Memòria annual 2016.
Boopendranath, M. (2012). Basic principle of fishing gear desing and classification.
Boucher, J. et al. (2019). The Marine Plastic Footprint. IUCN.
Center for International Earth Science Information Network - CIESIN - Columbia University (2018). Population Estimation Service, Version 3 (PES-v3). Palisades, NY: NASA Socioeconomic Data and Applications Center (SEDAC). https://doi.org/10.7927/H4DR2SK5.
Clean Virginia Waterways, Longwood University (2008). Cigarette butt litter. Available at: http://www.longwood.edu/cleanva/cigbutthowmany.htm
Concell Insular de Menorca (2017). Memòria - Pla director sectorial per a la gestió de residus no perillosos de Menorca 2017-2025.
Consorci de residus i energia de Menorca (2018). Informe de situació de la gestió dels residus a Menorca.
Espinosa-Valdemar, R. M et al. (2015). Assessment of gardening wastes as a co-substrate for diapers degradation by the fungus Pleurotus ostreatus. Sustainability, 7(5), 6033-6045.
European Commission (2018). Plastics: Reuse, recycling and marine litter, final report.
ICIS, Independent Commodity Intelligences Services (2020). Plastic production in Viet Nam for 2018. https://www.icis.com/explore/
Lau, W. W. et al. (2020). Evaluating scenarios toward zero plastic pollution. Science, 369(6510), 1455-1461.
Jambeck, J. et al.. (2015). Plastic waste inputs from land into the ocean. Science, 347(6223), 768-771.
Kaza, S. et al (2018). What a Waste 2.0 : A Global Snapshot of Solid Waste Management to 2050. Urban Development;. Washington, DC: World Bank. © World Bank. https://openknowledge.worldbank.org/handle/10986/30317 License: CC BY 3.0 IGO
Kishan, W. et al. (2018). Design characteristics and technical specifications of mackerel gill nets of Sindhudurg, Maharashtra. Journal of Experimental Zoology, India, 21(1), 373-378.
Kostova, D. et al. (2014). Exploring the relationship between cigarette prices and smoking among adults: a cross-country study of low-and middle-income nations. nicotine & tobacco research, 16(Suppl_1), S10-S15.
Lebreton, L. C et al. (2017). River plastic emissions to the world’s oceans. Nature communications, 8, 15611.
Lehner, B. et al. (2013): Global river hydrography and network routing: baseline data and new approaches to study the world’s large river systems. Hydrological Processes, 27(15): 2171–2186. Data is available at www.hydrosheds.org.
Lehner, B. et al. (2008): New global hydrography derived from spaceborne elevation data. Eos, Transactions, AGU, 89(10): 93-94. Data is available at www.hydrosheds.org.
IBESTAT - Balearic Islands Statistical Institute (2020). Població. Available at: http://ibestat.caib.es/ibestat/estadistiques/
Geyer, R. et al. (2017). Production, use, and fate of all plastics ever made. Science advances, 3(7), e1700782.
Gaulier, G. et al. (2008). BACI: A world database of international trade at the product-level. CEPII wp.
Mendoza, J. M. F. et al. (2019). Improving resource efficiency and environmental impacts through novel design and manufacturing of disposable baby diapers. Journal of Cleaner Production, 210, 916-928.

Plastic pollution hotspots: Menorca 81
BIBLIOGRAPHY (2/2)
Nédélec, C. et al. (1990). Definition and classification of fishing gear categories (No. 222). FAO.
Minoglou, M. et al. (2017). Healthcare waste generation worldwide and its dependence on socio-economic and environmental factors. Sustainability, 9(2), 220.
ODYSSEE-MURE (2020). Sectoral profile – Transport.
PlasticsEurope (2018). Plastic - the Facts 2018.
PLP (2020). Plastic Leak Project. (https://quantis-intl.com/metrics/initiatives/plastic-leak-project/)
Prado, J. et al. (1990). Fisherman's workbook. Fishing News Books.
Queirolo, D. et al. (2009). Improved interspecific selectivity of nylon shrimp (Heterocarpus reedi) trawling in Chile. Latin American Journal of Aquatic Research, 37(2), 221-230.
Richardson, K. et al. (2019). Estimates of fishing gear loss rates at a global scale: A literature review and meta‐analysis. Fish and Fisheries, 20(6), 1218-1231.
Pérez, M. et al. (2018). Sistema d’Indicadors Turístics de Menorca 2018. Observatori Socioambiental de Menorca, Institut Menorquí d’Estudis.
Tecnoambiante (2020). Estudi sobre la generació i composició dels residus municipals a la comunitat autònoma de les Illes Balears.
The World Bank, World Development Indicators (2012). Industry (including construction), value added (annual % growth). Retrieved from https://data.worldbank.org/indicator/NV.IND.TOTL.KD.ZG
UN Environment (2018). “Table A3. Use share of polymer resin production according to plastic application” in Mapping of global plastics value chain and plastics losses to the environment (with a particular focus on marine environment). Ryberg, M., Laurent, A., Hauschild, M.(2018) United Nations Environment Programme. Nairobi, Kenya
OBSAM (2020). Recycling indicators for Menorca; Occupancy rate, area and localization of main beaches of Menorca; Resident population by urban nuclei and rural areas.
Ports de Balears, Autoritat Portuària de Balears, (2016) 2016 Memoria Anual, Annual report.

82
Published in December 2020,with results for year 2018
MENORCACountry report
Implemented with
Funded by the Didier et Martine Primat Foundation