Phase relationships in the system K2CO3-CaCO3 at 6 GPa and 900-1450 C

Coccolithophore (–CaCO3) flux in the Sea of Okhotsk:seasonality, settling and alteration processes
A.T.C. Broersea,* , P. Ziveria, S. Honjob
aFaculty of Earth Sciences, Vrije Universiteit, De Boelelaan 1085, 1081 HV, Amsterdam, The NetherlandsbWoods Hole Oceanographic Institution, Woods Hole, MA 02540, USA
Accepted 5 November 1999
Abstract
Coccolithophore fluxes were determined in the Sea of Okhotsk using samples from a 1 year experiment (12 August 1990 to12 August 1991) with sediment traps at 258 and 1061 m depth. A special study was made onCoccolithus pelagicus, usingfragmentation and the degree of etching, as indicators of transport mechanisms. A Corrosion Index forC. pelagicusisdeveloped. The coccolithophore flux pattern at 258 m depth was characterised by a strong seasonality, with flux peaks duringautumn 1990 (late November to early December) and spring 1991 (March). The assemblage consisted almost entirely of the twospeciesC. pelagicusandEmiliania huxleyi. During autumn, coccolithophore transportation to 258 m depth mainly occurredwithin cylindrical fecal pellets and marine snow aggregates of silicoflagellates, and through agglutination on tintinnids. Grazingcaused severe fragmentation of coccoliths and disintegration of coccospheres. Marine snow aggregates contained many intactcoccospheres ofC. pelagicus. During spring, coccolithophores were probably removed from the euphotic zone by the ballasteffect of sinking diatoms. The coccolithophore flux peak in spring occurred immediately after the ice had retreated from the trapstation, and the trapped assemblage included coccoliths of subtropical species. These features indicate drifting from an ice-freelocation to the south or east.
The coccolith and coccosphere flux at 1061 m was respectively 7 and 12 times lower than at 258 m depth, and maximumfluxes were recorded 2 months later. Increasing carbonate dissolution from 258 to 1061 m depth is expressed in the cocco-lithophore–CaCO3 flux reduction of 82%, and in the increasing percentage of etched coccoliths ofCoccolithus pelagicusfrom32 to .90%.q 2000 Elsevier Science B.V. All rights reserved.
Keywords: coccolithophores; fluxes; CaCO3; dissolution; fragmentation; Sea of Okhotsk
1. Introduction
The subarctic Pacific and its adjacent marginal seasbelong to one of the highest biological productivityregions and therefore act as an important CO2 sinkthrough the biological pump (Honjo, 1996a,b;Takahashi et al., 1997). Recent long-term sedimenttrap studies in the subarctic Pacific revealed that this
high biological production is associated with a highopal contribution, mainly due to diatoms, whereasCaCO3 producing planktic organisms tend to playonly a minor role (Takahashi et al., 1997). Weselected the Sea of Okhotsk in the cold, subpolarzone adjacent to the extreme northwestern part ofthe Pacific Ocean, to study the seasonal coccolitho-phore export production because of the uniqueoceanographic and climatic conditions in this semi-isolated basin (Yasuoka, 1967, 1968; Kitani, 1973;Talley and Nagata, 1995). Extensive sea-ice covers
Marine Micropaleontology 39 (2000) 179–200
0377-8398/00/$ - see front matterq 2000 Elsevier Science B.V. All rights reserved.PII: S0377-8398(00)00020-7
www.elsevier.nl/locate/marmicro
* Corresponding author. Fax:1 31-20-6462457.E-mail address:[email protected] (A.T.C. Broerse).
a large part of the Sea of Okhotsk during winter andtherefore analogy to the climate in polar and subpolarareas is appropriate. In addition, the Sea of Okhotskcan be seen as a modern analogue for oceanic condi-tions in mid latitudes during glacial periods (Morleyand Hays, 1983; Sancetta and Silvestri, 1986).
In subarctic and arctic regions biological produc-tion is strongly controlled by the highly seasonal solarinsolation. This results in a short production periodand a strongly defined phytoplankton seasonality. Inthe cold, nutrient-rich waters of the polar region,diatoms usually dominate, while coccolithophoresare relatively less abundant than in warm, oligotrophicwaters (Smayda, 1980). Coccolithophore diversitydecreases at higher latitudes and only a few cocco-lithophore species,Coccolithus pelagicus, Emilianiahuxleyi, Algirosphaera robusta, Calciopappus cauda-tus, andSyracosphaera borealis, are able to survive intemperatures as low as 18C (Okada and McIntyre,1979). Only one detailed phytoplankton study onwater samples from the Sea of Okhotsk has beenpublished, in whichE. huxleyiwas the only cocco-lithophore species recorded as abundant (Smirnova,1959).
Extensive studies in the Norwegian–GreenlandSeas on living coccolithophores (Samtleben andSchroder, 1992; Samtleben et al., 1995a,b; Baumannet al., 1997) and coccolithophore fluxes (Andruleit,1997, 1999) revealed that settling assemblagesin arctic environments are highly susceptible toalteration by processes such as dissolution and frag-mentation. Most existing dissolution indices havebeen developed to understand the effect of dissolutionon coccolith assemblages deposited in deep seasediments, using the differential preservation ofcoccolithophore species (McIntyre and McIntyre,1971; Roth and Thierstein, 1972; Roth and Berger,1975; Schneidermann, 1977; Roth and Coulbourn,1982). We developed a Corrosion Index (CI) tomonitor seasonal changes in the preservation state ofcoccoliths ofCoccolithus pelagicusin sediment trapsamples.
We present results from a year-round sediment trapexperiment at Shoyo Station in the Sea of Okhotsk(Fig. 1) from August 1990 to August 1991 at twodepths (258 and 1061 m) on (1) the coccolithophore(–CaCO3) export production, (2) the coccolithophoresinking mechanisms through the watercolumn, and (3)
the coccolithophore–CaCO3 dissolution processesunder corrosive influences of the cold watermassesof the Sea of Okhotsk.
2. Oceanographic setting and particle fluxes
2.1. Currents
The circulation in the Sea of Okhotsk is dominatedby a cyclonic gyre consisting of the northward flowingWest Kamchatka Current (WKC) and the southwardflowing East Sakhalin Current (Talley and Nagata,1995; Fig. 1). The origin of the WKC is North Pacificwater, which flows northwards through channelsbetween the northern Kuril Islands into the Sea ofOkhotsk. The WKC is thus a warm current and itkeeps the southern part of Kamchatka coast ice-free.The East Sakhalin Current (ESC) flows southward offthe east coast of Sakhalin Island. In addition, fromJune to November warm, salty water (7–208C,33.6–34.3‰) enters from the Sea of Japan throughthe narrow, shallow Soˆya Strait as the Soˆya Current.Fresh water input comes from the Amur River. Waterflows out through the southern Kuril straits, primarilyEtorofu Strait and Bussol Strait. This water contri-butes to the cold Oyashio Current of the North Pacificcyclonic circulation.
2.2. Vertical watercolumn profile and temperature
The water column in the Sea of Okhotsk consists of:the surface mixed layer, the dichothermal layer, andthe intermediate/deep water. The surface mixed waterlayer (0–50 m) is characterised by strong seasonalityin both temperature and salinity (Kitani, 1973).During the sediment trap experiment (August 12,1990 to August 12, 1991) the sea surface temperatureat Shoyo Station varied between21.28C during theend of March and 14.88C in early September (Fig. 2).Near the eastern Kuril Islands surface temperaturesare^18C warmer due to the Pacific inflow (Parkinsonand Gratz, 1983). Surface salinities fluctuate with theinput of fresh water from the Amur River and themelting of ice. They vary between,32.8‰ insummer and 33.2‰ in winter (Kitani, 1973). Inmost parts of the Sea of Okhotsk the surface mixedlayer is underlain by the Okhotsk Dichothermal Layer(ODTL) between a depth of approximately 50 and
A.T.C. Broerse et al. / Marine Micropaleontology 39 (2000) 179–200180

150 m. The ODTL is a low temperature layer thatpersists year-round in the Sea of Okhotsk. Thetemperature ranges from21.78C in the northern Seaof Okhotsk and east of Sakhalin to 2.08C along thenorthern Kuril Islands, and the salinity is around33.0‰ (Kitani, 1973). The formation of the ODTLis linked to extensive sea-ice coverage in winter(Yang and Honjo, 1996). In summer the surfacefreshwater flux increases due to sea-ice melting andAmur River runoff. These effects create a very stablesurface layer that prevents mixing between relativelylow salinity, warm surface waters and colder moresaline waters in the ODTL (Yang and Honjo, 1996).The intermediate and deep waters (.150 m) are of
Pacific origin, with temperatures of 2.0–2.58C, and asalinity of approximately 34.3‰ (Yasuoka, 1967,1968).
2.3. Seasonal ice coverage
The Sea of Okhotsk is the southernmost location ofsea-ice formation in the northern hemisphere. Signifi-cantly interannual variations in the maximum icecover and in the smoothness of the growth and retreatperiods exist, but generally the first ice appears inNovember, in a few coastal locations along thenorthern coast and along much of the Sakalin Islandcoast (Parkinson and Gratz, 1983). By the beginning
A.T.C. Broerse et al. / Marine Micropaleontology 39 (2000) 179–200 181
Fig. 1. Map of the Sea of Okhotsk including surface current pattern and location of Shoyo sediment trap station (538190N, 1498500E). ESC�East Sakhalin Current; WKC�West Kamchatka Current.
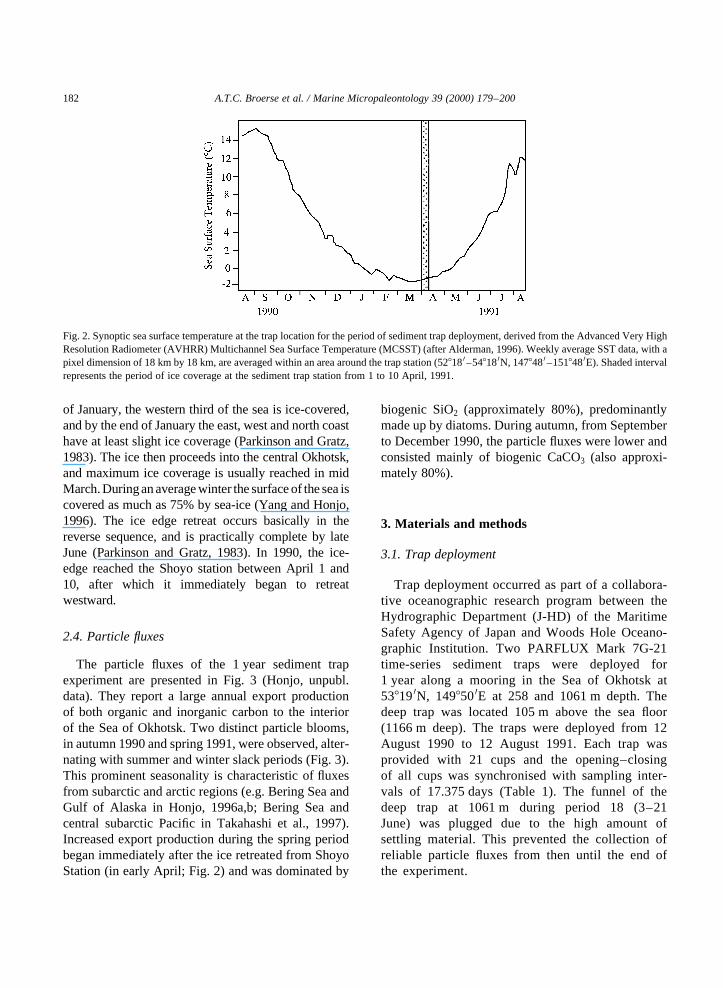
of January, the western third of the sea is ice-covered,and by the end of January the east, west and north coasthave at least slight ice coverage (Parkinson and Gratz,1983). The ice then proceeds into the central Okhotsk,and maximum ice coverage is usually reached in midMarch.Duringan average winter the surface of the sea iscovered as much as 75% by sea-ice (Yang and Honjo,1996). The ice edge retreat occurs basically in thereverse sequence, and is practically complete by lateJune (Parkinson and Gratz, 1983). In 1990, the ice-edge reached the Shoyo station between April 1 and10, after which it immediately began to retreatwestward.
2.4. Particle fluxes
The particle fluxes of the 1 year sediment trapexperiment are presented in Fig. 3 (Honjo, unpubl.data). They report a large annual export productionof both organic and inorganic carbon to the interiorof the Sea of Okhotsk. Two distinct particle blooms,in autumn 1990 and spring 1991, were observed, alter-nating with summer and winter slack periods (Fig. 3).This prominent seasonality is characteristic of fluxesfrom subarctic and arctic regions (e.g. Bering Sea andGulf of Alaska in Honjo, 1996a,b; Bering Sea andcentral subarctic Pacific in Takahashi et al., 1997).Increased export production during the spring periodbegan immediately after the ice retreated from ShoyoStation (in early April; Fig. 2) and was dominated by
biogenic SiO2 (approximately 80%), predominantlymade up by diatoms. During autumn, from Septemberto December 1990, the particle fluxes were lower andconsisted mainly of biogenic CaCO3 (also approxi-mately 80%).
3. Materials and methods
3.1. Trap deployment
Trap deployment occurred as part of a collabora-tive oceanographic research program between theHydrographic Department (J-HD) of the MaritimeSafety Agency of Japan and Woods Hole Oceano-graphic Institution. Two PARFLUX Mark 7G-21time-series sediment traps were deployed for1 year along a mooring in the Sea of Okhotsk at538190N, 1498500E at 258 and 1061 m depth. Thedeep trap was located 105 m above the sea floor(1166 m deep). The traps were deployed from 12August 1990 to 12 August 1991. Each trap wasprovided with 21 cups and the opening–closingof all cups was synchronised with sampling inter-vals of 17.375 days (Table 1). The funnel of thedeep trap at 1061 m during period 18 (3–21June) was plugged due to the high amount ofsettling material. This prevented the collection ofreliable particle fluxes from then until the end ofthe experiment.
A.T.C. Broerse et al. / Marine Micropaleontology 39 (2000) 179–200182
Fig. 2. Synoptic sea surface temperature at the trap location for the period of sediment trap deployment, derived from the Advanced Very HighResolution Radiometer (AVHRR) Multichannel Sea Surface Temperature (MCSST) (after Alderman, 1996). Weekly average SST data, with apixel dimension of 18 km by 18 km, are averaged within an area around the trap station (528180–548180N, 1478480–1518480E). Shaded intervalrepresents the period of ice coverage at the sediment trap station from 1 to 10 April, 1991.

3.2. Sample processing and coccolithophore countingprocedure
Aliquots (1/40) of the collected samples wereprovided by S. Honjo (Woods Hole OceanographicInstitution). These were further wet-split, using a
PARFLUX Wet Sample Divider (deviation betweenaliquots,3%), until an appropriate amount of mate-rial for coccolith analysis was obtained. The aliquotsused for coccolith analysis varied between 3/400 and6/4000 split. The aliquots were wet-sieved over a32mm mesh, while disintegrating fecal pellets and
A.T.C. Broerse et al. / Marine Micropaleontology 39 (2000) 179–200 183
Fig. 3. Mass fluxes of biogenic silica, organic carbon, calcium carbonate, and lithogenic material (mg m22 d21) at 258 and 1061 m water depth(Honjo unpubl. data) and total number of foraminifera (ind. m22 d21) at 258 m water depth (after Alderman, 1996) at mooring station Shoyo.The total mass flux of samples 8–13 and sample 20 at 258 m were too low to determine reliable fluxes for the biogenic components. Open circlesin samples 19–21 at 1061 m represent minimum values. Shaded interval represents the period of ice coverage at the sediment trap station from 1to 10 April, 1991.

aggregates with a small soft brush. The fraction,32mm was filtered over a 0.45mm Millipore filterof type HA (cellulose acetate; 47 mm diameter) andrinsed with buffered distilled water to remove salts.The filters were dried at 408C and stored in petridishes. For the quantitative analysis of coccolithsand coccospheres we used an Olympus polarisingmicroscope at magnifications of 1500× and 750× ,respectively. Coccoliths and coccospheres werecounted along scans running from the border towardsthe centre of the filter. It was intended to count a mini-mum number of 300 coccoliths and 50 coccospheres.However, in a number of samples the coccolith andcoccosphere concentration on the filter was too lowto attain this number. In those samples an area wasscanned of at least 17 mm2 (Table 1). Coccolith andcoccosphere fluxes (in numbers m22 d21) were calcu-lated by extrapolating the counted specimens to theentire filter area and to the total original trap sample,length of sampling interval, and trap aperture area.
In addition, we performed a Scanning ElectronMicroscopy (SEM) survey on two unprocessed aliquotsto study the coccolithophore sinking mechanismsduring their main sedimentation phases in autumn1990 (sample 7) and spring 1991 (sample 14). A listingof taxa encountered in this study, with full taxonomiccitations, is given in Jordan et al. (2000).
3.3. Fragmentation and etching in coccoliths ofCoccolithus pelagicus
We performed a quantitative study on frag-mentation and etching in coccoliths ofCoccolithuspelagicus, using SEM. Some samples were excludedfrom analysis, either due to the absence or rarity ofcoccoliths, or due to the presence of diatom frag-ments, covering the coccoliths (Table 2).
We defined fragmented coccoliths as coccolithswhich miss a part of the distal and/or proximalshield(s) due to mechanical breakage (see Plate I,
A.T.C. Broerse et al. / Marine Micropaleontology 39 (2000) 179–200184
Table 1Rotation schedule of the sediment traps at 258 and 1061 m depth of the annual mooring in the Sea of Okhotsk and aliquots used forcoccolithophore analysis
Sampling period Opening date Closing date Mid date Days elapsed Coccolith split
258 m 1061 m
1 12 August 1990 29 August 1990 21 August 17.4 1/400a 1/200a
2 29 August 1990 16 September 1990 7 September 34.8 1/400a 1/200a
3 16 September 1990 3 October 1990 24 September 52.1 1/400a 1/400a
4 3 October 1990 21 October 1990 12 October 69.5 1/160a 1/400a
5 21 October 1990 7 November 1990 29 October 86.9 1/400 1/400a
6 7 November 1990 24 November 1990 16 November 104.3 1/800 1/400a
7 24 November 1990 12 December 1990 3 December 121.6 1/400 1/400a
8 12 December 1990 29 December 1990 20 December 139 1/200 1/400a
9 29 December 1990 15 January 1991 7 January 156.4 1/200 1/200a
10 15 January 1991 2 February 1991 24 January 173.8 3/400a 3/40011 2 February 1991 19 February 1991 10 February 191.1 3/400a 1/20012 19 February 1991 9 March 1991 28 February 208.5 1/200a 1/20013 9 March 1991 26 March 1991 17 March 225.9 3/400a 1/200a
14 26 March 1991 12 April 1991 4 April 243.3 1/400 1/200a
15 12 April 1991 30 April 1991 21 April 260.6 1/400 1/200a
16 30 April 1991 17 May 1991 8 May 278 1/400 1/40017 17 May 1991 3 June 1991 26 May 295.4 1/400 1/40018 3 June 1991 21 June 1991 12 June 312.8 1/800 1b/200a
19 21 June 1991 8 July 1991 29 June 330.1 6/4000a 3b/400a
20 8 July 1991 26 July 1991 17 July 347.5 1/200a 3b/400a
21 26 July 1991 12 August 1991 3 August 364.9 1/200a 3b/400a
a Intended minimum no. of coccoliths and coccospheres not counted.b Fluxes not reliable due to plugging of the trap funnel.

A.T
.C.
Bro
erse
et
al.
/M
arin
eM
icrop
ale
on
tolo
gy
39
(20
00
)1
79
–2
00
185
Table 2Preservation ofCoccolithus pelagicuscoccoliths at 258 and 1061 m depth. Relative abundances of unaffected (not fragmented and not etched), only fragmented, both fragmented andetched, and only etched coccoliths. The Corrosion Index (CI) summarises the degree of etching ofC. pelagicuswithin a sample (see text). No. analysed: number of coccoliths countedby SEM. The preservation state of coccoliths could not be determined in samples where coccoliths were absent or rare, or in samples covered by a layer ofdiatom fragments
Sample 258 m 1061 m
No.analysed
Unaffected(%)
Fragmented(%)
Frag.1etched(%)
Etched(%)
Corrosionindex (CI)
No.analysed
Unaffected(%)
Fragmented(%)
Frag.1etched(%)
Etched(%)
Corrosionindex (CI)
1 22 31.8 36.4 9.1 22.7 54.5 Rare – – – – –2 22 45.5 40.9 0.0 13.6 23.8 Rare – – – – –3 42 42.9 40.5 2.4 14.3 26.2 Rare – – – – –4 Absent – – – – – Rare – – – – –5 61 4.9 8.2 32.8 54.1 218.0 Rare – – – – –6 81 32.1 40.7 9.9 17.3 49.4 Rare – – – – –7 85 31.8 64.7 0.0 3.5 10.6 Rare – – – – –8 66 36.4 63.6 0.0 0.0 0.0 Rare – – – – –9 51 11.8 33.3 25.5 29.4 90.2 Rare – – – – –10 34 0.0 2.9 23.5 73.5 320.6 56 3.6 8.9 26.8 60.7 191.111 Absent – – – – – Rare – – – – –12 Absent – – – – – 37 2.7 0.0 43.2 54.1 240.513 Absent – – – – – Rare – – – – 014 51 54.9 37.3 0.0 7.8 9.8 Rare – – – – 015 46 37.0 34.8 2.2 26.1 73.9 Rare – – – – 016 12 33.3 8.3 25.0 33.3 133.3 36 2.8 0.0 50.0 47.2 205.617 Diatoms – – – – – 21 0.0 0.0 38.1 61.9 200.018 7 0.0 0.0 0.0 100.0 300.0 Diatoms – – – – –19 Absent – – – – – Diatoms – – – – –20 Rare – – – – – Rare – – – – –21 Rare – – – – – Rare – – – – –

6–9). Since fragmentation happens in both wellpreserved and etched coccoliths, it appears not to berelated to disintegration of coccoliths as a result ofdissolution. In addition, etching normally starts inthe more soluble central area of a coccolith (seePlate II), while fragmentation mostly occurs at theouter part a coccolith (see Plate I, 6–9). Therefore,we included coccoliths, which are both fragmentedand etched in the percentage of fragmented coccoliths.
In most samples coccoliths and coccospheresshowed different degrees of dissolution. Dissolutionin the resistant coccoliths ofCoccolithus pelagicuswas studied by: (1) quantifying the ratio of etchedcoccoliths (including coccoliths both etched and frag-mented) to perfectly preserved coccoliths and; (2) byclassifying the degree of dissolution of the distalshields of coccoliths into six groups, ranging fromnon-etched to almost completely dissolved.
The six dissolution stages distinguished are:
(0) Non-etched coccoliths.(1) Coccoliths slightly etched in the central area(Plate II, 1).(2) Coccoliths heavily etched in central area andslightly etched on the elements of the distal shields(Plate II, 2).(3) Coccoliths with completely dissolved centralarea, and sutures between the elements of distalshields beginning to open around the periphery ofthe coccolith (Plate II, 3).(4) Coccoliths with completely dissolved centralarea. Distal shield sutures open and extend towardsthe centre of the coccolith, and openings haveformed between the outer part of the elements(Plate II, 4).(5) Coccoliths with completely dissolved centralarea. Shield elements are completely separateddue to a progressive separation of elements towardsthe centre (Plate II, 5).
The degree of dissolution within a sample of cocco-liths of Coccolithus pelagicuscan then be expressedin a corrosion index (CI):
CI � S�Ei p ri�whereE is the percentage of coccoliths in dissolutionstagei, r the multiplication factor of dissolution stagei andr the ranking from 0 to 5, following the dissolu-tion stages 0–5. CI values can range from 0 (all cocco-liths at stage 0) to 500 (all coccoliths at stage 5).
3.4. Coccolith and coccosphere–CaCO3 fluxes
The calculated CaCO3 contribution of coccolitho-phores to the particle flux was determined by multi-plying the average coccolith weight of the variousspecies by their flux. We determined the averagecoccolith weight ofCoccolithus pelagicus(84.2 pg)by applying the average coccolith length�8:04^1:31mm� into the coccolith mass equation of Youngand Ziveri (2000). The average coccolith length ofC.pelagicuswas derived from size measurements on 112coccoliths from different samples, using SEM. ForEmiliania huxleyi we used a coccolith weight of3 pg (Samtleben and Bickert, 1990). To determinethe CaCO3 weight of coccospheres we convertedcoccosphere counts into coccoliths using an averageof 17 coccoliths per coccosphere forC. pelagicusand25 forE. huxleyi(Samtleben and Schro¨der, 1992). Wedid not take into account loss of CaCO3 due to etchingin coccoliths, and therefore the calculation of thecoccolithophore–CaCO3 should be considered as amaximum value of the actual coccolithophore–CaCO3 as observed in the cup samples.
For each sample the fine fraction (,32mm) CaCO3
content was determined in an aliquot, equal to the onefor coccolith flux quantification, by inductivelycoupled plasma emission spectrometry (VarianLiberty II, axial plasma technique; % RSD� 0.8)
A.T.C. Broerse et al. / Marine Micropaleontology 39 (2000) 179–200186
Plate I. (1) Marine snow aggregate of silicoflagellates containing intact coccospheres and isolated coccoliths ofCoccolithus pelagicus. Alsotintinnids and some diatom fragments are entangled in the aggregates. Sample 7,,1 mm fraction, 258 m. Bar represents 100mm. (2) Detail ofaggregate of silicoflagellates with intact coccospheres and isolated coccoliths ofC. pelagicus, showing the adhesive role of organic matter.Sample 7,,1 mm fraction, 258 m. Bar represents 10mm. (3) and (4) Details of fecal pellets containing fragmented coccoliths ofC. pelagicusand small amounts of fragments of diatoms and silicoflagellates. Sample 7,,1 mm fraction, 258 m. Bar represents 10mm. (5) Cluster oftintinnid loricae, covered with coccoliths ofC. pelagicus. Sample 7,,1 mm fraction, 258 m. Bar represents 10mm. (6) Detail of the bulksettling material showing fragments of diatoms and intact frustules, with one coccosphere and some isolated coccoliths ofC. pelagicus. Sample14, ,1 mm fraction, 258 m. Bar represents 10mm. (7)–(9) Fragmented coccoliths ofC. pelagicus. Bar represents 1mm. (7) Coccolith bothfragmented and slightly etched. (8) and (9) Coccoliths only fragmented. Sample 7,, 32mm, 258 m.

A.T.C. Broerse et al. / Marine Micropaleontology 39 (2000) 179–200 187

A.T.C. Broerse et al. / Marine Micropaleontology 39 (2000) 179–200188
Plate II. (Bar represents 1mm) (1)–(5) Coccolithus pelagicusf. pelagicusetched coccolith. (1) Dissolution stage 1. Sample 6, 258 m. (2)Dissolution stage 2. Sample 6, 258 m. (3) Dissolution stage 3. Sample 5, 258 m. (4) Dissolution stage 4. Sample 10, 258 m. (5) Dissolution stage5. Sample 10, 258 m. (6)Emiliania huxleyicollapsed coccosphere. Sample 7, 258 m. Note the wide space between proximal and distal shields.
following the procedures described in Broerse et al.(2000a).
4. Results
4.1. Coccolithophore fluxes at 258 and 1061 m depth
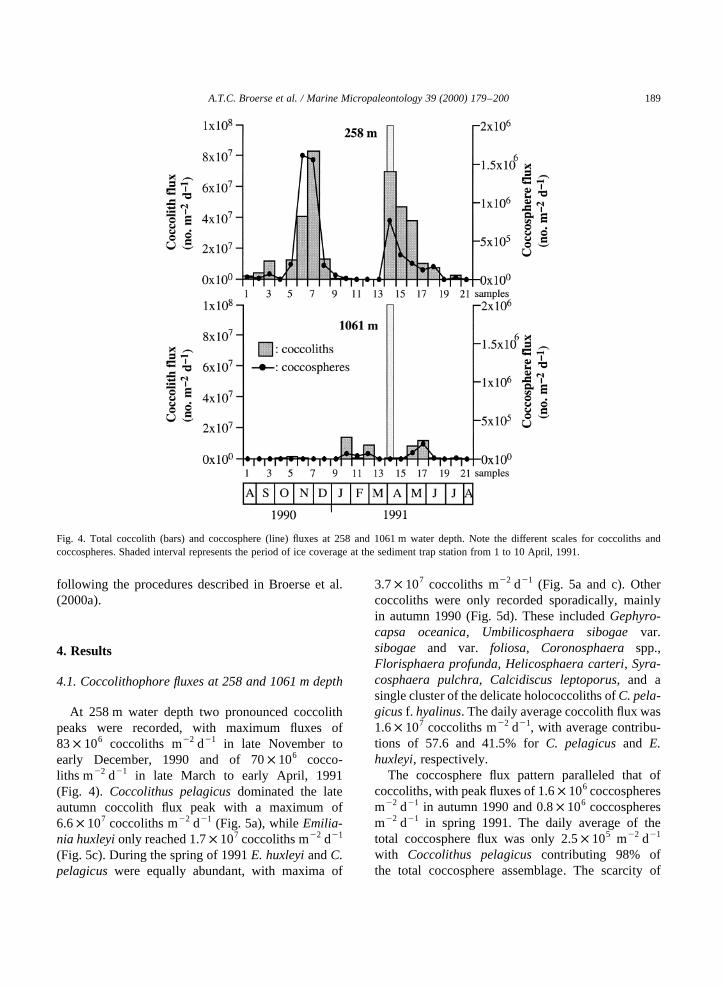
At 258 m water depth two pronounced coccolithpeaks were recorded, with maximum fluxes of83× 106 coccoliths m22 d21 in late November toearly December, 1990 and of 70× 106 cocco-liths m22 d21 in late March to early April, 1991(Fig. 4). Coccolithus pelagicusdominated the lateautumn coccolith flux peak with a maximum of6.6× 107 coccoliths m22 d21 (Fig. 5a), whileEmilia-nia huxleyionly reached 1.7× 10⁷ coccoliths m22 d21
(Fig. 5c). During the spring of 1991E. huxleyiandC.pelagicuswere equally abundant, with maxima of
3.7× 10⁷ coccoliths m22 d21 (Fig. 5a and c). Othercoccoliths were only recorded sporadically, mainlyin autumn 1990 (Fig. 5d). These includedGephyro-capsa oceanica, Umbilicosphaera sibogaevar.sibogae and var. foliosa, Coronosphaera spp.,Florisphaera profunda, Helicosphaera carteri, Syra-cosphaera pulchra, Calcidiscus leptoporus, and asingle cluster of the delicate holococcoliths ofC. pela-gicusf. hyalinus. The daily average coccolith flux was1.6× 107 coccoliths m22 d21, with average contribu-tions of 57.6 and 41.5% forC. pelagicusand E.huxleyi, respectively.
The coccosphere flux pattern paralleled that ofcoccoliths, with peak fluxes of 1.6× 10⁶ coccospheresm22 d21 in autumn 1990 and 0.8× 10⁶ coccospheresm22 d21 in spring 1991. The daily average of thetotal coccosphere flux was only 2.5× 10⁵ m22 d21
with Coccolithus pelagicuscontributing 98% ofthe total coccosphere assemblage. The scarcity of
A.T.C. Broerse et al. / Marine Micropaleontology 39 (2000) 179–200 189
Fig. 4. Total coccolith (bars) and coccosphere (line) fluxes at 258 and 1061 m water depth. Note the different scales for coccoliths andcoccospheres. Shaded interval represents the period of ice coverage at the sediment trap station from 1 to 10 April, 1991.

coccospheres ofEmiliania huxleyimight be related tothe unusually large separation of the distal andproximal shields in coccoliths (Plate II; resemblingthe cold water type of Nishida, 1979), facilitatingthe disintegration of coccospheres.
The apparent seasonal pattern in total coccolith fluxrecorded at 258 m was not displayed at 1061 m depth(Fig. 4). A few short pulses of coccolith fluxes wererecorded during late winter 1990 and spring 1991,with a maximum of 13× 106 coccoliths m22 d21
during the second half of January 1991.Coccolithuspelagicusdominated the assemblage at the deep trap,forming approximately 100% of the counts. Cocco-liths of Emiliania huxleyi and subtropical specieswere virtually absent. The maximum coccosphereflux was reached during the second half of May1991 with 1.8× 10⁵ ind. m22 d21 (Figs. 4 and 5b).Coccospheres ofE. huxleyi were absent, but twococcospheres ofBraarudosphaera bigelowiiwereencountered in April 1991. The daily average cocco-
lith and coccosphere fluxes at the deep trap were2.2× 106 and 2.1× 10⁴ m22 d21, respectively, show-ing a decrease with respect to the shallow trap by afactor 7 and 12. At both depths, elevated fluxes ofboth coccoliths and coccospheres were recordedsimultaneously.
4.2. Mode of coccolith transportation during main fluxevents at 258 m
The SEM survey on two unprocessed samples from258 m depth revealed the principal coccolithophoresettling mechanisms during their main sedimentationphases in autumn 1990 and spring 1991. In sample 7(24 November–12 December 1990) many cylindricalshaped fecal pellets were observed, containing a largeamount of fragmented coccoliths (Plate I, 3 and 4).Intact coccospheres ofCoccolithus pelagicusandcoccoliths ofC. pelagicusandEmiliania huxleyiwerefound entangled in marine snow aggregates. These
A.T.C. Broerse et al. / Marine Micropaleontology 39 (2000) 179–200190
Fig. 5. Coccolith (bar) and coccosphere (line) fluxes ofCoccolithus pelagicusat (a) 258 m and (b) 1061 m depth. Coccolith fluxes of (c)Emiliania huxleyiand (d) subtropical species at 258 m water depth. Note the different scales. Shaded interval represents the period of icecoverage at the sediment trap station from 1 to 10 April, 1991.
aggregates contained silicoflagellates, predominantlythe cold water genusDistephanus, embedded in anorganic matrix (Plate I, 1 and 2). Agglutination ontintinnid loricae, mostly with intact coccoliths ofC.pelagicus, was also commonly observed, and occa-sionally tintinnids were entangled in the aggregatesof silicoflagellates (Plate I, 1 and 5). In sample 14(26 March–12 April 1991) the settling materialconsisted mainly of fragmented frustules of centricand pennate diatom, and of some intact diatoms.Coccoliths as well as coccospheres appeared mainlyas isolated particles, uniformly distributed among thediatom remains. Only a small amount of coccolithswas incorporated into fecal pellets or agglutinatedon tintinnids.
4.3. Alteration processes inCoccolithus pelagicus
4.3.1. Coccolith/coccosphere ratioThe coccolith/coccosphere ratio ofCoccolithus
pelagicusrecords the number of detached coccolithsrelative to the number of intact coccospheres. Atthe 258 m depth, the average ratio during autumn1990 was 31:1, while during spring 1991 detachedcoccoliths were relatively more abundant, asexpressed in a ratio of 53:1 (Fig. 5a). The averageratio, integrated over the 1 year duration of the sedi-ment trap experiment, increased from 38:1 at 258 m to104:1 at 1061 m, indicating that the coccospheres ofC. pelagicusdisintegrate with depth (Fig. 5a and b).
4.3.2. FragmentationThe percentage of fragmentedCoccolithus pelagi-
cuscoccoliths (including coccoliths both fragmentedand etched) at 258 m depth varied in samples betweenapproximately 25 and 65% in autumn 1990. Duringthis period, the highest fragmentation percentagecoincided with the maximum coccolith flux ofC.pelagicus. During spring 1991, fragmentation at258 m was relatively low and constant with40%(Fig. 6a; Table 2). At 1061 m water depth 35–50%of the coccoliths were fragmented, which iscomparable to the values in the 258 m trap (Fig. 6a).
4.3.3. DissolutionAt 258 m depth, both slightly and heavily etched
coccoliths are encountered within a single sample(Plate II; Fig. 6b). There is, however, a clear tendency
towards increased percentages of more heavily etchedspecimens during the end of both the autumn and thespring bloom (Fig. 6b). During peak fluxes (samples 7and 14) less than 10% of the coccoliths are etched,while during declining or low fluxes more than 90% ofthe coccoliths show signs of dissolution (Fig. 6b;Table 2). In samples with a high percentage of etchedcoccoliths, coccoliths become more heavily etched.On average 32% of the coccoliths at 258 m depthwere etched. The degree of dissolution within asample of Coccolithus pelagicuscoccoliths wassummarised quantitatively as a Corrosion Index (CI)(Table 2). The CI index is highly variable during theseasonal development of coccolithophore fluxes inspring and autumn, with the coccoliths being moreseverely etched during low flux intervals (Fig. 6b;Table 2).
At 1061 m depth, the percentage of etched cocco-liths increased dramatically, to more than 85% (Table2). However, the degree of etching of corroded cocco-liths does not increase significantly with depth (Fig.6b). The CI values at 1061 m depth are relativelyconstant and high (Table 2).
4.4. Coccolithophore–CaCO3 flux
At 258 m depth the calculated coccolithophore–CaCO3 fluxes (including coccoliths and coccospheres)varied between 0 and 7.4 mg m22 d21, with a meandaily flux of 1.1 mg m22 d21 (Fig. 7a). Isolated cocco-liths contributed on average 73.5% and coccospheres26.5% to the coccolithophore–CaCO3 flux (Fig. 7a).The relative contribution of the species to the cocco-lithophore–CaCO3 flux showed an absolute domi-nance ofCoccolithus pelagicus. In the shallow trapat 258 mC. pelagicuscontributed 98.6%, andEmilia-nia huxleyi only 1.2%. The fine fraction (,32mm)carbonate flux varied between 0.2 and 14.1 mgm22 d21, with a mean daily flux of 4.0 mg m22 d21,contributing 13% of the total carbonate flux (Fig. 7b).
At 1061 m depth the calculated coccolithophore–CaCO3 flux was reduced to a mean daily flux of0.2 mg m22 d21, ranging from 0 to 1.2 mg m22 d21.At this depth the contribution of isolated coccoliths tothe coccolithophore–CaCO3 flux increased to 88%(Fig. 7a). The contribution ofCoccolithus pelagicusto the total coccolithophore–CaCO3 flux reachednearly 100%, since fluxes of other species were
A.T.C. Broerse et al. / Marine Micropaleontology 39 (2000) 179–200 191

A.T
.C.
Bro
erse
et
al.
/M
arin
eM
icrop
ale
on
tolo
gy
39
(20
00
)1
79
–2
00
192
Fig. 6. Graphs showing (a) the percentages of fragmented coccoliths ofCoccolithus pelagicusat 258 and 1061 m depth and (b) the degree of etching in coccoliths ofC. pelagicusover six stages, from non-etched (stage 0) to almost dissolved (stage 5) at 258 and 1061 m depth. Note that the percentage of fragmented coccoliths (a) also includes coccolithswhich are both fragmented and etched. Correspondingly, the percentage of etched coccoliths (b) includes coccoliths which are both etched and fragmented (see Table 2). Arrowsabove the graphs indicate the maximum coccolith flux ofC. pelagicusduring autumn 1990 and spring 1991 at 258 m depth.

drastically reduced in the deeper trap. The fine frac-tion carbonate flux varied between 0.1 and 10.5 mgm22 d21, with an average daily flux of 2.6 mgm22 d21, contributing 10.4% to the total carbonateflux (Fig. 7b).
5. Discussion
5.1. Ecological implications of the coccolithophorefluxes at 258 m depth
The coccolithophore flux record in the Sea ofOkhotsk at 258 m depth exhibited two peaks, duringautumn 1990 and spring 1991. The assemblageconsisted almost entirely of the two speciesCoccolithus pelagicusand Emiliania huxleyi. Fluxstudies in subarctic and arctic regions of the AtlanticOcean (Norwegian Sea: Samtleben and Bickert, 1990;
Andruleit, 1997 and Greenland Sea: Andruleit, 1997)and the Pacific Ocean (Bering Sea and central sub-arctic: Takahashi, 1995; Takahashi et al., 1997) haverevealed comparable results, with coccolithophoresettling assemblages dominated by the cold adaptedC. pelagicus together with the more eurythermalE. huxleyi. The average coccolith flux levels in theseregions vary within a narrow range (1–10× 107
coccoliths m22 d21) and are relatively low comparedto those at mid and low latitudes (39–110× 107
coccoliths m22 d21; Broerse and Ziveri, 1998).During autumn 1990 the trap at 258 m depth
recorded a gradually increasing and decreasing cocco-lithophore flux pattern. Maximum coccolithophorefluxes were recorded in November/December, whensea surface temperature had declined from its summermaximum of 14.88C to 4–28C. Both the cold-adaptedCoccolithus pelagicusand the more eurythermalEmiliania huxleyiare found in temperatures as low
A.T.C. Broerse et al. / Marine Micropaleontology 39 (2000) 179–200 193
Fig. 7. Graphs showing (a) the coccolith– and coccosphere–CaCO3 fluxes at 258 and 1061 m depth, and (b) the,32mm CaCO3 and.32mmCaCO3 fluxes (bars) and percentage of,32mm CaCO3 (line) at 258 and 1061 m depth. Shaded interval represents the period of ice coverage atthe sediment trap station from 1 to 10 April, 1991.
as 18C (Okada and McIntyre, 1979). A study onphytoplankton standing stock in the Sea of Okhotskrevealed highest concentrations of coccolithophores(in this caseE. huxleyi; C. pelagicuswas not identi-fied) in spring and decreasing abundances in summer(Smirnova, 1959). The foraminifera flux peakpreceded that of coccolithophores by 1 month (Fig.3; Alderman, 1996). Probably the production ofbiogenic silica had already terminated before thetrap experiment started, considering the low flux inthe shallow trap during this period (Fig. 3). The nutri-ent profiles obtained during the Shoyo cruise inAugust 1990 show a depletion of dissolved SiO2 inthe surface mixed layer, while NO3 and PO4 were stillavailable in the lower part of the 30 m deep mixedlayer (Honjo, unpubl. data). This suggests that cocco-lithophores took over the primary production afterdiatoms removed all Si in early September, and thatcoccolithophore production in the watercolumn isprimarily controlled by the availability of nutrients.The SEM survey revealed that the depletion of SiO2
might be related to the production of silicoflagellates(see Plate I, 1 and 2). The regular coccolithophore fluxdevelopment in the trap, and the coupling to decreas-ing nutrient availability in the surface water, suggestthat the flux primarily reflects the actual seasonalplankton development in the euphotic zone in thearea of the trap station. However, the presence ofsub-tropical species in the trap samples (Fig. 5d)shows that some coccoliths have drifted into the traparea. Termination of the coccolithophore flux in lateDecember 1990 appears to be unrelated to ice-coversince it only started in April, but could be associatedwith the depletion of nutrients or for other pos-sible reasons such as the onset of vigorous winterconvection.
During the spring of 1991, bothEmiliania huxleyiandCoccolithus pelagicusfluxes peaked immediatelyafter the ice-edge started to retreat westwards from thesediment trap station in early April (Fig. 5a and c),when sea surface temperatures were still below218C(Fig. 2). Increased fluxes ofC. pelagicusduring sea-ice coverage, have been recorded in several occasionsin sediment traps in the Greenland Current area inwinter and early spring (Honjo, 1990; Andruleit,1997). Honjo (1990) suggested that a heterotrophicgrowth stage forC. pelagicuscould explain thegrowth of this species under low light conditions.
The flux of biogenic silica, dominated by diatomfrustules, peaked 2 months after the coccolithophoresin June 1991, and showed a more gradually increasingflux pattern (Figs. 3 and 4). The succession froma coccolithophore dominated towards a diatomdominated phytoplankton assemblage in the Sea ofOkhotsk is the reversal of the succession pattern inthe Greenland Sea, where diatoms tend to be the firstphytoplankton group to growth after the ice melting(Grøntved and Seidenfaden, 1938; Samtleben et al.,1995a). This rather exceptional succession pattern inthe Sea of Okhotsk, with an instantaneous flux pulseof bothC. pelagicusandE. huxleyiimmediately afterthe ice-retreat at Shoyo station might not reflect theproduction in the directly overlying water column,since this would imply an extremely rapid populationbuild up and settling to the trap at 258 m depth underunfavourable conditions. A more likely explanationfor the early flux of coccolithophores in March 1991is that the trap collected laterally transported cocco-lithophores which were produced in an area west orsouth of the trap station which was not covered by ice.This explanation is supported by the trapping ofcoccoliths of subtropical species such asG. oceanica,U. sibogae, andCoronosphaeraspp. (Fig. 5d), whichwere probably initially growing in the subtropicalPacific waters (Okada and Honjo, 1975) and enteredthe Sea of Okhotsk through the passages between theKuril Islands. In the Sea of Okhotsk the coccolithsmust have been further transported along the north-ward flowing West Kamchatka Current, whichbranches off the Kamchatka peninsula, continuingwestward towards the centre of the sea (Lipps andWarme, 1966).
5.2. Transport mechanisms to 258 m depth
During settling and sedimentation, individualcoccoliths and coccospheres are highly susceptibleto dissolution processes due to their minute size andvery low sinking rates. Hence, the principal transportmechanisms of these small biogenic particles from theeuphotic zone to the deep-sea is via incorporation intolarger particles, such as fecal pellets and marine snowaggregates (Honjo, 1975, 1976, 1977, 1980, 1982;Pilskaln and Honjo, 1987) or agglutination on tintin-nids (Takahashi and Ling, 1984; Winter et al., 1986).Therefore, a flux record reflects not only coccolith
A.T.C. Broerse et al. / Marine Micropaleontology 39 (2000) 179–200194
production in photic zone, but also the generation oftransport vehicles (Andruleit, 1997).
The SEM survey revealed distinct coccolithophoresettling mechanisms during the main coccolithophoreflux events in autumn 1990 and spring 1991 (Plate I).During autumn, coccolithophores were mainly trans-ported within cylindrical fecal pellets and marinesnow aggregates of silicoflagellates, and throughagglutination on tintinnids. These transportationmechanisms have distinct effects on the preservationof coccoliths (see Plate I). The observed fecal pelletscontained highly fragmented coccoliths and grazingappears to have a major effect on the mechanicalbreakage of coccoliths and the destruction of cocco-spheres. Identification of swimmers in the sedimenttrap samples revealed high abundances of the copepodCalanus plumchrusand other zooplankton in thisperiod (Shiga and Honjo, 1992). Fragmentation ofcoccoliths and disintegration of coccospheres, due tozooplankton grazing, have been observed in feedingexperiments and in field observations (Roth et al.,1975; Samtleben and Bickert, 1990; Harris, 1994;Knappertsbusch and Brummer, 1995; Andruleit,1997). The size of the aliquot prevents a quantitativeanalysis on the settling vehicles, yet the large percen-tage of fragmented coccoliths during autumn 1990(Fig. 6a) indicates that grazing was probably theprincipal mechanism affecting coccolithophore sedi-mentation. The mechanisms through which tintinnidsagglutinate coccoliths and other small particles is stillspeculative (Takahashi and Ling, 1984; Winter et al.,1986). The tintinnids observed during autumn 1990,used mainly coccoliths of the dominant speciesCoccolithus pelagicusfor agglutination on theirloricae. These coccoliths were mostly well preservedand intact, therefore tintinnids are probably dependenton living coccolithophores for agglutination. Numer-ous well preserved, intact coccospheres wereembedded in marine snow aggregates of silicoflagel-lates within an organic matrix, indicating that a part ofthe coccolithophore assemblage settled rapidly out ofthe euphotic zone without being grazed upon. Thehigh preservation potential of coccospheres in marinesnow aggregates during autumn 1990 was alsoreflected in the relatively low ratio of detached cocco-liths to intact coccospheres ofC. pelagicusat 258 mdepth (Fig. 5a).
Coccolithophore settling in fecal pellets and by
agglutination on tintinnids was insignificant duringthe early phase of the spring bloom in 1991. Thelow grazing activity during this period is supportedby the relatively low percentage of fragmentedcoccoliths, compared to the previous flux event inautumn (Fig. 6a). However, high abundances of thecopepod Eucalanus bungii in the sediment trapsamples in late April (Shiga and Honjo, 1992)suggest that grazing may have been an importantagent of the downward flux in a later phase of thespring bloom. The major biogenic flux componentduring the spring bloom was silica (Fig. 3) and theSEM survey revealed the presence of large amountsof fragmented and intact centric and pennate diatomfrustules (see Plate I, 6). Diatoms are known to be asignificant force in the removal of material from thesurface water to the deep ocean by secreting asticky mucus which enhances the formation ofaggregates in the water column (see Smetacek,1985). The sinking speed of marine snow aggre-gates may be accelerated by scavenging of mineralsand other biogenic particles during descent to thesea floor (Smetacek, 1985). Mucus secretionincreases in nutrient depleted waters and might berelated to the survival strategy of diatoms in senes-cent blooms (Smetacek, 1985). Recent worksuggests that bacteria may play an important rolein the inhibition of diatom aggregation and are ableto reduce the sinking flux of marine snow (seeAzam, 1998). In the early stage of the flux devel-opment during the spring bloom, no evident aggre-gation of coccolithophores with diatoms wasobserved (see Plate I, 6). The SEM survey wasconducted on a sample prior to the main silicaflux event, and it is likely that the formation ofgelatinous aggregates only occurred during the endof the spring bloom. Therefore, it seems likely thatcoccolithophores were removed from the euphoticzone predominantly by the ballast of the large amountof sinking particles, as was sustained by the increase ofbiogenic silica and lithogenic fluxes from trace valuesduring the winter to 129 and 3.6 mg m22 d21, respec-tively, after the spring thaw.
5.3. Comparison of coccolithophore fluxes at 258 and1061 m depth
The deep sediment trap at 1061 m displayed a
A.T.C. Broerse et al. / Marine Micropaleontology 39 (2000) 179–200 195

highly altered flux pattern compared to the shallowtrap at 258 m depth, in terms of species assemblage,flux magnitude, and timing of peak fluxes. Theaverage coccolith and coccosphere fluxes decreasedby a factor 7 and 12, respectively, and the coccolithassemblage at the deep trap became monospecificwith Coccolithus pelagicus. Coccoliths ofEmilianiahuxleyiwere not encountered at the deep trap, due totheir lower preservation potential. The coccolitho-phore flux maxima at the deep trap were approxi-mately 2 months delayed with respect to the shallowtrap in autumn 1990 and in spring 1991. This offset of2 months would imply an average settling velocityfrom the shallow to the deep trap of 27 m/day. Thisis an extremely low settling rate, hence we areuncertain about the source of the coccoliths in thedeep trap. The deep trap was deployed 105 m abovethe sea floor, therefore, the coccolithophore fluxrecord in the deep trap might have been overprintedby resuspended and laterally advected coccoliths. Thepresence of laterally advected material in the deeptrap is also inferred from the remarkable increase ofthe lithogenic flux in the deep trap and from thegeochemical signature of the lithogenic particles(Honjo, unpubl. data). However, the co-occurrenceof peak fluxes of coccoliths and coccospheres at1061 m depth would suggests that the flux pattern at1061 m is primarily the result of sedimentation fromthe watercolumn above, rather than of enrichment dueto resuspension from the sediment, since cocco-spheres usually disintegrate rapidly during sinking,become scarce in surface sediments and even scarcerin resuspended sediments (see Andruleit, 1997; Ziveriet al., 2000). The increase in the coccolith/cocco-sphere ratio ofC. pelagicusin the Sea of Okhotskfrom the shallow to the deep trap confirm thedisintegration of coccospheres with depth.
The massive decrease of coccolith flux betweenthe shallow and deep traps is clear evidence of astrongly corrosive environment. The solubility ofCO2 increases with decreasing temperature, increas-ing the rate at which CaCO3 will be dissolved(Sverdrup et al., 1942). Therefore at higher latitudescalcite dissolution can occur in shallow water(Schneidermann, 1977). Extensive studies in thenorthern Atlantic Ocean have shown that corrosionof coccoliths occurs in surface waters and proceedsduring sedimentation (Samtleben and Bickert, 1990;
Samtleben and Schro¨der, 1992; Samtleben et al.,1995a; Andruleit, 2000). A possible explanation forthe reduced flux in the deep trap is that the fecalpellets and marine snow aggregates, which providedthe coccolithophore transportation to the shallow trap,disintegrated during further sinking, causing theresuspension of coccoliths and the exposure to thecorrosive environment. Coprophagy and microbialdegradation are the principal mechanisms preventingthe sedimentation of fecal pellets (Honjo and Roman,1978; Smetacek, 1985; Gersonde and Wefer, 1987).Especially the less consolidated, elongated cylindricalpellets produced by euphausiids, are subjected to arapid disintegration and spilling of coccoliths(Honjo, 1975). Laboratory experiments revealed thatbiodegradation of the surface membrane of fecalpellets by bacteria is suppressed under cold conditions(Honjo and Roman, 1978). Therefore, it is more likelythat in the Sea of Okhotsk a prolonged residence timeof coccoliths in the water column is induced byconsumption of pellets and aggregates by largeranimals such as shrimps, fish or salps.
5.4. Dissolution degrees ofCoccolithus pelagicus
In most samples from 258 m depth, coccoliths ofCoccolithus pelagicusshowed a range of degrees ofetching (Fig. 6b). This indicates that carbonatedissolution in the Sea of Okhotsk is already takingplace at shallow depth. Progressive dissolution fromthe shallow to the deep trap was indicated by: a strongreduction of both coccolith and coccosphere fluxes;the assemblage change from a co-dominance ofEmiliania huxleyi and C. pelagicus towards amonospecific assemblage ofC. pelagicus; and bythe increasing proportion of etched coccoliths ofC.pelagicus.
The CI index reflects the overall state of the degreeof etching ofCoccolithus pelagicuscoccoliths withina sample. The CI index at 258 m showed a high varia-bility within seasonal production phases and wasinversely correlated to the magnitude of the coccolithflux (Fig. 6b; Table 2), indicating that the preservationof coccoliths strongly depends on rapid transport forprotection from corrosive water masses. During lowsedimentation phases, coccoliths have probably beensuspended in the watercolumn for a long period due toa lack of sinking vehicles and are highly susceptible to
A.T.C. Broerse et al. / Marine Micropaleontology 39 (2000) 179–200196
dissolution. Conversely, during high sedimentationphases, coccoliths become incorporated in largerparticles, which limits the exposure to ambientwater due to protection provided by the organic matrixas well as the accelerated sinking speed. A relativelyhigh proportion of etched specimens during low sedi-mentation stages was also recorded in sediment trapsamples from the subarctic Atlantic Lofoten Basin(Samtleben and Bickert, 1990). Andruleit (2000)suggested that highly etched coccoliths ofEmilianiahuxleyi in surface waters of the Norwegian Current,might be the remnants of the previous year, since theyco-occurred with well preserved fragile coccoliths. Asmentioned before, a large part of the coccolithophoreassemblage during the main flux event in autumn1990 sedimented within fecal pellets. Harris (1994)reported feeding experiments on copepods whichsuggested that only 27–50% of the ingested calcitewas preserved in fecal pellets. However, our resultsshow no indication of enhanced dissolution due tograzing activity, since the fragmented coccoliths inpellets appear to be well preserved, in terms of disso-lution, as those in aggregates and on tintinnids (PlateI) and only low percentages of coccoliths during themain flux event in autumn 1990 appeared to be bothfragmented and etched (Table 2).
In the 1061 m trap the high percentage of etchedcoccoliths results in relatively high CI values.However, the degree of etching of etched coccolithsat 1061 m depth was comparable to that at 258 m(Fig. 6). This is surprising, since progressive dissolu-tion with depth should not only act upon non-corrodedcoccoliths, but also increase the degree of etching inalready corroded specimens. A possible explanationfor this discrepancy might be related to rapid dissolu-tion of heavily etched coccolith stages at depth.
5.5. Coccolithophore CaCO3 production
Carbonate in the fine fraction may consist ofcoccoliths, coccospheres, juvenile foraminifera, fora-minifera and pteropod fragments, thoracosphaeridsand non-identifiable carbonate material (Paul et al.,1988). At open-ocean sediment trap stations,coccolithophores are usually the main calcium carbo-nate components of the fine (,32mm) fraction(Broerse et al., 2000a,b; Ziveri et al., 2000). In theSea of Okhotsk, however, the (calculated) coccolitho-
phore–CaCO3 weight accounts for only a limitedcontribution to the fine fraction: 27.5% at 258 m and8.0% at 1061 m water depth. This is also expressed inthe low correlation between the fine fraction CaCO3
and the calculated coccolithophore–CaCO3 flux: r 2 �0:75 at 258 m andr2 � 0:06 at 1061 m depth. Cocco-lithophores contributed on average 3.6% at 258 m and0.8% at 1061 m to the total CaCO3 flux. The averagecoccolithophore–CaCO3 flux was 1.1 mg m22 d21 at258 m and only 0.2 mg m22 d21 at 1061 m, implying aloss of coccolithophore–CaCO3 of 82%. However, thetotal CaCO3 flux was only 12% lower at 1061 mdepth. This indicates that relatively small carbonateparticles, such as coccoliths, dissolve more rapidlythan larger particles, e.g. foraminifera. The averagereduction in the fine fraction CaCO3 flux from 258to 1061 m depth was 35%. The increasing discrepancybetween the fine fraction and the coccolithophore–CaCO3 with depth, might be related to enrichmentof detrital carbonate in the deep trap, as also occurredwith lithogenic particles, which increased from3.6 mg m22 d21 at 258 m to 9.9 mg m22 d21 at1061 m.
6. Summary and conclusions
1. The coccolithophore export production in the Seaof Okhotsk as recorded at 258 m depth is charac-terised by strong seasonality with pronounced,elevated fluxes during autumn 1990 and spring1991. The coccolithophore assemblage mainlyconsisted of two species,Coccolithus pelagicusandEmiliania huxleyi.
2. During autumn 1990 a gradually increasing anddecreasing coccolithophore flux pattern, and thetiming of peak fluxes in a late stage of the planktonsuccession, suggest primarily coccolithophoreproduction in the above surface water. Duringearly spring 1991, the instantaneous coccolitho-phore flux peak immediately after the ice retreat,and the presence of subtropical species, suggestadvection of coccolithophores along the WestKamchatka Current from an ice-free region westor south of the trap station.
3. Differences in the preservation state of coccolithsand SEM observations, indicated distinct sinkingmechanisms during autumn and spring at 258 m
A.T.C. Broerse et al. / Marine Micropaleontology 39 (2000) 179–200 197

depth. During autumn, coccolithophores weremainly transported within cylindrical fecal pelletsand marine snow aggregates of silicoflagellates,and through agglutination on tintinnids. Grazingcaused severe fragmentation of coccoliths and thedisintegration of coccospheres. The high number ofintact coccospheres in marine snow aggregatesindicates rapid transportation. During early spring,coccolithophores were probably removed from theeuphotic zone predominantly by the ballast of thesinking diatoms.
4. Increasing carbonate dissolution with depth isexpressed in (1) a decrease of total coccolith andcoccosphere fluxes, (20 the absence ofEmilianiahuxleyiin the deep trap, (3) the increasing percen-tage of etched coccoliths ofCoccolithus pelagicusfrom 32% at 258 m to.90% at 1061 m depth, and(4) the coccolithophore–CaCO3 flux reduction of82% from 258 to 1061 m depth.
5. A Corrosion Index (CI) was developed to monitorseasonal changes in the preservation state of cocco-liths of Coccolithus pelagicuswithin each sample,by quantifying the degree of etching in coccoliths.During autumn 1990 and spring 1991 the Corro-sion Index and coccolithophore flux magnitude areinversely correlated at 258 m depth, reflecting thedependence of coccolithophores on transportmechanisms for protection against corrosive water-masses. At 1061 m depth, moderately high CIvalues express a dramatic increase in the percen-tage of etched coccoliths, but no increase in thedegree of etching within etched coccoliths.
Acknowledgements
We thank P. Westbroek and J. E. van Hinte forinitiating and guiding this research and for the helpfulcomments on an earlier version of the manuscript;and also Ric and Yoko Jordan, J.R. Young, and A.Lototskaya for recovering and translating some ofthe literature cited. Thanks to J.R. Young and an anon-ymous referee for providing many helpful suggestionson the manuscript. The authors also thank S. Karsfor operating the SEM and her assistance on thepreparations of the plates, R. Sheikh for assistingwith the processing of the samples, and J. Kist forthe ICP analyses. This work was funded by the
Dutch Science Foundation (NWO-GOA, grant #750.294.01A) and is part of the “GlobalEmilianiaModeling Initiative”. This is publication number990301 of the Netherlands Research School ofSedimentary Geology (NSG), Vrije Universiteit,Amsterdam.
References
Alderman, S.E., 1996. Planktonic foraminifera in the Sea ofOkhotsk: population and stable isotopic analysis from a sedi-ment trap. Internal report, Master of Science, Woods HoleOceanographic Institution, 99pp.
Andruleit, H., 1997. Coccolithophore fluxes in the Norwegian–Greenland Sea: seasonality and assemblage alterations. Mar.Micropaleontol. 31, 45–64.
Andruleit, H., 2000. Dissolution-affected coccolithophore fluxes inthe central Greenland Sea (1994/95). Deep Sea Res. II 47,1719–1742.
Azam, F., 1998. Microbial control of oceanic carbon flux: the plotthickens. Science 280, 694–696.
Baumann, K.-H., Andruleit, H., Schro¨der-Ritzau, A., Samtleben, C.,1997. Spatial and temporal dynamics of coccolithophorecommunities during low production phases in the Norwegian–Greenland Sea. In: Hass, H.C., Kaminski, M.A. (Eds.), Contri-butions to the Micropaleontology and Paleoceanography of theNorthern North Atlantic. Grzybowski Found. Spec. Publ. No. 5,pp. 227–243.
Broerse, A.T.C., Ziveri, P., 1998. Coccolithophore export produc-tion from equatorial to subpolar waters. Abstract, Seventh INAmeeting, Puerto Rico.
Broerse, A.T.C., Brummer, G.-J.A., van Hinte, J.E., 2000a. Cocco-lithophore export production in response to monsoonal upwel-ling off Somalia (northwestern Indian Ocean). Deep Sea Res. II47, 2179–2205.
Broerse, A.T.C., Ziveri, P., van Hinte, J.E., Honjo, S., 2000b.Coccolithophore export production, species composition, andcoccolith–CaCO3 fluxes in the NE Atlantic (348N 218W and488N 218W). Deep Sea Res. II 47, 1877–1905.
Gersonde, R., Wefer, G., 1987. Sedimentation of biogenic siliceousparticles in Antarctic waters from the Atlantic sector. Mar.Micropaleontol. 11, 311–332.
Grøntved, J., Seidenfaden, G., 1938. The phytoplankton of thewaters west of Greenland. Medd. øm Grønland 82 (2), 1–380.
Harris, R.P., 1994. Zooplankton grazing on the coccolithophoreEmiliania huxleyi and its role in the inorganic carbon flux.Mar. Biol. 119, 431–439.
Honjo, S., 1975. Dissolution of suspended coccoliths in the deep-seawater column and sedimentation of coccolith ooze. In: Sliter,W., Be, A.W.H., Berger, W.H. (Eds.), Dissolution of Deep SeaCarbonates. Cushman Found. Foram. Res. Spec. Publ. No 13,pp. 114–128.
Honjo, S., 1976. Coccoliths: production, transportation and sedi-mentation. Mar. Micropaleontol. 1, 65–79.
Honjo, S., 1977. Biogenic carbonate particles in the ocean; do they
A.T.C. Broerse et al. / Marine Micropaleontology 39 (2000) 179–200198
dissolve in the water column? In: Anderson, N.R., Malahoff, A.(Eds.). The Fate of Fossil Fuel CO2 in the Oceans, Plenum, NewYork, pp. 269–295.
Honjo, S., 1980. Material fluxes and modes of sedimentation inthe mesopelagic and bathypelagic zones. J. Mar. Res. 38 (1),53–97.
Honjo, S., 1982. Seasonality and interaction of biogenic andlithogenic particle flux at the Panama Basin. Science 218,883–884.
Honjo, S., 1990. Particle fluxes and modern sedimentation in thepolar oceans. In: Smith, W. (Ed.). Polar Oceanography, Part B:Chemistry, Biology, and Geology, Academic Press, New York,pp. 687–739.
Honjo, S., 1996. Fluxes of particles to the interior of the openoceans. In: Ittekkot, V., Scha¨fer, P., Honjo, S., Depetris, P.J.(Eds.). Particle Fluxes in the Ocean, Wiley, New York, pp.91–154.
Honjo, S., 1996b. The Northwestern Pacific Ocean, a crucial oceanregion to understand global change: rationale for new interna-tional collaborative investigations. In: Proc. IGBP Int. Symp. onBiogeochemical Processes in the North Pacific, pp. 1–15.
Honjo, S., Roman, M.R., 1978. Marine copepod fecal pellets:production, preservation and sedimentation. J. Mar. Res. 36,45–57.
Jordan, R.W., Broerse, A.T.C., Hagino, K., Kinkel, H., Sprengel, C.,Takahashi, K., Young, J.R., 2000. Taxon lists for studies ofmodern nannoplankton. Mar. Micropaleontol. 39, 309–314.
Kitani, K., 1973. An oceanographic study of the Okhotsk Sea—particularly in regard to cold waters. Bull. Far Seas Fish. Res.Lab. 9, 45–76.
Knappertsbusch, M., Brummer, G.-J.A., 1995. A sediment trapinvestigation of sinking coccolithophorids in the North Atlantic.Deep Sea Res. 42 (7), 1083–1109.
Lipps, J.H., Warme, J.E., 1966. Planktonic foraminiferal biofaciesin the Okhotsk Sea. Contrib. Cushman Found. Foram. Res. 17(4), 125–134.
McIntyre, A., McIntyre, R., 1971. Coccolith concentrations anddifferential solution in oceanic sediments. In: Funnell, B.M.,Riedel, W.R. (Eds.). The Micropaleontology of Oceans,Cambridge University Press, London, pp. 253–261.
Morley, J.J., Hays, J.D., 1983. Oceanographic conditions associatedwith high abundances of radiolarianCycladophora davisiana.Earth Planet. Sci. Lett. 66, 63–72.
Nishida, S., 1979. Atlas of Pacific nannoplanktons. News OsakaMicropaleontol. Spec. Pap. (3 April, 1979): 1–31.
Okada, H., Honjo, S., 1975. Distribution of coccolithophores inmarginal seas along the western Pacific Ocean and in the RedSea. Mar. Biol. 31, 271–285.
Okada, H., McIntyre, A., 1979. Seasonal distribution of moderncoccolithophores in the western North Atlantic Ocean. Mar.Biol. 54, 319–328.
Parkinson, C.L., Gratz, A.J., 1983. On the seasonal sea ice cover ofthe Sea of Okhotsk. J. Geophys. Res. 88, 2793–2802.
Paul, C.K., Hills, S.J., Thierstein, H.R., 1988. Progressive dissolu-tion of the fine carbonate particles in pelagic sediments. Mar.Geol. 81, 27–40.
Pilskaln, C.H., Honjo, S., 1987. The fecal pellet fraction of biogeo-
chemical particle fluxes to the deep sea. Global Biogeochem.Cycles 1 (1), 31–48.
Roth, P.H., Berger, W.H., 1975. Distribution and dissolution ofcoccoliths in the south and central Pacific. Contrib. CushmanFound. Foram. Res. 13, 87–113.
Roth, P.H., Coulbourn, W.T., 1982. Floral and solution patterns ofcoccoliths in surface sediments of the North Pacific. Mar.Micropaleontol. 7, 1–52.
Roth, P.H., Thierstein, H.R., 1972. Calcareous nannoplankton.DSDP, Initial Reports 14, 421–486.
Roth, P.H., Mullin, M.M., Berger, W.H., 1975. Coccolith sedimen-tation by fecal pellets: laboratory experiments and field observa-tions. Geol. Soc. Am. Bull. 86, 1079–1084.
Samtleben, C., Bickert, T., 1990. Coccoliths in sediment traps fromthe Norwegian Sea. Mar. Micropaleontol. 16, 39–64.
Samtleben, C., Schro¨der, A., 1992. Living coccolithophore commu-nities in the Norwegian–Greenland Sea and their record in sedi-ments. Mar. Micropaleontol. 19, 333–354.
Samtleben, C., Baumann, K.-H., Schro¨der-Ritzrau, A., 1995. Distri-bution, composition and seasonal variation of coccolithophorecommunities in the northern North Atlantic. In: Flores, J.A.,Sierro, F.J. (Eds.). Fifth INA Conf. Proc. Univ. Salamanca,University of Salamanca Press, Salamanca, pp. 219–235.
Samtleben, C., Scha¨fer, P., Andruleit, H., Baumann, A., Baumann, K.-H., Kohly, A., Matthiessen, J., Schro¨der-Ritzrau, A. (‘Synpal’working Group), 1995b. Plankton in the Norwegian–GreenlandSea: from living communities to sediment assemblages—anactualistic approach. Geol. Rundsch. 84, 108–136.
Sancetta, C., Silvestri, S., 1986. Pliocene-Pleistocene evolution ofthe North Pacific ocean–atmosphere system, interpreted fromfossil diatoms. Paleoceanography 1 (2), 163–180.
Schneidermann, N., 1977. Selective dissolution of recent coccolithsin the Atlantic Ocean. In: A.T.S. Ramsay (Ed.), OceanMicropaleontology. pp. 1009–1053.
Shiga, N., Honjo, S., 1992. Seasonal variation in zooplankton at astation in the Okhotsk Sea, from sediment trap samples.Abstract (in Japanese), Fall Meeting of the OceanographicalSociety of Japan, Sapporo.
Smayda, T.J., 1980. Phytoplankton species succession. In: Morris, I.(Ed.). The Physiological Ecology of Phytoplankton, Studies inEcology, Vol. 7. University of California Press, Berkeley, CA,pp. 493–570.
Smetacek, V.S., 1985. Role of sinking in diatom life-history cycles:ecological, evolutionary and geological significance. Mar. Biol.84, 239–251.
Smirnova, L.T., 1959. Phytoplankton in the Okhotsk Sea and KurilIsland region. Trudy. Inst. Okeanol. Akad. Nauk SSSR 30, 3–51(in Russian).
Sverdrup, H.U., Johnson, M.W., Fleming, R.H., 1942. The Oceans,their Physics and General Biology, Prentice-Hall, EnglewoodCliffs, NJ, 1087pp.
Takahashi, K., 1995. Opal particle flux in the subarctic Pacific andBering Sea and sidocoenosis preservation hypothesis. In:Tsunogai, S. (Ed.). Global Fluxes of Carbon and its RelatedSubstances in the Coastal–Sea–Ocean–Atmosphere System,Proc. 1994 Sapporo IGBP Symp., M. & J. International,Yaokohama, Japan, pp. 458–466.
A.T.C. Broerse et al. / Marine Micropaleontology 39 (2000) 179–200 199

Takahashi, K., Ling, H.Y., 1984. Particle selectivity of pelagictintinnid agglutination. Mar. Micropaleontol. 9, 87–92.
Takahashi, K., Fujitani, N., Yanada, M., Maita, Y., 1997. Fiveyear long particle fluxes in the central subarctic Pacific andthe Bering Sea. In: Tsunogai, S. (Ed.). BiogeochemicalProcesses in the North Pacific, Proc. Int. Mar. Sci. Symp.,Mutsu, Japan, Japan Marine Science Foundation, pp. 277–289.
Talley, L.D., Nagata, Y., 1995. The Okhotsk Sea and OyashioRegion PICES Sci. Rep. 2, Inst. Ocean Sci., 227pp.
Winter, A., Stockwell, D., Hargraves, P.E., 1986. Tintinnid agglu-tination of coccoliths: a selective or random process? Mar.Micropaleontol. 10, 375–379.
Yang, J., Honjo, S., 1996. Modeling the near-freezing dichothermallayer in the Sea of Okhotsk and its interannual variations.J. Geophys. Res. 101 (c7), 16 421–16 433.
Yasuoka, T., 1967. Hydrography in the Okhotsk Sea—(1).Oceanogr. Mag. 19 (1), 61–72.
Yasuoka, T., 1968. Hydrography in the Okhotsk Sea—(2).Oceanogr. Mag. 20 (1), 55–63.
Young, J.R., Ziveri, P., 1999. Calculation of coccolith volume andits use in calibration of carbonate flux estimates. Deep Sea Res.II 47, 1679–1700.
Ziveri, P., Broerse, A.T.C., van Hinte, J.E., Westbroek, P., Honjo,S., 1999. The fate of coccoliths at 488N 218W, NortheasternAtlantic. Deep Sea Res. II 47, 1853–1875.
A.T.C. Broerse et al. / Marine Micropaleontology 39 (2000) 179–200200
Copyright © 2022 FDOKUMEN