Turbulence as a driver for vertical plankton distribution in the subsurface upper ocean
Upload
independentCategory
view
1download
0
The spatial distribution of plankton communitiesin a SlopeWater anticyclonic Oceanic eDDY (SWODDY)
in the southern Bay of Biscay
Emilio Ferna¤ ndez1*, Florentina A¤ lvarez2, Ricardo Anado¤ n2, Susana Barquero3O, Antonio Bode3,Ana Garc|¤ a4, Carlos Garc|¤ a-Soto4, Julio Gil4, Nicola¤ s Gonza¤ lez3, Arantza Iriarte5,
Beatriz Mourin‹ o1, Francisco Rodr|¤ guez6P, Ricardo Sa¤ nchez4$, Eva Teira1, Silvia Torres1,Luis Valde¤ s7, Manuel Varela3, Ramiro Varela1 and Manuel Zapata1,6
1*Facultad de Ciencias del Mar, Universidad deVigo, E-36200,Vigo, Spain. 2Departamento de Biolog|¤ a de Organismos y Sistemas,Universidad de Oviedo, E-33071, Oviedo, Spain. 3Instituto Espan‹ ol de Oceanograf|¤ a, Centro Costero de A Corun‹ a, E-15001,
A Corun‹ a, Spain. 4Instituto Espan‹ ol de Oceanograf|¤ a, Centro Costero de Santander, E-39004, Santander, Spain. 5Departamento deBiolog|¤ aVegetal y Ecolog|¤ a, Universidad del PaisVasco, E-48080, Bilbao, Spain. 6Centro de Investigacio¤ ns Marin‹ as, Xunta de Galicia,
E-36620,Vilanova de Arousa, Spain. 7Instituto Espan‹ ol de Oceanograf|¤ a, Centro Costero de Gijo¤ n, E-33212, Gijo¤ n, Spain.OPresent address: Plymouth Marine Laboratory, Prospect Place,West Hoe, Plymouth, PL1 3DH, UK. PPresent address: StationBiologique, UMR 7127 CNRS/INSU/UPMC, BP 74, 29682 Rosco¡, France. $Present address: CIACOMAR^Universidade do
Algarve, Avenida 16 de Junho s/n, 8700-311, Olha‹ o, Portugal. *Corresponding author, e-mail: [email protected]
SlopeWater anticyclonic Oceanic eDDIES (SWODDIES) are typical mesoscale features of open-oceanwaters of the southern Bay of Biscay which usually develop in winter by shedding from the seasonalpoleward current £owing along the northern Spanish slope. These eddies have been intensively studiedfrom the physical perspective. However, their e¡ect on the distribution of biological properties and on thefunctioning of the pelagic ecosystem has not been assessed so far.To this aim, a sea-truth, multidisciplinaryand comprehensive study of a SWODDY was carried out in summer 1998. The eddy, radius of *50 km,was initially centred at 45.58N 6.08W, being characterized by a relatively homogeneous core of water in thecentre of the eddy extending from 80 to about 200 dbar. In the central region of the core, temperature(12.55^12.758C) and salinity (*35.70) values were higher than outside the eddy. The optical properties ofthe eddy also di¡ered from those of the surrounding waters. A distinct biological signature was foundassociated with the eddy. Depth-integrated chlorophyll-a concentrations were 25% higher at the eddycentre where upward doming of the seasonal pycnocline (up to 30 dbar) occurred. Enhanced phyto-plankton biomass was related to a higher contribution of 410 mm cells, mainly represented by diatomsand chrysophyceans. Phytoplankton and mesozooplankton species composition in and outside the eddydi¡ered signi¢cantly re£ecting the coastal origin of the water parcel trapped by the eddy. The sharpmodi¢cation of the planktonic community composition, biomass and associated size-structure caused byslope water oceanic eddies are likely to exert a signi¢cant e¡ect upon the upper trophic levels of the pelagicecosystem of the southern Bay of Biscay.
INTRODUCTION
Eddy motion in the ocean is a widespread phenomenonmainly generated at regions where strong mean shear £owoccurs (Wyrtki et al., 1976). A considerable body ofknowledge accumulated during the last decades clearlydemonstrated that mesoscale eddy activity exerts aprofound e¡ect on the chemistry and biology of openoceanic waters by enhancing productivity and by inducingentrainment and subsequent horizontal advection ofplanktonic organisms (e.g. The Ring Group, 1981; Angel& Fasham, 1983; Falkwoski et al., 1991; Smith et al.,1996). Eddies transport physical, chemical and biologicalproperties over long distances from the location wherethey are formed and constitute isolated ecological systemswhose function substantially di¡ers from that of thesurrounding waters. In recent years, detailed observational
and modelling investigations (e.g. McGillicuddy &Robinson, 1997; McGillicuddy et al., 1998; Oschlies &Garc� on, 1998; Oschlies et al., 2000; Garc� on et al., 2001)have stressed the signi¢cant role of eddy dynamics uponthe injection of nutrients into the photic layer and, ulti-mately, on the magnitude of new production in the openocean.
Maps of eddy kinetic energy for the Atlantic Oceancalculated from surface drift currents derived frommerchant ships (Wyrtki et al., 1976) show relatively highmesoscale eddy activity associated with the Bay of Biscayregion. Moreover, remote sensing studies based on theanalysis of sea surface temperature from infrared imagerydisplayed a widespread distribution of cyclonic and anti-cyclonic eddies of small horizontal extent over the Bay ofBiscay abyssal plain (Dickson & Hughes, 1981). A similarmesoscale pattern showing the presence of anticyclonic
J. Mar. Biol. Ass. U.K. (2004), 84, 501^517Printed in the United Kingdom
Journal of the Marine Biological Association of the United Kingdom (2004)
eddies of radius 50^75 km was inferred from sea-truthobservations obtained with drifting buoys deployed in thewestern approaches of the Bay of Biscay (Madelain &Kerut, 1978).
Among the diverse types of eddies described in waters ofthe Bay of Biscay (Madelain & Kerut, 1978; Pingree & LeCann, 1992a), the study of SlopeWater Oceanic eDDIES,named SWODDIES by Pingree & Le Cann (1992a), hasreceived increasing attention especially from a physicalperspective. According to these authors, SWODDIES areanticyclonic parcels of water of radius 50^60 km rotatingat maximum velocities of about 30 cm s71 and migratingwestward at *2 cm s71 over extended temporal scales(49 months). They are characterized by an upper core ofwater warmer and saltier than the adjacent waters.Remote sensing studies revealed that they are formed inthe winter period as they shed from the jet-like current£owing poleward along the upper slopes of the southernBay of Biscay (Pingree & Le Cann 1990, 1992a,b;Garcia-Soto, 2004). Hydrographic surveys conductedacross SWODDIES observed doming of the seasonalpycnocline near the eddy centre resulting in lower sea-surface temperature that allows their monitoring frominfrared satellite imagery (Pingree & Le Cann, 1992a,b).A signi¢cant surface chlorophyll response associated withthe doming of the seasonal thermocline has been recentlydescribed (Garcia-Soto et al., 2002; swoddy F90).
Although the current knowledge on SWODDIES isimportant (see references above), investigations focusedon the ecological characteristics of this particular type ofeddies have not been conducted so far. However, theobserved doming of the seasonal pycnocline with asso-ciated increased chlorophyll values, as well as the retentionof characteristics of slope waters within the eddy allowedus to hypothesize that measurable di¡erences might beexpected in the structure and functioning of the biologicalcommunities inhabiting these eddies with respect tosurrounding waters of the Bay of Biscay. These presumedchanges in ecological properties induced by SWODDIESare likely to be signi¢cant for the overall functioning ofthe pelagic communities in the southern Bay of Biscay,given the recurrent presence of anticyclonic oceaniceddies over seasonal and interannual scales (see table 2 inPingree & Le Cann, 1992a).
To test this hypothesis, a comprehensive, multidisci-plinary observational programme (GIGOVI) wasdesigned to examine the relationship between the physicalcharacteristics of SWODDIES and the composition, distri-bution and functioning of the planktonic food web. Firstly,a monitoring programme of the mesoscale ¢eld of thesouthern Bay of Biscay using infrared satellite imagerywas initiated ten months earlier and further intensi¢edthree months before sea-truth observations took place. Acold core eddy, named AE6, was detected, its evolutionmonitored, and ¢nally selected for a further detailedstudy given the thermal and dynamic characteristicswhich suggested that the feature was probably aSWODDY. Eddy AE6 was then intensively investigated in
situ during a 20 day cruise.A detailed account of the remote sensing structure
(Advanced Very High Resolution Radiometer [AVHRR],altimeter and SeaWiFS) and mesoscale and submesoscalephysical properties of anticyclonic eddy AE6 has been
published elsewhere (Garcia-Soto et al., 2002; Sa¤ nchez &Gil, in press). In this paper, we present a wider overview ofthe physical, chemical and biological observationsobtained from both the initial remote sensing and thesubsequent sea-truth programme conducted in thesouthern Bay of Biscay in summer 1998.
MATERIALS AND METHODS
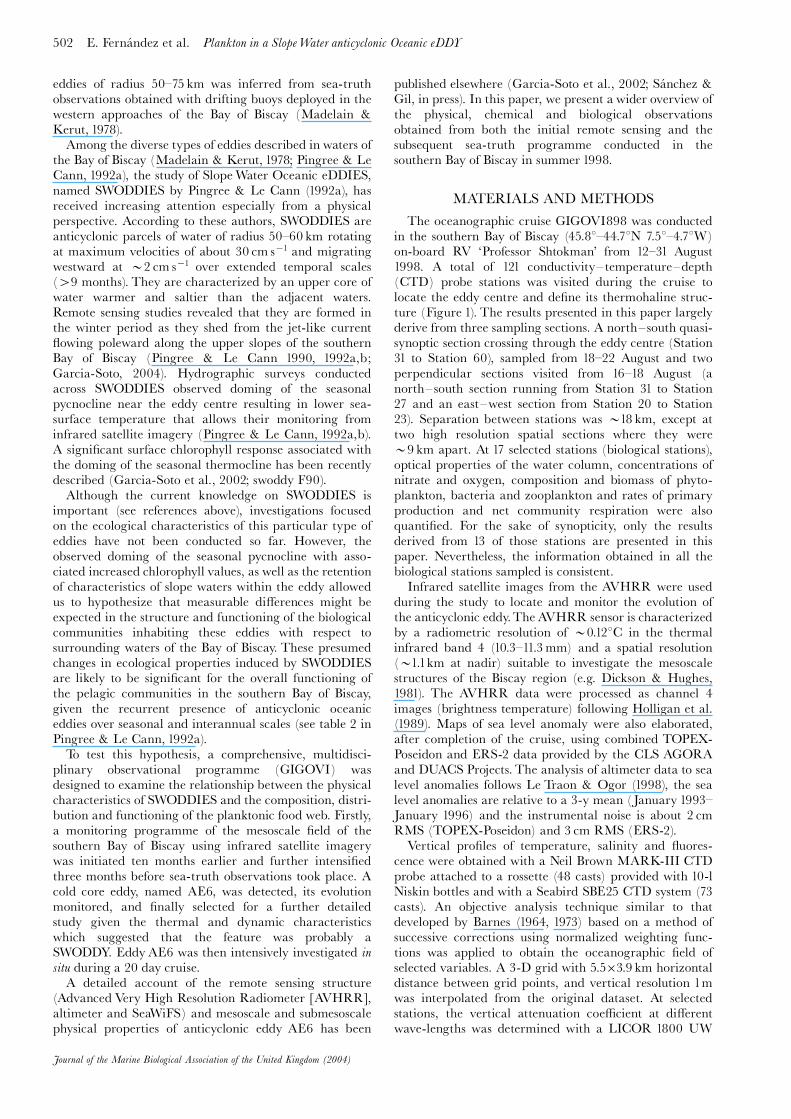
The oceanographic cruise GIGOVI898 was conductedin the southern Bay of Biscay (45.88^44.78N 7.58^4.78W)on-board RV ‘Professor Shtokman’ from 12^31 August1998. A total of 121 conductivity^temperature^depth(CTD) probe stations was visited during the cruise tolocate the eddy centre and de¢ne its thermohaline struc-ture (Figure 1). The results presented in this paper largelyderive from three sampling sections. A north^south quasi-synoptic section crossing through the eddy centre (Station31 to Station 60), sampled from 18^22 August and twoperpendicular sections visited from 16^18 August (anorth^south section running from Station 31 to Station27 and an east^west section from Station 20 to Station23). Separation between stations was *18 km, except attwo high resolution spatial sections where they were*9 km apart. At 17 selected stations (biological stations),optical properties of the water column, concentrations ofnitrate and oxygen, composition and biomass of phyto-plankton, bacteria and zooplankton and rates of primaryproduction and net community respiration were alsoquanti¢ed. For the sake of synopticity, only the resultsderived from 13 of those stations are presented in thispaper. Nevertheless, the information obtained in all thebiological stations sampled is consistent.
Infrared satellite images from the AVHRR were usedduring the study to locate and monitor the evolution ofthe anticyclonic eddy.The AVHRR sensor is characterizedby a radiometric resolution of *0.128C in the thermalinfrared band 4 (10.3^11.3mm) and a spatial resolution(*1.1km at nadir) suitable to investigate the mesoscalestructures of the Biscay region (e.g. Dickson & Hughes,1981). The AVHRR data were processed as channel 4images (brightness temperature) following Holligan et al.(1989). Maps of sea level anomaly were also elaborated,after completion of the cruise, using combined TOPEX-Poseidon and ERS-2 data provided by the CLS AGORAand DUACS Projects. The analysis of altimeter data to sealevel anomalies follows Le Traon & Ogor (1998), the sealevel anomalies are relative to a 3-y mean (January 1993^January 1996) and the instrumental noise is about 2 cmRMS (TOPEX-Poseidon) and 3 cm RMS (ERS-2).
Vertical pro¢les of temperature, salinity and £uores-cence were obtained with a Neil Brown MARK-III CTDprobe attached to a rossette (48 casts) provided with 10-lNiskin bottles and with a Seabird SBE25 CTD system (73casts). An objective analysis technique similar to thatdeveloped by Barnes (1964, 1973) based on a method ofsuccessive corrections using normalized weighting func-tions was applied to obtain the oceanographic ¢eld ofselected variables. A 3-D grid with 5.5�3.9 km horizontaldistance between grid points, and vertical resolution 1mwas interpolated from the original dataset. At selectedstations, the vertical attenuation coe⁄cient at di¡erentwave-lengths was determined with a LICOR 1800 UW
502 E. Ferna¤ ndez et al. Plankton in a SlopeWater anticyclonic Oceanic eDDY
Journal of the Marine Biological Association of the United Kingdom (2004)
spectroradiometer which was deployed down to 90m.Subsurface irradiance readings were corrected accordingto the irradiance values recorded with a LICOR 2p PARsensor located on-deck.
At every ‘biological’ station, the concentration of dissolvedinorganic nitrate and ammoniumwas measuredwith aTech-nicon AAII autoanalyser (Grasho¡ et al., 1983) and theconcentration of dissolved oxygen according to theWinklermethod (see UNESCO, 1994). Vertical nitrate £uxes acrossthe deep chlorophyll maximum were calculated from theproduct of the estimated di¡usion coe⁄cients Kz and thegradients of nitrate concentration across the deep chlorophyllmaximumas detailed inMourin‹ o et al. (2002).
The concentration of chlorophyll-a by three phyto-plankton size-classes (0.2^2 mm, 2^10 mm and 410 mm)were determined £uorimetrically on 90% acetone extractsas described in Teira et al. (2001). The absorption coe⁄-cients of total particulate matter (Ap), chlorophyll-containing particles (Aph) and non-phytoplankton parti-culate matter (Ad) integrated over the 400^700 nm photo-synthetically available radiation (PAR) range weredetermined as inVarela et al. (1998). The concentration ofmarker pigments were measured by high performanceliquid chromatography (HPLC) as detailed in Zapata et
al. (2000). The abundance of phytoplankton species wasquanti¢ed by settling 50^100ml Lugol-¢xed samples.Phytoplankton cells 42 mm were counted using aninverted microscope. Size-fractionated primary produc-tion rates (0.2^2 mm, 2^10 mm and 410 mm) weremeasured through the incorporation of NaH14CO3
7
during in situ simulated incubations of seawater samplescollected from ¢ve depths as described in Teira et al.(2001). Rates of microbial net O2 community productionwere determined from in vitro changes in dissolved oxygenafter 24 h light and dark incubations as in Serret et al.(1999). Nitrate and ammonium uptake rates were deter-mined experimentally by means of incubations of planktonfrom three depths within the euphotic zone with traceramounts of 15N (Dudgale & Goering, 1967; Glibert et al.,1982). New production was estimated from nitrate uptakeand f values were computed for selected stations. Dailynew production rates were calculated from hourly ratesby assuming that N incorporation occurred at the samerate over the 24 h period.
Bacterial abundance was determined in samplespreserved with glutaraldehyde (5% ¢nal concentration)using the method of Porter & Feig (1980). Bacterialcellular carbon was estimated from biovolumes using the
Plankton in a SlopeWater anticyclonic Oceanic eDDY E. Ferna¤ ndez et al. 503
Journal of the Marine Biological Association of the United Kingdom (2004)
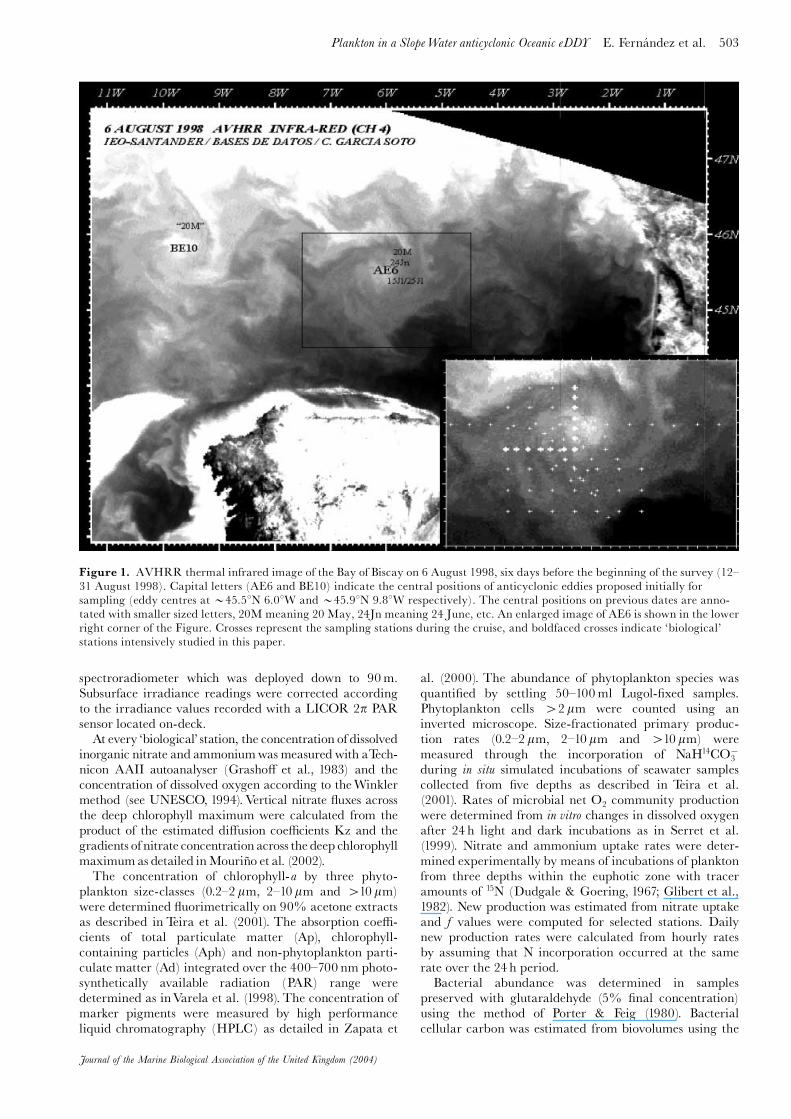
Figure 1. AVHRR thermal infrared image of the Bay of Biscay on 6 August 1998, six days before the beginning of the survey (12^31 August 1998). Capital letters (AE6 and BE10) indicate the central positions of anticyclonic eddies proposed initially forsampling (eddy centres at *45.58N 6.08W and *45.98N 9.88W respectively). The central positions on previous dates are anno-tated with smaller sized letters, 20M meaning 20 May, 24Jn meaning 24 June, etc. An enlarged image of AE6 is shown in the lowerright corner of the Figure. Crosses represent the sampling stations during the cruise, and boldfaced crosses indicate ‘biological’stations intensively studied in this paper.

empirical equation of Norland et al. (1987) for bacteriabetween 0.001 and 0.5 mm3. Bacterial biovolumes werecomputed from measurements of bacterial dimensions.Mean biovolume of bacteria in this study was0.11�0.09 mm3 cell71 (N¼254), and the resulting carboncontent was 12.7�10.5 fg C cell71.
A tripleWP2 net (40 cm diameter and 200-mmmesh) wasused for mesozooplankton sampling (Fraser, 1968). The netwas deployed down to 200mat a speed of 1m s71. One of thethree samples was sequentially screened through 1000 mmand 200 mm and then both size fractions ¢ltered throughglass ¢bre ¢lters, these were then frozen (7208C) until thefurtherdeterminationofdryweightashore. Samples for taxo-nomic identi¢cation of zooplankton were preserved withborax bu¡ered formalin (4%) and the species identi¢ed andcountedunder the stereomicroscope.
RESULTSSatellite imagery
Figure 1 shows a thermal infrared image of the Bay ofBiscay on 6 August 1998, six days before the beginning of
the survey. The surface central region of two anticycloniceddies (AE6 and BE10) can be seen in the thermal infra-red image as an oval patch of cool water (white shades),known to indicate the local elevation of the seasonal ther-mocline of SWODDIES (Pingree & Le Cann, 1992a). Theanticyclonic sense of rotation of both structures is visua-lized by ¢laments of cool water coming from the north(*46.58N) that trace the ¢eld of £ow at the northernand eastern margins of the eddies. Comparison withsimultaneous altimeter observations (sea level anomalies)reveals that these jet structures result in surface waterbeing drawn around the eddy margins between the mainanticyclone and associated smaller surrounding cyclones(Garcia-Soto et al., 2002). Maps of sea level anomaly(mm) are also shown here (Figure 2) shortly before,during and shortly after the cruise time (12^31 August)and they show the spatial structure of the swoddy AE6changing in time by interaction with the surroundingcyclones (see for example C1). The anticyclone AE6 waschosen as the target mesoscale structure for sea-truthsampling as the series of satellite observations indicatedthat it was a persistent feature. AE6 was last observed on
504 E. Ferna¤ ndez et al. Plankton in a SlopeWater anticyclonic Oceanic eDDY
Journal of the Marine Biological Association of the United Kingdom (2004)
Figure 2. Maps of sea level anomaly (TOPEX-Poseidon and ERS-2 data) showing the spatial structure of swoddy AE6 on dates:(A) 02^11 August 1998; (B) 12^21 August 1998; (C) 22^31 August 1998; and (D) 01^10 September 1998. The sea level elevationassociated to the anticyclonic swoddy is highlighted with shading. ‘C1’ and ‘C2’ indicate surrounding cyclones.

22 September at *45.38N 7.08W having travelled west-wards *100 km since its ¢rst AVHRR observation on20 May. Before 20 May, AVHRR observations of theeddy were scarce due to unsettled weather that made itdi⁄cult to track eddies continuously.
Thermohaline structure
The spatial distribution of temperature at the 200misobath during the survey clearly shows the presence of awarm, relative to water outside or adjacent to the eddy,subsurface core of water located at the eddy centre anddelineates the extension of AE6 (Figure 3). Temperatureat 200 dbar changed from 128C outside the eddy to12.48C at the centre, over a horizontal scale of 50^60 km.The thermal gradient established between subsurfacewaters located outside and inside the eddy (0.04^
0.058Ckm71) indicates progressive depression of isothermstowards the eddy centre resulting in anticyclonic motion ofthe mesoscale structure.
A north^south quasi-synoptic section crossing throughthe eddy centre (Stations 31 to 60; for reference see Figure3) shows the presence of the seasonal pycnocline in theupper 70 dbar and the slope of isotherms, isohalines and,hence, isopycnals towards the eddy centre (Figure 4). Thesection shows a central homogeneous core situatedbetween 80^200 dbar with typical near-constant salinity(35.70) and a weak temperature gradient from 12.75^12.558C at the eddy centre. The slope of isohalinesdecreased considerably below the 27.1 isopycnic surfacedue to the progressive extinction of the core. The core ofthe eddy was warmer and saltier than neighbouringwaters. Typical potential temperature and salinity values
Plankton in a SlopeWater anticyclonic Oceanic eDDY E. Ferna¤ ndez et al. 505
Journal of the Marine Biological Association of the United Kingdom (2004)
Figure 3. Distribution of temperature (8C) at the 200misobath. Dots represent CTD stations. Encircled dots indicatestations included in the sections shown in Figures 4 to 8. Thecodes of the main stations cited in the text are also shown.
Table 1. Physical characteristics of surface (10 dbar) andsubsurface waters (200 dbar) at stations located inside (Stations20 and 27) and outside (Stations 23 and 31) the slope wateroceanic eddy (AE6).
St. 20Eddycentre
St. 27Eddycentre
St. 23Outsideeddy
St. 31Outsideeddy
Latitude N 45817 45817 45817 45847Longitude W 68 10.50 68 10.35 68 53 68 10.43Water depth (m) 4250 4800 4400 4800Depth 128C isotherm (m) 425 363 251 207
10 dbar
Potential temp. 8C 19.49 19.43 19.81 19.75Salinity 35.809 35.803 35.708 35.818Sigma-t 25.513 25.523 25.350 25.451
200 dbar
Potential temp. 8C 12.42 12.48 12.11 12.01Salinity 35.697 35.698 35.674 35.665Sigma-t 27.044 27.032 27.087 27.099
Figure 4. Latitudinal section (Stations 31 to 60; see Figure 3)of temperature (8C), salinity and sigma-t through the slopewater oceanic eddy AE6.

at 200 dbars were 12.42^12.488C and 35.69, respectively(Table 1), values 0.3^0.48C and 0.02^0.03 higher thanthose measured in waters located outside the eddy. Sigma-t values at 200 dbar were lower inside the eddy. Bycontrast, surface waters were cooler, saltier and denser atsurface layers of the eddy centre as a consequence of theoutcropping of the seasonal pycnocline. The observeddensity ¢eld could somewhat be a¡ected by tidal activity.However, given the fact that several stations were visitedin di¡erent times within a quasi-synoptic time scale, itseems likely that tidal e¡ects on the quasi-geostrophicadjustment were largely ¢ltered.
Figure 5 represents east^west geostrophic velocitiescalculated for a high spatial resolution CTD section. Theno motion level was selected as 1500 dbar. Velocities werecalculated below 65 dbar to overcome the perturbation ofthe density ¢eld caused by internal waves (see Figure 10).The distribution of geostrophic velocities reveal the anti-cyclonic rotation of the eddy down to 1500m. Velocitiesexceeding 410 cm s71 were found in the upper 300 dbar,*20 km away from the eddy centre.The geostrophic velo-city ¢eld at surface layers was asymmetric with highervelocities in the southern region of the section. The inter-action of AE6 with mesoscale surface structures appears asthe most likely explanation for this geostrophic pattern(Sa¤ nchez & Gil, in press). In the northern part of theeddy, the eastward £ow characteristic of the upper layersreversed below 600 dbar.
The distribution of thermohaline properties at 10 dbar(Figure 6), evidence the e¡ect of eddy-induced outcrop-ping of the thermocline at the eddy centre. At this depth,the upper water column was 40.48C cooler and 40.04saltier at the eddy centre than in waters outside the eddy(Figure 6A,B). The 25.25 isopycnic surface showed asloping from *28m in the peripheral region to less than8m at the top of the SWODDY core, a rather density-homogeneous region (Figure 6C).
In this paper, two perpendicular sections of CTDstations, both of them converging at the eddy centre, wereselected to describe the spatial distribution of chemical andbiological variables (Figure 7). Sampling of the twosections was completed in three days. The thermohalinecharacteristics of the perpendicular sections (Figure 7)were similar to those described above (see Figure 4).Di¡erences in the vertical location of isotherms and isoha-lines between both sections re£ected the lack of synopticity
506 E. Ferna¤ ndez et al. Plankton in a SlopeWater anticyclonic Oceanic eDDY
Journal of the Marine Biological Association of the United Kingdom (2004)
Figure 5. Geostrophic velocities (cm s71) across the slopewater oceanic eddy AE6 (Stations 31 to 49 see Figure 3).Sigma-t values are also overlapped. Dotted lines indicatenegative (westward) velocities.
Figure 6. Horizontal distribution of: (A) temperature (8C);(B) salinity; and (C) sigma-t at the 10m isobath.

caused by the sampling of ‘biological’ stations (Stations 20and 27 at the eddy centre and Stations 23 and 31 outsidethe eddy) that lasted 24 h. As a consequence, the eddycentre (Stations 20 and 27) was visited with a two days
o¡-set. The warm and saline subsurface core of the eddyas well as the doming of the seasonal pycnocline wasclearly manifested.
Nitrate and dissolved oxygen
The distribution of dissolved nitrate (Figure 8) closelyfollowed the density structure of the upper 500 dbar ofthe water column. Nitrate was exhausted (50.5 mmol l71)in the upper mixed layer. The nitracline was located at50^75 dbar, depending on the station. The vertical loca-tion of the nitracline was associated with that of theseasonal pycnocline (e.g. Station 20). At subsurface layersand for a given depth, nitrate concentration was lower atthe core of the eddy than at outside waters. Ammoniumconcentrations were low in surface waters both inside andoutside the eddy (50.2 mmol l71). Relatively higherdissolved oxygen concentrations were measured in theupper 100 dbar than below this depth. Maximum values
Plankton in a SlopeWater anticyclonic Oceanic eDDY E. Ferna¤ ndez et al. 507
Journal of the Marine Biological Association of the United Kingdom (2004)
Figure 7. Vertical section (500m) of (A) temperature (8C);and (B) salinity along the east^west, north^south intensivesection (for the location of stations see Figure 3).
Table 2. Vertical attenuation coe⁄cients and absorptioncharacteristics (integrated over the 400^700 nmphotosynthetically available radiation [PAR] range) ofsuspended particulate matter for stations located inside (Stations20 and 27) and outside (Stations 23 and 31) the slope wateroceanic eddy (AE6).
St. 20Eddycentre
St. 27Eddycentre
St. 23Outsideeddy
St. 31Outsideeddy
Ap 5 m 5.0 1.9 2.1 1.7Ap 1% Io 11.0 4.7 5.4 3.8Aph 5 m 4.0 1.4 1.5 1.3Aph 1% Io 9.1 3.7 4.6 3.2Ad 5 m 1.0 0.5 0.5 0.4Ad 1% Io 1.9 1.0 0.9 0.6Kd (PAR) (m71) 0.056 0.096 0.07Kd 440/Kd 660 0.307 0.5 0.19
Ap, absorption coe⁄cient of total suspended particulate matter;Aph, absorption coe⁄cient of chlorophyll-containing particles;Ad, absorption coe⁄cient of non-phytoplankton particulatematter.
Figure 8. Vertical section (500m) of dissolved inorganicnitrate and oxygen along the east^west, north^south intensivesection (for the location of stations see Figure 3).

were associated with subsurface layers where a chloro-phyll-a (chl-a) maximum developed (see Figure 9). Rela-tively low oxygen concentration characterized the core ofthe eddy from 100 to 250 dbar.
Mesoscale spatial and short-scale temporal chlorophyll-a distribution
The distribution of chl-a in the upper 100 dbar of theperpendicular section together with the accompanyingthermal ¢eld is represented in Figure 9. At Station 21,located at the eddy centre, doming of the thermocline isshown. Chl-a concentrations in the upper 20m of thewater column were always lower than 0.05mgm73.SeaWiFS chl-a observations near the sampling time (7August 1998; Garcia-Soto et al., 2002) did not show asigni¢cant chl-a increase near the eddy centre though the
satellite values were higher at the northern and easternmargins where the gradient of dynamic height (and asso-ciated geostrophic currents) was more intense. In situ datadepicted a distinct subsurface chl-a maximum (SCM) atall the stations, typically at 50^70 dbar. The vertical posi-tion of the SCM was shown, however, to be variable at theeddy centre.Whereas, it was located at 40 dbar at Stations20 and 21, it was measured at 70m at Station 27. Themagnitude of the SCM at the eddy centre was alwayshigher (0.4^0.6mgm73) than at the rest of the stations.
The drastic changes in the vertical location of the SCMat the eddy centre (30 dbar) appear to be related to theinteraction between the seasonal pycnocline and thepassage of short-period perturbations, internal waves,through the eddy region. The continuous deployment ofCTD casts at the eddy centre (45.28N 6.38W) for four
508 E. Ferna¤ ndez et al. Plankton in a SlopeWater anticyclonic Oceanic eDDY
Journal of the Marine Biological Association of the United Kingdom (2004)
Figure 9. Vertical section (100m) of temperature and chlorophyll-a along the east^west, north^south intensive section (for thelocation of stations see Figure 3).

hours illustrate the large variability at short time scales inthe thermal structure of the upper water column in theregion (Figure 10). Vertical excursions of the isotherms ofup to 20m were measured over temporal scales of about 10minutes. The subsurface chl-a maximum, initially locatedat 50^55 dbar, displayed excursions of the same spatialextension and temporal period as those described for theisotherms. The spatial continuity of the SCM seemed tobecome disrupted when the amplitude of the perturbationwas more intense, possibly as a result of shearing withinthe layers, although we cannot discard that this e¡ectwere the result of a contouring artefact. The magnitude ofthe SCM remained rather constant with values rangingfrom 0.4 to 0.7mgm73, a range similar to that measuredat CTD Stations 20 and 27. The vertical displacements ofisotherms and the SCM measured in this exercise were ofthe same magnitude to those observed at the two stationscorresponding to the eddy centre (Stations 20 and 27)sampled along the perpendicular sections (see Figure 9).Very similar results were obtained when the samesampling strategy was conducted in waters located
Plankton in a SlopeWater anticyclonic Oceanic eDDY E. Ferna¤ ndez et al. 509
Journal of the Marine Biological Association of the United Kingdom (2004)
Figure 10. Short-term vertical distribution of: (A) temperature (8C); and (B) chlorophyll-a concentration (mg m73) at the eddycentre (45811.100N 6816.100W).
Figure 11. Spatial distribution of depth integratedchlorophyll-a (100m) and the relative contribution of 410 mmphytoplankton cells to total chlorophyll-a along the east^west,north^south intensive section.

outside anticyclonic eddy AE6 (44.78N 5.88W). In thiscase, however, the SCM was located 10^20 dbar deeper.
Clear di¡erences in photic-depth integrated chl-aconcentration were identi¢ed between the eddy centre,the eddy margin and waters outside the eddy (Figure 11).Maximum depth-integrated chl-a concentrations,exceeding 25mgchl-a m72, were measured at Stations 20and 21, located at the eddy centre (see Figure 9). Bycontrast, minimum values were found at stations separated20^30 km from the centre, i.e. in the region wheremaximum geostrophic velocities were calculated (seeFigure 4). Hence, stations at the eddy centre displayedchl-a concentrations up to 48% higher as compared with
the surrounding waters. The contribution of 410 mmphytoplankton cells was consistently higher inside theeddy (420%) as compared with the surrounding waterswhere typical values were *17% (Table 4).
The same patterns of spatial variability detected inphytoplankton biomass were also manifested from theabsorption characteristics of the suspended particulatematter (Table 2). The absorption coe⁄cients of total parti-culate matter and chlorophyll-containing particles werehigher, almost by a factor of 2, at the centre than outsidethe eddy, both at surface waters and at the depth of the 1%isolume. The relative contribution of non-photosyntheticparticulate matter to total suspended particulate matter
510 E. Ferna¤ ndez et al. Plankton in a SlopeWater anticyclonic Oceanic eDDY
Journal of the Marine Biological Association of the United Kingdom (2004)
Table 3. Pigment concentrations and pigment ratios at surface and at the subsurface chlorophyll maximum (SCM) of Stations 20(eddy centre) and 23 (outside eddy) determined by HPLC analysis. SCM was located at 45 and 60 dbar at Stations 20 and 23,respectively.
PigmentEddy centre
(St. 20)mgm73Outside eddy(St. 23)mgm73
Eddy centre(St. 20)
pigment/chl-a
Outside eddy(St. 23)
pigment/chl-a
SurfaceChlorophyll-a 17.5 22.6Non-polar chlorophyll-c2 ‘Chrysochromulina type’ 3.8 3.6 0.217 0.159190 Hexanoyloxyfucoxanthin 2.6 8.3 0.149 0.367Zeaxanthin 2.1 9.1 0.120 0.402SCMChlorophyll-a 745.4 176.4Chlorophyll-b 100.3 112.6 0.135 0.638Non-polar chlorophyll-c2 ‘Chrysochromulina type’ 15.6 3.1 0.021 0.018Non-polar chlorophyll-c2 ’Emiliania huxleyi type’ 22.9 3.1 0.031 0.018190 Butanoyloxyfucoxanthin 34.2 16.5 0.046 0.094Fucoxanthin 61.1 24.3 0.082 0.138190 Hexanoyloxyfucoxanthin 275.6 80.4 0.370 0.456Peridinin 13.8 13.8 0.019 0.078Zeaxanthin 25.1 14.1 0.034 0.080
Table 4. Depth-integrated phytoplankton biomass, primary production, new production and net community production rates andestimated di¡usive nitrate £uxes at stations located inside (Stations 20 and 27) and outside (Stations 23 and 31) the slope wateroceanic eddy (AE6). f ratio computed from euphotic zone-integrated uptake rates.
St. 20Eddy centre
St. 27Eddy centre
St. 23Outside eddy
St. 31Outside eddy
Depth integrated (100m) chl-a (mg chl-a m72) 22.2 28.4 16 17.8Relative contribution of 410 mm chl-a (%) to total chl-a 27 23 17 17Depth integrated (100m) biomass of autotrophic £agellates(mg C m72)
105.1 77
Photic zone (1% Io) integrated total primary productionrates (mg C m72 d71)
247 357 169 340
Relative contribution of 5 2 mm primary producers (%) tototal primary production rate
24 38 38 46
Relative contribution of 2^10 mm primary producers (%) tototal primary production rate
28 24 18 15
Relative contribution of 4 10 mm primary producers (%) tototal primary production rate
48 37 45 39
Photic zone (1% Io) integrated net community production(g O2 m72 d71)
72.7 0.2 4.4 0.3
Eddy di¡usion coe⁄cients (Kz; cm2 s72) 1.8 1075 1.4 1075 7.8 1076 7.8 1076
Estimated di¡usive nitrate £uxes (mmol N m72 d71) 0.075 0.039 0.080 0.023Photic zone (1% Io) integrated new production(mmol N m72 d71)
0.41 0.77 0.91
Photic zone (1% Io) f ratio 0.1 0.14 0.29

did not show noticeable spatial di¡erences, accounting onaverage for *20% of total absorption. Signi¢cant di¡er-ences were neither found in the PAR vertical attenuationcoe⁄cient. However, the spectral extinction of photons bythe eddy waters clearly di¡ered from those not in£uencedby the mesoscale structure. The relationship between theattenuation coe⁄cients at 440 and 660 nm displayed atwo-fold increase inside the eddy (Table 2). This sharpchange in the relative seawater absorption of blue andgreen light derived mainly from an important reduction ofthe absorption at 660 nm rather than from a markedenhancement of the corresponding absorption at 440 nminside the eddy, and suggests the existence of distinct phyto-plankton populations inside and outside the SWODDY.
Phytoplankton species distribution
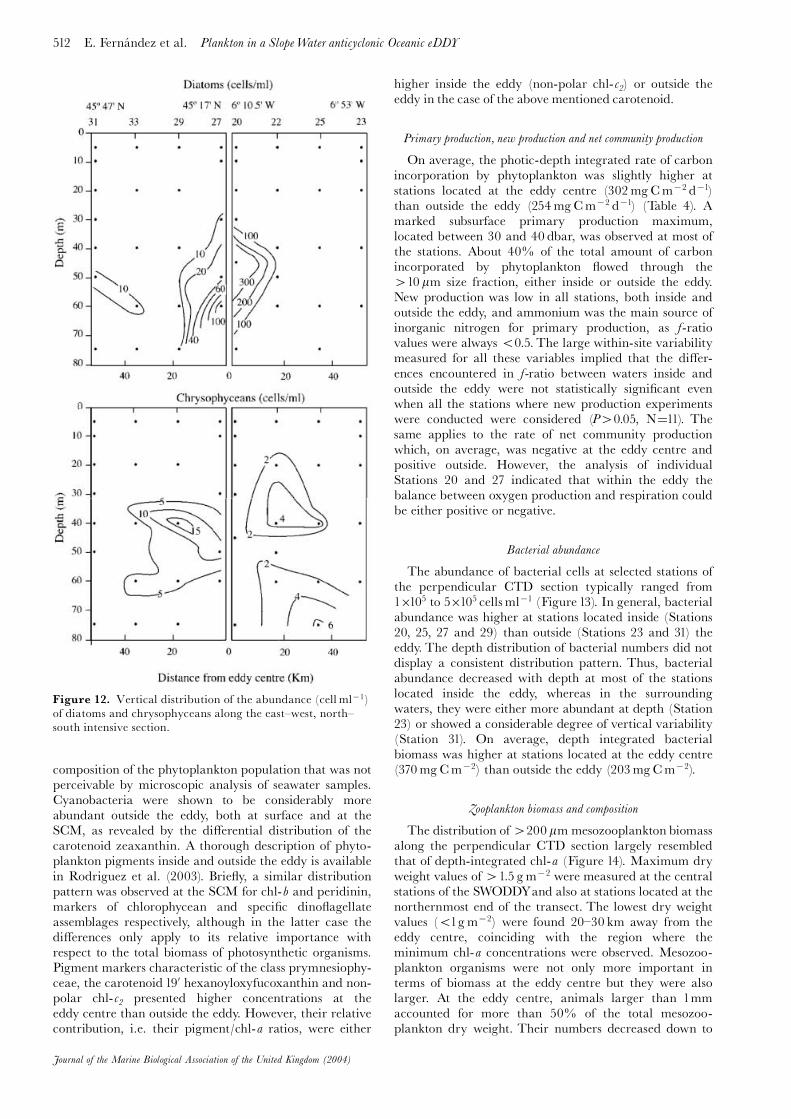
The microscopic examination of the planktonic primaryproducers revealed that waters inside and outside the eddyalso di¡ered in terms of the relative dominance ofphytoplankton assemblages (Figure 12). Dino£agellates,cryptophyceans and small unidenti¢ed £agellates(510 mm) were the most abundant phytoplankton groups.Their distribution was rather homogeneous across theeddy. Among dinophyceans, Cachonina niei, and small dino-£agellates (530 mm) dominated, with average numberof cells exceeding 6 and 30 cellsml71, respectively.
Representative species of this group were also Ceratium
lineatum, Gonyaulax polygramma, Triadinium polyedricum,
Oxytoxum sphaeroideum, Prorocentrum micans (with averagedabundances always 51 cell ml71) and several species ofthe genus Gyrodinium and Gymnodinium. By contrast,diatoms and chrysophyceans presented a distributionclosely associated with the mesoscale structure (Figure12). Diatoms were clearly concentrated in the central partof the eddy. Their abundances were remarkably higher inthe subsurface layer below 40 dbar, approximately coin-ciding with the location of the SCM. Several species ofthe genus Pseudo-nitzschia were the most common diatoms,with mean values of 425 cellsml71. Nitzschia longissima,Lioloma paci¢cum and small centric and pennate diatomswere also present, but their abundances never exceeded1cellml71. Chrysophyceans were represented especiallyby the silico£agellates Dictyocha ¢bula and D. speculum, andthe epibiontic £agellate Solenicola setigera.
The comparison of HPLC absolute and chlorophyll-a-normalized pigment concentrations between Stations 20and 23, located at the eddy centre and outside the eddyrespectively (Table 3), con¢rmed the results obtained frommicroscopic analysis.Thus, fucoxanthin, a pigment markerfor diatoms and chrysophyceans, showed higher absoluteand relative concentrations at the SCM inside the eddy.Nevertheless, HPLC analysis of photosynthetic pigmentsalso allowed us to gain additional insight into the
Plankton in a SlopeWater anticyclonic Oceanic eDDY E. Ferna¤ ndez et al. 511
Journal of the Marine Biological Association of the United Kingdom (2004)
Table 5. Abundance (ind m72) of mesozooplankton species at stations located inside (Stations 20 and 27) and outside (Stations 23and 31) the slope water oceanic eddy (AE6).
St. 20Eddy centre
St. 27Eddy centre
St. 23Outside eddy
St. 31Outside eddy
Total individuals 35261 37744 70633 195792Total copepods 34242 35826 66471 171362% copepods 97 95 94 88% juvenile copepods* 9 5 16 13% juvenile euphausiids* 38 3 76 63No copepod species 36 33 25 34
Species dominant outside the eddyClausocalanus pergens 15979 14817 22974 52577Clausocalanus lividus 40 207 5873 4122Centropages typicus 8 16 748 3891Mesocalanus tenuicornis 374 48 684 4838Appendiculariaceans 0 32 1854 11189
Species exclusive of waters outside the eddyDisconchoecia elegans 0 0 0 796Heterorhabdus norvegicus 0 0 0 294Calocalanus styliremis 0 0 525 2730Pleuromamma abdominalis 0 0 16 16Sagitta serratodentata 0 0 310 1058
Species dominant inside the eddyHeterorhabdus papilliger 40 72 8 0Scolecithricella minor 1003 175 8 0
Species exclusive of the eddyOrthoconchoecia haddoni 80 64 0 0Acartia clausi 175 0 0 0Euchaeta hebes 477 0 0 0Vettoria granulosa 119 8 0 0Sagitta friderici 0 32 0 0
*, Percentage relative to the total abundance of copepods and euphausiids, respectively.
composition of the phytoplankton population that was notperceivable by microscopic analysis of seawater samples.Cyanobacteria were shown to be considerably moreabundant outside the eddy, both at surface and at theSCM, as revealed by the di¡erential distribution of thecarotenoid zeaxanthin. A thorough description of phyto-plankton pigments inside and outside the eddy is availablein Rodriguez et al. (2003). Brie£y, a similar distributionpattern was observed at the SCM for chl-b and peridinin,markers of chlorophycean and speci¢c dino£agellateassemblages respectively, although in the latter case thedi¡erences only apply to its relative importance withrespect to the total biomass of photosynthetic organisms.Pigment markers characteristic of the class prymnesiophy-ceae, the carotenoid 190 hexanoyloxyfucoxanthin and non-polar chl-c2 presented higher concentrations at theeddy centre than outside the eddy. However, their relativecontribution, i.e. their pigment/chl-a ratios, were either
higher inside the eddy (non-polar chl-c2) or outside theeddy in the case of the above mentioned carotenoid.
Primary production, new production and net community production
On average, the photic-depth integrated rate of carbonincorporation by phytoplankton was slightly higher atstations located at the eddy centre (302mgCm72 d71)than outside the eddy (254mgCm72 d71) (Table 4). Amarked subsurface primary production maximum,located between 30 and 40 dbar, was observed at most ofthe stations. About 40% of the total amount of carbonincorporated by phytoplankton £owed through the410 mm size fraction, either inside or outside the eddy.New production was low in all stations, both inside andoutside the eddy, and ammonium was the main source ofinorganic nitrogen for primary production, as f-ratiovalues were always 50.5. The large within-site variabilitymeasured for all these variables implied that the di¡er-ences encountered in f-ratio between waters inside andoutside the eddy were not statistically signi¢cant evenwhen all the stations where new production experimentswere conducted were considered (P40.05, N¼11). Thesame applies to the rate of net community productionwhich, on average, was negative at the eddy centre andpositive outside. However, the analysis of individualStations 20 and 27 indicated that within the eddy thebalance between oxygen production and respiration couldbe either positive or negative.
Bacterial abundance
The abundance of bacterial cells at selected stations ofthe perpendicular CTD section typically ranged from1�105 to 5�105 cellsml71 (Figure 13). In general, bacterialabundance was higher at stations located inside (Stations20, 25, 27 and 29) than outside (Stations 23 and 31) theeddy. The depth distribution of bacterial numbers did notdisplay a consistent distribution pattern. Thus, bacterialabundance decreased with depth at most of the stationslocated inside the eddy, whereas in the surroundingwaters, they were either more abundant at depth (Station23) or showed a considerable degree of vertical variability(Station 31). On average, depth integrated bacterialbiomass was higher at stations located at the eddy centre(370mgCm72) than outside the eddy (203mgCm72).
Zooplankton biomass and composition
The distribution of 4200 mmmesozooplankton biomassalong the perpendicular CTD section largely resembledthat of depth-integrated chl-a (Figure 14). Maximum dryweight values of 41.5 gm72 were measured at the centralstations of the SWODDYand also at stations located at thenorthernmost end of the transect. The lowest dry weightvalues (51gm72) were found 20^30 km away from theeddy centre, coinciding with the region where theminimum chl-a concentrations were observed. Mesozoo-plankton organisms were not only more important interms of biomass at the eddy centre but they were alsolarger. At the eddy centre, animals larger than 1mmaccounted for more than 50% of the total mesozoo-plankton dry weight. Their numbers decreased down to
512 E. Ferna¤ ndez et al. Plankton in a SlopeWater anticyclonic Oceanic eDDY
Journal of the Marine Biological Association of the United Kingdom (2004)
Figure 12. Vertical distribution of the abundance (cell ml71)of diatoms and chrysophyceans along the east^west, north^south intensive section.

30^40% at the rest of the sampled stations, except atStations 25 and 23 where they exceeded 40%.
In spite of the higher zooplankton dry weight detectedat the eddy centre, their abundance was signi¢cantlyhigher outside the eddy, where more than 7�104 indm72
were found, than inside (*3.5�104 indm72) (Table 5).This mismatch can be explained from the di¡erences incommunity size structure mentioned above and is consis-tent with the higher proportion of juvenile copepods andeuphausiids registered at stations located outside the eddy.This pattern was not observed at Station 23. At all thestations, copepods represented more than 87% of thetotal number of mesozooplankton individuals.
Sharp changes in mesozooplankton community speciescomposition resulted from the presence of the SWODDY(Table 5). Typical coastal-neritic (Acartia clausi) or shelf/
shelf-breakcopepod species (Euchaeta hebes) appeared exclu-sively inside the eddy. By contrast, oceanic epipelagic andmesopelagic species such as Pleuromamma abdominalis,Heterorhabdusnorvegicus,CalocalanusstyliremisandDisconchoecia
elegans were absent from the interior of the mesoscale struc-ture. Appendicularians were found almost exclusivelyoutside the eddy. It is worth noting the di¡erential distri-bution of the chaetognaths Sagitta serratodentata and Sagitta
friderici. Thus, whereas S. serratodentata, a characteristicoceanic species inhabited only waters outside the eddy, theneritic species S. friderici appeared only inside the eddy.
DISCUSSION
The results presented in this paper demonstrate thatSlopeWater Oceanic eDDIES (SWODDIES), a recurrentmesoscale feature in the southern Bay of Biscay (Pingree &Le Cann, 1992a; Garc|¤ a Soto et al., 2002), signi¢cantlymodify the ecological characteristics of the planktoniccommunities of the region during the period of verticalthermal strati¢cation.
Infrared satellite images evidence that warm slopewater £ows along the western and northern Spanish coastduring winter. On some locations this slope water isinjected into the deep regions of the Bay of Biscay therebygenerating slope water anticyclonic eddies (Pingree & LeCann, 1992a). Unfortunately, for the investigationpresented here it was not possible to have a sequence ofcloud-free AVHRR images linking clearly AE6 to a slopewater origin. We note, however, that the winter of 1997/1998 preceeding the cruise was a year of exceptional pole-ward £ow along northern Spain and that at least twowinter swoddies (21/22 January AVHRR observations)were shed to the ocean from near Cape Ferret canyon(F98) and Cape Ortegal (O98) (Garcia-Soto et al., 2002).
Plankton in a SlopeWater anticyclonic Oceanic eDDY E. Ferna¤ ndez et al. 513
Journal of the Marine Biological Association of the United Kingdom (2004)
Figure 13. Vertical pro¢les of bacterial abundance (�106 cell ml71) at stations located at the eddy centre (20, 27), inside the eddy(25, 29) and outside the eddy (23, 31).
Figure 14. Spatial distribution of depth integrated (200m)mesozooplankton (4200 um) biomass (dry weight) along theeast^west, north^south intensive section.
The anticyclonic eddy AE6 was a typical slope wateranticyclonic oceanic eddy. The thermohaline properties ofAE6, closely resembled those of SWODDIES previouslystudied in the same region such as F90a (Pingree & LeCann, 1992a) and X91 (Pingree & Le Cann, 1992b). Allthese eddies showed a characteristic homogeneous core ofwater at the ring centre which extended from 65^70 to4200 dbar. The core of AE6 was slightly colder, lesssaline and denser than F90a. By contrast, as comparedwith X91, AE6 was warmer (11.5^128C in X91). Themaximum geostrophic velocity of AE6, observed 30 kmfrom the eddy centre was slightly lower than the30 cm s71 calculated for F90a. Di¡erences in the thermo-haline properties of the eddy cores are likely to re£ectinterannual thermal changes in the slope water, whichtypically vary within a range of �28C (see ¢gure 3 inPingree & Le Cann, 1992b). An alternative, but not exclu-sive, explanation for the observed di¡erences could be anorthern or deeper source of the slope water originatingAE6 as compared with F90a. The properties of the corehave been shown to vary little over shorter (20 days) timescales (Pingree & Le Cann, 1992a).
The results shown in this investigation demonstrate thatanticyclonic eddies do not always give rise to downwarddepression of isopycnals and associated motion ofnutrient-depleted water within the photic layer. Thevertical thermal structure of the SWODDY investigatedin this study (Figure 6) is similar to the anticyclonic eddyAC1 described in the Sargasso Sea (see ¢gure 2 inMcGillicudy et al., 1999). AC1 was composed of a thicklens of 188C water that depressed the main thermoclinewhile raising the seasonal thermocline, resulting in ashoaling and increase in magnitude of the deep chloro-phyll maximum. In this case, as in the SWODDY AE6,depression of the main thermocline has a larger contribu-tion to the geostrophic shear than uplifting of the seasonalpycnocline, originating the anticyclonic circulation char-acteristic of this feature. These eddies also have a similarorigin, as it has been hypothesized that AC1 was formedby convective mixing during the previous winter near aseamount chain (McGillicudy et al., 1999).
Depth-integrated chl-a concentrations were signi¢-cantly higher inside than outside the eddy (Figure 11).Pingree & Le Cann (1992a) already postulated that thedoming of the pycnocline characteristic of SWODDIES,which results from a ‘partial response towards hydrostaticequilibrium of the slope core within the surroundingocean’, might have implications for phytoplankton produc-tivity. Continuous chl-a sections conducted across theslope water eddy F90a using Seasoar, show comparableresults to those shown here (see ¢gures 15 and 16 ofGarc|¤ a-Soto et al., 2002). We are aware, however, thatthe submesoscale structure detected inside Swoddy AE6(Sa¤ nchez & Gil, in press) could potentially a¡ect thecomparison between waters inside and outside the eddy.The description of higher chl-a levels at the core of antic-yclonic eddies have been previously reported (e.g. Tranteret al., 1980; Je¡rey & Hallegrae¡, 1980; Krom et al.,1992), although in these cases the build up of phyto-plankton biomass was induced by deep winter convectivemixing of the eddy cores. Modelling studies of the upperlayers of the ocean revealed that mesoscale eddy activity,through the upward displacements of the pycnocline, has a
two way e¡ect on biological production: (a) an upward£ux of new nutrients into the photic layer; and (b)enhanced PAR irradiance levels, thereby enhancingprimary production rates (Smith et al., 1996).
Tilting of isopycnal surfaces favours vertical transport ofnutrient-rich water into the euphotic zone and, as a conse-quence, a close relationship has been reported betweendoming of the pycnocline and nitracline, maximumvalues of vertical velocity and enhanced chl-a levels inmesoscale structures (e.g. Pinot et al., 1995). A relaxationin the constraint of nutrient limitation could thus lead to astimulation of primary production and a correspondingincrease in phytoplankton biomass. With the aim of esti-mating the fraction of new production accounted for bynitrate entering the photic layer by eddy di¡usion at theeddy centre, we estimated the £ux of nitrate across thedeep chlorophyll maximum from the product of the esti-mated di¡usion coe⁄cients (Kz) and the gradients ofnitrate concentration across the deep chlorophyllmaximum (0.033^0.124mmolm71). The estimated £uxes,ranged from 0.039 to 0.075mmolm72d71 (Table 4). Dailynew production rates at the eddy centre, estimated fromthe measured nitrate uptake rates (Table 4), ranged from0.41 to 0.77mmolNm72 d71. Thus, the resulting di¡usive£uxes of nitrogen accounted for *5^18% of the nitrogenrequired to sustain the measured rate of new production.We are aware that the way daily new production rateswere calculated in this study (assuming a constant 24 h Nincorporation rate) is likely to overestimate the actualvalue of this rate. Nevertheless, an independent estimateof new production, based on the measured radiocarbonincorporation by phytoplankton, and assuming a C to Nmolar ratio equivalent to the Red¢eld value (6.6; Red¢eldet al., 1963) and a f-ratio typical of an oligotrophic oceanicregion between 0.1 and 0.2 (Dugdale & Goering, 1967;Sahlsten, 1987), yielded rates ranging from 0.3 to0.9mmolNm72 d71 which were close to our direct esti-mates using nitrate uptake. Moreover, even assuming thatnitrogen incorporation exclusively occurs during the lightperiod, the estimated di¡usive £uxes of nitrogen wouldrepresent less than 40% of the nitrogen required for newproduction. The results of these calculations suggest thatdi¡usion appears to be of limited importance for theupward supply of nitrate to the photic layer both outsideand inside the eddy and that other processes are likely toplay a relevant role in the sustainability of new productionin the southern Bay of Biscay in summer. Calculations ofvertical di¡usive £ux of nutrients in the mesoscale eddy¢eld of the Sargasso Sea (Siegel et al., 1999) also showedthat diapycnal di¡usion was not a signi¢cant processtransporting nutrients into the euphotic zone. Eddy di¡u-sive mixing along sloping isopycnals is another mechanismthat can transport nutrients into the upper productivelayer (e.g. Jenkins, 1988), but this mechanism alsoappears to be of reduced relevance compared with eddypumping (Siegel et al., 1999).
Although our results show that internal wave activitywas of similar magnitude inside and outside the eddy,their e¡ect on primary production is likely to be moreconspicuous at the eddy centre where phytoplanktonpopulations inhabiting the SCM are subjected to higherirradiance levels due to the in general shallower locationof the thermocline. On average, the SCM was located
514 E. Ferna¤ ndez et al. Plankton in a SlopeWater anticyclonic Oceanic eDDY
Journal of the Marine Biological Association of the United Kingdom (2004)

10m shallower at the eddy centre (50m) than outside theeddy. Assuming a vertical displacement of the averagedvertical location of the SCM of �7.5m due to internalwave oscillations (see Figure 10), and using an average Kdof 0.0705m71 (Table 2), the irradiance reaching the SCMwould range from 17 to 50 mmolm72 s71 at the eddy centreand from 9 to 25 mmolm72 s71 outside the eddy,representing 1.7^5% and 1.5^2.5% of surface irradiance,respectively. Hence, the irradiance at the SCM is approxi-mately a two-fold factor higher inside than outside theeddy centre. The transient relatively high irradiancelevels experienced by primary producers at the SCMinside the eddy is likely to explain the enhanced levels ofphytoplankton biomass detected at the centre ofSWODDY AE6 as compared with surrounding waters.Although this enhanced irradiance level does not necessa-rily translate into a proportional increase in phytoplanktoncarbon assimilation, it is possible that given the low irra-diance levels characteristic of the SCM, the magnitudeof primary production rates at the eddy centre weresigni¢cantly higher than those measured at surroundingwaters. Although this result agrees with the rates of depthintegrated primary production measured at selectedstations during the cruise (see Table 4), the di¡erences inthe temporal scales associatedwith radiocarbon incorpora-tion experiments (*6 h) and to internal waves (10^15min)imposes serious constraints on our phytoplankton produc-tion estimates in such a highly variable environment.
Enhanced plankton biomass can also result from theconcentration of particles by the £ow ¢eld. Theoreticalanalysis has shown that non-motile particles can betrapped in certain areas within the eddy core (Flierl,1977). If these mechanisms were of relevance inSWODDYAE6, an increase in the contribution of detritalmaterial at the eddy centre would be expected, as reportedby Nelson et al. (1985). However, we did not ¢nd anysigni¢cant di¡erences in the ratio between the absorptioncoe⁄cients of chlorophyll-containing particles and totalsuspended particulate matter at stations located at theeddy centre or outside the eddy (Table 2). Not everyspecies of primary producers responded in a similar wayto the new environmental conditions set up by the eddydynamics. The phytoplankton assemblages of the centralregion of the SWODDY were dominated by diatoms andchrysophyceans (Figure 12 and Table 3), therebyincreasing the contribution of large cells (410 mm) tototal phytoplankton chlorophyll (Figure 12). Similarly,Nelson et al. (1985) found a higher contribution of largerphytoplankton cells at the ring centre of a Gulf Streamwarm core ring, a feature that generally results from thedominance of diatom populations (Je¡rey & Hallegrae¡,1980; Nelson et al., 1985; Gould & Fryxell, 1988). Recently,Rodr|¤ guez et al. (2001) have shown the existence of adirect empirical relationship between the relative propor-tion of large cells and the magnitude of the velocity ofseawater in a frontal system in the range �5md71. Inthis regard, based upon the observed vertical displacementof isopycnal surfaces with time, Joyce et al. (1984) esti-mated mean upward vertical velocities of 0.5 to 1.5md71
at the centre of the warm core ring 82-B, values that liewithin the range mentioned above (�5md71). Thehigher biomass of larger primary producers observed inthis study at the eddy centre (Figure 11) directly propa-
gated through the food web favouring enhanced growthrates of large-sized mesozooplankton species (Figure 14).
SWODDIES are able to transport their core propertiesover long distances (4100 km) through the ocean(Pingree, 1984). Living particles are among the propertiesbeing transported by these eddies as the characteristicshort response time allows planktonic organisms to main-tain themselves within mesoscale features by theirincreased net population growth rates that work againstdi¡usive processes (Angel & Fasham, 1983). This studyclearly shows that phytoplankton and mesozooplanktonpopulations not only exhibited higher biomass and adi¡erent size structure inside anticyclonic eddy AE6, buttheir taxonomic composition was di¡erent as comparedwith the surrounding waters. The exclusive presence ofthe silico£agellates Dyctyocha ¢bula and D. speculum insidethe eddy, both species characteristic of the autumn^winter period in the adjacent Central Cantabrian Sea(Ferna¤ ndez & Bode, 1994), when the poleward slopecurrent develops, re£ects the biological characteristics ofthe water body which initially originated SWODDYAE6.In addition, the HPLC pigment signature of samples fromthe eddy centre and those collected from the core of thepoleward slope current on October 1999, was demonstra-tive of a high degree of similarity of phytoplankton speciescomposition between these two hydrodynamic features(see also Rodr|¤ guez et al., 2003).
Nevertheless, the most distinct distributional patternobserved in this investigation was found for diversespecies of mesozooplankton (Table 5). The presence oftypical coastal-neritic or shelf/shelf-break copepod andchaetognath species exclusively inside the eddy and theoccurrence of oceanic copepods and appendiculariansonly at stations outside the anticyclonic AE6, reinforcethe role of these mesoscale features in the retention of typi-cally coastal biological properties in open ocean waters.Our results, agree with previous ¢ndings in Kuroshiowarm core-eddies showing enhanced zooplankton abun-dance and presence of coastal-neritic copepods (e.g.Acartia clausi) and indicators of coastal waters such ascladocerans trapped by this structures in open oceanwaters (Yamamoto & Nishizawa, 1986).
The sharp modi¢cation of the planktonic communitycomposition, biomass and associated size-structurecaused by the insulation of water parcels from coastalorigin are likely to exert a profound e¡ect upon the uppertrophic levels of the pelagic ecosystem. In this regard,Sa¤ nchez & Gil (2000) reported an inverse relationshipbetween the intensity of the eastward shelf-break pole-ward £ow during October and hake recruitment indicesdue to o¡shore transport of larvae and pre-recruits, amechanism that would be related to the generation ofSWODDIES which could retain and export hake recruitsfar from the recruitment areas (Sa¤ nchez & Gil, 2000).Theinteraction of SlopeWater Antyciclonic Eddies with larval¢sh transport mechanisms could, therefore, result in£uctuations in recruitment.
On a larger oceanic scale, oceanic SWODDIES, as theone presented in this study but observed before the estab-lishment of the seasonal thermocline, have been shown tobe characterized by lower chlorophyll-a concentrationswith respect to surrounding cyclones, probably as a resultof the deeper mixed layer depth of these anticyclonic
Plankton in a SlopeWater anticyclonic Oceanic eDDY E. Ferna¤ ndez et al. 515
Journal of the Marine Biological Association of the United Kingdom (2004)

structures (see ¢gure 14A in Garc|¤ a-Soto et al., 2002).Future ecological investigations of Slope Water OceaniceDDIES might examine the trophic aspects of these rele-vant mesoscale eddy structures at the beginning of theproductive season and during the spawning and recruit-ment of commercial ¢sh.
We wish to thank the captain and crew of RV ‘ProfessorShtokman’ for their excellent support at sea. Thanks are alsogiven to two anonymous referees whose comments notablyimproved an earlier version of this manuscript. S. Barquero,E.Teira and B. Mourin‹ o were supported by research studentshipsof the Spanish Ministry of Science and Education, R. Sa¤ nchezwas supported by a research fellowship of the Instituto Espan‹ olde Oceanograf|¤ a and A. Garc|¤ a by a research fellowship of theFundacio¤ n Marcelino Bot|¤ n. C. Garc|¤ a-Soto acknowledges apostdoctoral contract RAMON Y CAJAL from the Ministry ofScience andTechnology (MCyT) of Spain. This investigation is acontribution of the research programme GIGOVI, funded by theSpanish Ministry of Education and Science (C.I.C.Y.T. MAR96-1872-CO3)
REFERENCESAngel, M.V. & Fasham, M.J., 1983. Eddies and biologicalprocesses. In Eddies in marine science (ed. A.R. Robinson),pp. 492^524. Berlin: Springer-Verlag.
Barnes, S.L., 1964. A technique for maximizing details in numer-ical weather map analyses. Journal of Applied Meteorology, 3,396^409.
Barnes, S.L., 1973. Mesoscale objetive map analysis usingweighted time series observations. NOAATechnical Memorandum
ERL NSLL-62, 60 pp. [NTIS COM-73-10781]Dickson, R.R. & Hughes, D.G., 1981. Satellite evidence of mesos-cale eddy activity over the Biscay abyssal plain. OceanologicaActa, 4, 43^46.
Dugdale, R.C. & Goering, J.J., 1967. Uptake of new and regen-erated forms of nitrogen in primary productivity. Limnology andOceanography, 12, 196^206.
Falkowski, P.G., Ziemann, D., Kolber, Z. & Bienfang, P.K., 1991.Role of eddy pumping in enhancing primary production in theocean. Nature, London, 352, 55^58.
Ferna¤ ndez, E. & Bode, A., 1994. Succession of phytoplanktonassemblages in relation to the hydrography in the southern Bayof Biscay: amultivariate approach. ScientiaMarina, 58,191^205.
Flierl, G.R., 1977. The application of linear quasigeostrophicdynamics to Gulf Stream Rings. Journal of Physical
Oceanography, 7, 365^379.Fraser, J.H., 1968. Standardization of zooplankton samplingmethods at sea. In Monographs on oceanographic methodology, (2):
zooplankton sampling, 1^174. Paris: UNESCO.Garc|¤ a-Soto, C., 2004. Prestige oil spill and Navidad £ow.Journal of the Marine Biological Association of the United Kingdom,84, 297^300.
Garc|¤ a-Soto, C., Pingree, R.D. & Valde¤ s, L., 2002. Navidaddevelopment in the Southern Bay of Biscay: climate changeand swoddy structure from Remote Sensing and in situ
measurements. Journal of Geophysical Research, 107 (C8), 10.029/2001JC001012.
Garc� on, V.C., Oschlies, A., Doney, S.C., McGillicuddy, D. &Waniek, J., 2001. The role of mesoscale variability onplankton dynamics in the North Atlantic. Deep-Sea Research,48, 2199^2226.
Glibert, P.M., Lipschultz, F., McCarthy, J.J. & Altabet, M.A.,1982. Isotope dilution models of uptake and remineralizationof ammonium by marine plankton. Limnology and Oceanography,27, 639^650.
Gould, R.W. & Fryxell, G.A., 1988. Phytoplankton speciescomposition and abundance in a Gulf Stream warm corering. II. Distributional patterns. Journal of Marine Research, 46,399^428.
Grassho¡, K., Erhardt, M. & Kremling, K., 1983. Methods of
seawater analysis, 2nd. edn.Weinheim: Verlag Chemie.Holligan, P.M., Aarup, T. & Groom, S.B., 1989. The north seasatellite colour atlas. Continental Shelf Research, 9, 667^765.
Je¡rey, S.W. & Hallegrae¡, G.M., 1980. Studies of phytoplanktonspecies in a warm core eddy of the East Australian Current. 1.Summer populations. Marine Ecology Progress Series, 3, 285^294.
Jenkins, W.J., 1988. Nitrate £ux into the euphotic zone nearBermuda. Nature, London, 331, 521^522.
Joyce,T.M. et al., 1984. Rapid evolution of a Gulf Stream warm-core ring. Nature, London, 308, 837^840.
Krom, M.D., Brenner, S., Kress, N., Neori, A. & Gordon, L.I.,1992. Nutrient dynamics and new production in a warm-coreeddy from the eastern Mediterranean Sea. Deep-Sea Research,39, 467^480.
Le Traon, P.Y. & Ogor, F., 1998. ERS-1/2 orbit error improve-ment using TOPEX-Poseidon: The 2 cm challenge. Journal ofGeophysical Research, 103, 8045^8057.
Madelain, F. & Kerut, E.G., 1978. Evidence of mesoscale eddiesin the Northeast-Atlantic from a drifting buoy experiment.Oceanologica Acta, 1, 159^168.
McGillicuddy, D.J., Johnson, R., Siegel, D.A., Michaels, A.F.,Bates, N.R. & Knap, A.H., 1999. Mesoscale variations ofbiogeochemical properties in the Sargasso Sea. Journal of
Geophysical Research, 104 (C6), 13381^13394.McGillicuddy, D.J. & Robinson, A.R., 1997. Eddy-inducednutrient supply and new production in the Sargasso Sea.Deep-Sea Research, 44, 1427^1450.
McGillicuddy, D.J. et al., 1998. In£uence of mesoscale eddies onnew production in the Sargasso Sea. Nature, London, 394, 263^266.
Mourin‹ o, B., Ferna¤ ndez, E., Esca¤ nez, J., De Armas, D., Giraud,S., Sinha, B. & Pingree, R., 2002. A Sub Tropical OceanicRing of Magnitude (STORM) in the Eastern North Atlantic:physical, chemical and biological properties. Deep-Sea Research,49, 4003^4021.
Nelson, D.M. et al., 1985. Distribution and composition ofbiogenic particulate matter in a Gulf Stream warm-core ring.Deep-Sea Research, 32, 1347^1369.
Norland, S., Heldal, M. & Tumyr, O., 1987. On the relationbetween dry matter and volume of bacteria. Microbial
Ecology, 13, 95^101.Oschlies, A. & Garcon, V., 1998. Eddy-induced enhancement ofprimary production in a model of the North Atlantic Ocean.Nature, London, 394, 266^269.
Oschlies, A., Koeve, W. & Garcon, V., 2000. An eddy-permit-ting coupled physical^biogeochemical model of the NorthAtlantic. 2. Ecosystem dynamics and comparison with satel-lite and JGOFS local studies. Global Biogeochemical Cycles, 14,499.
Pingree, R.D., 1984. Some applications of remote sensing tostudies in the Bay of Biscay, Celtic Sea and English Channel.In Remote sensing of shelf seas hydrodynamics, Proceedings of the 15th
International Lie' ge Colloquium on ocean hydrodynamics (ed. J.C.J.Nihoul), pp. 287^315. Amsterdam: Elsevier.
Pingree, R.D. & Le Cann, B., 1990. Structure, strength andseasonality of the slope currents in the Bay of Biscay region.Journal of the Marine Biological Association of the United Kingdom,70, 857^885.
Pingree, R.D. & Le Cann, B., 1992a. Three anticyclonic slopewater oceanic eddies (SWODDIES) in the southern Bay ofBiscay. Deep-Sea Research, 39, 1147^1175.
Pingree, R.D. & Le Cann, B., 1992b. Anticyclonic eddy X91 inthe southern Bay of Biscay, May 1991 to February 1992. Journalof Geophysical Research, 97(C9), 14353^14367.
516 E. Ferna¤ ndez et al. Plankton in a SlopeWater anticyclonic Oceanic eDDY
Journal of the Marine Biological Association of the United Kingdom (2004)

Pinot, J.M.,Tintore¤ , J., Lo¤ pez-Jurado, J.L., Ferna¤ ndez de Puelles,M.L. & Jansa, J., 1995. Three-dimensional circulation of amesoscale eddy/front system and its biological implications.Oceanologica Acta, 18, 389^400.
Porter K.G. & Feig, Y.S., 1980. The use of DAPI for identifyingand counting aquatic micro£ora, Limnology and Oceanography, 25,943^948.
Red¢eld, A.C., Ketchum, B.H. & Richards, F.A., 1963. Thein£uence of organisms on the composition of sea-water. InThe
sea, vol. 2 (ed. M.N. Hill), pp. 26^79. New York: WileyInterscience.
Rodr|¤ guez, F., Varela, M., Ferna¤ ndez, E. & Zapata, M., 2003.Phytoplankton and pigment distributions in an anticyclonicslope water oceanic eddy (SWODDY) in the southern Bay ofBiscay. Marine Biology, 143, 995^1011.
Rodr|¤ guez, J. et al., 2001. Mesoscale vertical motion and the sizestructure of phytoplankton in the ocean. Nature, London, 410,360^363.
Sahlsten, E., 1987. Nitrogenous nutrition in the euphotic zone ofthe Central North Paci¢c Gyre. Marine Biology, 96, 433^439.
Sa¤ nchez, F. & Gil, J., 2000. Hydrographic mesoscale structuresand Poleward Current as a determinant of hake (Merluccius
merluccius) recruitment in southern Bay of Biscay. ICES Journalof Marine Science, 57, 152^170
Sa¤ nchez, R. & Gil, J. in press. Structure, mesoscale interactionsand potential vorticity conservation in a 3D Swoddy in the Bayof Biscay. Journal of Marine Systems.
Serret, P., Ferna¤ ndez, E., Sostres, J.A. & Anado¤ n, R., 1999.Seasonal compensation of microbial production and respir-ation in a temperate sea. Marine Ecology Progress Series, 187,43^57.
Siegel, D.A., McGillicuddy, D.J. & Fields, E.A., 1999. Mesoscaleeddies, satellite altimetry, and new production in the SargassoSea. Journal of Geophysical Research, 104 (C6), 13359^13379.
Smith, C.L., Richards, K.J. & Fasham, M.J., 1996.The impact ofmesoscale eddies on plankton dynamics in the upper ocean.Deep-Sea Research, 43, 1807^1832.
Teira, E., Serret, P. & Ferna¤ ndez, E., 2001. Phytoplankton size-structure, particulate and dissolved organic carbon productionand oxygen £uxes through microbial communities in the NWIberian coastal transition zone. Marine Ecology Progress Series,219, 65^83.
The Ring Group, 1981. Gulf Stream cold-core rings: theirphysics, chemistry and biology. Science, New York, 212, 1091^1100.
Tranter, D.J., Parker, R.R. & Cresswell, G.R., 1980. Are warm-core eddies unproductive? Nature, London, 284, 540^542.
UNESCO, 1994. Protocols for theJoint Global Ocean Flux Study(JGOFS) core measurements. Manuals and Guides, 29, 1^170.
Varela, R.A., Figueiras, F., Agust|¤ , S. & Arbones, B., 1998Determining the contribution of pigments and the non-algalfraction to total absorption: towards a global algorithm.Limnology and Oceanography, 43, 449^457.
Wyrtki, K., Magaard, L. & Hager, J., 1976. Eddy energy in theoceans. Journal of Geophysical Research, 81, 2641^2646.
Yamamoto, T. & Nishizawa, S., 1986. Small-scale zooplanktonaggregations at the front of a Kuroshio warm-core ring. Deep-Sea Research, 33, 1729^1740.
Zapata, M., Rodr|¤ guez, F. & Garrido, J.L., 2000. Separation ofchlorophylls and carotenoids from marine phytoplankton: anew HPLC method using reversed phase C8 column and pyri-dine-containing mobile phases. Marine Ecology Progress Series,195, 29^45.
Submitted 5 September 2003. Accepted 15 April 2004.
Plankton in a SlopeWater anticyclonic Oceanic eDDY E. Ferna¤ ndez et al. 517
Journal of the Marine Biological Association of the United Kingdom (2004)
Copyright © 2022 FDOKUMEN