From particles to individuals: modelling the early stages of anchovy (Engraulis...
11
From particles to individuals: modelling the early stages of anchovy (Engraulis capensis/encrasicolus) in the southern Benguela C. MULLON, 1,2, * P. FRE ´ ON, 1,3 C. PARADA, 2 C. VAN DER LINGEN 3 AND J. HUGGETT 3 1 Institut de Recherche pour le De´veloppement (IRD), 213, rue La Fayette, 75480, Paris, France 2 Department of Oceanography, University of Cape Town (UCT), 7701, Rondebosch, South Africa 3 Marine and Coastal Management (MCM), Private Bag X2, Rogge Bay, Cape Town, 8012, South Africa ABSTRACT Several individual-based models (IBMs) have recently been developed to improve understanding of factors impacting on recruitment variability of anchovy (Engraulis capensis/encrasicolus) in the southern Benguela. These IBMs have focused on early life his- tory stages (eggs through to post-larvae) as it is thought that variations in anchovy recruitment strength are primarily driven by biological and/or physical factors impacting on these stages. The pelagic zone of the Benguela system constitutes an ideal sys- tem for studying the coupling between biological and physical processes; in the IBMs this coupling is obtained by releasing particles endowed with biologi- cal properties in the virtual currents resulting from the output of a hydrodynamic model of the southwestern coast of South Africa. The particles are tracked through virtual time and space and their final loca- tions are assessed in terms of previously defined criteria deemed to promote successful recruitment. The aim of this paper is to provide a synthesis of the results of IBMs of the early stages of anchovy in the southern Benguela constructed to date. Emphasis is placed on the methodological aspects of these studies and on the sequential link of several simulation experiments of increasing complexity. In addition to improving understanding, such an approach allows for effective interplay between modelling experiments and surveys or laboratory experiments. Details of individual IBM experiments and their results have been published elsewhere. Key words: anchovy, individual based modelling, particle tracking, simulation, southern Benguela INTRODUCTION The southern Benguela upwelling ecosystem situated off the west coast of southern Africa is a highly dynamic system. Its main oceanographic features include the warm Agulhas current from the Indian Ocean in the south, a coastal upwelling regime that extends north- wards from Cape Point into the St Helena Bay region, and between them, a seasonal coastal jet current (Fig. 1; Hutchings et al., 2002). The life history of anchovy (Engraulis capensis/encrasicolus), a commercially important pelagic species in this area, is characterized by a spatial discontinuity between the spawning grounds on the Agulhas Bank and the nursery grounds off the West Coast (Bakun and Broad, 2002). Each year during spring, anchovy migrate from the nursery grounds to the spawning grounds where they spawn during summer. Spawn products are advected from the Agulhas Bank to the nursery grounds via the jet current (Fig. 1; Shelton and Hutchings, 1982; Crawford et al., 1987; Armstrong et al., 1988; Boyd et al., 1992; Hutchings et al., 1998); during this transport process hatching occurs and the larvae reach the nursery area. Variability in the transport of eggs from spawning to nursery grounds is considered to be among the primary determinants of anchovy recruitment success (Hutch- ings, 1992; Hutchings et al., 1998). Anchovy in the southern Benguela system have been intensively studied for decades; these studies have examined factors impacting on their recruitment variability (e.g. Hutchings, 1992; Hutchings et al., 1998, 2002), have provided accurate estimates of the biomass of spawners and recruits (Fig. 2) and have allowed spatial characterizations of the population (Barange et al., 1999; van der Lingen et al., 2001). The system is highly productive and variable, with *Correspondence. e-mail: [email protected] Received 25 October 2002 Revised version accpeted 13 June 2003 FISHERIES OCEANOGRAPHY Fish. Oceanogr. 12:4/5, 396–406, 2003 396 ȑ 2003 Blackwell Publishing Ltd.
Transcript of From particles to individuals: modelling the early stages of anchovy (Engraulis...

From particles to individuals: modelling the early stages ofanchovy (Engraulis capensis/encrasicolus) in the southernBenguela
C. MULLON,1,2,* P. FREON,1,3 C. PARADA,2
C. VAN DER LINGEN3 AND J. HUGGETT3
1Institut de Recherche pour le Developpement (IRD), 213, rueLa Fayette, 75480, Paris, France2Department of Oceanography, University of Cape Town(UCT), 7701, Rondebosch, South Africa3Marine and Coastal Management (MCM), Private Bag X2,
Rogge Bay, Cape Town, 8012, South Africa
ABSTRACT
Several individual-based models (IBMs) have recentlybeen developed to improve understanding of factorsimpacting on recruitment variability of anchovy(Engraulis capensis/encrasicolus) in the southernBenguela. These IBMs have focused on early life his-tory stages (eggs through to post-larvae) as it isthought that variations in anchovy recruitmentstrength are primarily driven by biological and/orphysical factors impacting on these stages. The pelagiczone of the Benguela system constitutes an ideal sys-tem for studying the coupling between biological andphysical processes; in the IBMs this coupling isobtained by releasing particles endowed with biologi-cal properties in the virtual currents resulting from theoutput of a hydrodynamic model of the southwesterncoast of South Africa. The particles are trackedthrough virtual time and space and their final loca-tions are assessed in terms of previously defined criteriadeemed to promote successful recruitment. The aim ofthis paper is to provide a synthesis of the results ofIBMs of the early stages of anchovy in the southernBenguela constructed to date. Emphasis is placed onthe methodological aspects of these studies and on thesequential link of several simulation experiments ofincreasing complexity. In addition to improvingunderstanding, such an approach allows for effectiveinterplay between modelling experiments and surveys
or laboratory experiments. Details of individual IBMexperiments and their results have been publishedelsewhere.
Key words: anchovy, individual based modelling,particle tracking, simulation, southern Benguela
INTRODUCTION
The southern Benguela upwelling ecosystem situatedoff the west coast of southern Africa is a highly dynamicsystem. Its main oceanographic features include thewarm Agulhas current from the Indian Ocean in thesouth, a coastal upwelling regime that extends north-wards from Cape Point into the St Helena Bay region,and between them, a seasonal coastal jet current (Fig. 1;Hutchings et al., 2002). The life history of anchovy(Engraulis capensis/encrasicolus), a commerciallyimportant pelagic species in this area, is characterizedby a spatial discontinuity between the spawninggrounds on the Agulhas Bank and the nursery groundsoff the West Coast (Bakun and Broad, 2002). Each yearduring spring, anchovy migrate from the nurserygrounds to the spawning grounds where they spawnduring summer. Spawn products are advected from theAgulhas Bank to the nursery grounds via the jet current(Fig. 1; Shelton and Hutchings, 1982; Crawford et al.,1987; Armstrong et al., 1988; Boyd et al., 1992;Hutchings et al., 1998); during this transport processhatching occurs and the larvae reach the nursery area.Variability in the transport of eggs from spawning tonursery grounds is considered to be among the primarydeterminants of anchovy recruitment success (Hutch-ings, 1992; Hutchings et al., 1998).
Anchovy in the southern Benguela system havebeen intensively studied for decades; these studieshave examined factors impacting on their recruitmentvariability (e.g. Hutchings, 1992; Hutchings et al.,1998, 2002), have provided accurate estimates of thebiomass of spawners and recruits (Fig. 2) and haveallowed spatial characterizations of the population(Barange et al., 1999; van der Lingen et al., 2001).The system is highly productive and variable, with
*Correspondence. e-mail: [email protected]
Received 25 October 2002
Revised version accpeted 13 June 2003
FISHERIES OCEANOGRAPHY Fish. Oceanogr. 12:4/5, 396–406, 2003
396 � 2003 Blackwell Publishing Ltd.

estimates of anchovy recruitment strength varyingfrom 30 billion to over 500 billion individuals (Fig. 2;MCM, unpublished data). Apart from exceptionallyhigh recruitment during the last few years, there are noclear trends in these variations which appear quiteerratic. Anchovy exhibit a spatially structuredspawning pattern, with intense spawning taking placeover various regions of the Agulhas Bank during thepeak spawning season (van der Lingen et al., 2001).
In order to ensure successful transport of spawnproducts from the spawning to the nursery grounds,
there must be some synchronization between thephysical process (the jet current) and the biologicalprocess (spawning). The individual-based models(IBMs) developed thus far have examined this coup-ling (Mullon et al., 2002a; Huggett et al., 2003; Paradaet al., 2003). In this paper we emphasize the meth-odological questions such studies have raised whenusing simulation tools.
METHODS
Hydrodynamic modelling
The hydrodynamics of the southern Benguela systemhave been modelled by Penven (2000) and Penvenet al. (2001) through implementation of the RegionalOcean Modelling System (ROMS; Haidvogel et al.,2000), developed at Rutgers University and the Uni-versity of California. The model solves the free surface,hydrostatic primitive equations of the fluid dynamicsover variable topography using stretched, terrain-fol-lowing coordinates in the vertical, and orthogonal,curvilinear coordinates in the horizontal (Song andHaidvogel, 1994). This allows enhanced resolution inthe region of interest at the coast, and is very accuratein dealing with the hydrodynamics of a coastal system(Penven et al., 2001).
The hydrodynamic model has been run for a 10-yearperiod with the same seasonal forcing and the sameboundary conditions (issued from monthly climatolo-gies) repeated for every year. It accurately reproducesthe main features of the physics of the system. Duringsimulation the model generates field-observed featuresincluding the warm Agulhas Current and its retroflec-tions, the cold upwelling in the St Helena Bay area, thecoastal jet current, and other structures such as eddiesand filaments (Penven et al., 2001). Even without fur-ther improvement, which is currently in progress, thismodel is considered to constitute a realistic virtualenvironment. Although the same forcing has beenapplied for all simulated years, the resulting outputdiffers noticeably, because of different initial condi-tions. We have selected five successive years of theoutput which present sufficient interannual variability(contrasting patterns of meso-scale activity) to be usedas input for individual based modelling experiments.Output from the hydrodynamic model includes valuesof current, temperature and salinity fields, and isobtained every 2 days for every point on the 3-D grid.
Particles
Coupling the outputs of the hydrodynamic model withan IBM allows the trajectories of passive particles to be
Offshore dispersalConcentrationand retention
Coastal jet Spawning areaAgulhas Bank
South Africa
Cape Town
Figure 1. Schematic diagram of the life history of anchovyin the southern Benguela including spawning area, jet cur-rent and nursery ground.
Figure 2. Numbers of anchovy and sardine recruits (bil-lions) estimated from annual (May) acoustic pelagicrecruitment surveys over the period 1985–2001.
From particles to individuals 397
� 2003 Blackwell Publishing Ltd, Fish. Oceanogr., 12:4/5, 396–406.

tracked, a common approach in recent studies of earlystages of fish (Werner et al., 1996; Heath and Gallego,1997; Hinckley et al., 1996; Hermann et al., 2001). OurIBMs were used to track the movement of particlesrepresenting anchovy eggs spawned over the AgulhasBank and transported northwards to the West Coastnursery grounds. Throughout all simulations the IBMsrecorded the number and age of particles meeting thecriteria for successful transport (see Results section fora definition of successful transport). This value wasused as the dependent variable in subsequent statisticalanalyses.
From particles to individuals
The process of recruitment is complex and depends on avariety of biological and physical mechanisms. Hence itis unrealistic to consider eggs and larvae simply as passiveparticles. They have density and buoyancy, which affectstheir transport from the spawning grounds to the nurseryarea. They are developing and growing during transport,and both of these processes are temperature-dependent,e.g. too cold temperatures may cause egg and larvalmortalities. At a certain age, larvae need food. Later,they become active and swim in the currents. All theseprocesses have to be integrated in a study on recruitment,which raises difficult methodological questions.
Approach
Learning from complex simulations such as IBMs isnot straightforward. In a key paper, Grimm (1999)made several recommendations, both theoretical andpractical, which we have tried to follow in our studies.Rephrasing Grimm (1999) we have implemented thefollowing principles:
Principle 1: Keep it as simple as possible, avoidover-parameterization, and proceed step by step. Inaddressing this principle we found it helpful to usevisualization facilities of recent computers in order topresent a synthetic view of the whole modelling pro-cedure to the scientists involved in an experiment. Forall our IBM experiments this involved a representationon a single computer screen of the processes, hypo-theses, control parameters, animations and real timesimulation results (Fig. 3).
Principle 2: Use an experimental approach andapply sensitivity analyses. Building an experimentconsists of: (1) The formulation of a hypothesis interms of processes; (2) Defining how to test thehypothesis; (3) Testing the hypothesis; and (4)Accepting the result, even if it is not the expected one(which may be difficult). This approach can help toavoid the risk of never-ending fine-tuning of a model.We know from experience that this is a real risk.
Principle 3: Use a pattern oriented approach(POA). According to Grimm et al. (1996) andRailsback (2001), POA consists of: (1) Defining a setof ‘test-patterns’, i.e. observed patterns at the system(or individual)-level in response to known stimulithat the IBM is designed to explain and reproduce;(2) Building a model that includes the mechanismsand agents’ traits (e.g. larval mortality according totemperature) believed to drive the test-patterns;(3) Posing alternative rules for agent behaviour ashypotheses that will be tested; (4) Simulating theconditions under which each test-pattern has beenobserved to occur: reject rules that do not cause thetest-patterns to emerge from the model, and acceptrules that do (Grimm, 1994, 1999; Grimm et al.,1996, 1999; Railsback, 2001). Such an approachcould provide the basis of what John Woods calls anEcological Turing Test (Woods, 2002). This is theonly known approach that addresses, in a practicalway, the question of how to justify the results ofmodelling a complex system.
Principle 4: Take into account the specificities ofmodelling in an interdisciplinary context. At thebeginning of our IBM projects it was clearly stated thatthe aim was to address questions and provide answers,not to reproduce the real world. In other words, thatthis was heuristic modelling, not predictive modelling.More precisely, our modelling study was aimed atsharing concepts amongst a variety of disciplines andrepresenting the right level of the observed complexitynecessary to express interactions between physical andbiological processes. It is very important to state thisprinciple, and to continuously keep it in mind. A lot ofmisunderstandings result from deeply different con-cepts of the aim of the modelling.
Here we illustrate the overall process of thesequential approach that has been set up using theseprinciples, based on several model experiments thatare detailed elsewhere (Mullon et al., 2002a; Huggettet al., 2003; Parada et al., 2003).
Application to the study of early stages of anchovyin the southern Benguela system
Keeping in mind that the aim of the modelling ap-proach was to answer scientific questions, particularly– ‘Why are the spawning and nursery areas of anchovyin the southern Benguela spatially distinct?’ – thesefour principles have been implemented in our IBMs.First, an interdisciplinary group comprising ecologists,physical oceanographers and biologists was set up todiscuss hypotheses, plan experiments and assess resultsobtained. Secondly, test-patterns were chosen fromfield-derived observations, the most important ones
� 2003 Blackwell Publishing Ltd, Fish. Oceanogr., 12:4/5, 396–406.
398 C. Mullon et al.

being: inter-annual variability in recruitment strength(Fig. 2); the distribution and abundance of anchovyeggs during November spawner biomass surveys(Fig. 4); the temporal distribution of eggs and larvaealong a monitoring line located in the transport area(Fig. 5), and the vertical distribution of eggs and lar-vae (according to the results of a field survey in pro-gress). Finally, we used the following process for theexperimental simulations:1. Express assumptions concerning the biological or
physical processes and their coupling. Identify anddefine factors that explicitly affect recruitment,such as transport, buoyancy, growth, sensitivity totemperature during transport, vertical migration,food availability, etc.
2. Define a global quantifiable characteristic (C) of thedynamics of the system; this was mostly the prob-ability of transport success (used as a proxy forrecruitment success) but the probability of egg orlarval mortality was also used.
3. Define a list of factors that are believed to affect C.4. Simulate the behaviour of the system for all the
possible combinations of factors.5. Using an appropriate statistical tool (ANOVA or
GLM), select the factors which appear to signifi-cantly drive the variability of C.
6. For each of the selected factors, observe their par-ticular effect on C; if the simulated patterns fit theobserved ones, conclude that preliminary assump-tions cannot be rejected.
Figure 3. Screen of the simulator during a single trial showing on the left controllers of the variable coefficients of the model,on the right views of the domain of the model and the process at the individual level, on the bottom of the screen the output ofthe model in real time. In the lower figures, the horizontal axis indicates time, while the vertical axis indicates the number ofparticles.
� 2003 Blackwell Publishing Ltd, Fish. Oceanogr., 12:4/5, 396–406.
From particles to individuals 399

7. Pursue a biological/physical interpretation of thislast conclusion.Experimental simulations are not in themselves
able to validate the model, but in some cases it wasclear that, under a given set of assumptions, a par-ticular factor either did have an effect or did not.This allowed the identification of important factors,the impacts of which could be confirmed by surveydata or laboratory experiments. It was also veryinstructive to base the assumptions of an experiment
on the conclusions of a previous one, which allowedan assessment of the relative importance of the var-ious factors influencing anchovy recruitmentvariability.
RESULTS
Experiment 1: Transport
In the first experiment transport was considered to bethe main factor affecting recruitment. Transport suc-cess was defined as particles that reached the offshoreor inshore part of the West Coast nursery area between14 and 60 days after release (see Huggett et al. (2003)).Hypotheses tested were: (1) spatio-temporal spawningpatterns affect transport success, and (2) the modelledcurrent regime facilitates passive transport of spawningproducts directly into the core (inshore) nursery area,rather than into the adjacent offshore region. Possiblefactors influencing transport success were: (1) locationof spawning – following current convention, fivepossible spawning areas were used, as shown inFigure 4, namely the western Agulhas Bank (WAB),the inshore and offshore central Agulhas Bank (CA-Bin and CABoff), and the inshore and offshore easternAgulhas Bank (EABin and EABoff); (2) month ofspawning – all 12 months were considered; (3) theyear of simulation from the output of the hydrody-namic model; (4) spawning patchiness (random, con-centrated, or highly concentrated); (5) spawningfrequency (every 2 days, every 10 days, or once amonth); (6) a random factor. Each trial involvedreleasing 10 000 particles randomly in the fivespawning areas, then tracking these particles as theywere advected by currents for a period of 60 days, andfinally noting the success of their transport. The wholeexperiment consisted of 1620 trials, which representsabout 26 h of computing time.
Figure 3 represents the screen of the simulatorduring a single trial. This demonstrates the applica-tion of the simplicity principle mentioned previously.On the left of the screen are all possible values forthe variable coefficients of the model. The right ofthe screen provides a view of the process at anindividual level, an animation of the particles thatallows them to be tracked while being transported.The bottom of the screen represents global features ofthe dynamics. The first five plots on the bottomrepresent, for each area of origin, the number ofparticles in all possible areas of the system. The lastplot represents the origin of the successful particles.This kind of visualization proved to be an effectiveway to check the model.
Aug. Sep. Oct. Nov. Dec. Jan. Feb. Mar. Apr. May Jun. Jul.
Abu
ndan
ce (
%)
0
10
20
30
40
50
60
Historical eggs (64–69)CELP eggs (77–78)SARP Line eggs (95–01)
Figure 5. Mean monthly abundance of anchovy eggs sam-pled during historical ichthyoplankton surveys conducted offthe southwest coast (1964–69), during the Cape Egg andLarval Programme (CELP) surveys (1977–78) – a grid of 120stations extending 50 miles offshore from 31�20¢S on thewest coast to 21�30¢E on the south coast and along theSardine and Anchovy Recruitment Programme (SARP)Monitoring Line (1995–2001) off the Cape Peninsula(Fig. 1).
Figure 4. Composite distribution map of anchovy eggs(no. m)2) collected with a California Vertical Egg Tow(CalVET) net during annual (November) pelagic spawnerbiomass surveys over the period 1983–99, the five spawningareas on the Agulhas Bank and the two nursery regions onthe West Coast as used in the model.
� 2003 Blackwell Publishing Ltd, Fish. Oceanogr., 12:4/5, 396–406.
400 C. Mullon et al.
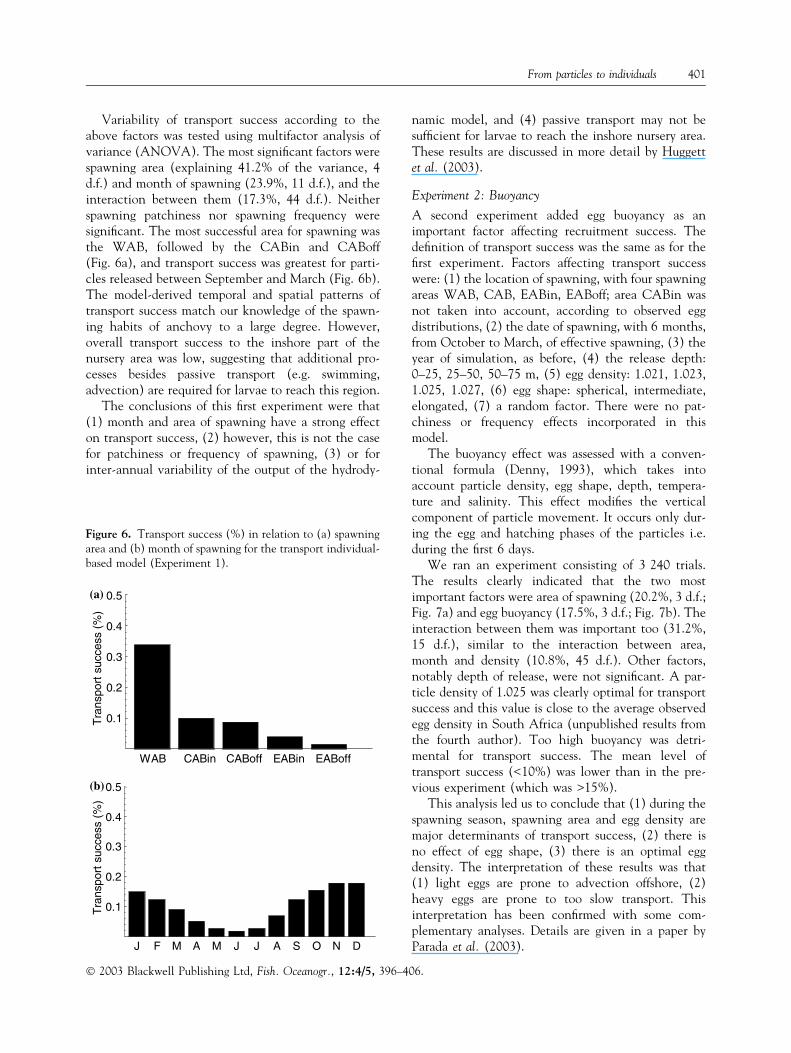
Variability of transport success according to theabove factors was tested using multifactor analysis ofvariance (ANOVA). The most significant factors werespawning area (explaining 41.2% of the variance, 4d.f.) and month of spawning (23.9%, 11 d.f.), and theinteraction between them (17.3%, 44 d.f.). Neitherspawning patchiness nor spawning frequency weresignificant. The most successful area for spawning wasthe WAB, followed by the CABin and CABoff(Fig. 6a), and transport success was greatest for parti-cles released between September and March (Fig. 6b).The model-derived temporal and spatial patterns oftransport success match our knowledge of the spawn-ing habits of anchovy to a large degree. However,overall transport success to the inshore part of thenursery area was low, suggesting that additional pro-cesses besides passive transport (e.g. swimming,advection) are required for larvae to reach this region.
The conclusions of this first experiment were that(1) month and area of spawning have a strong effecton transport success, (2) however, this is not the casefor patchiness or frequency of spawning, (3) or forinter-annual variability of the output of the hydrody-
namic model, and (4) passive transport may not besufficient for larvae to reach the inshore nursery area.These results are discussed in more detail by Huggettet al. (2003).
Experiment 2: Buoyancy
A second experiment added egg buoyancy as animportant factor affecting recruitment success. Thedefinition of transport success was the same as for thefirst experiment. Factors affecting transport successwere: (1) the location of spawning, with four spawningareas WAB, CAB, EABin, EABoff; area CABin wasnot taken into account, according to observed eggdistributions, (2) the date of spawning, with 6 months,from October to March, of effective spawning, (3) theyear of simulation, as before, (4) the release depth:0–25, 25–50, 50–75 m, (5) egg density: 1.021, 1.023,1.025, 1.027, (6) egg shape: spherical, intermediate,elongated, (7) a random factor. There were no pat-chiness or frequency effects incorporated in thismodel.
The buoyancy effect was assessed with a conven-tional formula (Denny, 1993), which takes intoaccount particle density, egg shape, depth, tempera-ture and salinity. This effect modifies the verticalcomponent of particle movement. It occurs only dur-ing the egg and hatching phases of the particles i.e.during the first 6 days.
We ran an experiment consisting of 3 240 trials.The results clearly indicated that the two mostimportant factors were area of spawning (20.2%, 3 d.f.;Fig. 7a) and egg buoyancy (17.5%, 3 d.f.; Fig. 7b). Theinteraction between them was important too (31.2%,15 d.f.), similar to the interaction between area,month and density (10.8%, 45 d.f.). Other factors,notably depth of release, were not significant. A par-ticle density of 1.025 was clearly optimal for transportsuccess and this value is close to the average observedegg density in South Africa (unpublished results fromthe fourth author). Too high buoyancy was detri-mental for transport success. The mean level oftransport success (<10%) was lower than in the pre-vious experiment (which was >15%).
This analysis led us to conclude that (1) during thespawning season, spawning area and egg density aremajor determinants of transport success, (2) there isno effect of egg shape, (3) there is an optimal eggdensity. The interpretation of these results was that(1) light eggs are prone to advection offshore, (2)heavy eggs are prone to too slow transport. Thisinterpretation has been confirmed with some com-plementary analyses. Details are given in a paper byParada et al. (2003).
WAB CABin CABoff EABin EABoff
0.1
0.2
0.3
0.4
0.5
Tra
nspo
rt s
ucce
ss (
%)
Tra
nspo
rt s
ucce
ss (
%)
(b)
(a)
J F M A M J J A S O N D
0.1
0.2
0.3
0.4
0.5
Figure 6. Transport success (%) in relation to (a) spawningarea and (b) month of spawning for the transport individual-based model (Experiment 1).
� 2003 Blackwell Publishing Ltd, Fish. Oceanogr., 12:4/5, 396–406.
From particles to individuals 401

Experiment 3: Growth and mortality
A third experiment added growth and differentialmortality as potential factors affecting recruitment.Growth was evaluated according to a modifiedGompertz equation, which incorporates a temperatureeffect. Hatching occurred when particle size was>3 mm. Particles representing egg or larval stageswere sensitive to different temperatures. Definition oftransport success was still the same. Factors affectingsuccess were: (1) Spawning area, as before, (2) themonth of spawning, as before, (3) the year of simu-lation, as before, (4) the release depth, as before, (5)the growth rate, the k parameter of the modifiedGompertz equation which allows one to distinguishbetween slow (0.2) and fast (2) growth; a value of 1represents the growth rate as observed in field studies,(6) the lethal temperature for eggs (13, 14 or 15�C),(7) the lethal temperature for larvae (11, 12 or13�C), (8) a random factor, as before. Patchiness andfrequency of spawning were not incorporated. Particledensity was optimal (1.025), and particles represent-ing eggs were elongated. An experiment consisting of12 150 trials was run.
The original Gompertz equation (Zweifel andLasker, 1976) is defined as:
Lt ¼ L0 exp½kð1 � eaTtÞ� ð1Þ
where t is age and T is temperature. We replaced theoriginal definition aT ¼ a0em(1 ) e)bT
) of Zweifel andLasker (1976) by a more simple linear relation:
aT ¼ kðnT � cÞ ð2Þ
Parameters L0, k, n and c were set to fit observeddata. In order to quantify the effect of temperature ongrowth speed, we used the following values of thegrowth factor k: 0.2, 0.5, 1, 1.5 and 2.0. We thencalculated growth according to the followingapproximation, at any time step:
Lðt þ dtÞ ¼ LðtÞ þ dt L0ðtÞ þ 1=2 dt2 L00ðtÞ ð3Þ
The most important factors affecting transportsuccess were spawning area (22.6%, 3 d.f.; Fig. 8a),month of spawning (9.5%, 5 d.f.; Fig. 8b), depth ofrelease (2.8%, 2 d.f.), the year of simulation (8.0%, 4d.f.; Fig. 8c) and the critical temperature for larvae(2.2%, 2 d.f.; Fig. 8d). Depth and year were significant,although they were not important in the previousexperiment. The fact that variability of transportsuccess was partly explained by the inter-annualvariability emphasizes the dependence of the growthprocess on temperature, and indicates that sensitivityto temperature is coupled with the physics. Consid-ering the effect of area: the WAB was still the mostsuccessful (Fig. 8a), but to a lesser extent that in theprevious experiment (Fig. 7a). This suggests thattaking growth into account results in a less detrimentaloutcome for particles released from the remote easternspawning area.
Taking into account all the factors that affect thevariability of transport success, as well as egg mor-tality and larval mortality, one concludes that withinthe spawning season, spawning area, year of simula-tion, spawning depth and lethal temperature for lar-vae are the main determinants of transport successfrom the spawning area to the nursery grounds. Thishas been interpreted as follows: (1) eggs from theWAB are transported very rapidly to the nursery areawhere low temperatures are lethal for them; (2) eggsspawned too deep are transported very slowly and donot reach the nursery area at the appropriate time.There is thus a trade-off between speed of transportand growth rate. The effects of this trade-off are verysensitive to the physical conditions in which theindividuals evolve.
WAB CABoff EABin EABoff
0.1
0.2
0.3
0.4
0.5
Tra
nspo
rt s
ucce
ss (
%)
Tra
nspo
rt s
ucce
ss (
%)
1.021 1.023 1.025 1.027
0.1
0.2
0.3
0.4
0.5
Density
(a)
(b)
Figure 7. Transport success (%) in relation to (a) spawningarea and (b) density of the eggs for the buoyancy individual-based model (Experiment 2).
� 2003 Blackwell Publishing Ltd, Fish. Oceanogr., 12:4/5, 396–406.
402 C. Mullon et al.

Experiment 4: Active swimming
In the final experiment, we added active behaviour oflarvae (i.e. swimming) as an important factor affect-ing transport success. In the previous experiments,transport success was defined as particles reachingeither the offshore or the inshore part of the nurseryarea. Mean transport success was 15% to this offshoreregion but only 2% to the inshore nursery area, whichis the core nursery ground where the prerecruitsremain until undertaking their first reproductivemigration. An assumption of this final experiment wasthat vertical migration of larvae could have a positiveeffect on the final phase of recruitment, improvingthe success rate of transport to the inshore part of thenursery area. It was postulated that at a given agelarvae have a tendency to reach a particular depth,which is a simple way of accounting for diel verticalmigration.
Thus, in this experiment, factors affectingrecruitment success were: (1) the spawning area, asbefore, (2) the month of spawning, as before, (3) theyear of simulation, as before, (4) the release depths,as before, (5) the lag after hatching for active beha-viour: 4, 6, 8, 10 days, (6) the target depth, i.e. the
constant depth at which the larvae remain: 0, 20, 40,60, 80, 100 m, (7) a random factor. There was nopatchiness or frequency of spawning effects; eggdensity was optimal, eggs were elongated, criticaltemperature was 14�C for eggs and 12�C for larvae,and the growth factor was set to 1. This experimentconsisted of 6 480 trials.
The most important factors influencing the vari-ability of transport success were the spawning area(32.3%, 3 d.f.; Fig. 9a) and the target depth (8.2%,5 d.f.; Fig. 9b). The average rate of transport success tothis smaller coastal area was 10%, although it was <2%in the previous experiments. The lag after hatching foractive behaviour did not have a significant effect, andthe year effect was small.
The optimal depth target for active behaviour was40 m. This suggests that there is a trade off betweenavoidance of surface Ekman transport offshore andlethal temperature in deep waters. This strategyappears to be quite robust, considering the inter-an-nual variability of the currents. We can thus concludethat vertical migration may be a good strategy to reachretention areas, and could be an important componentof the retention process.
WAB CABoff EABin EABoff
0.1
0.2
0.3
0.4
0.5
Oct. Nov. Dec. Jan. Feb. Mar.
Tra
nspo
rt s
ucce
ss (
%)
Tra
nspo
rt s
ucce
ss (
%)
1 2 3 4 5
0.1
0.2
0.3
0.4
0.5
Year11 12 13
Critical temperature
(a)
(c)
(b)
(d)
Figure 8. Transport success (%) in relation to (a) spawning area, (b) month of spawning, (c) year of the simulation and(d) critical temperature for larvae for the growth and mortality individual-based model (Experiment 3).
� 2003 Blackwell Publishing Ltd, Fish. Oceanogr., 12:4/5, 396–406.
From particles to individuals 403

DISCUSSION
This paper has focused on the methodological aspectsof IBM as applied to the study of early stages of fish.Detailed results and their ecological interpretationfrom several IBMs of anchovy in the southernBenguela system are published (Mullon et al., 2002a,b;Huggett et al., 2003; Parada et al., 2003) or in pre-paration. The methodological approach describedabove provides a framework for designing and plan-ning a series of experiments following a logical path-way. From one step to the next, only factors thatcontribute significantly to the variability of the globalquantifiable characteristic of the dynamics of the sys-tem (in our case successfully-transported particles) areincorporated. This approach has proved to be effectivein providing a simple model of the recruitment processwith a limited number of factors (spawning area,month of spawning, egg density, sensitivity to tem-perature, target depth for active behaviour, inter-an-nual variability of the currents).
Nonetheless, the strict application of such anapproach can run the risk of eliminating from the
model a factor that does not contribute substantially inone step, but could well have a significant effect in thenext step, especially if interacting with one of the newparameters. For instance, in Experiment 2 the depth ofparticle release did not significantly contribute toexplaining the observed model variance, whereas inExperiment 3 it was significant both as a singleparameter and when interacting with the month ofspawning. This illustrates the need to consider severallinked experiments together when making ecologicalinterpretations of results. In this case it was obviousthat depth would become an important factor afterincluding a sensitivity of the ichthyoplankton totemperature, knowing that particles would experiencecontrasting temperatures according to their position inthe water column.
Another choice we made illustrates the complexityof linking two experiments. In Experiment 1, themonth of spawning was varied from January toDecember in order to check that the model correctlyreproduced the seasonality of the anchovy-spawningpattern and to understand the adaptive spawningstrategy of the species. Once this was achieved, wedecided to concentrate only on the observed spawningseason (October–March) in Experiment 2. Because ofthe large disparity in transport success during thespawning season compared with the rest of the year,the effect of month of spawning become much lesssignificant in Experiment 2 compared with Experi-ment 1. In order to make the two experiments com-parable in that respect, Experiment 1 must be re-runwith the same spawning period as in Experiment 2.
Results obtained from our IBM experiments thus faron the early stages of anchovy in the southernBenguela system may be summarized as follows:• The importance of transport success to recruitment
variability has been confirmed.• Spawning during the summer months and on the
WAB is most efficient for successful transport ofspawn products to the nursery area. This is a verystrong and consistent effect and appears in allexperimental simulations.
• Consideration of the buoyancy of anchovy eggsimmediately after spawning appears to be veryimportant, as variations in density strongly affecttheir transport success.
• A trade-off between sensitivity to temperature andgrowth rate is evident and must be taken into ac-count.
• There is strong evidence for active swimmingbehaviour of the post-larvae.Further IBM experiments are planned that will use
more realistic output from the hydrodynamic model
WAB CABoff EABin EABoff
0.1
0.2
0.3
0.4
0.5
Tra
nspo
rt s
ucce
ss (
%)
Tra
nspo
rt s
ucce
ss (
%)
0 20 40 60 80 100
0.1
0.2
0.3
0.4
0.5
Depth
(a)
(b)
Figure 9. Transport success (%) in relation to (a) spawningarea and (b) target depth of active behaviour for the swim-ming behaviour individual-based model (Experiment 4).
� 2003 Blackwell Publishing Ltd, Fish. Oceanogr., 12:4/5, 396–406.
404 C. Mullon et al.

and that will be related to field and laboratory studies.First, and arising from previous IBM results, severallaboratory studies are planned concerning the buoy-ancy of eggs and the vertical migratory behaviour oflarvae and post-larvae. Secondly, we plan to conduct anew IBM experiment to test a hypothesis that hasemerged from recent egg survey data, namely theparental condition hypothesis (van der Lingen et al.,2002). This IBM will relate transport success to foodavailability and adult condition during spawning.
This interplay between modelling experiments andfield and laboratory studies could be considered as oneof the most important achievements of our approach.This was made possible by the early involvement ofscientists from different disciplines in the modellingprocess, and by the experimental approach of modellingthat looked familiar to them. This multidisciplinary andinteractive approach is considered to be an appropriatemethod for drawing together a range of expertise toaddress important ecological questions such as thoseconcerning anchovy recruitment variability.
ACKNOWLEDGEMENTS
This work forms part of the IDYLE program, a jointresearch project between South Africa and France,co-funded by the PNEC program (France), and affili-ated to SPACC-GLOBEC. The co-authors have beendirectly involved in the experiments presented here.This modelling approach relies heavily on previousresearch and advice from other scientists at Marine andCoastal Management (SA) and the University of CapeTown (SA), namely Lynne Shannon, Coleen Molo-ney, John Field, Frank Shillington, Philippe Cury,Larry Hutchings, Andy Bakun, Johan Lutjeharms andManuel Barange. It also relies on a preliminaryhydrodynamic modelling approach by Pierrick Penvenand Claude Roy, who provided us with an accuraterepresentation of the physics of the system.
REFERENCES
Armstrong, M.J., Shelton, P.A., Hampton, I., Jolly, G. andMelo, Y. (1988) Egg production estimates of anchovy bio-mass in the Southern Benguela System. Calif. Coop. Oceanic.Fish. Rep. 29:137–156.
Bakun, A. and Broad, K. (2002) Workshop discussions. Currentunderstanding. In: The IRI-IPRC Pacific Climate-FisheriesWorkshop on Climate and fisheries. Interacting Paradigms, Scalesand Policy Approaches. A. Bakun and K. Broad (eds) Inter-national Research Institute for Climate Prediction.
Barange, M., Hampton, I. and Roel, B.A. (1999) Trends in theabundance and distribution of anchovy and sardine on theSouth African continental shelf in the 1990s, deduced fromacoustic surveys. S. Afr. J. Mar. Sci. 19:367–391.
Boyd, A.J., Taunton-Clark, J. and Oberholster, G.P.J. (1992)Spatial features of the near-surface and midwater circulationpatterns off western and southern Africa and their role in thelife histories of various commercially fished species. In:Benguela Trophic Functioning. A.I.L. Payne, K.H. Brink, K.H.Mann and R. Hilborn (eds) S. Afr. J. Mar. Sci. 12:189–206.
Crawford, R.J., Shannon, L.V. and Pollock, D.E. (1987) TheBenguela ecosystem. 4. The major fish and invertebrateresources. In: Oceanography and Marine Biology. An AnnualReview, Vol. 25. M. Barnes (ed.) Aberdeen: University Press,pp. 353–505.
Denny, M.W. (1993) Air and Water: The Biology and Physics ofLife’s Media. NJ, USA: Princeton University Press, 341 p.
Grimm, V. (1994) Mathematical models and understanding inecology. Ecological modelling 75/76:641–651.
Grimm, V., Frank, K., Jeltsch, F., Brandl, R., Uchmarıski, J. andWissel, C. (1996) Pattern-oriented modelling in populationecology. Sci. Total Environ. 183:151–166.
Grimm V. (1999) Ten years of individual-based modelling inecology: what have we learned and what could we learn inthe future? Ecological Modelling 115:129–148.
Grimm, V., Wyszomirski, T., Aikman, D. and Uchmanski, J.(1999) Individual-based modelling and ecological theory:synthesis of a workshop. Ecological Modelling 115:275–282.
Haidvogel, D.B., Arango, H.G., Hedstrom, K.S., Beckmann, A.,Malanotte-Rizzoli, P. and Shchepetkin, A.F. (2000) Modelevaluation experiments in the North Atlantic Basin: simu-lations in nonlinear terrain-following coordinates. Dyn.Atmos. Oceans. 32:239–281.
Heath, M. and Gallego, A. (1997) From the biology of theindividual to the dynamics of the population: bridging thegap in fish early life studies. Journal of Fish Biology 51(A):1–29.
Hermann, A.J., Hinckley, S., Bernard, A, Megrey, B.A. andNapp, J.M. (2001) Applied and theoretical considerationsfor constructing spatially explicit individual-based models ofmarine larval fish that include multiple trophic levels. ICESJ. Mar. Sci. 58:1030–1041.
Hinckley, S., Hermann, A.J. and Megrey, B.A. (1996) Devel-opment of a spatially explicit individual based model ofmarine fish early life history. Mar. Ecol. Progr. Ser. 139:47–68.
Huggett, J., Freon P., Mullon, C. and Penven, P. (2003) Mod-elling the transport success of anchovy (Engraulis encrasico-lus) eggs and larvae in the southern Benguela: the effect ofspatio-temporal spawning patterns. Mar. Ecol. Progr. Ser.250:247–262.
Hutchings, L. (1992) Fish harvesting in a variable, productiveenvironment: searching for rules or searching for exceptions?In: Benguela Trophic Functioning. A.I.L. Payne, K.H. Brink,K.H. Mann and R. Hilborn (eds) S. Afr. J. Mar. Sci. 12:297–318.
Hutchings, L., Barange, M., Bloomer, S.F. et al. (1998) Multiplefactors affecting anchovy recruitment in the spawning,transport and nursery areas. In: Benguela Dynamics. Impacts ofVariability on Shelf-Sea Environments and their Living Resources.S.C. Pillar, C.L. Moloney, A.I.L. Payne and F.A. Shillington(eds) S. Afr. J. Mar. Sci. 19:211–225.
Hutchings, L., Beckley, L.E., Griffiths, M.H., Roberts, M.J.,Sundby, S. and van der Lingen, C.D. (2002) Spawning onthe edge: spawning grounds and nursery areas around thesouthern African coastline. Mar. Freshwater Res. 53:307–318.
� 2003 Blackwell Publishing Ltd, Fish. Oceanogr., 12:4/5, 396–406.
From particles to individuals 405

Mullon, C., Cury, P. and Penven, P. (2002a) Evolutionarysimulations of the recruitment of the anchovy in theBenguela current. Can. J. Fish. Aquat. Sci. 59:910–922.
Mullon, C., Parada, C., Cury, P. et al. (2002b) Individualbased modelling (IBM) of the early stages of anchovy inthe southern Benguela system. In: Report of a GLOBEC-SPACC/IDYLE/ENVIFISH Workshop on Spatial Approachesto the Dynamics of Coastal Pelagic Resources and theirEnvironment in Upwelling Areas. C.D. van der Lingen,C. Roy, P. Freon, M. Barange, L. Castro, M. Gutierrez,L. Nykjaer and F. Shillington (eds) GLOBEC Rep. 16:87–89.
Parada, C., van der Lingen, C.D., Mullon, C. and Penven, P.(2003) The effect of buoyancy on the transport of anchovy(Engraulis capensis) eggs from spawning to nursery grounds inthe Southern Benguela: an IBM approach. Fish. Oceanogr.12:1–15.
Penven, P. (2000) A Numerical Study of the Southern BenguelaCirculation with an Application to Fish Recruitment. These dedoctorat de l’Universite de Bretagne Occidentale, Brest,France 189 pp.
Penven, P., Roy, C., Brundrit, G. et al. (2001) A regionalhydrodynamic model of upwelling in the Southern Benguela.S. Afr. J. Sci. 97:472–475.
Railsback, S.F. (2001) Getting ‘‘results’’: the pattern-orientedapproach to analyzing natural systems with individual-basedmodels. Natural Resource Modelling 14:465–474.
Shelton, P.A. and Hutchings, L. (1982) Transport of anchovy,Engraulis capensis Gilchrist, eggs and early larvae by a frontaljet current. J. Cons. Int. Explor. Mer. 40:185–198.
Song, Y. and Haidvogel, D. (1994) A semi-implicit ocean cir-culation model using a generalized topography-followingcoordinate system. J. Comp. Physics 115:228–244.
van der Lingen, C.D., Hutchings, L., Merkle, D., van derWesthuizen, J.J. and Nelson, J. (2001) Comparative spawn-ing habitats of anchovy (Engraulis capensis) and sardine(Sardinops sagax) in the Southern Benguela upwelling eco-system. In: Spatial Processes and Management of Marine Pop-ulations. G.H. Kruse, N. Bez, T. Booth, M. Dorn, S. Hills,R. Lipicius, D. Pelletier, C. Roy, S. Smith and D. Witherell(eds) Fairbanks: University of Alaska Sea Grant, AK-SG-00-04, pp. 185–209.
van der Lingen, C.D., Coetzee, J.C. and Hutchings, L. (2002)Temporal shifts in the distribution of anchovy spawners andtheir eggs in the southern Benguela: implications forrecruitment. In: Report of a GLOBEC-SPACC/IDYLE/ENVIFISH Workshop on Spatial Approaches to the Dynamics ofCoastal Pelagic Resources and their Environment in UpwellingAreas. C.D. van der Lingen, C. Roy, P. Freon, P.M. Barange,L. Castro, M. Gutierrez, L. Nykjaer and F. Shillington (eds)GLOBEC Rep. 16:46–48.
Werner, F.E., Perry, R.I., Lough, R.G. and Naximie, C.E. (1996)Trophodynamic and advective influences on Georges Banklarval cod and haddock. Deep Sea Res. II 43:1793–1822.
Woods, J. (2002) Primitive equations modelling of planktonecosystems. In: Ocean Forecasting. Conceptual Basis andApplication. N. Pinardi and J. Woods (eds) Germany:Springer-Verlag Berlin Heidelberg, 472 pp.
Zweifel, J.R. and Lasker, R. (1976) Prehatch and posthatchgrowth of fishes – a general model. Fish. Bull. 74:609–621.
� 2003 Blackwell Publishing Ltd, Fish. Oceanogr., 12:4/5, 396–406.
406 C. Mullon et al.