Geographical differences in the feeding patterns of red rockfish (Sebastes capensis) along South...
9
489 Abstract —Feeding habits and feed- ing strategy of red rockfish ( Sebastes capensis) were studied from fish cap- tured along most of the range of this species in coastal waters of South America. Stomach contents of 613 individuals, collected during 2003, were analyzed. Fish were obtained from six locations along the Chil- ean (23°S to 46°S) and Argentinian (43°S) coasts. The main prey items were Mysidacea (75.06% IRI), Osteich- thyes (6.29% IRI),and Rhynchocinetes typus (6.03% IRI). Predator sex and size did not significantly affect the diet, but significant differences were found between locations. Four geo- graphical areas, discriminated by prey occurrence and frequencies, were determined: three on the Pacific coast and one on the Atlantic coast. These areas correspond roughly with biogeographic zones described for the Chilean and southern Argentinian coasts. The feeding strategy index (FSI) indicated a specialized feed- ing strategy for S. capensis for most of its range. However, the FSI does not include the behaviour of a preda- tor, and the FSI must be interpreted carefully for fishes like S. capensis that are passive ambush feeders. The abundance and availability of different prey may explain both the geographic differences in dietary com- position and the specialized feeding strategy of S. capensis. Manuscript submitted 18 November 2004 to the Scientific Editor’s Office. Manuscript approved for publication 1 November 2005 by the Scientific Editor. Fish. Bull. 104:489–497 (2006). Geographical differences in the feeding patterns of red rockfish ( Sebastes capensis ) along South American coasts Claudio A. Barrientos M. Teresa González (contact author) Carlos A. Moreno Instituto de Ecología y Evolución Universidad Austral de Chile Isla Teja s/n, Casilla 567 Valdivia, Chile Present address for M. T. González: Instituto de Investigaciones Oceanológicas Universidad de Antofagasta, Casilla 170 Antofagasta, Chile Email address for M. T. González: [email protected] The feeding habits of a species, deter- mined by its physiological, and behav- ioral adaptations, form a basic aspect of its biology; they provide a way to understand the trophic interactions between predators and their prey (Herrán 1 ). Throughout the evolution of behavior and morphological adapta- tion there have been strong selective pressures toward those characteristics that allow a species to capture its prey and to escape from predators (Hixon and Beets, 1993; Reznick et al., 1997; Abrams, 2000). Most trophic studies in fishes are carried out only on a local scale (e.g., Moreno and Zamorano, 1980; Ojeda and Fariña, 1996), and rarely consid- er the predator’s entire distributional range. Thus, conclusions about the species’ trophic patterns can reflect local conditions rather than a gener- alized feeding habit. In the Southern Hemisphere, red rockfish ( Sebastes capensis (Gmelin, 1788)) is the only known species within this genus. It is distributed from the Pacific coast (the coast of Peru and Chile), to east of the Falkland Islands, to east of Tristan da Cunha, and as far as the southwestern coast of South Africa (Chen, 1971; Kong, 1985). Sebastes capensis is an ovoviviparous species that inhabits the waters over the con- tinental shelf between 20 and 200 m in depth (Pequeño, 2000). Despite the economic importance of this species along the north and central coast of Chile, where it is exploited by local fisherman, there is little information about its biology and ecology. Cur- rently, there is only one known study describing the diet of this species from the central Chilean coast (Ojeda and Fariña, 1996). In our study, the feeding habits of S. capensis are described and its feeding strategy is analyzed along its geographic range in South America in order to understand whether the feeding pattern and the trophic be- havior of this species are maintained at the regional scale. Moreover, the ability of the feeding strategy index of Amundsen et al. (1996) is evalu- ated for a predator like S. capensis that is a passive ambush feeder. Materials and methods Sampling The area of study included most of the distributional range for S. capen- sis (Fig. 1) along the Chilean coast— A ntofagasta (23°11ʹ S; 70°29 ʹ W), Coquimbo (29°58 ʹ S;71°19 ʹ W), Val- 1 Herrán, R. A. 1988. Stomach con- tents in fishes: bibliographic revision of objectives and methods. Technical report of the Instituto Oceanográfico Español, number 63, 74 p. Muelle de Poniente s/n; Apartado 291; 07015 Palma de Mallorca; Islas Baleares; Spain. [In Spanish.]
Transcript of Geographical differences in the feeding patterns of red rockfish (Sebastes capensis) along South...
489
Abstract—Feeding habits and feed-ing strategy of red rockfish (Sebastes capensis) were studied from fish cap-tured along most of the range of this species in coastal waters of South America. Stomach contents of 613 individuals, collected during 2003, were analyzed. Fish were obtained from six locations along the Chil-ean (23°S to 46°S) and Argentinian (43°S) coasts. The main prey items were Mysidacea (75.06% IRI), Osteich-thyes (6.29% IRI),and Rhynchocinetes typus (6.03% IRI). Predator sex and size did not significantly affect the diet, but significant differences were found between locations. Four geo-graphical areas, discriminated by prey occurrence and frequencies, were determined: three on the Pacific coast and one on the Atlantic coast. These areas correspond roughly with biogeographic zones described for the Chilean and southern Argentinian coasts. The feeding strategy index (FSI) indicated a specialized feed-ing strategy for S. capensis for most of its range. However, the FSI does not include the behaviour of a preda-tor, and the FSI must be interpreted carefully for fishes like S. capensis that are passive ambush feeders. The abundance and availability of different prey may explain both the geographic differences in dietary com-position and the specialized feeding strategy of S. capensis.
Manuscript submitted 18 November 2004 to the Scientific Editor’s Office.
Manuscript approved for publication 1 November 2005 by the Scientific Editor.
Fish. Bull. 104:489–497 (2006).
Geographical differences in the feeding patterns of red rockfish (Sebastes capensis) along South American coasts
Claudio A. Barrientos
M. Teresa González (contact author)
Carlos A. Moreno
Instituto de Ecología y Evolución Universidad Austral de Chile Isla Teja s/n, Casilla 567 Valdivia, Chile Present address for M. T. González: Instituto de Investigaciones Oceanológicas
Universidad de Antofagasta, Casilla 170 Antofagasta, Chile
Email address for M. T. González: [email protected]
The feeding habits of a species, deter-mined by its physiological, and behav-ioral adaptations, form a basic aspect of its biology; they provide a way to understand the trophic interactions between predators and their prey (Herrán1). Throughout the evolution of behavior and morphological adapta-tion there have been strong selective pressures toward those characteristics that allow a species to capture its prey and to escape from predators (Hixon and Beets, 1993; Reznick et al., 1997; Abrams, 2000).
Most trophic studies in fishes are carried out only on a local scale (e.g., Moreno and Zamorano, 1980; Ojeda and Fariña, 1996), and rarely consid-er the predator’s entire distributional range. Thus, conclusions about the species’ trophic patterns can reflect local conditions rather than a gener-alized feeding habit. In the Southern Hemisphere, red rockfish (Sebastes capensis (Gmelin, 1788)) is the only known species within this genus. It is distributed from the Pacific coast (the coast of Peru and Chile), to east of the Falkland Islands, to east of Tristan da Cunha, and as far as the southwestern coast of South Africa (Chen, 1971; Kong, 1985). Sebastes capensis is an ovoviviparous species that inhabits the waters over the con-tinental shelf between 20 and 200 m in depth (Pequeño, 2000). Despite the economic importance of this species along the north and central coast of
Chile, where it is exploited by local fisherman, there is little information about its biology and ecology. Cur-rently, there is only one known study describing the diet of this species from the central Chilean coast (Ojeda and Fariña, 1996).
In our study, the feeding habits of S. capensis are described and its feeding strategy is analyzed along its geographic range in South America in order to understand whether the feeding pattern and the trophic be-havior of this species are maintained at the regional scale. Moreover, the ability of the feeding strategy index of Amundsen et al. (1996) is evalu-ated for a predator like S. capensis that is a passive ambush feeder.
Materials and methods
Sampling
The area of study included most of the distributional range for S. capen-sis (Fig. 1) along the Chilean coast— A ntofagasta (23°11ʹS; 70°29 ʹ W), Coquimbo (29°58ʹS;71°19 ʹW), Val-
1 Herrán, R. A. 1988. Stomach con-tents in fishes: bibliographic revision of objectives and methods. Technical report of the Instituto Oceanográfico Español, number 63, 74 p. Muelle de Poniente s/n; Apartado 291; 07015 Palma de Mallorca; Islas Baleares; Spain. [In Spanish.]
490 Fishery Bulletin 104(4)
paraíso (32°54ʹS; 71°44ʹW), Talcahuano (36°44ʹS;
80°W 70°W
10°S
20°S
30°S
40°S
50°S
1
2
3
4
5
6
7
15°S
30°SChile
Peru
Arg
entin
a
�
90°W 75°W 60°W 45°W 30°W
15°N
0°
15°S
30°S
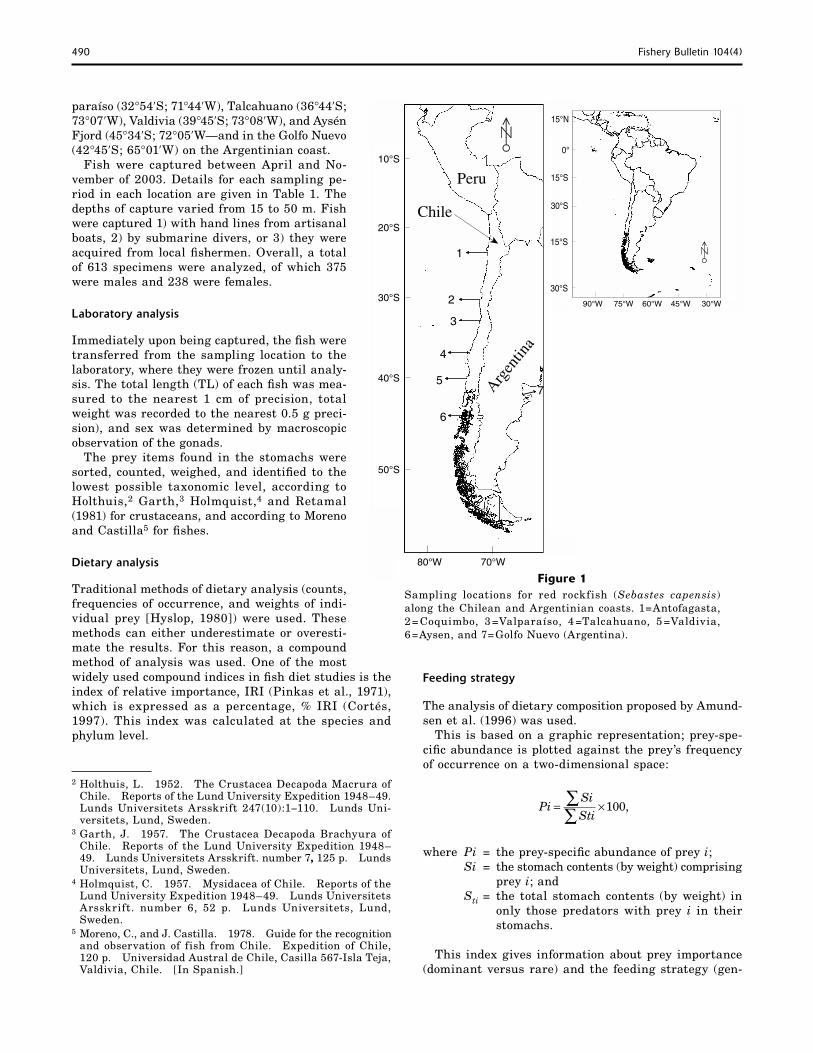
Figure 1
73°07ʹW), Valdivia (39°45ʹS; 73°08ʹW), and Aysén Fjord (45°34ʹS; 72°05ʹW—and in the Golfo Nuevo (42°45ʹS; 65°01ʹW) on the Argentinian coast.
Fish were captured between April and No-vember of 2003. Details for each sampling pe-riod in each location are given in Table 1. The depths of capture varied from 15 to 50 m. Fish were captured 1) with hand lines from artisanal boats, 2) by submarine divers, or 3) they were acquired from local fishermen. Overall, a total of 613 specimens were analyzed, of which 375 were males and 238 were females.
Laboratory analysis
Immediately upon being captured, the fish were transferred from the sampling location to the laboratory, where they were frozen until analy-sis. The total length (TL) of each fish was mea-sured to the nearest 1 cm of precision, total weight was recorded to the nearest 0.5 g preci-sion), and sex was determined by macroscopic observation of the gonads.
The prey items found in the stomachs were sorted, counted, weighed, and identified to the lowest possible taxonomic level, according to Holthuis,2 Garth,3 Holmquist,4 and Retamal (1981) for crustaceans, and according to Moreno and Castilla5 for fishes.
Dietary analysis
Traditional methods of dietary analysis (counts, Sampling locations for red rockfish (Sebastes capensis)frequencies of occurrence, and weights of indi- along the Chilean and Argentinian coasts. 1=Antofagasta, vidual prey [Hyslop, 1980]) were used. These 2= Coquimbo, 3=Valparaíso, 4 =Talcahuano, 5 =Valdivia, methods can either underestimate or overesti-mate the results. For this reason, a compound method of analysis was used. One of the most widely used compound indices in fish diet studies is the index of relative importance, IRI (Pinkas et al., 1971), which is expressed as a percentage, % IRI (Cortés, 1997). This index was calculated at the species and phylum level.
2 Holthuis, L. 1952. The Crustacea Decapoda Macrura of
6=Aysen, and 7=Golfo Nuevo (Argentina).
Feeding strategy
The analysis of dietary composition proposed by Amund-sen et al. (1996) was used.
This is based on a graphic representation; prey-spe-cific abundance is plotted against the prey’s frequency of occurrence on a two-dimensional space:
∑Chile. Reports of the Lund University Expedition 1948–49. Si Pi ×100, Lunds Universitets Arsskrift 247(10):1−110. Lunds Uni- ∑
= Sti versitets, Lund, Sweden.
3 Garth, J. 1957. The Crustacea Decapoda Brachyura of Chile. Reports of the Lund University Expedition 1948– where Pi = the prey-specific abundance of prey i;49. Lunds Universitets Arsskrift. number 7, 125 p. Lunds
Si = the stomach contents (by weight) comprising Universitets, Lund, Sweden. prey i; and
= the total stomach contents (by weight) in Sti only those predators with prey i in their stomachs.
This index gives information about prey importance (dominant versus rare) and the feeding strategy (gen-
4 Holmquist, C. 1957. Mysidacea of Chile. Reports of the Lund University Expedition 1948–49. Lunds Universitets Arsskrift. number 6, 52 p. Lunds Universitets, Lund, Sweden.
5 Moreno, C., and J. Castilla. 1978. Guide for the recognition and observation of fish from Chile. Expedition of Chile, 120 p. Universidad Austral de Chile, Casilla 567-Isla Teja, Valdivia, Chile. [In Spanish.]

Barrientos et al.: Differences in the feeding patterns of Sebastes capensis 491
Table 1 Sampling period and mean sizes (mean, in cm) of red rockfish (Sebastes capensis) examined by location and latitude. n=number of stomachs with prey; SD=size standard deviation, and P=probability associated with Kruskal-Wallis test. ns=no significant differences.
Total length
Location Latitude Sampling period n Mean SD P
Antofagasta 24°S May−June 2003 Coquimbo 30°S May 2003 Valparaíso 33°S April−May 2003 Talcahuano 36°S April−May 2003 Valdivia 40°S April−May 2003 Aysen fjord 45°S July, November 2003 Golfo Nuevo 43°S June 2003
eralist versus specialist) of the predator. The verti-cal axis of a hypothetical index represents the feeding strategy of the predator in terms of specialization or generalization. Prey points located at the upper left of the diagram would be indicative of specialization of individual predators, and those in the upper right would represent specialization of the predator popu-lation. Data seen in the upper right of the diagram (population specialization) necessarily restricted to a single point or to a few points, would reflect a predator population with a narrow niche diet. If all prey points were located along or below the diagonal from the upper left to the lower right, the predator population would have a broad niche width. Prey points located in either the upper left or the lower right corner would represent prey that make the same overall contributions to the population diet, but they would be indicative of totally different feeding strategies for the individual predators. Prey with high specific abundance and low occurrence (upper left) would be consumed by a few individuals displaying specialization, whereas prey with a low spe-cific abundance and a high occurrence (lower right) would be eaten occasionally by most individuals. These differences in feeding strategy are related to the be-tween- and within-phenotypic contributions to the niche width. In a population with a high between-phenotypic component, individuals specialize on different resource types. In a population with a high within-phenotype component, most of the individuals use many resource types simultaneously.
Statistical analysis
The Mann Whitney test was used to compare the sizes of fish between sexes, and the Kruskal-Wallis test was performed to compare the sizes of fish from different locations (Zar, 1999). The χ2 contingency tables were used to evaluate the possible differences in the prey items clustered by phylum (Arthropoda, Chordata, and Mollusca) among locations. In addition, the G-statistic was used to evaluate differences in the occurrences
29 24.8 1.74 ns 21 26.2 4.39 ns 50 22.2 3.02 ns 59 26.8 1.66 <0.05 87 26.2 3.34 <0.05 25 25.1 2.15 ns 23 27.1 2.60 ns
of different prey types between sexes (Zar, 1999) and among the different size classes of fish defined arbitrary (class 1: fish between 18 and 25 cm, and class 2: fish between 26 and 38 cm) (Zar, 1999).
A correspondence analysis was used to evaluate the association between occurrences of prey items and the different locations, allowing the ordination of samples in a reduced space (two dimensions) (Digby and Kemp-ton, 1987).
Results
Fish characteristics
A total of 613 specimens were analyzed and of those 296 stomachs contained some prey, 189 had empty stom-achs, and 128 had everted stomachs (48.29%, 30.83% and 20.88%, respectively). Table 1 summarizes the characteristics of the fish analyzed by location. There was no significant difference in body size between males and females (U=9854.5, P=0.26). The size of fish dif-fered significantly among locations: fish from Talca-huano and Valdivia did not differ significantly in size but were significantly larger than those from the others locations (Table 1).
Diet analysis
Across the geographical range, a total of 60 prey items were identified (Table 2): 40 crustaceans, 9 fishes, 3 cephalopods, 7 snails, and 1 polychetes. Crustaceans were the predominant prey in the diet of S. capensis. The low occurrence of other prey items allowed us to des-ignate this species as carcinophagous (=feeding mainly on crustaceans).
Overall, the most important prey item was Mysida-cea unident. (75.06% IRI), followed by Osteichthyes unident. (6.29% IRI), the rock shrimp Rhynchocinetes typus (6.03% IRI), deep red crab (Petrolisthes desmar-estii) (4.67 % IRI), the rock crab Cancer setosus (2.32%
492 Fishery Bulletin 104(4)
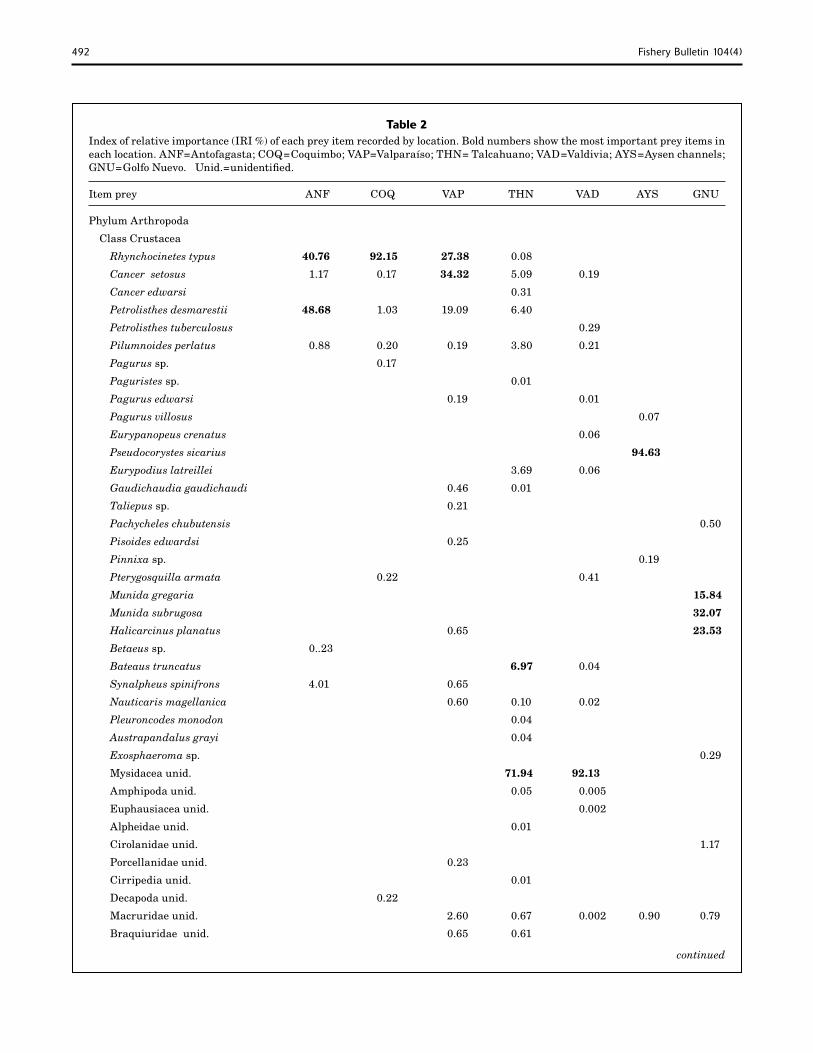
Table 2 Index of relative importance (IRI %) of each prey item recorded by location. Bold numbers show the most important prey items in each location. ANF=Antofagasta; COQ=Coquimbo; VAP=Valparaíso; THN= Talcahuano; VAD=Valdivia; AYS=Aysen channels; GNU=Golfo Nuevo. Unid.=unidentified.
Item prey ANF COQ VAP THN VAD AYS GNU
Phylum Arthropoda
Class Crustacea
Rhynchocinetes typus 40.76 92.15 27.38 0.08
Cancer setosus 1.17 0.17 34.32 5.09 0.19
Cancer edwarsi 0.31
Petrolisthes desmarestii 48.68 1.03 19.09 6.40
Petrolisthes tuberculosus 0.29
Pilumnoides perlatus 0.88 0.20 0.19 3.80 0.21
Pagurus sp. 0.17
Paguristes sp. 0.01
Pagurus edwarsi 0.19 0.01
Pagurus villosus 0.07
Eurypanopeus crenatus 0.06
Pseudocorystes sicarius 94.63
Eurypodius latreillei 3.69 0.06
Gaudichaudia gaudichaudi 0.46 0.01
Taliepus sp. 0.21
Pachycheles chubutensis 0.50
Pisoides edwardsi 0.25
Pinnixa sp. 0.19
Pterygosquilla armata 0.22 0.41
Munida gregaria 15.84
Munida subrugosa 32.07
Halicarcinus planatus 0.65 23.53
Betaeus sp. 0..23
Bateaus truncatus 6.97 0.04
Synalpheus spinifrons 4.01 0.65
Nauticaris magellanica 0.60 0.10 0.02
Pleuroncodes monodon 0.04
Austrapandalus grayi 0.04
Exosphaeroma sp. 0.29
Mysidacea unid. 71.94 92.13
Amphipoda unid. 0.05 0.005
Euphausiacea unid. 0.002
Alpheidae unid. 0.01
Cirolanidae unid. 1.17
Porcellanidae unid. 0.23
Cirripedia unid. 0.01
Decapoda unid. 0.22
Macruridae unid. 2.60 0.67 0.002 0.90 0.79
Braquiuridae unid. 0.65 0.61
continued
Barrientos et al.: Differences in the feeding patterns of Sebastes capensis 493
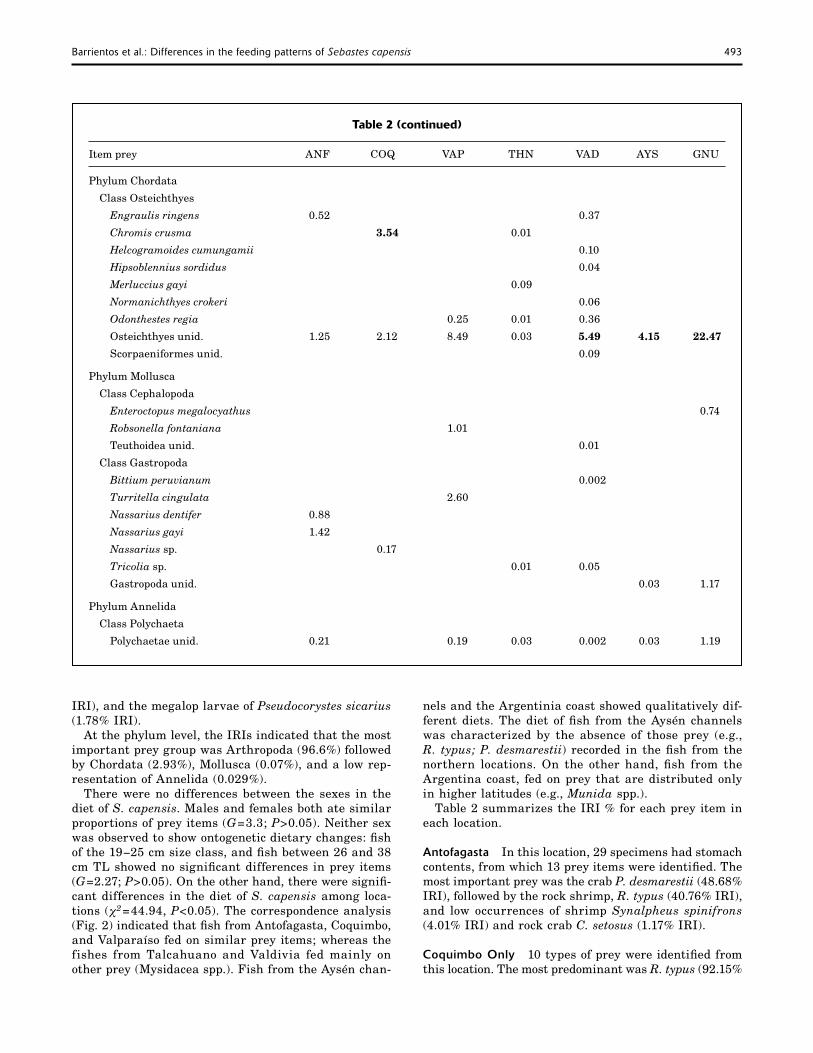
Table 2 (continued)
Item prey ANF COQ VAP THN VAD AYS GNU
Phylum Chordata
Class Osteichthyes
Engraulis ringens 0.52
Chromis crusma 3.54
Helcogramoides cumungamii
Hipsoblennius sordidus
Merluccius gayi
Normanichthyes crokeri
Odonthestes regia
Osteichthyes unid. 1.25 2.12
Scorpaeniformes unid.
Phylum Mollusca
Class Cephalopoda
Enteroctopus megalocyathus
Robsonella fontaniana
Teuthoidea unid.
Class Gastropoda
Bittium peruvianum
Turritella cingulata
Nassarius dentifer 0.88
Nassarius gayi 1.42
Nassarius sp. 0.17
Tricolia sp.
Gastropoda unid.
Phylum Annelida
Class Polychaeta
Polychaetae unid. 0.21
IRI), and the megalop larvae of Pseudocorystes sicarius (1.78% IRI).
At the phylum level, the IRIs indicated that the most important prey group was Arthropoda (96.6%) followed by Chordata (2.93%), Mollusca (0.07%), and a low rep-resentation of Annelida (0.029%).
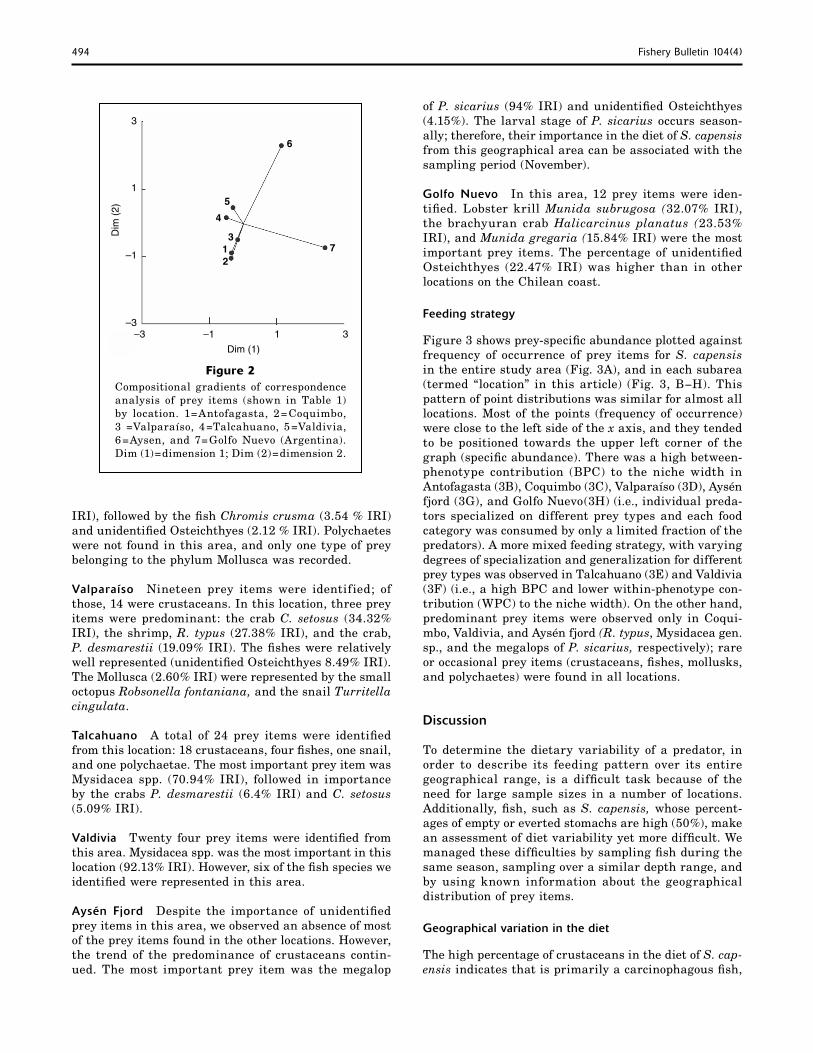
There were no differences between the sexes in the diet of S. capensis. Males and females both ate similar proportions of prey items (G =3.3; P>0.05). Neither sex was observed to show ontogenetic dietary changes: fish of the 19−25 cm size class, and fish between 26 and 38 cm TL showed no significant differences in prey items (G =2.27; P>0.05). On the other hand, there were signifi-cant differences in the diet of S. capensis among loca-tions (χ2 =44.94, P<0.05). The correspondence analysis (Fig. 2) indicated that fish from Antofagasta, Coquimbo, and Valparaíso fed on similar prey items; whereas the fishes from Talcahuano and Valdivia fed mainly on other prey (Mysidacea spp.). Fish from the Aysén chan-
0.37
0.01
0.10
0.04
0.09
0.06
0.25 0.01 0.36
8.49 0.03 5.49 4.15 22.47
0.09
0.74
1.01
0.01
0.002
2.60
0.01 0.05
0.03 1.17
0.19 0.03 0.002 0.03 1.19
nels and the Argentinia coast showed qualitatively dif-ferent diets. The diet of fish from the Aysén channels was characterized by the absence of those prey (e.g., R. typus; P. desmarestii) recorded in the fish from the northern locations. On the other hand, fish from the Argentina coast, fed on prey that are distributed only in higher latitudes (e.g., Munida spp.).
Table 2 summarizes the IRI % for each prey item in each location.
Antofagasta In this location, 29 specimens had stomach contents, from which 13 prey items were identified. The most important prey was the crab P. desmarestii (48.68% IRI), followed by the rock shrimp, R. typus (40.76% IRI), and low occurrences of shrimp Synalpheus spinifrons (4.01% IRI) and rock crab C. setosus (1.17% IRI).
Coquimbo Only 10 types of prey were identified from this location. The most predominant was R. typus (92.15%
494 Fishery Bulletin 104(4)
Dim
(2)
Dim (1)
–3 –1 1 3
3
1
–1
–3
7
6
5
4
3 1 2
Figure 2 Compositional gradients of correspondence analysis of prey items (shown in Table 1) by location. 1=Antofagasta, 2=Coquimbo, 3 =Valparaíso, 4=Talcahuano, 5=Valdivia, 6=Aysen, and 7=Golfo Nuevo (Argentina). Dim (1)=dimension 1; Dim (2)=dimension 2.
IRI), followed by the fish Chromis crusma (3.54 % IRI) and unidentified Osteichthyes (2.12 % IRI). Polychaetes were not found in this area, and only one type of prey belonging to the phylum Mollusca was recorded.
Valparaíso Nineteen prey items were identified; of those, 14 were crustaceans. In this location, three prey items were predominant: the crab C. setosus (34.32% IRI), the shrimp, R. typus (27.38% IRI), and the crab, P. desmarestii (19.09% IRI). The fishes were relatively well represented (unidentified Osteichthyes 8.49% IRI). The Mollusca (2.60% IRI) were represented by the small octopus Robsonella fontaniana, and the snail Turritella cingulata.
Talcahuano A total of 24 prey items were identified from this location: 18 crustaceans, four fishes, one snail, and one polychaetae. The most important prey item was Mysidacea spp. (70.94% IRI), followed in importance by the crabs P. desmarestii (6.4% IRI) and C. setosus (5.09% IRI).
Valdivia Twenty four prey items were identified from this area. Mysidacea spp. was the most important in this location (92.13% IRI). However, six of the fish species we identified were represented in this area.
Aysén Fjord Despite the importance of unidentified prey items in this area, we observed an absence of most of the prey items found in the other locations. However, the trend of the predominance of crustaceans contin-ued. The most important prey item was the megalop
of P. sicarius (94% IRI) and unidentified Osteichthyes (4.15%). The larval stage of P. sicarius occurs season-ally; therefore, their importance in the diet of S. capensis from this geographical area can be associated with the sampling period (November).
Golfo Nuevo In this area, 12 prey items were iden-tified. Lobster krill Munida subrugosa (32.07% IRI), the brachyuran crab Halicarcinus planatus (23.53% IRI), and Munida gregaria (15.84% IRI) were the most important prey items. The percentage of unidentified Osteichthyes (22.47% IRI) was higher than in other locations on the Chilean coast.
Feeding strategy
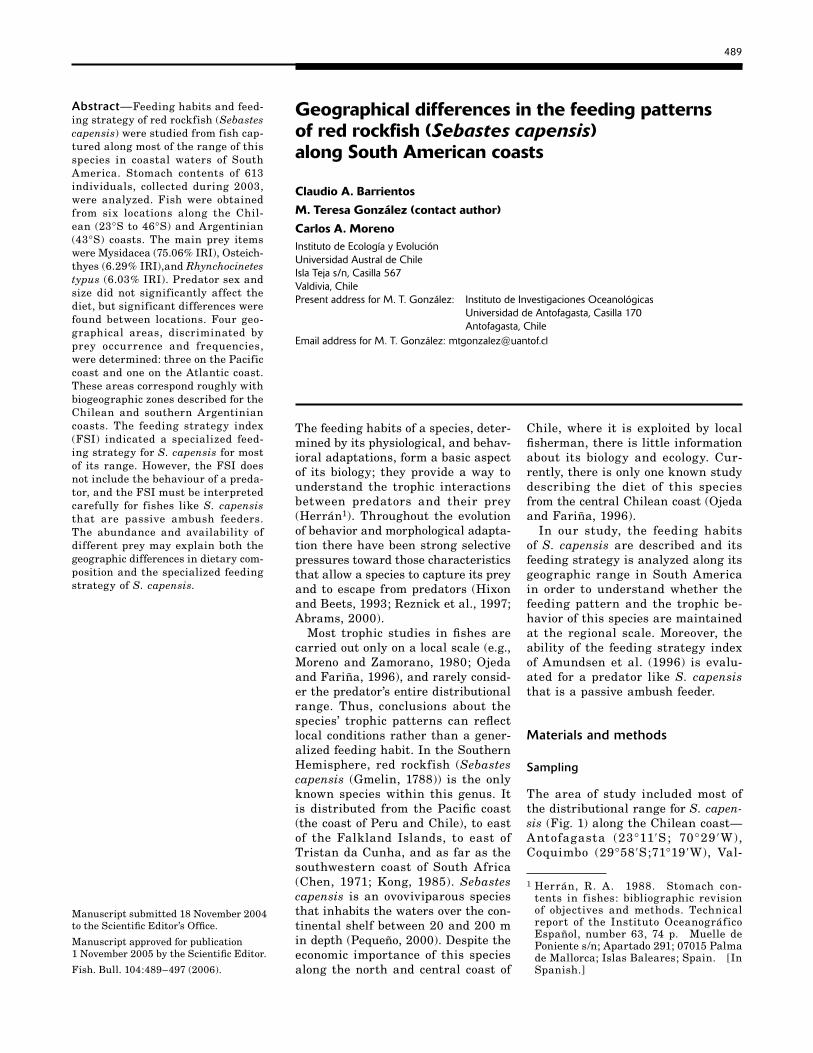
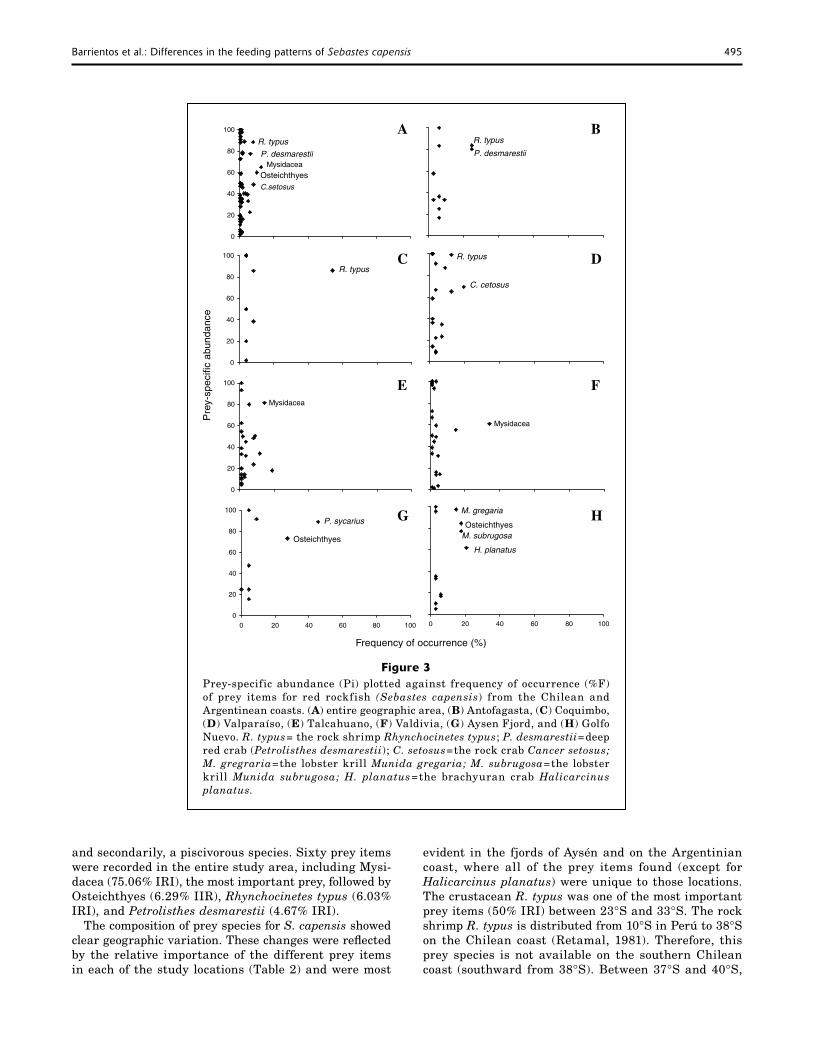
Figure 3 shows prey-specific abundance plotted against frequency of occurrence of prey items for S. capensis in the entire study area (Fig. 3A), and in each subarea (termed “location” in this article) (Fig. 3, B−H). This pattern of point distributions was similar for almost all locations. Most of the points (frequency of occurrence) were close to the left side of the x axis, and they tended to be positioned towards the upper left corner of the graph (specific abundance). There was a high between-phenotype contribution (BPC) to the niche width in Antofagasta (3B), Coquimbo (3C), Valparaíso (3D), Aysén fjord (3G), and Golfo Nuevo(3H) (i.e., individual preda-tors specialized on different prey types and each food category was consumed by only a limited fraction of the predators). A more mixed feeding strategy, with varying degrees of specialization and generalization for different prey types was observed in Talcahuano (3E) and Valdivia (3F) (i.e., a high BPC and lower within-phenotype con-tribution (WPC) to the niche width). On the other hand, predominant prey items were observed only in Coqui-mbo, Valdivia, and Aysén fjord (R. typus, Mysidacea gen. sp., and the megalops of P. sicarius, respectively); rare or occasional prey items (crustaceans, fishes, mollusks, and polychaetes) were found in all locations.
Discussion
To determine the dietary variability of a predator, in order to describe its feeding pattern over its entire geographical range, is a difficult task because of the need for large sample sizes in a number of locations. Additionally, fish, such as S. capensis, whose percent-ages of empty or everted stomachs are high (50%), make an assessment of diet variability yet more difficult. We managed these difficulties by sampling fish during the same season, sampling over a similar depth range, and by using known information about the geographical distribution of prey items.
Geographical variation in the diet
The high percentage of crustaceans in the diet of S. cap-ensis indicates that is primarily a carcinophagous fish,
0 20 40 60 80 100
0
20
40
60
80
100
0 20 40 60 80 100
0 20 40 60 80 100
0
20
40
60
80
100
0 20 40 60 80 100
0 20 40 60 80 1000
20
40
60
80
100
0 20 40 60 80 100
0
20
40
60
80
100
Barrientos et al.: Differences in the feeding patterns of Sebastes capensis 495
i
0
i
0
A
C
R. typus
Mys dacea
C.setosus
20
40
60
80
100
Osteichthyes
P. desmaresti
R. typus
20
40
60
80
100
c ab
unda
nce
ii
B
D
R. typus
P. desmarest
R. typus
C. cetosus
i
0
i
ifi
E F Mys dacea
20
40
60
80
100
Mys dacea
Pre
y-sp
ec
0 0
Osteichthyes
P. sycarius
0
l
i
iaG H
A B C(D E F G j H
;
20
40
60
80
100
20 40 60 80 100 20 40 60 80 100
H. p anatus
Oste chthyes
M. gregar
Frequency of occurrence (%)
Figure 3 Prey-specific abundance (Pi) plotted against frequency of occurrence (%F) of prey items for red rockfish (Sebastes capensis) from the Chilean and Argentinean coasts. ( ) entire geographic area, ( ) Antofagasta, ( ) Coquimbo,
) Valparaíso, ( ) Talcahuano, ( ) Valdivia, ( ) Aysen F ord, and ( ) Golfo Nuevo. R. typus= the rock shrimp Rhynchocinetes typus P. desmarestii=deep red crab (Petrolisthes desmarestii); C. setosus=the rock crab Cancer setosus; M. gregraria=the lobster krill Munida gregaria; M. subrugosa=the lobster krill Munida subrugosa; H. planatus=the brachyuran crab Halicarcinus planatus.
M. subrugosa
and secondarily, a piscivorous species. Sixty prey items were recorded in the entire study area, including Mysi-dacea (75.06% IRI), the most important prey, followed by Osteichthyes (6.29% IIR), Rhynchocinetes typus (6.03% IRI), and Petrolisthes desmarestii (4.67% IRI).
The composition of prey species for S. capensis showed clear geographic variation. These changes were reflected by the relative importance of the different prey items in each of the study locations (Table 2) and were most
evident in the fjords of Aysén and on the Argentinian coast, where all of the prey items found (except for Halicarcinus planatus) were unique to those locations. The crustacean R. typus was one of the most important prey items (50% IRI) between 23°S and 33°S. The rock shrimp R. typus is distributed from 10°S in Perú to 38°S on the Chilean coast (Retamal, 1981). Therefore, this prey species is not available on the southern Chilean coast (southward from 38°S). Between 37°S and 40°S,
496 Fishery Bulletin 104(4)
Mysidacea was the most important prey item. In this geographic area, the mysids are also the most impor-tant prey item for other rocky bottom fishes (González and Oyarzún, 2003). Mysids are found in large and dense patches a few centimeters from the benthos (Silva and Stuardo, 1985).
The changes in prey types and their differences in IRI were also supported by a correspondence analysis (Fig. 2), which separated the sampling locations into four major areas according to recorded prey types as follows: 1) 23°S−33°S, 2) 37°S−40°S, 3) 45°S, and 4) Golfo Nuevo (43°S), Argentina. These geographic areas agree well with the proposed biogeographic units for this region by Briggs (1995) and by Camus (2001). Ac-cording to Briggs (1995), two faunistic provinces are recognized in the southeastern Pacific: the Peruvian province, which extends from Perú (ca. 10°S) down to the northern Chilean coast (ca. 30°S), and the Magel-lanic province located on the southern Chilean coast (ca. 43°S). Between these provinces a transitional zone is found, in which species typical of the Peruvian prov-ince and the Magellanic province overlap (Brattström and Johanssen, 1983; Lancelloti and Vasquez, 2000). Additionally, Camus (2001) recognized five areas of distributional discontinuities along the Chilean coast: (1) 30°S; (2) 33°S; (3) 37°−38° S; (4) 41°−43°S, and (5) 52°−53°S. Thus prey, such as R. typus, are distrib-uted along the Peruvian province and transitional zone, whereas prey like mysids are present mainly between latitudes 37°S and 40°S.
Alternatively, Balech (1954) and Pequeño (2000) con-sidered all of South America’s southern extremity as the same biogeographic province. The records of prey items (i.e., Munida gregaria and M. subrugosa) in Golfo Nuevo (Argentina coast) support the existence of a connection between the southeastern Pacific and the southwestern Atlantic. These prey species are also distributed along the Chilean coast from Chiloé (42°S) southward. However, these prey items were not found in Aysén fjord, which could be explained by the presence of two zones in the Aysen area with different physical and faunistic conditions: the fjord channels and a ma-rine zone (Arntz et al., 1999). Fish were sampled in the Aysen channels, where species of Munida are absent (Retamal, 1981). Therefore, abundance and availability of prey may be a factor explaining the differences in the dietary composition of S. capensis between biogeo-graphical regions.
The present study indicates the existence of geograph-ic variations in the dietary composition of S. capensis, and these variations generally agree with the zoogeo-graphic limits proposed in the literature. However, the interpretation of this result is limited because of the absence of an adequate background on the abundance and biogeography of each prey item.
Feeding strategy
According to Ojeda and Fariña (1996), S. capensis is a nocturnal predator that feeds selectively on the decapod
crustaceans R. typus and P. perlatus in the rocky subti-dal shores of the central Chilean coast. Ojeda and Fariña suggested that these species are consumed preferentially from a large array of potentially abundant invertebrate prey items. Crustaceans are more active at night than during the day, which could explain their large rate of consumption by rockfishes that are active a night. Decapod crustaceans have the highest caloric content (Duarte et al., 1980), therefore Ojeda and Fariña (1996) proposed that the specialized diet of S. capensis reflects an optimal foraging alimentary strategy based on the maximization of available energy. On the other hand, Moreno and Zamorano (1980) indicated that the feeding strategy of a species has a direct relationship with its morphological and behavioral adaptations that preclude being preyed upon, and these adaptations could restrict the potential prey items that they could capture. In this context, Moreno et al. (1979) and Moreno (1981) studied the bathymetric distribution of six species of fishes from the rocky subtidal shore of the Valdivian coast, including S. capensis. They established that the fishes segregate by habitats in order to take refuge from predators, mainly the sea lion Otaria flavescens; such segregation was not related to the bathymetric distribution of their most important prey items.
Sebastes capensis shows buccal traits characteristic of carnivorous speciesl it has a good protrusion capacity and its teeth are inclined in a dorsal-caudal orienta-tion that prevents the escape of prey once they have been caught (Alvarado, 1985). Sebastes capensis is a poor swimmer; its anatomy conforms to that of sed-entary species in that its head and mouth are big in comparison to the rest of the body, and it has big eyes that allow an extensive angle of vision facilitating the capture of their prey and the detection of their preda-tors. Therefore, their capacity to catch prey depends mainly on characteristics of their prey. All prey species of S. capensis show similar behavioral traits (i.e., swim-ming organisms that move between rocky intertidal and subtidal zones) and S. capensis waits to capture them. The specialized feeding strategy of S. capensis may be a consequence of the availability of prey species moving in the vicinity of the refuges of this fish.
The feeding strategy index, as defined by Amund-sen et al. (1996), has been used successfully for active predators like sharks (e.g., Lucifora et al., 2000; Vogler et al. 2003). However, this index does not integrate either predator behavior or the availability of prey in a given environment. Therefore, the criteria used to differentiate specialist from generalist predators must be clarified. According to the feeding strategy index of Amundsen et al. (1996), S. capensis is a specialized predator (preying mainly on crustaceans, although it consumes some prey species, and other rare prey species in almost all locations analyzed). In reality, S. capensis is an ambush predator that does not actively search for its prey. Because this fish waits in rocky refuges for mobile prey, the probability of it encountering prey depends, to a large extent, on prey abundances, prey distributions, and prey behaviors.
Barrientos et al.: Differences in the feeding patterns of Sebastes capensis 497
Acknowledgments
The authors thank to Carlos Jara for the collaboration in the identification of crustaceans prey. This study was realized under the sponsorship of D.I.D. (Dirección de Investigación y Desarrollo) of the Universidad Austral de Chile (Project D-2003-09). M.T.G. was supported by a CONICYT fellowship of the Chilean Government.
Literature cited
Abrams, P. 2000. The evolution of predator-prey interactions: theory
and evidence. Annu. Rev. Ecol. Syst. 3179−105. Alvarado, V.
1985. Trophic and adaptative morphological aspect of red rockfish Sebastes capensis (Gmelin, 1788). M.S. thesis, 70 p. Facultad de Ciencias, Universidad Austral de Chile, Valdivia, Chile. [In Spanish.]
Amundsen, P., H. Gabler, and F. Staldvik. 1996. A new approach to graphical analysis of feeding
strategy from stomach contents data-modification of the Costello (1990) method. J. Fish Biol. 48:607−614.
Arntz, W. E., M. Gorny, R. Soto, M. Lardies, M. Retamal, and I. Whertmann.
1999. Species composition and distribution of decapod crustaceans in the waters off Patagonia and Tierra del Fuego, South America. Sci. Mar. 63 (suppl. 1): 303−314.
Balech, E. 1954. Zoogeographic division of the South American
coast. Rev. Biol. Mar. (Chile) 4: 184−195. [In Spanish.] Brattström, H., and A. Johanssen.
1983. Ecological and regional zoogeography of the marine benthic fauna of Chile. Sarsia 68:289−339.
Briggs, J. C. 1995. Global biogeography. Developments in palaeon-
tology and stratigraphy, 475 p. Elsevier Science B.V., Amsterdam, Netherlands.
Camus, P. 2001. Marine biogeography of continental Chile. Rev.
Chil. Hist. Nat. 74:587−617. [In Spanish.] Chen, L.
1971. Systematic, variation, distribution and biology of rockfishes of the subgenus Sebastomus (Pisces Scorpae-nidae, Sebastes). Bull. Scripps Inst. Oceanogr. Calif. 18:115.
Cortés, E. 1997. A critical review of methods of studying fish feed-
ing based on analysis of stomach contents: application to elasmobranches fishes. Can. J. Fish. Aquat. Sci. 54:726−738.
Digby, P. G., and R. A. Kempton. 1987. Multivariate analysis of ecological communities,
206 p. Chapman and Hall, New York, NY. Duarte, W., F. Jara, and C. Moreno.
1980. Energetic contents of some benthonic invertebrates from the Chilean coast and annual f luctuation in Myti-lus chilensis Hupe 1854. Bol. Inst. Ocean. Sao Paulo (Brasil). 29:157−162. [In Spanish.]
González, P., and C. Oyarzún. 2003. Diet of Chilean sandperch, Pinguipes chilensis
(Perciformes, Pinguipidae) in southern Chile. J. Appl. Ichthyol. 19:371−375.
Hixon, M. A., and J. P. Beets. 1993. Predation, prey refuges, and the structure of coral-
reef fish assemblages. Ecol. Monogr. 63:77−101. Hyslop, E.
1980. Stomach contents analysis: a review of methods and their application. J. Fish Biol. 17:411−429.
Kong, I. 1985. Review of the Chilean species of Sebastes (Osteich-
thyes, Scorpaeniformes, Scorpaenidae). Estud. Oceanol. 4:21–75. [In Spanish.]
Lancellotti, D. A., and J. A. Vásquez. 2000. Biogeographical patterns of benthic macro-
invertebrates in the Southeastern Pacific littoral. J. Biogeogr. 26:1001−1006.
Lucifora, L. O., J. L. Valero, C. S. Bremen, and M. L. Lasta. 2000. Feeding habits and prey selection by the skate
Dipturus chilensis (Elasmobranchii: Rajidae) from the southwestern Atlantic. J. Mar. Biol. Assoc. UK. 80: 953−954.
Moreno, C. A. 1981. Development of the studies about trophic rela-
tionship in fishes from Antarctic and Sub-Antarctic rocky sub-littoral from Chile. Medio Ambiente (Chile). 5:161−174. [In Spanish.]
Moreno, C. A., W. E. Duarte, and J. H. Zamorano. 1979. Latitudinal variation of number of fish species
from the rocky sub-littoral: an ecological approach. Arch. Biol. Med. Experiment. (Chile). 12:169−178. [In Spanish.]
Moreno, C. A., and J. H. Zamorano. 1980. Food selectivity in two benthic fish species (Mugi-
loides chilensis and Calliclinus geniguttatus). Bol. Inst. Oceanogr, Sao Paulo (Brasil). 29:245−249. [In Spanish.]
Ojeda, P., and J. Fariña. 1996. Temporal variations in the abundance, activity,
and trophic patterns of the rockfish, Sebastes capensis, off the central Chilean coast. Rev. Chil. Hist. Nat. 69:205−211.
Pequeño, G. 2000. Delimitations and biogeographical relationships
of the Southeastern Pacific fishes. Estud. Oceanol. 19:53−76. [In Spanish.]
Pinkas, L., M. Oliphant, and Y. Iverson. 1971. Food habits of albacore, bluefish tuna and bonito
in California waters. Calif. Dep. Fish. and Game. 152:1−105.
Retamal, M. A. 1981. Catalogue of the decapods crustacean of Chile.
Gayana Zool. 44:1−110. [In Spanish.] Reznick, D. N., F. H. Shaw, F. H. Rodd, and R. G. Shaw.
1997. Evaluation of the rate of evolution in natural populations of guppies (Poecilia reticulata). Science 275:1934−1937.
Silva, M., and J. Stuardo. 1985. Feeding and trophic relationship between demersal
fishes and the benthos of Bahía Coliumo (Concepción, Chile). Gayana Zool. 49:77−102. [In Spanish.]
Vogler, R., A. C. Milessi, and R. A. Quiñones. 2003. Trophic ecology of Squantina Guggenheim on the
continental shelf off Uruguay and northern Argentina. J. Fish Biol. 62:1254−1267.
Zar, J. 1999. Biostatistical analysis. 4th ed., 663 p. Prentice-
Hall Inc., Englewood Cliffs, NJ.