habitat utilization of cape clawless otters aony.x capensis
224
HABITAT UTILIZATION OF CAPE CLAWLESS OTTERS AONY.X CAPENSIS , by MICHAEL JOHN SOMERS Dissertation presented for the degree of Doctor of Philosophy at the University of Stellenbosch. Promoter: Professor J.A.J. Nel Co-promoter: Professor H. Kruuk October 2001
-
Upload
khangminh22 -
Category
Documents
-
view
4 -
download
0
Transcript of habitat utilization of cape clawless otters aony.x capensis

HABITAT UTILIZATION OF CAPE CLAWLESS OTTERS AONY.X CAPENSIS ,
by
MICHAEL JOHN SOMERS
Dissertation presented for the degree ofDoctor of Philosophy
at the University of Stellenbosch.
Promoter: Professor J.A.J. NelCo-promoter: Professor H. Kruuk
October 2001

ii
DECLARATION
I, the undersigned, hereby declare that the work contained inthis dissertation is my own original work and that I have notpreviously in its entirety or in part submitted it at anyuniversity for a degree.
Stellenbosch University http://scholar.sun.ac.za
iii
HABITAT UTILIZATION OF CAPE CLAWLESS OTTERS AONYX CAPENSIS
by
M.J. Somers
SUMMARY
This study tested several hypotheses regarding various aspects ofhabitat use by Cape clawless otters Aonyx capensis, in varioushabitats. The hypotheses, namely that A. capensis do not selectany prey types, prey sizes or habitat type were tested. Habitattype was investigated at a scale that enabled separating theeffects of types of riparian vegetation, geomorphology andanthropogenic influences. Aspects of the resource dispersionhypothesis (RDH) and optimal foraging theory were tested. This wasdone in both the marine and freshwater environments.
The annual and seasonal diets of A. capensis in the Olifantsand Eerste Rivers, Western Cape Province, are described. Crabswere found to be the main prey and fish the second most importantprey of A. capensis in both the rivers during all seasons. Thepercentage occurrence of prey of A. capensis in both rivers,showed an increase in the amount of crab in summer and acorresponding decrease in the number of fish eaten. The seasonalfluctuation in crabs and fish found in the spraints (faeces),corresponded with the expected frequencies as determined fromtrapping.
Seven A. capensis were caught in the two rivers and radio-tracked between 1993 and 1995. Total home range length varied from4.9 to 54.1 km and core home range length from 0.2 to 9.8 km.Total area of water used ranged from 4.9 to 1062.5 ha and corearea used from 1.1 to 138.9 ha. As predicted using the RDH totalhome range length was correlated to mean reed bed nearestneighbour distance. The otters were typically active from dawn for2.6 h and moved a mean of 0.9 km. They were also typically active
Stellenbosch University http://scholar.sun.ac.za

iv
from sunset for a mean of 2.3 h moving a mean of 1.3 km. Theywere found to select for areas with boulders and/or reed beds.
Aonyx capensis were found to be mainly solitary in all thehabitats. The pattern of female home ranges was suggestive ofterritoriality. The males, however, had overlapping home ranges,both with other males and females.
From spraint analysis and direct observations, the seasonaldiet and foraging behaviour of A. capensis feeding in the surfzone in False Bay, Western Cape Province, were determined. Themost common prey species during all seasons was Cape rock crabPlagusia chabrus. Diversity of prey was lowest in winter,increasing through the seasons from spring to autumn. Foragingbehaviour data support the optimal breathing hypothesis, whichpredicts that both surface and dive times should increase fordives of greater depths. However, diving efficiency did notdecrease with increasing depth, nor did percentage time at thesurface increase with increasing depth. These results arecontrary to the optimal breathing hypothesis.
How A. capensis use their habitat in the presence ofpotential competitors spotted-necked otters Lutra maculicollis
and water mongooses Atilax paludinosus was also determined byinvestigating their trophic overlap during enforced cohabitationin a relatively small range during drought conditions.
The analysis of trophic overlap showed that even duringenforced cohabitation in a relatively small range during droughtconditions, there was separation of diets of A. capensis, L.
maculicollis and A. paludinosus.
These results and their implications for conservationmanagement are discussed.
Stellenbosch University http://scholar.sun.ac.za
v
OPSOMMING
Hierdie studie het 'n aantal hipoteses oor verskeie aspekte vanhabitat gebruik deur die Groototter Aonyx capensis, inverskillende habitatte, getoets. Die nul hipotese, nl. dat A.
capensis nie vir enige prooitipe, prooigrootte of habitat-tipeselekteer nie, is getoets. Habitat tipe is ondersoek teen 'nskaalgrootte wat dit moontlik gemaak het om die effekte van tipesoewer plantegroei, geomorfologie en antropogeniese invloede vanmekaar te skei. Aspekte van die hulpbron verspreiding hipotese(HVH) en optimale kossoek gedrag, is in beide die varswater enseewater omgewing getoets.
Die jaarlikse en seiseonale diëte van A. capens~s in dieOlifants and Eerste Riviere in die Wes-Kaap Provinsie, wordbeskryf. Daar is gevind dat krappe die hoof prooi en vis dietweede mees belangrike prooi van A. capensis in beide riviere,gedurende al die seisoene, was. Die persentasie A. capensis prooiteenwoordig in beide riviere het 'n toename in krap getalle in diesomer en 'n ooreenstemmende afname in die hoeveelheid vis watgeeet word getoon. Die seisoenale verandering van krap en vis watin die keutels (mis) voorkom, het ooreengestem met die verwagtefrekwensies soos bepaal deur fangste in fuike.
Sewe A. capensis is in die twee riviere gevang en tussen 1993en 1995 d.m.v. radiosenders gevolg. Die totale tuisgebied lengtehet van 4.9 tot 54.1 km, en die kern tuisgebied lengte van 0.2 tot9.8 km, gewissel. Die totale area water wat gebruik is het van 4.9tot 1062.5 ha, en kerngebiede van 1.1 tot 138.9 ha gewissel. Soosvoorspel deur gebruik van die HVH, was die totale tuisgebiedlengte gekorreleer met die gemiddelde rietbedding naaste-buurmananalise afstand.
Die otters was tipies aktief vanaf sonsopkoms vir 2.6 ure enhet dan 'n gemiddeld van 0.9 km beweeg. Hulle was ook tipiesaktief vanaf sonsondergang vir 'n gemiddeld van 2.3 ure en het dangemiddeld 1.3 km beweeg. Daar is gevind dat hulle selekteer virareas met rotse en areas met rietbeddings. Dit is ook gevind dat
Stellenbosch University http://scholar.sun.ac.za

vi
A. capens~s in alle habitatte hoofsaaklik alleenlopend is. Diewyfies se tuisgebied-patroon het op territorialiteit gedui, terwyldie manlike diere se tuisgebiede oorvleuel het met beide dié vanwyfies, en met dié van ander mannetjies.
Die seisoenale dieet en kossoekgedrag van A. capensis wat indie brander sone van Valsbaai, Wes-Kaap Provinsie, voed, is deurkeutel analise en direkte waarneming bepaal. Die mees algemeneprooi spesie gedurende al die seisoene was die Kaapse rotskrapPlagusia chabrus. Prooi diversiteit was die laagste in winter enhet toegeneem vanaf lente tot herfs. Kossoekgedrag gegewensondersteun die optimale asemhalings hipotese, wat voorspel datbeide oppervlak- en duik tye toeneem met dieper duike. Duikeffektiwiteit het egter nie afgeneem met toenemende diepte nie,en persentasie tyd op die oppervlakte het ook nie toegeneem mettoenemende diepte nie. Dit is dus in teenstelling met dieoptimale asemhalings hipotese.
Hoe A. capensis hul habitat in die teenwoordigheid vanpotesieele kompiteerders nl. Klein otters Lutra maculicollis, enWater muishonde Atilax paludinosus gebruik, is ook bepaal. Dit isgedoen deur hul trofiese oorvleueling gedurende noodgedwongesaamleef, veroorsaak deur droogte kondisies in 'n relatiewe kleintuisgebied, te ondersoek.
Die resultate van die trofiese oorvleueling analise het getoondat selfs gedurende noodgedwonge saamleef gedurende droogtetoestande in 'n relatiewe klein gebied, daar 'n verskil was in diediëte van A. capensis, L. maculicollis and A. paludinosus.
Hierdie resultate en hul implikasies vir bewaringsbestuur wordbespreek.
Stellenbosch University http://scholar.sun.ac.za

vii
ACKNOWLEDGEMENTSSpecial thanks goes to my supervisors Prof. J.A.J. Nel and Prof.H. Kruuk for all their input into the project.
Thanks goes to WWF South Africa, Foundation for ResearchDevelopment and the University of Stellenbosch for funding. MazdaWildlife Fund is thanked for providing a vehicle.
The staff of Cape Nature Conservation are thanked forallowing me access to their property at Jonkershoek and forinterest shown in my work. The many farmers are thanked forallowing me to work on their properties and providingaccommodation. Special thanks goes to Ms. H. Compion for allowingme to stay on her farm at subsidised rates.
Mr. J. Visser is thanked for the loan of two traps. Mr. D.Brink, is thanked for providing trout used as bait in the ottertraps.
Prof. J.C. Morgenthal, Dr. H. de Kock and Dr. D.M. Barry arethanked for implanting the radio transmitters into the otters.
Dr. D. Rowe-Rowe is thanked for the interest andencouragement shown in the project.
Dr. P. Skelton is thanked for identifying fishes and forproviding fish scales.
Mr. M. Purves and Ms. T. Mudge are thanked for helping withspraint analysis as used in Chapter 7.
Prof. J.A.J. Nel, Prof. H. Kruuk, Dr. P. Chanin, Ms. M.Walters, Ms. B. Elliot, Dr. L. Durbin, Dr. A.H. Maddock and Dr.D.T. Rowe-Rowe provided useful comments on various parts of thethesis.
My family and Michele Walters are thanked for their continuedpatience and encouragement.
Stellenbosch University http://scholar.sun.ac.za
viii
CONTENTS
Chapter 1 Introduction
Background 1Taxonomy and phylogeny of Aonyx capensis 6
Distribution and status of Aonyx capensis 7Previously published work on Aonyx capensis 8Objectives and layout of the study 10References 12
Chapter 2 : Diet and prey availability of Cape clawless otters(Aonyx capensis) in two South African rivers
Introduction 21Materials and Methods 23Results 27Discussion 41References 47
Chapter 3 : Variations in, and factors affecting, home rangeparameters of individual Cape clawless otters (Aonyx capensis)
Introduction 55Materials and Methods 58Resul ts 61Discussion 77References 88
Stellenbosch University http://scholar.sun.ac.za

ix
Chapter 4 : Habitat selection by Cape clawless (Aonyx capensis)
otters in rivers
Introduction 96
Materials and Methods 99
Results 107
Discussion 112
References 116
Chapter 5 : Seasonal variation in the diet of Cape clawless
otters (Aonyx capensis) in a marine habitat.
Introduction 123
Materials and Methods 125
Results 128
Discussion 138
References 144
Chapter 6 : Foraging behaviour of Cape clawless otters (Aonyx
capensis) in a marine habitat.
Introduction 148
Materials and Methods 151
Resul ts 154
Discussion 163
References 172
Stellenbosch University http://scholar.sun.ac.za

x
Chapter 7 : Trophic overlap between three syntopic semi-aquaticcarnivores: Cape clawless otter (Aonyx capensis), spotted-neckedotter (Lutra maculicollis), and water mongoose (Atilax
pal udinosus) .
Introduction 177Materials and Methods 179Results 182Discussion 182References 191
Chapter 8 : Conclusion and conservation managementconsiderations 194
Stellenbosch University http://scholar.sun.ac.za

xi
List of Tables
Table 2.1. Prey items recorded in 824 Cape clawless otter Aonyx
capensis spraints collected from the Olifants River fromApril 1993 to September 1996, as percentage occurrence,relative frequency occurrence, percentage of spraintsdominated by a prey and overall rank of importance 28
Table 2.2 Prey items recorded in 362 Cape clawless otter Aonyx
capens~s spraints collected from the Eerste River fromFebruary 1993 to September 1996, as percentage occurrence,relative frequency occurrence, percentage of spraintsdominated by a prey and overall rank of importance 29
Table 2.3. The size distribution of crabs Potamonautes perlatus
in spraints of Cape clawless otters Aonyx capensis, from theOlifants River, by season 38
Table 2.4. The size distribution of crabs Potamonautes perlatus
represented in spraints of Aonyx capensis, from the EersteRiver, by season 39
Table 2.5. The mean number of crabs (Potamonautes perlatus) andfish (Tilapia sparrmanii) caught in traps during all seasonsin the Olifants River and Eerste River, Western CapeProvince, South Africa. (n = 30 trap nights per season perriver) 40
Table 3.1. Radio-tracking of Cape clawless otters Aonyx capensis
in the (a) Eerste and (b) Olifants Rivers, Western CapeProvince, South Africa. M = male; F = female 62
Stellenbosch University http://scholar.sun.ac.za

xii
Table 3.2. Various measures of horne range size of Capeclawless otters Aonyx capensis in the (a) Eerste and (b)Olifants Rivers, Western Cape Province, SouthAfrica 66
Table 3.3. The spatial overlap of linear horne ranges (total andcore) between individual Cape clawless otters Aonyx capensis
in the (a) Eerste and (b) Olifants Rivers, Western CapeProvince, South Africa 70
Table 3.4. The number of reed beds and mean reed bed nearestneighbour distance in the total and core horne range areas ofindividual Cape clawless otters Aonyx capensis in the (a)Eerste River and (b) Olifants River, Western Cape Province,South Africa 73
Table 3.5. Spearman rank correlations between various measures ofhorne range size and body weight, preferred habitat (reed bed)patch number and dispersal (mean nearest neighbour distancebetween reed beds) for seven Cape clawless otters Aonyx
capensi s 74
Table 3.6. Mean distances moved and activity periods ofindividual Cape clawless otters Aonyx capensis duringcomplete tracking sessions in the (a) Eerste and (b) OlifantsRivers, Western Cape Province, South Africa. Means are given± standard error. Ranges are given in parenthesis 76
Table 3.7. Movement parameters of individual Cape clawless ottersAonyx capensis otters in the (a) Eerste and (b) OlifantsRivers, Western Cape Province, South Africa. Means are given± standard error. Ranges are given in parenthesis 78
Stellenbosch University http://scholar.sun.ac.za

xiii
Table 3.8. Spearman rank correlations between variousmeasures of home range size and movement parameters of sevenCape clawless otters Aonyx capensis 79
Table 4.1. Radio-tracking effort on Cape clawless otters Aonyx
capensis in (a) the Eerste and (b) Olifants Rivers, WesternCape Province, South Africa. M = male; F = female 102
Table 4.2. The habitat variables used for analysis of habitatselection by Cape clawless otters Aonyx capensis 104
Table 4.3. Correlation matrix of habitat variables from twoWestern Cape Rivers 108
Table 4.4. Regression statistics for relationships betweenpreference indices (a) PL, (b) PA, and habitat scores.Significant coefficients are indicated in bold 110
Table 5.1. Prey items recorded in 21 Cape clawless otter Aonyx
capensis spraints collected from False Bay during winter(June, July and August 1996), as percentage occurrence,relative frequency occurrence, and percentage of spraintsdominated by a prey 129
Table 5.2. Prey items recorded in 58 Cape clawless otter Aonyx
capensis spraints collected from False Bay during spring(September, October and November 1996), as percentageoccurrence, relative per cent occurrence, and percentage ofspraints dominated by a prey 130
Table 5.3. Prey items recorded in 83 Cape clawless otter Aonyx
capensis spraints collected from False Bay during summer(December 1995, January and February 1996), as percentageoccurrence, per cent frequency occurrence, and percentage ofspraints dominated by a prey 131
Stellenbosch University http://scholar.sun.ac.za
xiv
Table 5.4. Prey items recorded in 42 Cape clawless otter Aonyx
capensis spraints collected from False Bay during autumn(March, April and May 1996), as percentage occurrence, percent frequency occurrence, and percentage of spraintsdominated by a prey 132
Table 5.5. Relative percentage occurrence data and rank (inparenthesis) of most important prey categories of Capeclawless otters Aonyx capensis for this study and variousother localities 134
Table 5.6. Sizes of crustaceans and fish found in spraints ofCape clawless otters Aonyx capensis in False Bay during thevarious seasons. Measurements (mm) are given ± SE with samplesize in parenthesis. For fish total lengths are given. Forcrabs and Jasus lalandii maximum carapace widths and lengths,respectively, are given 135
Table 5.7. The size distribution of fish eaten by Cape clawlessotters Aonyx capensis in False Bay, Western Cape Province,South Africa. The figures represent the number of fish ineach size category 137
Table 5.8. The observed versus the expected percentage ofindividual species of fish found in the spraints of Capeclawless otters Aonyx capensis in False Bay, Western CapeProvince, South Africa 139
Table 5.9. Seasonal diversity of prey species recorded in Capeclawless otter Aonyx capensis spraints collected from FalseBay, Western Cape Province, South Africa 140
Table 6.1. Diving behaviour of Cape clawless otters Aonyx
capensis at various depths: n number of dives; UDT =unsuccessful dive time; SDT successful dive time; PTprocessing time; RT = recovery time 157
Stellenbosch University http://scholar.sun.ac.za
xv
Table 6.2. Area per depth-class within 40 m from the shore ofCape clawless otters Aonyx capensis, and number of dives ineach 161
Table 6.3. Foraging efficiency of Cape clawless otters Aonyx
capensis in various depths 162
Table 6.4. Frequency occurrence (%) of prey sizes, as determinedby direct observations, of Cape clawless otters Aonyx
capensis at various depths in False Bay, South Africa .....165
Table 7.1. Prey items recorded in 66 Aonyx capensis spraintscollected from the Bushmans River from September to November1993, as percentage occurrence, relative frequencyoccurrence, and percentage of spraints dominated by aprey 183
Table 7.2. Prey items recorded in 79 Lutra maculicollis spraintscollected from the Bushmans River from September to November1993, as percentage occurrence, relative frequencyoccurrence, and percentage of spraints dominated by aprey 184
Table 7.3. Prey items recorded in 31 Atilax paludinosus scatscollected from the Bushrnans River from September to November,as percentage occurrence, relative frequency occurrence, andpercentage of scats dominated by a prey 185
Table 7.4. The size of crabs eaten by Aonyx capens~s, Lutra
maculicollis and Atilax paludinosus in the BushmansRiver 186
Table 7.5. The size distribution of crabs Potamonautes perlatus
eaten by Aonyx capensis, Lutra maculicollis, Atilax
paludinosus in the Bushmans River 187
Stellenbosch University http://scholar.sun.ac.za
xvi
Table 7.6. The size of fish eaten by Aonyx capensis, Lutra
maculicollis and Atilax paludinosus in the BushmansRiver 188
List of Figures
Fig. 2.1. The percentage frequency size distribution of crabsPotamonautes perlatus found in the spraints of Cape clawlessotters Aonyx capens~s in the Olifants River and EersteRiver 31
Fig. 2.2. The percentage occurrence of prey items found in thespraints of Cape clawless otters Aonyx capensis in theOlifants River, from April 1993 to September 1996 for thefour seasons 33
Fig. 2.3. The percentage occurrence of prey items found in thespraints of Cape clawless otters Aonyx capensis in the EersteRiver, from February 1993 to September 1996 for the fourseasons 34
Fig. 2.4. The mean number (± SE) of crabs (represented by halfthe number of eye stalks) found per 10 g dry weight of Capeclawless otter Aonyx capensis spraint collected from theEerste River (n = 50 per season) and Olifants River (n = 50per season) during the four seasons 36
Fig. 2.5. The mean number (± SE) of fish (represented by half thenumber of eye lenses) found per 10 g dry weight of Capeclawless otter Aonyx capensis spraint collected from theEerste River (n = 50 per season) and Olifants River (n = 50per season) during the four seasons 37
Stellenbosch University http://scholar.sun.ac.za

xvii
Fig. 3.1. Cumulative home range length against time radio-tracking active Cape clawless Aonyx capensis otters in theEerste River 63
Fig. 3.2. Cumulative home range length against time radio-tracking active Cape clawless otters Aonyx capensis in theOlifants River 64
Fig. 3.3. Total home range, core range and home range overlap ofthree radio-tracked Cape clawless otters Aonyx capensis inthe Eerste River, Western Cape Province, South Africa 68
Fig. 3.4. Total home range, core range and home range overlap offour radio-tracked Cape clawless otters Aonyx capensis in theOlifants River, Western Cape Province, South Africa 69
Fig. 3.5. The percentage frequency distribution of group sizeclasses of Cape clawless otters Aonyx capensis seen in theOlifants (n = 13) and Eerste Rivers (n = 2), Western CapeProvince, South Africa, between July 1993 and August 1995 ..72
Fig. 6.1. The percentage frequency distribution of group sizeclasses of Cape clawless otters Aonyx capensis seen in FalseBay from 26 April 1994 to 2 October 1996 (n = 38sightings) 156
Fig. 6.2. Relationship between recovery times and precedingunsuccessful dive times of Cape clawless otters Aonyx
capensis in False Bay, South Africa. (a) 0.0-0.5 m, (b) 0.5-1.5 m, (c) 1.5-2.5 m, (d) 2.5-3.5 m....••...••..•.•.••...• 159
Fig. 6.3. The percentage of dives of Cape clawless otters Aonyx
capensis corrected for the percentage of the available area(within 40 m from the shore) at various depths. (The depthfigures are the medians of the depth ranges, 0.25 = 0.0-0.5m, 1 = 0.5-1.5 m, 2 = 1.5-2.5 m, 3 = 2.5-3.5 m) 160
Stellenbosch University http://scholar.sun.ac.za

xviii
Fig. 6.4. Frequency of occurrence of food items obtained by Capeclawless otters Aonyx capensis at different depths in FalseBay, Western Cape Province, South Africa 164
Stellenbosch University http://scholar.sun.ac.za

xix
"The rivers are our brothers. They quench our thirst. They carryour canoes and feed our children. So you must give the rivers the
kindness you would give any brother"
Chief Seattle, 1852
Stellenbosch University http://scholar.sun.ac.za

1
CHAPTER 1
INTRODUCTION
BACKGROUNDWhen an animal harvests food, it has to make decisions. Forexample where to hunt for food, which kinds of prey to eat, whento move and how far to move (Crawley & Krebs 1992). The optimalforaging theory (OFT), first proposed by Emlen (1966) andMacArthur & Pianka (1966), states that foraging strategies mayinvolve decisions that optimise food intake per unit effort or ofsome other measure of foraging efficiency (Emlen 1966; MacArthur& Pianka 1966; Schoener 1971; Krebs & Kacelnik 1991; Perry &Pianka 1997).
Optimality models have three main components: the currency,the constraints, and the decision variable (Krebs & Kacelnik1991). In the case of diving organisms, the currencies couldinclude maximising the rate of energy intake, maximising the rateof oxygen intake, minimising the risk of predation, or acombination of these. Constraints and variables could be: traveltime (duration of time taken to get to the bottom), bottom orsearch time (duration of time searching on the bottom),unsuccessful dive time (travel and bottom time of an unsuccessfuldive), successful dive time (travel and bottom time of asuccessful dive), recovery time (duration of time after surfacingfrom an unsuccessful dive to the start of the next dive),processing time (duration of time after surfacing from ansuccessful dive to the start of the next dive), hunting success(HS: % of dives yielding prey), % time at surface, time precedingeach catch, success or failure (capturing or not capturing prey)and whether to eat or reject a small prey. Owing to loss ofenergy in the water (Kruuk et al. 1997) it would be expected thatotters would always maximise the net rate of energy gain.
Stellenbosch University http://scholar.sun.ac.za

2
Cape clawless otters Aonyx capensis exploit a variety ofaquatic habitats, including marine, estuarine, riparian, mangroveand lacustrine (see below for a discussion on their distribution)and are primarily crab eaters (Rowe-Rowe & Somers 1998). Tounderstand how A. capensis use their habitats and in order to makeconservation management decisions regarding the otters, it isnecessary to have baseline information on the feeding ecology ofthe species. Diet of A. capensis using spraints analysis has beendetermined (freshwater habitats: Turnbull-Kemp (1960); Rowe-Rowe(1975, 1977a, 1978); Donnelly & Grobler (1976); Kruuk &Goudswaard (1990); Butler (1994); Butler & du Toit (1994);Ligthart et al. (1994); Purves et al. (1994); Carugati (1995);Somers (1996); Perrin & Carugati (2000a); marine habitats: vander Zee (1979, 1981); Arden-Clarke (1983, 1986) and Verwoerd(1987)), but no-one has attempted to relate it to relative preyabundance. As food availability has a powerful influence on animalsin both the determination of habitable areas and the numbers ofindividuals which these areas can support (Krebs 1985), therelative densities of the otters' main prey were determined in thepresent study. Also as only Rowe-Rowe (1977a) and Purves et al.
(1994) provide some seasonal data, this study provides moredetailed seasonal data for A. capensis, living in both marine andfreshwater environments. The above studies on the diet of A.
capens~s have shown A. capensis to eat a variety of prey both interms of size and type. Optimal foraging theory can be used toaccount for the types and sizes of prey items taken by predators(Krebs & Kacelnik 1991). One possible hypothesis to explain whyseveral types of prey are eaten is that the times taken to searchfor the most profitable sizes influence the choice. If it takes along time to find a profitable fish, the otter might be able toobtain a higher overall rate of intake by eating some of the lessprofitable crabs. The same applies to sizes of prey eaten.
An extension of the OFT is the marginal value theorem (MVT)(Charnov 1976), which, in brief, states that an animal foragingfor food in patches spends much of its time travelling betweenpatches, or searching for and handling food within patches. As a
Stellenbosch University http://scholar.sun.ac.za
3
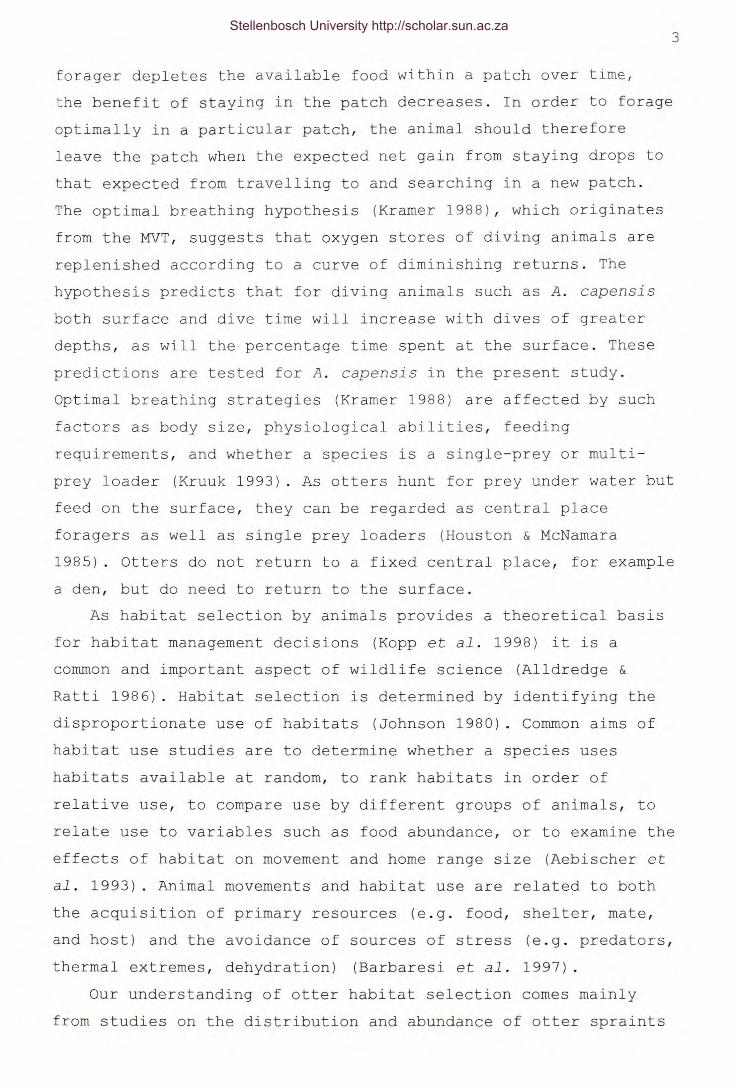
forager depletes the available food within a patch over time,the benefit of staying in the patch decreases. In order to forageoptimally in a particular patch, the animal should thereforeleave the patch when the expected net gain from staying drops tothat expected from travelling to and searching in a new patch.The optimal breathing hypothesis (Kramer 1988), which originatesfrom the MVT, suggests that oxygen stores of diving animals arereplenished according to a curve of diminishing returns. Thehypothesis predicts that for diving animals such as A. capens~s
both surface and dive time will increase with dives of greaterdepths, as will the percentage time spent at the surface. Thesepredictions are tested for A. capensis in the present study.Optimal breathing strategies (Kramer 1988) are affected by suchfactors as body size, physiological abilities, feedingrequirements, and whether a species is a single-prey or multi-prey loader (Kruuk 1993). As otters hunt for prey under water butfeed on the surface, they can be regarded as central placeforagers as well as single prey loaders (Houston & McNamara1985). Otters do not return to a fixed central place, for examplea den, but do need to return to the surface.
As habitat selection by animals provides a theoretical basisfor habitat management decisions (Kopp et al. 1998) it is acommon and important aspect of wildlife science (Alldredge &Ratti 1986). Habitat selection is determined by identifying thedisproportionate use of habitats (Johnson 1980). Common aims ofhabitat use studies are to determine whether a species useshabitats available at random, to rank habitats in order ofrelative use, to compare use by different groups of animals, torelate use to variables such as food abundance, or to examine theeffects of habitat on movement and home range size (Aebischer etal. 1993). Animal movements and habitat use are related to boththe acquisition of primary resources (e.g. food, shelter, mate,and host) and the avoidance of sources of stress (e.g. predators,thermal extremes, dehydration) (Barbaresi et al. 1997).
Our understanding of otter habitat selection comes mainlyfrom studies on the distribution and abundance of otter spraints
Stellenbosch University http://scholar.sun.ac.za
4
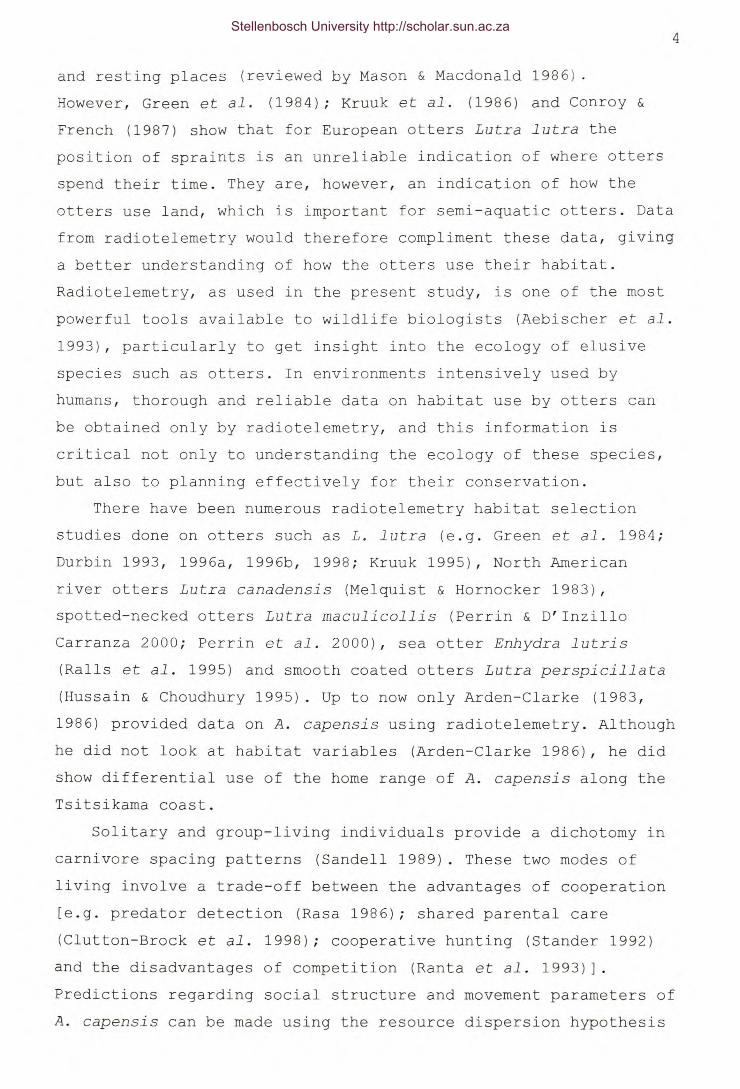
and resting places (reviewed by Mason & Macdonald 1986) .However, Green et al. (1984); Kruuk et al. (1986) and Conroy &
French (1987) show that for European otters Lutra lutra theposition of spraints is an unreliable indication of where ottersspend their time. They are, however, an indication of how theotters use land, which is important for semi-aquatic otters. Datafrom radiotelemetry would therefore compliment these data, givinga better understanding of how the otters use their habitat.Radiotelemetry, as used in the present study, is one of the mostpowerful tools available to wildlife biologists (Aebischer et al.
1993), particularly to get insight into the ecology of elusivespecies such as otters. In environments intensively used byhumans, thorough and reliable data on habitat use by otters canbe obtained only by radiotelemetry, and this information iscritical not only to understanding the ecology of these species,but also to planning effectively for their conservation.
There have been numerous radiotelemetry habitat selectionstudies done on otters such as L. lutra (e.g. Green et al. 1984;
Durbin 1993, 1996a, 1996b, 1998; Kruuk 1995), North Americanriver otters Lutra canadensis (Melquist & Hornocker 1983),spotted-necked otters Lutra maculicollis (Perrin & D'InzilloCarranza 2000; Perrin et al. 2000), sea otter Enhydra lutris
(Ralls et al. 1995) and smooth coated otters Lutra perspicillata
(Hussain & Choudhury 1995). Up to now only Arden-Clarke (1983,1986) provided data on A. capensis using radiotelemetry. Althoughhe did not look at habitat variables (Arden-Clarke 1986), he didshow differential use of the home range of A. capensis along theTsitsikama coast.
Solitary and group-living individuals provide a dichotomy incarnivore spacing patterns (Sandell 1989). These two modes ofliving involve a trade-off between the advantages of cooperation[e.g. predator detection (Rasa 1986); shared parental care(Clutton-Brock et al. 1998); cooperative hunting (Stander 1992)and the disadvantages of competition (Ranta et al. 1993)].Predictions regarding social structure and movement parameters ofA. capensis can be made using the resource dispersion hypothesis
Stellenbosch University http://scholar.sun.ac.za

5
(RDH) (Macdonald 1983). The RDH (Macdonald 1983; Kruuk &Macdonald 1985; Carr & Macdonald 1986) tries to explain, withinthe limits of all constraints, interspecific and intraspecificvariation in territories and group sizes in ecological terms. TheRDH predicts that spatial organisation will be determined bydispersion of resources (particularly food) and that group sizewill be determined by the richness of these patches when animalsoccupy the smallest economically defendable area (Macdonald 1983;Kruuk & Macdonald 1985; Carr & Macdonald 1986). In addition to thedispersion and richness of resources, the rate of resource renewalafter depletion may also influence sociality, with high recoveryrates favouring group-living (Waser 1981). There is a distinctionbetween social groups (Gittleman 1989) and "spatial groups", wherethere is no cooperation, but the cost of evicting additionalanimals, outweighs that of tolerating them (Macdonald & Carr 1989).The data of Arden-Clarke (1983, 1986) indicates that A. capensis
do not conform to the standard mustelid spacing patterns (Powell1979), which is to have intrasexual territories where males areterritorial against males, females against females (perhapsincluding most recent offspring), but where there is extensiveoverlap between sexes with male territories being larger thanthose of females (Powell 1979). It appears that A. capensis
mostly forage alone but occur in groups of up to five (Rowe-Rowe1978; Arden Clarke 1983). This was further investigated in thepresent study, which for the first time radio-tracked female A.
capensis. It was also the first time that A. capensis infreshwater habitats were radio-tracked. The RDH was used togenerate predictions regarding the otters' home range size andsocial structure.
Although intraspecific competition is common (Connell 1983),there is a paucity of studies concerning ecological separationand competition among smaller sympatric carnivores. Previous tothis study only Rowe-Rowe (1977a) had given data on the diet ofA. capensis living syntopically with L. maculicollis and watermongoose Atilax paludinosus. As competition may affect the way A.
Stellenbosch University http://scholar.sun.ac.za

6
capens~s forages these data are important in a discussion on howA. capensis exploits resources.
Many of the 13 otter species occurring worldwide are rapidlydisappearing along with the clean wetlands they inhabit (Foster-Turley et al. 1990). This may apply to otters in South Africa aswell, but little is known about their biology. Against thisbackground, this project on habitat use by A. capensis in SouthAfrica was undertaken.
TAXONOMY AND PHYLOGENY OF AONYX CAPENSIS
The classification of the species is as follows (Meester et al.
1986; Skinner & Smithers 1990):
Class:Order:Family:Subfamily:Genus:Species:
MammaliaCarnivoraMustelidaeLutrinaeAonyx (Lesson, 1827)capensis (Schinz, 1821)
The common English names for A. capens~s are African clawlessotter and Cape clawless otter (used here). The originalscientific application was Lutra capensis (Schinz, 1821).
The phylogeny and taxonomy of the Lutrinae have been reviewedby Harris (1968); van Zyll de Jong (1987); Koepfli & Wayne (1998)and Bininda-Emonds et al. (1999). The only congeneric to A.
capensis is the Congo otter Aonyx congica with a time ofdivergence estimated to be 2.6 MYBP (Bininda-Emonds et al. 1999).The small-clawed otter Amblonyx cinerea is estimated to havediverged from Aonyx 4.2 MYBP (Bininda-Emonds et al. 1999).
Only two extant genera of otters occur in Africa - Aonyx andLutra - with four species recognised: A. capensis, A. congica, L.
maculicollis and L. lutra.
Stellenbosch University http://scholar.sun.ac.za

7
DISTRIBUTION AND STATUS OF AONYXCAPENSIS
Aonyx capensis occur over most of sub-Saharan Africa (Rowe-Rowe1990, 1991; Rowe-Rowe & Somers 1998; Nel & Somers in press) indiverse habitats, for example the mangrove forests of KwaZulu-Natal Province (personal observation), the southern and easterncoast (Rowe-Rowe 1992; van der Zee 1979; Arden-Clarke 1983, 1986;Verwoerd 1987; Somers & Nel 1996; van Niekerk et al. 1998;
personal observation), salt water lakes (Lake st Lucia, KwaZulu-Natal) (Kroger & Forrest 1978), estuaries (Kosi Bay, KwaZulu-Natal) (Kyle 1981), freshwater lakes (Lake Sibaya, KwaZulu-Natal)(Tinley 1958) and the desert conditions surrounding the upperDoring River and Fish River in southern Namibia (Nel unpublisheddata). They are also the only otters occurring on offshoreislands, e.g. the Bijago archipelago of Guinea-Bissau (Nel &Somers in press). They occur in extremely arid areas «: 30 mmrainfall/annum) as long as pools of freshwater persists (Nel &Somers in press). They have been found in towns (e.g.Stellenbosch) and cities (e.g. Port Elizabeth, Cape Town)(personal observations). They sometimes occur in rivers with highpollution and eutrophication levels (Heath & Claassen 1999; Nel &Somers unpublished data) .
The occurrence of otters in specific African countries hasbeen reviewed by Nel & Somers (in press). Aonyx capensis is themost widely distributed otter species in Africa, occurring in 35countries. It is common or fairly common in 19 (but could be rarein parts of a country), and rare to very rare in 12 countries(Nel & Somers in press). The distributional range and/orpopulation size appears stable in 29 countries and declining insix (Nel & Somers in press). For most African countries thegeographical distribution and population status of otter speciesoccurring are poorly known (Nel & Somers in press) .
Aonyx capensis are listed in Appendix II of the "Conventionon International Trade in Endangered Species of Wild Fauna andFlora" (CITES). Appendix II lists species that are notnecessarily currently threatened with extinction but that may
Stellenbosch University http://scholar.sun.ac.za
8
become so unless trade is closely controlled. It also includesso-called "look-alike species", i.e. species of which thespecimens in trade look like those of species listed forconservation reasons. International trade in specimens ofAppendix II species may be authorized by the granting of anexport permit or re-export certificate while no import permit isnecessary. Permits or certificates should only be granted if therelevant authorities are satisfied that certain conditions aremet, and above all, that trade will not be detrimental to thesurvival of the species in the wild.
PREVIOUSLY PUBLISHED WORK ON AONYX CAPENSIS
General descriptions of A. capensis and their natural historyhave been given by Tayler (1970); Kingdon (1977); Chanin (1985)and Foster-Turley et al. (1995), with reviews on our knowledge ofthe species given by Rowe-Rowe (1990); Skinner & Smithers (1990);Somers (1997) and Lariviere (2001).
The feeding behaviour of A. capensis has been described byRowe-Rowe (1977b, 1977c) and Verwoerd (1987), while aspect of thediet of A. capensis in freshwater habitats have been given byTurnbull-Kemp (1960); Rowe-Rowe (1975, 1977a, 1978); Kruuk &Goudswaard (1990); Butler (1994); Butler & du Toit (1994);Ligthart et al. (1994); Purves et al. (1994); Caruga ti (1995);Butler & Marshall (1996); Somers (1996) and Perrin & Carugati(2000a), and in marine habitats by van der Zee (1979, 1981);Arden-Clarke (1983, 1986); Verwoerd (1987) and van Niekerk et al.
(1998). In these studies crustaceans were shown to be their mostimportant prey, but fish, frogs, insects, birds, reptiles,molluscs, dung (ungulate) and mammals are also taken. Boshoff(1978) speculated on there being commensalism with regards tofinding food between pied kingfishers Ceryle rudis and A.
capensis. Donnelly & Grobler (1976) speculated on them using ananvil to break open freshwater mussels Aspatharia wahlbergi.
Arden-Clarke (1983, 1986) used radio-tracking andradionuclide recovery from spraints to determine density and
Stellenbosch University http://scholar.sun.ac.za

9
range utilization in the Tsitsikama Coastal National Park.Density estimates in Tsitsikama Coastal National Park have beengiven as one otter per 1.9 - 2 km of coast (van der Zee 1979,1982; Arden-Clarke 1983, 1986). Verwoerd (1987) estimated oneotter per 2 km of coast at Betty's Bay. As the otters rarelyventured further than 100 m from shore (Arden-Clarke 1983, 1986)these densities are equivalent to one per 20, 19 and 20 ha ofwater for the three studies respectively. Estimates of density infreshwater habitats are one otter per 1.25-2.5 km (Carugati 1995;Perrin & Carugati 2000b), one otter per 3-4 km (Rowe-Rowe 1992)and one otter per 8-10 km of river (Butler & du Toit 1994).
Perrin & Carugati (2000b) analysed habitat selection by A.
capensis in a freshwater environment by comparing sites of otteractivity on land with environmental variables. They found theotters select, for time spent on land, undisturbed areas withrock cover and natural dense vegetation. Rowe-Rowe (1992) andButler & du Toit (1994) give densities of spraints and restingplaces but do not relate these to habitat variables. Rowe-Rowe(1992) discussed his findings on the distribution of otter signfor use in surveying otter populations in South Africa. Hesuggested that sign of otters could possibly be used to estimaterelative abundance in different areas, provided that limitationsof the method are taken into account.
Along the coast there is evidence that A. capens~s selectplaces of activity on land to be near thick vegetation, anabundant food resource and fresh water (van der Zee 1982; Arden-Clarke 1986; van Niekerk et al. 1998).
There is a paucity of studies on factors regarding andpromoting ecological separation among the smaller sympatriccarnivores. Prior to this study only Rowe-Rowe (1977a) hadprovided data on the trophic overlap of A. capensis, L.
maculicollis and A. paludinosus living syntopically. Purves etal. (1994) provides trophic overlap data on A. capensis and A.
paludinosus living in the Olifants River, and Kruuk & Goudswaard(1990) provide data on the diet of A. capensis and L.
maculicollis living in Lake Victoria. Butler & Marshall (1996)
Stellenbosch University http://scholar.sun.ac.za

10
include A. capensis in a crab-eating guild with African mottledeels Anguilla bengalensi and rainbow trout Oncorhynchus mykiss.
These studies show some overlap with regards to prey specieseaten but there appears to be resource partitioning with regardssize and diversity of prey eaten.
Recent distribution and status data have been provided bySomers (1997); Rowe-Rowe & Somers (1998); Lariviere (2001); Nel &Somers (in press) and Nel et al. (in press) (see above fordetails). Aonyx capensis are often killed for their skins, orbecause they kill domestic waterfowl and fish, or are caught anddrowned in fish traps or fishnets (Rowe-Rowe 1990, 1991, 1995;Butler 1994; Baranga 1995; Nel & Somers unpublished data) .
Mason & Rowe-Rowe (1992) found levels of organochlorinepesticide residues and polychlorinated biphenyls (PCBs) in otterspraints from KwaZulu-Natal to be low and unlikely to pose athreat to otter populations at the localities studied.
Aonyx capensis have been shown to make friendly yetunpredictable pets (Maxwell 1960, 1963, 1968; Eyre 1963).
The results of these various works and their implications forthe present study are discussed in the introductions anddiscussions of the relevant chapters.
Much has been published on other species of ottersparticularly L. lutra (for review see Chanin (1985); Mason &Macdonald (1986) and Kruuk (1995)).
OBJECTIVES AND LAYOUT OF THE STUDY
The main aim of this study was to establish relationships amongthe food, home range parameters, spatial organisation, habitatvariables and competitors of A. capens~s. It was aimed to make asignificant contribution to our knowledge and understanding of A.
capensis and the way in which they use the environment. Theseaims are addressed in six chapters, each with more specificobjectives. Each chapter is designed to stand alone, givingspecific introductions, descriptions of study sites, materialsand methods, discussions and references.
Stellenbosch University http://scholar.sun.ac.za

11
Chapter 2 gives the annual and seasonal diet of A.
capensis, as estimated from spraint analysis, in relation to thepresence of their main prey (crabs and fish) in two rivers. Themain questions asked were 1) What is the species composition ofthe diet of the otters? 2) How does diet vary with season? 3) Howdoes the variation of crabs and fish in the diet of the ottersrelate to availability of crabs and fish in the two rivers?
Chapter 3 provides data, from radio telemetry, on movementparameters of individual A. capensis in two rivers. The mainobjectives of this chapter were 1) To determine, for the firsttime, home range sizes and movement parameters of A. capens~s infreshwater habitats. 2) To determine spatial organisation,density and group sizes of A. capensis in freshwater habitats 3)To test the hypothesis that A. capensis in freshwater habitats donot conform to the typical mustelid spacing pattern (Powell1979), and 4) To test predictions based on a hypothesis (RDH ofMacdonald 1983) relating otter dispersion to the distribution ofresources.
Chapter 4 reports on the habitat selection by individual A.
capensis, determined by radio-tracking in the Olifants and EersteRivers. The hypothesis tested was that active otters do notselect for any particular habitat.
Chapter 5 presents data on the seasonal diet of A. capens~s
in a marine habitat, as determined by spraint analysis. Chapter 5quantifies sizes of marine crustaceans eaten by A. capensis,
using length of eyestalks found in spraints. The sizes of thefish eaten are also determined, using the diameter of otoliths inthe spraints.
The main aim of this chapter was to determine the diet of A.
capensis in a marine habitat and, for the first time, relate thisto prey availability and season.
Chapter 5 has been published as Somers (2000a). Ms. B.Elliot, Dr. D.T. Rowe-Rowe and two anonymous referees provideduseful comments which have been incorporated into the thesis.
Chapter 6 provides the first detailed quantitative data onforaging by free swimming A. capensis in a marine habitat. It was
Stellenbosch University http://scholar.sun.ac.za

-12
hypothesised that A. capensis maximise their diving successrate and that they dive at depths where they get most prey forleast effort.
Chapter 6 has been published as Somers (2000b). Dr. D.T.Rowe-Rowe, Dr. P. Chanin and an anonymous referee provided usefulcomments on the manuscript prior to publication.
Chapter 7 determines how A. capensis uses its prey source inrelation to other syntopic semi-aquatic carnivores: L.
maculicollis and A. paludinosus, under conditions of enforcedcompetition.
Chapter 7 has been published as Somers & Purves (1996). Mr.M. Purves accompanied me on the field trip and helped collect thedata. He was also responsible for the analysis of the A.
paludinosus scats, while Ms. T. Mudge analysed the L.
maculicollis spraints. Mr. M. Purves also critically read themanuscript prior to submission for publication. As the manuscriptwas accepted, with no changes, as submitted, no referees'comments were included.
REFERENCESAEBISCHER, N.J., ROBERTSON, P.A. & KENWARD, R.E. 1993. Composition
analysis of habitat use from animal radio-tracking data.Ecology 74: 1313-1325.
ALLDREDGE, J.R. & RATTI, J.T. 1986. Comparison of somestatistical techniques for analysis of resource selection.Journal of Wildlife Management 50: 157-165.
ARDEN-CLARKE, C.H.G. 1983. Population density and socialorganisation of the Cape clawless otter, Aonyx capensis
Schinz, in the Tsitsikama Coastal National Park. M.Sc.thesis, University of Pretoria, Pretoria, South Africa.
ARDEN-CLARKE, C.H.G. 1986. Population density, horne range sizeand spatial organization of the Cape clawless otter, Aonyx
capensis, in a marine habitat. Journal of Zoology, London
209: 201-211.BARANGA, J. 1995. The distribution and conservation status of
Stellenbosch University http://scholar.sun.ac.za

13
otters in Uganda. Habitat 11: 29-32.BARBARESI, S., GHERARDI, F. & VANNINI, M. 1997. Movement patterns
of river crabs (Decapoda, Potamoidea) in the field:predictable and unpredictable components. Journal of Zoology,
London 242: 247-259.BININDA-EMONDS, O.R.P., Gittleman, J.L. & PURVIS, A. 1999.
Building large trees by combining phylogenetic information: acomplete phylogeny of the extant Carnivora (Mammalia).Biological Review 74: 143-175
BOSHOFF, A.F. 1978. Possible pied kingfisher-clawless ottercommensalism. Ostrich 4: 89.
BUTLER, J.R.A. 1994. Cape clawless otter conservation and a troutriver in Zimbabwe: a case study. Oryx 28: 276-282.
BUTLER, J.R.A. & DU TOIT, J.T. 1994. Diet and conservation ofCape clawless otters in eastern Zimbabwe. South African
Journal of Wildlife Research 24: 41-47.BUTLER, J.R.A. & MARSHALL, B.E. 1996. Resource use within the
crab-eating guild of the upper Kairezi River, Zimbabwe.Journal of Tropical Ecology 12: 475-490.
CARR, R.J. & MACDONALD, D.W. 1986. The sociality of solitaryforagers: a model based on resource dispersion. Animal
Behaviour 34: 1540-1549.CARUGATI, C. 1995. Habitat, prey, and area requirements of otters
(Aonyx capensis and Lutra maculicollis) in the NatalDrakensberg. M.Sc. thesis, University of Natal.Pietermaritzburg, South Africa.
CHANIN, P. 1985. The natural history of otters. Facts on FilePublications, New York.
CHARNOV, E.L. 1976. Optimal foraging: the marginal value theorem.Theoretical Population Biology 9: 129-136.
CLUTTON-BROCK, T.H., GAYNOR, D., KANSKY, R., MACCOLL, A.D.C.,MCLLRATH, G., CHADWICK, P., BROTHERTON, P.N.M., O'RIAIN,J.M., MANSER, M. & SKINNER, J.D. 1998. Costs of cooperativebehaviour in suricates (Suricata suricatta). Proceedings of
the Royal Society of London B 265: 185-191.CONNELL, J.H. 1983. On the prevalence and relative importance of
Stellenbosch University http://scholar.sun.ac.za
14
interspecific competition: evidence from field experiments.American Naturalist 122: 661-696.
CONROY, J.W.H. & FRENCH, D.D. 1987. The use of spraints tomonitor populations of otters (Lutra lutra L.). Symposia of
the Zoological Society of London No. 58: 247-262.CRAWLEY, M.J. & KREBS, J.R. 1992. Foraging theory. In: Natural
enemies: The population biology of predators, parasites and
diseases, (ed) M.J. Crawley, Blackwell Scientificpublications, Oxford.
DONNELLY, B.G. & GROBLER, J.H. 1976. Notes on food and anvilusing behaviour by Cape clawless otter, Aonyx capensis in theRhodes Matopos National Park, Rhodesia. Arnoldia Rhod. 7: 1-8.
DURBIN, L.S. 1993. Food and Habitat Utilization of Otters (Lutra
Lutra L.) in a Riparian Habitat. D. Phil. thesis, Universityof Aberdeen, Aberdeen, Scotland.
DURBIN, L.S. 1996a. Some changes in the habitat use of free-ranging female otter Lutra lutra during breeding. Journal of
Zoology, London 240: 761-764.DURBIN, L.S. 1996b. Individual differences in spatial utilization
of a river-system by otters Lutra lutra. Acta Theriologica
41: 137-147.DURBIN, L.S. 1998. Habitat selection by five otters Lutra lutra
in rivers of northern Scotland. Journal of Zoology, London
245: 85-92.EMLEN, J.M. 1966. The role of time and energy in food preference.
American Naturalist 100: 611-617.EYRE, M. 1963. Otter in our parlour. Tafelberg, Cape Town.FOSTER-TURLEY, P., MACDONALD, S. & MASON, C. 1990. Otters: an
action plan for their conservation. IUCN/SSC Otter SpecialistGroup, Gland.
GITTLEMAN, J.L. 1989. Carnivore group living: comparative trends.In: Carnivore behaviour, ecology and evolution, (ed) G.L.Gittleman, Chapman and Hall, London.
Stellenbosch University http://scholar.sun.ac.za

15
GREEN, J., GREEN, R. & JEFFERIES, D.J. 1984. A radio-trackingsurvey of otters Lutra lutra on a Perthshire river system.Lutra 27: 85-145.
HARRIS, C. J. 1968. Otters: a study of the Recent Lutrinae.Weidenfeld and Nicolson, London.
HEATH, R.G.M. & CLAASSEN, M. 1999. An overv~ew of the pesticide
and metal levels present in populations of the larger
indigenous fish species of selected South African rivers. WRCReport No 428/1/99, Water Research Commission, Pretoria.
HOUSTON, A.I. & MCNAMARA. J.M. 1985. A general theory of centralplace foraging for single-prey loaders. Theoretical
Population Biology 28: 233-262.HUSSAIN, S.A. & CHOUDHURY, B.C. 1995. Seasonal movement, home
range, and habitat use in smooth coated otters in NationalChambal Sanctuary, India. Habitat 11: 45-55.
JOHNSON, D.H. 1980. The comparison of usage and availabilitymeasurements for evaluating resource preference. Ecology 61:
65-71.KINGDON, J. 1977. East African mammals: an atlas of evolution in
Africa. Volume III A (Carnivores). Academic Press, London.KOEPFLI, K.-P. & WAYNE, R.K. 1998. Phylogenetic relationships of
otters (Carnivora: Mustelidae) based on mitochondrialcytochrome b sequences. Journal of Zoology, London 246: 401-416.
KOPP, S.D., GUTHERY, F.S., FORRESTER, N.D. & COLE, L.C. 1998.Habitat selection modeling for northern bobwhites onsubtropical rangeland. Journal of Wildlife Management 62:
884-895.KRAMER, D.L. 1988. The behavioral ecology of air breathing by
aquatic animals. Canadian Journal of Zoology 66: 89-94.KREBS, C.J. 1985. Ecology: The experimental analysis of
distribution and abundance. Harper and Row, New York.KREBS, J.R. & KACELNIK, A. 1991. Decision making. In: Behavioural
ecology an evolutionary approach, (eds) J.R. Krebs, & N.B.Davies, Blackwell Scientific Publications, Oxford.
Stellenbosch University http://scholar.sun.ac.za

16
KROGER, Z. & FORREST, G.W. 1978. First record of clawless otterfrom Lake st Lucia. Lammergeyer 26: 64.
KRUUK, H. 1993. The diving behaviour of the platypus(Ornithorhynchus anatinus) in waters with different trophicstatus. Journal of applied Ecology 30: 592-598.
KRUUK, H. 1995. Wild otters: Predation and populations. OxfordUniversity Press, Oxford.
KRUUK, H. & MACDONALD, D.W. 1985. Group territories ofcarnivores: empires and enclaves. In: Behavioural ecology:
ecological consequences of adaptive behaviour, (eds) R.M.Sibly & R.H. Smith, Blackwell Scientific Publications,Oxford.
KRUUK, H. & GOUDSWAARD, P.C. 1990. Effects of changes in fishpopulations in Lake Victoria on the food of otters (Lutra
maculicollis Schinz and Aonyx capensis Lichtenstein). African
Journal of Ecology 28: 322-329.KRUUK, H., CONROY, J.W.H., GLIMMERVEEN, U. & OUWERKERK, E.J.
1986. The use spraints to survey populations of otter Lutra
lutra. Biological Conservation 35: 187-194.KRUUK, H., TAYLOR, P.T. & MOM, G.A.T. 1997. Body temperature and
foraging behaviour of the Eurasian otter (Lutra lutra), inrelation to water temperature. Journal of ZoologYr London
241: 689-697.KYLE, R. 1981. The clawless otter-extension of known range in
Natal. Lammergeyer 31: 44.LARIVIERE, S. 2001. Aonyx capensis. Mammalian Species 671:
LIGTHART, M.F., NEL, J.A.J. & AVENANT, N.L. 1994. Diet of Capeclawless otters in part of the Breede River system. South
African Journal of Wildlife Research 24: 38-39.MACARTHUR, R.H. & PIANKA, E.R. 1966. On optimal use of a patchy
environment. American Naturalist 100: 603-609.MACDONALD, D.W. 1983. The ecology of carnivore social behaviour.
Naturer London 301: 379-384.MACDONALD, D.W. & CARR, G.M. 1989. Food security and the rewards
of tolerance. In: Comparative socioecology: The behavioural
Stellenbosch University http://scholar.sun.ac.za

17
ecology of humans and animals, (eds) V. Standen & R.A.Foley, Blackwell Scientific, Oxford.
MASON, C.F. & MACDONALD, S.M. 1986. Otters: ecology and
conservation. Cambridge University Press, Cambridge.MASON, C.F. & ROWE-ROWE, D.T. 1992. Organochlorine pesticide
residues and PCBs in otter scats from Natal. South African
Journal of Wildlife Research 22: 29-31.MAXWELL, G. 1960. Ring of bright water. Longmans Green, London.MAXWELL, G. 1963. The rocks remain. Longmans Green, London.MAXWELL, G. 1968. Raven seek thy brother. Longmans Green, London.MEESTER, J.A.J., RAUTENBACH, I.L., DIPPENAAR, N.J. & BAKER, C.M.
1986. Classification of Southern African mammals. Transvaal
Museum Monographs NO.5: 1-359.MELQUIST, W.E. & HORNOCKER, M.G. 1983. Ecology of river otters in
west central Idaho. wildlife Monographs 83: 1-60.NEL, J.A.J. & SOMERS, M.J. In press. The status of otters in
Africa: an assessment. Habitat 13:
NEL, J.A.J., SOMERS, M.J. & ROWE-ROWE, D.T. In press.Conservation of sub-Saharan otters. In: Otter Action Plan2000. IUCN.
PERRIN, M.R. & CARUGATI, C. 2000a. Food habits of coexisting Capeclawless otter and spotted-necked otter in the KwaZulu-NatalDrakensberg, South Africa. South African Journal of Wildlife
Research 30: 85-92.PERRIN, M.R. & CARUGATI, C. 2000b. Habitat use by the Cape
clawless otter and the spotted-necked otter in the KwaZulu-Natal Drakensberg, South Africa. South African Journal of
Wildlife Research 30: 103-113.PERRIN, M.R. & D'INZILLO CARRANZA, I. 2000. Habitat use by
spotted-necked otters in the KwaZulu-Natal Drakensberg, SouthAfrica. South African Journal of Wildlife Research 30: 8-14.
PERRIN, M.R., D'INZILLO CARRANZA, I. & LINN, I.J. 2000. Use ofspace by the spotted-necked otter in the Natal Drakensberg,South Africa. South African Journal of Wildlife Research 30:
15-21.
Stellenbosch University http://scholar.sun.ac.za

18
PERRY, G. & PIANKA, E.R. 1997. Animal foraging: past, presentand future. Trends in Ecology and Evolution 12: 360-364.
POWELL, R.A. 1979. Mustelid spacing patterns: variations on atheme by Mustela. Zeitschrift fUr Tierpsychologie 50: 153-163.
PURVES, M.G., KRUUK, H. & NEL, J.A.J. 1994. Crabs Potamonautes
perlatus in the diet of the otter Aonyx capensis and watermongoose Atilax paludinosus in a freshwater habitat in SouthAfrica. Zeitschrift fUr Saugetierkunde 59: 332-341.
RALLS, K., HATFIELD, B.B. & SINIFF, D.B. 1995. Foraging patternsof California sea otters as indicated by telemetry. Canadian
Journal of Zoology 73: 523-531.RANTA, E., RITA, H. & LINDSTROM, K. 1993. Competition versus
cooperation: success of individuals foraging alone and ingroups. American Naturalist 142: 42-58.
RASA, O.A.E. 1986. Ecological factors and their relationships togroup size, mortality and behaviour in the dwarf mongooseHelogale undulata (Peters, 1852). Cimbebasia 8: 15-21.
ROWE-ROWE, D.T. 1975. Biology of Natal mustelids. M.Sc. thesis,University of Natal, Durban, South Africa.
ROWE-ROWE, D.T. 1977a. Food ecology of otters in Natal, SouthAfrica. Oikos 28: 210-219.
ROWE-ROWE, D.T. 1977b. Prey capture and feeding behaviour ofSouth African otters. Lammergeyer 23: 13-21.
ROWE-ROWE, D.T. 1977c. Variation in the predatory behaviour ofthe clawless otter. Lammergeyer 23: 22-27.
ROWE-ROWE, D.T. 1978. The small carnivores of Natal. Lammergeyer
25: 1-48.ROWE-ROWE, D.T. 1990. Otter distribution and protection in South
Africa. IUCN Otter Specialist Group Bulletin No.5: 17-23ROWE-ROWE, D.T. 1991. Status of otters in Africa. Habitat 6: 15-
20.ROWE-ROWE, D.T. 1992. The carnivores of Natal. Natal Parks Board,
Pietermaritzburg.ROWE-ROWE, D.T. 1995. Distribution and status of African otters.
Habitat 11: 8-10
Stellenbosch University http://scholar.sun.ac.za

19
ROWE-ROWE, D.T. & SOMERS, M.J. 1998. Diet, foraging behaviourand coexistence of African otters and the water mongoose.Symposia of the Zoological Society of London No. 71: 215-227.
SANDELL, M. 1989. The mating tactics and spacing patterns ofsolitary carnivores. In: Carnivore Behaviour, Ecology, and
Evolution, (ed) Gittleman, J.L. Chapman and Hall, London.SCHOENER, T.W. 1971. Theory of feeding strategies. Annual Review
of Ecology and Systematics 2: 369-404.SKINNER, J.D. & SMITHERS, R.H.N. 1990. The mammals of the
Southern African subregion. University of Pretoria, Pretoria.SOMERS, M.J. 1996. Cape clawless otters associated with the
Riviersonderend and Breede Rivers. In: The Riviersonderend:
Situation assessment, with specific reference to the effects
of Tweewaterskloof Dam on the riverine ecosystem, (eds)Ractliffe, G., Snaddon, K. & Brown, C. Department of WaterAffairs and Forestry, Cape Town.
SOMERS, M.J. 1997. Aonyx capensis. In: The Complete Book of
Southern African Mammals, (eds) Mills, M.G.L. & Hess, L.Struik Winchester, Cape Town.
SOMERS, M.J. 2000a. Foraging behaviour of Cape clawless otters(Aonyx capensis) in a marine habitat. Journal of Zoology,
London 252: 473-480.SOMERS, M.J. 2000b. Seasonal variation in the diet of Cape
clawless otters (Aonyx capensis) in a marine habitat. African
Zoology 35: 261-268.SOMERS, M.J. & NEL, J.A.J. 1996. Otters in the Eastern Cape.
Pelea 15: 56-62.SOMERS, M.J. & PURVES, M.G. 1996. Trophic overlap between three
syntopic semi-aquatic carnivores: Cape clawless otter,spotted-necked otter, and water mongoose. African Journal of
Ecology 34: 158-166.STANDER, P.E. 1992. Cooperative hunting in lions: the role of the
individual. Behavioral Ecology and Sociobiology 29: 445-454.TAYLER, C. 1970. The elusive otter. The Eastern Cape Naturalist
39: 20-23.
Stellenbosch University http://scholar.sun.ac.za

20
TINLEY, K.L. 1958. A preliminary report on the ecology of Lake
Sibaya with special reference to the hippopotamus. NatalParks Board Unpublished Report, Pietermaritzburg.
TURNBULL-KEMP, P.ST.J. 1960. Quantitative estimations ofpopulations of river crab, Potamon (Potamonautes) perlatus
(M. Edw.), in Rhodesian trout streams. Nature, London 185:
481.VAN DER ZEE, D. 1979. Food and status of the Cape clawless otter
(Aonyx capensis Schinz 1821) in the Tsitsikama CoastalNational Park. M.Sc. thesis, University of Pretoria,Pretoria, South Africa.
VAN DER ZEE, D. 1981. Prey of the Cape clawless otter (Aonyx
capensis) in the Tsitsikama National Park, South Africa.Journal of Zoology, London 194: 467-483.
VAN DER ZEE, D. 1982. Density of Cape clawless otters Aonyx
capensis (Schinz, 1821) in the Tsitsikama Coastal NationalPark. South African Journal of wildlife Research 12: 8-12.
VAN NIEKERK, C.H., SOMERS, M.J. & NEL, J.A.J. 1998. Freshwateravailability and distribution of Cape clawless otter spraintsand resting places along the south-west coast of SouthAfrica. South African Journal of Wildlife Research 28: 68-72.
VAN ZYLL DE JONG, C.G. 1987. A phylogenetic study of the Lutrinae(Carnivora; Mustelidae) using morphological data. Canadian
Journal of Zoology 65: 2536-2544.VERWOERD, D.J. 1987. Observations on the food and status of the
Cape clawless otter Aonyx capensis at Betty's Bay, SouthAfrica. South African Journal of Zoology 22: 33-39.
WASER, P.M. 1981. Sociality or territorial defence? The influenceof resource renewal. Behavioral Ecology and Sociobiology 8:
231-237.
Stellenbosch University http://scholar.sun.ac.za

21
CHAPTER 2
DIET AND PREY AVAILABILITY OF CAPE CLAWLESS OTTERS (AONYX
CAPENSIS) IN TWO SOUTH AFRICAN RIVERS
INTRODUCTION
When an animal harvests food, it has to make decisions. One ofthese decisions is which kinds of prey to eat (Crawley & Krebs1992). The optimal foraging theory (OFT), first proposed by Emlen(1966) and MacArthur & Pianka (1966), states that foragingstrategies may involve decisions that optimise food intake perunit effort or of some other measure of foraging efficiency(Emlen 1966; MacArthur & Pianka 1966; Schoener 1971; Krebs &Kacelnik 1991; Perry & Pianka 1997). Optimality models have threemain components: the currency, the constraints, and the decisionvariable (Krebs & Kacelnik 1991). In the case of diving organismssuch as Cape clawless otters Aonyx capensis, the currencies couldinclude maximising the rate of energy or oxygen intake,minimising the risk of predation, or a combination of these.Constraints and variables could be: amongst others (see Chapter1), whether to eat or reject a small prey or certain types ofprey. In this chapter these two variables are considered for A.
capensis in two freshwater habitats. As there is increased lossof energy in water (Kruuk et al. 1997), it would be expected thatotters would always maximise the net rate of energy gain.
Aonyx capensis are semi-aquatic predators, which occur overmost of sub-Saharan Africa (Rowe-Rowe & Somers 1998; Nel & Somersin press). Aonyx capensis exploit a variety of aquatic habitats,including marine, estuarine, riparian, mangrove and lacustrine(see Chapter 1 for a discussion on their distribution), and areprimarily crab eaters (Rowe-Rowe & Somers 1998). To understand howA. capensis use their habitats it is necessary to have baseline
Stellenbosch University http://scholar.sun.ac.za

22
information on the feeding ecology of the species. Diet of A.
capensis using spraints has been determined (freshwater habitats:
Turnbull-Kemp (1960); Rowe-Rowe (1975, 1977a, 1978); Donnelly &Grobler (1976); Kruuk & Goudswaard (1990); Butler (1994); Butler& du Toit (1994); Ligthart et al. (1994); Purves et al. (1994);Carugati (1995); Somers (1996); Perrin & Carugati (2000); marine
habitats: van der Zee (1979, 1981); Arden-Clarke (1983, 1986);Verwoerd (1987) and Somers (2000a, 2000b (Chapters 5 & 6)) butnone of these studies have attempted to relate it to relative preyabundance. These studies show that in most areas crustaceans arethe most important prey type, but fish, frogs, insects, birds,reptiles, molluscs, dung (ungulate) and mammals are also eaten.This is in contrast to most other otters, which are mainlypiscivorous (Estes 1989). Asian small-clawed otters Amblonyx
cinerea, however, also feed mostly on crabs (Kruuk et al. 1994).Only Rowe-Rowe (1977a) and Purves et al. (1994) show seasonalvariation in the diet of A. capensis but like the other studiesdo not give any data on prey availability. Data on availabilityare important for understanding the effects of food on otterpopulations and behaviour (Kruuk & Moorhouse 1990). For example,in European otters Lutra lutra prey availability can affect otternumbers, timing of reproduction, breeding success and mortality(Kruuk & Conroy 1991; Kruuk et al. 1987, 1991, 1993; Heggberget &Christensen 1994; Beja 1996).
As the relationship between behaviour and the availability ofresources is a central part of behavioral ecology (Pulliam 1989),and food availability has a powerful influence on animals in boththe determination of habitable areas and the numbers of individualswhich these areas can support (Krebs 1985), the relative density ofthe otters' main prey are determined in the present study. As onlyRowe-Rowe (1977a) and Purves et al. (1994) provide some seasonaldata on diet this study provides more detailed seasonal data for A.
capensis, living in freshwater environments. The above studies onthe diet of A. capensis have shown A. capensis to eat a variety ofprey, both in terms of size and type. Optimal foraging theory canbe used to account for the types and sizes of prey items taken by
Stellenbosch University http://scholar.sun.ac.za

23
predators (Krebs & Kacelnik 1991). One possible hypothesis toexplain why several types of prey are eaten is that the timestaken to search for the most profitable prey types influenceschoice. If it takes a long time to find a profitable fish, theotter might be able to obtain a higher overall rate of intake byeating some of the less profitable crabs. The same applies tosizes of prey eaten.
Despite freshwater crabs of the genus Potamonautes (the mainprey of A. capensis) being locally abundant (up to 36 crabs m-')in southern African freshwater systems (Turnbull-Kemp 1960;ArkelI 1978; King 1983; Raubenheimer 1986; Hill & O'Keeffe 1992;Somers & Nel 1998), and forming a major part of the diet of manyother species, little information is available about theirbiology (Somers & Nel 1998). The crabs, besides being eaten by A.
capensis, are eaten by many species of fish (Skelton 1993), birds(Maclean 1985), and other mammals such as spotted-necked otterLutra maculicollis, and water mongoose Atilax paludinosus (Rowe-Rowe 1977a; Somers & Purves 1996 (Chapter 7)). Somers & Nel(1998) predict they may be important enough in freshwater systemsto be termed dominant or even keystone species (Power et al.
1996), but more data are needed (Somers & Nel 1998).In this chapter I report on the annual and seasonal diet of
A. capensis, as estimated from spraint (faecal) analysis, inrelation to the presence of their main prey (crabs and fish) intwo South African rivers. The main questions asked were:
1. What is the species composition of the diet of the otters?2. How does diet vary with season?3. Are variations in crab and fish abundance in the environment
reflected in the diet of otters?
MATERIALS & METHODS
Spraints were collected in the Eerste River (near Stellenbosch(33° 56' S, 18° 52' E)) and Olifants River (near Clanwilliam (32°11' S, 18° 23' E)) in the Western Cape Province, South Africa.
Stellenbosch University http://scholar.sun.ac.za

24
The Eerste River is a rocky, narrow river, which rises inpristine conditions in the Jonkershoek Mountains, but then flowsthrough agricultural, industrial and urban areas. The flow rateis variable depending on rainfall, which is mostly in winter. Itreaches the sea about 40 km from its source. The Eerste River isdisturbed for ca 90% of its length by agriculture, industry andthe urban environment. Cattle Bas taurinus farming is rare alongthe Eerste River. The main crops (vines, fruit, and vegetables)are subject to heavy applications of fertilizers, herbicides andpesticides (Heinecken et al. 1983). Winery effluents are eitherirrigated onto pasturelands or sent to the Stellenbosch sewageworks. Treated effluent from these works is discharged into atributary of the Eerste River (Heinecken et al. 1983). Duringheavy rainfall events overflow of the sewage works occurs anduntreated sewage flows into the river below Stellenbosch(personal observations). The Eerste River and a number of itstributaries flow through Stellenbosch, and these receive all thestorm water run-off from the town. Pollution levels andeutrophication increases rapidly below Stellenbosch. The treatedsewage from the towns of Macassar, Somerset West and Strand isalso discharged into the estuary of the Eerste River (Heineckenet al. 1983). For a detailed classification of the Eerste Riversee Eekhout et al. (1997).
The Olifants River is 285 km long and has a catchment area of46 220 km2• The part of the Olifants River used in this study isdominated by two impoundments: the Clanwilliam and Bulshoek Dams.There are holiday camps along the edge of the impoundments andrecreational boating, swimming, and fishing takes place. Thelength of river between the two dams is 17.6 km and bordered bycattle and crops. There is, however, little disturbance along thewater edge where mostly exotic Eucalyptus trees grow. Just aboveBulshoek Dam the river is slow flowing, has a sandy bank withreed Phragmites australis beds, bulrushes Typha capensis andoccasional sedges Cyperus spp along the edge. The river belowBulshoek Dam is slow flowing with marshlands, oxbows, largebasins, large reed beds and bulrushes and rocky pools of up to 6
Stellenbosch University http://scholar.sun.ac.za
25
m deep. Except for recreational activities on the dam (mostlyduring weekends and the summer holidays) there is not muchdisturbance. The area down to ca 15 km below Bulshoek Dam is notintensively farmed, except for some cattle farming, resulting invery little disturbance. Further down (out of the present studyarea) the river has extensive agriculture in the form of vines,fruit and vegetables along the edge. For a detailedclassification of the Olifants River see Harrison (1997) andEekhout et al. (1997).
Otter diet
From February 1993 to September 1996, 362 spraints werecollected along the Eerste River and, from April 1993 toSeptember 1996, 824 spraints were collected along the OlifantsRiver. Identification of spraints in the field was based on theircharacteristic odour.
Spraints were air-dried, teased apart and prey remainsidentified using a stereomicroscope (X 10 - 100 magnification) .Prey items were sorted into the following categories: mammal,bird, frog, fish, crab, insect, plant material and non-food suchas dung, soil and leaves. The presence of mammal remains in thespraints was determined from hair, crabs and insects fromcarapaces or exoskeletons, fishes from bones and scales, reptilesand frogs from bones, and birds from feathers.
Fishes were identified by scales, provided by Dr. P. Skeltonof the J.L.B. Smith Institute of Ichthyology, Grahamstown, or byreference material in the Department of Zoology, University ofStellenbosch, which was originally produced by Ms. T. Cousin.
The minimum number of crabs and fish represented in spraintsfrom each season and each river was estimated from the number ofcrab eyestalks and fish eye lenses in 10 g dry weight of spraint(n = 50 randomly selected spraints for each season and eachriver). To determine size of crabs eaten, the regressiondetermined for crabs in the Olifants River (Purves et al. 1994)
was used: C = -11.48+(8.33*E), where C = carapace width (mm) and
Stellenbosch University http://scholar.sun.ac.za

26
E = eye stalk length (mm). This correlation was highlysignificant (r2 = 0.99, n = 66, P < 0.001).
The presence of each prey category in each spraint wasscored, and the percentage occurrence of each prey categorycalculated. Scores for each category were also added andexpressed as a percentage of the total number of scores of allcategories, yielding relative percentage occurrence. This methodhas been shown to closely approximate the proportions ofdifferent items actually consumed by L. lutra (Erlinge 1968) andA. capensis (Rowe-Rowe 1977a). Carss & Parkinson (1996), however,show that for L. lutra it should only be used to rank importanceof prey in the diet. The rank of importance, based on thepercentage occurrence was therefore also determined.
For each spraint the dominant prey type was also determinedby volumetric analysis of prey items. The different dominant preyitems were then expressed as a percentage of the total number ofspraints (Kruuk et al. 1994; Purves et al. 1994; Somers & Purves1996 (Chapter 7)) .
The diet was determined for all years combined and the fourseasons: winter (June-August); spring (September-November);summer (December-February) and autumn (March-May).
Prey abundance
To determine expected prey availability crabs and fish werecaught in plastic gauze, funnel traps (550 by 250 mm, with afunnel of 100 mm, baited with ca 200 g of shallow-water hakeMerluccius capensis), which were left overnight in the river. Thecrabs were removed the following morning and the maximum carapacewidths of these crabs were measured with callipers. The numberand species of fish caught were determined. The traps, anchoredwith string to the shore, were placed along the edges within 5 mof the shore. This distance was used, as it is where the ottersusually forage in fresh water (personal observation). As thenumber of crabs caught varied among different parts of the river(Somers & Nel 1998), the data used to compare relative densitiesbetween the two rivers, are from traps deposited within a 50 m
Stellenbosch University http://scholar.sun.ac.za

27
stretch of similar habitat (over rocky bottomed riverbed) ineach river. The use of 50 m stretches of similar habitat ensuredthat only seasonal and not spatial variations were shown in theresults. As each season was not sampled in each year the data arecombined and compared with the overall seasonal diet of theotters. Thirty trap nights for each season in each river wereused. Furthermore, in the Olifants River, crabs were trapped inthe following habitat types: > 5 m from the shore (open water),within 5 m from a sandy shore, within 5 m of the rocky shore, andca 1 m into a reed bed. These were sampled as above but onlycounting numbers of crabs caught.
RESULTS
Annual diet and prey availability
The results of all four methods used in quantifying the diet,showed crabs were the main prey of A. capensis in the Olifantsand Eerste Rivers during the entire study period (Tables 2.1 &2.2). Crab remains found in the spraints from both rivers were ofPotamonautes perlatus, the only species of crab occurring in thestudy area of the Eerste River (see stewart 1997). Within theOlifants River study area P. perlatus occurred up to the BulshoekDam wall. For the remainder of the study area, below the damwall, a hybrid between P. perlatus and P. granularis occurs(Daniels et al. 1999). Fish were the second most abundant prey inthe spraints from both rivers. However, the species differed withonly Tilapia sparrmanii (92.5%) and Micropterus dolomieu (7.5%)
being found in the spraints from the Olifants River (Table 2.1),and T. sparrmanii (17.8%), Oreochromis mossambicus (16.10%),Oreochromis mykiss (51%), and Sandelia capensis (14.4%) beingfound in the spraints from the Eerste River (Table 2.2).
Stellenbosch University http://scholar.sun.ac.za
28
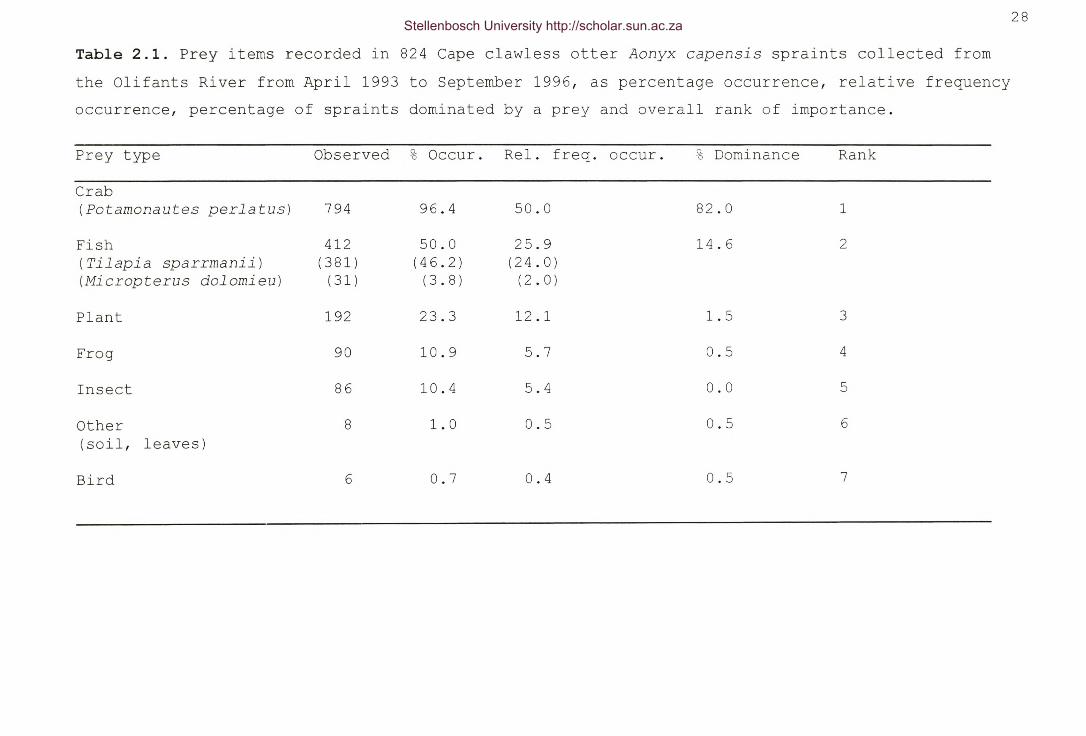
Table 2.1. Prey items recorded in 824 Cape clawless otter Aonyx capensis spraints collected fromthe Olifants River from April 1993 to September 1996, as percentage occurrence, relative frequencyoccurrence, percentage of spraints dominated by a prey and overall rank of importance.
Prey type Observed % Occur. Rel. freq. occur. 2- Dominance Rank0
Crab(Potamonautes perlatus) 794 96.4 50.0 82.0 1
Fish 412 50.0 25.9 14.6 2(Tilapia sparrmanii) (381) (46.2) (24.0)(Micropterus dolomieu) (31) (3.8) (2.0)
Plant 192 23.3 12.1 1.5 3
Frog 90 10.9 5.7 0.5 4
Insect 86 10.4 5.4 0.0 5
Other 8 1.0 0.5 0.5 6(soil, leaves)
Bird 6 0.7 0.4 0.5 7
Stellenbosch University http://scholar.sun.ac.za

29
Table 2.2 Prey items recorded in 362 Cape clawless otter Aonyx capens~s spraints collected fromthe Eerste River from February 1993 to September 1996, as percentage occurrence, relative frequencyoccurrence, percentage of spraints dominated by a prey and overall rank of importance.
Prey type Observed % Occur. Rel. freq. occur. % Dominance Rank
Crab(Potamonautes perlatus) 340 93.9 61.3 91.4 1
Fish 118 32.6 21.3 6.9 2(Oreochromis mykiss) (60) (16.6) (10.8)(Tilapia sparrmanii) (21) (5.8) (3.8)(Oreochromis mossambicus) (19) (5.2) (3.4)(Sandelia capensis) (17) (4.7) (3.1)
Insect 40 11.0 7.2 0.0 3
Frog 24 6.6 4.3 0.6 4
Bird 17 4.7 3.1 0.0 5
Mammal 9 2.5 1.6 0.0 6
Plant 5 1.4 0.9 1.1 7
Other 2 0.6 0.4 0.0 8(soil, leaves)
Stellenbosch University http://scholar.sun.ac.za

30
Plant material was ranked third in the diet of the otters tromOlifants River but using percentage occurrence, relativefrequency occurrence and ranking, it was only seventh in theEerste River. Percentage dominance, however, showed plantmaterial to be ranked third in the Eerste River. Other itemsincluded frogs, insects, birds and mammals (Tables 2.1 & 2.2).Insect remains represented Coleoptera and Odonata, while mammalsand frogs were unidentified.
In terms of numbers of prey, crabs again dominated the dietin both rivers. There were significantly more crabs than fishrepresented in the spraints in both the Olifants River (Mann-Whitney U 36795, d.f. 399, P < 0.001) and Eerste River (Mann-Whitney U 36572, d.f. 399, P < 0.001) (Table 2.3).
There was no significant difference between the relativenumber of crabs in the spraints (represented by half the numberof eye-stalks per 10 g of spraint) from the Olifants River (mean= 3.4 per 10 g spraint, S.E. = 0.2, range = 0-20) and the EersteRiver (mean = 3.3 per 10 g of spraint, S.E. = 0.2, range = 0-18)(Mann-Whitney U = 19939, d.f. = 399, P = 0.958).
There was also no significant difference between the relativenumber of fish in the spraints (represented by half the number ofeye lenses per 10 g of spraint) from the Olifants River (mean0.2 per 10 g of spraint, S.E. = 0.01, range = 0-15.5) and theEerste River (mean = 0.2 per 10 g of spraint, S.E. = 0.05, range
0-7.5) (Mann-Whitney U 20319, d.f. = 399, P = 0.783).The crabs found in the spraints from the Olifants River (mean
27.2, S.E. = 0.2, range = 4.3-66.8, n = 1983) were slightly butsignificantly smaller (Mann-Whitney U 569122, d.f. = 2612, P <
0.001) than those found in the spraints from the Eerste River(mean = 28.4, S.E. = 0.3, range = 6.9-50.5, n = 630) (Fig. 2.1).
Stellenbosch University http://scholar.sun.ac.za

31
>. 150eCl) ~--------_._-::::J • Olifants RiverCT~ o Eerste Riveru.~ 100
4-8 8-12 12-16 16-20 20-24 24-28 28-32 32-36 36-40 40-44 44-48 48-52 52-56 56-60 60-64 64-68
Size of crabs (mm)
Fig. 2.1. The percentage frequency size distribution of crabs Potamonautes perlatus foul1d in thespraints of Cape clawless otters Aonyx capensis in the Olifants River and Eerste River.
Stellenbosch University http://scholar.sun.ac.za

32
There were significantly different numbers of crabs caughtin the open area (mean = 1.4, S.E. = 0.27, range = 0-8 crabs pertrap, n = 40), sandy area (mean = 2.2, S.E. = 0.35, range = 0-6crabs per trap, n = 30) rocky area ((mean = 2.6, S.E. = 0.36,range = 0-8 crabs per trap, n = 42) and in the reed beds (mean5.9, S.E. = 0.67, range = 1-22 crabs per trap, n = 35) (H =
52.63, d.f. = 3, P < 0.001). An all pairwise multiple comparison(Dunn's method) isolated reeds to differ from the others withregards number of crabs caught.
In the Eerste River crabs with a mean carapace width of 41.22mm were caught, while Somers & Nel (1998) caught crabs by hand (amore accurate collection method) with a mean carapace width of18.25 (S.E. = 0.34 mm, range = 5.05-44.0 mm).
Comparing the data from this study and Somers & Nel (1998)there was a significant difference between the size of trap andhand caught crabs (Mann-Whitney U = 906, d.f. = 627, P < 0.001).
Seasonal variation in the diet
When combining the data from all the years, the annualpattern in the percentage occurrence of prey of A. capensis inthe Olifants and Eerste Rivers showed an increase in the amountof crab in summer vs winter and a corresponding decrease in theamount of fish eaten (Fig. 2.2 & 2.3). Another noticeable patternin the diet of A. capens~s in the Olifants River was that frogswere seldom eaten in summer compared to other seasons (Fig. 2.2).There was a strong concordance among seasons in the relativeimportance of prey categories for the Olifants River (W = 0.97,X2 23.21, d.f. 6, P < 0.001) and the Eerste River (W = 0.89,
24.94, d.f. 7, P < 0.001). Wilcoxon matched pairs signedrank test showed no significant difference between the seasonalrelative frequency occurrences of the various prey categoriesbetween the two rivers (P > 0.07 for all pairs) .
Stellenbosch University http://scholar.sun.ac.za
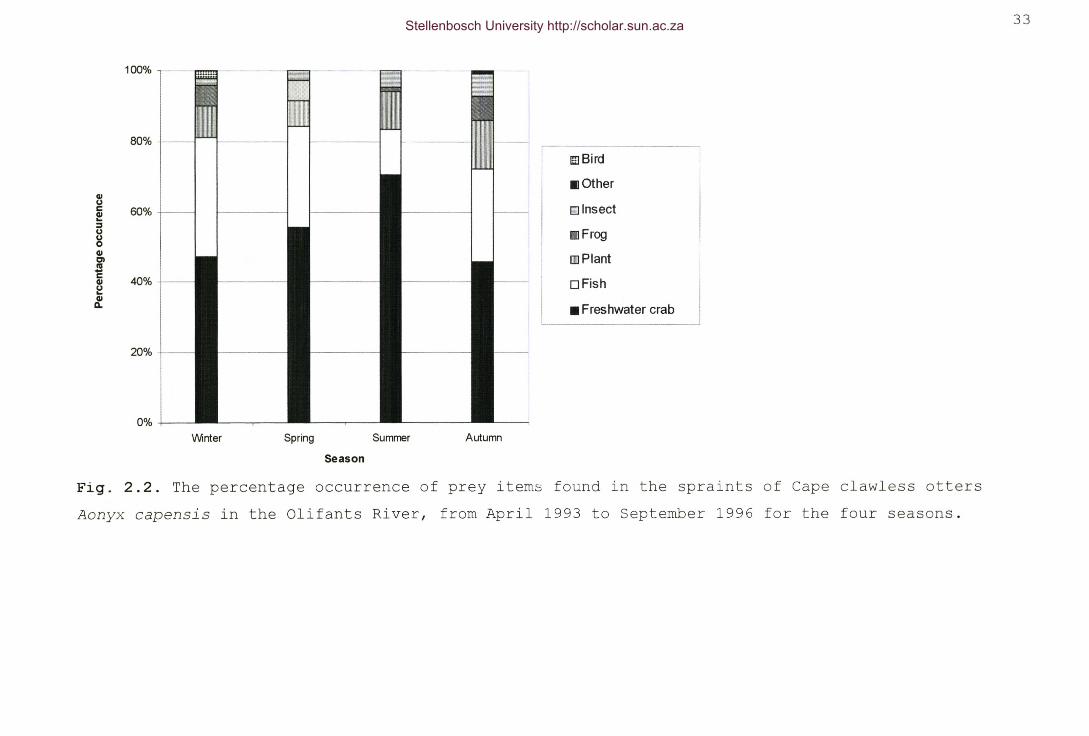
100%
33
80%
E!l Bird
III OtherGICJ
~Insectc 60%e:::rCJ ill FrogCJ0GI IIPlantClI'll1:
40%GI OFishCJ...GIQ. • Freshwater crab
20%
0%
Winter Spring Summer Autumn
Season
Fig. 2.2. The percentage occurrence of prey items found in the spraints of Cape clawless ottersAonyx capensis in the Olifants River, from April 1993 to September 1996 for the four seasons.
Stellenbosch University http://scholar.sun.ac.za

34
80%
DOtherQI II Plantuc: 60% II Mammalnl..:Iu DFrogu0cu IillBirdCl.l!I ~ Insectc:cu~ 40% DFishcu0.. • Freshwater crab
Winter Spring Summer Autumn
Season
Fig. 2.3. The percentage occurrence of prey items found in the spraints of Cape clawless ottersAonyx capensis in the Eerste River, from February 1993 to September 1996 for the four seasons.
Stellenbosch University http://scholar.sun.ac.za

35
Kruskal-Wallis One Way Analysis of Variance on Ranks showed thatalthough there is a noticeable seasonal pattern in number of crabsand fish found in the spraints of the otters (Fig. 2.4 & 2.5), onlythe crab numbers in the spraints collected in the Eerste Rivershowed a significant seasonal variation (H = 9.51, d.f. = 3, P
0.023). An apparent increase in the number of fish represented inthe spraints during spring in the Olifants River was not significant(H = 1.80, d.f. = 3, P = 0.61).
There was a significant seasonal difference in the size of crabseaten by the otters in the Olifants River (H = 23.7, d.f. = 3, P <
0.001) and those eaten in the Eerste River (H = 134.5, d.f. = 3, P <
o . 001) (Tables 2.3 & 2.4) .
Diet in relation to food resources
Only P. perlatus and T. sparrmanii were caught in the baitedtraps in the rivers (Table 2.5). However, in both rivers, otherspecies of fish are known to occur (Skelton 1993) and were eaten bythe otters (Tables 2.1 & 2.2).
There was no significant difference between the observed numbersof crabs represented in the spraints vs the expected number duringthe four seasons, as determined from the traps in the Olifants River(X2 = 4.38, d.f. = 3, P = 0.22) and the Eerste River (X2 = 0.71,d.f. = 3, P = 0.87). The same applied to the number of fishrepresented in the spraints for the Olifants River (X2 = 0.83, d.f.= 3, P = 0.84) and the Eerste River (X2 = 0.90, d.f. 3, P = 0.83) .There was, however, a significant difference between the observed vsexpected percentage occurrence of crabs in the diet from theOlifants River (X2 = 125.38, d.f. = 3, P < 0.001) and the EersteRiver (X2 = 19.98, d.f. = 3, P < 0.001).
Stellenbosch University http://scholar.sun.ac.za

4.5
4
3.5ë'iii..Q.UI 3-0CJ)
I:).... 2.5..QIQ.
UI.c2ca..
u-0..QI 1.5.cE::IZ
,----------_._----------------_._---_ ..__ ._ .._---_ _._.. ._._ .
36
o Eerste Riverml Oilfants River
Fig. 2.4. The mean number (± SE) of crabs (represented by half the number of eye stalks) found per 10g dry weight of Cape clawless otter Aonyx capensis spraint collected from the Eerste River (n = 50 perseason) and Olifants River (n = 50 per season) during the four seasons.
0.5
oWinter Sring Summer Autumn
Season
Stellenbosch University http://scholar.sun.ac.za

37
ë'~Cl.III
'0:0,8T--=-------~---------~----------------------------~----------------.----------------------------------------~----------------------------------------~.......IVCl...c:III
lO: 0,6 +---+-+---------'0~E~z 0.4
0,2
° Winter Sring Summer AutumnSeason
Fig. 2.5. The mean number (± SE) of fish (represented by half the number uf ~ye lenses) found per 10 gdry weight of Cape clawless otter Aonyx capensis spraint collected from Lhe Eerste River (n = 50 perseason) and Olifants River (n = 50 per season) during the four seasons.
Stellenbosch University http://scholar.sun.ac.za

38
Table 2.3. The size distribution of crabs Potamonautes perlatus in spraints of Cape clawlessotters Aonyx capensis, from the Olifants River, by season.
Size of crabs(mm)
autumn (%)(n = 1676)
winter (%)(n = 162)
spring (%)(n = 67)
summer (%)(n = 77)
Size distribution0-45-910-1415-1920-2425-2930-3435-3940-4445-4950-5455-5960-6566-70
Size parametersMean (mm)S.E.Range
0.00.03.16.8
22.225.315.413.67.43.12.50.60.00.0
0.00.00.06.0
25.426.922.416.43.00.00.00.00.00.0
0.00.00.05.2
23.420.827.310.411.72.30.00.00.00.0
0.11.04.9
16.020.923.616.09.75.31.90.40.10.00.1
29.60.7
11.8-55.2
28.50.8
16.8-43.5
29.50.9
15.2-45.2
26.80.24.3-66.8
Stellenbosch University http://scholar.sun.ac.za

39
Table 2.4. The size distribution of crabs Potamonautes perlatus represented in spraints of Aonyxcapensis, from the Eerste River, by season.
Size of crabs winter (% ) spring (%) summer ( %) autumn (%)(mm) (n = 63) (n = 156) (n = 228 ) (n = 182)
5-9 0.0 0.0 0.0 3.310-14 23.8 0.0 0.0 2.215-19 46.0 0.6 0.0 24.220-24 28.6 59.6 39.5 18.125-29 0.0 0.0 8.8 9.930-34 0.0 11.5 39.5 7.735-39 0.0 27.6 12.3 24.740-44 1.6 0.0 0.0 3.345-49 0.0 0.6 0.0 6.6
Size parametersMean (mm) 18.3 32.9 28.5 27.7S.E. 0.7 0.6 0.3 0.7Range 12.0-43.0 18.0-50.5 21.3-38.0 6.9-46.3
Stellenbosch University http://scholar.sun.ac.za

40
Table 2.5. The mean number of crabs (Potamonautes perlatus) and fish (Tilapia sparrmanii) caught intraps during all seasons in the Olifants River and Eerste River, Western Cape Province, SouthAfrica. (n = 30 trap nights per season per river)
Autumn Winter Spring SummerPrey type Mean ± S.E Range Mean ± S.E Range Mean ± S.E Range Mean ± S.E RangeOlifants RiverCrabsFish
7.2 ± 0.71.5 ± 0.3
0-200-6
2.5 ± 0.50.7 ± 0.2
0-90-5
1.2 ± 0.22.2 ± 0.4
0-40-6
3.5 ± 0.41.9 ± 0.3
1-100-7
Eerste RiverCrabsFish
6.2 ± 0.80.8 ± 0.2
0-170-3
3.4 ± 0.60.9 ± 0.2
0-100-5
3.2 ± 0.42.0 ± 0.4
0-90-7
4.1 ± 0.41.3 ± 0.2
1-110-4
Stellenbosch University http://scholar.sun.ac.za

41
The same applied to the percentage occurrence of fish in theOlifants River (X2 54.46, d.f. = 3, P < 0.001) and the EersteRiver (X2 = 17.47, d.f. = 3, P < 0.001).
The difference between size of crabs caught in the traps andthose found in the spraints was significant (Olifants River,Mann-Whitney U 54313, d.f. 2259, P < 0.001; Eerste River,Mann-Whitney U 10427, d.f. 789, P < 0.001).
There was no significant difference (Mann-Whitney U = 21731,d.f. = 437, P = 0.69) between the size of crabs caught in thetraps in the Olifants River (mean 40.70, S.E. = 0.3, range =20.0-59.0, n = 278) and the size of those caught in the traps inthe Eerste River (mean = 41.22, S.E. = 0.4, range = 29.4-53.0, n
180) .There were significantly more crabs caught in the traps in
the Olifants River than in the Eerste River (Mann-Whitney U
35885 .5, d. f. = 231, P < O. 001 ) (Table 2.5) .
DISCUSSION
Annual Diet
This study shows freshwater crabs to be the main prey of A.
capensis in freshwater habitats. The present results areconsistent with previous studies (see Rowe-Rowe & Somers 1998 forreview), except those of Rowe-Rowe (1977a) and Purves & Sachse(1998), where frogs were the second most common prey type. Thesetwo studies were, however, done at middle to high altitudes(1060-1650 m.a.s.l.) where fish faunas are poor (Rowe-Rowe &Somers 1998). No molluscs or reptiles were found in the spraintsin this study whereas they have been found in low frequencies insome other areas (Rowe-Rowe & Somers 1998). Waterfowl were, as inother studies (Rowe-Rowe & Somers 1998), rarely eaten.
The importance of different secondary items found in thevarious studies is probably related to local prey availability(Rowe-Rowe & Somers 1998). Optimal foraging theory can be used to
Stellenbosch University http://scholar.sun.ac.za

42
account for the types and sizes of prey items taken bypredators (Krebs & Kacelnik 1991). One possible hypothesis toexplain why several types of prey are eaten is that the timestaken to search for the most profitable type influences choice.If it takes a long time to find a profitable prey item (such as afish), the otter might be able to obtain a higher overall rate ofintake by eating some of the less profitable crabs. The same mayapply to sizes of prey eaten. The size of crabs eaten here, andin other studies is relatively small compared to what is found inthe environment. They may find small crabs more profitablebecause they are more easily found and this is what they areadapted to catching. Whereas most otter species are piscivorous(Mason & Macdonald 1986), A. capensis, Congo otter Aonyx congica
and small-clawed otter Amblonyx cinerea are generally regarded ascrab specialists in freshwater habitats (Rowe-Rowe 1977a, Kruuket al. 1994), having broadened bunodont molars for crushing theexoskeletons of invertebrate prey. Their manual dexterity furtherenables them to feel for and capture prey such as crabs understones and in crevices (Rowe-Rowe 1977a). The results presentedhere again show the importance of crabs in the diets of A.
capensis, emphasising, for their conservation management, theneed for more information about factors limiting crab numbers.
Area related differences in diet have been shown in L. lutra
(Kemenes & Nechay 1990; Kruuk & Moorhouse 1990), southern riverotter Lutra provocax (Medina 1998) and in A. capensis (Rowe-Rowe& Somers 1998). However in this study, the diets of the otters inthe two study sites have been shown to be fairly similar. Thenotable difference was the amount of ungulate, probably cattle,dung found in the spraints collected along the Olifants River(23.3%), where cattle grazing down to the river edge is common.No record of this has been found for other species of otters andthe reason remains unclear. However, one explanation is that theotters feed on dung beetles in the dung and accidentally take insome of the dung.
Stellenbosch University http://scholar.sun.ac.za

43
Seasonal diet
As shown here for A. capensis, other species of otter, likeL. lutra (Erlinge 1967; Kruuk et al. 1987; Weber 1990; Brzezinskiet al. 1993; Heggberget 1993; Beja 1997), Canadian river otterLutra canadensis (Turnlison & Karnes 1987; Dolloff 1993), smoothotter L. perspicillata (Nayerul Haque & Vijayan 1995) andNeotropical river otter L. longicaudis (Helder & Ker De Andrade1997) have a seasonal variation in diet.
The seasonal pattern in the percentage occurrence of prey ofA. capensis in the Olifants and Eerste Rivers shows an increasein the amount of crab in summer and a corresponding decrease inthe amount of fish eaten. This may be a result of fish (but notcrabs) being more available (perhaps more easily caught inwinter, owing to them being more lethargic; Rowe-Rowe 1977b)They may also be selecting for the more energy rich fish inwinter owing to the otters having higher energy demands resultingfrom the colder water. As water levels are lower during summerthe otters may also find catching crabs easier. In winter,frequent flooding leaves isolated pools near the main streamwherein small fish are often stranded, which may also contributetowards the increased amount of fish and decreased amount ofcrabs eaten during winter. Purves et al. (1994) also showed adecrease in the percentage occurrence of crabs in the diet of theotters in winter (June) compared to summer (February). Anothernoticeable pattern in the diet of A. capensis in the OlifantsRiver is that frogs were seldom eaten in summer compared to theother seasons (Fig. 2.2). The reason for this is unknown.
Diet in relation to food resources
Although the crabs found in the spraints from the OlifantsRiver were significantly smaller than those found in the EersteRiver, there was no significant difference between the sizes ofcrabs caught in the traps from the two rivers. This suggests thatthe otters on the Eerste River were selecting slightly largercrabs than the otters in the Olifants River.
Stellenbosch University http://scholar.sun.ac.za

44
The traps were obviously size selective and the comparisonbetween size of crabs eaten and the size of crabs caught in thetraps, were thus meaningless. However, the relative number ofcrabs caught could still be used as an indication ofavailability. The results show the relative number of crabscaught in the traps to be represented in the diet of the otters.The percentage occurrence of crabs and fish in the diet, however,are not representative of the crabs and fish caught in the traps.This result shows that otters and traps selected differently fromthe available prey populations.
Lutra lutra have also been shown to eat prey in relation toabundance (Lanszki & Kbrmendi 1996) but in a marine habitat inScotland, they ate prey not in relation to numbers of fish, butrather in relation to availability (Kruuk & Moorhouse 1990). Thelatter also applies to L. canadensis (Melquist & Hornocker 1983).Owing to this dietary plasticity between habitats, otters areregarded as opportunistic predators (Chanin 1985). This alsoappears to be the case here, at least with regards to number ofprey being eaten by A. capensis.
The data supports previous findings (see Somers & Nel 1998)that smaller crabs « 20 mm carapace width) are not sampled bytraps. The reasons may be that larger crabs are more dominant(Somers & Nel 1998), or that smaller crabs are not attracted tothe bait as they eat more plant material (Hill & O'Keeffe 1992).The sizes of crabs caught are, however, not representative of thepopulation and cannot be directly compared to those caught by theotters. Sampling crabs by hand is only an option in shallow,clear water and could not be done, except in limited areas of theEerste River. More crabs were caught in the traps placed in thereed beds than in the other habitat types sampled. This suggeststhat the reed beds are important habitat types for the otters.The finding that the otters select areas with reed beds (Chapter4) further supports this.
Oncorhynchus mykiss breed from June through to August andprefer fast flowing water (Skelton 1993). Sandelia capensis andT. sparrmanii prefer quiet or standing waters with submerged or
Stellenbosch University http://scholar.sun.ac.za

45
emergent vegetation (Skelton 1993). All the fish species eaten,except O. mykiss, therefore prefer quiet or slow flowing waterwith submerged or emergent vegetation. These data suggest thatthe otters forage mostly at the edges of the rivers where thewater flow is less and there is more vegetation. Oncorhynchus
mykiss, however, are farmed in the Eerste River where otters havebeen seen catching them in holding tanks (personal observations)An important management problem with otters is the damage theycause to o. mykiss farms (Somers & Nel 1995), and the otters inthe Eerste River have been a cause of concern for the localO.mykiss farmers and researchers. Otters are reported to beresponsible for the destruction of large numbers of O. mykiss anddomestic fowl. This supports the idea that otters are somewhatopportunistic predators (Chanin 1985) in that they select anartificial and abundant prey source (0. mykiss), when available.There are few o. mykiss in the Eerste River but it is not knownif the otters are eating these or just those in the O. mykiss
tanks.Temporal changes in diet, owing to change in prey
availability caused by otters, have been recorded in sea ottersEnhydra lutris (Ostfeld 1982) and L. lutra (Lanszki & Kbrmendi1996). Enhydra lutris has also been shown to be important indetermining the structure of prey communities and can thereforebe called a keystone species (Estes & Palmisano 1974; Lowry &Pearse 1974). The role of A. capensis in determining aquaticcommunities is presently unknown. Melquist & Hornocker (1983)have suggested that the river otter, L. canadensis do notinfluence its prey numbers and that the ability of vertebratepredators to regulate their prey is rare, as also stated byErlinge et al. (1984) for L. lutra. With P. perlatus being veryabundant (up to 36 per m2) (Somers & Nel 1998), it is thought thatthe otters would not have much influence on the crab population,but they could have a large effect on populations of farmed fish!More data are, however, needed.
As there is a high correlation between prey density and otterrecruitment (Kruuk et al. 1991), and evidence that otter
Stellenbosch University http://scholar.sun.ac.za

46
mortality is higher during periods of low prey availability(Kruuk & Conroy 1991) in a L. lutra population in Shetland, U.K.,prey availability may significantly affect L. lutra populations.If there is a similar pattern with A. capensis, knowledge of crabdensities or relative densities in all freshwater systems may beimportant to the conservation of A. capensis. Butler & du Toit(1994) have speculated that the low densities of A. capensis inZimbabwe is probably a reflection of the poor productivity ofcrabs in certain water bodies. With a rapidly decreasing qualityand quantity of fresh water in Africa (Davies & Day 1998) thefate of aquatic biological communities is uncertain. Moredetailed long-term data are needed to determine the relationshipsbetween A. capensis and their prey.
Much of our knowledge of the diet of otters comes from theidentification of undigested prey remains in spraints (seereviews of Mason & Macdonald (1996) for all species of otters,Rowe-Rowe & Somers (1998) for African otters in freshwaterhabitats and Somers (2000b) (chapter 5) for A. capensis in marinehabitats). However, frequency of occurrence data, from analysisof spraints, have certain potential shortcomings. For example, asample with one complete specimen is counted in the same way asone having just one fish scale, fishes without scales may bemissed entirely and spraints may contain remains from the gut ofprey (Webb 1975). It is also not known which otter left aparticular spraint, where the prey was taken, or when it wastaken (Kruuk 1995). The activity level of the otter whichsprainted, which is unknown, can also have a large effect onspraint composition (Carss et al. 1998). Confidence levels forthese data, from L. lutra have been shown to be low and the datashould therefore be interpreted with caution (Carss & Parkinson1996). Only Somers (2000a) (chapter 6) has provided data on dietof A. capensis from direct observations but could not providemuch detail. However, spraint analysis by frequency of occurrencecan provide useful information on the prey consumed, particularlyin ranking the "importance" of prey accurately (Carss & Parkinson1996). The quantification of diet may also be improved by
Stellenbosch University http://scholar.sun.ac.za

47
assessing the relative size frequencies of the most commonlyconsumed prey species (Carss & Parkinson 1996), which was donehere for crabs.
REFERENCESARDEN-CLARKE, C.H.G. 1983. Population density and SOCla_
organisation of the Cape clawless otter, Aonyx capensis
Schinz, in the Tsitsikama Coastal National Park. M.Sc.thesis, University of Pretoria, Pretoria, South Africa.
ARDEN-CLARKE, C.H.G. 1986. Population density, home range sizeand spatial organization of the Cape clawless otter, Aonyx
capensis, in a marine habitat. Journal of Zoology, London
209: 201-211.ARKELL, G.B.F. 1978. Aspects of the feeding and breeding biology
of the giant kingfisher. Ostrich 50: 176-181.BEJA, P.R. 1996. Seasonal breeding and food resources of otters,
Lutra lutra (Carnivora, Mustelidae) , in south-west Portugal:a comparison between coastal and inland habitats. Mammalia
60: 27-34.BEJA, P.R. 1997. Predation by marine-feeding otters (Lutra lutra)
in south-west Portugal in relation to fluctuating foodresources. Journal of Zoology, London 242: 503-518.
BRZEZINSKI, M., J~DRZEJEWSKI, W. & J~DRZEJEWSKA, B. 1993. Diet ofotters (Lutra lutra) inhabiting small rivers in theBialowieza National Park, eastern Poland. Journal of Zoology,
London 230: 495-501.BUTLER, J.R.A. 1994. Cape clawless otter conservation and a trout
river in Zimbabwe: a case study. Oryx 28: 276-282.BUTLER, J.R.A. & DU TOIT, J.T. 1994. Diet and conservation of
Cape clawless otters in eastern Zimbabwe. South African
Journal of wildlife Research 24: 41-47.CARSS, D.N. & PARKINSON, S.G. 1996. Errors associated with otter
Lutra lutra faecal analysis. I. Assessing general diet fromspraints. Journal of Zoology, London 238: 301-317.
Stellenbosch University http://scholar.sun.ac.za

48
CARSS, D.N., ELSTON, D.A. & MORLEY, H.S. 1998. The effects ofotter (Lutra lutra) activity on spraint production andcomposition: implications for models which estimate prey-sizedistribution. Journal of Zoology~ London 244: 295-302.
CARUGATI, C. 1995. Habitat, prey, and area requirements of otters(Aonyx capensis and Lutra maculicollis) in the NatalDrakensberg. M.Sc. thesis, University of Natal,Pietermaritzburg, South Africa
CHANIN, P. 1985. The natural history of otters. Facts on FilePublications, New York.
CRAWLEY, M.J. & KREBS, J.R. 1992. Foraging theory. In: Natural
enemies: The population biology of predators~ parasites and
diseases~ (ed) M.J. Crawley, Blackwell Scientificpublications, Oxford.
DANIELS, S.R., STEWART, B.A. & GIBBONS, M.J. 1999. Geneticstructure among populations of Potamonautes perlatus
(Decapoda: Potamonautidae) from the Olifants River system inthe Western Cape, South Africa. Journal of Zoology~ London
249: 137-142.DAVIES, B.R. & DAY, J.A. 1998. Vanishing waters. University of
Cape Town Press, Cape Town.DOLLOFF, C.A. 1993. Predation by river otters (Lutra canadensis)
on juvenile coho salmon (Oncorhynchus kisutch) and DollyVarden (Salvelinus malma) in southeast Alaska. Canadian
Journal of Fisheries and Aquatic Sciences 50: 312-315.EEKHOUT, S., KING, J.M. & WACKERNAGEL, A. 1997. Classification of
South African river~ volume 1. Department of EnvironmentAffairs and Tourism, Pretoria.
EMLEN, J.M. 1966. The role of time and energy in food preference.American Naturalist 100: 611-617.
ERLINGE, S. 1967. Food habits of the fish-otter, Lutra lutra L.in South Swedish habitats. Viltrevy 4: 371-443.
ERLINGE, S. 1968. Food studies on captive otters Lutra lutra L ..Oikos 19: 259-270.
Stellenbosch University http://scholar.sun.ac.za

49
ERLINGE, S., GORANSSON, G., HOGSTEDT, G., JANSSON, G., LIBERG,G., LOMAN, L., NILSSON, I.N., VON SCHANTZ, T. & SYLVÉN, M.1984. Can vertebrate predators regulate their prey? American
Naturalist 123: 125-133.ESTES, J.A. 1989. Adaptations for aquatic living by carnivores.
In: Carnivore behavior, ecology and evolution, (ed) J.L.Gittleman, Chapman and Hall, London.
ESTES, J.A. & PALMISANO, S.F. 1974. Sea otters: their role instructuring near shore communities. Science 185: 1058-1060.
HARRISON, T.D. 1997. A preliminary survey of coastal riversystems on the South African west coast, Orange River - GrootBerg, with particular reference to the fish fauna.Transactions of the Royal Society of South Africa 52: 277-321.
HEGGBERGET, T.M. 1993. Marine-feeding otters (Lutra lutra) inNorway: seasonal variation in prey and reproductive timing.Journal of the Marine Biological Association of the United
Kingdom 73: 297-312.HEGGBERGET, T.M. & Christensen, H. 1994. Reproductive timing in
Eurasian otters on the coast of Norway. Ecography 17: 339-348.
HEINECKEN, T.J.E., BICKERTON, l.B. & HEYDORN, A.E.F. 1983. A
Summary of Studies of the Pollution Input by Rivers and
Estuaries Entering False Bay. Council for Scientific andIndustrial Research, Stellenbosch.
HELDER, J. & KER DE ANDRADE, H. 1997. Food and feeding habits ofthe neotropical river otter Lontra longicaudis (Carnivora,Mustelidae) . Mammalia 61: 193-203.
HILL, M.P. & O'KEEFFE, J.H. 1992. Some aspects of the ecology ofthe freshwater crab (Potamonautes perlatus Milne Edwards) inthe upper reaches of the Buffalo River, eastern CapeProvince, South Africa. South African Journal of Aquatic
Science 18: 42-50.KEMENES, I. & NECHAY, G. 1990. The food of otters Lutra lutra in
different habitats in Hungary. Acta Theriologica 35: 17-24.
Stellenbosch University http://scholar.sun.ac.za
50
KING, J.M. 1983. Abundance, biomass and diversity of benthicmacroinvertebrates in a Western CAPE river, South Africa.Transactions of the Royal Society of South Africa 45: 11-34.
KREBS, C.J. 1985. Ecology: The experimental analysis of
distribution and abundance. Harper and Row, New York.KREBS, J.R. & KACELNIK, A. 1991. Decision making. In: Behavioural
ecology an evolutionary approach, (eds) J.R. Krebs, & N.B.Davies, Blackwell Scientific Publications, Oxford.
KRUUK, H. 1995. Wild otters: Predation and populations. OxfordUniversity Press, Oxford.
KRUUK, H. & CONROY, J.W.H. 1991. Mortality of otters (Lutra
lutra) in Shetland. Journal of Applied Ecology 28: 83-94.KRUUK, H. & GOUDSWAARD, P.C. 1990. Effects of changes in fish
populations in Lake Victoria on the food of otters (Lutra
maculicollis Schinz and Aonyx capensis Lichtenstein). African
Journal of Ecology 28: 322-329.KRUUK, H. & MOORHOUSE, A. 1990. Seasonal and spatial differences
in food selection by otters (Lutra lutra) in Shetland.Journal of Zoology, London 221: 621-637.
KRUUK, H., CONROY, J.W.H. & MOORHOUSE, A. 1987. Seasonalreproduction, mortality and food of otters (Lutra lutra L.)in Shetland. Symposia of the Zoological Society of London No.58: 263-278.
KRUUK, H., CONROY, J.W.H. & MOORHOUSE, A. 1991. Recruitment to apopulation of otters (Lutra lutra) in Shetland, in relationto fish abundance. Journal of Applied Ecology 28: 95-101.
KRUUK, H., TAYLOR, P.T. & MOM, G.A.T. 1997. Body temperature andforaging behaviour of the Eurasian otter (Lutra lutra), inrelation to water temperature. Journal of Zoology, London
241: 689-697.KRUUK, H., CARSS, D.N., CONROY, J.W.H. & DURBIN, L. 1993. Otter
(Lutra lutra L.) numbers and fish productivity in rivers innorth-east Scotland. Symposia of the Zoological Society of
London No. 65: 171-191.
Stellenbosch University http://scholar.sun.ac.za
51
KRUUK, H., KANCHANASAKA, B., O'SULLIVAN, S. & WANGHONGSA, S.1994. Niche separation in three sympatric otters Lutra
perspicillata, L. lutra and Aonyx cinerea in Huai Kha Khaeng,Thailand. Biological Conservation 69: 115-120.
LANSZKI, J. & KORMENDI, S. 1996. Otter diet in relation to fishavailability in a fish pond in Hungary. Acta Theriologica 41:
127-136.LIGTHART, M.F., NEL, J.A.J. & AVENANT, N.L. 1994. Diet of Cape
clawless otters in part of the Breede River system. South
African Journal of Wildlife Research 24: 38-39.LOWRY, L.F. & PEARSE, J.S. 1974. Abalones and sea urchins in an
area inhabited by sea otters. Marine Biology 23: 312-319.MACARTHUR, R.H. & PIANKA, E.R. 1966. On optimal use of a patchy
environment. American Naturalist 100: 603-609.MACLEAN, G.L. 1985. Roberts' birds of southern Africa. John
Voelcker Bird Book Fund, Cape Town.MASON, C.F. & MACDONALD, S.M. 1986. Otters: ecology and
conservation. Cambridge University Press, Cambridge.MEDINA, G. 1998. Seasonal variations and changes in the diet of
southern river otter in different freshwater habitats inChile. Acta Theriologica 43: 285-292.
MELQUIST, W.E. & HORNOCKER, M.G. 1983. Ecology of river otters inwest central Idaho. Wildlife Monographs 83: 1-60.
NAYERUL HAQUE, M.D. & VIJAYAN, V.S. 1995. Food habits of thesmooth Indian otter (Lutra perspicillata) in KeoladeoNational Park, Bharatpur, Rajasthan (India). Mammalia 59:
345-348.NEL, J.A.J. & SOMERS, M.J. In press. The status of otters in
Africa: an assessment. Habitat 13:
OSTFELD, R.S. 1982. Foraging strategies and prey switching in theCalifornia sea otter. Oecologia 53: 170-178.
PERRIN, M.R. & CARUGATI, C. 2000. Food habits of coexisting Capeclawless otter and spotted-necked otter in the KwaZulu-NatalDrakensberg, South Africa. South African Journal of Wildlife
Research 30: 85-92.
Stellenbosch University http://scholar.sun.ac.za

52
PERRY, G. & PIANKA, E.R. 1997. Animal foraging: past, presentand future. Trends in Ecology and Evolution 12: 360-364.
POWER, M.E., TILMAN, D., ESTES, J.A., MENGE, B.A., BOND, W.J.,MILLS, L.S., DAILY, G., CASTILLA, J.C., LUBCHENCO, J. &PAINE, R.T. 1996. Challenges in the quest for keystones.BioScience 46: 609-620.
PULLIAM, H.R. 1989. Individual behavior and the procurement ofessential resources. In: Perspectives in ecological theory,
(eds) J. Roughgarden, R.M. May, & S.A. Levin, PrincetonUniversity Press, Princeton.
PURVES, M.G. & SACHSE, B. 1998. The utilization of freshwater
crabs by co-existing otter (Aonyx capensis Schinz) and water
mongoose (Atilax paludinosus Cuvier) in the Drakensberg,
South Africa. Unpublished report, University of Stellenbosch,Stellenbosch.
PURVES, M.G., KRUUK, H. & NEL, J.A.J. 1994. Crabs Potamonautes
perlatus in the diet of the otter Aonyx capensis and watermongoose Atilax paludinosus in a freshwater habitat in SouthAfrica. Zeitschrift fUr Saugetierkunde 59: 332-341.
RAUBENHEIMER, C.D. 1986. Aspects of the biology of the freshwatercrab, Potamonautes sidneyi, with particular reference togeneral seasonality and female aggression. M.Sc. thesis,University of Natal, Durban, South Africa.
ROWE-ROWE, D.T. 1975. Biology of Natal mustelids. M.Sc. thesis,University of Natal, Durban, South Africa.
ROWE-ROWE, D.T. 1977a. Food ecology of otters in Natal, SouthAfrica. Oikos 28: 210-219.
ROWE-ROWE, D.T. 1977b. Variation in the predatory behaviour ofthe clawless otter. Lammergeyer 23: 22-27.
ROWE-ROWE, D.T. 1978. The small carnivores of Natal. Lammergeyer
25: 1-48.ROWE-ROWE, D.T. & SOMERS, M.J. 1998. Diet, foraging behaviour and
coexistence of African otters and the water mongoose.Symposia of the Zoological Society of London No. 71: 215-227.
SCHOENER, T.W. 1971. Theory of feeding strategies. Annual Review
of Ecology and Systematics 2: 369-404.
Stellenbosch University http://scholar.sun.ac.za

53
SKELTON, P.H. 1993. A complete guide to the freshwater fishes
of southern Africa. Southern Book Publishers, Halfway House.SOMERS, M.J. 1996. Cape clawless otters associated with the
Riviersonderend and Breede Rivers. In: The Riviersonderend:
Situation assessment, with specific reference to the effects
of Tweewaterskloof Dam on the riverine ecosystem, (eds)Ractliffe, G., Snaddon, K. & Brown, C. Department of WaterAffairs and Forestry, Cape Town.
SOMERS, M.J. 2000a. Foraging behaviour of Cape clawless otters(Aonyx capensis) in a marine habitat. Journal of Zoology,
London 252: 473-480.SOMERS, M.J. 2000b. Seasonal variation in the diet of Cape
clawless otters (Aonyx capensis) in a marine habitat. African
Zoology 35: 261-268.SOMERS, M.J. & NEL, J.A.J. 1995. Otters as biological indicators
of freshwater systems in South Africa: project descriptionand some preliminary results. Habitat 11: 18-21.
SOMERS, M.J. & NEL. J.A.J. 1998. Dominance and populationstructure of freshwater crabs (Potamonautes perlatus MilneEdwards). South African Journal of zoology 33: 31-36.
SOMERS, M.J. & PURVES, M.G. 1996. Trophic overlap between threesyntopic semi-aquatic carnivores: Cape clawless otter,spotted-necked otter, and water mongoose. African Journal of
Ecology 34: 158-166.STEWART, B.A. 1997. Morphological and genetic differentiation
between populations of river crabs (Decapoda: Potamonautidae)from the Western Cape, South Africa, with a taxonomic re-examination of Gecarcinautes brincki. Zoological Journal of
the Linnean Society 119: 1-21.TUMLISON, R. & KARNES, M. 1987. Seasonal changes in food habits
of river otters in southwestern Arkansas beaver swamps.Mammalia 51: 225-231.
TURNBULL-KEMP, P.ST.J. 1960. Quantitative estimations ofpopulations of river crab, Potamon (Potamonautes) perlatus
(M. Edw.), in Rhodesian trout streams. Nature, London 185:
481.
Stellenbosch University http://scholar.sun.ac.za

54
VAN DER ZEE, D. 1979. Food and status of the Cape clawlessotter (Aonyx capensis Schinz 1821) in the Tsitsikama CoastalNational Park. M.Sc. thesis, University of Pretoria,Pretoria, South Africa.
VAN DER ZEE, D. 1981. Prey of the Cape clawless otter (Aonyx
capensis) in the Tsitsikama National Park, South Africa.Journal of Zoology, London 194: 467-483.
VERWOERD, D.J. 1987. Observations on the food and status of theCape clawless otter Aonyx capensis at Betty's Bay, SouthAfrica. South African Journal of Zoology 22: 33-39.
WEBB, J.B. 1975. Food of the otter (Lutra lutra) on the Somersetlevels. Journal of Zoology, London 177: 486-491.
WEBER, J.-M. 1990. Seasonal exploitation of amphibians by otters(Lutra lutra) in north-east Scotland. Journal of Zoology,
London 220: 641-651.
Stellenbosch University http://scholar.sun.ac.za

55
CHAPTER 3
VARIATIONS IN, AND FACTORS AFFECTING, HOME RANGE
PARAMETERS OF INDIVIDUAL CAPE CLAWLESS OTTERS (AONYX
CAPENSIS)
INTRODUCTION
The concept of and methods for determining home range have beenmuch debated (e.g. Burt 1943; Jewell 1966; Jennrich & Turner1969; Brown & Orians 1970; Brown 1975; Anderson 1982; Boulanger &White 1990; Gautestad & Mysterud 1995; Seaman & Powell 1996;Bothma et al. 1997). Home range is defined as the area an animaluses in its normal activities of food gathering, mating andcaring for young (Burt 1943). Most animals do not use theirentire home range with equal intensity and tend to occupy certainareas with greater frequency than others (Dixon & Chapman 1980).This implies a core area of concentrated activity (Samuel et al.
1985) that is used more frequently, and with greater regularity,than other parts of the home range (Jewell 1966).
Single species studies on home ranges have found home rangesto vary owing to, amongst others, differences in habitats (Geffenet al. 1992; Somers et al. 1994), food availability (Melquist &Hornocker 1983; Mills 1990), interspecific relationships (Rasa1983), intraspecific relationships (Rasa 1986), time in residence(Conner et al. 1999) sex of the animal (Green et al. 1984; Somerset al. 1994; Gehrt & Fritzell 1997; Conner et al. 1999), age ofthe animal (Ralls et al. 1995), anthropogenic influences (Weber &Dailly 1998) and vegetation cover (Gese et al. 1988; Bothma etal. 1997). Home ranges of animals may also shift with time(Doncaster & Macdonald 1991). Estimates of home range size andmovement patterns of individual animals are useful in determiningpopulation density, habitat use, energy requirements, and socialstructure (Sanderson 1966) that in turn allow estimates of thecarrying capacity of available habitat. As territoriality (the
Stellenbosch University http://scholar.sun.ac.za

56
action of defending an area) greatly affects the spatialorganisation of animal populations (Lack 1954; Wynne-Edwards1962) it is important to determine if this occurs in populations.Home range and territoriality data are needed to help determinethe amount of suitable habitat required, and to realise acomplete conservation management plan for a species.
If territorial, animals are expected to move over the minimumeconomically defendable area (pyke et al. 1977; Maher & Lott1995), which also satisfies their metabolic needs (McNab 1963,1980; Nagy 1987). Home range size and territory size of animalsgenerally increase with body size and metabolic requirements(McNab 1963; Clutton-Brock & Harvey 1977; Gittleman & Harvey1992; Grant et al. 1992), but decrease with an increase inhabitat productivity (Macdonald 1983). Broad diet has beenrecognised as the most important factor influencing home rangesize (Grant et al. 1992). For example, carnivores typically havelarger home ranges than omnivores or herbivores of the same size(Grant et al. 1992). A possible reason for observed differencesin home range size could be that species with undefended homeranges are usually larger than territories (Grant et al. 1992)
An explanation for males having larger home ranges than femalesmay be linked to males' ranging behaviour being primarilygoverned by access to potential mates (Emlen & Oring 1977;Wrangham 1980; Macdonald 1983; Davies & Lundberg 1984; Clutton-Brock 1989; Gehrt & Fritzeli 1998).
The resource dispersion hypothesis (RDH) (Macdonald 1983;Carr & Macdonald 1986) tries to explain, within the limits of allconstraints, interspecific and intraspecific variation interritories and group sizes in ecological terms. The RDH predictsthat spatial organisation will be determined by dispersion ofresources (particularly food) and that group size will bedetermined by the richness of these patches when animals occupythe smallest economically defendable area (Macdonald 1983; Kruuk& Macdonald 1985; Carr & Macdonald 1986). For Cape clawlessotters Aonyx capensisr resource patches are assumed to be reedbeds Phragmites australis. This assumption is made in light of
Stellenbosch University http://scholar.sun.ac.za

57
the results of chapters 2 & 4, which shows that A. capens~s
preÏer these areas for foraging and that their preferred prey aremore abundant here than in other habitat types sampled. Also mostfreshwater fish species use submerged macrophytes in which tobreed and hide (Skelton 1993). I therefore predict a variation ofspatial organisation of A. capensis owing to a variation in thedistribution of reed beds.
Aonyx capensis are widely distributed in sub-Saharan Africa(Rowe-Rowe & Somers 1998; Nel & Somers in press) and occur mainlyin freshwater habitats such as rivers, marshes, lakes and damswhere they eat predominantly freshwater crabs (Potamonautes
spp.). In South Africa, and elsewhere in Africa, however, thesefreshwater habitats are under serious and increasing threat(Davies & Day 1998) .
Arden-Clarke (1983, 1986) provided home range data for sevenmale otters (radio-tracking data) and one female otter (usingrecovery of 65Zn-labelled spraints) in a marine habitat. No dataare available on the home range size of A. capensis in freshwaterhabitats. The data of Arden-Clarke (1983, 1986) indicate that A.
capensis do not conform to the standard mustelid spacingpatterns, which is to have intrasexual territories where malesare territorial against males, females against females (perhapsincluding most recent offspring), with extensive overlap betweensexes and male territories being larger than those of females(Powell 1979). It appears that A. capensis mostly forage alonebut occur in groups of up to five (Rowe-Rowe 1978; Arden Clarke1983; Somers 2000b (Chapter 6)).
This study provides data, using radio telemetry, on movementparameters of individual A. capensis in two Western Cape Provincerivers. The main objectives of this study were:
1. To determine, for the first time, home range sizes andmovement parameters of A. capensis in freshwater habitats.
2. To determine spatial organisation, density and group sizesof A. capensis in freshwater habitats.
3. To test the hypothesis that A. capensis in freshwaterhabitats do not conform to the typical mustelid spacing
Stellenbosch University http://scholar.sun.ac.za

58
pattern (Powell 1979), and 4) To test predictions based ona hypothesis (RDH of Macdonald 1983) relating otterdispersion to the distribution of resources.
MATERIALS & METHODS
Data were collected in the Eerste (near Stellenbosch (33° 56' S,18° 52' E)) and Olifants (near Clanwilliam (32° 11' S, 18° 23'E)) rivers in the Western Cape Province, South Africa.
The Eerste River is a rocky, narrow river, which begins inpristine conditions in the Jonkershoek Mountains, but then flowsthrough agricultural, industrial and urban areas. Most of theEerste River has a stony bed, and consists of runs, riffles andoccasional deep pools (Brown & Dallas 1995). The flow rate isvariable depending on rainfall, which mostly occurs in winter. Itreaches the sea about 40 km from its source. It is disturbed forca 90% of its length by agriculture, industry and the urbanenvironment. The main crops are vines, fruit, and vegetables, allof which are subject to heavy applications of fertilizers,herbicides and pesticides (Heinecken et al. 1983). Wineryeffluents are either irrigated onto pasturelands or sent to theStellenbosch sewage works. Treated effluent from these works isdischarged into a tributary (Veldwagters River) of the EersteRiver (Heinecken et al. 1983). During heavy rainfall eventsoverflow of the sewage works occurs and untreated sewage flowsinto the river below Stellenbosch (personal observations). TheEerste River and a number of its tributaries flow through thetown of Stellenbosch, and these receive all the storm water run-off from the town. Pollution levels and eutrophication increasesrapidly below Stellenbosch. The treated sewage from the towns ofMacassar, Somerset West and Strand is also discharged into theestuary of the Eerste River (Heinecken et al. 1983). The riparianvegetation along the lower part of the river is mostly theinvasive alien, Acacia mearnsii. For a detailed classification
Stellenbosch University http://scholar.sun.ac.za

59
and description of the Eerste River see Brown & Dallas (1995)and Eekhout et al. (1997).
The Olifants River is 285 km long and has a catchment area of46 220 km2• The part of the Olifants River used in this study isdominated by two impoundments: the Clanwilliam and Bulshoek Dams.There are holiday camps along the edge of both impoundments andrecreational boating, swimming, and fishing takes place. Thelength of river between the two impoundments is 17.6 km and it isbordered by cattle and crops. There is, however, littledisturbance along the water edge where mostly alien Eucalyptus
trees grow. Just above Bulshoek Dam the river is slow flowing,has a sandy bank with reed beds, bulrushes Typha capensis andoccasional sedges Cyperus spp along the edge. The river belowBulshoek Dam is slow flowing with marshlands, oxbows, largebasins, large reed beds, bulrushes, and rocky pools of up to 6 mdeep. Except for recreational activities on the dam (mostlyduring weekends and the summer holidays), there is minimaldisturbance. The area down to ca 15 km below Bulshoek Dam is notintensively farmed, except for some cattle farming, againresulting in very little disturbance. For a detailedclassification of the Olifants River see Harrison (1997) andEekhout et al. (1997).
Seven otters (Table 3.1) were caught in standard carnivoretraps (800 X 800 X 1400 mm) as described by van der Zee (1979,1982) and Arden-Clarke (1983, 1986). The traps were baited witheither fish and/or fresh spraints from another area. Fish baitused in the Eerste River was rainbow trout Oncorhynchus mykiss,
and in the Olifants River shallow-water hake Merluccius capensis.
The otters were anaesthetized with ketamine hydrochloride(Ketalar 50 mg/ml Parke Davis). Radio transmitters (IMP/300/L,implantable transmitter, 40g, 80 x 20 mm diameter cylinder(Telonics Inc., Arizona, USA)) were implanted by a veterinarysurgeon into the otters following the same procedures asdescribed by McKenzie et al. (1990). The transmitters were leftfree floating in the abdominal cavity. A Telonics TR-4 receiverand multidirectional whip antenna were used to find the general
Stellenbosch University http://scholar.sun.ac.za

60
locality of the otters. The TR-4 receiver and a RA - 2A antennawere then used to find their position. Otter Ml was found deadfour months after the transmitter was implanted. There were skinpunctures, which appeared to be a result of another animal. Onpost-mortem there appeared to be no physical abnormalityassociated with the transmitter.
Continuous radio-tracking (Harris et al. 1990), with fixesbeing taken at 10 min intervals, was carried out. This was doneat times of usual otter activity and periodically on a 24 hourbasis. Activity was detected as fluctuations in signal strength.Whenever possible, otters were visually observed using 10x42binoculars. A total of 1579 h was spent radio-tracking between1993 and 1995 of which 851 h were of active otters (Table 3.1).Observations and radio-tracking were conducted from a vehicle andon foot. The otters were located by triangulation (usually fromthe vehicle) or tracking (on foot) the path of increasing signalstrength to within ca 20 m of the animal or closer.
The study areas were divided into numbered, 100 m stretchesof river, and these drawn on 1 : 50 000 topographical maps and 1: 10 000 orthophotographs of the study area. The position of theotters was continuously recorded on tape.
Four measures of home range were determined: the totallength, core length, total area and core area of river used byeach otter. Areas were measured by multiplying the mean width ofthe river by 100 m by the number of sections that the otter used.Mean width was determined from the mean of the two ends of the100 ID section. The amount of overlap in home range lengths wasdetermined. Following Kruuk & Moorhouse (1991), core areas forthe otters were taken as the shortest stretch where each otterspent more than 50% of its time.
Although it may not be logical to compare otters living alongmarine coasts with those in rivers (Kruuk 1995) it would beinteresting to note any differences. The total home range lengthsand areas found along the Tsitsikama coast (Arden-Clarke 1983,1986) were therefore statistically compared with the results fromthe present study.
Stellenbosch University http://scholar.sun.ac.za

61
The amount and distribution of preferred A. capensis
habitat (reed beds) (Chapter 4) were measured in the otters' homeranges. These and body size of the otters (Table 3.1) werecorrelated to the various measures of home range size.
The number of reed beds and the mean distance to the nearestreed bed (patch distribution) was measured using the 1: 10 000orthophotographs. Only reed beds large enough to be seen on theorthophotographs were counted. These were assumed to be largeenough to be a significant source of food to the otters and wereconsistent over years. Reed beds that stretched over more thanone 100 m section were counted as the number of sections overwhich they stretched.
Following Durbin (1996a), for each tracking session the rateof range use = LIT, and revisit index = DIL were measured. D isthe total distance travelled by the otter during the session(including revisited areas), T is the time it spent active duringthe session and L is the length of range that it used. Thesemovement parameters were correlated to the various measures ofhome range size.
To determine density of the otters along the Olifants Riverthe detection of isotopes in spraints (isotope-based LincolnIndex), as used for European otters Lutra lutra (Durbin 1993;Kruuk et al. 1993), was used. One otter (F2) was injected with6~Zn. Fifty five spraints were collected within the following twoweeks and tested for radioactivity. Thereafter the laboratory,which did the tests for me, unfortunately closed.
RESULTS
Home ranges
Except for otter F1, the range expansion over time radio-trackedshows that longer study periods would have had minimal effect onmeasured home range length (Fig. 3.1 & 3.2).
Stellenbosch University http://scholar.sun.ac.za

62
Table 3.1. Radio-tracking of Cape clawless otters Aonyx capens~s in the (a) Eerste and (b)Olifants Rivers, Western Cape Province, South Africa. M = male; F = female.
AnimalTracking dates(day/mon/yr)
Tracking Otter Sessions trackedperiod activity(h) partial(h) complete total
(a)
Ml (12.2 kg sub-adult)F1 (10 kg adult)M2 (18 kg adult)
20/07/93 - 16/11/9310/08/93 - 13/08/9318/02/94 - 20/07/94
(b)
M3 (14 kg adul t)M4 (14 kg adult)F2 (11.5 kg adult)F3 (10 kg adult)
24/03/94 - 05/12/9423/04/94 - 13/05/9518/05/94 - 12/04/9522/11/94 - 31/08/95
21625
246
1401157
464
48
222
33
486
82
189208447248
105123248167
12204918
4548
11046
33286128
Stellenbosch University http://scholar.sun.ac.za

40• M1
35 _- F1-Á--- M2
30--.E 25se--.c+-'0>C 20Q)
Q)0>Cco 15 •0:: -:
.>10
63
90
Fig. 3.1. Cumulative home range length against time radio-~racking active Cape clawless Aonyx capensis otters in the EersteRiver.
5 _ _....._-~--Á---_.....
o 10 60 7020 30 40 50 80Time (h)
Stellenbosch University http://scholar.sun.ac.za

........E
..:::t:.-..c 30......0>CQ)
Q)0> 20ccu0::
60
• • •
• M3
50 _- M4-.__- F2-__"'-- F3
40
-----
10
o
o 100Time (h)
20050 150
Fig. 3.2. Cumulative home range length against time radlc-tracking active Cape clawless otters Aonyx caDens~s in theOlifants River.
64
250
Stellenbosch University http://scholar.sun.ac.za

65
The otters were never seen or radio-located more than ca 5m away from water. Total home range length varied from 4.9 to54.1 km, and core home range length varied from 0.2 to 9.8 km(Table 3.2; Fig. 3.1 & 3.2). Total home range area varied from4.9 to 1062.5 ha, while core home range area varied from 1.1 to138.9 ha. The total and core home ranges of otter M2 were short(4.9 & 0.2 km respectively) and small (4.9 & 1.1 ha respectively)mainly owing to his habit of leaving his resting place and movingca 200 m to a floating rainbow trout tank from which he fedalmost exclusively. Excluding otter M2 from the analyses below,the total home range length of males was significantly longerthan that of females (t = 4.17, d.f. = 4, P = 0.014) (Table 3.2)
This was not the case with core home range length (t = 2.04,d.f. = 4, P = 0.11, power of test with alpha 0.275) (As thepower of this test was below the desired 0.8 the negative findingshould be interpreted with caution. This applies to other testswhere the power of the test is given and is below 0.8).
Males and females did not have significantly different sizedtotal or core home range areas
0.331, power of test 0.07)(total area: t = 1.11, d.f. = 4, P
(core area: t = 1.30, d.f. = 4, P
0.265, power of test 0.01) (Table 3.2). Combining sexes,total and core home range lengths were not significantlydifferent between the Eerste and Olifants Rivers (total homerange length: t = -0.49, d.f. = 4, P = 0.651, power of test withalpha = 0.05) (core home range length: t = -1.69, d.f. = 4, P =
0.166, power of test with alpha = 0.182) (Table 3.2). However,otters in the Olifants River using the Clanwilliam and Bulshoekdams as part of their home ranges occupied areas that were muchlarger (mean = 416.5, range = 119.8-1062.5 ha) than those in theEerste River (mean = 16.9, range = 4.9-32.0 ha). Despite this,total and core home range areas were not significantly differentbetween the Eerste and Olifants Rivers (total home range area:Mann-Whitney U 12, d.f. 6, P 0.06) (core home range area:Mann-Whitney U 12, d.f. 6, P 0.06) (Table 3.2). Total homeranges of the radio-tracked male otters in both rivers overlappedconsiderably.
Stellenbosch University http://scholar.sun.ac.za

66
Table 3.2. Various measures of home range size of Cape clawless otters Aonyx capens~s in the (a)Eerste and (b) Olifants Rivers, Western Cape Province, South Africa.
River Total length(km)
Core length(km)
Total area(ha)
Core area(ha)
Animal
(a)
MlFlM2
35.614.64.9
3.71.00.2
32.013.84.9
3.91.31.1
(b)
M3F2M4F3
54.118.937.418.1
9.84.27.93.6
1062.5200.3283.5119.8
138.963.0
129.625.2
Mean sizes: 26.2 4.3 245.3 51. 9
Stellenbosch University http://scholar.sun.ac.za

67
The males also overlapped the total home range lengths of thefemales. Core home range lengths of males overlapped with othermales and females but the two female core home ranges in theOlifants River only overlapped with one 100 m section (Fig. 3.3 &3.4; Table 3.3). Despite the spatial overlap (Table 3.3) betweenthe total home ranges of otters F2 and F3, no temporal overlapoccurred in the section common to both.
Otters F1 and Ml used the Eerste River in the urbanenvironment of Stellenbosch town. All the otters used humandisturbed parts of the Eerste and Olifants Rivers and Clanwilliamand Bulshoek dams, which were in their home ranges. As there wasa significant difference in total home range lengths betweenmales and females in the present study only males were comparedwith those of Arden-Clarke (1983, 1986). There was a significantdifference between the total home range lengths of males betweenthe two habitats (t = -2.66, d.f. = 8, P = 0.03). As there was nosignificant difference between the total home range areas ofmales and females in the present study, these data were pooledand compared with those of Arden-Clarke (1983, 1986). There wasno significant difference between total home range areas of theotters living in the marine environment of Tsitsikama and thosein the present study area.
Members of both sexes foraged and rested independently ofothers. Only once did tracked otters spend time together. OttersF3 and M4 were together from 15:00 to 21:50 on 14 March 1995.They were resting together from at least 15:00 until 19:10 afterwhich they were foraging together until 21:50. At 10:20 on 2November 1994 otter M4 was seen swimming in one of the large deeppools below Bulshoek Dam. With him were five other otters. Theydid not appear to be foraging, but swimming and diving together.At 11:40 another two otters approached from upriver. The ottersvocalised with whistles and squeaks while swimming rapidly aroundeach other. They all moved off into a reed bed and were not seenagain. At 12:20, two otters (presumably the two that had justarrived) swam out of the reeds and went off.
Stellenbosch University http://scholar.sun.ac.za

Cl)
(IJ
Ee«
68
_ F1 Core range
------------ F1 Total range
• M2 Core range
---- M2 Total range
___ M1 Core range_____________________________ M1 Total range
o 50 450100 150 200 250 300 350 400
Distance (100 m sections)
Fig. 3.3. Total home range, core ranges and home range overlap of three radio-tracked Cape clawlessotters Aonyx capensis in the Eerste River, Western Cape Province, South Africa.
Stellenbosch University http://scholar.sun.ac.za

69
_ F3 Core range__________ F3 Total range
___ F2 Core range__________ F2 Total range
_____ M4 Core range
~------------------- M4 Total range
_____ M3 Core range_____________________________ M3 Total range
o 100 400 500 600 700200 300Distance (100 m sections)
Fig. 3.4. Total home range, core ranges and home range overlap of four radio-tracked Cape clawlessotters Aonyx capensis in the Olifants River, Western Cape Province, South Africa.
Stellenbosch University http://scholar.sun.ac.za

70
Table 3.3. The spatial overlap of linear home ranges (total and core) between individual Capeclawless otters Aonyx capensis in the (a) Eerste and (b) Olifants Rivers, Western Cape Province,South Africa.
RiverAnimals
Total home range length(km) (%: %)
Core home range length(km) (%: %)
(a)M1:F1 14.6 41.0:100.0 0.9 24.3: 90.0Ml :M2 4.9 13.8:100.0 0.2 5.4:100.0M2:F1 2.8 19.2: 57.1 0.0
(b)M3: F2 18.9 34.9:100.0 4.2 42.9:100.0M3:F3 18.1 33.5:100.0 3.6 36.7:100.0M3:M4 37.0 68.4: 98.9 7.1 72.4: 89.9F2:F3 9.5 50.3: 52.5 0.1 2 .4: 2.8M4: F2 18.9 100.0: 50.5 4.2 53.2:100.0M4:F3 16.9 54.8: 93.4 0.1 1.3: 2.8
Stellenbosch University http://scholar.sun.ac.za

71
From their size they appeared to be a female and a cub. Thesignal of otter M4 showed he was resting from 13:00. Otter M4 wasnot seen the next day but remained in the area. Excluding radio-tracked otters, single otters were seen more often than groups ofotters (Fig. 3.5).
When observed, the otters appeared to use only the edges ofthe rivers and darns and short distances in from the edges inwhich to forage. They occasionally crossed to the opposite side,both in the rivers and darns. Radio-tracked otters were neverobserved foraging in tributaries of either river. Otter F2(Olifants River) and Ml (Eerste River), however, had restingplaces short distances up tributaries.
Spraints were not found near these resting places but werefound at the mouths of the tributaries. The otters in the EersteRiver used a small tributary to access the trout darns in thetrout farm, where they foraged.
As expected, there was significantly (Mann Whitney U = 0,d.f. = 13, P < 0.001) more reed beds in the total areas (mean76.1, S.E. 25.33, range = 20-175), than in the core areas (mean= 7.43, S.E. = 1.57, range = 2-13) (Table 3.4). There was,however, no significant difference (Mann Whitney U = 21, d.f.13, P = 0.71) in the mean reed bed nearest neighbour either inthe total ranges (mean = 276.0, S.E. = 70.9, range 100-679 m),or in the core areas (mean = 287.6, S.E. = 100.86, range = 100-786 m) (TabIe 3.4) .
There were no significant correlations between any of themeasures of horne range size and body weight (Table 3.5).
There was a highly significant correlation between thenumbers of reed beds and total length and total area used (Table3.5). The mean reed bed nearest neighbour was correlated to totalhorne range length but none of the other measures of horne rangesize (TabIe 3.5) .
Stellenbosch University http://scholar.sun.ac.za

72
>.CJc:::G>
5- 30 +-~--I.eLL.';Ie
2 3 4
Group size
Fig. 3.5. The percentage frequency distribution of group size classes of Cape clawJes~ otters Aonyx
capensis seen in the Olifants (n = 13) and Eerste Rivers (n = 2), Western Cape Province, SouthAfrica, between July 1993 and August 1995.
Stellenbosch University http://scholar.sun.ac.za

73
Table 3.4. The number of reed beds and mean reed bed nearestneighbour distance in the total and core home range areas ofindividual Cape clawless otters Aonyx capensis in the (a)Eerste River and (b) Olifants River, Western Cape Province,South Africa.Animal (home No reed beds Mean (± S.E.) nearest
range type) neighbour distance (m)
(a)
Ml (Total) 49 679.2 ± 300.9
Ml (Core) 13 100 ± 0.0
F1 (Total) 23 220.8 ± 120.8
Fl (Core) 10 100 ± 0.0
M2 (Total) 20 100 ± 0.0
M2 (Core) 2 100
(b)
M3 (Total) 175 278.9 ± 56.7
M3 (Core) 10 470.0 ± 144.6
M4 (Total) 169 168.0 ± 35.85
M4 (Core) 7 785.7 ± 430.1
F2 (Total) 61 262.5 ± 78.6
F2 (Core) 2 100
F3 (Total) 36 222.2 ± 73.2
F3 (Core) 8 357.1 ± 110.0
Stellenbosch University http://scholar.sun.ac.za

74
Table 3.5. Spearman rank correlations between various measures of home range size and bodyweight, preferred habitat (reed bed) patch number and dispersal (mean nearest neighbour distancebetween reed beds) for seven Cape clawless otters Aonyx capensis.
Total length Core length Total area Core area
Variable r P r P r P r P
Body weight (kg) 0.04 0.91 0.09 0.78 0.00 0.97 0.00 0.97
No reed beds 0.89 <0.001 0.11 0.78 0.93 <0.001 0.67 0.10
Mean nearest 0.79 0.03 0.49 0.22 0.50 0.22 0.59 0.12
neighbour
Stellenbosch University http://scholar.sun.ac.za

75
Total home range length and core home range length werecorrelated (r = 0.96, n = 7, P < 0.001). However, core length wascorrelated with number of reed beds in the total length (r =
0.96, n = 7, P < 0.001) but not with number of reed beds in thecore length (Table 3.5).
Density
Of the 55 spraints collected and tested for the presence of65Zn, three (5.45%) proved positive. These spraints were collectedfrom 12 km of the Olifants River. With these few data the densityof otters was estimated to be 1.53 otters per km.
Movement parameters
The furthest an otter was recorded movlng in one activitysession was 10.5 km (otter Ml). This was continuous movement bythe otter from above Stellenbosch to below the town. The longestactivity session lasted 11.7 h (otter F2). The otters were activefrom dawn for 2.6 (S.E. = 0.1) h and moved a mean of 0.9 (S.E.0.1) km during this period, i.e. a mean of 350 m/h. They werealso active from sunset for a mean of 2.3 (S.E. = 0.1) h moving amean of 1.3 (S.E. = 0.2) km, i.e. 565 m/h. There was nosignificant difference in the length of home range used betweenmorning and evening activity bouts (Mann-Whitney U = 2951, d.f. =155, P = 0.85). However, the otters were active significantlylonger during the morning than during the evening sessions (Mann-Whitney U = 4881, d.f. = 155, P = 0.013). Distance travelled persession varied from a mean of 0.4 to 2.8 km between individuals(Table 3.6), and the mean activity periods from 1.6 to 3.1 h(Table 3.6).
Kruskal-Wallis One Way Analysis of Variance on Ranks showed asignificant difference in time active among individual otters (H
= 36.84, d.f. = 6, P < 0.001). An all pairwise multiplecomparison (Dunn's method) isolated otter M2 as the individual tobe less active than the other otters. Otter M2 was the otter thatfished almost exclusively for trout (see above).
Stellenbosch University http://scholar.sun.ac.za

76
Table 3.6. Mean distances moved and activity periods of individual Cape clawless otters Aonyx
capensis during complete tracking sessions in the (a) Eerste and (b) Olifants Rivers, Western CapeProvince, South Africa. Means are given ± standard error. Ranges are given in parenthesis.
River Activity session
Animal Distance (km) Activity period (h)n
(a)Ml 22 1.5 ± 0.6 (0.1-10.5) 2.6 ± 0.2 (0.7-3.8)F1 2 1.0 ± 0.1 (0.9-1.1) 2.3 ± 1.2 (1.2-3.5)M2 33 0.4 ± 0.1 (0.1-1.6) 1.6 ± 0.1 (1.0-3.0)
(b)
M3 12 2.8 ± 0.8 (0.5-9.4) 2.3 ± 0.2 (1.3-3.3)F2 49 1.2 ± 0.3 (0.1-6.0) 2.7 ± 0.3 (0.3-11.7)M4 20 1.4 ± 0.3 (0.1-4.0) 3.1 ± 0.2 (2.0-4.7)F3 18 0.6 ± 0.1 (0.1-1.6) 2.2 ± 0.2 (0.8-3.3)
All 156 1.2 ± 0.1 2.4 ± 0.1
Stellenbosch University http://scholar.sun.ac.za

77
Excluding M2 there was no significant difference betweenindividuals with regards time active (H = 9.97, d.f. = 6, P
0.126) .Range use rate varied between 0.2 and 1.2 km/h between
individuals (Table 3.7). There was a significant differencebetween range use rate among individuals (H = 19.7, d.f. = 6, P =0.003). An all pairwise multiple comparison isolated otter M3 asthe individual to differ from the others with regards range userate.
Revisit index varied between 1.0 and 1.7 among individuals(Table 3.7). There was a significant difference in the revisitindex among individual otters (H = 44.2, d.f. = 6, P < 0.001). Anall pairwise multiple comparison isolated otter M2 as theindividual to differ from the others with regards the revisitindex.
Table 3.8 provides the Spearman correlations between themovement parameters and the various measures of home range size.There was a significant correlation between distance travelledand the total and core home range lengths. Total home rangelength was correlated to range use rate. The other correlationswere not significant (Table 3.8).
DISCUSSION
The most striking result found was the long total home rangesused by some of the males. otter home ranges are, however,probably better expressed as area of water used (Kruuk &Moorhouse 1991; Kruuk 1995). Although it is convenient to measureotter home ranges in terms of length, comparisons with otherareas should be made with caution (Kruuk & Moorhouse 1991). Fromthe results and following discussion it is evident that the useof both home range length and home range area are appropriate inanalysing home range of A. capensis.
Stellenbosch University http://scholar.sun.ac.za
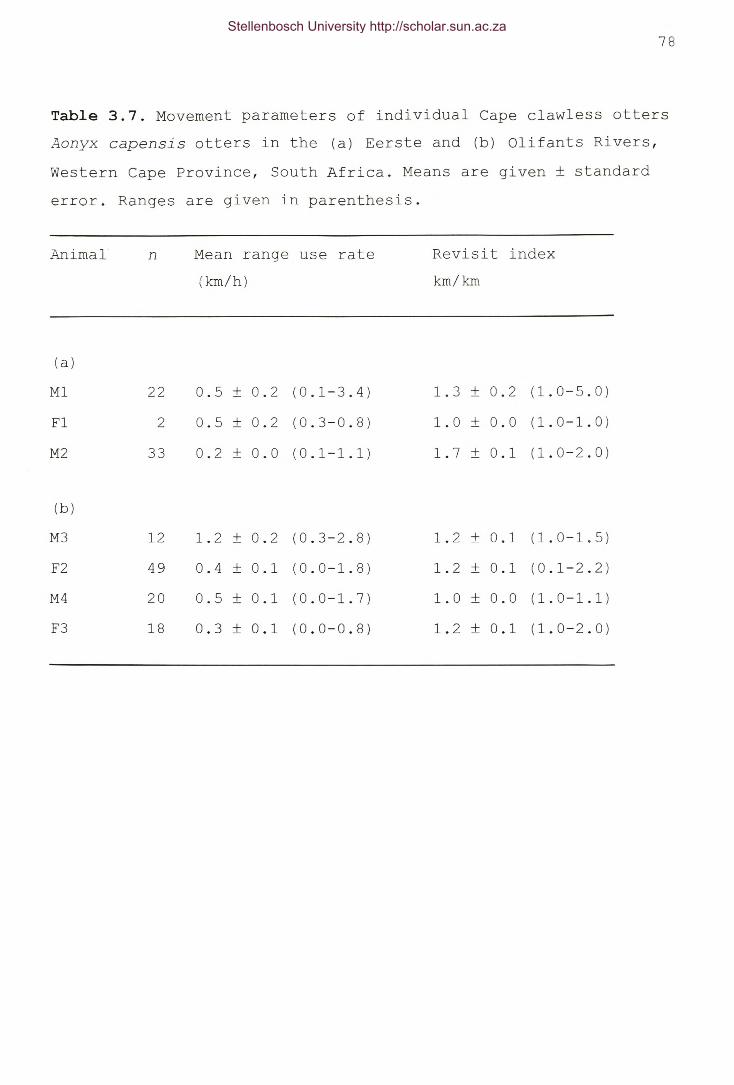
78
Table 3.7. Movement parameters of individual Cape clawless ottersAonyx capensis otters in the (a) Eerste and (b) Olifants Rivers,Western Cape Province, South Africa. Means are given ± standarderror. Ranges are given in parenthesis.
Animal n Mean range use rate(km/h)
Revisit indexkm/km
(a)
MlF1M2
222
33
0.5 ± 0.2 (0.1-3.4)0.5 ± 0.2 (0.3-0.8)0.2 ± 0.0 (0.1-1.1)
1.3 ± 0.2 (1.0-5.0)1.0 ± 0.0 (1.0-1.0)1.7 ± 0.1 (1.0-2.0)
(b)
M3 12 1.2 ± 0.2 (0.3-2.8) 1.2 ± 0.1 (1.0-1.5)F2 49 0.4 ± 0.1 (0.0-1.8) 1.2 ± 0.1 (0.1-2.2)M4 20 0.5 ± 0.1 (0.0-1.7) 1.0 ± 0.0 (1.0-1.1)F3 18 0.3 ± 0.1 (0.0-0.8) 1.2 ± 0.1 (1.0-2.0)
Stellenbosch University http://scholar.sun.ac.za

79
Table 3.8. Spearman rank correlations between various measures of home rangesize and movement parameters of seven Cape clawless otters Aonyx capensis.
Total length Core length Total area Core area
Variable R P r P R P r P
Time active 0.63 0.09 0.67 0.07 0.56 0.15 0.56 0.15
Distance 0.93 <0.001 0.86 0.006 0.71 0.05 0.71 0.05
travelled
Range use rate 0.78 0.03 0.70 0.05 0.59 0.12 0.59 0.12
Revisit index -0.26 0.55 -0.34 0.44 -0.41 0.30 -0.41 0.30
Stellenbosch University http://scholar.sun.ac.za

80
As in L. lutra (Kruuk 1995) and other species (referencesgiven in the introduction) spatial organisation of A. capensis isexpected to be variable. Even within broadly similar habitatsthere is considerable intraspecific variation in carnivore homerange sizes (Macdonald 1983). The large variation in area used inthe two rivers may be a result of A. capensis not using largesurface areas for foraging, but mostly the edges of dams andrivers. It is unclear why they did not use the central parts ofthe dams. It may simply be too deep for the otters, or there werefewer crabs further away from the edge (Chapter 2). Although crabdensity was higher in the Olifants River than in the Eerste River(Chapter 2) home ranges were smaller (although not significantlyso) in the Eerste River. Increased prey would be expected toaffect group size but not home range size (Macdonald 1983). I didnot have enough sightings of otters in the Eerste River tostatistically test if there were differences between group sizesin the two rivers. The prediction of the RDH that group sizeincreases with increased richness of resources is supported bythe data of Perrin et al. (2000). They found that in an areawhere food from the river was supplemented by dams artificiallystocked with trout 70% of groups seen comprised 3 or more otters(n = 73), whereas at Stillerust (river, reed beds, oxbows) 77%comprised 2 Otters and 3 were seen on only two occasions (n =31). The RDH also takes resource dispersion into account. Fromthe RDH we would predict that home range size increases withincreased dispersal of reed beds, which is what was found fortotal length of rivers used by the otters. The fact that theotters did not use most of the dam's surface may explain why thecorrelations for the other home range areas were not significant.
As in L. lutra in Scotland (Kruuk 1995; Durbin 1996a, 1996b)males of A. capensis used longer home ranges than females. Kruuk(1995) stated that as male L. lutra are 1.5X heavier than femalesthis alone might explain the difference in home range sizesbetween the sexes (McNab 1963; Clutton-Brock & Harvey 1977; Grantet al. 1992). As intersexual differences in social behaviour andspacing behaviour are common in mammals (Wilson 1975; Crook et
Stellenbosch University http://scholar.sun.ac.za

81
al. 1976) they are not unexpected here. The reasons may varybut size of species, diet or dispersal of resources may allaffect the various species. There was, however, no relationshipbetween body size and home range size for the otters in thepresent study. Other explanations must therefore be explored. Asboth sexes of A. capensis appear to have similar diets I wouldnot expect diet to affect intersexual home range size of A.
capensis. The variation in intersexual home range size may be aresult of undefended home ranges usually being larger thandefended home ranges (Grant et al. 1992). Total home ranges ofthe radio-tracked otters in the two rivers overlappedconsiderably between and within sexes, which with the findingthat home ranges of otters F2 and F3 were exclusive when theywere radio-tracked concurrently and only shared one 100 m sectionof core length, is evidence that they have evolved a variation ofthe typical mustelid spacing pattern as described above (Powell1979). The pattern of female home ranges is suggestive ofterritoriality. Although there was no evidence for the areasbeing defended, thus being territories as defended areas (Burt1943), the areas were exclusive (Schoener 1968). Kruuk (1995)described turnaround points or boundaries for female spatialgroups. Although this may be the case with A. capensis, I neversaw another female in the core areas of otters F2 or F3. Moredirect radio-tracking data and direct observations would beneeded to determine if the females were defending their homeranges. If, however, the females are territorial, as seemslikely, and have defended home ranges, there would be a cost todefending a home range and the smaller the home range the smallerthe cost. As other females would be excluded, there would befewer competitors in the range. The home ranges could thereforebe smaller than those of the males, who have to share with othermales and females. Some evidence against this explanation,however, is that core lengths or areas were not significantlydifferent between sexes, which are what females appear to bedefending.
Stellenbosch University http://scholar.sun.ac.za
82
As members of both sexes of A. capens~s tended to forageand rest independently of other adults, this study supports thenotion that A. capensis are solitary. Most species of carnivoresare, however, solitary, with single females defending territoriesagainst other females, and single males using larger areas, whichoverlap the ranges of several females but exclude other males(Kruuk & Macdonald 1985). In Somers (2000b) (Chapter 6), thelargest foraging group observed consisted of three individuals,which is less than found by Arden-Clarke (1983) who recordedthree groups of four and one group of five (n = 67). The resultsfound here were more consistent with those found by Arden-Clarke(1983) than those found by Somers (2000b (Chapter 6)). These datasuggest that A. capensis have similar group structures in therivers and marine habitats so far investigated.
The fact that body size and home range size was notcorrelated and that males had larger home ranges than females,indicates that home ranges of males were larger than needed tomeet energetic requirements, suggesting that distribution offemales may be important in the spacing of the males. As femaleA. capensis appear to be spread out, males are expected not tocompete and therefore not form male alliances as happens in someother carnivores (e.g. Cheetah (Caro 1994)). The males withoverlapping home ranges may be co-operating in defending a homerange with many females. Each male by himself may not be able topatrol the area and keep it scent-marked adequately. This would,however, only happen if there was no shortage of females. Theymay, however, not be co-operating but the costs to each ofexpelling the others may be too great (Macdonald & Carr 1989)This may select for the formation of male group home ranges. Ifthis were the case we would expect group size to decrease inhabitats with decreased prey richness.
Lutra lutra females and males overlap with no territories ineither sex (Kruuk & Moorhouse 1991; Kruuk 1995). Female coreareas were, however, like A. capensis, exclusive. However, in L.
lutra there were exclusive group ranges. There has not been
Stellenbosch University http://scholar.sun.ac.za
83
enough female A. capens~s radio-tracked to determine if this isalso the case with this species.
The data of Arden-Clarke (1986) suggest the existence of aclan-type social organization. Kruuk (1978) described a clan as agroup of animals (he uses badgers Meles meles) jointly inhabitingan area where females may use only part of that area. Data are atpresent too few to elucidate this. Broadly, the males may haveempires and the females may have enclaves (Kruuk & Macdonald1985) .
The spatial organization I have described where males overlapmales, possibly forming male group ranges, and males overlap manyfemales, with the females being possibly territorial is common inmustelids (Powell 1979). This intraspecific variation in spatialpatterns within my study animals, as well as those of Arden-Clarke (1996), is consistent with the general mammalian spatialpatterns as described above.
Similar to this study, the size of badger territories isclosely correlated with the distance between feeding patches(Kruuk & Parish 1982) (reed beds in the present case). The numberof badgers per clan was correlated with the biomass of earthwormsper territory and with the biomass of earthworms per field orpatch (Kruuk & Parish 1982). I could not determine prey richnessbut would predict from the RDH that the number of males in arange would be less where prey richness is less.
Male North American river otters Lutra canadensis have beensuggested to move in groups of males ('bachelor groups') or inhome range groups (Melquist & Hornocker 1983; Larsen 1983 citedin Kruuk 1995). In the often-sympatric L. maculicollis there isintrasexual and intersexual overlap in home ranges (Perrin et al.
2000) but the existence of group home ranges is uncertain.The largest male otter (M2) was expected to have the largest
home range. His use of the abundant trout in the trout tank,however, enabled him to use only a small home range. Thisobserved small home range of M2 therefore suggests that thebenefits of an abundant food resource was possibly, at leastduring the time radio-tracked, more beneficial to it than
Stellenbosch University http://scholar.sun.ac.za

84
coverlng as large an area as possible to gain access to manyfemales.
There appears to be some differences between the coastalliving otters and those living in freshwater, at least in totalhome range lengths of males. Rowe-Rowe (1992) predicted that ascoastal-living freshwater otters occur at higher densities in themarine environment (Estes 1989) the same would apply to A.
capensis and they would have greater area requirements in afreshwater system. This appears not to be the case. The otters infresh water had longer, but not larger home ranges. Arden-Clarke(1993) estimated that the otters he studied never foraged morethan 100 m from the coast. Whether they use all 100 m equally,however, is unknown. The presence of the large Bulshoek andClanwilliam Dams in the Olifants River almost certainly causedthe home range areas in the present study to be inflated. TheTsitsikama marine reserve is probably more productive than thetwo rivers, which could explain the different home range lengths.Food patches may also be closer together in the marineenvironment, which could explain the smaller home ranges. Thecomparison between home range parameters of marine and freshwaterenvironments therefore remains inconclusive.
Other otter species have varying home range sizes. Infreshwater habitats in northeast Scotland the much smaller L.
lutra have been found to have a mean home range length of 34.8 kmfor males (n = 6) and 20.0 km for females (n = 2, range = 18.2-84.4 km) (Durbin 1993, 1996a, 1996b; Kruuk 1995) . Another studyfound them to range over distances of 39.1 km for a male and 18km for females (n = 2) (Green et al. 1984). Core lengths of L.
lutra vary from 5.4-38.0 km (Durbin 1993, 1996a). A young maleand adult female were radio-tracked in Spain for 20.7 and 11.8 kmrespectively (Ruiz-Olmo et al. 1995). Home range areas range from66.5-276.3 ha (Green et al. 1984) and 10.2-35.6 ha (Durbin1996a). Lutra canadensis have total home range lengths from 10-81km (mean = 39.8, S.E. = 4.0) (Melquist & Hornocker 1983).Spotted-Necked otters Lutra maculicollis which occur in SouthAfrica, but not the Western Cape, and which are mostly
Stellenbosch University http://scholar.sun.ac.za

85
plsclvorous (Rowe-Rowe & Somers 1998) have total home rangelengths with a mean of 14.8 km (range 6.9-23.2 km), home rangeareas of 114.0-1714.0 ha and core areas of 100.0-941.0 ha (Perrinet al. 2000). The home range areas were, however, 100% MinimumConvex Polygon measures. As this included more land than water itcannot be used for comparisons for the other measures of homerange areas used here and in the other studies cited. Four radio-tracked smooth-coated otters Lutra perspicillata (weight = 7-11kg; Harris 1968) have been found to use short (mean = 7.3, S.E.0.5, 5.5-11.3 km) and small (mean = 2.8, S.E. 0.5, range 2.1-4.4 ha) home ranges (Hussain & Choudhury 1995). These were,however, all juvenile or sub-adult animals. Other individuals,not radio-tracked, had estimated home ranges of 17.0 km and 6.6ha (adult male) and 5.5 km and 2.1 ha (a mother and cub)respectively (Hussain & Choudhury 1995) .
Although the use of different methods and large intraspecificvariations in home range sizes from this study and the otherspecies make predicting trends difficult, A. capensis do notappear to have larger home ranges than the other, smaller(Foster-Turley et al. 1990), freshwater species.
Other factors such as human disturbance may also play asignificant role in determining home-range size (Ciucci et al.
1997), especially in shy species such as otters. The home rangesof the otters studied here included areas of high human impact(town, camping sites and dams). They have, therefore, adapted,although to an unknown extent, to an altered environment. Theseresults show the Lutrinae to be adaptable with regards to someaspects of spatial use.
Other authors (Van der Zee 1979, 1982; Arden-Clarke 1983,1986; Verwoerd 1987) have estimated one otter for every two km ofmarine coast. Estimates for freshwater habitats are one otter per1.25-2.5 km (Carugati 1995), one otter per 3-4 km (Rowe-Rowe1992) and one otter per 8-10 km of river (Butler & du Toit 1994)Butler & du Toit (1994) predicted that the low density inZimbabwe was a result of the poor productivity of freshwatercrabs. The estimated density of one otter per 0.65 km found in
Stellenbosch University http://scholar.sun.ac.za

86
the present study was higher than these other studies. This maybe real or a result of the high crab densities in the OlifantsRiver, or the estimate may not be accurate. With only one ottermarked and only 55 spraints sampled this result should be takenas incomplete.
Total home range length was correlated to range use rate,suggesting the otters with larger home ranges were attempting tocover their home range as quickly as those with smaller homeranges. Excluding otter M2, males, besides having larger homerange sizes, had larger range sizes per activity bout, perhapsbecause they were searching for females. otter M3, besides havingthe longest recorded distance moved, also had the highest rangeuse rate further suggesting he was looking for mates or maleintruders rather than just searching for good foraging sites.Otter M2 had the highest revisit index owing to his habit offeeding at the same place (trout tank) during most activitysessions.
An underlying assumption of most radio-tracking studies isthat the instrumented animals are moving through the environment,responding to stimuli, and behaving in a similar way to non-instrumented animals (White & Garrott 1990). As there was noevidence that the otters in the present study were affected bythe implants I confidently accepted this assumption. The mainshortcoming of the data was the small sample size of sevenotters. This either prevented statistical analysis or reduced thepower of some of the tests, which caused some results to beinconclusive and difficult to interpret. To measure theavailability of resources, such as prey, is also notoriouslydifficult (Macdonald 1983) and this study was no exception. Thelarge home ranges and deep waters made it impossible to measureabsolute prey densities. The distribution of food was thereforemeasured indirectly by counting the number of reed beds and theirmean nearest neighbour distance.As the otters certainly foraged in other areas of the rivers anddams besides the reed beds, this analysis is imperfect. Also,even where different habitat types have different prey
Stellenbosch University http://scholar.sun.ac.za

87
availability, such as in this study (Chapter 2), spatial andtemporal variation in aggregation within habitats would haveimportant implications for home range configuration (Johnson et
al. 2001). The RDH is also based on the assumption that thepopulations in question are limited by food, or other resourceavailability (Kruuk & Macdonald 1985). One of the assumptionsleading to the RDH predictions tested here is that the number ofpatches (reed beds) correlates with home range size. This isexpected since larger home ranges are more likely to incorporatemore patches. It was, however, specifically tested since it is anassumption crucial to deriving the above predictions (Johnson etal. 2001). This assumption is supported with highly significantresults in this study, but only for total length and total areaused by the otters. This, like so many other studies (see Johnsonet al. 2001 for refs), however, remains an imperfect test of theRDH. Although more data are needed to use the RDH to predict andexplain the group structure of A. capensis, we can make somepreliminary predictions on the data we have.
The large home ranges found show that large stretches ofrivers would need to be protected to effectively conserve otters.The use of the entire Eerste River by otter Ml shows that thismay even include whole rivers and not just large stretches. Thisis important when planning an effective conservation managementplan for the species. In South Africa, and elsewhere in Africa,freshwater habitats are under serious and increasing threat(Davies & Day 1998). In South Africa, e.g., at best, with theslowest estimated population growth and the smallest demand forwater, fresh water supplies will no longer be able to meet demandsome time between 2020 (use of all surface water) and 2040 (useof surface and ground water). At worst, with the highestpopulation growth and water demand, supplies will be fullycommitted some time between 2003 and 2015 (Davies & Day 1998) Asalmost all of the water used in South Africa comes from rivers(Davies & Day 1998) the potential impact on A. capensis habitatis of immediate and great concern. Elsewhere in Africa and theworld, rapidly expanding human populations and accelerated water
Stellenbosch University http://scholar.sun.ac.za

88
extraction for industry and agriculture, yields an equallydismal scenario (see Tilman et al. 2001).
Otters often cause damage to trout farms and domestic fowland are therefore caught and either relocated or killed. Thepresent results show that there will probably be other otters inthe area and the problem will not be solved by killing ortranslocations. The results suggest that areas with widelydispersed reed beds will have otters ranging over greaterdistances. Longer stretches of river would need to be conservedif otters were taken into consideration for conservation.
If, as it seems, females have exclusive home ranges, they areprobably density dependent. Habitat loss will directly affecttotal population size and productivity. The increased silting upof South African rivers is also of concern. This causes loss ofreed beds and may cause otters to range over larger areas tofulfil their requirements.
REFERENCESANDERSON, D.J. 1982. The home range: A new nonparametric
estimation technique. Ecology 63: 103-112.ARDEN-CLARKE, C.H.G. 1983. Population density and social
organisation of the Cape clawless otter, Aonyx capensis
Schinz, in the Tsitsikama Coastal National Park. M.Sc.thesis, University of Pretoria, Pretoria, South Africa.
ARDEN-CLARKE, C.H.G. 1986. Population density, home range sizeand spatial organization of the Cape clawless otter, Aonyx
capensis, in a marine habitat. Journal of Zoology, London
209: 201-211.BOTHMA J. DU P., KNIGHT M.H., LE RICHE, E.A.N. & VAN HENS BERGEN
H.J. 1997. Range size of southern Kalahari leopards. South
African Journal Of Wildlife Research 27: 94-99.BOULANGER, J.G. & WHITE, G.C. 1990. A comparison of home-range
estimators using Monte Carlo simulation. Journal of wildlife
Management 54: 310-315.
Stellenbosch University http://scholar.sun.ac.za

89
BROWN, C.A. & DALLAS, H.F. 1995. Eerste River, Western Cape:
situation assessment of the riverine ecosystem. CSIR,Stellenbosch.
BROWN, J.L. 1975. The evolution of behavior. W.W. Norton &Company, New York.
BROWN, J.L. & ORlANS, G.H. 1970. Spacing patterns in mobileanimals. Annual Review of Ecological Systems 1: 239-262.
BURT, W.H. 1943. Territoriality and home range concepts asapplied to mammals. Journal of Mammalogy 24: 346-352.
BUTLER, J.R.A. & DU TOIT, J.T. 1994. Diet and conservation ofCape clawless otters in eastern Zimbabwe. South African
Journal of Wildlife Research 24: 41-47.CARO, T.M. 1994. Cheetahs of the Serengeti Plains, University of
Chicago Press, Chicago.CARR, R.J. & MACDONALD, D.W. 1986. The sociality of solitary
foragers: a model based on resource dispersion. Animal
Behaviour 34: 1540-1549.CARUGATI, C. 1995. Habitat, prey, and area requirements of otters
(Aonyx capensis and Lutra maculicollis) in the NatalDrakensberg. M.Sc. thesis, University of Natal,Pietermaritzburg, South Africa.
CIUCCI, P., BOlTANI, L., FRANCISCl, F. & ANDREOLI, G. 1997. Homerange, activity and movements of a wolf pack in centralItaly. Journal of Zoology, London 243: 803-812.
CLUTTON-BROCK, T.H. 1989. Mammalian mating systems. Proceedings
of the Royal Society of London B 236: 339-372.CLUTTON-BROCK, T.H. & HARVEY, P.H. 1977. Primate ecology and
social organisation. Journal of Zoology, London 183: 1-39.CONNER, M.M., PLOWMAN, B.P., LEOPOLD, B.D. & LOVELL, C. 1999.
Influence of time-in-residence on home range and habitat useof bobcats. Journal of Wildlife Management 63: 261-269.
CROOK, J.H., ELLIS, J.E. & GOSS-CUSTARD, J.D. 1976. Mammaliansocial systems: structure and function. Animal Behaviour 24:
261-274.DAVIES, B.R. & DAY, J.A. 1998. Vanishing waters. University of
Cape Town Press, Cape Town.
Stellenbosch University http://scholar.sun.ac.za
90
DAVIES, N.B. & LUNDBERG, A. 1984. Food distribution and avariable mating system in the Dunnock Prunella modularis.
Journal of Animal Ecology 53: 895-912.DIXON, K.R. & CHAPMAN, J.A. 1980. Harmonic mean measure of animal
activity areas. Ecology 61: 1040-1044.DONCASTER, C.P. & MACDONALD, D.W. 1991. Drifting territoriality
in the red fox Vulpes vulpes. Journal of Animal Ecology 60:
423-439.DURBIN, L.S. 1993. Food and habitat utilization of otters (Lutra
lutra L.) in a riparian habitat. D.Phil thesis, University ofAberdeen, Aberdeen, Scotland.
DURBIN, L.S. 1996a. Individual differences in spatial utilizationof a river-system by otters Lutra lutra. Acta Theriologica
41: 137-147.DURBIN, L.S. 1996b. Some changes in the habitat use of free-
ranging female otter Lutra lutra during breeding. Journal of
Zoology, London 240: 761-764.EEKHOUT, S., KING, J.M. & WACKERNAGEL, A. 1997. Classification of
South African river, volume 1., Department of EnvironmentAffairs and Tourism, Pretoria.
EMLEN, S.T. & ORING, L.W. 1977. Ecology, sexual selection, andthe evolution of mating systems. Science 197: 215-223.
ESTES, J.A. 1989. Adaptations for aquatic living by carnivores.In: Carnivore behavior, ecology and evolution, (ed) J.L.Gittleman, Chapman and Hall, London.
FOSTER-TURLEY, P., MACDONALD, S. & MASON, C. 1990. Otters: an
action plan for their conservation. IUCN/SSC Otter SpecialistGroup, Gland.
GAUTESTAD, A.O. & MYSTERUD, I. 1995. The home range ghost. Oikos
74: 195-204.GEFFEN, E., HEFNER, R., MACDONALD, D.W. & UCKO, M. 1992. Habitat
selection and home range in the Blanford's fox Vulpes cana:
compatibility with the resource dispersion hypothesis.Oecologia 91: 75-81.
GEHRT, S.D. & FRITZELL, E.K. 1997. Sexual differences in homeranges of raccoons. Journal of Mammalogy 78: 921-931.
Stellenbosch University http://scholar.sun.ac.za

91
GEHRT, S.D. & FRITZELL, E.K. 1998. Resource distribution,female home range dispersion and male spatial interactions:group structure in a solitary carnivore. Animal Behaviour 55:
1211-1227.GESE, E.M., RONGSTAD, O.J. & MYTTON, W.R. 1988. Home range and
habitat use of coyotes in southeastern Colorado. Journal of
wildlife Management 52: 640-646.GITTLEMAN, J.L. & HARVEY P.H. 1992. Carnivore home-range size,
metabolic needs and ecology. Behavioural Ecology and
Sociobiology 10: 57-83.GRANT, J.W.A., CHAPMAN, C.A. & RICHARDSON, K.S. 1992. Defended
versus undefended home range size of carnivores, ungulatesand primates. Behavioral Ecology and Sociobiology 31: 149-161.
GREEN, J., GREEN, R. & JEFFERIES, D.J. 1984. A radio-trackingsurvey of otters Lutra lutra on a Perthshire river system.Lutra 27: 85-145.
HARRIS, C.J. 1968. Otters: A study of the recent Lutrinae.
Weidenfeld and Nicolson, London.HARRIS, S., CRESSWELL, W.J., FORDE, P.G., TREWHELLA, W.J.,
WOOLLARD, T. & WRAY, S. 1990. Home-range analysis usingradio-tracking data - a review of problems and techniquesparticularly as applied to the study of mammals. Mammal
Review 20: 97-123.HARRISON, T.D. 1997. A preliminary survey of coastal river
systems on the South African west coast, Orange River - GrootBerg, with particular reference to the fish fauna.Transactions of the Royal Society of South Africa 52: 277-321.
HEINECKEN, T.J.E., BICKERTON, l.B. & HEYDORN, A.E.F. 1983. A
Summary of Studies of the Pollution Input by Rivers and
Estuaries Entering False Bay. CSIR, Stellenbosch.HUSSAIN, S.A. & CHOUDHURY, B.C. 1995. Seasonal movement, home
range, and habitat use in smooth coated otters in NationalChambal Sanctuary, India. Habitat 11: 45-55.
JENNRICH, R.I. & TURNER, F.B. 1969. Measurement of non-circular
Stellenbosch University http://scholar.sun.ac.za

92
home range. Journal of Theoretical Biology 22: 227-237.JEWELL, P.A. 1966. The concept of home range in mammals. Symposia
of the Zoological Society of London No. 18: 85-109.JOHNSON, D.D.P., BAKER, S., MORECROFT, M.D. & MACDONALD, D.W.
2001. Long-term resource variation and group size: A large-sample field test of the Resource Dispersion Hypothesis. BMC
Ecology 1: 2.KRUUK, H. 1978. Spatial organization and territorial behaviour of
the European badger Meles meles. Journal of Zoology, London
184: 1-19.KRUUK, H. 1995. Wild otters: Predation and populations. Oxford
University Press, Oxford.KRUUK, H. & MACDONALD, D.W. 1985. Group territories of
carnivores: empires and enclaves. In: Behavioural ecology:
ecological consequences of adaptive behaviour, (eds) R.M.Sibly & R.H. Smith, Blackwell Scientific Publications,Oxford.
KRUUK, H. & MOORHOUSE, A. 1991. The spatial organization ofotters (Lutra lutra) in Shetland. Journal of Zoology, London
224: 41-57.KRUUK, H. & Parish, T. 1982. Factors affecting population
density, group size and territory of the European badger,Meles meles. Journal of Zoology, London 196: 31-39.
KRUUK, H., CARSS, D.N., CONROY, J.W.H. & DURBIN, L.S. 1993. Otter(Lutra lutra L.) numbers and fish productivity in rivers innorth-east Scotland. Symposia of the Zoological Society of
London No. 65: 171-191.LACK, D. 1954. The natural regulation of animal numbers. Oxford
University Press, Oxford.MACDONALD, D.W. 1983. The ecology of carnivore social behaviour.
Nature, London 301: 379-384.MACDONALD, D.W. & CARR, G.M. 1989. Food security and the rewards
of tolerance. In: Comparative socioecology: The behavioural
ecology of humans and animals, (eds) V. Standen & R.A. Foley,Blackwell Scientific, Oxford.
Stellenbosch University http://scholar.sun.ac.za

93
MAHER, C.R. & LOTT, D.F. 1995. Definitions of territorialityused in the study of variation in vertebrate spacingsystems. Animal Behaviour 49: 1581-1597.
MCKENZIE, A.A., MELTZER, D.G.A., LE ROUX, P.G. & GOSS, R.A. 1990.Use of implantable radio transmitters in large Africancarnivores. South African Journal of Wildlife Research 20:
33-35.MCNAB, B.E. 1963. Bioenergetics and the determination of home
range size. American Naturalist 97: 133-140.MCNAB, B.E. 1980. Food habits, energetics, and the population
biology of mammals. American Naturalist 116: 106-124.MELQUIST, W.E. & HORNOCKER, M.G. 1983. Ecology of river otters in
west central Idaho. Wildlife Monographs 83: 1-60.MILLS, M.G.L. 1990. Kalahari hyaenas: The comparative behavioural
ecology of two species. Unwin Hyman, London.NAGY, K.A. 1987. Field metabolic rates and food requirements
scaling in mammals and birds. Ecological Monographs 57: 111-128.
PERRIN, M.R., D'INZILLO CARRANZA, I. & LINN, I.J. 2000. Use ofspace by the spotted-necked otter in the Natal Drakensberg,South Africa. South African Journal of Wildlife Research 30:
15-21.POWELL, R.A. 1979. Mustelid spacing patterns: variations on a
theme by Mustela. Zeitschrift fur Tierpsychologie 50: 153-163.
PYKE, G.H., PULLIAM, H.R. & CHARNOV, E.L. 1977. Optimal foraging:a selective review of theory and tests. Quarterly Review of
Biology 52: 137-254.RALLS, K., HATFIELD, B.B. & SINIFF, D.B. 1995. Foraging patterns
of California sea otters as indicated by telemetry. Canadian
Journal of Zoology 73: 523-531.RASA, O.A.E. 1983. Dwarf mongoose and hornbill mutualism in the
Taru Desert, Kenya. Behavioral Ecology and Sociobiology 12:
181-190.
Stellenbosch University http://scholar.sun.ac.za

94
RASA, O.A.E. 1986. Ecological factors and their relationshipsto group size, mortality and behaviour in the dwarf mongooseHelogale undulata (Peters, 1852). Cimbebasia 8: 15-21.
ROWE-ROWE, D.T. 1978. The small carnivores of Natal. Lammergeyer
25: 1-48.ROWE-ROWE, D.T. 1992. Survey of South African otters in
freshwater habitat, using sign. South African Journal of
Wildlife Research 22: 49-55ROWE-ROWE, D.T. & SOMERS, M.J. 1998. Diet, foraging behaviour and
coexistence of African otters and the water mongoose.Symposia of the Zoological Society of London No. 71: 215-227.
RUIZ-OLMO, J., JIMENEZ, J. & LOPEZ-MARTIN, J.M. 1995. Radio-tracking of otters Lutra lutra in North-eastern Spain. Lutra
38: 11-21.SAMUEL, M.D., PIERCE, D.J. & GARTON, E.O. 1985. Identifying areas
of concentrated use within the home range. Journal of Animal
Ecology 54: 711-719.SANDERSON, G.C. 1966. The study of mammal movements - a review.
Journal of wildlife Management 30: 215-235.SCHOENER, T.W. 1968. Sizes of feeding territories among birds.
Ecology 49: 123-141.SEAMAN, D.E. & POWELL, R.A. 1996. An evaluation of the accuracy
of kernel density estimators for home range analysis. Ecology
77: 2075-2085.SKELTON, P.H. 1993. A complete guide to the freshwater fishes of
southern Africa. Southern Book Publishers, Halfway House.SOMERS, M.J. 2000a. Seasonal variation in the diet of Cape
clawless otters (Aonyx capensis) in a marine habitat. African
Zoology 35: 261-268.SOMERS, M.J. 2000b. Foraging behaviour of Cape clawless otters
(Aonyx capensis) in a marine habitat. Journal of Zoology,
London 252: 473-480.SOMERS, M.J., PENZHORN, B.L. & RASA, O.A.E. 1994. Home range
size, range use and dispersal of warthogs in the easternCape, South Africa. Journal of African Zoology 108: 361-373.
Stellenbosch University http://scholar.sun.ac.za

95
TILMAN, D., FARGIONE, J., WOLFF, B., D'ANTONIO, C., DOBSON, A.,HOWARTH, R., SCHINDLER, D., SCHLESINGER, W.H., SIMBERLOFF, D.& SWACKHAMER, D. 2001. Forecasting agriculturally drivenglobal environmental change. Science 292: 281-284.
VAN DER ZEE, D. 1979. Food and status of the Cape clawless otter(Aonyx capensis Schinz 1821) in the Tsitsikama CoastalNational Park. M.Sc. thesis, University of Pretoria,Pretoria, South Africa.
VAN DER ZEE, D. 1982. Density of Cape clawless otters Aonyx
capensis (Schinz, 1821) in the Tsitsikama Coastal NationalPark. South African Journal of Wildlife Research 12: 8-13.
VERWOERD, D.J. 1987. Observations on the food and status of theCape clawless otter Aonyx capensis at Betty's Bay, SouthAfrica. South African Journal of Zoology 22: 33-39.
WEBER, J.-M. & DAILLY, L. 1998. Food habits and ranging behaviourof a group of farm cats (Felis catus) in a Swiss mountainousarea. Journal of Zoology, London 245: 234-237.
WHITE, G.C. & GARROTT, R.A. 1990. Analysis of wildlife radio-
tracking data. Academic Press, San Diego.WILSON, E.O. 1975. Sociobiology The new synthesis. Belknap Press
of Harvard University Press, Cambridge.WRANGHAM, R. 1980. An ecological model of female-bonded primate
groups. Behaviour 75: 262-300.WYNNE-EDWARDS, V.C. 1962. Animal dispersion ~n relation to social
behaviour. Oliver & Boyd, Edinburgh.
Stellenbosch University http://scholar.sun.ac.za

96
CHAPTER4
HABITAT SELECTION BY CAPE CLAWLESS OTTERS (AONYX
CAPENSIS) IN RIVERS
INTRODUCTION
As habitat selection by animals provides a theoretical basis forhabitat management decisions (Kopp et al. 1998) it is a commonand important aspect of wildlife science (Alldredge & Ratti1986). Habitat selection is determined by identifying thedisproportionate use of habitats (Johnson 1980). Common aims ofhabitat use studies are to determine whether a species useshabitats available at random, to rank habitats in order ofrelative use, to compare use by different groups of animals, torelate use to variables such as food abundance, or to examine theeffects of habitat on movement and home range size (Aebischer etal. 1993). Animal movements and habitat use are related to boththe acquisition of primary resources (e.g. food, shelter, mate,and host) and the avoidance of sources of stress (e.g. predators,thermal extremes, dehydration) (Barbaresi et al. 1997).Differences in habitat use by carnivores can vary owing to,amongst others, differences in geographic locality (Crooks & VanVuren 1995), geomorphology (shelter) (Waller & Mace 1997), foodavailability (Melquist & Hornocker 1983; Mills 1990),interspecific relationships (Rasa 1983), intraspecificrelationships (Rasa 1986), time in residence (Conner et al.
1999), sex of the animal (Green et al. 1984; Conner et al. 1999),age of the animal (Ralls et al. 1995); anthropogenic influences(Weber & Dailly 1998) and vegetation cover (Gese et al. 1988).
Knowledge of a species' use of habitat can be helpful toconservation efforts. Ralls (1997) gives the sea otter Enhydra
lutris as an example of this, showing that they selected areasmuch further offshore and in deeper water than had previously
Stellenbosch University http://scholar.sun.ac.za

97
been thought. These new habitat selection data, fromradiotelemetry (Ralls et al. 1995), facilitated legislationprohibiting set-net fishing in the otters' hunting areas, so asto prevent them from drowning in the nets (Ralls 1997).
Radiotelemetry, as used in the present study, is one of themost powerful tools available to wildlife biologists (Aebischeret al. 1993) particularly to get insight into the ecology ofelusive species such as otters. In environments intensively usedby humans, thorough and reliable data on space and habitatselection by otters can be obtained only by radiotelemetry, andthis information is critical not only to understanding theecology of these species, but also to planning effectively fortheir conservation.
Our understanding of otter habitat selection comes mainlyfrom studies on the distribution and abundance of otter spraintsand resting places (reviewed by Mason & Macdonald 1986). However,Green et al. (1984); Kruuk et al. (1986) and Conroy & French(1987) show that for European otters Lutra lutra the position ofspraints is an unreliable indication of where otters spend theirtime. They are, however, an indication of how the otters useland, which is important for semi-aquatic otters. Data fromradiotelemetry would therefore compliment these data, giving abetter understanding of how the otters use their habitat.
There have been numerous radiotelemetry habitat selectionstudies done on otters such as L. lutra (e.g. Green et al. 1984;
Durbin 1993, 1996a, 1996b, 1998; Kruuk 1995), North Americanriver otters Lutra canadensis (Melquist & Hornocker 1983),spotted-necked otters Lutra maculicollis (Perrin & D'InzilloCarranza 2000; Perrin et al. 2000), E. lutris (Rails et al. 1995)
and smooth coated otters Lutra perspicillata (Hussain & Choudhury1995). Only Arden-Clarke (1986) and Somers (Chapter 3) providedata on Cape clawless otters Aonyx capensis using radiotelemetry.Although he did not look at habitat variables, Arden-Clarke(1986) did show differential use of the home range of A. capensis
along the Tsitsikama coast. Somers (Chapter 3), in the present
Stellenbosch University http://scholar.sun.ac.za

98
study area, showed that A. capensis could range over distancesas long as 54.1 km.
Aonyx capensis are semi-aquatic predators, which occur overmost of sub-Saharan Africa (Rowe-Rowe & Somers 1998; Nel & Somersin press). In most areas crustaceans are the most important preytype, but fish, frogs, insects, birds, reptiles, molluscs, dung(ungulate) and mammals are also eaten (Rowe-Rowe & Somers 1998;Perrin & Carugati 2000a; Somers 2000a, 2000b; (Chapters 5 & 6)).This is in contrast to most otters, which are mainly piscivorous(Estes 1989).
Perrin & Carugati (2000b) analysed habitat selection by A.
capensis by comparing sites of otter activity on land withenvironmental variables. They found that the otters select, fortime spent on land, undisturbed areas with rock cover and naturaldense vegetation. Rowe-Rowe (1992) and Butler & du Toit (1994)give densities of spraints and resting places but do not relatethese to habitat variables. Van der Zee (1981); Arden-Clarke(1986) and Verwoerd (1987) also give densities and distributionof sign of A. capensis along the coast but again do notquantitatively relate these to habitat characteristics. Along thecoast there is evidence that A. capensis select places ofactivity on land to be near thick vegetation, an abundant foodresource and fresh water (van der Zee 1982; Arden-Clarke 1986;van Niekerk et al. 1998). Just as L. lutra use spraints as scentmarks (Kruuk 1992) so may A. capensis. This implies that theanalysis of habitat selection from sprainting sites may indicateonly areas that the otters select as scent marking stations andnot general habitat selection.
Although Kruuk et al. (1998) point out that limiting factorsshould be of primary concern for conservation of otters, it isnot known what limits A. capensis numbers. However, Kruuk et al.
(1998) also point out that it is important to identify habitatpreferences and to establish what kind of role the particularfactors are likely to play, either as habitat requirements or asmere preferences. This is because if the main limiting factor(e.g. food) is abundant and therefore not limiting numbers the
Stellenbosch University http://scholar.sun.ac.za

99
population will increase until another factor becomes limiting(Kruuk et al. 1993).
Owing to loss of energy while in the water (Kruuk et al.
1997) it would be expected that otters would always maximise thenet rate of energy gain. Optimal foraging theory states thatforaging strategies may involve behaviours that maximise the netrate of food intake, or of some other measure of foragingefficiency (Emlen 1966; MacArthur & Pianka 1966; Krebs & Kacelnik1991). An otter should therefore use its habitat to the optimumand select those parts that allow it to best maximise itsinclusive fitness. It is therefore predicted that otters selectsome habitat types over others.
In this chapter I report on the habitat selection by seven A.
capensis, as determined by radio-tracking in the Olifants andEerste Rivers, Western Cape Province, South Africa. Thehypothesis being tested is that active otters do not select forany particular habitat.
MATERIALS & METHODS
Data were collected in the Eerste (near Stellenbosch (33° 56' S,18° 52' E)) and Olifants (near Clanwilliam (32° 11' S, 18° 23'E)) rivers in the Western Cape Province, South Africa.
The Eerste River is a rocky, narrow river, which rises inpristine conditions in the Jonkershoek Mountains, but then flowsthrough agricultural, industrial and urban areas. The flow rateis variable depending on rainfall, which is mostly in winter. Itreaches the sea about 40 km from its source. It is disturbed forca 90% of its length by agriculture, industry and the urbanenvironment. The main crops are vines, fruit, and vegetables, allof which are subject to heavy applications of fertilizers,herbicides and pesticides (Heinecken et al. 1983). Wineryeffluents are either irrigated onto pasturelands or accepted intothe Stellenbosch sewage works. Treated effluent from these worksis discharged into a tributary of the Eerste River (Heinecken etal. 1983). During heavy rainfall events, overflow of the sewage
Stellenbosch University http://scholar.sun.ac.za

100
works occurs and untreated sewage flows into the river belowStellenbosch (personal observations). The Eerste River and anumber of its tributaries flow through the town of Stellenbosch,and these receive all the storm water run-off from the town.Pollution levels and eutrophication increases rapidly belowStellenbosch. The treated sewage from the towns of Macassar,Somerset West and Strand is also discharged into the estuary ofthe Eerste River (Heinecken et al. 1983). For a detailedclassification of the Eerste River see Eekhout et al. (1997)
The Olifants River is 285 km long and has a catchment area of46 220 km2• The part of the Olifants River used in this study isdominated by two impoundments: the Clanwilliam and Bulshoek Dams.There are holiday camps along the edge of the two impoundmentsand recreational boating, swimming and fishing takes place. Thelength of river between the two dams is 17.6 km and bordered bycattle and crops. There is, however, little disturbance along thewater edge where mostly exotic Eucalyptus trees grow. Just aboveBulshoek Dam the river is slow flowing, has a sandy bank withreed beds Phragmites australis, bulrushes Typha capensis andoccasional sedges Cyperus spp along the edge. The river belowBulshoek Dam is slow flowing with marshlands, oxbows, largebasins, large reed beds and rocky pools of up to 6 m deep. Exceptfor recreational activities on the dam (mostly during weekendsand the summer holidays) there is not much disturbance. The areadown to ca 15 km below Bulshoek Dam is not intensively farmed,except for some cattle farming, resulting in very littledisturbance. Further down (out of the present study area) theriver has extensive agriculture in the form of vines, fruit andvegetables along the edge. For a detailed classification of theOlifants River see Harrison (1997) and Eekhout et al. (1997).
Seven otters (Table 4.1) were caught in standard carnivoretraps (800 X 800 X 1400 mm) as described by van der Zee (1982)and Arden-Clarke (1986). The traps were baited with either fishand/or fresh spraints from another area. Fish bait used in theEerste River was rainbow trout Oncorhynchus mykiss, and in theOlifants River shallow-water hake Merluccius capensis. The otters
Stellenbosch University http://scholar.sun.ac.za

101
were anaesthetized with ketamine hydrochloride (Ketalar 50mg/ml Parke Davis). Radio transmitters (IMP/300/L, implantabletransmitter, 40g, 80 x 20 mm diameter cylinder (Telonics Inc.,Arizona, USA)) were implanted by a veterinary surgeon into theotters following the same procedures as described by McKenzie etal. (1990). The transmitters were left free floating in theabdominal cavity. A Telonics TR-4 receiver and multidirectionalwhip antenna were used to find the general locality of theotters. The TR-4 receiver and a RA - 2A antenna were then used tofind their position.
Otter Ml was found dead four months after the transmitter wasimplanted. There were skin punctures, which appeared to be aresult of another animal. On post-mortem there appeared to be nophysical abnormality associated with the transmitter.
Continuous radio-tracking (Harris at al. 1990) with fixesbeing taken at 10 min intervals was carried out. This was done attimes of usual otter activity and periodically on a 24-hourbasis. Most radio-tracking habitat use studies combine bothactive and non-active data, which underestimates foraginghabitat, with potentially important management and/or ecologicalconsequences (Palomares & Delibes 1992). This study avoided thisproblem by only using data from active otters. Activity wasdetected as fluctuations in signal strength. Whenever possibleotters were visually observed using 10 x 42 binoculars. A shortun-quantified description of their foraging is provided. A totalof 1579 h was spent radio-tracking between 1993 and 1995 of which851 h were of active otters (Table 4.1).
Observations and radio-tracking were conducted from a vehicleand on foot. The otters were located by triangulation (usuallyfrom the vehicle) or tracking (on foot) the path of increasingsignal strength.
Stellenbosch University http://scholar.sun.ac.za

102
Table 4.1. Radio-tracking effort on Cape clawless otters Aonyx capens~s in (a) theEerste and (b) Olifants Rivers, Western Cape Province, South Africa. M = male; F = female.
Tracking dates Tracking Otter Sessions trackedAnimal (day/mon/yr) period activity
(h) (h) partial complete total
(a)
Ml (sub-adult) 20/07/93 - 16/11/93 216 140 46 22 48F1 (adult) 10/08/93 - 13/08/93 25 11 4 2 6M2 (adult) 18/02/94 - 20/07/94 246 57 48 33 82
(b)
M3 (adult)M4 (adult)F2 (adult)F3 (adult)
24/03/94 - 05/12/9423/04/94 - 13/05/9518/05/94 - 12/04/9522/11/94 - 31/08/95
189208447248
12204918
4548
11046
105123248167
33286128
Stellenbosch University http://scholar.sun.ac.za
103
The study areas were divided into numbered, 100 mstretches of river, and these drawn on 1: 50 000 topographicalmaps and 1 : 10 000 orthophotographs. The position of the otterswhen active was continuously recorded on tape. Following Durbin(1993), two 100 m sections were combined and these 200 m sectionswere used for the present analyses.
The surveys were done during 1995 and 1996. This was duringsummer when the rivers were not in flood. To prevent Type IIstatistical errors the numbers of habitat variables were limited(Alldredge & Ratti 1986). This restricts the number of usablevariables and makes deciding which ones to use critical. Thevariables decided on were those thought to be of importance tothe otters. The importance was subjectively decided by referenceto the literature and to direct observations of the otters(personal observations) .
For each 200 m section, the areas or lengths of the variousvariables (Table 4.}) were estimated by eye, and following Durbin(1993) assigned to the following percentage classes using themidpoint scores: 3 0-5%; 13 = 6-25%; 35 = 26-50%; 73 = 51-95%;98 = 96-100%. Within 100 m of the bank, surrounding land useswere quantified by estimating the length of bank adjacent toparticular habitat types (Table 4.2). Variables such as channelwidth and bank vegetation change temporarily during the rainyseason. Water levels would, however, usually return to normalwithin a few days of rainfall events.
Following Durbin (1993) and Kruuk et al. (1993) the meanwidth of each section was calculated from two measurements at theupstream and downstream boundaries. This was done by directmeasurement (narrow sections) or from the 1 : 10 000orthophotographs (wide sections). An estimate was made of thenumber of trees (>2.0 m high) overhanging the water. The minimumdistance of each section from roads and buildings were measuredusing the 1: 10 000 orthophotographs. The length of canalisedbank was measured from the 1 : 10 000 orthophotographs.
Stellenbosch University http://scholar.sun.ac.za

104
Table 4.2. The habitat variables used for analysis of habitat selection by Capeclawless otters Aonyx capensis.
Variable Code Description Measurement Log-conversion
Substratesoil SOIL < 20 mm maximum %A ln (xl (lOa-x) )
diametergravel GRAV 20-60 mm %A ln (xl (lOa-x) )
stones STON 60-200 mm %A ln (xl (lOa-x))boulders BOUL > 200 mm %A In(xl (lOa-x))
Bank vegetationover-hanging OVER No. trees >2.0 mover-hanging Count ln (x+1 (mean+1)emergent EMER length of bank %L ln (xl (lOa-x) )
reeds REED m2 %A In(xl (lOa-x))
Surrounding areaarable ARAB length of bank %L ln (xl (lOa-x) )
fynbos FYNB length of bank %L ln (xl (100-x))
Stellenbosch University http://scholar.sun.ac.za

105
Table 4.2 Continued:
Variable Code Description Measurement Log-conversion
Channel width WIDT mean width In m In(xlmean)
Canalisation CANA length of bank %L ln (xl (100-x))
Roads ROAD minimum distancefrom road In m In(xlmean)
Buildings BUlL minimum distancefrom building
In m In(xlmean)
%A percentage area class; %L per cent length class; x habitat variable score
Stellenbosch University http://scholar.sun.ac.za

106
Although there are various methods for analysing habitatuse data from radio-tracking (see Alldredge & Ratti 1986, 1992for comparisons) there are shortcomings affecting the validity oftheir analysis (see Aebischer et al. 1993). In order to minimiseproblems with analysis, analysis of data closely followed thatused by Durbin (1998) for L. lutra. Minor differences betweenthis study and that of Durbin (1998) in methods and the reasonsfor them are outlined below. As the exact habitat type (e.g. reedbed) that the otters were foraging in could seldom be determinedthe method used here provides the most powerful analysispossible.
The total amount of active time (T) spent in each section wascalculated. These patterns of utilization were compared withmodels based on the uniform use of habitat length (Tl) and area(r). As Durbin (1998) points out, both these models may beappropriate, as the riverine habitat is clearly linear but variesin width. This is especially true with the data collected in theOlifants River, where the two dams were included in the studyarea (Durbin personal communication). The predicted values foreach section were calculated in a Microsoft Excel spreadsheet asfollows:r Tt ( SI/Rl) ,
r Tt (Sa/Ra) ,
where Tt = total amount of active time that the otter was tracked,Sl = length of the section (200 m), Rl = total length of otter'srange, Sa = area of the section (200 m X width), and Ra = area ofthe otter's range. Two preference indices were then calculatedfor each section using natural log ratios of the observed topredicted values:
PL (deviation from uniform use of length) In(T/TI), and
PA (deviation from uniform use of area) ln (T/r) .
Stellenbosch University http://scholar.sun.ac.za

107
Sections with indices greater than zero were interpretedas being used more than expected, and those with values less thanzero were used less than expected. Sections with indices of zerowere used as predicted. As with Durbin (1998), associationsbetween habitat variable scores and levels of preference haddependence problems because some habitat variables were inter-correlated (Table 4.3). All the variables were still used as theywere considered to be of possible relevance to the otter's use ofhabitat.
To be compatible with the preference indices the habitatvariable scores were log converted (see Table 4.2). Regressionsbetween the preference indices with habitat variables were donefor each otter. Significant regressions were taken to indicatethat the habitat variable concerned, or some correlated variable,was affecting the otter's use of its range (Durbin 1998).
Although the number of radiolocations per animal determinesthe accuracy with which its habitat use is estimated, it is thenumber of animals tracked that determines the sample size uponwhich to test the hypothesis that the otters were selecting forvarious habitat types (Aebischer et al. 1993; Durbin 1998) .Habitat preference was inferred on the basis of consistencybetween the samples of otters. For this analysis the Mann-WhitneyU test was used to test the hypothesis that the mediancoefficient for a particular habitat variable was zero across thesample of seven otters. A significant result indicated a generalpattern for the seven otters, and the sign of the meancoefficient defined the relationship between observed vs expected(i.e. as a preference or avoidance) (Durbin 1998).
RESULTS
The mean width of the part of the Eerste River used by the radio-tracked otters was 8.9 m (S.E. = 1.3, range = 2-110, n 178) andof the Olifants River (including dams) was 182.8 m (S.E. = 12.07,range = 10-1250, n = 270) .
Stellenbosch University http://scholar.sun.ac.za

108
Table 4.3. Correlation matrix of habitat variables from two Western Cape Rivers.
GRAV STON BOUL OVER EMER REED ARAB FYNB WIDT CANA ROAD BUIL
SOIL -0.25 -0.38 -0.26 0.14 0.18 0.45 0.48 0.05 0.05 -0.10 -0.04 0.02
GRAV -0.18 -0.16 0.03 0.08 -0.03 0.20 0.16 0.01 -0.12 -0.08 0.06
STON -0.23 0.15 0.06 -0.09 0.05 0.06 -0.14 0.16 -0.14 0.08
BOUL 0.11 0.10 -0.13 -0.20 0.13 0.78 -0.19 -0.09 0.16
OVER 0.07 0.37 -0.11 0.11 -0.37 0.55 -0.04 -0.07
EMER 0.19 -0.01 -0.01 0.25 -0.87 -0.02 -0.18
REED 0.28 0.03 0.02 -1.00 -0.01 0.22
ARAB 0.56 0.07 -1. 00 0.07 0.23
FYNB 0.15 -0.40 -0.05 0.54
WIDT -0.95 -0.01 -0.08
CANA 0.93 0.95
ROAD 0.76
Stellenbosch University http://scholar.sun.ac.za

109
Excluding Bulshoek and Clanwilliam dams, the mean width of theOlifants River used by the radio-tracked otters was 50.1 m (S.E.= 2.01, range = 10-145, n = 161).
Observations showed that, as in the marine habitat (Somers2000a) (Chapter 6), two modes of hunting or foraging could berecognised. In the first, the otters, selecting open water withinca 8 m of the shore, would dive and surface with or without prey.The second type of hunting involved the otters moving intoshallow water (ca 0.2 m deep), and walking along the substratefeeling for prey with their feet, disturbing possible prey items,which were then caught with the forefeet. They occasionallysubmerged their heads, presumably looking for food. For a moredetailed description see Somers (2000b) (Chapter 6).
In the rivers, the second type of hunting in shallow waterseemed more common than that of hunting in open water. The ottersoften "swam fished" along the shore, while occasionally comingcloser to the shore and foraging in the reeds, stones, bouldersor emergent vegetation. They would occasionally cross to theopposite bank, usually without diving. The otters did not appearto forage in tributaries, but F2 and Ml had resting places shortdistances up tributaries (Chapter 3) .
Among the regressions using the index PL (related to theamount of time spent active per unit length of river) thevariables that showed consistent relationships with all sevenotters were, boulders (mean coefficient = 0.37, S.E. = 0.1, range; 0.07-0.75; Mann-Whitney U = 0, d.f. = 13, P < 0.001) and reeds(mean coefficient; 0.37, S.E. = 0.07, range; 0.08-0.66; Mann-Whitney U = 0, d.f. = 13, P < 0.001) (Table 4.4). The threeotters in the Eerste River showed a preference for areas withoverhanging vegetation, which was not the case for all the ottersin the Olifants River (Table 4.4). Except for otter M2 and F2 theotters did not select for wide areas.
Stellenbosch University http://scholar.sun.ac.za

110
Table 4.4. Regression statistics for relationships between preference indices(a) PL, (b) PA, and habitat scores. Significant coefficients are indicated in bold.
Animal Habitat variables
SOIL GRAV STON BOUL OVER EMER REED ARAB FYNB WIDT CANA ROAD BUIL
(a)Mlr2 0.10 0.10 0.05 0.33 0.19 0.35 0.02 0.00 0.04 0.06 0.37 0.01 0.05b 0.16 0.12 0.21 0.68 0.38 0.29 0.08 -0.00 0.09 -0.05 -0.76 0.09 -0.31
Flr2 0.05 0.03 0.02 0.25 0.09 0.00 0.11 0.08 0.00 0.00 0.26 0.18 0.10b -0.19 -0.05 0.08 0.75 0.23 0.01 0.18 -0.15 -0.01 0.02 -0.46 -0.29 -0.17
M2r2 0.03 0.06 0.00 0.10 0.03 0.00 0.20 0.11 0.00 0.04 0.00 0.13 0.00b 0.09 0.12 0.03 0.29 0.14 -0.05 0.37 -0.34 0.03 0.16 0.00 0.22 0.00
M3r2 0.06 0.09 0.00 0.06 0.00 0.01 0.28 0.00 0.00 0.08 0.00 0.00 0.00b -0.10 -0.21 -0.02 0.07 -0.04 0.12 0.54 -0.00 -0.01 -0.21 0.00 -0.08 0.09
M4r2 0.03 0.02 0.05 0.11 0.08 0.00 0.28 0.00 0.07 0.00 0.00 0.03 0.00b 0.16 -0.16 -0.14 0.25 0.14 -0.01 0.38 0.02 -0.11 -0.02 0.00 -0.08 0.02
F2r2 0.04 0.06 0.15 0.02 0.03 0.01 0.25 0.00 0.00 0.14 0.00 0.04 0.01b 0.10 0.16 0.46 0.15 -0.08 0.08 0.38 0.00 -0.05 0.45 0.00 -0.14 -0.23
F3r2 0.05 0.06 0.00 0.11 0.00 -0.02 0.31 0.08 0.07 0.05 0.00 0.00 0.02b 0.12 0.17 0.00 0.38 -0.05 0.14 0.66 -0.17 -0.13 -0.15 0.00 -0.06 0.12
Stellenbosch University http://scholar.sun.ac.za

111
Tdble 4.4 continued
Animal Habitat variables
SOIL GRAV STON BOUL OVER EMER REED ARAB FYNB wrDT CANA ROAD BUrL
(b)Mlr2 0.01 0.14 0.07 0.13 0.11 0.35 0.03 0.00 0.01 0.03 0.17 0.01 0.03b 0.06 0.17 0.12 0.57 0.22 0.15 0.14 -0.00 0.04 -0.04 -0.56 0.04 -0.06
F1r2 0.00 0.00 0.01 0.14 0.21 0.00 0.06 0.09 0.01 0.00 0.16 0.17 0.11b -0.03 0.02 0.05 0.44 0.35 0.01 0.15 -0.25 -0.04 -0.03 -0.39 -0.32 -0.19
M2r2 0.04 0.03 0.00 0.10 0.02 0.01 0.17 0.11 0.00 0.15 0.00 0.02 0.00b 0.09 0.12 0.03 0.39 0.18 -0.07 0.44 -0.24 -0.03 0.27 0.00 0.10 0.00
M3r2 0.04 0.05 0.01 0.06 0.21 0.01 0.15 0.00 0.20 0.06 0.00 0.00 0.00b 0.10 -0.15 -0.07 0.21 0.33 -0.15 0.38 0.00 -0.06 -0.14 0.00 -0.08 0.07
M4r2 0.03 0.01 0.03 0.08 0.04 0.03 0.29 0.00 0.00 0.00 0.00 0.01 0.00b 0.12 -0.10 0.10 0.15 0.19 0.12 0.48 -0.09 -0.02 -0.07 0.00 -0.03 -0.05
F2r2 0.09 0.02 0.00 0.12 0.06 0.11 0.39 0.00 0.00 0.10 0.00 0.01 0.01b 0.19 0.05 -0.02 0.08 0.07 0.23 0.56 0.00 -0.01 0.35 0.00 -0.04 -0.23
F3r2 0.01 0.03 0.00 0.01 0.05 0.01 0.31 0.04 0.05 0.03 0.00 0.02 0.01b 0.32 0.27 -0.00 0.03 0.11 0.08 0.76 0.07 -0.13 0.18 0.00 0.08 -0.10
Stellenbosch University http://scholar.sun.ac.za

112
When controlling for area using the index PA (related tothe amount of time spent active per unit area of river) thevariables that showed consistent relationships with all sevenotters were boulders (mean coefficient = 0.27, S.E. = 0.8, range= 0.03-0.0.57; Mann-Whitney U = 0, d.f. = 13, P < 0.001), reeds(mean coefficient = 0.42, S.E. = 0.08, range = 0.14-0.76; Mann-Whitney U = 0, d.f. = 13, P < 0.001) and overhanging vegetation(mean coefficient = 0.21, S.E. = 0.04, range = 0.07-0.35; Mann-Whitney U = 0, d.f. 13, P < 0.001). The four otters in theOlifants River showed a preference for areas with soil. Althoughthe pattern did not extend to the otters of the Eerste River therelationship across all the otters was significant (meancoefficient 0.12, S.E. = 0.04, range = -0.03-0.32; Mann-WhitneyU = 7, d.f.
wide areas.13, P = 0.03). Otters M2, F2 and F3 selected for
DISCUSSION
Both indexes show that the seven otters selected habitats withreeds and boulders. Personal observations confirmed this, as theotters would forage in and around individual patches of reeds -sometimes for hours.
Aonyx capensis occur over most of sub-Saharan Africa (Rowe-Rowe & Somers 1998; Nel & Somers in press) using diversehabitats, from the mangrove forests of KwaZulu-Natal Province(personal observation) to the desert conditions of the upperDoring River and Fish River in southern Namibia (Nel unpublisheddata). It appears that only where there is no fresh water, dothey not occur. They have been found in towns (e.g. Stellenbosch)and cities (e.g. Port Elizabeth, Cape Town) (personalobservations). They occur in rivers with high pollution andeutrophication levels (Heath & Claassen 1999; Nel & Somersunpublished data). No data are, however, available on theirrelative densities in these areas and the present data are thefirst on their habitat selection.
Stellenbosch University http://scholar.sun.ac.za
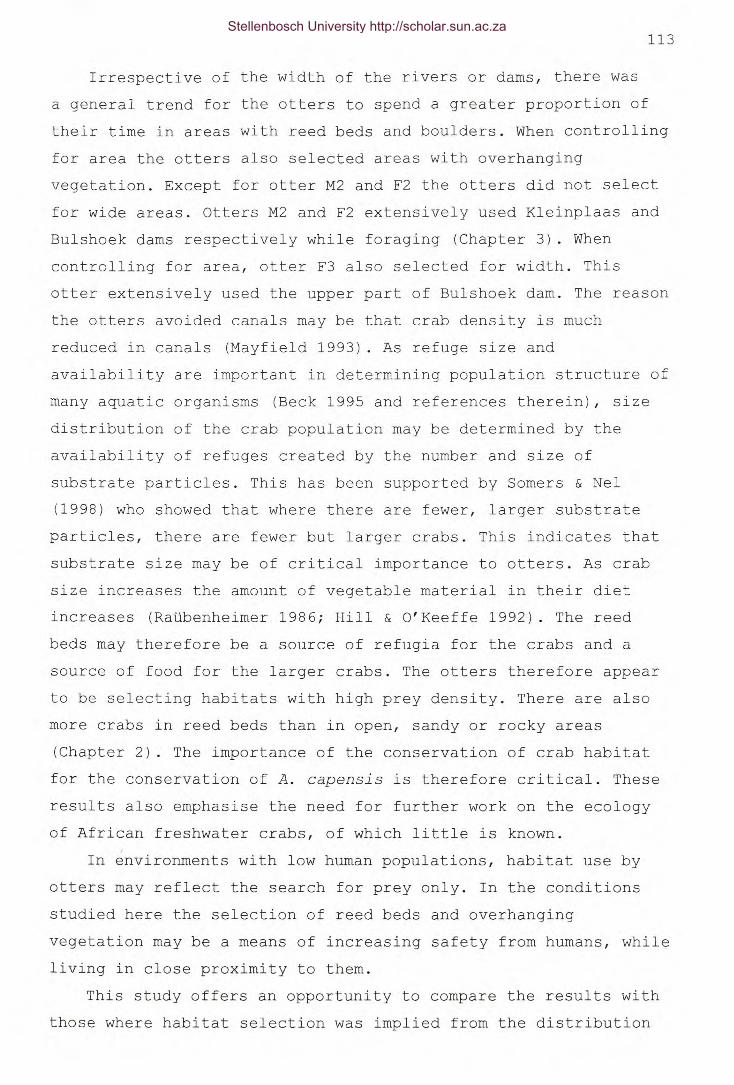
113
Irrespective of the width of the rivers or dams, there wasa general trend for the otters to spend a greater proportion oftheir time in areas with reed beds and boulders. When controllingfor area the otters also selected areas with overhangingvegetation. Except for otter M2 and F2 the otters did not selectfor wide areas. otters M2 and F2 extensively used Kleinplaas andBulshoek dams respectively while foraging (Chapter 3). Whencontrolling for area, otter F3 also selected for width. Thisotter extensively used the upper part of Bulshoek dam. The reasonthe otters avoided canals may be that crab density is muchreduced in canals (Mayfield 1993). As refuge size andavailability are important in determining population structure ofmany aquatic organisms (Beck 1995 and references therein), sizedistribution of the crab population may be determined by theavailability of refuges created by the number and size ofsubstrate particles. This has been supported by Somers & Nel(1998) who showed that where there are fewer, larger substrateparticles, there are fewer but larger crabs. This indicates thatsubstrate size may be of critical importance to otters. As crabsize increases the amount of vegetable material in their dietincreases (Raubenheimer 1986; Hill & O'Keeffe 1992). The reedbeds may therefore be a source of refugia for the crabs and asource of food for the larger crabs. The otters therefore appearto be selecting habitats with high prey density. There are alsomore crabs in reed beds than in open, sandy or rocky areas(Chapter 2). The importance of the conservation of crab habitatfor the conservation of A. capensis is therefore critical. Theseresults also emphasise the need for further work on the ecologyof African freshwater crabs, of which little is known.
,In environments with low human populations, habitat use by
otters may reflect the search for prey only. In the conditionsstudied here the selection of reed beds and overhangingvegetation may be a means of increasing safety from humans, whileliving in close proximity to them.
This study offers an opportunity to compare the results withthose where habitat selection was implied from the distribution
Stellenbosch University http://scholar.sun.ac.za

114
and density of otters sign (e.g. Carugati 1995; Perrin &Carugati 2000b). The methods used by Carugati (1995) and Perrinand Carugati (2000b) are quicker, less expensive and lessinvasive to the otters and would therefore be preferred, ifproved reliable estimates of habitat use by A. capensis. Perrin &Carugati (2000b) found the otters select, for time spent on land,undisturbed areas with rock cover and natural dense vegetation.This is similar to the results of the present radio-trackingstudy. A notable exception is that the otters did not seem toavoid disturbed areas as reported by Perrin & Carugati (2000b)The reason for this may be that although otters forage nearanthropogenic disturbances they do not use these areas forsprainting or resting (i.e. landing). Another explanation may bethat the otters in the present study areas are more habituated toanthropogenic influences because there is more disturbance thanin the study area of Perrin & Carugati (2000b). Furthersupporting the present findings is the evidence that along themarine coasts A. capensis select places of activity on land to benear thick vegetation, abundant food resource and fresh water(van der Zee 1982; Arden-Clarke 1986; van Niekerk et al. 1998).
Durbin (1998) shows a trend towards narrow areas with treesbeing selected. In the terrestrial habitat of freshwater areas L.
lutra show preference for islands and for reed beds, but theyrest or sleep almost anywhere with a cover of vegetation orrocks. While foraging, they prefer narrow parts of rivers thatare shallow, with a high fish biomass, or marshy areas withamphibians (Kruuk et al. 1998).
As with Durbin (1998), the results are based on consistentpatterns between a few individuals (seven in the present study),resulting in the conclusions being conservative. This means thathabitat selection at the population level might be missed. Thesetwo studies, however, were done in two rivers with habitats whichdiffer, which somewhat obviates this limitation. The presentresults may, however, only be applicable to rivers in the WesternCape Province. As 200-m sections were used, some detailedpatterns of small-scale habitat use will have been lost.
Stellenbosch University http://scholar.sun.ac.za

115
Consistent relationships, however, indicate a behaviouralresponse and may be of conservation significance (Durbin 1998)The importance of scale in habitat use studies has been stressedby many (e.g. Morris 1987; Orians & Wittenberger 1991). Studiesdone at several scales improve the resolution of factors thatdetermine ecological patterns and their interrelationships amongscales (Wiens 1989). Data on otter densities in different riversystems, which are presently lacking, are needed to determinelarge-sale habitat selection. Owing to the difficulty ofobserving the otters in freshwater systems it would also beextremely difficult to measure small-scale habitat selection.Some attempt at detailed habitat use in the marine environmenthas been made (Somers 2000a, 2000b (Chapters 5 & 6)). In thesestudies, however, the otters were not radio-tracked and habitatuse could only be determined in a limited area and in one habitattype. There was differential use of depths by the otters and theotters selected specific depths in which to forage (Somers 2000b(Chapter 6)). The present data, although only on one scale, areuseful in determining which habitat types are preferred. Fromthese data, predictions as to how other systems would be used byA. capensisr can be made. The data also provide direction forfuture research.
Although the use of the models based on the amount of timespent per unit length and space may seem appropriate for otters(Durbin 1998), A. capensis seldom forage more than ca 8 m fromthe shore (personal observations). The use of the area index maytherefore be inappropriate for the wide Olifants River where mostof the water surface area is not used by the otters (see alsoChapter 3) .
Although South Africa has international legal obligationsthrough the "Convention on Biological Diversity" treaty toprotect its biological diversity, its rivers are in a state ofcritical conservation status (Davies & Day 1998). With the ever-decreasing quality of freshwater systems in South Africa andelsewhere in Africa (Davies & Day 1998), increasing water use byinvading alien plants (Le Maitre et al. 2000) and impending
Stellenbosch University http://scholar.sun.ac.za

116
climate change (Schmandt 1992), the fate of many aquaticspecies is unclear. Most of Southern Africa is expected to becomeconsiderably more arid (Schmandt 1992), probably affecting mosttaxa. The affects on aquatic organisms are likely to be severe asriver systems change or dry up totally.
Scientists are being asked what these affects are going to beand what can be done to avoid or minimize them. For many aquaticspecies there are very few data on how they use their habitats.These data are needed to predict the affects of future changes.For example the present results suggest that submergedmacrophytes are important habitat types for otters. Withincreasing silting up of rivers (Davies & Day 1998) these habitattypes are at risk through increased flooding (Colloty et al.
2000) .The results show, that the otters radio-tracked did not use
the entire home range uniformly and their presence was mostfrequent in areas with reeds and boulders: The hypothesis cantherefore be rejected.
REFERENCESAEBISCHER, N.J., ROBERTSON, P.A. & KENWARD, R.E. 1993. Composition
analysis of habitat use from animal radio-tracking data.Ecology 74: 1313-1325.
ALLDREDGE, J.R. & RATTI, J.T. 1986. Comparison of somestatistical techniques for analysis of resource selection.Journal of Wildlife Management 50: 157-165.
ALLDREDGE, J.R. & RATTI, J.T. 1992. Further comparison of somestatistical techniques for analysis of resource selection.Journal of Wildlife Management 56: 1-9.
ARDEN-CLARKE, C.H.G. 1986. Population density, home range sizeand spatial organization of the Cape clawless otter, Aonyx
capensis, in a marine habitat. Journal of Zoology, London
209: 201-211.
Stellenbosch University http://scholar.sun.ac.za

117
BARBARESI, S., GHERARDI, F. & VANNINI, M. 1997. Movementpatterns of river crabs (Decapoda, Potamoidea) in the field:predictable and unpredictable components. Journal of Zoology,
London 242: 247-259.BECK, M.W. 1995. Size-specific shelter limitation in stone crabs:
a test of the demographic bottleneck hypothesis. Ecology 776:
968-980.BUTLER, J.R.A. & DU TOIT, J.T. 1994. Diet and conservation of
Cape clawless otters in eastern Zimbabwe. South African
Journal of Wildlife Research 24: 41-47.CARUGATI, C. 1995. Habitat, prey, and area requirements of otters
(Aonyx capensis and Lutra maculicollis) in the NatalDrakensberg. M.Sc. thesis, University of Natal,Pietermaritzburg, South Africa
COLLOTY, B.M., ADAMS, J.B. & BATE, G.C. 2000. The use of abotanical importance rating to assess changes in the flora ofthe Swartkops Estuary over time. Water SA 26: 171-180.
CONNER, M.M., PLOWMAN, B.P., LEOPOLD, B.D. & LOVELL, C. 1999.Influence of time-in-residence on home range and habitat useof bobcats. Journal of Wildlife Management 63: 261-269.
CONROY, J.W.H. & FRENCH, D.D. 1987. The use of spraints tomonitor populations of otters (Lutra lutra L.). Symposia of
the Zoological Society of London No. 58: 247-262.CROOKS, K.R. & VAN VUREN, D. 1995. Resource utilization by two
insular endemic mammalian carnivores, the island fox andspotted skunk. Oecologia 104: 301-307.
DAVIES, B.R. & DAY, J.A. 1998. Vanishing waters. University ofCape Town Press, Cape Town.
DURBIN, L.S. 1993. Food and Habitat Utilization of Otters (Lutra
Lutra L.) in a Riparian Habitat. D. Phil. thesis, Universityof Aberdeen, Aberdeen, Scotland.
DURBIN, L.S. 1996a. Some changes in the habitat use of free-ranging female otter Lutra lutra during breeding. Journal of
Zoology, London 240: 761-764.DURBIN, L.S. 1996b. Individual differences in spatial utilization
of a river-system by otters Lutra lutra. Acta Theriologica
Stellenbosch University http://scholar.sun.ac.za

118
41: 137-147.DURBIN, L.S. 1998. Habitat selection by five otters Lutra lutra
in rivers of northern Scotland. Journal of ZoologYr London
245: 85-92.EEKHOUT, S., KING, J.M. & WACKERNAGEL, A. 1997. Classification of
South African riverr volume 1. Department of EnvironmentAffairs and Tourism, Pretoria.
EMLEN, J.M. 1966. The role of time and energy in food preference.American Naturalist 100: 611-617.
ESTES, J.A. 1989. Adaptations for aquatic living by carnivores.In: Carnivore behaviorr ecology and evolutionr (ed) J.L.Gittleman, Chapman and Hall, London.
GESE, E.M., RONGSTAD, O.J. & MYTTON, W.R. 1988. Home range andhabitat use of coyotes in southeastern Colorado. Journal of
Wildlife Management 52: 640-646.GREEN, J., GREEN, R. & JEFFERIES, D.J. 1984. A radio-tracking
survey of otters Lutra lutra on a Perthshire river system.Lutra 27: 85-145.
HARRIS, S., CRESSWELL, W.J., FORDE, P.G., TREWHELLA, W.J.,WOOLLARD, T. & WRAY, S. 1990. Home-range analysis usingradio-tracking data - a review of problems and techniquesparticularly as applied to the study of mammals. Mammal
Review 20: 97-123.HARRISON, T.D. 1997. A preliminary survey of coastal river
systems on the South African west coast, Orange River - GrootBerg, with particular reference to the fish fauna.Transactions of the Royal Society of South Africa 52: 277-321.
HEATH, R.G.M. & CLAASSEN, M. 1999. An overv~ew of the pesticide
and metal levels present in populations of the larger
indigenous fish species of selected South African rivers. WRCReport No. 428/1/99, Water Research Commission, Pretoria.
HEINECKEN, T.J.E., BICKERTON, l.B. & HEYDORN, A.E.F. 1983. Asummary of studies of the pollution input by rivers and
estuaries entering False Bay. Council for Scientific andIndustrial Research, Stellenbosch.
Stellenbosch University http://scholar.sun.ac.za

119
HILL, M.P. & O'KEEFFE, J.H. 1992. Some aspects of the ecologyof the freshwater crab (Potamonautes perlatus Milne Edwards)in the upper reaches of the Buffalo River, eastern CapeProvince, South Africa. South African Journal of Aquatic
Sciences 18: 42-50.HUSSAIN, S.A. & CHOUDHURY, B.C. 1995. Seasonal movement, home
range, and habitat use by smooth coated otters in NationalChambal Sanctuary, India. Habitat 11: 45-55
KOPP, S.D., GUTHERY, F.S., FORRESTER, N.D. & COLE, L.C. 1998.Habitat selection modeling for northern bobwhites onsubtropical rangeland. Journal of Wildlife Management 62:
884-895.KREBS, J.R. & KACELNIK, A. 1991. Decision making. In: Behavioural
ecology an evolutionary approach, (eds) J.R. Krebs, & N.B.Davies, 3rd edn, Blackwell Scientific Publications, Oxford.
KRUUK, H. 1992. Scent marking by otters (Lutra lutra): signalingthe use of resources. Behavioral Ecology 3: 133-140.
KRUUK, H. 1995. Wild otters: Predation and populations. OxfordUniversity Press, Oxford.
KRUUK, H., CARSS, D.N., CONROY, J.W.H. & DURBIN, L.S. 1993. Otter(Lutra lutra L.) numbers and fish productivity in rivers innorth-east Scotland. Symposia of the Zoological Society of
London No. 65: 171-191.KRUUK, H., TAYLOR, P.T. & MOM, G.A.T. 1997. Body temperature and
foraging behaviour of the Eurasian otter (Lutra lutra), inrelation to water temperature. Journal of Zoology, London
241: 689-697.KRUUK, H., CARSS, D.N., CONROY, J.W.H. & GAYWOOD, M.J. 1998.
Habitat use and conservation of otters (Lutra lutra) inBritain: a review. Symposia of the Zoological Society of
London No. 71: 119-133.KRUUK, H., CONROY, J.W.H., GLIMMERVEEN, U. & OUWERKERK, E.J.
1986. The use spraints to survey populations of otter Lutra
lutra. Biological Conservation 35: 187-194.
Stellenbosch University http://scholar.sun.ac.za

120
JOHNSON, D.H. 1980. The comparison of usage and availabilitymeasurements for evaluating resource preference. Ecology 61:
65-71.LE MAITRE, D.C., VERSFELD, D.B. & CHAPMAN, R.A. 2000. The impact
of invading alien plants on surface water resources in SouthAfrica: A preliminary assessment. Water SA 26: 397-408.
MACARTHUR, R.H. & PIANKA, E.R. 1966. On optimal use of a patchyenvironment. American Naturalist 100: 603-609.
MASON, C.F. & MACDONALD, S.M. 1986. Otters: ecology and
conservation. Cambridge University Press, Cambridge.MAYFIELD, S. 1993. Aspects of the distribution, population
structure and feeding biology of the freshwater crabPotamonautes perlatus (Milne Edwards) (Decapoda: Potamonidae)in the Liesbeek River, western Cape, South Africa. B.Sc.(Hons) thesis, University of Cape Town, Cape Town, SouthAfrica.
MCKENZIE, A.A., MELTZER, D.G.A., LE ROUX, P.G. & GOSS, R.A. 1990.Use of implantable radio transmitters in large Africancarnivores. South African Journal of Wildlife Research 20:
33-35.MELQUIST, W.E. & HORNOCKER, M.G. 1983. Ecology of river otters in
west central Idaho. Wildlife Monographs 83: 1-60.MILLS, M.G.L. 1990. Kalahari hyaenas: The comparative behavioural
ecology of two species. Unwin Hyman, London.MORRIS, D.W. 1987. Ecological scale and habitat use. Ecology 68:
362-369.NEL, J.A.J. & SOMERS, M.J. In press. The status of otters in
Africa: an assessment. Habitat No. 13:ORlANS, G.H. & WITTINGER, J.F. 1991. Spatial and temporal scales
in habitat selection. American Naturalist 137(supplement):29-49.
PALOMARES, F. & DELIBES, M. 1992. Data analysis design andpotential bias in radio-tracking studies of animal habitatuse. Acta Oecologica 13: 221-226.
PERRIN, M.R. & CARUGATI, C. 2000a. Food habits of coexisting Capeclawless otter and spotted-necked otter in the KwaZulu-Natal
Stellenbosch University http://scholar.sun.ac.za

121
Drakensberg, South Africa. South African Journal of
Wildlife Research 30: 85-92.PERRIN, M.R. & CARUGATI, C. 2000b. Habitat use by the Cape
clawless otter and the spotted-necked otter in the KwaZulu-Natal Drakensberg, South Africa. South African Journal of
wildlife Research 30: 103-113.PERRIN, M.R. & D'INZILLO CARRANZA, I. 2000. Habitat use by
spotted-necked otters in the KwaZulu-Natal Drakensberg, SouthAfrica. South African Journal of wildlife Research 30: 8-14.
PERRIN, M.R., D'INZILLO CARRANZA, I. & Linn, I.J. 2000. Use ofspace by the spotted-necked otter in the Natal Drakensberg,South Africa. South African Journal of Wildlife Research 30:
15-21.RALLS, K. 1997. On becoming a conservation biologist:
autobiography and advice. In: Behavioral approaches toconservation in the wild, (eds) J.R. Clemmons & R. Buchholz,Cambridge University Press, Cambridge.
RALLS, K., HATFIELD, B.B. & SINIFF, D.B. 1995. Foraging patternsof California sea otters as indicated by telemetry. Canadian
Journal of Zoology 73: 523-531.RASA, O.A.E. 1983. Dwarf mongoose and hornbill mutualism in the
Taru Desert, Kenya. Behavioral Ecology and Sociobiology 12:
181-190.RASA, O.A.E. 1986. Ecological factors and their relationships to
group size, mortality and behaviour in the dwarf mongooseHelogale undulata (Peters, 1852). Cimbebasia 8: 15-21.
RAUBENHEIMER, C.D. 1986. Aspects of the biology of the freshwatercrab, Potamonautes sidneyi, with particular reference togeneral seasonality and female aggression. M.Sc. thesis,University of Natal, Durban, South Africa.
ROWE-ROWE, D.T. 1992. Survey of South African otters infreshwater habitat, using sign. South African Journal of
Wildlife Research 22: 49-55.ROWE-ROWE, D.T. & SOMERS, M.J. 1998. Diet, foraging behaviour and
coexistence of African otters and the water mongoose.Symposia of the Zoological Society of London No. 71: 215-227.
Stellenbosch University http://scholar.sun.ac.za

122
SCHMANDT, J. 1992. The regions and global warming
impacts and response strategies. Oxford University Press, NewYork.
SIEGEL, S. 1956. Nonparametric statistics for the behavioral
sciences. McGraw-Hill Book Company, New York.SOMERS, M.J. 2000a. Seasonal variation in the diet of Cape
clawless otters (Aonyx capensis) in a marine habitat. African
Zoology 35: 261-268.SOMERS, M.J. 2000b. Foraging behaviour of Cape clawless otters
(Aonyx capensis) in a marine habitat. Journal of Zoology,
London 252: 473-480.VAN DER ZEE, D. 1981. Prey of the Cape clawless otter (Aonyx
capensis) in the Tsitsikama National Park, South Africa.Journal of Zoology, London 194: 467-483.
VAN DER ZEE, D. 1982. Density of Cape clawless otters Aonyx
capensis (Schinz, 1821) in the Tsitsikama Coastal NationalPark. South African Journal of Wildlife Research 12: 8-12.
VAN NIEKERK, C.H., SOMERS, M.J. & NEL, J.A.J. 1998. Freshwateravailability and distribution of Cape clawless otter spraintsand resting places along the south-west coast of SouthAfrica. South African Journal of Wildlife Research 28: 68-72.
VERWOERD, D.J. 1987. Observations on the food and status of theCape clawless otter Aonyx capensis at Betty's Bay, SouthAfrica. South African Journal of Zoology 22: 33-39.
WALLER, J.S. & MACE, R.D. 1997. Grizzly bear habitat selection inthe swan mountains, Montana. Journal of Wildlife Management
61: 1032-1039.WEBER, J.-M. & DAILLY, L. 1998. Food habits and ranging behaviour
of a group of farm cats (Felis catus) in a Swiss mountainousarea. Journal of Zoology, London 245: 234-237.
WIENS, J.A. 1989. Spatial scaling in ecology. Functional Ecology
3: 385-397.
Stellenbosch University http://scholar.sun.ac.za

123
CHAPTER 5*
SEASONAL VARIATION IN THE DIET OF CAPE CLAWLESS OTTERS
(AONYX CAPENSIS) IN A MARINE HABITAT
INTRODUCTION
Optimal foraging theory (MacArthur & Pianka 1966; Stephens &Krebs 1986) predicts that when food is scarce, individuals cannotbe as particular about what they eat as when food is abundant. Asa result, diets are predicted to be broader during 'lean seasons'than during 'rich seasons'. This is probably optimal foragingtheory's most robust theorem to date (Perry & Pianka 1997). Thediets of animals are therefore expected to change with theseasons, being more diverse in winter than in summer. In certaincircumstances this may, however, be reversed with the leanerperiod being summer. For piscivorous predators the leaner periodmay also be related to the ability of the predator to catch prey,rather than prey abundance. Colder water enables fish to becaught more easily as they are more lethargic (Rowe-Rowe 1977a)In cold water, piscivorous predators could therefore afford to bemore selective than in warmer water where the prey can movefaster. In False Bay, Western Cape Province, South Africa, seatemperature in winter is significantly colder than in otherseasons, but neither the total number nor the overall densitiesof fish fluctuate seasonally (Clark et al. 1996). This localitytherefore affords an opportunity to test the hypothesis thatdiversity (i.e. the number of prey species, their relative
*Published as: SOMERS, M.J. 2000. Seasonal variation in the diet
of Cape clawless otters (Aonyx capensis) in a marine habitat.
African Zoology 35: 261-268.
Stellenbosch University http://scholar.sun.ac.za

124
contribution, and size distribution) in the diet ofpiscivorous predators is influenced by their ability to catchprey, rather than just prey abundance. One such predator feedingon fish and crustaceans in the surf zone in False Bay is the Capeclawless otter Aonyx capensis (Schinz, 1821).
Aonyx capensis weigh between 10 and 18 kg, males being largerthan females. They use freshwater habitats extensively (see Rowe-Rowe & Somers 1998 for a review) but also use marine habitats forfood such as Cape rock crab Plagusia chabrus, shore crabCyclograpsus punctatus, Cape rock lobster Jasus lalandii, octopusOctopus granulatus, and various species of fish (Van der Zee1981; Arden-Clarke 1983; Verwoerd 1987). Of these studies onlyVan der Zee (1981) provides seasonal data on four prey speciesand their relation to availability. As has been shown forEuropean otters Lutra lutra (Kruuk 1995), A. capensis also appearto only use marine habitats in the presence of fresh water (vanNiekerk et al. 1998). In the marine habitat of TsitsikamaNational Park, Eastern Cape Province, South Africa, they aremainly nocturnal (Arden-Clarke 1983). Crustaceans have been shownin most studies to be the most common prey of A. capensis infreshwater ecosystems, supplemented with lesser amounts of frogs,fish, and aquatic insects (Rowe-Rowe & Somers 1998 and referencestherein). Birds, reptiles, molluscs, dung (ungulate) and mammalsare all minor items, seldom eaten. In freshwater habitats A.
capensis are active mainly during late afternoon, early evening,and early morning (Rowe-Rowe 1977a, 1978; Chapter 3) .
This study quantifies sizes of marine crustaceans eaten by A.capensis, using length of eyestalks found in spraints (Purves etal. 1994). The sizes of the fish eaten are also determined, usingthe diameter of otoliths (Smale et al. 1995) in the spraints.Otoliths have long been recognised as a tool for determining thediet of piscivorous predators (Fitch & Brownell 1968; Ross 1984),but have not previously been used for otters. The energetics ofprey capture, however, fall outside the scope of this chapter; nodata are available on energetic requirements of A. capensis, orthe energetic content of different prey species.
Stellenbosch University http://scholar.sun.ac.za
125
In this chapter I present data on the seasonal diet of A.
capensis in a marine habitat as determined by spraint analysis.As little is known about use of marine environments by A.
capensis (Estes 1994) this chapter also aims to contribute to theknowledge on which future conservation management plans for thespecies could be based.
MATERIALS & METHODS
Spraints were collected, and visual observations made, on A.
capensis foraging and feeding, from 7 September 1995 to 10October 1996, along a 2-km stretch of the southwestern corner ofFalse Bay, just South West of Rooi-Els (33° 19' S, 26° 05' E),Western Cape Province, South Africa.
The coast here is highly exposed, with broad (up to 40 m)surf zones. Four small, perennial, freshwater streams (ca 0.5-2 mwide and ca 50-500 mm deep, depending on season) enter the seawithin this 2 km stretch. A road parallel to the coast and 3-5 IDabove and 15-20 m away from the high water mark, facilitatesaccess.
The mean sea temperature varies with season: summer, 21.5°C;spring, 18.2°C; autumn, 17.1°C; and winter, 13.2°C. Winter seatemperature is significantly lower than that of the other seasons(Clark et al. 1996). The climate type is Mediterranean with cold,wet winters and hot, dry summers (Schulze 1965). The mean tidalrange in False Bay is 1.48 m (Spargo 1991) and mean salinitiesrange from ca 35.0-35.3~ (Atkins 1970).
Identification of A. capensis spraints in the field was basedon their characteristic odour, diameter and appearance (Rowe-Rowe1992). Two hundred and four spraints were collected during thestudy. Spraints were air-dried, teased apart and prey remainsidentified using a stereomicroscope (X 10-100 magnification) .Prey items were sorted into the following categories: P. chabrus,
c. punctatus, freshwater crab Potamonautes perlatus, J. lalandii,
O. granulatus, fish, frog, mammal, and unidentified items. The
Stellenbosch University http://scholar.sun.ac.za

126
presence of mammals was based on hair, crabs from carapaces,fish from bones, scales and otoliths, and frogs from bones.Otoliths were removed and identified to species level (Smale etal. 1995). Misidentification may occur when using otoliths toidentify fish but this was circumvented (Smale et al. 1995) byidentifying those fishes that occur in the area (Smith & Heemstra1986; Clark et al. 1996). Two hundred and six otoliths were foundin 103 spraints. Of these, 16 were complete yet unidentifiable,45 were broken but identifiable, 109 were undamaged, measurableand identifiable and 36 broken and unidentifiable.
The presence of each prey category in each spraint wasscored, and the percentage occurrence of each prey categorycalculated. Scores for each category were also added andexpressed as a percentage of the total number of scores of allcategories, yielding relative percentage occurrence. This methodhas been shown to closely approximate the proportions ofdifferent items actually consumed by L. lutra (Erlinge 1968) andA. capensis (Rowe-Rowe 1977b). Carss & Parkinson (1996), however,showed that for L. lutra it should only be used to rankimportance of prey in the diet.
For comparisons with direct observations (Somers 2000(Chapter 6)) and other studies, the rank order of all fishspecies, all crab species, J. lalandii and O. granulatus in thediet was determined using relative percentage occurrence data.
For each spraint the dominant prey type was also determinedby volumetric analysis of remains of prey items. For thisanalysis, in a spraint consisting mainly of crab remains, crabwould be the dominant prey type and the other prey items ignored.The different dominant prey items were then added and expressedas a percentage of the total number of spraints (Kruuk et al.
1994; Purves et al. 1994; Somers 2000 (Chapter 6)).The diet was determined for the four seasons: winter (June-
August) ; spring (September-November); summer (December-February)and autumn (March-May).
Following Arden-Clarke (1983), gastropods, isopods,amphipods, insects and unidentified crustacean larvae were
Stellenbosch University http://scholar.sun.ac.za

127
excluded from these analyses. These were all minor items iLthe spraints and were probably not food, but had entered thespraints after defaecation, or were attached to prey. They were,however, combined as an "other" category.
Prey diversity was, based on an analysis of 21, 58, 83 and 42spraints respectively, compared between seasons using theShannon-Wiener index (Krebs 1985).
sH = -L (p,Xlog 2P')
i=1
Where,H index of species diversity,5 number of speciesand Pi = proportion of total sample belonging to the ith species.
Diversity was also calculated using Simpson's diversity index
s
D = 1-L (Piyi=1
where D = Simpson's index of diversity and Pi = proportion ofindividual of species i in the community (Krebs 1985).
Equitability or evenness of representation E (range 0-1) ofeach species was calculated as
E = H/Hmax
where Hmax is log25 and H = observed diversity (Krebs 1985).Jasus lalandii (n = 12, mean carapace length = 79.1 mm, S.E.
5.0 mm, rangecarapace lengthc. punctatus (n
70.2-89.9 mm), P. chabrus (n = 10, mean32.7 mm, S.E. = 2.6 mm, range 20.0-45.0 mm) and7, mean carapace length = 39.0 mm, S.E. 5.0
mm, range = 22.8-60.1 mm) were collected from shallow areas orfound dead on the beach. Jasus lalandii and crabs were air-dried.The maximum carapace length of the J. lalandii and maximumcarapace widths of the crab species were measured with callipers
Stellenbosch University http://scholar.sun.ac.za

128
and eyestalk lengths were measured with an ocular ruler in astereo microscope. Regressions were calculated for carapace sizeand eyestalk lengths (Purves et al. 1994).
For J. lalandii there was a significant linear relationship(r2 = 0.84, n = 12, S.E. 2.10%, P < 0.001) for which C =
49.25+(15.81*E), where C carapace length (mm) and E = eye stalklength (mm). For C. punctatus there was a significant linearrelationship (r2 = 0.96, n = 7, S.E. = 2.95%, P < 0.001) forwhich C = -10.65+(6.8*E). For P. chabrus there was a significantlinear relationship (r2 = 0.95, n = 10, S.E. 2.0%, P < 0.001)for which C = -7.2 (7.11*E). For P. perlatus the regression,determined for crabs in the Olifants River, Western CapeProvince, (Purves et al. 1994) was used: C = -11.48+(8.33*E).This correlation was also significant (r2 = 0.99, n = 66, P <
0.001) .Lengths of eyestalks of all four crustacean species found in
the spraints, were measured. The equations were then used todetermine size of crabs and J. lalandii eaten by the otters. Thesizes of the fishes were also determined, from publishedregressions using otolith diameter (Smale et al. 1995).
The amount of fish in the diet was compared with theiravailability during the different seasons, as determined by Clarketal. (1996).
Statistical tests used are mentioned at appropriate points inthe text, the level of significance being p = 0.05. Statisticaltests were done using the computer programme SigmaStat forWindows 95 version 2.0, Jandel Corporation©.
RESULTS
Nearly all prey of A. capensis in False Bay were benthic marinespecies (Tables 5.1-5.4). Using the relative per cent occurrencedata to rank the various prey the most common prey species of A.
capensis was P. chabrus during all seasons, followed by J.
lalandii.
Stellenbosch University http://scholar.sun.ac.za

129
Table 5.1. Prey items recorded in .21 Cape clawless otter Aonyx capensis spraints collected fromFalse Bay during winter (June, July and August 1996), as percentage occurrence, relative frequencyoccurrence, and percentage of spraints dominated by a prey.
Prey Observed % Occur. Rel. freq. Occur. % Dominance
Crustacean 16 76.2 44.4 55.0
Plagusia chabrus* (11 ) (52.4) (30.6) (40.0)
Potamonautes perlatus* (1 ) (4.8) (2.8) (5.0)
Jasus lalandii * (4 ) (19.0) (11.1) (15.0)
Fish 19 90.5 52.8 40.0
Clinus superciliosus* (4 ) (19.0) (11. 1)
Coryphaena hippurus (1 ) (4.8) (2.8)
Sarpa salpa (2 ) (9.5) (5.6)
Unidentified ( 6) (28.6) (16.7)
Mammal 1 4.8 2.8
Other (non food) 9
*Benthic species
Stellenbosch University http://scholar.sun.ac.za
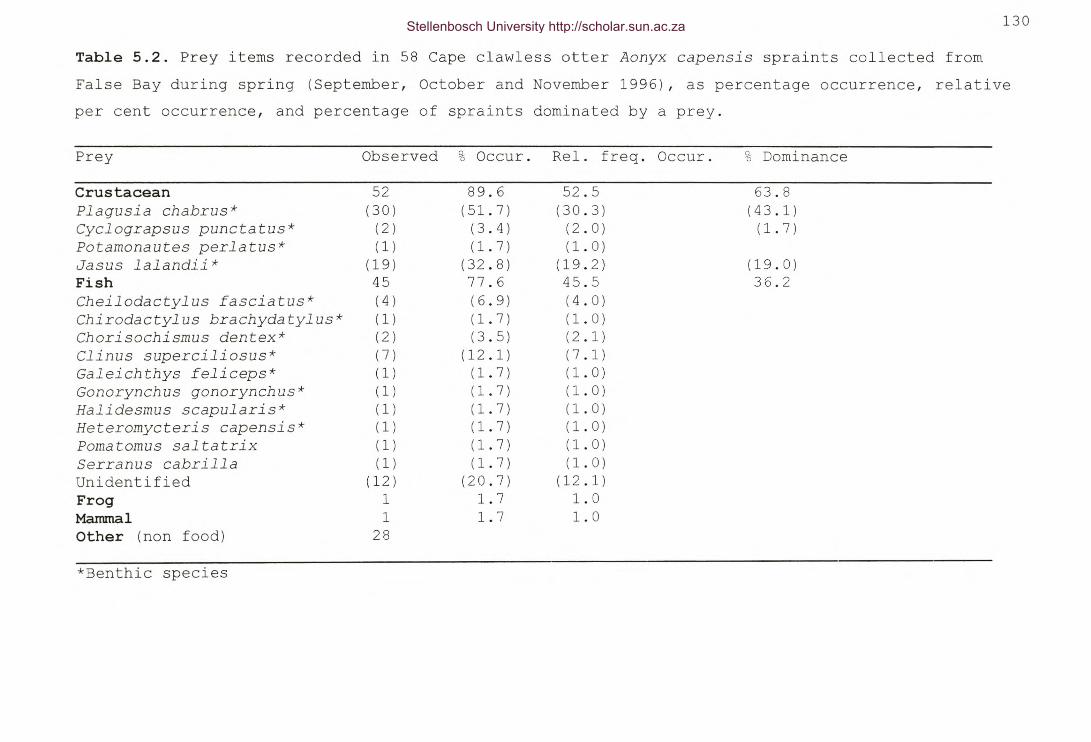
130
Table 5.2. Prey items recorded in 58 Cape clawless otter Aonyx capensis spraints collected fromFalse Bay during spring (September, October and November 1996), as percentage occurrence, relativeper cent occurrence, and percentage of spraints dominated by a prey.
Prey Observed % Occur. Rel. freq. Occur. % Dominance
Crustacean 52 89.6 52.5 63.8Plagusia chabrus* (30) (51.7) (30.3) (43.1)Cyclograpsus punctatus* (2) (3.4) (2.0) (1.7)Potamonautes perlatus* (1) (1.7) (1.0)Jasus lalandii * (19) (32.8) (19.2) (19.0)Fish 45 77.6 45.5 36.2Cheilodactylus fasciatus* (4) (6.9) (4.0)Chirodactylus brachydatylus* (1) (1.7) (1.0)Chorisochismus dentex* (2) (3.5) (2.1)Clinus superciliosus* (7) (12.1) (7.1)Galeiehthys feliceps* (1) (1.7) (1.0)Gonorynchus gonorynchus* (1) (1.7) (1.0)Halidesmus scapularis* (1) (1.7) (1.0)Heteromycteris capensis* (1) (1.7) (1.0)Pomatomus saltatrix (1) (1.7) (1.0)Serranus cabrilla (1) (1.7) (1.0)Unidentified (12) (20.7) (12.1)Frog 1 1.7 1.0Mammal 1 1.7 1.0Other (non food) 28
*Benthic species
Stellenbosch University http://scholar.sun.ac.za

131
Table 5.3. Prey items recorded in 83 Cape clawless otter Aonyx capens~s spraints collected fromFalse Bay during summer (December 1995, January and February 1996), as percentage occurrence, percent frequency occurrence, and percentage of spraints dominated by a prey.
Prey Observed % Occur. Rel. freq. Occur.
Crustacean 70 84.3 49.0Plagusia chabrus* (44) (53.0) (30.8)Cyclograpsus punctatus* (1) (l.2) (0.7)Potamonautes perlatus* (5) (6.0) (3.5)Jasus lalandii * (20) (24.0) (13.9)MolluscOctopus granulatus* 7 8.4 4.9Fish 66 79.5 46.2Cheilodactylus fasciatus* (14) (16.9) (26.92)Chorisochismus dentex* (2) (2.4) (3.85)Clinus supercilious* (7) (8.4) (13.46)Galeichthys feliceps* (4) (4.8) (7.69)Gilchristelia aestuaria (1) (l.2) (1.92)Halidesmus scapularis* (1) (l.2) (1.92)Heteromycteris capensis* (1) (l.2) (l.92)Pomatomus saitatrix (3) (3.6) (5.77)Rhabdosargus hoI ubi (1) (l.2) (1.92)Sarpa salpa (2) (2.4) (3.85)Serranus cabrilia (1) (l.2) (l.92)Solea bleekeri* (1) (l.2) (l.92)Unidentified (16) (19.3) (26.92)Other (non food) 52
*Bottom-dweller
% Dominance
56.6(37.3)
(3.6)(15.7)
43.4
Stellenbosch University http://scholar.sun.ac.za

132
Table 5.4. Prey items recorded in 42 Cape clawless otter Aonyx capens~s spraints collected fromFalse Bay during autumn (March, April and May 1996), as percentage occurrence, per cent frequencyoccurrence, and percentage of spraints dominated by a prey.
Prey Observed % Occur. Rel. freq. Occur.
Crustacean 23 54.8 32.8Plagusia chabrus* 11 (26.2) (15.7)Potamonautes perlatus* 2 (4.8) (2.9)Jasus lalandii * 10 (23.8) (14.3)MolluscOctopus granulatus* 9 21.4 12.8Fish 38 90.5 54.3Atherina breviceps (1) (2.4) (1.4)Cheilodactylus fasciatus* (8) (19.1) (11.4)Chorisochismus dentex* (5) (11.9) (7.1)Clinus supercili osus * (7) (16.7) (10.0)Diplodus sargus capensis (1) (2.4) (1.4)Heteromycteris capensis* (1) (2.4) (1.4)Pomatomus saltatrix (3) (7.1) (4.3)Sarpa salpa (1) (2.4) (1.4)Umbrina canariensis (1) (2.4) (1.4)Unidentified (14) (33.3) (20.0)Other (non food) 29
*Benthic species
% Dominance
31. 0(19.0)(4.8)(7.1)
69.0
Stellenbosch University http://scholar.sun.ac.za

133
In winter the fish Clinus superciliosus was of equalimportance. Other prey included the crustaceans C. punctatus, andP. perlatus, the mollusc O. granulatus, and an additional 17 fi5hspecies, frogs and mammals (Tables 5.1-5.4). Using rank andpercentage dominance, fish was the most important prey categoryin winter and autumn while crustacean was the most important inspring and summer (Tables 5.1-5.4). When separating J. lalandii
from the crab species, the ranking of the three most importantprey categories was (1) fish (2) crabs (3) J. lalandii for allseasons (Table 5.5) .
Only for Cheilodactylus fasciatus and C. superciliosus weresample sizes large enough for seasonal comparison. For these twofish species Kruskal-Wallis one way analysis of variance on ranksindicated that there were no significant differences in the sizeof fish represented in the spraints in different seasons (H
0.68, d.f. = 2, P = 0.712; H = 0.59, d.f. = 3, P = 0.900)respectively. There was also no significant difference in thesizes of all fish species combined (H = 7.65, d.f. = 3, P
0.054) during the different seasons.However, when comparing only summer and winter fish, there
was a significant difference between the sizes of fish found inthe spraints (Mann-Whitney U = 285, d.f. = 48, P = 0.007, two-tailed test). In addition, A. capensis also ate the widest sizerange of fish (Table 5.7), and preyed on the largest number ofspecies (Tables 5.1-5.4), in summer.
Seasonal sample sizes of the two crustaceans (P. chabrus andP. perlatus) were large enough to allow statistical comparison.There were significant differences in size of Plagusia chabrus (H
12.43, d.f = 3, P = 0.006) and P. perlatus (H = 8.96, d.f. = 3,P = 0.03) during the various seasons, with the largest P. chabrus
being eaten in spring and the largest P. perlatus being eaten inwinter.
Stellenbosch University http://scholar.sun.ac.za

134
Table 5.5. Relative percentage occurrence data and rank (in parenthesis) of most important preycategories of Cape clawless otters Aonyx capensis for this study and various other localities.
Sampled area crab species Jasus lalandii fish species Octopus granulatus
False Bay (Winter) 33 (2) 11 (3) 53 (1 ) 0 (4 )
False Bay (Spring) 32 (2) 19 (3) 46 (1 ) 0 (4 )
False Bay (Summer) 35 (2) 14 (3) 46 (1 ) 5 (4 )
False Bay (Autumn) 19 (2) 3 (4 ) 54 (1 ) 13 (3)
Tsi t si.kama' 38 (2) 1 (4 ) 52 (1 ) 7 (3)
Tsi t si.karaa" 63 (1 ) 0 (4 ) 33 (2) 4 (3)
Betty's Bay3 31 (2) 18 (3) 36 (1 ) 11 (4 )
1 van der Zee (1981), 2 Arden-Clarke (19B3), 3 Verwoerd (1987).
Stellenbosch University http://scholar.sun.ac.za

135
Table 5.6. Sizes of crustaceans and fish found in spraints of Cape clawless otters Aonyx
capensis in False Bay during the various seasons. Measurements (mm) are given ± SE with sample sizein parenthesis. For fish total lengths are given. For crabs and Jasus lalandii maximum carapacewidths and lengths, respectively, are given.
Winter Spring Summer Autumn
Crustaceans:Plagusia chabrus 21.1±4.9 (4) 3l.3±l.8 (7) 29.4±l.5 (12) 22.8±l.6 (14)Cyclograpsus punctatus 17.9±3.8 (2)Potamonautes perlatus 39.33 (1) 27.7±7.1 (3) 26.5±2.75 (8) 37.0±l.43 (5)Jasus lalandii 96.68 (1) 142.5 (1) 80.9 (1) -Fish:Atherina breviceps 5l.8(1)Cheilodactylus fasciatus 115.3±25.4(3) 127.2±11.0(13) 124.2±5.4 (9)Chirodactylus brachydatylus 252.0 (1)Chorisochismus dentex 53.2±16.2(2) 43.9±25.5 (2) 39.0±5.2 (5)Clinus superciliosus 75.8±12.5 (4) 79.6±7.7(15) 94.0±17.4 (9) 92.1±16.9 (9)Coryphaena hippurusDiplodus sargus capens~s 43.8±6.3 (2)Galeiehthys feliceps 709.1 (1) 181.9±48.0 (9) -
Stellenbosch University http://scholar.sun.ac.za

136
Table 5.6. Continued:
Winter Spring Summer Autumn
Fish Continued:GilchristelIa aestuariaGonorynchus gonorynchusHalidesmus scapularisHeteromycteris capensisPomatomus saltatrixRhabdosargus hoI ubiSarpa salpaSerranus cabriIIaSolea bleekeriUmbrina canariensisAll species of fish:
40.3 (1 )124.6 (1 ) 183.8 (1 )
127.5±48.7 (2) 98.2±1.0 (2)305.1 (1 )
64.2±2.4 (5) 62.6±2.3 (2 ) 38.3 (1 )2.6 (1 )
69.3±5.7 (9) 115.5±27.6(24) 127.7±14.2(40) 86.8±8.3 (29)
Stellenbosch University http://scholar.sun.ac.za

137
Table 5.7. The size distribution of fish eaten by Capeclawless otters Aonyx capensis in False Bay, Western CapeProvince, South Africa. The figures represent the number of fishin each size category.
Size of fish Winter Spring Summer Autumn(TL mm) (n = 9) (n = 24) (n = 40) (n = 30)
0-910-19 220-29 1 330-39 3 2 440-49 1 250-59 3 1 1 460-69 4 2 370-79 3 180-89 4 4 290-49 2 2 9 2100-54 1 3110-59 3 4 3120-65 2 1130-70 1 3140-149 1 2150-159 1160-169 1 2170-179180-189 1 1190-199 3200-209210-219220-229 1230-239240-249250-259 1260-269270-279280-289290-299300-310 1> 310 2
Stellenbosch University http://scholar.sun.ac.za

138
Although the data are not suitable for statisticalcomparison, the comparison of the percentages of species caught(Clark et al. 1996) with those found in the spraints show a clearselection for certain species of fishes such as C. superciliosusr
C. fasciatus and Sarpa salpa (Table 5.8). The abundant Atherina
breviceps (Clark et al. 1996, Table 5.8) was not eaten except inautumn.
Diversity of prey (Tables 5.1-5.4), as measured by theShannon-Wiener and Simpson's indices, was lowest in winterincreasing through the seasons (Table 5.9). Equitability washigher in winter and autumn than in spring and summer (Table5.9). None of the measures of diversity used increasedsignificantly with seasonal increases in temperature (Table 5.9).
DISCUSSION
The present data, although collected over a short period from asmall sample of spraints do indicate which species were eaten,and some seasonal differences in diet. However, spraint analysisdoes not reveal the importance of various prey with regard tobiomass or energy consumed.
Diet analysis using frequency of occurrence data in L. lutra
has come under severe criticism, with Carss & Parkinson (1996)showing that these data should only be used to rank theimportance of various prey categories rather than as anindication of relevant quantities in the diet. The frequency ofoccurrence data from the present study show the same rank ofimportance of the three most important prey categories as does(Somers 2000 (Chapter 6)) (1) fish (2) crabs (3) J. lalandii.
Somers (2000; Chapter 6) used direct observations of A. capens~s
and found unidentified fish (50.0%); unidentified crabs (27.8%);J. lalandii (11.1%) and abalone Haliotis midae (5.6%) to be eatenby otters. As only the soft part of H. midae are eaten (Somers,pers. obs.), no remains of them would be have been found inspraints in the present study.
Stellenbosch University http://scholar.sun.ac.za

139
Table 5.8. The observed versus the expected percentage of individual species of fish found inthe spraints of Cape clawless otters Aonyx capensis in False Bay, Western Cape Province, SouthAfrica.
Fish speciesE
Wintero E
Springo E
Summero E
Autumno
Atherina brevicepsCheilodactylus fasciatusChirodactylus brachydatylusChorisochismus dentexClinus superciliosusCoryphaena hippurusDiplodus sargus capens~sGaleichthys felicepsGilchristelIa aestuariaGonorynchus gonorynchusHalidesmus scapularisHeteromycteris capensisPomatomus saltatrixRhabdosargus hoI ubiSarpa salpaSerranus cabrillaSolea bleekeriUmbrina canariensis
0.000.000.000.00
53.857.690.000.000.000.000.000.000.000.00
38.460.000.000.00
27.000.000.000.000.160.000.230.002.550.000.000.090.200.010.000.000.010.29
0.0015.792.635.26
47.370.000.002.630.002.632.632.63
15.790.000.002.630.000.00
62.660.000.000.000.110.020.020.000.040.000.000.100.410.010.720.000.000.02
0.0033.330.003.51
22.810.000.00
17.541.750.001.751.758.771.753.511.751.750.00
61.990.000.000.000.030.000.050.000.500.000.000.220.110.001.790.000.000.03
2.2242.220.00
11.1124.440.00
24.440.000.000.000.002.228.890.002.220.000.002.22
54.210.000.000.000.240.000.020.000.050.000.000.050.120.030.340.000.220.05
* Percentage of catch as determined from Clark et al. (1996)
Stellenbosch University http://scholar.sun.ac.za

140
Table 5.9. Seasonal diversity of prey species recorded in Cape clawless otter Aonyx capensis
spraints collected from False Bay, Western Cape Province, South Africa.
Community parameter Winter Spring Summer Autumn Simple linear regression of
variables vs water temperature
Total number of species 6 16 17 13 r2 0.89, P 0.055*
Diversity (Hl 2.00 2.70 2.95 3.20 r2 0.52, P 0.282*
Equitability (El 0.78 0.68 0.72 0.87 r2 0.17, P 0.592*
Dominance (Dl 0.71 0.77 0.80 0.89 r2 0.18, P 0.571*
*As the pOINers of these tests are below 0.800 the findings should be interpreted with caution.
Stellenbosch University http://scholar.sun.ac.za

141
This supports previous findings (Erlinge 1968; Rowe-Rowe1977b) that percentage occurrence is a reliable estimate of thediet, but as shown here only when per cent of prey categoriescaught is concerned. The results show that a combination ofdirect observation and spraint analysis will give a more completedescription of diet. For example, in the present study prey suchas abalone were not found in the spraints but observationsindicated that they were eaten (Somers 2000 (Chapter 6)). On theother hand, crab and fish species data were not available fromdirect observations (Somers 2000 (Chapter 6)), but are from thespraint analysis.
The finding of a general seasonal shift in diets fromcrustaceans being more important than fish in summer and springsuggests a shift in diet as the water gets warmer. This supportsthe hypothesis that the otters are able to catch fish more easilyduring colder times.
Other studies (Table 5.5) on the diet of A. capens~s inmarine habitats yielded varying results. In Tsitsikama van derZee (1981), who sampled all seasons, found fish to be the mostimportant but later Arden-Clarke (1983), who sampled only autumn,found crabs to be the most important prey type. The reasons forthis difference between these two studies in the same localityare unknown. Verwoerd (1987) found a similar rank in theimportance of prey to that in the present study and Somers (2000;Chapter 6).
Aonyx capensis ate a wide size range of crustaceans,including specimens much larger than they eat in freshwaterhabitats (e.g. mean carapace width = 23.5 mm, range 3.1-65.5 mm)(Somers & Purves 1996 (Chapter 7)). This applies to fish as wellwith A. capensis, in fresh water, eating Tilapia sparrmanii witha mean fork length of only 20.5 mm (range 12.8-30.5) (Somers &Purves 1996 (Chapter 7)). Similarly, Rowe-Rowe (1997b) found thatmainly small fish were eaten. This disparity in prey size couldbe related to differences in feeding behaviour of the otters, orto availability of the prey. However, the diet of otters does not
Stellenbosch University http://scholar.sun.ac.za

142
always reflect prey availability, but may be influenced byfeeding preferences (van der Zee 1981; Kruuk & Moorhouse 1990).
The results from the analysis of spraints should beinterpreted with caution and only measures of relative importanceor rank (Carss & Parkinson 1996) used.
The comparison of what was eaten by A. capensis with what wasavailable in the sea must also be made with care. Clark et al.
(1996) sampled 1-40 m out from the beach, which includes most ofwhere the otters were seen foraging (Somers 2000 (Chapter 6)),but prey species that occur close to shore and in rock pools mayhave been undercounted. For example, S. salpa was eaten by theotters during winter but was not caught by Clark et al. (1996)
during this season. This species is common in the rock pools inFalse Bay (Bennett & Griffiths 1984). Clinus superciliosus is themost common species of fish caught during the winter when fishare more easily caught, and appears to be a favourite of A.
capensis in False Bay. Clinus superciliosus is abundant (1.34 -2m ,15.44 g m-2) in rock pools in False Bay (Bennett & Griffiths 1984)but not throughout the intertidal zone (Clark et al. 1996). Thissuggests that the otters are feeding extensively in the shallowrock pools, though Somers (2000; Chapter 6) found otters foragingin False Bay mostly at depths deeper (1.5-2.5 m) than the rockpools « 1.5 m) which C. superciliosus inhabit (Bennett &Griffiths 1984). The disparity of these results and those ofSomers (2000; Chapter 6) remains unclear. Van der Zee (1981) alsofound Clinus species, including C. superciliosus, to be importantin the diet of A. capensis in a marine habitat.
The results show that A. capensis seem to select benthic fishspecies such as C. superciliosus and C. fasciatus. Anotherbenthic species, Galeiehthys feliceps, represented in spraintsmostly in summer, was larger than the more commonly eaten speciesand could therefore be as important in the diet of A. capensis
during summer as C. superciliosus and C. fasciatus. Analysis byweight of prey caught was, however, not possible in the presentstudy. otter preferences could be related to the low escapeability of prey. Erlinge (1968) also concluded that L. lutra
Stellenbosch University http://scholar.sun.ac.za

143
catch fish in inverse proportion to their ability to escape.There are few easily caught benthic freshwater fish species insouthern Africa (Skelton 1993) which may be the reason fishremain low in importance in the diet of A. capensis in freshwaterhabitats. In addition, A. capensis could also eat more P.
perlatus in freshwater habitats because they are abundant (Somers& Nel 1998) and more easily caught than fish (Rowe-Rowe 1977a)
The relationship between the otters and their prey iscomplex. Local differences such as the water depth, substratumtype, availability of alternative prey, floods or tides, or thedensity of the predators, probably all interact to determinewhich section of fish and crustacean populations are available toA. capensis in specific areas and seasons. These aspects need tobe further studied.
Aonyx capensis are generally regarded as crab specialists infreshwater habitats (Rowe-Rowe 1977b), having broadened bunodontmolars for crushing the exoskeletons of invertebrate prey. Theirmanual dexterity further enables them to feel for and captureprey under stones and in crevices (Rowe-Rowe 1977c), possiblyfacilitating capture of all sizes of crabs, and probably bottom-dwelling fishes as well (see Tables 5.1-5.4). The resultspresented here suggest little dietary change (e.g. more J.lalandii in the southwestern Cape) along the south andsouthwestern coast of South Africa. Aonyx capensis, by foragingin both marine and freshwater habitats, demonstrate that they cansuccessfully exploit different types of aquatic environments andare capable of exploiting different kinds of prey in each. Thisis emphasised by the finding here, and in Tsitsikama (van der Zee1981), of both freshwater and marine species of prey in thespraints. Because of this ability otters are regarded asopportunist predators, and therefore can exploit a wide varietyof habitats. They, however, do exhibit a degree ofspecialisation, being primarily adapted to feed on crustaceans,but are able to make use of other suitable prey, such as slow-moving fishes.
Stellenbosch University http://scholar.sun.ac.za

144
The results presented here show the importance ofcrustaceans in the diets of these carnivores, emphasising, forthe conservation management of otters, the need for moreinformation about factors limiting prey populations, especiallythe commercially exploited (Branch & Branch 1981) andecologically important (van Zyl et al. 1998 and referencestherein) J. lalandii. The role of otters in this system is atpresent unknown and deserves further study. None of the threemain fishes consumed are used commercially (Smith & Heemstra1986) .
It is not possible, with the data available, to assess theimpact of otters on prey populations in the marine environment.Detailed data of the prey populations need to be gathered. Theseare, however, difficult to collect in the rough surf zones ofFalse Bay and other areas of southern Africa's coast.
REFERENCESARDEN-CLARKE, C.H.G. 1983. Population density and social
organisation of the Cape clawless otter, Aonyx capensis
Schinz, in the Tsitsikama Coastal National Park. M.Sc.thesis, University of Pretoria, Pretoria, South Africa.
ATKINS, G.R. 1970. Thermal structure and salinity of False Bay.Transactions of the Royal Society of South Africa 34: 11-128.
BENNETT, B.A. & GRIFFITHS, C.L. 1984. Factors affecting thedistribution, abundance and diversity of rock-pool fishes onthe Cape Peninsula, South Africa. South African Journal of
Zoology 19: 97-104.BRANCH, G. & BRANCH, M. 1981. The living shores of southern
Africa. C. Struik, Cape Town.CARSS, D.N. & PARKINSON, S.G. 1996. Errors associated with otter
Lutra lutra faecal analysis. I. Assessing general diet fromspraints. Journal of Zoology, London 238: 301-317.
CLARK, B.M., BENNETT, B.A. & LAMBERTH, S.J. 1996. Temporalvariations in surf zone fish assemblages from False Bay,South Africa. Marine Ecology Progress Series 131: 35-47.
Stellenbosch University http://scholar.sun.ac.za

145
ERLINGE, S. 1968. Food studies on captive otters Lutra lutra
L.. Oikos 19: 259-270.ESTES, J.A. 1994. Conservation of marine otters. Aquatic Mammals
20: 125-128.FIELD, J.G., GRIFFITHS, C.L., GRIFFITHS, R.J., JARMAN, N.,
ZOUTENDYK, P., VELIMIROV, B. & BOWES, A. 1980. Variation instructure and biomass of kelp communities along the south-west Cape coast. Transactions of the Royal Society of South
Africa 44: 145-203.FITCH, J.E. & BROWNELL, R.L. 1968. Fish otoliths in cetacean
stomachs and their importance in interpreting feeding habits.Journal of the Fisheries Research Board of Canada 25: 2561-2574.
KREBS, C.J. 1985. Ecology: The experimental analysis of
distribution and abundance. Harper and Row, New York.KRUUK, H. 1995. Wild otters: predation and populations. Oxford
University Press, Oxford.KRUUK, H. & MOORHOUSE, A. 1990. Seasonal and spatial differences
in food selection by otters (Lutra lutra) in Shetland.Journal of ZoologYr London 221: 621-637.
KRUUK, H., KANCHANASAKA, B., O'SULLIVAN, S. & WANGHONGSA, S.1994. Niche separation in three syrnpatric otters Lutra
perspicillatar L. lutra and Aonyx cinerea in Huai Kha Khaeng,Thailand. Biological Conservation 69: 115-120.
MACARTHUR, R.H. & PIANKA, E.R. 1966. On optimal use of a patchyenvironment. American Naturalist 100: 603-609.
PERRY, G. & PIANKA, E.R. 1997. Animal foraging: past, present andfuture. Trends in Ecology and Evolution 12: 360-364.
PURVES, M.G., KRUUK, H. & NEL, J.A.J. 1994. Crabs Potamonautes
perlatus in the diet of the otter Aonyx capensis and watermongoose Atilax paludinosus in a freshwater habitat in SouthAfrica. Zeitschrift fur Saugetierkunde 59: 332-341.
ROSS, G.J.B. 1984. The smaller cetaceans of the south east coastof southern Africa. Annals of the Cape Province Museum
(Natural History) 15: 173-410.ROWE-ROWE, D.T. 1977a. Variation in the predatory behaviour of
Stellenbosch University http://scholar.sun.ac.za

146
the clawless otter. Lammergeyer 23: 22-27.ROWE-ROWE, D.T. 1977b. Food ecology of otters in Natal, South
Africa. Oikos 28: 210-219.ROWE-ROWE, D.T. 1977c. Prey capture and feeding behaviour of
South African otters. Lammergeyer 23: 13-21.ROWE-ROWE, D.T. 1978. The small carnivores of Natal. Lammergeyer
25: 1-48.ROWE-ROWE, D.T. 1992. Survey of South African otters in
freshwater habitat, using sign. South African Journal of
Wildlife Research 22: 49-55.ROWE-ROWE, D.T. & SOMERS, M.J. 1998. Diet, foraging behaviour and
coexistence of African otters and the water mongoose.Symposia of the Zoological Society of London No. 71: 215-227.
SCHULZE, B.R. 1965. Climate of South Africa, Part 8, General
Survey. Weather Bureau, Pretoria.SKELTON, P.H. 1993. The complete guide to the freshwater fishes
of Southern Africa. Southern Book Publishers, Halfway House.SMALE, M.J., WATSON, G. & HECHT, T. 1995. Otolith atlas of
southern African marine fishes. Ichthyological Monographs ofthe J.L.B. Smith Institute of Ichthyology, No.1: 253 pp.
SMITH, M.M. & HEEMSTRA, P.C. 1986. Smiths' sea fishes. Macmillan,Johannesburg.
SOMERS, M.J. 2000. Foraging behaviour of Cape clawless otters(Aonyx capensis) in a marine habitat. Journal of Zoology,
London 252: 473-480.SOMERS, M.J. & PURVES, M.G. 1996. Trophic overlap between three
syntopic semi-aquatic carnivores: Cape clawless otter,spotted-necked otter, and water mongoose. African Journal of
Ecology 34: 158-166.SOMERS, M.J. & NEL. J.A.J. 1998. Dominance and population
structure of freshwater crabs (Potamonautes perlatus MilneEdwards). South African Journal of Zoology 33: 31-36.
SPARGO, P.E. 1991. False Bay, South Africa - an historic andscientific overview. Transactions of the Royal Society of
South Africa 47: 363-375.STEPHENS, D.W. & KREBS, J.R. 1986. Foraging Theory. Princeton
Stellenbosch University http://scholar.sun.ac.za

147
University Press, Princeton.VAN DER ZEE, D. 1981. Prey of the Cape clawless otter (Aonyx
capensis) in the Tsitsikama National Park, South Africa.Journal of Zoology, London 194: 467-483.
VAN NIEKERK, C.H., SOMERS, M.J. & NEL, J.A.J. 1998. Freshwateravailability and distribution of Cape clawless otter spraintsand resting places along the south-west coast of SouthAfrica. South African Journal of Wildlife Research 28: 68-72.
VAN ZYL, R.F., MAYFIELD, S., PULFRISH, A. & GRIFFITHS, C.L. 1998.Predation by West coast rock lobster (Jasus lalandii) on twospecies of winkle (Oxystele sinensis and Turbo cidaris) .
South African Journal of Zoology 33: 203-209.VERWOERD, D.J. 1987. Observations on the food and status of the
Cape clawless otter Aonyx capensis at Betty's Bay, SouthAfrica. South African Journal of Zoology 22: 33-39.
Stellenbosch University http://scholar.sun.ac.za

148
CHAPTER 6*
FORAGING BEHAVIOUR OF CAPE CLAWLESS OTTERS (AONYX
CAPENSIS) IN A MARINE HABITAT
INTRODUCTION
Differences in diving behaviour of aquatic mammals can vary owingto differences in prey type (Rowe-Rowe 1977a; Kvitek et al.
1993), prey availability (Kvitek et al. 1993), diving depth(Kvitek et al. 1993; Nolet et al. 1993), hunting tactics,locality (Ostfeld 1991), water turbidity (Rowe-Rowe 1977a) andage of the predator (Watt 1993).
Our understanding of otter diving behaviour comes mainly fromstudies on Eurasian otters Lutra lutra (e.g. Kruuk et al. 1990;
Nolet et al. 1993; Watt 1993), and sea otters Enhydra lutris
(e.g. Kvitek & Oliver 1988; Kvitek et al. 1993; Ralls et al.
1995). Partly because of the difficulties in watching otters,both at sea and in freshwater systems, most research on Capeclawless otters Aonyx capensis has been centred on feedingbehaviour (reviewed in Rowe-Rowe & Somers 1998) and large scalemovements (Arden-Clarke 1983, 1986). Although Rowe-Rowe (1977a)gave 16 dive times of A. capensis in freshwater, and Arden-Clarke(1983) and Verwoerd (1987) gave 26 and 12 dive times respectivelyof A. capensis in the sea, little is known of diving behaviour ofthis species.
*Published as: SOMERS, M.J. 2000. Foraging behaviour of Cape
clawless otters (Aonyx capensis) in a marine habitat. Journal of
ZoologYr London 252: 473-480.
Stellenbosch University http://scholar.sun.ac.za

149
Observations on foraging and habitat use by A. capens~s
may be useful first for conservation management, to determine howthe species copes with the decrease in the quality of aquaticecosystems in South Africa (see Branch & Branch 1981; Davies &Day 1998). Second it would be interesting to compare theirbehaviour with those of other species of marine diving mammals.Furthermore, observations on diving behaviour have been shown tobe useful in the assessment of efficiency of exploitation of foodresources in different environments for L. lutra (Kruuk et al.
1990; Kruuk & Moorhouse 1990; Watt 1993) and platypusOrnithorhynchus anatinus (Kruuk 1993) .
Optimality models have three main components: the currency,the constraints, and the decision variable (Krebs & Kacelnik1991). In the case of diving organisms, the currencies couldinclude maximising the rate of energy intake, maximising the rateof oxygen intake, minimising the risk of predation, or acombination of these. Constraints and variables could be: traveltime (duration of time taken to get to the bottom), bottom orsearch time (duration of time searching on the bottom),unsuccessful dive time (travel and bottom time of an unsuccessfuldive), successful dive time (travel and bottom time of asuccessful dive), recovery time (duration of time after surfacingfrom an unsuccessful dive to the start of the next dive),processing time (duration of time after surfacing from ansuccessful dive to the start of the next dive), hunting success(HS: % of dives yielding prey), % time at surface, time precedingeach catch, success or failure (capturing or not capturing prey)and whether to eat or reject a small prey.
Owing to loss of energy in the water (Kruuk et al. 1997) itwould be expected that otters would always maximise the net rateof energy gain. Optimal foraging theory states that foragingstrategies may involve decisions that maximise the net rate offood intake or of some other measure of foraging efficiency(Emlen 1966; MacArthur & Pianka 1966; Krebs & Kacelnik 1991) Anextension is the marginal value theorem (Charnov 1976), which(briefly) states that an animal foraging for food in patches
Stellenbosch University http://scholar.sun.ac.za

150
spends much of its time travelling between patches, orsearching for and handling food within patches. As a foragerdepletes the available food within a patch over time, the benefitof staying in the patch decreases. In order to forage optimallyin a particular patch, the animal should therefore leave thepatch when the expected net gain from staying drops to thatexpected from travelling to and searching in a new patch.
The optimal breathing hypothesis (Kramer 1988), whichoriginates from the marginal value theorem, suggests that oxygenstores are replenished according to a curve of diminishingreturns. The hypothesis predicts that both surface and dive timewill increase with dives of greater depths, as will thepercentage time spent at the surface. Optimal breathingstrategies (Kramer 1988) are affected by such factors as bodysize, physiological abilities, feeding requirements, and whethera species is a single-prey or multi-prey loader (Kruuk 1993). Asotters hunt for prey under water but feed on the surface, theyare central place foragers as well as single prey loaders(Houston & McNamara 1985). Otters do not return to a fixedcentral place, for example a den, but do need to return to thesurface.
Aonyx capens~s weigh between 10 and 18 kg, with a mean of ca
13.0 kg and males being larger_then females (Skinner & Smithers1990). Aonyx capensis relies on sight for locating prey but alsofeels for prey that is hidden from view (Rowe-Rowe 1977b). Aonyx
capensis dives directly to the bottom (Rowe-Rowe 1977b) where itcaptures prey with its dextrous forefeet (Rowe-Rowe 1977b; Vander Zee 1979 1981; Verwoerd 1987). In captivity, factors such aswater temperature, depth, substratum, turbidity, and darkness donot greatly affect the ability of A. capensis to catch crabs andfrogs in freshwater, but do for fish (Rowe-Rowe 1977c).
Aonyx capensis uses freshwater habitats extensively (Rowe-Rowe & Somers 1998) but also uses marine habitats for food (Vander Zee 1981; Arden-Clarke 1983; Verwoerd 1987). However, theyappear to use marine habitats only in the presence of freshwater(van Niekerk et al. 1998). Crustaceans, including shore crabs
Stellenbosch University http://scholar.sun.ac.za

151
Cyclograpsus punctatus, Cape rock crabs Plagusia chabrus andCape rock lobsters Jasus lalandii, are their main prey, indecreasing order of importance, in marine habitats along thesouthern and southeastern coasts of South Africa. These aresupplemented with octopus (Octopus granulatus) and fishes (Vander Zee 1981; Arden-Clarke 1983; Verwoerd 1987). Freshwater crabsPotamonautes spp are their most common prey in freshwaterecosystems, with lesser amounts of frogs, fishes, aquaticinsects, birds, reptiles, molluscs, dung (ungulate) and mammalsbeing taken (Rowe-Rowe & Somers 1998).
This chapter provides the first detailed quantitative data onforaging by free swimming A. capensis in a marine habitat. Italso aims to contribute information on which a futureconservation management plan for the species could be based.Perry & Pianka (1997) suggested that optimal foraging studieswould contribute most by (1) providing a prediction of optimumpossible performance, and (2) an indication of potential avenuesfor further research. This chapter, therefore, (1) describesquantitative and qualitative aspects of foraging behaviour of A.
capensis in a marine ecosystem; (2) determines if depth has aneffect on diving behaviour and diet; (3) tests the optimalbreathing hypothesis (Kramer 1988); and (4) compares divingbehaviour of A. capensis with that of L. lutra in marinehabitats. I hypothesised that A. capensis maximise their divingsuccess rate and that they dive at depths where they get mostprey for least effort. I predicted that due to differences indiet, there would be differences between A. capensis and L. lutra
with regard to diving behaviour.
MATERIALS & METHODS
Data were collected from 26 April 1994 to 2 October 1996, along a2 km stretch of the south-west corner of False Bay, just Southeast of Rooi-Els (33° 19' S, 26° 05' E), Western Cape Province,South Africa.
Stellenbosch University http://scholar.sun.ac.za

152
The coast here is highly exposed, with broad surf zones.There are four small, perennial, freshwater streams (ca 0.5-2 mwide and ca 50-500 mm deep, depending on season) entering the seawithin this 2 km stretch. The substrate in the area from whichdata were collected consisted of boulders. A road, which runsparallel to the coast, at 3-5 m above and 15-20 m away from thehigh water mark, facilitates observations. The area was chosenbecause the otters, when hunting in the sea, are easily watchedwithout disturbance.
The mean sea temperature varies with season: summer, 21.5°C;spring, 18.2°C; autumn, 17.1°C; and winter, 13.2°C. Winter seatemperature is significantly lower than that of the other seasons(Clark, Bennett, & Lamberth 1996). The climate type isMediterranean with cold, wet winters and hot, dry summers(Schulze 1965). The mean tidal range in False Bay is 1.48 m(Spargo 1991) and mean salinities range from ca 35.0-35.3~(Atkins 1970).
Observations using 10X40 binoculars were conducted on foot,during the day at low tide. As the age of individual L. lutra
affects diving behaviour (Watt 1993), diving data from only adultA. capensis were used to avoid a possible similar situation withA. capensis affecting results. As it was usually impossible toidentify individuals, repeated sightings of individual otters mayhave been included. Although the number of individuals observedcould not be determined there appeared to be a high turnover ofindividuals over the 29 months study period. The longest onerecognisable individual was observed in the area was threemonths. As distinguishing between individuals which are huntingtogether proved to be very difficult, and as they may be co-operating under water (Arden-Clarke 1983), only data fromsolitary otters were used to compare diving parameters atdifferent depths. Group sizes were recorded for all sightings. Ilocated otters by walking transects along the 2 km shoreline inboth directions (i.e. 4 km) (n = 106), and scanning the sea andshore for otters. Focal otters were followed for as long aspossible.
Stellenbosch University http://scholar.sun.ac.za

153
The success or failure of dives was recorded. Duration o~dives, recovery times and processing times were measured bystopwatch from tape recordings. Diving depths were allocated tothe following depth categories: 0.0-0.5, 0.5-1.5, 1.5-2.5 and2.5-3.5 m. This was possible after diving in the area andmeasuring the depth at 5 m intervals perpendicular to the shore.Depths were also estimated during calm spring tides. A map wasproduced showing approximate depths of the area for laterestimation. It was, however, normally possible to estimate depthwithout the map. The area covered by particular depth categorieswas determined from the map. The percentage of dives at a givendepth was correlated with the available area of that depthcategory (within 40 m of the shore).
The per cent time at the surface and time foraging beforeeach catch were calculated at various depths. A hunt was regardedas the interval that elapsed between the time an otter was firstseen foraging to when it was last seen foraging. The beginningand end of hunts were not always seen. When possible, thebehaviour of otters was also recorded when they exited the sea.
Prey items that the otters were seen to catch were identifiedto the lowest taxonomic category possible. Occasionally, preycould not be identified while being handled and eaten. Preylength was estimated relative to otter head width (ca 150 mm foradults). Small prey were regarded as those < 50 mm, medium 50-100mm and large> 100 mm (after Kvitek et al. 1993 for E. lutris)
Quantitative data were collected from diving otters only.Occasionally, when the otters were foraging while walking inshallow water, they were difficult to observe without disturbing.
Qualitative data of foraging behaviour were recorded, andpresented in a descriptive form.
Statistical tests used are mentioned at appropriate points inthe text, the level of significance being P = 0.05. Statisticaltests were done by hand using Siegel (1956), or by computer usingthe programme SigmaStat for Windows 95 version 2.0, JandelCorporation©.
Stellenbosch University http://scholar.sun.ac.za

154
RESULTS
Two forms of hunting or foraging mode were recognised. In thefirst, the otters would dive and surface with or without prey.Diving from the surface, or looping, is done by dorsal bending ofthe body, lifting the back and tail out of the water. Just afterleaving the surface, there was paddling followed by dorsoventralflexion of the body and tail. Dives occurred either at the placethe otter surfaced, or after the otter swam on the surface for afew metres. The most common foraging pattern appeared to be'swim-fishing' (Kruuk 1995) which is when the otters swim on thesurface, then dive and emerge some distance ahead, stilltravelling in the same direction. Swimming on the surface waseither by paddling or by lateral undulations of the body andtail. The details of how the limbs were used could not be clearlydetermined. After unsuccessful dives otters would sometimes'porpoise' in and out of the water. Occasionally they wouldsimply submerge their heads and loop underwater. Theyoccasionally dived vertically down, but usually at a slightangle, estimated to be ca 60°.
The second type of hunting involved the otters moving intoshallow water (ca 0.2 m deep), and walking along the substratefeeling for prey with their feet, disturbing possible prey items,which were then caught with the forefeet. They occasionallysubmerged their heads, presumably looking for food.
After a successful dive the otters ate their prey while inthe water, either in an upright position or lying on their back.The prey items were held with the forefeet, sometimes submerged.When a wave approached, the otter would briefly submerge its headuntil the wave passed. When large prey items of ca 150 mm or morewere caught, an otter would head directly to the shore with theprey in its mouth, land, and then eat the prey. On 21 occasionsthe landing behaviour was clearly observed. The otter approachedthe shore, appearing vigilant by occasionally lifting its headand looking around. The otter would then wait for a wave surge to
Stellenbosch University http://scholar.sun.ac.za

155
lift it onto the shore, which consisted of boulders in thepresent study area. The otter usually lay down on a boulderwithin ca 2 m of the water while eating its prey. On oneoccasion, when the wind was very strong, an otter took shelterbetween boulders. On 43% of the landings they had a prey itemwith them. They defaecated on 57% of landings. Fifty seven percent of landings were at freshwater streams, while for another38% they moved up into a freshwater stream and were not seenagain.
Otters were seen on 30.2% (n = 32) of the 106 transects alongthe 2 km of coast of the study area. Two groups were seen duringsix transects giving a total of 38 groups sighted. Sixty eightper cent of groups sighted foraging consisted of solitary otters(Fig. 6.1).
Aonyx capensis tended to move along the coast while feeding(mean = 21.4 m per min, n = 5, S.E. = 4.83, range = 8.3-34.1).The furthest off shore an otter was estimated hunting was 40 m,which was usually within the surf zone.
The mean duration of hunts of all groups observed, includingsolitary animals, was 75.3 min (n = 38, S.E. = 5.9, range = 5-181min) .
The durations of two hunts where the start and end wereobserved were 66 and 181 min. In total 848 dives of solitary,foraging adults were observed (Table 6.1).
The mean dive time for all complete dives recorded was 21.0 s(n 848, S.E. = 0.3, range = 1.0-48.0). Mean successful divetime was 21.0 s (n = 64, S.E. = 1.5, range = 5.4-48) whileunsuccessful dives also lasted a mean of 21.0 s (n = 774, S.E.0.3, range = 1.0-46.0). Unsuccessful dive times were notsignificantly longer then successful dive times at depths of 0.0-0.5 m (Mann-Whitney U = 184, d.f. = 101, P = 0.843); 0.5-1.5 m(Mann-Whitney U 1882, d.f. = 293, P = 0.803) and 2.5-3.5 m(Mann-Whitney U 428; d.f. = 105, P = 0.671) but were for depthsbetween 1.5-2.5 m (Mann-Whitney U = 7029, d.f. = 335, P = 0.015).
Stellenbosch University http://scholar.sun.ac.za
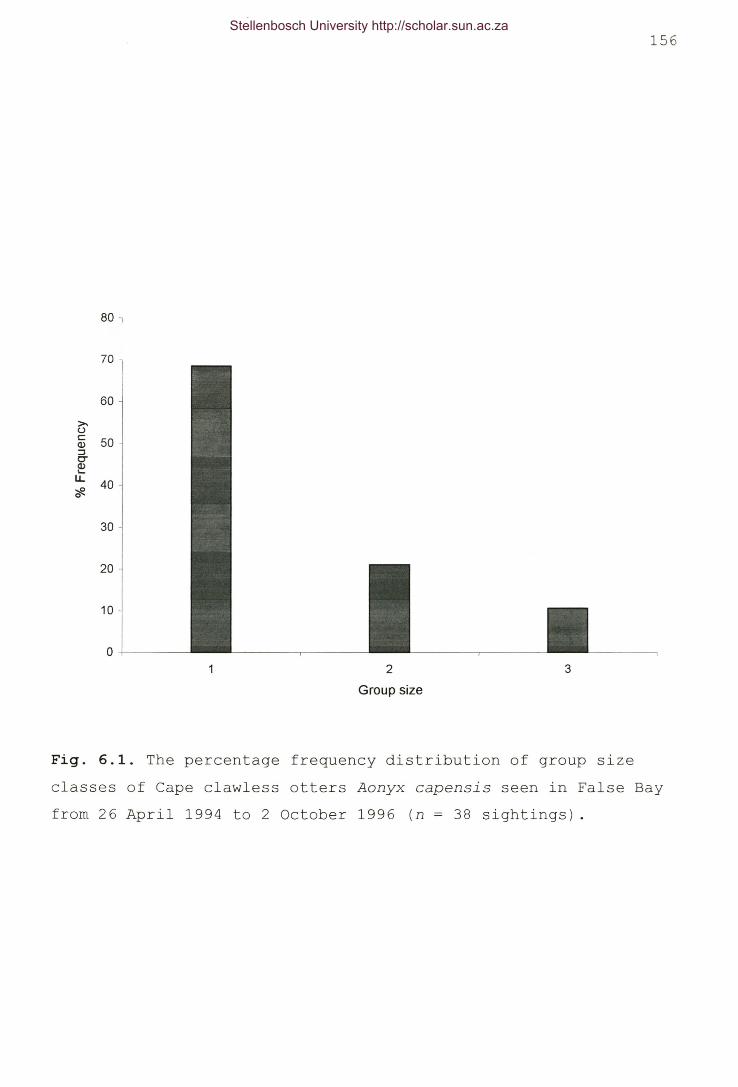
156
80 l
70
60:>.oc 50Q):::Jcr~LL 40~0
30
20
10
02 3
Group size
Fig. 6.1. The percentage frequency distribution of group sizeclasses of Cape clawless otters Aonyx capensis seen in False Bayfrom 26 April 1994 to 2 October 1996 (n = 38 sightings).
Stellenbosch University http://scholar.sun.ac.za

157
Table 6.1. Diving behaviour of Cape clawless otters Aonyx capensis at various depths: n = number ofdives; UDT = unsuccessful dive time; SDT = successful dive time; PT = processing time; RTrecovery time.
UDT ± SE PT ± SE RT ± SEDepth
(m)
SDT ± SEn
(s) (s) (s) (s)
0.0-0.5 102 9.9±0.5
0.5-1.5 298 19.3±0.4
1.5-2.5 344 22.8±0.5
2.5-3.5 104 31.5±0.8
10.0±1.4
22.3±3.5
19.4±1.7
31.5±3.9
10.6±2.3
58.2±12.1
153.1±40.4
43.5±12.0
0.0-3.5 848 21.0±0.3 21.0±1.5 109.6±24.5
3.6±0.3
7.3±0.3
8.5±0.3
11.3±0.7
7.8±0.2
Stellenbosch University http://scholar.sun.ac.za

158
Combining all depths there was not a significant differencebetween unsuccessful and successful dive times (Mann-Whitney U =26133, d.f. = 837, P 0.464) (Table 6.1). Mean recovery time was7.8 s (n = 764, S.E. 0.2, range = 1.0-40.0) and mean processingtime was 109.6 s (n = 82, S.E. = 24.5).
As expected, recovery time increased with the precedingunsuccessful dive time for all depths combined (r2 = 0.24, P <0.001) .
Recovery time, however, did not increase with the precedingunsuccessful dive time at 0.0-0.5 m (r2 = 0.05, P 0.216) butdid for 0.5-1.5 (r2 = 0.10, P < 0.001), 1.5-2.5 (r2 = 0.16, P <
0.001) 2.5-3.5 m (r2 = 0.21, P < 0.001) (Fig. 6.2) Processingtime was longest after diving to 1.5-2.5 m depths (Table 6.1).
Otters dived more frequently in water of less then 1.5 m thanwould be expected on the basis of the area present (Fig. 6.3, X2
= 260, d.f. = 3, P < 0.001) (Table 6.2). As the furthest out anotter was estimated hunting was 40 m, 80 ha was available to theotters along this 2-krn stretch of coast.
Foraging efficiency at various depths are given in Table 6.3.HS was highest at a depth of between 1.5-2.5 m. Per cent time atthe surface was similar between depths (Table 6.3). Kruskal-Wallis one way analysis of variance on ranks indicated that therewere no significant differences in surface time before asuccessful dive (H = 4.50, d.f. = 3, P = 0.213) with variousdepths (Table 6.3).
Kruskal-Wallis one way analysis of variance on ranksindicated that there were significant differences in recoverytimes (H = 117.94, d.f. = 3, P < 0.001), processing times (H =9.61, d.f. = 3, P = 0.022), unsuccessful dive times (H = 263.03,d.f. 3, P < 0.001) and successful dive times (H = 11.34, df =
3, P 0.01) with various depths (Table 6.1).
Stellenbosch University http://scholar.sun.ac.za

159
,-_if)'-'if]
<IJ
'ES>-0o<IJ~ 30
(C) 25
20
15
10
0
~.; .
.:"'~
2520
10
(a) 18-116i
14
12
10
20(b)
15
10 15 20 25 30 3510 20 30 40 50
..... :.~0;':~(·:::··
50
.:::/c~~--::::~/'~~y;.' ...
(d) 40
30
20
10
10 20 30 40 50oo 10 20 30 40 50 60
Unsuccessful dive times (s)
Fig. 6.2. Relationship between recovery times and precedingunsuccessful dive times of Cape clawless otters Aonyx capensis inFalse Bay, South Africa. (a) 0.0-0.5 m, (b) 0.5-1.5 m, (c) 1.5-2.5 m, (d) 2.5-3.5 m.
Stellenbosch University http://scholar.sun.ac.za

160
Cl)ID>
1
4
roIDCu 3~-"0 2:::Ro
o ~----~----~----~----~------~----.---~0.0 0.5 1.0 1.5 2.0 2.5 3.0 3.5
Depth (m)
Fig. 6.3. The percentage of dives of Cape clawless otters Aonyx
capensis corrected for the percentage of the available area(within 40 m from the shore) at various depths. (The depthfigures are the medians of the depth ranges, 0.25 = 0.0-0.5 m, 1= 0.5-1.5 m, 2 = 1.5-2.5 m, 3 = 2.5-3.5 m).
Stellenbosch University http://scholar.sun.ac.za

161
Table 6.2. Area per depth-class within 40 m from the shore of Cape clawless otters Aonyx capensis,
and number of dives in each.
Depth Area Area No dives
(m) (ha) (% )
No dives
observed expected
0.0-1.5 16.0
(0-0.5) (l0.0)
(0.5-1.5) (6.0)
1.5-2.5 34.0
2.5-3.5 30.0
20.0
(12.5)
(7.5)
42.5
37.5
400
(l02)
(298)
344
104
170
(106)
(64)
360
318
Stellenbosch University http://scholar.sun.ac.za

162
Table 6.3. Foraging efficiency of Cape clawless otters Aonyx capens~s in various depths.
Depth
(m)
Hunting success
(% of dives
% time at surface Time foraging before
each catch
4.1
5.0
12.8
8.2
39.4
37.6
37.3
35.9
92.5 (n
221. 0 (n
71. 8 (n
280.5 (n
yielding prey) (s)
0.0-0.5
0.5-1.5
1.5-2.5
2.5-3.5
2 )
11)
16)
5)
Stellenbosch University http://scholar.sun.ac.za

163
Aonyx capensis were observed feeding mostly on fist(50.0%) followed by crabs (27.8%), J. lalandii (11.1%) andabalone Haliotis midae (5.6%) (Fig. 6.4). On two occasions crabswere identified as C. punctatus. It was not possible to identifythe species of fish caught.
Prey size varied significantly with depth where captured (X2
15.0, d.f. = 6, P = 0.005) (Table 6.4). The proportion of largeprey (> 100 mm) also increased with depth (Table 6.4).
DISCUSSION
Despite A. capensis being primarily a crab eater the generalswimming and diving behaviour are similar to primarily fisheating otter species. The foraging pattern of 'swim-fishing' isas described for L. lutra (Kruuk 1995). The undulatory swimmingmode described here is similar to that of L. canadensis (Fish1994) and the 'porpoiseing' has been previously described for L.
lutra (Conroy & Jenkins 1986).In the present study, the largest foraging group observed
consisted of three individuals, which is less than found byArden-Clarke (1983) who recorded three groups of four and onegroup of five (n = 76). The percentage of individuals (64.2%),twosomes (17.9%) and threesomes (11.9%) were similar to thosefound in the present study (i.e. 68.4, 21.1 & 10.5%respectively). These data suggest that marine A. capensis has asimilar group structure to L. lutra (Kruuk 1995) but furtherdata, especially age sex data, are needed to clarify this.As expected on the basis of differences in metabolic rates andlung volume (Kooyman 1989), Kruuk (1993) found that there is aclear relationship between log mean body weight and log mean divetime for a number of diving mammals.
Stellenbosch University http://scholar.sun.ac.za

-ë. 40>-ocQ)::l
~ 30u,
70
164
.0.5-1.5 m01.5-2.5 m02.5-3.5 m
Fig. 6.4. Frequency of occurrence of food items obtained by Capeclawless otters Aonyx capensis at different depths in False Bay,Western Cape Province, South Africa.
60
50
20
10
oCrab Fish Abalone UnidentifiedRock lobster
Prey type
Stellenbosch University http://scholar.sun.ac.za

165
Table 6.4. Frequency occurrence (%) of prey sizes, as determined by direct observations, ofCape clawless otters Aonyx capensis at various depths in False Bay, South Africa
Prey size 0.5-1.5 m 1.5-2.5 m 2.5-3.5 m
Small « 50 mm) 50.0 0.0 25.0
Medium (50-100 mm) 16.7 36.4 0.0
Large (> 100 mm) 33.3 54.5 75.0
Unidentified 0.0 9.1 0.0
n 12 22 8
Stellenbosch University http://scholar.sun.ac.za

166
The data in the multi-species comparison of Kruuk (1993) arebest expressed with the polynomial:
y 2.6 - 0.83x + 0.05x2 + 0.02x3 (r2 0.96)
which predicts a mean dive time for a 13.0 kg A. capensis tobe about 26.5 s, longer then that found in this study (21.0s) .Others have also found dive times of A. capensis to be lowerthan that expected. Arden-Clarke (1983) gave successful divetimes of solitary males as 19.8 s (n = 15) and unsuccessful divetimes as 23.6 s (n = 11). These are similar to those of thepresent study at 1.5-2.5 m depths. Verwoerd (1987) gave two meandive times for A. capensis of 4.75 s (n = 8, range = 3-13 s), and8.6 s (n 6, range = 8-16 sj, but did not give depths or successof these dives. Although not directly comparable with the marineenvironment, Rowe-Rowe (1977b) gave mean freshwater diving time(depth = 1.5 m) as 17.4 s (n = 6, range = 8-26), in KwaZulu-NatalProvince, South Africa.
Kruuk & Hewson (1978) recorded mean times of successful divesof L. lutra in a marine habitat to be 15.9 s, and 24.8 s forunsuccessful dives - a significant difference. Kruuk & Moorhouse(1990) recorded a mean recovery time of 3.7 s for depths of < 1m. Other mean diving times for L. lutra are 23.1 s (WestScotland; Kruuk & Hewson 1978), 20.1 s (Shetland, Conroy &Jenkins 1986), 23.3 s (Shetland; Nolet et al. 1993), and 22.7 s(Mull, West Scotland; Watt 1993).
As at most depths in the present study, Arden-Clarke (1983)found no significant differences between the duration ofunsuccessful and successful dives. One reason for this may bethat the otters continue searching for better prey until oxygenstores need to be replenished, even after catching a prey item. Asecond possibility could be that they have a constant giving uptime owing to a trade-off between saving energy, if the dive isnot successful in a given time, and keeping on diving in the hopeof eventually getting prey (but expending much energy ifunsuccessful). This could be related to food availability. A
Stellenbosch University http://scholar.sun.ac.za

167
third possibility is that during every dive the animalsinvestigate only one prey-hiding place, and come up regardless ofsuccess. The third possibility is unlikely as bubbles cansometimes be seen coming up over a few meters while the otterforages at the bottom. There is, however, no other evidence forany of these possibilities. This similarity in duration ofsuccessful and unsuccessful dives differs from L. lutra, wheresuccessful dive times are significantly shorter then unsuccessfuldive times (Kruuk & Hewson 1978).
Arden-Clarke (1983) recorded processing times of 42.5 s (n =
21) for unidentified prey, which is less than that of the presentstudy (153.1 s) for depths of 1.5-2.5 m, but closer to that found(10-58 s) at other depths. For three "relatively large" crabsArden-Clarke (1983) recorded processing time as 30, 32 & 180 s,while six large fish required processing times of 180-900 s (mean
555 s) .The hunting success recorded in the present study (4.1-12.8%;
Table 6.3) is in contrast to that recorded by Arden-Clarke (1983)who gave hunting success in Tsitsikama National Park as 62.3% (n
= 53). Rowe-Rowe (1977a) recorded hunting success in freshwaterto be 62.2% (n = 37). In freshwater systems A. capensis have beenshown to eat much smaller prey of 23.5-28.5 mm (mean carapacewidth of P. perlatus) (Purves et al. 1994; Somers & Purves 1996(Chapter 7)) than in the present study. Either the otters in thepresent study were selecting larger prey then along theTsitsikama coast, or there was only larger prey available. In anycase, the larger prey selected may have enabled A. capensis tohave a lower success rate and still meet their energy needs.
Hunting success rates in L. lutra vary between areas e.g.19.2% (West Scotland; Kruuk & Hewson 1978), 23.0% and 25.0%(Shetland; Kruuk et al. 1990) and 32.8% (Muil, West Scotland;Watt 1993). These success rates for L. lutra, although verydifferent, are rather closer to the 4.1-12.8% (Table 6.3) foundfor A. capensis in the present study than that found for A.
capensis by Arden-Clarke (1983).
Stellenbosch University http://scholar.sun.ac.za

168
Ostfeld (1991) suggested that hunting success is a usefulmeans of comparing forage strategies and habitat characteristicsin sea otters. As results appear to vary between habitats, thismay apply to A. capensis as well. Kruuk et al. (1990), however,caution that hunting success may merely measure the likelihoodthat a predator will initiate a hunt after observing a situationwith a potential for a capture (Kruuk 1972), and is therefore nota suitable unit of prey-capturing effort.
The question arises as to why A. capensis foraging in FalseBay have a much lower hunting success than in Tsitsikama NationalPark and in KwaZulu-Natal. Although not directly comparable,spraint analysis by Arden-Clarke (1983) and Rowe-Rowe (1977c) forthe same study area as Rowe-Rowe (1977a), gave crustaceans to bethe most important prey. The lower hunting success in False Baymay therefore be explained by the higher percentage of highenergy food (fish) eaten compared to Tsitsikama National Park andKwaZulu-Natal where a higher percentage of low energy food(crustaceans) are eaten. Aonyx capens~s therefore appear to beable to switch prey and change foraging behaviour to accommodateavailability of prey of various energy values. Prey switching hasbeen shown in E. lutris (Ostfeld 1982) which prefer food speciesof high energy intake/unit foraging time but replace depleteddietary items with those of the next highest rank. Poor huntingsuccess rates in E. lutris also drive them to hunt for differentprey species (Ostfeld 1982) .
As animals relatively seldom focus on feeding to theexclusion of other factors such as avoiding predators or findingmates (Perry & Pianka 1997) behaviour may not be optimal.Phylogenetic history may have 'won' over local behaviouraladaptations (Perry & Pianka 1997). Aonyx capensis, however, seemto be able to adapt their foraging behaviour to differenthabitats (i.e. they can vary hunting success in differenthabitats)
As A. capensis in the present study ate a lower percentage(50%) of energy-rich fish than marine L. lutra (50-100%
occurrence) (Kruuk & Moorhouse 1990; Clode & Macdonald 1995; Watt
Stellenbosch University http://scholar.sun.ac.za

169
1995), it would be expected to require a higher huntingsuccess to compensate. However, as L. lutra hunt in colder waterthan A. capensis, which is energetically highly costly (Kruuk etal. 1997), they may need a higher success rate to minimise timein the water.
Time taken for each catch could be used as a measure ofdiving efficiency. The results presented here showed nosignificant trend with depth.
A low per cent time at the surface indicates efficienthunting behaviour. Watt (1993) recorded a per cent time at thesurface for adult L. lutra of 29.8 - 43.5% increasing with depth.Nolet et al. (1993) gave per cent time at the surface to varybetween 32.2 and 70.9%. Aonyx capens~s in the present study has aper cent time at the surface, varying between 35.9-39.4% (Table6.3), with no trend with depth.
Although a very imprecise measure, the technique used todetermine prey size (i.e. comparing with head-width (ca 150 mm)of an adult otter) did provide some indication of the prey sizeseaten by the otters. These data also provide a comparison formore detailed faecal analyses (Somers, in prep). The data arealso sufficient to show the differences in prey type, relativequantities and sizes of prey. Although only a small sample sizewas obtained, the results show that composition of the diet inFalse Bay was similar to that found elsewhere along the SouthAfrican coast in marine habitats (Tayler 1970; Van der Zee 1981;Arden-Clarke 1983; Verwoerd 1987), except that o. granulatus wasnot observed as a prey item, but H. midae was. Remains of o.granulatus have, however, been found in the spraints of A.
capensis inhabiting the study area (Somers 2000) (Chapter 6)Fish were the most common prey, followed by crabs, although
the species of both could seldom be identified. Jasus lalandii
were not seen to be caught in shallow waters (0.0-1.5 m) anddeeper waters (2.5-3.5 ml, while H. midae were only seen to becaught in the deeper (2.5-3.5 m) waters. Aonyx capensis aregenerally regarded as crab specialists in freshwater habitats(Rowe-Rowe 1977c), having broadened bunodont molars for crushing
Stellenbosch University http://scholar.sun.ac.za

170
the exoskeletons of invertebrate prey (Rowe-Rowe 1977b). Theirmanual dexterity further enables them to feel for and captureprey under stones and in crevices (Rowe-Rowe 1977a), possiblyfacilitating capture of crabs, and probably J. lalandii as well.
The data presented above support Kramer's (1988) optimalbreathing hypothesis in that surface times as well as dive timesincrease with dives of greater depths. The percentage time at thesurface, however, does not increase with depth. Time taken foreach catch also does not decrease with depth as would beexpected.
The results indicate that, as predicted, significantdifferences existed in diving behaviour with various depths. Itis often assumed that divers switch to anaerobic respiration onreaching the aerobic dive limit (Carbone & Houston 1996). It isalso argued that the upturn commonly observed in the relationshipbetween recovery time and dive time may be associated with ashift to anaerobic respiration (Kramer 1988). This was notobserved with the otters in the present study, perhaps becausethey did not dive to depths of more than ca 4 m.
Optimum foraging theory predicts that A. capensis will forageat the depth that optimises food intake per unit effort, or ofsome other measure of foraging efficiency. Here I have shown thatthey are diving more at a depth shallower than where they arecatching the most prey, the largest prey and the most energy-richprey (i.e. fish). One possibility for deviations from thepredicted trends is that A. capensis are avoiding predators suchas great white sharks Carcharodon carcharias, an inshore speciesthat eats sea mammals such as seals and small dolphins (Smith &Heemstra 1986) and possibly otters. Selecting for a depth rangeof 0.5-1.5 m may be locally optimal, and could therefore bedifferent in other systems or areas.
The results (Fig. 6.4 and Table 6.4) show that when theotters dived at increasing depths their response was to vary preysize in a way which both qualitatively (increasing prey size withincreasing depth) and quantitatively is as predicted by themarginal value theorem. This assumes a gradual depletion of
Stellenbosch University http://scholar.sun.ac.za

171
resources (Krebs & Kacelnik 1991). If no depletion occurs, theexplanation of a load-distance (prey-size depth in the presentsituation) effect may lie in the energy cost or time cost oftransporting different sized loads (Krebs & Kacelnik 1991). Themarginal value theorem would therefore still explain the load-size distance relationship, but in a modified way (Krebs &Kacelnik 1991).
The data on diet at various depths (Fig. 6.4 and Table 6.4)suggests that the marginal value theorem provides a satisfactoryaccount of foraging by adult A. capensis. This, however, is onlythe beginning as the data show only the outcome of behaviour andnot the mechanisms by which the outcome was achieved (Krebs &Kacelnik 1991). The results do show that the assumptions aboutcurrency and constraints incorporated into the marginal valuetheorem are helpful in explaining the behaviour of otters (Krebs& Kacelnik 1991). A full analysis of the fitness consequenceswould be needed to separate out the consequences of allvariables. This could clearly not be done using the present data,but opens up ideas for future research.
In broad discussions on conservation of southern Africanaquatic ecosystems (Branch & Branch 1981; Davies & Day 1998),little or no mention is made of either A. capensis or the oftensympatric spotted-necked otter L. maculicollis. This is despitethem being top predators in aquatic systems. The results obtained(Fig. 6.4) also emphasise the importance of J. lalandii in thediets of these carnivores, indicating the need for more continuedstringent conservation measures for the conservation managementof J. lalandii. Jasus lalandii and H. midae are intensivelyexploited in the study area by recreational and commercialfisheries. It is also known that otters (Kvitek & Oliver 1992)and other mustelids (Klemola et al. 1997) can slow the populationgrowth of prey species. It is therefore highly recommended thatfor the conservation management of A. capensis, H. midae and J.
lalandii, further data be collected to determine the ecologicalinteractions between the three species. We need to bring together
Stellenbosch University http://scholar.sun.ac.za

172
decisions made by foraging otters and community and populationprocesses.
REFERENCESARDEN-CLARKE, C.H.G. 1983. Population density and social
organisation of the Cape clawless otter, Aonyx capensis
Schinz, in the Tsitsikama Coastal National Park. M.Sc.thesis, University of Pretoria, Pretoria, South Africa.
ARDEN-CLARKE, C.H.G. 1986. Population density, home range sizeand spatial organization of the Cape clawless otter, Aonyx
capensis, in a marine habitat. Journal of Zoology, London
209: 201-211.ATKINS, G.R. 1970. Thermal structure and salinity of False Bay.
Transactions of the Royal Society of South Africa 34: 11-128.BRANCH, G. & BRANCH, M. 1981. The living shores of southern
Africa. C. Struik, Cape Town.CARBONE, C. & HOUSTON, A.I. 1996. The optimal allocation of time
over the dive cycle: an approach based on aerobic andanaerobic respiration. Animal Behaviour 51: 1247-1255.
CHARNOV, E.L. 1976. Optimal foraging: the marginal value theorem.Theoretical Population Biology 9: 129-136.
CLARK, B.M., BENNETT, B.A. & LAMBERTH, S.J. 1996. Temporalvariations in surf zone fish assemblages from False Bay,South Africa. Marine Ecology Progress Series 131: 35-47.
CLODE, D. & MACDONALD. D.W. 1995. Evidence for food competitionbetween mink (Mustela vision) and otter (Lutra lutra) onScottish islands. Journal Zoology, London 237: 435-444.
CONROY, J.W.H. & JENKINS, D. 1986. Ecology of otters in northernScotland. VI. Diving times and hunting success of otters(Lutra lutra) at Dinnet, Aberdeenshire and in Yell Sound,Shetland. Journal of Zoology, London 209: 341-346.
DAVIES, B.R. & DAY, J.A. 1998. Vanishing waters. University ofCape Town Press, Cape Town.
Stellenbosch University http://scholar.sun.ac.za

173
EMLEN, J.M. 1966. The role of time and energy in foodpreference. American Naturalist 100: 611-617.
FISH, F.E. 1994. Association of propulsive swimming mode withbehavior in river otters (Lutra canadensis). Journal of
Mammalogy 75: 989-997.HOUSTON, A.I. & MCNAMARA. J.M. 1985. A general theory of central
place foraging for single-prey loaders. Theoretical
Population Biology 28: 233-262.KLEMOLA, T., KOIVULA, M., KORPIMÁKI, E. & KAINORRDAHL, K. 1997.
Small mustelid predation slows population growth of Microtus
voles: a predator reduction experiment. Journal of Animal
Ecology 66: 607-614.KOOYMAN, G.L. 1989. Diverse divers. Springer Verlag, Berlin.KRAMER, D.L. 1988. The behavioral ecology of air breathing by
aquatic animals. Canadian Journal of Zoology 66: 89-94.KREBS, J.R. & KACELNIK, A. 1991. Decision making. In: Behavioural
ecology an evolutionary approach, (eds) J.R. Krebs, & N.B.Davies, 3rd edn, Blackwell Scientific Publications, Oxford.
KRUUK, H. 1972. The spotted hyena. University of Chicago Press,Chicago.
KRUUK, H. 1993. The diving behaviour of the platypus(Ornithorhynchus anatinus) in waters with different trophicstatus. Journal of Applied Ecology 30: 592-598.
KRUUK, H. 1995. Wild otters: predation and populations. OxfordUniversity Press, Oxford.
KRUUK, H. & HEWSON, R. 1978. Spacing and foraging of otters(Lutra lutra) in a marine habitat. Journal of Zoology, London
185: 205-212.KRUUK, H. & MOORHOUSE, A. 1990. Seasonal and spatial differences
in food selection by otters (Lutra lutra) in Shetland.Journal of Zoology, London 221: 621-637.
KRUUK, H., TAYLOR, P.T. & MOM, G.A.T. 1997. Body temperature andforaging behaviour of the Eurasian otter (Lutra lutra), inrelation to water temperature. Journal of Zoology, London
241: 689-697.
Stellenbosch University http://scholar.sun.ac.za
174
KRUUK, H., WANSINK, D. & MOORHOUSE, A. 1990. Feeding patchesand diving success of otters, Lutra lutra, in Shetland. Oikos
57: 68-72.KVITEK, R.G. & OLIVER, J.S. 1988. Sea otter foraging habits and
effects on prey populations and communities in soft-bottomenvironments. In: The community ecology of sea otters, (eds)G.R. VanBlaricom & J.A. Estes, Springer-Verlag, Berlin.
KVITEK, R.G. & OLIVER, J.S. 1992. Influence of sea otters onsoft-bottom prey communities in southeast Alaska. Marine
Ecology Progress Series 82: 103-113.KVITEK, R.G., BOWLBY, C.E. & STAEDLER, M. 1993. Diet and foraging
behavior of sea otters in Southeast Alaska. Marine Mammal
Science 9: 168-181.MACARTHUR, R.H. & PIANKA, E.R. 1966. On optimal use of a patchy
environment. American Naturalist 100: 603-609.NOLET, B.A., WANSINK, D.E.H. & KRUUK, H. 1993. Diving of otters
(Lutra lutra) in a marine habitat: use of depths by a single-prey loader. Journal of Animal Ecology 62: 22-32.
OSTFELD, R.S. 1991. Measuring diving success of otters. Oikos 60:
258-260.PERRY, G. & PIANKA, E.R. 1997. Animal foraging: past, present and
future. Trends in Ecology and Evolution 12: 360-364.PURVES, M.G., KRUUK, H. & NEL, J.A.J. 1994. Crabs Potamonautes
perlatus in the diet of the otter Aonyx capensis and watermongoose Atilax paludinosus in a freshwater habitat in SouthAfrica. Zeitschrift fur Saugetierkunde 59: 332-341.
RALLS, K., HATFIELD, B.B. & SINIFF, D.B. 1995. Foraging patternsof California sea otters as indicated by telemetry. Canadian
Journal of Zoology 73: 523-531.ROWE-ROWE, D.T. 1977a. Variation in the predatory behaviour of
the clawless otter. Lammergeyer 23: 22-27.ROWE-ROWE, D.T. 1977b. Prey capture and feeding behaviour of
South African otters. Lammergeyer 23: 13-21.ROWE-ROWE, D.T. 1977c. Food ecology of otters in Natal, South
Africa. Oikos 28: 210-219.
Stellenbosch University http://scholar.sun.ac.za

175
ROWE-ROWE, D.T. & SOMERS, M.J. 1998. Diet, foraging behaviourand coexistence of African otters and the water mongoose.Symposia of the Zoological Society of London No. 71: 215-227.
SCHULZE, B.R. 1965. Climate of South Africa, Part 8, General
Survey. Weather Bureau, Pretoria.SIEGEL, S. 1956. Nonparametric Statistics for the behavioural
sciences. McGraw-Hill, New York.SKINNER, J.D. & SMITHERS, R.H.N. 1990. The mammals of the
Southern African subregion. University of Pretoria, Pretoria.SMITH, M.M. & HEEMSTRA, P.C. 1986. Smiths' sea fishes. Macmillan,
Johannesburg.SOMERS, M.J. 2000. Seasonal variation in the diet of Cape
clawless otters (Aonyx capensis) in a marine habitat. African
Zoology 35: 261-268.SOMERS, M.J. & PURVES, M.G. 1996. Trophic overlap between three
syntopic semi-aquatic carnivores: Cape clawless otter,spotted-necked otter, and water mongoose. African Journal of
Ecology 34: 158-166.SPARGO, P.E. 1991. False Bay, South Africa - an historic and
scientific overview. Transactions of the Royal Society of
South Africa 47: 363-375.TAYLER, C. 1970. The elusive otter. The Eastern Cape Naturalist
39: 20-23.VAN DER ZEE, D. 1979. Food and status of the Cape clawless otter
Aonyx capensis Schinz, in the Tsitsikama Coastal NationalPark, South Africa. M.Sc. thesis, University of Pretoria,Pretoria, South Africa.
VAN DER ZEE, D. 1981. Prey of the Cape clawless otter (Aonyx
capensis) in the Tsitsikama National Park, South Africa.Journal of Zoology, London 194: 467-483.
VAN NIEKERK, C.H., SOMERS, M.J. & NEL, J.A.J. 1998. Freshwateravailability and distribution of Cape clawless otter spraintsand resting places along the south-west coast of SouthAfrica. South African Journal of Wildlife Research 28: 68-72.
Stellenbosch University http://scholar.sun.ac.za

176
VERWOERD, D.J. 1987. Observations on the food and status ofthe Cape clawless otter Aonyx capensis at Betty's Bay, SouthAfrica. South African Journal of Zoology 22: 33-39.
WATT, J.P. 1993. Ontogeny of hunting behaviour of otters (Lutra
lutra L.) in a marine environment. Symposia of the Zoological
Society of London No. 65: 87-104.WATT, J. 1995. Seasonal and area-related variations in the diet
of otters Lutra lutra on Mull. Journal of Zoology, London
237: 179-194.
Stellenbosch University http://scholar.sun.ac.za

177
CHAPTER 7*
TROPHIC OVERLAP BETWEEN THREE SYNTOPIC SEMI-AQUATIC
CARNIVORES: CAPE CLAWLESS OTTER (AONYX CAPENSIS),
SPOTTED-NECKED OTTER (LUTRA MACULICOLLIS), AND WATER
MONGOOSE (ATILAX PALUDINOSUS).
INTRODUCTION
Cape clawless otters Aonyx capensis (Schinz), spotted-neckedotters Lutra maculicollis (Lichtenstein), and water mongoosesAtilax paludinosus (Cuvier) , coexist throughout much of theirgeographic ranges (Rowe-Rowe 1991), feed on many of the samefoods, (Rowe-Rowe 1977a; Skinner & Smithers 1990) and use similarhabitats (Skinner & Smithers 1990). Interspecific competition cantherefore occur, but the extent and nature of this is largelyunknown. Rowe-Rowe (1977a) compared the diet of the threecarnivores where they coexist in KwaZulu-Natal, South Africa, butno other comparative data on factors affecting their coexistenceare available.
Both A. capensis and A. paludinosus are widely distributed insouthern Africa (Skinner & Smithers 1990), but the geographicalrange of L. maculicollis appears to be shrinking (Stuart 1985;Nel & Somers unpublished data). Applicable ecological informationis therefore essential for successful conservation measures.During a drought between 1990 and 1993 a large part of the
*Published as: SOMERS, M.J. & PURVES, M.G. 1996. Trophic overlap
between three syntopic semi-aquatic carnivores: Cape clawless
otter, spotted-necked otter, and water mongoose. African Journal
of Ecology 34: 158-166.
Stellenbosch University http://scholar.sun.ac.za

178
Bushmans River system dried up and suitable habita~,especially for the two otter species, was much reduced. Thisforced the three carnivores to coexist in restricted areas. Itallowed observation and quantification of the way in which theyshared food resources under conditions of enforced competition.
I report here on the food of A. capensis, L. maculicollis andA. paludinosus in the Bushmans River, Eastern Cape Province,South Africa, as indicated by the composition of their scats.This study quantifies sizes of crabs Potamonautes perlatus (MilneEdwards) eaten by the three carnivores, using length of eyestalksfound in the faeces (Purves et al. 1994). The sizes of the fishTilapia sparrmanii (Smith) eaten is also quantified, using thediameter of eye-lenses in the faeces (Kruuk & Goudswaard 1990) .
Ecological background of the three species
Aonyx capensis weigh between 10 and 16 kg, with males beinglarger than females. Prey of A. capensis have been documented inmarine habitats by Van der Zee (1981); Arden-Clarke (1983) andVerwoerd (1987). Crustaceans have been shown to be the mostcommon prey of A. capensis freshwater ecosystems, supplementedwith lesser amounts of frogs, fishes, and aquatic insects(Turnbull-Kemp 1960; Rowe-Rowe 1977a; Kruuk & Goudswaard 1990;Butler & du Toit 1994; Ligthart et al. 1994; Purves et al. 1994)
Birds, reptiles, molluscs, dung (ungulate) and mammals are allminor items, seldom eaten. In freshwater habitats A. capensis areactive mainly during late afternoon, early evening, and earlymorning (Rowe-Rowe 1978; unpublished radio-tracking data). Inmarine habitats they are mainly nocturnal (Arden-Clarke 1983).
Lutra maculicollis have a total length of less than 1 mandweight of about 4.5 kg for males and 3.5 kg for females (Skinner& Smithers 1990). No published data are available on L.
maculicollis prey in the Eastern Cape Province. Presentinformation indicates cichlid fish (Haplochromis spp.) to be themost common prey of L. maculicollis in Lake Muhazi, Rwanda(Lejeune 1990) and in Lake Victoria, Tanzania (Procter 1963;
Stellenbosch University http://scholar.sun.ac.za

179
Kruuk & Goudswaard 1990), while in KwaZulu-Natal, Soutt~frica, crabs (Potamonautes spp.) and fish appear to be the mostcommon prey (Rowe-Rowe 1977a). Birds, frogs, insects, andmolluscs are also taken (Rowe-Rowe 1977a; Kruuk & Goudswaard1990; Lejeune 1990). Although not based on radio telemetry, L.
maculicollis are reported to be mainly diurnal (Procter 1963;Kruuk & Goudswaard 1990), with activity peaking in the morningand late afternoon (Rowe-Rowe 1978). Lutra maculicollis do notoccur in marine habitats (Skinner & Smithers 1990).
Male and female A. paludinosus have mean lengths of 878 and848 mm respectively, and the mean weight for both sexes is 3.4 kg(Skinner & Smithers 1990). Crabs appear to be the most commonprey of A. paludinosus in most areas with mammals, birds,reptiles, fish, frogs, molluscs, insects, diplopods, isopods, andfruit also being taken (Rowe-Rowe 1977a; Smithers & Wilson 1979;du Toit 1980; Whitfield & Blaber 1980; Louw & Nel 1986; Baker1989; Purves et al. 1994). Atilax paludinosus are nocturnal(Maddock & Perrin 1993), and hunt mainly along the edges of water(Rowe-Rowe 1978) but may fully immerse themselves when catchingfood (Baker 1989).
MATERIALS & METHODS
Scats were collected during September, October, and November1993, along a 3-km stretch of the Bushrnans River running throughand south of Alicedale (33° 19' S, 26° 05' E), Eastern CapeProvince, South Africa. The average width of the river was ca 8m. Depth varied between 20 mm (riffles and reed beds) and 1.5 m(pools). Water level rose by about 0.5 m during rain in October.The vegetation is classified as subtropical transitional thicket.Structurally the plant communities are dominated by evergreensclerophyllous shrubs and succulents (Cowling 1984). Annualrainfall for the area is ca 450 mm (Kopke 1988).
Sixty-six A. capensis, 79 L. maculicollis, and 31 A.
paludinosus scats were collected. Identification of otter scats
Stellenbosch University http://scholar.sun.ac.za
180
in the field was based on their characteristic odour. Thespecies origin was based on locality of deposition and size(Rowe-Rowe 1992) and the presence of otter tracks. Identificationof A. paludinosus scats was based on locality and characteristicbanded hairs in them. When the species origin was not clear thescats were not collected.
The scats were air-dried, teased apart and prey remainsidentified using a stereomicroscope (X 10 - 100 magnification)Prey items were sorted into the following categories: mammal,bird, reptile, frog, fish, crab, insect, unidentified material,and non-food such as soil and leaves. The presence of mammalremains in the scats was determined from hair and bones, crabsand insects from carapaces, fish from bones and scales, reptilesand frogs from bones, and birds from feathers.
The presence of each prey category in each scat was scored.Scores for each category were added and expressed as a percentageof the total number of scores of all categories, yieldingrelative percentage frequency. This method has been shown toclosely approximate the proportions of different items actuallyconsumed by otters (Erlinge 1968; Rowe-Rowe 1977a).
For each scat the dominant prey type was also determined byvolumetric analysis of prey items. For that analysis, in a scatconsisting mainly of crab remains, crab would be the dominantprey type and the other prey items in the scat would be ignored.The different dominant prey items were then added up andexpressed as percentage of the total number of scats (Kruuk etal. 1994; Purves et al. 1994).
Crabs (n = 33, mean carapace width = 22.3 mm, S.D. = 8.1 mm,range = 8.6-49.7 mm) were collected from reed beds in the riverby searching under stones and in grass. Crabs (n = 10, meancarapace width = 50.5 mm, S.D. = 12.3 mm, range = 29.9-69.1 mm)were also caught in pools in funnel traps baited with dead fish.The maximum carapace widths of these crabs were measured withcalipers and eyestalk lengths were measured with an ocular rulerin a stereomicroscope. A regression was calculated for carapace
Stellenbosch University http://scholar.sun.ac.za

181
width and eyestalk lengths (Purves et al. 1994). There was 2
~inear relationship for whichC = -11.94+7.90*E, where C = carapace width (mm) and E = eyestalklength (mm). The correlation was significant (r = 0.996, n = 50,S.E. = 6.09%). Lengths of eyestalks in the scats of all threespecies were measured. The equation was then used to determinesize of crabs taken by the three predators.
Fish were caught in funnel traps to determine speciespresent. I identified river goby Glossogobius callidus (Smith),goldie barb Barbus pallidus (Greenwood), and banded tilapia T.sparrmanii. Other fish species known to occur at the study siteare moggel Labeo umbratus (Smith) and largemouth bass Micropterus
salmoides (Lacepéde) (P. Skelton pers. comm. 1993). Scales wereremoved from each fish species and mounted on slides.
Scales from Labeo umbratus were provided by the J.L.B. SmithInstitute of Ichthyology, Grahamstown and Micropterus salmoides
from reference material of the Department of Zoology, Universityof Stellenbosch. Fish scales found in the scats of the threecarnivores were compared with the mounted specimens.
The only fish species found in the scats was T. sparrmanii. Aregression using eye-lens diameter and fish fork length wascalculated, as has been done for cichlids in Lake Victoria (Kruuk& Goudswaard 1990). The eye-lenses were air dried with the scatsbefore they were measured. There was a linear relationship forwhich F = 11.75+43.84*E, where F = fish fork length (mm) and Eeye-lens diameter (mm). The correlation was significant (r =
0.988, n = 87, S.E. = 3.51%). Eye-lenses from the scats were thenmeasured and the size of fishes preyed upon by the threepredators was determined.
Stellenbosch University http://scholar.sun.ac.za

182
RESULTS
Faecal analysis
The relative percentage occurrence and dominant category of preyitems recorded in scats of A. capensis, L. maculicollis and A.
paludinosus are shown in Tables 7.1-7.3. Crab remains were of P.
perlatus, the only freshwater crab in the Bushmans River (Barnard1950). Fish remains in all scats were from T. sparrmanii, insectremains represented Coleoptera and Odonata, while mammals andfrogs were unidentified.
Size of crabs and fish
The crabs which A. paludinosus and L. maculicollis ate wereof similar sizes (Mann-Whitney U test, P = 0.082, two-tailed forthis and all subsequent Mann-Whitney U tests) (Table 7.4), butsignificantly larger than the crabs eaten by A. capensis (Mann-Whitney U test, P < 0.001, for both tests) (Table 7.4). The sizedistribution of crabs eaten by the three carnivores differed withA. capensis taking a wider range than the other two species(Tab1e 7.5) .
The fish which A. paludinosus and A. capens~s ate were ofsimilar size (Mann-Whitney Utest, P= 0.056) (Table 7.6), andboth ate significantly smaller fish than did L. maculicollis
(Mann-Whitney U test, P = 0.048); (Mann-Whitney U test, P <
o . 001 ) (Tab1e 7.6) .
DISCUSSION
Although it is not clear how many individuals of each specieswere present, frequent sightings of A. capensis and abundanttracks of L. maculicollis and A. paludinosus indicated that therewere many individuals of all three carnivores. These data werecollected over a short period from a small sample of scats.
Stellenbosch University http://scholar.sun.ac.za

183
Table 7.1. Prey items recorded in 66 Aonyx capensis scats collected from the Bushmans River fromSeptember to November 1993, as percentage occurrence, relative frequency occurrence, and percentageof scats dominated by a prey.
Observed s Freq. Rel. s Freq.0 0
Crab 66 100 50.8
Insect (total) 25 37.9 19.2Odonata 14 21.2 10.8Coleoptera 2 3.0 1.5
Fish 23 36.4 17.7
Frog 12 18.2 9.2
Spider 2 3.0 1.5
Unidentified 2 3.0 1.5
Non-food 9 13.6(soil leaves)
% Dominance
95.5
4.6
Stellenbosch University http://scholar.sun.ac.za

184
Table 7.2. Prey items recorded in 79 Lutra maculicollis scats collected from the Bushmans Riverfrom September to November 1993, as percentage occurrence, relative frequency occurrence, andpercentage of scats dominated by a prey.
Observed 2- Freq. Rel. 2- Freq. 2- Dominance0 0 0
Fish 64 81.0 46.7 53.2
Crab 52 65.8 38.0 44.3
Frog 11 13.9 8.0 2.5
Unidentified 4 5.6 2.9
Insect (total) 3 3.8 2.2Odonata 1 1.3 0.7
Bird 2 2.5 1.5
Mammal 1 1.3 0.7
Non-food 1 1.3(soil leaves)
Stellenbosch University http://scholar.sun.ac.za
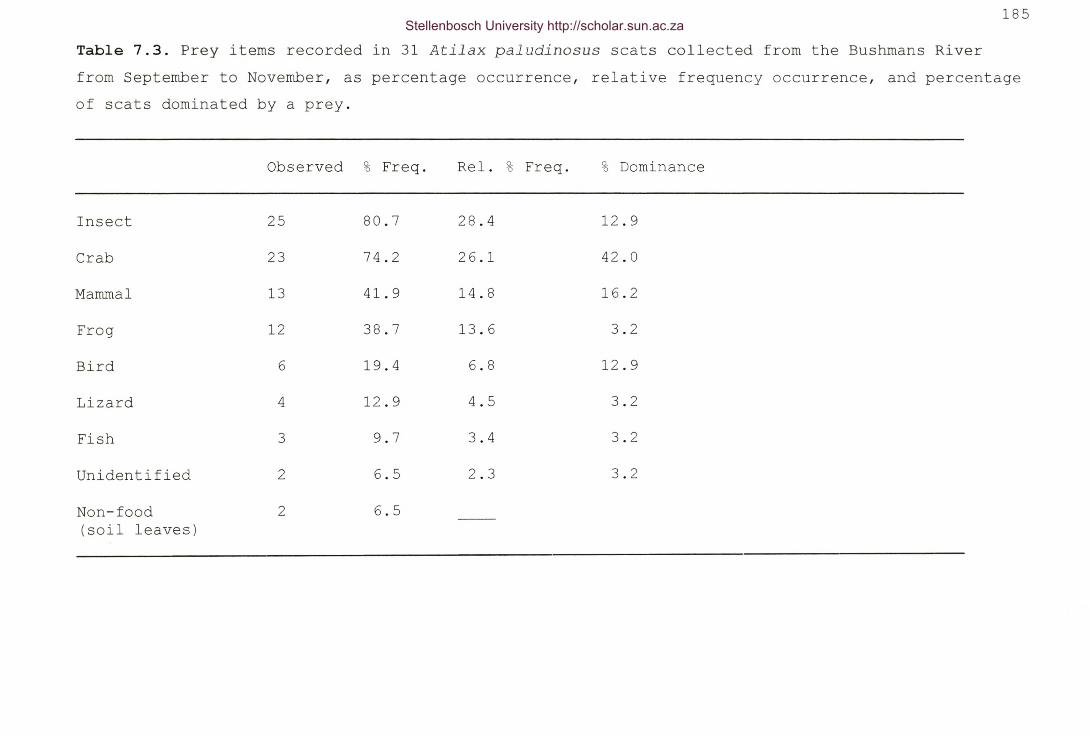
185
Table 7.3. Prey items recorded in 31 Atilax paludinosus scats collected from the Bushmans Riverfrom September to November, as percentage occurrence, relative frequency occurrence, and percentageof scats dominated by a prey.
Observed % Freq. Rel. % Freq. % Dominance
Insect 25 80.7 28.4 12.9
Crab 23 74.2 26.1 42.0
Mammal 13 41.9 14.8 16.2
Frog 12 38.7 13.6 3.2
Bird 6 19.4 6.8 12.9
Lizard 4 12.9 4.5 3.2
Fish 3 9.7 3.4 3.2
Unidentified 2 6.5 2.3 3.2
Non-food 2 6.5(soil leaves)
Stellenbosch University http://scholar.sun.ac.za

186
Table 7.4. The size of crabs eaten by Aonyx capens~s, Lutra maculicollis and Atilax paludinosus
in the Bushmans River.
Aonyx Lutra Atilax
nMean (mm)S.D.Range
136523.510.03.1-65.5
9127.38.68.6-44.2
6425.06.610.2-41.0
Stellenbosch University http://scholar.sun.ac.za
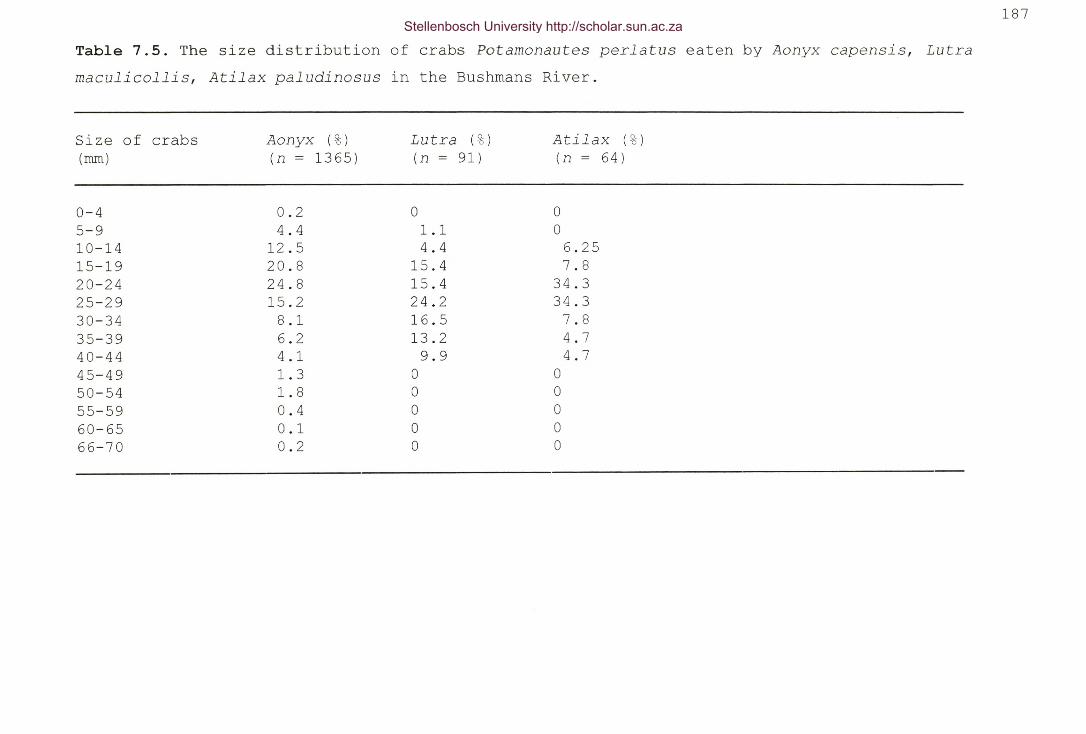
187
Table 7.5. The size distribution of crabs Potamonautes perlatus eaten by Aonyx capensis, Lutra
maculicollis, Atilax paludinosus in the Bushmans River.
Size of crabs(mm)
Aonyx (%)(n = 1365)
Lutra (%)(n = 91)
Atilax (%)(n = 64)
0-4 0.2 0 05-9 4.4 1.1 010-14 12.5 4.4 6.2515-19 20.8 15.4 7.820-24 24.8 15.4 34.325-29 15.2 24.2 34.330-34 8.1 16.5 7.835-39 6.2 13.2 4.740-44 4.1 9.9 4.745-49 1.3 0 050-54 1.8 0 055-59 0.4 0 060-65 0.1 0 066-70 0.2 0 0
Stellenbosch University http://scholar.sun.ac.za

188
Table 7.6. The size of fish eaten by Aonyx capensis, Lutra maculicollis and Atilax paludinosus
in the Bushmans River.
Aonyx Lutra Atilax
n 60
20.5
4.0
12.8-30.5
Mean (mm)
S.D.
range
205
28.0
7.2
9.6-52.9
8
24.7
5.7
20.9-38.5
Stellenbosch University http://scholar.sun.ac.za

189
They are, however, sufficient to show the degree of overlap inprey types between the three carnivores, and the differences inrelative quantities and sizes of prey, especially for crabs andfish.
The results show that even during enforced cohabitation in arelatively small range during drought conditions there isseparation of diets in these three carnivores. The differences inprey species selection are similar to those reported by Rowe-Rowe(1977a) for the three species where they coexist in rivers inKwaZulu-Natal, suggesting little or no resource shift in responseto drought conditions.
Crabs were the main prey of A. capens~s and A. paludinosus,
whereas L. maculicollis took fish and crabs in similarproportions. Atilax paludinosus, however, used a wider range ofterrestrial prey than did the two otter species.
The hunting behaviour of the predators may have influencedthe selection of prey. Both otter species actively dive in searchof prey (Rowe-Rowe 1977b), while A. paludinosus occupy a widerrange of habitats and only immerse their heads once prey havebeen sighted (Rowe-Rowe 1978; Baker 1989), usually in shallowwater. The more frequent occurrence of aquatic prey in the dietof the two otter species suggests that their foraging is mostlyrestricted to the river, whereas A. paludinosus were the onlypredators taking terrestrial prey in significant proportions.
Another factor that would further aid dietary segregation,although only over a short period, is that the carnivoresutilized different sizes of prey. Although the differencesbetween the means were not very great, the crabs eaten by L.
maculicollis and A. paludinosus were significantly larger thanthose taken by A. capensis. Aonyx capensis ate a wide range ofcrab sizes, including specimens much larger than those taken bythe other two carnivores. This could be related to differences infeeding behaviour of the predators, as well as to differences inforaging behaviour of the crabs (Hill & O'Keeffe 1992). Therelationship between the predators and the size of crabs theyprey upon, is therefore complex. Local differences such as the
Stellenbosch University http://scholar.sun.ac.za

190
depth of the river, substratum type, availability ofalternative prey, seasonal floods, or the density of thepredators, probably all interact to determine which section ofthe crab population is available to a specific predator speciesat a specific time. In the Olifants River, Western Cape Province,A. capensis ate smaller crabs than A. paludinosus (Purves et al.
1994) .Aonyx capens~s are generally regarded as crab specialists in
freshwater habitats (Rowe-Rowe 1977a), having broadened bunodontmolars for crushing the exoskeletons of invertebrate prey. Theirmanual dexterity further enables them to feel for and captureprey under stones and in crevices (Rowe-Rowe 1977a), possiblyfacilitating capture of all sizes of crabs. In contrast, L.
maculicollis are not as well adapted for the capture andconsumption of crabs and even avoid larger crabs (> 50 mm) whenavailable (Rowe-Rowe 1977b). In Lakes Victoria and Muhazi, wherefish are particularly abundant, L. maculicollis are virtuallyentirely piscivorous (Kruuk & Goudswaard 1990; Lejeune 1990),whereas in KwaZulu-Natal, where fish faunas are impoverished,Rowe-Rowe (1977a) found that they ate almost equal amounts ofcrab and fish. Larger crabs would be more visible than smallerspecimens, especially in a river with a high turbidity, such asthe Bushmans River during this study. The size distribution ofcrabs eaten by the three predators, also suggests that there isno obvious selection for energetically more rewarding large crabsabove smaller specimens (Table 7.5).
Lutra maculicollis preyed on fish more often and ate largerfish than did the other two predators, reflecting theirpiscivorous adaptations. Aonyx capensis and A. paludinosus tooksimilar sized fish, although this was not a major prey type of A.
paludinosus. All the fish eaten were T. sparrmanii, which wasalso the species eaten most often (81 %) by A. capensis in theOlifants River, Western Cape (Purves et al. 1994). Similar to therivers in KwaZulu-Natal, the fish fauna of the Bushmans River maynot be rich enough to sustain L. maculicollis, and crabs,therefore, form an important complimentary part of their diet.
Stellenbosch University http://scholar.sun.ac.za

191
Tilapia sparrmanii are exotic to the Olifants and BushmansRivers (Skelton 1993), indicating a possible improvement in theavailability of food for otters, in these areas, as a result ofhuman interference.
The results show the importance of crabs in the diets ofthese three carnivores, emphasizing, for the conservationmanagement of otters and A. paludinosus, the need for moreinformation about factors limiting crab numbers.
REFERENCESARDEN-CLARKE, C.H.G. 1983. Population density and social
organization of the Cape clawless otter, Aonyx capensis
Schinz, in the Tsitsikama Coastal National Park. M.Sc.thesis, University of Pretoria, Pretoria, South Africa.
BAKER, C.M. 1989. Feeding habits of the water mongoose (Atilax
paludinosus). Zeitschrift fur Saugetierkunde 54: 31-39.BARNARD, K.H. 1950. Descriptive catalogue of South African
Decapod Crustacea (crabs and shrimps). Annals of the South
African Museum 38: 179-194.BUTLER, J.R.A. 1994. Cape clawless otter conservation and a trout
river in Zimbabwe: a case study. Oryx 28: 276-282.TURNBULL-KEMP, P.ST.J. 1960. Quantitative estimations of
populations of river crab, Potamon (Potamonautes) perlatus
(M. Edw.), in Rhodesian trout streams. Nature, London 185:
481.BUTLER, J.R.A. & DU TOIT, J.T. 1994. Diet and conservation of
Cape clawless otters in eastern Zimbabwe. South African
Journal of Wildlife Research 24: 41-47.COWLING, R.M. 1984. A syntaxonomic and synecological study in the
Humansdorp region of the fynbos biome. Bothalia 15: 175-227.DU TOIT, C.F. 1980. The yellow mongoose Cynictis penicillata and
other small carnivores in the Mountain Zebra National Park.Koedoe 23: 179-184.
Stellenbosch University http://scholar.sun.ac.za

192
ERLINGE, S .. 1968. Food studies on captive otters Lutra lutre
L .. Oikos 19: 259-270.HILL, M.P. & O'KEEFFE, J.H. 1992. Some aspects of the ecology of
the freshwater crab (Potamonautes perlatus Milne Edwards) inthe upper reaches of the Buffalo River, eastern CapeProvince, South Africa. South African Journal of Aquatic
Sciences 18: 42-50.KOPKE, D. 1988. The climate of the eastern Cape. In: Towards an
environmental plan for the eastern Cape, (eds) M.N. Bruton &F.W. Gess, Rhodes University, Grahamstown.
KRUUK, H. & GOUDSWAARD, P.C. 1990. Effects of changes in fishpopulations in Lake Victoria on the food of otters (Lutra
maculicollis Schinz and Aonyx capensis Lichtenstein). African
Journal of Ecology 28: 322-329.KRUUK, H., KANCHANASAKA, B., O'SULLIVAN, S. & WANGHONGSA, S.
1994. Niche separation in three sympatric otters Lutra
perspicillata, L. lutra and Aonyx c~nerea in Huai Kha Khaeng,Thailand. Biological Conservation 69: 115-120.
LEJEUNE, A. 1990. Ecologie alimentaire de la loutre (Hydrictis
maculicollis) au lac Muhazi. Mammalia 54: 33-45.LIGTHART, M.F., NEL, J.A.J. & AVENANT, N.L. 1994. Diet of Cape
clawless otters in part of the Breede River system. South
African Journal of Wildlife Research 24: 38-39.LOUW, C.J. & NEL, J.A.J. 1986. Diets of coastal and inland-
dwelling water mongoose. South African Journal of Wildlife
Research 16: 153-156.MADDOCK, A.H. & PERRIN, M.R. 1993. Spatial and temporal ecology
of an assemblage of viverrids in Natal, South Africa. Journal
of Zoology, London 229: 227-287.PROCTER, J. 1963. A contribution to the natural history of the
spotted-necked otter (Lutra maculicollis Lichtenstein) inTanganyika. East African Wildlife Journal 1: 93-102.
PURVES, M.G., KRUUK, H. & NEL, J.A.J. 1994. Crabs Potamonautes
perlatus in the diet of the otter Aonyx capensis and watermongoose Atilax paludinosus in a freshwater habitat in SouthAfrica. Zeitschrift fur Saugetierkunde 59: 332-341.
Stellenbosch University http://scholar.sun.ac.za

193
ROWE-ROWE, D.T .. 1977a. Food ecology of otters in Natal, SouthAfrica. Oikos 28: 210-219.
ROWE-ROWE, D.T. 1977b Prey capture and feeding behaviour of SouthAfrican otters. Lammergeyer 23: 13-21.
ROWE-ROWE, D.T. 1978. The small carnivores of Natal. Lammergeyer
25: 1-48.ROWE-ROWE. D.T. 1991. Status of otters in Africa. Habitat 6: 15-
20.ROWE-ROWE, D.T. 1992. Survey of South African otters in
freshwater habitat, using sign. South African Journal of
Wildlife Research 22: 49-55.SKELTON, P.H. 1993. A complete guide to the freshwater fishes of
southern Africa. Southern Book Publishers, Halfway House.SKINNER, J.D. & SMITHERS, R.H.N. 1990. The mammals of the
southern African subregion. University of Pretoria, Pretoria.SMITHERS, R.H.N. & WILSON, V.J. 1979. Check list and atlas of the
mammals of Zimbabwe Rhodesia. Museum Memoirs of the National
Museums and Monuments of Rhodesia 9: 1-147.STUART, C.T. 1985. The status of two endangered carnivores
occurring in the Cape province, South Africa, Felis serval
and Lutra maculicollis. Biological Conservation 32: 375-382.TURNBULL-KEMP, P.st J. 1960. Quantitative estimations of
populations of river crab, Potamon (Potamonautes) perlatus
(M. Edw.), in Rhodesian trout streams. Nature, London 185:
481.VAN DER ZEE, D. 1981 Prey of the Cape clawless otter (Aonyx
capensis) in the Tsitsikama National Park. South Africa.Journql of Zoology, London 194: 467-483.
VERWOERD, D.J. 1987. Observations on the food and status of theCape clawless otter Aonyx capensis at Betty's Bay, SouthAfrica. South African Journal of Zoology 22: 33-39.
WHITFIELD, A.K. & BLABER, S.J.M. 1980. The diet of Atilax
paludinosus (water mongoose) at st Lucia, South Africa.Mammalia 44: 315-318.
Stellenbosch University http://scholar.sun.ac.za

194
CHAPTER 8
CONCLUSION AND CONSERVATION MANAGEMENT
CONSIDERATIONS
Of the 13 species of otter worldwide most if not all are to agreater or lesser extent, or in part of their distributionalrange, subject to habitat changes brought about by man. Most havetheir main distribution in freshwater ecosystems and with theburgeoning human population and increased use of finitefreshwater resources pressure on most species can only increase.In addition, apart from a few species, e.g. European otter Lutra
lutra, the North American river otter Lutra canadensis and thesea otter Enhydra lutris, knowledge of the ecology and behaviour,and conservation status of most species is limited. The Capeclawless otter Aonyx capensis is widespread in sub-Saharan Africaand inhabit both freshwater and marine ecosystems, but apart froma few studies in southern Africa are largely unknown. As a toppredator in freshwater ecosystems it was initially thought to bea good indicator species but as will be shown below arewidespread and can tolerate altered habitats and humandisturbance, so it probably cannot fulfil this role.
The rationale and aims for the present study was to expandour knowledge on some aspects of the ecology and behaviour of A.
capensis, and especially to obtain data on habitat use, andrelation between prey availability and prey eaten (aspects notpreviously addressed in a quantitative fashion) of A. capensis Inthe southwestern Western Cape Province. In addition, data on thesame aspects in a marine habitat were also obtained; the ottersenjoy a wide distribution along the southern and easternseaboards of South Africa, and marine habitats can thereforepossibly function as an important stronghold for the species.
This study therefore tested several hypotheses regardingvarious aspects of habitat use by A. capensisr in various
Stellenbosch University http://scholar.sun.ac.za

195
habitats. The hypotheses, namely that A. capensis do not selectany prey types, prey sizes or habitat type were tested. Habitattypes used were investigated at a scale that enabled separatingthe effects of types of riparian vegetation, geomorphology andanthropogenic influences. Aspects of the resource dispersionhypothesis and optimal foraging theory were also tested. This wasdone in both the marine and freshwater environments.
Prey availability (as apposed to density) is notoriouslydifficult to quantify. For otters, as for other carnivores, thisentails sampling prey at the times and in the habitats, whereforaging takes place. Activity of A. capensis were deduced fromradio-tracking data, as were habitats most often used. Freshwatercrabs have been shown in all previous as well as the present studyto be the main prey species. On account of the habitats frequentedby otters, sampling of crabs by hand was not always possible, andother methods, e.g. - by trapping them in traps, had to be used.Results from the two rivers indicated that hand sampling was moreaccurate, as traps were selective for size; small crabs wereexcluded.
While crabs were the most important prey in all seasons fishwas the second most important in both the rivers, and during allseasons. The percentage occurrence of prey of A. capensis in bothrivers showed an increase in the amount of crab in summer and acorresponding decrease in the number of fish eaten. The seasonalfluctuation in crabs and fish found in the spraints (faeces),corresponded with the expected frequencies as determined fromtrapping. The results obtained are also consistent with those ofprevious studies (see Rowe-Rowe & Somers 1998 for review), butfor those of Rowe-Rowe (1977a) and Purves & Sachse (1998), wherefrogs were found to be the second most common prey type. Thesetwo studies were, however, done at middle to high altitudes(1060-1650 m.a.s.l.) where fish faunas are poor (Rowe-Rowe &Somers 1998). The importance of different secondary prey found inthe various studies is probably related to local preyavailability (Rowe-Rowe & Somers 1998).
Stellenbosch University http://scholar.sun.ac.za

196
Optimal foraging theory can be used to account for thetypes and sizes of prey items taken by predators (Krebs &Kacelnik 1991). One possible hypothesis to explain why severaltypes of prey are eaten, apart from the main prey (for which A.
capensis is anatomically (long vibrissae, prehensile toes) andbehaviourally (foraging mode, degree of sociality, habitatchoice) adapted) is that the times taken to search for the mostprofitable prey type influences choice. If it takes a long timeto find and catch a more profitable prey item (such as a fish),an otter might be able to obtain a higher overall rate of energyintake per unit time by eating something less profitable, e.g.crabs. The same may apply to sizes of prey eaten. The size ofcrabs in the present and in other studies, were relatively smallcompared to what was available. Otters may find small crabs more"profitable" because these are more easily located, caught, andeaten than larger crabs (i.e. a higher encounter rate, and lowerhandling time) and this is what they are adapted to catching.
Butler & du Toit (1994) speculated that the low densities ofA. capensis in Zimbabwe is probably a reflection of the lownumbers of crabs in certain water bodies. If this holds trueelsewhere a rapidly decreasing quality and quantity of fresh waterin Africa (Davies & Day 1998) indicates that the fate of manyaquatic biological communities is uncertain. More detailed long-term data are therefore needed to determine the relationshipsbetween A. capensis and their main and secondary prey.
Home range useWhat lS a home range, and what is it used for? The classical
definition of Burt (1943) still holds good: that a home range isthat area about an animal's established home which is traversed byan animal in its normal activities of food-gathering, mating, andcaring for young. This study has found that total home rangelength of the seven radio-tracked otters varied from 4.9 to 54.1km and core home range length from 0.2 to 9.8 km. Total surfacearea of water used ranged from 4.9 to 1062.5 ha, and the core areaused from 1.1 to 138.9 ha.
Stellenbosch University http://scholar.sun.ac.za

197
As home range used by some of the otters were large,conservation areas for otters would need to be extremely large,even including whole river systems.
The spatial organization found i.e. home ranges of malesoverlap, possibly forming male group ranges, while those of malesoverlap those of several females, with the females being possiblyterritorial, is common in mustelids (Powell 1979). If, as thisstudy suggests, females have exclusive home ranges, they areprobably density dependent. Habitat loss, i.e. less availablefood and shelter, will therefore directly affect total otterpopulation size. The results presented here suggest thatsubmerged macrophytes are important habitat types for otters,because it is here that their main food source (crabs) islocated. With increasing silting up of rivers (Davies & Day1998), such habitat types are at risk through increased flooding(Colloty et al. 2000).
Activity and effects of distanceExcept for the otters moving through Stellenbosch, human
activity did not appear to affect otter movements. This, andevidence from studies on other species such as L. lutra (e.g.Durbin 1993), suggests that "disturbance" per se should not beafforded high priority in conservation programmes, unless thisaffects habitat structure or pollution levels.
The otters studied were typically active from dawn for 2.6 h,and moved a mean of 0.9 km. They were also typically active fromsunset for a mean of 2.3 h, moving a mean of 1.3 km. They werefound to select for areas with boulders and/or reed beds, areaswith widely dispersed reed beds will have otters ranging overgreater distances. As pointed out above, reed beds are where preydensity (and probably availability) is highest, and where otterswere found to spend most of their time foraging. Boulder substrateis also a habitat rich in crabs (as apposed to e.g. a sandysubstrate) so habitat "selection" reflects prey densities morethan anything else.
Stellenbosch University http://scholar.sun.ac.za

198
Aonyx capensis cause losses to trout farms and domesticfowl and are therefore caught and either relocated or killed. Theresults obtained showed that there will probably be other ottersin the area and the problem will not be solved by killing ortranslocations.
Otters in the seaOf the three species of sub-Saharan otters (A. capens~s,
Congo clawless otter Aonyx congica, spotted-necked otter Lutra
maculicollis) A. capensis is the only one thus far documented asusing the marine seaboard, in South Africa as well as in Guinea-Bissau (Bijago archipelago). Considering the extent, and oftenpristine condition of stretches of the coast, the marine habitatis an important one for A. capensis.
The most common prey species during all seasons was Cape rockcrab Plagusia chabrus. Diversity of prey was lowest in winter,increasing from spring through to autumn, probably because preywere more easily caught in the cold water, enabling the otters tobe more selective with regards prey types eaten. Foragingbehaviour data obtained support the optimal breathing hypothesis,which predicts that both surface and dive times should increasefor dives of greater depths. However, diving efficiency did notdecrease with increasing depth, nor did percentage time at thesurface increase with increasing depth.
For A. capensis in the sea a combination of directobservation and spraint analysis would give a more completedescription of diet. For example, in the present study soft preysuch as abalone were not represented in the spraints, yetobservations indicated that they were eaten. On the other hand,crab and fish species data were not available from directobservations, but were from spraint analyses. The generalseasonal shift in diet composition, from fish being moreimportant in autumn and winter to crustaceans being moreimportant in summer and spring suggests a mechanism akin to thatoperating in freshwater: changes in the mortality of the prey. Asthe water gets warmer fish are less easily caught.
Stellenbosch University http://scholar.sun.ac.za

199
By foraging in both marine and freshwater habitats Aonyx
capensis demonstrates an ability to successfully exploitdifferent types of aquatic environments while also being capableof exploiting different kinds of prey in each. Because of thisability otters can be regarded as opportunist predators, able toexploit a wide variety of habitats. This augurs well for their
, --continued existence in a variety of habitats. They, however, doexhibit a degree of anatomical specialisation, being primarilyadapted to feed on crustaceans, but are able to make use of othersuitable prey, such as slow-moving fishes.
The results on diet emphasised, for the conservationmanagement of otters, the need for more information about factorslimiting prey populations. In the sea this is the commerciallyexploited (Branch & Branch 1981) and ecologically important (vanZyl et al. 1998 and references therein) Cape rock lobster Jasus
lalandii. The role of otters in the sea is also at presentpractically unknown and poorly understood, and deserves furtherstudy. It is also not possible, with the limited data available,to assess the impact of A. capensis on prey populations in themarine environment. Detailed data on the prey populations need tobe gathered, but such data are, however, difficult to collect inthe rough surf zones of False Bay and other areas of southernAfrica's coast.
Competition with sympatric species in the same feeding guildHow A. capensis use freshwater habitats in the presence of
potential competitors, e.g. L. maculicollis and water mongoosesAtilax paludinosus, was highlighted by investigating theirtrophic overlap during enforced cohabitation in a relativelysmall range during drought conditions. As the three speciesexploit the same class of environmental resources in a similarway they could be called a "guild" (Root 1967). This would haveimportant influences on the way they utilise resources. Thoughthe species' diets overlap, competition forces each member of theguild to adopt a distinct food niche. The analysis of trophicoverlap showed that even during enforced cohabitation in a
Stellenbosch University http://scholar.sun.ac.za

200
relatively small range during drought conditions, there wasseparation of diets of A. capensis, L. maculicollis and A.
paludinosus. This predicted that coexistence of similar speciesis only possible if intraspecific competition is greater theninterspecific competition (Lotka 1925; MacArthur & Levins 1967)Since many species do compete with each other and still manage tocoexist (Creel & Creel 1996), another explanation is necessary(Durant 1998). Models show that resource partitioning (MacArthur& Levins 1967), fluctuating environments (Chesson & Huntly 1989)and spatial heterogeneity (Hanski 1994; Durant 1998) can promotecoexistence (Schoener 1974). Aonyx capensis, L. maculicollis andA. paludinosus may therefore be able to coexist as a result ofresource partitioning, primarily as far as prey resources andsizes are concerned.
The hunting behaviour of the three coexisting predators mayalso influence the selection of prey. Both otter species activelydive in search of prey (Rowe-Rowe 1977b), while A. paludinosus
also use terrestrial habitats to a much larger extent and onlyimmerse their heads once prey have been si~1ted (Rowe-Rowe 1978;Baker 1989), usually in shallow water. The more frequentoccurrence of aquatic prey in the diet of the two otter speciestherefore suggests that their foraging is mostly restricted tothe river, whereas A. paludinosus also take terrestrial prey insignificant proportions.
Another factor that would further aid dietary segregation,although only over a short period, is the utilization ofdifferent sizes of prey. Although the differences between themeans were not very great, the crabs eaten by L. maculicollis andA. paludinosus were significantly larger than those taken by A.
capensis. Aonyx capensis ate a wide range of crab sizes,including specimens much larger than those taken by the other twocarnivores. This could be related to differences in feedingbehaviour of the predators, as well as to differences in foragingbehaviour of the crabs (Hill & O'Keeffe 1992). The relationshipbetween the three syrnpatric predators and the sizes of crabs theyprey upon, is therefore complex. Local differences such as the
Stellenbosch University http://scholar.sun.ac.za

201
depth of the river, substratum type, availability of~lternative prey, seasonal floods, or the density of thepredators, probably all interact to determine which section ofthe crab population is available to a specific predator speciesat a specific time.
Conservation management considerationConservation management practices can be divided into
protecting species in their natural habitat, breeding them incaptivity, and reintroducing them back into the wild. Each ofthese different spheres of intervention relies on behavioural andecological information (Caro 1998). The present study providedmuch ecological and behavioural data necessary when planningconservation management of A. capensis. The environment is dynamicwhich dictates that different management strategies will have tobe applied at different times. No specific instructions as to themanagement of otters in the rivers can, therefore, be given.Rather the implications of the results of this study should beused wisely with the specific conditions id mind.
In South Africa, and elsewhere in Africa, freshwater habitatsare under serious and increasing threat (Davies & Day 1998). InSouth Africa, e.g., at best, with the slowest estimatedpopulation growth and the smallest demand for water, fresh watersupplies will no longer be able to meet demand some time between2020 (use of all surface water) and 2040 (use of surface andground water). At worst, with the highest population growth andwater demand, supplies will be fully committed some time between2003 and 2015 (Davies & Day 1998). As almost all of the waterused in South Africa comes from rivers (Davies & Day 1998), thepotential impact on A. capensis habitat is of immediate and greatconcern. For example, water extraction would mean lowering ofwater levels and therefore a decreased food supply. Elsewhere inAfrica and the world, rapidly expanding human populations andaccelerated water extraction for industry and agriculture, yieldsan equally dismal scenario (see Tilman et al. 2001).
Stellenbosch University http://scholar.sun.ac.za

202
In broad discussions on conservation of southern Africanaquatic ecosystems (Branch & Branch 1981; Davies & Day 1998),little or no mention is made of otters. This happens despite thembeing top predators and therefore subject to the accumulativeaffects of organisms lower in the food chain. Besides being at ornear the top of the food chain, otters possess characteristicsthat should make them good biological indicators. They rely bothon aquatic and terrestrial habitats, which exposes them todisturbance of either or both habitats (double jeopardy), andthey feed on a variety of prey and have been shown to besensitive to pollution and habitat destruction (Mason & Macdonald1986). However, it is difficult to estimate otter densities, theonly accurate methods probably being the use of radio trackingcombined with radionuclide recovery (Knaus et al. 1983; Kruuk etal. (1993), or through extensive microsatellite genotyping offaeces collected throughout an area (Kohn & Wayne 1997). Second,because fresh water crabs tolerate eutrophic areas so do A.
capensis. Therefore, although seemingly in possession of manycharacteristics expected for acting a biol~ical indicatorsotters fail in this respect. But this does not negate the needfor more information on them. They also have a great potential asan ecotourism attraction.
REFERENCESBAKER, C.M. 1989. Feeding habits of the water mongoose (Atilax
paludinosus). Zeitschrift fur Saugetierkunde 54: 31-39.BRANCH, G. & BRANCH, M. 1981. The living shores of southern
Africa. C. Struik, Cape Town.BURT, W.H. 1943. Territoriality and home range concepts as
applied to mammals. Journal of Mammalogy 24: 346-352.BUTLER, J.R.A. & DU TOIT, J.T. 1994. Diet and conservation of
Cape clawless otters in eastern Zimbabwe. South African
Journal of Wildlife Research 24: 41-47.CARO, T. 1998. Behavioral ecology and conservation biology.
Oxford University Press, New York.
Stellenbosch University http://scholar.sun.ac.za

203
CHESSON, P. & HUNTLY, N. 1989. Short-term instabilities andlong-term community dynamics. Trends in Ecology and Evolution
4: 293-299.COLLOTY, B.M., ADAMS, J.B. & BATE, G.C. 2000. The use of a
botanical importance rating to assess changes in the flora ofthe Swartkops Estuary over time. Water SA 26: 171-180.
CREEL, S. & CREEL, N.M. 1996. Limitation of African wild dogs bycompetition with larger carnivores. Conservation Biology 10:
526-538.DAVIES, B.R. & DAY, J.A. 1998. Vanishing waters. University of
Cape Town Press, Cape Town.DURANT, S.M. 1998. Competition refuges and coexistence: an
example from Serengeti carnivores. Journal of Animal Ecology
67: 370-386.DURBIN, L.S. 1993. Food and Habitat Utilization of Otters (Lutra
Lutra L.) in a Riparian Habitat. D. Phil. thesis, Universityof Aberdeen, Aberdeen, Scotland.
HANSKI, I. 1994. Spatial scale, patchiness and populationdynamics on land. Philosophical Transaátions of the Royal
Society, London, B. 343: 19-25HILL, M.P. & O'KEEFFE, J.H. 1992. Some aspects of the ecology of
the freshwater crab (Potamonautes perlatus Milne Edwards) inthe upper reaches of the Buffalo River, eastern CapeProvince, South Africa. South African Journal of Aquatic
Science 18: 42-50.KNAUS, R.M., KINLER, N. & LINSCOMBE, R.G. 1983. Estimating river
otter populations: the feasibility of 65Zn to label feces.Wildlife Society Bulletin 11: 375-377.
KOHN, M.H. & WAYNE, R.K. 1997. Facts from feces revisited. Trends
in Ecology and Evolution 12: 223-227.KREBS, J.R. & KACELNIK, A. 1991. Decision making. In: Behavioural
ecology an evolutionary approach, (eds) J.R. Krebs, & N.B.Davies, Blackwell Scientific Publications, Oxford.
KRUUK, H. & CONROY, J.W.H. 1991. Mortality of otters (Lutra
lutra) in Shetland. Journal of Applied Ecology 28: 83-94.
Stellenbosch University http://scholar.sun.ac.za

204
KRUUK, H., CONROY, J.W.H. & MOORHOUSE, A. 1991. Recruitment toa population of otters (Lutra lutra) in Shetland, in relationto fish abundance. Journal of Applied Ecology 28: 95-101.
KRUUK, H., CARSS, D.N., CONROY, J.W.H. & DURBIN, L. 1993. Otter(Lutra lutra L.) numbers and fish productivity in rivers innorth-east Scotland. Symposia of the Zoological Society of
London No. 65: 171-191.KRUUK, H., KANCHANASAKA, B., O'SULLIVAN, S. & WANGHONGSA, S.
1994. Niche separation in three sympatric otters Lutra
perspicillata, L. lutra and Aonyx c~nerea in Huai Kha Khaeng,Thailand. Biological Conservation 69: 115-120.
MACARTHUR, R.H. & LEVINS, R. 1967. Competition, habitat selectionand character displacement in a patchy environment.Proceedings of the National Academy of Science USA 51: 1207-1210.
MASON, C.F. & MACDONALD, S.M. 1986. Otters: ecology and
conservation. Cambridge University Press, Cambridge.POWELL, R.A. 1979. Mustelid spacing patterns: variations on a
theme by Mustela. Zeitschrift fUr Tier~ychologie 50: 153-163.
PURVES, M.G. & SACHSE, B. 1998. The utilization of freshwater
crabs by co-existing otter (Aonyx capensis Schinz) and water
mongoose (Atilax paludinosus Cuvier) in the Drakensberg,
South Africa. Unpublished report, University of Stellenbosch,Stellenbosch.
ROOT, R.B. 1967. The niche exploitation pattern of the blue-graygnatcatcher. Ecological Monographs 37: 317-350.
ROWE-ROWE, D.T. & SOMERS, M.J. 1998. Diet, foraging behaviour andcoexistence of African otters and the water mongoose.Symposia of the Zoological Society of London No. 71: 215-227.
ROWE-ROWE, D.T. 1977a. Food ecology of otters in Natal, SouthAfrica. Oikos 28: 210-219.
ROWE-ROWE, D.T. 1977b. Prey capture and feeding behaviour ofSouth African otters. Lammergeyer 23: 13-21.
ROWE-ROWE, D.T. 1978. The small carnivores of Natal. Lammergeyer
25: 1-48.
Stellenbosch University http://scholar.sun.ac.za

205
SCHOENER, T.W. 1974. Resource partitioning ln ecological2ommunities. Science 185: 27-39.
TILMAN, D., FARGIONE, J., WOLFF, B., D'ANTONIO, C., DOBSON, A.,HOWARTH, R., SCHINDLER, D., SCHLESINGER, W.H., SIMBERLOFF, D.& SWACKHAMER, D. 2001. Forecasting agriculturally drivenglobal environmental change. Science 292: 281-284.
VAN DER ZEE, D. 1981. Prey of the Cape clawless otter (Aonyx
capensis) in the Tsitsikama National Park, South Africa.Journal of African Zoology 194: 467-483.
VAN ZYL, R.F., MAYFIELD, S., PULFRISH, A. & GRIFFITHS, C.L. 1998.Predation by West coast rock lobster (Jasus lalandii) on twospecies of winkle (Oxystele sinensis and Turbo cidaris) .
South African Journal of Zoology 33: 203-209.
,
Stellenbosch University http://scholar.sun.ac.za