Byproducts Utilization from Wheat Milling Industries for ...
88
i Addis Ababa University Addis Ababa Institute of Technology (AAiT) School of Chemical and Bio Engineering Byproducts Utilization from Wheat Milling Industries for Development of Value Added Products A Thesis Submitted to the School of Chemical and Bio Engineering of Addis Ababa Institute of Technology, in Partial Fulfillment of the requirements for the Degree of Master of Science in Chemical Engineering (Food Engineering Stream) By: Yemsrach Yishak Advisor: Dr. Eng. Shimelis Admassu (Associate Professor) Addis Ababa, Ethiopia March, 2014
-
Upload
khangminh22 -
Category
Documents
-
view
2 -
download
0
Transcript of Byproducts Utilization from Wheat Milling Industries for ...
i
Addis Ababa University
Addis Ababa Institute of Technology (AAiT)
School of Chemical and Bio Engineering
Byproducts Utilization from Wheat Milling Industries for
Development of Value Added Products
A Thesis Submitted to the School of Chemical and Bio Engineering of Addis
Ababa Institute of Technology, in Partial Fulfillment of the requirements for the
Degree of Master of Science in Chemical Engineering (Food Engineering Stream)
By: Yemsrach Yishak
Advisor: Dr. Eng. Shimelis Admassu (Associate Professor)
Addis Ababa, Ethiopia
March, 2014

i
Addis Ababa University
Addis Ababa Institute of Technology (AAiT)
School Of Chemical and Bio-Engineering
Food Engineering Stream
Byproducts Utilization from Wheat Milling Industries for Development of
Value Added Products
A Thesis Submitted to the School of Graduate Studies of Addis Ababa Institute
of Technology, in Partial Fulfillment of the Requirements for the Degree of
Master of Science in Chemical Engineering (Food Engineering Stream)
By: Yemsrach Yishak
Approved by the Examining Board Signatures
Ato Taye Zewdu (Chair man, Department’s Graduate Committee)
Dr. Eng. Shimelis Admassu (Associate professor)
(Advisor)
Ato Adamu Zegeye
(Internal Examiner)
Dr. Ashagrie Zewdu
(External Examiner)

ii
Acknowledgments
First and for most of all I would love to thank Almighty God for all the blessings he has
given me; enabling me to accomplish this thesis work, for all the special people surrounded
me. Apart from my effort the success of this thesis depends mainly on the encouragement,
guidelines, assistance and support of many others. I take this opportunity to express my
gratitude, for the people who have been instrument in the successful achievement of this
thesis.
First, I would love to express my deepest appreciation to my thesis advisor Dr. Eng. Shimelis
Admassu starting from choosing the right topic and guided me through. Your advice, hard
work, inspirational conversations, the ability to look, wonder and dare to see beyond the
limits makes you exceptional. Thanks for all the encouragement, guidance and assistance;
and of course love to express my sincere gratitude to Mr. Bekele Mekuria, for assisting me
and fill me with new ideas and clues during my preliminary work.
I genuinely acknowledge Prof. Kibret Mequanint; your efforts were backbones to the whole
thesis work. Thank you for the financial support, willingness, and all the positive feedbacks.
I love to acknowledge Ato Hintsa for continuously trying to work with devotion, without
your effort and miracle job on Supper critical fluid extractor machine my thesis work would
have been totally different.
Most importantly of all, I express my deep sense of gratitude to my most affectionate and
beloved fiancé and family for all the spectra you ran for me. Thanks for being there for me
for each never last seem journey. You taught me to never surrender for battles in my life, and
keep on reminding me that God is already there. I just want to say thank you for your love,
undying encouragement, wisdom, advice, and for being there in every aspect of my life. Meri
my little sister extra thanks to you dear, you really mean something to me. I honestly could
not have done this without your support.
And last but not least, my friends Habtish and Dera I’m grateful from the bottom of my
hypothalamus, thanks for assisting me when I was in need of support; Dr. Ashagre, PHD
students Alexa and Engida in Science Faculty without your guidance all would have been
impossible. Finally, I would love to thank Sirgute and Tigist for all the secretarial works you
help me out.

iii
Abstract
The main byproducts of wheat milling industries, wheat germ and bran, have been known as
an outstanding sources of protein, dietary fiber, trace minerals, antioxidants, phytochemicals
and allied micronutrients. This research was conducted to evaluate utilization of wheat germ
(WG) and wheat bran (WB) for the development of value added cookies and tea substitute
products; respectively. Supercritical fluid extractor (SFE) was used to extract oil from wheat
germ and the defatted wheat germ flour (DWGF) was used as a supplement for wheat flour at
10%, 15% and 20% blending ratios (BR1, BR2 &BR3) and baking temperatures of 150, 180
and 210 oC (T1, T2 &T3).Wheat bran (WB), the other byproduct of wheat milling industries,
used to made tea substitute by milling, screening, and heating before utilized as final product.
Chemical composition of raw materials, physico-chemical and rheological characteristics of
flours were investigated prior to cookies preparation. Proximate analysis for wheat flour
(WF)(0.83,11.92,0.52,0.45,9.33) and defatted wheat germ flour (DWGF) (4.72,
12.98,1.01,5.17,28.11); for ash, moisture, fat, fiber and protein were resulted respectively; as
a result nutrient dense DWGF used as a substitute for development of cookies . It was found
that protein, fiber, ash and minerals (Ca, K, P, and Mg) contents in the blends increased
significantly (P<0.05) with an increase in DWGF substitution. The effect of BR2 and T2 on
proximate composition resulted with (protein (14.29), fiber (2.84), and ash (1.31)) resulted
better together with sensory quality evaluation. Rheological and functional properties of
flours, physical properties for cookies and organoleptic properties for both products were
analyzed. Total phenolic content (TPC) and antioxidant activity were determined by using
Folin-Ciocalteu and DPPH scavenging activity assays respectively. Extraction procedure
went out using methanol at three different temperatures (40, 60 and 80)0C. Higher total
phenolic content ranged from 1.037 to 3.68mg of gallic acid equivalent (GAE)/gm of dried
extract obtained at 60 0C using methanol. While antioxidant activity with lower half maximal
inhibitory concentration (IC50) (mg/ml) value of (1.4, 1.75, 2.13) scavenging activity for
ascorbic acid, methanol solvent extract of wheat bran and by absolute methanol respectively.
Finally, cookies baked at 180oC using blend ratio 15 % resulted better sensory qualification
and wheat bran extracted using solvent methanol at 60oC showed potential antioxidant
activity and TPC.
Keywords: defatted wheat germ, cookies, antioxidant, folin-Ciocalteu assay, DPPH
scavenging capacity assay

iv
Table of contents
Chapter Title Page
Title page
Acknowledgements
Abstract
Table of contents
List of tables
List of figures
List of abbreviations
i
ii
iii
iv
v
viii
ix
1 Introduction
1
1.1 Background 1
1.2 Statement of the problem 3
1.3 Objectives 4
1.4 Limitation of the study 4
1.5 Significance of the study 5
2 Literature Review
6
2.1 Overview on cereals 6
2.1.1 Wheat consumption and production in Ethiopia 7
2.1.2 Uses and varities of wheat 8
2.1.3 Morphology and composition of wheat 11
2.2 Effect of milling process 12
2.3 Phytochemicals and antioxidants 14
2.4 Raw materials for developed products 17
2.4.1 Wheat bran 17
2.4.2 Wheat germ 19
2.5 Process description 21
2.5.1 Process description for wheat flow 21

v
2.5.2 Process description for biscuit production 25
2.6 Sensory quality attributes 31
2.7 Concluding Remarks 32
3 Materials and Methods 34
3.1 Raw material collection, transportation, preparation and storage 34
3.2 Frame work of the research experiment 35
3.3 Methods of processing 36
3.3.1 Preparation of defatted wheat germ flour 36
3.3.2 Blend formulation and cookies production 37
3.4 Methods of analysis 39
3.4.1 Analysis of proximate composition of flours and cookies 39
3.4.2Determination of rheology property of flours 44
3.4.3 Determination of functional properties of flours 44
3.4.4 Determination of physical properties of cookies 44
3.5 Analysis of antioxidant activity and total phenolics 45
3.5.1 Sample extraction 45
3.5.2 Determination of total phenolic content 45
3.5.3 Determination of free radical scavenging activity 46
3.6 Sensory quality evaluation 48
3.7 Experimental design and statistical data analysis 48
4 Result and Discussion 49
4.1 Proximate chemical composition of flours and cookies 49
4.2 Effect of Blend ratio and baking temperature on
Proximate composition of cookies 50
4.2.1 Effect of blend ratio and baking temperature on
moisture content 50
4.2.2 Effect of blend ratio and baking temperature on crude
protein 51
4.2.3 Effect of blend ratio and baking temperature on
crude fiber 52
4.2.4 Effect of blend ratio and baking temperature on ash 52
4.3 Rheological property of flours 53
4.3.1 Water absorption 53
4.3.2 Dough development time 55

vi
4.3.3 Dough stability 56
4.3.4 Farinograph quality number (FQN) 56
4.4 Functional properties of flours 56
4.4.1 Bulk density 56
4.4.2 Water absorption capacity 57
4.4.3 Oil absorption capacity 57
4.5 Physical properties of cookies 58
4.5.1 Effect of blend ratio and baking temperature on weight of cookies 58
4.5.2 Effect of blend ratio and baking temperature on diameter of cookies 59
4.5.3 Effect of blend ratio and baking temperature on cookies height 59
4.5.4 Effect of blend proportion and temperature on spread ratio 59
4.6 Total phenolic content and antioxidant activity of bran 60
4.6.1 Total phenolic content of wheat bran 60
4.6.2 Antioxidant content of wheat bran 61
4.7 Sensory quality evaluation of products 62
5 Process Technology 64
5.1 Production process for cookies and tea substitute 64
5.2 Suggested cookies manufacturing plant 65
6 Conclusion and Recommendation 67
6.1 Conclusion 67
6.2 Recommendation 68
References 69
Appendices 76
Appendix I Score card for the sensory quality evaluation using nine point hedonic scales
for cookies
76
Appendix II Score card for the sensory quality evaluation using nine point hedonic
scales for tea substitute
77
Appendix III Data obtained for bran extraction and tests 78
Appendix IV Pictorial representations for actual frame work 80
vii
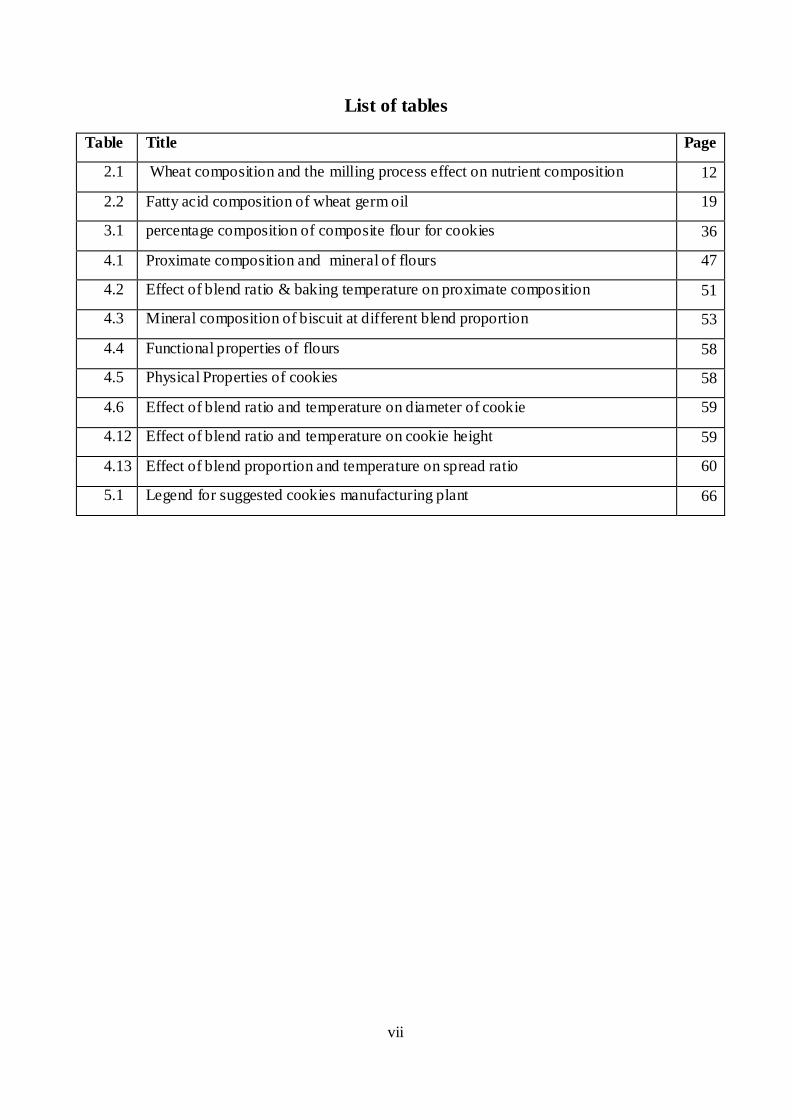
List of tables
Table Title Page
2.1 Wheat composition and the milling process effect on nutrient composition 12
2.2 Fatty acid composition of wheat germ oil 19
3.1 percentage composition of composite flour for cookies 36
4.1 Proximate composition and mineral of flours 47
4.2 Effect of blend ratio & baking temperature on proximate composition 51
4.3 Mineral composition of biscuit at different blend proportion 53
4.4 Functional properties of flours 58
4.5 Physical Properties of cookies 58
4.6 Effect of blend ratio and temperature on diameter of cookie 59
4.12 Effect of blend ratio and temperature on cookie height 59
4.13 Effect of blend proportion and temperature on spread ratio 60
5.1 Legend for suggested cookies manufacturing plant 66
viii
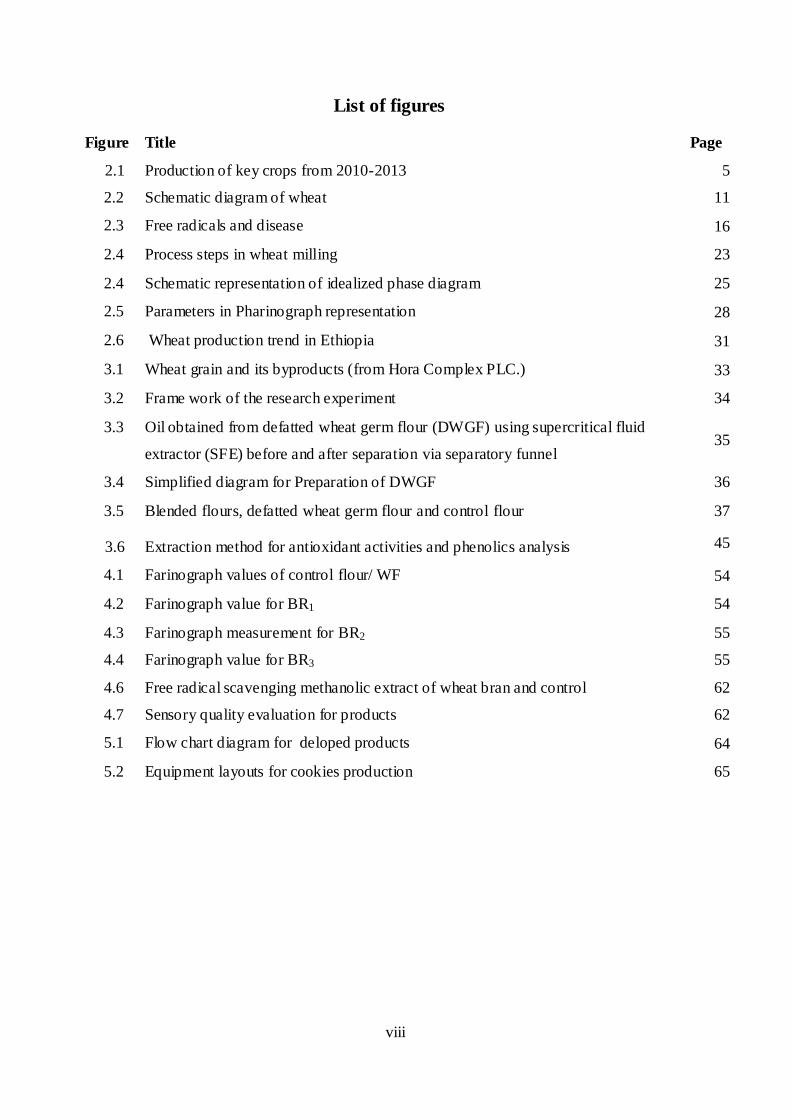
List of figures
Figure Title Page
2.1 Production of key crops from 2010-2013 5
2.2 Schematic diagram of wheat 11
2.3 Free radicals and disease 16
2.4 Process steps in wheat milling 23
2.4 Schematic representation of idealized phase diagram 25
2.5 Parameters in Pharinograph representation 28
2.6 Wheat production trend in Ethiopia 31
3.1 Wheat grain and its byproducts (from Hora Complex PLC.) 33
3.2 Frame work of the research experiment 34
3.3 Oil obtained from defatted wheat germ flour (DWGF) using supercritical fluid
extractor (SFE) before and after separation via separatory funnel 35
3.4 Simplified diagram for Preparation of DWGF 36
3.5 Blended flours, defatted wheat germ flour and control flour 37
3.6 Extraction method for antioxidant activities and phenolics analysis 45
4.1 Farinograph values of control flour/ WF 54
4.2 Farinograph value for BR1 54
4.3 Farinograph measurement for BR2 55
4.4 Farinograph value for BR3 55
4.6 Free radical scavenging methanolic extract of wheat bran and control 62
4.7 Sensory quality evaluation for products 62
5.1 Flow chart diagram for deloped products 64
5.2 Equipment layouts for cookies production 65
ix
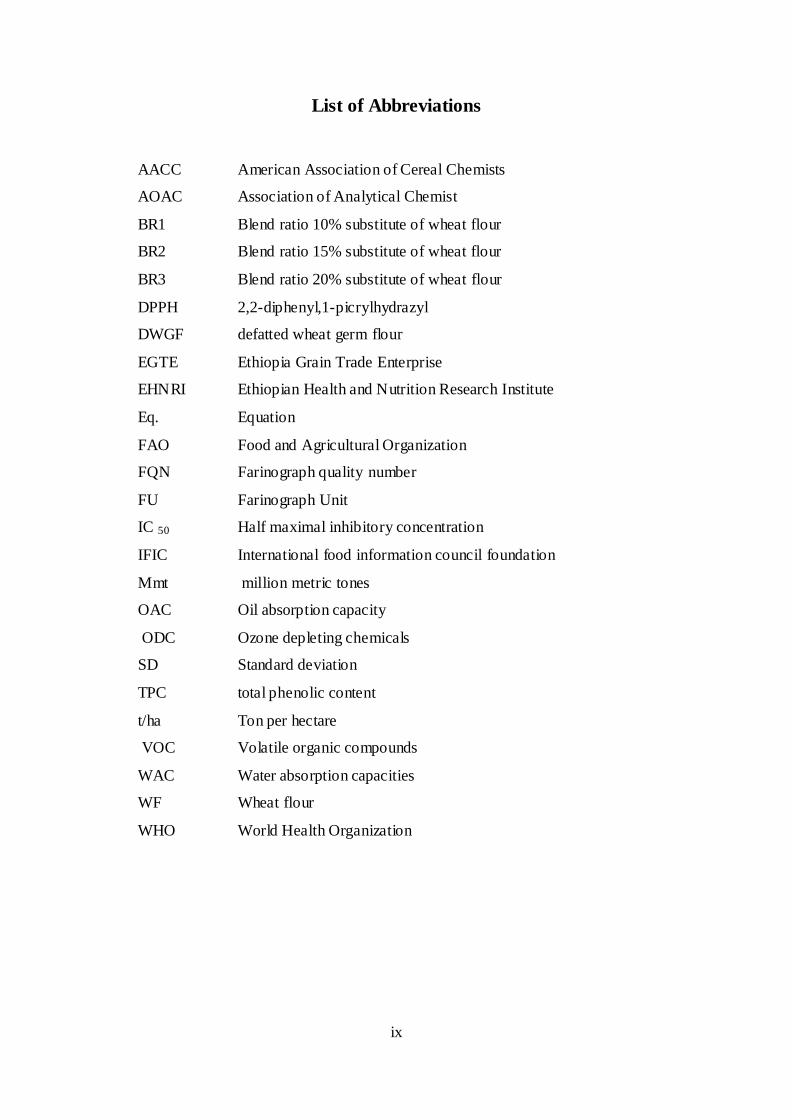
List of Abbreviations
AACC American Association of Cereal Chemists
AOAC Association of Analytical Chemist
BR1 Blend ratio 10% substitute of wheat flour
BR2 Blend ratio 15% substitute of wheat flour
BR3 Blend ratio 20% substitute of wheat flour
DPPH 2,2-diphenyl,1-picrylhydrazyl
DWGF defatted wheat germ flour
EGTE Ethiopia Grain Trade Enterprise
EHNRI Ethiopian Health and Nutrition Research Institute
Eq. Equation
FAO Food and Agricultural Organization
FQN Farinograph quality number
FU Farinograph Unit
IC 50 Half maximal inhibitory concentration
IFIC International food information council foundation
Mmt million metric tones
OAC Oil absorption capacity
ODC Ozone depleting chemicals
SD Standard deviation
TPC total phenolic content
t/ha Ton per hectare
VOC Volatile organic compounds
WAC Water absorption capacities
WF Wheat flour
WHO World Health Organization
1
CHAPTER ONE
Introduction
1.1 Background
Cereal crops are staple foods that provide essential nutrients to numerous populations of the
world. Cereals are dominant in the food sector because they are a versatile and reliable source
of food. They are easy to store and may be used to produce a myriad of food products.
Cereals processing thus forms a large and important part o f the food production chain. It also
plays a lesser, but no less important role in the non-food sector. It is for these reasons that
ways of improving cereal processing technology and practice need to be addressed on a
continual basis. Practically every meal produced today contains cereals in some form, while
the range of non-food applications (Galvin, 2001).
Wheat is a farinaceous grass, known botanically as triticum spp., is one of the most consumed
cereal grains worldwide and makes up a substantial part of the human diet. It provides more
nourishment (calories & proteins) for humans than any other single food crops. According to
Statista 2013/2014, the global production volume of wheat amounted approximately 710
million metric tons, which has shown a 7.7% increment from the previous year. It is the
second most important food crop in the developing world after rice. In sub-Saharan Africa,
14 countries produce wheat; Ethiopia and South Africa are the two major producers. Along
with Teff, wheat and maize represent the three most important cereal crops in Ethiopia.
Wheat is one of the various cereal crops largely grown in highlands of Ethiopia. It is
produced largely in the southeast, central and northwest parts of Ethiopia (Karin & Leo,
2013).
Cereal processing industry may be described as any industry that takes a cereal or a cereal
product as its raw material. The wheat-based industry is a multi-billion dollar market; hence
wheat is one of the top three cereals crop in the world. The milling process of wheat produces
large amount of wheat bran and germ as a byproduct. During milling, the endosperm is
broken down into fine particles (white flour) while bran and germ are removed. Wheat is a
significant agricultural and dietary commodity worldwide with known antioxidant properties
concentrated mostly in the bran. Wheat germ, being a byproduct of the flour milling industry,
is reported to be one of the most potential and excellent sources of much-needed vitamins,
minerals, dietary fiber, calories, proteins, and some functional micro-compositions at a
relative low cost (Yiqiang et al., 2001 and Shao & LiYu, 2011).
2
In general from wheat milling industries release a byproduct of (25-40) % and these by-
products utilized for animal feed, bioethanol production, succinic acid production, like a
blend for baked products as nutritional improvement, for cosmetics, meat substitute,
neutraceutical/ pharmaceutical products and for many more others. A value addition, any step
in the production process that improves the product for the customer and results in a higher
net worth of the last product. Using by-products from wheat milling industries for value
addition is accustomed in the developed countries like U.S.A for instance defatted wheat
germ helps meet today’s demands for full flavor grain-based foods that are rich in protein and
fiber (Dotty, 2012).
Oil inside the wheat germ extracted using different mechanisms such as the common method
organic solvent extraction (Hexane, Methanol, Chloroform-methanol, etc) which recovers
about 90% of the oil, by mechanical pressing, which recovers about 50% (Singh and Rice
1979) or by using super critical extraction methods (85%). The extracted wheat germ oil from
the former two mechanisms resulted in having lower free fatty acid and α-tocopherol content;
in other word oil obtained by supper critical extraction can overcome these negative factors;
in fact, the oils are solvent-free and do not need the traditional refining processes, and
extraction yields are similar to those usually need to be refined (Panfali et. al, 2003).
Above all, recent research demonstrates that wheat grain contains significant level of natural
antioxidants, mostly concentrated at the outer part. Wheat is an important agricultural
commodity and a primary food ingredient worldwide and contains considerable beneficial
nutritional components. Wheat and wheat-based food ingredients rich in natural antioxidants
can ideally serve as the basis for development of functional foods designed to improve the
health of millions of consumers (Tomas et. al., 2014).
Tea/ coffee substitutes are non-coffee products, usually without caffeine, that are used to
imitate coffee. This substitutes can be used for younger children, medical, economic and
religious reason, or simply because coffee is not readily available. Coffee and tea substitutes
made from wheat and barley have been produced for a century; however, limited research has
gone into the antioxidant benefits from roasted wheat and coffee beverages. As the benefits
of wheat antioxidants become better known, the wheat and coffee beverage markets may
emerge as well. According to researches by naturopathic clinic caffeine stimulates central and
sympathetic nervous systems, resulting in an elevation of the stress hormones released by
pituitary, adrenal and hypothalamus glands. These hormones can cause short term spikes in

3
our blood pressure by raising both systolic and diastolic pressures. Release of stress
hormones causes our body to enter a state similar to a fight or flight response, causing blood
to be redirected from our stomach and digestive system and potentially causing indigestion
(Doty, 2012).
1.2. Statement of the problem
Wheat milling industries process and finally ground wheat kernel in to flour by separating the
wheat grain in to its constituents endosperm, bran and germ. The end product flour mainly
contains endosperm where as bran and germ removed as byproduct from wheat milling
industries. Wheat bran removed from being part of final flour with aim to produce flour with
a white rather than a brown color, and eliminated the fiber. Neither of these objectives is
necessarily desirable from the nutritional point of view. Similarly, for the reason that wheat
germ, if left in flour, has an adverse effect on the functional properties of dough, and reduces
the shelf life of final flour hence it’s rich in polyunsaturated fats (which have a tendency to
oxidize and become rancid on storage). Consequently wheat germ removed during processing
improved the storage qualities of flour and milled as part of mill feed and the final flour/
white flour sold without enrichment process.
Abroad, countries like United States, Far East and others developed countries managed to
utilize their wheat milling industries byproducts beyond meeting the nutritional needs of their
customers. Wheat germ used as a resource for value addition purpose after extracting the oil.
When wheat germ defatted; it becomes ideal ingredient for grain based products; hence it is
high in protein, fiber and is virtually fat free. Processing and finally blending with wheat
flour to get better functional qualities included improved stability, nutritional values and
flavor of processed foods besides making consumer goods of all kinds.
The basic problems in developing countries like ours unlike the developed ones; instead of
maximizing (using available) resources in our hand, lose it as if we couldn’t gain any
importance from it. Hence , the number of wheat milling industries are increasing year after
year, as that of consumption and production of wheat; then utilizing the (25- 40) % of the
total would be nice than waste it.
Wheat milling industries byproducts, wheat germ and bran, were collected to feed animals
therefore underutilized. Hence, aim of this thesis was utilization of byproducts from wheat
milling industries at industrial level (produced cookies from blend of wheat germ after
defatted and a non caffeine tea substitute from wheat bran) help to attempt the shortage of

4
wheat by developing composite products and insures food security in the country. By
creating awareness in consumer’s mind; commercialization and promoting healthier products
should be given attention.
1.3 Objectives of the study
General objectives
The general objective of this research was to utilize byproducts from wheat milling industries
for development of value added products.
Specific objectives
The specific objectives of this research were to:
Assess the proximate composition of raw materials: wheat germ flour, defatted wheat germ
flour, wheat flour and identify if defatted wheat germ flour was able to supplement wheat
flour to develop last product cookies.
Evaluate mineral contents of wheat flour and defatted wheat germ flour and the composite
cookies developed.
Evaluate rheological properties of control and blended flours.
Determine the functional property of blended flours and control.
Determine the effect of baking temperature and blend ratios on the proximate composition,
physical as well as organoleptic property of cookies
Evaluate the antioxidant property of wheat bran
1.4 Limitation of the study
Even though the research has reached its aspire, there were some avoidable limitations. The
first one is scarcity of byproducts that are used as raw materials for the development of the
value added products i.e wheat germ and wheat bran separately. Because most industries here
avoid those byproducts together for animal feed; but Hora food complex was willing to open
the accurate pipes in the middle of processing the kernel to wheat flour. The second limit was
means of knowing the amount & which specific amino acids present in the defatted wheat
germ flour however there wasn't means of knowing all the amino acids present inside the
wheat germ protein content from nitrogen was calculated.
1.5 Significance of the study
This research studied the importance of utilization of cheap byproducts (wheat bran and
germ) from wheat milling industries. Hence, the final refined white flour resulted in most of

5
the industries in Ethiopia; do not pass through enrichment process unlike the developed
countries. This as a result leaves the society poor in nutrition, and the industries less
profitable; instead of utilizing these byproducts either to maximize resource (by blending
with defatted wheat germ flour) or bran as raw material for tea substitute. Utilizing wheat
germ in baked products will not only explore its functional and neutraceutical role but also
contribute towards value addition in wheat milling sectors so that consumers benefit
nutritionally. This indirectly encourages cosmetic industry sectors to make use of oil from
that of defatted wheat germ instead of importing expensive goods from abroad. Finally a new
idea and practices to develop a non caffeine tea substitute from antioxidant rich wheat bran.
Overall outcome of the research will raise profit, creates awareness and give alternatives for
processors especially contribute its part to achieve food security.
6
CHAPTER TWO
Literature Review
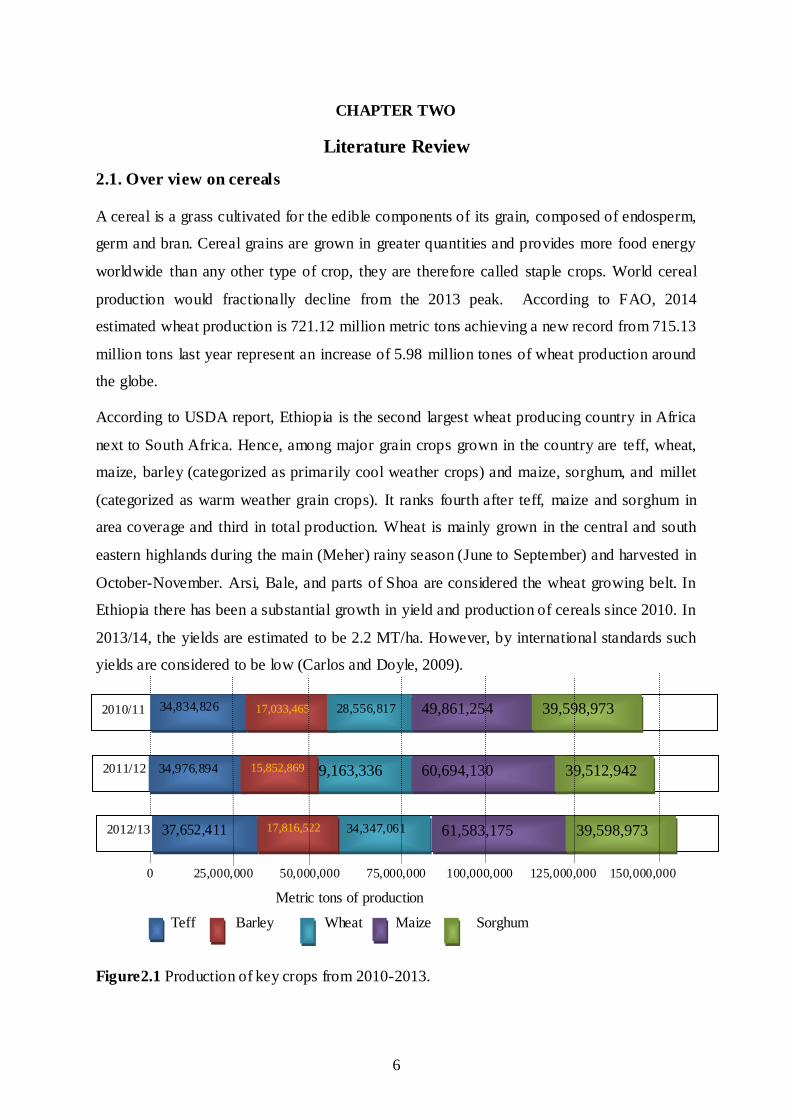
2.1. Over view on cereals
A cereal is a grass cultivated for the edible components of its grain, composed of endosperm,
germ and bran. Cereal grains are grown in greater quantities and provides more food energy
worldwide than any other type of crop, they are therefore called staple crops. World cereal
production would fractionally decline from the 2013 peak. According to FAO, 2014
estimated wheat production is 721.12 million metric tons achieving a new record from 715.13
million tons last year represent an increase of 5.98 million tones of wheat production around
the globe.
According to USDA report, Ethiopia is the second largest wheat producing country in Africa
next to South Africa. Hence, among major grain crops grown in the country are teff, wheat,
maize, barley (categorized as primarily cool weather crops) and maize, sorghum, and millet
(categorized as warm weather grain crops). It ranks fourth after teff, maize and sorghum in
area coverage and third in total production. Wheat is mainly grown in the central and south
eastern highlands during the main (Meher) rainy season (June to September) and harvested in
October-November. Arsi, Bale, and parts of Shoa are considered the wheat growing belt. In
Ethiopia there has been a substantial growth in yield and production of cereals since 2010. In
2013/14, the yields are estimated to be 2.2 MT/ha. However, by international standards such
yields are considered to be low (Carlos and Doyle, 2009).
0 25,000,000 50,000,000 75,000,000 100,000,000 125,000,000 150,000,000
Metric tons of production
Teff Barley Wheat Maize Sorghum
Figure2.1 Production of key crops from 2010-2013.
2011/12
2010/11 34,834,826
34,976,894
17,033,465 28,556,817
29,163,336
49,861,254
60,694,130 15,852,869
39,598,973
39,512,942
2012/13 37,652,411 34,347,061 61,583,175 17,816,522 39,598,973

7
2.1.1 Wheat Consumption and Production in Ethiopia
In Ethiopia, Wheat ranks fourth in terms of area production and yield among food crops.
Production of wheat increased from 2.2 (000 t) in 2004/2005 (CSA, 1998) to 2.8 (000 t) in
2010/2011 (CSA, 2000) an increase of 31 percent. However, the share of wheat in total cereal
area decreased (-12.4 percent) over the same period, mainly due to a shift in cropping
patterns towards sorghum. Wheat yield in Ethiopia is also lagging behind other major
producers in Africa: average yield was 1.68 t/ ha during the same period, about 32 percent
and 39 percent below Kenyan and South African averages, respectively (FAOSTAT). The
apparent low productivity can be attributed to several factors, including slow progress in
developing wheat cultivars with durable resistance to diseases, and depleted soil fertility
(Demeke, 2013).
Commercial imports of wheat have increased in the last couple of years, which is likely the
result of the government’s efforts to stabilize wheat prices following a significant increase in
domestic food prices. Ethiopia remains one of the largest recipients of food aid in Africa,
receiving around 27% of the global food aid given to sub-Saharan Africa. In May 2012/13,
Ethiopian Grain Trade Enterprise (EGTE) imported 322,415 MT of wheat, primarily from
India, 26 percent of which was from the US and from food aid too (Demeke, 2013).
There are around 216 flour mills in Ethiopia, with a total production capacity of about 4.2
million tons of wheat flour a year. Almost a third of these mills are located in Addis Ababa.
Mills are able to obtain wheat through two channels, namely subsidized wheat from the
EGTE and from domestic production on the open market, whose price is higher than imports.
The state-owned EGTE controls all commercial wheat imports and makes wheat available to
millers at a subsidized price; this accounts for roughly a quarter of the wheat market and the
rest of the market is supplied from domestic production, whose price is not controlled and
whose price is higher than imported wheat (Abu, 2014).
It accounts for about 11% of the national calorie intake. The largest volume of the main
season production of wheat originates from Oromia (55 per cent), Amhara (29 per cent) and
the Southern Nations, Nationalities, and Peoples Region, SNNPR (9 per cent) (CSA, 2010).
8
2.1.2 Use s and varities of wheat
Uses of wheat
In Ethiopia, wheat grain is used in the preparation of a range of products such as: the
traditional pancake (“injera”), bread (“dabo”), local beer (“tella”), porridge and several others
local food items (i.e., "dabokolo","genfo", "kinche”). Besides, wheat straw is commonly used
as a roof thatching material, and as a feed for animals. Wheat contributes approximately 200
kcal/day in urban areas and about 310 kcal in rural areas.
Globally, there is no doubt that the number of people who rely on wheat for a substantia l part
of their diet amounts to several billions. According to P. kumar et al journal wheat, as
produced by nature, contains several medicinal virtues and relevant to human being discussed
as follow:
Every part of the whole wheat grain supplies elements needed by the human body. Wheat
bran is used as a supplemental source of dietary fiber for preventing colon diseases (including
cancer), preventing gastric cancer, helps constipation by speeding up the colon and increasing
stool output and bowel frequency. Treating irritable bowel syndrome, reducing the risk of
breast cancer and gallbladder disease, and type 2 diabetes
The germ forms only 3% of the weight of a wheat grain; nonetheless, contains about 25% of
the protein, lecithin, vitamins and minerals. Its oil is highly rich unrefined oil, richest sources
of vitamin E, A and D, has a shelf life nearly 6-8 months. This oil widely used for external
application, as it helps a great deal in getting rid of skin irritation including skin dryness and
cracking, improves the circulation of blood and helps to repair the skin cells destroyed by the
scorching heat of sun, has exceptional nourishing qualities, as a result; increasingly finding
its way in the making of skin care products. Wheat germ oil is known for its antioxidant
properties, a good source of fatty acids that are very vital for the healthy growth of the body
and this explains the reason why it is added to other carrier oils. It keeps away the symptoms
of dermatitis, thereby preventing the skin from being victimized by various kinds of
problems.
Wheat grass therapy can be effectively used for skin diseases and ulcerated wounds as by
retarding bacterial action, it promotes cell activity and normal re-growth. By drinking wheat
grass juice regularly, an unfavorable environment is created for bacterial growth. Poultice of
wheat grass juice can be applied on the infected area, as it is an able sterilizer. Externally,
wheat flour is useful as a dusting powder over inflamed surface as in burns, scalds and

9
various itching and burning eruptions, Whole wheat flour, mixed with vinegar, boiled and
applied outwardly removes freckles.
The young stem of wheat used in the treatment of biliousness and intoxication. The ash is
used to remove skin blemishes. The fruit is antipyretic and sedative. The light grain is
antihydrotic. It is used in the treatment of night sweats and spontaneous sweating. The seed is
said to contain sex hormones and has been used in China to promote female fertility. The
seed sprouts are antibilious, antivinous and constructive. They are used in the treatment of
malaise, sore throat, thirst, abdominal coldness and spasmic pain, constipation and cough.
The plant has anticancer properties also.
The straw has many uses, as a biomass for fuel, for thatching, as mulch in the garden. A fiber
obtained from the stems is used for making paper. The stems are cut into usable pieces and
soaked in clear water for 24 hours. They are then cooked for 2 hours in lye or soda ash and
then beaten in a ball mill for 1½ hours in a ball mill. The fibers make a green-tan paper. The
starch from the seed is used for laundering, sizing textiles, etc.
Antioxidants in wheat bran exist in the forms of vitamins (tocopherols – vitamin E), minerals
(selenium), phenolic acids (ferulic acid, vanillic acid), tocotrienols, phytic acid, phytosterols,
flavonoids, and carotenoids (lutein) (El-Sayed et al., 2008). Coffee and tea contain abundant
levels of antioxidants as do wheat and barley kernels. Coffee and tea also naturally contain
caffeine. Coffee and tea substitutes made from wheat and barley have been produced for a
century; however, limited research has gone into the antioxidant benefits from roasted wheat
and coffee beverages.
Species and varieties of wheat
Today wheat is one of the world’s most important grains, as it covers more of the earth’s
surface than any other grain crop. Wheat is a cereal grain of the genus Triticum within the
grass family Poaceae. Botanically, there are more than 30, 000 wheat varieties, categorized
into six major classes according to planting and harvesting dates as well as hardness, color
and shape of the kernels(Kelly, 2009): Wheat varieties included were (i) Hard or soft, which
relates to the hardness of the kernel. (ii) Red or white, which relates to the presence or
absence of a red pigment in the outer layers of the wheat kernel. (iii) Winter or spring wheat
varieties that are categorized as such depending on when the wheat is planted.
Ethiopian farmers traditionally grow several varietal mixtures (even less productive cultivars
and wild relatives) in the same field that might have advantage to add variety to their diet,

10
reduce the risk of pests and diseases or unusual environmental conditions, and also preserve
cultivars and genetic diversity (Bekele, 1984; Jain, 2000). Ethiopian wheat includes tetraploid
and hexaploid species. Tetraploid wheats are indigenous, whereas hexaploid wheats are
probably a recent introduction (Bechere, 2000). In wheat breeding history Ethiopian
tetraploid wheat landraces were often used as sources of earliness, disease and pest
resistance, nutritional quality, resistance to drought and other stresses, adaptation to low soil
fertility and other characteristics useful in low-input agriculture (Worede, 1997).
Durum wheat is of the species Triticum durum distinctly different from common wheat in
that it produces very hard kernels and has yellow pigments throughout the endosperm rather
than in the outer layers. It is typically used to produce pasta products, while common wheat is
used, for example, in breads, cakes, cookies, and crackers (Korolchuk et. al., 2006). The
species according to Ministry of agriculture and rural development, (2009) can be categorized
as:
Hexaploid species
Common wheat or Bread wheat (T. aestivum) is hexaploid species that is the most widely
cultivated one in the world. Spelt (T. spelta) is another hexaploid species cultivated in limited
quantities. Spelt is sometimes considered a subspecies of the closely related species common
wheat (T. aestivum), in which case its botanical name is considered to be Triticum aestivum
subsp. spelta. Among the different varieties of bread wheat in Ethiopia that have been
currently developed to satisfy the growing production demands are: Tura, Sirbo, Bobicho,
Tossa, Sofumar, Digalu, Senkegna, Dinknesh, Alidoro, Menze, Meraro, Warkaye,
Dereselgne, Dashen, Mitike, Kubsa, Wabe, Galema, Megala, Abola, Tuse, Simba, Katar,
Shina, Wetera, Gasay, Sulla, Meraro, Warkaye, Jiru, Senkegna, Millennium.
Tetraploid Species
Durum (T. durum) – The only tetraploid form of wheat widely used today, and the second
most widely cultivated wheat. It has very narrow adaptation and lower yield potential as
compared to bread wheat includes: Hitosa, Denbi, Werer (Mamouri I), Tate, Flakit, Obsa,
Ejersa, Bakalcha, Kokate, Malefia, Oda, Ilani, Megenagna, Quami, Mettaya, Ude, Selam,
Ginchi, Robe, Laste , Asasa, Arsi-Robe, Mosobo .
Emmer (T. dicoccum) is also tetraploid species originated in the Near East., cultivated in
ancient times but no longer in widespread use worldwide. Indeed, it is one of the first cereals
ever domesticated and was part of the early agriculture of the Fertile Crescent.
11
Diploid Species
Einkorn (T. monococcum) is diploid species with wild and cultivated variants. Domesticated
at the same time as emmer wheat, but never reached the same importance.
Triticale (X-Triticosecale)
This one is a man-made crop developed by crossing wheat (Triticum turgidum or Triticum
aestivum) with Rye (Secale cereale). In Ethiopia triticale is only a recent introduction:
Dilfekar, Logaw Shibo, Minet, Snan.
2.1.3 Morphology and composition of wheat
Wheat grains are generally oval shaped, although different types of wheat have grains that
range from almost spherical to long, narrow and flattened shapes. The grain is usually
between 5 and 9mm in length, weighs between 35 and 50mg and has a crease down one side
where it was originally connected to the wheat flower. The wheat grain contains 2-3% germ,
13-17% bran and 80-85% mealy endosperm (all constituents converted to a dry matter basis)
(Zuzana et al, 2009).
The wheat kernel consists of three fractions, the endosperm, bran, and germ, which are
compositionally and morphologically very different. Thus, products will have different
coarseness, textures, and color depending on the portion of the wheat kernel being used.
Refined wheat flour is formed primarily from the endosperm of the wheat kernel. The
endosperm comprises approximately 82% of the wheat kernel. The function of the endosperm
is to provide energy for the embryonic plant during germination of the wheat kernel. The
endosperm contains approximately starch and 10-14% protein (Korolchuk et al., 2005).
Compared to the bran and germ, the endosperm contains low amounts of fiber, lipid,
vitamins, minerals, protein, pigments and other phytonutrients. This helps give the refined
wheat flour its consistent, fine, starchy texture and off-white color compared to whole-grain
wheat flour. The bran consists of several cell layers and contains a significant amount of
fiber. The bran includes the aleurone layer, which separates the endosperm from the bran
layers. The aleurone layer is rich in proteins, vitamins and phytonutrients. The germ is rich in
lipids, fiber, vitamins, minerals and phytonutrients. Thus, refined wheat flour, which is made
primarily of endosperm is mainly starch and has limited amounts of fiber, proteins, lipids,
vitamins, minerals and other phytonutrients (Korolchuk et al., 2005).
12
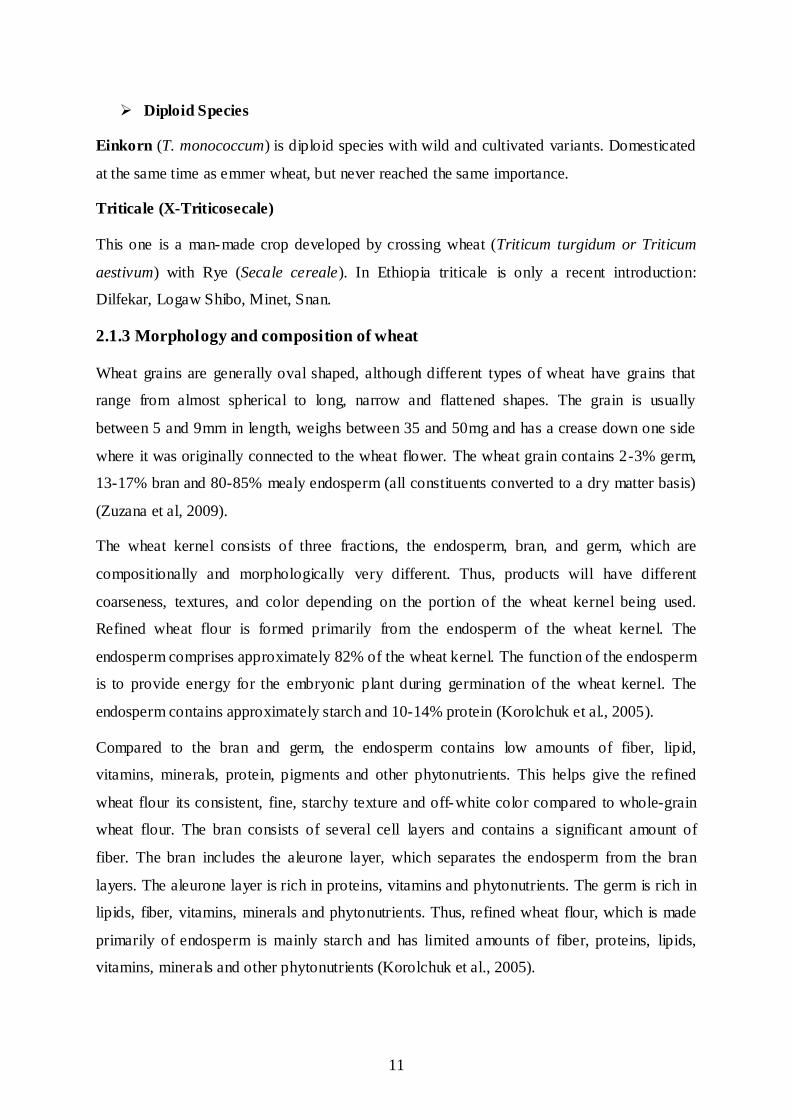
Figure 2.2 Schematic diagram of wheat (Surget and Barron, 2005).
The bran (outer layers of wheat grain) is made up of several layers, which protect the main
part of the grain. In order to protect the grain and endosperm material, the bran comprises
water-insoluble fiber. Chemical composition of wheat bran fiber is complex; it contains,
essentially, cellulose and pentosans, polymers based on xylose and arabinose, which are
tightly bound to proteins. These substances are typical polymers present in the cell walls of
wheat and layers of cells such as aleurone layer. Proteins and carbohydrates each represent
16% of total dry matter of bran. The mineral content is rather high (7.2%). The two external
layers of the grain (pericarp and seed coat) are made up of dead empty cells. The cells of the
inner bran layer- aleurone layer are filled with living protoplasts. There are large differences
between the levels of certain amino acids in the aleurone layer and those in flour. Glutamine
and proline levels are only about one half, while arginine is treble and alanine, asparagine,
glycine, histidine and lysine are double those in wheat flour (Cornell 2003).
2.2 Effect of milling process
The consumption of white flour and bread have historically been associated with prosperity
and the development of sophisticated roller mills in Austro-Hungary during the second part
of the 19th century allowed the production of higher volumes of whiter flour than it was
possible to produce by traditional milling based on grinding between stones and sieving. The
bleached flour obtained at the end of the product is not rich in nutrient; however the by-
products obtained are excessively prosperous to be left for animal feed (Jones, 2007).
Generally, cereal grains are subjected to different processes to prepare them for human
consumption. These processes significantly affect their chemical composition and
consequently their nutritional value. Flour processing decreases the levels of naturally
13
occurring, non -bioavailable nutrients in flour. Iron and folic acid are among the vitamins and
minerals lost when bran and germ are separated from endosperm (Victor, 2011).
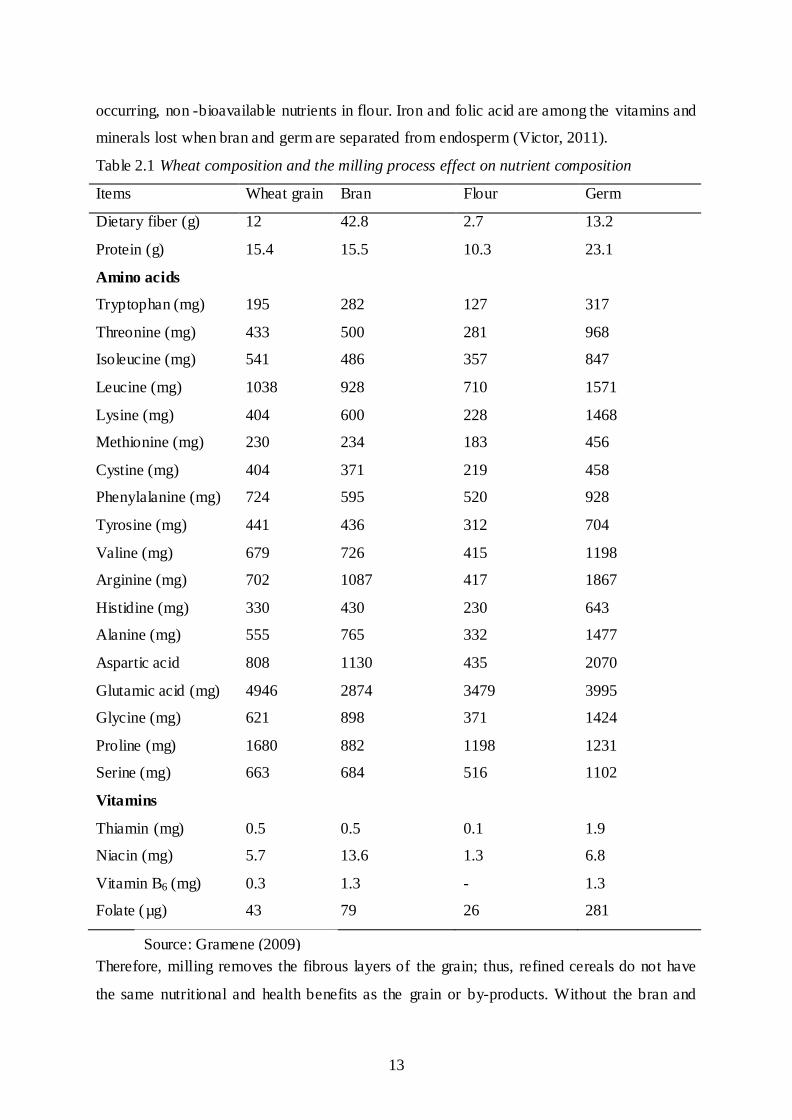
Table 2.1 Wheat composition and the milling process effect on nutrient composition
Items Wheat grain Bran Flour Germ
Dietary fiber (g) 12 42.8 2.7 13.2
Protein (g) 15.4 15.5 10.3 23.1
Amino acids
Tryptophan (mg) 195 282 127 317
Threonine (mg) 433 500 281 968
Isoleucine (mg) 541 486 357 847
Leucine (mg) 1038 928 710 1571
Lysine (mg) 404 600 228 1468
Methionine (mg) 230 234 183 456
Cystine (mg) 404 371 219 458
Phenylalanine (mg) 724 595 520 928
Tyrosine (mg) 441 436 312 704
Valine (mg) 679 726 415 1198
Arginine (mg) 702 1087 417 1867
Histidine (mg) 330 430 230 643
Alanine (mg) 555 765 332 1477
Aspartic acid 808 1130 435 2070
Glutamic acid (mg) 4946 2874 3479 3995
Glycine (mg) 621 898 371 1424
Proline (mg) 1680 882 1198 1231
Serine (mg) 663 684 516 1102
Vitamins
Thiamin (mg) 0.5 0.5 0.1 1.9
Niacin (mg) 5.7 13.6 1.3 6.8
Vitamin B6 (mg) 0.3 1.3 - 1.3
Folate (µg) 43 79 26 281
Therefore, milling removes the fibrous layers of the grain; thus, refined cereals do not have
the same nutritional and health benefits as the grain or by-products. Without the bran and
Source: Gramene (2009)

14
germ, approximately 45% of the grain proteins are lost, along with 80% of fiber, 50 -85% of
vitamins, 20-80% of minerals, and up to 99.8% of phytochemicals. In addition, important
losses of amino acids (35-55%) occur during refining. Some fiber, vitamins, and minerals
may be added back into refined cereal products through fortification or enrichment programs,
which compensates for losses due to refining, but it is impossible to restore the
phytochemicals lost during processing (Rosell, 2007).
2.3 Phytochemicals and antioxidants
Phytochemicals
Two hundred and ten thousand phytochemicals present in plants have been isolated and
characterized according to the Dictionary of Natural Products (Hampden Data Services Ltd.,
2008) but a large percentage of phytochemicals remain unknown. ‘Phytochemical’ refers to
every naturally occurring chemical substance present in plants, especially those that are
biologically active (Zielinski and Kozlowska, 2000).
Wheat grains are sources of phytochemicals with potential health benefits. Phytochemicals
together with many other micronutrients are often found in the germ and the bran of wheat.
Though, wheat bran and germ layers removed during milling contain 75% of the phytonutrients
(Slavin, 2003; Jones et al., 2004) in the wheat kernel.
Wheat grain, particularly, its bran fraction contains several classes of phytochemicals. Among
them, phenolic acids, polyphenols (flavonoids and lignans), (both phenolic acids and flavonoids
are major class of phytochemicals containing one or more aromatic ring and one or more
hydroxyl group), carotenoid (another group of phytochemicals contributing to the pigments and
are thought to provide health benefits in decreasing the risk of disease, particularly certain
cancers and eye diseases), tocopherol/tocotrienols (used for treating diabetis, desease of brain and
nervous system, to avoid complication in late pregnancy, to prevent aging etc.), and
phytosterols/phytosterols (a group of phytochemicals known for cholesterol reduction in human
have been characterized and linked to many bioactivities related to human health). Most of these
phytochemicals have shown strong antioxidant activities in both pure and mixed forms also have
been implicated to play a protective role against chronic diseases such as cancer, cardio-vascular
diseases, and diabetes (Liang, 2007).
Antioxidants
Antioxidants are substances that may protect the cells against the effects of free radicals or
compounds that detoxify reactive oxygen species (ROS) and prevent their damage through
15
multi mechanisms. Oxidation reactions can produce free radicals and these radicals are
responsible to vast variety of human diseases including atherosclerosis, arthritis, ischemia
diabetic mellitus, hypertension, aging, and cancer. Synthetic antioxidants have been in use as
food additives for a long time, but reports on their involvement in chronic diseases have
restricted their use in foods. It is established that consumption of antioxidant substances has
been linked to the reduction in the incidence of oxidative-stress related diseases. The use of
currently available synthetic antioxidants like butylated hydroxy anisole (BHA), butylated
hydroxyl toluene (BHT) has been limited due to their toxicity and side effects. They are
suspected of being responsible for liver damage and carcinogenesis in laboratory animals.
Hence strong restrictions have been placed on their application and therefore research for the
determination of the natural oxidants source is important (Tapan et. al., 2013 and Magdy et
al., 2014).
They play many important roles such as free radical scavenger, reducing agent and
antioxidant defense enzyme system activator. Rice and wheat are two very commonly
consumed cereal grain that contain several antioxidative compounds and are shown to be
beneficial for a wide range of medical conditions (Bishwajit et. al., 2013).
Antioxidants terminate ROS attacks and appear to be of primary importance in the prevention
of these diseases and health problems. It has been widely accepted that diet can significantly
alter the overall health and quality of life. Development of functional foods rich in
bioavailable antioxidants may play an important role in this regard. The key for developing
functional foods is to provide a sufficient amount of the bioavailable safe active components,
the functional additives/nutraceuticals, in the finished functional food products (Liangli,
2007).
Antioxidant activity is an important biological property of many phytochemicals that protects
living organisms from oxidative damage thereby preventing various deleterious events and
diseases in plants and animals including human beings. Phenolic compounds possess
antioxidant activity and these are aromatic secondary metabolites of phenylalanine, and, to a
lesser extent, tyrosine that constitute one of the most diverse family of compounds found in
plants. Simple phenols, phenylpropanoids, flavonoids, tannins (proanthocyanidins and
others), and lignins are among numerous categories of plant phenolics. Cereals have been
known to contain phenolic acids, phytoestrogens, and small quantities of flavonoids. The
phenolic acids in cereals are benzoic and cinnamic acid derivatives; the latter being most

16
common. Cereals are also a major source of dietary lignans with potent antioxidant activity
(Liangli, 2007).
Phenolic acids exist as free, esterified and insoluble-bound forms. One of the advantages of
bound phytochemicals is their ability to survive digestion in the upper gut, allowing them to
reach the colon and, therefore, exert health benefits. Flavonoids and phenolic acids are
examples of antioxidants, which are important ingredients of many foods, and keenly sought
in many ‘health foods’. They are thought to help protect against diseases like cancer,
cardiovascular disorders, neurodegenerative diseases and ageing by mopping up potentially
damaging free radicals that are released in the body (Asli et al., 2010).
Postum is a powdered roasted-grain beverage once popular as a coffee substitute. The
caffeine-free beverage was created by Postum Cereal Company founder 1895 and marketed
as a healthful alternative to coffee. The Postum Cereal Company eventually became General
Foods, which was bought by Kraft Foods. Post was a student of John Harvey Kellogg, who
believed that caffeine was unhealthy. The "instant" drink mix version was developed in 1912,
replacing the original brewed beverage Postum is made from wheat bran, wheat, molasses,
and maltodextrin from corn (Pendergrast and Mark, 2010). The tea substitute made in this
research paper only shared the wheat bran part from postum neither used the molasses nor
corn instead wheat bran stimulated by natural non caffeine herb /additives like mint,
Cinnamon, funnel seed used as extra flavor for the drink when steeped in hot cup water.
The main characteristic of an antioxidant is its ability to trap free radicals. Highly reactive
free radicals and oxygen species are present in biological systems from a wide variety of
sources. These free radicals may oxidize nucleic acids, proteins, lipids or DNA and can
initiate degenerative disease (Aruna et al., 2014).

17
2.4 Raw materials for developed products
2.4.1Wheat bran
Bran, an outer layer of most cereal grains, is nutrient dense as it contains proteins, omega 3
and omega 6 fatty acids and antioxidants. Cereal bran is an excellent source of dietary fiber;
for addition to food, it offers all the nutritional and neutraceutical benefits. It contributes a
pleasing sweet, nutty flavor when added as a flavor enhancer in baked products and pasta. It
is obtained from screened grains of wheat (Muhannad, 2010).
Wheat bran is a major by-product of the wheat milling industry used in value added products;
the majority of it is used as animal feed and therefore underutilized. Wheat bran is known to
contain many phytochemicals with numerous health benefits. wheat bran extracts have
greater bioactivity than endosperm wheat extracts, suggesting that this major by-product of
Figure 2.3 Free radicals and disease.
Source: Pearson Education Inc. Publishing as Benjamin Cummings (2005).
18
the flour milling industry is highly nutritious, and contributes to the known health benefits of
wheat for humans. Wheat extracts have shown high antioxidant activity, binding free radicals
to promote healthy aging, and reduce risk of cardiovascular disease, diabetes and obesity, as
well as some forms of cancer. Wheat bran had the highest level of antioxidant activity which
was found by bioassay guided fractionation to be attributed to the unsaturated fatty acids;
linolenic, linoleic and oleic acids (Kelly, 2009).
Wheat bran contains strong antioxidant activity. It may therefore provide protection against
aging, cardiovascular disease, cancer, diabetes and obesity. The amino acid tryptophan was
the prominent cause of the antioxidant activity observed in durum wheat bran. Wheat bran
has been reported to contain 75% of the phytochemicals present in wheat, but the bioactivity
and chemical identity of these phytochemicals is largely unknown (Kelly Marie, 2009).
The antioxidant activity of wheat is derived mainly from the bran layers, with compounds
found in the endosperm playing a minor role. Many studies have assessed wheat antioxidant
activity with speculation on bioactives. A study of antioxidant activity from six milling
fractions including head shorts, tail shorts, low-quality flour, low-grade flour, bran and
control flour, showed that bran possessed the greatest antioxidant activity compared to all
these samples. This is further supported by Adom et al. (2005), who found antioxidant
activity of a bran/germ fraction, from milled fractions of different wheat varieties, had 13–27
fold increase in antioxidant activity compared to the endosperm in the hydrophilic assay
(Kelly Marie, 2009).
Antioxidants in wheat exist in the forms of vitamins (tocopherols – vitamin E), minerals
(selenium), phenolic acids (ferulic acid, vanillic acid), tocotrienols, phytic acid, phytosterols,
flavonoids, and carotenoids (lutein). About 36 Wheat species have widely differing quantities
of antioxidants. Antioxidant content in modern white wheat varieties has tested to be lower
than antioxidant content in modern red wheat varieties. Coffee and tea contain abundant
levels of antioxidants as do wheat and barley kernels. Coffee and tea also naturally contain
caffeine. Coffee and tea substitutes made from wheat and barley have been produced for a
century; however, limited research has gone into the antioxidant benefits from roasted wheat,
or from it’s by products. As the benefits of wheat and barley antioxidants become better
known, the wheat and coffee beverage markets may emerge as well. (Neil et. al, 2012)
Recovery of antioxidant compounds from plant materials is typically accomplished through
different extraction techniques taking into account their chemistry and uneven distribution in
the plant matrix. For example, soluble phenolics are present in higher concentrations in the

19
outer tissues (epidermal and sub-epidermal layers) of fruits and grains than in the inner
tissues (mesocarp and pulp). Solvent extraction is most frequently used technique for
isolation of plant antioxidant compounds. However, the extract yields and resulting
antioxidant activities of the plant materials are strongly dependent on the nature of extracting
solvent, due to the presence of different antioxidant compounds of varied chemical
characteristics and polarities that may or may not be soluble in a particular solvent. Polar
solvents are frequently employed for the recovery of polyphenols from a plant matrix. The
most suitable of these solvents are (hot or cold) aqueous mixtures containing ethanol,
methanol, acetone, and ethyl acetate (Neil et al., 2012).
2.4.2 Wheat germ
Wheat germ, a part of the wheat kernel removed as by-product of the wheat milling industry,
is considered as a natural source of highly concentrated nutrients (Shao and LiYa, 2011). The
wheat germ is a unique source of concentrated nutrients, highly valued as food supplement.
While the oil is widely appreciated for its pharmaceutica,l nutritional and cosmetic value, the
defatted germ meal is a promising source of high-quality vegetable proteins. The germ is only
a very small part of the kernel, approximately 3 percent in total. Wheat germ is very high
(around 28 percent proteins) (Finely, 1989; Bruce, 1997).
The amount of nutrients that are contained within wheat germ seems endless. It contains
more potassium and iron than any other food source. Also found in great quantities are
riboflavin, calcium, zinc, magnesium and vitamins A, B1 and B3. Vitamins B1
and B3are very
important to maintain energy levels and maintain healthy muscles, organs, hair and skin.
Another important vitamin found in wheat germ is vitamin E; which is a very important
antioxidant. It is helpful in preventing the body's aging process and also to prevent heart
disease, helps to prevent blood clots and is needed to strengthen the body’s immune system.
Wheat germ has been found to be very beneficial in order to keep the body in tip top
condition. It is used by athletes in their diet to improve cardiovascular function and improve
endurance levels (Sabate, 1993; Spiller, 1997). Body builders will also add wheat germ to
their diets in order to bulk up and maintain the nutritional levels they need to perform (Neli et
al., 2007).
Wheat germ also contains some relatively functional phytochemicals such as flavonoids,
sterols, octacosanols, and glutathione. It provides three times as much protein, seven times as
much fat, 15 times as much sugar and six times as much mineral content than wheat flour.
20
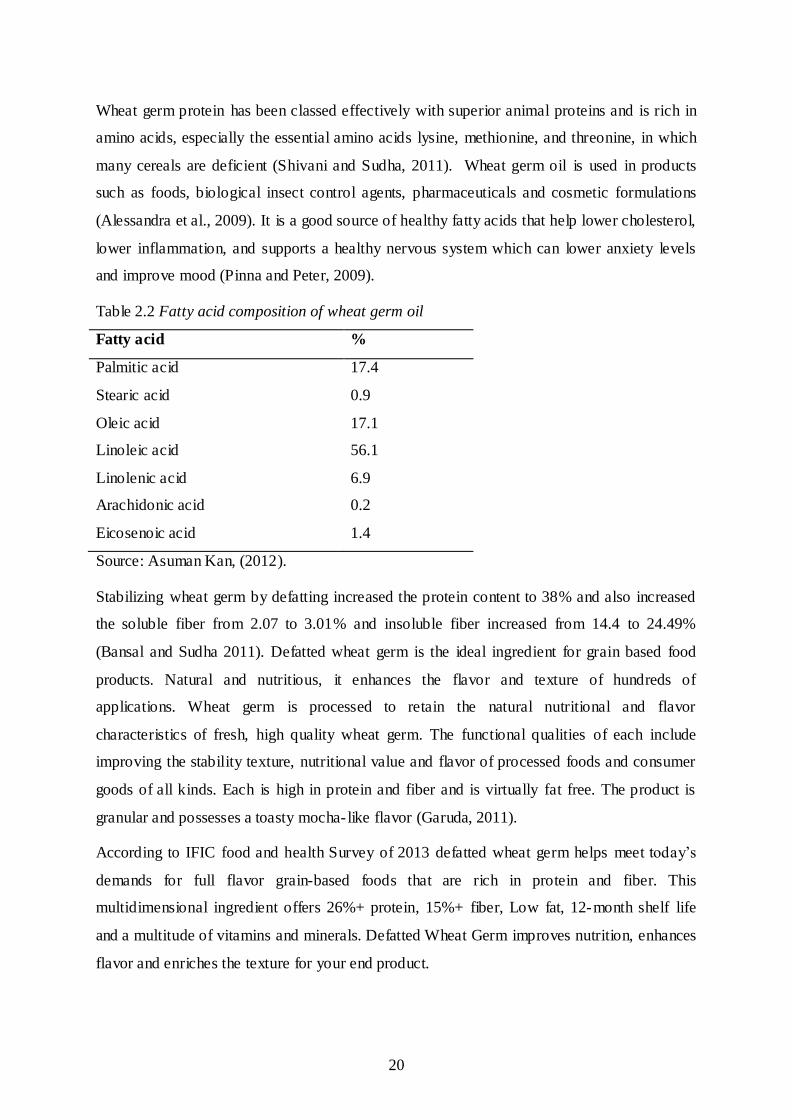
Wheat germ protein has been classed effectively with superior animal proteins and is rich in
amino acids, especially the essential amino acids lysine, methionine, and threonine, in which
many cereals are deficient (Shivani and Sudha, 2011). Wheat germ oil is used in products
such as foods, biological insect control agents, pharmaceuticals and cosmetic formulations
(Alessandra et al., 2009). It is a good source of healthy fatty acids that help lower cholesterol,
lower inflammation, and supports a healthy nervous system which can lower anxiety levels
and improve mood (Pinna and Peter, 2009).
Table 2.2 Fatty acid composition of wheat germ oil
Fatty acid %
Palmitic acid 17.4
Stearic acid 0.9
Oleic acid 17.1
Linoleic acid 56.1
Linolenic acid 6.9
Arachidonic acid 0.2
Eicosenoic acid 1.4
Source: Asuman Kan, (2012).
Stabilizing wheat germ by defatting increased the protein content to 38% and also increased
the soluble fiber from 2.07 to 3.01% and insoluble fiber increased from 14.4 to 24.49%
(Bansal and Sudha 2011). Defatted wheat germ is the ideal ingredient for grain based food
products. Natural and nutritious, it enhances the flavor and texture of hundreds of
applications. Wheat germ is processed to retain the natural nutritional and flavor
characteristics of fresh, high quality wheat germ. The functional qualities of each include
improving the stability texture, nutritional value and flavor of processed foods and consumer
goods of all kinds. Each is high in protein and fiber and is virtually fat free. The product is
granular and possesses a toasty mocha- like flavor (Garuda, 2011).
According to IFIC food and health Survey of 2013 defatted wheat germ helps meet today’s
demands for full flavor grain-based foods that are rich in protein and fiber. This
multidimensional ingredient offers 26%+ protein, 15%+ fiber, Low fat, 12-month shelf life
and a multitude of vitamins and minerals. Defatted Wheat Germ improves nutrition, enhances
flavor and enriches the texture for your end product.

21
2.5 Process description
2.5.1 Process description for wheat flow
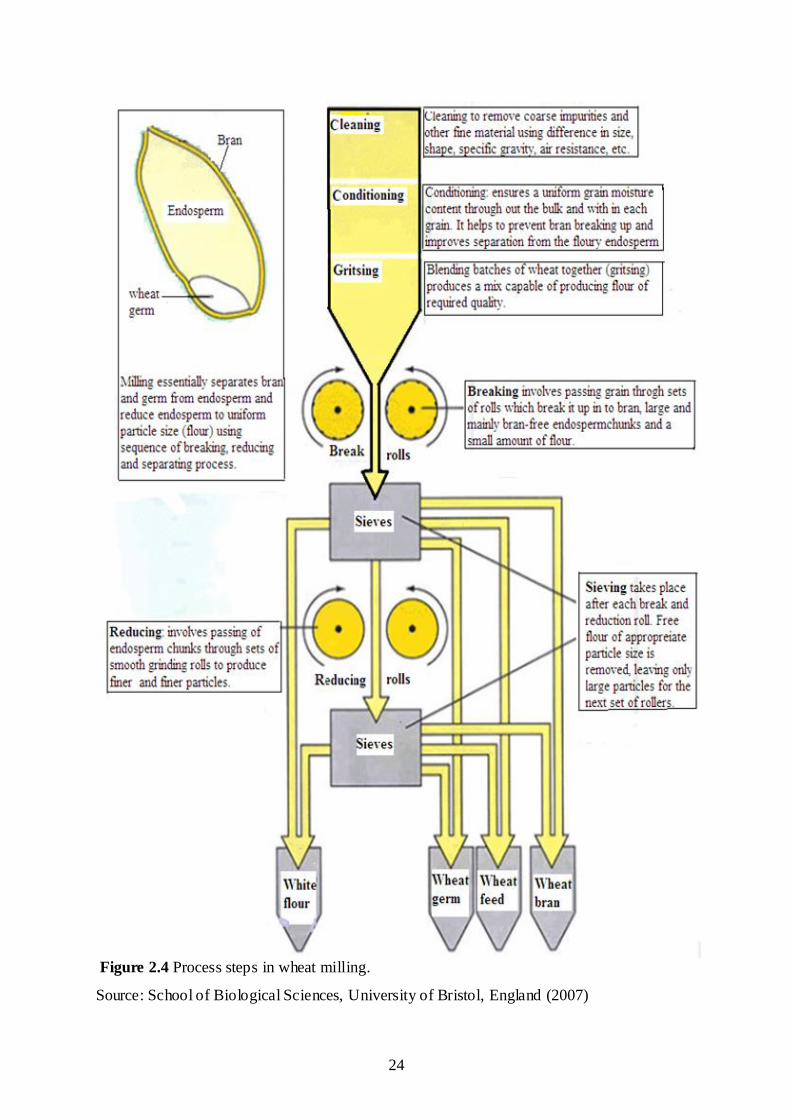
A modern milling operation involves much more than grinding wheat to a powder. Three
general operations are usually involved: cleaning, tempering, and milling. Cleaning removes
unwanted material; tempering softens the grain, making it easier to separate and grind; and
milling involves grinding the wheat and isolating wheat components of a specific size.
i. Cleaning
Wheat unloaded from a truck, into a mill elevator contains a sizable percentage of non wheat
kernel components, termed “dockage.” Dockage consists of other types of seeds,
underdeveloped or unsound wheat kernels, insects, stems, stones, and other debris commonly
found in a wheat field. Before milling, this debris must be removed, and this is accomplished
in the wheat cleaning section of the mill. Although numerous machines exist to clean wheat,
they are all classified based on separation by size, shape, density, and magnetism. Different
mills vary greatly with respect to the order of the operations in a cleaning process. Usually,
one of the first separations removes any ferrous metal in the wheat using magnetic separators.
Removing metal early in the process helps avoid damage to equipment farther downstream.
A milling separator may be next, to remove sticks, stones, stems, and other plant debris.
Lighter, less-dense components in the wheat are removed here via aspiration. Air circulates
upward through the grain as it is fed into the separator, and lighter material is drawn away
from the wheat kernels. The wheat then falls onto a sieve, which allows the wheat to pass
through but retains stones and larger seeds. Another sieve follows which retains the wheat
and allows smaller seeds to pass through.
A disk separator, which separates wheat from other grains of equal density, is also likely to
be included in the cleaning process. This machine separates grains based on shape. Pockets in
rotating disks accept seeds of certain lengths and reject those of other sizes. Generally there is
more than one disk separator. One will accept wheat and another will reject wheat to remove
both larger and smaller grains. Dirt or mold adhering to wheat kernels is largely removed
using a scourer. This machine uses a screen or an abrasive surface to remove any material
adhering to the kernel. Materials such as small stones similar in size to a wheat kernel are
separated based on density in a gravity table or dry stoner. The gravity table is an oscillating
inclined plane. Denser material such as stones moves down the table faster than lighter

22
material. The dry stoner removes the dense material with aspiration sufficient to raise the
grain and allow the stones to drop out.
ii. Tempering:
is the addition of predetermined amounts of water to wheat during specific holding periods. It
toughens the bran, making it easier to separate from the endosperm and germ. It also softens
the endosperm, allowing it to break apart with less force. Tempering involves adjusting the
moisture level of the wheat. For soft wheat, optimal tempering brings the grain to 13.5–
15.0% moisture and takes 6–10 hr. For hard wheat, the final moisture is 15.5–16.5%, and
tempering times are 12–18 hr. Incoming wheat is generally lower in moisture content than
this; hence, water is usually added and the grain is allowed to equilibrate for a period of time.
This time varies considerably based on the hardness of the wheat. Conditioning of wheat
refers to the application of heat in the tempering process to increase the rate of penetration of
moisture into the kernels. Temperatures lower than 50°C are employed during conditioning to
ensure that the functionality of the flour components, especially the gluten, is maintained.
iii. Milling:
At this point, the wheat is ready for milling and starts through the various systems in the
mill. The first machine in almost every mill is the roller mill. Two rolls, one rotating
clockwise and the other counterclockwise, are separated by a small distance called the “gap.”
One of the rolls usually rotates faster than the other one. Consequently, at the nip, due to the
rotation of the rolls the wheat experiences a shearing action as well as a crushing action.
The first roller mills are employed in the break system. This is the part of the milling
operation designed to remove the endosperm from the bran and germ. Rolls in this process
have spiral grooves called “corrugations” cut parallel to the long axis of each roll. Generally
there are about five roller mills or five “breaks” in the system. The germ is removed in the
first two breaks, as is much of the bran. The germ is pliable and tends to flatten when it goes
through the rollers. Bran particles are usually in the form of low-density small flakes. These
properties allow millers to separate the germ and bran fractions from the endosperm fraction.
After each break, a set of sieves and/or purifiers (aspirators) separates the ground material by
size and density.
23
iv. Sieving:
Small particles are channeled into the flour, and large particles are either removed (as is the
case with the germ and bran) or sent to the next break (as occurs for large endosperm pieces).
Once the endosperm is isolated, the large particles that result (called middlings) are reduced
in the reduction system to a particle size distribution consistent with flour. This means they
must be able to pass through a 136-μm opening. The rollers in the reduction system are
smooth and are operated at low differentials, providing a crushing action that yields the fine
particles of flour (although a small amount of shear is still important). A large percentage of
the particles composing the final flour come off the reduction rolls.
Flour from the break and reduction rolls may be combined in many ways to create different
types of flour, but it is usually sifted again in the flour dressing system and passes through
sieves meets the particle size standard for flour. Larger particles are recirculated back to the
appropriate point in the grinding process. The flour may be further treated with chlorine or a
bleaching agent depending on the requirements of the customer. In the mill feed system, the
germ and bran are separated from each other, and adhering endosperm is removed. The
coarse bran from the early breaks is termed “bran” and composes about 11% of the total
products from the mill. The finer branny material from the later steps is called shorts; it
represents about 15% of the total. Germ is generally recovered at the rate of about 2–3.0% of
the total wheat depending on the type of equipment used. These special products or
ingredients for human consumption are usually sold as animal feed in our country. The steps
were shown in Fig 2.4 Process steps in wheat milling.
24
Figure 2.4 Process steps in wheat milling.
Source: School of Biological Sciences, University of Bristol, England (2007)
25
2.5.2 Process description for biscuit production
Defatting process by supercritical fluid extraction
There are several methods for oil extraction that all have their advantages and disadvantages.
Mechanical expression (pressing) and organic solvent extraction are both being used for
commercial extraction of wheat germ oil (WGO). Solvent extraction is by far the most widely
used method to extract oil (Woerfel, 1995).
In recent years supercritical fluid extraction (SFE) has received increased attention as an
important alternative to conventional methods.This is due to regulatory and environmental
pressures on hydrocarbon and ozone-depleting emissions. SCF-based processes have helped
to eliminate the use of hexane and methylene chloride as solvents. With increasing scrutiny
of solvent residues in pharmaceuticals, medical products, and neutraceuticals, and with
stricter regulations on volatile organic compounds (VOC) and ozone depleting compounds
(ODC) emissions, the use of SCFs is rapidly proliferating in all industrial sectors.
Supercritical fluids have adjustable extraction characteristics due to their density, which can
be controlled by changes in pressure or temperature. In addition, other properties such as low
viscosity, high diffusivity and low surface tension enhance the solute mass transfer from
inside a solid matrix. SCFs are advantageously applied to increasing product performance to
levels that cannot be achieved by traditional processing technologies, and such applications
for SCFs offer the potential for both technical and economic success (Sultana, et.al, 2007,
Reverchon et. al., and Lang et.al., 2001).
Supercritical carbon dioxide (SC-CO2), being nontoxic, nonflammable, inexpensive and
easily separable from the extracts, has been the most frequently used extractant in the food
and pharmaceutical industries. Furthermore, the low critical temperature of carbon dioxide
allows extraction of thermolabile compounds without degradation (Alessandra et al., 2009). It
is an efficient extraction method, which is non-explosive and non-toxic, leaving non-solvent
residues. The oils extracted with this method do not need the traditional refining processes. In
addition, SFE is a mild process which can avoid fatty acid oxidation and protein in defatted
wheat germ denaturation. Therefore SFE has received increased attention as a promising
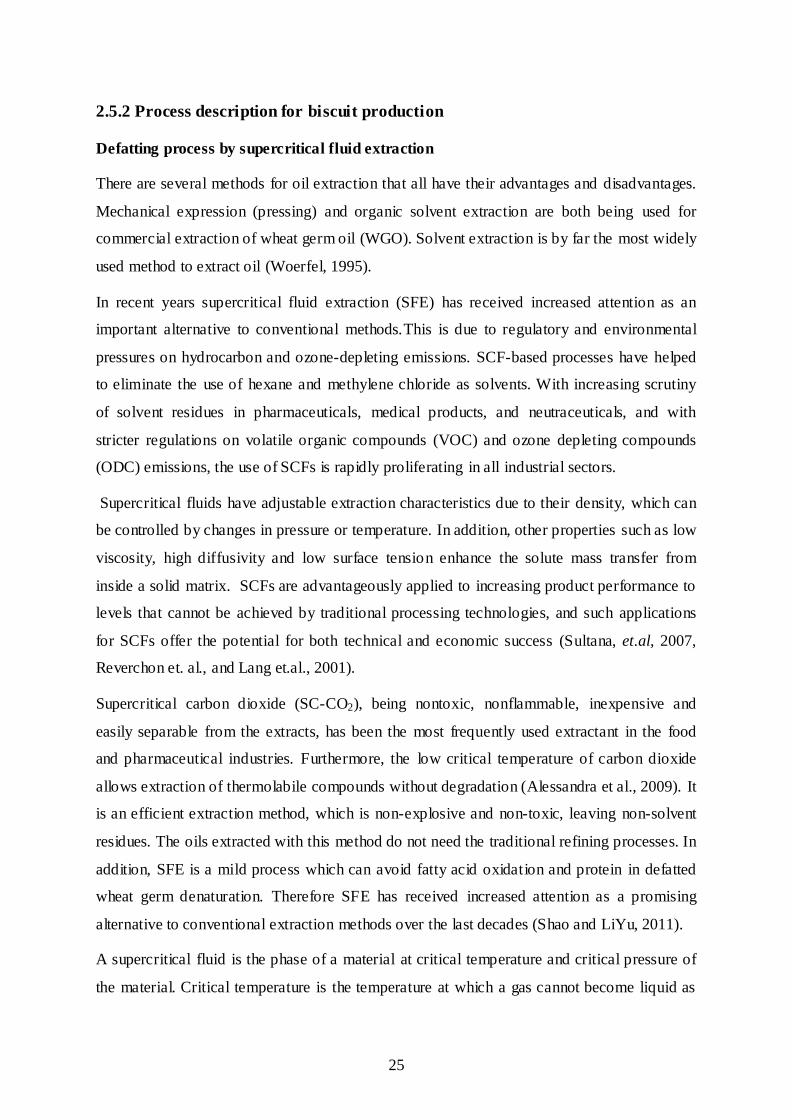
alternative to conventional extraction methods over the last decades (Shao and LiYu, 2011).
A supercritical fluid is the phase of a material at critical temperature and critical pressure of
the material. Critical temperature is the temperature at which a gas cannot become liquid as

26
long as there is no extra pressure; and, critical pressure is the minimum amount of pressure to
liquefy a gas at its critical temperature. Supercritical values for these features take place
between liquids and gases. The formation of a supercritical fluid is the result of a dynamic
equilibrium. When a material is heated to its specific critical temperature in a closed system,
at constant pressure, a dynamic equilibrium is generated. This equilibrium includes the same
number of molecules coming out of liquid phase to gas phase by gaining energy and going in
to liquid phase from gas phase by losing energy. At this particular point, the phase curve
between liquid and gas phases disappears and supercritical material appears (Mustafah and
Andrew, 2013).
There is another characteristic point in the phase diagram; the critical point (CP) is obtained
at critical temperature (Tc) and critical pressure (Pc). After the CP, no matter how much
pressure or temperature is increased, the material cannot transform from gas to liquid or from
liquid to gas phase. This form is the supercritical fluid form. Increasing temperature cannot
result in turning to gas, and increasing pressure cannot result in turning to liquid at this point.
In the phase diagram, the field above Tc and Pc values is defined as the supercritical region.
(Mustafah and Andrew, 2013).
Figure 2.4 Schematic representation of idealized phase diagram.
Source: (http://cnx.org/content/m46150/1.2/)
27
According to thermodynamic research laboratories of university of Illinois’ SCFE is
advantageous:
1. SCFs have solvating powers similar to liquid organic solvents, but with higher
diffusivities, lower viscosity, and lower surface tension.
2. Since the solvating power can be adjusted by changing the pressure or temperature
separation of analytes from solvent is fast and easy.
3. By adding modifiers to a SCF (like methanol to CO2) its polarity can be changed for
having more selective separation power.
4. In industrial processes involving food or pharmaceuticals, one does not have to worry
about solvent residuals as you would if a "typical" organic solvent were used.
5. Candidate SCFs are generally cheap, simple and are safe. Disposal costs are much
less and in industrial processes, the fluids can be simple to recycle
6. SCF technology requires sensitive process control, which is a challenge. In addition,
the phase transitions of the mixture of solutes and solvents have to be measured or
predicted quite accurately. Generally the phase transition in the critical region is
rather complex and difficult to measure and predict. Advantages of Using Carbon
dioxide is the most commonly utilized SCF in SFE machine. It is chemically stable,
has relatively low toxicity, is not flammable, is inexpensive and produces zero surface
tension. Furthermore, it has a mild critical temperature required for extraction of
thermolabile compounds and is separated easily from the sample.
Farinograph analysis
The Farinograph is an apparatus which is commonly used to measure the rheological
properties of dough (Inn, et al., 2007). It measures (as torque) and records the resistance to
mixing of dough as it is formed from flour and water (AACC, 2000). Viscoelastic properties
of wheat dough are the result of the presence of a three dimensional net work of gluten
proteins. The Visco-elastic properties enable dough to retain gas which is essential for
production of baked products with a light texture. Rheological properties such as elasticity,
viscosity and extensibility are important in the prediction of the processing parameters of
dough and quality of end product (Hruskova, 2001). Farinograph results include absorption,
arrival time, stability time, peak time, departure time, and mixing tolerance index.

28
Absorption (%): is the amount of water required to center the farinograph curve on the
500 brabender units (BU) line. This relates to the amount of water needed for a flour to
be optimally processed into end products.
Peak Time (minute) - indicates dough development time, beginning the moment water is
added until the dough reaches maximum consistency. This gives an indication of
optimum mixing time under standardized conditions. It is expressed in minutes.
Arrival Time (minute) - is the time when the top of the curve touches the 500-BU line.
This indicates the rate of flour hydration (the rate at which the water is taken up by the
flour). Arrival time is expressed in minute.
Departure Time (minute) - is the time when the top of the curve leaves the 500-BU line.
This indicates the time when the dough is beginning to break down and is an indication
of dough consistency during processing. Departure time is expressed in minutes.
Stability Time (minute) - is the difference in time between arrival time and departure
time. This indicates the time the dough maintains maximum consistency and is a good
indication of dough strength.
Mixing Tolerance Index (MTI) is the difference in BU value at the top of the curve at
peak time and the value at the top of the curve 5 minutes after the peak. This indicates
the degree of softening during mixing. Mixing tolerance index is expressed in Brabender
units(BU). Weak gluten flour has a lower water absorption and shorter stability time than
strong gluten flour.

29
Preparation of value added cookies
The demand for food and agricultural products is changing in unprecedented ways. The
nature and extent of the changing structure of agri- food demand offer extraordinary
opportunities for diversification and value addition in agriculture, particularly in developing
countries. The prospects for continued growth in demand for value-added food and
agricultural products constitute an incentive for increased attention to agro industries
development within the context of economic growth, food security and poverty-fighting
strategies. Agro- industries, here understood as a component of the manufacturing sector
where value is added to agricultural raw materials through processing and handling
operations are known to be efficient engines of growth and development. With their forward
and backward linkages, agro-industries have high multiplier effects in terms of job creation
and value addition (Carlos and Doyle, 2009).
According to New Brunswick Value-added Food Sector Strategy 2012-2016, any step in the
production process that improves the product for the customer and results in a higher net
worth called value addition. Value-added food sector encompasses companies producing
agriculture and seafood-based products, beverages and other food made from both local and
imported resources. The sector includes live, fresh, frozen, packaged, processed and
preserved food products whose value and profitability has been increased by making them
more appealing and valuable to the buyer.
In Ethiopia, the food-processing sector is by far the largest manufacturing industry and
accounts for 39% of the gross value of production in large and medium size manufacturing in
Figure 2.5 Parameters in Pharinograph representation from manual in Kality Factory (1923).
30
2009/2010 which expected to arouse even more by now. The gross value of production
(GVP) equals 16,220 million Birr (900 million USD), of which small-scale manufacturers
achieve a GVP of 308 million Birr in food processing excluding grain milling, and the grain
millers produce a GVP of 1,113 million Birr. The largest sectors are sugar, bakery, and grain
milling, which together cover about 47% of the total GVP (Soethoudt et. al., 2013).
Increasing awareness of consumers regarding health and nutrition has led to
experimentations for modification and development of bakery products to value added health
foods. This may become a boon for further development of bakery products using low cost,
nutritious ingredients. Among these bakery products cookies/biscuits are popular and well
accepted as snack food. ‘Cookie’ is chemically leavened product, also known as ‘biscuit’
(Uma Ballolli, 2010).
Cookies are textural and flavorful wonders, they are easy to make and usually require no
special equipment. Cookie recipes run the gamut from chic and classic to simple, homespun,
and familiar. Cookies are versatile: They can be huge or miniature, chewy or crisp, filled or
frosted or plain, sweet or savory. They can be round, square or rectangular or take the shape
of animal, vegetable, or mineral. They can be kitschy, chic or both at the same time. Many
welcome variations (John, 2002).
The ingredients of cookies are flour, shortening, eggs, salt, leavening agents, additives,
flavors, liquids, and various other enriching ingredients. Each one of these ingredients has its
own role and function in the preparation of the product (Sumnu and Sahin, 2008). The
importance/ function of ingredients used in cookies making are revealed below:
Fat is added for flavor and controls how chewy or crunchy the cookie is. More fat is a
chewier cookie, less fat is a crunchier cookie. Options for fat are butter, margarine,
shortening, or oil. Since shortening melts at a higher temperature, it is the best choice if one
wants to keep spreading to a minimum. Shortening, butter, and margarine are all fats. But not
all fats are created equal when it comes to baking cookies. Fats are used in cookies to:
tenderize and soften the texture, ad moistness and richness, increase the keeping quality, add
flavor, assist in leavening when used as a creaming agent
Sugar is a sweetener (obviously!) and tenderizer, while controlling how much the cookie
spreads. Using white sugar will result in a crispier cookie, while brown sugar will help
retain moisture, making cookies chewier. Adding sugar increases the spread of a cookie, so
cookies with less sugar will be puffier.

31
Flour is a stabilizer and thickener and controls how much the cookie rises. It holds the cookie
together, providing it with its structure. If too little flour used cookie won’t keep its shape but
if one use too much you’ll end up with a thick tasteless cookie. Also, different types of flour
result in different cookie textures. All-purpose flour is the standard flour used most often.
Dough may have a ratio of 1:6 or higher and might be used for cookies or pastry dough.
Rising agent or leavener most commonly used is either baking soda or baking powder. If
baking soda used, recipe must include another acidic ingredient, like sour cream, lemon juice,
or buttermilk. On the other hand, baking powder has its own built in acid. Baking soda
increases browning and spreading, resulting in a flatter cookie. Baking powder will give a
puffier cookie.
Binding agents are the liquid in the recipe that hold the cookie together. Examples of binding
agents are eggs, milk, honey, and fruit juice. Cookies with more eggs will rise more and
spread less.
Salt, Spices, Flavorings, and Extracts / additives Salt is used to bring out flavor of many
foods, including sweet cookies while Spices, flavorings, and extracts add flavor to the
cookies. Usually these are added in small amounts.
2.6 Sensory quality attributes
Human accepts food on the basis of certain characteristics that he/she defines and perceives
with his/her senses. These attributes are described in terms of sensations and sometimes
referred as qualitative or sensory qualities. They include perception of appearance factors
such as color, size, shape and physical aspects; kinesthetic factors such as texture, viscosity,
consistency, finger feel and mouth feel; and flavor factors or sensations combining odor and
taste. Human judges are used to measure sensory characteristics of food. Sensory analysis is
too commonly often overlooked as a requirement before product launched. Similarly in this
research work sensory data such as appearance, color, smell, taste, texture aroma and mouth
feel are obtained through subjective evaluation by panelists.
Color and other aspects of appearance influence: Color is a quality factor that greatly
influences the appearance of a product. There are five functions that should be
considered in understanding human reactions to color in foods are (perception,
motivation, emotion, learning and thinking). The human eye has remarkably fine
qualitative discrimination for color, but it is not quantitative instrument. Appearance
refers to the size, shape together with defects and color are appearance factors that
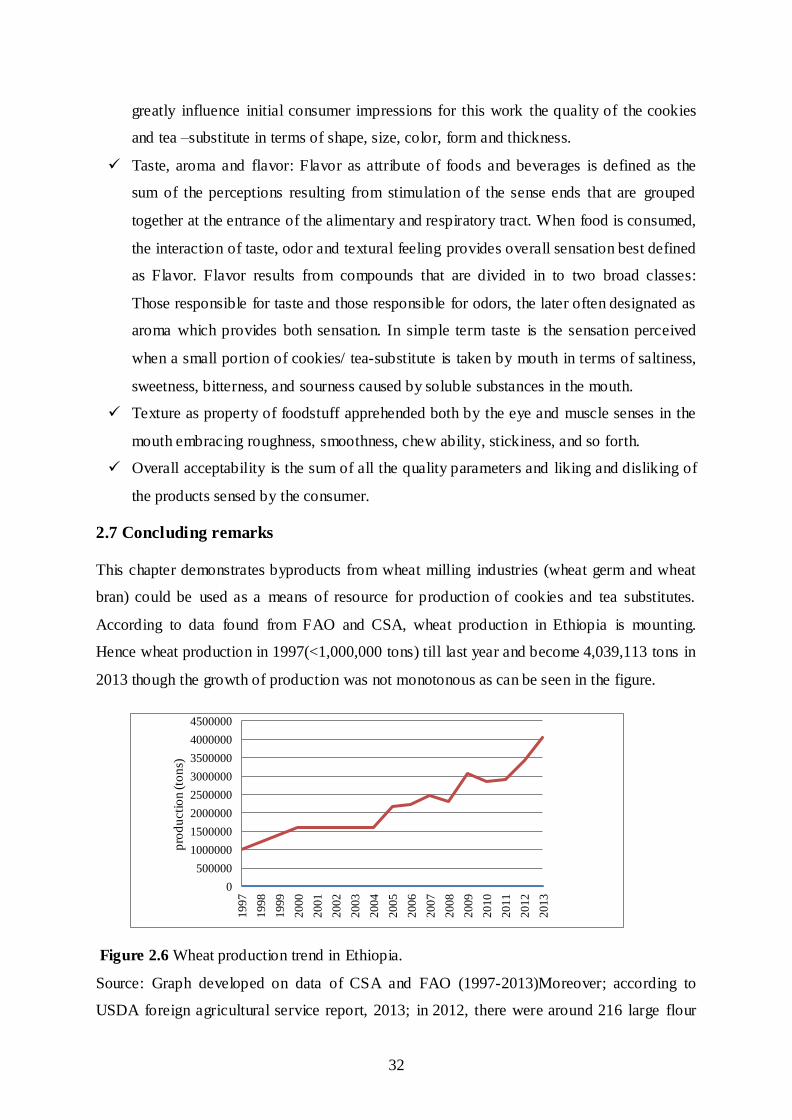
32
greatly influence initial consumer impressions for this work the quality of the cookies
and tea –substitute in terms of shape, size, color, form and thickness.
Taste, aroma and flavor: Flavor as attribute of foods and beverages is defined as the
sum of the perceptions resulting from stimulation of the sense ends that are grouped
together at the entrance of the alimentary and respiratory tract. When food is consumed,
the interaction of taste, odor and textural feeling provides overall sensation best defined
as Flavor. Flavor results from compounds that are divided in to two broad classes:
Those responsible for taste and those responsible for odors, the later often designated as
aroma which provides both sensation. In simple term taste is the sensation perceived
when a small portion of cookies/ tea-substitute is taken by mouth in terms of saltiness,
sweetness, bitterness, and sourness caused by soluble substances in the mouth.
Texture as property of foodstuff apprehended both by the eye and muscle senses in the
mouth embracing roughness, smoothness, chew ability, stickiness, and so forth.
Overall acceptability is the sum of all the quality parameters and liking and disliking of
the products sensed by the consumer.
2.7 Concluding remarks
This chapter demonstrates byproducts from wheat milling industries (wheat germ and wheat
bran) could be used as a means of resource for production of cookies and tea substitutes.
According to data found from FAO and CSA, wheat production in Ethiopia is mounting.
Hence wheat production in 1997(<1,000,000 tons) till last year and become 4,039,113 tons in
2013 though the growth of production was not monotonous as can be seen in the figure.
Figure 2.6 Wheat production trend in Ethiopia.
Source: Graph developed on data of CSA and FAO (1997-2013)Moreover; according to
USDA foreign agricultural service report, 2013; in 2012, there were around 216 large flour
0
500000
1000000
1500000
2000000
2500000
3000000
3500000
4000000
4500000
1997
1998
1999
2000
2001
2002
2003
2004
2005
2006
2007
2008
2009
2010
2011
2012
2013
pro
du
cti
on
(to
ns)
33
mills in Ethiopia with a total of 4.2 million tons of milling capacity of flour per year; which is
expected to increase in number by now. The wheat consumption trend in Ethiopia is
gradually increasing in urban areas due to high population growth (about 2.6 percent a year),
migration of people to urban areas, and changes in life styles. Amount of byproducts from
milling industries is about (25-35) %; which can result more than 11 million quintals of
byproducts per year. The above facts show byproducts of wheat milling industries can be
used as means of resource without short supply throughout a year.
Milling industries in developed countries; use a source of enrichment for the final refined
white flour either directly by adding mineral and vitamins to the last product or by using
different wheat byproduct flours as a source of enrichment. This is done because they are
fully aware of wheat flour alone is nutritionally incompetent for daily use. Hence, developing
countries like Ethiopia show more scarcity in wheat and deficient it’s better to use byproducts
for human use rather than as animal feed. In view of the fact that defatted wheat germ flour
can be used as a supplement for the newly developed cookie; due to its high quality nutrition
content in protein, fiber, minerals. Similarly, from the s tudies wheat bran showed higher
amount of antioxidant activity.
A conclusion from studies establishes basic ideas and possibilities, which can be favorable to
support the development of wheat milling industries to use their own byproducts as a
resource. Apart from utilizing byproducts as a resource, minimizing agricultural waste for
production of new products to human better usage is something.
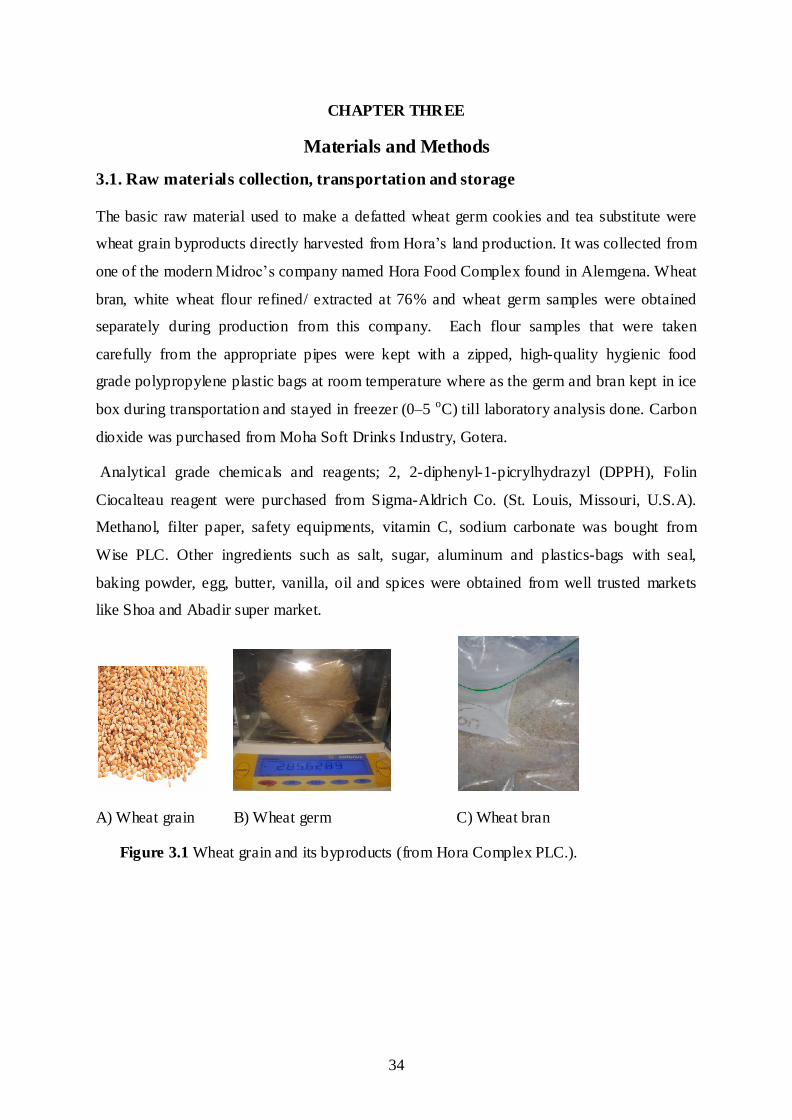
34
CHAPTER THREE
Materials and Methods
3.1. Raw materials collection, transportation and storage
The basic raw material used to make a defatted wheat germ cookies and tea substitute were
wheat grain byproducts directly harvested from Hora’s land production. It was collected from
one of the modern Midroc’s company named Hora Food Complex found in Alemgena. Wheat
bran, white wheat flour refined/ extracted at 76% and wheat germ samples were obtained
separately during production from this company. Each flour samples that were taken
carefully from the appropriate pipes were kept with a zipped, high-quality hygienic food
grade polypropylene plastic bags at room temperature where as the germ and bran kept in ice
box during transportation and stayed in freezer (0–5 oC) till laboratory analysis done. Carbon
dioxide was purchased from Moha Soft Drinks Industry, Gotera.
Analytical grade chemicals and reagents; 2, 2-diphenyl-1-picrylhydrazyl (DPPH), Folin
Ciocalteau reagent were purchased from Sigma-Aldrich Co. (St. Louis, Missouri, U.S.A).
Methanol, filter paper, safety equipments, vitamin C, sodium carbonate was bought from
Wise PLC. Other ingredients such as salt, sugar, aluminum and plastics-bags with seal,
baking powder, egg, butter, vanilla, oil and spices were obtained from well trusted markets
like Shoa and Abadir super market.
A) Wheat grain B) Wheat germ C) Wheat bran
Figure 3.1 Wheat grain and its byproducts (from Hora Complex PLC.).

35
3.2 Frame work of the research experiment
Figure 3.2 Frame work of the research experiment.
Defatted wheat germ
flour
Flours from wheat
milling Industries
Wheat bran Wheat flour Wheat germ
Proximate composition Analysis Extraction using
methanol
Defatting Wheat
germ flour process
by SFE
Farinogram Analysis and
Functional property analysis
(OAC, WAC, BD)
Blending flours
(WF & DWGF)
Determining total
phenolic content by Folin-
Ciocalteau assay and
antioxidant by DPPH
Tea substitute
WF BR1 BR2 BR3
- Mixing
- Kneading
- Cutting
- Baking
- Cooling
- Packing
Cookies
Produced
Sensory
quality
evaluation
Proximate composition
Analysis
Analysis of physical properties
(diameter, height, and weight)

36
3.3 Methods of processing
3.3.1 Preparation of defatted wheat germ flour
Raw wheat germ carefully selected and cleaned to remove contaminants. According to the
method described by Zhu and Zhou, (2005), the enzymes in the raw wheat germ were
inactivated by heating for 30 minutes at 105°C. Wheat germ samples were loaded into the
extraction vessel carbon dioxide from a cylinder was passed through a chiller kept at 2°C and
pumped into the extractor by a high pressure pump.
Raw wheat germ was defatted by using supercritical fluid extractor machine that is found in
AAiT’s Laboratory. According to methods by Alessandra et. al, 2009 and Shao and LiYa,
2011 the machine operated to defat wheat germ at pressure of 300 bar; temperature of 40°C;
CO2 flow rate of 20kg/h. Then the defatted wheat germ flour milled by coffee machine the
flour passed through a 250µm sieve diameter. Finally the flour stored in freezer (0-40C); after
extraction, the oil was collected separators while water and volatile components were
recovered. The extracted oil obtained was together with iced form water separated using
separatory funnel. The oil collected looks like as shown below:
(a) (b)
Figure 3.3 Oil obtained by defatting wheat germ flour (WGF) by supercritical fluid extractor
(SFE) before and after separation by using separatory funnel.
(a) Before separation by separatory funnel (b) after separation by separatory funnel
The extracted oil from the wheat germ is not pure oil form instead (icy form) latter melted in
to water and the oils float above. Separatory funnel is used in order to separate the oil from
the water part as shown in figure.
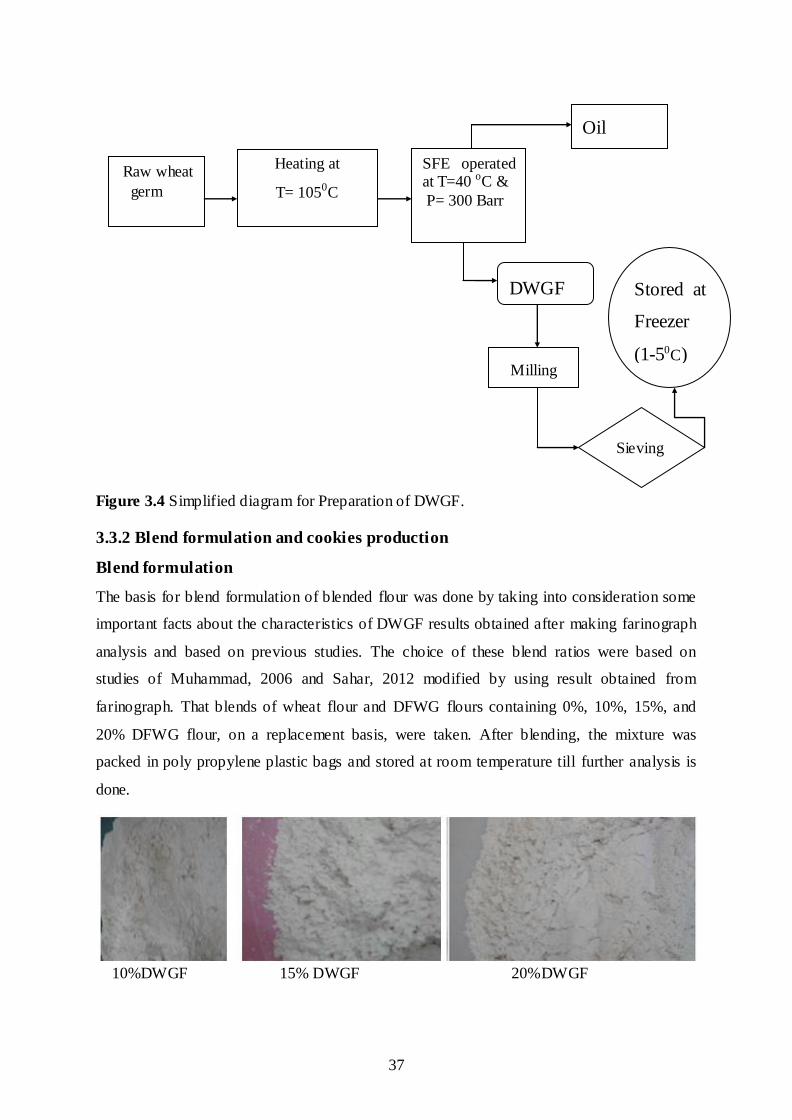
37
Figure 3.4 Simplified diagram for Preparation of DWGF.
3.3.2 Blend formulation and cookies production
Blend formulation
The basis for blend formulation of blended flour was done by taking into consideration some
important facts about the characteristics of DWGF results obtained after making farinograph
analysis and based on previous studies. The choice of these blend ratios were based on
studies of Muhammad, 2006 and Sahar, 2012 modified by using result obtained from
farinograph. That blends of wheat flour and DFWG flours containing 0%, 10%, 15%, and
20% DFWG flour, on a replacement basis, were taken. After blending, the mixture was
packed in poly propylene plastic bags and stored at room temperature till further analysis is
done.
10%DWGF 15% DWGF 20%DWGF
Raw wheat
germ
SFE operated at T=40 oC &
P= 300 Barr
Oil
Stored at
Freezer
(1-50C)
DWGF
Heating at
T= 1050C
Milling
Sieving

38
100% DWGF Control (100%Wheat flour)
Figure 3.5 Blended flours, defatted wheat germ flour and control flour.
Table 3.1 Percentage composition of blended flour for cookies
Flour blend Wheat flour (%) DWGF (%)
BR-0/control/WF 100 -
BR-1 90 10
BR-2 85 15
BR-3 80 20
Cookies production
Cookies were prepared according to the procedure described by (Taha et al., 2006) with some
modifications on type and amount of spices added. The basic ingredients used were 110 g of
flour blend, 29g shortening, 34 g of sugar, 13 g of beaten whole egg, and 1.1 g of baking
powder, 1.5 g of salt, 1.2 g vanilla, 2 g cinnamon, 1g clove, 0.6 g ginger and 5.3gm water.
First, dry ingredients were weighed and mixed thoroughly in a bowl by hand for 3–5 min.
The shortening, sugar and egg creamed together was added to the mixed dry ingredients and
rubbed in until uniform. The dough was sheeted using Lasagna sheeting machine with a
uniform thickness (5 mm) and cut out using a round cutter of diameter 45mm. The cut out
dough pieces were baked on lightly greased pans at baking temperatures 150, 180 and 210 oC
for 10-12 minutes in a baking oven. The prepared cookies were cooled to room temperature
and packed in polyethylene bags.
39
3.4 Methods of analysis
3.4.1 Analysis of proximate composition
Proximate chemical composition analysis such as moisture content, total ash, crude protein,
crude fat, and crude fiber of raw materials and finished products were carried out according
to AOAC (2000) official methods 925.09, 923.03, 920.87, 450.1 and 962.09 respectively.
Determination of moisture content
Moisture content was determined according to AOAC, (2000) using the official method
(925.09). Empty dishes and their lids (made of porcelain) was dried using drying oven for 1
hour at 100oC and cooled for 30 minute in the desiccators (with granular silica gel). A clean
dried and covered dish was weighed and about 5gm of the sample was transferred to the dish
(W1). The dish then placed in the oven at 100oC for 5hrs and cooled in desiccators and re-
weighed (W2). Then, the moisture content on wet basis estimated by the formula:
Moisture content in percent (%) =
Eq. (3.1)
Where: W1 = weight of fresh sample (g), W2 = weight of dry sample (g)
Determination of total ash
The ash content was determined by using AOAC, (2000) the official method (923.03). About
2.5g of sample was added into each dish. The dishes were placed on a hot plate under a fume-
hood and the temperature was slowly increased until smoking ceases and the samples become
thoroughly charred. The dishes (crucibles) were placed inside the muffle furnace at 550oC for
6 hr, and removed from the muffle and then placed in desiccators for 1hr to cool. Finally
weight of total ash was calculated by difference and expressed as percentage using the
formula:
Total Ash (%) =
Eq. (3.2)
Where: W1 = Weight in grams of the crucible with the sample
W2 = Weight in grams of the crucible plus ash
W = Weight in grams of empty crucible
Determination of crude protein
Crude protein was determined by Kjeldahl method according to (AOAC, 2000) using the
official method (920.87). About 1.0 gm of fresh samples were taken in a Tecator tube and
6ml of acid mixture (5parts of concentrated orthophosphric acid and 100 parts of
40
concentrated sulfuric acid) was added, mixed, thoroughly and 3.5ml of 30% hydrogen
peroxide was added step by step. As soon as the violent reaction had ceased, the tubes were
shaken for a few minutes and placed back into the rack. A 3.00g of the catalyst mixture
(ground 0.5g of selenium metal with 100g of potassium sulfate) was added into each tube,
and allowed to stand for about 10min. before digestion. When the temperature of the digester
reached 370oC, the tubes were lowered into the digester. The digestion was continued until a
clear solution was obtained for about 1h. The tubes in the rack was transferred into the fume
hood for cooling, 15ml of deionized water was added, and shaken to avoid precipitation of
sulfate in the solution.
Then, 250ml conical flask containing 25ml of the boric acid-indictor solution was placed
under the condenser of the distiller with its tips immersed into the solution. The digested and
diluted solution was transferred into the sample compartment of the distiller. The tubes were
rinsed with two portions of about 5ml de- ionized water and the rinses were added into the
solution. A 25ml of 40% sodium hydroxide solution was added into the compartment and
washed with a small amount of water, stopped and the steam switched on. About 100ml
solution of the sample was distilled, and then the receiver was lowered so that the tip of the
condenser is above the surface of the distiller. The distillation was continued until a total
volume of 150ml is collected. The tip was rinsed with a few milliliter of water before the
receiver was removed. Finally, the distillate is titrated with standardized 0.1N sulphuric acid
to a reddish color. The percent total nitrogen and crude protein were calculated us ing
equation (3.3).
Nitrogen (%) =
Eq. (3.3)
Where: N = Normality of standard sulfuric acid (0.1N).
T = Volume in ml of standard sulfuric acid solution used in the titration for the test material.
B = Volume in ml of standard sulfuric acid solution used in the titration for the blank
determination.
W = sample weight on dry matter basis and 14.007 is the molecular weight of nitrogen.
Crude protein content percent per weight = Total Nitrogen * universal conversion factor
N.B: The % of nitrogen is converted to % of protein by using appropriate conversion factor
i.e., (6.25 for biscuits, 6.31 for bran and 5.7 used for flour) according to Jones, (1941).
41
Determination of crude fat
Crude fat was determined based on the Sohxlet extraction method of AOAC (2000) using
official method 920.39. A 250 ml quick fit round bottom flask was washed and dried in an
oven (Gallenkamp, model OV 880, England) at 105°C for 25 minutes and allowed to cool to
room temperature before it was weighed. A clean and dried muslin thimble containing about
5 g of dried sample and covered with fat free cotton at the bottom and top was placed in the
extraction chamber. 2.0g of the samples were weighed into the thimble. This was inserted
into the extraction column with the condenser connected. 200ml of the extracting solvent
(petroleum ether, boiling point 40-60°C) was poured into the round bottom flask and fitted
into the extraction unit. The flask was then heated with the aid of electro-thermal heater at
60°C for 8 hrs.
Losses of solvent due to heating were checked with the aid of the condenser so that it cooled
and refluxed the evaporated solvent. After extraction, the thimble was removed and the
solvent salvaged by distillation. The flask containing the fat and residual solvent was placed
on a water bath to evaporate the solvent followed by a further drying in an oven
(Gallenkamp, model: OV 880, England, 1974) at 105°C for 30 minutes to completely
evaporate the solvent. It was then cooled in desiccators and weighed. The flask containing the
extracted fat was dried on a steam bath at 98ºC to a constant mass. The fat obtained was
expressed as a percentage of the initial weight of the sample using the formula.
Crude fat, % by weight =
Eq. (3.4)
Where: W1 = weight of the extraction flask (g),
W2= weight of extraction flask plus the dried crude fat (g), and
W= weight of samples (g)
Determination of crude fiber
Crude fiber was conducted using the method of AOAC, (2000) official method (962.09).
About 1.6g of fresh sample was placed into a 600ml beaker, 200ml of 1.25% sulfuric acid
was added, and boiled gently exactly for 30 minutes placing a watch glass over the mouth of
the beaker. During boiling, the level of the sample solution was kept constant with hot
distilled water. After 30 minute boiling, 20ml of 28% KOH was added and boiled gently for
further 30 minute, with occasional stirring. The solution was poured from beaker into sintered
glass crucible and then the vacuum pump was turned on. The wall of the beaker was rinsed
42
with hot distilled water several times; washing were transferred to crucible, and filtered. The
residue in the crucible was first washed with hot distilled water and filtered and then it was
washed with 1% H2SO4 and filtered. Secondly the residue was washed with hot distilled
water and filtered; and again washed with 1% NaOH and filtered. Finally the residue was
washed with water- free acetone. The crucible with its content dried for 2 hr in an electric
drying oven at 130 0C and cooled for 30 min in the desiccators (with granular silica gel), and
then weighed. The crucible was transferred to a small muffle furnace and incinerated for 30
min at 5500C. The crucible was cooled in the desiccators and weighed.
) =
Eq. (3.5)
Where: W1 = dried weight of crucible
W2 = Weight of crucible after ashing
W3 = dried weight of sample
M = % moisture of the sample
Determination of total carbohydrates
Total carbohydrates of the samples including crude fiber were determined by subtraction:
(3.6)
Energy calculation (kcal/100gm)
Energy content was obtained by multiplying the mean values of crude protein, crude fat and
total carbohydrate by the Atwater factors of 3.91, 9, 4.12 respectively, taking the sum of the
products and expressing the result in kilocalories per 100 g sample as reported by Edem et
al., (1990) and Onyeike et al., (1995). The formula for calculating energy is shown below.
Eq. (3.7)
Minerals analysis
Calcium and Magnesium
Calcium and Magnesium were determined using AOAC (1998) official method (985.35).
They were quantifying by atomic absorption spectrophotometric method. About 25 ml
composite aliquot was placed in previously cleaned evaporating dish. Then the aliquot was
dried in oven at 1000C for overnight. After completion of drying it was heated on hot plate
until smoking cease. Next the dish was placed in furnace at 5250C to obtain ash of white and
free from carbon for 4 hrs. Then dish was removed from the furnace and cooled. Following
this H2O and 2ml of HNO3 was added, dried on hot plate and the dish was returned to 5250c

43
furnace for 2hrs. After that the ash was dissolved in 5ml 1N HNO 3 and warmed on steam bath
for 3 min to aid in solution. Next add solution to 50ml volumetric flask with 1 N HNO3 and
repeated with 2 additional portion of 1N HNO3. Lanthanum Chloride (LaCl) solution was
added to final dilution of each standard then solution was tested to make 0.1% (W/V) La.
Blanks were prepared to represent all reagents and glassware. Then calibration curve was
prepared (concentration Vs absorbance) to determine each mineral using wave length and
flame specified in the table. Finally determine concentration of each mineral from its
calibration curve, and calculate the values using the following relation:
Eq. (3.8)
Where: W = Weight of the sample (g), V = Volume of the extract (ml), A = Concentration
(µg/ml) of sample solution and B = Concentration (µg/ml) of blank solution
Phosphorous determination
Phosphorous was determined by the colorimetric method using ammonium molybdate
(AOAC, 1984) using the official method (965.17). It was converted to phosphomolybdate,
which was reduced to a blue molybdenum compound. A sample solution was obtained from
mineral analysis. About 1 ml of the clear extract was taken from the sample solution and
diluted to 100ml with deionized water in a 100 ml volumetric flask. A 5ml (duiplicate) of the
sample dilution was added into test tubes. A 0.5 ml of molybdate and a 0.2ml
aminonaphthosulphonic acid was added into the test tube (sample solution) and mixed
thoroughly step by step. A 0.2 ml amino naphtholsulphonic acid was added into the test tube
repeatedly each time until the solution become clear. The solution was allowed to stand for
10min. The absorbance (reading A) of the solution was measured at 660 nm against distilled
water. Simultaneously with sample phosphorous, standard and blank analysis were carried
out. Standard and blank solutions were prepared as above but 5ml of working standard
(reading As) and 5ml of de- ionized water (reading AB) in place of the sample dilution were
used respectively. A standard curve was made from absorbance versus concentration and the
slope was used for calculation. First AB subtracted from all other readings
Eq. (3.9)
Where: A = reading of the sample solution; AB = reading of the blank solution; WF = weight
of fresh sample.

44
Potassium
Potassium was determined using AOAC (1998) official method (969.03) by using flame
absorption photometric. About 4 g sample was added into crucible and char on over flame.
Then it was placed in cold furnace at temperature of 525 oC and ashed for 2 hrs. Then 15 ml
of dilute HNO3 was added to crucible and it was filtered into 100 ml volumetric flask
through acid- washed quantitative paper. Then residue was washed with H2O. Next it was
diluted for direct readout as follows: about 1 ml aliquot was placed in 25 ml volumetric flask
and dilute to volume with H2O. At the same time blank solution was prepared by diluting 2
ml HNO3 to 100 ml with H2O. Finally read the blank, standards, and samples at 767 nm until
results were reproduced; record % T or absorption for each and Convert % absorption to
absorbance (A). At last standard curve was plotted A against concentration. Finally read
unknown concentrations from the curve and determine the values by the following relation:
Eq. (3.10)
Determination of rheology property of flours
A 300g of each blended and control flours were prepared and placed into the corresponding
farinograph mixing bowl. Water from a burette was added to the flour and mixed to form
dough. As the dough was mixed, the farinograph recorded a curve on graph. The amount of
water added (absorption) affects the position of the curve on the graph paper. Less water
increases dough consistency and moves the curve upward. The curve is centered on the 500-
Brabender unit (BU) line ±20 BU by adding the appropriate amount of water and is run until
the curve leaves the 500-BU line.
Functional properties of flour
Water and oil absorption capacity
Water and oil absorption capacity of flour was determined with the method reported by
Anderson et al.,(1969) as cited by Sukhcharn et al., (2008). Five gram flour of each sample
was weighed into a centrifuge tube and 30 ml of distilled water or oil was then added and
mixed thoroughly. This was allowed to stand for 30 min and centrifuged at 3,000 rpm for 15
min. The supernatant was then decanted and the sample weighed again. The amount of water
or oil retained in the sample was recorded as weight gain and was taken as water or oil
absorbed. The results were expressed as weight of water absorbed in grams per gram dry
matter of the sample.
Bulk density
45
The bulk density of the composite flour was analyzed according to the method stated by
Oladele and Aina (2007) in which a mass of 50 g of the sample was put in to a 100 ml
measuring cylinder. The cylinder was tapped continuously until a cons tant volume was
obtained. The bulk density was then calculated as weight of the grounded flour (g) divided by
its volume (ml).
Determination of physical properties of cookies
For the determination of diameter (width), thickness and spread factor, AACC (1995)
methods were followed.
Diameter
To determine the diameter (D), six cookies were placed edge to edge. The total diameter of
the six cookies was measured in cm by using a ruler. The cookies were rotated at an angle of
90 for duplicate reading. This was repeated once more and average diameter was taken in
centimeter.
Thickness
To determine the thickness (height), six cookies were placed on top of one another. The total
height was measured in millimeters with the help of ruler. This process was repeated twice to
get an average value and results were taken in mm.
Spread ratio
Spread ratio was determined by dividing the diameter to height of cookies.
3.5 Analysis of antioxidant activity and total phenolics
3.5.1 Sample extraction
Method used by (David, 2006, Bushra et al., 2009 and Barinderjit et al., 2012) with some
modification used for extraction. Ten grams of grounded fine bran weighed using an
aluminum foil and transferred in to a beaker. 40 ml methanol was added in a beaker. The
beakers were capped, placed in water bath at (40, 60 and 80 0C) for 20 min and were shaken
twice, while it’s inside the water bath. Finally, incubator shaker used to extract effectively.
Then the solvent layer from each test tube was separated by centrifugation at 5000rpm for 14
min. The residue was then extracted with two additional 20 ml portions of solvent as
described above. And the re-dissolved sample by the respective solvents used then passed
through what man No. 4 paper. The combined extracts were put below 50 0C in thermostat
oven. The separated solvent supernatant with the bioactive compounds in it was transferred to
clean, previously weighed and labeled test tube. Beaker cleansed, dried, weighted and made
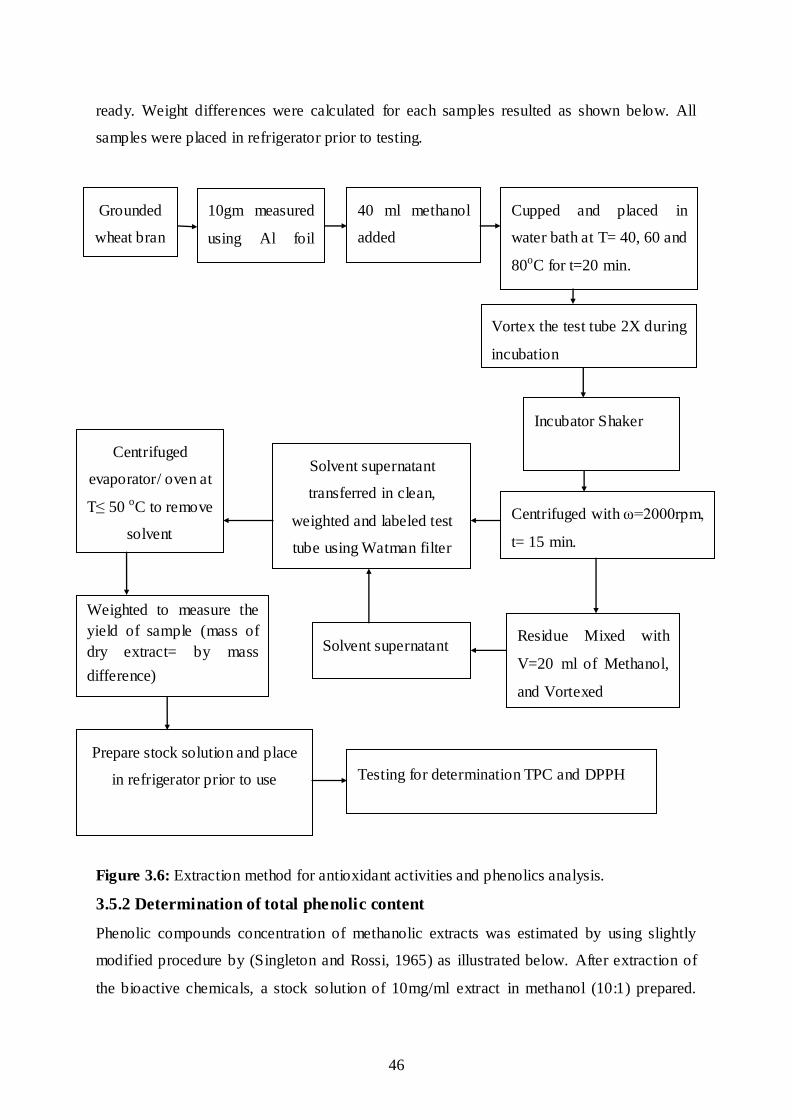
46
ready. Weight differences were calculated for each samples resulted as shown below. All
samples were placed in refrigerator prior to testing.
Figure 3.6: Extraction method for antioxidant activities and phenolics analysis.
3.5.2 Determination of total phenolic content
Phenolic compounds concentration of methanolic extracts was estimated by using slightly
modified procedure by (Singleton and Rossi, 1965) as illustrated below. After extraction of
the bioactive chemicals, a stock solution of 10mg/ml extract in methanol (10:1) prepared.
10gm measured
using Al foil
added to beaker
40 ml methanol
added
Cupped and placed in
water bath at T= 40, 60 and
80oC for t=20 min.
Vortex the test tube 2X during
incubation
Centrifuged with ω=2000rpm,
t= 15 min.
200
Residue Mixed with
V=20 ml of Methanol,
and Vortexed
Solvent supernatant
transferred in clean,
weighted and labeled test
tube using Watman filter
paper
Centrifuged
evaporator/ oven at
T≤ 50 oC to remove
solvent
Solvent supernatant
Weighted to measure the
yield of sample (mass of
dry extract= by mass
difference)
Prepare stock solution and place
in refrigerator prior to use
Testing for determination TPC and DPPH
Incubator Shaker
Grounded
wheat bran
47
Then 1ml stock solution taken and diluted by 1ml methanol to have 2ml total volume, but the
concentration is diluted by half i.e. 5mg/ml. 1ml of Folin-Ciocalteu and 1ml of 7% of sodium
carborbonate added. The samples were vortexed for 3 min before sodium carbonate added.
Finally, 7ml water added to the sample then vortexed for the last time before absorption read.
Incubated for 90 minutes and spectrophotometer read at an absorbance of 725nm model
(Perkin Elmer Lamda 950 UV/Vis/NIR). First Gallic acid calibration curve standard is
required, so absorption for the gallic acid done in place of extract till R2 ≥0.98 achieved. All
phenolic compounds carried out in triplicate. Total phenolic content was expressed as mg
gallic acid equivalents (GAE)/100g weight. The total content of phenolics in wheat bran
extracts in gallic acid equivalent was calculated by the following formula:
Eq. (3.11)
Where TPC is the total content of phenolic compounds, mg/g fresh material, in GAE; C is the
concentration of gallic acid established from the calibration curve (Absorbance = 0.0134
gallic acid /g – 0.0144, R2 = 0.9918); V the volume of extract (L); m is the weight of extract
the concentration of gallic acid established from the calibration curve.
3.5.3 Determination of free radical scavenging activity
The effect of methanolic extracts on the DPPH radical was estimated according to Kirby and
Schmidt (1997). A 0.004% solution of DPPH radical solution in methanol was prepared and
then 4 ml of this solution was mixed with 1 ml of various concentrations (2– 14 mg/ml) of the
extracts in methanol. Finally, the samples were incubated for 30 min in the dark at room
temperature. Scavenging capacity was read spectrophotometrically model (Perkin Elmer
Lamda 950 UV/Vis/NIR) by monitoring the decrease in absorbance at 517 nm. The
maximum absorption was first verified by scanning freshly prepared DPPH from 200 to 800
nm using the scan mode of the spectrophotometer. Ascorbic acid was used as a standard and
mixture without extract was used as the control. Inhibition of free radical DPPH in percent
(I%) was then calculated:
Eq. (3.12)
Where A0 is the absorbance of the control and A1 is the absorbance of the sample.
3.6 Sensory quality evaluation
The sensory quality evaluation for coded samples (cookies and tea substitutes) done by using
descriptive sensory analysis via ten trained panelists. It was conducted in Addis Ababa
48
institute of Technology (AAiT) and in quiet, daylight, room temperature separated house at
different sessions. Descriptive tests can be qualitative or quantitative and involve detection
and description of both qualitative and quantitative sensory attributes. This has successfully
been used to obtain detailed descriptions of sensory attributes like aroma, flavor, texture and
others attributes of the cookies and tea substitute. Samples were evaluated for a number of
attributes by trained panelists (Lea et al.1998). Factors like health status, allergies,
availability, personality, verbal creativity, concentration, motivation, smoker, sensitivity,
medications were considered when selecting sensory panelists.
For ease of evaluation, the panelists were handed a scored sheets with 9-point hedonic scale
(a balanced bipolar scale around neutral at the center with four positive and four negative
categories on each side). The categories are labeled with phrases representing various degrees
of affect and those labels are arranged successively to suggest a single continuum of likes and
dislikes (Peryam & Pilgrim, 1957). The panelists were instructed to rate the products using a
9 point hedonic scale with 1 = dislike extremely, 5 = neither like nor dislike, 9 = like
extremely was used for attributes according to Amerine et al., (1965); Then coded samples of
cookies and tea substitute were presented to panelists together with water for mouth wash
within each taste interval.
3.7 Experimental design and statistical data analysis
The data obtained from each experiment were analyzed by using JMP statis tical analysis
software version 7.0; using complete randomized design (CRD). Significance was accepted at
0.05 level of probability (p<0.05). Mean separation was performed by “Each Pair Student’s t
test” for multiple comparisons of means. All of experiments were performed in triplicates and
duplicates. For defatted wheat germ enriched biscuits a factor of two; (Temperature and blend
ratio at level of three attained while for the tea substitute extraction Temperature). Data
analysis output of some properties and proximate compositions were listed in result and
discussion. The effect of replacing wheat flour by DWGF on the acceptability of the product
developed was evaluated by comparing them to a control and measuring the least significant
difference (LSD) at 5% according to method described by Mc Clave et al (1991). For wheat
bran sample analysis, average value was taken using Excel, 2007.

49
CHAPTER FOUR
Results and Discussion
4.1 Proximate chemical composition
Proximate chemical composition for raw materials including wheat germ, defatted wheat
germ, wheat flour, wheat bran and cookies were performed.
Proximate chemical composition of raw materials
Proximate analysis is crucial as one part of quality parameter starting from raw material
processing throughout the development process up to final state of product obtained in almost
every food product development, production/ process/. The proximate composition of foods
is used to determine the functional property, amount of nutrition value, and over all
acceptability of the final food product.
Proximate composition analysis was made for flours and cookies, which was made from
different blend ratio of composite flours and baking temperature. It offers vital clues about
the overall composition and nutritional status intended for edibility purpose. The results of
proximate analysis of raw materials WF, WGF, DWGF, and WB flour used for making
cookies and preparation of a tea substitute respectively are presented in tables 4.1, 4.2 and
4.3.
Table 4.1 Proximate composition of flours
Proximate Composition
Flour Types
WF WGF DWGF Bran
Ash (%) 0.84±0.06c 3.90±0.11b 4.72±0.04a 4.8±0.18 a
Moisture (%) 11.92±.0.06c 12.08±0.03b 12.99±0.04a 10.38±0.06d
Crude Fat (%) 0.52±0.03b 9.91±0.03a 1.01±0.04b 3.25±0.13b
Crude Fiber (%) 0.45±0.07c 1.19±0.03b 5.18±0.08a 11.91±0.85a
Crude Protein (%) 9.33±0.26d 18.41±0.04b 28.12±0.32a 14.17±0.28c
Total Carbohydrates (%) 77.39±0.17a 54.51±0.18c 53.17±0.19c 67.43±.1.8b
Samples Minerals (mg/100 gm)
Mg P Ca K
WF
DWGF
35±0.14b
45.95±0.35a
192.35±0.64b
392±0.42a
27±0.42b
46.6±0.92a
171±0.28b
1044.9±0.14a
All a-c values are means of duplicate ± SD on dry weight basis Means followed by different superscript within the same row differ significantly (P < 0.05). Where WF is wheat flour; WGF is wheat germ flour and DWGF is defatted wheat germ flour.
50
From the table 4.1 above, in proximate evaluation of the three types of flours, DWGF has ash
(4.72%), crude fiber (5.18%) and crude protein (28.12%) has a huge difference from WGF
with ash (3.9%), crude fiber (1.19%) and crude protein (18.41%) and WF with ash (0.84%),
crude fiber (0.45%) and crude protein (9.33%). Similarly in Table 4.2 DWGF resulted having
considerable amount of minerals than that of WF; resulting WF has the lowest nutritional
content. Consequently from table 4.1 the total amount of minerals and proximate composition
obtained from DWGF is much higher than that of WF; thus DWGF can be used for
supplementation as substitute of WF for upgrading nutritional content of the flour and its
product.
The data obtained were in agreement with the findings of various investigators Sahar, (2012).
The variation in moisture content value may be caused by due effect of conditioning and
storage conditions. A better yield of protein, ash and fiber in DWGF might be due to wheat
germ by nature is most nutrient rich part of the kernel.
Brans of cereals have been used mainly as source of dietary fiber in cereal foods due to
physiological and metabolical effects. Both insoluble and soluble fibers have many positive
effects on health and can help prevent diseases.
4.2 Effect of blend ratio and baking temperature on proximate
composition of cookies
In developed countries, wheat flour is generally fortified with vitamins B1, B2, niacin, with
minerals: iron, calcium and folate. Vitamins A and D can also be added to flour (Fortification
basics, USAID). But in developing countries like Ethiopia mostly the final refined wheat
flour, is nutritionally deficient wheat flour is consumed without being fortified this might be
due to the cost needed to buy or import the required amount of minerals and vitamins to
enrich the last refined white flour. However it’s possible to utilize the byproduct wheat germ
to upgrade the nutritional content of white wheat flour with least cost as raw material. Effect
of both baking temperature and blend ratio on proximate of baked cookies discussed below.
4.2.1 Effect of blend ratio and baking temperature on moisture content
As it can be observed from table 4.2 the moisture content of the cookies was significantly
affected by blend ratio, baking temperature, and their interaction (p< 0.05). The moisture
content has a unit of g/100g. With rising baking temperature the moisture content of cookies
becomes smaller this makes the biscuits to turn out to be crispier if kept for the average time
required. Similarly, as the amount of blend ratio used for baking the cookies increased down
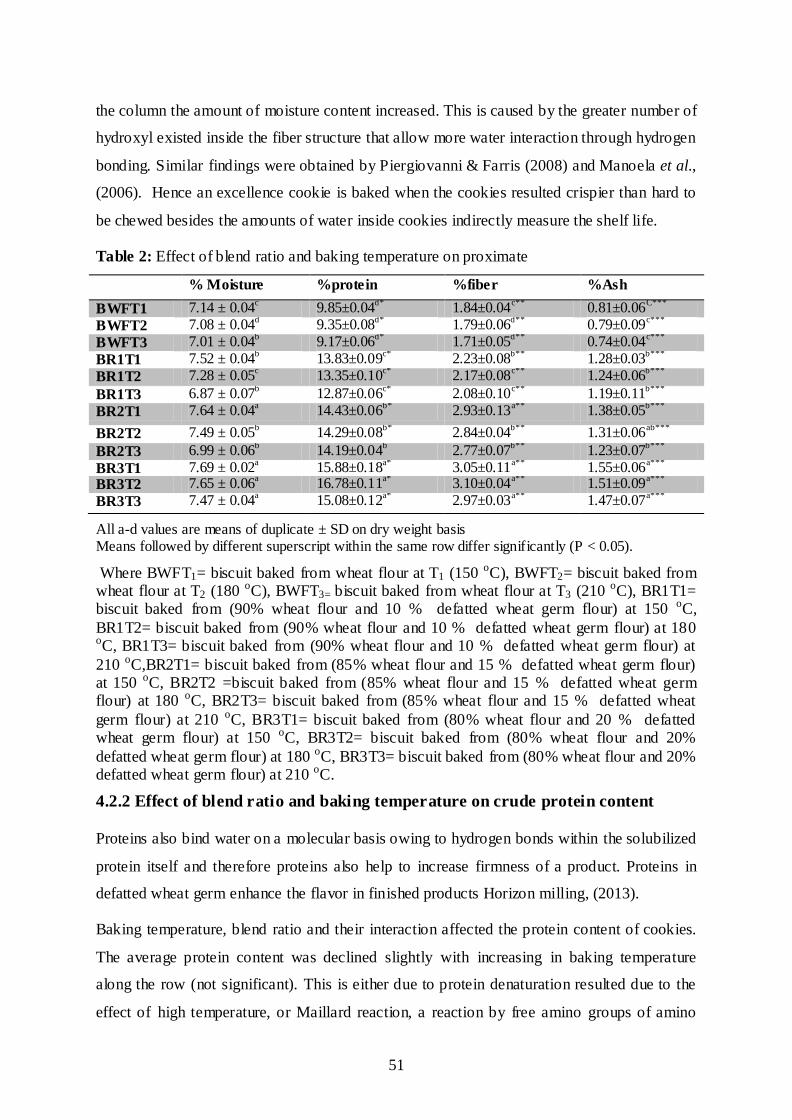
51
the column the amount of moisture content increased. This is caused by the greater number of
hydroxyl existed inside the fiber structure that allow more water interaction through hydrogen
bonding. Similar findings were obtained by Piergiovanni & Farris (2008) and Manoela et al.,
(2006). Hence an excellence cookie is baked when the cookies resulted crispier than hard to
be chewed besides the amounts of water inside cookies indirectly measure the shelf life.
Table 2: Effect of blend ratio and baking temperature on proximate
% Moisture %protein %fiber %Ash
BWFT1 7.14 ± 0.04c 9.85±0.04
d* 1.84±0.04
c** 0.81±0.06
C***
BWFT2 7.08 ± 0.04d 9.35±0.08
d* 1.79±0.06
d** 0.79±0.09
c***
BWFT3 7.01 ± 0.04b 9.17±0.06
d* 1.71±0.05
d** 0.74±0.04
c***
BR1T1 7.52 ± 0.04b 13.83±0.09
c* 2.23±0.08
b** 1.28±0.03
b***
BR1T2 7.28 ± 0.05c 13.35±0.10
c* 2.17±0.08
c** 1.24±0.06
b***
BR1T3 6.87 ± 0.07b 12.87±0.06
c* 2.08±0.10
c** 1.19±0.11
b***
BR2T1 7.64 ± 0.04a 14.43±0.06
b* 2.93±0.13
a** 1.38±0.05
b***
BR2T2 7.49 ± 0.05b 14.29±0.08
b* 2.84±0.04
b** 1.31±0.06
ab***
BR2T3 6.99 ± 0.06b 14.19±0.04
b 2.77±0.07
b** 1.23±0.07
b***
BR3T1 7.69 ± 0.02a 15.88±0.18
a* 3.05±0.11
a** 1.55±0.06
a***
BR3T2 7.65 ± 0.06a 16.78±0.11
a* 3.10±0.04
a** 1.51±0.09
a***
BR3T3 7.47 ± 0.04a 15.08±0.12
a* 2.97±0.03
a** 1.47±0.07
a***
All a-d values are means of duplicate ± SD on dry weight basis Means followed by different superscript within the same row differ significantly (P < 0.05).
Where BWFT1= biscuit baked from wheat flour at T1 (150 oC), BWFT2= biscuit baked from wheat flour at T2 (180 oC), BWFT3= biscuit baked from wheat flour at T3 (210 oC), BR1T1= biscuit baked from (90% wheat flour and 10 % defatted wheat germ flour) at 150 oC,
BR1T2= biscuit baked from (90% wheat flour and 10 % defatted wheat germ flour) at 180 oC, BR1T3= biscuit baked from (90% wheat flour and 10 % defatted wheat germ flour) at
210 oC,BR2T1= biscuit baked from (85% wheat flour and 15 % defatted wheat germ flour) at 150 oC, BR2T2 =biscuit baked from (85% wheat flour and 15 % defatted wheat germ flour) at 180 oC, BR2T3= biscuit baked from (85% wheat flour and 15 % defatted wheat
germ flour) at 210 oC, BR3T1= biscuit baked from (80% wheat flour and 20 % defatted wheat germ flour) at 150 oC, BR3T2= biscuit baked from (80% wheat flour and 20%
defatted wheat germ flour) at 180 oC, BR3T3= biscuit baked from (80% wheat flour and 20% defatted wheat germ flour) at 210 oC.
4.2.2 Effect of blend ratio and baking temperature on crude protein content
Proteins also bind water on a molecular basis owing to hydrogen bonds within the solubilized
protein itself and therefore proteins also help to increase firmness of a product. Proteins in
defatted wheat germ enhance the flavor in finished products Horizon milling, (2013).
Baking temperature, blend ratio and their interaction affected the protein content of cookies.
The average protein content was declined slightly with increasing in baking temperature
along the row (not significant). This is either due to protein denaturation resulted due to the
effect of high temperature, or Maillard reaction, a reaction by free amino groups of amino

52
acids and sugars. Similar result found by Gulen and Eris (2004) when studied the effect of
heat stress on protein content.
As can be seen from table 4.2 the value of protein raised with every increment of blend ratio
down the column this is because the more amounts of amino acids are presence in each
increment in blend ratio. The amount of water associated to proteins is closely related with its
amino acids profile and increases with the number of charged residues, conformation,
hydrophobicity, pH, temperature, ionic strength and protein concentration Damodaran,
(1997).
4.2.3 Effect of blend ratio and baking temperature on crude fiber
Now a day a number of people in the world boost up consumption of dietary fiber intake by
accepting the fact it’s capable of reducing blood cholesterol levels, occurrence of colon
cancer even best for weight loss hence it is the indigestible part of foods, determined from the
residue remaining after extraction under specified conditions, it feels the belly full without
leaving the individual obsessed. According to (FAO, 2003) daily intake of dietary fiber is
25gm/day. Thus it’s advantageous to use the byproduct DWGF with almost no cost.
From table 4.2 baking temperature of the cookies doesn’t have that much significant effect
(P>0.05) on the crude fiber content of the cookies, however cookies were found significantly
affected by blend ratio (p<0.05). As the blend ratio of the composite flour used increased the
amount of crude fiber content also increased. Therefore supplementation of wheat flour with
defatted wheat germ flour could be one alternative to make our food prosperous nutritionally.
Similar findings were obtained by (Mian et al., 2009).
4.2.4 Effect of blend ratio and baking temperature on ash
Ash is mineral content of foods, determined by combustion of the sample under defined
conditions and weighing of the residue. The ash content of the cookie was found significantly
influenced by the blend ratio (p< 0.05) but not by baking temperature and their interaction.
Increasing in the blend ratio of DWGF in the respective blend ratios similarly increased the
amount of ash in the last product. This could be the result of higher amount of ash content in
defatted wheat germ flour than wheat flour initially. Ash was found not significantly
influenced by baking temperature (p > 0.05) similar finding with Biniyam, (2010).

53
Table 3: Mineral composition of biscuits at different blend proportions
Flours Minerals
Mg P Ca K
WF 25.65±1.34d 179.15±1.20d 39.55±1.06a 130.1±0.85d
BBR1 46.2±0.98c 207.85±0.35c 40.4±0.28a 213.8±0.42c
BBR2 54.5±0.84b 216.7±0.57b 40.6±0.42a 235.0±0.28b
BBR3 61.95±1.34a 232.5±0.84a 41.1±0.28a 278.7±0.84a
All values are means of duplicate ± SD
Means followed by different superscript within the same column differ significantly (P < 0.05).
According to (Fenema, 1996) Mineral elements, unlike vitamins and amino acids, cannot be
destroyed by exposure to heat this could be the reason that baking temperature was not
influence ash and mineral content of the cookie significantly. Therefore amount of minerals
presented in the cookies is significantly affected (P<0.05) by blend ratio, this is basically true
hence the defatted wheat germ flour has got magnificent amount of minerals than that of the
control. Similar findings can be observed by (Mian et al., 2009).
4.3 Rheological property of flours
Rheology is the science that studies the flow and deformations of solids and fluids under the
influence of mechanical forces as a function of time. The rheological measures of a product
in the manufacture stage can be useful in quality control. The microstructure of a product can
also be correlated with its rheological behavior, allowing development of new materials
(Gipsy and Gustavo, 2004).
In the food industry, rheology provides a scientific basis for subjective measurements such as
mouth feel, spread ability and pour ability by using farinograph an instruments used to
investigate the physical properties of dough. Rheological properties such as elasticity,
viscosity and extensibility are important in the prediction of the processing parameters of
dough and quality of end product (Hruskova, 2001).
The measurements completed on the variation of the kneading torque by two different
modalities, using an electronic brabender farinograph and an experimental plant with torques.
Rheological properties of the different types of blends and the control were analyzed. Mixer
temperature was set at 30 oC prior for all tests.

54
Figure 4.1 Farinograph values of control flour/ WF.
Figure 4.2 Farinograph value for BR1.
4.3.1 Water absorption
It is the amount of water required to center the farinograph curve on the 500-Brabender unit
(BU) line. From this water absorption showed tendency of change in the physical
characteristics of the dough found from wheat flour alone and blended with defatted wheat
germ flour with the increase in the proportion of defatted wheat germ flour in the mixture.
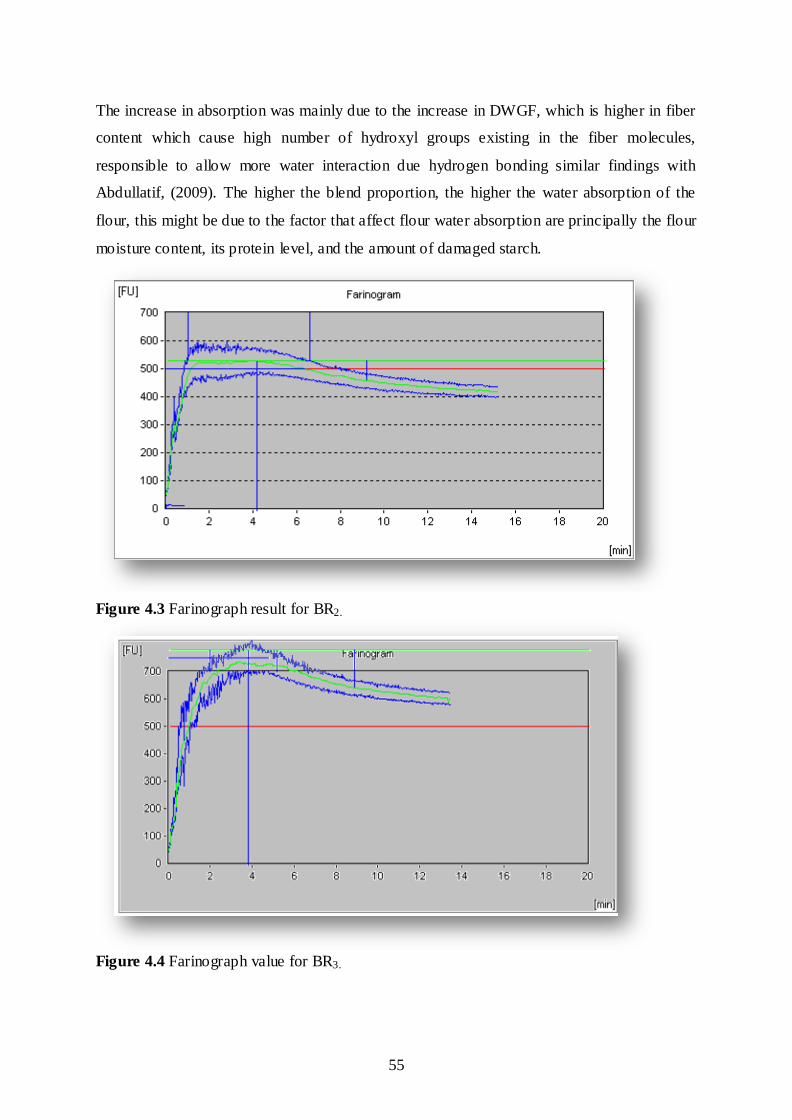
55
The increase in absorption was mainly due to the increase in DWGF, which is higher in fiber
content which cause high number of hydroxyl groups existing in the fiber molecules,
responsible to allow more water interaction due hydrogen bonding similar findings with
Abdullatif, (2009). The higher the blend proportion, the higher the water absorption of the
flour, this might be due to the factor that affect flour water absorption are principally the flour
moisture content, its protein level, and the amount of damaged starch.
Figure 4.3 Farinograph result for BR2.
Figure 4.4 Farinograph value for BR3.
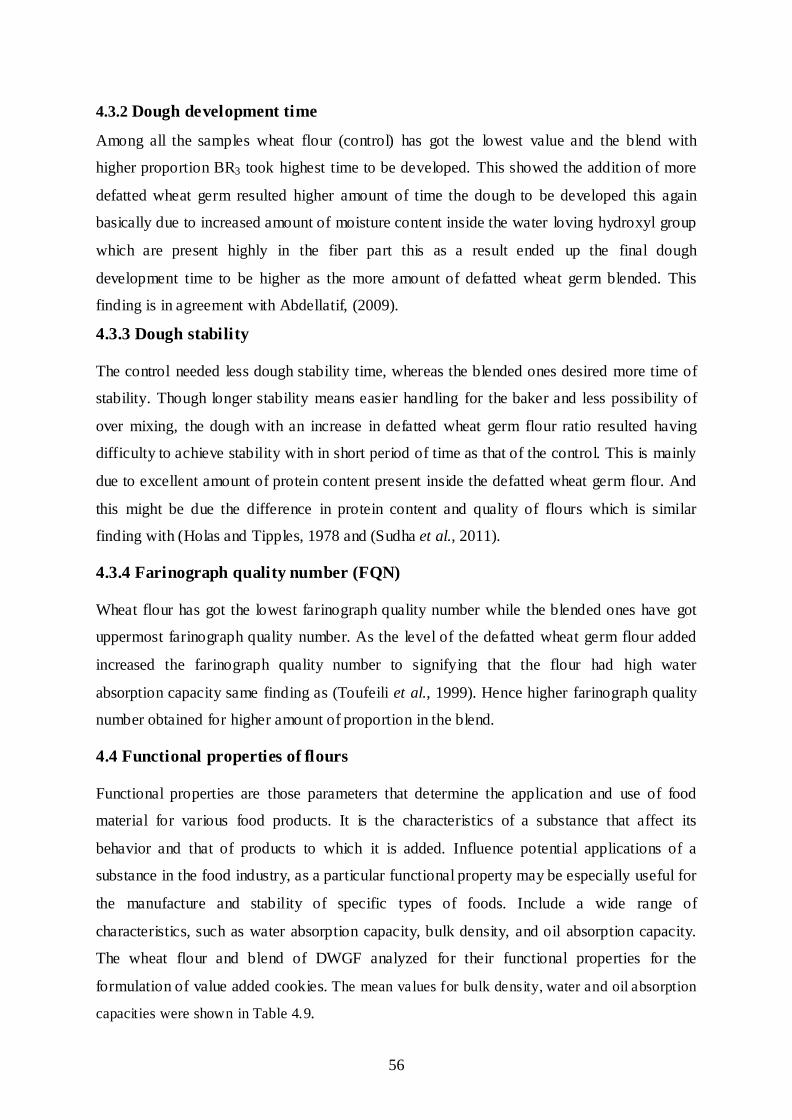
56
4.3.2 Dough development time
Among all the samples wheat flour (control) has got the lowest value and the blend with
higher proportion BR3 took highest time to be developed. This showed the addition of more
defatted wheat germ resulted higher amount of time the dough to be developed this again
basically due to increased amount of moisture content inside the water loving hydroxyl group
which are present highly in the fiber part this as a result ended up the final dough
development time to be higher as the more amount of defatted wheat germ blended. This
finding is in agreement with Abdellatif, (2009).
4.3.3 Dough stability
The control needed less dough stability time, whereas the blended ones desired more time of
stability. Though longer stability means easier handling for the baker and less possibility of
over mixing, the dough with an increase in defatted wheat germ flour ratio resulted having
difficulty to achieve stability with in short period of time as that of the control. This is mainly
due to excellent amount of protein content present inside the defatted wheat germ flour. And
this might be due the difference in protein content and quality of flours which is similar
finding with (Holas and Tipples, 1978 and (Sudha et al., 2011).
4.3.4 Farinograph quality number (FQN)
Wheat flour has got the lowest farinograph quality number while the blended ones have got
uppermost farinograph quality number. As the level of the defatted wheat germ flour added
increased the farinograph quality number to signifying that the flour had high water
absorption capacity same finding as (Toufeili et al., 1999). Hence higher farinograph quality
number obtained for higher amount of proportion in the blend.
4.4 Functional properties of flours
Functional properties are those parameters that determine the application and use of food
material for various food products. It is the characteristics of a substance that affect its
behavior and that of products to which it is added. Influence potential applications of a
substance in the food industry, as a particular functional property may be especially useful for
the manufacture and stability of specific types of foods. Include a wide range of
characteristics, such as water absorption capacity, bulk density, and oil absorption capacity.
The wheat flour and blend of DWGF analyzed for their functional properties for the
formulation of value added cookies. The mean values for bulk density, water and oil absorption
capacities were shown in Table 4.9.
57
4.4.1 Bulk density
Bulk density, weight per unit volume of wheat flour and the blended composites flours,
presented in table 4.9. The highest bulk density was obtained by BR3, BR2, BR1 and finally
WF. Having higher bulk density of composite flour exhibit better compactness and possible
mixed effect caused by the interaction of the molecules of the DWGF and WF. The higher
bulk density observed for the composite flour implies that a denser packaging material may
be required for this product. Bulk density gives information on the porosity of a product and
can influence the choice of package and its design (Odedeji and Oyeleke, 2010).
4.4.2 Water absorption capacity
The water absorption capacity is a function of water holding ability of the flour sample. From
the analysis reported in table 4.9. The highest WAC of DWGF could be attributed due the
presence of high protein, crude fiber and higher amounts of hydrophilic constituents in
DWGF. Similar findings were obtained by Adeyemi and Beckley (1986) reported that water
absorption capacities of flours correlate positively with the particle size of flours. Higher
WAC of the composite flour may be attributed to their higher protein contents. Afoakwa,
(1996), reported that proteins are mainly responsible for the bulk of water uptake in flours.
Water absorption capacity is a critical function of protein in various food products like soups,
gravies, doughs and baked products Sosulski et al., (1976).
4.4.3 Oil absorption capacity
Oil absorption capacity (OAC) is another vital functional property of flour hence it’s
excellent in enhancing the mouth feel while preserve the flavor of food products. The
removal of fat from the samples exposes the water binding sites on the side chain groups of
protein units previously blocked in a lipophilic environment thereby leading to an increase in
WAC value as in defatted flours as mentioned earlier. Similar observation has been reported
by Lin et al. (1974). Oil absorption increased in proportion to the protein contents of the
flour. The mechanism of fat binding is not fully understood, but formation of lipid-protein
complexes is markedly responsible for oil retention.
As can be seen from table 4.9 the oil absorption capacity of flours increased from wheat flour
through the blended ratios. The oil absorption of defatted wheat germ flour was higher than
those of wheat flour. This implied DWGF may have more hydrophobic proteins flour; the
more hydrophobic proteins demonstrate superior binding of lipids. Hence the major chemical
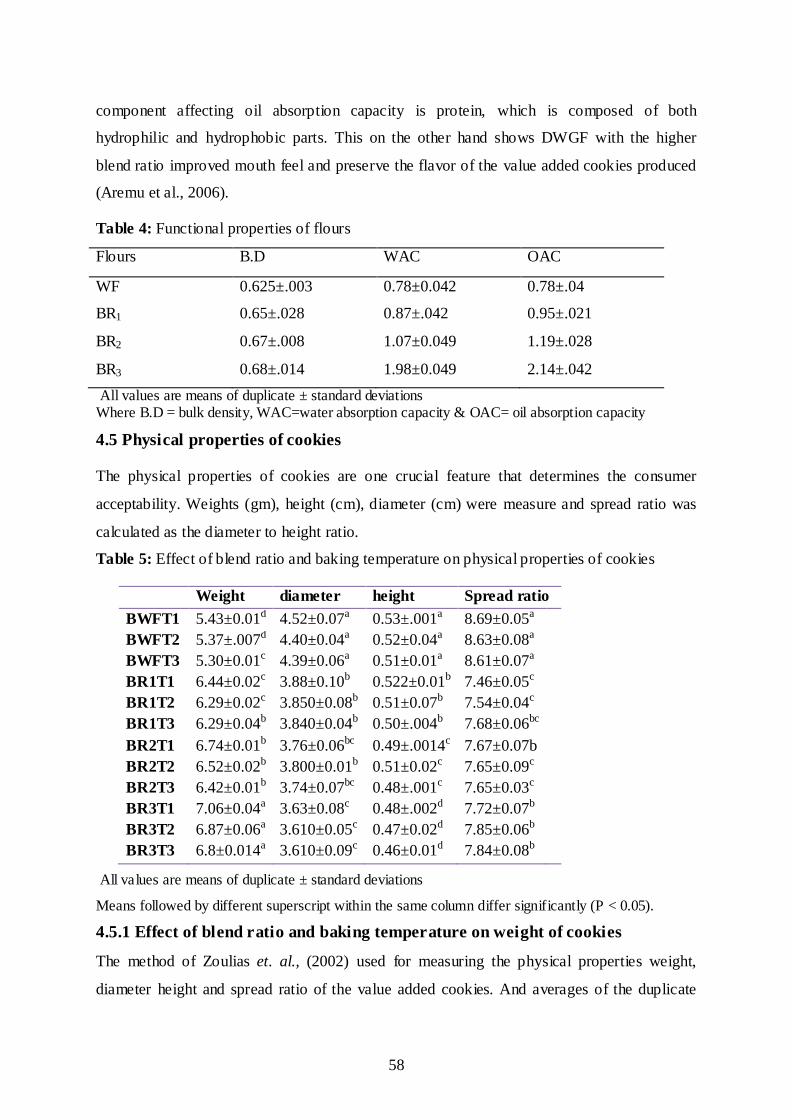
58
component affecting oil absorption capacity is protein, which is composed of both
hydrophilic and hydrophobic parts. This on the other hand shows DWGF with the higher
blend ratio improved mouth feel and preserve the flavor of the value added cookies produced
(Aremu et al., 2006).
Table 4: Functional properties of flours
Flours B.D WAC OAC
WF 0.625±.003 0.78±0.042 0.78±.04
BR1 0.65±.028 0.87±.042 0.95±.021
BR2 0.67±.008 1.07±0.049 1.19±.028
BR3 0.68±.014 1.98±0.049 2.14±.042
All values are means of duplicate ± standard deviations Where B.D = bulk density, WAC=water absorption capacity & OAC= oil absorption capacity
4.5 Physical properties of cookies
The physical properties of cookies are one crucial feature that determines the consumer
acceptability. Weights (gm), height (cm), diameter (cm) were measure and spread ratio was
calculated as the diameter to height ratio.
Table 5: Effect of blend ratio and baking temperature on physical properties of cookies
Weight diameter height Spread ratio
BWFT1 5.43±0.01d 4.52±0.07a 0.53±.001a 8.69±0.05a
BWFT2 5.37±.007d 4.40±0.04a 0.52±0.04a 8.63±0.08a
BWFT3 5.30±0.01c 4.39±0.06a 0.51±0.01a 8.61±0.07a
BR1T1 6.44±0.02c 3.88±0.10b 0.522±0.01b 7.46±0.05c
BR1T2 6.29±0.02c 3.850±0.08b 0.51±0.07b 7.54±0.04c
BR1T3 6.29±0.04b 3.840±0.04b 0.50±.004b 7.68±0.06bc
BR2T1 6.74±0.01b 3.76±0.06bc 0.49±.0014c 7.67±0.07b
BR2T2 6.52±0.02b 3.800±0.01b 0.51±0.02c 7.65±0.09c
BR2T3 6.42±0.01b 3.74±0.07bc 0.48±.001c 7.65±0.03c
BR3T1 7.06±0.04a 3.63±0.08c 0.48±.002d 7.72±0.07b
BR3T2 6.87±0.06a 3.610±0.05c 0.47±0.02d 7.85±0.06b
BR3T3 6.8±0.014a 3.610±0.09c 0.46±0.01d 7.84±0.08b
All values are means of duplicate ± standard deviations
Means followed by different superscript within the same column differ significantly (P < 0.05).
4.5.1 Effect of blend ratio and baking temperature on weight of cookies
The method of Zoulias et. al., (2002) used for measuring the physical properties weight,
diameter height and spread ratio of the value added cookies. And averages of the duplicate
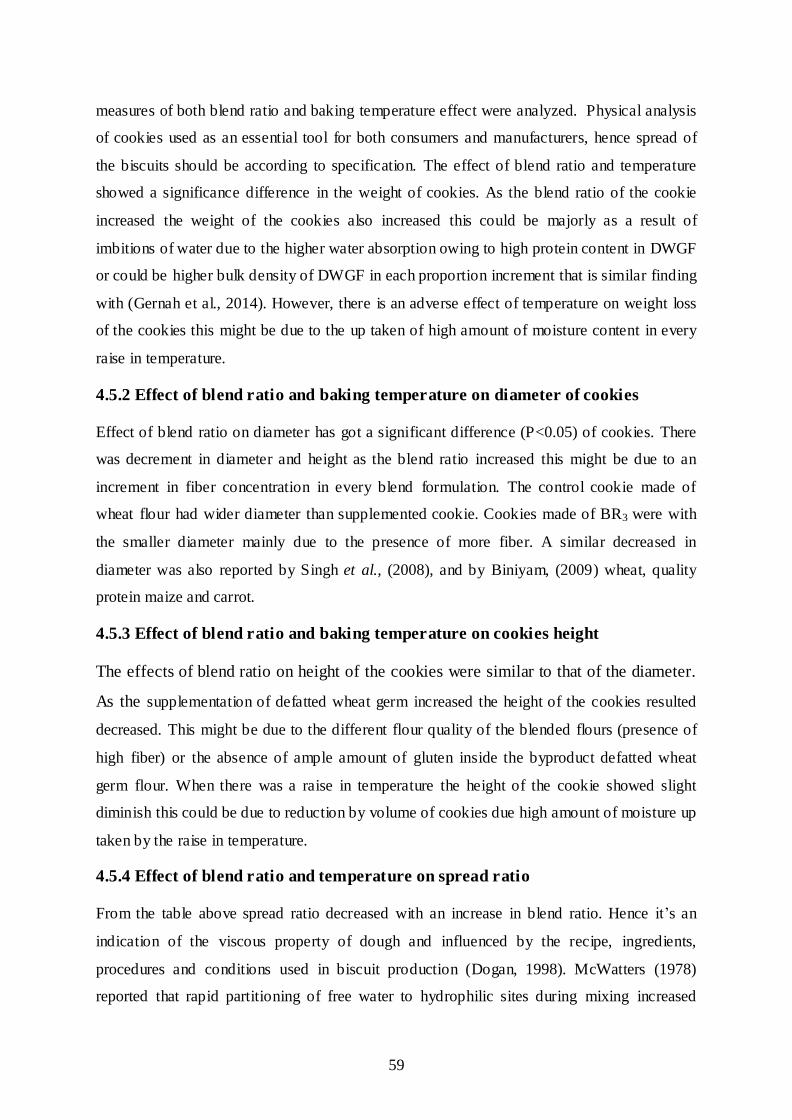
59
measures of both blend ratio and baking temperature effect were analyzed. Physical analysis
of cookies used as an essential tool for both consumers and manufacturers, hence spread of
the biscuits should be according to specification. The effect of blend ratio and temperature
showed a significance difference in the weight of cookies. As the blend ratio of the cookie
increased the weight of the cookies also increased this could be majorly as a result of
imbitions of water due to the higher water absorption owing to high protein content in DWGF
or could be higher bulk density of DWGF in each proportion increment that is similar finding
with (Gernah et al., 2014). However, there is an adverse effect of temperature on weight loss
of the cookies this might be due to the up taken of high amount of moisture content in every
raise in temperature.
4.5.2 Effect of blend ratio and baking temperature on diameter of cookies
Effect of blend ratio on diameter has got a significant difference (P<0.05) of cookies. There
was decrement in diameter and height as the blend ratio increased this might be due to an
increment in fiber concentration in every blend formulation. The control cookie made of
wheat flour had wider diameter than supplemented cookie. Cookies made of BR3 were with
the smaller diameter mainly due to the presence of more fiber. A similar decreased in
diameter was also reported by Singh et al., (2008), and by Biniyam, (2009) wheat, quality
protein maize and carrot.
4.5.3 Effect of blend ratio and baking temperature on cookies height
The effects of blend ratio on height of the cookies were similar to that of the diameter.
As the supplementation of defatted wheat germ increased the height of the cookies resulted
decreased. This might be due to the different flour quality of the blended flours (presence of
high fiber) or the absence of ample amount of gluten inside the byproduct defatted wheat
germ flour. When there was a raise in temperature the height of the cookie showed slight
diminish this could be due to reduction by volume of cookies due high amount of moisture up
taken by the raise in temperature.
4.5.4 Effect of blend ratio and temperature on spread ratio
From the table above spread ratio decreased with an increase in blend ratio. Hence it’s an
indication of the viscous property of dough and influenced by the recipe, ingredients,
procedures and conditions used in biscuit production (Dogan, 1998). McWatters (1978)
reported that rapid partitioning of free water to hydrophilic sites during mixing increased

60
dough viscosity, thereby limiting cookie spread; or a decrease in spread factor and thickness
was due to the increase in amount of protein, as addition of soy flour which could attribute to
higher protein content of soy flour as reported by Mridula et. al., (2007). These results were
similar to those reported for cookies prepared from wheat–cowpea (McWatters et al., 2003)
and wheat–soybean (Shrestha & Noomhorm, 2002) flour blends. However, it has been
suggested that spread ratio is affected by the competition of ingredients for the available
water, by flour or any other ingredient, which absorbs water during dough mixing, will
decrease it (Fuhr, 1962).
4.6 Total phenolic content and antioxidant activity of bran
4.6.1Total phenolic content of wheat bran
In preliminary determination of total phenolic content of wheat bran, standard curve for the
gallic acid obtained by Excel, 2007 from table found in appendix III. Total phenolic content
(TPC) was expressed as milligrams of gallic acid equivalent per gram (mg/g) of dry extract
samples. Gallic acid, the major phenolic acid found in wheat, was used as a standard. Total
phenolic content of wheat bran using different temperature range differed (1.037, 2.15, 3.58
and 3.68) mg of GAE /g for temperatures 40, 80, and 60 oC using absolute and solvent
methanol for extraction. These results are in agreement with that observed by Vaher et al.
(2010) who found that the bran layers have the highest content of total phenolics content.
This may be due to the use of mixture alcohol and water present the advantage of depends
mainly on the hydroxyl groups, the molecular size and the length of hydrocarbon. The higher
total phenolic compounds were extracted by using organics solvent (alcohols) whose polarity
is modified with water. These mixtures become ideal and selective to extract a great number
of bioactive compounds of phenolic compounds. Whereas water given more amount of yield,
but only is not good to extract polyphenols. Water extracts only the water-soluble bioactive
compounds; moreover much other residual substances and impurities are present in the
aqueous extracts (Zohra, 2011).
Therefore for the experiment, with increase in solvent extraction temperature, there was
significant increase in total phenolic content in cereal brans. Maximum total phenolic
contents were obtained at 60°C (3.68mg GAE g- l) while minimum at 40°C (1.037 mg GAE
g-l). The difference in total phenolic content among each extraction may be due to the
difference in heat labile nature of cereal bran (Dar and Savita, 2011).
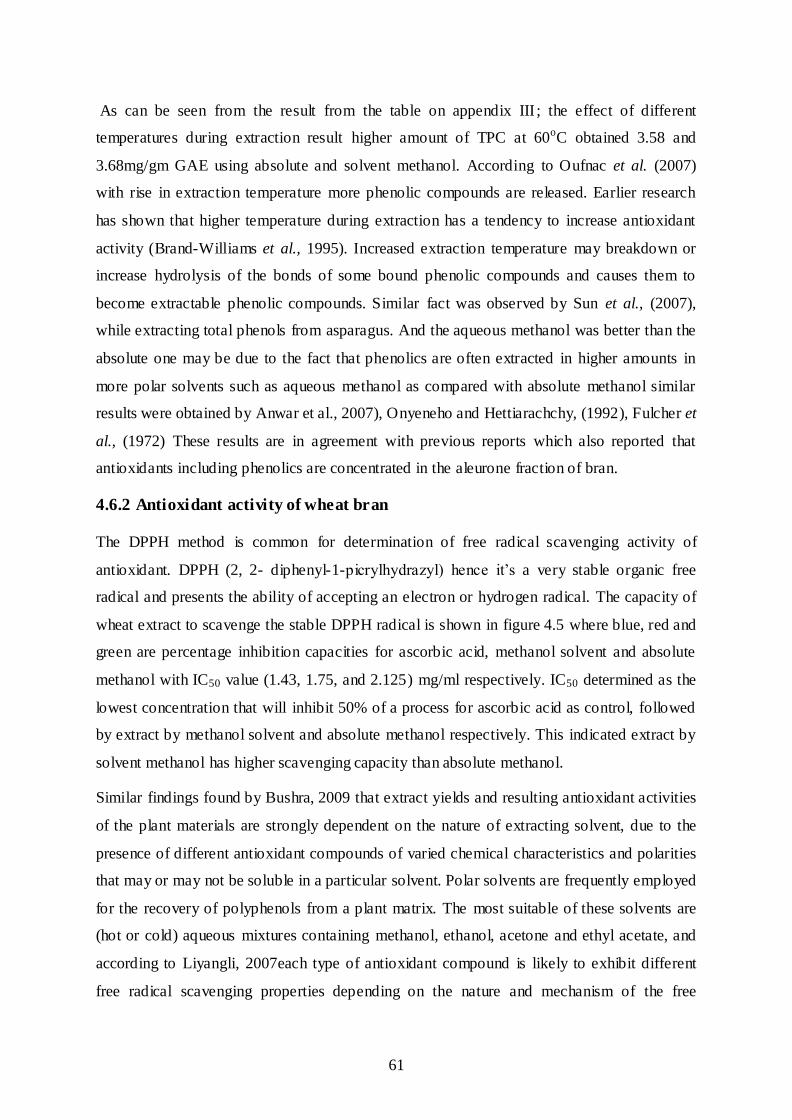
61
As can be seen from the result from the table on appendix III ; the effect of different
temperatures during extraction result higher amount of TPC at 60oC obtained 3.58 and
3.68mg/gm GAE using absolute and solvent methanol. According to Oufnac et al. (2007)
with rise in extraction temperature more phenolic compounds are released. Earlier research
has shown that higher temperature during extraction has a tendency to increase antioxidant
activity (Brand-Williams et al., 1995). Increased extraction temperature may breakdown or
increase hydrolysis of the bonds of some bound phenolic compounds and causes them to
become extractable phenolic compounds. Similar fact was observed by Sun et al., (2007),
while extracting total phenols from asparagus. And the aqueous methanol was better than the
absolute one may be due to the fact that phenolics are often extracted in higher amounts in
more polar solvents such as aqueous methanol as compared with absolute methanol similar
results were obtained by Anwar et al., 2007), Onyeneho and Hettiarachchy, (1992), Fulcher et
al., (1972) These results are in agreement with previous reports which also reported that
antioxidants including phenolics are concentrated in the aleurone fraction of bran.
4.6.2 Antioxidant activity of wheat bran
The DPPH method is common for determination of free radical scavenging activity of
antioxidant. DPPH (2, 2- diphenyl-1-picrylhydrazyl) hence it’s a very stable organic free
radical and presents the ability of accepting an electron or hydrogen radical. The capacity of
wheat extract to scavenge the stable DPPH radical is shown in figure 4.5 where blue, red and
green are percentage inhibition capacities for ascorbic acid, methanol solvent and absolute
methanol with IC50 value (1.43, 1.75, and 2.125) mg/ml respectively. IC50 determined as the
lowest concentration that will inhibit 50% of a process for ascorbic acid as control, followed
by extract by methanol solvent and absolute methanol respectively. This indicated extract by
solvent methanol has higher scavenging capacity than absolute methanol.
Similar findings found by Bushra, 2009 that extract yields and resulting antioxidant activities
of the plant materials are strongly dependent on the nature of extracting solvent, due to the
presence of different antioxidant compounds of varied chemical characteristics and polarities
that may or may not be soluble in a particular solvent. Polar solvents are frequently employed
for the recovery of polyphenols from a plant matrix. The most suitable of these solvents are
(hot or cold) aqueous mixtures containing methanol, ethanol, acetone and ethyl acetate, and
according to Liyangli, 2007each type of antioxidant compound is likely to exhibit different
free radical scavenging properties depending on the nature and mechanism of the free

62
radicals used and their reactivities with different antioxidant compounds, a moderately polar
extraction solvent such as 80% methanol may be more effective for extracting phenolic
antioxidants and DPPH scavengers from wheat grain than absolute methanol.
Figure 4.5 Free radical scavenging methanolic extract of wheat bran and control.
4.7 Sensory quality evaluation of products
The last evaluation conducted by the panelist was the overall acceptability of cookies. Hence
overall acceptability is the sum of all the quality parameters and loving the cookies,
considered as basic for new product development. The overall acceptability of the cookie was
influenced by both blend proportion and baking temperature. The uppermost score of
judgment on over all acceptability was observed for BR2 at 1800C while the least one was
BR3 at T1.
Figure 4.5 (a) Sensory evaluation for cookies
For the sensory evaluation cookies were selected primarily, followed by hedonic test. From
this the overall acceptability of BR2 was more acceptable than all the others included control
0
10
20
30
40
50
60
70
80
90
100
110
0 2 4 6 8 10 12
Ascorbic
Me-ol & H2O
Me-ol
0 2 4 6 8
10 WFBT2
WFBT1
WFBT3
BBR1T2
BBR1T1
BBR1T3
BBR2T2
BBR2T1
BBR2T3
BBR3T2
BBR3T1
BBR3T3 appea.
color
flavor
texture
taste
OAA
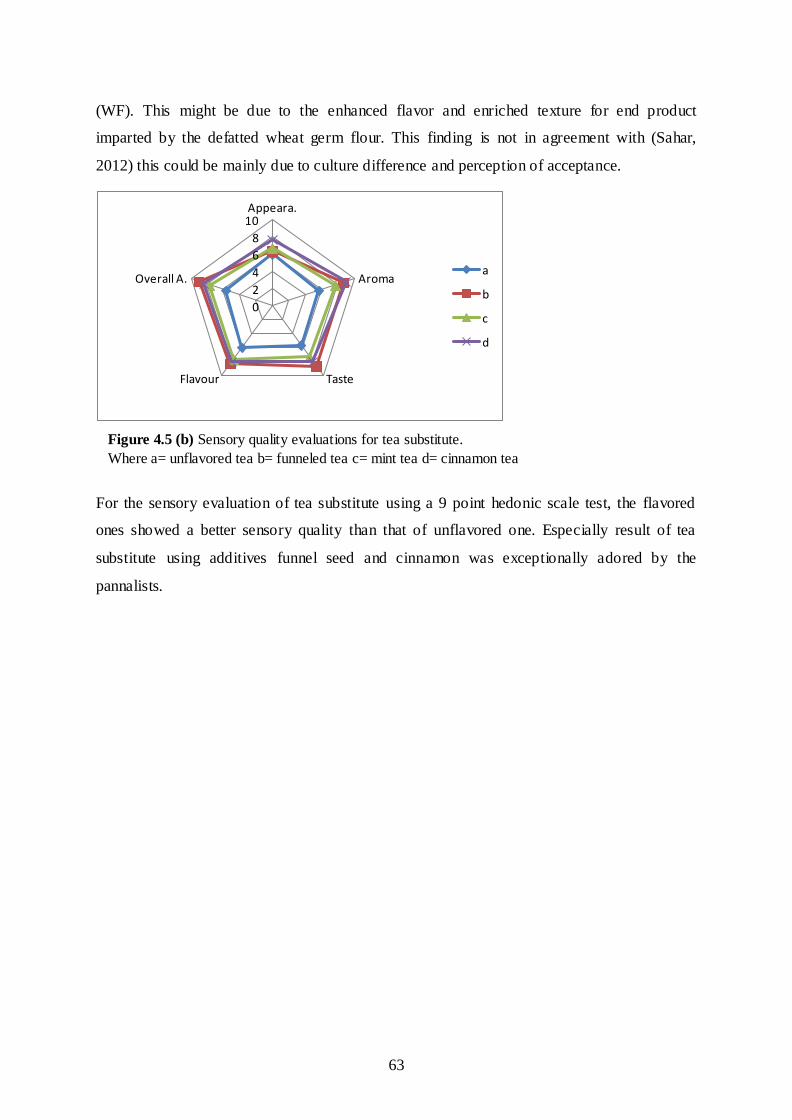
63
(WF). This might be due to the enhanced flavor and enriched texture for end product
imparted by the defatted wheat germ flour. This finding is not in agreement with (Sahar,
2012) this could be mainly due to culture difference and perception of acceptance.
For the sensory evaluation of tea substitute using a 9 point hedonic scale test, the flavored
ones showed a better sensory quality than that of unflavored one. Especially result of tea
substitute using additives funnel seed and cinnamon was exceptionally adored by the
pannalists.
0
2
4
6
8
10 Appeara.
Aroma
Taste Flavour
Overall A. a
b
c
d
Figure 4.5 (b) Sensory quality evaluations for tea substitute.
Where a= unflavored tea b= funneled tea c= mint tea d= cinnamon tea
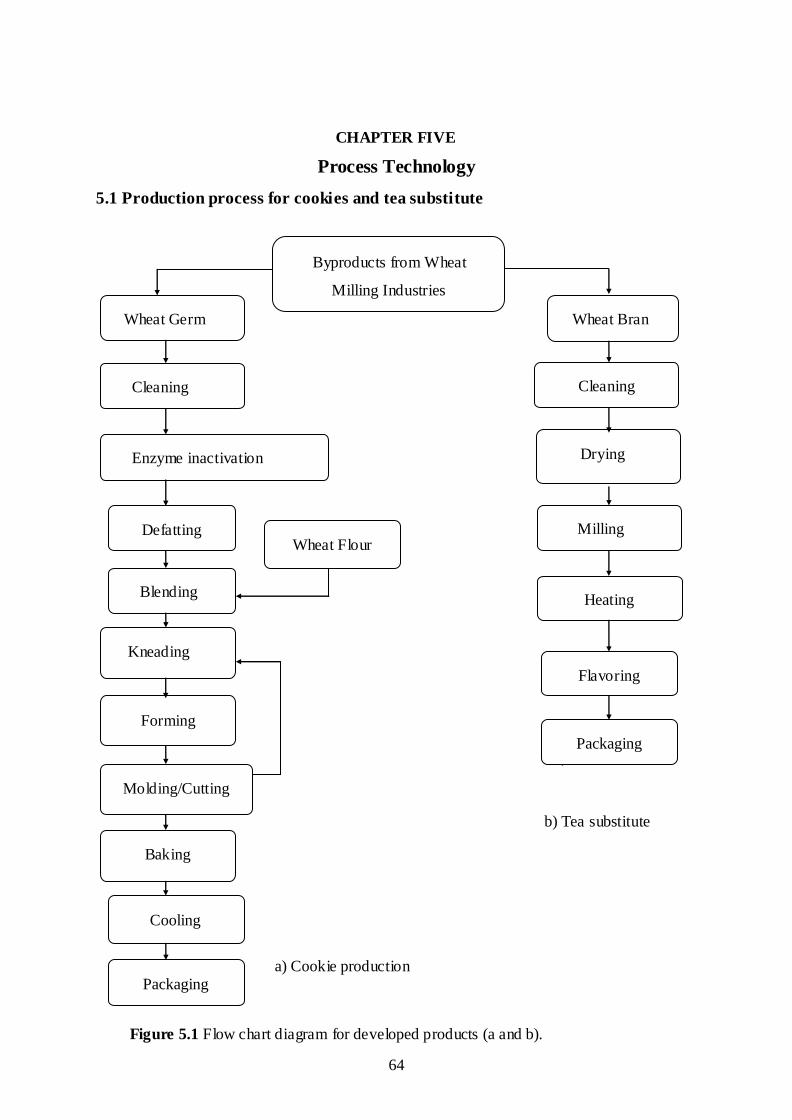
64
CHAPTER FIVE
Process Technology
5.1 Production process for cookies and tea substitute
b) Tea-substitute
a) Cookie production
Figure 5.1 Flow chart diagram for developed products (a and b).
Drying
Wheat Bran
Cleaning
Heating
Milling
Flavoring
Packaging
Byproducts from Wheat
Milling Industries
Wheat Germ
Defatting
Blending
Kneading
Forming
Molding/Cutting
Baking
Cooling
Packaging
Cleaning
Enzyme inactivation
Wheat Flour
b) Tea substitute
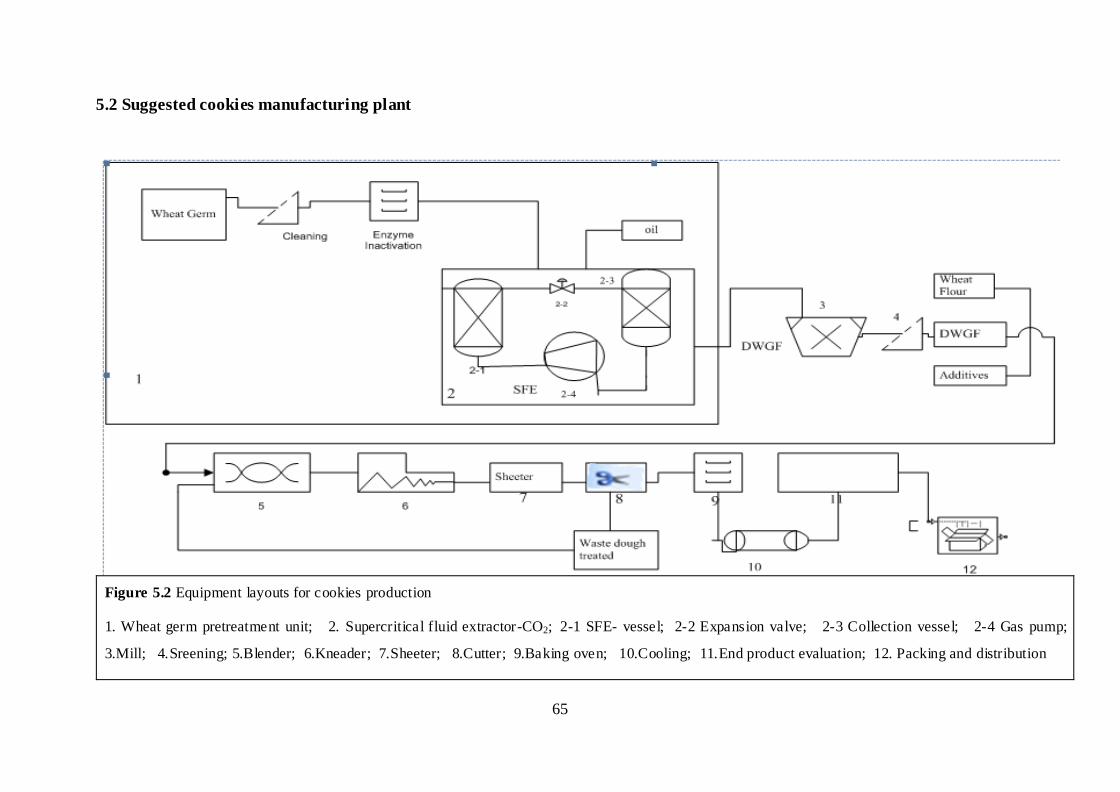
65
5.2 Suggested cookies manufacturing plant
Figure 5.2 Equipment layouts for cookies production
1. Wheat germ pretreatment unit; 2. Supercritical fluid extractor-CO2; 2-1 SFE- vessel; 2-2 Expansion valve; 2-3 Collection vessel; 2-4 Gas pump;
3.Mill; 4.Sreening; 5.Blender; 6.Kneader; 7.Sheeter; 8.Cutter; 9.Baking oven; 10.Cooling; 11.End product evaluation; 12. Packing and distribution

67
CHAPTER SIX
Conclusions and Recommendations
6.1 Conclusions
This study was primarily and mainly aimed to investigate the possibility of exploit
underutilized byproducts (wheat germ and wheat bran) from wheat milling industries; with
the intention of developing value added products (cookies and tea substitute) respectively.
Secondly, it was attempted to determine appropriate blend ratio, temperature and their
combination plus their impact on the (functional, physical and rheological property of flours
(proximate and sensory quality)) of the newly formulated products; and tea substitute from
wheat bran demonstrated better antioxidant activity and phenolic content.
From the findings, when wheat flour supplemented with defatted wheat germ flour with
protein (28.12), fiber (5.18) was more than adequate to be used as enrichment of wheat flour
with protein (9.33), fiber (0.45) and much lesser amount of minerals (Mg, P, Ca, K) content
than that of the defatted wheat germ flour. Hence, the Farinogram analysis demonstrated
acceptable range of dough character existed till level of 15%. Finally, the 15% blended
cookies baked at temperature of 180oC result very good sensory acceptance, better nutritional
content (protein=16.8, fiber=3) quite not destructively affected by temperature and blend
ratio.
The wheat bran extracted using absolute and solvent methanol for determination of total
phenolic content using Folin-Ciocalteu assay and antioxidant activity using DPPH
scavenging assay at (40, 60 and 80) oC . Gallic acid and ascorbic acid were used as a control
for both assays respectively. A higher total phenolic content (3.68mg/gm) of gallic acid
equivalent was investigated at a temperature of 60oC using solvent methanol. Percentage
inhibition capacity for ascorbic acid, methanol solvent and absolute methanol with IC50 value
was (1.43, 1.75, and 2.125) mg/ml respectively. The tea substitute made from wheat bran
flavored with funnel seed and cinnamon resulted better sensory acceptance.
68
6.2 Recommendations
From the study result, partial substitution of wheat flour with defatted wheat germ flour for
cookies making appeared to promising in nutrition point of view; similarly the tea substitute
of variety additives were success too. The following recommendations are forwarded based
on holistic assessment of the subject area for production of value added products from
defatted wheat germ flour and wheat flour:
Establish benches mark for further research pertaining to work on the germ o il
production and characterization which is useful for making variety of products in
different sectors; hence it owes high amount of tocopherol and unsaturated fatty acids
both of which are of great importance in human metabolism and cannot be
synthesized by organism.
Hence defatted wheat germ flour resulted in much lesser amount of oil, which was
responsible for rancidity of the flour, long and durable researches should be done on
determination of shelf life of flour. It can be used as nutrient supplement for the
wheat flour alone which has smaller nutritional content; even more these by-products
from wheat milling industries sold in much lesser price so anyone could buy it cheap
and use it for home baking purpose; because this encourages the expansion of
existing and development of value added flour, and a new type of cookies from
inexpensive and available resources, besides it improves the health status of
malnutrition vulnerable group of the society
Further studies on defatted wheat germ flour based value added products like as a
source for production of meat products by partial replacement of the meat should
be done.
Further studies on wheat bran alone for determination of all other antioxidant
activities; and other value added products like soft drink in United Kingdom requires
further investigation.
69
References
AACC (1995). Approval method of the American Association of cereal chemist .Method 10-52 Micro Sugar-Snap Cookie Method, USA
AACC. (2000). The American Association of Cereal Chemists. Approved Methods of
American Association of Cereal Chemists, 10th ed. Minnesota.
AOAC (2000). Association of Official Analytical Chemists. Official Methods of Analysis
(Vol.II 17th edition) of AOAC International. Washington, DC, USA. Official methods 925.09, 923.03, 979.09, 962.09, 4.5.01 and 923.05.
Abdellatif, M, Gordon, S.H, Rogers E. Harry- O' Kuru & Debre,E., P. (2009). Phospholipids
and wheat gluten blends. Journal of Cereal Science, 41, 259 -265.
Adeleke, R.O. And J.O. Odedeji ( 2010). Functional Properties of Wheat and Sweet Potato
Flour Blends. Pakistan Journal of Nutrition, 9: 535-538.
Adeyemi, I.A. and O. Beckley, (1986). Effect of period of maize fermentation and souring on chemical properties and amyl grapy on millet biscuit characteristic. Plant Foods
for Human Nutrition, 56: 195-202.
Afoakwa, E.O. (1996). Storage characteristics and quality evaluation of cowpea-fortified
traditional foods. B.Sc. Dissertation, Department of Nutrition and Food Science, University of Ghana, Legon- Accra, Ghana.
Alessandra Piras 1, Antonella Rosa 2, Danilo Falconieri, Silvia Porcedda, Maria. A. Dessì
and Bruno Marongiu, (2009). Extraction of Oil from Wheat Germ by Supercritical CO2, Molecules14: 2573-2581.
Ali Khoddami, Meredith A. Wilkes and Thomas H. Roberts. (2013). Techniques for Analysis of Plant Phenolic Compounds, Department of P lant and Food Sciences, University of Sydney, Molecules, 18: 2328-2375.
Anderson, R.A., H.F. Conway, V.F. Pfeifer and F. Griffin F. (1969). Gelatinization of corn grits by tool and extrusion-cooking. Cereal Sci. Today. 14: 11-12.
Anwar F., Sultana B., Przybylski R (2007). Antioxidant activity of phenolic components present in barks of barks of Azadirachta indica, Terminalia arjuna, Acacia nilotica, and Eugenia jambolana Lam. trees. Food Chemistry. 104:1106-1114.
Aremu, M. O., Olonisakin, A., Bako, D.A & Madu, P. C. (2006). Compositional studies and physiochemical characteristics of banana flour. Pakistan Journal of Nutrition, 5(4):
328 – 333.
Aruna Prakash, Fred Rigelhof and Eugene Miller (2014). Antioxidant Activity. Medallion Laboratories, Analytical Progress, Minnesota 55427.
Asiedu, J.J., (1989). Processing of tropical and subtropical crops. Machnillan Education publisher Ltd, London and Basingstoke.
Aslı Ozkok, Bruce D’arcy, Kadriye Sorkun (2010). Total Phenolic Acid and Total Flavonoid Content of Turkish Pine Honeydew Honey.Journal of ApiProduct and ApiMedical Science 2 (2): 65 – 71.

70
Asuman Kan. (2012). Chemical and elemental characterization of wheat germ oil (Triticum spp. L.) cultivated in Turkey. African Journal of Agricultural Research Vol. 7(35), pp. 4979 - 4982.
Adeyemi, I.A. and Beckley O., (1986) Effect of period of maize fermentation and souring on chemical properties and amyl grapy ur on millet biscuit characteristic. Plant Foods
Human Nutrition. 56: 195202.
Biniyam Tesfaye (2010).Development of cookies from wheat quality protein maize and carrot composite flour. Addis Ababa University, Technology Faculty.
Bishwajit Ghose, Marce-Amara Kpoghomou, Hasanbek Shamsitdinov, Arun Kumar Mondal, Sudeb Sarker. (2013). Nutraceutical potential of rice and wheat antioxidants and their
impacts on health. Oxidants and Antioxidants Medical Science 2013; 2(4):245-249.
Brand-Williams, W., M. and C. Berset, (1995). Use of free radical method to evaluate antioxidant activity, LWT-Food Science and Technology, 28 (1): 25-30.
Bruce, B., Spiller, G.A., Farquhar, J.W. (1997): Effects of a plant-based diet rich in whole grains, sun-dried raisins and nuts on serum lipoproteins. Int. J., 1, 58-63.
Bushra Sultana, Farooq Anwar and Muhammad Ashraf (2009). Effect of Extraction Solvent/Technique on the Antioxidant Activity of Selected Medicinal Plant Extracts, Department of Chemistry and Biochemistry ,Department of Botany, University of
Agriculture, Molecules, 14, 2167-2180.
Carlos A. da Silva, Doyle Baker, Andrew W. Shepherd, Chakib Jenane, and Serigo Miranda-
da- Cruz, (2009). Agro- industries for development, FAO and UNIDO. Agro-industries for Development P. 14-16.
Chatha, S.A.S.; Anwar, F.; Manzoor, M.; Bajwa, J.R. (2006). Evaluation of the antioxidant
activity of rice bran extracts using different antioxidant assays. Grasas Aceites Sevilla, 57, 328-335.
Central Statistical Agency of Ethiopia, (2011). Report on Large and Medium Scale Manufacturing and Electricity Industries Survey.
Damodaran, S. Damodaran and A. Paraf (Eds) (1997). Food proteins: An overview in:
Food proteins and their application New York.
Dar B.N. and Savita Sharma (2011). Total Phenolic Content of Cereal Brans using
Conventional and Microwave Assisted Extraction. Department of Food Science and Technology, Punjab Agricultural University, American Journal of Food Technology 6 (12): 1045-1053.
Dogan, I.S. (1998). Factors affecting cookie quality. Food Technology. 3: 72-76.
Efrem Teferi, Meskele Lera, Sahle Sita1, Zerihun Bogale, Daniel Gemechu Datiko (2010).
Treatment outcome of children with severe acute malnutrition admitted to therapeutic feeding centers in Southern Region of Ethiopia. Ethiopian Journal of health development 24(3).
El-Sayed M. Abdel-Aal and Iwona Rabalski. (2008). Bioactive compounds and their antioxidant capacity in selected primitive and modern wheat species. Agriculture and
Agri-Food Canada, Guelph Food Research Center, Guelph, Ontario, CA, The Open Agriculture Journal
Fennema, R.O., (1996). Food Chemistry. Third Edition. Marcel Dekker, Inc.USA.
71
Finley, N.J. (1989). Power foods; wheat germ. Better Nutrition. March, 19-27.
Fuhr, F.R. 1962. Cookie Spread: Its Effects on Production and Quality. Bakers Digest. 36, 56–60.
Fulcher, R.G., T.P. O. Brien and J.W. Lee, 1972. Studies on the aleurone layer. I. Conventional and fluorescence microscopy of the cell wall with emphasis on phenol-
carbohydrate complexes in wheat. Australia Journal of. Biological Science, 25: 23-24.
Gavin Owens. (2001). Cereal processing technology.
Gernah D.I.and K. Anyam (2014) Production and quality assessment of protein–rich biscuits
from blends of wheat and sefatted sesame flours. Department of Food Science and
Technology, Federal University of Agriculture, P.M.B. 2373, Makurdi, Nigeria,
Gipsy T. and Gustavo V. B. (2004). Rheology for the food industry. Department of Food Engineering, Journal of Food Engineering 67 (2005) 147–156.
Government of the Federal Democratic Republic of Ethiopia, (2007). National Nutrition
Communication – Food Science.
Gunars Tirzitis and Grzegorz Bartosz,(2010). Determination of antiradical and antioxidant activity: basic principles and new insights.
Han Soethoudt, Johan van der Riet, Yared Sertse, and Jim Groot. (2013). Food processing in
Ethiopia. Wageningen UR Food and Biobased Research,Institute Onderzoek.
Hautal, W.H. (2001). Advances with supercritical fluids-review. Chemosphere 43:123-135.
Holas, J., & Tipples, K. H. (1978). Factors affecting farinograph and baking absorption. Quality characteristics of flour stream. Journal of Cereal Chemistry, 55 , 637–652.
Horizon milling/ Cargill (2013). Defatted wheat germ. Simply milled special addition P.1-2 .
Hossain1 K., Ulven C., Glover K., Ghavami F., S. Simsek, M.S. Alamri, A. Kumar and M. Mergoum (2013). Interdependence of cultivar and environment on fiber composition
in wheat bran, Australian Journal of Food science, AJCS 7(4):525-531, ISSN: 1835- 2707.
Hruskova M. Bednarova M. and Novotny F. (2001) Czech Journal of Food Science ,Vol. 19,
No. 6: 213–218.
Hui,Y. H., Corke, H., Leyn, D. I., Kit Nip, W., and Cross, N., (2006). Bakery products
science and technology. Blackwell Publishing Ltd UK.
Inn, A., Hayakawa S., Ogawa, M., and Sun, Y. (2007). The improvement of rheological properties of wheat dough using porcine globlin glycated with sugar. Journal of
Biological Sciences, 7(2), 247-254.
Julia Gonen , N . D. (2005). Effects of Coffee and/or Caffeine on the Gastrointestinal Tract,
gaianaturopathic clinic where nature meets science, America.
Janaku, K.O., Dawodu F. A., Ajanaku C.O. and Nwinyi O.C. (2011). Functional and nutritional properties of spent grain enhanced cookies. American Journal of
FoodTechnology 6:763-771.
Jeffrey Calvin Moore, Doctor of Philosophy, Liangli (Lucy) Yu, (2007). Enhancing the
availability of natural antioxidants in wheat-based food ingredients and food products
72
through improved post- harvest treatments and processing conditions,Department of Nutrition and Food Science.
Kalekristos Yohannes. (2010). Influence of baking time and temperature on the quality of
kocho biscuit enriched with faba bean and wheat. P 38-40.
Karin de Punder and Leo Pruimboom. (2013). The Dietary Intake of Wheat and other Cereal
Grains and Their Role in Inflammation. Nutrients 5, 771-787;
Karin dePunder and Leo P. (2013). The dietary intake of wheat and other cereal grains and their role in inflammation. University of Girona, Plaça Sant Domènec, Spain and Uni
for Life, University of Graz, Austria.
Kaushik, R., Sharma N., Swami N., M. Sihag, A., Goyal P. (2013). Physico-Chemical
Properties, Extraction and Characterization of Gluten from Different Indian Wheat Cultivars Research & Reviews: A Journal of Crop Science and Technology, Volume 2, Issue 1, ISSN: 2319-3395.
Kesetebirhan A. (2011). Assessment of Feasibility and Potential Benefits of Food Fortification in Ethiopia II, State Minister of Health Federal Democratic Republic of
Ethiopia, P 57-60.
Kinsella, J. E. (1976). Functional properties of food proteins. Critical Reviews in Food Science and Nutrition, 7:219-280.
Korolchuk, Elizabeth, and Theodore A. (2005). A process for producing ultra fined milled whole-grain wheat flour and products thereof.
Lang, Q. Wai, C.M. (2001). Supercritical fluid extraction in herbal and natural product studies-a practical review. Atlanta. 53: 771-782.
Liangli Y. (2007). Wheat antioxidants, John Wiley Bicentennial. Department of Nutrition and
Food Science the University of Maryland.
Lilei Y., Anne-Laure Nanguet and Trust B. (2013). Comparison of Antioxidant
International Journal of Food Processing Technology, 1, 27-31 27
Lin M.Y, Humbert E.S, Sosulski F. (1974). Certain functional properties of sunflower meal products. Journal of Food Science. 39: 368.
Magdy Abdel-Aleem, Mohamed S., Sayed A., Sayed F. and Marwa M. S., Ali El G. (2014). Protective effects of wheat bran and buckwheat hull extracts against
hypercholesterolemia in male rats. International Journal of Advance Research.Volume 2, Issue 4, 724-736.
Manoela A. Vieira Karina N. de Simas, Leila do N. Vieira, Rossana Podestá , Ismael I.
Rockenbach, Carmen L.O. Petkowicz, João de Deus Medeiros Alícia de Francisco, of Edna R. Amante, (2006). Microstructure, nutrient composition and antioxidant
capacity king palm flour: A new potential source of dietary fiber.
Mcwatters, K.M. 1978. Cookie baking properties of defatted peanut, soybean and field pea flours in baking powder biscuits. Cereal Chemistry, 55: 853-863.
Mian K., Masood S., Faqir MA., Haq N. (2009). Preparation of fiber and mineral enriched defatted rice bran supplemented biscuits. Pakistan Journal of Nutrition, 8 (5): 571–
577.

73
Mridula, D.; R. K. Gupta And Manikantan, M.R. (2007). Effect of incorporation of sorghum flour to wheat flour on quality of biscuits fortified with defatted soy flour. American Journal of Food Technology, 2: 428 – 434
Muhammad Umair Arshad, Faqir Muhammad Anjum, Zahoor T. (2006). Nutritional assessment of cookies supplemented with defatted wheat germ. Institute of Food
Science and Technology, Journal of Food Chemistry 102 (2007): 123–128.
Muhannad Mazen Darwazeh. (2010). Effects of rumen filterate fermented wheat bran on performance of finishing broiler chickens, faculty of graduate studies /the
animal production program.
Mustafa Salih Hizir and Andrew R. Barron. (2013). Basic principles of supercritical fluid.
Nawrot, P. Jordan S., J. Eastwood, J. Rotstein, A. Hugenholtz and M. Feeley, (2003). Effects of caffeine on human health. Food Additives and Contaminants, Vol. 20, No. 1, 1–30.
Neil C. Doty, N. C. & Associates, LLC (2012). Value added opportunities and alternative
uses of wheat and barley.
Neil C. Doty, N. C. Doty & Associates, LLC. (2012). Value-added opportunities and
alternative Uses for Wheat and Barley. Agricultural utilization research institute. P.62-72.
Neli Darie, V. Jâşcanu, M., Ognean, Cristina Busuioc, S. Lungu, Claudia F. (2007). Studies
on obtaining high nutritional value products from wheat germ. Journal of Agroalimentary Processes and Technologies, Volume XIII, No.2, 439-442.
Odedeji J., and Adeleke, R.O. ( 2010). Functional properties of wheat and sweet potato flour blends. Pakistan Journal of Nutrition, 9: 535-538.
Oladele, A. K., and Aina, J. O., (2007). Chemical Composition and Functional Properties of Flour Produced from Two Varieties of Tigernut (Cyperus esculentus). African Journal of Biotechnology, 6 (21) 2473-2476.
Onyeneho SN, Hettiarachchy NS (1992). Antioxidant activity of durum wheat bran. Journal of Food Chemistry 40(9):1496–1500.
Oufnac, D.S., Z. Xu, T. Sun, C. Sabliov, W. Prinyawiwatkul and J.S. Gadber, (2007). Extraction of antioxidants from wheat bran using conventional solvent and
microwave-assisted methods. Journal of Cereal Chernistry, 84: 125-129.
Piergiovanni L. and Farris S. (2008). Effects of ingredients and process conditions on ‘Amaretti’ cookies characteristics. International Journal of Food Science &
Technology. Volume 43, Issue 8, pages 1395–1403.
Rajaram, S.; Macpherson, H.G. (2002). Plant production and protection series.
Reverchon, E. Marrone, C. (2001). Modeling and simulation of the supercritical CO2 extraction of vegetable oils. Journal of Supercritical Fluid. 19:161-175.
Sabaté, J, Fraser, G.E., Burke. K, Knutsen, S.F., Bennett, H., Lindsted, K.D. (1993). Effects
of walnuts on serum lipid levels and blood pressure in normal men. England Journal of Medicine, 328: 603-607.
Sahar R. Abd El-Hady. (2012). Utilization of defatted wheat germ flour as nutrient supplement of biscuits. Food Technology Department, Journal of Agriculture research Kafer El-Sheikh University. Egypt.
74
Sandra Bastin, (2010). Super star cookies baking chief, University of Kentucky College of Agriculture.
Saskia De Pee, Martin W Bloem. (2008). Current and potential role of specially formulated
Programme, Rome, Italy.
Satinder Kaur, Savita Sharma and H.P.S Nagi, (2011). Functional properties and anti-
nutritional factors in cereal bran, Department of Food Science and Technology, India, Asian Journal of Food and Agro-Industry, 4(02): 122-131.
Shewry P. R. (2009). Darwin Review Wheat, Department of Plant Sciences, Journal of
Experimental Botany, Vol. 60, No. 6, pp. 1537–1553.
Shivani Bansal & M. L. Sudha. (2011). Nutritional, micro-structural, rheological and quality
characteristics of biscuits using processed wheat germ flour. Milling, Baking & Confectionery Technology Department. International Journal of Food Sciences & Nutrition,62 (5): 474–479.
Shrestha, A. K., & Noomhorm, A. (2002). Comparison of Physicochemical properties of biscuits supplemented with soy and kinema Flours. International Journal of Food
Science and Technology, 37, 361–368.
Siddhuraju, P.; Becker, K. (2003). Antioxidant properties of various extracts of total phenolic constituents from three different agroclimatic origins of drumstick tree (Moringa
oleifera lam.) leaves. Journal of Agricalture and Food Chemistry. 51, 2144-2155.
Sosulski FW., Garratt MO., Slinkard AE. (1976). Functional properties of ten legume flours.
Institute of Food Science Technology.
Spiller, G.A., Bruce, B. (1997). Nuts and healthy diets.
Sudha, M.L., R. Vetrimani and K. Leelavathi. (2007). Influence of fiber from different
cereals on the rheological characteristics of wheat flour dough and on biscuit quality. Food Chemistry, 100(4): 1365-1370.
Sukhcharn Singh, C. S. Riar and D. C. Saxena. (2008). Effect of incorporating sweet potato flour to wheat flour on the quality characteristics of cookies. Department of Food Engineering and Technology, Sant Longowal Institute of Engineering and
Technology, Longowal, India.
Sumnu, S., and Sahin, S., (2008). Food Engineering Aspects of Baking Sweet Goods, CRC
Press Taylor & Francis Group.
Surget A, Barron C (2005). Histologie du grain de bleo . Ind Ce´r 145:3–7.
Szabolcs I (1989). Salt affected Soils. CRC Press, Inc. Boca Raton,Florida, USA. P.274.
Taha, M. R., Majdi, A. A., and Khalil, I. E., (2006). Effect of chickpea, broad bean, or isolated soy protein additions on the physicochemical and sensory properties of
biscuits. Jordan University of Science and Technology, Jordan.
Tapan Seal, Kaushik Chaudhuri and Basundhara Pillai, (2013). Effect of solvent extraction system on the antioxidant activity of some selected wild edible fruits of Meghalaya
state in India. Journal of Chemical and Pharmaceutical Research. 5(1):276-282.
Tapsell, L.C., Gillen, L.J., Patch, C.S., Batterham. M., Owen. A., Baré, M., Kennedy, M.
(2004). Including walnuts in a low-fat/modified-fat diet improves HDL cholesterol-to-total cholesterol ratios in patients with type 2 diabetes. Diabetes Care. 27, 12-27.

75
Tish B. (2002). The good cookie over 250 delicious recipes from simple to sublime, John Wiley & Sons, Inc. United States of America.
Tomas Kosík, Magdaléna Lacko-Bartošová, Ľubomír Kobida, (2014). Free Phenol Content
and Properties of Refined and Whole Wheat Flour and Bread, Department of Food Science. Antioxidants 2: 370-383.
Toufeili, I, Habbal, Y, Shadarevian, S & Olabi, A. (1999). Substitution of wheat starch with non wheat starches and cross- linked waxy barley starch affects sensory properties and staling of Arabic bread. Journal of the Science of Food and Agriculture 79(13):1855-
1860.
Uma Ballolli (2010). Development and Value Addition to Barnyard Millet (Echinochloa
Frumantacea Link) Cookies. Department of Food Science and Nutrition.
Jideani, V. A. (2011). Functional properties of soybean food ingredients in food systems- soybean -Biochemistry, Chemistry and physiology, department of food technology,
intech open science.
Vaher, M., Matso, K., Levandi, T., Helmja, K., Kaljurand, M., (2010). Phenolic compounds
and the antioxidant activity of the bran, flour and whole grain of different wheat varieties. Proceed. Chem. 2, 76–82.
Wheat foods councils (2005). Grains of truth about cookies.
Zohra Mohammedi( 2011). Impact of solvent extraction type on total polyphenols content and biological activity From Tamarix Aphylla (L.) Karst.Department Of Biology,
Faculty Of Science, University Of Mascara, Algeria. International Journal of Pharmaceutical and Bio Sciences Vol2/ Issue 1.
Zoulias, V.E., Oreopoulou, V. and Kounalaki, E. (2002). Effect of fat and sugar replacement
on cookie properties. Journal of Science. of Food and Agriculture, 82,1637-1644.

76
Appendices
Appendix I: Scorecard for the sensory quality evaluation using nine point hedonic scales
Nine Point Hedonic Scaling Scored-Card for Cookies
Date .........................................
Name....................................................... Instruction: Taste the coded cookies samples. Fill your appropriate scores which best
describes your feeling (according to the 9-point hedonic scale below). Please rinse your
palate by drinking water in between samples.
9. Point Hedonic Scaling
9. Like ext remely 6. Like slightly 3. Dislike moderately
8. Like very much 5. Neither like nor d islike 2. Dislike very much
7. Like moderately 4. Dislike slightly 1. Dislike ext remely
If you have additional Comments/suggestions please do not hesitate to jot down:
......................................................................................................................................................
......................................................................................................................................................
......................................................................................................................................................
......................................................................................................................................................
......................................................................................................................................................
...................................................................................................
Thank you!
Sample
Code
Attributes
Appearance Color Flavor Texture Taste Overall accept.
BWFT1
BWFT2
BWFT3
BBR1T1
BBR1T2
BBR1T3
BBR2T1
BBR2T2
BBR2T3
BBR3T1
BBR3T2
BBR3T3

77
Appendix II
Score card for the sensory quality evaluation using nine point hedonic scales
Nine Point Hedonic Scaling Scored-Card for tea substitute
Date .........................................
Name.......................................................
Instruction: Taste the coded samples (a-d). Fill your appropriate scores which best describes
your feeling (according to the 9-point hedonic scale below). Please rinse your palate by
drinking water in between samples.
9. Point Hedonic Scaling
9. Like ext remely 6. Like slightly 3. Dislike moderately
8. Like very much 5. Neither like nor d islike 2. Dislike very much
7. Like moderately 4. Dislike slightly 1. Dislike ext remely
If you have additional Comments/suggestions please do not hesitate to jot down:
......................................................................................................................................................
......................................................................................................................................................
......................................................................................................................................................
......................................................................................................................................................
......................................................................................................................................................
...................................................................................................
Thank you!
Sample
Code
Attributes
Appearance Aroma Mouth
Feel
Flavor Overall
acceptability
A
B
C
D
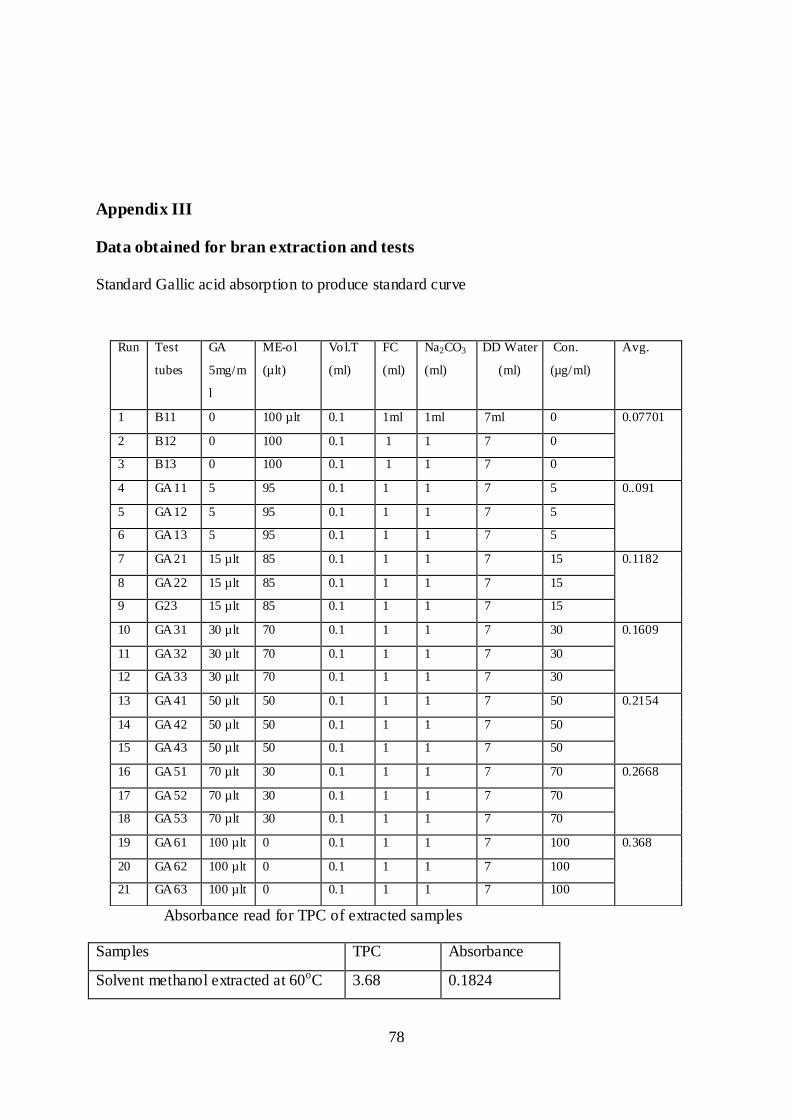
78
Appendix III
Data obtained for bran extraction and tests
Standard Gallic acid absorption to produce standard curve
Absorbance read for TPC of extracted samples
Samples TPC Absorbance
Solvent methanol extracted at 60oC 3.68 0.1824
Run Test
tubes
GA
5mg/m
l
ME-o l
(µlt)
Vol.T
(ml)
FC
(ml)
Na2CO3
(ml)
DD Water
(ml)
Con.
(µg/ml)
Avg.
1 B11 0 100 µlt 0.1 1ml 1ml 7ml 0 0.07701
2 B12 0 100 0.1 1 1 7 0
3 B13 0 100 0.1 1 1 7 0
4 GA11 5 95 0.1 1 1 7 5 0..091
5 GA12 5 95 0.1 1 1 7 5
6 GA13 5 95 0.1 1 1 7 5
7 GA21 15 µlt 85 0.1 1 1 7 15 0.1182
8 GA22 15 µlt 85 0.1 1 1 7 15
9 G23 15 µlt 85 0.1 1 1 7 15
10 GA31 30 µlt 70 0.1 1 1 7 30 0.1609
11 GA32 30 µlt 70 0.1 1 1 7 30
12 GA33 30 µlt 70 0.1 1 1 7 30
13 GA41 50 µlt 50 0.1 1 1 7 50 0.2154
14 GA42 50 µlt 50 0.1 1 1 7 50
15 GA43 50 µlt 50 0.1 1 1 7 50
16 GA51 70 µlt 30 0.1 1 1 7 70 0.2668
17 GA52 70 µlt 30 0.1 1 1 7 70
18 GA53 70 µlt 30 0.1 1 1 7 70
19 GA61 100 µlt 0 0.1 1 1 7 100 0.368
20 GA62 100 µlt 0 0.1 1 1 7 100
21 GA63 100 µlt 0 0.1 1 1 7 100

79
Absolutemethanol extracted at 60oC 3.58 0.1793
Methanol extracted at 80 oC 2.15 0.1381
Methanol extracedt at 40 oC 1.037 0.10577
Scavenging capacity using DPPH for control and two samples
Standard Gallic acid curve (absorption Vs concentration)
Concentration (mg/ml)
Ascorbic
acid
Solvent
methanol
bsolute
Methanol
0
0 0 0
0.5
18.7 6.623 4.322
2
90 58.37 40.752
2.5
96 68.685 54.595
5
91.5 83 79.567
10
92 86.605 82.567