EVALUATION OF MILLING PERFORMANCE OF A 1½
50
AGRICULTURAL ENGINEERING EVALUATION OF MILLING PERFORMANCE OF A 1½ BELL GRINDING MILL MANUFACTURED AT HELIDES ENGINEERING BY TSOKA KUDZANAI R049698D SUPERVISORS MR P RWAKATIWANA AND MR A CHIGARISO An undergraduate Research Project submitted in partial fulfillment of the requirements of the degree of Bachelor of Science Honors in Agricultural Engineering. UNIVERSITY OF ZIMBABWE PO BOX MP167, HARARE JULY 2008
Transcript of EVALUATION OF MILLING PERFORMANCE OF A 1½

AGRICULTURAL ENGINEERING
EVALUATION OF MILLING PERFORMANCE OF A 1½
BELL GRINDING MILL MANUFACTURED AT HELIDES
ENGINEERING
BY
TSOKA KUDZANAI
R049698D
SUPERVISORS
MR P RWAKATIWANA
AND
MR A CHIGARISO
An undergraduate Research Project submitted in partial fulfillment of
the requirements of the degree of Bachelor of Science Honors in
Agricultural Engineering.
UNIVERSITY OF ZIMBABWE
PO BOX MP167, HARARE
JULY 2008

i
ABSTRACT
The milling performance of a 1½ Bell grinding mill was evaluated taking
parameters such as throughput, milling efficiency, quantitative loss, power
requirement, uniformity of milled particles and major causes of breakdown
into consideration. It was hypothesized that the throughput of the grinding
mill was greater than 850kg/hr; milling efficiency would be greater than
65% whilst the quantitative losses would not exceed 10% of the initial mass
fed. Masses between 50kg and 25kg were milled to investigate the above
parameters using the 1½ Bell grinding mill for maize with the same moisture
content.
The throughput obtained was relatively higher than that expected were as the
quantitative losses and power requirement was lower than what was
hypothesized. The predicted hypotheses were proved to be true. The
particles of the milled products were relatively uniform falling within the
required standards for grinding mills. Major causes of breakdowns were
obtained from a questionnaire with most of them being due to lack of
knowledge on machine operation.
The 1½ Bell grinding mill was proved to be an effective and efficient
milling machine which can be used for different milling operations at
different industrial levels in Zimbabwe.
ii
ACKNOWLEDGEMENTS
Special thanks for the support and technical know how provided by Mr A
Chigariso from Helides Engineering.
I also articulate my sincere gratitude to my dedicated supervisor Mr P
Rwakatiwana for expert advice and encouragement during the course of the
project.
I would also like to thank the Agricultural Engineering department technical
staff for the technical assistance.

iii
DEDICATION
To the most high God for his grace is sufficient and his mercy endures
forever.

iv
TABLE OF CONTENTS
CHAPTER 1……………………………………………………………….1
1.0 INTRODUCTION…………………………………………………..1
1.1 JUSTIFICATION…………………………………………………...3
1.2.0 OBJECTIVES………………………………………………….5
1.2.1 Main objective………………………………………………….5
1.2.2 Specific objectives……………………………………………...5
1.2.3 Hypothesis……………………………………………………...5
CHAPTER 2……………………………………………………………….6
2.0 LITERATURE REVIEW……………………………………….......6
2.1 Equipment operation……… ……………………………………….11
2.2.0 Factors to consider in specifying a size reduction system….…….12
2.2.1 Feed control……………………………………………………….12
2.2.2 Milling discharge…………………………………………………12
2.2.3 Energy consumption………………………………………………12
2.2.4 Moisture content…………………………………………………..13
2.3.0 Pneumatic Conveyor System .........................................................14
2.3.1 Limitations of a conveyor System………………………………...15
2.4.0 Size reduction machine operation and performance……………..15
2.5.0 Flowchart for the milling operation………………………………16
2.6.0 Screening………………………………………………………….16
2.6.1 Factors affecting screening operation…………………………….17
CHAPTER 3………………………………………………………………19
3.0 METHODOLOGY...……………………………………………….19
3.1 Determination of throughput……………………………………….19
3.2 Determination of milling efficiency………………………………..20
3.3 Power consumption………………………………………………...20
3.4 Determination of particle uniformity…………………...…………..21
3.5 Determining losses during milling………………………………….22
3.6 Determining the major causes of breakdown.………………………22
CHAPTER 4………………………………………………………………23
4.0 Results………………………………………………………………23
v
4.1 Throughput..………………………………………………………...23
4.2 Milling efficiency..………………………………………………….24
4.3 Power consumption…………………………………………………25
4.4 quantitative losses…………………………………………………..28
4.5 Uniformity of milled particles………………………………………29
4.6 Major causes of breakdown………………………………………...30
CHAPTER 5………………………………………………………………32
5.0 Discussion of Results……….………………………………………32
5.1 throughput…………………………………………………………..32
5.2 Power requirement ………………………………………………....32
5.3 Quantitative losses…………………………………………………..32
5.4 Milling efficiency…………………………………………………...33
5.5 Uniformity of milled particles………………………………………33
5.6 Major causes of breakdowns………………………………………..34
CHAPTER 6………………………………………………………………35
6.0 Conclusions…………………………………………………………35
6.1 Throughput…………………………………………………...35
6.2 Quantitative losses…………………………………………..35
6.3 Causes of losses……………………………………………..35
6.4 Milling efficiency……………………………………………36
6.5 Power requirement…………………………………………..36
6.6 Uniformity of milled particles……………………………….36

1
CHAPTER ONE
1.0 INTRODUCTION
Due to the Government initiated black empowerment program there has
been a marginal increase in the number of small to medium scale
manufacturing companies. This has also been necessitated by the exodus
of large commercial companies and the increased number of government
support programmes. For example, in 2007 fifteen billion dollars was
disbursed for small to medium enterprises revolving fund (Dr G Gono,
2007). This has also received a major boost by the launching of the third
phase Agricultural Mechanization Programme of which there is now an
increased demand for agricultural machinery. This increase in demand
for agricultural machinery has resulted in the need to perfect the
operations of small to medium scale equipment.
Although there has been an increase in the number of players in the
manufacturing of agricultural equipment, there has been stunted growth
in the marketing of products due to lack of information on the operation
of these products. It has been observed that equipment operators in the
developing countries have been poorly provided with information and
guidelines to make realistic machinery evaluations. Technical
performance and data gained from machinery testing has been limited
and rarely presented with the customer in mind while other information
needed for effective evaluation of information and its use in machinery
selection is not available (FAO, 1995). In addition, according to FAO
1995 realistic methodologies for collection and evaluation of information

2
and its use in machinery selection are not yet established while
consumers have had little encouragement to participate in formulating
them.
Agricultural processing has been defined as any activity that is performed
to maintain or improve quality or to change the form or characteristics of
any agricultural product (Sahay and Singh, 1999). Processing operations
are undertaken to add value to agricultural materials after their
production of which grain milling is one of the operations. The milling
industry in Zimbabwe has seen the design and development of various
types of machines with different milling techniques. Some of these
include attrition mills, ball mills and hammer mills. Great emphasis has
been put in speed, throughput and power resulting in the need for
evaluation of other parameters such as prediction of losses during milling
process and energy efficiency especially for products produced by small
to medium manufacturing companies. This can enable upcoming
companies like Helides Engineering to compete with well established
companies since useful information will be available to the miller.
One big step in improving competition at Helides Engineering with the
well established companies like Precision Grinders, Tunroy and
AgricAfrica is through performance evaluation of some of its products.
This includes the evaluation of milling performance of the 1½ Bell
Grinding Mill manufactured by the latter. The 1½ Bell Grinding Mill is a
hammer that is relatively compact in stature hence it can be easily
transported from one place to the other. Furthermore, the rotor assembly
is evenly balanced thereby reducing noise and vibrations, which makes it

3
environmentally friendly. Moreover, it can be fitted with sieves of
different sizes depending on product requirement which makes it highly
flexible. In addition it can also be easily maintained since it is locally
made which gives it an urge over the imported grinding mills. Due to the
fact that it has not been performing as expected on the market there is a
need to evaluate it so as to make amends on the available loop holes.
1.1 JUSTIFICATION
Even though a lot has been done in the design and fabrication of grinding
mills at Helides Engineering little has been done in the evaluation of
milling machines among them the 1½ Bell grinding mill. The current
power shortages being experienced in Zimbabwe makes it imperative for
one to assess the power requirements of the 1½ Bell grinding mill during
the milling process so as to come up with energy saving measures
thereby improving its competitiveness on the market. Thus it will be able
to compete with grinding mills from well established companies like
Hippo Hammer mills, AgricAfrica Pvt Ltd and Tanroy Engineering.
Furthermore, evaluation will give the miller an insight into production
capacity for the grinding mill for example the Ndune mill in Kenya was
found to have a capacity of 70-200kg/hr for small grains and 400-
2550kg/hr for large grain (ELA Publications, 1985). The given data thus
gives the miller a prediction on the amount of grain that can be milled in
a given period of time hence it is possible to assess whether one can
meet the given targets.

4
In addition, there is a need for performance evaluation so as to assess or
to predict quantitative losses that occur during the milling process and
coming up with measures or methods that can be implemented to reduce
some of the losses. The latter is also important in the determination of
quantity of grain that is required to produce a certain tonnage of possibly
mealie meal taking losses during milling into account.
Moreover, there is a need for assessing the quality of product that is
produced with the standards set by the buyer (Krammer and Twigg,
1970, Chapter 3). Particle size analysis found that 44 to 88% by weight
of the mass exiting the mill was within the same size distribution
(Brennan, 1976). Particle size analysis is important in determining the
uniformity of the milled product, which is important in adding value to
the milling machine and also to the produced product hence maximizing
profits. Size is additionally closely related to quality and appearance of
product, and also has a direct bearing on how certain manufacturing
operations are perfumed. Colour of product can also be enriched if
particle size and shape are uniform. Hence form the foregoing statements
it will be seen that the objective of size reduction or milling is to make a
product which meet certain specifications hence marketing of grinding
mills from Helides Engineering will be enhanced if the above
specifications are determined.
There was also a need for evaluating the milling performance of the 1½
Bell grinding so that improvements on the existing designs can be made.
The study was also important to ensure availability of quantified

5
technical data on milling performance to the miller or consumer of the
product.
1.2 MAIN OBJECTIVE
To evaluate the milling performance of a 1½ Bell grinding mill
1.3 SPECIFIC OBJECTIVE
To determine throughput of the machine.
To determine losses during the milling process.
To determine the milling efficiency.
To assess the uniformity of particles after size reduction.
To assess the major causes of breakdowns.
To determining the power requirement during milling process for
different grain varieties.
1.4 HYPOTHESES
Throughput is greater than 850kg/hr.
Less than 10% of quantitative losses occur during the milling process.
Milling efficiency should be greater than 65%.

6
CHAPTER TWO
2.0 LITERATURE REVIEW
In 1985 maize accounted for 43% of cereal production in Africa,
sorghum and millet, wheat, and rice accounting for 28%, 11% and 11%
respectively. These figures show that 93% of what is produced in crop
production consists of cereals and therefore there is much demand for the
processing of cereals and thus includes the milling operation (ELA
Publications, 1985). The aim of milling process is to achieve an
economic size reduction at minimum cost (Brennan, 1976). Thus
evaluations of technical performance should be carried out so as to give
the consumer a wide range of options in the selection of machines with
quantified values of performance.
Evaluation consists of the engineering parameters established during
testing combined with economic and ergonomic parameters, all of which
relate to the performance of the equipment, machine or tool (FAO, 1992).
Quantifying of parameters such as uniformity of milled particles, milling
efficiency, energy efficiency, throughput and maintenance requirements
gives information to the user or buyer in deciding on what milling
equipment to buy in relation to intended use. For example, the M16 from
AgricAfrica product catalogue with a 30hp, Star Delta and with a
throughput of 1500kg per hour (AgricAfrica, 2008). But there is no
adequate information on other important factors such as the milling

7
efficiency and energy efficiency, which are of great interests to the miller
during the current economic hardships being experienced in Zimbabwe.
Well established manufacturing companies have been advertising their
products with respect to how they perform during the milling process
mainly in terms of capacity and this has been a major setback on the
marketing of products produced by the small to medium scale
engineering companies venturing in design and fabrication of grinding
mills. One way in which the small to medium scale engineering
companies should advertise their product should be similar to the way
Tinytech advertise the Tinytech maize mill (www.tinytechindia.com).
This mill is referred to as:
-The simplest appropriate scientific design
-Very simple and easy to operate
-Long reliable and trouble free operation
-Pay back period against investment, less than three months
-Highly profitable for custom milling
It also includes technical details like:
-Three easily replaceable sieves are provided for desired fineness of flour
-Inner housing made of steel is easily explicable
-Design is based on hammer mill principle
In this design, there is an advantage of using three replaceable sieves,
which are responsible for improving the degree of fineness. It is also
advantageous when one of the sieves fails because there is always a
backup sieve to do the screening process. The mesh of the screen
determines the particle size; a 1mm size is suitable for most human

8
foods, whereas a 3mm hole is preferred for animal feed (IT, Publications,
1985). Though technical details on the Tinytech maize mill is provided
there is no detail when it comes to the issues involving throughput,
milling efficiency and energy efficiency which is important when
marketing products especially in Zimbabwe where there is currently a
shortage of cereal grains and also experiencing electrical shortages.
ZESA reduced their power generation by about a third from 750
megawatts to 550megawatts (The Herald, 29 October, 2007). There is a
need for using grinding mills that require minimum energy whilst getting
the desired output.
Another grinding mill that is available on the world market is the
Vibrokinetic Energy mill from MicroGrinding systems Inc. The VKE is
regarded as the most efficient, extremely fast and very energy efficient.
The VKE mill is very versatile, can be operated wet or dry, simple low
cost and practically maintenance free. Energy savings of 50% or more
over the other types of mills by use of high-speed type vibratory motion,
which increases the grinding impact rate resulting in faster grinding
(www.microgrindingsystems.com). The marketing of the VKE puts more
emphasis in energy efficiency, which is the most appropriate for the
Zimbabwean situation, but there is inadequate information provided for
other parameters such as throughput and losses incurred during the
milling process.
An example of a hammer mill manufactured in Zimbabwe is the hippo
mill from precision grinders. It is an ISO 9002 certified product. Can be
sold either as electric or diesel powered which widens its market

9
spectrum to remote locations without electricity. It is an ideal machine
for farmers, contract millers and businesses that require high performance
and reliability. It is available in three different sizes i.e. 500kg/hr to
4ton/hr. There are 7 different screens available which makes it flexible
enough to mill other cereals besides maize and even silage. There is also
a full spares backup guarantee which reduces expenses of having to
import spares in the event of a breakdown thereby reducing maintenance
costs. It is robust and can be operated for long hours which makes it
suitable for millers that operate in double shifts. It is a device that can be
easily serviced and it also comes with comprehensive operator’s manual
which is one of the things that lacks on the 1½ Bell grinding mills. The
complex rotor assembly is evenly balanced to ensure free rotation and
longer bearing life (www.pgehippo.co.zw). Figure below shows the
picture of the hippo mill

10
Assessment of how much energy in kilowatt-hours is required to achieve
a given performance rate and how many hours of labour for the mill staff
does this represent (ELA, Publications, 1985). The Swepco Vibro
Grinding mills are the most versatile type of mill available today for fast,
low cost particle size reduction to sub-micron range. Vibro Energy
grinding action achieves higher output per unit input horsepower, precise
control of size of few moving parts and replaceable linings made
abrasion resistant ceramic or elastomers. Information on performance has

11
been provided but there is no quantitative data or actual figures on the
given information. There is also missing information on issues
concerning losses or estimation of losses during milling process neither is
there any data on particle uniformity of the products.
The type of grinding media utilized identifies the type of grinding mill.
Each type of mill has characteristics that adopt it to certain grinding
applications. The operational characteristics of each mill type must be
evaluated in relation to the objectives of the grinding mill requirements
being studied in order to select the optimum mill
(www.miningbasics.com).
2.1 EQUIPMENT OPERATION
For proper selection and economical operation of size reduction
machinery, attention must be given to many details and procedure of
auxiliary equipment. A milling machine cannot be expected to perform
unless;
1. The feed is of suitable size and enters at a uniform rate
2. The product is removed as soon as possible after particles are of
desired size
3. Unbreakable material is kept out of the machine
4. In the event of low melting and heat sensitive products blowers
and pumps should remove the heat generated in the mill.

12
2.2 FACTORS TO CONSIDER IN SPECIFYING A SIZE
REDUCTION SYSTEM
2.2.1 Feed control
Control of the feed in the mill is the most important. The particles in the
feed must be of appropriate size. In continuous mills the feed rate must
be controlled within close limits to avoid chocking and erratic variations
in load and yet make full use of the capacity of the machine (Kukla and
Hixon 1991)
2.2.2 Mill discharge
Rate of discharge must be equal to rate of feed to avoid build up in a
continuous mill. Furthermore, the discharge rate must be such that the
working parts of the mill can operate most efficiently in the interval to be
reduced. A sweep of air removes product from the hammer mill
(McGraw Hill, Chemical Engineering Series).
2.2.3 Energy consumption
Enormous quantities of energy are consumed during the size reduction
operations. Over 99% of energy goes to the operating of the equipment,
producing undesirable heat and noise leaving less than one percent for
creating of new surface (Warren, 1973). This shows that there is a need

13
for evaluation of grinding mills so as to come up with new energy saving
designs to improve on the milling efficiency. The energy requirement for
any milling process is also affected by types and condition of products to
be produced such as grains, size of hammer screens and hence fineness of
grind and hammer mill loading conditions. These include moisture
content, bulk density, texture, size, and aerodynamic characteristic of
products. The mill condition include rate at which mill is fed with grain
and coupling efficiency of the prime move and mill (D.M.Nyang, 2003).
Certain improvements have been done in development of energy saving
technologies for the food processing industry. These include;
1. The needy to improve efficiency of each unity operation by design
improvement.
2. Development of new processes or products that consume less
energy than traditional processes for example grain conditioning
before the milling process
2.2.4 Moisture content
Materials do not flow well if they contain high moisture contents
(Coulson, 1978). Under these conditions the material tends to cake
together in the form of balls. Hence there is a need for evaluation of the
proper milling moisture content for various grains so as to improve on the
milling efficiency.

14
2.3 PNEUMATIC CONVEYOR SYSTEM
The pneumatic conveyor system plays an important role in determining
the optimum performance of a grinding mill. It is a system mainly used
for moving milled products in a closed duct system by a high velocity air
stream. It is a continuous and flexible transportation method by which the
material is carried in pipelines either by suction or blowing pressure of
air stream. The milled material because of high pressure is conveyed in a
dispersed condition and for this dispersion air velocity in the range of 15-
30m/s is necessary (Sahay and Singh, 1999).
The conveyor system needs a source of air blowing or suction, means of
feeding the product into the conveyor, ducts and a cyclone receiving
hopper for collection of products. As for the 1½ Bell a blowing or
positive pressure system is used to convey the products by using air
pressure greater than atmospheric pressure. The system used consists of a
fan or blower, an air lock feeder for introducing the product into the
system, ducts and a suitable air and product separating device. The
product is fed into the conveying system through the bottom of the
hopper. The feeder should be able to feed product at a specified rate in a
pneumatic conveyor system from the supply hopper at a certain pressure
to the other conveying pipeline at another pressure.
A fan is used to deliver the specified volume of air to transport the milled
products through the conveying pipeline (ducts) to the cyclone separator.
The supply pressure depends upon the working pressure drop required for
the length of the conveying line and properties of the conveyed products.

15
The cyclone separator is used for separation of product particles from air
or in other words it is a device which removes the bulk of the product
from the conveying air stream by centrifugal force. In some cyclone
separators, a fabric filter is attached to remove residual dust and fine
product particles from the air stream. The conveying air is first passed
through the cyclone and then goes for secondary separation of finer
particles.
2.3.1 Limitations of pneumatic conveying
1. Erosion of air ducts by abrasive product particles in a conveying air
stream
2. In case of bends and misaligned sections, the erosion of ducts is
severe.
3. There are high chances of repeated impacts between particles and
solid surfaces and this may lead to product degradation and this in
turn might diminish the market value of the products.
2.4 Size reduction machine operation and performance
To achieve good results from any size reducing machine the following
should be given due care.
Feed should be of proper size and feeding rate should be uniform.
Hard and unbreakable material should not be allowed to enter the mill.
There should be some arrangement to remove the excess heat
generated during the milling operation.

16
There should be an air lock system that separates the conveyor system
from the conveyor system for efficient transportation of products.
2.5 FLOW CHART FOR THE MILLING OPERATION
Feed
Product
2.6.0 SCREENING
Screening is one of the most important parameters that affect the milling
performance of a hammer mill. By definition screening is the unit
operation in which a mixture of various sizes of solid particles is
separated into two or more fractions by passing over a sieve
(J.G.Brennan at al, 1969). A screen contains a number of equally sized
apertures. On a grinding mill these are selected in relation to the required
particle size of the product. The smaller the apertures on the screens the
higher the energy required for size reduction since the feed will have take
longer in the action zone before they could pass through the sieves and
Grinding
chamber
Screens Pneumatic
conveyor
Cyclone separator

17
the higher will be the cost of production (Leninger ,1911). The former
statement is closely related to throughput since throughput decreases with
increasing fineness.
2.6.1 Factors affecting screening operation
1. Rate of feeding
If the rate of feeding is too high, insufficient residence time on the
screening surface will result. This causes overloading on the screen
surface and as a result material capable of passing through the sieve
will leave with the oversize and thereby increasing the milling time.
2. Moisture
The presence of high moisture content in the feed can cause adhesion
between small and large particles and this will result in blinding or
clogging of the sieves. Aspect of moisture content is of paramount
importance in determining milling performance hence there is a great
need for identifying the optimum moisture content to prevent
clogging of screens.
3. Worn or damaged sieves
Oversize particles will pass through the damaged area and the
efficiency of the separation will be impaired. This has got a huge
effect on the uniformity of milled particles and It tends to reduce the

18
price of the product produced hence damaged screens should be
repaired immediately

19
CHAPTER THREE
3.0 METHODOLOGY
Determination of milling efficiency, throughput and energy consumption
measurements was carried out at Helides Engineering and Betta milling
company located at 128 Willovale road just opposite High Glen shopping
center. Whilst particle size analysis were investigated at the University of
Zimbabwe laboratories
3.1 Determination of throughput
Masses of 50kg and 25kg were measured using a mass balance and these
were milled respectively with time taken to feed each sample recorded
using a stop watch. Four replicas for each mass were milled using the
above procedure so that we can get a better estimate of the throughput.
The throughput was then calculated using the formula below.
Throughput = mm Tm
Where; mm is mass of milled grain
Tm time taken to mill the grain

20
Figure 3.1
Figure 3.1: The setup that was used for throughput measurements at Betta milling
company
3.2 Determination of milling efficiency
Masses of grain between 25 and 50kg masses were measured using a
mass balance. The milling efficiency of the 1½ Bell grinding mill was
obtained by the percentage ratio of mass of milled product to mass of
feed as shown by the equation below
Milling efficiency= mp*100
mf
Where; mp is the mass of product and mf is the mass of feed
3.3 Power consumption during milling process
To measure power requirement an ammeter was connected between
the electric motor of the grinding mill and the electrical supplies.

21
The current taken up by the machine when there is no input of grain
i.e. the idle current before commencement of milling process was
measured using an ammeter.
The feed was then emptied into the milling machine at a constant feed
rate. Meter readings were taken after every 5seconds intervals until all
the grain was milled. This was shown when the meter reading goes
back to the idle power.
Voltage readings were taken using a voltmeter across the power
supplies.
Power was then obtained by using P=VI where P is the power
required during the milling process, V is the average voltage obtained
and I is the current difference between the maximum current and the
idle current
3.4 Determination of particle uniformity
Tyler meshes were used to determine particle size. In the analysis of
milled products a set of standard sieves was arranged sequentially
according to size with the pan at the bottom and the smallest sieve at the
top. The samples were placed on the top most sieve and the set was
placed on a sieve shacking machine for 5 minutes.
The fineness modulus which indicates the uniformity of ground products
was determined by adding the weight fractions retained above each sieve
divided by 100 (Sahay and Singh, 1999).

22
3.5 Determining losses during milling
Quantitative losses were determined by subtracting mass of milled
product from mass of feed. Mass of feed and product was measured using
a mass balance. This was then obtained by the following formula;
L=mp-mf
Where; mp is the mass of product in kg
mf is the mass of feed in kg
3.6 Assessing frequency of breakdown.
Frequency of breakdown was assessed by the use of a questionnaire
which was disbursed to individual people who operate the grinding mill
or companies who have purchased the product. Data was analysed using
SPSS (Statistical Package for Social Studies). The basic structure of
questions is shown below;

23
CHAPTER 4
Results From obtained data of throughput from different trials graphs of
throughput and number of trials was plotted. This is important so that
a better estimate of the through is obtained.
Figure 4.1: shows the general variation of average throughput
with the number trials.
From the graph in figure 4.1 it is seen that the throughput was almost
constant through out the different trials carried out.
24
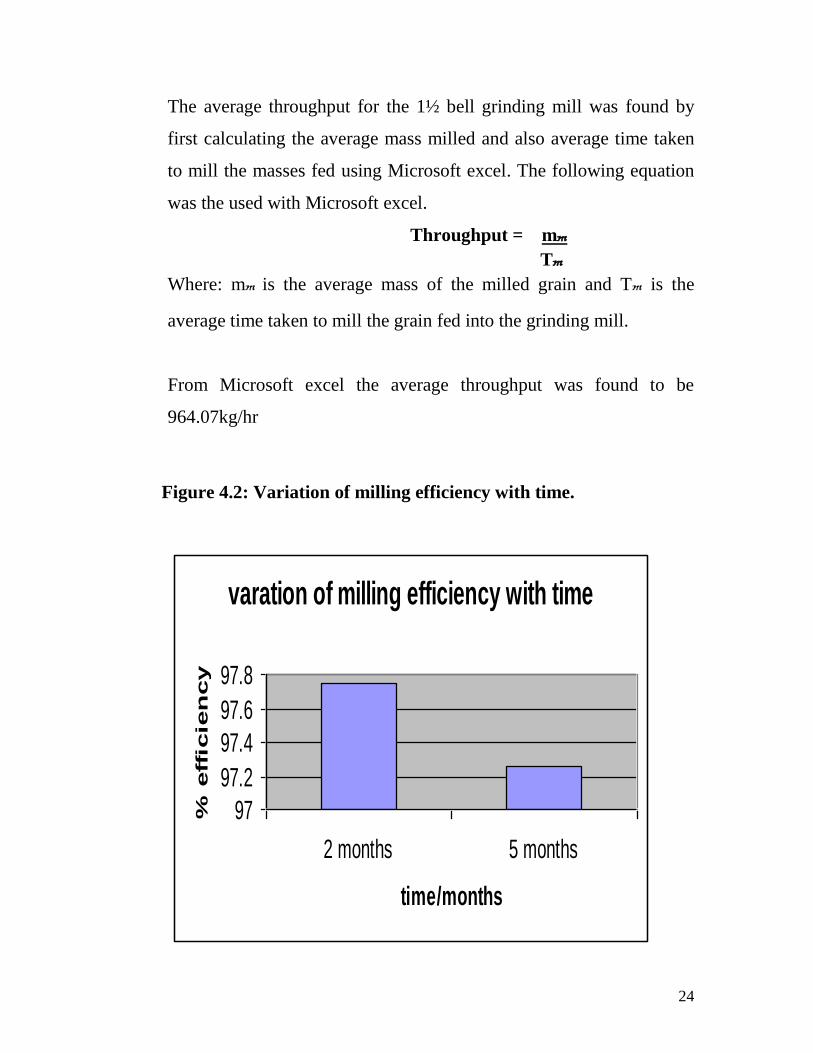
The average throughput for the 1½ bell grinding mill was found by
first calculating the average mass milled and also average time taken
to mill the masses fed using Microsoft excel. The following equation
was the used with Microsoft excel.
Throughput = mm Tm
Where: mm is the average mass of the milled grain and Tm is the
average time taken to mill the grain fed into the grinding mill.
From Microsoft excel the average throughput was found to be
964.07kg/hr
Figure 4.2: Variation of milling efficiency with time.
varation of milling efficiency with time
97
97.2
97.4
97.6
97.8
2 months 5 months
time/months
% efficien
cy

25
Figure 4.2 shows that milling efficiency was decreasing with an
increase with time of operation. But on average it was found to be
97.50%.
Figure 4.3: Relationship between current and time for a hammer
mill with 5 month old beaters
The graph shows the relationship between current and time of which the
current increased from an idle current of 18A to a maximum of 40A and
then started top decrease though there were some fluctuations throughout the
Graph of current against time
0
5
10
15
20
25
30
35
40
45
0 50 100 150 200 250
Time (sec)
Current

26
whole graph The current then starts to drop to its idle current of 18A which
shows that the grinding process is over and there is no longer anything in the
grinding chamber.
The above data is used to calculate the energy requirement during the
grinding process for the 1½ bell grinding mill. The idle or minimum current
before any grain is added into the grinding mill is obtained from graph so as
the maximum current during the milling process. Calculations are carried out
as follows.
Current required =Maximum current-Idle current
Hence I=40-18
=22A.
The current obtained above is the current required for the milling process
only i.e. the actual size reduction of the grain without taking current required
for running the electric motor without any grain fed into the grinding mill.
From voltage measurements the value obtained was a constant throughout
the whole experiment, of which it was found to be 330V
The power required during milling process is obtained by the formula:
P=IV
Where P=power required during milling process
V=voltage required by the electric motor
I=current drawn during milling
Therefore; power required during milling process = 22*330
= 7260W

27
= 7.26Kw
Figure 4.4: Relationship between current and time for a hammer mill
with 2 month old beaters.
G ragh o f curren t against tim e
0
5
10
15
20
25
30
35
1 2 3 4 5 6 7 8 9 10 11 12 13 14 15 16 17 18 19 20 21 22 23 24 25 26 27 28 29 30 31 32 33 34 35 36 37 38 39 40
tim e/sec
cu
rren
t/A
current
Scale 1unit represents 5seconds on the x-axis.
Basically the variation between current and time is the same as in fig 4.3
despite the age difference. The idle current is 15 amperes and the maximum

28
current obtained from the graph is 30 amperes. The voltage across the motor
remained the same i.e. 330V
Using P=IV
Therefore power = 30*330
= 4950W
= 4.95Kw
The power requirement for the 1½ Bell Grinding mill increases with time of
use as shown by the above calculation since the one with 2 month old
beaters was 4.95Kw whilst the one with 5 month old beaters was 7.26Kw.
Figure 4.5: Comparing average quantitative losses between open and
closed air inlet ducts.
Period of
operation
Mass of mealie
meal lost when
aperture is open/kg
Mass of mealie
meal lost when
aperture is
closed/kg
Throughput of
machine when
aperture is
open/kg/hr
Throughput of
machine when
aperture is
closed/kg/hr
2 months 1.000 0.500 962.07 961.53
5 months 0.750 0.625 514.90 513.60
Figure 4.5 shows the variation of quantitative losses with time of which the
losses tend to increase with time whilst the throughput is decreases. The
quantitative losses are decreasing for a mill with open apertures (air ducts)
from 1.000kg for a hammer mill with 2 month old beaters to 0.750 whilst
that with a closed aperture is increasing from 0.500kg for mill with 2 month
old beaters to 0.625kg for mill with 5 month old beaters. Generally much
29
losses are incurred when the air duct is open than when it is closed but as
shown by the above table the throughput tends to be reduced when the duct
is closed than when it is open. This is shown by a reduction from
962.07kg/hr to 961.53kg/hr. From the above figure it is also shown that
throughput decreases with an increase in operational time.
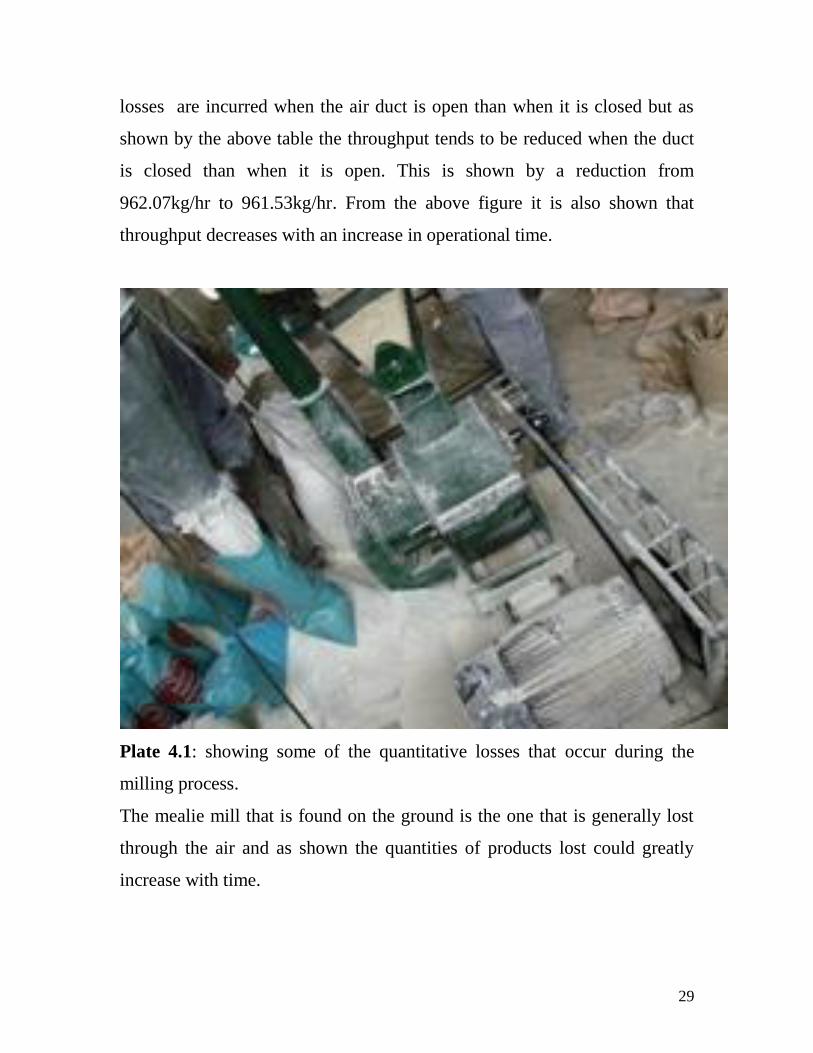
Plate 4.1: showing some of the quantitative losses that occur during the
milling process.
The mealie mill that is found on the ground is the one that is generally lost
through the air and as shown the quantities of products lost could greatly
increase with time.

30
-10
0
10
20
30
40
50
100 70 50 40 30 20 15 pan
sieve num ber
% w
eig
ht
reta
ined
S eries1
Figure 4.6: variation of average %mass retained with sieve number.
The figure above shows that there was an increase ion the % mass retained
as the sieve number or aperture size decreased up top a maximum the a drop
in the last to sieves. A maximum of 46.28% was observed in sieve number
20 which has an aperture size of 0.894mm (see Appendix 2).

31
Results obtained from questionnaire
Major causes of breakdown
-Presents of foreign matter.
-Seizure of bearings
-Wear of beaters.
-Failure of electric motors
-damaged sieve.
-fan belt failure
-over-loading causing the grinding mill to stop during milling process.
-Motor should not exceed the optimum required speed of between
4000- 4200rpm of which if exceeded this will result in increased rate of wear
of bearings.
Summary of results
Figure 4.6
Age of
beaters
throughput
(kg/hr)
%
Quantitative
losses
Milling
efficiency
Power
requirement
(Kw)
2months 961.80 2.25% 97.75% 4.95
5months 513.70 2.75% 97.25% 7.26
Figure 4.6 is summarizing the relationship between the time of operation and
parameters that determine the performance the 1½ Bell Grinding mill.

32
CHAPTER 5
5.0 Discussion of results
5.1 Throughput
The first hypothesis was proved to be true since an average experimental
throughput of 964.07kg/hr was obtained as compared to expected throughput
of 850kg/hr from the operator’s manual. The throughput was found to be
greater than the expected and this is observed to increase with the increase in
time of use.
5.2 Power requirement
The power requirement for the 1½ bell grinding mill was found to increase
with time from 4.95Kw for a grinding mill with 2month old beaters to
7.26Kw for a grinding mill with 5month old beaters this is due to an increase
in resident time inside the mill as the beaters wore out. Current required
during the milling process was obtained by taking readings on the ammeter
for which the current was determined by subtracting the minimum current
from the maximum.
5.3 Quantitative losses
The average quantitative losses increased with time from about
0.750kg/50kg which is approximately 1.5% to 1.00kg/50kg which
approximately 2% for 2month old hammer mill to 5month old hammer mill
respectively the latter results are for open air ducts whereas for closed ducts
the range was from 0.500kg/50kg (1%) to 0.625kg/50kg(1.25%) for
hammer mill with 2month old beaters and 5 month old beaters respectively.

33
From the above data it is observed that the greatest losses occurred when the
air duct was open. This is so due to a reduction in the pressure required for
the conveyance system. And from the figures obtained the second hypothesis
was proved true since less than 10% quantitative losses occurred for the 1½
Bell Grinding mill.
5.4 Milling efficiency
The milling efficiency decreased from 97.75% for a hammer mill with
2month old beaters to 97.25% for a hammer mill with 5month old beaters.
This is mainly due to wear of beaters and an increase in the quantitative
losses of which as a recap the milling efficiency is the ratio between mass of
product and the mass of feed hence if there is a marginal decrease in the
mass of milled product the efficiency is assumed to be low. The obtained
experimental means for both 2 month old beaters and 5 month old beaters is
greater than the expected efficiency of 65% from literature hence the third
hypothesis was proved to be true..
5.5 Uniformity of milled particles
The particles obtained from the milled mealie mill from the 1½ Bell grinding
mill were proved to be relatively uniform since the majority of the particles
fell within sieve number 30 and 20 with % masses retains of 27.28% and
46.28%. These are proved to be uniform since from literature 44-88% by
weight of particles exiting a milling machine should fall within the same size
distribution (Brennan, 1976) of which 46.28% from sieve number 20 falls
with in the required range.

34
5.6 Major causes of breakdowns
From the questionnaire it was observed that the causes of breakdowns due to
lack of the technical know how on the use of grinding mills. This is shown
by breakdowns caused by overloading and damaged sieves due to presents
of foreign matter of which these can be avoided if there is proper inspection
of the feed by the operator of the machine. Also such cases of overloading
and presents of foreign matter led to other causes such as seizer of bearings
and increased wear rate of beaters which are responsible for the actual size
reduction process. Causes due to electric motor failure where not much of an
issue due to overloading or presents of foreign matter due to the presents of
a fail safe mechanism in the form of fan belt linking the motor and the
rotating shaft with beaters.

35
CHAPTER 6
6.0 Conclusions and recommendations
6.1 Throughput
The first hypothesis was proved to be true since an average experimental
throughput of 964.07kg/hr was obtained as compared to expected throughput
of 850kg/hr from the operator’s manual. This figure shows that the 1½ Bell
Grinding mill has a throughput that is relatively large for use in small to
medium scale milling processes. The mill can safely compete with other
mills on the local market for example it exceeds the 500kg/hr hippo mill
from precision grinders (www.pgehippo.co.zw) hence I can strongly
recommend it for use by companies or individuals who want to meet given
targets.
6.2 Quantitative losses
The second hypothesis was proved to be true for which the expected %
quantitative losses was expected to be less than 10% whilst the obtained
experimental means were found to be between 1% and 2% despite the
different conditions discussed in chapter 5. The major causes of the losses
are highlighted below.
6.2.1 Causes of losses
The major causes of loses was found through the upper covers and the air
ducts mainly due to over loading and air getting through the feeding hopper.

36
Overloading caused the grinding chamber to discharge more than what is
required by the pneumatic conveying system and this tended to increase the
pressure inside the conveyor system and thereby causing the mealie meal to
escape through the lower air inlet/duct. As a result to reduce these losses a
rotary hopper can be used since it meters the supply of products into the
conveying system and it affects the air lock which is necessary for the
efficient operation of the pneumatic conveyor system and thereby reducing
quantitative losses in the process. In addition losses also occurred through
the fan housing and for this I recommend the use of gaskets to produce an air
tight seal which prevents ground products from escaping outwards from the
conveyor system.
6.4 Milling efficiency
From the conducted research the 1½ bell grinding has proved to have a high
average efficiency in terms of the ratio of milled product to the mass of feed
hence it can be safely used by companies that require high efficiency
grinding mill or individuals who do service milling.
6.5 Power requirement
The energy required during the milling process was observed to be
increasing marginally with time of use though initially the energy required is
relatively low. This could be due to an increase in wear rate of beaters which
increase the residents’ time of feed within the grinding chamber.
6.6 Uniformity of milled particles
The 1½ Bell grinding mill proved to produce milled particles with a
uniformity that fell within the required ranges from literature hence it has

37
proved to be a standard size reduction machine. But there is still need for
research on ways of improving the uniformity from 46.28% to higher values
especially when it comes to baking and colour enriching products which
require particles with a higher degree of uniformity.

38
REFERENCES
A.Chakraverty, 1998. “Post Harvesting Technology of Cereals,
Pulses and Oilseeds”. Oxford and IBH Publishers. New Dehli,
Bombay, Culculta
Brennan.J.G, Butters.J.R, Cowell N.D, Lilly A.E. (1976). Food
Engineering Operations. Applied Science Publishers, Essex,
England.
J.M Coulson, J.F.Richardson. J.R Buckhurst and J.H Harker.
(1978).Chemical Engineering Unit Operations, Vol 2,3rd
ed.
Leniger H.A and Beverlov W. (1993). Food Process
Engineering. Riede Publishers.Pordretch,
Holland/Boston, USA.
Warren L, Mcobe, Julian.C.Smith, Peter harriot.”Unit
Operations in Chemical Engineering, 5th ed”.
Sahay and Singh. (1999). Unit 0perations in Agriculture.
www.tinytechindia.com
www.microgrindingsystems.com
www.rbz.co.zw, 2007
The Herald 29 October 2007
FAO (1992) Machine Performance Evaluation.

39
Appendices
Appendix 1
QUESTIONARE FOR MILLING PERFORMANCE OF A 1½ BELL GRINDING
MILL
NAME OF COMPANY: ……………………………………….................................
TYPE OF MILLING MACHINE: ………………………………………………………..
DATE OF PURCHARSE: …………………………………………………………………
SIZE OF MOTOR USED: …………………………………………………………………
HOW MUCH MAIZE DO YOU USE PER DAY…………………………………………
DOES IT MILL OTHER PRODUCTS BESIDES MAIZE (If yes specify): ………….......
………………………………………………………………………………………………
WHICH GRAINS DOES IT PERFORM BEST…………………………………………...
HOW OFTEN DOES THE GRINDING MILL BREAK DOWN…………………………
………………………………………………………………………………………………
WHAT ARE THE MAJOR CAUSES……………………………………………………...
………………………………………………………………………………………………
………………………………………………………………………………………………
………………………………………………………………………………………………
ARE YOU SATISFIED WITH THE MAINTANANCE COSTS…………………………
IS IT USER FRIENDLY…………IF NOT WHAT DIFFICULTIES ARE YOU
HAVING WHEN OPERATING THE HAMMER MILL………………………………....

40
………………………………………………………………………………………………
………………………………………………………………………………………………
DOES THE GRINDING MILL IMPOSE ANY DANGERS TO THE
OPERATOR……….
IF YES WHERE EXACTLY………………………………………………………………
………………………………………………………………………………………………
WHAT WEAKNESSES HAVE YOU OBSERVED ON THE MACHINE……………....
………………………………………………………………………………………………
………………………………………………………………………………………………
ARE CUSTOMERS SATISFIED WITH THE PRODUCTS PRODUCED……………….
………………………………………………………………………………………………
WHAT AREAS DO YOU FEEL NEED TO BE IMPROVED AND WHAT ARE
YOUR SUGGESTIONS……………………………………………………………………
………………………………………………………………………………………………
………………………………………………………………………………………………
………………………………………………………………………………………………

41
Appendix 2
Test sieves and their respective sizes.
BSS ASTM ISS Width of
Opening/mm
Width of
Opening/inches
5
6
7
8
10
12
14
16
18
20
22
25
30
36
40
44
48
50
52
60
72
80
85
100
120
150
170
200
240
300
325
350
400
4
6
7
8
10
12
14
16
18
20
-
25
30
35
40
-
45
-
-
50
60
70
-
80
100
120
140
170
200
220
270
-
325
-
480
340
280
240
200
170
140
120
100
85
-
70
60
50
40
-
35
-
-
30
25
20
-
18
15
12
10
9
8
7
6
5
-
4
4.750
3.250
2.818
2.399
2.032
1.676
1.405
1.201
1.000
0.954
0.894
0.708
0.592
0.500
0.420
0.401
0.351
0.336
0.295
0.296
0.251
0.211
0.186
0.177
0.157
0.124
0.104
0.089
0.075
0.064
0.053
0.044
0.044
0.038
0.1870
0.1252
0.1109
0.0945
0.0800
0.0659
0.0553
0.0473
0.0394
0.0332
0.0322
0.0279
0.0233
0.0197
0.0165
0.0158
0.0133
0.0132
0.0116
0.0117
0.0099
0.0083
0.0073
0.0070
0.0060
0.0049
0.0041
0.0035
0.0030
0.0025
0.0021
0.0017
0.0015
0.0015

42
Appendix 3
Expected
mean 850
Exp mean 964.07
Median 954.04
stdev 28.10813
sample var 790.0672
n 5
conf level 95,0%

43
Appendix 4
time current
5 18
10 24
15 26
20 30
25 34
30 38
35 33
40 35
45 34
50 36
55 38
60 36
65 38
70 36
75 40
80 38
85 38
90 40
95 36
100 38
105 34
110 36
115 32
120 33
125 30
130 28
135 30
140 28
145 30
150 36
155 34
160 32
165 35
170 32
175 30
180 26
185 24
190 18
195 18
200 18

44
Appendix 5
sieve no
% weight of mealie meal retained
100 0
70 0.48
50 5.44
40 13.8
30 27.28
20 46.28
15 2.88
pan 3.84