Environmental Performance Evaluation and Analysis Using ...
18
sustainability Article Environmental Performance Evaluation and Analysis Using ISO 14031 Guidelines in Construction Sector Industries Ibrahim Falqi 1 , Saleh Alsulamy 2 and Mohamed Mansour 3,4, * 1 Civil Engineering Department, College of Engineering, King Khalid University, Abha 394, Saudi Arabia; [email protected] 2 Architecture and Planning Engineering Department, College of Engineering, King Khalid University, Abha 394, Saudi Arabia; [email protected] 3 Industrial Engineering Department, College of Engineering, Zagazig University, Zagazig 44519, Egypt 4 Industrial Engineering Department, College of Engineering, King Khalid University, Abha 394, Saudi Arabia * Correspondence: [email protected]; Tel.: +966-54-575-0250 Received: 23 January 2020; Accepted: 26 February 2020; Published: 27 February 2020 Abstract: The construction sector is garnering increasing concern as an industry that generates significant pollution while suffering from a lack of adequate environmental performance evaluations. The purpose of this study is to evaluate the environmental performance of construction sector industries using the ISO 14031 standard in three dimensions: planning, using data and information, and reviewing and improving environmental performance evaluations. Using a descriptive and correlational approach, this study described and analyzed the level of implementation using a 7-point Likert scale questionnaire distributed to 1000 organizations in Saudi Arabia. The questionnaires were completed between May and December of 2018 and the results were measured against similar studies. The mean positive percentage responses were 31.36 and expressed the implementation levels of the three dimensions of environmental performance. The corresponding values for the three dimensions’ items were 33.36, 29.83, and 30.95 respectively. The minimum Kendall correlation coefficients for each item in a dimension were 0.79, 0.79, and 0.83, respectively. The maximum correlation values between an item and a dimension to which the item did not belong were 0.25. This study answers a fundamental question regarding the implementation level values of environmental performance in construction organizations based on the ISO 14031 standard model and analyzes the pairwise correlation among the descriptor variables of the model. Further studies are needed to investigate the model structure using the principle component, factor analysis, and cluster analysis. Keywords: environmental management; construction industry; environmental performance evaluation; ISO 14031; Saudi Arabia 1. Introduction The construction industry generates a fairly large amount of pollutants compared to other industries [1], and occupies the first position in the number of ISO 14001 certificated organizations with 53,978 certificates (16.98%) [2]. These statistics reflect a significant effort by the construction industry to follow international standards that evaluate environmental and social performance. ISO 14001 is a management tool that enables an organization of any size or type to continually improve its environmental performance (EP) [3]. While it certifies that an organization has a certain type of environmental management system (EMS), it does not say anything about how the system is performing [4] and does not provide detailed performance assessment procedures. In 1999, ISO Sustainability 2020, 12, 1774; doi:10.3390/su12051774 www.mdpi.com/journal/sustainability
-
Upload
khangminh22 -
Category
Documents
-
view
0 -
download
0
Transcript of Environmental Performance Evaluation and Analysis Using ...

sustainability
Article
Environmental Performance Evaluation and AnalysisUsing ISO 14031 Guidelines in ConstructionSector Industries
Ibrahim Falqi 1, Saleh Alsulamy 2 and Mohamed Mansour 3,4,*1 Civil Engineering Department, College of Engineering, King Khalid University, Abha 394, Saudi Arabia;
[email protected] Architecture and Planning Engineering Department, College of Engineering, King Khalid University,
Abha 394, Saudi Arabia; [email protected] Industrial Engineering Department, College of Engineering, Zagazig University, Zagazig 44519, Egypt4 Industrial Engineering Department, College of Engineering, King Khalid University, Abha 394, Saudi Arabia* Correspondence: [email protected]; Tel.: +966-54-575-0250
Received: 23 January 2020; Accepted: 26 February 2020; Published: 27 February 2020�����������������
Abstract: The construction sector is garnering increasing concern as an industry that generatessignificant pollution while suffering from a lack of adequate environmental performance evaluations.The purpose of this study is to evaluate the environmental performance of construction sectorindustries using the ISO 14031 standard in three dimensions: planning, using data and information,and reviewing and improving environmental performance evaluations. Using a descriptive andcorrelational approach, this study described and analyzed the level of implementation using a 7-pointLikert scale questionnaire distributed to 1000 organizations in Saudi Arabia. The questionnaires werecompleted between May and December of 2018 and the results were measured against similar studies.The mean positive percentage responses were 31.36 and expressed the implementation levels of thethree dimensions of environmental performance. The corresponding values for the three dimensions’items were 33.36, 29.83, and 30.95 respectively. The minimum Kendall correlation coefficients foreach item in a dimension were 0.79, 0.79, and 0.83, respectively. The maximum correlation valuesbetween an item and a dimension to which the item did not belong were 0.25. This study answersa fundamental question regarding the implementation level values of environmental performancein construction organizations based on the ISO 14031 standard model and analyzes the pairwisecorrelation among the descriptor variables of the model. Further studies are needed to investigate themodel structure using the principle component, factor analysis, and cluster analysis.
Keywords: environmental management; construction industry; environmental performanceevaluation; ISO 14031; Saudi Arabia
1. Introduction
The construction industry generates a fairly large amount of pollutants compared to otherindustries [1], and occupies the first position in the number of ISO 14001 certificated organizationswith 53,978 certificates (16.98%) [2]. These statistics reflect a significant effort by the constructionindustry to follow international standards that evaluate environmental and social performance.ISO 14001 is a management tool that enables an organization of any size or type to continuallyimprove its environmental performance (EP) [3]. While it certifies that an organization has a certaintype of environmental management system (EMS), it does not say anything about how the systemis performing [4] and does not provide detailed performance assessment procedures. In 1999, ISO
Sustainability 2020, 12, 1774; doi:10.3390/su12051774 www.mdpi.com/journal/sustainability
Sustainability 2020, 12, 1774 2 of 18
14031 was issued to help industrial organizations evaluate their EP without giving benchmarks foracceptable levels of performance [5].
The motivation for this study and its importance stems from several existing studies.Firstly, Psomas, Fotopoulos, and Kafetzopoulos [6] argued that the actual contribution of EMSsto improving EP remains uncertain, even in the organizations that use EMSs to manage their business.Secondly, prior studies examining the association between adaptations of an EMS and EP resultedin mixed findings that included a positive impact association in the work of [7,8], no associationbetween EMSs and EP [9], and no agreement on what EP is or how to measure it as concluded by [10].This last contribution is particularly important as many authors have called for further research intoEP measurement [11,12]. While other studies have assessed EP using a single performance indexranked by external parties or by the environmental impact of a single business activity, this studyattempts to provide a first step to assess the performance of an organization, with or without EMSs,in implementing the guidelines given in ISO 14031 to evaluate EP. Accordingly, there is a need toinvestigate whether or not the organizations use the environmental performance evaluation (EPE)guidelines given in in the international standard to evaluate their EP.
Previous research has focused on management practices that prevent negative environmentalaspects and impacts, such as cleaner production, eco-efficiency, EMSs, and life cycle assessment [13].Some research has focused on motivations for the standard’s implementation [14]. Other studieshave concentrated on the effects that these systems have on a firms’ environmental, operational,and financial performance [15]. Some studies have also found that improvements in an organization’senvironmental performance are beneficial to the company’s overall performance [16]. The applicationof ISO 14001 is one particular area of research that has received a great deal of attention [17], and therehas been a substantial body of literature on this research area, providing insights into how ISO14001 diffuses at a country level [18], regional level [19] and global level [20]. Various approacheshave been proposed to incorporate techniques and tools that support EMS decision making, suchas multi-criteria techniques [21], hybrid models combining mathematical programming, and othermethods [22]. Although extensive literature on EMSs exists, there is still a lack of in-depth investigationon maintaining ISO 14001’s EMS [23]. The implementation of an EMS does not guarantee itseffectiveness [24]. Additionally, there is a need for continuous monitoring of an EMS’s critical points.While researchers advocate that EPEs are not directly linked to the maintenance of EMSs [25], othersadvocate that companies that do not use a set of EMS performance indicators may not be managingtheir own environmental system [26]. Therefore, EP must be continually monitored to ensure successin either developed or developing countries. Consequently, it is important to fill this gap in theliterature by developing measurement models to assess the performance of management systems inEPEs regardless of the size and type of the industry.
EPE guidelines are an important resource for organizations that allow them to compare their EP incontext and perspective with others and across industry sectors. EPEs consider operational indicators,management decisions, the wider impact on the environment, and the relevance, completeness,consistency, accuracy, and transparency of the data that is being reported. ISO 14031 defines EPEsas a process by which environmental indicators are selected to measure, analyze, assess, report,and communicate an organization’s EP against certain criteria. Moreover, the standard describesthree types of indicators that may be used for an EP assessment: environmental condition indicators,for presenting achievements in context; operational performance indicators, used to demonstratechanges in resource use; and management performance indicators, for showing cost savings andimprovements in training [27]. Moreover, the USA’s Environmental Protection Agency (EPA) hasorganized environmental indicators into two main categories and six levels that correspond to thetype of activity measured. The two categories of indicators are administrative and environmental.The administrative category includes two levels. Level 1 represents actions taken by the EPA, whilelevel 2 corresponds to steps taken by entities to reduce pollutants entering the air, water, or landin response to level 1 actions. The environmental category includes four levels. Level 3 represents

Sustainability 2020, 12, 1774 3 of 18
indicators for measuring the actual amount of pollutants emitted by a source, and level 4 measuresthe levels of pollutants detected in local communities. Level 5 represents the chemical or biologicalchanges that occur in some pollutants (e.g., the concentration of a toxin as it moves up the foodchain). Level 6 represents the true indicator or condition the firm seeks to attain [28]. Hence, ISO14031 and the EPA agree on the importance of measuring environmental management performancein terms of indicators related to the management activities, processes, and procedures concerningenvironmental assessment.
Currently, no studies have examined whether or not industrial organizations follow the guidelinesgiven in international standard ISO 14031 to evaluate their EP. Additionally, no work has proposed ameasurement tool for the EPE management process. Ejdys and Matuszak-Flejszman [29] confirmedthat one of the ways of realizing sustainable development principles at the level of an organizationalunit is implementation of normalized systems elaborated by ISO. Based on the findings of Ejdys,et al. [30], guidelines can be offered to both scholars and practitioners regarding the factors crucial forthe improvement of the EMS. Aiming to add value to the existing literature, the structural analysis wasadapted to classification and identification of the key factors. In this case, the ISO 14031 model maintainsthat the gap in measuring the management performance is maintaining the EP and developing a newmeasurement model based on statistical analysis and design. The lack of EPE models for the economicactivities of the construction sector according to the guidelines given in international standard ISO14031 have led to the inability to benchmark an organization’s EP and compare it with others in thesame field. The standardization of measuring models and indicators that would enable consumersand stakeholders to assess and compare their EP is a necessity, and development of a descriptiveand correlational study to evaluate the commitment of a construction sector organization to EPEs byconsidering the guidelines given in international standard ISO 14031 is an urgent need.
To assess the procedures, processes, and activities adopted by an organization’s management toevaluate the EP of their business, a measurement model based of the guidelines given in internationalstandard ISO 14031 was designed. A descriptive correlation study was also implemented in order todetermine the measurement model items and evaluate the implementation level of the environmentalguidelines in the construction industry in Saudi Arabia. According to the ISO 14031 guidelines,evaluations were conducted in three main dimensions: planning, using data and information,and review and improvement of EPEs. In this case, ISO 14031 could be used independently or tosupport ISO 14001 requirements and ISO 14004 guidance for all organizations, regardless of type,size, location, or complexity [27]. It gives guidelines for the design and use of EPEs within anorganization. It is important to note that it is not intended to be used as a specification standard forcertification, registration purposes, or the establishment of any other environmental managementsystem conformance requirements.
Implementation of the research methodology could be applied by organizations working notonly in the construction sector, but also in any economic activity. The results presented are limited toorganizations that work in the construction sector in Saudi Arabia. This sector includes 29 constructionactivities according to the Saudi Contractor Classification Agency located in 13 regions of SaudiArabia [31]. EPE activities will be assessed according to the guidelines given in ISO 14031’s modeldimensions. This study will benefit construction industry organizations, industrial organizations ingeneral, and society at large. Construction industry organizations will be benefit by increasing theirunderstanding of their EP, and will be able to use that information as a marketing and development tool.The performance evaluation methodology shown in this study will serve as an example to local andglobal organizations, as well as society in general. Furthermore, customers and various environmentalauthorities will find it easier to assess organizations. The following benefits are available to anyorganization that follows the research methodology adopted in this study for EPEs: understanding anorganization’s impacts on the environment, providing a basis for EPE benchmarking, determiningwhether environmental objectives and targets are being met, demonstrating compliance with regulations,increasing the awareness of employees, and improving community and customer relations.

Sustainability 2020, 12, 1774 4 of 18
In summary, the objectives of this study are to examine the implementation levels of the ISO14031 guidelines in Saudi construction sector organizations. In this context, this research was guidedby the theoretical studies on the management and evaluation of environmental performance, as well asthe types of performance indicators. This led to the following research question: what are the ISO14031 guidelines governing the EPE implementation level in the Saudi construction sector? In addition,does a relationship exist between the ISO 14031 main and sub-dimensions? To address those questions,the next section describes the research procedures employed in this study.
This article is composed of five sections. The adopted measurement model is illustrated in thesecond section, Methodology. The third section, Results, applies the solution methodology to evaluatethe level of EP based on the opinion and judgment of industrial experts. Section 4, Discussion, providesa discussion of the results. Finally, Section 5, Conclusions, gives the conclusion and a description offuture work.
2. Materials and Methods
The methodology used supports the purpose of this study in terms of measuring the level ofimplementation of the ISO 14031 guidelines in the Saudi construction industry. In order to coverthe objectives of ISO 14031, a qualitative design was chosen. A descriptive statistical analysis andKendall correlation analysis were chosen because qualitative research is concerned with experiences,and understanding these experiences is more important than achieving an outcome [32]. The targetpopulation was construction companies working in Saudi Arabia. Data collection via a survey waschosen because qualitative research allows a lot of flexibility in terms of data sources [33]. The surveywas emailed to the construction organizations, and then a select group was filtered through a datacleaning process and used in the statistical analysis. A total of 1258 construction companies (79%private, 21% governmental) were included in the study. Table 1 lists the 29 construction industrycategories and the number of companies that responded with a valid and complete questionnaire [31].The stratified sampling technique under nonprobability sampling was used in this paper. The studywas conducted between May and December of 2018 in 13 regions of Saudi Arabia [34]. Participation inthe survey was completely voluntary and included four categories (25.60% main contractors, 23.50%private departments, 26.80% governmental departments, and 24.10% subcontractors). Their responseswere subjected to statistical analysis.
The ISO 14031 guidelines were used to scale EPEs in the Saudi construction industry. A 7-pointLikert-scale scaled questionnaire, shown in Table 2, was designed and emailed to the correspondingcompanies’ mangers. The questionnaire’s model included 13 items categorized by three descriptorvariables: planning for EPEs, using data and information, and reviewing and improving EPEs.Each descriptor variable included five, six, and two items, respectively. The items in dimensionI were assigned codes P1 to P5, the items in dimension II were assigned codes D1 to D6, and theitems in dimension III were assigned codes R1 and I1. Participants rated the statements of the ISO14031 implementation level on a 7-point Likert-scale, with a rating of 7 indicating total agreement withthe statement. This method illuminated the participants’ own perception of their implementationlevel [35,36].
A descriptive statistics and correlation analysis approach was adopted to describe and analyze thecollected data [32]. The description was done in terms of the number of observations (n), the percentage(%), and the cumulative percentage (Cum.%). Cohen’s standard was used to evaluate the strength of therelationships, where coefficients between 0.10 and 0.29 indicated a small effect size, coefficients between0.30 and 0.49 indicated a moderate effect size, and coefficients above 0.50 indicated a large effectsize [37]. The correlations were examined using Holm corrections to adjust for multiple comparisonsbased on an alpha value of 0.05 [38] for ordinal data. The R language and environment for statisticalcomputing was used to describe and analyze the collected data and implement the article’s statisticalprocedures [39].
Sustainability 2020, 12, 1774 5 of 18
Table 1. Frequencies and percentages of responded companies by construction field.
Construction field Number of Responded Companies Percentage (%)
Water and sanitation works 40 4.00Electronic works 28 2.80Marine works 36 3.60Industrial works 45 4.50Electrical works 33 3.30Mechanical works 34 3.40Dams 31 3.10Roads 40 4.00Buildings 41 4.10Slaughterhouses 32 3.20Catering for individuals 55 5.50Maintenance health centers 35 3.50Landscaping 33 3.30Communication technology 49 4.90Well drilling 26 2.60Maintenance of Landscaping 39 3.90Maintenance and operation dams 12 1.20Maintenance roads 33 3.30Maintenance buildings 46 4.60Catering for medical centers 45 4.50Maintenance and operation of water and sanitation works 18 1.80Maintenance and operation of electronic works 29 2.90Maintenance and operation of marine works 17 1.70Maintenance and operation of industrial works 19 1.90Maintenance and operation of electrical works 51 5.10Maintenance and operation of mechanical works 17 1.70Maintenance and operation of slaughterhouses 29 2.90Maintenance and operation of communication technology 31 3.10City cleaning and wastes disposal 56 5.60
Total 1000 100.00
Table 2. Questionnaire items on the implementation of the ISO 14031 in the construction industry.
Stage Code Definition
Planning for EPE(Dimension I)
P1 EPE planning is based on the significant/controlling environmental aspects
P2 EPE planning is based on environmental performance criteria and on theviews of interested parties
P3 The organization selects and uses MPIs data in a useful formP4 The organization selects and uses OPIs data in a useful formP5 The organization selects and uses ECIs data in a useful form
Using data andinformation(Dimension II)
D1 Using data and information to do EP is based on documented procedures.D2 The organization collect data from sources consistent with EPE planning
D3 The organization analyze and convert the collected data into informationdescribing EPE
D4 The EPE’s analyzed data compared with the organization’s EP criteriaindicating progress in EP
D5Management ensure that appropriate and necessary information describingthe organization’s environmental performance is communicated throughoutthe organization on a timely basis
D6 The organization issues environmental EP’ reports to external interestedparties
Reviewing andimproving EPE(Dimension III)
R1 The organization’s EPE is reviewed periodically to identify opportunitiesfor improvement
I1The review contributes to management actions to improve the performanceof the management and operations of the organization, and result inimprovements to the condition of the environment
Sustainability 2020, 12, 1774 6 of 18
3. Results
A descriptive and correlational study was performed to evaluate the commitment of a constructionsector organization to EPEs and to measure if a relationship exist between the ISO 14031 main andsub-dimensions. The analysis based on a survey (a 7-point Likert scale questionnaire) conducted across29 construction sector categories located in 13 regions in Saudi Arabia including 1000 organizations’mangers. The implementation levels was estimated by frequencies and cumulative percentages ofrespondents while correlation was evaluated by Kendall correlation coefficient.
3.1. The Overall ISO 14031 Guidelines Implementation Levels in Saudi Construction Sector
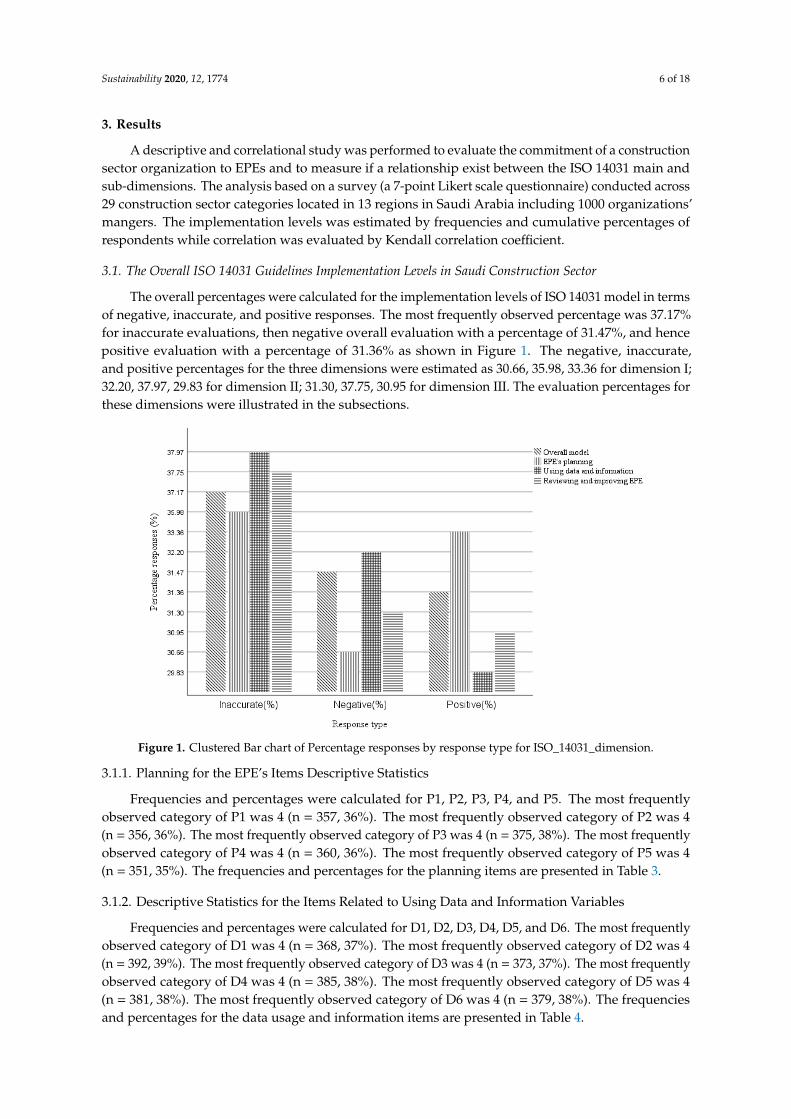
The overall percentages were calculated for the implementation levels of ISO 14031 model in termsof negative, inaccurate, and positive responses. The most frequently observed percentage was 37.17%for inaccurate evaluations, then negative overall evaluation with a percentage of 31.47%, and hencepositive evaluation with a percentage of 31.36% as shown in Figure 1. The negative, inaccurate,and positive percentages for the three dimensions were estimated as 30.66, 35.98, 33.36 for dimension I;32.20, 37.97, 29.83 for dimension II; 31.30, 37.75, 30.95 for dimension III. The evaluation percentages forthese dimensions were illustrated in the subsections.
Sustainability 2020, 12, 1774 6 of 17
3. Results
A descriptive and correlational study was performed to evaluate the commitment of a
construction sector organization to EPEs and to measure if a relationship exist between the ISO 14031
main and sub‐dimensions. The analysis based on a survey (a 7‐point Likert scale questionnaire)
conducted across 29 construction sector categories located in 13 regions in Saudi Arabia including
1000 organizations’ mangers. The implementation levels was estimated by frequencies and
cumulative percentages of respondents while correlation was evaluated by Kendall correlation
coefficient.
3.1. The Overall ISO 14031 Guidelines Implementation Levels in Saudi Construction Sector
The overall percentages were calculated for the implementation levels of ISO 14031 model in
terms of negative, inaccurate, and positive responses. The most frequently observed percentage was
37.17% for inaccurate evaluations, then negative overall evaluation with a percentage of 31.47%, and
hence positive evaluation with a percentage of 31.36% as shown in Figure 1. The negative, inaccurate,
and positive percentages for the three dimensions were estimated as 30.66, 35.98, 33.36 for dimension
I; 32.20, 37.97, 29.83 for dimension II; 31.30, 37.75, 30.95 for dimension III. The evaluation percentages
for these dimensions were illustrated in the subsections.
Figure 1. Clustered Bar chart of Percentage responses by response type for ISO_14031_dimension.
3.1.1. Planning for the EPE’s Items Descriptive Statistics
Frequencies and percentages were calculated for P1, P2, P3, P4, and P5. The most frequently
observed category of P1 was 4 (n = 357, 36%). The most frequently observed category of P2 was 4 (n
= 356, 36%). The most frequently observed category of P3 was 4 (n = 375, 38%). The most frequently
observed category of P4 was 4 (n = 360, 36%). The most frequently observed category of P5 was 4 (n
= 351, 35%). The frequencies and percentages for the planning items are presented in Table 3.
Table 3. Frequency table for the Planning for the EPE’s variables.
P1 n % Cum.% P2 n % Cum.% P3 n % Cum.% P4 n % Cum.% P5 n % Cum.%
1 5 0.50 0.50 1 3 0.30 0.30 1 5 0.50 0.50 1 4 0.40 0.40 1 3 0.30 0.30
2 62 6.20 6.70 2 59 5.90 6.20 2 66 6.60 7.10 2 57 5.70 6.10 2 65 6.50 6.80
3 242 24.20 30.90 3 249 24.90 31.10 3 230 23.00 30.10 3 247 24.70 30.80 3 236 23.60 30.40
Figure 1. Clustered Bar chart of Percentage responses by response type for ISO_14031_dimension.
3.1.1. Planning for the EPE’s Items Descriptive Statistics
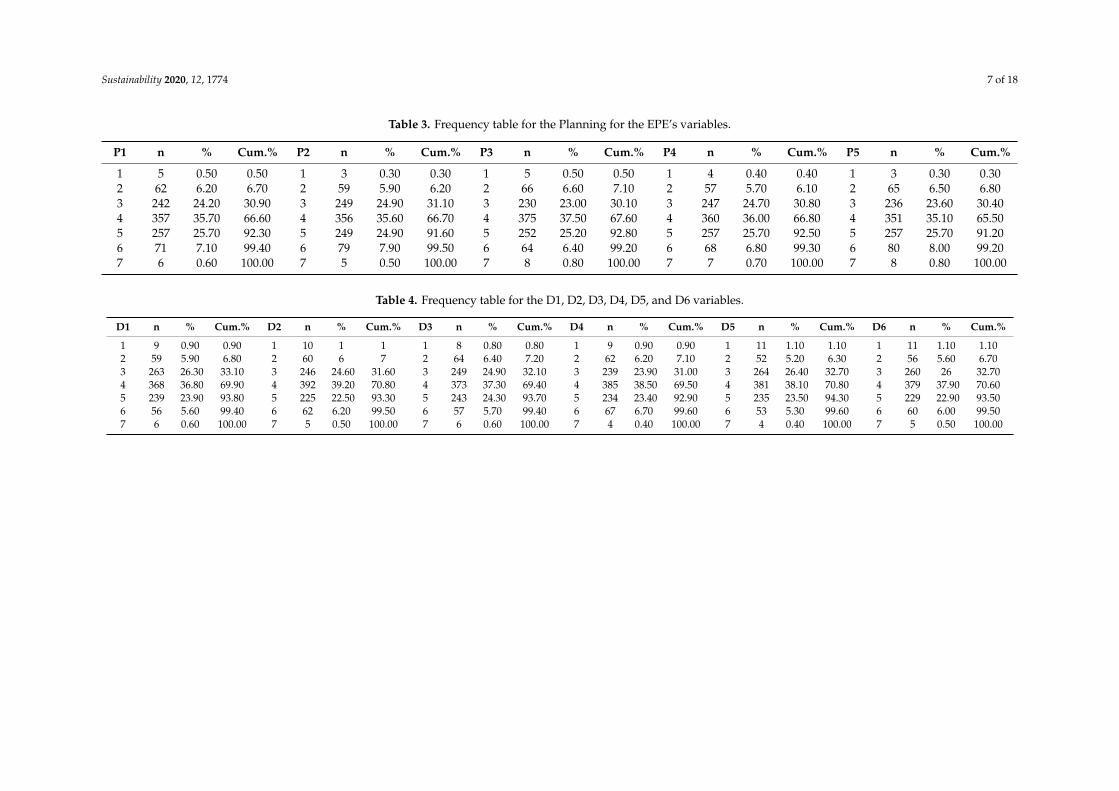
Frequencies and percentages were calculated for P1, P2, P3, P4, and P5. The most frequentlyobserved category of P1 was 4 (n = 357, 36%). The most frequently observed category of P2 was 4(n = 356, 36%). The most frequently observed category of P3 was 4 (n = 375, 38%). The most frequentlyobserved category of P4 was 4 (n = 360, 36%). The most frequently observed category of P5 was 4(n = 351, 35%). The frequencies and percentages for the planning items are presented in Table 3.
3.1.2. Descriptive Statistics for the Items Related to Using Data and Information Variables
Frequencies and percentages were calculated for D1, D2, D3, D4, D5, and D6. The most frequentlyobserved category of D1 was 4 (n = 368, 37%). The most frequently observed category of D2 was 4(n = 392, 39%). The most frequently observed category of D3 was 4 (n = 373, 37%). The most frequentlyobserved category of D4 was 4 (n = 385, 38%). The most frequently observed category of D5 was 4(n = 381, 38%). The most frequently observed category of D6 was 4 (n = 379, 38%). The frequenciesand percentages for the data usage and information items are presented in Table 4.
Sustainability 2020, 12, 1774 7 of 18
Table 3. Frequency table for the Planning for the EPE’s variables.
P1 n % Cum.% P2 n % Cum.% P3 n % Cum.% P4 n % Cum.% P5 n % Cum.%
1 5 0.50 0.50 1 3 0.30 0.30 1 5 0.50 0.50 1 4 0.40 0.40 1 3 0.30 0.302 62 6.20 6.70 2 59 5.90 6.20 2 66 6.60 7.10 2 57 5.70 6.10 2 65 6.50 6.803 242 24.20 30.90 3 249 24.90 31.10 3 230 23.00 30.10 3 247 24.70 30.80 3 236 23.60 30.404 357 35.70 66.60 4 356 35.60 66.70 4 375 37.50 67.60 4 360 36.00 66.80 4 351 35.10 65.505 257 25.70 92.30 5 249 24.90 91.60 5 252 25.20 92.80 5 257 25.70 92.50 5 257 25.70 91.206 71 7.10 99.40 6 79 7.90 99.50 6 64 6.40 99.20 6 68 6.80 99.30 6 80 8.00 99.207 6 0.60 100.00 7 5 0.50 100.00 7 8 0.80 100.00 7 7 0.70 100.00 7 8 0.80 100.00
Table 4. Frequency table for the D1, D2, D3, D4, D5, and D6 variables.
D1 n % Cum.% D2 n % Cum.% D3 n % Cum.% D4 n % Cum.% D5 n % Cum.% D6 n % Cum.%
1 9 0.90 0.90 1 10 1 1 1 8 0.80 0.80 1 9 0.90 0.90 1 11 1.10 1.10 1 11 1.10 1.102 59 5.90 6.80 2 60 6 7 2 64 6.40 7.20 2 62 6.20 7.10 2 52 5.20 6.30 2 56 5.60 6.703 263 26.30 33.10 3 246 24.60 31.60 3 249 24.90 32.10 3 239 23.90 31.00 3 264 26.40 32.70 3 260 26 32.704 368 36.80 69.90 4 392 39.20 70.80 4 373 37.30 69.40 4 385 38.50 69.50 4 381 38.10 70.80 4 379 37.90 70.605 239 23.90 93.80 5 225 22.50 93.30 5 243 24.30 93.70 5 234 23.40 92.90 5 235 23.50 94.30 5 229 22.90 93.506 56 5.60 99.40 6 62 6.20 99.50 6 57 5.70 99.40 6 67 6.70 99.60 6 53 5.30 99.60 6 60 6.00 99.507 6 0.60 100.00 7 5 0.50 100.00 7 6 0.60 100.00 7 4 0.40 100.00 7 4 0.40 100.00 7 5 0.50 100.00
Sustainability 2020, 12, 1774 8 of 18
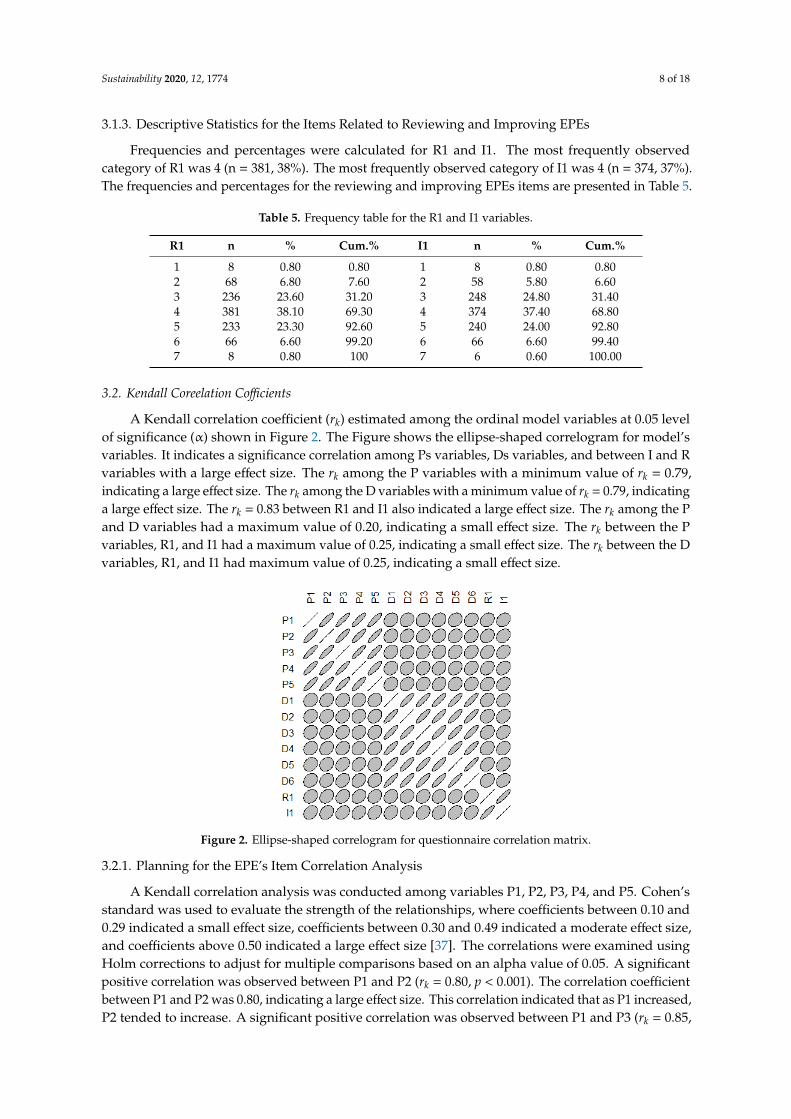
3.1.3. Descriptive Statistics for the Items Related to Reviewing and Improving EPEs
Frequencies and percentages were calculated for R1 and I1. The most frequently observedcategory of R1 was 4 (n = 381, 38%). The most frequently observed category of I1 was 4 (n = 374, 37%).The frequencies and percentages for the reviewing and improving EPEs items are presented in Table 5.
Table 5. Frequency table for the R1 and I1 variables.
R1 n % Cum.% I1 n % Cum.%
1 8 0.80 0.80 1 8 0.80 0.802 68 6.80 7.60 2 58 5.80 6.603 236 23.60 31.20 3 248 24.80 31.404 381 38.10 69.30 4 374 37.40 68.805 233 23.30 92.60 5 240 24.00 92.806 66 6.60 99.20 6 66 6.60 99.407 8 0.80 100 7 6 0.60 100.00
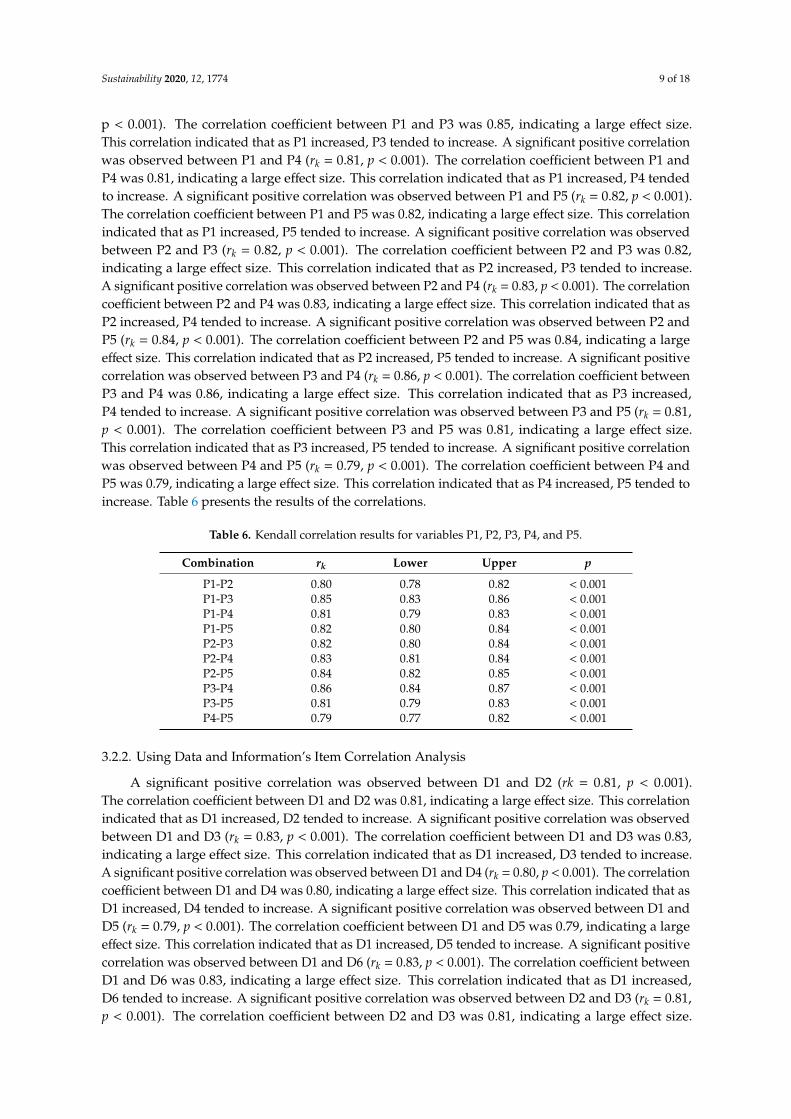
3.2. Kendall Coreelation Cofficients
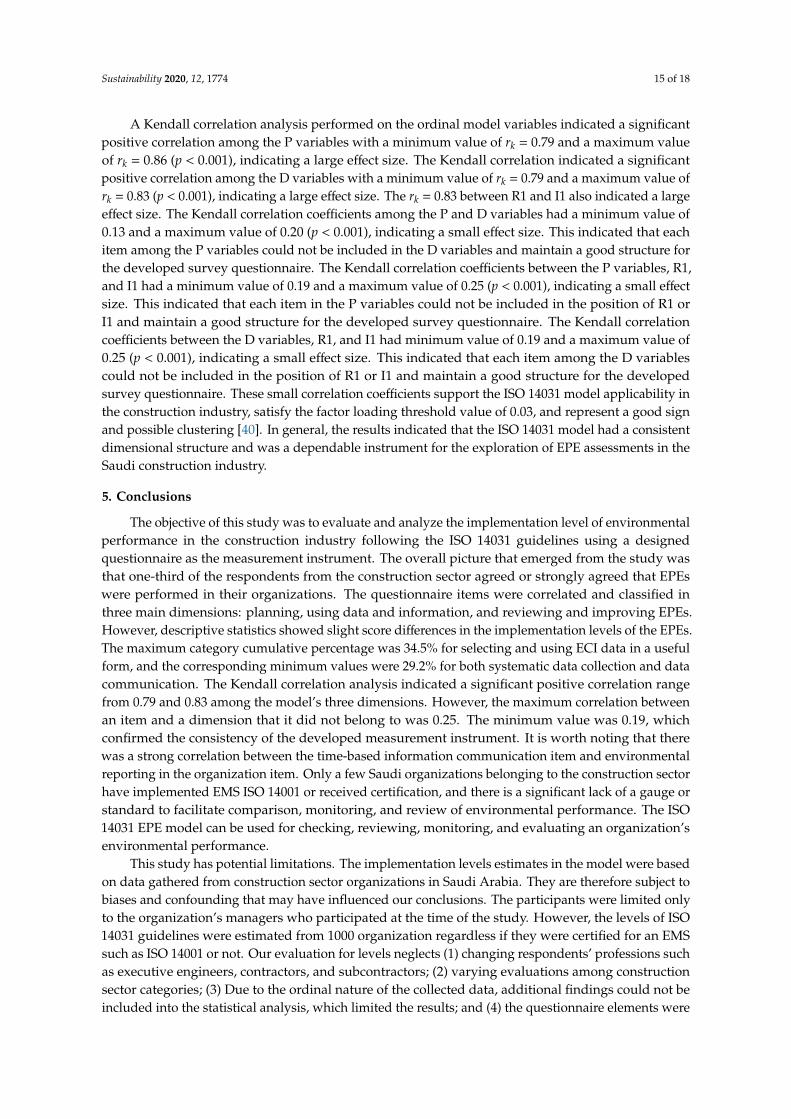
A Kendall correlation coefficient (rk) estimated among the ordinal model variables at 0.05 levelof significance (α) shown in Figure 2. The Figure shows the ellipse-shaped correlogram for model’svariables. It indicates a significance correlation among Ps variables, Ds variables, and between I and Rvariables with a large effect size. The rk among the P variables with a minimum value of rk = 0.79,indicating a large effect size. The rk among the D variables with a minimum value of rk = 0.79, indicatinga large effect size. The rk = 0.83 between R1 and I1 also indicated a large effect size. The rk among the Pand D variables had a maximum value of 0.20, indicating a small effect size. The rk between the Pvariables, R1, and I1 had a maximum value of 0.25, indicating a small effect size. The rk between the Dvariables, R1, and I1 had maximum value of 0.25, indicating a small effect size.
Sustainability 2020, 12, 1774 8 of 17
between the P variables, R1, and I1 had a maximum value of 0.25, indicating a small effect size. The
rk between the D variables, R1, and I1 had maximum value of 0.25, indicating a small effect size.
Figure 2. Ellipse‐shaped correlogram for questionnaire correlation matrix.
3.2.1. Planning for the EPE’s Item Correlation Analysis
A Kendall correlation analysis was conducted among variables P1, P2, P3, P4, and P5. Cohenʹs
standard was used to evaluate the strength of the relationships, where coefficients between 0.10 and
0.29 indicated a small effect size, coefficients between 0.30 and 0.49 indicated a moderate effect size,
and coefficients above 0.50 indicated a large effect size [37]. The correlations were examined using
Holm corrections to adjust for multiple comparisons based on an alpha value of 0.05. A significant
positive correlation was observed between P1 and P2 (rk = 0.80, p < 0.001). The correlation coefficient
between P1 and P2 was 0.80, indicating a large effect size. This correlation indicated that as P1
increased, P2 tended to increase. A significant positive correlation was observed between P1 and P3
(rk = 0.85, p < 0.001). The correlation coefficient between P1 and P3 was 0.85, indicating a large effect
size. This correlation indicated that as P1 increased, P3 tended to increase. A significant positive
correlation was observed between P1 and P4 (rk = 0.81, p < 0.001). The correlation coefficient between
P1 and P4 was 0.81, indicating a large effect size. This correlation indicated that as P1 increased, P4
tended to increase. A significant positive correlation was observed between P1 and P5 (rk = 0.82, p <
0.001). The correlation coefficient between P1 and P5 was 0.82, indicating a large effect size. This
correlation indicated that as P1 increased, P5 tended to increase. A significant positive correlation
was observed between P2 and P3 (rk = 0.82, p < 0.001). The correlation coefficient between P2 and P3
was 0.82, indicating a large effect size. This correlation indicated that as P2 increased, P3 tended to
increase. A significant positive correlation was observed between P2 and P4 (rk = 0.83, p < 0.001). The
correlation coefficient between P2 and P4 was 0.83, indicating a large effect size. This correlation
indicated that as P2 increased, P4 tended to increase. A significant positive correlation was observed
between P2 and P5 (rk = 0.84, p < 0.001). The correlation coefficient between P2 and P5 was 0.84,
indicating a large effect size. This correlation indicated that as P2 increased, P5 tended to increase. A
significant positive correlation was observed between P3 and P4 (rk = 0.86, p < 0.001). The correlation
coefficient between P3 and P4 was 0.86, indicating a large effect size. This correlation indicated that
as P3 increased, P4 tended to increase. A significant positive correlation was observed between P3
and P5 (rk = 0.81, p < 0.001). The correlation coefficient between P3 and P5 was 0.81, indicating a large
effect size. This correlation indicated that as P3 increased, P5 tended to increase. A significant positive
correlation was observed between P4 and P5 (rk = 0.79, p < 0.001). The correlation coefficient between
P4 and P5 was 0.79, indicating a large effect size. This correlation indicated that as P4 increased, P5
tended to increase. Table 6 presents the results of the correlations.
Table 6. Kendall correlation results for variables P1, P2, P3, P4, and P5.
Figure 2. Ellipse-shaped correlogram for questionnaire correlation matrix.
3.2.1. Planning for the EPE’s Item Correlation Analysis
A Kendall correlation analysis was conducted among variables P1, P2, P3, P4, and P5. Cohen’sstandard was used to evaluate the strength of the relationships, where coefficients between 0.10 and0.29 indicated a small effect size, coefficients between 0.30 and 0.49 indicated a moderate effect size,and coefficients above 0.50 indicated a large effect size [37]. The correlations were examined usingHolm corrections to adjust for multiple comparisons based on an alpha value of 0.05. A significantpositive correlation was observed between P1 and P2 (rk = 0.80, p < 0.001). The correlation coefficientbetween P1 and P2 was 0.80, indicating a large effect size. This correlation indicated that as P1 increased,P2 tended to increase. A significant positive correlation was observed between P1 and P3 (rk = 0.85,
Sustainability 2020, 12, 1774 9 of 18
p < 0.001). The correlation coefficient between P1 and P3 was 0.85, indicating a large effect size.This correlation indicated that as P1 increased, P3 tended to increase. A significant positive correlationwas observed between P1 and P4 (rk = 0.81, p < 0.001). The correlation coefficient between P1 andP4 was 0.81, indicating a large effect size. This correlation indicated that as P1 increased, P4 tendedto increase. A significant positive correlation was observed between P1 and P5 (rk = 0.82, p < 0.001).The correlation coefficient between P1 and P5 was 0.82, indicating a large effect size. This correlationindicated that as P1 increased, P5 tended to increase. A significant positive correlation was observedbetween P2 and P3 (rk = 0.82, p < 0.001). The correlation coefficient between P2 and P3 was 0.82,indicating a large effect size. This correlation indicated that as P2 increased, P3 tended to increase.A significant positive correlation was observed between P2 and P4 (rk = 0.83, p < 0.001). The correlationcoefficient between P2 and P4 was 0.83, indicating a large effect size. This correlation indicated that asP2 increased, P4 tended to increase. A significant positive correlation was observed between P2 andP5 (rk = 0.84, p < 0.001). The correlation coefficient between P2 and P5 was 0.84, indicating a largeeffect size. This correlation indicated that as P2 increased, P5 tended to increase. A significant positivecorrelation was observed between P3 and P4 (rk = 0.86, p < 0.001). The correlation coefficient betweenP3 and P4 was 0.86, indicating a large effect size. This correlation indicated that as P3 increased,P4 tended to increase. A significant positive correlation was observed between P3 and P5 (rk = 0.81,p < 0.001). The correlation coefficient between P3 and P5 was 0.81, indicating a large effect size.This correlation indicated that as P3 increased, P5 tended to increase. A significant positive correlationwas observed between P4 and P5 (rk = 0.79, p < 0.001). The correlation coefficient between P4 andP5 was 0.79, indicating a large effect size. This correlation indicated that as P4 increased, P5 tended toincrease. Table 6 presents the results of the correlations.
Table 6. Kendall correlation results for variables P1, P2, P3, P4, and P5.
Combination rk Lower Upper p
P1-P2 0.80 0.78 0.82 < 0.001P1-P3 0.85 0.83 0.86 < 0.001P1-P4 0.81 0.79 0.83 < 0.001P1-P5 0.82 0.80 0.84 < 0.001P2-P3 0.82 0.80 0.84 < 0.001P2-P4 0.83 0.81 0.84 < 0.001P2-P5 0.84 0.82 0.85 < 0.001P3-P4 0.86 0.84 0.87 < 0.001P3-P5 0.81 0.79 0.83 < 0.001P4-P5 0.79 0.77 0.82 < 0.001
3.2.2. Using Data and Information’s Item Correlation Analysis
A significant positive correlation was observed between D1 and D2 (rk = 0.81, p < 0.001).The correlation coefficient between D1 and D2 was 0.81, indicating a large effect size. This correlationindicated that as D1 increased, D2 tended to increase. A significant positive correlation was observedbetween D1 and D3 (rk = 0.83, p < 0.001). The correlation coefficient between D1 and D3 was 0.83,indicating a large effect size. This correlation indicated that as D1 increased, D3 tended to increase.A significant positive correlation was observed between D1 and D4 (rk = 0.80, p < 0.001). The correlationcoefficient between D1 and D4 was 0.80, indicating a large effect size. This correlation indicated that asD1 increased, D4 tended to increase. A significant positive correlation was observed between D1 andD5 (rk = 0.79, p < 0.001). The correlation coefficient between D1 and D5 was 0.79, indicating a largeeffect size. This correlation indicated that as D1 increased, D5 tended to increase. A significant positivecorrelation was observed between D1 and D6 (rk = 0.83, p < 0.001). The correlation coefficient betweenD1 and D6 was 0.83, indicating a large effect size. This correlation indicated that as D1 increased,D6 tended to increase. A significant positive correlation was observed between D2 and D3 (rk = 0.81,p < 0.001). The correlation coefficient between D2 and D3 was 0.81, indicating a large effect size.

Sustainability 2020, 12, 1774 10 of 18
This correlation indicated that as D2 increased, D3 tended to increase. A significant positive correlationwas observed between D2 and D4 (rk = 0.83, p < 0.001). The correlation coefficient between D2 andD4 was 0.83, indicating a large effect size. This correlation indicated that as D2 increased, D4 tendedto increase.
A significant positive correlation was observed between D2 and D5 (rk = 0.79, p < 0.001).The correlation coefficient between D2 and D5 was 0.79, indicating a large effect size. This correlationindicated that as D2 increased, D5 tended to increase. A significant positive correlation was observedbetween D2 and D6 (rk = 0.81, p < 0.001). The correlation coefficient between D2 and D6 was 0.81,indicating a large effect size. This correlation indicated that as D2 increased, D6 tended to increase.A significant positive correlation was observed between D3 and D4 (rk = 0.82, p < 0.001). The correlationcoefficient between D3 and D4 was 0.82, indicating a large effect size. This correlation indicated that asD3 increased, D4 tended to increase. A significant positive correlation was observed between D3 andD5 (rk = 0.80, p < 0.001). The correlation coefficient between D3 and D5 was 0.80, indicating a largeeffect size. This correlation indicated that as D3 increased, D5 tended to increase. A significant positivecorrelation was observed between D3 and D6 (rk = 0.81, p < 0.001). The correlation coefficient betweenD3 and D6 was 0.81, indicating a large effect size. This correlation indicated that as D3 increased,D6 tended to increase. A significant positive correlation was observed between D4 and D5 (rk = 0.80,p < 0.001). The correlation coefficient between D4 and D5 was 0.80, indicating a large effect size.This correlation indicated that as D4 increased, D5 tended to increase. A significant positive correlationwas observed between D4 and D6 (rk = 0.80, p < 0.001). The correlation coefficient between D4 andD6 was 0.80, indicating a large effect size. This correlation indicated that as D4 increased, D6 tended toincrease. A significant positive correlation was observed between D5 and D6 (rk = 0.88, p < 0.001).The correlation coefficient between D5 and D6 was 0.88, indicating a large effect size. This correlationindicated that as D5 increased, D6 tended to increase. Table 7 lists Kendall correlation results forvariables D1, D2, D3, D4, D5, and D6.
Table 7. Kendall correlation results for variables D1, D2, D3, D4, D5, and D6.
Combination rk Lower Upper p
D1-D2 0.81 0.79 0.83 < 0.001D1-D3 0.83 0.80 0.84 < 0.001D1-D4 0.80 0.77 0.82 < 0.001D1-D5 0.79 0.76 0.81 < 0.001D1-D6 0.83 0.81 0.85 < 0.001D2-D3 0.81 0.79 0.83 < 0.001D2-D4 0.83 0.81 0.85 < 0.001D2-D5 0.79 0.76 0.81 < 0.001D2-D6 0.81 0.79 0.83 < 0.001D3-D4 0.82 0.80 0.84 < 0.001D3-D5 0.80 0.78 0.82 < 0.001D3-D6 0.81 0.78 0.83 < 0.001D4-D5 0.80 0.78 0.82 < 0.001D4-D6 0.80 0.78 0.82 < 0.001D5-D6 0.88 0.87 0.89 < 0.001
3.2.3. Reviewing and Improving EPEs Item Correlation Analysis
The correlations were examined based on an alpha value of 0.05. A significant positive correlationwas observed between R1 and I1 (rk = 0.83, p < 0.001). The correlation coefficient between R1 andI1 was 0.83, indicating a large effect size. This correlation indicated that as R1 increased, I1 tended toincrease. Table 8 presents the Kendall correlation results between variables R1 and I1.

Sustainability 2020, 12, 1774 11 of 18
Table 8. Kendall correlation results between variables R1 and I1.
Combination rk Lower Upper p
R1-I1 0.83 0.81 0.85 < 0.001
3.2.4. Planning, Using Data and Information, and Reviewing and Improving EPEs Item CorrelationAnalysis
The correlations were examined based on an alpha value of 0.05. A significant positive correlationwas observed between P1 and D1 (rk = 0.15, p < 0.001). The correlation coefficient between P1 andD1 was 0.15, indicating a small effect size. This correlation indicated that as P1 increased, D1 tendedto increase. A significant positive correlation was observed between P1 and D2 (rk = 0.14, p < 0.001).The correlation coefficient between P1 and D2 was 0.14, indicating a small effect size. This correlationindicated that as P1 increased, D2 tended to increase. A significant positive correlation was observedbetween P1 and D3 (rk = 0.13, p < 0.001). The correlation coefficient between P1 and D3 was 0.13,indicating a small effect size. This correlation indicated that as P1 increased, D3 tended to increase.A significant positive correlation was observed between P1 and D4 (rk = 0.15, p < 0.001). The correlationcoefficient between P1 and D4 was 0.15, indicating a small effect size. This correlation indicated that asP1 increased, D4 tended to increase. A significant positive correlation was observed between P1 andD5 (rk = 0.15, p < 0.001). The correlation coefficient between P1 and D5 was 0.15, indicating a smalleffect size. This correlation indicated that as P1 increased, D5 tended to increase. A significant positivecorrelation was observed between P1 and D6 (rk = 0.16, p < 0.001). The correlation coefficient betweenP1 and D6 was 0.16, indicating a small effect size. This correlation indicated that as P1 increased,D6 tended to increase.
A significant positive correlation was observed between P2 and D1 (rk = 0.16, p < 0.001).The correlation coefficient between P2 and D1 was 0.16, indicating a small effect size. This correlationindicated that as P2 increased, D1 tended to increase. A significant positive correlation was observedbetween P2 and D2 (rk = 0.18, p < 0.001). The correlation coefficient between P2 and D2 was 0.18,indicating a small effect size. This correlation indicated that as P2 increased, D2 tended to increase.A significant positive correlation was observed between P2 and D3 (rk = 0.18, p < 0.001). The correlationcoefficient between P2 and D3 was 0.18, indicating a small effect size. This correlation indicated that asP2 increased, D3 tended to increase. A significant positive correlation was observed between P2 andD4 (rk = 0.19, p < 0.001). The correlation coefficient between P2 and D4 was 0.19, indicating a smalleffect size. This correlation indicated that as P2 increased, D4 tended to increase. A significant positivecorrelation was observed between P2 and D5 (rk = 0.16, p < 0.001). The correlation coefficient betweenP2 and D5 was 0.16, indicating a small effect size. This correlation indicated that as P2 increased,D5 tended to increase. A significant positive correlation was observed between P2 and D6 (rk = 0.17,p < 0.001). The correlation coefficient between P2 and D6 was 0.17, indicating a small effect size.This correlation indicated that as P2 increased, D6 tended to increase.
A significant positive correlation was observed between P3 and D1 (rk = 0.18, p < 0.001).The correlation coefficient between P3 and D1 was 0.18, indicating a small effect size. This correlationindicated that as P3 increased, D1 tended to increase. A significant positive correlation was observedbetween P3 and D2 (rk = 0.16, p < 0.001). The correlation coefficient between P3 and D2 was 0.16,indicating a small effect size. This correlation indicated that as P3 increased, D2 tended to increase.A significant positive correlation was observed between P3 and D3 (rk = 0.18, p < 0.001). The correlationcoefficient between P3 and D3 was 0.18, indicating a small effect size. This correlation indicated that asP3 increased, D3 tended to increase. A significant positive correlation was observed between P3 andD4 (rk = 0.18, p < 0.001). The correlation coefficient between P3 and D4 was 0.18, indicating a smalleffect size. This correlation indicated that as P3 increased, D4 tended to increase. A significant positivecorrelation was observed between P3 and D5 (rk = 0.20, p < 0.001). The correlation coefficient betweenP3 and D5 was 0.20, indicating a small effect size. This correlation indicated that as P3 increased,

Sustainability 2020, 12, 1774 12 of 18
D5 tended to increase. A significant positive correlation was observed between P3 and D6 (rk = 0.20,p < 0.001). The correlation coefficient between P3 and D6 was 0.20, indicating a small effect size.This correlation indicated that as P3 increased, D6 tended to increase.
A significant positive correlation was observed between P4 and D1 (rk = 0.13, p < 0.001).The correlation coefficient between P4 and D1 was 0.13, indicating a small effect size. This correlationindicated that as P4 increased, D1 tended to increase. A significant positive correlation was observedbetween P4 and D2 (rk = 0.15, p < 0.001). The correlation coefficient between P4 and D2 was 0.15,indicating a small effect size. This correlation indicated that as P4 increased, D2 tended to increase.A significant positive correlation was observed between P4 and D3 (rk = 0.15, p < 0.001). The correlationcoefficient between P4 and D3 was 0.15, indicating a small effect size. This correlation indicated that asP4 increased, D3 tended to increase. A significant positive correlation was observed between P4 andD4 (rk = 0.16, p < 0.001). The correlation coefficient between P4 and D4 was 0.16, indicating a smalleffect size. This correlation indicated that as P4 increased, D4 tended to increase. A significant positivecorrelation was observed between P4 and D5 (rk = 0.20, p < 0.001). The correlation coefficient betweenP4 and D5 was 0.20, indicating a small effect size. This correlation indicated that as P4 increased,D5 tended to increase. A significant positive correlation was observed between P4 and D6 (rk = 0.19,p < 0.001). The correlation coefficient between P4 and D6 was 0.19, indicating a small effect size.This correlation indicated that as P4 increased, D6 tended to increase.
A significant positive correlation was observed between P5 and D1 (rk = 0.16, p < 0.001).The correlation coefficient between P5 and D1 was 0.16, indicating a small effect size. This correlationindicated that as P5 increased, D1 tended to increase. A significant positive correlation was observedbetween P5 and D2 (rk = 0.19, p < 0.001). The correlation coefficient between P5 and D2 was 0.19,indicating a small effect size. This correlation indicated that as P5 increased, D2 tended to increase.A significant positive correlation was observed between P5 and D3 (rk = 0.17, p < 0.001). The correlationcoefficient between P5 and D3 was 0.17, indicating a small effect size. This correlation indicated that asP5 increased, D3 tended to increase. A significant positive correlation was observed between P5 andD4 (rk = 0.17, p < 0.001). The correlation coefficient between P5 and D4 was 0.17, indicating a smalleffect size. This correlation indicated that as P5 increased, D4 tended to increase. A significant positivecorrelation was observed between P5 and D5 (rk = 0.15, p < 0.001). The correlation coefficient betweenP5 and D5 was 0.15, indicating a small effect size. This correlation indicated that as P5 increased,D5 tended to increase. A significant positive correlation was observed between P5 and D6 (rk = 0.16,p < 0.001). The correlation coefficient between P5 and D6 was 0.16, indicating a small effect size.This correlation indicated that as P5 increased, D6 tended to increase.
A significant positive correlation was observed between P1 and R1 (rk = 0.19, p < 0.001).The correlation coefficient between P1 and R1 was 0.19, indicating a small effect size. This correlationindicated that as P1 increased, R1 tended to increase. A significant positive correlation was observedbetween P1 and I1 (rk = 0.22, p < 0.001). The correlation coefficient between P1 and I1 was 0.22,indicating a small effect size. This correlation indicated that as P1 increased, I1 tended to increase.A significant positive correlation was observed between P2 and R1 (rk = 0.20, p < 0.001). The correlationcoefficient between P2 and R1 was 0.20, indicating a small effect size. This correlation indicated that asP2 increased, R1 tended to increase. A significant positive correlation was observed between P2 and I1(rk = 0.22, p < 0.001). The correlation coefficient between P2 and I1 was 0.22, indicating a small effect size.This correlation indicated that as P2 increased, I1 tended to increase. A significant positive correlationwas observed between P3 and R1 (rk = 0.23, p < 0.001). The correlation coefficient between P3 andR1 was 0.23, indicating a small effect size. This correlation indicated that as P3 increased, R1 tendedto increase. A significant positive correlation was observed between P3 and I1 (rk = 0.25, p < 0.001).The correlation coefficient between P3 and I1 was 0.25, indicating a small effect size. This correlationindicated that as P3 increased, I1 tended to increase. A significant positive correlation was observedbetween P4 and R1 (rk = 0.23, p < 0.001). The correlation coefficient between P4 and R1 was 0.23,indicating a small effect size. This correlation indicated that as P4 increased, R1 tended to increase.

Sustainability 2020, 12, 1774 13 of 18
A significant positive correlation was observed between P4 and I1 (rk = 0.25, p < 0.001). The correlationcoefficient between P4 and I1 was 0.25, indicating a small effect size. This correlation indicated that asP4 increased, I1 tended to increase.
A significant positive correlation was observed between P5 and R1 (rk = 0.20, p < 0.001).The correlation coefficient between P5 and R1 was 0.20, indicating a small effect size. This correlationindicated that as P5 increased, R1 tended to increase. A significant positive correlation was observedbetween P5 and I1 (rk = 0.23, p < 0.001). The correlation coefficient between P5 and I1 was 0.23,indicating a small effect size. This correlation indicated that as P5 increased, I1 tended to increase.A significant positive correlation was observed between D1 and R1 (rk = 0.19, p < 0.001). The correlationcoefficient between D1 and R1 was 0.19, indicating a small effect size. This correlation indicated that asD1 increased, R1 tended to increase. A significant positive correlation was observed between D1 andI1 (rk = 0.21, p < 0.001). The correlation coefficient between D1 and I1 was 0.21, indicating a smalleffect size. This correlation indicated that as D1 increased, I1 tended to increase. A significant positivecorrelation was observed between R1 and I1 (rk = 0.83, p < 0.001). A significant positive correlationwas observed between D2 and R1 (rk = 0.19, p < 0.001). The correlation coefficient between D2 andR1 was 0.19, indicating a small effect size. This correlation indicated that as D2 increased, R1 tendedto increase. A significant positive correlation was observed between D2 and I1 (rk = 0.22, p < 0.001).The correlation coefficient between D2 and I1 was 0.22, indicating a small effect size. This correlationindicated that as D2 increased, I1 tended to increase. A significant positive correlation was observedbetween D3 and R1 (rk = 0.21, p < 0.001). The correlation coefficient between D3 and R1 was 0.21,indicating a small effect size. This correlation indicated that as D3 increased, R1 tended to increase.A significant positive correlation was observed between D3 and I1 (rk = 0.24, p < 0.001). The correlationcoefficient between D3 and I1 was 0.24, indicating a small effect size. This correlation indicated that asD3 increased, I1 tended to increase.
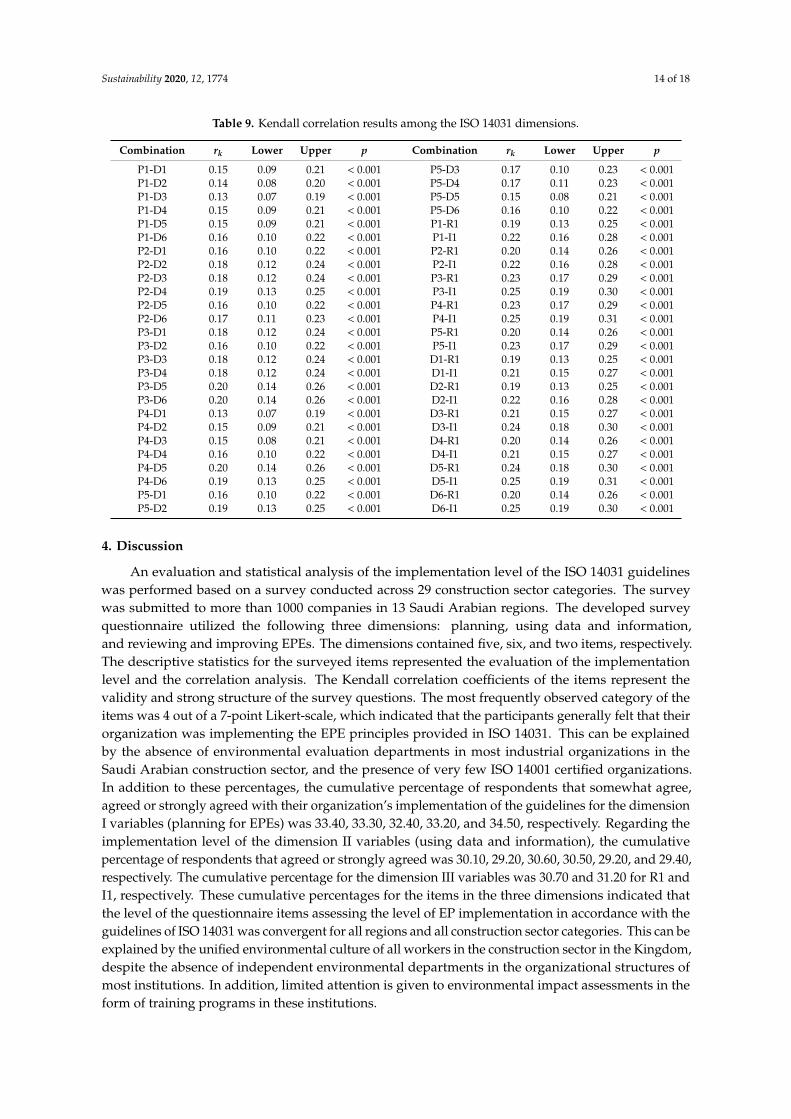
A significant positive correlation was observed between D4 and R1 (rk = 0.20, p < 0.001).The correlation coefficient between D4 and R1 was 0.20, indicating a small effect size. This correlationindicated that as D4 increased, R1 tended to increase. A significant positive correlation was observedbetween D4 and I1 (rk = 0.21, p < 0.001). The correlation coefficient between D4 and I1 was 0.21,indicating a small effect size. This correlation indicated that as D4 increased, I1 tended to increase.A significant positive correlation was observed between D5 and R1 (rk = 0.24, p < 0.001). The correlationcoefficient between D5 and R1 was 0.24, indicating a small effect size. This correlation indicated that asD5 increased, R1 tended to increase. A significant positive correlation was observed between D5 and I1(rk = 0.25, p < 0.001). The correlation coefficient between D5 and I1 was 0.25, indicating a small effect size.This correlation indicated that as D5 increased, I1 tended to increase. A significant positive correlationwas observed between D6 and R1 (rk = 0.20, p < 0.001). The correlation coefficient between D6 andR1 was 0.20, indicating a small effect size. This correlation indicated that as D6 increased, R1 tendedto increase. A significant positive correlation was observed between D6 and I1 (rk = 0.25, p < 0.001).The correlation coefficient between D6 and I1 was 0.25, indicating a small effect size. This correlationindicated that as D6 increased, I1 tended to increase. Table 9 presents Kendall correlation results amongthe ISO 14031 dimensions.
Sustainability 2020, 12, 1774 14 of 18
Table 9. Kendall correlation results among the ISO 14031 dimensions.
Combination rk Lower Upper p Combination rk Lower Upper p
P1-D1 0.15 0.09 0.21 < 0.001 P5-D3 0.17 0.10 0.23 < 0.001P1-D2 0.14 0.08 0.20 < 0.001 P5-D4 0.17 0.11 0.23 < 0.001P1-D3 0.13 0.07 0.19 < 0.001 P5-D5 0.15 0.08 0.21 < 0.001P1-D4 0.15 0.09 0.21 < 0.001 P5-D6 0.16 0.10 0.22 < 0.001P1-D5 0.15 0.09 0.21 < 0.001 P1-R1 0.19 0.13 0.25 < 0.001P1-D6 0.16 0.10 0.22 < 0.001 P1-I1 0.22 0.16 0.28 < 0.001P2-D1 0.16 0.10 0.22 < 0.001 P2-R1 0.20 0.14 0.26 < 0.001P2-D2 0.18 0.12 0.24 < 0.001 P2-I1 0.22 0.16 0.28 < 0.001P2-D3 0.18 0.12 0.24 < 0.001 P3-R1 0.23 0.17 0.29 < 0.001P2-D4 0.19 0.13 0.25 < 0.001 P3-I1 0.25 0.19 0.30 < 0.001P2-D5 0.16 0.10 0.22 < 0.001 P4-R1 0.23 0.17 0.29 < 0.001P2-D6 0.17 0.11 0.23 < 0.001 P4-I1 0.25 0.19 0.31 < 0.001P3-D1 0.18 0.12 0.24 < 0.001 P5-R1 0.20 0.14 0.26 < 0.001P3-D2 0.16 0.10 0.22 < 0.001 P5-I1 0.23 0.17 0.29 < 0.001P3-D3 0.18 0.12 0.24 < 0.001 D1-R1 0.19 0.13 0.25 < 0.001P3-D4 0.18 0.12 0.24 < 0.001 D1-I1 0.21 0.15 0.27 < 0.001P3-D5 0.20 0.14 0.26 < 0.001 D2-R1 0.19 0.13 0.25 < 0.001P3-D6 0.20 0.14 0.26 < 0.001 D2-I1 0.22 0.16 0.28 < 0.001P4-D1 0.13 0.07 0.19 < 0.001 D3-R1 0.21 0.15 0.27 < 0.001P4-D2 0.15 0.09 0.21 < 0.001 D3-I1 0.24 0.18 0.30 < 0.001P4-D3 0.15 0.08 0.21 < 0.001 D4-R1 0.20 0.14 0.26 < 0.001P4-D4 0.16 0.10 0.22 < 0.001 D4-I1 0.21 0.15 0.27 < 0.001P4-D5 0.20 0.14 0.26 < 0.001 D5-R1 0.24 0.18 0.30 < 0.001P4-D6 0.19 0.13 0.25 < 0.001 D5-I1 0.25 0.19 0.31 < 0.001P5-D1 0.16 0.10 0.22 < 0.001 D6-R1 0.20 0.14 0.26 < 0.001P5-D2 0.19 0.13 0.25 < 0.001 D6-I1 0.25 0.19 0.30 < 0.001
4. Discussion
An evaluation and statistical analysis of the implementation level of the ISO 14031 guidelineswas performed based on a survey conducted across 29 construction sector categories. The surveywas submitted to more than 1000 companies in 13 Saudi Arabian regions. The developed surveyquestionnaire utilized the following three dimensions: planning, using data and information,and reviewing and improving EPEs. The dimensions contained five, six, and two items, respectively.The descriptive statistics for the surveyed items represented the evaluation of the implementationlevel and the correlation analysis. The Kendall correlation coefficients of the items represent thevalidity and strong structure of the survey questions. The most frequently observed category of theitems was 4 out of a 7-point Likert-scale, which indicated that the participants generally felt that theirorganization was implementing the EPE principles provided in ISO 14031. This can be explainedby the absence of environmental evaluation departments in most industrial organizations in theSaudi Arabian construction sector, and the presence of very few ISO 14001 certified organizations.In addition to these percentages, the cumulative percentage of respondents that somewhat agree,agreed or strongly agreed with their organization’s implementation of the guidelines for the dimensionI variables (planning for EPEs) was 33.40, 33.30, 32.40, 33.20, and 34.50, respectively. Regarding theimplementation level of the dimension II variables (using data and information), the cumulativepercentage of respondents that agreed or strongly agreed was 30.10, 29.20, 30.60, 30.50, 29.20, and 29.40,respectively. The cumulative percentage for the dimension III variables was 30.70 and 31.20 for R1 andI1, respectively. These cumulative percentages for the items in the three dimensions indicated thatthe level of the questionnaire items assessing the level of EP implementation in accordance with theguidelines of ISO 14031 was convergent for all regions and all construction sector categories. This can beexplained by the unified environmental culture of all workers in the construction sector in the Kingdom,despite the absence of independent environmental departments in the organizational structures ofmost institutions. In addition, limited attention is given to environmental impact assessments in theform of training programs in these institutions.
Sustainability 2020, 12, 1774 15 of 18
A Kendall correlation analysis performed on the ordinal model variables indicated a significantpositive correlation among the P variables with a minimum value of rk = 0.79 and a maximum valueof rk = 0.86 (p < 0.001), indicating a large effect size. The Kendall correlation indicated a significantpositive correlation among the D variables with a minimum value of rk = 0.79 and a maximum value ofrk = 0.83 (p < 0.001), indicating a large effect size. The rk = 0.83 between R1 and I1 also indicated a largeeffect size. The Kendall correlation coefficients among the P and D variables had a minimum value of0.13 and a maximum value of 0.20 (p < 0.001), indicating a small effect size. This indicated that eachitem among the P variables could not be included in the D variables and maintain a good structure forthe developed survey questionnaire. The Kendall correlation coefficients between the P variables, R1,and I1 had a minimum value of 0.19 and a maximum value of 0.25 (p < 0.001), indicating a small effectsize. This indicated that each item in the P variables could not be included in the position of R1 orI1 and maintain a good structure for the developed survey questionnaire. The Kendall correlationcoefficients between the D variables, R1, and I1 had minimum value of 0.19 and a maximum value of0.25 (p < 0.001), indicating a small effect size. This indicated that each item among the D variablescould not be included in the position of R1 or I1 and maintain a good structure for the developedsurvey questionnaire. These small correlation coefficients support the ISO 14031 model applicability inthe construction industry, satisfy the factor loading threshold value of 0.03, and represent a good signand possible clustering [40]. In general, the results indicated that the ISO 14031 model had a consistentdimensional structure and was a dependable instrument for the exploration of EPE assessments in theSaudi construction industry.
5. Conclusions
The objective of this study was to evaluate and analyze the implementation level of environmentalperformance in the construction industry following the ISO 14031 guidelines using a designedquestionnaire as the measurement instrument. The overall picture that emerged from the study wasthat one-third of the respondents from the construction sector agreed or strongly agreed that EPEswere performed in their organizations. The questionnaire items were correlated and classified inthree main dimensions: planning, using data and information, and reviewing and improving EPEs.However, descriptive statistics showed slight score differences in the implementation levels of the EPEs.The maximum category cumulative percentage was 34.5% for selecting and using ECI data in a usefulform, and the corresponding minimum values were 29.2% for both systematic data collection and datacommunication. The Kendall correlation analysis indicated a significant positive correlation rangefrom 0.79 and 0.83 among the model’s three dimensions. However, the maximum correlation betweenan item and a dimension that it did not belong to was 0.25. The minimum value was 0.19, whichconfirmed the consistency of the developed measurement instrument. It is worth noting that therewas a strong correlation between the time-based information communication item and environmentalreporting in the organization item. Only a few Saudi organizations belonging to the construction sectorhave implemented EMS ISO 14001 or received certification, and there is a significant lack of a gauge orstandard to facilitate comparison, monitoring, and review of environmental performance. The ISO14031 EPE model can be used for checking, reviewing, monitoring, and evaluating an organization’senvironmental performance.
This study has potential limitations. The implementation levels estimates in the model were basedon data gathered from construction sector organizations in Saudi Arabia. They are therefore subject tobiases and confounding that may have influenced our conclusions. The participants were limited onlyto the organization’s managers who participated at the time of the study. However, the levels of ISO14031 guidelines were estimated from 1000 organization regardless if they were certified for an EMSsuch as ISO 14001 or not. Our evaluation for levels neglects (1) changing respondents’ professions suchas executive engineers, contractors, and subcontractors; (2) varying evaluations among constructionsector categories; (3) Due to the ordinal nature of the collected data, additional findings could not beincluded into the statistical analysis, which limited the results; and (4) the questionnaire elements were

Sustainability 2020, 12, 1774 16 of 18
included general statements and did not consider the details of evaluating EP in each dimensions.This shortcoming could be treated as extension of the current research. Consequently, further researchis required to examine the structure of the developed model with respect to the variation that existsamong descriptor variables.
Based on our findings, we have contributed to the development of a first measurementstatistical model based on the ISO 14031 guidelines for EPEs. The management activities, processes,and procedures are the only common efforts of all organizations working in the same economicfield or in different industries. Therefore, comparing or benchmarking the environmental qualityof organizations can be done based on the developed model. A natural expansion of the currentresearch could be using the principle component analysis technique to explore the validity of theISO 14031 model to gauge environmental performance in addition to using the explanatory andconfirmatory factor analysis. A clustering analysis could be helpful in future studies to clusterconstruction industry organization with respect to EPEs. The adaptation of the responsible researchand innovation concept and future-oriented technology assessment in the construction industry asa strategy towards sustainability are possible expansions for the study. Important implications canbe derived from the findings of this study. Construction organizations can adopt the developed ISO14031 model as a useful tool to measure their environmental performance even though it does notimplement ISO 14001.
Author Contributions: Conceptualization, M.M. and I.F.; methodology, M.M.; software, S.A.; validation, M.M.and S.A.; formal analysis, I.F.; investigation, M.M.; resources, S.A.; data curation, I.F.; writing—original draftpreparation, S.A. and M.M.; writing—review and editing, M.M., I.F. and S.A.; visualization, M.M.; supervision,M.M. and I.F.; project administration, M.M.; All authors have read and agreed to the published version ofthe manuscript.
Funding: This research received no external funding.
Acknowledgments: The authors are grateful to anonymous reviewers and editors for their comments and suggestionson this article.
Conflicts of Interest: The authors declare no conflict of interest.
References
1. Ball, J. Can ISO 14000 and eco-labelling turn the construction industry green? Build. Environ. 2002, 37,421–428. [CrossRef]
2. ISO-Survey. The ISO Survey of Mangement System Standard Certifications. 2018. Available online:https://www.iso.org/the-iso-survey.html (accessed on 4 November 2019).
3. Environmental Management Systems -Requirements with Guidance for Use; ISO 14001; ISO: Geneva, Switzerland, 2015.4. Bansal, P.; Hunter, T. Strategic Explanations for the Early Adoption of ISO 14001. J. Bus. Ethics 2003, 46,
289–299. [CrossRef]5. Dowell, G.; Hart, S.; Yeung, B. Do Corporate Global Environmental Standards Create or Destroy Market
Value? Manag. Sci. 2000, 46, 1059–1074. [CrossRef]6. Psomas, E.; Fotopoulos, C.; Kafetzopoulos, D. Motives, difficulties and benefits in implementing the ISO
14001 Environmental Management System. Manag. Environ. Qual. Int. J. 2011, 22, 502–521. [CrossRef]7. Anton, W.R.Q.; Deltas, G.; Khanna, M. Incentives for environmental self-regulation and implications for
environmental performance. J. Environ. Econ. Manag. 2004, 48, 632–654. [CrossRef]8. Yüksel, H. An empirical evaluation of cleaner production practices in Turkey. J. Clean. Prod. 2008, 16, S50–S57.
[CrossRef]9. Montabon, F.; Melnyk, S.; Sroufe, R.; Calantone, R. ISO 14000: Assessing Its Perceived Impact on Corporate
Performance. J. Supply Chain Manag. 2006, 36, 4–16. [CrossRef]10. Nawrocka, D.; Parker, T. Finding the connection: Environmental management systems and environmental
performance. J. Clean. Prod. 2009, 17, 601–607. [CrossRef]11. Weber, M. The business case for corporate social responsibility: A company-level measurement approach for
CSR. Eur. Manag. J. 2008, 26, 247–261. [CrossRef]

Sustainability 2020, 12, 1774 17 of 18
12. Orlitzky, M.; Siegel, D.S.; Waldman, D.A. Strategic Corporate Social Responsibility and EnvironmentalSustainability. Bus. Soc. 2011, 50, 6–27. [CrossRef]
13. Mestre, A.; Vogtlander, J. Eco-efficient value creation of cork products: An LCA-based method for designintervention. J. Clean. Prod. 2013, 57, 101–114. [CrossRef]
14. Prajogo, D.; Tang, A.K.Y.; Lai, K.-H. Do firms get what they want from ISO 14001 adoption?: An Australianperspective. J. Clean. Prod. 2012, 33, 117–126. [CrossRef]
15. Melnyk, S.; Sroufe, R.; Calantone, R. A Model of Site Specific Antecedents of ISO 14001 Certification.Prod. Oper. Manag. 2003, 12, 369–385. [CrossRef]
16. López-Gamero, M.D.; Molina-Azorín, J.F.; Claver-Cortés, E. The potential of environmental regulation tochange managerial perception, environmental management, competitiveness and financial performance.J. Clean. Prod. 2010, 18, 963–974. [CrossRef]
17. To, W.M.; Lee, P.K.C. Diffusion of ISO 14001 environmental management system: Global, regional andcountry-level analyses. J. Clean. Prod. 2014, 66, 489–498. [CrossRef]
18. Trierweiller, A.C.; Severo Peixe, B.C.; Tezza, R.; Bornia, A.C.; Campos, L.M.S. Measuring environmentalmanagement disclosure in industries in Brazil with Item Response Theory. J. Clean. Prod. 2013, 47, 298–305.[CrossRef]
19. Delmas, M.A. The diffusion of environmental management standards in Europe and in the United States:An institutional perspective. Policy Sci. 2002, 35, 91–119. [CrossRef]
20. Nishitani, K. Demand for ISO 14001 adoption in the global supply chain: An empirical analysis focusing onenvironmentally conscious markets. Resour. Energy Econ. 2010, 32, 395–407. [CrossRef]
21. Sambasivan, M.; Fei, N.Y. Evaluation of critical success factors of implementation of ISO 14001 using analytichierarchy process (AHP): A case study from Malaysia. J. Clean. Prod. 2008, 16, 1424–1433. [CrossRef]
22. Celik, M. A hybrid design methodology for structuring an Integrated Environmental Management System(IEMS) for shipping business. J. Environ. Manag. 2009, 90, 1469–1475. [CrossRef]
23. Balzarova, M.A.; Castka, P. Underlying mechanisms in the maintenance of ISO 14001 environmentalmanagement system. J. Clean. Prod. 2008, 16, 1949–1957. [CrossRef]
24. Rondinelli, D.; Vastag, G. Panacea, common sense, or just a label?: The value of ISO 14001 environmentalmanagement systems. Eur. Manag. J. 2000, 18, 499–510. [CrossRef]
25. Poksinska, B. Implementing ISO 14000 in Sweden: Motives, benefits and comparisons with ISO 9000. Int. J.Qual. Reliab. Manag. 2003, 20, 585–606. [CrossRef]
26. Henri, J.-F.; Journeault, M. Environmental performance indicators: An empirical study of Canadianmanufacturing firms. J. Environ. Manag. 2008, 87, 165–176. [CrossRef]
27. Environmental Management—Environmental Performance Evaluation—Guidelines; ISO-14031; InternationalOrganization for Standardization: Geneva, Switzerland, 2013.
28. EPA. Bridging the Gap: EPA’s Report on the Environment Provides a Tool for Communicating Health andEnvironmental Trends. Available online: https://blog.epa.gov/tag/environmental-indicators/ (accessed on9 December 2019).
29. Ejdys, J.; Matuszak-Flejszman, A. New Management Systems as an Instrument of Implementation SustainableDevelopment Concept at Organizational Level/Naujos Valdymo Sistemos Kaip Instrumentai IgyvendinantDarnios Pletros Koncepcija Organizaciniu Lygmeniu. Technol. Econ. Dev. Econ. 2010, 16, 202–218. [CrossRef]
30. Ejdys, J.; Matuszak-Flejszman, A.; Szymanski, M.; Ustinovichius, L.; Shevchenko, G.; Lulewicz-Sas, A.Crucial Factors for Improving the ISO 14001 Environmental Management System. J. Bus. Econ. Manag. 2016,17, 52–73. [CrossRef]
31. Contractor Classification Agency. Number of Contarctors Classified by Field; k. o. A., Ed.; Ministry of Municipaland Rural Affairs: Riyadh, Saudi Arabia, 2018.
32. Merriam, S.B. Qualitative Research: A Guide to Design and Implementation, 4th ed.; John Wiley & Sons: Hoboken,NJ, USA, 2015; p. 368.
33. Ravitch, S.M.; Carl, N.C.M. Qualitative Research: Bridging the Conceptual, Theoretical, and Methodological; SAGEPublications Inc.: Thousand Oaks, CA, USA, 2015; p. 600.
34. KSA. Statistical Yearbook of 2018 Kingdom of Saudi Arabia; General Authority for Statistics (GASTAT): Riyadh,Saudi Arabia, 2018; Volume 2018.
35. Simula, B.L. Book Review: The Coding Manual for Qualitative Researchers, 3rd ed. Teach. Sociol. 2018, 46,173–175. [CrossRef]

Sustainability 2020, 12, 1774 18 of 18
36. Wicks, D. The Coding Manual for Qualitative Researchers. Qual. Res. Org. Manag. Int. J. 2017, 12, 169–170.[CrossRef]
37. Cohen, J. Statistical Power Analysis for the Behavioral Sciences; Academic Press: New York, NY, USA, 2013.[CrossRef]
38. Holm, S. A Simple Sequentially Rejective Multiple Test Procedure. Scand. J. Stat. 1979, 6, 65–70. [CrossRef]39. R Core Team. R: A Language and Environment for Statistical Computing; R Foundation for Statistical Computing:
Vienna, Austria, 2018.40. Tabachnick, B.G.; Fidell, L.S. Using Multivariate Statistics; Pearson Education: Boston, MA, USA, 2013.
© 2020 by the authors. Licensee MDPI, Basel, Switzerland. This article is an open accessarticle distributed under the terms and conditions of the Creative Commons Attribution(CC BY) license (http://creativecommons.org/licenses/by/4.0/).