7.6 Economic Evaluation of Environmental Impacts
29
Chapter 7 ENVIRONMENTAL IMPACT ASSESSMENT FOR PROPOSED DEVELOPMENT OF KUANTAN MARITIME HUB AT MUKIM SUNGAI KARANG, KUANTAN, PAHANG DARUL MAKMUR Chemsain Konsultant Sdn Bhd CK/EV703/7021/16 EIA C7-157 Revision No.: 1 Revision Date: Nov 2017 7.6 Economic Evaluation of Environmental Impacts This section contains the analysis and assessment of the economic valuation of environmental impacts for the development of the Kuantan Maritime Hub (KMH) near Kuantan Port in Pahang. The KMH will mainly consist of shipyard, fabrication yard and maritime industrial park with other supporting amenities, utilities and infrastructures to ensure that the proposed project can largely be self-sufficient. The proposed project site will need to be reclaimed in phases with currently approved land size of 500 acres and future development to be considered in this EIA study is reclamation of additional 500 acres. The proposed project will also require a capital dredging along the proposed navigation channel to the shipyards and fabrication yard. The purpose of this economic valuation is to assess in monetary terms the changes in the flow of goods and services provided by the environment. In line with the objectives of the EIA process, an economic valuation is required to: identify and quantify the significant environmental impacts of the Project and make an economic assessment of these impacts into environmental costs and benefits. The proposed KMH project development will have some residual impacts that cannot be completely mitigated. Thus this justifies the need to quantify the degradation in services from the disturbance to the natural environment. Economic valuation serves to demonstrate the significance loss of the environmental values of the services. This provides some measure of trade-off being incurred from the proposed Project. The foregone flows of environmental services with project implementation are real economic loss to different stakeholders. By quantifying these losses, more informed decisions can be made. The following are the methodology and results of the economic valuation of significant environmental impacts of the proposed Project. The intention is to quantify the gains and losses in environmental services that can be attributed to the Project. 7.6.1 Objective The objective of the economic valuation is to quantify and monetize the impacts of the Project on the flow of environmental services. This requires valuation in monetary terms of the changes (both negative and positive if any) in environmental services arising from Project implementation over an assessment period of 50 years. 7.6.2 Methodology A critical step in the valuation process revolves around the need to ensure valid attribution of impacts on environmental services to the Project. In order to satisfy this requirement, physical environmental impacts that can reasonably be attributable to the Project are first demonstrated. The approach requires the establishment of a clear link between project impacts on the physical
-
Upload
khangminh22 -
Category
Documents
-
view
4 -
download
0
Transcript of 7.6 Economic Evaluation of Environmental Impacts

Chapter 7
ENVIRONMENTAL IMPACT ASSESSMENT FOR PROPOSED DEVELOPMENT OF KUANTAN MARITIME HUB AT MUKIM SUNGAI KARANG, KUANTAN, PAHANG DARUL MAKMUR
Chemsain Konsultant Sdn Bhd CK/EV703/7021/16 EIA
C7-157 Revision No.: 1
Revision Date: Nov 2017
7.6 Economic Evaluation of Environmental Impacts
This section contains the analysis and assessment of the economic valuation of environmental
impacts for the development of the Kuantan Maritime Hub (KMH) near Kuantan Port in Pahang. The
KMH will mainly consist of shipyard, fabrication yard and maritime industrial park with other supporting
amenities, utilities and infrastructures to ensure that the proposed project can largely be self-sufficient.
The proposed project site will need to be reclaimed in phases with currently approved land size of 500
acres and future development to be considered in this EIA study is reclamation of additional 500
acres. The proposed project will also require a capital dredging along the proposed navigation
channel to the shipyards and fabrication yard.
The purpose of this economic valuation is to assess in monetary terms the changes in the flow of
goods and services provided by the environment. In line with the objectives of the EIA process, an
economic valuation is required to:
identify and quantify the significant environmental impacts of the Project and
make an economic assessment of these impacts into environmental costs and benefits.
The proposed KMH project development will have some residual impacts that cannot be completely
mitigated. Thus this justifies the need to quantify the degradation in services from the disturbance
to the natural environment. Economic valuation serves to demonstrate the significance loss of the
environmental values of the services. This provides some measure of trade-off being incurred from
the proposed Project. The foregone flows of environmental services with project implementation are
real economic loss to different stakeholders. By quantifying these losses, more informed decisions
can be made.
The following are the methodology and results of the economic valuation of significant
environmental impacts of the proposed Project. The intention is to quantify the gains and losses in
environmental services that can be attributed to the Project.
7.6.1 Objective
The objective of the economic valuation is to quantify and monetize the impacts of the Project on
the flow of environmental services. This requires valuation in monetary terms of the changes
(both negative and positive if any) in environmental services arising from Project implementation
over an assessment period of 50 years.
7.6.2 Methodology
A critical step in the valuation process revolves around the need to ensure valid attribution of
impacts on environmental services to the Project. In order to satisfy this requirement, physical
environmental impacts that can reasonably be attributable to the Project are first demonstrated. The
approach requires the establishment of a clear link between project impacts on the physical

Chapter 7
ENVIRONMENTAL IMPACT ASSESSMENT FOR PROPOSED DEVELOPMENT OF KUANTAN MARITIME HUB AT MUKIM SUNGAI KARANG, KUANTAN, PAHANG DARUL MAKMUR
Chemsain Konsultant Sdn Bhd CK/EV703/7021/16 EIA
C7-158 Revision No.: 1
Revision Date: Nov 2017
functions of the environment and the alteration of the quality and quantity of streams of
environmental goods and services.
In order to identify and value these environmental impacts, the guidelines on economic valuation on
environmental impacts prepared by the DOE are adopted. Adequate considerations have to be taken
with regard to identifying:
i. Identifying the project stakeholders in establishing clear links between the degradation in
environmental services to the impacted parties.
ii. Defining the “With Project” versus “Without Project” scenario. For this proposed project the
“With Project” scenario is defined as the situation where the Project is implemented involving
the reclamation works for use in the KMH development. The “without Project” scenario is
depicted as the situation in which the proposed Project is not implemented, i.e. maintenance
of the status quo.
iii. Describing and listing of potential physical impacts that can be reliably attributed to the project.
Focus is given on the physical extent of the impact and the link between the project and its
impact on the flow of environmental services
iv. After establishing the significant potential physical impacts, these impacts on the environment
over the duration of the project are quantified. These physical impacts of the project on the
environment are explained and quantified via scientific assessments
v. Valuation of these impacts using appropriate methodologies. The quantified impacts
estimated in the previous step are valued in monetary terms using market and
non-market valuation techniques. Value parameters of similar environmental
services obtained in other studies can be used as reference points for the valuation exercise.
vi. Costs and benefits of the potential impacts occur over time. To add these values, they would
have to be discounted to the present values. Several discount rates are used ranging from
4%, 6% and 8%. The period of discounting is over fifty years which are typically used for
evaluation of projects having similar coastal land reclamation. Further this length of time is
the standard period of evaluation since the present value of future costs and benefits
beyond 50 years tend to become quantitatively insignificant.
vii. Determining the aggregated net present values of the potential impacts of the project. The
computation will involve adding up the discounted values of the losses and gains in
environmental services.
viii. Performing a sensitivity analysis on the net present values of these impacts to test for the
robustness of the aggregated net present values estimates under adverse economic and
technical circumstances. A common sensitivity test is to conduct the discounting calculations
under different rates of discount to demonstrate the impact of variation in discount rates
on the net present value of the environmental costs and benefits.
ix. Making appropriate recommendations in consideration of the contributions of the various
physical impacts to the aggregated net present values. Where appropriate mitigation
measures are recommended to ameliorate the significant impacts.

Chapter 7
ENVIRONMENTAL IMPACT ASSESSMENT FOR PROPOSED DEVELOPMENT OF KUANTAN MARITIME HUB AT MUKIM SUNGAI KARANG, KUANTAN, PAHANG DARUL MAKMUR
Chemsain Konsultant Sdn Bhd CK/EV703/7021/16 EIA
C7-159 Revision No.: 1
Revision Date: Nov 2017
7.6.3 Identification of Change in Environmental Services
Table 7.6.1 provides a list of the environmental services that may change as a result of the
implementation of the Project. The table describes the kind and spatial extent of the impacts as well
as their respective locations. From among these potential impacts, mitigation measures are
considered, and only those that are seen to be significant are evaluated in this study.
Of the six (6) potential changes in environmental services as listed in Table 7.6.1, 6 are considered to
be significant enough for evaluation. These are:
1. Loss of fishing ground and increase in fuel and opportunity cost of time for fishermen
2. Loss from repair and replacement of nets damaged during dredging operation
3. Changes to water quality
4. Degradation of mangrove area
5. Decline in recreational services
6. Environmental impacts to residents
The other impacts are considered minimal following the implementation of mitigation measures. The
nature of losses in environmental services for each of the impact is described and evaluated in the
following sub-sections.
Table 7.6.1: Environmental Services Potentially Affected by the Proposed Project
No. Environmental Components
Environmental Services Affected
Location and Stakeholders Affected
Suggestion on Valuation Assessment
1 Loss of fishing ground
There will be a reduction in the size of fishing ground because part of the sea will be reclaimed. The reclamation will force the fishermen to find alternative fishing grounds, potentially increasing their operational costs and time.
Affected stakeholders are the coastal fishermen operating from jetties at Sg. Balok, located about 3.3km from proposed Project site.
Estimate about 90 units of coastal plying boats.
Fishermen who routinely fish in the affected area will have to find other locations. Additional cost of fishing involves the increase in cost of travelling to and from a further alternative fishing ground or to intensify the fishing effort.
Valuation of the increase in fuel and opportunity cost of time will apply.
2 Net repairing and replacement
During the dredging activities, fishing nets are may be entangled by dredger or working vessels causing damage to the nets
Risk of damage to fishing nets if the fishermen is fishing near dredging work areas.
Cost of repairs / replacement technique can be used to value potential losses if the events occur.
Chapter 7
ENVIRONMENTAL IMPACT ASSESSMENT FOR PROPOSED DEVELOPMENT OF KUANTAN MARITIME HUB AT MUKIM SUNGAI KARANG, KUANTAN, PAHANG DARUL MAKMUR
Chemsain Konsultant Sdn Bhd CK/EV703/7021/16 EIA
C7-160 Revision No.: 1
Revision Date: Nov 2017
No. Environmental Components
Environmental Services Affected
Location and Stakeholders Affected
Suggestion on Valuation Assessment
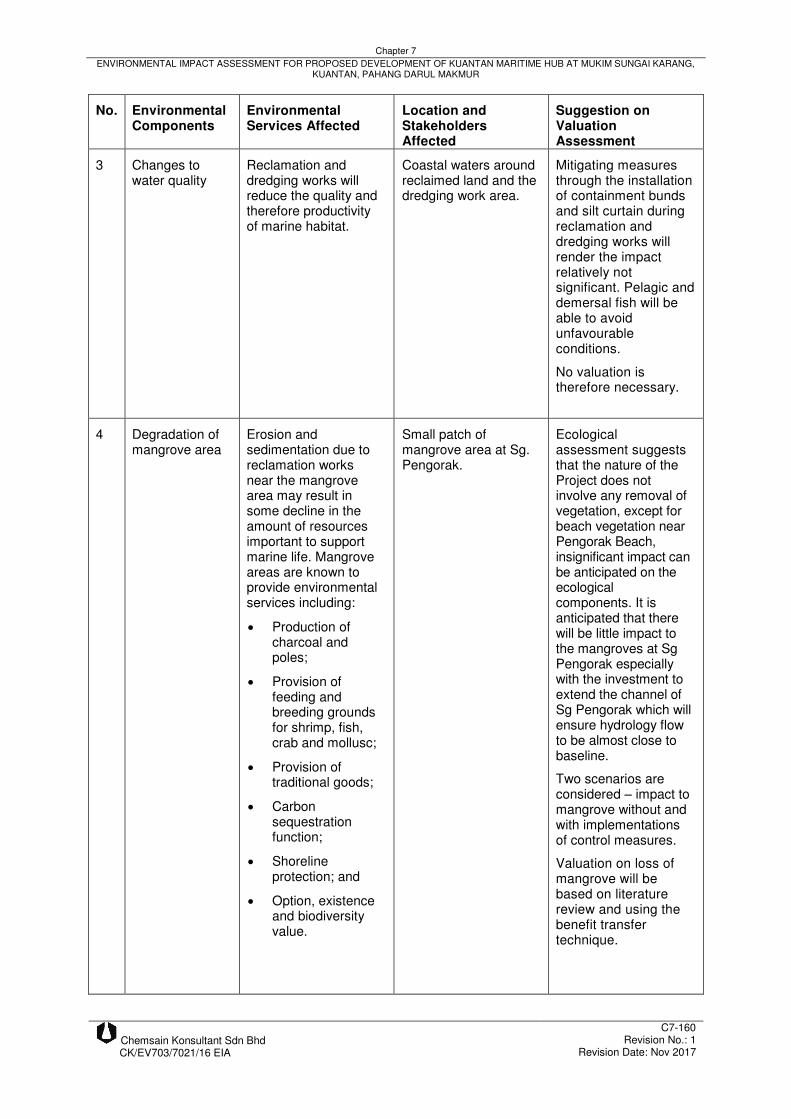
3 Changes to water quality
Reclamation and dredging works will reduce the quality and therefore productivity of marine habitat.
Coastal waters around reclaimed land and the dredging work area.
Mitigating measures through the installation of containment bunds and silt curtain during reclamation and dredging works will render the impact relatively not significant. Pelagic and demersal fish will be able to avoid unfavourable conditions.
No valuation is therefore necessary.
4 Degradation of mangrove area
Erosion and sedimentation due to reclamation works near the mangrove area may result in some decline in the amount of resources important to support marine life. Mangrove areas are known to provide environmental services including:
Production of charcoal and poles;
Provision of feeding and breeding grounds for shrimp, fish, crab and mollusc;
Provision of traditional goods;
Carbon sequestration function;
Shoreline protection; and
Option, existence and biodiversity value.
Small patch of mangrove area at Sg. Pengorak.
Ecological assessment suggests that the nature of the Project does not involve any removal of vegetation, except for beach vegetation near Pengorak Beach, insignificant impact can be anticipated on the ecological components. It is anticipated that there will be little impact to the mangroves at Sg Pengorak especially with the investment to extend the channel of Sg Pengorak which will ensure hydrology flow to be almost close to baseline.
Two scenarios are considered – impact to mangrove without and with implementations of control measures.
Valuation on loss of mangrove will be based on literature review and using the benefit transfer technique.

Chapter 7
ENVIRONMENTAL IMPACT ASSESSMENT FOR PROPOSED DEVELOPMENT OF KUANTAN MARITIME HUB AT MUKIM SUNGAI KARANG, KUANTAN, PAHANG DARUL MAKMUR
Chemsain Konsultant Sdn Bhd CK/EV703/7021/16 EIA
C7-161 Revision No.: 1
Revision Date: Nov 2017
No. Environmental Components
Environmental Services Affected
Location and Stakeholders Affected
Suggestion on Valuation Assessment
5 Recreational services
The existing Pengorak beach provides beach recreational activities and some angling area. Reclamation of the Project site will reduce footprint of Pengorak beach and thus, reduces the value of recreational services.
Section of Pengorak beach that will be reclaimed. Thus, visitors who benefit from the recreational services are perceived to have directly impacted.
Visitor decision to come-by maybe affected by the reclamation project. Their purpose of visit and angling will be marginally affected.
Valuation is undertaken using the travel cost method.
6 General environmental impact such as traffic, noise and air quality
Construction works involve movement from the sea and land sides. Some increase in traffic, noise and dust are considered as nuisance to the locals.
Fishermen plying through the sea during fishing and residents living close to the reclaimed area would be directly inconvenienced.
A contingent valuation technique could be used to assess willingness to pay to avoid the inconvenience suffered
7.6.3.1 Loss Of Fishing Ground And Increase In Fuel And Opportunity Cost Of Time For
Fishermen
Generally, most of the surveyed fishermen came from jetties located at Sg. Balok. Based on
observation at the jetty, approximately 90 active boats were docking there. The jetty is about 3.3 km
from the proposed Project site. With the proposed Project which involves reclamation of sea area
near Pengorak beach, the fishermen did not feel that their fishing ground area will disappear
completely but it will have some impact on their fishing time and the number of commute for their
fishing nets. Hence, there are two economic effects that fishermen have to face:
Increase the cost of fuel due to commute at sea for longer distances
Longer fishing time than usual. The economic value of this extra time can be calculated
according to the concept of opportunity cost which is proxied by hourly catch value of the
initial ‘without project’ scenario.
It was estimated that about 90 fishing boats operate regularly along the coast where reclamation will
take place. This area is claimed as one of the fishing grounds. Fishing activities can take place day or
night, and at various stages of the tides. The fishermen will be directly impacted because the would-
be reclaimed area is part of their regular fishing grounds. If they are no longer allowed to catch fish in
this area, then they need to spend longer time in the sea as compared to their normal days. This will
cause them to bear more fuel costs when they are forced to sow and drag the nets more often than
usual.

Chapter 7
ENVIRONMENTAL IMPACT ASSESSMENT FOR PROPOSED DEVELOPMENT OF KUANTAN MARITIME HUB AT MUKIM SUNGAI KARANG, KUANTAN, PAHANG DARUL MAKMUR
Chemsain Konsultant Sdn Bhd CK/EV703/7021/16 EIA
C7-162 Revision No.: 1
Revision Date: Nov 2017
7.6.3.1.1 Incremental of Fuel Cost
It is determined that the coastal fishermen generally use outboard engines ranging from 15 to 60
horsepower. A significantly smaller proportion of fishermen use bigger horsepower engines, and this
group usually fish in deeper water area away from the proposed Project site. The corresponding
estimated fuel usage per day is 17 litres to 61 litres per trip depending on engine horsepower. A litre
of subsidized petrol costs the fishermen RM 1.65. However, for economic valuation the true resource
cost as reflected by unsubsidized market price should be used. For this study, a market price of RM
2.20 per litre is applied to determine the fuel cost.
In order to assess the likely increase in the cost of fuel as a result of the Project, the following
assumptions are employed:
The average number of fishing days is 20 trips in a month. This figure is derived from the
survey conducted of the fishermen;
Although the boats belong to various horsepower categories, but they incur the same
distance to fishing grounds where the Project site is located. The increase in distance is
computed to be about 20 km noting that the coastal fishing distance is about 3 nautical mile
plus distance searching for fish colonies travelled. Hence the fuel incurred is assumed similar.
Figure 6.4.1 in Chapter 6 shows the location of jetty within Sg. Balok and the coastal area as
well as the Project site.
The increase of 50% fuel cost for a single trip was assumed based on feedbacks given by
fishermen interviewed. Nevertheless, a lower increase of 25% was also used as suggested by
Dr. Nik & Associate (2016)1.
The additional fuel cost per month can then be computed as:
= Fuel in litres/trip x RM 2.20/litre x 20 trips x (50% or 25%)
The incremental fuel cost calculated as presented in Table 7.6.2.
1 Environmental Impact Assessment (Second Schedule) for the Proposed Land Reclamation and Dredging of
Kuantan Waterfront Resort City, Kuantan, Pahang by Ideal Heights Development Sdn Bhd and Prepared by Dr Nik & Associates Sdn Bhd in October 2016

Chapter 7
ENVIRONMENTAL IMPACT ASSESSMENT FOR PROPOSED DEVELOPMENT OF KUANTAN MARITIME HUB AT MUKIM SUNGAI KARANG, KUANTAN, PAHANG DARUL MAKMUR
Chemsain Konsultant Sdn Bhd CK/EV703/7021/16 EIA
C7-163 Revision No.: 1
Revision Date: Nov 2017
Table 7.6.2: Total Annual Incremental Fuel Cost
No of trip/month 20
No of Boat Owner 90
Average distance (km) 20
Average fuel (l/trip) 20.57
Value of Fuel Consumption per Trip (RM) RM45.25
Monthly Value of Fuel Consumption per Boat (RM) RM905.01
Monthly Fuel Consumption by Fishermen (RM) RM81,450.80
Based on 50% incremental fuel consumption per trip with proposed Project
Monthly Incremental Fuel Cost (RM) RM40,725.40
Annual Increment Fuel Cost (RM) RM488,704.80
Based on 25% incremental fuel consumption per trip with proposed Project
Monthly Incremental Fuel Cost (RM) RM20,362.70
Annual Increment Fuel Cost (RM) RM244,352.40
For an average distance per trip of 20 km/trip, fishermen will incur an average of RM45.25/trip.
Taking consideration the number of boats and adding up per month and per year provides us an
estimate of the additional incremental fuel cost incurred by the fishermen as a result of the
proposed Project. The estimated total incremental fuel cost is RM0.49 million per year and RM0.24
million per year for 50% and 25% incremental fuel consumption per trip respectively.
7.6.3.1.2 Opportunity Cost of Fishermen
Usually fishermen spend an average of 6.5 hours at sea. When the reclamation takes place, the
fishing ground in the reclaimed area will be completely closed to any fishing activities. Consequently
fishermen are forced to catch in other areas along the coast. Two additional travel time periods were
used, 1 hour as assumed by Dr. Nik & Associate (2016) and 2 hrs as provided by the fishermen
interviewed. Hence, the average fishing time could increase to 7.5 hours or 8.5 hours per trip
depending on the assumption being made. Hence, these additional working hours is the loss of
potential gain from initial alternatives measured as opportunity cost incurred by fishermen.
In order to compute the value of opportunity loss, we need to gather several information on a monthly
basis as follows:
Average catch for different species per trip per boat crew
Ex-jetty prices of various species per kilogram
As shown in Figure 7.6.1 fish harvest vary monthly due to fish species availability and fishing season.
From these information we average out the net harvest value after deducting fishing effort cost. As
shown in the graph net harvesting revenues are at two levels, on a per boat basis and on a per

Chapter 7
ENVIRONMENTAL IMPACT ASSESSMENT FOR PROPOSED DEVELOPMENT OF KUANTAN MARITIME HUB AT MUKIM SUNGAI KARANG, KUANTAN, PAHANG DARUL MAKMUR
Chemsain Konsultant Sdn Bhd CK/EV703/7021/16 EIA
C7-164 Revision No.: 1
Revision Date: Nov 2017
fisherman basis. Harvest per boat are reallocated into three – to the boat owner, crew head and
assistant.
Figure 7.6.1: Cost and earning structure of fishing at proposed Project site (Source: Information from interviews of fishermen)
The opportunity cost of incremental hour of fishing efforts on affected fishermen was obtained by
dividing net harvest per boat trip by 6.5 hours of fishing trip (Table 7.6.3). As in the case of the
additional fuel consumed, a 20 fishing day was assumed. It is considered that to retain the same net
revenue each boat crew has to undertake for an extra 1 or 2 hours of travel to new fishing grounds.
Over the year the total opportunity cost incurred for all the 90 fishing boats working on the monthly of
20 fishing days were estimated as RM1.16 million and RM2.33 million at the assumed 1 and 2 hours
additional travel time per trip respectively.
Table 7.6.3: The Opportunity Cost from Incremental Working Hours by Fishermen.
Net fish harvest (RM/month/boat) 7,003.65
Net fish harvest (RM/trip/boat) 350.18
Net fish harvest (RM/hr/boat)1 53.87
High Estimates (2 hours additional travel time/trip)
Opportunity cost (RM/trip/boat) 107.75
Annual opportunity cost (RM/boat/yr) 25,859.63
Total opportunity cost (RM/yr)2 2,327,366.77
Low Estimates (1 hour additional travel time/trip)
Opportunity cost (RM/trip/boat) 53.87
Annual opportunity cost (RM/boat/yr) 12,929.82
Total opportunity cost (RM/yr)2 1,163,683.38
Notes: 1
Using a 20 fishing day per month
2 Total opportunity cost = Opportunity Cost X numbers of monthly trips X 12 month X 90 boats
0
2000
4000
6000
8000
10000
12000
14000
1 2 3 4 5 6 7 8 9 10 11 12
Month Gross Harvest (RM/Boat) Fishing cost (RM/boat)
Net Harvest (RM/boat) Net Harvest (RM/Fisherman)

Chapter 7
ENVIRONMENTAL IMPACT ASSESSMENT FOR PROPOSED DEVELOPMENT OF KUANTAN MARITIME HUB AT MUKIM SUNGAI KARANG, KUANTAN, PAHANG DARUL MAKMUR
Chemsain Konsultant Sdn Bhd CK/EV703/7021/16 EIA
C7-165 Revision No.: 1
Revision Date: Nov 2017
7.6.3.2 Degradation Of Mangrove
Short strip of mangrove vegetation can be found at the river mouth of Sg Pengorak. Due to
development along upstream of Sg Pengorak, most of the mangrove along the river has been cleared
and filled hence making the balance of mangrove area concentrated near the river mouth. It is
estimated that the area of the mangrove of approximately 1.4 ha, will be degraded and even
inundated if no mitigation measures are applied.
The nature of the proposed Project does not involve any removal of vegetation, except for beach
vegetation near Pengorak beach. No significant impacts is expected at the mangrove area at Sg.
Pengorak during the operation stage as a drainage system has been incorporated to the proposed
Project to extend the channel from Sg. Pengorak to maintain hydrology flow close to existing
conditions, thus ensuring tidal flow of saline water is maintained. However, during the reclamation
stage and construction of the channel extension, some short term blockages due to diversion of
flow between Sg Pengorak and the sea may occurred. Hence at the extreme situation, a small
stretch of mangrove may still be at risk. Depending on the level and efficiency of controls
adopted and after a discussion with the ecologist, it was anticipated that the degradation impact
would be 50% and 5% for without and with efficient management controls.
There are many important roles of mangrove such as coastal protection (Dahdouh-Guebas et al.,
2005 and Barbier et al., 2008), binding the soil and also purify the water by absorbing impurities and
harmful heavy metals, site for nursery and breeding ground for juvenile fish and prawn larvae
(Robertson & Duke, 1987) and providing of important permanent and temporary habitats for a large
number and range of marine and terrestrial fauna (Luther & Greenburg, 2009). There is an increasing
number and intensity of natural hazards at coastal areas in the event of global warming. The value of
Malaysian mangroves just for storm protection and flood control has been estimated at US$300,000
per km of coastline, which is based on the cost of replacing the mangroves with rock walls (Ramsar
Secretariat, 2001). Besides this, the barrier functions of mangroves are important in protecting lands
located behind the mangrove fringe from seawater intrusion and salinization.
To assess the economic value of the loss of mangroves requires conducting a valuation
methodological call benefit transfer whereby the estimated economic values of mangroves
undertaken elsewhere is used as the average economic value of environmental services provided by
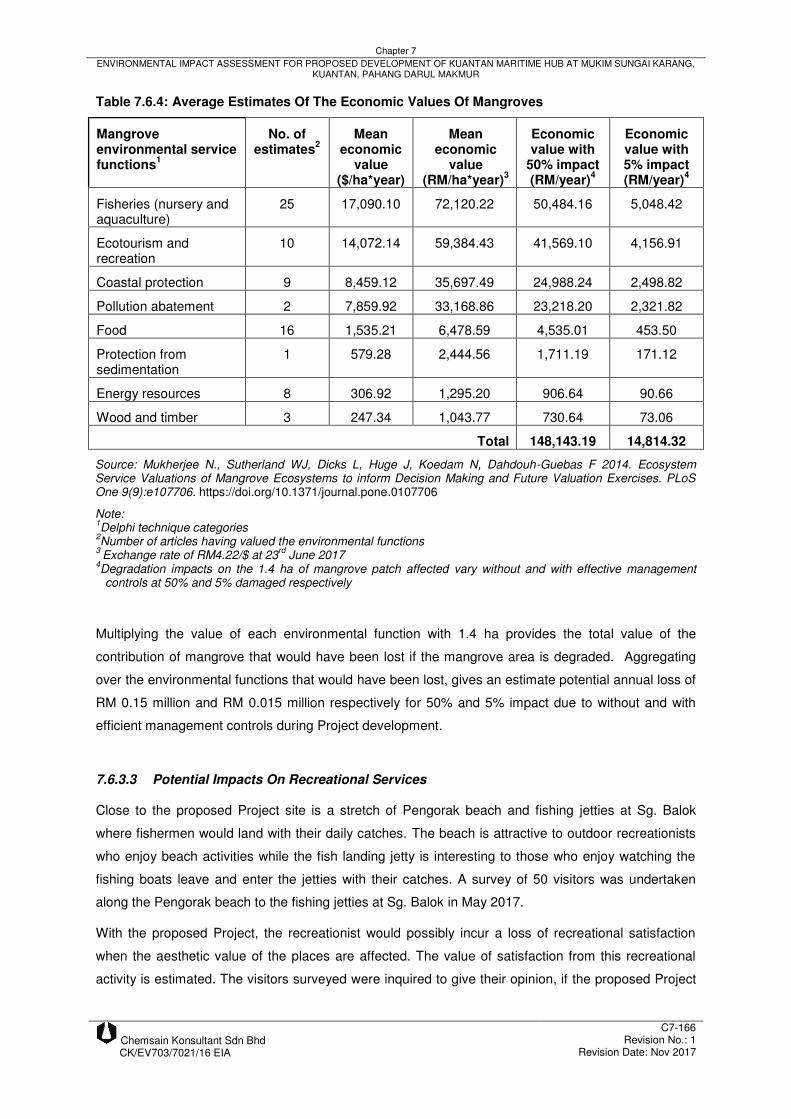
mangroves that could be loss with the project. Mukherjee et al 2014 provides an average estimate of
the economic value of mangroves as presented in Table 7.6.4.
Chapter 7
ENVIRONMENTAL IMPACT ASSESSMENT FOR PROPOSED DEVELOPMENT OF KUANTAN MARITIME HUB AT MUKIM SUNGAI KARANG, KUANTAN, PAHANG DARUL MAKMUR
Chemsain Konsultant Sdn Bhd CK/EV703/7021/16 EIA
C7-166 Revision No.: 1
Revision Date: Nov 2017
Table 7.6.4: Average Estimates Of The Economic Values Of Mangroves
Mangrove environmental service functions
1
No. of estimates
2
Mean economic
value ($/ha*year)
Mean economic
value (RM/ha*year)
3
Economic value with
50% impact (RM/year)
4
Economic value with 5% impact (RM/year)
4
Fisheries (nursery and aquaculture)
25 17,090.10 72,120.22 50,484.16 5,048.42
Ecotourism and recreation
10 14,072.14 59,384.43 41,569.10 4,156.91
Coastal protection 9 8,459.12 35,697.49 24,988.24 2,498.82
Pollution abatement 2 7,859.92 33,168.86 23,218.20 2,321.82
Food 16 1,535.21 6,478.59 4,535.01 453.50
Protection from sedimentation
1 579.28 2,444.56 1,711.19 171.12
Energy resources 8 306.92 1,295.20 906.64 90.66
Wood and timber 3 247.34 1,043.77 730.64 73.06
Total 148,143.19 14,814.32
Source: Mukherjee N., Sutherland WJ, Dicks L, Huge J, Koedam N, Dahdouh-Guebas F 2014. Ecosystem Service Valuations of Mangrove Ecosystems to inform Decision Making and Future Valuation Exercises. PLoS One 9(9):e107706. https://doi.org/10.1371/journal.pone.0107706
Note: 1Delphi technique categories
2Number of articles having valued the environmental functions
3 Exchange rate of RM4.22/$ at 23
rd June 2017
4Degradation impacts on the 1.4 ha of mangrove patch affected vary without and with effective management controls at 50% and 5% damaged respectively
Multiplying the value of each environmental function with 1.4 ha provides the total value of the
contribution of mangrove that would have been lost if the mangrove area is degraded. Aggregating
over the environmental functions that would have been lost, gives an estimate potential annual loss of
RM 0.15 million and RM 0.015 million respectively for 50% and 5% impact due to without and with
efficient management controls during Project development.
7.6.3.3 Potential Impacts On Recreational Services
Close to the proposed Project site is a stretch of Pengorak beach and fishing jetties at Sg. Balok
where fishermen would land with their daily catches. The beach is attractive to outdoor recreationists
who enjoy beach activities while the fish landing jetty is interesting to those who enjoy watching the
fishing boats leave and enter the jetties with their catches. A survey of 50 visitors was undertaken
along the Pengorak beach to the fishing jetties at Sg. Balok in May 2017.
With the proposed Project, the recreationist would possibly incur a loss of recreational satisfaction
when the aesthetic value of the places are affected. The value of satisfaction from this recreational
activity is estimated. The visitors surveyed were inquired to give their opinion, if the proposed Project

Chapter 7
ENVIRONMENTAL IMPACT ASSESSMENT FOR PROPOSED DEVELOPMENT OF KUANTAN MARITIME HUB AT MUKIM SUNGAI KARANG, KUANTAN, PAHANG DARUL MAKMUR
Chemsain Konsultant Sdn Bhd CK/EV703/7021/16 EIA
C7-167 Revision No.: 1
Revision Date: Nov 2017
would worsen the quality of their future opportunities to enjoy the recreational benefits and if so by
how much. Working on this assumption the probable loss due to the environmental impact of the
proposed Project is computed.
The Travel Cost Method (TCM) is the appropriate valuation procedure to use when estimating the
value of the recreational services. The TCM requires first fitting a Trip Generating Function (TGF) that
represents the demand for the recreational activity. Since we are interested only on the value of the
outdoor recreation at the beach, only respondents who were engaged in this activity were used for the
TGF estimation. This reduced the relevant respondents to 31. The economic value is obtained by
calculating the consumer’s surplus which is the area below the demand curve but above the travel
cost of the visitors.
Table 7.6.5 shows the demographic characteristics of the beach recreationists surveyed. In general
the majority of these visitors were males with 77.4% presence and their ages ranged from 18 to 50
years with the mean (33 years) exceeding the median (32 years).. The visitors have a range of
educational background from primary schooling to even university degrees with mean and median
being Sijil Pelajaran Menengah (SPM). The incomes of the visitors ranged from RM250/month to
RM5,250/month with the median and mean of RM2,250/month and RM2,298.89/month. The number
of visits made in 2016 ranged from only 2 visits/year to as high as every day, the latter refers to
retirees who enjoyed to past their time enjoying the breeze and ocean view. This also explains why
the median number of visits were 40/year were lower than the mean of 75.90/year.
The distance travelled to the recreational site ranged from 0.5 km to as far as 270 km away with a
median of 15 km and a mean of 41 km away. In terms of time taken to travel to the site ranged from 5
minutes to 3.5 hours with a median of 20 minutes and a mean of 41 minutes again suggesting that
those who came from a far such as from Kuala Lumpur were few in numbers. Other than those who
walk, the majority used motorcycles and cars to travel to the site.
Table 7.6.5: Demographic characteristics of the visitors surveyed
Demography Range Median Mean
Gender 77.4% Male Male Male
Age 18 – 50 years 32 years 33 years
Education Level Primary School to University SPM SPM
Income (RM/month) 250 – 5,250 2250 2,298.89
Number of Visits/year 2 times to every day 40 75.90
Time Travelled 5 minutes -3.5 hours 20 minutes 42.1 minutes
Vehicle motorcycle and car Car Car
Distance travelled 0.5 km - 270 km 15 km 41 km

Chapter 7
ENVIRONMENTAL IMPACT ASSESSMENT FOR PROPOSED DEVELOPMENT OF KUANTAN MARITIME HUB AT MUKIM SUNGAI KARANG, KUANTAN, PAHANG DARUL MAKMUR
Chemsain Konsultant Sdn Bhd CK/EV703/7021/16 EIA
C7-168 Revision No.: 1
Revision Date: Nov 2017
Trip Generating Function(TGF)
A recreational TGF to the recreational area at Pengorak beach was estimated. The estimated
econometric coefficients for the TGF are provided in Table 7.6.6 the equation functional forms in
Equations I.
Two common functional forms for a TGF to estimate are the linear and semi-logarithmic forms that
have the advantage of obtaining the consumer surplus for a visit directly. Base on theoretical
consideration (negative coefficient for travel cost) and statistical diagnostics, the estimated semi-log
TGF provided the best fit and is provided in Table 7.6.6 that gives the following function:
LnVisit = 2.4744 – 0.0087 Travel Cost + 0.0450 Age (Equation I)
(3.12)** (-3.91)** (1.91)*
The function is overall relatively well-fitted with two independent variables having statistically
significant coefficients with the correct signs. The estimated function has an F statistic statistically
significant at the 1% level and a adjusted coefficient of multiple determination (R2) of 33.41% which is
acceptable considering that the function is estimated using cross-sectional data.
Table 7.6.6: Trip generation function for outdoor recreation at Pengorak beach and jetties at Sg.
Balok
Coefficients Standard Error t Statistic
Intercept 2.4744** 0.7942 3.1154
Travel cost -0.0087** 0.0022 -3.9105
Age 0.0450* 0.0236 1.9088
Notes:
** * statistically significant at the 1% and 10% level Adjusted R
2 is 33.41%
F statistic of 8.53 is statistically significant at 1% level
From the TGF function the average consumer surplus per visit is estimated by the following formula :
Consumer Surplus per visit = (- 1/coefficient of Travel Cost)
= (- 1 / -0.0087)
= RM 114.94
The economic values gain by visitors for engaging in beach activities at Pengorak beach is estimated
to worth about RM 114.94 per visit.
Literature review in Malaysia on economic value of outdoor recreation suggests that the estimate
obtained is acceptable, although on the high side. Using dichotomous choice contingent valuation, the
highest estimate obtained of the mean willingness to pay for recreational benefit at Kapar Bird

Chapter 7
ENVIRONMENTAL IMPACT ASSESSMENT FOR PROPOSED DEVELOPMENT OF KUANTAN MARITIME HUB AT MUKIM SUNGAI KARANG, KUANTAN, PAHANG DARUL MAKMUR
Chemsain Konsultant Sdn Bhd CK/EV703/7021/16 EIA
C7-169 Revision No.: 1
Revision Date: Nov 2017
Sanctuary, Kelang was RM 60.94 (Seddigheh et al. 2009). But it is not uncommon to obtain high
consumer’s surplus estimates for unique nature. Jamal and Redzuan (1997) using the travel cost
method obtained high estimates as well ranging from RM 62 to RM 120 per trip for the opportunities
to view the fireflies illuminating the Beremban trees by cruising in a boat along the Sg. Kuantan, Kuala
Selangor.
The second component of the investigation is to estimate how much reduction in recreational services
visitors would suffer from the Project. It was found that ‘with the Project option’, the recreationists at
the beach perceived an average reduction of 10% in recreational satisfaction arising among others
from the problems of potential loss of natural vista and noise as well as water pollution cause by the
Project’s activities. This allows a computation of reduction of economic value ‘with the Project option’
of RM 11.49 per visit (Table 7.6.7).
The third component of the analysis requires an estimation of the visitation rates to the Pengorak
beach. Based on field investigations, it was estimated that during the weekends and weekdays the
average visits were 50 and 10 times per day respectively. This provides estimated annual visits of
7,200 trips. Hence, the total annual economic value from potential impact to recreational services is
estimated to be about RM82,728.00.
Table 7.6.7: Economic Value from a Perceived Decline in Satisfaction of Beach Activities and View of Boats Movement at Jetties in Sg. Balok.
Consumer Surplus/trip Without
Project (RM)
Consumer Surplus/trip With
Project (RM)
Decline in Consumer Surplus/trip (RM)
Decline in Consumer Surplus/Year (RM )
114.94 103.45 -11.49 -82,728.00
7.6.3.4 Contingent Valuation Of Environmental Impacts To Residents
The development stage of the Project would involve transportation of construction materials to the
Project site either by sea or land. There would be some amount of Project induced traffic to be
generated both at the sea and later on land in the form of construction equipment and other
transporting lorries carrying construction materials. Local fishermen plying through the sea during
fishing and residents living close to the proposed Project site would be directly inconvenienced by the
greater sea and land traffic, noise and air pollution.
A contingent valuation technique could be used to assess the loss in economic welfare to local
residents from the Project’s development activities by soliciting their hypothetical willingness to pay
bids to avoid the potential inconvenience suffered.
The contingent valuation exercise involved 51 respondents who are local residents living in areas
surrounding the Project site. The valuation followed the following steps:

Chapter 7
ENVIRONMENTAL IMPACT ASSESSMENT FOR PROPOSED DEVELOPMENT OF KUANTAN MARITIME HUB AT MUKIM SUNGAI KARANG, KUANTAN, PAHANG DARUL MAKMUR
Chemsain Konsultant Sdn Bhd CK/EV703/7021/16 EIA
C7-170 Revision No.: 1
Revision Date: Nov 2017
1. In the questionnaire, the respondents were briefed on the development of Kuantan
Maritime Hub with the aid of appropriate diagrams and maps. The typical layout of the
facilities is explained where it will be developed with a land area of 500 acres under Phase
1 of the proposed project. Among the facilities described in this phase 1 include shipyard,
fabrication yard, institution, marine industrial park and, business and residential park. The
location of proposed facilities is proximity to Kuantan port with the nearest settlement is Kg
Selamat. During the construction phase, the major activities would involve the dredging and
reclamation process. These activities would involve heavy and sophisticated machinery
such as grab dredger, sand carrier, barge, etc on sea and lorry and truck on land.
During the interviewing process, even though the dredger and sand carrier route would be
earmarked, fishermen were still worried of their safety. While on land even though the truck
route will not pass through the residential area, local residents felt worried about the safety
of road users in the event of increasing number of large trucks on the road. Apart of that,
they also worried the noise and pollution occurrence cause by the movement of truck and
lorries on the road as well as barge and boats at sea.
2. The respondents were then asked how much they are willing to pay for a volunteer
safeguard services to monitor the activities at sea during sand dredging and filling and
routes taking up by dredger and barges and on land during construction to make sure that
the lorries and trucks are under control and not to work at night.
3. There are 66.67% of the respondents who felt that the payment for establishing safeguard
measures including a monitoring team, as being reasonable while the remaining 33.33%
thought otherwise. All the respondents were then asked: depending on the location of their
homes, how much they willing to pay for the above assessment.
4. This information was then used to compute the Willingness to Pay (WTP) estimates which
are the maximum amount an individual is willing to sacrifice for avoid the undesirable
potential side effects of the project. Generally the residential covered is categorized into
several different major areas namely; Kg. Berahi and its network of small villages, and
Taman Putra Perdana. Estimated household for Kampung Berahi or Balok area is 1,532
while Taman Putra Perdana consists of 825 household (Table 7.6.8).
5. From the contingent valuation method (CVM) survey, residents provide their estimated
WTP estimates, which enabled us to compute the average annual WTP values by location
of RM 20.79 per household for Kg. Berahi area and RM 3.67 for Taman Putra Perdana
These average WTP estimates were multiplied by the household population of each
location to obtain an annual total economic value loss of RM 21,799 from the potential
inconvenience to the local residents due to the project.

Chapter 7
ENVIRONMENTAL IMPACT ASSESSMENT FOR PROPOSED DEVELOPMENT OF KUANTAN MARITIME HUB AT MUKIM SUNGAI KARANG, KUANTAN, PAHANG DARUL MAKMUR
Chemsain Konsultant Sdn Bhd CK/EV703/7021/16 EIA
C7-171 Revision No.: 1
Revision Date: Nov 2017
Table 7.6.8: List of residential areas within 5 km from proposed Project site
Major Area Housing Area Estimated Household
Kg Berahi (Balok Area)
Seberang Balok 1,532
Taman Kasha Villa
Taman Aisha
Perkampungan Seberang Balok 1
Taman Cahaya
Kompleks Perumahan TLDM Seberang Balok
Taman Aisha
Taman Balok Fajar
Taman Balok Aman
Kampung Selamat
Taman Putra Perdana
Balok Perdana 825
Taman Balok Makmur
Baluk Baru
Baluk Pine
Total 2,357
Table 7.6.9: WTP Estimates to Avoid Undesirable Environmental Impact.
Settlements WTP (RM/year) House-holds Annual Economic Value1 (RM)
Kg Berahi (Balok Area) 20.79 1532 19,906.43
Taman Putra Perdana 3.67 825 1,892.34
Total 21,798.77 Notes: 1 It is anticipated that the inconvenience would occurred largely only during the construction stage and less during the dredging and reclamation works which would be done at sea. Further the inconvenience would occur only during the 15 working hours during the day and as such the inconvenience loss was proportioned by (15/24) hours.
7.6.4 Total Economic Loss
To obtain an aggregate of the economic value losses to be suffered by the various stakeholders, their
future losses would have to be accounted for. The loss for fishermen from fishing, visitors from
outdoor recreation, and the public from potential loss of mangroves would be recurring into the future,
hence these losses are accounted over the next 50 years, discounted and sum up.
While for local residents to be affected by safety and pollution from noise and air, these may occur
over the construction period of at least 8 years. Hence their losses are accounted over the next 8
years, discounted and sum up.
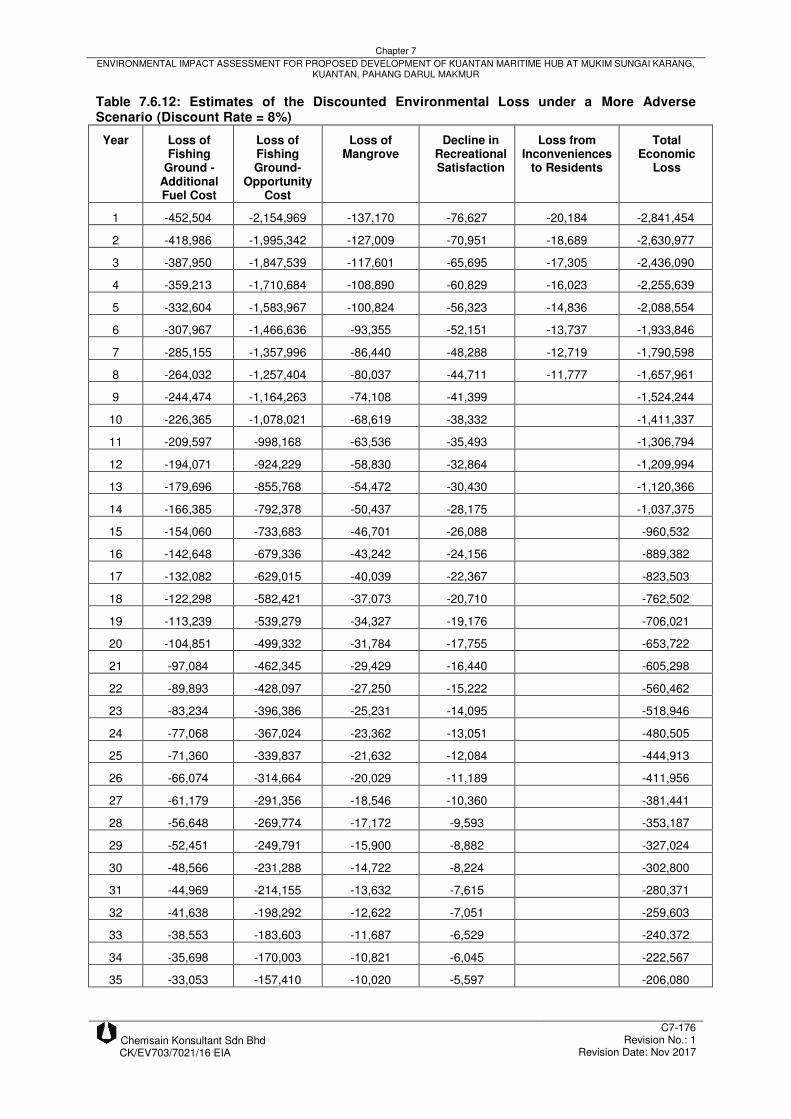
The discount rates used are 4%, 6% and 8% per annum. The discounted cash flows of losses of
incremental fuel cost and opportunity cost for additional working hour for the fishermen, potential

Chapter 7
ENVIRONMENTAL IMPACT ASSESSMENT FOR PROPOSED DEVELOPMENT OF KUANTAN MARITIME HUB AT MUKIM SUNGAI KARANG, KUANTAN, PAHANG DARUL MAKMUR
Chemsain Konsultant Sdn Bhd CK/EV703/7021/16 EIA
C7-172 Revision No.: 1
Revision Date: Nov 2017
mangrove loss, decline in satisfaction from recreational experience, losses from inconveniences to
local residents due to the Project over the next 50 years are provided in Tables 7.6.10 to 7.6.12 under
a more adverse scenario of mangrove degradation loss of 50%, additional fishing fuel cost of 50%
and additional travel time of 2 hours and Tables 7.6.13 to 7.6.15 under a more efficient controlled
scenario with mangrove degradation loss of only 5%, additional fishing fuel cost of 25% and additional
travel time of 1 hour only.
Table 7.6.10: Estimates of the Discounted Environmental Loss under a More Adverse Scenario (Discount Rate = 4%)
Year Loss of Fishing
Ground - Additional Fuel Cost
(50%)
Loss of Fishing Ground-
Opportunity Cost (2 hours)
Loss of Mangrove
(50%)
Decline in Recreational Satisfaction
Loss from Inconveniences
to Residents
Total Economic
Loss
1 -469,908 -2,237,853 -142,445 -79,574 -20,960 -2,950,740
2 -451,835 -2,151,781 -136,967 -76,513 -20,154 -2,837,250
3 -434,457 -2,069,021 -131,699 -73,570 -19,379 -2,728,126
4 -417,747 -1,989,443 -126,633 -70,741 -18,634 -2,623,198
5 -401,680 -1,912,926 -121,763 -68,020 -17,917 -2,522,306
6 -386,230 -1,839,352 -117,080 -65,404 -17,228 -2,425,294
7 -371,375 -1,768,607 -112,577 -62,888 -16,565 -2,332,012
8 -357,092 -1,700,584 -108,247 -60,470 -15,928 -2,242,321
9 -343,358 -1,635,177 -104,083 -58,144 -2,140,762
10 -330,151 -1,572,286 -100,080 -55,908 -2,058,425
11 -317,453 -1,511,813 -96,231 -53,757
-1,979,254
12 -305,244 -1,453,666 -92,530 -51,690
-1,903,130
13 -293,503 -1,397,756 -88,971 -49,702
-1,829,932
14 -282,215 -1,343,996 -85,549 -47,790
-1,759,550
15 -271,360 -1,292,304 -82,259 -45,952
-1,691,875
16 -260,923 -1,242,600 -79,095 -44,185
-1,626,803
17 -250,888 -1,194,808 -76,053 -42,485
-1,564,234
18 -241,238 -1,148,854 -73,128 -40,851
-1,504,071
19 -231,960 -1,104,667 -70,315 -39,280
-1,446,222
20 -223,038 -1,062,180 -67,611 -37,769
-1,390,598
21 -214,460 -1,021,327 -65,010 -36,316
-1,337,113
22 -206,212 -982,045 -62,510 -34,920
-1,285,687
23 -198,280 -944,274 -60,106 -33,577
-1,236,237
24 -190,654 -907,956 -57,794 -32,285
-1,188,689
25 -183,321 -873,034 -55,571 -31,043
-1,142,969
26 -176,271 -839,456 -53,434 -29,849
-1,099,010
27 -169,491 -807,169 -51,379 -28,701
-1,056,740
28 -162,972 -776,124 -49,402 -27,598
-1,016,096
29 -156,704 -746,273 -47,502 -26,536
-977,015

Chapter 7
ENVIRONMENTAL IMPACT ASSESSMENT FOR PROPOSED DEVELOPMENT OF KUANTAN MARITIME HUB AT MUKIM SUNGAI KARANG, KUANTAN, PAHANG DARUL MAKMUR
Chemsain Konsultant Sdn Bhd CK/EV703/7021/16 EIA
C7-173 Revision No.: 1
Revision Date: Nov 2017
Year Loss of Fishing
Ground - Additional Fuel Cost
(50%)
Loss of Fishing Ground-
Opportunity Cost (2 hours)
Loss of Mangrove
(50%)
Decline in Recreational Satisfaction
Loss from Inconveniences
to Residents
Total Economic
Loss
30 -150,677 -717,571 -45,675 -25,515
-939,438
31 -144,882 -689,972 -43,919 -24,534
-903,307
32 -139,309 -663,434 -42,229 -23,590
-868,562
33 -133,951 -637,918 -40,605 -22,683
-835,157
34 -128,799 -613,382 -39,043 -21,811
-803,035
35 -123,845 -589,791 -37,542 -20,972
-772,150
36 -119,082 -567,106 -36,098 -20,165
-742,451
37 -114,502 -545,295 -34,709 -19,390
-713,896
38 -110,098 -524,322 -33,375 -18,644
-686,439
39 -105,864 -504,156 -32,091 -17,927
-660,038
40 -101,792 -484,765 -30,857 -17,237
-634,651
41 -97,877 -466,120 -29,670 -16,574
-610,241
42 -94,112 -448,192 -28,529 -15,937
-586,770
43 -90,493 -430,954 -27,431 -15,324
-564,202
44 -87,012 -414,379 -26,376 -14,735
-542,502
45 -83,665 -398,441 -25,362 -14,168
-521,636
46 -80,448 -383,117 -24,386 -13,623
-501,574
47 -77,353 -368,382 -23,448 -13,099
-482,282
48 -74,378 -354,213 -22,547 -12,595
-463,733
49 -71,518 -340,589 -21,679 -12,111
-445,897
50 -68,767 -327,490 -20,846 -11,645
-428,748
Total -10,498,444 -49,996,921 -3,182,441 -1,777,797 -146,765 -65,602,368

Chapter 7
ENVIRONMENTAL IMPACT ASSESSMENT FOR PROPOSED DEVELOPMENT OF KUANTAN MARITIME HUB AT MUKIM SUNGAI KARANG, KUANTAN, PAHANG DARUL MAKMUR
Chemsain Konsultant Sdn Bhd CK/EV703/7021/16 EIA
C7-174 Revision No.: 1
Revision Date: Nov 2017
Table 7.6.11: Estimates of the Discounted Environmental Loss under a More Adverse Scenario (Discount Rate = 6%)
Year Loss of Fishing
Ground - Additional Fuel Cost
Loss of Fishing Ground-
Opportunity Cost
Loss of Mangrove
Decline in Recreational Satisfaction
Loss from Inconveniences
to Residents
Total Economic
Loss
1 -461,042 -2,195,629 -139,758 -78,072 -20,565 -2,895,066
2 -434,946 -2,071,348 -131,847 -73,653 -19,401 -2,731,195
3 -410,326 -1,954,102 -124,384 -69,484 -18,303 -2,576,599
4 -387,100 -1,843,492 -117,343 -65,551 -17,267 -2,430,753
5 -365,189 -1,739,144 -110,701 -61,841 -16,289 -2,293,164
6 -344,518 -1,640,702 -104,435 -58,340 -15,367 -2,163,362
7 -325,017 -1,547,832 -98,524 -55,038 -14,497 -2,040,908
8 -306,619 -1,460,219 -92,947 -51,923 -13,677 -1,925,385
9 -289,264 -1,377,565 -87,686 -48,984
-1,803,499
10 -272,890 -1,299,589 -82,722 -46,211
-1,701,412
11 -257,444 -1,226,028 -78,040 -43,595
-1,605,107
12 -242,871 -1,156,630 -73,623 -41,128
-1,514,252
13 -229,124 -1,091,160 -69,455 -38,800
-1,428,539
14 -216,155 -1,029,397 -65,524 -36,603
-1,347,679
15 -203,919 -971,129 -61,815 -34,532
-1,271,395
16 -192,377 -916,159 -58,316 -32,577
-1,199,429
17 -181,488 -864,301 -55,015 -30,733
-1,131,537
18 -171,215 -815,378 -51,901 -28,993
-1,067,487
19 -161,523 -769,225 -48,963 -27,352
-1,007,063
20 -152,380 -725,684 -46,192 -25,804
-950,060
21 -143,755 -684,608 -43,577 -24,343
-896,283
22 -135,618 -645,856 -41,110 -22,965
-845,549
23 -127,942 -609,298 -38,783 -21,666
-797,689
24 -120,700 -574,810 -36,588 -20,439
-752,537
25 -113,868 -542,273 -34,517 -19,282
-709,940
26 -107,422 -511,579 -32,563 -18,191
-669,755
27 -101,342 -482,621 -30,720 -17,161
-631,844
28 -95,605 -455,303 -28,981 -16,190
-596,079
29 -90,194 -429,531 -27,341 -15,273
-562,339
30 -85,088 -405,218 -25,793 -14,409
-530,508
31 -80,272 -382,281 -24,333 -13,593
-500,479
32 -75,728 -360,643 -22,956 -12,824
-472,151
33 -71,442 -340,229 -21,656 -12,098
-445,425
34 -67,398 -320,971 -20,431 -11,413
-420,213
35 -63,583 -302,803 -19,274 -10,767
-396,427

Chapter 7
ENVIRONMENTAL IMPACT ASSESSMENT FOR PROPOSED DEVELOPMENT OF KUANTAN MARITIME HUB AT MUKIM SUNGAI KARANG, KUANTAN, PAHANG DARUL MAKMUR
Chemsain Konsultant Sdn Bhd CK/EV703/7021/16 EIA
C7-175 Revision No.: 1
Revision Date: Nov 2017
Year Loss of Fishing
Ground - Additional Fuel Cost
Loss of Fishing Ground-
Opportunity Cost
Loss of Mangrove
Decline in Recreational Satisfaction
Loss from Inconveniences
to Residents
Total Economic
Loss
36 -59,984 -285,663 -18,183 -10,158
-373,988
37 -56,589 -269,493 -17,154 -9,583
-352,819
38 -53,386 -254,239 -16,183 -9,040
-332,848
39 -50,364 -239,848 -15,267 -8,529
-314,008
40 -47,513 -226,272 -14,403 -8,046
-296,234
41 -44,824 -213,464 -13,588 -7,590
-279,466
42 -42,286 -201,381 -12,818 -7,161
-263,646
43 -39,893 -189,982 -12,093 -6,755
-248,723
44 -37,635 -179,228 -11,408 -6,373
-234,644
45 -35,504 -169,083 -10,763 -6,012
-221,362
46 -33,495 -159,513 -10,153 -5,672
-208,833
47 -31,599 -150,484 -9,579 -5,351
-197,013
48 -29,810 -141,966 -9,036 -5,048
-185,860
49 -28,123 -133,930 -8,525 -4,762
-175,340
50 -26,531 -126,349 -8,042 -4,493
-165,415
Total -7,702,900 -36,683,632 -2,335,009 -1,304,401 -135,366 -48,161,308
Chapter 7
ENVIRONMENTAL IMPACT ASSESSMENT FOR PROPOSED DEVELOPMENT OF KUANTAN MARITIME HUB AT MUKIM SUNGAI KARANG, KUANTAN, PAHANG DARUL MAKMUR
Chemsain Konsultant Sdn Bhd CK/EV703/7021/16 EIA
C7-176 Revision No.: 1
Revision Date: Nov 2017
Table 7.6.12: Estimates of the Discounted Environmental Loss under a More Adverse Scenario (Discount Rate = 8%)
Year Loss of Fishing
Ground - Additional Fuel Cost
Loss of Fishing Ground-
Opportunity Cost
Loss of Mangrove
Decline in Recreational Satisfaction
Loss from Inconveniences
to Residents
Total Economic
Loss
1 -452,504 -2,154,969 -137,170 -76,627 -20,184 -2,841,454
2 -418,986 -1,995,342 -127,009 -70,951 -18,689 -2,630,977
3 -387,950 -1,847,539 -117,601 -65,695 -17,305 -2,436,090
4 -359,213 -1,710,684 -108,890 -60,829 -16,023 -2,255,639
5 -332,604 -1,583,967 -100,824 -56,323 -14,836 -2,088,554
6 -307,967 -1,466,636 -93,355 -52,151 -13,737 -1,933,846
7 -285,155 -1,357,996 -86,440 -48,288 -12,719 -1,790,598
8 -264,032 -1,257,404 -80,037 -44,711 -11,777 -1,657,961
9 -244,474 -1,164,263 -74,108 -41,399 -1,524,244
10 -226,365 -1,078,021 -68,619 -38,332 -1,411,337
11 -209,597 -998,168 -63,536 -35,493
-1,306,794
12 -194,071 -924,229 -58,830 -32,864
-1,209,994
13 -179,696 -855,768 -54,472 -30,430
-1,120,366
14 -166,385 -792,378 -50,437 -28,175
-1,037,375
15 -154,060 -733,683 -46,701 -26,088
-960,532
16 -142,648 -679,336 -43,242 -24,156
-889,382
17 -132,082 -629,015 -40,039 -22,367
-823,503
18 -122,298 -582,421 -37,073 -20,710
-762,502
19 -113,239 -539,279 -34,327 -19,176
-706,021
20 -104,851 -499,332 -31,784 -17,755
-653,722
21 -97,084 -462,345 -29,429 -16,440
-605,298
22 -89,893 -428,097 -27,250 -15,222
-560,462
23 -83,234 -396,386 -25,231 -14,095
-518,946
24 -77,068 -367,024 -23,362 -13,051
-480,505
25 -71,360 -339,837 -21,632 -12,084
-444,913
26 -66,074 -314,664 -20,029 -11,189
-411,956
27 -61,179 -291,356 -18,546 -10,360
-381,441
28 -56,648 -269,774 -17,172 -9,593
-353,187
29 -52,451 -249,791 -15,900 -8,882
-327,024
30 -48,566 -231,288 -14,722 -8,224
-302,800
31 -44,969 -214,155 -13,632 -7,615
-280,371
32 -41,638 -198,292 -12,622 -7,051
-259,603
33 -38,553 -183,603 -11,687 -6,529
-240,372
34 -35,698 -170,003 -10,821 -6,045
-222,567
35 -33,053 -157,410 -10,020 -5,597
-206,080

Chapter 7
ENVIRONMENTAL IMPACT ASSESSMENT FOR PROPOSED DEVELOPMENT OF KUANTAN MARITIME HUB AT MUKIM SUNGAI KARANG, KUANTAN, PAHANG DARUL MAKMUR
Chemsain Konsultant Sdn Bhd CK/EV703/7021/16 EIA
C7-177 Revision No.: 1
Revision Date: Nov 2017
Year Loss of Fishing
Ground - Additional Fuel Cost
Loss of Fishing Ground-
Opportunity Cost
Loss of Mangrove
Decline in Recreational Satisfaction
Loss from Inconveniences
to Residents
Total Economic
Loss
36 -30,605 -145,750 -9,277 -5,183
-190,815
37 -28,338 -134,954 -8,590 -4,799
-176,681
38 -26,239 -124,957 -7,954 -4,443
-163,593
39 -24,295 -115,701 -7,365 -4,114
-151,475
40 -22,496 -107,131 -6,819 -3,809
-140,255
41 -20,829 -99,195 -6,314 -3,527
-129,865
42 -19,286 -91,847 -5,846 -3,266
-120,245
43 -17,858 -85,044 -5,413 -3,024
-111,339
44 -16,535 -78,744 -5,012 -2,800
-103,091
45 -15,310 -72,911 -4,641 -2,593
-95,455
46 -14,176 -67,511 -4,297 -2,401
-88,385
47 -13,126 -62,510 -3,979 -2,223
-81,838
48 -12,154 -57,879 -3,684 -2,058
-75,775
49 -11,253 -53,592 -3,411 -1,906
-70,162
50 -10,420 -49,622 -3,159 -1,764
-64,965
Total -5,978,565 -28,471,803 -1,812,310 -1,012,407 -125,270 -37,400,355

Chapter 7
ENVIRONMENTAL IMPACT ASSESSMENT FOR PROPOSED DEVELOPMENT OF KUANTAN MARITIME HUB AT MUKIM SUNGAI KARANG, KUANTAN, PAHANG DARUL MAKMUR
Chemsain Konsultant Sdn Bhd CK/EV703/7021/16 EIA
C7-178 Revision No.: 1
Revision Date: Nov 2017
Table 7.6.13: Estimates of the Discounted Environmental Loss under a More Controlled Scenario (Discount Rate = 4%)
Year Loss of Fishing
Ground - Additional Fuel Cost
Loss of Fishing Ground-
Opportunity Cost
Loss of Mangrove
Decline in Recreational Satisfaction
Loss from Inconveniences
to Residents
Total Economic
Loss
1 -234,954 -1,118,926 -14,245 -79,574 -20,960 -1,468,659
2 -225,918 -1,075,891 -13,697 -76,513 -20,154 -1,412,173
3 -217,228 -1,034,510 -13,170 -73,570 -19,379 -1,357,857
4 -208,873 -994,721 -12,663 -70,741 -18,634 -1,305,632
5 -200,840 -956,463 -12,176 -68,020 -17,917 -1,255,416
6 -193,115 -919,676 -11,708 -65,404 -17,228 -1,207,131
7 -185,688 -884,304 -11,258 -62,888 -16,565 -1,160,703
8 -178,546 -850,292 -10,825 -60,470 -15,928 -1,116,061
9 -171,679 -817,589 -10,408 -58,144 -1,057,820
10 -165,076 -786,143 -10,008 -55,908 -1,017,135
11 -158,727 -755,907 -9,623 -53,757
-978,014
12 -152,622 -726,833 -9,253 -51,690
-940,398
13 -146,752 -698,878 -8,897 -49,702
-904,229
14 -141,107 -671,998 -8,555 -47,790
-869,450
15 -135,680 -646,152 -8,226 -45,952
-836,010
16 -130,462 -621,300 -7,909 -44,185
-803,856
17 -125,444 -597,404 -7,605 -42,485
-772,938
18 -120,619 -574,427 -7,313 -40,851
-743,210
19 -115,980 -552,334 -7,032 -39,280
-714,626
20 -111,519 -531,090 -6,761 -37,769
-687,139
21 -107,230 -510,663 -6,501 -36,316
-660,710
22 -103,106 -491,022 -6,251 -34,920
-635,299
23 -99,140 -472,137 -6,011 -33,577
-610,865
24 -95,327 -453,978 -5,779 -32,285
-587,369
25 -91,661 -436,517 -5,557 -31,043
-564,778
26 -88,135 -419,728 -5,343 -29,849
-543,055
27 -84,745 -403,585 -5,138 -28,701
-522,169
28 -81,486 -388,062 -4,940 -27,598
-502,086
29 -78,352 -373,137 -4,750 -26,536
-482,775
30 -75,338 -358,785 -4,568 -25,515
-464,206
31 -72,441 -344,986 -4,392 -24,534
-446,353
32 -69,655 -331,717 -4,223 -23,590
-429,185
33 -66,976 -318,959 -4,061 -22,683
-412,679
34 -64,400 -306,691 -3,904 -21,811
-396,806
35 -61,923 -294,895 -3,754 -20,972
-381,544

Chapter 7
ENVIRONMENTAL IMPACT ASSESSMENT FOR PROPOSED DEVELOPMENT OF KUANTAN MARITIME HUB AT MUKIM SUNGAI KARANG, KUANTAN, PAHANG DARUL MAKMUR
Chemsain Konsultant Sdn Bhd CK/EV703/7021/16 EIA
C7-179 Revision No.: 1
Revision Date: Nov 2017
Year Loss of Fishing
Ground - Additional Fuel Cost
Loss of Fishing Ground-
Opportunity Cost
Loss of Mangrove
Decline in Recreational Satisfaction
Loss from Inconveniences
to Residents
Total Economic
Loss
36 -59,541 -283,553 -3,610 -20,165
-366,869
37 -57,251 -272,647 -3,471 -19,390
-352,759
38 -55,049 -262,161 -3,337 -18,644
-339,191
39 -52,932 -252,078 -3,209 -17,927
-326,146
40 -50,896 -242,383 -3,086 -17,237
-313,602
41 -48,938 -233,060 -2,967 -16,574
-301,539
42 -47,056 -224,096 -2,853 -15,937
-289,942
43 -45,246 -215,477 -2,743 -15,324
-278,790
44 -43,506 -207,190 -2,638 -14,735
-268,069
45 -41,833 -199,221 -2,536 -14,168
-257,758
46 -40,224 -191,558 -2,439 -13,623
-247,844
47 -38,677 -184,191 -2,345 -13,099
-238,312
48 -37,189 -177,107 -2,255 -12,595
-229,146
49 -35,759 -170,295 -2,168 -12,111
-220,333
50 -34,383 -163,745 -2,085 -11,645
-211,858
Total -5,249,224 -24,998,462 -318,246 -1,777,797 -146,765 -32,490,494

Chapter 7
ENVIRONMENTAL IMPACT ASSESSMENT FOR PROPOSED DEVELOPMENT OF KUANTAN MARITIME HUB AT MUKIM SUNGAI KARANG, KUANTAN, PAHANG DARUL MAKMUR
Chemsain Konsultant Sdn Bhd CK/EV703/7021/16 EIA
C7-180 Revision No.: 1
Revision Date: Nov 2017
Table 7.6.14: Estimates of the Discounted Environmental Loss under a More Controlled Scenario (Discount Rate = 6%)
Year Loss of Fishing
Ground - Additional Fuel Cost
Loss of Fishing Ground-
Opportunity Cost
Loss of Mangrove
Decline in Recreational Satisfaction
Loss from Inconveniences
to Residents
Total Economic
Loss
1 -230,521 -1,097,815 -13,976 -78,072 -20,565 -1,440,949
2 -217,473 -1,035,674 -13,185 -73,653 -19,401 -1,359,386
3 -205,163 -977,051 -12,438 -69,484 -18,303 -1,282,439
4 -193,550 -921,746 -11,734 -65,551 -17,267 -1,209,848
5 -182,594 -869,572 -11,070 -61,841 -16,289 -1,141,366
6 -172,259 -820,351 -10,444 -58,340 -15,367 -1,076,761
7 -162,508 -773,916 -9,852 -55,038 -14,497 -1,015,811
8 -153,310 -730,109 -9,295 -51,923 -13,677 -958,314
9 -144,632 -688,782 -8,769 -48,984 -891,167
10 -136,445 -649,795 -8,272 -46,211 -840,723
11 -128,722 -613,014 -7,804 -43,595
-793,135
12 -121,436 -578,315 -7,362 -41,128
-748,241
13 -114,562 -545,580 -6,946 -38,800
-705,888
14 -108,077 -514,698 -6,552 -36,603
-665,930
15 -101,960 -485,564 -6,181 -34,532
-628,237
16 -96,188 -458,080 -5,832 -32,577
-592,677
17 -90,744 -432,151 -5,502 -30,733
-559,130
18 -85,607 -407,689 -5,190 -28,993
-527,479
19 -80,762 -384,612 -4,896 -27,352
-497,622
20 -76,190 -362,842 -4,619 -25,804
-469,455
21 -71,878 -342,304 -4,358 -24,343
-442,883
22 -67,809 -322,928 -4,111 -22,965
-417,813
23 -63,971 -304,649 -3,878 -21,666
-394,164
24 -60,350 -287,405 -3,659 -20,439
-371,853
25 -56,934 -271,137 -3,452 -19,282
-350,805
26 -53,711 -255,789 -3,256 -18,191
-330,947
27 -50,671 -241,311 -3,072 -17,161
-312,215
28 -47,803 -227,652 -2,898 -16,190
-294,543
29 -45,097 -214,766 -2,734 -15,273
-277,870
30 -42,544 -202,609 -2,579 -14,409
-262,141
31 -40,136 -191,141 -2,433 -13,593
-247,303
32 -37,864 -180,321 -2,296 -12,824
-233,305
33 -35,721 -170,114 -2,166 -12,098
-220,099
34 -33,699 -160,485 -2,043 -11,413
-207,640
35 -31,792 -151,401 -1,927 -10,767
-195,887

Chapter 7
ENVIRONMENTAL IMPACT ASSESSMENT FOR PROPOSED DEVELOPMENT OF KUANTAN MARITIME HUB AT MUKIM SUNGAI KARANG, KUANTAN, PAHANG DARUL MAKMUR
Chemsain Konsultant Sdn Bhd CK/EV703/7021/16 EIA
C7-181 Revision No.: 1
Revision Date: Nov 2017
Year Loss of Fishing
Ground - Additional Fuel Cost
Loss of Fishing Ground-
Opportunity Cost
Loss of Mangrove
Decline in Recreational Satisfaction
Loss from Inconveniences
to Residents
Total Economic
Loss
36 -29,992 -142,831 -1,818 -10,158
-184,799
37 -28,294 -134,747 -1,715 -9,583
-174,339
38 -26,693 -127,119 -1,618 -9,040
-164,470
39 -25,182 -119,924 -1,527 -8,529
-155,162
40 -23,756 -113,136 -1,440 -8,046
-146,378
41 -22,412 -106,732 -1,359 -7,590
-138,093
42 -21,143 -100,690 -1,282 -7,161
-130,276
43 -19,946 -94,991 -1,209 -6,755
-122,901
44 -18,817 -89,614 -1,141 -6,373
-115,945
45 -17,752 -84,542 -1,076 -6,012
-109,382
46 -16,747 -79,756 -1,015 -5,672
-103,190
47 -15,799 -75,242 -958 -5,351
-97,350
48 -14,905 -70,983 -904 -5,048
-91,840
49 -14,061 -66,965 -852 -4,762
-86,640
50 -13,265 -63,174 -804 -4,493
-81,736
Total -3,851,447 -18,341,814 -233,499 -1,304,401 -135,366 -23,866,527

Chapter 7
ENVIRONMENTAL IMPACT ASSESSMENT FOR PROPOSED DEVELOPMENT OF KUANTAN MARITIME HUB AT MUKIM SUNGAI KARANG, KUANTAN, PAHANG DARUL MAKMUR
Chemsain Konsultant Sdn Bhd CK/EV703/7021/16 EIA
C7-182 Revision No.: 1
Revision Date: Nov 2017
Table 7.6.15: Estimates of the Discounted Environmental Loss under a More Controlled Scenario (Discount Rate = 8%)
Year Loss of Fishing
Ground - Additional Fuel Cost
Loss of Fishing Ground-
Opportunity Cost
Loss of Mangrove
Decline in Recreational Satisfaction
Loss from Inconveniences
to Residents
Total Economic
Loss
1 -226,252 -1,077,485 -13,717 -76,627 -20,184 -1,414,265
2 -209,493 -997,671 -12,701 -70,951 -18,689 -1,309,505
3 -193,975 -923,769 -11,760 -65,695 -17,305 -1,212,504
4 -179,606 -855,342 -10,889 -60,829 -16,023 -1,122,689
5 -166,302 -791,983 -10,082 -56,323 -14,836 -1,039,526
6 -153,983 -733,318 -9,336 -52,151 -13,737 -962,525
7 -142,577 -678,998 -8,644 -48,288 -12,719 -891,226
8 -132,016 -628,702 -8,004 -44,711 -11,777 -825,210
9 -122,237 -582,131 -7,411 -41,399 -753,178
10 -113,182 -539,011 -6,862 -38,332 -697,387
11 -104,799 -499,084 -6,354 -35,493
-645,730
12 -97,036 -462,115 -5,883 -32,864
-597,898
13 -89,848 -427,884 -5,447 -30,430
-553,609
14 -83,192 -396,189 -5,044 -28,175
-512,600
15 -77,030 -366,842 -4,670 -26,088
-474,630
16 -71,324 -339,668 -4,324 -24,156
-439,472
17 -66,041 -314,507 -4,004 -22,367
-406,919
18 -61,149 -291,211 -3,707 -20,710
-376,777
19 -56,619 -269,639 -3,433 -19,176
-348,867
20 -52,425 -249,666 -3,178 -17,755
-323,024
21 -48,542 -231,172 -2,943 -16,440
-299,097
22 -44,946 -214,049 -2,725 -15,222
-276,942
23 -41,617 -198,193 -2,523 -14,095
-256,428
24 -38,534 -183,512 -2,336 -13,051
-237,433
25 -35,680 -169,919 -2,163 -12,084
-219,846
26 -33,037 -157,332 -2,003 -11,189
-203,561
27 -30,590 -145,678 -1,855 -10,360
-188,483
28 -28,324 -134,887 -1,717 -9,593
-174,521
29 -26,226 -124,895 -1,590 -8,882
-161,593
30 -24,283 -115,644 -1,472 -8,224
-149,623
31 -22,484 -107,078 -1,363 -7,615
-138,540
32 -20,819 -99,146 -1,262 -7,051
-128,278
33 -19,277 -91,802 -1,169 -6,529
-118,777
34 -17,849 -85,002 -1,082 -6,045
-109,978
35 -16,527 -78,705 -1,002 -5,597
-101,831

Chapter 7
ENVIRONMENTAL IMPACT ASSESSMENT FOR PROPOSED DEVELOPMENT OF KUANTAN MARITIME HUB AT MUKIM SUNGAI KARANG, KUANTAN, PAHANG DARUL MAKMUR
Chemsain Konsultant Sdn Bhd CK/EV703/7021/16 EIA
C7-183 Revision No.: 1
Revision Date: Nov 2017
Year Loss of Fishing
Ground - Additional Fuel Cost
Loss of Fishing Ground-
Opportunity Cost
Loss of Mangrove
Decline in Recreational Satisfaction
Loss from Inconveniences
to Residents
Total Economic
Loss
36 -15,302 -72,875 -928 -5,183
-94,288
37 -14,169 -67,477 -859 -4,799
-87,304
38 -13,119 -62,479 -795 -4,443
-80,836
39 -12,148 -57,851 -736 -4,114
-74,849
40 -11,248 -53,565 -682 -3,809
-69,304
41 -10,415 -49,598 -631 -3,527
-64,171
42 -9,643 -45,924 -585 -3,266
-59,418
43 -8,929 -42,522 -541 -3,024
-55,016
44 -8,267 -39,372 -501 -2,800
-50,940
45 -7,655 -36,456 -464 -2,593
-47,168
46 -7,088 -33,755 -430 -2,401
-43,674
47 -6,563 -31,255 -398 -2,223
-40,439
48 -6,077 -28,940 -368 -2,058
-37,443
49 -5,627 -26,796 -341 -1,906
-34,670
50 -5,210 -24,811 -316 -1,764
-32,101
Total -2,989,281 -14,235,905 -181,230 -1,012,407 -125,270 -18,544,093
7.6.5 Aggregate NPV Environmental Loss
The aggregated net present values of the incremental fishing travel costs and opportunity cost of
extra working hour, losses from mangrove degradation, decline in recreational satisfaction and loss
from inconveniences to local residents as a result of the proposed Project, under the selected
discount rates over a duration of 50 years are summarised in Table 7.6.16 for a more adverse
scenario and in Table 7.6.17 for a more controlled scenario. It was also observed that at lower
discount rates, the aggregated NPV rises.

Chapter 7
ENVIRONMENTAL IMPACT ASSESSMENT FOR PROPOSED DEVELOPMENT OF KUANTAN MARITIME HUB AT MUKIM SUNGAI KARANG, KUANTAN, PAHANG DARUL MAKMUR
Chemsain Konsultant Sdn Bhd CK/EV703/7021/16 EIA
C7-184 Revision No.: 1
Revision Date: Nov 2017
Table 7.6.16: Aggregated Value of the Discounted Environmental Loss Under a More Adverse Scenario with 3 Discount Rates Over 50 Year Duration
NPV Loss Loss of Fishing
Ground - Additional Fuel Cost
(RM)1
Loss of Fishing Ground-
Opportunity Cost (RM)
2
Loss of Mangrove
(RM) 3
Decline in Recreational Satisfaction
(RM)
Loss from Inconvenience
to Residents(RM)
Total Economic Loss (RM)
NPV loss at 4% discount rates
-10,498,444 -49,996,921 -3,182,441 -1,777,797 -146,765 -65,602,368
NPV loss at 6% discount rates
-7,702,900 -36,683,632 -2,335,009 -1,304,401 -135,366 -48,161,308
NPV loss at 8% discount rates
-5,978,565 -28,471,803 -1,812,310 -1,012,407 -125,270 -37,400,355
Note: 1 The increment in fuel per trip needed was 50% ‘With the Project’
2 The additional travel time per trip is 2 hours ‘With the Project’
3 Under status quo the mangrove degradation loss is reduced to 50% ‘with the Project’.
Table 7.6.17: Aggregated Value of the Discounted Environmental Loss Under a More Controlled Management with 3 Discount Rates Over a 50 Year Duration
NPV Loss Loss of Fishing
Ground - Additional Fuel Cost
(RM) 1
Loss of Fishing Ground-
Opportunity Cost (RM)
2
Loss of Mangrove
(RM) 3
Decline in Recreational Satisfaction
(RM)
Loss from Inconvenience
to Residents(RM)
Total Economic Loss (RM)
NPV loss at 4% discount rates
-5,249,224 -24,998,462 -318,246 -1,777,797 -146,765 -32,490,494
NPV loss at 6% discount rates
-3,851,447 -18,341,814 -233,499 -1,304,401 -135,366 -23,866,527
NPV loss at 8% discount rates
-2,989,281 -14,235,905 -181,230 -1,012,407 -125,270 -18,544,093
Note: 1 The increment in fuel per trip needed was 25% ‘With the Project’
2 The additional travel time per trip is 1 hour ‘With the Project’
3 Under control management the mangrove degradation loss is reduced to 5% ‘With the Project’.

Chapter 7
ENVIRONMENTAL IMPACT ASSESSMENT FOR PROPOSED DEVELOPMENT OF KUANTAN MARITIME HUB AT MUKIM SUNGAI KARANG, KUANTAN, PAHANG DARUL MAKMUR
Chemsain Konsultant Sdn Bhd CK/EV703/7021/16 EIA
C7-185 Revision No.: 1
Revision Date: Nov 2017
Conclusion
Under a more adverse scenario presented above, the total present value of the stream of annual loss
are RM 65.6 million, RM 48.2 million and RM 37.4 million with discount rates of 4%, 6% and 8%
respectively. Whereas under a more controlled scenario which is deemed as the more realistic
scenario, the total present value of the stream of annual loss are RM 32.5 million, RM 23.9 million and
RM 18.5 million with the discount rate of 4%, 6% and 8% respectively.
With the development of the proposed Project, professional and skilled jobs will be created to fulfil the
workforce requirement of the components of the Project, namely the shipyard and fabrication yard.
The Project Proponent will provide required trainings to ensure adequate supply of workforce in a
timely manner. The proposed KMH is also expected to benefit the general economy of the area as the
Project encourages the inflow of investors, potential technology transfer and reduce currency outflow.
Other spinoff economy activities will further benefit the locals indirectly such as the creation of other
business opportunities such as food supply services and restaurants, supporting services (including
logistics handling) and supplies. Overall, the proposed KMH will contribute to the East Coast
Economic Region (ECER) and nation’s vision as described in the statement of needs as well as
balancing the socio-economic between the East Coast and West Coast of Peninsular Malaysia.
Yet to the local residents and fishermen, there would be specific welfare losses at the local
community levels. The extent of the NPV losses reflects these losses to the local Malaysian society.
These economic value losses could be used as a yardstick to encourage Corporate Social
Responsibility (CSR) programmes that the Project Proponent could undertake to compensate for the
local losses. Among the relevant programmes are:
Investment on additional artificial reefs (tukun) to create new fishing grounds at suitable
locations. Close collaborations with the local fishermen association and Fishery Department
are recommended for such investment.
Entrepreneurial skill development programme to include interested local fishermen. This will
enhance local fishermen capability with alternative livelihood skills.
Participation in local mangrove rehabilitation programme namely along Sg. Balok or Sg.
Kuantan.
Promotion on road and marine safety programmes.