Psychological Impacts of COVID-19 in Dental Patients are ...
Upload
khangminh22Category
view
0download
0
Analysis of the Social and Economic Impacts of COVID-19 on Households and Strategic Policy Recommendations for Indonesia 1
Supported by
INDONESIA
©U
NIC
EF/U
NI3
8919
8/W
iland
er
Analysis of the Social and Economic Impacts of COVID-19 on Households and Strategic Policy Recommendations for Indonesia

2 Analysis of the Social and Economic Impacts of COVID-19 on Households and Strategic Policy Recommendations for Indonesia
© United Nations Children’s Fund (UNICEF)May 2021
The report can be cited as:
UNICEF, UNDP, Prospera, and SMERU (2021). Analysis of the Social and Economic Impacts of COVID-19 on Households and Strategic Policy Recommendations for Indonesia, Jakarta.

Analysis of the Social and Economic Impacts of COVID-19 on Households and Strategic Policy Recommendations for Indonesia 3
Foreword
In Indonesia, 2019 was a landmark year: the poverty rate dropped to just under 10 per cent and Indonesia transitioned into the high human development index category. The country reached positive milestones for almost 20 years. Unfortunately, 2020 also stands as a landmark year – as the COVID-19 pandemic severely impacted the lives of many Indonesians, in particular, vulnerable communities. As Indonesia, and its neighbouring countries, begin their vaccination campaigns, the real impact of the COVID-19 pandemic on families and children’s lives is still emerging.
In Indonesia, data from SUSENAS in March 2019, showed 25 million people were living under the poverty line (9.4 per cent of the population). A further 55 million people (or 20.6 per cent of the population) live slightly above the poverty line, which indicates that they are vulnerable to becoming poor. Thus, it is possible that now, due to the pandemic, up to 30 per cent of the country’s population are living in poverty. With an increased number of people living under the poverty line, there is a strong need to accelerate studies & lessons learnt on the socio-economic impacts of COVID-19 on vulnerable groups and children so that multi-sectoral policies and programmes may be developed to counter these effects.
In an effort to understand the social and economic impacts of COVID-19 on women, families with children, vulnerable groups, and people with disabilities, the largest household survey recorded in Indonesia was launched between October and December 2020. Through qualitative interviews, over 12,000 families — across 34 provinces and 247 districts — were surveyed. The results revealed information about the impact of COVID-19 on employment, micro-businesses, food security, access to health, educational services and access to social protection programmes. On a deeper level, it provided insight into the impact of the pandemic on children’s development and wellbeing.
The study highlights the impact of the pandemic on multidimensional child poverty in Indonesia. 3 out of 4 households reported a reduction in income since January 2020. A significant percentage — 75.3 per cent— were households with children in urban areas. Nearly a third of respondents noted concern about feeding their families, while 12.6 per cent of households with children reported experiencing food insecurity.
In addition, 13 per cent of households with children under the age of 5 were unable to get access to standard vaccines. 36.7 per cent of households with children with disabilities were unable to access health care services, including therapy. The risk of lost learning is high and can have long term impacts on children’s growth, development and advancement. Child poverty, which currently stands at 2.1 million, may increase if emergency support measures are not provided in 2021 and beyond.
While 85 per cent of the families surveyed reported receiving some form of government assistance, one in three of the poorest households, who are at the bottom 40 per cent of incomes, did not receive cash assistance of any sort.
During this Decade of Action, a more focused approach is needed to ensure that the poor and new poor are cushioned from the impacts of the global pandemic - whilst the momentum for achieving the SDG Agenda is maintained. The results of this survey provide an opportunity for decision makers to develop tailored and targeted programmes to ensure that no one is left behind.
This study would not have been possible without the support of key development partners working in close coordination with the Government of Indonesia. The United Nations Children’s Fund and The United Nations Development Programme sincerely thank and appreciate the Governments of Australia and Japan, and the Multi-partner Partner Trust Fund (MPTF) for their financial support for this survey.

4 Analysis of the Social and Economic Impacts of COVID-19 on Households and Strategic Policy Recommendations for Indonesia
Acknowledgements
This report is a product of cooperation between UNICEF, UNDP, Australia Indonesia Partnership for Economic Development (or Prospera) and The SMERU Research Institute. Prospera coordinated the overall writing of this report with inputs from UNICEF, UNDP and The SMERU Research Institute. The broader study and analyses on which this report is based on, are the product of hard work of many contributors in each agency including agencies under the Government of Indonesia.
UNICEF is lead by Ratnawati Muyanto (Social Protection Specialist) with support from Bheta Arsyad (Social Policy Specialist), Suci Wulandari (Data Centre Specialist), Anna-Lisa Robertson (Communication and Community Engagement Officer), Mutia Zakia Salma (Knowledge Management Support Officer), Rachma Indah Nurbani (National Consultant) and all specialists from Nutrition, Health, Child Protection, Education and the Business Engagement Section.
UNDP is lead by Rima Prama Artha (Country Economist) with support from Usha Adelina Riyanto (Economist), Rachmat Reksa Samudra (Economist) and Ranjit Jose (UNDP Communications Advocacy Specialist).
Prospera is lead by Bimbika Sijapati Basnett (Senior Advisor, Gender and Social Inclusion) and Kartika Sari Juniwaty (Development Economist, Gender and Social Inclusion) with support from Nicholas George Owen (Economic Communications Adviser), Monica Dwiyanti (Project Officer, Gender and Social inclusion), Melissa Nicole Wells (Deputy Director – Partnerships, Policy and Performance) and Della Y. A. Temenggung (Deputy Director – Advisory and Policy).
The SMERU Research Institute is lead by Asep Suharyadi (Senior Research Fellow) and Michelle Andrina (Researcher), supported by Fauzan Kemal Musthofa (Junior Researcher), Sylvia Andriyani Kusumandari (Junior Researcher), Rizki Fillaili (Research Associate), Ridho Al Izzati (Researcher), Jimmy Daniel Berlianto Oley (Junior Researcher), and Aqilah Farhani (Intern).
The government counterparts have provided oversight and direction to the data collection, analyses and report writing process. The National Statistics Office is lead by Suhariyanto, supported by Margo Yuwono, Ateng Hartono, Gantjang Amannullah, Sarpono, Ahmad Avenzora, Amiek Chamami, Nur Sahrizal, Yuni Susianto, Agus Marzuki, and Adhi Kurniawan; The Ministry of Finance is lead by Febrio Nathan Kacaribu and Titik Anas with support of Hidayat Amir, Ali Moechtar, and Irma Marlina; and the Ministry of National Development Planning is lead by Bapak Maliki and Fisca Aulia. Great appreciation is extended to the Government of Indonesia and in particular the Ministry of Finance, for its continued and extraordinary support and partnership during this year-long process.
We would like to acknowledge the contribution of the Development Technology Strategy (DTS) lead by Ainul Huda for coordinating the collection of the survey data, and their team of enumerators who have made this work possible.
The development of this report and the data collection are financially supported by the Government of Australia, the Government of Japan and the COVID-19 Multi Partner Trust Fund. The support of our donors makes this production possible and we are incredibly grateful for their continued belief and cooperation.
Last but not the least, this report is dedicated to the 12,000+ women and men across 34 provinces in Indonesia who participated in the survey. We hope that we have adequately represented their voices, and that survey results and policy messages highlighted in this report will be leveraged to support Indonesia to emerge stronger out of this unprecedented health and economic crisis.
The findings, interpretations, and conclusions expressed in this report are of the team members involved in the production of this report. They do not necessarily reflect the views of the United Nations, the Australian Government, the Government of Indonesia.

Analysis of the Social and Economic Impacts of COVID-19 on Households and Strategic Policy Recommendations for Indonesia 5
Executive Summary
The arrival of COVID-19 has created unprecedented challenges for the world. In Indonesia, the coronavirus has infected more than a million people since the first confirmed cases in March 2020 and tens of thousands have died. Coronavirus curbs on the economy and society continue to have a shocking impact on human development. After years of progress, poverty is rising again. One in ten people in Indonesia today are living below the national poverty line. Child poverty may increase significantly. The social impact would have been far worse had it not been for government assistance.
In response to the crisis, the government of Indonesia has introduced a massive fiscal stimulus package through the National Economic Recovery (PEN) program. Indonesia ranks among the top five countries in the Asia Pacific region in terms of the total amount devoted to combatting COVID-19 (ADB, 2021). In 2020 the government allocated IDR 695.2 trillion (approximately US$ 49 billion) to the program. With the crisis still unfolding, the government announced a budget of IDR 699.43 trillion (approximately US$ 49.3 billion) in February 2021 for the continuation of the PEN program this year (Kemenkeu, 2021).
Indonesia has continued to invest in strengthening its social protection programs to respond to the crisis. These have been expanded to protect today’s poor
against major shocks as well as a growing number of low- and middle-income earners who have become vulnerable and are at risk of becoming tomorrow’s poor. Small businesses, too, are receiving assistance as they continue to contend with a contracting economy and public health restrictions.
To assess the impact of COVID-19 on Indonesia’s households and to inform government policies, UNICEF, UNDP, Prospera, the SMERU Research Institute and the National Statistics Office (BPS) collaborated on a ground-breaking survey in October-November 2020.
The survey included 12,216 nationally representative households across all 34 provinces. It was the largest survey of the impact of COVID-19 so far and focused on children and vulnerable groups. It was based on face-to-face interviews with households interviewed by National Statistics Office as part of its National Socio-Economic Survey 2019 (SUSENAS). The survey and analyses were undertaken in close collaboration with the Indonesian government.
The impact of COVID-19 will continue throughout 2021 and beyond. However, the pace of support must continue to boost child and family wellbeing. Indonesia’s development partners stand ready to assist in this endeavour.

6 Analysis of the Social and Economic Impacts of COVID-19 on Households and Strategic Policy Recommendations for Indonesia
Key finding 1: The impact of COVID-19 on household finances has been severe
Almost three-quarters of households (74.3%)
interviewed in October-November 2020 said they were
earning less than they were in January 2020.
The proportion of households with lower income was
slightly higher among those with children (75.3%)
and among those living in urban areas (78.3%). Urban
households also experienced a larger reduction in
income than rural ones.
Households across all income groups—from the
poorest to the richest—reported similar percentage-
terms falls in income. Many households that were
previously economically secure in the middle of the
income distribution have either become poor or are at
risk of becoming poor.
For many households, a loss of earnings was not
the only challenge: almost a quarter of respondents
(24.4%) said their expenses had risen, too. Increased
costs for groceries and other essentials were the main
contributor to this rise in expenses.
A significantly higher proportion of households with
children (65%) are spending more on internet or mobile
telephone charges than those without children (28.9%).
Only a small proportion (14%) of primary income
earners changed job as a result of COVID-19. However,
almost half (47.3%) of those who did change job moved
from work as salaried employees in the formal sector
into less secure work in the informal sector.
Half of all households (51.5%) have no savings upon
which to fall back. More than one-quarter (27.3%) were
pawning possessions to survive. A quarter (25.3%)
were borrowing money informally from family or
friends.
For many households, small businesses are an
important source of income. One-third of respondents
had at least one household member who was running
a business, and almost all of these businesses (87.5%)
had been affected by the pandemic. Fewer customers,
lower revenues and higher costs were the main
concerns.
Key finding 2: Social assistance is reaching most but not all people in need
Most households (85.3%) received at least one form
of social assistance, be it a cash transfer or some sort
of “in kind” assistance. Half of all households (50.8%)
received a cash transfer.
The poorest households received the most assistance.
Among those in the bottom 40% of the expenditure
(income) distribution, more than 90% received at least
one form of assistance and more than 60% received
cash. Most households that were economically secure
before the pandemic but experienced a significant
©N
ICEF
/UN
0200
189/
van
Oor
souw

Analysis of the Social and Economic Impacts of COVID-19 on Households and Strategic Policy Recommendations for Indonesia 7
School closures, social isolation combined with
economic uncertainties are also exposing children to
other risks. This survey found that 45% of households
reported behavioural challenges among their children.
Among them, 20.5% said children are finding it harder
to concentrate; 12.9% are becoming angrier; and 6.5%
are finding it difficult to sleep.
Key finding 4: Gender inequalities widen as women take on additional caring responsibilities
Mothers were three times more likely to care for
children than fathers: 71.5% of households said the
mother was taking the lead in supporting children
with home schooling compared with only 22% of
households who said it was the father.
Half of these women were also engaged in paid
work to support their families. They were struggling
to find a balance between work and the additional
responsibilities posed by school closures.
Key finding 5: Food insecurity among vulnerable groups is an emerging concern
Almost one-third (30%) of respondents were worried
they could not feed their families. The proportion of
households facing moderate or severe food insecurity
rose to 11.7% in 2020. Income reduction and
disruptions to food delivery systems were the main
factors contributing to food insecurity.
Households who have a person with a disability
experienced more income and job loss. One in 10
households with a person with a mild disability lost
their job due to COVID-19, and eight out of 10 saw their
income fall as a result of the pandemic. Meanwhile,
households who have a member with a disability could
not access the health and/or therapy services they
needed.
More women-headed households (56.7%) said they
did not have savings to help cushion the impact of the
crisis compared with men (50.6%).
loss of income after it began were also able to access
assistance (approximately 70%). These included
programs such as tax deferrals, credit subsidies and
internet assistance that targeted newly affected
households.
Many households received a combination of cash and
in-kind assistance, and there was little duplication in
households receiving cash programs, spreading the
benefits further.
Two-thirds (67.4%) of recipients of government
assistance said that it was helpful in countering
the impact of the recession on household finances.
Households used the assistance to buy groceries and
fulfil daily needs, utilities, and mobile credit/internet.
However, more than a third (38%) of households in
the bottom 40% of the expenditure distribution did
not receive any cash assistance in October-November
2020. The proportion of non-cash recipients who had
experienced income loss (75%) was comparable to that
of cash recipients.
Very few of the households (7.5%) that ran a small
business received business support from the
government at the time of the survey. Four out of ten
small business owners said they were not aware that
government assistance was available.
Key finding 3: Children are missing out on education and healthcare
Almost three in four parents are concerned about
learning loss due to disruptions to their children’s
education. Access to reliable internet is a major
obstacle to children learning from home successfully,
with 57.3% of households that have children
reporting this to be a major concern. Rural and poorer
households faced more internet problems and device
constraints than their urban and wealthier counterparts.
Many parents reported that they had insufficient time
(28.7%) and/or lacked capacity (25.3%) to support their
children in learning from home.
Households with children are accessing fewer health
services—one main reason is the fear of catching
COVID-19. More than one in 10 of households with
children under five said they had not taken their
children to immunisation clinics since April 2020.

8 Analysis of the Social and Economic Impacts of COVID-19 on Households and Strategic Policy Recommendations for Indonesia
ĵ Recommendation 1: Support children more
through learning, social protection, health and nutrition and child protection. Support schools to gradually and safely re-open; ensure cash transfer programs benefit all affected households who have a child; prioritise delivery of life-saving vaccines and medicines to protect children from disease; include mental health services for parents and children as a part of the public-health response to COVID-19.
ĵ Recommendation 2: Expand food assistance and address disruptions to supply, to combat rising food insecurity. Accompany cash-based food transfers with health and nutrition promotion. Roll out surveillance of nutrition at the local level. Ensure supply of nutritious food is available and affordable.
ĵ Recommendation 3: Maintain support to
poor and low-middle income groups, who are now poorer and more vulnerable, through a suite of labour market (such as cash for work, skills training, job creation) and social assistance programs.
ĵ Recommendation 4: Continue assistance to
family businesses to recover through cash transfer programs tailored to them, information dissemination, on-demand registration and by linking recipients with complementary support. Ensure women-owned businesses are equally supported.
Strategic policy recommendations
ĵ Recommendation 5: Reduce women’s care
burden by gradually and safely re-opening schools, launching a campaign to promote equal sharing of care work at home and equip both parents with skills and support they need to successfully support children’s learning during school closures and/or periods of hybrid learning.
ĵ Recommendation 6: Ensure people with
disabilities can access the health and care
services they need. Prioritise households and individuals with a disability for social assistance and complement with access to upskilling and reskilling training opportunities.
ĵ Recommendation 7: Link new registrations
for social assistance into a single database
for future targeting. Specific recommendations are consolidating and integrating data of cash recipients into the integrated social welfare database (DTKS). Develop rules and guidelines to collect standardised information. Ensure the new micro business registry has household identification numbers for data-merging purposes.
ĵ Recommendation 8: : Promote greater
understanding of government support by developing a user-friendly medium with up-to-date information about business support programs.
©U
NIC
EF/U
NI3
6017
3/W
iland
er

Analysis of the Social and Economic Impacts of COVID-19 on Households and Strategic Policy Recommendations for Indonesia 9
Contents
FOREWORD 3
ACKNOWLEDGEMENTS 4
EXECUTIVE SUMMARY 5
STRATEGIC POLICY RECOMMENDATIONS 8
LIST OF FIGURES 10
LIST OF TABLES 10
LIST OF BOXES 11
LIST OF ANNEXES 11
GLOSSARY 12
1. CONTEXT 131. 1. COVID-19: a challenge like no other 13
1. 2. Collaborative survey 13
2. KEY FINDINGS 172. 1. The impact of COVID-19 on household finances has been severe 17
2. 2. Social assistance is reaching most but not all people in need 22
2. 3. Children are missing out on education and healthcare 32
2. 4. Women are taking on additional caring responsibilities 37
2. 5. Food insecurity among vulnerable groups is an emerging concern 38
3. STRATEGIC POLICY RECOMMENDATIONS 433. 1. Support children more 43
3. 2. Expand food assistance and reduce supply chain disruptions to combat food insecurity 44
3. 3. Maintain support to lower-middle and middle-income groups who are now poorer and vulnerable 44
3. 4. Continue assisting family businesses to recover 45
3. 5. Reduce women’s care burden 45
3. 6. Ensure people with disabilities can access health and care services 45
3. 7. Link new registrations for social assistance into single database for future targeting 45
3. 8. Promote greater understanding of government support 45
3. 9. Considerations for program specific improvements 46
LIST OF REFERENCES 47

10 Analysis of the Social and Economic Impacts of COVID-19 on Households and Strategic Policy Recommendations for Indonesia
List of Tables
List of Figures
Table 1. Proportion of households experiencing reduction in income and change in expenditure by expenditure quintile 18
Table 2. Impact of the pandemic on small businesses (%) 20
Table 3. Income and Expenditure Comparison between 2019 and 2020 of Bottom 60% Households 28
Table 4. Result and recommendations on specific programs 46
Table A1. Comparison of household characteristics (%) 54
Table A2. Household composition and individual members with specific vulnerability condition 55
Table A3. Descriptive statistics of per capita expenditure and household expenditure by expenditure group 55
Table A4. Tabulation of change in expenditure and income due to pandemic 57
Table A5. Transition matrix assuming expenditure decrease by 10% 57
Figure 1. Geographical location and household composition 15
Figure 2. Monthly expenditure per capita by quintile (in thousands IDR) of households surveyed in 2019 16
Figure 3. Current income in comparison to January 2020 by groups (%) 17
Figure 4. Simulation of shift in quintile position as expenditure and income are reduced 19
Figure 5. Work suspension rates were in line with strictness of public health measures 19
Figure 6. Business Operation 21
Figure 7. Combination of assistance received by households 24
Figure 8. Proportion of beneficiaries households by expenditure level (%) 25
Figure 9. Use of benefit 26
Figure 10. Distribution of households 28
Figure 11. The use of business support (multiple answers allowed) 29
Figure 12. Awareness about government assistance 30
Figure 13. Estimation of additional cash transfer PKH beneficiaries received during the pandemic (%). 32
Figure 14. Constraints to learning from home by groupings (%) 34
Figure 15. Proportion of internet package beneficiaries among HH with school-age children 35
Figure 16. Reason for not visiting the healthcare facilities by groupings (%) 36
Figure 17. Main carer supporting children with remote learning (%) 37
Figure 18. Who should do domestic chores and who has done more domestic chores (%) 38
Figure 19. Proportion of households facing ‘moderate or severe’ food insecurity 39
Figure 20. Proportion of households facing ‘moderate or severe’ food insecurity based on quintiles 39
Analysis of the Social and Economic Impacts of COVID-19 on Households and Strategic Policy Recommendations for Indonesia 11
List of Boxes
List of Annexes
Box 1. Characteristics of the households that took part in the survey 15
Box 2. Indonesia’s experience using data to deliver social assistance 23
Box 3 Did social assistance reach too many wealthy households? 26
Box 4. Many households needed cash assitance but did not receive it 28
Box 5. Indonesia’s support for MSMEs: a comparative view 30
Box 6. The effectiveness of Village Cash Transfer and Family Hope Programs 31
Box 7. Box Fears of accessing public health facilities during pandemic 36
Box 8. “Hunger Won’t Kill Us, Bear with It” 41
Box 9. Children in need are missing therapy 42
Annex I. Overview of government assistance programs 51
Annex II. Note on Methodology - a comparison between 2020 COVID-19 Survey and 2019 SUSENAS 54
Annex III. Analyses to support simulated impacts of income and expenditure change on 2019 quintile distribution 56
Annex IV. Summary of social assistance policy responses to COVID-19 across a selection of low and middle-income countries in the Asia-Pacific Region 58
Annex V. Summary of MSME policy responses to COVID-19 across a selection of low and middle-income countries in the Asia-Pacific Region 59
Annex VI. Comparison between cash and non-recipients by quintile 1-3 60
Annex VII. Regression results on household’s risk factors 61
Annex VIII. Summary of labour market policy responses to COVID-19 in various countries 63
Annex IX. Questionnaire 65
12 Analysis of the Social and Economic Impacts of COVID-19 on Households and Strategic Policy Recommendations for Indonesia
GlossaryBLT-DD Bantuan Langsung Tunai – Dana Desa Direct Cash Transfer – Village Funds
BOS Bantuan Operasional Sekolah School operational assistance fund
BPJS Badan Penyelenggara Jaminan Sosial Social Security Administrative Body
BPS Badan Pusat Statistik National Statistics Office
BPUM Bantuan Presiden Produktif Usaha Mikro President’s Assistance for Micro Enterprises
BST Bantuan Sosial Tunai Cash Social Assistance
COVID-19 Coronavirus Disease 2019
DTKS Data Terpadu Kesejahteraan Sosial Integrated Social Welfare Database
FAO Organisasi Pangan Dunia Food and Agriculture Organization
FIES Skala Pengalaman Kerawanan Pangan Food Insecurity Experience Scale
ICT Teknologi, Informasi, dan Komunikasi Information, Communication, and Technology
Kemenkeu Kementerian Keuangan Republik Indonesia
Ministry of Finance Indonesia
Kemnaker Kementerian Ketenagakerjaan Republik Indonesia
Ministry of Manpower Indonesia
Kemendes PDTT Kementerian Desa, PDT, dan Transmigrasi Republik Indonesia
Ministry of Villages, Disadvantaged Regions, and Transmigration Indonesia
MSMEs Usaha Mikro, Kecil, dan Menengah Micro, Small, and Medium Enterprises
PEN Program Program Pemulihan Ekonomi Nasional National Economic Recovery Program
PKH Program Keluarga Harapan Family of Hope Program
PIP Program Indonesia Pintar Smart Indonesia Program
Posyandu Pos Pelayanan Terpadu Integrated health post
PSBB Pembatasan Sosial Berskala Besar Large scale social distancing
Puskesmas Pusat Kesehatan Masyarakat Public health center
PwD Orang dengan Disabilitas People with disabilities
Susenas Survei Sosialekonomi Nasional National socioeconomic survey
UNDP Badan Program Pembangunan Perserikatan Bangsa-Bangsa
United Nations Development Programme
UNICEF Dana Darurat Anak Internasional Perserikatan Bangsa-Bangsa
United Nations Children’s Fund

Analysis of the Social and Economic Impacts of COVID-19 on Households and Strategic Policy Recommendations for Indonesia 13
1. Context
1. 1. COVID-19: a challenge like no other
COVID-19 poses unprecedented challenges all over the world. Indonesia is no exception. The coronavirus has already infected more than a million people and tens of thousands have lost their lives. Beyond the public-health crisis caused by the pandemic itself, restrictions on the economy and society are having a shocking impact on human development by pushing people into poverty, curtailing children’s access to education and healthcare, and increasing mental-health complaints. The economy is shrinking for the first time since the Asian crisis of the late 1990s (World Bank, 2020). Gross domestic product was IDR 89 trillion (US$ 6.4 billion) smaller in 2020. The National Statistics Office (BPS) notes that five million people have been forced out of work during the pandemic and 24 million others are working fewer hours (BPS, 2020a).
The finances of Indonesia’s 70 million households have come under extreme pressure as a result of the pandemic. Last year gross domestic product fell by IDR 2.2 million (US$ 157.3) on a per-capita basis—the first decline in Rupiah terms ever recorded. Personal income (as measured by consumption) dropped by 2.6% on average after adjusting for inflation. The National Statistics Office said that unemployment rose by 2.7 million in the year to August to almost 10 million people (BPS, 2020a). Millions more are working for too few hours, or for too little pay. After years of progress, poverty increased by 2.8 million people in the year to September (BPS, 2021c). In total, 27.6 million people were living below the national poverty line of about IDR 458,947 (US$ 31.8) per capita per month. The poverty rate spiked to 10.2% (BPS, 2021c), the first time it has reached double digits since 2017; it was higher still in rural areas, at 13.2%. Behind these figures are countless human tragedies.
In response to the crisis, the government of Indonesia has introduced a massive fiscal stimulus through the National Economic Recovery (PEN) program. In 2020, the government allocated IDR 695.2 trillion (US$ 49 billion) to the program. Of this, IDR 63.51 trillion (US$ 4.5 billion) was spent on the health sector, IDR 220.39 trillion (US$ 15.6 billion) for social protection, and IDR 112.44 trillion (US$ 7.9 billion) for MSMEs (Kemenkeu, 2020a).1 As the crisis continued, the government in February 2021announced a budget of IDR 699.43 trillion (US$ 49.6 billion) for the continuation of the PEN program (Kemenkeu, 2021). The social protection spending consisted of new programs and existing programs that have been expanded vertically (with additional new beneficiaries) and horizontally (with top-up of benefit amounts).
1. 2. Collaborative survey
To assess the impact of COVID-19 on Indonesia’s households and recommend programs and policies to respond to the crisis, UNICEF, UNDP, Prospera and the SMERU Research Institute, with support from the National Statistics Office, undertook a survey of 12,216 nationally representative households across all 34 provinces in October-November 2020. It is the largest survey yet on COVID-19 based exclusively on face-to-face interviews with households that were surveyed by the National Statistics Office in 2019.
It gives special attention to children and vulnerable groups. There is also a focus on women as well as on people with disabilities. The survey and analysis of results were designed with regular feedback and input from the Government of Indonesia.
The major objectives of the survey were to assess the impact of the pandemic on: (1) income, employment and business; (2) household consumption and food security; (3) children and welfare (health and education); and (4) vulnerable groups such as persons with disability and female-headed households. It
1. The detail information about each program is provided in the Annex I
14 Analysis of the Social and Economic Impacts of COVID-19 on Households and Strategic Policy Recommendations for Indonesia
also focused on (5) strategies used by affected households to cope and (6) access to government assistance. The COVID-19 survey has sought to monitor the outreach of the programs along with the dimensions of ‘coverage’ (who has access to benefits); ‘comprehensiveness’ (risks covered, complementarities between cash and non-cash assistance) and ‘adequacy’ (level of benefits and expenses covered).
The survey results have been disaggregated by economic status of households based on their reported expenditures in National Socioeconomic Survey (Susenas) of March 2019 (see Box 1); presence of children, gender of the head of household (male or female), presence of persons with disabilities, economic status of households, and location of household (rural/urban).
The results of this disaggregation have been presented in this report where relevant. To estimate the prevalence of food insecurity, the survey uses the ‘Food Insecurity Scale’ (FIES) as adopted by the National Statistics Office in Susenas2.
The survey included both factual questions, such information on changes to consumption, as well as perception questions. The latter was particularly useful for eliciting views and feedback from respondents. For instance, in a dedicated module on social assistance, a series of questions were asked about the type of assistance received, how the recipients used the
assistance, and feedback on usefulness and parity of such assistance. Similarly, on children and education, data was gathered on experiences of learning from home and parents’ observations about their children’s behaviour.
The respondents in this study were a sub-sample of Susenas 2019, and the data from the two surveys has been merged, among other things, to identify household expenditure prior to the pandemic which was challenging to collect at the time of this survey3. This has made it possible to determine the economic status, or baseline condition4, of households prior to the pandemic. This is used in this report to: (1) analyse the impact of the crisis on households across the expenditure distribution; (2) assess the extent to which poor and vulnerable households were reached by social protection programs.
The data collected from the household surveys were complemented with in-depth, interviews. This was to probe the survey findings more deeply and situate the results in the context of the unfolding pandemic. The interviews focused on, among other things, changes to employment and jobs; division of care and domestic work; families’ experiences with accessing basic services; children’s experiences with online learning; and vulnerabilities faced by persons with disabilities during the pandemic.
2. National Statistics Office and The SMERU Research Institute have done the FIES estimation for the purposes of this joint survey. FIES is originally developed by the Food and Agriculture Organization (FAO).
3. National Statistics Office measures the economic status by using expenditure per capita which calculated based on detail expenditures asked in the Susenas. This detail expenditure module has more than 290 items, which cannot be administered in the joint-survey due to time limitation conducting face-to-face survey during the COVID-19 pandemic. To approximate the economic status of the respondent, hence we used the 2019 Susenas data.
4. This has been done primarily by determining the socio-economic position of households prior to the pandemic in the distribution of expenditure using the full sample of Susenas 2019. Each household in Susenas 2019 was sorted based on its monthly expenditure per capita, from the lowest to the highest, and then divided into five groups (or quintiles). This identification of the quintile position in Susenas 2019 was then merged with the 2020 survey data . This serves as the baseline position of households surveyed.

Analysis of the Social and Economic Impacts of COVID-19 on Households and Strategic Policy Recommendations for Indonesia 15
BOX 1 Characteristics of the households that took part in the survey
Distribution of households across Indonesia
�������
����������
�������� ���������������
���������������������
����
20.8%
6%
6.7%
5.5%
58.7%
2.4%
The data and analysis presented in this
report is based on sampling weights
provided by the National Statistics Office
and is representative of the 69 million
households in Indonesia.5 Below are the characteristics of the population that were represented by the survey. Over 70% of households lived with children under 18. Out of these, 25.4% had children under the age
of 5. Around 30% of households lived with elderly relatives, 6.9% with persons with disabilities, 3.2% with pregnant women, and 15.8% with members with chronic diseases.6 Women-headed households made up 14.3% and households headed by men 85.7%. Households headed by women tended to be single/divorced, older, and less educated compared to households headed by men.
Figure 1. Geographical Location and Household Composition
5 Annex II provides the detailed methodological information of the weighted sample in comparison with the sample of Susenas 2019.
6 These statistics are quite stable from 2019 (compared to Susenas) with notable differences: 67% of households live with children under 18 years old, 29% of households have children under 5, 28% of households live with the elderly, 8% with PwD (severe and moderate difficulties), 3.7% with pregnant women.

16 Analysis of the Social and Economic Impacts of COVID-19 on Households and Strategic Policy Recommendations for Indonesia
Urban 56%
85.7%
46.6%are aged 50 or older
93.8%are married
43.4%have elementary school or lower
education
of householdheads aremale
Households Key Characteristics
Rural 44%
14.3%
68.3%are aged 50 orolder
77.7%are widowed/ divorced
56.3%have elementary school or lower
education
of householdheads arefemale
71.5%of households have children under 18 years old
25.4%of households have children under 5 years old
Half of households have 3–4 members and one-third have five or more members(use en dash)
work in the agriculture, plantation, forestry, hunting, and fisheries sectors
30.4%of households live with the
elderly
3.2%of households have pregnant
women
6.9%of households have
people with disabilities
15.2%of households have
members with chronic diseases
Profile of household heads
The largest proportion of breadwinners
31.2%work in the community, social, and individual services sectors
17.5%
are employed in theformal sector
57.0%are employed in theinformal sector
43.0%
work in the trade, restaurant, and accommodation services sectors
22.5%
The survey included households from all five wealth quintiles, but most respondents were not very wealthy. As Figure 2 illustrates, half of the households in Quintile 1 were living below the poverty line in 2019, Quintile 2-4 had only low-moderate household income of between
IDR 560,000 and IDR 1,750,000 (US$ 38 – US$170) per month, and even Quintile 5 households were not that well off. The survey does not capture very high-income households because these groups rarely participate in such surveys.
26500
2500
//
1250
430
560
Quintile 1(Lowest)
Quintile 2 Quintile 3 Quintile 4 Quintile 5(Highest)
1680
670
800
560
967
1150
803
1367
2362
26400
1750
1737
1147
Median 2019 Poverty Line (425,0000) 2015 Decent Living Cost (1,800,000)
Figure 2. Monthly expenditure per capita by quintile (in thousands IDR) of households surveyed in 2019
Source: calculated from the Susenas March 2019 and the 2020 household survey
Analysis of the Social and Economic Impacts of COVID-19 on Households and Strategic Policy Recommendations for Indonesia 17
2. Key findings
2. 1. The impact of COVID-19 on household finances has been severe
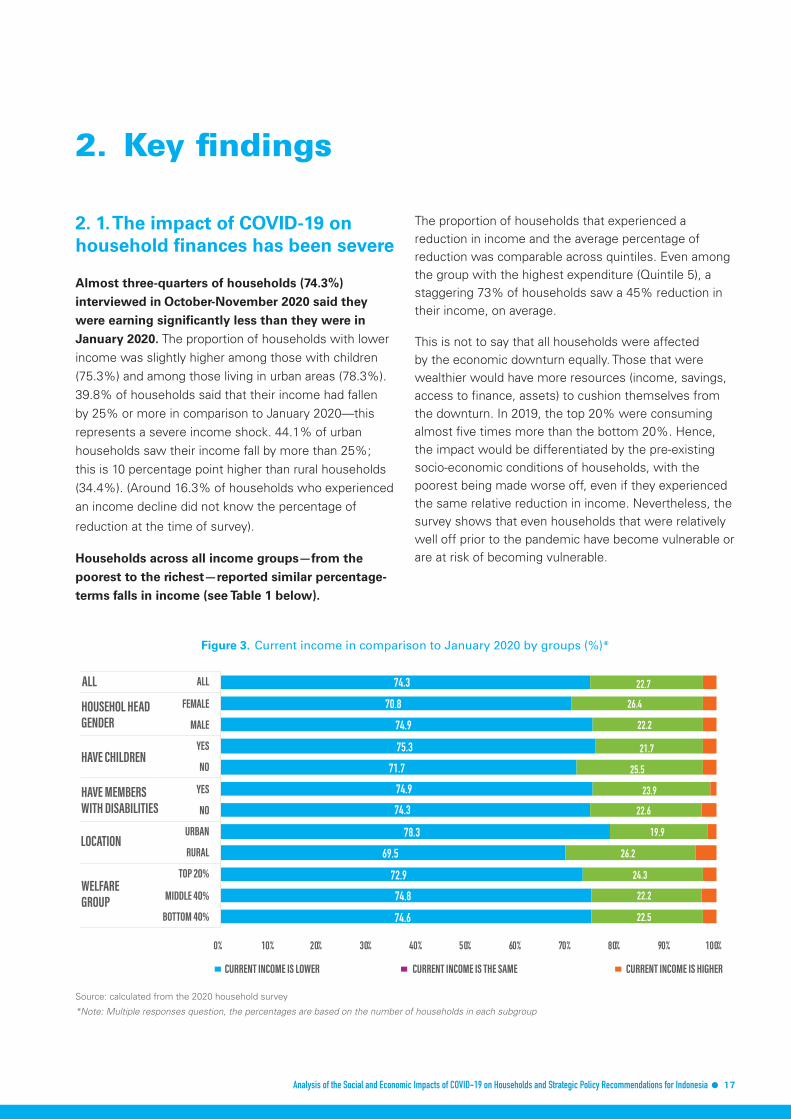
Almost three-quarters of households (74.3%) interviewed in October-November 2020 said they were earning significantly less than they were in January 2020. The proportion of households with lower income was slightly higher among those with children (75.3%) and among those living in urban areas (78.3%). 39.8% of households said that their income had fallen by 25% or more in comparison to January 2020—this represents a severe income shock. 44.1% of urban households saw their income fall by more than 25%; this is 10 percentage point higher than rural households (34.4%). (Around 16.3% of households who experienced an income decline did not know the percentage of
reduction at the time of survey).
Households across all income groups—from the poorest to the richest—reported similar percentage-terms falls in income (see Table 1 below).
The proportion of households that experienced a reduction in income and the average percentage of reduction was comparable across quintiles. Even among the group with the highest expenditure (Quintile 5), a staggering 73% of households saw a 45% reduction in their income, on average.
This is not to say that all households were affected by the economic downturn equally. Those that were wealthier would have more resources (income, savings, access to finance, assets) to cushion themselves from the downturn. In 2019, the top 20% were consuming almost five times more than the bottom 20%. Hence, the impact would be differentiated by the pre-existing socio-economic conditions of households, with the poorest being made worse off, even if they experienced the same relative reduction in income. Nevertheless, the survey shows that even households that were relatively well off prior to the pandemic have become vulnerable or are at risk of becoming vulnerable.
74.6
74.8
72.9
69.5
78.3
74.3
74.9
71.7
75.3
74.9
70.8
74.3
22.5
22.2
24.3
26.2
19.9
22.6
23.9
25.5
21.7
22.2
26.4
22.7
0% 10% 20% 30% 40% 50% 60% 70% 80% 90% 100%
����������
����������
�������
�����
�����
��
��
��
��
����
������
���
��������������������������
����������
������������
��������
����������������
���
����������������������� ������������������������� ����������������������
Figure 3. Current income in comparison to January 2020 by groups (%)*
Source: calculated from the 2020 household survey
*Note: Multiple responses question, the percentages are based on the number of households in each subgroup

18 Analysis of the Social and Economic Impacts of COVID-19 on Households and Strategic Policy Recommendations for Indonesia
For many households, a loss of earnings was not the only challenge: almost a quarter of respondents (24.4%) said their expenses had risen, too. Increased costs for groceries and other essentials (for 77.8% of households) was the main contributor to this rise in expenses followed by increased costs for
communications (for 57.3%). One main reason could be that households were bulk buying groceries and other essentials due to the uncertainties posed by COVID-19. Significantly more households with children that experienced increases in expenditure reported to be spending more money on mobile telephone credit (65%) than their counterparts with no children (28.8%), likely due to remote learning requirements.
The main implication of the pandemic-induced changes is that a new wave of households, which were previously economically secure, have now
become poor and vulnerable. Figure 4 illustrates this through simulations of the potential implications of income loss reported in the survey on expenditure (see Annex III details on the simulation). This exercise shows that a 10% reduction of expenditure among households most affected by COVID-19 would translate into significant shifts downwards in the position in expenditure quintile compared with 2019 levels. The proportion of households in Quintile 1 (the bottom 20%) would increase by 34%. Meanwhile,
those in Quintile 5 (the top 20%) decreases by 29%. The poverty rate among all households surveyed would also increase, to 12.3% from 8.1% in 2019. This represents a significant shift towards a poorer society. It means that many more people are now living in the bottom 40% of the expenditure distribution (earning up to IDR 800,000 per month), and there are fewer households in the top 60% of the distribution (earning more than IDR 803,000 per month) compared with 2019 levels.
The primary earner in most households continued to work, but some were working fewer hours and
earning less. In most households (91.2%), the primary earner continued to work when the survey was conducted in October-November 2020. On average, the primary earner worked 35 hours per week, indicating they were working full time. However, 90% of primary earners from female-headed households and 89% of those from households with persons with disabilities worked comparatively fewer hours per week. More than 80% of primary earners employed in the trade and restaurant sector, and 70% in the transport and communication sector and mining sector reported to be earning less than they were prior to the pandemic. These results are understandable as demand is lower in these sectors due to public health restrictions coupled with economic downturn (BPS, 2021b).
Table 1. Proportion of households experiencing reduction in income and change in expenditure by expenditure quintile
Quintile 1 (Lowest Expenditure)
2 3 4 5 (Highest Expenditure)
Average monthly household expenditure in 2019 (000 IDR)
1,900 2,900 4,000 5,100 9,350
Average % reduction in income
42% 44.4% 44.1% 43.4% 45%
Experienced reduction in income (%)
73.2 75.8 75.9 73.6 72.9
Experienced increased in expenditure (%)
28.7 32.3 35.1 36.4 38.7
Experienced decrease in expenditure (%)
24.4 28.7 25.6 23.7 21.8
Source: calculated from the Susenas March 2019 and the 2020 household survey

Analysis of the Social and Economic Impacts of COVID-19 on Households and Strategic Policy Recommendations for Indonesia 19
17.3
22.9 23.020.1
16.6
23.224.8
22.2
18.0
11.8
���
���
����
����
����
����
����
������� ����������� �� ������������
QUINTILE 1�������� ���������
QUINTILE 2 QUINTILE 3 QUINTILE 4 QUINTILE 5
Figure 4. Simulation of shift in quintile position as expenditure and income are reduced
Source: calculated from the Susenas March 2019 and the 2020 household survey
Fourteen percent of primary earners switched jobs because of the pandemic. Almost half (47.3%) of those who did change job moved from work as salaried employees in the formal sector into less
secure work in the informal sector. People working in industry, transport or services pre-COVID were most likely to leave formal jobs for informal ones. 43.1% moved to the construction sector and 36.7% moved to the agriculture sector. Among the small proportion
of households where the primary earner had been furloughed (5.5%), almost three-quarters (73.7%) had received no wages at all, and more than one-fifth (21.2%) had received reduced wages. Only one-third of those who were suspended were guaranteed a return to their jobs. Suspension occurred every month throughout the year, but peaked in April and October. This is in line with strictness of public health measures, as shown in Figure 5 below.
�������
�������
������������
������
������
�������
�������
���������� �� �������������� �������� � ����� ����������� �������������� ������������
������������������������������������������� �������������������������������������
Figure 5. Work suspension rates were in line with strictness of public health measures*
Source: calculated from the 2020 household survey
*Note: Timeline of Large-Scale Social Restrictions (PSBB) in Jakarta: 10-23 April 2020: PSBB Phase I; 24 April-22 May: PSBB Phase II; 22 May-4 June: PSBB Phase III; 5 June-10 September: PSBB transition; 14 Sep: PSBB; 12 Oct: PSBB transition

20 Analysis of the Social and Economic Impacts of COVID-19 on Households and Strategic Policy Recommendations for Indonesia
Despite the pandemic, seven in 10 primary earners continued to work from their workplaces. Around one-fifth (20.4%) of primary earners were able to work from home. This was the case for all households, including those with elderly relatives, children, and people with disabilities, raising concerns over transmission, caregiving and the ability to support children learn from home.
Half of all households (51.5%) had no savings upon which to fall back on. More than one-quarter (27.3%) were pawning possessions to survive. A quarter (25.3%) were borrowing money informally from family or friends. Of the households to have racked up personal debt, 40% were failing to make regular repayments.
For many households, small businesses are an important source of income. One-third of all households (29.9%) in the survey had at least one household member who was running a business, and almost all of these businesses (87.5%) had been affected by the pandemic. Even before the pandemic, household businesses were mostly unregistered small-scale units, often employing unpaid family workers. Indonesia’s micro and small businesses are central to employment and income for poorer households in the informal sector. Because they are relatively simple to
start up and shut down, many people resort to making a living running informal micro businesses, particularly in times of crisis when the formal economy shrinks. Most of those who run or work in these informal enterprises face precarious working conditions, without social protection and with often poor health and safety measures. They typically have low productivity, low rates of savings and investment, and less capital (Prospera’s own estimates using VIMK 2015, see Wells and Sijapati Basnett 2020).
Such pre-existing conditions render small-scale enterprises vulnerable to both the economic shocks caused by lockdown and other containment measures as well as to health risks. It also makes it more difficult for the government to reach them with business assistance programs. And yet the collapse and closure of these enterprises can trigger significant surges in unemployment and underemployment, leading to long-lasting effects on the economy while retarding recovery and/or preventing recovery that is inclusive (ILO and OECD, 2020).
Fewer customers (66.4%), lower revenue (56.4%) and higher costs (11.5%) were the main complaints. Only a small fraction of household businesses (3%) reported that their businesses had improved.
Table 2. Impact of the pandemic on small businesses (%)
All business Male-owned Female-owned Jointly-owned
1 2 3 4 5Buyers decrease 66.4 61 70.2 70.8
Revenues decrease 56.3 57.2 57.5 53.7
Costs increase 11.5 12.5 11.5 10.1
Capital decreases 10.5 9 11.7 11.4
Raw material availability is disrupted 5.47 6.79 4.32 5.4
Goods delivery/distribution is difficult 5.3 8.5 3.4 3.4
Cannot pay business loans 2.9 1.4 3.3 5.5
Costs decrease 2.6 1.8 1.8 5.9
Buyers increase 2.1 1.4 3.0 1.7
Revenue increase 0.9 0.6 1.4 0.6
Source: Calculated from the 2020 household survey.
*Note: The percentages are based on the number of households with small business.

Analysis of the Social and Economic Impacts of COVID-19 on Households and Strategic Policy Recommendations for Indonesia 21
As the survey was conducted almost six months after the lockdown was first imposed, most businesses had found ways to cope and were settling into the ‘new normal’. Almost half said they were able to maintain the same operating hours as prior to the pandemic. 38.9% of businesses that were adversely affected were trimming expenses by spending less on inventories, salaries and bonuses and 9.6% of businesses had reduced operating hours. Around 10% were using online platforms to market their products and secure buyers. In total, 40% of the businesses were applying health protocols. Out of these, 30% were maintaining their operating hours with health protocols in place while the remaining 10% were operating with reduced hours. During qualitative interviews, businesses were generally hopeful for a brighter future and/or believed they could cope with the ‘new normal’:
Nevertheless, a sizeable proportion of family-based enterprises were still struggling—perhaps an indication of more long-term structural problems.
33.5% of businesses with outstanding debt said they could not meet their monthly loan installments. 8.3% of business had to sell off assets; 2.7% reduced workers. Meanwhile, 8.2% of businesses had to temporarily close down to cope with the pandemic’s negative impact.
"Since COVID-19, I have had to think hard about how to
sustain my family as I did not have the same number of
orders as before. In the end, I decided to make masks
from leftover fabric, and I am able to sell them more
cheaply, IDR 10,000 (US$ 0.7 for three masks). Other
stores generally charge the same price for only one
mask, and the sewing is mediocre compared to what I
offer.”
(In-depth interview informant, Ibu Melati, tailor, Yogyakarta City, urban, 7
December 2020).
"Since November, my business has started to recover.
Tourists have started to slowly return. Hopefully, more
will come during the end-of-year holiday."
(In-depth interview informant, Ibu Sari, grocery seller, Kepulauan Seribu
District, urban, 2 December 2020).7
Figure 6. Business Operation
7 All names provided in this report are pseudonyms to maintain the identity of those who participated in the survey
0
������������������
������������������������������ ���� ����������
���������������������������� ���� ����������
�������������������������
10 20 30 40 50 60
7.05.9
12.1
36.4
45.6
3.4
10.4
32.4
50.251.9
33.9
10.8
JOINTLY OWNED FEMALE OWNERS MALE OWNERS
Women played a major role in family businesses. The proportion of women-owned businesses that had to close down (7%) was two times higher than those
owned by men (3.4%). Most of the small-scale family businesses were either owned solely by women (40%) or jointly owned by women and other members of the household.
Source: calculated from the 2020 household survey

22 Analysis of the Social and Economic Impacts of COVID-19 on Households and Strategic Policy Recommendations for Indonesia
One reason for the closure of a greater proportion of women-owned businesses is that these businesses are mainly concentrated in the retail trade, restaurant, and accommodation sectors (81.4%), which have been hardest hit by the social restrictions
imposed to curb the spread of the virus. When the pandemic arrived, Prospera estimated that women-owned small-scale businesses would be especially vulnerable because they are consistently smaller and with fewer sales than businesses owned by men. 70.7% of all micro and small enterprises owned by women generate profits of less than Rp1.4 million (A$145) per month. This is not enough to keep a family of four out of poverty. These enterprises are the least likely to survive the pandemic.
58.1% of all family businesses run by women had school-age children, and women were the main
carers, supporting their children to learn from home. Having to balance additional caring responsibilities with an increasingly challenging business environment compounded the challenges faced by women:
2. 2. Social assistance is reaching most but not all people in need
To help protect people and communities from the adverse effects of the pandemic, Indonesia has massively expanded its social assistance programs.
Indonesia’s investment in social protection programs in 2020 amounted to a total of IDR 203 trillion (US$ 14 million), and it was the single largest allocation in the National Economic Recovery Program (PEN). This has been done by building on its expansion of social protection system since the Asian Financial Crisis two decades ago, with coverage buttressed by a robust social registry covering the poorest 40% of the population. The COVID-19 response programs have been expanded from those who are poor already to also assist a growing number of middle-income earners and small businesses who have become vulnerable due to the sudden slowdown of the economy and restrictions on economic life.
The government has increased the coverage and benefit levels of existing assistance programs while also introducing several new social protection and labour market measures to reach newly vulnerable
groups. Indonesia has rapidly distributed aid to the poorest through the Family Hope Program (PKH), Sembako Program, and made electricity free for households with 450 VA and 900 VA connections. New programs to support the newly vulnerable have also been introduced, including pre-employment cards (Kartu-Pra Kerja), cash assistance for micro, small, and medium-sized enterprises (BPUM), wage subsidies for formal workers, village cash transfer program (BLT-DD), and others.8
As of February 2021, the total allocated budget for social protection measures in 2021 amounted to IDR 157.41 trillion (US$ 10.9 billion), equivalent to 1.02% of GDP in 2020 (Kemenkeu, 2021). Due to large number of recipients, Indonesia’s budget is slightly larger than those of Malaysia and the Philippines, which have rolled out comparable programs (see Annex IV for a comparative perspective).
“It is always me who has to help our child with remote
learning. Every time I ask my husband, he says he is on
his way out and leaves immediately. But I am also busy
with the shop. So, I must delay helping my child out until
I have time. Maybe around 10 am or 11 am. If my child
needs help urgently then I help my child first but then
there is no one to tend to my shop.”
(In-depth interview informant, Ibu Sari, grocery seller, Kepulauan Seribu
District, urban, 2 December 2020).
8 The detailed information about each program is provided in the Annex I

Analysis of the Social and Economic Impacts of COVID-19 on Households and Strategic Policy Recommendations for Indonesia 23
BOX 2 Indonesia’s experience using data to deliver social assistance
Indonesia’s pre-existing social registry, known
as the Integrated Social Welfare Database
(DTKS), has been the foundation for targeting
assistance to households and individuals during
the pandemic. First developed in 2005 through
a National Statistics Office-lead census on poor
households, the database has since been updated
three times (in 2008, 2011 and 2015). The DTKS
now includes details of 27 million of the lowest-
earning households, representing 40% of the
population.
Prior to the pandemic, social assistance programs
such as the Family Hope Program (PKH) and
Kartu Sembako food staples program were aimed
at the poorest households. Not all households
and individuals registered in the DTKS received
assistance. But during the pandemic, Indonesia
has used the database to identify and enrol
new beneficiaries into programs, such as
staple food support for those residing in Jakarta
and surrounding areas, and cash transfer for
households outside the Jabodetabek region (BST).
The database has also been used to spread the
benefits further and avoid duplication.
Depending entirely on the database has proved
challenging, however, as it was not updated
regularly, in contrast to countries such as Brazil,
Turkey and the Philippines where citizens’ economic
status is tracked regularly to tailor the support
(labour market and/or basic needs) available to
them. And DTKS is not yet interoperable with other
databases, namely population data (NIK).
These problems and a lack of data on Indonesians
who are vulnerable to poverty (beyond households
in the bottom 40% of the expenditure distribution),
including people working in the informal economy,
has been tackled by relying on innovative measures,
including electricity records (electricity subsidy);
community-based targeting (BLT DD); self-targeting
through on demand application (Kartu Pra Kerja);
and other novel sources of data such as bank
account data (BPUM).
As the survey results show, however, there is more
to be done to reach those who have not received
any support as the crisis continues. Having data that
is reliable and regularly updated will be critical to
respond to shocks in the future.
The survey shows that most households (85.3%) received at least one form of social assistance. These include cash or in-kind transfers. Half of them (50.8%)
received cash assistance. Among the households that were surveyed, 88.9% said they needed social assistance; 72.6% specifically said that they needed cash assistance. Overall, there was only a three-percentage point difference between the proportion of people who said they needed support and those who received it. The gap was larger, at 14 percentage points, for those who said they needed cash and those that received it.
A higher proportion of women-headed households (55.1%); households with children (52.9%); rural households (59.6%); and households in the bottom
40% (63.5%) received cash assistance. Interestingly, government assistance reached more female-headed households and households in the bottom 40%
compared with financial assistance that was provided to these groups through their relatives and social networks. 16.4% of women-headed households and 8.8% in in the bottom 40% received cash from extended family or neighbours. These results provide an indication of the difference in number of people reached. They do not reveal which support was more adequate for meeting the needs of beneficiaries, nor the potential complementarities between government and non-government support among those who received both. Nevertheless, it does provide an indication of the significance of government support during this critical period.
The households surveyed received at least one of the six main types of cash assistance – BLT DD, BST, PKH, wage subsidy, Kartu Pra-Kerja, BPUM. There was minimal duplication across survey participants. This is good news because with a proliferation of different

24 Analysis of the Social and Economic Impacts of COVID-19 on Households and Strategic Policy Recommendations for Indonesia
programs being rolled out rapidly with varying eligibility and delivery mechanisms, a key challenge faced by Indonesia has been to create complementarities and avoid duplication across programs (Sudarno, 2020).
Many households also received a diverse combination of complementary cash and non-cash support. Overall, 77% of households received at least one of the three programs that had the widest reach: cash (50% received), electricity subsidy (46% received), and staple food (43% received). Among those who received cash, 32% also received electricity and food staples; 28% also received electricity subsidy; 16% also received food staples; 24% received neither of the other two.
During in-depth interviews, recipients said that while cash gave them flexibility to choose what goods or services to spend on, the electricity subsidy and internet assistance offset the cost of studying and working from home. Food assistance reduced their food expenses. These results show that among the 60% cash recipients who received other complementary support, the support provided was fairly comprehensive. But there were many who received only one type of assistance (only cash or only food staple).
Food (11% )
Electricity(8% )
Cash(12%)
Total43%
Total46%
Total50%
8%
16%
8%
14%
Figure 7. Combination of assistance received by house-holds*
Source: calculated from the 2020 household survey
*Note: among those (23%) who were not receiving any support from the three main programs, 35% were receiving other support such as loan defer-
ral, tax relief and/or internet subsidy.
©U
NIC
EF/3
4620
2/W
iland
er

Analysis of the Social and Economic Impacts of COVID-19 on Households and Strategic Policy Recommendations for Indonesia 25
Most of the poorest and vulnerable households (over 90% in Quintiles 1-3) received at least one social assistance program, and they also benefitted more
than those households that were better off. Figure 8
below shows that the proportion of beneficiaries among
the poorest group was larger than that of the other
expenditure groups. The proportion of beneficiaries
in each quintile reduces with the rise in household
wealth. The drop is particularly noticeable after quintile
3. In other words, the difference in the proportion of
beneficiaries between quintile 1, 2 and 3 is small (a few
percentage points lower), but the difference between
the proportion of beneficiaries in quintile 3 and 4 is
almost 10 pp, and between 4 and 5 (wealthiest) it is
11.5 pp. Cash assistance follows a similar pattern. And
being poor and vulnerable (Quintiles 1-3) increased
the chances of receiving at least one form of social
assistance and/or cash assistance compared with
better off households.9
Some households that were previously economically secure but had experienced a significant loss of income as a result of COVID-19 were also able to
access assistance. The figure shows that 28.9% of
those with highest expenditure (Quintile 5) received a
cash transfer, but this does not mean that all assistance
received by this group was mistargeted for two main
reasons. First, 72.9% of those who were in Quintile
5 (in 2019) experienced an average income reduction
of 45%. Understandably, 70.9% said that they needed
social assistance. So even quintile 5 were not very
wealthy at the time of the survey. Some households
in quintile 5, therefore, were also eligible for support
because they were adversely impacted by the
pandemic. Second, not all social assistance programs
were targeted at the poor. Programs such as Kartu
Pra-Kerja targeted individuals who were not yet in the
social register and had not received any other form of
cash assistance, while internet package, BPUM and
wage subsidy were available to everyone who meet the
eligibility criteria, which did not include income. For a
summary of program-specific results, refer to Table 4 in
policy recommendations.
Figure 8. Proportion of beneficiaries households by expenditure level (%)
Source: calculated from the Susenas March 2019 and the 2020 household survey
65,2
94,9
61,9
92,5
54,6
91,0
44,4
80,1
28,9
68,6
0,0
10,0
20,0
30,0
40,0
50,0
60,0
70,0
80,0
90,0
100,0
CASH ASSISTANCE AT LEAST ONE PROGRAM
QUINTILE 1 ��������
QUINTILE 2 QUINTILE 3 QUINTILE 4 QUINTILE 5 ���������
9. Similar magnitude of probabilities of receiving assistance by expenditure quintiles were also confirmed by various model of logistic regression with and without controlling house-holds ‘characteristics such as gender and age head of household, the size of household, whether there are children in household, rural-urban dummy, and Java-non Java dummy.

26 Analysis of the Social and Economic Impacts of COVID-19 on Households and Strategic Policy Recommendations for Indonesia
0.6
1.0
2.5
3.1
3.3
4.8
9.6
11.3
14.9
46.2GROCERIES AND DAILY EXPENSES
UTILITIES
CELL PHONE CREDIT OR INTERNET PACKAGE
EDUCATION EXPENSES
HEALTH EXPENSES
TRANSPORTATION EXPENSES
SEED MONEY
DONATION OR CHARITABLE EXPENSES
INSTALLMENTS OR DEBT REPAYMENTS
HOUSE OR ROOM RENT PAYMENTS
BOX 3 Did social assistance reach too many wealthy households?
The middle-income group (Quintiles 2, 3, and 4) had median monthly expenditures of IDR 670,000 (US$ 46.44), IDR 967,000 (US$ 67.0) and IDR 1,367,000 (US$ 94.4), respectively. This shows that the median expenditure of these households was below the cost of a decent standard of living. These groups would be vulnerable to any reduction in their household income as a result of COVID-19 and at risk of sliding into poverty.
Meanwhile, the median monthly expenditure for the wealthiest households (Quintile 5) was IDR 2,362,000 (US$ 163.7). This is only around one-third higher than the cost of a decent living10. This shows that even the wealthiest households, while more economically secure than those in the lower quintiles, were not very well off. They, too, would be at risk of falling into poverty if faced with a severe income shock.
It might seem surprising that so many households in the higher expenditure quintiles accessed social assistance during the pandemic. Yet analysis shows that only households in the top 20% of the expenditure distribution (Quintile 5) were earning enough to sustain a decent standard of living before COVID-19. Households in the bottom 80% of the distribution (Quintiles 1-4) were earning too little to sustain a decent living standard. In other words, it was right that government assistance reached these groups.
To provide a better sense of the value of the expenditures of each quintile, Figure 2 shows median monthly expenditure for each of the five groups represented in the household survey. The poorest households (Quintile 1) had median monthly expenditure of IDR 430,000 (US$ 29.8) in 2019. The national poverty line in that year was IDR 425,000 (US$ 29.5). In other words, around half of those in Quintile 1 were poor.
10. Decent cost living used in this graph was published by National Statistics Office, the latest national figure available is from 2015 (BPS, 2020b). The decent cost of living has been used in determination of the minimum wage and in these recent years, the effort in calculating the decent cost of living has become more decentralized at the provincial level and become the task of the Provincial Renumeration Council based on National Statistics Office data. At the central level, Ministry of Labor decided items of cost to be included in the decent living cost calculation for a single worker (Kemnaker, 2020)
Figure 9. Use of benefit
Source: calculated from the 2020 household survey

Analysis of the Social and Economic Impacts of COVID-19 on Households and Strategic Policy Recommendations for Indonesia 27
The results show that assistance eased household’s
financial pressure. Households reported that they used assistance to buy groceries and other essential items (46.2%) and to pay for utilities (14.9%) and mobile/internet credit (11.3%).
Most of the recipients (67.4%) thought government
assistance was useful. People who had experienced a significant reduction in their household income explained how support had helped them during in-depth interviews:
“I used up the cash assistance I received from the
government in one day, paying off some of the debts I
owed to the grocery store. I hope that I will be able to
work again or receive an additional round of support
from the government. I will be able to pay off my
remaining debts. Alhamdullilah, I still got the little that
I did this time around because other families have not
received any support and they too are struggling.”
(in-depth interview informant, Ibu Rini, making embroidery for praying robe,
Tasikmalaya City, rural, 16 November 2020).
“I had never received social assistance from the
government prior to the pandemic. But since August,
I have received three tranches already. I used the first
IDR 500,000 (US$ 34.7) to seek medical treatment
for my child who has a disability. And the assistance I
received in September and October 2020, I have used it
for buying food and other everyday necessities”
(In-depth interview informant, Ibu Tati, housewife, Banjar City, urban, 19
November 2020).
Nevertheless, one in three households (or 34.8%) in the bottom 20% of the expenditure distribution did
not receive any cash assistance (the preferred form of assistance for 72.6% of respondents). The percentage of households in the bottom 20% who did not receive cash assistance by type of vulnerability are as follows: 32.7% of households with children, 32.9% of female-headed households, and 34.7% of households with a member who has a disability. Box 4 highlights insights gained on two COVID-19 flagship measures to cushion the poor and vulnerable against economic shocks.
©U
NIC
EF/U
N03
5261
6/B
ea
The survey results suggest that poor and lower-middle households who have fallen out of the social
safety net also need assistance. As the Box below shows, a similar proportion of cash recipients and non-cash recipients in the bottom three quintiles reported a decline in income and expenditure during the pandemic. A higher proportion of non-cash recipients reported that they were facing challenges feeding themselves and paying for their children’s education compared with cash recipients, even though non-cash recipients were relatively better off prior to the pandemic. All these results are indicative of the need to widen cash assistance and reach the poorest and lower-middle-income households who have been affected by the pandemic but have fallen out of the social safety net.

28 Analysis of the Social and Economic Impacts of COVID-19 on Households and Strategic Policy Recommendations for Indonesia
BOX 4 Many households needed cash assitance but did not receive it
Source: calculated from Susenas 2019 and the 2020 household
66.1
59.1
57.0
60.6
33.9
40.9
43.0
39.4
0% 50% 100%
QUINTILE 1
QUINTILE 2
QUINTILE 3
TOTAL
NEEDED AND RECEIVED NEEDED BUT DID NOT RECEIVE
Overall, 71% of households in the bottom 60% of the expenditure distribution reported that they needed cash assistance from the government. Among them, 60.6% had received cash, while the remaining 39.4% had not. The survey shows that both groups had a similar proportion of households who had experienced a welfare loss with a decline in income (75-76%) or expenditure (25-28%).
The distribution by quintile is provided in the graph below:
Figure 10. Distribution of households
Table 3. Income and Expenditure Comparison between 2019 and 2020 of Bottom 60% Households
CharacteristicsTotal Bottom 60% (Quintile 1-3)
Cash recipients Non-cash recipientsBaseline of expenditure in 2019
Expenditure per capita 682807.8 724229.8
Food expenditure per capita 416384.9 428733.2
Income condition in 2020
Income reduced compared to January* 75.9% 74.5%
Expenditure reduced compared to January 25.6% 28.0%
Food Security condition in 2020
Eaten smaller portions than usual 8.3% 12.3%
Run out of food 5.6% 8.6%
Not eaten for a whole day 2.2% 4.1%
Other adverse conditions in 2020
Having difficulties with educational costs** 52.8% 59.9%
* The percentages presented here are only among those who provided non-missing response** The percentages presented here are only among those who have educational expenses
Among the households in the bottom three quintiles that reported that they needed cash support, those who received cash tended to have had lower initial welfare conditions than non-beneficiaries, in terms of their 2019 per capita expenditure and food expenditure.
However, the survey results show that both groups had a similar proportion of households who had experienced a decline in income (75-76%) and expenditure (25-28%). This also shows that among those who self-reported that they needed cash assistance were indeed many who were adversely affected by the pandemic.
A higher proportion of non-cash recipient households reported that they were concerned about food insecurity (Refer to Section 2.4 for dedicated discussion) and had difficulties in meeting educational costs compared with their cash recipient. For example, 12.3% of non-cash beneficiary households said they were eating less than usual. In the group that received cash the proportion was lower, at 8.3%.
60% of non-cash beneficiary households reported that they experienced difficulties paying educational-related expenses, while for cash beneficiaries the proportion was 58%. These results are particularly stark among non-cash recipient households in the quintile 3 followed by quintile 1 as compared to their counterparts who had received assistance (See Annex VI for the quintile breakdown).

Analysis of the Social and Economic Impacts of COVID-19 on Households and Strategic Policy Recommendations for Indonesia 29
Very few of the households (7.5%) that ran a small family business had received any business support
from the government at the time of the survey. This included cash grants, tax concessions, and loan deferrals.11
Those that received support, used it for the intended purposes. Around 80% of recipients used assistance for additional capital, while 12% used the funds for
seed capital. 12% repaid loans and almost a quarter used it for household expenses. [These are averages across the three types of owners presented in the Figure 11]. There were notable differences in the way women-owned businesses used the support they received compared to male-owned or jointly owned businesses. Namely, women-owned businesses used assistance as additional capital and for family essentials, indicating the wider benefits of reaching women.
12.8
2.230.67
0.21
2.1
1.2
36.423.2
12.5
9.421.4
8.85.8
22.4
68.283.7
86.0
OTHERS
BUYING HOUSEHOLD NECESSITIES
PAYING MARKETING COSTS
PAYING LOANS INSTALLMETN
PAYING WORKERS
AS NEW CAPITAL
AS ADDITIONAL CAPITAL
0 10 20 30 40 50 60 70 80 90 100
JOINTLY-OWNED FEMALE-OWNED MALE-OWNED
Figure 11. The use of business support (multiple answers allowed)
11. The cash grants program (targeted at around 12 million microbusiness—or 20% of the estimated business) itself has been rolled out one month before the surveyed, there is possi-bility that there were some bottleneck in the implementation and also because of the timing of the survey-the assistance started in September 2020.
©U
NIC
EF/
UN
0409
842/
Bea

30 Analysis of the Social and Economic Impacts of COVID-19 on Households and Strategic Policy Recommendations for Indonesia
BOX 5 Indonesia’s support for MSMEs: a comparative view
To ensure small enterprises have enough funds to meet their financial obligations and continue their operations, most countries in the Asia Pacific region have provided substantial amounts of collateral-free or low-interest loans. India, for example, is concentrating its effort in supporting MSMEs by preparing a substantial INR 3 Trillion (1.44% of its 2019 GDP) worth of collateral-free loans reserved for MSMEs in 2020 (OECD, 2020). Indonesia implemented a similar measure in the form of collateral subsidies with a budget of IDR 8.5 trillion (US$ 593.1 million) or 0.06% of its GDP (Kemenkeu, 2020b). Other policies to support small businesses during the pandemic have included credit restructuring or loan repayment deferrals and tax relief.
Indonesia has also provided a direct cash transfer of IDR 2,400,000 (US$ 167) to a target of 12 million MSMEs through the Bantuan Presiden Usaha Mikro scheme, as many of Indonesia’s MSMEs are not yet bankable and rely on informal sources of financing (ILO, 2019; ADB, 2020). (refer to Annex I). This
amounts to a support for 20% of the 60 million microbusinesses in Indonesia. The program relied on a wide range of institutions – microlenders, state-owned banks, and/or local offices of Ministry of Cooperatives and Small Medium Enterprises – to propose names of potential beneficiaries.
The survey results suggest that 6.6% of the households with a family business had received BPUM at the time of the survey (October-November). Such a low reach (approximately one-third of distribution target) could be because the program (started in September) was still in implementation stage at the time of the survey. However, it must be noted that family run businesses are harder to reach because they operate informally and may not be in the record of designated proposers of the program. Notwithstanding, the survey results show that among those who received the program (6.6% of households with family business), 80% put it towards additional capital, as was intended by
program design.
Awareness about business assistance was low.
36.8% of small business owners said they were not aware that government assistance was available. Approximately 12.3% who said they received cash did not know about the program they received it from. This is likely because information about government programs is fragmented and not yet centralised.
At the program level, many programs were delivering as intended and together they helped to reach a large proportion of the population. But there is room for improvement, individually and collectively, to reach more recipients and to expand the benefits for
existing ones, as illustrated by Box 5 on the Village Cash Transfer Program (BLT-DD) and Family Hope Program (PKH). For an overview of results on key programs that were included in the survey, refer to Table 4 in Section 3.9 on policy recommendations.
����������������������������������������������� � �����������������������������
����������������������� ��������������������� ����������������������������
�������������������������������������������������������������������������
Figure 12. Awareness about government assistance

Analysis of the Social and Economic Impacts of COVID-19 on Households and Strategic Policy Recommendations for Indonesia 31
BOX 6 The effectiveness of Village Cash Transfer and Family Hope Programs
To adapt an existing program to meet the challenge
of the times, the government announced the
Village Cash Transfer Program, or BLT-DD, with
a target of reaching 11 million households in rural
areas who were not recipients of other social
assistance programs, such as the Family Hope
Program (PKH) or the Sembako card. Beneficiaries
were entitled to IDR 600,000 (US$ 41.6) per month
from April to June, and IDR 300,000 (US$ 20.8)
per month from July until December (Kemenkeu,
2020c). The funding for this program came from the
Dana Desa (Village Fund) program, which was first
introduced in 2015 with the landmark ratification
of the Village Law, allowing villages to receive a
direct fiscal transfer from the central government
each year to finance their own development efforts
(Kemendes PDTT, 2015).
With COVID-19, villages have been required
by law to use up to 35% of the Dana Desa to
provide social safety nets for poor households.
Villages were granted discretion to determine
the eligibility of households through a two-stage
process: door-to-door visits by at least three people
to identify affected households, and village-wide
meetings to finalise the list of beneficiaries. The
program implementers had to prioritise vulnerable
households that were adversely affected by the
pandemic, including female-headed household and
people with a disability (Bappenas, 2020).
The survey shows that the poor and vulnerable
benefitted most from the program (quintile 1-3).
The program also reached more female-headed
households (21.5%) compared to male headed
(17.3%). 19.6% of households in the bottom 40%
of the expenditure distribution with children also
received BLT- DD funds. These results confirm
that empowering the community to identify
beneficiaries and distribute cash has been an
effective strategy during COVID-19. Such an
approach reduces exclusion errors as local
communities are often in a better position to
identify the impact of the shock on their neighbours
(see JPAL, 2020). Recent qualitative monitoring
shows that village authorities and citizens were
satisfied with the program’s implementation
(Kurniawan 2020).
On the downside, the survey results show that
24.2% of the poorest households in the bottom
40% that live in rural areas did not receive any cash
assistance, including from BLT-DD. This suggests
there is room for BLT-DD to play a larger role in
reaching poor and vulnerable groups who are
suffering from the pandemic but who have not yet
received assistance. Empowering communities to
continue identifying and enrolling those who have
been affected while allowing people to self-register
may assist in expanding the reach of the program.
Increasing the amount of aid distributed through
the flagship social assistance program – the
Family Hope Program (PKH) – was one of the
first measures the Indonesian government took to
cushion the poorest families from the economic
downturn. Existing beneficiaries are entitled to a
25% top-up on their regular transfers and can now
receive monthly instead of quarterly transfers.
As a way of background, the PKH program was
introduced in 2007 to improve health and education
outcomes among the poorest households in the
country. Asset-poor households with children and
pregnant women are entitled to cash transfers
conditional on attending schools and/or health
facilities. More recently, in 2016, poor households
with elderly members and/or persons with disability
are also able to access the program (Kemensos,
2020a).
The amount of the cash transfer depends on the
number of eligible members in the household, with a maximum four eligible members per household (Kemensos, 2020b). For example, a household with a pregnant woman and a child under 5 would be entitled to two transfers of IDR 3,000,000 (US$ 207.9) per year. Households with an elderly member or a member with a disability are entitled to IDR 2,400,000 (US$ 166.3) per year each. For eligible school-age children, the benefit is slightly less, and it varies depending on their age (IDR 900,000 or

32 Analysis of the Social and Economic Impacts of COVID-19 on Households and Strategic Policy Recommendations for Indonesia
2. 3. Children are missing out on education and healthcare
While the health risk from COVID-19 infection has been lower for the 80 million children in Indonesia (approximately 30% of the total population), children’s health, wellbeing, development and future prospects are being changed in profound ways due
to the secondary impacts of the crisis. With a rise in poverty and vulnerability due to the economic recession (World Bank, 2020; BPS, 2021a), children –
as dependents – are among those at greatest risk of seeing their living standards and personal wellbeing decline. School closures since early March 2020 are leaving nearly 60 million students to learn from home. Disruptions to essential health services have been rampant. While all children, of all ages, are being affected, existing inequalities are likely to be exacerbated by the socio-economic impacts and the measures to suppress transmission and control the pandemic (UNICEF, 2021a).
BOX 6 The effectiveness of Village Cash Transfer and Family Hope Programs
US$ 62.38 to IDR 1,500,000 or US$ 103.9). Hence, the maximum amount of benefit received by a household is IDR 10,800,000 per year (US$ 748.1).
The survey results show that 33% of the poorest households (quintile 1) benefitted from the program. Figure 13 presents simulated additional benefits received by beneficiaries of the PKH program during the pandemic. The value of top-up has been calculated as 25% of the amount of yearly benefit/eligible members in the household and it puts a cap on 4 eligible members per household. The results suggests that around 94% of the program beneficiaries received up to IDR 2,000,000 (US$ 138.6) and the remaining 6% received between IDR 2,000,000 to IDR 2,700,000 (US$ 138.6) as additional benefit in 2020.
All cash transfer programs are meant to provide the same level of benefit to all recipients, irrespective of the source. However, our simulation suggests that the additional benefit that PKH recipients received in response to COVID-19 was less than the amount received by beneficiaries of other COVID-19 response programs, such as BLT DD or BST, who were entitled to a total transfer of IDR 3,600,000 for 9 months, between April and December 2020. Our simulation supports earlier findings from another study (Hastuti et al. 2020).
Considering that PKH beneficiaries are among the poorest households and they are not allowed to access cash from other COVID-19 response schemes so as to prevent duplication, this is a less than ideal outcome. Indeed, the survey shows that a negligible proportion of PKH beneficiaries received any other cash transfers.
Future reforms may consider at least equalising the benefits between PKH and other beneficiaries. This can be achieved by either increasing the additional benefit offered to PKH beneficiaries during this period which is regressive against the number of eligible members in the household and/or allowing PKH beneficiaries to also receive other cash assistance.
Figure 13. Estimation of additional cash transfer PKH beneficiaries received during
the pandemic (%).
26.9 %
31.8 %
35.3 %
6.1 %
LESS THAN IDR 500.000 BETWEEN IDR 500.000 AND 1.000.000BETWEEN IDR 1.000.000 AND 2.000.000 BETWEEN IDR 2.000.000 AND 2.700.000
Source: calculated from the 2020 household survey

Analysis of the Social and Economic Impacts of COVID-19 on Households and Strategic Policy Recommendations for Indonesia 33
The survey results show that most households (75.3%) who have children have experienced a
reduction in income. Such sudden loss of household income is concerning because it can exacerbate child poverty and impoverishment. According to UNICEF’s 2019 estimates, even prior to the crisis, 13% of children and adolescents were living in poverty (UNICEF, 2020a). Nine of every 10 children were already experiencing deprivation in at least one dimension of child well-being, such as: lack of access to food and nutrition, health, education, housing, water and sanitation and child protection. According to UNICEF’s new estimates in 2020, child poverty may increase significantly (by 2.1 million children) if emergency support measures are rolled back in 2021 (UNICEF, 2021a).
A recent study jointly carried out by UNICEF Indonesia and Fiscal Policy Agency, Indonesian Ministry of Finance (2021) finds that without temporary expansion of the social protection system, average child poverty would have risen by 14%. While all social assistance programs have helped, the Family Hope Program has had the greatest impact (approximately 60% according to the simulated results), in large part due to child-specific targeting criteria.
Almost three in four parents are concerned about learning loss due to disruptions to their children’s
education. This is likely to be indicative of parental concerns that their children would not be able to meet grade level knowledge and skill expectations due to long periods of missed or inadequate learning. Even prior to the pandemic, a global study in 2018 carried out by the OECD (2019), had estimated that approximately 70% of 15-year-old students in Indonesia had not achieved minimum proficiency in reading and mathematics. Furthermore, prolonged school closures threaten to derail the strong progress Indonesia has made in school enrolment over the past decade and further exacerbate the learning crisis (UNICEF, 2020a).
Six months into the pandemic, the survey found that 3.45% of households had one or more children
who had dropped out of school. The main reasons for dropping out were inability to pay for school (31%)
and lack of interest in schooling (30%). These findings are complemented by results of a separate large-scale survey conducted by UNICEF and the Ministry of Villages, Development of Disadvantaged Regions and Transmigration on the impact of COVID-19 on school children from September to December 202012. Out of more than 82,000 poor families with children aged 7-18, just over 1% had dropped out but 3 out of 4 children who were still enrolled experienced at least one risk factor that could push them to drop out in the short term. For instance, more than 50% of these school children were doing additional, unpaid work to help their families. Gender and disability status of the children mattered. Girls were ten times more at risk of dropping out of school than boys due partly to a rise in early marriage. As the COVID-19 pandemic had limited their opportunities to obtain adequate learning support according to their needs, children and adolescents with disabilities faced three times higher a risk of drop out as compared to their counterparts with no disability.
Survey results show that access to reliable internet
was a major constraint to learning. A significantly higher proportion of households with children (65%) are spending more on cell phone credit/internet packages compared to households without children (28.9%). This is likely because of the added expense of online learning. And yet 57.3% reported they do not have reliable internet. Even among the top 20% of the consumption group of households who have children, 36.6% of them say they have limited internet access. Many also do not have the necessary devices (18%) or must take turns to use them (15.8%).
Rural and poorer households faced more internet problems and device constraints than their urban
and wealthier counterparts. Around 23% of the bottom 40% of households do not have the necessary device, while for the top 20% of households the percentage is as low as 8%, signaling a rather significant gap.
12. The monitoring was carried out in 1,151 villages across 354 districts of 33 provinces in Indonesia (2021a in 2021).
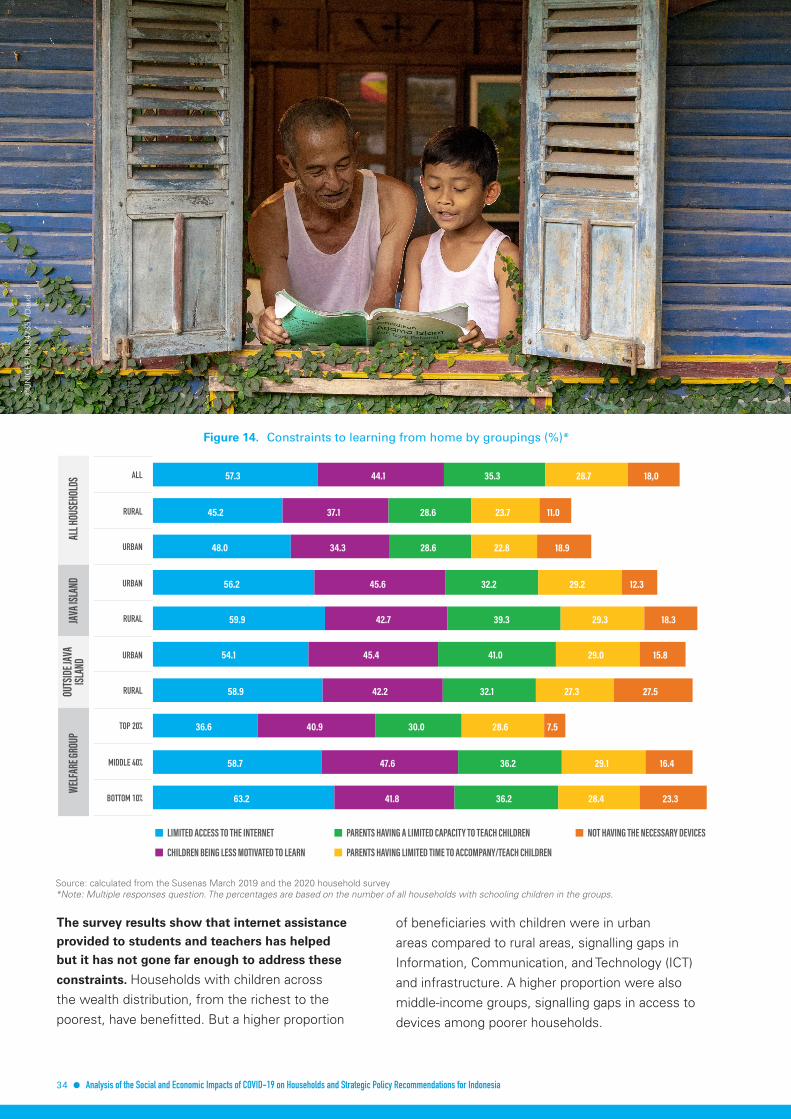
34 Analysis of the Social and Economic Impacts of COVID-19 on Households and Strategic Policy Recommendations for Indonesia
The survey results show that internet assistance provided to students and teachers has helped but it has not gone far enough to address these
constraints. Households with children across the wealth distribution, from the richest to the poorest, have benefitted. But a higher proportion
of beneficiaries with children were in urban areas compared to rural areas, signalling gaps in Information, Communication, and Technology (ICT) and infrastructure. A higher proportion were also middle-income groups, signalling gaps in access to devices among poorer households.
������������������������������
��������������������������������������
�������������������������������� ������������������ ����������������������� ��������
��������������������������������������� ���������������
�����
�����
�����
�����
�����
�����
�����
�����
�����
�����
�����
�����
�����
�����
�����
�����
�����
�����
�����
�����
�����
�����
�����
�����
�����
�����
�����
�����
�����
�����
�����
�����
�����
�����
�����
�����
�����
�����
�����
�����
�����
�����
����
�����
�����
�����
�����
�����
�����
�����
MIDDLE 40%
BOTTOM 10%
TOP 20%
RURAL
URBAN
RURAL
URBAN
URBAN
RURAL
ALL
����
�������
�����������
������
�����������
�������������
Figure 14. Constraints to learning from home by groupings (%)*
Source: calculated from the Susenas March 2019 and the 2020 household survey*Note: Multiple responses question. The percentages are based on the number of all households with schooling children in the groups.
©U
NIC
EF/U
NI3
4735
1/D
aud
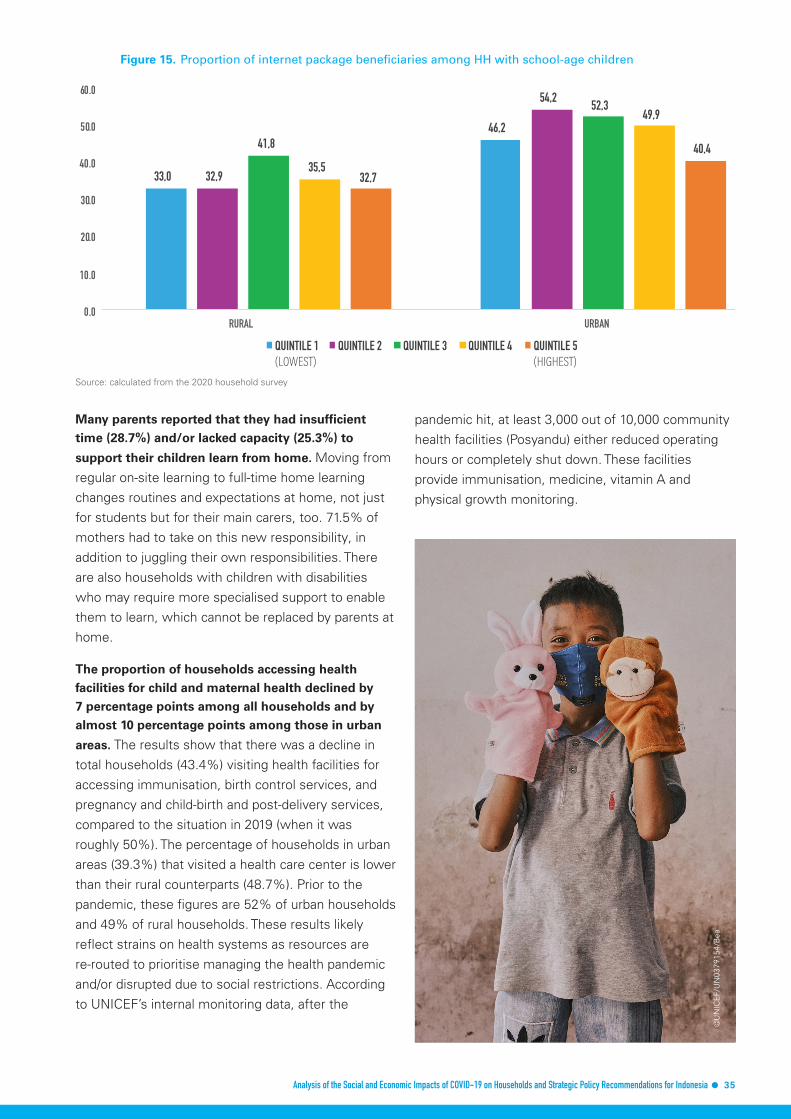
Analysis of the Social and Economic Impacts of COVID-19 on Households and Strategic Policy Recommendations for Indonesia 35
Many parents reported that they had insufficient time (28.7%) and/or lacked capacity (25.3%) to
support their children learn from home. Moving from regular on-site learning to full-time home learning changes routines and expectations at home, not just for students but for their main carers, too. 71.5% of mothers had to take on this new responsibility, in addition to juggling their own responsibilities. There are also households with children with disabilities who may require more specialised support to enable them to learn, which cannot be replaced by parents at home.
The proportion of households accessing health facilities for child and maternal health declined by 7 percentage points among all households and by almost 10 percentage points among those in urban
areas. The results show that there was a decline in total households (43.4%) visiting health facilities for accessing immunisation, birth control services, and pregnancy and child-birth and post-delivery services, compared to the situation in 2019 (when it was roughly 50%). The percentage of households in urban areas (39.3%) that visited a health care center is lower than their rural counterparts (48.7%). Prior to the pandemic, these figures are 52% of urban households and 49% of rural households. These results likely reflect strains on health systems as resources are re-routed to prioritise managing the health pandemic and/or disrupted due to social restrictions. According to UNICEF’s internal monitoring data, after the
pandemic hit, at least 3,000 out of 10,000 community health facilities (Posyandu) either reduced operating hours or completely shut down. These facilities provide immunisation, medicine, vitamin A and physical growth monitoring.
33,0
46,2
32,9
54,2
41,8
52,3
35,5
49,9
32,7
40,4
0.0
10.0
20.0
30.0
40.0
50.0
60.0
RURAL URBAN
QUINTILE 1��������
QUINTILE 2 QUINTILE 3 QUINTILE 4 QUINTILE 5 ���������
Figure 15. Proportion of internet package beneficiaries among HH with school-age children
Source: calculated from the 2020 household survey
©U
NIC
EF/U
N03
7915
4/B
ea
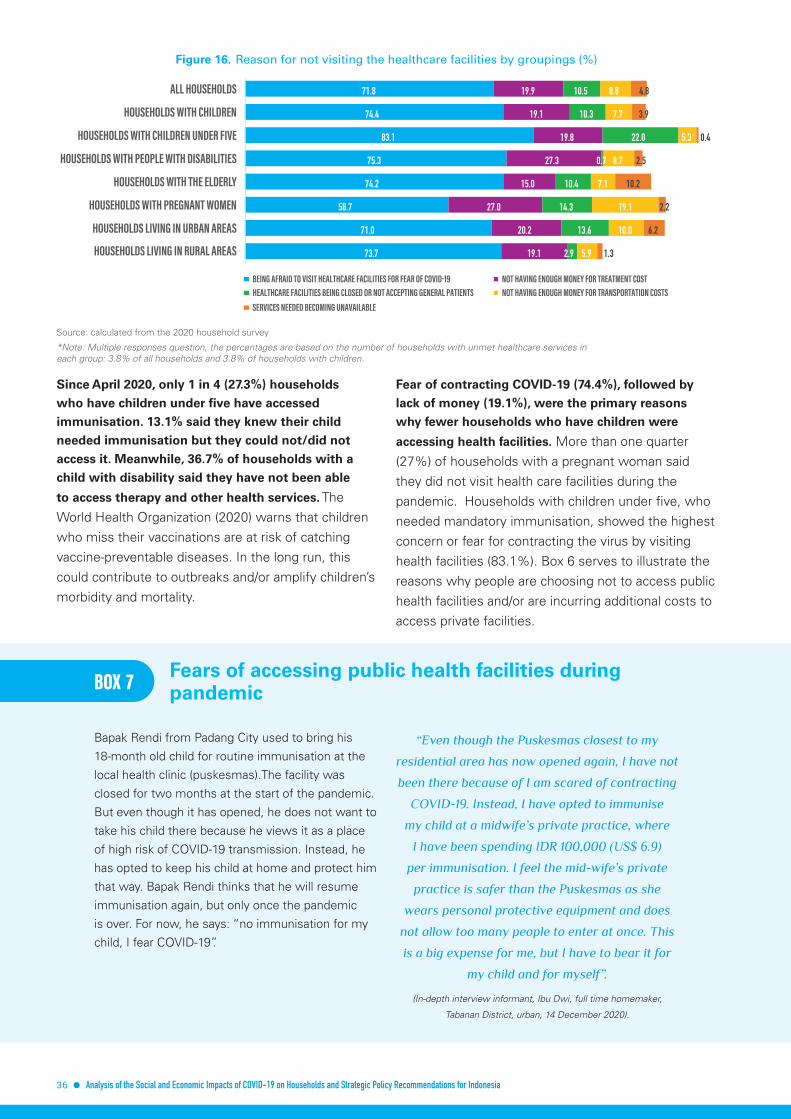
36 Analysis of the Social and Economic Impacts of COVID-19 on Households and Strategic Policy Recommendations for Indonesia
BOX 7 Fears of accessing public health facilities during pandemic
Bapak Rendi from Padang City used to bring his
18-month old child for routine immunisation at the
local health clinic (puskesmas).The facility was
closed for two months at the start of the pandemic.
But even though it has opened, he does not want to
take his child there because he views it as a place
of high risk of COVID-19 transmission. Instead, he
has opted to keep his child at home and protect him
that way. Bapak Rendi thinks that he will resume
immunisation again, but only once the pandemic
is over. For now, he says: “no immunisation for my
child, I fear COVID-19”.
“Even though the Puskesmas closest to my
residential area has now opened again, I have not
been there because of I am scared of contracting
COVID-19. Instead, I have opted to immunise
my child at a midwife’s private practice, where
I have been spending IDR 100,000 (US$ 6.9)
per immunisation. I feel the mid-wife’s private
practice is safer than the Puskesmas as she
wears personal protective equipment and does
not allow too many people to enter at once. This
is a big expense for me, but I have to bear it for
my child and for myself”.
(In-depth interview informant, Ibu Dwi, full time homemaker,
Tabanan District, urban, 14 December 2020).
Since April 2020, only 1 in 4 (27.3%) households who have children under five have accessed immunisation. 13.1% said they knew their child needed immunisation but they could not/did not access it. Meanwhile, 36.7% of households with a child with disability said they have not been able
to access therapy and other health services. The World Health Organization (2020) warns that children who miss their vaccinations are at risk of catching vaccine-preventable diseases. In the long run, this could contribute to outbreaks and/or amplify children’s morbidity and mortality.
Fear of contracting COVID-19 (74.4%), followed by lack of money (19.1%), were the primary reasons why fewer households who have children were
accessing health facilities. More than one quarter (27%) of households with a pregnant woman said they did not visit health care facilities during the pandemic. Households with children under five, who needed mandatory immunisation, showed the highest concern or fear for contracting the virus by visiting health facilities (83.1%). Box 6 serves to illustrate the reasons why people are choosing not to access public health facilities and/or are incurring additional costs to access private facilities.
73.7
71.0
58.7
74.2
75.3
83.1
74.4
71.8
19.1
20.2
27.0
15.0
27.3
19.8
19.1
19.9
2.9
13.6
14.3
10.4
0.7
22.0
10.3
10.5
5.9
10.0
19.1
7.1
8.7
5.3
7.7
8.8
1.3
6.2
2.2
10.2
2.5
0.4
3.9
4.8
��������������������������������
��������������������������������
��������������������������� ��
���������������������������
����������������������������������������
����������������������������������
������������������������
��������������
���������������������������������������������������������� ������������������ ������������� ��������������������������������������������������������������������������� ������������������ ������������������������������������������������ ���������������
Figure 16. Reason for not visiting the healthcare facilities by groupings (%)
Source: calculated from the 2020 household survey
*Note: Multiple responses question, the percentages are based on the number of households with unmet healthcare services in each group: 3.8% of all households and 3.8% of households with children.

Analysis of the Social and Economic Impacts of COVID-19 on Households and Strategic Policy Recommendations for Indonesia 37
School closures, social isolation combined with economic uncertainties are also exposing children to other risks, including mental health concerns.
This survey found that 45% of households reported behavioural challenges among their children. Among them, 20.5% said children are finding it harder to concentrate; 12.9% are becoming angry or rebellious more often; 7% are becoming sad or moody more often; 6.5% are finding it difficult to sleep. About 7.15% households reported to have at least one child who is working. Out of these, 2.5% had started working since the pandemic (April 2020).
2. 4. Women are taking on additional caring responsibilities
School closures during the past year have put an additional strain on women’s time. In 71.5% of the households, mothers are the primary carers who support their children in remote learning, whereas
this figure was only 23.4% for fathers. Half of these women are also engaged in paid work to support their families. They are struggling to find a balance between work and additional responsibilities posed by school closures. A more problematic situation may be faced by 62.3% of mothers who have junior-high school or lower education. They may be less aware of what is required for children to engage in effective distance learning.
The following reflects the challenges women with young children face:
Figure 17. Main carer supporting children with remote learning (%)
OTHER MALE ADULTSIN THE HOUSEHOLD
RELATIVES/NEIGHBORSNOT IN THE HOUSEHOLD
OTHER FEMALE ADULTSIN THE HOUSEHOLD
CHILDREN STUDYINGUNACCOMPANIED
OLDER BROTHERS/SISTERS
FATHERS
MOTHERS
4.1
4.7
8.1
18.1
18.5
23.4
71.5
- 10,0 20,0 30,0 40,0 50,0 60,0 70,0 80,0
Source: calculated from the 2020 household survey
“During the mornings, I am an emotional wreck. I have
to cook for the whole family, bathe the little one (baby),
mop, sweep, clean the house, wash the clothes. On top
of this, I have to also help my older child to learn online
while carrying the little one.”
(In-depth interview informant, Ibu Dwi, full-time mother, Tabanan Regency,
urban, 14 December 2020).
These results are understandable because domestic responsibilities are strongly perceived as women’s responsibilities, and women assume the lion’s share of these, particularly in households headed by men (see Figure 18 below). 59.1% of female-headed households reported that they do majority of house chores while in male headed houses, 75.5% of the spouse (or women) said they do more chores than their spouse. This comparison between male and female-headed households reflects the imbalances in gender distribution of unpaid and domestic work by gender of the household head. Furthermore, only 11.4% of all households viewed that chores should be divided evenly.

38 Analysis of the Social and Economic Impacts of COVID-19 on Households and Strategic Policy Recommendations for Indonesia
With less income, fewer opportunities for social contact, and higher burden due to prolonged school closures, 8.6% of households report that they
experience conflict in the home since April 2020. Among them, 37.5% say they have more conflict with their spouse and 23.5% with their children. 39.4% of male-headed households report experiencing more conflict with their spouse. Meanwhile, 36.1% of female-headed households report conflict with children.
“Since the pandemic, my husband and I argue more
than we had done in the past. My husband feels that
the food I serve during meal-times is monotonous, and
he is bored of eating the same thing. But I do not have
enough money to buy food that he likes”
(In-depth interview informant, Ibu Yohana, housewife & part-time seller,
East Flores, rural, 4 December 2020).
“My husband rarely helps our child study because he
goes to work and only returns home at night. I am the
one who enforces discipline to keep our child motivated
to study. After the homework is done, then I allow
my child to play. Yet my husband spoils our child and
undermines my authority”
(In-depth interview informant, Ibu Meri, housewife, Bone, rural,
11 November 2020).
Figure 18. Who should do domestic chores and who has done more domestic chores (%)*
Source: calculated from the 2020 household survey
*Note: Single responses question, the percentages are based on the number of households in the groups.
59,1
53,9
7,7
6,0
15,1
12,9
12,9
15,3
75,5
74,8
66,6
66,3
4,4
3,1
1,2
1,1
1,6
1,3
11,5
13,4
5,2
4,4
6,1
5,7
7,0
11,0
7,0
11,5
7,0
11,4
5,1
3,4
3,4
2,2
3,7
2,4
- ����� ����� ����� ����� ����� ����� ����� ����� ����� ������
������� �� �������� �
������� �� �������� �
������� �� �������� �
�������� �������� ��� �
���� ������ ��� ���� ������ ���������� � �������������������������������������������� � ����� �� � ��������������� �� � ��� ����� ������ �� �
�������� �������� ��� �
�������� �������� ��� �
���� �� �� �
���� �����
� ��� �� �� �
���� �����
�����
���� �����
These challenges are leaving around 1 in 5 (19.7%) female-household heads more unhappy, stressed,
and even depressed, compared to 16.8% of male-headed households. Most (60.6%) female household heads stated that the main reasons for their emotional state are ‘money and job issues’, worries about being infected with COVID-19 (49%), and about their children’s development and education (10%). Helping children study does not only require time but also capacity in teaching school material and assignments. Despite increased anxiety, there is low use of formal support. Almost 4 in 5 (79.4%) households reported experiencing anxiety and seeking moral support or counselling from family or relatives, while only a small share of respondents seek support from medical professionals, such as health workers/doctors (4.5%) and psychologists or psychiatrists (0.5%).
2. 5. Food insecurity among vulnerable groups is an emerging concern
During the past year, the proportion of households
facing food insecurity has gone up. Almost one-third (30%) of respondents worried they could not feed their families.
The proportion of families facing ‘moderate or
severe’ food insecurity has doubled: 11.7% of households experienced ‘moderate’ food insecurity

Analysis of the Social and Economic Impacts of COVID-19 on Households and Strategic Policy Recommendations for Indonesia 39
(such as reducing their quality of food or eating less healthy or less varied food) or ‘severe’ food insecurity (such as going an entire day without eating) since April 2020. That compares with only 5.4% in 2019 (based on BPS’s FIES calculation). Households that included a member with a disability were at greatest risk of facing food insecurity (15%), followed by households headed by women (14%) ,and those with children (12.6%). Location wise, food insecurity was most prevalent in urban areas and in the eastern part of Indonesia.
�����
����������
�����
����
���� ���� ���� ���� ����
���������� ���������� ���������� ���������� ����������� ���� ����
� ��������������� ������
Figure 19. Proportion of households facing ‘moderate or severe’ food insecurity*
Figure 20. Proportion of households facing ‘moderate or severe’ food insecurity*
Source: calculated from the Susenas March 2019 and the 2020 household survey
*Note: This is a rough estimate based on survey results. There are methodological differences between 2019 BPS estimate. In Susenas March 2019, the time frame is “in the last 12 months” while in the 2020 survey, the time frame is between April and October/November 2020.
Households towards the middle of the income distribution were the most likely to report moderate
or severe food insecurity. 15.7% of households in quintile 2 and 13.5% of those in quintile 3 reported ‘moderate or severe’ food insecurity, compared with 11.7% of the poorest. These results are confirmed by regression results (Annex VII) which suggest there is a significant positive correlation between these groups and the prevalence of ‘moderate or severe’ food insecurity.
Source: calculated from the Susenas March 2019 and the 2020 household survey *Note: based on quintiles
FOOD INSECURITY Experience Scale (FIES)SURVEY MODULE (FAO)
5,4
11,7
0
2
4
6
8
10
12
14
SUS ENA S Ma rch 2 019 Sur vey Octob er /N ovemb er 2 020
Light
Moderate
severe
1 WORRIED2 UNHEALTHY3 FEWER FOOD
4 SKIPPED MEAL
5 ATE LESS
6 RAN OUT7 HUNGRY8 WHOLE DAY WITHOUT
Q# FIES Indicator
5.4 %
2019 (MAR) 2020 (oct/nov)
11.7 %

40 Analysis of the Social and Economic Impacts of COVID-19 on Households and Strategic Policy Recommendations for Indonesia
Income shocks and disruptions to food supply are
the main factors contributing to food insecurity. Income shocks have pushed households to reduce and/or change their allocation of consumption, and those in the most desperate conditions are most likely to reduce their food expenditure. Although more households choose to reduce non-food expenditure (26.4%), 18% have had to reduce food expenditure as a strategy to cope with hardship.
Disruptions to supply are likely to be a contributing factor. One of the factors that shows a significant positive correlation with food insecurity is a reduction of mobility, as measured by Google mobility data. This suggests that as mobility becomes more restricted due to large-scale social restrictions (Pembatasan Sosial Berskala Besar/PSBB), food insecurity increases. Second, the prevalence of food insecurity is more significant in eastern Indonesia, but less so in Java and Bali, possibly because the eastern provinces are heavily dependent on food supplies from other islands. [For more information on the regression results, see Annex VII]. A joint World Food Program and Government of Indonesia study confirms that existing challenges to supply chains of nutritious,
yet highly perishable food have been exacerbated by movement restrictions aimed at limiting the spread of the virus (WFP, 2020).
A higher proportion of households who have children are facing ‘moderate to severe’ food insecurity
(12.6%) than the general population (11.7%). Rapid impoverishment of households and children can have a tremendous impact on household food security by limiting the accessibility, availability, and affordability of healthy food items. This can lead to a surge in wasting and micronutrient deficiencies among children. Undernutrition and wasting increases the risk of children experiencing developmental problems throughout their lives and/or premature death. Prior to the pandemic, more than 7 million children under five were estimated to be stunted, placing Indonesia fifth in the world for child stunting. More than 2 million children under five were suffering from severe wasting (low weight for height) (UNICEF, 2020b). Before the pandemic, Indonesia had begun to reduce persistent stunting, falling from 37.2% in 2013 to 27.7% in 2019 (see: dashboard.setnas-stunting.id). Cumulative conditional cash transfers had successfully contributed to the decline (Cahyadi et al 2020). But these gains could be at a risk of being reversed.
©U
NIC
EF/U
NI3
2916
7/Ija
zah

Analysis of the Social and Economic Impacts of COVID-19 on Households and Strategic Policy Recommendations for Indonesia 41
BOX 8 “Hunger Won’t Kill Us, Bear with It”
Ibu Bunga has a two-year old son who has lost weight because the family has had to cut back spending on food to cope with the income losses they have suffered during the pandemic. In September 2020, after a few months of re-adjusting their family’s finances and reducing their expenses on food, Ibu Bunga’s son was identified as ‘at risk of stunting’ by healthcare staff at the local integrated health service post (Posyandu). His weight was significantly below what is expected for children of his age.
Ibu Anita’s family has undergone a severe food crisis since the pandemic to the extent that they have had to skip meals consecutively. Ibu Anita’s 12-year old daughter often complains that she is starving and that she cannot concentrate while studying at home. Ibu Anita tries to negotiate with her by offering food in exchange for assignment completed. But even then, she cannot always deliver on her promise. Ibu Anita described how she consoles her daughter:
“Before the pandemic, she used to drink formula
milk. But now, we cannot afford to give her
anything other than sweetened condensed milk. I
know it has too much sugar. She often complains
of tooth aches. I feel helpless, but I don’t feel like I
have a choice”
(Ibu Nisa, mother of a toddler, Serang, 10 December 2020).
“You are not a child anymore; you are almost 12
years old. Hunger won’t kill us, bear with it.”
(Ibu Anita, female-headed household, North Jakarta, 2 December
2020).
The survey shows that the proportion of households with persons with disabilities that experienced income loss (76.5%) was similar to what was
observed in the general population. However, they were less well-off compared to the general population surveyed as they had a slightly lower percentage of working breadwinners (89% compared to 91%); a half (50.6%) of households with a person with a disability did not have any savings. According to the survey, only 11.1% of households with a person with a disability reported that their needs have been met in contrast with the national average of 15%. 15% of households with a person with a disability said they had experienced ‘moderate or severe’ food insecurity since April 2020, which is higher than the national average of 11.7%. These findings are in line with other surveys on the economic impact of the pandemic on persons with disabilities (e.g. Mahkota and KOMPAK, 2020; J-PAL, 2020).
The impacts varied according to the level of disability (mild, moderate or severe), with more households with a member with ‘mild’ disability facing job and income loss compared to those with moderate or
severe disability. The survey finds that one in 10 (9.12%) households who had a member with mild
disability lost their job due to COVID-19 (which is between 5-6 percentage points higher than those with moderate or severe disability) and more than eight out of 10 (83.7%) had experienced a decrease in income since the start of the pandemic. The latter figure is more than 10 percentage points higher than those with moderate (70%) or severe disability (66.5%). This is concerning because, in 2019, households with a ‘mild’ disability had better labour force participation rates and were economically better off than households who had a member with severe disability (Prospera’s analyses, presented to Fiscal Policy Agency, December 2020).
Households who have members with disabilities said that the most significant disruptions they experienced as a consequence of COVID-19 were access to health services (14.5%) followed by daily
activities (13.18%). For those with mild disabilities, daily activities were the most disrupted, whereas for those with moderate and severe disabilities it was access to health. 60% of all households with disabilities said they did not experience any change due to COVID-19. This likely indicates that many of them were not accessing any support to begin with.

42 Analysis of the Social and Economic Impacts of COVID-19 on Households and Strategic Policy Recommendations for Indonesia
BOX 9 Children in need are missing therapy
Ibu Kasih has a child who needs routine physical therapy for his leg and vitamins to strengthen his bones as he grows. Prior to COVID-19, Ibu Kasih would take him for monthly physical therapy using the ‘Indonesian Health Card’. But since the onset of the pandemic, she has had to interrupt these visits because she has less money to pay for them than she did before. She also fears her son might contract the virus if he resumes therapy in person. The special
pair of shoes that he was using is also damaged. She had planned to replace them five months ago, but she has had to postpone the purchase because she does not have the funds for it. These interruptions are affecting her child’s mobility. He often complains about pain and is unable to walk for long.
(In-depth interview, Ibu Kasih, full time homemaker, Kulon Progo,
rural, 18 December)
More female-headed households (56.7%) said they do not have savings to cushion the impact of the
crisis than their male counterparts (50.6%). Female-headed households fare relatively worse than those headed by males across many of the indicators the survey uses to assess the economic impacts of COVID-19. Women-headed households had less primary breadwinners who were working (89.8%) in the past week than the general population (91.2%). A higher proportion of women-headed households (86.3%) said their basic needs were not being met compared with households headed by men (84.4%). The survey results also show that 14% of female-headed households were facing ‘moderate to severe’ food insecurity; this compares with 11.4% for households headed by men.
In almost 20% of all households interviewed where women were the primary breadwinners, slightly more experienced income loss (75.1%) compared with households with male breadwinners (74.2%).
This is because more women were working in informal jobs (60%) than men (56%). Among male and female breadwinners who worked as employees or casual workers, both experienced roughly similar levels of job loss because of the pandemic (7%).
These results lend support to new global analyses commissioned by UN Women and Women Count (2020) estimating that 435 million women and girls will be living on less than US$ 1.90 a day. This includes 47 million who will be pushed into poverty.
©U
NIC
EF/U
NI3
2914
5/Ija
zah

Analysis of the Social and Economic Impacts of COVID-19 on Households and Strategic Policy Recommendations for Indonesia 43
3. Strategic policy recommendations
3. 1. Support children more
Ensure children continue to learn. Considering the gravity of learning loss experienced by children (see Section 2.2), support schools to gradually and safely open (with infrastructure and know-how) and offer hybrid learning. As the access to internet and devices is still a challenge, continuing internet supplement for teachers and students and scaling up no-tech and low-tech solutions for home learning would provide meaningful support for children. Consider rolling out “skills boost programs” to recover learning loss, particularly in early years and for children with disability, and couple this with a mass socialisation campaign for children to return and complete school.
Offer social protection solutions to support households to cover their needs and care for
children. These include maintaining increases in coverage and transfer values of social assistance programs during the pandemic such as PKH and BLT-DD to reach all households with children living in affected households. Other measures include continuing to temporarily relax conditionalities in PKH during the pandemic such as school attendance and visits to health facilities as well as accelerating the integration of PKH-PIP program to help children from poor and vulnerable backgrounds to continue learning. Lastly, formalise the link between cash recipients and complementary programs, such as Kartu Sembako, to ensure households with children can cover the nutritional needs of children.
Another option could be the rolling out of universal and unconditional child-specific benefits (or UCBs), as at least a temporary solution to mitigate the worst immediate effects of the crisis. The survey results shed light on the widespread and unprecedented effects of the crisis. Even households with children who were previously economically secure and living
in urban areas, have now experienced significant income reduction and are at a higher risk of food insecurity. While the social impact would have been far worse had it not been for government assistance, many households that needed cash did not receive it. UCBs are cash or tax transfer paid to household with children. The design details of specific child benefits, and the broader tax-transfer systems within which they operate, incorporate varying degrees of universalism and selectivity that influence how benefits work in practice and their impact (see: UNICEF & ODI, 2020). .
Several countries in the Asia-Pacific region have already incorporated child-specific benefit as a part of their broader package of support in response to the pandemic. For example, Thailand provided a monthly emergency fund of THB 1,000 (US$32) as a top-up to the existing Child Support Grant (launched in 2015 for under 6 old children) between May and July 2020 (UNICEF, 2020d). The Government of Bhutan has released a benefit amount of BTN 12,000 (US$ 165.7) per person per month, and an additional monthly benefit of BTN 800 (US$ 11) per child is granted to beneficiaries with children (UNICEF & IPC-IG, 2020). After the pandemic hit, Mongolia increased its child benefit funds (The Child Money Programme) by 400% starting from the 1st April to 1st October 2020 (from MNT 20,000 or US$ 7 to MNT 100,000 or US$ 35). The scheme has reached 1.1 million children.
Keep children healthy and nourished. Prioritise continued delivery of life-saving vaccines and medicines to protect children from disease and work with logistics networks to address any bottlenecks to mitigate delivery of supplies (See Section 2.2). In the context of growing food insecurity (see Section 2.4), minimising disruption to nutrition services and community programs for early detection and treatment of wasted children is also essential for

44 Analysis of the Social and Economic Impacts of COVID-19 on Households and Strategic Policy Recommendations for Indonesia
children’s overall health. A mass campaign to promote healthy diets and strengthen immune systems could be considered, together with the roll out of a ‘health boost’ program in 2021/22 with mobile clinics to recover missed immunisations, nutrition supplements, family planning, and mental health.
Protect children from violence, abuse, and stress by including mental health services for parents and children as a part of public health responses to the COVID-19 crisis (See section 2.2). Local authorities can also play a role and thus they need to be equipped with necessary resources and expertise to strengthen child protection systems and prevent and respond to violence, exploitation, and abuse.
3. 2. Expand food assistance and reduce supply chain disruptions to combat food insecurity
Enlarging the benefit of Kartu Sembako based on number of children, elderly, and persons with disabilities in the households, and accompanying cash transfers with health promotion, including nutritious food, would help the affected households amid heightened food insecurity. Other options include repeating the PKH’s “Family Development Session” nutrition module and rolling out nutrient surveillance at the local level and focusing on children. On the supply side, interventions are needed to ensure that food is available and affordable. Some examples are monitoring supply and price of staple foods to guide policy responses; working with logistics networks to mitigate against supply disruptions from COVID-19 restrictions; supporting farmers to continue production, etc.
3. 3. Maintain support to lower-middle and middle-income groups who are now poorer and vulnerable
The survey results show that most households have faced earning losses. In such a dynamic situation, it is imperative to continue identifying and enrolling affected households in social assistance and labour market programs. Such new households could be
identified through on-demand application, community targeting and then validated through the civil registry and non-conventional data sources such as mobile phones, electricity, bank account (Karina, 2020).
The government of Indonesia has made its best possible efforts, given the unprecedented scale of the crisis, to introduce policy measures to help workers keep their jobs while the pandemic is ongoing, combined with measures to encourage job creation and ease adjustment to new jobs as the pandemic subsides. These have included measures to curb the spread of the virus by supporting teleworking for workers when possible and requiring stricter health and safety standards in workplaces; a wage subsidy program (Bantuan Subsidi Upah) for workers who have been furloughed or experienced pay cuts; and reskilling and upskilling through its flagship Kartu prakerja Program, which is also a double-track measure to distribute unemployment benefits to informal and self-employed workers affected by COVID-19.
These measures are in line with good policies implemented globally and in peer countries to dampen the negative impact and encourage a speedier labour market recovery (Bluedorn 2021). Some additional considerations for workers in the formal sector could include extension or increased paid sick-leave entitlement to allow workers to self-isolate (such as in South Korea, US, France); regulations to restrict collective or individual dismissals (Turkey, Spain and France). Job search and job placement measures could also be an avenue for reaching out to Indonesia’s informal workers and/or supporting transition to the formal sector in the aftermath of the crisis. France, Germany and Netherlands are examples of countries that have introduced online tools to connect displaced workers with vacancies and/or promoted existing online job-matching platforms (ILO& OECD, 2020). Finally, workers who need to care for children and/or other family members can be supported by extending parental leave (for formal sector workers) or safe and affordable childcare services to those who need them (ILO & OECD, 2020). Refer to Annex VIII for more information.
Analysis of the Social and Economic Impacts of COVID-19 on Households and Strategic Policy Recommendations for Indonesia 45
3. 4. Continue assisting family businesses to recover
This could involve continuing business grants program (such as BPUM) for family business as they are less likely to take out loans due to uncertainty. Such programs can be bolstered by allowing eligible businesses to self-register through on-demand applications to make themselves known. Linking business grant recipients with other complementary programs that they need will make the support more holistic. Examples of support could be additional capital on favourable terms; wraparound business support; access to new markets to offset supply and demand disruptions due to the pandemic. Ensuring women-owned businesses can equally access and benefit from support would be critical.
3. 5. Reduce women’s care burden
Gradually and safely opening schools could be a win-win for both children and the mothers who have had to act as substitute teachers during school closures and/or balance motherhood and paid work. Rolling out campaigns involving well-known men who can act as “champions of change” may also encourage the equal sharing of housework. While schools remain closed and/or hybrid learning is offered, equipping parents with the skills and support they need to successfully support their children would be important. Offering mental health support could be a part of the support that is made available.
3. 6. Ensure people with disabilities can access health and care services
People with disabilities and their families can be supported through specific social programs that are targeted at them, and through top-ups to mainstream programs. The current disruptions to health services experienced by adults and children with disability could be addressed by ensuring continuity of services and support, adapting alternative modalities for provision of healthcare, such as through home visits programs. Engaging with organisations representing people with disabilities would help to assess their specific needs and deliver assistance more effectively.
3. 7. Link new registrations for social assistance into single database for future targeting
The roll-out of various government programs provided a valuable opportunity for data collection which can serve as an initial data source to update Indonesia’s existing unified database (DTKS).
For this purpose, some measures to consider include: integrating the data of beneficiaries of cash transfer programs (BPUM, BLT-DD, Kartu prakerja) who have not been recorded in DTKS into DTKS; and matching this additional data with administrative records (e.g., PLN customers data). Another important aspect of unified database creation is the development rules and guidelines to collect standardised information needed for future interventions. These could include additional data on children’s education and health and employment. Lastly, ensuring that other databases (such as new micro business registry, database of all people with disabilities) include household and individual identifiers would be useful for data merging purposes in the future.
3. 8. Promote greater understanding of government support
Given the low awareness of the support available to beneficiaries, consider developing a user-friendly medium13 with up-to-date information about social assistance and business support programs. Four central functions of such a medium could be: (1) disseminate – disseminate information using social media and helpline; (2) engage: add “ask me” feature to respond to common inquiries and use agents to personalise response; (3) coordinate: socialise all social assistance program facilitators to share up-to-date information to beneficiaries; and (4) voice – allow potential beneficiaries to register their needs; apply for specific programs; share grievances. Such a medium could be made accessible to people with disability, by ensuring that information provided is clear and concise, font style is appropriate, sign language interpretative services are included, and captioning videos are available.
13. Toll-free interactive voice response (IVR), website and other mediums

46 Analysis of the Social and Economic Impacts of COVID-19 on Households and Strategic Policy Recommendations for Indonesia
3. 9. Considerations for program specific improvements
Table 4. Result and recommendations on specific programs
SOCIAL ASSISTANCE PROGRAMS SUMMARY OF 2020 RESULTS RECOMMENDATIONS
Electricity subsidy
Most effective program in terms of budget (6T)
and reach (46%) of all households surveyed. The
poorest benefitted the best. Allowed households to
offset costs and work/learn from home.
Enhance electricity subsidy with on-demand
registration and expanding to BLT Dana Desa
beneficiaries for complementary support.
Village Cash Transfer
Program (BLT-DD)
Target number of beneficiaries reached. Poor and
vulnerable (quintile 1-3) benefitted the most.
Leverage opportunity to further reach affected
households with children who have been left out of
current assistance by identifying and enrolling them
through continued community targeting and self-
reporting.
Family Hope Program
(PKH)
Target number of beneficiaries reached. Poorest
(quintile 1) benefitted the most.
Equalize benefits with other cash transfer programs.
Accelerate integration with other programs targeting
poor children to combat child poverty and learning
loss.
Prakerja Program
Reached quintile 3-5 and beneficiaries in urban
areas. Recipients did not overlap with other cash
transfers. Results reflected design of program –
safety net targeted for decile 5 and above in urban
areas; other cash program recipients not eligible.
Encourage people in the DTKS (or bottom 40% of the
expenditure distribution) to access skills training once
the program is open to all.
Internet assistance
Households with children across the income
distribution benefitted. But a higher proportion of
beneficiaries were in urban areas (signalling gaps
in ICT infrastructure) and in middle income groups
(signalling gaps in access to devices).
Continue support. Complement with free/subsidized
devices to those in need. Invest in ICT infrastructure
for cheap and reliable internet coverage.
Capital grant for
business (BPUM)
Program implementation was still in process at
the time of the survey. More than one-third of
respondents with family business did not know
they would be eligible for the support. But those
who did receive the assistance used it as additional
capital, paying back loans and household basic
needs.
Continue to support family businesses as they
are less likely to take out loans due to uncertainty.
Allow self-registration. Match recipients with
complementary support (loans, business training,
preferential access to markets).
These overarching and program-specific recommendations are for the purposes of supporting households and family run businesses during the pandemic and recovery period. From a fiscal perspective, they will not be sustainable to continue implementing in the long-term unless revenue increases dramatically. To mitigate against long-
term scarring of households from the COVID-19 pandemic and to build resilience against future crisis, these recommendations could be complemented with efforts to continuously reform the overall social protection system and measures through fiscal assessments, streamlining of programs, and expanding social protection coverage for all.
Analysis of the Social and Economic Impacts of COVID-19 on Households and Strategic Policy Recommendations for Indonesia 47
List of References
Badan Pusat Statistik (2020a). Keadaan Ketenagakerjaan Indonesia Agustus 2020. . Available at: https://www.bps.go.id/pressrelease/2020/11/05/1673/agustus-2020--tingkat-pengangguran-terbuka--tpt--sebesar-7-07-persen.html (Accessed: March 2nd 2021).
Badan Pusat Statistik (2020b). Minimum Living Needs in a Month (Rupiah) by Province 2005 - 2015 Table. Available at: https://www.bps.go.id/linkTableDinamis/view/id/1212 (Accessed: March 2nd 2021).
Badan Pusat Statistik (2021a). Pertumbuhan Ekonnomi: Produk Domestik Bruto. Available at: https://www.bps.go.id/website/materi_ind/materiBrsInd-20210205095341.pdf (Accessed: March 2nd 2021).
Badan Pusat Statistik (2021b). Sumber Pertumbuhan PDB Seri 2010 (Persen), 2020. Available at: https://www.bps.go.id/indicator/11/554/1/-seri-2010-sumber-pertumbuhan-pdb-seri-2010.html (Accessed: March 18th 2021).
Badan Pusat Statistik (2021c). Profil Kemiskinan di Indonesia September 2020. Available at: https://www.bps.go.id/pressrelease/2021/02/15/1851/persentase-penduduk-miskin-september-2020-naik-menjadi-10-19-persen.html (Accessed: March 2nd 2021).
Bluedorn, J. (2021). Working out the Differences: Labour Policies for a Fairer Recovery, IMF Blog, Available at:https://blogs.imf.org/2021/03/31/working-out-the-differences-labor-policies-for-a-fairer-recovery/?utm_medium=email&utm_source=govdelivery (Accessed: March 31st 2021).
Cahyadi, N., Hanna, R., Olken, B. A., Prima, R. A., Satriawan, E. & Syamsulhakim, E. (2020). ‘Cumulative impacts of conditional cash transfer programs: Experimental evidence from Indonesia’, American Economic Journal: Economic Policy, 12(4), pp. 88-110.
Hastuti, Ruhmaniyati & Widyaningsih, D. (2020). Pelaksanaan PKH dan Program Sembako dalam Rangka Mitigasi Dampak COVID-19. Available at: https://smeru.or.id/sites/default/files/publication/cp02_covidpkh_in.pdf (Accessed: March 2nd 2021).
ILO (2019). Financing Small Businesses in Indonesia. Available at: https://www.ilo.org/wcmsp5/groups/public/---asia/---ro-bangkok/---ilo-jakarta/documents/publication/wcms_695134.pdf (Accessed: March 2nd 2021).
ILO (2020a). COVID-19 and the world of work: Country policy responses. Available at: https://www.ilo.org/global/topics/coronavirus/regional-country/country-responses/lang--en/index.htm#TH (Accessed: March 2nd 2021).
ILO (2020b). Temporary Wage Subsidies. Available at: https://www.ilo.org/global/topics/wages/publications/WCMS_745666/lang--en/index.htm (Accessed: March 2nd 2021).
ILO (2020c). The socioeconomic impacts of COVID-19 in Malaysia: Policy review and guidance for protecting the most vulnerable and supporting enterprises. Available at: https://www.ilo.org/asia/publications/WCMS_751600/lang--en/index.htm (Accessed: March 2nd 2021).
ILO (2021). Social Protection Responses to COVID-19. Available at: https://www.social-protection.org/gimi/gess/ShowWiki.action?id=3417 (Accessed: March 18th 2021).
ILO & OECD (2020). The impact of the COVID-19 pandemic on jobs and incomes in G20 economies. Available at: https://www.ilo.org/global/about-the-ilo/how-the-ilo-works/multilateral-system/g20/reports/WCMS_756331/lang--en/index.htm (Accessed: March 2nd 2021).

48 Analysis of the Social and Economic Impacts of COVID-19 on Households and Strategic Policy Recommendations for Indonesia
IMF (2021). Policy Responses to COVID-19. Available at: https://www.imf.org/en/Topics/imf-and-covid19/Policy-Responses-to-COVID-19#P (Accessed: March 18th 2021).
JPAL (2020). Online Survey on Economic Impact of COVID-19 in Indonesia: Results from Week 22. J-PAL Southeast Asia.
Karina, N. (2020). Strengthening Indonesia’s social protection in the COVID-19 era: Strategy and lessons from evidence. Available at: https://www.povertyactionlab.org/blog/11-20-20/strengthening-indonesias-social-protection-covid-19-era-strategy-and-lessons-evidence (Accessed: March 2nd 2021).
Kementerian Sosial (2020a). Pedoman Pelaksanaan Program Keluarga Harapan. Available at: https://pkh.kemensos.go.id/dokumen/DOCS20200629111004.pdf (Accessed: March 30th, 2021).
Kementerian Sosial (2020b). Keputusan Direktur Jenderal Perlindungan dan Jaminan Sosial No. 02/3/BS.02.01/01/2020 tentang Indeks dan Faktor Penimbang Bantuan Sosial Program Keluarga Harapan Tahun 2020. Available at: https://pkh.kemensos.go.id/dokumen/DOCS20201015042924.pdf (Accessed: March 30th, 2021).
Kementerian Desa, P. D. T., dan Transmigrasi Republik Indonesia, (2015). Peraturan Menteri Desa, Pembangunan Daerah Tertinggal, dan Transmigrasi Republik Indonesia Nomor 1 Tahun 2015. Available at: https://ppidkemkominfo.files.wordpress.com/2016/08/pm-desa-no-1-th-2015-tentang-pedoman-kewenangan-berdasarkan-hak-asal-usul-dan-kewenangan-lokal-berskala-desa.pdf (Accessed: March 2nd 2021).
Kementerian Ketenagakerjaan Republik Indonesia (2020). Kemnaker Sosialisasi Hasil Kajian Komponen dan KHL Kepada Dewan Pengupahan. Available at: https://kemnaker.go.id/news/detail/kemnaker-sosialisasi-hasil-kajian-komponen-dan-khl-kepada-dewan-pengupahan (Accessed: March 2nd 2021).
Kementerian Keuangan Republik Indonesia (2020a). Ini Realisasi PEN Hingga 25 November 2020. Available at: https://www.kemenkeu.go.id/publikasi/berita/ini-realisasi-pen-hingga-25-november-2020/ (Accessed: March 2nd 2021).
Kementerian Keuangan Republik Indonesia (2020b). Media Briefing: Program Pemulihan Ekonomi Nasional. Available at: https://www.kemenkeu.go.id/media/15116/media-briefing-kabkf.pdf (Accessed: March 2nd 2021).
Kementerian Keuangan Republik Indonesia (2020c). ‘Peraturan Menteri Keuangan Republik Indonesia Nomor 50/PMK.07/2020’. Available at: http://www.djpk.kemenkeu.go.id/wp-content/uploads/2020/05/PMK-Nomor-50-Tahun-2020-2.pdf (Accessed: March 2nd 2021).
Kementerian Keuangan Republik Indonesia (2021). APBN KITA: Kinerja dan Fakta: Kementerian Keuangan Republik Indonesia,. Available at: https://www.kemenkeu.go.id/media/17266/apbn-kita-februari-2021.pdf (Accessed: March 2nd 2021).
Kementerian Pendidikan dan Kebudayaan Republik Indonesia (2020). Peraturan Sekretaris Jenderal Nomor 14 Tahun 2020. Available at: https://anggunpaud.kemdikbud.go.id/images/upload/images/19092020_SALINAN_PERSESJEN_NOMOR_14_TAHUN_2020-merged.pdf (Accessed: March 18th 2021).
Kementerian Perencanaan Pembangunan Nasional/Badan Perencanaan Pembangunan Nasional (BAPPENAS) (2020). Panduan Pendataan Bantuan Langsung Tunai-Dana Desa (BLT Dana Desa). Available at: https://www.bappenas.go.id/files/3415/9549/4158/Buku_Saku_Pendataan_BLT-Dana_Desa_FINAL.pdf (Accessed: March 2nd 2021).
Komite Penanganan COVID-19 dan Pemulihan Ekonomi Nasional (KPC-PEN) (2021). Peta Sebaran. Available at: https://covid19.go.id/peta-sebaran (Accessed: March 2nd).

Analysis of the Social and Economic Impacts of COVID-19 on Households and Strategic Policy Recommendations for Indonesia 49
Kurniawan, A. (2020). Bantuan Langsung Tunai-Dana Desa untuk Menangani Dampak Pandemi COVID-19: Cerita dari Desa. Available at: https://smeru.or.id/sites/default/files/publication/cp04_covidblt_in.pdf (Accessed: March 2nd 2021).
Lembaga Hasil Dalam Negeri Malaysia (2021). Bantuan Prihatin Rakyat. Available at: https://bpr.hasil.gov.my/ (Accessed: March 18th 2021).
Malaysian Investment Development Authority (2021). Perlindungan Ekonomi dan Rakyat Malaysia (PERMAI). Available at: https://www.mida.gov.my/perlindungan-ekonomi-dan-rakyat-malaysia-permai/ (Accessed: March 18th 2021).
MAHKOTA & KOMPAK (2020). Dampak Ekonomi Krisis COVID-19 dan Peran Perlindungan Sosial dalam Memitigasi Kerentanan: Pengalaman Penyandang Disabilitas di Indonesia. Available at: https://www.dfat.gov.au/sites/default/files/covid-19-crisis-experiences-people-disabilities-indonesia-id.pdf (Accessed: March 2nd 2021).
OECD (2019). PISA 2018: Insights and Interpretations. Available at: https://www.oecd.org/pisa/PISA%202018%20Insights%20and%20Interpretations%20FINAL%20PDF.pdf (Accessed: March 18th 2021).
OECD (2020). Coronavirus (COVID-19): SME policy responses. Available at: http://www.oecd.org/coronavirus/policy-responses/coronavirus-covid-19-sme-policy-responses-04440101/ (Accessed: March 2nd 2021).
Pratiwi, A.M., G., Tureah, G.G., Vanya, H., Irawan, K.I., Adirespati, S. and Eke, Z. (2020). Kumpulan Rekomendasi Kebijakan: Penanganan Krisis Multidimensi Pandemi COVID-19, Knowledge Sector Society, Available at: https://www.ksi-indonesia.org/assets/uploads/original/2021/01/ksi-1611332690.pdf (Accessed on April 6th 2021).
Prospera (2020). Concessions to Promote Economic Participation of Persons with Disabilities in Indonesia: Preliminary Report. Jakarta, Indonesia.
Republic of the Philippines (2020). Joint Memorandum Circular No. 1 Series of 2020. Available at: https://www.officialgazette.gov.ph/downloads/2020/03mar/20200328-JOINT-MEMORANDUM-CIRCULAR-NO-1-S-2020.pdf (Accessed: March 18th 2021).
Schaefer, M. (2020). Life or livelihoods? Indonesia’s social policy response to COVID-19. Available at: https://socialprotection.org/discover/blog/life-or-livelihoods-indonesia%E2%80%99s-social-policy-response-covid-19 (Accessed: March 2nd 2021).
Sudarno, S. (2020). Weathering the Storm: Poverty and Indonesia’s Social Protection System Amidst the COVID-19 Pandemic. Asia Health Policy Program (AHPP) 2020-21 Colloquium series “Health, medicine, and longevity: Exploring public and private roles, Freeman Spogli Institute for International Studies. Stanford University. https://fsi.stanford.edu/events/weathering-storm-poverty-and-indonesia%E2%80%99s-social-protection-system-amidst-covid-19-pandemic (Accessed: March 3rd 2021)
Suryahadi, A., Izzati, R. A. & Suryadarma, D. (2020). The Impact of COVID-19 Outbreak on Poverty: An Estimation for Indonesia. Available at: https://smeru.or.id/sites/default/files/publication/wp_covid19impact_draft.pdf (Accessed: March 2nd 2021).
The Asian Development Bank (2020). Asia Small and Medium-Sized Enterprise Monitor 2020: The Asian Development Bank. Available at: https://www.adb.org/sites/default/files/publication/650251/asia-sme-monitor-2020-volume-2.pdf (Accessed: March 2nd 2021).
The Asian Development Bank (2021). ADB COVID-19 Policy Database. Available at: https://covid19policy.adb.org/policy-measures/INO (Accessed: March 2nd 2021).

50 Analysis of the Social and Economic Impacts of COVID-19 on Households and Strategic Policy Recommendations for Indonesia
UN Women & Women Count (2020). From Insights to Action: Gender Equality in the Wake of COVID-19. Available at: https://www.unwomen.org/-/media/headquarters/attachments/sections/library/publications/2020/gender-equality-in-the-wake-of-covid-19-en.pdf?la=en&vs=5142 (Accessed: March 18th 2021).
UNICEF (2020a). COVID-19 and Children in Indonesia: An Agenda for Action to Address Socio-Economic Challenges. Available at: https://www.unicef.org/indonesia/sites/unicef.org.indonesia/files/2020-05/COVID-19-and-Children-in-Indonesia-2020_0.pdf (Accessed: March 2nd 2021).
UNICEF (2020b). Laporan Kajian Cepat Kesehatan: Memastikan Keberlangsungan Layanaan Kesehatan Esensial Anak dan Ibu di Masa Pandemi COVID-19 di Indonesia. Available at: https://www.unicef.org/indonesia/media/5371/file/Laporan%20Kajian%20Cepat%20Layanan%20Kesehatan%20Esensial%20Ibu%20Anak.pdf (Accessed: March 2nd 2021).
UNICEF (2020c). COVID-19 and social protection in South Asia: India. Available at: https://www.unicef.org/rosa/media/10076/file/India.pdf (Accessed: March 18th 2021).
UNICEF (2020d). Cash transfer offer a lifeline to vulnerable families during COVID-19: The pandemic has taken a devastating toll on families, but cash transfers are helping ease the strain. Available at: https://www.unicef.org/thailand/stories/cash-transfers-offer-lifeline-vulnerable-families-during-covid-19 (Accessed: March 24th 2021).
UNICEF & Fiscal Policy Agency (2021a). The Impact of the COVID-19 Economic Crisis on Child Poverty and Mobility in Indonesia.
UNICEF & International Policy Centre for Inclusive Growth (IPC-IG) (2020). Profiles of pre-COVID-19 social protection systems in Bhutan, Bangladesh and Maldives and a snapshot of their COVID-19 responses. Available at: https://socialprotection.org/profile-pre-covid-19-social-protection-system-bhutan-bangladesh-and-maldives-and-snapshot-their (Accessed: March 24th 2021).
UNICEF & Overseas Development Institute (ODI) (2020). Briefing – Universal child benefits: policy issues and options. Available at: https://www.unicef.org/media/70416/file/Universal-child-benefits-Briefing-2020.pdf (Accessed: March 26th 2021).
Wells, M. and Sijapati Basnett, B. (2020). Why gender matters in Indonesia’s Covid-19 policy responses. ANU Indonesia Project Global Seminar, Available at: https://www.youtube.com/watch?v=At3DCjs5AQA (Accessed: March 31 2021).
World Health Organization (2020). At least 80 million children under one at risk of diseases such as diphtheria, measles and polio as COVID-19 disrupts routine vaccination efforts, warns Gavi, WHO and UNICEF. Available at: At least 80 million children under one at risk of diseases such as diphtheria, measles and polio as COVID-19 disrupts routine vaccination efforts, warn Gavi, WHO and UNICEF (Accessed: March 31st 2021).
World Bank (2019). Aspiring Indonesia: Expanding the Middle Class, Washington DC: The World Bank. Available at: https://www.worldbank.org/en/country/indonesia/publication/aspiring-indonesia-expanding-the-middle-class (Accessed: March 2nd 2021).
World Bank (2020) Indonesia Economic Prospects, December 2020: Towards a Secure and Fast Recovery, Available at: https://www.worldbank.org/en/country/indonesia/publication/december-2020-indonesia-economic-prospects (Accessed: 19 March 2021).

Analysis of the Social and Economic Impacts of COVID-19 on Households and Strategic Policy Recommendations for Indonesia 51
No Name of Scheme DetailExpansion/
Modification or New Program
Target Beneficiaries Pop. Coverage14
Value of Transfer/In-Kind Benefit
(Local Currency and US$)
Targeting Mechanism Initial planned duration in 2020
Continuation in 2021
Total Budget (Local Currency
and US$)
Cost of Emergency
response (% of GDP)
Social Assistance
1 Program Keluarga Harapan (PKH)
Conditional Cash Transfer for households with pregnant women, school-age children, infants, and elderly
Expansion 10 Million households per 2021
14% From IDR 900,000 (US$ 62) to IDR 10,000,000 (US$ 696) per year
DTKS 3 months Yes IDR 28.71 T (US$ 1.99 B) per 2021
0.18%
2 PKH Rice Assistance15
Rice assistance for PKH beneficiaries
Expansion 10 Million households per 2020
14% 15 kg / family / month
DTKS 3 months - IDR 5 T (US$ 347.48 M) per 2020
0.03%
3 Sembako Card
Food Assistance for consumption on rice, eggs, vegetables
Expansion 20 Million households per 2021
28% IDR 200,000 (US$ 134)
DTKS 9 months Yes IDR 45.12 T (US$ 3.14 B) per 2021
0.28%
4 Cash Assistance Expansion16
Cash transfer for beneficiaries of Sembako card program who do not receive PKH
Expansion 9 Million households per 2020
13% IDR 500,000 (US$ 35)
DTKS 1 month Yes IDR 4.5 T (US$ 312.73 M) per 2020
0.03%
5 Electricity Subsidy
Electricity subsidy on the basis of VA size
Expansion 31.2 Million households per 2020
45% Free for 450 VA and 50% discount for 900 VA
DTKS 3 months for households, 6 months for SMEs and industry
Yes IDR 3.5 T (US$ 242.8 M)
0.02%
Annex I. Overview of government assistance programs
14. The figure of the proportion of households as the intended target beneficiaries of each program is calculated from the target households of each program divided by total HH (69 million).
15. Due to a timing issue as the program were newly introduced, these programs had not been included in the survey
16. Due to a timing issue as the program were newly introduced, these programs had not been included in the survey

52 Analysis of the Social and Economic Impacts of COVID-19 on Households and Strategic Policy Recommendations for Indonesia
No Name of Scheme DetailExpansion/
Modification or New Program
Target Beneficiaries Pop. Coverage14
Value of Transfer/In-Kind Benefit
(Local Currency and US$)
Targeting Mechanism Initial planned duration in 2020
Continuation in 2021
Total Budget (Local Currency
and US$)
Cost of Emergency
response (% of GDP)
6 Food Assistance - Jabodetabek
Food assistance for those who are not covered by the PKH and Sembako Card program
New 1.36 Million households per 2020
2% IDR 600,000 (US$ 42) from Apr to Jun 2020, IDR 300,000 (US$ 21) from Jul to Dec 2020
DTKS 9 months Yes, converted to cash
IDR 4.57 T (US$ 317.6 M) per 2021
0.03%
7 Bansos Tunai Cash Transfer for those excluded from PKH and Sembako card
New 10 Million households per 2021
13% IDR 600,000 (US$ 42) from Apr to Jun 2020, IDR 300,000 (US$ 21) from Jul to Dec 2020
DTKS 9 months Yes IDR 12.0 T (US$ 834.78 M) per 2021
0.07%
8 BLT Dana Desa
Cash transfer for those excluded from PKH, Sembako, and Pre-Employment Card funded through Dana Desa
Expansion 11 Million household per 2020
16% IDR 600,000 (US$ 42) from Apr to Jun 2020, IDR 300,000 (US$ 21) from Jul to Dec 2020
Community Targeting
9 months Yes IDR 14.4 T (US$ 1 B) per 2021
0.09%
9 Pre-Employment Card18
Unemployment Benefit and Training Assistance for those SME entrepreneurs and those who are affected by COVID-19 lay-offs
Modification 5.6 Million individuals per 2021
5.40% IDR 3,550,000 (US$ 247)
On-Demand application, targeting decile 5 and above
9 months Yes IDR 20 T (US$ 1.391 B) per 2021
0.12%
10 Internet Package
Internet quota assistance for students and teachers
New 54.1 Million individuals per 2020
- Internet quota varies by education level
Dapodik and PDDikti
4 months Yes IDR 7.2 T (US$ 499.37 M) per 2020
0.04%
18 For programs with individual target, such as Kartu Prakerja, it is assumed that there are 1.5 eligible member per HH

Analysis of the Social and Economic Impacts of COVID-19 on Households and Strategic Policy Recommendations for Indonesia 53
No Name of Scheme DetailExpansion/
Modification or New Program
Target Beneficiaries Pop. Coverage14
Value of Transfer/In-Kind Benefit
(Local Currency and US$)
Targeting Mechanism Initial planned duration in 2020
Continuation in 2021
Total Budget (Local Currency
and US$)
Cost of Emergency
response (% of GDP)
MSMEs
1 Bantuan Presiden untuk UMKM (BPUM)19
Cash transfer to MSMEs (working capital aid)
New 12 Million MSMEs per 2021
8.80% IDR 2,400,000 (US$ 167)
Hybrid 5 months Yes IDR 17.34 T (US$ 1.21 B) per 2021
0.11%
2 Bantuan Subsidi Upah
Wage subsidy to workers actively registered in BPJS Ketenagakerjaan
New 15.7 Million workers per 2020
15.20% IDR 2,400,000 (US$ 167)
BPJS Ketenagakerjaan data, workers who earn < IDR 5 Million per month
4 months No IDR 29.4 T (US$ 2.04 B) per 2020
0.18%
3 Final Income Tax (0.5%) Borne by Govt
Compensation on SME final income tax
New - - - Tax Directorate General
- Yes IDR 2,4 T (US$ 167.46 M) per 2021
0.01%
4 Interest Subsidies
Interest subsidy for loans amounting to IDR 10 Billion (US$ 693.5 K)
New 29.9 Milion debitors per 2021
- 2% to 6% depending on the amount of the loan
Banks and non-financial institutions
- Yes IDR 31.95 T (US$ 2.23 B) per 2021
0.20%
5 Collateral Subsidy (Subsidi Imbal Jasa Penjaminan)
Government subsidizing collateral of the loans made by SMEs
New - - - - - Yes IDR 8.5 T (US$ 593.1 M) per 2021
0.05%
6 Loan Deferral Extension of loan maturities by one year
New Banks and non-financial institutions
12 months Yes
Source: Ministry of Finance, Pratiwi et al., 2020, Schaefer 2020, Kemdikbud, 2020.
19 For programs with individual target, such as BPUM, it is assumed that there are 1.5 eligible member per HH.

54 Analysis of the Social and Economic Impacts of COVID-19 on Households and Strategic Policy Recommendations for Indonesia
Annex II. Note on Methodology - a comparison between 2020 COVID-19 Survey and 2019 SUSENAS
Table A1 compares household characteristics between this survey and Susenas 2019. Since this is a probability survey that is following Susenas 2019’s sampling design, the report uses a weighted one to ensure the comparability with Susenas 2019. Overall, as a national representative survey, the 2020 survey is comparable with Susenas 2019 in terms of proportion rural urban and gender of the head of households. However, the main differences with Susenas 2019
are around age and education of household head. The 2020 survey has a slightly lower proportion of household head aged 29 years old or younger and a slightly higher proportion of individual aged 30-59 years old. It also has a lower proportion of household head who had never attended or not completed education and slightly higher proportion of senior high school level.
Table A1. Comparison of household characteristics (%)
Category 2020 survey weighted (%) Susenas 2019 (%)(1) (3) (4)
Urban/RuralUrban 56 58.2Rural 44 41.8Total 100.0 100.0Gender of household headMale 85.7 86.4Female 14.3 13.6Total 100.0 100.0Household head’s age range29 years old or younger 3.7 8.330-39 years old 16.6 20.940-49 years old 28.9 25.950-59 years old 26.9 22.760 years old or older 22.8 22.2Do not know 1.2 naTotal 100.0 100.0Marital status of the household headMarried 83.1 81.8Widowed 12.2 11.3Divorced 3.1 3.2Single 1.6 3.7Total 100.0 100.0Highest education of household headNever attended school or not completed 14.6 21.5Elementary school (MI/Paket A) 30.7 28.5Junior high school (MTs/Paket B) 16.9 16.1Senior high school (SMK/MA/Paket C) 28.7 25.1Diploma degree 2.1 2.1Bachelor/master/doctoral/professional degree 7 6.8Do not know 0.1 NaTotal 100.0 100.0Household size1-2 members 15.5 17.53-4 members 50.3 52.55-6 members 27.4 24.37 members or more 6.8 5.6Total 100.0 100.0
Source: calculated from the Susenas March 2019 and the 2020 household survey

Analysis of the Social and Economic Impacts of COVID-19 on Households and Strategic Policy Recommendations for Indonesia 55
The quintile distribution that is used throughout this report is based on household surveyed in the expenditure distribution in the whole sample of Susenas 2019. Ideally, each quintile should consist of exactly 20% of total (weighted) sample. However, in our survey, quintile 3 and 4 were slightly more than 20%, while the remaining were slightly less 20% (see Figure A1). Such a distribution indicates that compared to Susenas March 2019, the COVID-19 survey slightly over-represents households in the middle part of distribution. While these differences are important to note, they do not amount to a substantial difference.
Additional explanation on the Socio-economic
status in 2019
The survey data has been merged with the data from Susenas 2019 to determine the socio-economic conditions of sample households prior to the pandemic and the households’ position in the expenditure distribution. These figures help to better monitor the ramifications of COVID-19 induced income loss (as reported in the subsequent section) on households’ economic positioning.
As the joint-survey was only a sub-sample of Susenas 2019 data, the proportion of households in each quintile were no longer exactly 20% each. Instead, the distribution of the households across quintiles in the joint-study were as follow: quintile 1 (16%), quintile 2 (18%), quintile 3 (19%), quintile 4 (21%) and quintile 5 (24%). Hence, in terms of socio-economic status, the joint-survey is slightly upward biased against the sample of Susenas 2019; this is probably due to the fact that phone ownership was used as a selection criterion in the sampling procedure of the joint- survey.
Figure A1. Ideal vs actual proportion of expenditure/capita (2019) quintile calculated from full sample Susenas 2019
Table A2. Household composition and individual members with specific vulnerability condition
Number of children (0-17 years old)None 28.5
1 member 32.5
2 members 26.3
3 members or more 12.7
Proportion of HH with members with characteristics Pre-school age children 25.4
School age children 57.96
Person with disability 6.86
Pregnant women 3.2
Chronic disease 15.8
Elderly 30.4
18,1 19,621,8 21,1
19,4
0,0
5,0
10,0
15,0
20,0
25,0
1 (Po orest) 2 3 4 5 (Wealthiest)
A ctua l propo rtion Ideal p ropor tion
Source: calculated from the Susenas March 2019 and the 2020 household survey
*Note: The percentages are based on the number of households in each subgroup.
Table A3. Descriptive statistics of per capita expen-diture and household expenditure by expenditure group
Expenditure group
Per capita expenditure (000 IDR) Household expenditure (000 IDR)
Min Mean Max Min Mean Max
Quintile 1 (16% of total HH)
168 423 560 270 1,900 6,100
Quintile 2 (18% of total HH)
560 676 800 580 2,900 12,000
Quintile 3(19% of total HH)
803 971 1,150 800 4,000 13,400
Quintile 4(21% of total HH)
1,147 1,401 1,750 1,150 5,100 20,200
Quintile 5(24% of total HH)
1,737 2,890 26,400 1,775 9,350 119,000
Source: calculated from the Susenas March 2019 and the 2020 household survey
56 Analysis of the Social and Economic Impacts of COVID-19 on Households and Strategic Policy Recommendations for Indonesia
Annex III. Analyses to support simulated impacts of income and expenditure change on 2019 quintile distribution
Figure 4 illustrates the re-shuffling of quintiles that would take place should all households in the sub-group experience a 10% reduction of expenditure. The proportion of households in quintile 1 and 2 would increase by 5.9 pp and 1.9 pp, respectively. The 5.9-pp increase, if we were to show it as a percentage of the initial composition of the quintile 1 (17.3%), amounts to a 34.1% increase – which is significant. Similarly, a 1.9-pp increase amounts to an 8% increase in the composition of quintile 2.
The sizes of quintile 3 and 4 would reduce by 0.8 pp and 1.9 pp, respectively. The largest drop would be seen in the quintile 5, where a reduction of 10% in expenditure would produce a 4.8-pp fall. This amounts to a reduction of almost one-third (28.9%) of households that were in quintile 5 in 2019.22
This fall in expenditure and income has a significant impact on poverty. Prior to the simulations, 8.1% of households among the group we are focusing on (those who reported that both their income and expenditure reduced as the consequence of pandemic) were living below the poverty line.
The poverty rate rises to 12.3% after the simulation of a 10% reduction in expenditure. The relative fall in expenditure would translate into a 4.2pp increase in proportion of households living in poverty. This means a 50% increase in the number of individuals who are poor.
20. It must be noted that many households in our sample have experienced a reduction in income and simultaneously an increase in expenditure. We believe that many of these households, their welfare may be worse off. However, because the welfare measure used in determining the economic status is expenditure, then when expenditure increase, this translate into increase in welfare, hence including this group can be misleading. Furthermore, our data was not rich enough to fully quantify the coping mechanism involved in each household. Hence, simulating impacts on this group too will require many additional assumptions that may reduce the validity of our simulations. Hence, we deliberately focus on groups of households who are worse off in terms of both income and expenditure.
21. We use the following logic to estimate the 10% change in average PCE: The change in economic growth between 2019 and 2020 is -7.09, which we multiple with the coefficient correlation of 1.424, as shown in Table 3 of Surhayadi et al. 2020.
22. The transition matrix of shifting quintile position is provided in the Table A5 of Annex III
We present simple simulations to illustrate the implications of income and expenditure change during the pandemic on households’ economic status (or their position in quintile distribution at 2019 levels). Following National Statistics Office’s use of expenditure as the measure of welfare, this simulation focuses on those who reported that both their expenditure and their income have been reduced during the pandemic. Almost a quarter (23.4%) of the 63 million households in the survey reported both a decline in income and expenditure20.
The underlying assumption behind the simulations is that households faced with a reduction of income were “forced” to reduce their expenditure. Additional assumptions include: the basket of goods consumed and household size have not changed between 2019 and 2020. As we did not collect data on size of reduction in expenditure, for the simulation purposes, we adopt the average change of per capita expenditure (PCE) estimates as shown in Suryahadi et al. (2020) but we apply it to the actual economic growth of -2.07% in 2020 (BPS, 2021a). The average change in PCE we use is 10%21. We assume that this reduction in expenditure is experienced uniformly across all households in this sub-group. The simulated size of household expenditure is then divided by the average household size to estimate per capita expenditure. The new quintile is determined based on the simulated expenditure per capita.

Analysis of the Social and Economic Impacts of COVID-19 on Households and Strategic Policy Recommendations for Indonesia 57
Table A4. Tabulation of change in expenditure and income due to pandemic
HHousehold Situation Expenditure increased Expenditure the same Expenditure decrease
Income increased 2.16 0.51 0.26
Income the same 6.16 15.09 1.47
Income decrease 26.63 24.32 23.4
Total 34.96 39.92 25.13
Table A5. Transition matrix assuming expenditure decrease by 10%
Quintile after 90% reduction in expenditureTotal
Quintile 1 Quintile 2 Quintile 3 Quintile 4 Quintile 5
Initial
Quintile 1 100 0 0 0 0 17.3
Quintile 2 25.39 74.61 0 0 0 22.9
Quintile 3 0 30.02 69.98 0 0 23.0
Quintile 4 0 0 28.92 71.08 0 20.1
Quintile 5 0 0 0 23.48 76.52 16.6
Total 23.18 24.82 22.23 18 11.77

58 Analysis of the Social and Economic Impacts of COVID-19 on Households and Strategic Policy Recommendations for Indonesia
Annex IV. Summary of social assistance policy responses to COVID-19 across a selection of low and middle-income countries in the Asia-Pacific Region
Name of Scheme Detail Number of Recipients
Total Budget (Local Currency and US$)
Value of Transfer (Local Currency and US$)
Cost of Emergency response (% of GDP)
Malaysia (per 2021)23
Bantuan Prihatin Rakyat One-time cash transfer targeted to individuals and households. For households, the nominal is based on income categories and the size of households
8.1 Million recipients
RM 6.5 B (US$ 1.58 B) RM 250 (US$ 61) for individuals and RM500 (US$ 122) to RM1800 (US$ 438) for households
0.60%
Philippines (per 2020)24
Emergency Subsidy Program Two-months cash subsidy for low-income families based on the area of residence
18 Million low-income families
PHP 100 B (US$ 2.06 B) P 5000 (US$ 103) to 8000 (US$ 165) per month
0.55 %
Thailand (per 2020)25
Emergency Cash Payment for Informal Workers
Three-months cash transfer to informal workers not covered by Social Security Fund
16 Million workers
THB 331,5 B (US$ 7.817 B) THB 5,000 (US$ 163) per month
1.4%
Financial Assistance for Welfare Card holders
Cash transfers for those who were not eligible for other campaigns
1.16 Million people
THB 3.58 B (US$ 116.65 M) THB 3,000 0.02%
India (per 2020)26
PM-KISAN Minimum Income Support for Farmers, installed over 3 months
86.9 Million farmers
INR 521.4 B (US$ 7.16 B) INR 6,000 (US$ 83) 0.2%
Cash Transfer for vulnerable groups
Cash Transfer for poor senior citizens, windows, and divyangs (persons with disabilities) delivered in two instalments
30 Million individuals
INR 30 B (US$ 412 M) INR 1,000 (US$ 14) 0.01%
Jan Dhan Financial Inclusion Cash Transfer for women, delivered in instalments over 3 months
200 Million women
INR 300 B (US$ 4.12 B) INR 500 (US$ 7) per month 0.14%
Source: Lembaga Hasil Dalam Negeri Malaysia (2021); Republic of the Philippines (2020); ILO (2021); UNICEF (2020c)
23. https:lk//bpr.hasil.gov.my/
24. https://www.officialgazette.gov.ph/downloads/2020/03mar/20200328-JOINT-MEMORANDUM-CIRCULAR-NO-1-S-2020.pdf
25. https://www.social-protection.org/gimi/gess/ShowWiki.action?id=3417
26. https://www.unicef.org/rosa/media/10076/file/India.pdf

Analysis of the Social and Economic Impacts of COVID-19 on Households and Strategic Policy Recommendations for Indonesia 59
Annex V. Summary of MSME policy responses to COVID-19 across a selection of low and middle-income countries in the Asia-Pacific Region
Measures Number of Recipients Total Budget (Local Currency and US$)
Value of Transfer (Local Currency and US$)
Cost of Emergency response (% of GDP)
Malaysia (per 2021)27
Liquidity Support
• Microcredit schemes for MSMEs - RM 1 B (US$ 243.1 M) 0.07%
• PERMAI Prihatin Special Grant500,000 SMEs in MCO (socially restricted) states and 300,000 SMEs in other states
RM 650 M (US$ 158 M)RM 1,000 (US$ 242) for SMEs in MCO states and RM 500 for SMEs in other states
0.04%
• SME and Micro SME e-Commerce Campaign RM 300 M (US$ 72.9 M) 0.02%Tax/Loan Repayment Deferrals
• Targeted Loan Repayment Assistance (3-month moratorium/flexible repayment)Philippines (per 2020)28Liquidity Support
• Social protection measure for vulnerable workers and MSMEs
P 65 B (US$ 1.34 B) 0.36%
• Enterprise Rehabilitation Fund (P3-ERF), financing for MSMEs affected by COVID-19
PHP 1 B (US$ 20.63 M) 0.01%
Tax/Loan Repayment Deferrals• 30-day grace period for debt repayment
Thailand (per 2020)Liquidity Support
• Low-Interest Loans for SMEs (2%) THB 500 B (US$ 16.36 B) 3.01%• 150% interest expense deduction for SMEs
Tax/Loan Repayment Deferrals• Loan payment holiday of 6 months for SMEs
India (per 2020)29
Liquidity Support• Collateral-free loans for SMEs INR 3 T (US$ 41.30 B) 1.44%• Equity support for stressed firms 2 Million SMEs INR 200 B (US$ 2.75 B) 0.10%• MUDRA scheme (lending program for street vendors) 5 Million street vendors INR 50 B (US$ 688.37 M) up to INR10,000 (US$ 14) loans 0.02%
Tax/Loan Repayment Deferrals• 12-month principal repayment moratorium• Tax payment deferral for SMEs
Sources: Malaysian Investment Development Authority (2021); OECD (2020); IMF (2021
27. https://www.mida.gov.my/perlindungan-ekonomi-dan-rakyat-malaysia-permai/
28. https://www.imf.org/en/Topics/imf-and-covid19/Policy-Responses-to-COVID-19#P
29. http://www.oecd.org/coronavirus/policy-responses/coronavirus-covid-19-sme-policy-responses-04440101/

60 Analysis of the Social and Economic Impacts of COVID-19 on Households and Strategic Policy Recommendations for Indonesia
Annex VI. Comparison between cash and non-recipients by quintile 1-3
Households Condition
Quintile 1 Quintile 2 Quintile 3 Total
Received Did not received Received Did not
received Received Did not received Received Did not
received
Expenditure condition in 2019
Expenditure per capita
416019.7 433645.3 677208.8 680068.2 970698.3 971994 682807.8 724229.8
Food expenditure per capita
274309.4 277124.2 426210.3 418094 557562.9 547226.7 416384.9 428733.2
Ratio food per total expenditure
0.66 0.64 0.63 0.62 0.58 0.57 0.62 0.60
Impacts of COVID-19 on households, Income condition
Income reduced compared to January*
74.1% 69.0% 78.7% 76.1% 74.9% 77.2% 75.9% 74.5%
Expenditure reduced compared to January
24.0% 25.7% 25.5% 34.0% 27.4% 24.3% 25.6% 28.0%
Food security condition
Unable to eat healthy food
9.6% 14.7% 17.2% 17.9% 15.1% 20.4% 13.8% 18.0%
Eaten smaller portions than usual
4.6% 10.8% 11.7% 10.9% 9.1% 14.5% 8.3% 12.3%
Not eaten for a whole day
1.0% 5.1% 2.8% 3.3% 2.9% 4.1% 2.2% 4.1%
Other adverse conditions
Having difficulties meeting educational costs**
56.7% 62.1% 60.9% 60.1% 40.6% 58.4% 52.8% 59.9%
*The percentages presented here are only among those who provided non-missing response **The percentages presented here are only among those who have educational expenses
Source: calculated from Susenas 2019 and the 2020 household survey

Analysis of the Social and Economic Impacts of COVID-19 on Households and Strategic Policy Recommendations for Indonesia 61
Annex VII. Regression results on household’s risk factors
Losing jobsIncreasing domestic burden
Health disruptions
Child education disruptions
Health and basic services
difficultiesIncreasing expenses
Decreasing income
COVID-19 cases/100 pop.0.088** -0.001 -0.044** 0.005 0.024 0.125*** 0.031
(0.043) (0.016) (0.018) (0.029) (0.016) (0.045) (0.042)
Change in mobility to workplaces
0.110 -0.004 -0.180** 0.024 0.136** 0.136 -0.058
(0.212) (0.083) (0.082) (0.150) (0.058) (0.217) (0.215)
Female headed HH-0.090*** 0.030** 0.004 -0.001 0.026** -0.036 -0.116***
(0.024) (0.014) (0.008) (0.016) (0.012) (0.023) (0.024)
HH head age <300.065 0.011 0.016 -0.061*** 0.016 0.078* 0.033
(0.040) (0.021) (0.024) (0.024) (0.011) (0.044) (0.044)
HH head age 30-500.046** -0.005 0.002 0.014 -0.005 0.030 0.050***
(0.019) (0.008) (0.007) (0.014) (0.004) (0.018) (0.018)
Low education of HH head0.104*** -0.024*** -0.008 -0.067*** -0.010** -0.022 0.064***
(0.019) (0.008) (0.007) (0.014) (0.004) (0.019) (0.018)
Present of children <180.045** 0.006 -0.031*** 0.128*** -0.002 0.123*** 0.065***
(0.020) (0.008) (0.010) (0.011) (0.005) (0.019) (0.020)
Present of disability0.007 -0.007 0.007 -0.015 0.014 -0.022 -0.004
(0.034) (0.007) (0.011) (0.023) (0.011) (0.031) (0.034)
Live in urban area0.140*** -0.006 -0.028*** -0.061*** -0.002 0.010 0.076***
(0.019) (0.007) (0.010) (0.013) (0.004) (0.019) (0.019)
Welfare-Bottom 20%0.016 0.004 -0.036** 0.011 -0.012* -0.107*** 0.004
(0.030) (0.013) (0.015) (0.021) (0.007) (0.030) (0.030)
Welfare-Middle 40%0.041 0.017 -0.019 -0.003 -0.003 -0.096*** 0.050*
(0.028) (0.011) (0.016) (0.019) (0.010) (0.028) (0.028)
Welfare-Middle 60%0.061** -0.005 -0.025* 0.005 -0.011* -0.048* 0.048*
(0.027) (0.008) (0.014) (0.019) (0.007) (0.027) (0.026)
Welfare-Middle 80%0.039 0.013 -0.016 -0.018 -0.016*** -0.023 0.012
(0.026) (0.011) (0.014) (0.016) (0.006) (0.027) (0.026)
Jawa and Bali0.141*** 0.002 0.009 -0.089*** -0.017** -0.087*** 0.057**
(0.026) (0.010) (0.009) (0.020) (0.007) (0.026) (0.026)
NTB & Kalimantan0.101*** -0.011 0.014 -0.048* -0.015 -0.094*** 0.066**
(0.032) (0.010) (0.009) (0.025) (0.010) (0.031) (0.031)
NTT, Sulawesi, Maluku, Papua0.098*** 0.007 0.011 -0.104*** -0.000 -0.063** 0.060**
(0.030) (0.011) (0.008) (0.022) (0.013) (0.030) (0.029)
Constant0.329*** 0.036* 0.044*** 0.179*** 0.067*** 0.382*** 0.455***
(0.051) (0.019) (0.016) (0.034) (0.016) (0.051) (0.051)
Observations 12,066 12,066 12,066 12,066 12,066 12,066 12,066
R-squared 0.054 0.010 0.020 0.072 0.022 0.034 0.032
Mean of dependent variable 0.643 0.0325 0.0267 0.123 0.0143 0.344 0.681
Source: Calculated from the 2020 household survey

62 Analysis of the Social and Economic Impacts of COVID-19 on Households and Strategic Policy Recommendations for Indonesia
Insufficient daily needs
Spending more on internet
Some indication of food insecurity
Moderate and severe food insecurity
Severe food insecurity
Food insecurity
score
COVID-19 cases/100 pop.-0.044 0.111*** -0.065 0.008 -0.024* -0.139
(0.035) (0.040) (0.043) (0.027) (0.014) (0.157)
Change in mobility to workplaces-0.407** 0.222 -0.930*** -0.266** -0.172*** -3.051***
(0.174) (0.209) (0.205) (0.112) (0.064) (0.685)
Female headed HH0.039** -0.030 0.020 -0.000 -0.003 0.031
(0.017) (0.023) (0.021) (0.011) (0.006) (0.070)
HH head age <300.092*** -0.107** 0.067* 0.015 0.004 0.188
(0.026) (0.044) (0.039) (0.018) (0.010) (0.122)
HH head age 30-500.011 0.051*** 0.067*** 0.023** 0.010 0.182***
(0.015) (0.018) (0.018) (0.010) (0.006) (0.064)
Low education of HH head0.084*** -0.143*** 0.033* 0.013 0.018*** 0.146**
(0.015) (0.018) (0.018) (0.010) (0.005) (0.061)
Present of children <180.049*** 0.360*** 0.049*** 0.005 -0.010 0.088
(0.016) (0.019) (0.018) (0.010) (0.007) (0.066)
Present of disability0.052** -0.024 0.055* -0.028** -0.022*** -0.032
(0.022) (0.034) (0.032) (0.011) (0.005) (0.083)
Live in urban area0.035** 0.106*** 0.100*** 0.023** 0.003 0.241***
(0.015) (0.018) (0.018) (0.010) (0.006) (0.062)
Welfare-Bottom 20%0.149*** -0.109*** 0.036 0.001 -0.007 0.001
(0.025) (0.029) (0.027) (0.016) (0.010) (0.098)
Welfare-Middle 40%0.161*** -0.070*** 0.110*** 0.037** 0.002 0.313***
(0.021) (0.025) (0.026) (0.015) (0.009) (0.094)
Welfare-Middle 60%0.130*** -0.037 0.083*** 0.031** -0.003 0.259***
(0.022) (0.024) (0.025) (0.015) (0.009) (0.095)
Welfare-Middle 80%0.068*** -0.044* 0.070*** 0.012 -0.006 0.114
(0.023) (0.023) (0.023) (0.013) (0.007) (0.078)
Jawa and Bali-0.019 -0.003 -0.033 -0.010 -0.003 -0.111
(0.018) (0.024) (0.022) (0.012) (0.006) (0.074)
NTB & Kalimantan0.023 -0.088*** 0.115*** 0.030 0.008 0.348***
(0.023) (0.030) (0.033) (0.019) (0.010) (0.116)
NTT, Sulawesi, Maluku, Papua-0.052** -0.077*** 0.054** 0.030* -0.002 0.206**
(0.026) (0.029) (0.027) (0.017) (0.008) (0.100)
Constant0.521*** 0.429*** 0.041*** 0.020*** 0.009*** 0.163***
(0.043) (0.049) (0.007) (0.005) (0.003) (0.029)
Observations 12,066 12,066 -0.138*** -0.048* -0.018 -0.500***
R-squared 0.055 0.182 (0.048) (0.026) (0.016) (0.163)
Mean of dependent variable 0.818 0.569 11,721 11,721 11,721 11,721
Source: calculated from the Susenas March 2019 and the 2020 household survey

Analysis of the Social and Economic Impacts of COVID-19 on Households and Strategic Policy Recommendations for Indonesia 63
Annex VIII. Summary of labour market policy responses to COVID-19 in various countries
Targets Channel Measures/Supports Countries
Reducing workers’ exposure to COVID-19 in the workplace
Allowing Teleworking Financial support from government• Subsidies towards the cost of flexible work arrangements
Japan and South KoreaNon-Financial support from government• Procedure simplification• Amendments to labour code on teleworking• Digitalization of MSMEs
Italy Russia Spain
Strict health and safety standards in the workplace
Restriction on business operations• Strict regulations in meat industry• Limiting business operations to essential businesses only
Germany United Kingdom
Stricter sanitary guidelines and information provision inclusive of vulnerable groups• Renewed and updated protocol• Safe work practices and PPE utilization• Updated guide on the health and safety of construction workers
Italy South Korea, South Africa, USA France
Provision of sickness benefits and paid leave to all workers
Extension/announcement of sick-leaves to allow workers to self-isolate• Extended paid sick-leave to also cover those quarantined/hospitalized due to COVID-19 • Increased paid sick-leave entitlements and expanded access to self-employed workers South Korea and US
France, Australia, and SpainProvision of care needs Extension of the duration of special paid leave and provision of means for care services
• Parental leave extension (ranges from 10 days per parent in South Korea to four months in Canada)
• Allowing childcare facilities to remain open for essential service workers
South Korea, Canada, Australia, France, Germany, Italy, Japan, Korea, UK, US UK, France, Germany, Russia
Securing jobs, saving companies, maintaining essential service provision
Job Retention Schemes (preserve jobs at firms by reducing firms’ share of labor cost temporarily to avoid firm’s liquidity shortages in responding to their financial commitments)
Directly subsidize hours not worked• Short-term work and temporary layoff schemes
Germany, Italy, France, SpainSubsidize hours worked or top-up overall earnings of workers on reduced hours AustraliaExpand existing STW schemes• Simplifying access and extending coverage• Extending coverage to non-permanent workers• Raising the level of support
Brazil, France, Germany, Italy, Spain, and Turkey
Limiting economic dismissals and protecting workers against unfair dismissals
Introduce restrictions on collective and individual dismissals• On the basis of economic grounds• On the basis of increased cost Italy and Turkey
Spain and France

64 Analysis of the Social and Economic Impacts of COVID-19 on Households and Strategic Policy Recommendations for Indonesia
Targets Channel Measures/Supports Countries
Liquidity support for firms Direct assistance• Loan guarantees• Subsidies• Tax-related measures
Many G20 Countries
Indirect assistance• Deferrals for tax and social security contributions • Loan maturities extension
Russia
Providing income security and employment support to affected workers
Income support for those who lost their job/self-employment income
Improve access to coverage of unemployment benefits• Reduce or entirely waive minimum contribution requirements• Extend qualifying period• Cover self-employed or domestic employees
Spain and US France and US Spain, China, and France
Extend Unemployment benefits durations Argentina, Germany, Italy, LuxembourgRaise the level of unemployment benefits Australia, Russia, US, Austria, UKIntroduce or expand cash transfer schemes to vulnerable groups• Based on measures of vulnerability• Based on specific needs• Based on occupational groups• Unconditional cash transfer
Australia, Argentina, China Italy and Germany UK and Brazil Japan and South Korea
Employment services and training jobseekers and workers
Upskilling and reskilling labour force• Shift to online trainings• Additional funding to strengthen distance learning and internet-based education• Provide incentives for trainings
Austria, Belgium, Denmark France Thailand, Singapore
Support job search• Create online tools to connect displaced workers with vacancies• Promote existing online job-matching platforms France and Germany
Netherlands
Analysis of the Social and Economic Impacts of COVID-19 on Households and Strategic Policy Recommendations for Indonesia 65
Page 1 Of 24
QUESTIONNAIRE
ASSESSMENT OF THE SOCIOECONOMIC IMPACTS OF THE COVID-19 PANDEMIC ON HOUSEHOLDS IN INDONESIA
HOUSEHOLD ID: └─┴─┘└─┴─┘└─┴─┴─┘└─┴─┴─┘└─┴─┴─┴─┘└─┴─┘
Interview Start Time └─┴─┘. └─┴─┘ MODULE ID. HOUSEHOLD IDENTITY
Var Question Answer
ID1 Province Preload
ID2 District/City Preload
ID3 Subdistrict Preload
ID4 Village/Kelurahan (a kelurahan is a village-level administrative area located in an urban center) Preload
ID5 Village/Kelurahan Category Preload
ID6 Census Block Number Preload
ID7 Sample Code Number Preload
ID8 Enumerator Code Preload
ID9 Supervisor Code Preload
ID10 Date of interview visit [format: DD/MM/2020]
ID11 Full name of household head
ID12 Is the household found? 1. Yes 2. No → MODULE J
ID13 Is the household willing to be interviewed? 1. Yes 2. No → MODULE J
INTRODUCTION Greetings. My name is ______. Right now, I am assigned by DTS Indonesia, which is appointed by UNICEF, UNDP and PROSPERA to conduct data collection regarding the socioeconomic impacts of the COVID-19 pandemic on households in Indonesia. This survey is done in 310 districts/cities across 34 provinces in Indonesia. All data and information you give will be kept confidential and only used for research purposes. Thank you for your participation and willingness to take part in this survey. Are you willing to be interviewed?
1. Yes, PLEASE CONTINUE THE INTERVIEW 2. No
MODULE A. BASIC INFORMATION Var Question Answer
A1 Full name of the household head Preload based on the prelist
A_Check_1
INTERVIEWER’S NOTE: IS THE NAME OF THE HOUSEHOLD HEAD THE SAME AS THAT IN THE SAMPLE LIST?
1. Yes →→ A4 2. No
Annex IX. Questionnaire

66 Analysis of the Social and Economic Impacts of COVID-19 on Households and Strategic Policy Recommendations for Indonesia
Page 2 Of 24
Var Question Answer A2 What is the reason for the change of the household
head? 1. Death 2. Divorce 3. Migration 4. Others
A3 Full name of the current household head
A4 Full name of the respondent
A5 Household’s full address Housing complex name/Street/Alley, Neighborhood/Neighborhood unit, house number
A6 Is there a telephone number of this house, or cell phone number of this household member, that we can contact? REQUIRED FIELD as the research team will need to contact the number during the monitoring survey.
1. └─┴─┴─┴─┴─┴─┴─┴─┴─┴─┴─┴─┘
Owner’s Name: __________________ 96. NONE →→ MODULE J
A7 Are there any other telephone numbers belonging to the household members or close relatives/neighbors that we can contact?
1. └─┴─┴─┴─┴─┴─┴─┴─┴─┴─┴─┴─┘
Owner’s Name: __________________ 96. NONE
MODULE B. GENERAL
Var Question Answer Options B1 What is your relationship with the household head? 1. I am the head of this household
2. Wife/husband 3. Child/stepchild/adopted child 4. Child-in-law 5. Grandchild 6. Mother/father or mother-/father-in-law 95. Other member of the household
B2 First of all, I would like to ask you about the head of this household. Is the household head male or female?
1. Male 2. Female
B3 How old is he/she? Enumerator can probe from the household head’s date of birth
1. └─┴─┴─┘ years old 8. Don’t know
B4 What is the highest education level completed by the household head?
1. Never attended school or not completed elementary school.
2. Elementary school or education of the same level (MI/Paket A)
3. Junior high school or education of the same level (MTs/Paket B)
4. Senior high school or education of the same level (SMK/MA/Paket C)
5. Diploma degree (D1/D2/D3/D4) 6. Bachelor/master/doctoral/professional
degree 8. Don’t know
B5 What is the marital status of the household head? 1. Married 2. Widowed 3. Divorced 4. Single
B6 If the respondent is not the household head [B1≠1], Is the respondent male or female?
1. Male 2. Female
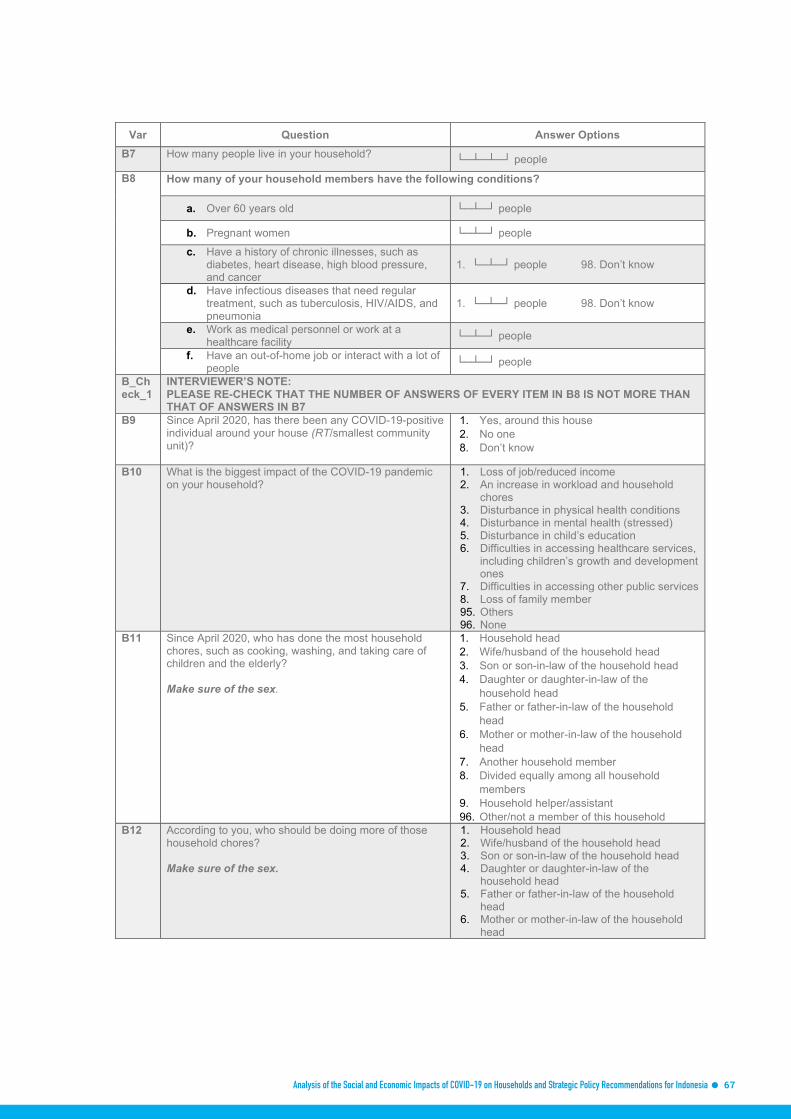
Analysis of the Social and Economic Impacts of COVID-19 on Households and Strategic Policy Recommendations for Indonesia 67
Page 3 Of 24
Var Question Answer Options B7 How many people live in your household? └─┴─┴─┘ people
B8 How many of your household members have the following conditions?
a. Over 60 years old └─┴─┘ people
b. Pregnant women └─┴─┘ people
c. Have a history of chronic illnesses, such as diabetes, heart disease, high blood pressure, and cancer
1. └─┴─┘ people 98. Don’t know
d. Have infectious diseases that need regular treatment, such as tuberculosis, HIV/AIDS, and pneumonia
1. └─┴─┘ people 98. Don’t know
e. Work as medical personnel or work at a healthcare facility └─┴─┘ people
f. Have an out-of-home job or interact with a lot of people └─┴─┘ people
B_Check_1
INTERVIEWER’S NOTE: PLEASE RE-CHECK THAT THE NUMBER OF ANSWERS OF EVERY ITEM IN B8 IS NOT MORE THAN THAT OF ANSWERS IN B7
B9 Since April 2020, has there been any COVID-19-positive individual around your house (RT/smallest community unit)?
1. Yes, around this house 2. No one 8. Don’t know
B10 What is the biggest impact of the COVID-19 pandemic on your household?
1. Loss of job/reduced income 2. An increase in workload and household
chores 3. Disturbance in physical health conditions 4. Disturbance in mental health (stressed) 5. Disturbance in child’s education 6. Difficulties in accessing healthcare services,
including children’s growth and development ones
7. Difficulties in accessing other public services 8. Loss of family member 95. Others 96. None
B11 Since April 2020, who has done the most household chores, such as cooking, washing, and taking care of children and the elderly? Make sure of the sex.
1. Household head 2. Wife/husband of the household head 3. Son or son-in-law of the household head 4. Daughter or daughter-in-law of the
household head 5. Father or father-in-law of the household
head 6. Mother or mother-in-law of the household
head 7. Another household member 8. Divided equally among all household
members 9. Household helper/assistant 96. Other/not a member of this household
B12 According to you, who should be doing more of those household chores? Make sure of the sex.
1. Household head 2. Wife/husband of the household head 3. Son or son-in-law of the household head 4. Daughter or daughter-in-law of the
household head 5. Father or father-in-law of the household
head 6. Mother or mother-in-law of the household
head

68 Analysis of the Social and Economic Impacts of COVID-19 on Households and Strategic Policy Recommendations for Indonesia
Page 4 Of 24
Var Question Answer Options 7. Another household member 8. Divided equally among all household
members 9. Household helper/assistant 96. Other/not a member of this household
B13 Since April 2020, in general, how has the decision regarding who does the household chores (such as cooking, washing, and taking care of children/the elderly) been made?
1. Decided together by all members of the household
2. Decided by the household head and his/her spouse
3. Decided by the household head alone 4. Decided by the household head’s spouse
alone 5. Decided by an older member of the
household B14 Since April 2020, has there been a difference in the time
you spend for doing household chores? Answer options can be read to the respondent for probing purpose. Questions are directed to the respondent only.
1. Spending more time than before 2. Time spent is just the same. 3. Spending less time than before 96. Irrelevant (not part of my responsibilities)
B15 Since April 2020, have household members of this house been using internet, including accessing it from cell phone? If yes, is there any difference in the intensity of use (frequency, duration, internet quota) compared to before April 2020?
1. Yes, just started to use it 2. Yes, use it more often 3. Yes, but there is no difference 4. Yes, use it less often 96. Never use the internet
MODULE C. SOCIAL ASSISTANCE
Var Question Answer Options
C1
Has this household received the following social assistance programs from the government?
a. Cash assistance since April 2020 Answer options can be read to the respondent for probing purpose. There can be more than one answer
A. Received Direct Cash Transfers-Dana Desa (BLT-DD)
B. Received Direct Cash Transfers (BLT) Non-Jabodetabek
C. Received Direct Cash Transfers for Micro and Small Enterprises: Banpres Produktif Usaha Mikro/BPUM (BLT-UMKM)
D. Received cash transfers but do not know which program
W. Did not receive cash transfers
b. Family of Hope (PKH) program 1. Yes, have received since before April 2020 2. Yes, have received since April 2020 3. No
c. Wage subsidy for active members of BPJS Ketenagakerjaan (or Workers Social Security Agency) who earn less than Rp5 million monthly
1. Yes 2. No 96. Irrelevant as none of the household
members is an active member of BPJS Ketenagakerjaan
d. Kartu Prakerja or Preemployment Card 1. Yes 2. No, but already applied for it 3. Did not receive and did not apply
C_Check_1 INTERVIEWER’S NOTE: HAS THE HOUSEHOLD RECEIVE CASH ASSISTANCE? Requirement: at least one C1 question is answered “Yes”
1. Yes 2. No →→ C3
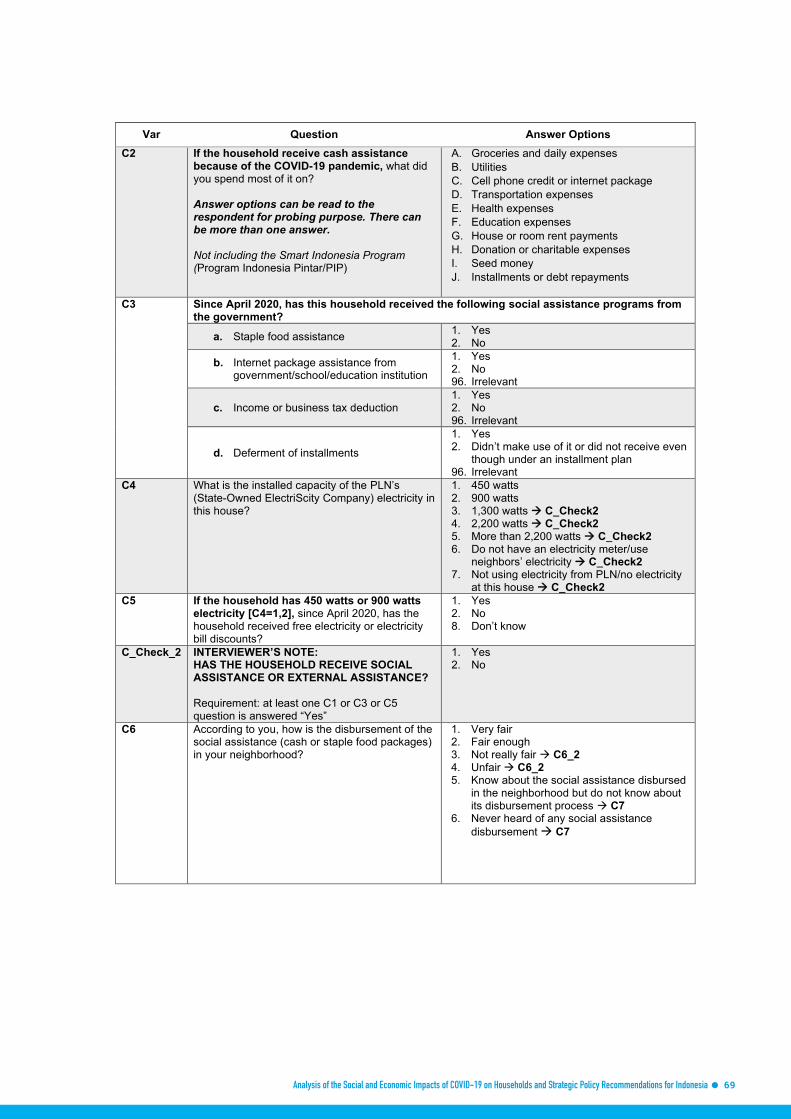
Analysis of the Social and Economic Impacts of COVID-19 on Households and Strategic Policy Recommendations for Indonesia 69
Page 5 Of 24
Var Question Answer Options C2 If the household receive cash assistance
because of the COVID-19 pandemic, what did you spend most of it on? Answer options can be read to the respondent for probing purpose. There can be more than one answer. Not including the Smart Indonesia Program (Program Indonesia Pintar/PIP)
A. Groceries and daily expenses B. Utilities C. Cell phone credit or internet package D. Transportation expenses E. Health expenses F. Education expenses G. House or room rent payments H. Donation or charitable expenses I. Seed money J. Installments or debt repayments
C3
Since April 2020, has this household received the following social assistance programs from the government?
a. Staple food assistance 1. Yes 2. No
b. Internet package assistance from government/school/education institution
1. Yes 2. No 96. Irrelevant
c. Income or business tax deduction 1. Yes 2. No 96. Irrelevant
d. Deferment of installments
1. Yes 2. Didn’t make use of it or did not receive even
though under an installment plan 96. Irrelevant
C4 What is the installed capacity of the PLN’s (State-Owned ElectriScity Company) electricity in this house?
1. 450 watts 2. 900 watts 3. 1,300 watts →→ C_Check2 4. 2,200 watts →→ C_Check2 5. More than 2,200 watts →→ C_Check2 6. Do not have an electricity meter/use
neighbors’ electricity →→ C_Check2 7. Not using electricity from PLN/no electricity
at this house →→ C_Check2 C5 If the household has 450 watts or 900 watts
electricity [C4=1,2], since April 2020, has the household received free electricity or electricity bill discounts?
1. Yes 2. No 8. Don’t know
C_Check_2 INTERVIEWER’S NOTE: HAS THE HOUSEHOLD RECEIVE SOCIAL ASSISTANCE OR EXTERNAL ASSISTANCE? Requirement: at least one C1 or C3 or C5 question is answered “Yes”
1. Yes 2. No
C6 According to you, how is the disbursement of the social assistance (cash or staple food packages) in your neighborhood?
1. Very fair 2. Fair enough 3. Not really fair → C6_2 4. Unfair → C6_2 5. Know about the social assistance disbursed
in the neighborhood but do not know about its disbursement process → C7
6. Never heard of any social assistance disbursement → C7

70 Analysis of the Social and Economic Impacts of COVID-19 on Households and Strategic Policy Recommendations for Indonesia
Page 6 Of 24
Var Question Answer Options C6_1 Why do you think it is fair?
Answer options can be read to the respondent for probing purposes. There can be more than one answer.
A. Neighborhood (RT1/RW2) officers conducted meetings
B. Neighborhood (RT/RW) officers checked each family’s condition
C. Poor families received assistance D. The available assistance was distributed
fairly V. Others
Whichever is the answer, → C7
C6_2 Why do you think it is not fair? Answer options can be read to the respondent for probing purposes. There can be more than one answer.
A. The system is fair but there is a limited amount/stock of social assistance
B. Neighborhood officers prioritized their families
C. There are poor families who did not receive assistance
D. Data is not updated E. The available assistance was distributed
equally F. The same person received some/many
assistance programs V. Others
C7 Do you think your household right now needs
assistance from the government? 1. Yes 2. No → C9
C8 If you think they do [C7=1], what kind of assistance does your household need the most?
1. Money 2. Staple food 3. Electricity bill discount 4. Deferment of installments 5. Seed money assistance 6. Reduction in Education fee/other forms of
assistance for education fees 7. Subsidies for cell phone credit or internet
package 8. Healthcare equipment/services 95. Others
C9 Since April 2020, has your household received assistance from your extended family or neighbors? Answer options can be read to the respondent for probing purpose. There can be more than one answer.
A. Yes, in the form of money B. Yes, in the form of staple food or basic daily
needs C. Yes, in the form of services D. Yes, in the form of other goods W. No
C10 Since April 2020, has your household received assistance from corporations, charitable organizations, or NGOs? Answer options can be read to the respondent for probing purpose. There can be more than one answer.
A. Yes, in the form of money B. Yes, in the form of staple food C. Yes, in the form of services D. Yes, in the form of healthcare equipment E. Yes, in the form of other goods W. No
C_Check_3 INTERVIEWER’S NOTE IS THE ANSWER IN C_Check_2, ANSWER = 1? Crosscheck:
1. Yes 2. No →→ MODULE D
1Rukun tetangga, or neighborhood unit, is the smallest unit of local administration consisting of a number of households. 2Rukun warga, is a unit of local administration consisting of several RT (neighborhood units) within a kelurahan.

Analysis of the Social and Economic Impacts of COVID-19 on Households and Strategic Policy Recommendations for Indonesia 71
Page 7 Of 24
Var Question Answer Options - If C_CHECK2=1, AND C9=W AND
C10=W →→ ONLY OPEN OPTIONS 5&6 - If C_CHECK2=2, AND C9≠W OR
C10≠W →→ ONLY OPEN OPTIONS 7&8 - If C_CHECK2=1, AND C9≠W OR
C10≠W →→ OPEN ALL OPTIONS (1–4)
C11 How helpful has the assistance from the government or the other parties been in meeting the daily needs of your household?
1. Received assistance from both, but the government assistance is more helpful
2. Received assistance from both, but the assistance from nongovernmental organization is more helpful
3. Received assistance from both and they are equally helpful
4. Received assistance from both and none of them are helpful
5. Only received government assistance and it is helpful
6. Only received government assistance but it is not helpful
7. Only received assistance from the other parties and it is helpful
8. Only received assistance from the other parties but it is not helpful
MODULE D. HOUSEHOLD CONSUMPTION AND FINANCE
Var Question Answer Options
D1 In the past week, what most often determines the food to be eaten/cooked every day?
1. Household head’s appetite 2. Another household adult’s appetite 3. Household children’s appetite 4. Every member’s appetite (cook many types
of meals) 5. What is available at the house on that day 6. What is sold at the market/seller 7. Grocery money sufficiency 95. Others
D2 Next, I would like to ask some questions about access to food between the period of April and October 2020.
a. Since April 2020, have you or other members of the household ever been worried that you will not have enough food/grocery stocks to eat because of lack of money or other resources?
1. Yes, because of the COVID-19 pandemic 2. Yes, because of other reasons 3. No 8. Don’t know 97. Refuse to answer
b. Since April 2020, have you or other members of the household ever been unable to eat healthy and nutritious food because of lack of money or other resources?
1. Yes, because of the COVID-19 pandemic 2. Yes, because of other reasons 3. No 8. Don’t know 97. Refuse to answer
c. Since April 2020, have you or other members of the household ever eaten an unvaried diet because of lack of money or other resources?
1. Yes, because of the COVID-19 pandemic 2. Yes, because of other reasons 3. No 8. Don’t know 97. Refuse to answer
d. Since April 2020, have you or other members of the household skipped a meal on a particular day because of lack of money or other resources to get food?
1. Yes, because of the COVID-19 pandemic 2. Yes, because of other reasons 3. No 8. Don’t know 97. Refuse to answer
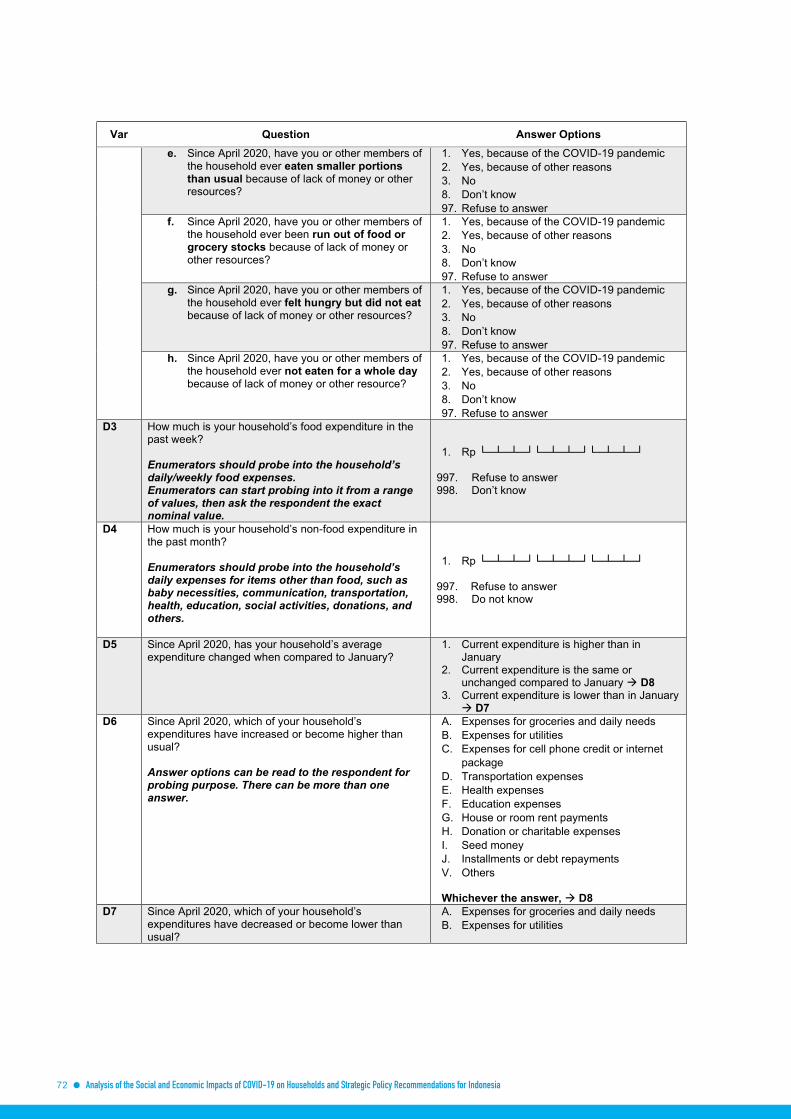
72 Analysis of the Social and Economic Impacts of COVID-19 on Households and Strategic Policy Recommendations for Indonesia
Page 8 Of 24
Var Question Answer Options
e. Since April 2020, have you or other members of the household ever eaten smaller portions than usual because of lack of money or other resources?
1. Yes, because of the COVID-19 pandemic 2. Yes, because of other reasons 3. No 8. Don’t know 97. Refuse to answer
f. Since April 2020, have you or other members of the household ever been run out of food or grocery stocks because of lack of money or other resources?
1. Yes, because of the COVID-19 pandemic 2. Yes, because of other reasons 3. No 8. Don’t know 97. Refuse to answer
g. Since April 2020, have you or other members of the household ever felt hungry but did not eat because of lack of money or other resources?
1. Yes, because of the COVID-19 pandemic 2. Yes, because of other reasons 3. No 8. Don’t know 97. Refuse to answer
h. Since April 2020, have you or other members of the household ever not eaten for a whole day because of lack of money or other resource?
1. Yes, because of the COVID-19 pandemic 2. Yes, because of other reasons 3. No 8. Don’t know 97. Refuse to answer
D3 How much is your household’s food expenditure in the past week? Enumerators should probe into the household’s daily/weekly food expenses. Enumerators can start probing into it from a range of values, then ask the respondent the exact nominal value.
1. Rp └─┴─┴─┘└─┴─┴─┘└─┴─┴─┘ 997. Refuse to answer 998. Don’t know
D4 How much is your household’s non-food expenditure in the past month? Enumerators should probe into the household’s daily expenses for items other than food, such as baby necessities, communication, transportation, health, education, social activities, donations, and others.
1. Rp └─┴─┴─┘└─┴─┴─┘└─┴─┴─┘ 997. Refuse to answer 998. Do not know
D5 Since April 2020, has your household’s average expenditure changed when compared to January?
1. Current expenditure is higher than in January
2. Current expenditure is the same or unchanged compared to January → D8
3. Current expenditure is lower than in January → D7
D6 Since April 2020, which of your household’s expenditures have increased or become higher than usual? Answer options can be read to the respondent for probing purpose. There can be more than one answer.
A. Expenses for groceries and daily needs B. Expenses for utilities C. Expenses for cell phone credit or internet
package D. Transportation expenses E. Health expenses F. Education expenses G. House or room rent payments H. Donation or charitable expenses I. Seed money J. Installments or debt repayments V. Others Whichever the answer, → D8
D7 Since April 2020, which of your household’s expenditures have decreased or become lower than usual?
A. Expenses for groceries and daily needs B. Expenses for utilities

Analysis of the Social and Economic Impacts of COVID-19 on Households and Strategic Policy Recommendations for Indonesia 73
Page 9 Of 24
Var Question Answer Options
Answer options can be read to the respondent for probing purpose. There can be more than one answer.
C. Expenses for cell phone credit or internet package
D. Transportation expenses E. Health expenses F. Education expenses G. House or room rent payments H. Donation or charitable expenses I. Seed money J. Installments or debt repayments V. Others
D8 Since April 2020, what have been the sources of your household’s income? Answer options can be read to the respondent for probing purpose. There can be more than one answer.
A. Profit from business operation, including earning from farming
B. Salary, wage, or allowance C. Pension → D12 D. Financial assistance from relatives → D12 E. Cash assistance from the government →
D12 F. Cash assistance from donators or NGOs →
D12 G. Scholarship money → D12 H. Return on investment → D12 V. Others → D12 W. No income at all → D12
D9 Since April 2020, has your household’s average income from working or business changed when compared to January?
1. Current income is higher than in January 2. Current income is the same or unchanged
compared to January → D11 3. Current income is lower than in January
D10 If your household’s income from working or business has changed, what is the average percentage of the change? Enumerators should probe into the income change from the nominal value of the January income and the average incomes from April up to present time.
1. └─┴─┴─┘ %
997. Refuse to answer 998. Don’t know
D11 In the past month, how much is the total net income from working or business by all members of the household? Enumerators can start probing into it from a range of values, then ask the respondent the exact nominal value.
1. Rp └─┴─┴─┘└─┴─┴─┘└─┴─┴─┘ 997. Refuse to answer 998. Don’t know
D12 Since April 2020, what have the household members been doing to make ends meet?
Answer options can be read to the respondent for probing purpose. There can be more than one answer.
A. Borrowing money from relatives or friends B. Borrowing money from a bank or a loan
shark C. Looking for side jobs D. Preparing/setting up a new business E. Seeking/applying for assistance from the
government F. Seeking/applying for assistance from
nongovernmental parties G. Using severance or savings H. Changing the allocation of consumption I. Reducing food expenditures J. Reducing non-food expenditures K. Selling or pawning belongings L. None of the above W. Not applicable because the household’s
needs are met D_CHECK_1
INTERVIEWER’S NOTE Has the household changed consumption allocation or reduced food expenditures (D12==H,I)?
1. Yes 2. No →→ D14
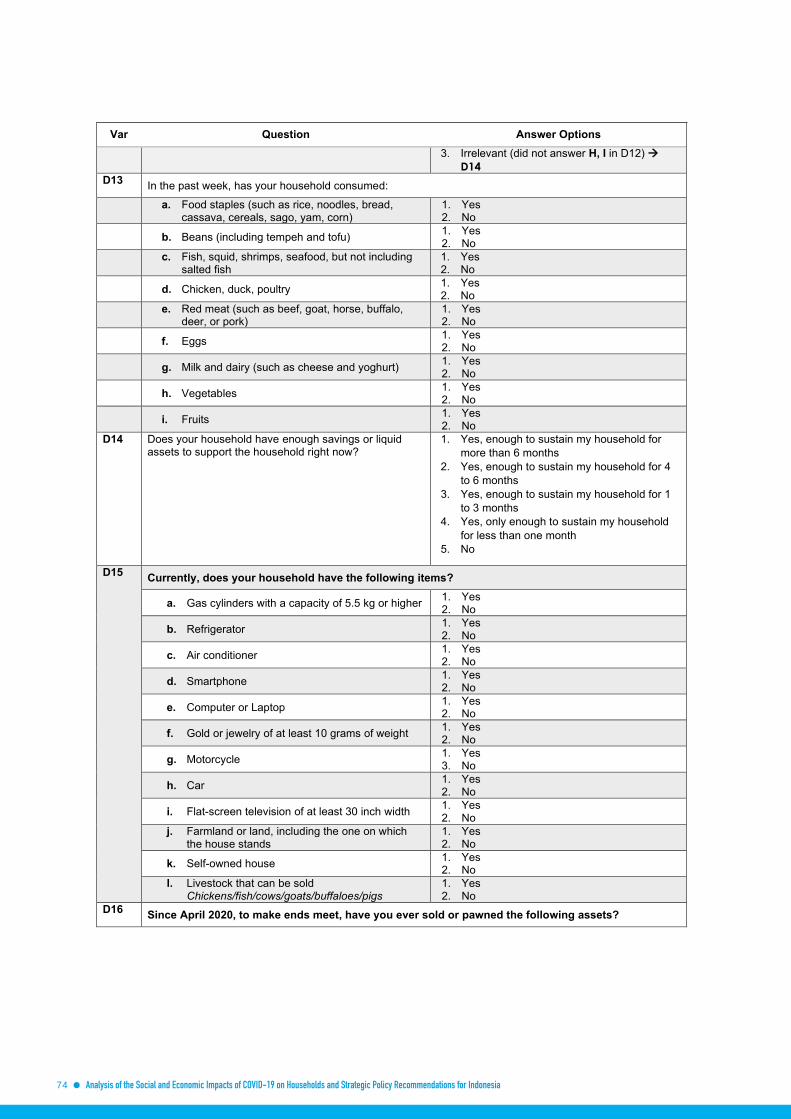
74 Analysis of the Social and Economic Impacts of COVID-19 on Households and Strategic Policy Recommendations for Indonesia
Page 10 Of 24
Var Question Answer Options
3. Irrelevant (did not answer H, I in D12) →→ D14
D13 In the past week, has your household consumed:
a. Food staples (such as rice, noodles, bread, cassava, cereals, sago, yam, corn)
1. Yes 2. No
b. Beans (including tempeh and tofu) 1. Yes 2. No
c. Fish, squid, shrimps, seafood, but not including salted fish
1. Yes 2. No
d. Chicken, duck, poultry 1. Yes 2. No
e. Red meat (such as beef, goat, horse, buffalo, deer, or pork)
1. Yes 2. No
f. Eggs 1. Yes 2. No
g. Milk and dairy (such as cheese and yoghurt) 1. Yes 2. No
h. Vegetables 1. Yes 2. No
i. Fruits 1. Yes 2. No
D14 Does your household have enough savings or liquid assets to support the household right now?
1. Yes, enough to sustain my household for more than 6 months
2. Yes, enough to sustain my household for 4 to 6 months
3. Yes, enough to sustain my household for 1 to 3 months
4. Yes, only enough to sustain my household for less than one month
5. No
D15 Currently, does your household have the following items?
a. Gas cylinders with a capacity of 5.5 kg or higher 1. Yes 2. No
b. Refrigerator 1. Yes 2. No
c. Air conditioner 1. Yes 2. No
d. Smartphone 1. Yes 2. No
e. Computer or Laptop 1. Yes 2. No
f. Gold or jewelry of at least 10 grams of weight 1. Yes 2. No
g. Motorcycle 1. Yes 3. No
h. Car 1. Yes 2. No
i. Flat-screen television of at least 30 inch width 1. Yes 2. No
j. Farmland or land, including the one on which the house stands
1. Yes 2. No
k. Self-owned house 1. Yes 2. No
l. Livestock that can be sold Chickens/fish/cows/goats/buffaloes/pigs
1. Yes 2. No
D16 Since April 2020, to make ends meet, have you ever sold or pawned the following assets?

Analysis of the Social and Economic Impacts of COVID-19 on Households and Strategic Policy Recommendations for Indonesia 75
Page 11 Of 24
Var Question Answer Options
a. Jewelry 1. Yes 2. No 96. Inapplicable
b. Vehicles 1. Yes 2. No 96. Inapplicable
c. Electrical home appliances 1. Yes 2. No 96. Inapplicable
d. House or land 1. Yes 2. No 96. Inapplicable
e. Livestock Make sure that the livestock is sold for daily needs and not because of Eid al-Adha or other ceremonials
1. Yes 2. No 96. Inapplicable
D17 Before April 2020, were there household members of yours who were in debt or took out a noncommercial loan and, since then, have been paying off the debt/loan in installments until now? Debt or loan for consumptive purpose; commercial loan not included.
1. Yes, and have been paying the installments regularly
2. Yes, but unable to pay the installments 3. Yes, and it is temporarily suspended 4. No debts that started before April
D18 Since April 2020, have any household members of yours been newly in debt or taken out a new noncommercial loan? Debt or loan for consumptive purpose; commercial loan not included.
1. Yes, and have been paying the installments regularly
2. Yes, but unable to pay the installments 3. Yes, and it is temporarily suspended 4. No debts that started since April
MODULE E. CHILDREN AND EDUCATION (Children = household members under 18 years of age)
Var Question Answer options
E1 How many household members of yours are children between 13 and 17 years of age?
└─┴─┘ children
E2 How many household members of yours are children between 5 and 12 years of age?
└─┴─┘ children
E3 How many household members of yours are children between 0 and 4 years of age?
└─┴─┘ children
E_Check_1 INTERVIEWER’S NOTE DOES THIS HOUSEHOLD HAVE CHILDREN AGED 0–4?
1. Yes 2. No →→ E_Check_2
E4 If there are children under 5 years old, In the last month, does the child in your household eat regularly like other members of the household?
1. Yes, same as other member of the household →→ E_Check_2
2. No
E5 If the child consumes differently than other members of the household [E4=2], what is the reason? Answer options can be read to the respondent for probing purpose. There can be more than one answer.
A. The child consumes more animal protein B. The child consumes more vegetables C. The child consumes more fruit D. The child only likes certain types of food E. The child has an allergy F. The child is under 6 months old or has not
consumed food substitution for breast milk (MPASI)

76 Analysis of the Social and Economic Impacts of COVID-19 on Households and Strategic Policy Recommendations for Indonesia
Page 12 Of 24
Var Question Answer options
V. Others
E_Check_2 CAPI: IF E1+E2+E3=0 THEN PROCEED TO E16
E6 Since April 2020, who usually been taking care of the children and accompanying or helping them study? Answer options can be read to the respondent for probing purpose. There can be more than one answer.
A. Father of the children B. Mother of the children C. Elder brothers/sisters of the children D. Other male adults of the household
members E. Other female adults of the household
members F. Relatives/neighbors not in this household G. Children study alone/unaccompanied V. Others W. Irrelevant (no children in school)
E7 Since April 2020, what are your top three concerns regarding the life of the children of this household?
A. Children not being able to play outside the house
B. Children’s learning process being disrupted C. Children being disturbed emotionally D. Children eating less than the usual/not
being able to eat regularly E. Children getting sick easily F. Children being infected with COVID-19 G. Children too much playing with cell phones
or watching TV H. Children lacking physical activities I. Children lacking for socialization and
interaction with their peers V. Others W. None
E8 Since April 2020, in general, what behavior changes have the children exhibited?
A. Become angry or rebellious more often B. Become sad or moody more often C. Find it harder to concentrate D. Find it harder to eat E. Find it harder to sleep F. Become lazier W. No changes
E9 Are there any children in this household who is currently attending school in elementary, junior or high school level for the year 2020/2021?
A. Yes, Elementary school or education of the same level (MI/Paket A) └─┴─┘ children
B. Yes, Junior high school or education of the same level (MTs/Paket B) └─┴─┘ children
C. Yes, Senior high school or education of the same level (SMK/MA/Paket C)
└─┴─┘ children
D. None →→ E14
E10 Since the implementation of learning from home, what constraints your household members have been faced with? Referring to the children and the other household members as well. Answer options
A. Not having the necessary devices B. Having to take turns to use the necessary
devices at home C. Limited access to internet (either data
package or the internet network/signal) D. Home/surrounding condition not being
conducive to learning activities

Analysis of the Social and Economic Impacts of COVID-19 on Households and Strategic Policy Recommendations for Indonesia 77
Page 13 Of 24
Var Question Answer options
can be read to the respondent for probing purpose. There can be more than one answer.
E. Children being less motivated to learn F. Parents’ limited time to accompany/teach
the children G. Parents’ limited capacity to teach the
children H. Not having any problems →→ E12 W. Irrelevant (do not learn from home, already
resume face-to-face learning) →→ E12
E11 If the household is being faced with constraints [E10 ≠ H,W], what have the parents done to overcome the constraints? Answer options can be read to the respondent for probing purpose. There can be more than one answer.
A. Buying a smartphone or laptop B. Borrowing the necessary devices from
relatives/neighbors C. Subscribing to a Wi-Fi or cable internet
provider D. Asking the children to study at another
place that has internet access E. Accompanying or helping the children to
learn F. Making deals with the children in the forms
of, for example, rewards, previously decided playtimes, or scheduled routines
G. Rebuking or hitting the children, or pinching them on the ear
H. Telling the children what to do I. Communicating with or consulting the
teachers J. Paying teachers to come and teach the
children at home or finding the children a course place for extra lesson
W. Nothing E12 Is the household having difficulties with the
children's educational costs, including school fees, books, learning devices, and cellphone credit?
1. Yes 2. No → E14
E13 If you are having difficulties with the children’s educational costs [E12 = 1], what steps have the household taken? Answer options can be read to the respondent for probing purpose. There can be more than one answer.
A. Adjusting the allocation of funds for other expenses/tightening belts
B. Applying for school fees relief C. Asking for assistance from the schools D. Sending the children to other schools E. Homeschooling the children F. Making the boys quit school G. Making the girls quit school H. Borrowing money or asking for financial
assistance from relatives I. Borrowing money from non-familial parties J. Seeking to earn additional incomes K. Pawning or selling assets/belongings
E14 Are there any children of this household who do not continue their education to elementary, junior high, or senior high levels in this 2020/2021 academic year?
A. Yes, boys B. Yes, girls C. No →→ E16
E15 If there are children who do not continue their education in this academic year [E14 = A,B], what has been the cause? Answer options can be read to the respondent for probing purpose. There can be more than one answer.
A. Too young or not getting a seat for new students’ position according to the zoning system based on age
B. Disability/illness C. Failed to achieve the required passing
grade D. No schools around/schools being too far
from home E. Unable to pay school fees F. Worried about possible COVID-19 infection

78 Analysis of the Social and Economic Impacts of COVID-19 on Households and Strategic Policy Recommendations for Indonesia
Page 14 Of 24
Var Question Answer options
G. Finding it difficult to follow a distant learning system
H. Working I. Assuming the task/responsibility to perform
household chores J. Getting married K. Bullying L. Not interested in school or not considering
education an important thing E16 If there is a household in your neighborhood that faces the impact of COVID-19 pandemic,
loses their income, do they usually do the following things?
a. Leaving their children in the care of a relative who is better off
1. Yes, for boys 2. Yes, for girls 3. Yes, for boys and girls 4. No 8. No idea
b. Sending their children to an Islamic boarding school or other informal educational institutions
1. Yes, for boys 2. Yes, for girls 3. Yes, for boys and girls 4. No 8. No idea
c. Leaving their children in the care of an orphanage
1. Yes, for boys 2. Yes, for girls 3. Yes, for boys and girls 4. No 8. No idea
d. Asking their children to work
1. Yes, for boys 2. Yes, for girls 3. Yes, for boys and girls 4. No 8. No idea
e. Marrying the children
1. Yes, for boys 2. Yes, for girls 3. Yes, for boys and girls 4. No 8. No idea
MODULE F. HEALTH
Var Question Answer Options
F1 Since April 2020, has any household member of yours visited/accessed healthcare facilities, such as posyandu (integrated health service posts), puskesmas (community health centers), hospitals, and clinics or being visited by a health worker?
1. Yes 2. No →→ F4
F2 If any of your household members have accessed healthcare facilities [F1 = 1], what facilities did she/he visit?
Answer options can be read to the respondent for probing purpose. There can be more than one answer.
A. Public hospital B. Private hospital C. Private practice (doctor/midwife) D. Clinic/general practice E. Puskesmas or pustu (secondary community health
centers) F. Community-Resourced Health Initiative/UKBM
(poskesdes or village health post, polindes or village maternity center, posyandu, and treatment center)
G. Traditional healing clinic, mantri (a doctor’s assistant or head of nurses)

Analysis of the Social and Economic Impacts of COVID-19 on Households and Strategic Policy Recommendations for Indonesia 79
Page 15 Of 24
Var Question Answer Options H. Pharmacy, laboratory, physical therapy clinic
F3 For what purpose did your household members visit the healthcare facilities?
Answer options can be read to the respondent for probing purpose. There can be more than one answer.
A. Immunization B. Birth control services (keluarga berencana) C. Pregnancy monitoring/examination, childbirth, and
post-delivery services D. Regular treatment or therapy, health checkup E. Checking herself/himself on the ailments felt F. Having surgery or inpatients (childbirth not
included) G. Treatment for COVID-19 H. Going for a health certificate request I. Having a COVID-19 test (rapid or swab)
F4 Since April 2020, has any household member of yours used application-based online health services for things, such as consultation and buying medicine?
1. Yes 2. No
F5 Since April 2020, has there been any household member of yours who needed a health service but did not get it? Including those who, for example, did not access health services for fear of COVID-19 infection.
1. Yes 2. No →→ F8
F6 If any of your household members did not get a health service they needed [F5 = 1], which health service was it? Answer options can be read to the respondent for probing purpose. There can be more than one answer.
A. Immunization B. Birth control services (Keluarga Berencana) C. Pregnancy monitoring/examination, childbirth, and
post-delivery services D. Regular treatment or therapy, health checkup E. Checking herself/himself on the ailments felt F. Having surgery or inpatients (childbirth not
included) G. Treatment for COVID-19 H. Going for a health certificate request I. Having a COVID-19 test (rapid or swab)
F7 What was the reason or the cause of the household members not getting the health service they needed? Answer options can be read to the respondent for probing purpose. There can be more than one answer.
A. Being afraid to visit healthcare facilities for fear of being infected with COVID-19
B. Not having enough money for treatment cost C. Not being covered by the insurance or BPJS
Kesehatan D. Not having enough money for transportation cost or
not having the means of transportation E. Not having someone to accompany herself/himself F. Services needed being unavailable, or the
healthcare facilities ran out of vaccines/medicine G. Healthcare facilities being closed or not accepting
general patients H. Already done self-medication to treat the ailments
or did not feel necessary to go to the health facilities
F8 Since April 2020, has any adult household member of yours felt unhappy, depressed, or experienced excessive anxieties? Answer options can be read to the respondent for probing purpose. There can be more than one answer.
A. Yes, head of the household B. Yes, wife/husband C. Yes, head of the household’s son or son-in-law D. Yes, head of the household’s daughter or daughter-
in-law E. Yes, head of the household’s father or father-in-law F. Yes, head of the household’s mother or mother-in-
law G. Other male family members H. Other female family members
80 Analysis of the Social and Economic Impacts of COVID-19 on Households and Strategic Policy Recommendations for Indonesia
Page 16 Of 24
Var Question Answer Options V. Yes, others (people with no family relationships
with the head of the household) W. None → F11
F9 What are the reasons why the member of your household exhibits those behaviors? Answer options can be read to the respondent for probing purpose. There can be more than one answer.
A. A family member or acquaintance was infected with the coronavirus
B. Worriedness about being infected with COVID-19 and family’s death risk
C. Money and job issues D. Children care, development and education issues E. Household issues (fight, divorce, affairs, etc.) Y. Don’t know
F10 If there is a household member who feels anxious, who has provided moral support or counseling? Answer options can be read to the respondent for probing purpose. There can be more than one answer. Include accessing health facilities.
A. Family or relatives B. Friends or neighbors C. Religious or community leaders D. NGOs E. Health workers such as doctors F. Psychologist or psychiatrist G. No one H. Doesn’t need external support
F11 Since April 2020, has there been any argument between you and your spouse, or between the members of this household?
1. Yes 2. No → MODUL G 97. Refuse to answer → MODUL G
F12 During the COVID-19 pandemic, how frequent do arguments occur between members of this household?
A. More often with the spouse B. More often with children C. More often with other household members D. Just the same with the spouse E. Just the same with children F. Just the same with other household members G. Less often with the spouse H. Less often with children I. Less often with other household members X. Refuse to answer
MODULE G. DISABILITY
Var Question Answer options
G1 Have any members of this household experienced any of the following with much or no difficulty?
A. Having difficulty or problems with vision B. Having difficulty or problems with hearing C. Having difficulty or problems with walking or taking
the stairs D. Having difficulty or problems with using or moving
hands and fingers E. Having difficulty or problems with memory or
concentration F. Having behavioral and/or emotional problems G. Having difficulty or problems with speaking and/or
understanding/communicating with others H. Having difficulty or problems with taking care of
oneself (such as showering, eating, dressing, urinate, defecate)
X. Do not know →→ MODULE H Y. Not applicable (no one with disabilities) →→
MODULE H G2 Who are the household members with
disabilities? A. Toddlers (2–4 years old) →→ G4 B. Children (5–17 years old) C. Adults (18–59 years old) D. The elderly (60 years old and above)

Analysis of the Social and Economic Impacts of COVID-19 on Households and Strategic Policy Recommendations for Indonesia 81
Page 17 Of 24
Var Question Answer options G3 About the households having members with
disabilities, in doing their daily activities, do they need help from others, or are they able to do the activities by themselves?
A. Fully independent B. Not yet independent, still need companion for
some activities C. Totally dependent on the companions
G4 To the households having members with disabilities, what is the most badly affected or disturbed by the COVID-19 pandemic?
1. Daily activities (worship, gathering) 2. Working activities 3. Access to medicine, therapy services or healthcare
facilities 4. Psychological disturbances (eating disorder,
trouble sleeping, etc.) 5. Access to clean water and sanitation 95. Others 96. None
G5 Since April 2020, what assistance have your households members with disabilities received regarding the COVID-19 pandemic?
Answer options can be read to the respondent for probing purpose. There can be more than one answer.
A. Cash (including PKH) B. Groceries/food C. Vitamins/medicines D. Medical equipment (wheelchairs, prosthetic legs,
hearing aid, etc.) E. Skill training for work F. Skill training for independent therapy V. Others W. Not receiving any assistance →→ G7
G6 If they have received assistance [G5 ≠ W], where did the assistance come from? Answer options can be read to the respondent for probing purpose. There can be more than one answer.
A. Central/Regional Government B. Village government C. Private companies D. NGOs E. Individual F. No idea
G7 Have your household having members with disabilities ever received dissemination on COVID-19 prevention specifically for people with disabilities by meeting them in person?
1. Yes 2. No →→ G9
G8 If they have received dissemination [G6 = 1], who organized the dissemination?
Answer options can be read to the respondent for probing purpose. There can be more than one answer.
A. Village officers B. Health workers C. Disability Facilitator from Ministry of Social Affairs D. Local Community E. Non-Government Organizations (NGOs) F. CSR team of a company G. Family v. Other
G9 Are there currently any household members with disabilities who have difficulty visiting health facilities because of the COVID-19 pandemic?
1. Yes 2. No →→ G11
G10 If persons with disabilities experience difficulties [G9 = 1], what are the complaints? Answer options can be read to the respondent for probing purpose. There can be more than one answer.
A. Did not visit health facilities because of fear of being infected with COVID-19
B. Visiting hours are highly limited C. Facilities needed are not available/scarce D. Health facilities are closed or did not accept
general patients E. The number of medical personnel is limited
because of the pandemic, resulting in long queues F. Costs rise G. Patients with disabilities are not accepted H. Access to transportation to health facilities are
difficult V. Other

82 Analysis of the Social and Economic Impacts of COVID-19 on Households and Strategic Policy Recommendations for Indonesia
Page 18 Of 24
Var Question Answer options G11 Are there any households members with
disabilities who need to attend facilitation or therapy regularly, at least every 3 months?
1. Yes 2. No → MODULE H
G12 If they need it [G11 = 1], how did the COVID-19 pandemic affect the facilitation or therapy for the person with disability? Answer options can be read to the respondent for probing purpose. There can be more than one answer.
A. Service duration is reduced B. Service is abolished C. Service rate increases D. Services are carried out online E. Household members have to facilitate or provide
therapy F. No professional services can be accessed v. Other
MODULE H. EMPLOYMENT
Var Question Answer options
H1 Since April 2020, who has been working to earn income for this household? Make sure:
1. If the respondent or any household member has a business or side job
2. If there are any children or household members who help with work
A. Household head B. Wife/husband of the household head C. Son or son-in-law of the household head D. Daughter or daughter-in-law of the household
head E. Father or father-in-law of the household head F. Mother or mother-in-law of the household head G. Another male household member H. Another female household member V. Other/not a member of this household W. No one is working →→ H3
H2 How many of your household members work to earn income? └─┴─┘ people
H3 Since April 2020, who has been the main breadwinner in this household? The main breadwinner is the person who has the greatest contribution to financing household needs.
1. Household head 2. Wife/husband 3. Son or son-in-law 4. Daughter or daughter-in-law 5. Father or father-in-law 6. Mother or mother-in-law 7. Other male family members 8. Other female family members 95. Others 96. Nobody is working or acting as the main
breadwinner →→ H5 H4 In the past week, did the main breadwinner work? 1. Yes →→ H_check1
2. No H5 If he/she did not work [H1=W or H4=2], in the
past week, does the main breadwinner have a job/business, yet he/she temporarily does not work? Including if he/she is temporarily laid off /sent home without confirmation of termination
1. Yes 2. No →→ H_Check1
H6 Is the main reason the main breadwinner is temporarily not working for the past week related to the COVID-19 pandemic?
1. Yes 2. No →→ H_check1
H7 If the main breadwinner is temporarily not working because of the COVID-19 pandemic, what month did they last work?
1. March 2020 2. April 2020 3. May 2020 4. June 2020 5. July 2020 6. August 2020 7. September 2020

Analysis of the Social and Economic Impacts of COVID-19 on Households and Strategic Policy Recommendations for Indonesia 83
Page 19 Of 24
Var Question Answer options 8. October 2020
H8 Does the main breadwinner still earn income/salary/wages during the period when he/she temporarily does not work?
1. Yes, and the amount is the same 2. Yes, but the amount is reduced 3. No
H9 Is there any guarantee that the main breadwinner can return to work at the current business unit/workplace?
1. Yes 2. No 8. Don’t know
H_Check1
INTERVIEWER’S NOTE IS THE MAIN BREADWINNER WORKING IN THE LAST WEEK OR USUALLY WORKED BUT DID NOT WORK IN THE LAST WEEK? Requirement: H4=1 or H5=1
1. Yes 2. No → H17
H10 In the past week, what was the main breadwinner's line of business/field of job? If the main breadwinner is temporarily not working, then the information regarding the job is inputted with the information regarding the job the respondent has temporarily left
1. Agriculture, Plantation, Forestry, Hunting & Fisheries
2. Mining and Quarrying 3. Industry 4. Utilities 5. Construction 6. Trade, Restaurants and Accommodation
Services 7. Transportation, Warehousing, and
Communication 8. Financial Institutions, Real Estate, Rental
Business & Corporate Services 9. Community, Social and Individual Services
H11 What was the status/position of the main breadwinner in his/her main job?
1. Self employed 2. Employer assisted by temporary
workers/unpaid/family workers 3. Employer assisted by permanent/paid workers 4. Laborer/employee 5. Casual employee in agriculture sector 6. Casual employee in non-agriculture sectors 7. Family/unpaid worker
H12 How many hours did the main breadwinner work in the past week? Start probing from day and hour of work. How many days did he/she work in a week? How many hours did he/she work in a day? Break time is not included. If the main breadwinner is currently not working, then the information regarding the job is inputted with the information on the number of working hours in a week.
1. └─┴─┴─┘hours 888. Don’t know
H13 Is the main breadwinner working from home? Workplace can be offices, factories, markets, rice fields, the sea, etc.
1. Completely working from home since before the pandemic/April 2020
2. Completely working from home since the pandemic/April 2020
3. Alternately working from home and at workplace
4. Completely working at workplace H14 If he/she was working as a laborer/casual
employee [H11=4,5,6], on what basis was the fee or remuneration paid for the job?
1. Monthly 2. Weekly 3. Daily 4. Lump-sum 5. Paid per unit of deliverables 6. Commissions or tips 7. Seasonal 96. Irrelevant →→ H16

84 Analysis of the Social and Economic Impacts of COVID-19 on Households and Strategic Policy Recommendations for Indonesia
Page 20 Of 24
Var Question Answer options H15 If he/she was working as a laborer/casual
employee [H11=4,5,6], what was the impact of COVID-19 pandemic the main breadwinner felt most as an employee?
1. Salary and allowances increased 2. Salary and allowances were
reduced/deducted 3. Temporarily laid off 4. Terminated by the company (permanent
layoffs) 5. Working at home is less conducive 6. No jobs were offered/number of jobs declined 95. Other 96. Not affected
H16 Does the main breadwinner have a side job/business?
A. Yes, since before April 2020 B. Yes, since April 2020 C. No
H17 Is the main breadwinner looking for work? 1. Yes, since before April 2020 2. Yes, since April 2020 3. No
H18 Is the main breadwinner setting up a business? If the business is already running, choose “No”.
1. Yes, since before April 2020 2. Yes, since April 2020 3. No
H_Check2
INTERVIEWER’S NOTE: IS THE MAIN BREADWINNER CURRENTLY LOOKING FOR WORK OR SETTING UP A BUSINESS? Requirement: H17 or H18 is answered 1 or 2
1. Yes 2. No →→ H20
H19 If he/she is looking for a job or setting up a business, what is the main reason for the breadwinner to look for work and/or set up a business?
1. Feeling responsible for earning a living/assisting the economy of households or families
2. Getting more income 3. Current work less appropriate 4. Permanently laid off 5. Business closed 6. Out of/running out of contract 7. Helping others/surrounding neighboorhood 95. Other
H20 Has the main breadwinner ever had a previous job/business?
1. Yes, stopped/changed work/business because of the COVID-19 pandemic
2. Yes, stopped/changed work/business because of other reasons → H24
3. No → H24 H21 If the main breadwinner stop/change
working/business because of The COVID-19 pandemic, what month did he/she last work?
1. March 2020 2. April 2020 3. May 2020 4. June 2020 5. July 2020 6. August 2020 7. September 2020 8. October 2020
H22 What was the main breadwinner's previous line of business/field of job?
1. Agriculture, Plantation, Forestry, Hunting & Fisheries
2. Mining and Quarrying 3. Industry 4. Utilities 5. Construction 6. Trade, Restaurants and Accommodation
Services 7. Transportation, Warehousing, and
Communication 8. Financial Institutions, Real Estate, Rental
Business & Corporate Services 9. Community, Social and Individual Services

Analysis of the Social and Economic Impacts of COVID-19 on Households and Strategic Policy Recommendations for Indonesia 85
Page 21 Of 24
Var Question Answer options H23 What was the status/position of the main
breadwinner in his/her previous job? 1. Self employed 2. Employer assisted by temporary
workers/unpaid/family workers 3. Employer assisted by permanent/paid workers 4. Laborer/employee 5. Casual employee in agriculture sector 6. Casual employee in non-agriculture sectors 7. Family worker/unpaid worker
H24 Since April 2020, have other household members changed jobs or obtained jobs or prepared the business? Answer options can be read to the respondent for probing purpose. There can be more than one answer.
A. Yes, they are looking for a job B. Yes, they have acquired a new job C. Yes, they have acquired a side job D. Yes, they are setting up a business E. Yes, they have opened a new business F. Someone lost a job W. Nothing changes →→ H27
H25 Was the reason the household members changed
job/looked for work/set up a business related to the COVID-19 pandemic?
1. Yes 2. No → H27
H26 If currently setting up a business [H24=D and H25=1 or H18=1,2], where did they get the seed money from? Answer options can be read to the respondent for probing purpose. There can be more than one answer. If the business is already running, there is no need to answer this question (answer the question in Module I)
A. Using savings as seed money B. Selling assets for seed money C. Seeking loans from family or friends for seed
money D. Seeking loans from banks or financial
institutions for seed money E. Seeking loans from government programs
such as KUR, Mekaar, UMI for seed money Y. No idea yet W. Inapplicable
H27 Since April 2020, are there any household members who claim their Old Age Benefit (JHT) from BPJS Ketenagakerjaan after they switch jobs?
1. Yes 2. No 96. Irrelevant because they did not have JHT
H28 Since April 2020, are there any household members who change their BPJS Kesehatan participation status into an independent participant?
1. Yes 2. No 96. Irrelevant because they are not registered as
BPJS Kesehatan participant H29 Is there a household member under 18 years old
who is working or helping with work to earn a living? Answers can be read for probing. There can be more than one answer.
A. Yes, since before April 2020 B. Yes, since April 2020 C. No → MODULE I W. Irrelevant because no household member
under 18 years of age →→ MODULE I
H30 What are the household members’s line of business/field of job? Answers can be read for probing. There can be more than one answer.
A. Agriculture, Plantation, Forestry, Hunting & Fisheries
B. Mining and Quarrying C. Industry D. Utilities E. Construction F. Trade, Restaurants and Accommodation
Services G. Transportation, Warehousing, and
Communication H. Financial Institutions, Real Estate, Rental
Business & Corporate Services I. Community, Social and Individual Services
MODULE I. MICRO AND SMALL ENTERPRISES

86 Analysis of the Social and Economic Impacts of COVID-19 on Households and Strategic Policy Recommendations for Indonesia
Page 22 Of 24
Var Question Answer options
I1 Are there any members of your household who own a business? Enumerator probing, who mainly manages the business. If there is more than one business, choose the main one or the one which give the most profit
1. Yes, a male member of the household 2. Yes, a female member of the household 3. Yes, operated by household members
together 4. Yes, operated by someone else (not a
member of this household) 5. No → MODULE J
I2 When did the business begin? 1. More than 10 years ago 2. 5–10 years ago 3. <5 years ago until before April 2020 4. Starting April 2020
I3 What made this household member decide to start a business? Answers can be read for probing. There can be more than one answer.
A. Losing his/her main income B. Looking for additional income C. Making use of his/her free time D. Inspired by/following colleagues E. Helping others/surrounding neighboorhood F. Additional income v. Others
I4 What is its line of business? If there is more than one business, choose the business the respondent thinks the main one.
1. Agriculture, Plantation, Forestry, Hunting & Fisheries
2. Mining and Quarrying 3. Industry 4. Utilities 5. Construction 6. Trade, Restaurants and Accommodation
Services 7. Transportation, Warehousing, and
Communication 8. Financial Institutions, Real Estate, Rental
Business & Corporate Services 9. Community, Social and Individual Services
I5 How is the business operating currently? Probing, if the business is open, do they apply health protocols, i.e. wearing mask, etc.
1. Open/taking orders as usual 2. Open as usual, while applying health protocols 3. Open for a limited operating hours or with a
limited capacity, while applying health protocols
4. Temporarily closed 95. Others
I6 Since April 2020, is there any difference in how you market your products?? Answer options can be read to the respondent for probing purpose. There can be more than one answer.
A. Adding social media marketing (Instagram, Facebook, Whatsapp, Line)
B. Adding marketplace marketing (Shopee, Tokopedia, Bukalapak.)
C. Adding marketing though online delivery service apps (GoFood, GrabFood, etc.)
D. No changes, already use online platforms before
E. No changes, only conventional marketing (selling products face-to-face)
F. Stockpiling products while waiting for the moment to sell
V. Others
I7 What effects does the COVID-19 pandemic have on the business? Answer options can be read to the respondent for probing purpose. There can be more than one answer.
A. Buyers increase B. Buyers decrease C. Operating and raw material costs increase D. Operating and raw material costs decrease E. Goods delivery/distribution is difficult F. Raw material availability is disrupted G. Revenues increase H. Revenues decrease I. Capital decreases

Analysis of the Social and Economic Impacts of COVID-19 on Households and Strategic Policy Recommendations for Indonesia 87
Page 23 Of 24
Var Question Answer options J. Cannot pay business installment loans V. Others W. Not applicable (not affected by the COVID-19)
I8 If the COVID-19 pandemic affects the business [I7 ≠ W], since April 2020, what strategies have been carried out to deal with it? Answer options can be read to the respondent for probing purpose. There can be more than one answer.
A. Reducing the number of employees (laid off) B. Temporarily laying off some employees C. Increasing the number of employees D. Not paying employees E. Reducing employee salaries F. Raising employee salaries G. Not giving bonuses H. Reducing less important purchases/expenses I. Reducing business hours J. Selling online/via apps K. Reducing seed money/selling assets L. Increasing seed money/buying assets M. Replacing the product N. Temporarily closing business V. Others W. Not applicable (No specific strategy is applied)
I9 Is there a child aged 18 and below who is helping or working in this business? Answer choices can be read for probing. There can be more than one answer.
A. Yes, a child/children in this household B. Yes, a child/children but not from this
household C. No → I11
I10 If yes, do they get paid? Answer choices can be read for probing. There can be more than one answer.
A. Yes, with money B. Yes, with goods C. Uncertain payment D. Unpaid
I11 Where does the business capital used come from? Answer choices can be read for probing. There can be more than one answer.
A. Business profits B. Savings C. Assets D. Family or friends E. Cooperatives F. Commercial banks (Kredit Usaha Rakyat
Program) G. Commercial banks or credit banks (BPR),
programs aside from KUR H. Leasing I. Pawnshops J. Online loans K. Microcredit programs such as: Mekaar, UMI
for seed money L. Loan sharks M. Village-owned enterprises (BUMDes)
I12 Does the business currently have outstanding debts or loans?
A. From family or friends B. From cooperatives C. From commercial banks (Kredit Usaha Rakyat
Program) D. From commercial banks or credit banks
(BPR), programs aside from KUR E. From leasing F. From pawnshops G. From online loans H. From microcredit programs such as: Mekaar,
UMI for seed money I. From loan sharks J. From village-owned enterprises (BUMDes) W. Have no business debts/loans→→ I14
I13 Since April 2020, can you make the next installment payment regularly?
1. Yes, I can 2. No, I can’t

88 Analysis of the Social and Economic Impacts of COVID-19 on Households and Strategic Policy Recommendations for Indonesia
Page 24 Of 24
Var Question Answer options 3. It’s being suspended
I14 Do you know or did you receive any assistance for medium, small-, and micro-scale enterprises (UMKM)?
1. Received cash assistance for UMKM (BLT UMKM/BPUM)
2. Received debt relaxations 3. Received both cash assistance and debt
relaxations 4. Know of, but did not receive it →→ MODUL J 5. Know of, but do not know how to apply →→
MODUL J 6. Know of, but did not apply because it is not
needed →→ MODUL J 98. Do not know about any assistance →→ MODUL
J I15 If you received assistance (I14 = 1,2,3), what is the
assistance used for? Answer choices can be read for probing. There can be more than one answer.
A. As additional capital B. As new capital C. Paying workers D. Paying suppliers E. Paying business installment loans F. Paying marketing costs G. Buying household necessities V. Others
MODULE J. END OF INTERVIEW
C12 How much in total is the social assistance received? (C_Check_1 = at least one C1 question is answered Yes)
1. Rp └─┴─┴─┘└─┴─┴─┘└─┴─┴─┘
999. Refuse to answer 998. No idea
J1 How did this household interview go?
1. Successful and completely filled 2. Incompletely filled 3. Refused (phone number) 4. Moved outside of the census block 5. The household disbanded 6. Cannot be found 7. The household merged with another
household
J2 Is the household willing to be interviewed in more depth through phone calls?
1. Yes 2. No
J3 Fill in the interviewer’s note
J4 Interview is over! Say thank you to the respondent and remind that there will be a follow-up interview through phone calls for three times.
1. Yes 2. No
Interview End Time └─┴─┘. └─┴─┘ Setting GPS Setting Photo
------ END OF INTERVIEW ------


90 Analysis of the Social and Economic Impacts of COVID-19 on Households and Strategic Policy Recommendations for Indonesia
UNITED NATIONS CHILDREN’S FUNDWorld Trade Center (WTC) 2, 22nd FloorJl. Jend. Sudirman Kav 31Jakarta 12910IndonesiaPhone: +62 21 50916100www.unicef.org
UNITED NATIONS DEVELOPMENT PROGRAMMEMenara Thamrin 7-9th FloorJl. MH Thamrin Kav. 3 Jakarta 10250IndonesiaPhone: +62 21 29802300www.id.undp.org
PROSPERA (AUSTRALIA INDONESIA PARTNERSHIP FOR ECONOMIC DEVELOPMENT)International Financial Centre Tower 2, Level 17, Jl. Jendral Sudirman, Kav 22-23Jakarta Selatan, 12920IndonesiaPhone: +62 21 50823500prospera.or.id
THE SMERU RESEARCH INSTITUTEJl. Cikini Raya No. 10A, Jakarta 10330,IndonesiaPhone: +62 21 31936336smeru.or.id
Copyright © 2022 FDOKUMEN