CPFT COVID-19 early impact
29
The early impact of COVID-19 on mental health and community physical health services and their patients’ mortality in Cambridgeshire and Peterborough, UK Shanquan Chen PhD [1] [email protected] ORCID 0000-0002-4724-4892 Peter B. Jones PhD [1, 2] [email protected] ORCID 0000-0002-0387-880X Benjamin R. Underwood PhD [2] [email protected] ORCID 0000-0003-3427-9487 Anna Moore PhD [1, 2] [email protected] ORCID 0000-0001-9614-3812 Edward T. Bullmore PhD [1, 2] [email protected] ORCID 0000-0002-8955-8283 Soumya Banerjee PhD [1] [email protected] ORCID 0000-0001-7748-9885 Emanuele F. Osimo MD [1, 2] [email protected] ORCID 0000-0001-6239-5691 Julia B. Deakin PhD [2] [email protected] ORCID 0000-0001-5093-9911 Catherine F. Hatfield PhD [2] [email protected] Fiona J. Thompson MB ChB [2] [email protected] Jonathon D. Artingstall BSc [2] [email protected] Matthew P. Slann – [2] [email protected] Jonathan R. Lewis BSc [2] [email protected] ORCID 0000-0003-1821-3824 Rudolf N. Cardinal PhD [1, 2, *] [email protected] ORCID 0000-0002-8751-5167 [1] Department of Psychiatry, University of Cambridge, Sir William Hardy Building, Downing Site, Cambridge CB2 3EB. [2] Cambridgeshire & Peterborough NHS Foundation Trust, Fulbourn Hospital, Cambridge CB21 5EF. [*] Corresponding author. • Accepted manuscript (accepted 17 Sep 2020) for Journal of Psychiatric Research, formatted 24 Sep 2020. • Published article DOI: 10.1016/j.jpsychires.2020.09.020 • Keywords: COVID-19/SARS-CoV-2 coronavirus pandemic; depression; anxiety; self-harm; alcohol and substance misuse; suicidality; mortality; severe mental illness (SMI) • “Green” Open Access route. • © 2020. Licensed under the CC BY-NC-ND 4.0 license (http://creativecommons.org/licenses/by-nc-nd/4.0/ ). 1 5 10 15 Page 1 of 29
-
Upload
khangminh22 -
Category
Documents
-
view
3 -
download
0
Transcript of CPFT COVID-19 early impact

The early impact of COVID-19 on mental health and community physical health services and their
patients’ mortality in Cambridgeshire and Peterborough, UK
Shanquan Chen PhD [1] [email protected] ORCID 0000-0002-4724-4892Peter B. Jones PhD [1, 2] [email protected] ORCID 0000-0002-0387-880XBenjamin R. Underwood PhD [2] [email protected] ORCID 0000-0003-3427-9487Anna Moore PhD [1, 2] [email protected] ORCID 0000-0001-9614-3812Edward T. Bullmore PhD [1, 2] [email protected] ORCID 0000-0002-8955-8283Soumya Banerjee PhD [1] [email protected] ORCID 0000-0001-7748-9885Emanuele F. Osimo MD [1, 2] [email protected] ORCID 0000-0001-6239-5691Julia B. Deakin PhD [2] [email protected] ORCID 0000-0001-5093-9911Catherine F. Hatfield PhD [2] [email protected] J. Thompson MB ChB [2] [email protected] D. Artingstall BSc [2] [email protected] P. Slann – [2] [email protected] R. Lewis BSc [2] [email protected] ORCID 0000-0003-1821-3824Rudolf N. Cardinal PhD [1, 2, *] [email protected] ORCID 0000-0002-8751-5167
[1] Department of Psychiatry, University of Cambridge, Sir William Hardy Building, Downing Site, Cambridge CB2 3EB.[2] Cambridgeshire & Peterborough NHS Foundation Trust, Fulbourn Hospital, Cambridge CB21 5EF.[*] Corresponding author.
• Accepted manuscript (accepted 17 Sep 2020) for Journal of Psychiatric Research, formatted 24
Sep 2020.
• Published article DOI: 10.1016/j.jpsychires.2020.09.020
• Keywords: COVID-19/SARS-CoV-2 coronavirus pandemic; depression; anxiety; self-harm;
alcohol and substance misuse; suicidality; mortality; severe mental illness (SMI)
• “Green” Open Access route.
• © 2020. Licensed under the CC BY-NC-ND 4.0 license
(http://creativecommons.org/licenses/by-nc-nd/4.0/).
1
5
10
15
Page 1 of 29

ABSTRACT
BACKGROUND: COVID-19 has affected social interaction and healthcare worldwide. METHODS: We
examined changes in presentations and referrals to the primary provider of mental health and community
health services in Cambridgeshire and Peterborough, UK (population ~0·86 million), plus service activity
and deaths. We conducted interrupted time series analyses with respect to the time of UK “lockdown”, which
was shortly before the peak of COVID-19 infections in this area. We examined changes in standardized
mortality ratio for those with and without severe mental illness (SMI). RESULTS: Referrals and
presentations to nearly all mental and physical health services dropped at lockdown, with evidence for
changes in both supply (service provision) and demand (help-seeking). This was followed by an increase in
demand for some services. This pattern was seen for all major forms of presentation to liaison psychiatry
services, except for eating disorders, for which there was no evidence of change. Inpatient numbers fell, but
new detentions under the Mental Health Act were unchanged. Many services shifted from face-to-face to
remote contacts. Excess mortality was primarily in the over-70s. There was a much greater increase in
mortality for patients with SMI, which was not explained by ethnicity. CONCLUSIONS: COVID-19 has
been associated with a system-wide drop in the use of mental health services, with some subsequent return in
activity. “Supply” changes may have reduced access to mental health services for some. “Demand” changes
may reflect a genuine reduction of need or a lack of help-seeking with pent-up demand. There has been a
disproportionate increase in death among those with SMI during the pandemic.
2
20
25
30
35
Page 2 of 29

INTRODUCTION
The COVID-19 pandemic has had profound effects on health services. The UK implemented interpersonal
distancing on 2020-03-16.1 Its National Health Service (NHS) took steps to release inpatient and critical care
capacity from 2020-03-17, including a shift towards remote (videoconferencing and telephone) patient
consultations.2 The UK moved to full “lockdown” on 2020-03-23,3 legally enforceable thereafter.4 Partial
“unlocking” began in England on 2020-05-10,5 and has continued.
The impact of the pandemic on population mental health (MH) is of major interest. The SARS-CoV-2
coronavirus may have direct neurotropic effects in humans: in addition to anosmia/ageusia, COVID-19 has
been associated with meningoencephalitis6,7 and other neuropsychiatric complications, in which endothelial
involvement and bradykinin dysregulation may be important.7–12 A broader problem is that the societal
response to COVID-19 has had effects with potential for major psychological and psychiatric consequences,
including distress in COVID-19 sufferers and their loved ones (including those bereaved); confinement and
dramatic reductions in the opportunities for social interaction leading to loneliness; worry about illness and
death, which may have adverse psychiatric consequences;13 and changes in healthcare services that may have
led to a reduction in support for those with pre-existing mental disorders. Some effects might have occurred
in the opposite direction, such as beneficial effect on MH from a society uniting against a “common
enemy”.14 However, to our knowledge, no previous observational study has reported the impact of the
pandemic on clinical mental health services (PubMed search for “covid* AND ("mental health" OR
psychiatr*) AND "observational study"[pt]”, 7 July 2020). Likewise, no previous study has provided direct
evidence of the impact of COVID-19 on mortality for those with severe mental illness (SMI; PubMed search
for “covid* AND mortality AND ("serious mental illness" OR "severe mental illness" OR schizophrenia OR
schizoaffective OR schizotypal OR delusional OR bipolar OR depression)”, 7 July 2020).
Our objectives were to measure changes in MH and community physical health (PH) service activity and
mortality associated with the pandemic and lockdown. We examined population-level changes using data
from the single public provider of specialist MH and community PH services to Cambridgeshire and
Peterborough (C&P), UK. We examined presentations and referrals to services. We looked for evidence of
redirection (e.g. was a reduction in face-to-face attendance associated with increased use of telephone crisis
services?) and changes in the type of presentation to MH services (e.g. in anxiety, self-harm, or psychosis).
We examined service activity, looking for changes in the nature of service provision (e.g. face-to-face versus
remote consultation). Finally, we examined mortality, to establish if there was an excess of deaths in these
patient groups, and whether those with severe mental illness (SMI) were at higher risk of dying during the
pandemic.
METHODS
Service overview
3
40
45
50
55
60
65
70
75
Page 3 of 29

Cambridgeshire & Peterborough NHS Foundation Trust (CPFT) provides community PH services,
psychological therapy services, and all secondary care MH services (including some embedded within
primary care) to C&P, which has a population of ~0·86 million.15 It provides MH inpatient facilities in the
cities of Cambridge and Peterborough, PH inpatient rehabilitation facilities in Cambridge, Peterborough, Ely,
and Wisbech, and Minor Injury Units (MIUs) in Ely, Wisbech, and Doddington. See Supplementary Methods
for more details of population demographics, geography, and services.
Data sources
De-identified data was extracted from CPFT clinical records by CPFT’s Information & Performance team
and via the CPFT Research Database (NHS research ethics 17/EE/0442; see Supplementary Methods). We
obtained data from four clinical records systems (RiO, SystmOne, PCMIS, and Epic; see Supplementary
Methods), representing all clinical records systems for CPFT plus one for services provided by CPFT within
another Trust (Epic). Data from each system were analysed separately.
Variables
For MH services, we extracted the following variables, per day:
• Referrals to CPFT teams embedded in primary care. We counted referrals to CPFT’s embedded
primary care mental health service, and to its Improving Access to Psychological Therapies (IAPT)
service, including self-referrals.
• Calls to 111 for MH crises. CPFT provides the NHS 111 MH crisis telephone service. We counted
calls and triage psychiatric assessments.
• Referrals to secondary care CPFT teams. We classified teams as (a) child and adolescent mental
health (CAMH) teams; (b) community MH teams (CMHTs) for adults; (c) crisis resolution/home
treatment teams (CRHTs); (d) adult liaison psychiatry (LP) teams; (e) early intervention in psychosis
(EIP) teams; (f) eating disorder teams; (g) other specialist services. See Supplementary Methods for
detail.
• Liaison Psychiatry referrals and presenting problems. For CPFT’s LP service at Cambridge
University Hospitals (CUH), we counted referrals, split as (a) from the Emergency Department (ED)
with its associated Clinical Decision Unit (CDU), and (b) from other wards. When responding to a
referral, LP clinicians record the primary reason(s) for referral. We counted presenting problems of
(a) alcohol and/or drug use; (b) anxiety; (c) confusion, cognitive problems, requests for assistance
with mental capacity assessment, and behavioural disturbance; (d) eating disorders; (e) low mood
and suicidal ideation; (f) overdose and other forms of self-harm; (g) psychosis and mood elevation
(hypomania/mania).
• Admissions. We counted admissions, discharges, inter-ward transfers, and inpatients per day across
MH wards (excluding day-care facilities). We classified admission days as “voluntary” or “detained”
4
80
85
90
95
100
105
110
Page 4 of 29

according to the patient’s UK Mental Health Act (MHA) status for that day. We classified an
admission as a readmission if it began <30 calendar days after a previous discharge for that patient.
• MHA detention. We counted new episodes of detention under the MHA, of all kinds (not individual
detentions, i.e. consecutive detention under different sections of the MHA counted as one episode).
We counted assessments recorded following police use of section 136 (s136) of the MHA, a police
power to take someone suspected of suffering from mental disorder to a place of safety in some
circumstances. The data did not cover all detentions under s136 but included those where CPFT
provided the place of safety (by far the majority in C&P).
• Documentation. We counted progress note entries by CPFT staff, and binary documents (written by
staff or inbound from others), as general measures of activity.
• Appointments/contacts. We counted formally recorded contacts, excluding those marked cancelled,
not attended, with a carer (rather than the patient), or where contact with the patient was not
explicitly recorded. We split by contact type (telephone versus all other types). Videoconferencing
was not recorded as a distinct contact type.
• Deaths. We counted deaths per day. We classified MH patients as having severe mental illness (SMI)
or not. Based on the definition of SMI as schizophrenia, schizotypal and delusional disorders, bipolar
affective disorder, and severe depression,16 we looked for a lifetime coded diagnosis of ICD-10 codes
F20*, F21*, F22*, F25*, F31*, F32.2, F32.3*, F33.2, and F33.3*. Any under-coding of diagnosis
was unmeasured.
For PH services, by day:
• MIU attendees.
• Referrals to children’s and adult services.
• Admissions. Historical daily admission data was not available, so we counted bed-days per month.
• Contacts. We counted contacts by age group (children’s and adult community services) and by
contact method (face-to-face or other, e.g. telephone, videoconferencing).
• Deaths. We counted deaths of patients with an open referral to CPFT’s PH services at the time of
death.
COVID-19 infection:
• We obtained daily lab-confirmed COVID-19 case rates for Cambridgeshire and Peterborough,17 by
specimen date.
• We counted CUH patients testing positive for COVID-19 for the first time, from anonymised data,
where tests were from inpatient wards or the ED.
Dates
5
115
120
125
130
135
140
145
Page 5 of 29

The first date of each available time series is shown in their respective Figures. We used 2020-03-23
(lockdown, week 13) as the event date for interrupted time series (ITS) analysis. We obtained data up to and
including the following dates. RiO: 2020-08-09. SystmOne: 2020-05-18 (most data), 2020-05-22 (primary
care MH). PCMIS: 2020-05-26. Epic: 2020-08-31 (LP), 2020-08-31 (COVID-19). National data: 2020-08-
30.
We truncated the last 7 days of RiO contact data, to allow for delays in recording appointment outcomes (lag
estimated). We truncated the last 7 days of SystmOne death data, to allow for delays in death reporting to the
NHS Spine (lag estimated), and 14 days of RiO death data, to allow for additional delays in Spine-to-RiO
updates. Finally, we truncated all data to the last available full week.
Service reorganization
A number of services reorganized during this period, influencing activity from the “supply” side
(Supplementary Methods).
Analyses: general
We used R v3.6.2.18 We counted events per week according to the ISO-8601 standard, excluding week 53.
For time series data, we conducted ITS analyses using a negative binomial generalized linear model19 (falling
back to Poisson regression under nonconvergence suggesting lack of overdispersion) with augmented
segmented regression. Predictors were: time (overall linear trend, with time=0 at UK lockdown); event (0
before lockdown and 1 at/afterwards, measuring instantaneous change); time×event (0 before lockdown and
time afterwards, measuring a change in slope after lockdown); week (a discrete predictor, to account for
seasonal autocorrelation across years or other shorter-term phenomena);20 year (discrete predictor, to account
for nonstationarity across years beyond a linear trend); and an intercept. We did not include a time lag. We
show ITS model predictions and report the instantaneous and slope-change effects, with associated
significance tests shown in the Figures (α = 0.05).
Analyses: mortality
We examined age- and sex-standardized metrics for mortality. First, for each year, we calculated the mean
number of deaths per week, by age at death in 10-year bands. In each age band, we performed ITS analysis
using Gaussian regression with predictors year (linear time trend) and year_is_2020 (step change). This
method does not account fully for the number of patients “exposed” to risk except via the linear trend, but
was applicable to PH data (for which exposure data was unavailable) and MH data.
Secondly, for MH data, we calculated standardized mortality ratios (SMRs). Within each year, a subject’s
observation (exposure) period began on 1 January or at the subject’s registration (whichever was later), and
ended on the date corresponding to the last data available for 2020 (to avoid comparing e.g. winter/spring
6
150
155
160
165
170
175
180
Page 6 of 29

2020 to the whole of previous years). Only subjects registered and alive at some point during that period
were considered. The observed death count was 1 if the subject died during that period and 0 otherwise. The
expected number of deaths for that subject was taken from national mortality tables (unweighted mean of
Cambridge, East Cambridgeshire, Fenland, Huntingdon, Peterborough, and South Cambridgeshire),21 by sex
and age (using the subject’s age on 1 January of each year, up to 90), weighted by the duration of the
observation period. Across subjects, the total number of observed (O) and expected (E) deaths was
calculated. The SMR is O/E, the standard deviation (SD) of ln(SMR) was taken as 1/√O, and the 95%
confidence limits of the SMR as eln(SMR)±1·96/√O.22
We calculated SMRs separately for those with and without SMI. We compared SMR pairs by taking the SD
of ln(SMR ratio) as √(1/O1 + 1/O2).22 We tested whether any change between 2020 and previous years was
different for SMI and non-SMI groups via an ITS analysis across all years, using: negative binomial
regression; deaths per thousand exposure years as the dependent variable; ln(expected deaths per thousand
exposure years) as an offset;23 predictors of year (linear), year_is_2020 (binary), SMI (binary),
SMI×year_is_2020, and an intercept. Since Black, Asian, and minority ethnic (BAME) groups are at
disproportionate hazard compared to White ethnic groups of contracting COVID-19, hospital admission,
critical care admission, and death from COVID-19,24 we also included ethnicity as a predictor (White versus
ethnic minorities or unrecorded ethnicity), and its interaction with all combinations of year_is_2020 and
SMI.
RESULTS
Presentations and referrals to MH services
There was a sharp reduction at lockdown in referrals to primary care MH services, psychological therapy,
and all secondary care MH teams apart from EIP services (for which there was no significant change), with a
subsequent increase towards normal levels for secondary care services (Figure 1). There was a gradual
decrease in telephone calls to the NHS 111 MH crisis service (Figure 1C), and a small immediate drop in
triage assessments by that service (p < 0·05) with no significant change thereafter (not shown). LP referrals
from wards dropped sharply then gradually increased back to normal (Figure 1D), likely reflecting the drop
in acute hospital inpatient numbers. There was a substantial reduction in LP referrals from the ED followed
by a slow increase (Figure 1D). The changes in referrals to secondary care were proportionally less for
patients with SMI than for those without SMI recorded; for example, referrals to crisis teams did not change
for those with SMI, and referrals to CMHTs dropped less (Supplementary Results).
This drop encompassed services accepting referrals from professionals (primary care MH service, IAPT,
specialist MH teams). Service reorganization may therefore have contributed. However, the drop was also
observed across services accepting patient self-referral, in part or exclusively (IAPT, 111, LP).
7
185
190
195
200
205
210
215
220
Page 7 of 29

Presenting MH problems
Presenting problems for LP referrals are shown in Figure 2. All types of presentation dropped at lockdown
and then increased towards normal levels, except presentation with psychosis/mood elevation (small
sustained reduction) or eating disorders (no significant change), though these presentations are less common
than the other reasons, potentially limiting power.
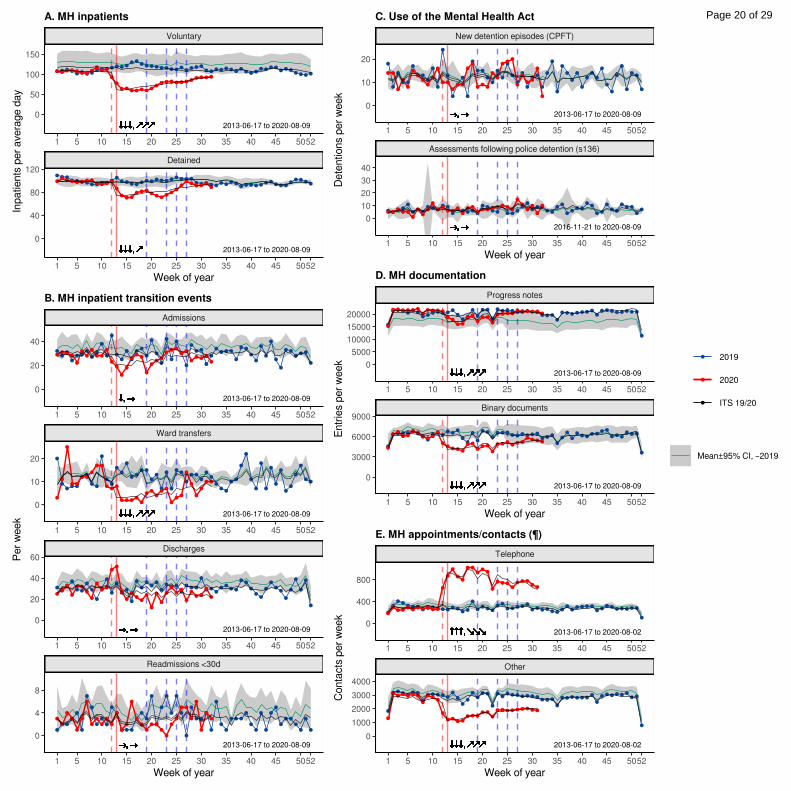
MH inpatient activity
Prior to the pandemic, the proportion of detained patients (as opposed to voluntary or “informal” inpatients)
was high compared to the local historical mean (Figure 3A), suggesting higher acuity. Both detained and
voluntary inpatient numbers dropped sharply at lockdown (Figure 3A), reflecting fewer admissions (and a
spike in discharges beginning just before lockdown; Figure 3B). The reduction in inpatient numbers was
deliberate (Supplementary Methods). Inter-ward transfers were reduced effectively (Figure 3B), and
readmission rates did not change (Figure 3B). The same patterns were seen for patients with and without
SMI, except that the admission rate did not drop significantly for those with SMI (Supplementary Results).
Mental Health Act
There was no evidence for a change in the use of the MHA, either within the MH service or by police
(Figure 3C); neither was there a change for subgroups with/without SMI (Supplementary Results).
MH contacts and documentation
Activity, as measured by clinical documentation, dropped (Figure 3D) and contacts shifted towards
telephone consultations (Figure 3E) (see also Supplementary Results). These changes were substantial and
sustained.
PH presentations, referrals, and contacts
Attendance at the MIU that remained open dropped dramatically at lockdown and increased slightly
thereafter, despite the closure of two other MIUs (Figure 4A). Referrals to PH services dropped across age
groups (Figure 4B). PH ward occupancy decreased (Figure 4C). Face-to-face contacts fell across age
groups, with an increase in non-face-to-face contacts (Figure 4D).
Deaths
There was a clear and sustained increase in death amongst patients with open referrals to PH services at the
time of lockdown (Figure 5A), with the excess deaths occurring shortly after the rapid increase in COVID-
19 infections in the region (Figure 5E). The excess of deaths in 2020 was predominantly in the over-70s
(Figure 5B). Deaths in patients known to MH services increased at this time for those with and without SMI
(Figure 5C,D); again, this was primarily in the over-70s, but with additional increases in other age bands,
notably for those with SMI (Figure 5D). More recent data were available for MH services, and in patients
8
225
230
235
240
245
250
255
Page 8 of 29

without SMI (who were in the majority) a biphasic effect was seen, with a drop in mortality below the
historical norm after the initial increase in deaths (Figure 5C).
Mortality, measured by SMR, increased significantly from 2019 to 2020 for patients with SMI, and increased
significantly more for those with SMI than without (Figure 5F; ITS analysis, SMI×2020, p<0·05). Across all
data available from 2020 to date, the change in SMR for those without SMI was not significant (reflecting
the biphasic pattern seen in Figure 5C: an increase followed by a decrease). Across all years, SMI conferred
a slightly greater additional risk of mortality in the ethnic minority/unrecorded ethnicity group
(SMI×ethnicity, p<0·05). There was no ethnicity-specific effect in 2020 (terms involving ethnicity×2020, not
significant) and the increased mortality amongst those with SMI in 2020 (as above) was not explicable by
ethnicity.
DISCUSSION
Summary
Referrals and self-presentations to health services dropped substantially at lockdown across the MH and
community PH system in our area. In some cases, these reflected service-led changes (e.g. closing some
teams to non-urgent referrals; discharging patients to create inpatient capacity). For some services, though,
activity is driven by patient self-presentation (e.g. 111 crisis calls, attendance at EDs/MIUs) yet activity
dropped nonetheless. There was no evidence that suppression of demand in some services led to
“redistribution” to any other service, with no increase in demand for MH emergency services (111, crisis
teams, ED), even for services permitting self-referral and remote consultation (111). There was no evidence
of a compensatory “rebound” in demand beyond initial levels, though this may change in the future, and the
trend for some services is now upwards. Service activity dropped less for those with SMI. There was clear
evidence of the shift to remote consultation. Mortality increased substantially, with a much greater increase
for patients with SMI than without (Figure 5F).
Mental health presentations
Our concerns a priori included an increase in MH presentations with affective disorders (anxiety, depression,
self-harm, suicide attempts), other stress-exacerbated disorders (psychosis, eating disorders), and referrals for
delirium associated with severe COVID-19. None of these effects were observed.
Several authors have highlighted a risk that suicide increases as a result of the pandemic, 25,26 noting such
effects after the 2003 severe acute respiratory syndrome (SARS) epidemic. In contrast, suicide rates fall
during wars that increase social cohesion by uniting a population against a common foe.14 COVID-19 may
have had some such “cohesion” effect, though a later increase in suicidality remains possible. Reduced
presentations with self-harm/suicide attempts may also reflect reduced access to the means of suicide and/or
reduced help-seeking; additionally, we do not have data on people who may have ended their life but were
9
260
265
270
275
280
285
290
295
Page 9 of 29

not known to our services. Population surveys of UK general mental health suggest a substantial
deterioration following lockdown,27 but this has not translated (thus far) to an increase in presentation with
mental disorder in our area. The increase in threshold for referral may be an important factor here.
Lockdown may have had negative psychological effects for many but positive effects for some. For example,
psychosocial stressors relating to school (e.g. bullying, examinations) commonly exacerbate MH problems in
children (e.g. school avoidance, associated anxiety and depression); schools were closed and examinations
cancelled. For some, there may have been beneficial effects of not having to leave the home environment. In
contrast, there have been dramatic negative effects for others. The pandemic has brought uncertainty and
anxiety both about the disease itself and associated consequences.28,29 Our clinical experience of patients
presenting in MH crisis has included people reporting COVID-19-related psychosocial stressors such as loss
of employment and support networks (both formal and informal) and confinement (including in emotionally
abusive situations), and people with severe mental disorders coming to the attention of the police and MH
services having been unable to follow social distancing rules.
Physical health presentations
The reduction in presentations to the open MIU was abrupt and dramatic, and occurred despite the closure of
two others in the area. Whilst a reduction in help-seeking cannot be excluded (injuries still occurring but
people not seeking medical attention or presenting to an ED instead), the degree suggests that lockdown has
reduced minor injury.
Inpatient stays
An effort to expedite discharge wherever safe had obvious results. The drop in the number of detained
inpatients is particularly striking. Given the lack of change in new MHA detentions, we suggest that
Responsible Clinicians perceived an increase in the risk of being admitted (relating to COVID-19
transmission) that shifted the risk/benefit balance, near the end of a detained admission, towards earlier
discharge. The sustained reduction in admissions, at least for those without SMI, suggests also a changed
threshold for admission—though not for detention and by inference probably therefore for voluntary
admission.
Mortality
There was stark excess mortality in the over-70s in 2020 to date, likely due to COVID-19, but these data also
provide strong (albeit observational) evidence that SMI is a major risk factor for death during the pandemic.
The baseline SMR in patients known to MH services was high, likely reflecting CPFT’s provision of MH
care to those with life-limiting illnesses including dementia. The biphasic mortality effect observed in
patients without recorded SMI—an increase in deaths when COVID-19 spread in Cambridgeshire and
Peterborough, followed by a drop below historical norms—suggests a degree of temporal shift in mortality,
10
300
305
310
315
320
325
330
Page 10 of 29

i.e. that some patients died earlier within 2020 than they would otherwise have done. However, beyond this,
there was a substantial and disproportionate increase in mortality amongst those with SMI during 2020. This
was not explained by ethnicity. Our data do not identify the mechanisms conferring additional risk on those
with SMI. These might include differences in interpersonal contact and viral transmission risk in those with
SMI;30 higher rates of comorbidities such as obesity, diabetes, and cardiovascular disease 31 that are associated
in turn with greater severity of COVID-19 infection;32 and increased mortality via diseases other than
COVID-19, potentially via differences in help-seeking or healthcare provision.
Strengths and weaknesses
These data represent a relatively comprehensive view of NHS-provided MH services in one geographical
area (because CPFT provides psychological therapy and all secondary MH care to the entire population of
C&P), making it less likely that decreases were compensated for by help-seeking via another NHS service.
For some services there were “unmeasured” alternatives (e.g. MH support from charities; support for
children from the Local Authority). The data are less comprehensive for PH services, but sufficient to allow
some comparison of health-seeking and mortality in the two domains. Changes in referrals to some services
may have reflected changes to “demand” or “supply” or both, though activity in other services was more
clearly led by patient help-seeking (demand). Widespread travel out of CPFT’s catchment area is not a
plausible explanation for the changes, given the magnitude of change and national travel bans. 4 Mortality
data was available via national reporting mechanisms for all MH patients, but only for PH patients with open
referrals to CPFT, and mortality data may be incomplete if delays in national reporting exceeded 7 days. This
was a retrospective observational study. Though the associations observed were strong via ITS analysis, a
recommended approach for evaluating changes in routine data associated with a well-defined event, 33 they do
not prove causation. Cambridgeshire and Peterborough have had COVID-19 infection rates spanning the
“low middle” of the UK range,17 which is high internationally;34 our findings may not generalize to areas
with different infection rates. The situation is changing rapidly and more recent data may change the overall
picture (e.g. if a rebound in demand occurs).
Conclusions
We show a reduction in demand as well as supply during the early phase of the pandemic for MH and
community PH services covering a population of ~0·86 million. The changes in supply may have reduced
access to mental health services for some. It remains to be seen whether the changes in demand reflect a
reduction in MH morbidity or whether a hidden burden of mental illness will become apparent in months to
come. However, activity in a number of services is now increasing; this suggests that there is patient need but
that help-seeking has been transiently suppressed. Further research is required into the mechanisms by which
SMI is associated with elevated mortality during this pandemic, but we suggest that patients with SMI be
considered a high-risk group during COVID-19.
11
335
340
345
350
355
360
365
Page 11 of 29

ABBREVIATIONS
111 NHS urgent care telephone service (111 is the telephone number)
BAME Black, Asian, and minority ethnic
C&P Cambridgeshire and Peterborough, UK
CAMH child and adolescent mental health
CDU Clinical Decision Unit
COVID-19 Coronavirus disease 2019
CPFT Cambridgeshire and Peterborough NHS Foundation Trust
CRHT crisis resolution/home treatment team
CUH Cambridge University Hospitals NHS Foundation Trust
ED Emergency Department
EIP early intervention in psychosis
IAPT Improving Access to Psychological Therapies
ICD-10 World Health Organization International Classification of Diseases, 10th Revision
ISO International Organization for Standardization
ITS interrupted time series
LP liaison psychiatry
MH mental health
MHA UK Mental Health Act
MIU Minor Injury Unit
NHS UK National Health Service
PCMIS Patient Case Management Information System
PH physical health
s136 Section 136 of the MHA
SARS severe acute respiratory syndrome
SARS-CoV-2 severe acute respiratory syndrome coronavirus 2
SD standard deviation
SMI severe mental illness
SMR standardized mortality ratio
UK United Kingdom
12
370
Page 12 of 29

FUNDING
SC’s, PBJ’s, SB’s, and RNC’s research was supported by the UK Medical Research Council (grant
MC_PC_17213 to RNC). PBJ is supported by the UK National Institute for Health Research (NIHR)
Applied Research Collaboration East of England. BU is supported by the Gnodde Goldman Sachs
Translational Neuroscience Unit at CPFT. ETB is an NIHR Senior Investigator. This research was supported
in part by the NIHR Cambridge Biomedical Research Centre; the views expressed are those of the authors
and not necessarily those of the NHS, the NIHR, or the Department of Health and Social Care.
The funders had no role in study design, data collection, analysis, interpretation, or writing of the article.
RNC had full access to all data in the study and had final responsibility for the decision to submit for
publication.
COMPETING INTERESTS
• Several authors (PBJ, BRU, AM, ETB, ESO, JBD, CFH, FJT, RNC) are CPFT clinicians involved in
delivering some of the services discussed here and two (BRU, FJT) are clinical directors and
therefore involved in managing them.
• PBJ is a scientific advisory board member for Janssen and Recordati.
• BRU is clinical director of the Windsor Unit at Fulbourn Hospital (CPFT), which delivers clinical
trials in dementia/mild cognitive impairment for academic and commercial organisations without
personal benefit, and is the clinical lead for dementia for the NIHR Clinical Research Network
(CRN) in the East of England. His salary is part-funded by the NIHR CRN. He has been principal
investigator on trials for Axovant, Lilly, and EIP Pharma; his institution has benefited from payment
for research carried out but he has not personally received any money. His wife is the lead for mental
health for Suffolk Clinical Commissioning Group.
• AM’s salary is part-funded by the Anna Freud National Centre for Children and Families, a mental
health charity.
• ETB is a scientific advisory board member for Sosei Hepares, and was a half-time employee of
GlaxoSmithKline until May 2019.
• RNC consults for Campden Instruments Ltd and receives royalties from Cambridge University
Press, Cambridge Enterprise, and Routledge.
• SC, SB, EFO, JBD, CFH, FJT, JDA, MPS, and JRL have nothing else to disclose.
ACKNOWLEDGEMENTS
We thank Matthew Loftus, Natalie Robinson-Creek, Alykhan Valani, and Mai Wong for assistance with data
extraction; Ben Warne for advice on COVID-19 reporting; Ann Cardinal for suggestions; and Melanie
Bruneau, Claire Cafferkey, Orna Clark, Myles Doyle, Terry Hill, Damaris Koch, Adele McCormack, Paul
13
375
380
385
390
395
400
405
Page 13 of 29

Millard, Ben Morris, and Maggie Page for advice on service organization. We thank our anonymous referees
for their helpful comments and suggestions.
AUTHOR CONTRIBUTIONS
RNC, ETB, BRU, and SC designed the study. SC, RNC, JRL, MPS, and JDA extracted and analysed the
data. RNC and SC drafted the manuscript. All authors contributed to data interpretation, and edited and
approved the final manuscript.
DATA AVAILABILITY
Patient-level data is not publicly available, under NHS Research Ethics terms. Source code and summary
data are available on request.
REFERENCES
1 Prime Minister’s Office. PM statement on coronavirus: 16 March 2020. 2020; published online March 16. https://www.gov.uk/government/speeches/pm-statement-on-coronavirus-16-march-2020 (accessed March 16, 2020).
2 NHS England, NHS Improvement. Next steps on NHS response to COVID-19. 2020; published online March 17. https://www.england.nhs.uk/coronavirus/wp-content/uploads/sites/52/2020/03/20200317-NHS-COVID-letter-FINAL.pdf (accessed March 18, 2020).
3 Prime Minister’s Office. PM address to the nation on coronavirus: 23 March 2020. 2020; published online March 23. https://www.gov.uk/government/speeches/pm-address-to-the-nation-on-coronavirus-23-march-2020 (accessed March 23, 2020).
4 Hancock M. The Health Protection (Coronavirus, Restrictions) (England) Regulations 2020. 2020 http://www.legislation.gov.uk/uksi/2020/350/contents/made.
5 Prime Minister’s Office. PM address to the nation on coronavirus: 10 May 2020. 2020; published online May 10. https://www.gov.uk/government/speeches/pm-address-to-the-nation-on-coronavirus-10-may-2020 (accessed May 27, 2020).
6 von Weyhern CH, Kaufmann I, Neff F, Kremer M. Early evidence of pronounced brain involvement in fatal COVID-19 outcomes. Lancet Lond Engl 2020; 395: e109.
7 Varatharaj A, Thomas N, Ellul MA, et al. Neurological and neuropsychiatric complications of COVID-19 in 153 patients: a UK-wide surveillance study. Lancet Psychiatry 2020; published online June 25. DOI:10.1016/S2215-0366(20)30287-X.
8 Zubair AS, McAlpine LS, Gardin T, Farhadian S, Kuruvilla DE, Spudich S. Neuropathogenesis and Neurologic Manifestations of the Coronaviruses in the Age of Coronavirus Disease 2019: A Review. JAMA Neurol 2020; published online May 29. DOI:10.1001/jamaneurol.2020.2065.
9 Romoli M, Jelcic I, Bernard-Valnet R, et al. A systematic review of neurological manifestations of SARS-CoV-2 infection: the devil is hidden in the details. Eur J Neurol 2020; published online June 5. DOI:10.1111/ene.14382.
14
410
415
420
Page 14 of 29

10 Rogers JP, Chesney E, Oliver D, et al. Psychiatric and neuropsychiatric presentations associated with severe coronavirus infections: a systematic review and meta-analysis with comparison to the COVID-19 pandemic. Lancet Psychiatry 2020; 7: 611–27.
11 Garvin MR, Alvarez C, Miller JI, et al. A mechanistic model and therapeutic interventions for COVID-19 involving a RAS-mediated bradykinin storm. eLife 2020; 9. DOI:10.7554/eLife.59177.
12 Roche JA, Roche R. A hypothesized role for dysregulated bradykinin signaling in COVID 19 respiratory ‐complications. FASEB J 2020; published online May 2. DOI:10.1096/fj.202000967.
13 Vindegaard N, Eriksen Benros M. COVID-19 pandemic and mental health consequences: systematic review of the current evidence. Brain Behav Immun 2020; published online May 30. DOI:10.1016/j.bbi.2020.05.048.
14 Pridmore S, Ahmadi J, Pridmore W. Suicide of Australians during the Vietnam War. Australas Psychiatry Bull R Aust N Z Coll Psychiatr 2018; 26: 149–51.
15 Office for National Statistics. Estimates of the population for the UK, England and Wales, Scotland and Northern Ireland [mid-2019 estimates]. 2020; published online June 24. https://www.ons.gov.uk/file?uri=%2fpeoplepopulationandcommunity%2fpopulationandmigration%2fpopulationestimates%2fdatasets%2fpopulationestimatesforukenglandandwalesscotlandandnorthernireland%2fmid2019april2020localauthoritydistrictcodes/ukmidyearestimates20192020ladcodes.xls (accessed July 3, 2020).
16 UK National Institute for Health and Care Excellence. NG58: Coexisting severe mental illness and substance misuse: community health and social care services. 2016. https://www.nice.org.uk/guidance/ng58 (accessed Oct 17, 2019).
17 Public Health England, NHSX. Coronavirus (COVID-19) in the UK. 2020. https://coronavirus.data.gov.uk/.
18 R Core Team. R: A language and environment for statistical computing. Vienna, Austria: R Foundation for Statistical Computing, 2019 http://www.R-project.org/.
19 Ripley B, Venables B, Bates DM, Hornik K, Gebhardt A, Firth D. MASS: Support Functions and Datasets for Venables and Ripley’s MASS. 2020 https://cran.r-project.org/web/packages/MASS/.
20 Wagner AK, Soumerai SB, Zhang F, Ross-Degnan D. Segmented regression analysis of interrupted time series studies in medication use research. J Clin Pharm Ther 2002; 27: 299–309.
21 Office for National Statistics. Age-standardised mortality rates and age-standardised fertility rates for local authorities in England (2018 based). 2020. https://www.ons.gov.uk/peoplepopulationandcommunity/populationandmigration/populationprojections/datasets/agestandardisedmortalityratesandagestandardisedfertilityratesforlocalauthoritiesinengland (accessed June 6, 2020).
22 Rothman KJ, Greenland S, Lash TL. Modern Epidemiology, Third edition. Philadelphia, PA, USA: Lippincott Williams & Wilkins, 2008.
23 Dalgaard P. Introductory Statistics with R, Second Edition. Springer, 2008.
24 UK Government Office for Science. Ethnicity and COVID-19: preliminary meeting for SAGE, 2 June 2020. 2020.
25 Gunnell D, Appleby L, Arensman E, et al. Suicide risk and prevention during the COVID-19 pandemic. Lancet Psychiatry 2020; 7: 468–71.
15
Page 15 of 29

26 Holmes EA, O’Connor RC, Perry VH, et al. Multidisciplinary research priorities for the COVID-19 pandemic: a call for action for mental health science. Lancet Psychiatry 2020; 7: 547–60.
27 Banks J, Xu X. The mental health effects of the first two months of lockdown and social distancing during the Covid-19 pandemic in the UK. 2020; published online June 10. DOI:10.1920/wp.ifs.2020.1620.
28 Rettie H, Daniels J. Coping and tolerance of uncertainty: Predictors and mediators of mental health during the COVID-19 pandemic. Am Psychol 2020; published online Aug 3. DOI:10.1037/amp0000710.
29 McElroy E, Patalay P, Moltrecht B, et al. Demographic and health factors associated with pandemic anxiety in the context of COVID-19. Br J Health Psychol 2020; published online Aug 29. DOI:10.1111/bjhp.12470.
30 Moore RC, Depp CA, Harvey PD, Pinkham AE. Assessing the Real-Time Mental Health Challenges of COVID-19 in Individuals With Serious Mental Illnesses: Protocol for a Quantitative Study. JMIR Res Protoc 2020; 9: e19203.
31 McGinty EE, Baller J, Azrin ST, Juliano-Bult D, Daumit GL. Interventions to Address Medical Conditions and Health-Risk Behaviors Among Persons With Serious Mental Illness: A Comprehensive Review. Schizophr Bull 2016; 42: 96–124.
32 Liu H, Chen S, Liu M, Nie H, Lu H. Comorbid Chronic Diseases are Strongly Correlated with Disease Severity among COVID-19 Patients: A Systematic Review and Meta-Analysis. Aging Dis 2020; 11: 668–78.
33 Bernal JL, Cummins S, Gasparrini A. Interrupted time series regression for the evaluation of public health interventions: a tutorial. Int J Epidemiol 2017; 46: 348–55.
34 Our World in Data. Total COVID-19 tests, confirmed cases and deaths per million people. 2020. https://ourworldindata.org/grapher/covid-tests-cases-deaths-per-million.
35 Mahase E. Covid-19: the problems with case counting. BMJ 2020; 370: m3374.
16
Page 16 of 29
FIGURE LEGENDS
Figure 1. “Front door” mental health (MH) service activity. (A) Referrals to MH teams embedded in primary care. (B) Referrals (from professionals or patient self-referrals) to CPFT’s IAPT psychological therapy service. (C) Calls from patients to the NHS “111 option 2” mental health crisis telephone service. (D) Referrals to one of CPFT’s Liaison Psychiatry (LP) services, at CUH. (E) Referrals to secondary care MH teams, which may come from outside the Trust (e.g. from general practitioners to community/crisis/specialist teams, or from acute hospital staff to liaison psychiatry) or internally (e.g. from community teams to crisis teams or vice versa). Graphical conventions: The x axis shows week-of-year. The line and ribbon marked “Mean±95% CI...” indicate the mean and 95% confidence interval (CI), calculated separately for each week of the year, across all past years available to 2019 inclusive. Weekly data from 2019 and 2020 are shown individually. Vertical lines relate to 2020 and indicate UK social distancing then “lockdown” (red: 16 March, 23 March), followed by phases of “unlocking” in England (blue: 10 May, 1 June, 16 June, 4 July). The “ITS 19/20” lines show predictions from an interrupted time series (see Methods), fitted to data from all years and shown for 2019–2020. ITS effects of interest in relation to UK lockdown (solid vertical red line) are shown textually in the sequence “instantaneous effect, subsequent slope change”, with instantaneous effects shown as up/down arrows (two-tailed; increases ↑↑↑ p < 0·001, ↑↑ p < 0·01, ↑ p < 0·05; → no significant change; decreases ↓↓↓ p < 0·001, ↓↓ p < 0·01, ↓ p < 0·05) and subsequent changes in slope shown as sloping arrows (increases ↗↗↗ p < 0·001, ↗↗ p < 0·01, ↗ p < 0·05; → no significant change; decreases ↘↘↘ p < 0·001, ↘↘ p < 0·01, ↘ p < 0·05). The date range of available data is shown at the bottom of each figure.
Figure 2. Presenting problems recorded at the time of first LP assessment at CUH. An individual referral may be associated with >1 problem (e.g. suicidal ideation plus overdose). Conventions as for Figure 1.
Figure 3. MH inpatient, Mental Health Act, and other service “activity” measures. (A) Number of inpatients on any given day (averaged over each week). (B) Admissions, ward transfers, discharges, and readmissions within 30 days. (C) New detention episodes under the MHA (any section) and assessments following police detention under s136. (D) Volume of documentation. Progress Notes are created by CPFT staff; binary documents may originate from CPFT staff or from others. (E) Booked appointments/contacts (not all contacts are thus recorded), split by telephone contact versus all other recorded kinds (e.g. first assessment, home visit). Conventions as for Figure 1. (¶ Recent values may be underestimated due to recording lag, though data are truncated to allow for this; see Methods.)
Figure 4. Physical health (PH) service activity. (A) Presentations to MIUs. Two units were closed while the other was expanded. (B) Referrals to PH services. (C) PH ward occupancy (as bed-days per month). The ITS was performed by month rather than week but was otherwise as for other analyses . (D) Recorded contacts, split by age group and whether the contacts were face-to-face or not. Conventions as for Figure 1.
Figure 5. Confirmed COVID-19 cases for Cambridgeshire and Peterborough, and deaths of CPFT patients. Note that reporting of deaths is delayed, so recent data may be incomplete, but the data are truncated to allow for this (see Methods). (A) Deaths of patients with an open referral to PH services at the time of their death. (B) Deaths from A, by year and age band at death. Annotations show tests of the step change in 2020 from an ITS analysis within that age band (see Methods) [↑↑, ↓↓ indicate increases and decreases respectively with p < 0·01; ↑, ↓ p < 0·05; (↑), (↓) p < 0·1]. (C) Deaths of patients known to MH services, by previous presence of a coded diagnosis of an SMI. (D) Deaths from C, plotted as for B. (E) Confirmed COVID-19 cases for C&P as a whole and for CUH (ED and inpatients only). The C&P spike around week 17–18 is related to the expansion of population testing (see Supplementary Methods).35 (F) Age- and sex-standardized mortality ratios (SMRs, ±95% confidence interval) for patients known to MH services, split by the presence of a coded SMI diagnosis or not. SMRs increased from 2019 to 2020 for the SMI group († p < 0·05). In 2020, the SMR was greater in the SMI group than the non-SMI group (differences for each year: *** p < 0·001). The increase in SMR from 2019 to 2020 was significantly greater in the SMI group than the non-SMI group (# p < 0·05 from ITS analysis; see Results). Note that SMRs are calculated for each year across dates available in 2020. This allows fair comparison with other years (given that deaths normally vary seasonally: compare A,C), though it may overestimate absolute SMRs slightly by comparing Jan–May CPFT figures with Jan–Dec population estimates. Conventions for A, C: as for Figure 1.
17
425
430
435
440
445
450
455
460
465
470
475
Page 17 of 29

2018-01-01 to 2020-05-17 ↓↓↓, → ↓↓↓, → ↓↓↓, → ↓↓↓, → ↓↓↓, → ↓↓↓, → ↓↓↓, → ↓↓↓, → ↓↓↓, → ↓↓↓, → ↓↓↓, → ↓↓↓, → ↓↓↓, → ↓↓↓, → ↓↓↓, → ↓↓↓, → ↓↓↓, → ↓↓↓, → ↓↓↓, → ↓↓↓, →0
400
800
1 5 10 15 20 25 30 35 40 45 5052
Week of year
Ref
erra
ls p
er w
eek
A. Primary care MH service referrals
2008-01-21 to 2020-05-24 ↓↓↓, → ↓↓↓, → ↓↓↓, → ↓↓↓, → ↓↓↓, → ↓↓↓, → ↓↓↓, → ↓↓↓, → ↓↓↓, → ↓↓↓, → ↓↓↓, → ↓↓↓, → ↓↓↓, → ↓↓↓, → ↓↓↓, → ↓↓↓, → ↓↓↓, → ↓↓↓, → ↓↓↓, → ↓↓↓, → ↓↓↓, →0
200
400
600
1 5 10 15 20 25 30 35 40 45 5052
Week of year
Ref
erra
ls p
er w
eek
B. IAPT psychological therapy service referrals
2017-10-09 to 2020-04-26 →, ↘ →, ↘ →, ↘ →, ↘ →, ↘ →, ↘ →, ↘ →, ↘ →, ↘ →, ↘ →, ↘ →, ↘ →, ↘ →, ↘ →, ↘ →, ↘ →, ↘0
1000
2000
1 5 10 15 20 25 30 35 40 45 5052
Week of year
Per
wee
k
C. Calls to the NHS 111 MH crisis telephone service
2016-01-04 to 2020-08-30 ↓↓↓, ↗↗↗ ↓↓↓, ↗↗↗ ↓↓↓, ↗↗↗ ↓↓↓, ↗↗↗ ↓↓↓, ↗↗↗ ↓↓↓, ↗↗↗ ↓↓↓, ↗↗↗ ↓↓↓, ↗↗↗ ↓↓↓, ↗↗↗ ↓↓↓, ↗↗↗ ↓↓↓, ↗↗↗ ↓↓↓, ↗↗↗ ↓↓↓, ↗↗↗ ↓↓↓, ↗↗↗ ↓↓↓, ↗↗↗ ↓↓↓, ↗↗↗ ↓↓↓, ↗↗↗ ↓↓↓, ↗↗↗ ↓↓↓, ↗↗↗ ↓↓↓, ↗↗↗ ↓↓↓, ↗↗↗ ↓↓↓, ↗↗↗ ↓↓↓, ↗↗↗ ↓↓↓, ↗↗↗ ↓↓↓, ↗↗↗ ↓↓↓, ↗↗↗ ↓↓↓, ↗↗↗ ↓↓↓, ↗↗↗ ↓↓↓, ↗↗↗ ↓↓↓, ↗↗↗ ↓↓↓, ↗↗↗ ↓↓↓, ↗↗↗ ↓↓↓, ↗↗↗ ↓↓↓, ↗↗↗ ↓↓↓, ↗↗↗
2014-11-03 to 2020-08-30 ↓↓↓, ↗↗↗ ↓↓↓, ↗↗↗ ↓↓↓, ↗↗↗ ↓↓↓, ↗↗↗ ↓↓↓, ↗↗↗ ↓↓↓, ↗↗↗ ↓↓↓, ↗↗↗ ↓↓↓, ↗↗↗ ↓↓↓, ↗↗↗ ↓↓↓, ↗↗↗ ↓↓↓, ↗↗↗ ↓↓↓, ↗↗↗ ↓↓↓, ↗↗↗ ↓↓↓, ↗↗↗ ↓↓↓, ↗↗↗ ↓↓↓, ↗↗↗ ↓↓↓, ↗↗↗ ↓↓↓, ↗↗↗ ↓↓↓, ↗↗↗ ↓↓↓, ↗↗↗ ↓↓↓, ↗↗↗ ↓↓↓, ↗↗↗ ↓↓↓, ↗↗↗ ↓↓↓, ↗↗↗ ↓↓↓, ↗↗↗ ↓↓↓, ↗↗↗ ↓↓↓, ↗↗↗ ↓↓↓, ↗↗↗ ↓↓↓, ↗↗↗ ↓↓↓, ↗↗↗ ↓↓↓, ↗↗↗ ↓↓↓, ↗↗↗ ↓↓↓, ↗↗↗ ↓↓↓, ↗↗↗ ↓↓↓, ↗↗↗
Wards
1 5 10 15 20 25 30 35 40 45 5052
Emergency Department
1 5 10 15 20 25 30 35 40 45 5052
0
30
60
90
0
50
100
Week of year
Ref
erra
ls p
er w
eek
D. Liaison psychiatry referrals, CUH
2013-06-17 to 2020-08-09 ↓↓↓, ↗↗↗ ↓↓↓, ↗↗↗ ↓↓↓, ↗↗↗ ↓↓↓, ↗↗↗ ↓↓↓, ↗↗↗ ↓↓↓, ↗↗↗ ↓↓↓, ↗↗↗ ↓↓↓, ↗↗↗ ↓↓↓, ↗↗↗ ↓↓↓, ↗↗↗ ↓↓↓, ↗↗↗ ↓↓↓, ↗↗↗ ↓↓↓, ↗↗↗ ↓↓↓, ↗↗↗ ↓↓↓, ↗↗↗ ↓↓↓, ↗↗↗ ↓↓↓, ↗↗↗ ↓↓↓, ↗↗↗ ↓↓↓, ↗↗↗ ↓↓↓, ↗↗↗ ↓↓↓, ↗↗↗ ↓↓↓, ↗↗↗ ↓↓↓, ↗↗↗ ↓↓↓, ↗↗↗ ↓↓↓, ↗↗↗ ↓↓↓, ↗↗↗ ↓↓↓, ↗↗↗ ↓↓↓, ↗↗↗ ↓↓↓, ↗↗↗ ↓↓↓, ↗↗↗ ↓↓↓, ↗↗↗ ↓↓↓, ↗↗↗
2013-06-17 to 2020-08-09 ↓↓↓, ↗↗ ↓↓↓, ↗↗ ↓↓↓, ↗↗ ↓↓↓, ↗↗ ↓↓↓, ↗↗ ↓↓↓, ↗↗ ↓↓↓, ↗↗ ↓↓↓, ↗↗ ↓↓↓, ↗↗ ↓↓↓, ↗↗ ↓↓↓, ↗↗ ↓↓↓, ↗↗ ↓↓↓, ↗↗ ↓↓↓, ↗↗ ↓↓↓, ↗↗ ↓↓↓, ↗↗ ↓↓↓, ↗↗ ↓↓↓, ↗↗ ↓↓↓, ↗↗ ↓↓↓, ↗↗ ↓↓↓, ↗↗ ↓↓↓, ↗↗ ↓↓↓, ↗↗ ↓↓↓, ↗↗ ↓↓↓, ↗↗ ↓↓↓, ↗↗ ↓↓↓, ↗↗ ↓↓↓, ↗↗ ↓↓↓, ↗↗ ↓↓↓, ↗↗ ↓↓↓, ↗↗ ↓↓↓, ↗↗
2016-09-19 to 2020-08-09 ↓↓↓, ↗↗ ↓↓↓, ↗↗ ↓↓↓, ↗↗ ↓↓↓, ↗↗ ↓↓↓, ↗↗ ↓↓↓, ↗↗ ↓↓↓, ↗↗ ↓↓↓, ↗↗ ↓↓↓, ↗↗ ↓↓↓, ↗↗ ↓↓↓, ↗↗ ↓↓↓, ↗↗ ↓↓↓, ↗↗ ↓↓↓, ↗↗ ↓↓↓, ↗↗ ↓↓↓, ↗↗ ↓↓↓, ↗↗ ↓↓↓, ↗↗ ↓↓↓, ↗↗ ↓↓↓, ↗↗ ↓↓↓, ↗↗ ↓↓↓, ↗↗ ↓↓↓, ↗↗ ↓↓↓, ↗↗ ↓↓↓, ↗↗ ↓↓↓, ↗↗ ↓↓↓, ↗↗ ↓↓↓, ↗↗ ↓↓↓, ↗↗ ↓↓↓, ↗↗ ↓↓↓, ↗↗ ↓↓↓, ↗↗
2013-06-17 to 2020-08-09 ↓↓↓, ↗↗↗ ↓↓↓, ↗↗↗ ↓↓↓, ↗↗↗ ↓↓↓, ↗↗↗ ↓↓↓, ↗↗↗ ↓↓↓, ↗↗↗ ↓↓↓, ↗↗↗ ↓↓↓, ↗↗↗ ↓↓↓, ↗↗↗ ↓↓↓, ↗↗↗ ↓↓↓, ↗↗↗ ↓↓↓, ↗↗↗ ↓↓↓, ↗↗↗ ↓↓↓, ↗↗↗ ↓↓↓, ↗↗↗ ↓↓↓, ↗↗↗ ↓↓↓, ↗↗↗ ↓↓↓, ↗↗↗ ↓↓↓, ↗↗↗ ↓↓↓, ↗↗↗ ↓↓↓, ↗↗↗ ↓↓↓, ↗↗↗ ↓↓↓, ↗↗↗ ↓↓↓, ↗↗↗ ↓↓↓, ↗↗↗ ↓↓↓, ↗↗↗ ↓↓↓, ↗↗↗ ↓↓↓, ↗↗↗ ↓↓↓, ↗↗↗ ↓↓↓, ↗↗↗ ↓↓↓, ↗↗↗ ↓↓↓, ↗↗↗
2013-06-17 to 2020-08-09 →, → →, → →, → →, → →, → →, → →, → →, → →, → →, → →, → →, → →, → →, → →, → →, → →, → →, → →, → →, → →, → →, → →, → →, → →, → →, → →, → →, → →, → →, → →, → →, →
2013-06-17 to 2020-08-09 ↓↓↓, ↗↗ ↓↓↓, ↗↗ ↓↓↓, ↗↗ ↓↓↓, ↗↗ ↓↓↓, ↗↗ ↓↓↓, ↗↗ ↓↓↓, ↗↗ ↓↓↓, ↗↗ ↓↓↓, ↗↗ ↓↓↓, ↗↗ ↓↓↓, ↗↗ ↓↓↓, ↗↗ ↓↓↓, ↗↗ ↓↓↓, ↗↗ ↓↓↓, ↗↗ ↓↓↓, ↗↗ ↓↓↓, ↗↗ ↓↓↓, ↗↗ ↓↓↓, ↗↗ ↓↓↓, ↗↗ ↓↓↓, ↗↗ ↓↓↓, ↗↗ ↓↓↓, ↗↗ ↓↓↓, ↗↗ ↓↓↓, ↗↗ ↓↓↓, ↗↗ ↓↓↓, ↗↗ ↓↓↓, ↗↗ ↓↓↓, ↗↗ ↓↓↓, ↗↗ ↓↓↓, ↗↗ ↓↓↓, ↗↗
2013-06-17 to 2020-08-09 ↓↓↓, ↗↗↗ ↓↓↓, ↗↗↗ ↓↓↓, ↗↗↗ ↓↓↓, ↗↗↗ ↓↓↓, ↗↗↗ ↓↓↓, ↗↗↗ ↓↓↓, ↗↗↗ ↓↓↓, ↗↗↗ ↓↓↓, ↗↗↗ ↓↓↓, ↗↗↗ ↓↓↓, ↗↗↗ ↓↓↓, ↗↗↗ ↓↓↓, ↗↗↗ ↓↓↓, ↗↗↗ ↓↓↓, ↗↗↗ ↓↓↓, ↗↗↗ ↓↓↓, ↗↗↗ ↓↓↓, ↗↗↗ ↓↓↓, ↗↗↗ ↓↓↓, ↗↗↗ ↓↓↓, ↗↗↗ ↓↓↓, ↗↗↗ ↓↓↓, ↗↗↗ ↓↓↓, ↗↗↗ ↓↓↓, ↗↗↗ ↓↓↓, ↗↗↗ ↓↓↓, ↗↗↗ ↓↓↓, ↗↗↗ ↓↓↓, ↗↗↗ ↓↓↓, ↗↗↗ ↓↓↓, ↗↗↗ ↓↓↓, ↗↗↗
Other specialist teams
Eating disorder teams
Early intervention psychosis services
Liaison psychiatry
Crisis teams
Community mental health teams
1 5 10 15 20 25 30 35 40 45 5052
1 5 10 15 20 25 30 35 40 45 5052
1 5 10 15 20 25 30 35 40 45 5052
1 5 10 15 20 25 30 35 40 45 5052
1 5 10 15 20 25 30 35 40 45 5052
1 5 10 15 20 25 30 35 40 45 5052
Child/adolescent services
1 5 10 15 20 25 30 35 40 45 5052
0
100
200
0
300
600
0
50
100
0
100
200
0
30
60
90
0
10
20
30
0
100
200
300
Week of year
Ref
erra
ls p
er w
eek
E. Referrals to secondary care MH teams
2019
2020
ITS 19/20
Mean±95% CI, –2019
Page 18 of 29

2014-11-03 to 2020-08-30 ↓↓↓, ↗↗↗ ↓↓↓, ↗↗↗ ↓↓↓, ↗↗↗ ↓↓↓, ↗↗↗ ↓↓↓, ↗↗↗ ↓↓↓, ↗↗↗ ↓↓↓, ↗↗↗ ↓↓↓, ↗↗↗ ↓↓↓, ↗↗↗ ↓↓↓, ↗↗↗ ↓↓↓, ↗↗↗ ↓↓↓, ↗↗↗ ↓↓↓, ↗↗↗ ↓↓↓, ↗↗↗ ↓↓↓, ↗↗↗ ↓↓↓, ↗↗↗ ↓↓↓, ↗↗↗ ↓↓↓, ↗↗↗ ↓↓↓, ↗↗↗ ↓↓↓, ↗↗↗ ↓↓↓, ↗↗↗ ↓↓↓, ↗↗↗ ↓↓↓, ↗↗↗ ↓↓↓, ↗↗↗ ↓↓↓, ↗↗↗ ↓↓↓, ↗↗↗ ↓↓↓, ↗↗↗ ↓↓↓, ↗↗↗ ↓↓↓, ↗↗↗ ↓↓↓, ↗↗↗ ↓↓↓, ↗↗↗ ↓↓↓, ↗↗↗ ↓↓↓, ↗↗↗ ↓↓↓, ↗↗↗ ↓↓↓, ↗↗↗
2014-11-03 to 2020-08-30 ↓↓↓, ↗↗↗ ↓↓↓, ↗↗↗ ↓↓↓, ↗↗↗ ↓↓↓, ↗↗↗ ↓↓↓, ↗↗↗ ↓↓↓, ↗↗↗ ↓↓↓, ↗↗↗ ↓↓↓, ↗↗↗ ↓↓↓, ↗↗↗ ↓↓↓, ↗↗↗ ↓↓↓, ↗↗↗ ↓↓↓, ↗↗↗ ↓↓↓, ↗↗↗ ↓↓↓, ↗↗↗ ↓↓↓, ↗↗↗ ↓↓↓, ↗↗↗ ↓↓↓, ↗↗↗ ↓↓↓, ↗↗↗ ↓↓↓, ↗↗↗ ↓↓↓, ↗↗↗ ↓↓↓, ↗↗↗ ↓↓↓, ↗↗↗ ↓↓↓, ↗↗↗ ↓↓↓, ↗↗↗ ↓↓↓, ↗↗↗ ↓↓↓, ↗↗↗ ↓↓↓, ↗↗↗ ↓↓↓, ↗↗↗ ↓↓↓, ↗↗↗ ↓↓↓, ↗↗↗ ↓↓↓, ↗↗↗ ↓↓↓, ↗↗↗ ↓↓↓, ↗↗↗ ↓↓↓, ↗↗↗ ↓↓↓, ↗↗↗
2014-11-03 to 2020-08-30 ↓↓↓, ↗ ↓↓↓, ↗ ↓↓↓, ↗ ↓↓↓, ↗ ↓↓↓, ↗ ↓↓↓, ↗ ↓↓↓, ↗ ↓↓↓, ↗ ↓↓↓, ↗ ↓↓↓, ↗ ↓↓↓, ↗ ↓↓↓, ↗ ↓↓↓, ↗ ↓↓↓, ↗ ↓↓↓, ↗ ↓↓↓, ↗ ↓↓↓, ↗ ↓↓↓, ↗ ↓↓↓, ↗ ↓↓↓, ↗ ↓↓↓, ↗ ↓↓↓, ↗ ↓↓↓, ↗ ↓↓↓, ↗ ↓↓↓, ↗ ↓↓↓, ↗ ↓↓↓, ↗ ↓↓↓, ↗ ↓↓↓, ↗ ↓↓↓, ↗ ↓↓↓, ↗ ↓↓↓, ↗ ↓↓↓, ↗ ↓↓↓, ↗ ↓↓↓, ↗
2014-11-03 to 2020-08-30 →, → →, → →, → →, → →, → →, → →, → →, → →, → →, → →, → →, → →, → →, → →, → →, → →, → →, → →, → →, → →, → →, → →, → →, → →, → →, → →, → →, → →, → →, → →, → →, → →, → →, → →, →
2014-11-03 to 2020-08-30 ↓↓↓, ↗↗↗ ↓↓↓, ↗↗↗ ↓↓↓, ↗↗↗ ↓↓↓, ↗↗↗ ↓↓↓, ↗↗↗ ↓↓↓, ↗↗↗ ↓↓↓, ↗↗↗ ↓↓↓, ↗↗↗ ↓↓↓, ↗↗↗ ↓↓↓, ↗↗↗ ↓↓↓, ↗↗↗ ↓↓↓, ↗↗↗ ↓↓↓, ↗↗↗ ↓↓↓, ↗↗↗ ↓↓↓, ↗↗↗ ↓↓↓, ↗↗↗ ↓↓↓, ↗↗↗ ↓↓↓, ↗↗↗ ↓↓↓, ↗↗↗ ↓↓↓, ↗↗↗ ↓↓↓, ↗↗↗ ↓↓↓, ↗↗↗ ↓↓↓, ↗↗↗ ↓↓↓, ↗↗↗ ↓↓↓, ↗↗↗ ↓↓↓, ↗↗↗ ↓↓↓, ↗↗↗ ↓↓↓, ↗↗↗ ↓↓↓, ↗↗↗ ↓↓↓, ↗↗↗ ↓↓↓, ↗↗↗ ↓↓↓, ↗↗↗ ↓↓↓, ↗↗↗ ↓↓↓, ↗↗↗ ↓↓↓, ↗↗↗
2014-11-03 to 2020-08-30 ↓↓↓, ↗ ↓↓↓, ↗ ↓↓↓, ↗ ↓↓↓, ↗ ↓↓↓, ↗ ↓↓↓, ↗ ↓↓↓, ↗ ↓↓↓, ↗ ↓↓↓, ↗ ↓↓↓, ↗ ↓↓↓, ↗ ↓↓↓, ↗ ↓↓↓, ↗ ↓↓↓, ↗ ↓↓↓, ↗ ↓↓↓, ↗ ↓↓↓, ↗ ↓↓↓, ↗ ↓↓↓, ↗ ↓↓↓, ↗ ↓↓↓, ↗ ↓↓↓, ↗ ↓↓↓, ↗ ↓↓↓, ↗ ↓↓↓, ↗ ↓↓↓, ↗ ↓↓↓, ↗ ↓↓↓, ↗ ↓↓↓, ↗ ↓↓↓, ↗ ↓↓↓, ↗ ↓↓↓, ↗ ↓↓↓, ↗ ↓↓↓, ↗ ↓↓↓, ↗
2014-11-03 to 2020-08-30 ↓, → ↓, → ↓, → ↓, → ↓, → ↓, → ↓, → ↓, → ↓, → ↓, → ↓, → ↓, → ↓, → ↓, → ↓, → ↓, → ↓, → ↓, → ↓, → ↓, → ↓, → ↓, → ↓, → ↓, → ↓, → ↓, → ↓, → ↓, → ↓, → ↓, → ↓, → ↓, → ↓, → ↓, → ↓, →
Psychosis/mood elevation
Overdose/self-harm
Low mood/suicidal ideation
Eating disorder
Confusion/cognitive problems/capacity/behavioural disturbance
Anxiety
1 5 10 15 20 25 30 35 40 45 50 52
1 5 10 15 20 25 30 35 40 45 50 52
1 5 10 15 20 25 30 35 40 45 50 52
1 5 10 15 20 25 30 35 40 45 50 52
1 5 10 15 20 25 30 35 40 45 50 52
1 5 10 15 20 25 30 35 40 45 50 52
Alcohol/drugs
1 5 10 15 20 25 30 35 40 45 50 52
0
10
20
30
40
0
5
10
15
0
10
20
0
1
2
3
4
01020304050
0
10
20
30
0
5
10
Week of year
Ref
erra
ls p
er w
eek
Liaison psychiatry presenting problems (CUH)
2019
2020
ITS 19/20
Mean±95% CI, –2019
Page 19 of 29
2013-06-17 to 2020-08-09 ↓↓↓, ↗↗↗ ↓↓↓, ↗↗↗ ↓↓↓, ↗↗↗ ↓↓↓, ↗↗↗ ↓↓↓, ↗↗↗ ↓↓↓, ↗↗↗ ↓↓↓, ↗↗↗ ↓↓↓, ↗↗↗ ↓↓↓, ↗↗↗ ↓↓↓, ↗↗↗ ↓↓↓, ↗↗↗ ↓↓↓, ↗↗↗ ↓↓↓, ↗↗↗ ↓↓↓, ↗↗↗ ↓↓↓, ↗↗↗ ↓↓↓, ↗↗↗ ↓↓↓, ↗↗↗ ↓↓↓, ↗↗↗ ↓↓↓, ↗↗↗ ↓↓↓, ↗↗↗ ↓↓↓, ↗↗↗ ↓↓↓, ↗↗↗ ↓↓↓, ↗↗↗ ↓↓↓, ↗↗↗ ↓↓↓, ↗↗↗ ↓↓↓, ↗↗↗ ↓↓↓, ↗↗↗ ↓↓↓, ↗↗↗ ↓↓↓, ↗↗↗ ↓↓↓, ↗↗↗ ↓↓↓, ↗↗↗ ↓↓↓, ↗↗↗
2013-06-17 to 2020-08-09 ↓↓↓, ↗ ↓↓↓, ↗ ↓↓↓, ↗ ↓↓↓, ↗ ↓↓↓, ↗ ↓↓↓, ↗ ↓↓↓, ↗ ↓↓↓, ↗ ↓↓↓, ↗ ↓↓↓, ↗ ↓↓↓, ↗ ↓↓↓, ↗ ↓↓↓, ↗ ↓↓↓, ↗ ↓↓↓, ↗ ↓↓↓, ↗ ↓↓↓, ↗ ↓↓↓, ↗ ↓↓↓, ↗ ↓↓↓, ↗ ↓↓↓, ↗ ↓↓↓, ↗ ↓↓↓, ↗ ↓↓↓, ↗ ↓↓↓, ↗ ↓↓↓, ↗ ↓↓↓, ↗ ↓↓↓, ↗ ↓↓↓, ↗ ↓↓↓, ↗ ↓↓↓, ↗ ↓↓↓, ↗
Detained
1 5 10 15 20 25 30 35 40 45 5052
Voluntary
1 5 10 15 20 25 30 35 40 45 5052
0
50
100
150
0
40
80
120
Week of year
Inp
atie
nts
per
ave
rage
day
A. MH inpatients
2013-06-17 to 2020-08-09 ↓, → ↓, → ↓, → ↓, → ↓, → ↓, → ↓, → ↓, → ↓, → ↓, → ↓, → ↓, → ↓, → ↓, → ↓, → ↓, → ↓, → ↓, → ↓, → ↓, → ↓, → ↓, → ↓, → ↓, → ↓, → ↓, → ↓, → ↓, → ↓, → ↓, → ↓, → ↓, →
2013-06-17 to 2020-08-09 ↓↓↓, ↗↗↗ ↓↓↓, ↗↗↗ ↓↓↓, ↗↗↗ ↓↓↓, ↗↗↗ ↓↓↓, ↗↗↗ ↓↓↓, ↗↗↗ ↓↓↓, ↗↗↗ ↓↓↓, ↗↗↗ ↓↓↓, ↗↗↗ ↓↓↓, ↗↗↗ ↓↓↓, ↗↗↗ ↓↓↓, ↗↗↗ ↓↓↓, ↗↗↗ ↓↓↓, ↗↗↗ ↓↓↓, ↗↗↗ ↓↓↓, ↗↗↗ ↓↓↓, ↗↗↗ ↓↓↓, ↗↗↗ ↓↓↓, ↗↗↗ ↓↓↓, ↗↗↗ ↓↓↓, ↗↗↗ ↓↓↓, ↗↗↗ ↓↓↓, ↗↗↗ ↓↓↓, ↗↗↗ ↓↓↓, ↗↗↗ ↓↓↓, ↗↗↗ ↓↓↓, ↗↗↗ ↓↓↓, ↗↗↗ ↓↓↓, ↗↗↗ ↓↓↓, ↗↗↗ ↓↓↓, ↗↗↗ ↓↓↓, ↗↗↗
2013-06-17 to 2020-08-09 →, → →, → →, → →, → →, → →, → →, → →, → →, → →, → →, → →, → →, → →, → →, → →, → →, → →, → →, → →, → →, → →, → →, → →, → →, → →, → →, → →, → →, → →, → →, → →, →
2013-06-17 to 2020-08-09 →, → →, → →, → →, → →, → →, → →, → →, → →, → →, → →, → →, → →, → →, → →, → →, → →, → →, → →, → →, → →, → →, → →, → →, → →, → →, → →, → →, → →, → →, → →, → →, →
Readmissions <30d
Discharges
Ward transfers
1 5 10 15 20 25 30 35 40 45 5052
1 5 10 15 20 25 30 35 40 45 5052
1 5 10 15 20 25 30 35 40 45 5052
Admissions
1 5 10 15 20 25 30 35 40 45 5052
0
20
40
0
10
20
0
20
40
60
0
4
8
Week of year
Per
wee
k
B. MH inpatient transition events
2013-06-17 to 2020-08-09 →, → →, → →, → →, → →, → →, → →, → →, → →, → →, → →, → →, → →, → →, → →, → →, → →, → →, → →, → →, → →, → →, → →, → →, → →, → →, → →, → →, → →, → →, → →, → →, →
2016-11-21 to 2020-08-09 →, → →, → →, → →, → →, → →, → →, → →, → →, → →, → →, → →, → →, → →, → →, → →, → →, → →, → →, → →, → →, → →, → →, → →, → →, → →, → →, → →, → →, → →, → →, → →, →
Assessments following police detention (s136)
1 5 10 15 20 25 30 35 40 45 5052
New detention episodes (CPFT)
1 5 10 15 20 25 30 35 40 45 5052
0
10
20
0
10
20
30
40
Week of year
Det
entio
ns p
er w
eek
C. Use of the Mental Health Act
2013-06-17 to 2020-08-09 ↓↓↓, ↗↗↗ ↓↓↓, ↗↗↗ ↓↓↓, ↗↗↗ ↓↓↓, ↗↗↗ ↓↓↓, ↗↗↗ ↓↓↓, ↗↗↗ ↓↓↓, ↗↗↗ ↓↓↓, ↗↗↗ ↓↓↓, ↗↗↗ ↓↓↓, ↗↗↗ ↓↓↓, ↗↗↗ ↓↓↓, ↗↗↗ ↓↓↓, ↗↗↗ ↓↓↓, ↗↗↗ ↓↓↓, ↗↗↗ ↓↓↓, ↗↗↗ ↓↓↓, ↗↗↗ ↓↓↓, ↗↗↗ ↓↓↓, ↗↗↗ ↓↓↓, ↗↗↗ ↓↓↓, ↗↗↗ ↓↓↓, ↗↗↗ ↓↓↓, ↗↗↗ ↓↓↓, ↗↗↗ ↓↓↓, ↗↗↗ ↓↓↓, ↗↗↗ ↓↓↓, ↗↗↗ ↓↓↓, ↗↗↗ ↓↓↓, ↗↗↗ ↓↓↓, ↗↗↗ ↓↓↓, ↗↗↗ ↓↓↓, ↗↗↗
2013-06-17 to 2020-08-09 ↓↓↓, ↗↗↗ ↓↓↓, ↗↗↗ ↓↓↓, ↗↗↗ ↓↓↓, ↗↗↗ ↓↓↓, ↗↗↗ ↓↓↓, ↗↗↗ ↓↓↓, ↗↗↗ ↓↓↓, ↗↗↗ ↓↓↓, ↗↗↗ ↓↓↓, ↗↗↗ ↓↓↓, ↗↗↗ ↓↓↓, ↗↗↗ ↓↓↓, ↗↗↗ ↓↓↓, ↗↗↗ ↓↓↓, ↗↗↗ ↓↓↓, ↗↗↗ ↓↓↓, ↗↗↗ ↓↓↓, ↗↗↗ ↓↓↓, ↗↗↗ ↓↓↓, ↗↗↗ ↓↓↓, ↗↗↗ ↓↓↓, ↗↗↗ ↓↓↓, ↗↗↗ ↓↓↓, ↗↗↗ ↓↓↓, ↗↗↗ ↓↓↓, ↗↗↗ ↓↓↓, ↗↗↗ ↓↓↓, ↗↗↗ ↓↓↓, ↗↗↗ ↓↓↓, ↗↗↗ ↓↓↓, ↗↗↗ ↓↓↓, ↗↗↗
Binary documents
1 5 10 15 20 25 30 35 40 45 5052
Progress notes
1 5 10 15 20 25 30 35 40 45 5052
0
5000
10000
15000
20000
0
3000
6000
9000
Week of year
Ent
ries
per
wee
k
D. MH documentation
2013-06-17 to 2020-08-02 ↑↑↑, ↘↘↘ ↑↑↑, ↘↘↘ ↑↑↑, ↘↘↘ ↑↑↑, ↘↘↘ ↑↑↑, ↘↘↘ ↑↑↑, ↘↘↘ ↑↑↑, ↘↘↘ ↑↑↑, ↘↘↘ ↑↑↑, ↘↘↘ ↑↑↑, ↘↘↘ ↑↑↑, ↘↘↘ ↑↑↑, ↘↘↘ ↑↑↑, ↘↘↘ ↑↑↑, ↘↘↘ ↑↑↑, ↘↘↘ ↑↑↑, ↘↘↘ ↑↑↑, ↘↘↘ ↑↑↑, ↘↘↘ ↑↑↑, ↘↘↘ ↑↑↑, ↘↘↘ ↑↑↑, ↘↘↘ ↑↑↑, ↘↘↘ ↑↑↑, ↘↘↘ ↑↑↑, ↘↘↘ ↑↑↑, ↘↘↘ ↑↑↑, ↘↘↘ ↑↑↑, ↘↘↘ ↑↑↑, ↘↘↘ ↑↑↑, ↘↘↘ ↑↑↑, ↘↘↘ ↑↑↑, ↘↘↘
2013-06-17 to 2020-08-02 ↓↓↓, ↗↗↗ ↓↓↓, ↗↗↗ ↓↓↓, ↗↗↗ ↓↓↓, ↗↗↗ ↓↓↓, ↗↗↗ ↓↓↓, ↗↗↗ ↓↓↓, ↗↗↗ ↓↓↓, ↗↗↗ ↓↓↓, ↗↗↗ ↓↓↓, ↗↗↗ ↓↓↓, ↗↗↗ ↓↓↓, ↗↗↗ ↓↓↓, ↗↗↗ ↓↓↓, ↗↗↗ ↓↓↓, ↗↗↗ ↓↓↓, ↗↗↗ ↓↓↓, ↗↗↗ ↓↓↓, ↗↗↗ ↓↓↓, ↗↗↗ ↓↓↓, ↗↗↗ ↓↓↓, ↗↗↗ ↓↓↓, ↗↗↗ ↓↓↓, ↗↗↗ ↓↓↓, ↗↗↗ ↓↓↓, ↗↗↗ ↓↓↓, ↗↗↗ ↓↓↓, ↗↗↗ ↓↓↓, ↗↗↗ ↓↓↓, ↗↗↗ ↓↓↓, ↗↗↗ ↓↓↓, ↗↗↗
Other
1 5 10 15 20 25 30 35 40 45 5052
Telephone
1 5 10 15 20 25 30 35 40 45 5052
0
400
800
0
1000
2000
3000
4000
Week of year
Con
tact
s p
er w
eek
E. MH appointments/contacts (¶)
2019
2020
ITS 19/20
Mean±95% CI, –2019
Page 20 of 29

2015-04-06 to 2020-05-17 ↓↓↓, ↗↗↗ ↓↓↓, ↗↗↗ ↓↓↓, ↗↗↗ ↓↓↓, ↗↗↗ ↓↓↓, ↗↗↗ ↓↓↓, ↗↗↗ ↓↓↓, ↗↗↗ ↓↓↓, ↗↗↗ ↓↓↓, ↗↗↗ ↓↓↓, ↗↗↗ ↓↓↓, ↗↗↗ ↓↓↓, ↗↗↗ ↓↓↓, ↗↗↗ ↓↓↓, ↗↗↗ ↓↓↓, ↗↗↗ ↓↓↓, ↗↗↗ ↓↓↓, ↗↗↗ ↓↓↓, ↗↗↗ ↓↓↓, ↗↗↗ ↓↓↓, ↗↗↗
2015-04-06 to 2020-04-05 ↓↓↓, → ↓↓↓, → ↓↓↓, → ↓↓↓, → ↓↓↓, → ↓↓↓, → ↓↓↓, → ↓↓↓, → ↓↓↓, → ↓↓↓, → ↓↓↓, → ↓↓↓, → ↓↓↓, → ↓↓↓, →
2015-04-06 to 2020-04-05 ↓↓↓, → ↓↓↓, → ↓↓↓, → ↓↓↓, → ↓↓↓, → ↓↓↓, → ↓↓↓, → ↓↓↓, → ↓↓↓, → ↓↓↓, → ↓↓↓, → ↓↓↓, → ↓↓↓, → ↓↓↓, →
Wisbech (closed)
Doddington (closed)
1 5 10 15 20 25 30 35 40 45 5052
1 5 10 15 20 25 30 35 40 45 5052
Ely
1 5 10 15 20 25 30 35 40 45 5052
0
100
200
300
400
0
100
200
300
400
0
100
200
300
Week of year
Att
end
ees
per
wee
kA. Minor Injury Unit attendees
2015-03-30 to 2020-05-17 ↓↓↓, → ↓↓↓, → ↓↓↓, → ↓↓↓, → ↓↓↓, → ↓↓↓, → ↓↓↓, → ↓↓↓, → ↓↓↓, → ↓↓↓, → ↓↓↓, → ↓↓↓, → ↓↓↓, → ↓↓↓, → ↓↓↓, → ↓↓↓, → ↓↓↓, → ↓↓↓, → ↓↓↓, → ↓↓↓, →
2010-04-05 to 2020-05-17 ↓↓, → ↓↓, → ↓↓, → ↓↓, → ↓↓, → ↓↓, → ↓↓, → ↓↓, → ↓↓, → ↓↓, → ↓↓, → ↓↓, → ↓↓, → ↓↓, → ↓↓, → ↓↓, → ↓↓, → ↓↓, → ↓↓, → ↓↓, →
Children
1 5 10 15 20 25 30 35 40 45 5052
Adults
1 5 10 15 20 25 30 35 40 45 5052
0
1000
2000
3000
4000
0
400
800
1200
Week of year
Ref
erra
ls p
er w
eek
B. PH referrals
2016-04-01 to 2020-04-30↓↓, ↘↘↘↓↓, ↘↘↘↓↓, ↘↘↘↓↓, ↘↘↘↓↓, ↘↘↘↓↓, ↘↘↘↓↓, ↘↘↘↓↓, ↘↘↘↓↓, ↘↘↘↓↓, ↘↘↘↓↓, ↘↘↘↓↓, ↘↘↘↓↓, ↘↘↘↓↓, ↘↘↘↓↓, ↘↘↘↓↓, ↘↘↘↓↓, ↘↘↘↓↓, ↘↘↘↓↓, ↘↘↘↓↓, ↘↘↘↓↓, ↘↘↘↓↓, ↘↘↘↓↓, ↘↘↘↓↓, ↘↘↘↓↓, ↘↘↘↓↓, ↘↘↘↓↓, ↘↘↘↓↓, ↘↘↘↓↓, ↘↘↘↓↓, ↘↘↘↓↓, ↘↘↘↓↓, ↘↘↘↓↓, ↘↘↘↓↓, ↘↘↘↓↓, ↘↘↘↓↓, ↘↘↘↓↓, ↘↘↘↓↓, ↘↘↘↓↓, ↘↘↘↓↓, ↘↘↘↓↓, ↘↘↘↓↓, ↘↘↘↓↓, ↘↘↘↓↓, ↘↘↘↓↓, ↘↘↘↓↓, ↘↘↘↓↓, ↘↘↘↓↓, ↘↘↘↓↓, ↘↘↘0
1000
2000
3000
1 2 3 4 5 6 7 8 9 10 11 12
Month of year
Bed
-day
s p
er m
onth
C. PH inpatient bed occupancy
2015-03-30 to 2020-05-17 ↓↓↓, ↘ ↓↓↓, ↘ ↓↓↓, ↘ ↓↓↓, ↘ ↓↓↓, ↘ ↓↓↓, ↘ ↓↓↓, ↘ ↓↓↓, ↘ ↓↓↓, ↘ ↓↓↓, ↘ ↓↓↓, ↘ ↓↓↓, ↘ ↓↓↓, ↘ ↓↓↓, ↘ ↓↓↓, ↘ ↓↓↓, ↘ ↓↓↓, ↘ ↓↓↓, ↘ ↓↓↓, ↘ ↓↓↓, ↘
2015-03-30 to 2020-05-17 ↑↑↑, ↘↘↘ ↑↑↑, ↘↘↘ ↑↑↑, ↘↘↘ ↑↑↑, ↘↘↘ ↑↑↑, ↘↘↘ ↑↑↑, ↘↘↘ ↑↑↑, ↘↘↘ ↑↑↑, ↘↘↘ ↑↑↑, ↘↘↘ ↑↑↑, ↘↘↘ ↑↑↑, ↘↘↘ ↑↑↑, ↘↘↘ ↑↑↑, ↘↘↘ ↑↑↑, ↘↘↘ ↑↑↑, ↘↘↘ ↑↑↑, ↘↘↘ ↑↑↑, ↘↘↘ ↑↑↑, ↘↘↘ ↑↑↑, ↘↘↘ ↑↑↑, ↘↘↘
2010-04-05 to 2020-05-17 ↓↓↓, → ↓↓↓, → ↓↓↓, → ↓↓↓, → ↓↓↓, → ↓↓↓, → ↓↓↓, → ↓↓↓, → ↓↓↓, → ↓↓↓, → ↓↓↓, → ↓↓↓, → ↓↓↓, → ↓↓↓, → ↓↓↓, → ↓↓↓, → ↓↓↓, → ↓↓↓, → ↓↓↓, → ↓↓↓, →
2010-04-05 to 2020-05-17 ↑↑↑, → ↑↑↑, → ↑↑↑, → ↑↑↑, → ↑↑↑, → ↑↑↑, → ↑↑↑, → ↑↑↑, → ↑↑↑, → ↑↑↑, → ↑↑↑, → ↑↑↑, → ↑↑↑, → ↑↑↑, → ↑↑↑, → ↑↑↑, → ↑↑↑, → ↑↑↑, → ↑↑↑, → ↑↑↑, →
Children / Not face-to-face
Children / Face-to-face
Adults / Not face-to-face
1 5 10 15 20 25 30 35 40 45 5052
1 5 10 15 20 25 30 35 40 45 5052
1 5 10 15 20 25 30 35 40 45 5052
Adults / Face-to-face
1 5 10 15 20 25 30 35 40 45 5052
0
5000
10000
15000
0
1000
2000
3000
4000
0
500
1000
1500
0
250
500
750
Week of year
Con
tact
s p
er w
eek
D. PH contacts
2019
2020
ITS 19/20
Mean±95% CI, –2019
Page 21 of 29

2015-04-06 to 2020-05-10 ↑↑↑, → ↑↑↑, → ↑↑↑, → ↑↑↑, → ↑↑↑, → ↑↑↑, → ↑↑↑, → ↑↑↑, → ↑↑↑, → ↑↑↑, → ↑↑↑, → ↑↑↑, → ↑↑↑, → ↑↑↑, → ↑↑↑, → ↑↑↑, → ↑↑↑, → ↑↑↑, → ↑↑↑, →0
100
200
1 5 10 15 20 25 30 35 40 45 5052
Week of year
Dea
ths
per
wee
kA. Deaths: patients open to PH services
↓↓
↑
↑
↑↑
(↑)
20
40
60
0-9
10
-19
20
-29
30
-39
40
-49
50
-59
60
-69
70
-79
80
-89
90
+
Age at death
Dea
ths
per
wee
k
B. By age (PH)
2013-06-17 to 2020-07-26 ↑↑↑, ↘↘↘ ↑↑↑, ↘↘↘ ↑↑↑, ↘↘↘ ↑↑↑, ↘↘↘ ↑↑↑, ↘↘↘ ↑↑↑, ↘↘↘ ↑↑↑, ↘↘↘ ↑↑↑, ↘↘↘ ↑↑↑, ↘↘↘ ↑↑↑, ↘↘↘ ↑↑↑, ↘↘↘ ↑↑↑, ↘↘↘ ↑↑↑, ↘↘↘ ↑↑↑, ↘↘↘ ↑↑↑, ↘↘↘ ↑↑↑, ↘↘↘ ↑↑↑, ↘↘↘ ↑↑↑, ↘↘↘ ↑↑↑, ↘↘↘ ↑↑↑, ↘↘↘ ↑↑↑, ↘↘↘ ↑↑↑, ↘↘↘ ↑↑↑, ↘↘↘ ↑↑↑, ↘↘↘ ↑↑↑, ↘↘↘ ↑↑↑, ↘↘↘ ↑↑↑, ↘↘↘ ↑↑↑, ↘↘↘ ↑↑↑, ↘↘↘ ↑↑↑, ↘↘↘
2013-06-17 to 2020-07-26 ↑↑↑, ↘↘↘ ↑↑↑, ↘↘↘ ↑↑↑, ↘↘↘ ↑↑↑, ↘↘↘ ↑↑↑, ↘↘↘ ↑↑↑, ↘↘↘ ↑↑↑, ↘↘↘ ↑↑↑, ↘↘↘ ↑↑↑, ↘↘↘ ↑↑↑, ↘↘↘ ↑↑↑, ↘↘↘ ↑↑↑, ↘↘↘ ↑↑↑, ↘↘↘ ↑↑↑, ↘↘↘ ↑↑↑, ↘↘↘ ↑↑↑, ↘↘↘ ↑↑↑, ↘↘↘ ↑↑↑, ↘↘↘ ↑↑↑, ↘↘↘ ↑↑↑, ↘↘↘ ↑↑↑, ↘↘↘ ↑↑↑, ↘↘↘ ↑↑↑, ↘↘↘ ↑↑↑, ↘↘↘ ↑↑↑, ↘↘↘ ↑↑↑, ↘↘↘ ↑↑↑, ↘↘↘ ↑↑↑, ↘↘↘ ↑↑↑, ↘↘↘ ↑↑↑, ↘↘↘
SMI coded
1 5 10 15 20 25 30 35 40 45 5052
No SMI coded
1 5 10 15 20 25 30 35 40 45 5052
0
50
100
150
0
5
10
Week of year
Dea
ths
per
wee
k
C. Deaths: patients known to MH services
↓↓ ↓↓
(↑)
(↑)
↑
↓
↑ ↑↑
SMI coded
0-9
10
-19
20
-29
30
-39
40
-49
50
-59
60
-69
70
-79
80
-89
90
+
No SMI coded
0-9
10
-19
20
-29
30
-39
40
-49
50
-59
60
-69
70
-79
80
-89
90
+
0
10
20
30
0.0
0.3
0.6
0.9
Age at death
Dea
ths
per
wee
k
D. By age (MH)
2020-03-02 to 2020-08-30
2020-03-02 to 2020-08-30
2020-03-02 to 2020-08-30
CUH (inpatient)
CUH (ED)
1 5 10 15 20 25 30 35 40 45 5052
1 5 10 15 20 25 30 35 40 45 5052
Cambridgeshire and Peterborough
1 5 10 15 20 25 30 35 40 45 5052
0200400600
02550
010203040
Week of year
Cas
es p
er w
eek
E. COVID-19 confirmed infections
***
†
#
0
1
2
3
4
5
2014 2016 2018 2020
Year
Sta
ndar
diz
edm
orta
lity
ratio
F. SMR (MH), 1 Jan–26 Jul
2019
2020
ITS 19/20
Mean±95% CI, –2019
No SMI coded
SMI coded
Page 22 of 29

SUPPLEMENTARY MATERIAL
The early impact of COVID-19 on mental health and community physical health services and their patients’ mortality in Cambridgeshire and Peterborough, UK
Chen et al.Journal of Psychiatric Research, DOI: 10.1016/j.jpsychires.2020.09.020
SUPPLEMENTARY METHODS
Geography and population
Cambridgeshire and Peterborough (C&P) is a Combined Authority in the East of England, with a population of ~0.86 million.1 Encompassing urban and rural areas, it has a total area of ~3,400 km2 and spans approximately 70×80 km. Its major cities are Cambridge (population ~140,000), Ely (~21,000), and Peterborough (~204,000); the other major conurbation is the town of Huntingdon (~25,000).2 The population is approximately 50% male and 50% female; 19.9% are aged 0–15, 62% are aged 16–64, and 18.2% are aged 65+.2 Across C&P, 90.2% are of White ethnicity and 9.8% of minority ethnicity, with greater ethnic diversity in Cambridge and Peterborough than the area as a whole. 3 The area spans a broad range of relative deprivation, with neighbourhoods (Lower Layer Super Output Areas, LSOAs) falling in all deciles of the Index of Multiple Deprivation (IMD) for England, but with a slightly higher proportion being less deprived. (As of 2019: 4.1% of LSOAs fall into the first and most deprived decile by IMD, 8.6% in the second decile, 5.7% the third, 6.4% the fourth, 11.5% the fifth, 11.1% the sixth, 11.3% the seventh, 13.3% the eighth, 14.0% the ninth, and 14.0% the tenth and least deprived decile.2)
Study approvals
The CPFT Research Database is approved by the Cambridge Central Research Ethics Committee, part of the Research Ethics Service of the UK Health Research Authority (references 12/EE/0407, 17/EE/0442). The present study was initiated via CPFT’s pandemic Major Incident Command structure and approved by the CPFT Research Database Oversight Committee on 7 July 2020.
Source clinical records systems and data quality
The four clinical records systems were as follows:
• RiO. CPFT’s electronic MH records system is RiO from Servelec (rolled out fully by mid-June 2013). Its records are cross-checked against the NHS Spine weekly to update dates of death for patients who have died (and therefore may be out of date with respect to the Spine by up to 7 days). Death notifications to the Spine can also be subject to delay, and this delay, which is unmeasured in our data, may have varied during the pandemic. We estimate this delay when truncating data (see Methods).
• SystmOne. PH records, and records for MH teams “embedded” in primary care, are in SystmOne, from The Phoenix Partnership (TPP). This has a live connection to the NHS Spine; deaths are registered when an active referral is closed following the death of a patient (so deaths are not registered for patients with no open SystmOne referrals to CPFT at the time of their death).
• PCMIS. CPFT’s Psychological Wellbeing Service (PWS), the local implementation of the UK’s Improving Access to Psychological Therapies (IAPT) programme, uses PCMIS (from the University of York).
• Epic. CPFT provides liaison psychiatry (LP) services to general and specialist hospitals in Cambridge (Addenbrooke’s Hospital, The Rosie Hospital, Royal Papworth Hospital), Peterborough (Peterborough City Hospital), and Huntingdon (Hinchingbrooke Hospital). Activity is recorded in those Trust’s records as well as CPFT’s RiO. In Cambridge, the acute hospital is part of Cambridge University Hospitals NHS Foundation Trust (CUH), which uses Epic (from Epic Systems Corporation). This provides additional structured data for a subset of CPFT LP activity.
RiO, SystmOne, and PCMIS are CPFT’s three clinical records systems, and between them capture all CPFT activity. They contain complete and non-overlapping data with respect to the outcomes analysed in this study; thus, their data were analysed separately. Epic provides more structured data (e.g. presenting problems) for a subset of liaison psychiatry referrals recorded in RiO.
Page 1 of 7
Page 23 of 29

In terms of data completeness and data quality, all referrals and admissions involve obligatory electronic recording as part of normal clinical workflow, as does detention under the MHA, and we expect 100% completeness (though cannot verify this from the de-identified research data set). As discussed in the main text, records of police detention under s136 MHA may be incomplete. Recording of diagnoses (e.g. those representing severe mental illness, SMI) was by clinicians, and may be incomplete. Liaison Psychiatry presenting problems are not made obligatory by the software but recording them via a structured template is part of the normal clinical workflow of LP teams using Epic. Recording of MH appointments/contacts is strongly encouraged in all secondary care MH teams but but there may be incomplete data (which we cannot measure via the research data set). Information about deaths is discussed above.
Classification of secondary care CPFT MH teams
We classified such teams as (a) child and adolescent mental health (CAMH) teams; (b) community MH teams (CMHTs) for adults of all ages, including perinatal MH teams, the personality disorder community service, some non-extant teams (assertive outreach teams), and older people’s primary care mental health services; (c) crisis resolution/home treatment teams (CRHTs); (d) adult liaison psychiatry (LP) teams; (e) early intervention in psychosis (EIP) teams; (f) eating disorder teams; (g) other specialist services (autistic spectrum disorder service, community forensic service, learning disability, prison in-reach and criminal justice liaison, community substance misuse [no longer provided by the NHS], memory/young-onset dementia services, brain injury services, art therapy, specialist psychotherapy, social care teams, approved mental health practitioner services, electroconvulsive therapy). We excluded wards (see Admissions) and some other services (e.g. day care, placement/support services, on-call teams, pharmacy).
Community services and Minor Injury Unit provision
Here we describe services whose data are captured within CPFT’s SystmOne electronic records system.
CPFT’s Children and Young People’s Directorate provides integrated children’s health services. This includes health visiting, community nursing, school nursing, speech and language therapy, paediatric psychology, occupational therapy, physiotherapy, community paediatrics, and child development. (This directorate also provides secondary care MH services for children and adolescents, captured within the RiO electronic system.)
CPFT’s Older People’s and Adult Community (OPAC) Directorate provides integrated Neighbourhood Teams for over-65s and for over-18s requiring community services. Their staff include support workers, district nurses, mental health nurses, occupational therapists, and physiotherapists. They provide case management integrating physical and mental health, a Hospital at Home service (encompassing community rehabilitation and palliative care), support for people to access personal care budgets, intermediate care (avoiding hospital admission or supporting those recently discharged), and crisis intervention. Other services include district nursing, podiatry, dietetics, memory services, speech and language therapy. There are four inpatient wards within this service for rehabilitation and end-of-life care (in Cambridge, Ely, Wisbech, and Peterborough). Joint Emergency Teams provide a two- or four-hour response for those aged 65+ or with long-term conditions who require urgent medical care but do not require hospital admission. (This directorate also provides secondary care mental health services for those aged 65+, captured within RiO.)
CPFT’s OPAC Directorate also provides Minor Injury Units (MIUs) for patients of all ages, staffed by specialist nurse practitioners. These are walk-in services. The MIUs treat wounds, bites, minor burns/scalds, fractures, muscle and joint injuries (including sports injuries), eye problems (e.g. foreign bodies, conjunctivitis), earache, cystitis (excluding children and male patients), and minor head injuries without loss of consciousness. The three MIUs (at Doddington, Ely, and Wisbech) lie within a circle of diameter ~33 km.
Service reorganization
A number of services reorganized during this period, influencing activity from the “supply” side. These included:
• CAMH closed to non-urgent referrals, and ordinarily receives many referrals from schools, which shut on 2020-03-19 (week 12). Staff were moved into CPFT’s First Response Service (FRS), the service providing the NHS 111 MH crisis telephone line, to provide a 24/7 crisis assessment service for children/adolescents.
• The Adult & Specialist MH directorate deferred appointments for many non-urgent referrals and offered interim telephone support, or closed to non-urgent referrals. Services in these categories included the primary care mental health service, locality teams, perinatal service, and neurodevelopmental assessment service. Others continued as normal, though with a shift towards remote work (e.g. eating disorder services, CRHT, first-episode psychosis services).
Page 2 of 7
Page 24 of 29

• The older people’s MH directorate shut routine memory/stepped care services, and advised professionals that referrals would be triaged to focus on people requiring intervention to prevent deterioration that might lead to hospital admission or threat to life.
• Non-urgent referrals were suspended for PH services including community rehabilitation, neurorehabilitation, diabetes, dietetics, continence, and speech/language therapy.
• The Doddington and Wisbech MIUs were closed on 2020-04-06 (week 15). The Ely MIU remained open and its hours were extended.
• Acute hospitals cancelled routine activity and discharged patients in preparation for COVID-19. For example, CUH is a 1,268-bed hospital4 and had 413 empty beds by 2020-04-23 (week 17), influencing inpatient (ward) referrals to LP. Additionally, the CUH ED was reconfigured on 2020-03-20 (week 12) to redeploy its CDU, a ward normally used for patients awaiting test results or having observation/therapy following overdose. Such patients were instead transferred directly to medical wards, which may in turn have shifted a proportion of LP referrals from the ED to wards.
• MH hospitals similarly made all efforts to discharge patients where safe, including to create isolation areas in some wards (with a reduction in total available bed numbers); at times there were ward closures in response to outbreaks. CAMH closed one of its three wards temporarily (closed 2020-03-17, reopened 2020-06-01).
• Inter-ward transfers within CPFT were curtailed. Such transfers normally occur for several reasons, including repatriation between CPFT’s hospitals to be closer to home, transfer to/from specialist wards such as as the psychiatric intensive care unit, and policy-based transfer. For working-age adults, CPFT ordinarily operates a “3-3-3” ward system,5 in which most voluntary patients are admitted to an “assessment” (3-day) ward, then transferred if necessary to a “treatment” (3-week) ward (to which detained patients are admitted initially), and then to a “rehabilitation” (3-month) ward. This system was changed (formally on 2020-04-20, week 17) to reduce inter-ward transfer. Older people’s MH services restricted inter-ward transfers for infection control on 2020-03-23 (week 13).
• There was a deliberate shift towards remote consultation across the NHS.6
• Alternative locations were sometimes used for urgent psychiatric assessments that might normally have taken place in EDs, to minimize ED footfall. However, these were recorded by and against the teams that would normally have performed those assessments.
• CPFT collaborated with a local mental health charity (Cambridgeshire, Peterborough and South Lincolnshire Mind) to provide non-urgent psychological support via telephone as an alternative to 111 and IAPT.7 Calls to this service were not captured in the present data.
• Other parts of the health service such as primary care changed procedures and priorities, which may have affected referrals “inwards” to CPFT.
Changes to national data reporting
Data from the UK central COVID-19 reporting for Cambridgeshire and Peterborough changed retrospectively,8 with more cases being reported as the result of adding “pillar 2” testing (antigen tests by commercial partners for the wider population) to “pillar 1” testing (antigen tests by Public Health England laboratories and NHS hospitals for those with a direct clinical need and health/care workers), plus de-duplication.8 Nationally, this was associated with a shift in the apparent peak of COVID-19 cases from weeks 14–15 to weeks 15–18.9 This change also accounts for some differences in these data (Figure 5C) from the preprint of the present study (at https://dx.doi.org/10.2139/ssrn.3648247).
SUPPLEMENTARY RESULTS
Referrals to secondary care MH teams, by SMI
Referrals to secondary care MH teams, shown aggregated across all patients in Figure 1E, are shown split by patients who did or did not have a lifetime recorded diagnosis of a severe mental illness (SMI, classified as per the Methods), in Supplementary Figure 1.
Admission, Mental Health Act, documentation, and contact data, by SMI
Whereas Figure 3 shows data for all patients, Supplementary Figure 2 shows these measures but only for patients with a lifetime recorded diagnosis of an SMI, and Supplementary Figure 3 for patients without such a recorded diagnosis.
Page 3 of 7
Page 25 of 29

SUPPLEMENTARY REFERENCES
1 Office for National Statistics. Estimates of the population for the UK, England and Wales, Scotland and Northern Ireland [mid-2019 estimates]. 2020; published online June 24. https://www.ons.gov.uk/file?uri=%2fpeoplepopulationandcommunity%2fpopulationandmigration%2fpopulationestimates%2fdatasets%2fpopulationestimatesforukenglandandwalesscotlandandnorthernireland%2fmid2019april2020localauthoritydistrictcodes/ukmidyearestimates20192020ladcodes.xls (accessed July 3, 2020).
2 Cambridgeshire Insight. Cambridgeshire Insight. 2020. https://cambridgeshireinsight.org.uk/population/ (accessed Aug 31, 2020).
3 Office for National Statistics. 2011 Census: Ethnic group, local authorities in England and Wales. 2012. https://www.ons.gov.uk/file?uri=/peoplepopulationandcommunity/populationandmigration/populationestimates/datasets/2011censuskeystatisticsforlocalauthoritiesinenglandandwales/r21ewrttableks201ewladv1_tcm77-290595.xls (accessed Aug 31, 2020).
4 Care Quality Commission. Cambridge University Hospitals NHS Foundation Trust: Inspection Report. 2019; published online Feb 26. https://www.cqc.org.uk/sites/default/files/new_reports/AAAJ0418.pdf.
5 Kar Ray M, Lombardo C, Syed Z, Patel N, Denman C, Jones PB. Embedding Recovery to Transform Inpatient Mental Health Care: The 333 Model. Psychiatr Serv Wash DC 2019; 70: 465–73.
6 NHS England, NHS Improvement. Next steps on NHS response to COVID-19. 2020; published online March 17. https://www.england.nhs.uk/coronavirus/wp-content/uploads/sites/52/2020/03/20200317-NHS-COVID-letter-FINAL.pdf (accessed March 18, 2020).
7 Cambridgeshire & Peterborough NHS Foundation Trust. Now we’re talking - coming together in isolation. 2020; published online April 27. https://web.archive.org/web/20200630192027/https://www.cpft.nhs.uk/Latest-news/Now-were-talking---coming-together-in-isolation.htm (accessed June 30, 2020).
8 Public Health England, NHSX. Coronavirus (COVID-19) in the UK. 2020. https://coronavirus.data.gov.uk/.
9 Mahase E. Covid-19: the problems with case counting. BMJ 2020; 370: m3374.
Page 4 of 7
Page 26 of 29

2013-06-17 to 2020-08-09 →, → →, → →, → →, → →, → →, → →, → →, → →, → →, → →, → →, → →, → →, → →, → →, → →, → →, → →, → →, → →, → →, → →, → →, → →, → →, → →, → →, → →, → →, → →, → →, →
2013-06-17 to 2020-08-09 ↓↓, → ↓↓, → ↓↓, → ↓↓, → ↓↓, → ↓↓, → ↓↓, → ↓↓, → ↓↓, → ↓↓, → ↓↓, → ↓↓, → ↓↓, → ↓↓, → ↓↓, → ↓↓, → ↓↓, → ↓↓, → ↓↓, → ↓↓, → ↓↓, → ↓↓, → ↓↓, → ↓↓, → ↓↓, → ↓↓, → ↓↓, → ↓↓, → ↓↓, → ↓↓, → ↓↓, → ↓↓, →
2016-09-19 to 2020-08-09 →, → →, → →, → →, → →, → →, → →, → →, → →, → →, → →, → →, → →, → →, → →, → →, → →, → →, → →, → →, → →, → →, → →, → →, → →, → →, → →, → →, → →, → →, → →, → →, →
2013-06-17 to 2020-08-09 ↓↓, → ↓↓, → ↓↓, → ↓↓, → ↓↓, → ↓↓, → ↓↓, → ↓↓, → ↓↓, → ↓↓, → ↓↓, → ↓↓, → ↓↓, → ↓↓, → ↓↓, → ↓↓, → ↓↓, → ↓↓, → ↓↓, → ↓↓, → ↓↓, → ↓↓, → ↓↓, → ↓↓, → ↓↓, → ↓↓, → ↓↓, → ↓↓, → ↓↓, → ↓↓, → ↓↓, → ↓↓, →
2013-06-17 to 2020-08-09 →, → →, → →, → →, → →, → →, → →, → →, → →, → →, → →, → →, → →, → →, → →, → →, → →, → →, → →, → →, → →, → →, → →, → →, → →, → →, → →, → →, → →, → →, → →, → →, →
2013-06-17 to 2020-08-09 →, → →, → →, → →, → →, → →, → →, → →, → →, → →, → →, → →, → →, → →, → →, → →, → →, → →, → →, → →, → →, → →, → →, → →, → →, → →, → →, → →, → →, → →, → →, → →, →
2013-06-17 to 2020-08-09 →, → →, → →, → →, → →, → →, → →, → →, → →, → →, → →, → →, → →, → →, → →, → →, → →, → →, → →, → →, → →, → →, → →, → →, → →, → →, → →, → →, → →, → →, → →, → →, →
Other specialist teams
Eating disorder teams
Early intervention psychosis services
Liaison psychiatry
Crisis teams
Community mental health teams
1 5 10 15 20 25 30 35 40 45 5052
1 5 10 15 20 25 30 35 40 45 5052
1 5 10 15 20 25 30 35 40 45 5052
1 5 10 15 20 25 30 35 40 45 5052
1 5 10 15 20 25 30 35 40 45 5052
1 5 10 15 20 25 30 35 40 45 5052
Child/adolescent services
1 5 10 15 20 25 30 35 40 45 5052
0
1
2
3
0
100
200
300
0
20
40
60
0
10
20
0
10
20
0.0
0.5
1.0
1.5
2.0
0
10
20
30
40
50
Week of year
Ref
erra
ls p
er w
eek
A. Referrals to secondary care MH teams: SMI recorded
2013-06-17 to 2020-08-09 ↓↓↓, ↗↗↗ ↓↓↓, ↗↗↗ ↓↓↓, ↗↗↗ ↓↓↓, ↗↗↗ ↓↓↓, ↗↗↗ ↓↓↓, ↗↗↗ ↓↓↓, ↗↗↗ ↓↓↓, ↗↗↗ ↓↓↓, ↗↗↗ ↓↓↓, ↗↗↗ ↓↓↓, ↗↗↗ ↓↓↓, ↗↗↗ ↓↓↓, ↗↗↗ ↓↓↓, ↗↗↗ ↓↓↓, ↗↗↗ ↓↓↓, ↗↗↗ ↓↓↓, ↗↗↗ ↓↓↓, ↗↗↗ ↓↓↓, ↗↗↗ ↓↓↓, ↗↗↗ ↓↓↓, ↗↗↗ ↓↓↓, ↗↗↗ ↓↓↓, ↗↗↗ ↓↓↓, ↗↗↗ ↓↓↓, ↗↗↗ ↓↓↓, ↗↗↗ ↓↓↓, ↗↗↗ ↓↓↓, ↗↗↗ ↓↓↓, ↗↗↗ ↓↓↓, ↗↗↗ ↓↓↓, ↗↗↗ ↓↓↓, ↗↗↗
2013-06-17 to 2020-08-09 ↓↓↓, ↗↗ ↓↓↓, ↗↗ ↓↓↓, ↗↗ ↓↓↓, ↗↗ ↓↓↓, ↗↗ ↓↓↓, ↗↗ ↓↓↓, ↗↗ ↓↓↓, ↗↗ ↓↓↓, ↗↗ ↓↓↓, ↗↗ ↓↓↓, ↗↗ ↓↓↓, ↗↗ ↓↓↓, ↗↗ ↓↓↓, ↗↗ ↓↓↓, ↗↗ ↓↓↓, ↗↗ ↓↓↓, ↗↗ ↓↓↓, ↗↗ ↓↓↓, ↗↗ ↓↓↓, ↗↗ ↓↓↓, ↗↗ ↓↓↓, ↗↗ ↓↓↓, ↗↗ ↓↓↓, ↗↗ ↓↓↓, ↗↗ ↓↓↓, ↗↗ ↓↓↓, ↗↗ ↓↓↓, ↗↗ ↓↓↓, ↗↗ ↓↓↓, ↗↗ ↓↓↓, ↗↗ ↓↓↓, ↗↗
2016-09-19 to 2020-08-09 ↓↓, ↗↗ ↓↓, ↗↗ ↓↓, ↗↗ ↓↓, ↗↗ ↓↓, ↗↗ ↓↓, ↗↗ ↓↓, ↗↗ ↓↓, ↗↗ ↓↓, ↗↗ ↓↓, ↗↗ ↓↓, ↗↗ ↓↓, ↗↗ ↓↓, ↗↗ ↓↓, ↗↗ ↓↓, ↗↗ ↓↓, ↗↗ ↓↓, ↗↗ ↓↓, ↗↗ ↓↓, ↗↗ ↓↓, ↗↗ ↓↓, ↗↗ ↓↓, ↗↗ ↓↓, ↗↗ ↓↓, ↗↗ ↓↓, ↗↗ ↓↓, ↗↗ ↓↓, ↗↗ ↓↓, ↗↗ ↓↓, ↗↗ ↓↓, ↗↗ ↓↓, ↗↗ ↓↓, ↗↗
2013-06-17 to 2020-08-09 ↓↓↓, ↗↗↗ ↓↓↓, ↗↗↗ ↓↓↓, ↗↗↗ ↓↓↓, ↗↗↗ ↓↓↓, ↗↗↗ ↓↓↓, ↗↗↗ ↓↓↓, ↗↗↗ ↓↓↓, ↗↗↗ ↓↓↓, ↗↗↗ ↓↓↓, ↗↗↗ ↓↓↓, ↗↗↗ ↓↓↓, ↗↗↗ ↓↓↓, ↗↗↗ ↓↓↓, ↗↗↗ ↓↓↓, ↗↗↗ ↓↓↓, ↗↗↗ ↓↓↓, ↗↗↗ ↓↓↓, ↗↗↗ ↓↓↓, ↗↗↗ ↓↓↓, ↗↗↗ ↓↓↓, ↗↗↗ ↓↓↓, ↗↗↗ ↓↓↓, ↗↗↗ ↓↓↓, ↗↗↗ ↓↓↓, ↗↗↗ ↓↓↓, ↗↗↗ ↓↓↓, ↗↗↗ ↓↓↓, ↗↗↗ ↓↓↓, ↗↗↗ ↓↓↓, ↗↗↗ ↓↓↓, ↗↗↗ ↓↓↓, ↗↗↗
2013-06-17 to 2020-08-09 →, → →, → →, → →, → →, → →, → →, → →, → →, → →, → →, → →, → →, → →, → →, → →, → →, → →, → →, → →, → →, → →, → →, → →, → →, → →, → →, → →, → →, → →, → →, → →, →
2013-06-17 to 2020-08-09 ↓↓↓, ↗↗ ↓↓↓, ↗↗ ↓↓↓, ↗↗ ↓↓↓, ↗↗ ↓↓↓, ↗↗ ↓↓↓, ↗↗ ↓↓↓, ↗↗ ↓↓↓, ↗↗ ↓↓↓, ↗↗ ↓↓↓, ↗↗ ↓↓↓, ↗↗ ↓↓↓, ↗↗ ↓↓↓, ↗↗ ↓↓↓, ↗↗ ↓↓↓, ↗↗ ↓↓↓, ↗↗ ↓↓↓, ↗↗ ↓↓↓, ↗↗ ↓↓↓, ↗↗ ↓↓↓, ↗↗ ↓↓↓, ↗↗ ↓↓↓, ↗↗ ↓↓↓, ↗↗ ↓↓↓, ↗↗ ↓↓↓, ↗↗ ↓↓↓, ↗↗ ↓↓↓, ↗↗ ↓↓↓, ↗↗ ↓↓↓, ↗↗ ↓↓↓, ↗↗ ↓↓↓, ↗↗ ↓↓↓, ↗↗
2013-06-17 to 2020-08-09 ↓↓↓, ↗↗↗ ↓↓↓, ↗↗↗ ↓↓↓, ↗↗↗ ↓↓↓, ↗↗↗ ↓↓↓, ↗↗↗ ↓↓↓, ↗↗↗ ↓↓↓, ↗↗↗ ↓↓↓, ↗↗↗ ↓↓↓, ↗↗↗ ↓↓↓, ↗↗↗ ↓↓↓, ↗↗↗ ↓↓↓, ↗↗↗ ↓↓↓, ↗↗↗ ↓↓↓, ↗↗↗ ↓↓↓, ↗↗↗ ↓↓↓, ↗↗↗ ↓↓↓, ↗↗↗ ↓↓↓, ↗↗↗ ↓↓↓, ↗↗↗ ↓↓↓, ↗↗↗ ↓↓↓, ↗↗↗ ↓↓↓, ↗↗↗ ↓↓↓, ↗↗↗ ↓↓↓, ↗↗↗ ↓↓↓, ↗↗↗ ↓↓↓, ↗↗↗ ↓↓↓, ↗↗↗ ↓↓↓, ↗↗↗ ↓↓↓, ↗↗↗ ↓↓↓, ↗↗↗ ↓↓↓, ↗↗↗ ↓↓↓, ↗↗↗
Other specialist teams
Eating disorder teams
Early intervention psychosis services
Liaison psychiatry
Crisis teams
Community mental health teams
1 5 10 15 20 25 30 35 40 45 5052
1 5 10 15 20 25 30 35 40 45 5052
1 5 10 15 20 25 30 35 40 45 5052
1 5 10 15 20 25 30 35 40 45 5052
1 5 10 15 20 25 30 35 40 45 5052
1 5 10 15 20 25 30 35 40 45 5052
Child/adolescent services
1 5 10 15 20 25 30 35 40 45 5052
0
100
200
0
200
400
0
40
80
0
100
200
0
20
40
60
0
10
20
30
0
100
200
300
Week of year
Ref
erra
ls p
er w
eek
B. Referrals to secondary care MH teams: no SMI recorded
2019
2020
ITS 19/20
Mean±95% CI, –2019
Supplementary Figure 1. Referrals to secondary care MH teams, split by SMI. (A) Referrals for patients with a lifetime recordeddiagnosis of an SMI. (B) Referrals for patients without a recorded SMI. Graphical conventions as for Figure 1.
Page 5 of 7
Page 27 of 29

2013-06-17 to 2020-08-09 ↓↓, ↗↗↗ ↓↓, ↗↗↗ ↓↓, ↗↗↗ ↓↓, ↗↗↗ ↓↓, ↗↗↗ ↓↓, ↗↗↗ ↓↓, ↗↗↗ ↓↓, ↗↗↗ ↓↓, ↗↗↗ ↓↓, ↗↗↗ ↓↓, ↗↗↗ ↓↓, ↗↗↗ ↓↓, ↗↗↗ ↓↓, ↗↗↗ ↓↓, ↗↗↗ ↓↓, ↗↗↗ ↓↓, ↗↗↗ ↓↓, ↗↗↗ ↓↓, ↗↗↗ ↓↓, ↗↗↗ ↓↓, ↗↗↗ ↓↓, ↗↗↗ ↓↓, ↗↗↗ ↓↓, ↗↗↗ ↓↓, ↗↗↗ ↓↓, ↗↗↗ ↓↓, ↗↗↗ ↓↓, ↗↗↗ ↓↓, ↗↗↗ ↓↓, ↗↗↗ ↓↓, ↗↗↗ ↓↓, ↗↗↗
2013-06-17 to 2020-08-09 ↓↓↓, → ↓↓↓, → ↓↓↓, → ↓↓↓, → ↓↓↓, → ↓↓↓, → ↓↓↓, → ↓↓↓, → ↓↓↓, → ↓↓↓, → ↓↓↓, → ↓↓↓, → ↓↓↓, → ↓↓↓, → ↓↓↓, → ↓↓↓, → ↓↓↓, → ↓↓↓, → ↓↓↓, → ↓↓↓, → ↓↓↓, → ↓↓↓, → ↓↓↓, → ↓↓↓, → ↓↓↓, → ↓↓↓, → ↓↓↓, → ↓↓↓, → ↓↓↓, → ↓↓↓, → ↓↓↓, → ↓↓↓, →
Detained
1 5 10 15 20 25 30 35 40 45 5052
Voluntary
1 5 10 15 20 25 30 35 40 45 5052
0
25
50
75
0
25
50
75
Week of year
Inp
atie
nts
per
ave
rage
day
A. MH inpatients
2013-06-17 to 2020-08-09 →, → →, → →, → →, → →, → →, → →, → →, → →, → →, → →, → →, → →, → →, → →, → →, → →, → →, → →, → →, → →, → →, → →, → →, → →, → →, → →, → →, → →, → →, → →, → →, →
2013-06-17 to 2020-08-09 ↓↓↓, ↗ ↓↓↓, ↗ ↓↓↓, ↗ ↓↓↓, ↗ ↓↓↓, ↗ ↓↓↓, ↗ ↓↓↓, ↗ ↓↓↓, ↗ ↓↓↓, ↗ ↓↓↓, ↗ ↓↓↓, ↗ ↓↓↓, ↗ ↓↓↓, ↗ ↓↓↓, ↗ ↓↓↓, ↗ ↓↓↓, ↗ ↓↓↓, ↗ ↓↓↓, ↗ ↓↓↓, ↗ ↓↓↓, ↗ ↓↓↓, ↗ ↓↓↓, ↗ ↓↓↓, ↗ ↓↓↓, ↗ ↓↓↓, ↗ ↓↓↓, ↗ ↓↓↓, ↗ ↓↓↓, ↗ ↓↓↓, ↗ ↓↓↓, ↗ ↓↓↓, ↗ ↓↓↓, ↗
2013-06-17 to 2020-08-09 →, → →, → →, → →, → →, → →, → →, → →, → →, → →, → →, → →, → →, → →, → →, → →, → →, → →, → →, → →, → →, → →, → →, → →, → →, → →, → →, → →, → →, → →, → →, → →, →
2013-06-17 to 2020-08-09 →, → →, → →, → →, → →, → →, → →, → →, → →, → →, → →, → →, → →, → →, → →, → →, → →, → →, → →, → →, → →, → →, → →, → →, → →, → →, → →, → →, → →, → →, → →, → →, →
Readmissions <30d
Discharges
Ward transfers
1 5 10 15 20 25 30 35 40 45 5052
1 5 10 15 20 25 30 35 40 45 5052
1 5 10 15 20 25 30 35 40 45 5052
Admissions
1 5 10 15 20 25 30 35 40 45 5052
0
10
20
0
5
10
15
0
10
20
0.0
2.5
5.0
Week of year
Per
wee
k
B. MH inpatient transition events
2013-06-17 to 2020-08-02 →, → →, → →, → →, → →, → →, → →, → →, → →, → →, → →, → →, → →, → →, → →, → →, → →, → →, → →, → →, → →, → →, → →, → →, → →, → →, → →, → →, → →, → →, → →, →
2016-11-21 to 2020-08-02 →, → →, → →, → →, → →, → →, → →, → →, → →, → →, → →, → →, → →, → →, → →, → →, → →, → →, → →, → →, → →, → →, →
Assessments following police detention (s136)
1 5 10 15 20 25 30 35 40 45 5052
New detention episodes (CPFT)
1 5 10 15 20 25 30 35 40 45 5052
0
5
10
0
5
10
15
Week of year
Det
entio
ns p
er w
eek
C. Use of the Mental Health Act
2013-06-17 to 2020-08-09 ↓↓, ↗↗ ↓↓, ↗↗ ↓↓, ↗↗ ↓↓, ↗↗ ↓↓, ↗↗ ↓↓, ↗↗ ↓↓, ↗↗ ↓↓, ↗↗ ↓↓, ↗↗ ↓↓, ↗↗ ↓↓, ↗↗ ↓↓, ↗↗ ↓↓, ↗↗ ↓↓, ↗↗ ↓↓, ↗↗ ↓↓, ↗↗ ↓↓, ↗↗ ↓↓, ↗↗ ↓↓, ↗↗ ↓↓, ↗↗ ↓↓, ↗↗ ↓↓, ↗↗ ↓↓, ↗↗ ↓↓, ↗↗ ↓↓, ↗↗ ↓↓, ↗↗ ↓↓, ↗↗ ↓↓, ↗↗ ↓↓, ↗↗ ↓↓, ↗↗ ↓↓, ↗↗ ↓↓, ↗↗
2013-06-17 to 2020-08-09 ↓↓↓, ↗↗ ↓↓↓, ↗↗ ↓↓↓, ↗↗ ↓↓↓, ↗↗ ↓↓↓, ↗↗ ↓↓↓, ↗↗ ↓↓↓, ↗↗ ↓↓↓, ↗↗ ↓↓↓, ↗↗ ↓↓↓, ↗↗ ↓↓↓, ↗↗ ↓↓↓, ↗↗ ↓↓↓, ↗↗ ↓↓↓, ↗↗ ↓↓↓, ↗↗ ↓↓↓, ↗↗ ↓↓↓, ↗↗ ↓↓↓, ↗↗ ↓↓↓, ↗↗ ↓↓↓, ↗↗ ↓↓↓, ↗↗ ↓↓↓, ↗↗ ↓↓↓, ↗↗ ↓↓↓, ↗↗ ↓↓↓, ↗↗ ↓↓↓, ↗↗ ↓↓↓, ↗↗ ↓↓↓, ↗↗ ↓↓↓, ↗↗ ↓↓↓, ↗↗ ↓↓↓, ↗↗ ↓↓↓, ↗↗
Binary documents
1 5 10 15 20 25 30 35 40 45 5052
Progress notes
1 5 10 15 20 25 30 35 40 45 5052
0
2500
5000
0
500
1000
1500
2000
Week of year
Ent
ries
per
wee
k
D. MH documentation
2013-06-17 to 2020-08-02 ↑↑↑, ↘↘↘ ↑↑↑, ↘↘↘ ↑↑↑, ↘↘↘ ↑↑↑, ↘↘↘ ↑↑↑, ↘↘↘ ↑↑↑, ↘↘↘ ↑↑↑, ↘↘↘ ↑↑↑, ↘↘↘ ↑↑↑, ↘↘↘ ↑↑↑, ↘↘↘ ↑↑↑, ↘↘↘ ↑↑↑, ↘↘↘ ↑↑↑, ↘↘↘ ↑↑↑, ↘↘↘ ↑↑↑, ↘↘↘ ↑↑↑, ↘↘↘ ↑↑↑, ↘↘↘ ↑↑↑, ↘↘↘ ↑↑↑, ↘↘↘ ↑↑↑, ↘↘↘ ↑↑↑, ↘↘↘ ↑↑↑, ↘↘↘ ↑↑↑, ↘↘↘ ↑↑↑, ↘↘↘ ↑↑↑, ↘↘↘ ↑↑↑, ↘↘↘ ↑↑↑, ↘↘↘ ↑↑↑, ↘↘↘ ↑↑↑, ↘↘↘ ↑↑↑, ↘↘↘ ↑↑↑, ↘↘↘
2013-06-17 to 2020-08-02 ↓↓↓, ↗↗↗ ↓↓↓, ↗↗↗ ↓↓↓, ↗↗↗ ↓↓↓, ↗↗↗ ↓↓↓, ↗↗↗ ↓↓↓, ↗↗↗ ↓↓↓, ↗↗↗ ↓↓↓, ↗↗↗ ↓↓↓, ↗↗↗ ↓↓↓, ↗↗↗ ↓↓↓, ↗↗↗ ↓↓↓, ↗↗↗ ↓↓↓, ↗↗↗ ↓↓↓, ↗↗↗ ↓↓↓, ↗↗↗ ↓↓↓, ↗↗↗ ↓↓↓, ↗↗↗ ↓↓↓, ↗↗↗ ↓↓↓, ↗↗↗ ↓↓↓, ↗↗↗ ↓↓↓, ↗↗↗ ↓↓↓, ↗↗↗ ↓↓↓, ↗↗↗ ↓↓↓, ↗↗↗ ↓↓↓, ↗↗↗ ↓↓↓, ↗↗↗ ↓↓↓, ↗↗↗ ↓↓↓, ↗↗↗ ↓↓↓, ↗↗↗ ↓↓↓, ↗↗↗ ↓↓↓, ↗↗↗
Other
1 5 10 15 20 25 30 35 40 45 5052
Telephone
1 5 10 15 20 25 30 35 40 45 5052
0
100
200
300
0
500
1000
Week of year
Con
tact
s p
er w
eek
E. MH appointments/contacts (¶)
2019
2020
ITS 19/20
Mean±95% CI, –2019
Supplementary Figure 2. Measures as for Figure 3, but restricted to patients with a lifetime recorded diagnosis of an SMI.Graphical conventions as for Figure 1.
Page 6 of 7
Page 28 of 29

2013-06-17 to 2020-08-09 ↓↓↓, ↗↗↗ ↓↓↓, ↗↗↗ ↓↓↓, ↗↗↗ ↓↓↓, ↗↗↗ ↓↓↓, ↗↗↗ ↓↓↓, ↗↗↗ ↓↓↓, ↗↗↗ ↓↓↓, ↗↗↗ ↓↓↓, ↗↗↗ ↓↓↓, ↗↗↗ ↓↓↓, ↗↗↗ ↓↓↓, ↗↗↗ ↓↓↓, ↗↗↗ ↓↓↓, ↗↗↗ ↓↓↓, ↗↗↗ ↓↓↓, ↗↗↗ ↓↓↓, ↗↗↗ ↓↓↓, ↗↗↗ ↓↓↓, ↗↗↗ ↓↓↓, ↗↗↗ ↓↓↓, ↗↗↗ ↓↓↓, ↗↗↗ ↓↓↓, ↗↗↗ ↓↓↓, ↗↗↗ ↓↓↓, ↗↗↗ ↓↓↓, ↗↗↗ ↓↓↓, ↗↗↗ ↓↓↓, ↗↗↗ ↓↓↓, ↗↗↗ ↓↓↓, ↗↗↗ ↓↓↓, ↗↗↗ ↓↓↓, ↗↗↗
2013-06-17 to 2020-08-09 ↓↓, → ↓↓, → ↓↓, → ↓↓, → ↓↓, → ↓↓, → ↓↓, → ↓↓, → ↓↓, → ↓↓, → ↓↓, → ↓↓, → ↓↓, → ↓↓, → ↓↓, → ↓↓, → ↓↓, → ↓↓, → ↓↓, → ↓↓, → ↓↓, → ↓↓, → ↓↓, → ↓↓, → ↓↓, → ↓↓, → ↓↓, → ↓↓, → ↓↓, → ↓↓, → ↓↓, → ↓↓, →
Detained
1 5 10 15 20 25 30 35 40 45 5052
Voluntary
1 5 10 15 20 25 30 35 40 45 5052
0
40
80
0
10
20
30
40
Week of year
Inp
atie
nts
per
ave
rage
day
A. MH inpatients
2013-06-17 to 2020-08-09 ↓, → ↓, → ↓, → ↓, → ↓, → ↓, → ↓, → ↓, → ↓, → ↓, → ↓, → ↓, → ↓, → ↓, → ↓, → ↓, → ↓, → ↓, → ↓, → ↓, → ↓, → ↓, → ↓, → ↓, → ↓, → ↓, → ↓, → ↓, → ↓, → ↓, → ↓, → ↓, →
2013-06-17 to 2020-08-09 ↓↓↓, ↗↗ ↓↓↓, ↗↗ ↓↓↓, ↗↗ ↓↓↓, ↗↗ ↓↓↓, ↗↗ ↓↓↓, ↗↗ ↓↓↓, ↗↗ ↓↓↓, ↗↗ ↓↓↓, ↗↗ ↓↓↓, ↗↗ ↓↓↓, ↗↗ ↓↓↓, ↗↗ ↓↓↓, ↗↗ ↓↓↓, ↗↗ ↓↓↓, ↗↗ ↓↓↓, ↗↗ ↓↓↓, ↗↗ ↓↓↓, ↗↗ ↓↓↓, ↗↗ ↓↓↓, ↗↗ ↓↓↓, ↗↗ ↓↓↓, ↗↗ ↓↓↓, ↗↗ ↓↓↓, ↗↗ ↓↓↓, ↗↗ ↓↓↓, ↗↗ ↓↓↓, ↗↗ ↓↓↓, ↗↗ ↓↓↓, ↗↗ ↓↓↓, ↗↗ ↓↓↓, ↗↗ ↓↓↓, ↗↗
2013-06-17 to 2020-08-09 →, → →, → →, → →, → →, → →, → →, → →, → →, → →, → →, → →, → →, → →, → →, → →, → →, → →, → →, → →, → →, → →, → →, → →, → →, → →, → →, → →, → →, → →, → →, → →, →
2013-06-17 to 2020-08-09 →, → →, → →, → →, → →, → →, → →, → →, → →, → →, → →, → →, → →, → →, → →, → →, → →, → →, → →, → →, → →, → →, → →, → →, → →, → →, → →, → →, → →, → →, → →, → →, →
Readmissions <30d
Discharges
Ward transfers
1 5 10 15 20 25 30 35 40 45 5052
1 5 10 15 20 25 30 35 40 45 5052
1 5 10 15 20 25 30 35 40 45 5052
Admissions
1 5 10 15 20 25 30 35 40 45 5052
0
10
20
30
0
5
10
0
10
20
30
0.0
2.5
5.0
Week of year
Per
wee
k
B. MH inpatient transition events
2013-06-17 to 2020-08-09 →, → →, → →, → →, → →, → →, → →, → →, → →, → →, → →, → →, → →, → →, → →, → →, → →, → →, → →, → →, → →, → →, → →, → →, → →, → →, → →, → →, → →, → →, → →, → →, →
2016-11-28 to 2020-08-09 →, → →, → →, → →, → →, → →, → →, → →, → →, → →, → →, → →, → →, → →, → →, → →, → →, → →, → →, → →, → →, → →, → →, → →, → →, → →, → →, → →, → →, → →, → →, → →, →
Assessments following police detention (s136)
1 5 10 15 20 25 30 35 40 45 5052
New detention episodes (CPFT)
1 5 10 15 20 25 30 35 40 45 5052
0
5
10
15
0
10
20
Week of year
Det
entio
ns p
er w
eek
C. Use of the Mental Health Act
2013-06-17 to 2020-08-09 ↓↓↓, ↗↗↗ ↓↓↓, ↗↗↗ ↓↓↓, ↗↗↗ ↓↓↓, ↗↗↗ ↓↓↓, ↗↗↗ ↓↓↓, ↗↗↗ ↓↓↓, ↗↗↗ ↓↓↓, ↗↗↗ ↓↓↓, ↗↗↗ ↓↓↓, ↗↗↗ ↓↓↓, ↗↗↗ ↓↓↓, ↗↗↗ ↓↓↓, ↗↗↗ ↓↓↓, ↗↗↗ ↓↓↓, ↗↗↗ ↓↓↓, ↗↗↗ ↓↓↓, ↗↗↗ ↓↓↓, ↗↗↗ ↓↓↓, ↗↗↗ ↓↓↓, ↗↗↗ ↓↓↓, ↗↗↗ ↓↓↓, ↗↗↗ ↓↓↓, ↗↗↗ ↓↓↓, ↗↗↗ ↓↓↓, ↗↗↗ ↓↓↓, ↗↗↗ ↓↓↓, ↗↗↗ ↓↓↓, ↗↗↗ ↓↓↓, ↗↗↗ ↓↓↓, ↗↗↗ ↓↓↓, ↗↗↗ ↓↓↓, ↗↗↗
2013-06-17 to 2020-08-09 ↓↓↓, ↗↗↗ ↓↓↓, ↗↗↗ ↓↓↓, ↗↗↗ ↓↓↓, ↗↗↗ ↓↓↓, ↗↗↗ ↓↓↓, ↗↗↗ ↓↓↓, ↗↗↗ ↓↓↓, ↗↗↗ ↓↓↓, ↗↗↗ ↓↓↓, ↗↗↗ ↓↓↓, ↗↗↗ ↓↓↓, ↗↗↗ ↓↓↓, ↗↗↗ ↓↓↓, ↗↗↗ ↓↓↓, ↗↗↗ ↓↓↓, ↗↗↗ ↓↓↓, ↗↗↗ ↓↓↓, ↗↗↗ ↓↓↓, ↗↗↗ ↓↓↓, ↗↗↗ ↓↓↓, ↗↗↗ ↓↓↓, ↗↗↗ ↓↓↓, ↗↗↗ ↓↓↓, ↗↗↗ ↓↓↓, ↗↗↗ ↓↓↓, ↗↗↗ ↓↓↓, ↗↗↗ ↓↓↓, ↗↗↗ ↓↓↓, ↗↗↗ ↓↓↓, ↗↗↗ ↓↓↓, ↗↗↗ ↓↓↓, ↗↗↗
Binary documents
1 5 10 15 20 25 30 35 40 45 5052
Progress notes
1 5 10 15 20 25 30 35 40 45 5052
0
5000
10000
15000
0
2000
4000
6000
Week of year
Ent
ries
per
wee
k
D. MH documentation
2013-06-17 to 2020-08-02 ↑↑↑, ↘↘ ↑↑↑, ↘↘ ↑↑↑, ↘↘ ↑↑↑, ↘↘ ↑↑↑, ↘↘ ↑↑↑, ↘↘ ↑↑↑, ↘↘ ↑↑↑, ↘↘ ↑↑↑, ↘↘ ↑↑↑, ↘↘ ↑↑↑, ↘↘ ↑↑↑, ↘↘ ↑↑↑, ↘↘ ↑↑↑, ↘↘ ↑↑↑, ↘↘ ↑↑↑, ↘↘ ↑↑↑, ↘↘ ↑↑↑, ↘↘ ↑↑↑, ↘↘ ↑↑↑, ↘↘ ↑↑↑, ↘↘ ↑↑↑, ↘↘ ↑↑↑, ↘↘ ↑↑↑, ↘↘ ↑↑↑, ↘↘ ↑↑↑, ↘↘ ↑↑↑, ↘↘ ↑↑↑, ↘↘ ↑↑↑, ↘↘ ↑↑↑, ↘↘ ↑↑↑, ↘↘
2013-06-17 to 2020-08-02 ↓↓↓, ↗↗↗ ↓↓↓, ↗↗↗ ↓↓↓, ↗↗↗ ↓↓↓, ↗↗↗ ↓↓↓, ↗↗↗ ↓↓↓, ↗↗↗ ↓↓↓, ↗↗↗ ↓↓↓, ↗↗↗ ↓↓↓, ↗↗↗ ↓↓↓, ↗↗↗ ↓↓↓, ↗↗↗ ↓↓↓, ↗↗↗ ↓↓↓, ↗↗↗ ↓↓↓, ↗↗↗ ↓↓↓, ↗↗↗ ↓↓↓, ↗↗↗ ↓↓↓, ↗↗↗ ↓↓↓, ↗↗↗ ↓↓↓, ↗↗↗ ↓↓↓, ↗↗↗ ↓↓↓, ↗↗↗ ↓↓↓, ↗↗↗ ↓↓↓, ↗↗↗ ↓↓↓, ↗↗↗ ↓↓↓, ↗↗↗ ↓↓↓, ↗↗↗ ↓↓↓, ↗↗↗ ↓↓↓, ↗↗↗ ↓↓↓, ↗↗↗ ↓↓↓, ↗↗↗ ↓↓↓, ↗↗↗
Other
1 5 10 15 20 25 30 35 40 45 5052
Telephone
1 5 10 15 20 25 30 35 40 45 5052
0
250
500
750
0
1000
2000
3000
Week of year
Con
tact
s p
er w
eek
E. MH appointments/contacts (¶)
2019
2020
ITS 19/20
Mean±95% CI, –2019
Supplementary Figure 3. Measures as for Figure 3, but restricted to patients without a lifetime recorded diagnosis of an SMI.Graphical conventions as for Figure 1.
Page 7 of 7
Page 29 of 29