Multiple early factors anticipate post-acute COVID-19 sequelae
36
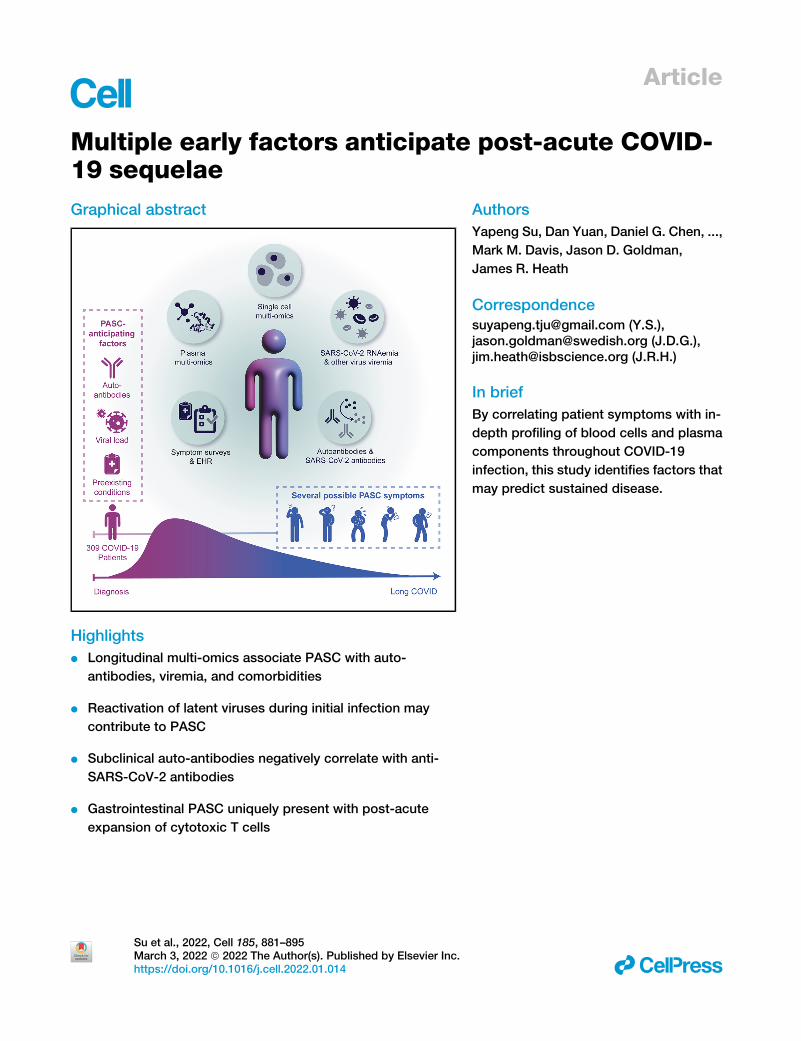
Article Multiple early factors anticipate post-acute COVID- 19 sequelae Graphical abstract Highlights d Longitudinal multi-omics associate PASC with auto- antibodies, viremia, and comorbidities d Reactivation of latent viruses during initial infection may contribute to PASC d Subclinical auto-antibodies negatively correlate with anti- SARS-CoV-2 antibodies d Gastrointestinal PASC uniquely present with post-acute expansion of cytotoxic T cells Authors Yapeng Su, Dan Yuan, Daniel G. Chen, ..., Mark M. Davis, Jason D. Goldman, James R. Heath Correspondence [email protected] (Y.S.), [email protected] (J.D.G.), [email protected] (J.R.H.) In brief By correlating patient symptoms with in- depth profiling of blood cells and plasma components throughout COVID-19 infection, this study identifies factors that may predict sustained disease. Su et al., 2022, Cell 185, 881–895 March 3, 2022 ª 2022 The Author(s). Published by Elsevier Inc. https://doi.org/10.1016/j.cell.2022.01.014 ll
-
Upload
khangminh22 -
Category
Documents
-
view
1 -
download
0
Transcript of Multiple early factors anticipate post-acute COVID-19 sequelae
Article
Multiple early factors anticipate post-acute COVID-19 sequelae
Graphical abstract
Highlights
d Longitudinal multi-omics associate PASC with auto-
antibodies, viremia, and comorbidities
d Reactivation of latent viruses during initial infection may
contribute to PASC
d Subclinical auto-antibodies negatively correlate with anti-
SARS-CoV-2 antibodies
d Gastrointestinal PASC uniquely present with post-acute
expansion of cytotoxic T cells
Su et al., 2022, Cell 185, 881–895March 3, 2022 ª 2022 The Author(s). Published by Elsevier Inc.https://doi.org/10.1016/j.cell.2022.01.014
Authors
Yapeng Su, Dan Yuan, Daniel G. Chen, ...,
Mark M. Davis, Jason D. Goldman,
James R. Heath
[email protected] (Y.S.),[email protected] (J.D.G.),[email protected] (J.R.H.)
In brief
By correlating patient symptoms with in-
depth profiling of blood cells and plasma
components throughout COVID-19
infection, this study identifies factors that
may predict sustained disease.
ll

OPEN ACCESS
llArticle
Multiple early factors anticipatepost-acute COVID-19 sequelaeYapeng Su,1,2,3,28,* Dan Yuan,1,4,28 Daniel G. Chen,1,5,28 Rachel H. Ng,1,4 Kai Wang,1 Jongchan Choi,1 Sarah Li,1
Sunga Hong,1 Rongyu Zhang,1,4 Jingyi Xie,1,6 Sergey A. Kornilov,1 Kelsey Scherler,1 Ana Jimena Pavlovitch-Bedzyk,7
Shen Dong,8 Christopher Lausted,1 Inyoul Lee,1 Shannon Fallen,1 Chengzhen L. Dai,1 Priyanka Baloni,1 Brett Smith,1
Venkata R. Duvvuri,1 Kristin G. Anderson,3,9 Jing Li,7 Fan Yang,10 Caroline J. Duncombe,11 Denise J. McCulloch,12
Clifford Rostomily,1 Pamela Troisch,1 Jing Zhou,13 Sean Mackay,13 Quinn DeGottardi,14 Damon H. May,14
Ruth Taniguchi,14 Rachel M. Gittelman,14 Mark Klinger,14 Thomas M. Snyder,14 Ryan Roper,1 Gladys Wojciechowska,1,15
(Author list continued on next page)
1Institute for Systems Biology, Seattle, WA 98109, USA2Vaccine and Infectious Disease Division, Fred Hutchinson Cancer Research Center, Seattle, WA 98109, USA
3Clinical Research Division, Program in Immunology, Fred Hutchinson Cancer Research Center, Seattle, WA 98109, USA4Department of Bioengineering, University of Washington, Seattle, WA 98105, USA5Department of Microbiology and Department of Informatics, University of Washington, Seattle, WA 98195, USA6Molecular Engineering & Sciences Institute, University of Washington, Seattle, WA 98105, USA7Institute for Immunity, Transplantation and Infection, Stanford University School of Medicine, Stanford, CA 94305, USA8Diabetes Center, University of California, San Francisco, San Francisco, CA 94143, USA9Departments of Immunology and Medicine, University of Washington, Seattle, WA 98109, USA10Department of Pathology, Stanford University, Stanford, CA 94304, USA11Division of Global Health, University of Washington, Seattle, WA 98105, USA12Division of Allergy and Infectious Diseases, Department of Medicine, University of Washington, Seattle, WA 98109, USA13Isoplexis Corporation, Branford, CT 06405, USA14Adaptive Biotechnologies, Seattle, WA 98109, USA15Medical University of Bia1ystok, Bia1ystok 15089, Poland16Swedish Center for Research and Innovation, Swedish Medical Center, Seattle, WA 98109, USA17Providence St. Joseph Health, Renton, WA 98057, USA18Monogram Biosciences, South San Francisco, CA 94080, USA(Affiliations continued on next page)
SUMMARY
Post-acute sequelae of COVID-19 (PASC) represent an emerging global crisis. However, quantifiable riskfactors for PASC and their biological associations are poorly resolved. We executed a deep multi-omic, lon-gitudinal investigation of 309 COVID-19 patients from initial diagnosis to convalescence (2–3 months later),integratedwith clinical data and patient-reported symptoms.We resolved four PASC-anticipating risk factorsat the time of initial COVID-19 diagnosis: type 2 diabetes, SARS-CoV-2 RNAemia, Epstein-Barr virus viremia,and specific auto-antibodies. In patientswith gastrointestinal PASC, SARS-CoV-2-specific andCMV-specificCD8+ T cells exhibited unique dynamics during recovery from COVID-19. Analysis of symptom-associatedimmunological signatures revealed coordinated immunity polarization into four endotypes, exhibiting diver-gent acute severity and PASC.We find that immunological associations between PASC factors diminish overtime, leading to distinct convalescent immune states. Detectability of most PASC factors at COVID-19diagnosis emphasizes the importance of early disease measurements for understanding emergent chronicconditions and suggests PASC treatment strategies.
INTRODUCTION
Around 31%–69% of COVID-19 patients suffer from post-acute
sequelae of COVID-19 (PASC) (Groff et al., 2021), or long COVID,
which is defined (Centers for Disease Control and Prevention,
2021) as a range of new, returning, or ongoing health problems
Cell 185, 881–895, MThis is an open access article und
people can experience four or more weeks following initial
SARS-CoV-2 infection (Huang et al., 2021; Nalbandian et al.,
2021). PASC may include memory loss, gastrointestinal (GI)
distress, fatigue, anosmia, shortness of breath, and other symp-
toms. PASC has been associated with acute disease severity
(Blomberg et al., 2021) and is suspected to be related to
arch 3, 2022 ª 2022 The Author(s). Published by Elsevier Inc. 881er the CC BY license (http://creativecommons.org/licenses/by/4.0/).
Kim Murray,1 Rick Edmark,1 Simon Evans,1 Lesley Jones,1 Yong Zhou,1 Lee Rowen,1 Rachel Liu,1 William Chour,1
Heather A. Algren,16,17 William R. Berrington,16,17 Julie A. Wallick,16,17 Rebecca A. Cochran,16,17 Mary E. Micikas,16,17 theISB-Swedish COVID-19 Biobanking Unit,1 Terri Wrin,18 Christos J. Petropoulos,18 Hunter R. Cole,19 Trevan D. Fischer,19
Wei Wei,1 Dave S.B. Hoon,19 Nathan D. Price,1 Naeha Subramanian,1,20 Joshua A. Hill,2,12 Jennifer Hadlock,1
Andrew T. Magis,1 Antoni Ribas,21 Lewis L. Lanier,22 Scott D. Boyd,10 Jeffrey A. Bluestone,8 Helen Chu,11,12
Leroy Hood,1,17 Raphael Gottardo,2,23,24,25 Philip D. Greenberg,3,9 Mark M. Davis,7,26,27 Jason D. Goldman,2,12,16,17,* andJames R. Heath1,4,29,*19St. John’s Cancer Institute at Saint John’s Health Center, Santa Monica, CA 90404, USA20Department of Global Heath and Department of Immunology, University of Washington, Seattle, WA 98109, USA21Department ofMedicine, University of California, Los Angeles, and Parker Institute for Cancer Immunotherapy, Los Angeles, CA 90095, USA22Department of Microbiology and Immunology, University of California, San Francisco, and Parker Institute for Cancer Immunotherapy, San
Francisco, CA 94143, USA23Division of Public Health Sciences, Fred Hutchinson Cancer Research Center, Seattle, WA 98109, USA24Department of Statistics, University of Washington, Seattle, WA 98195, USA25Biomedical Data Sciences, Lausanne University Hospital, University of Lausanne, Lausanne, 1011, Switzerland26Department of Microbiology and Immunology, Stanford University School of Medicine, Stanford, CA 94305, USA27The Howard Hughes Medical Institute, Stanford University School of Medicine, Stanford, CA 94305, USA28These authors contributed equally29Lead contact
*Correspondence: [email protected] (Y.S.), [email protected] (J.D.G.), [email protected] (J.R.H.)
https://doi.org/10.1016/j.cell.2022.01.014
llOPEN ACCESS Article
autoimmune factors (Galeotti and Bayry, 2020) and unresolved
viral fragments (Ramakrishnan et al., 2021), although experi-
mental validation on large patient cohorts is still pending. The
heterogeneity of PASC and the diverse factors suspected to
be associated with it highlight the need to systematically charac-
terize its biological and immunological underpinnings and the
evolution of those relationships over the time course of SARS-
CoV-2 infection and recovery. To address these knowledge
gaps, we carried out a longitudinal multi-omic study of COVID-
19 patients (Figure 1A) from initial clinical diagnosis to early-
stage recovery from acute disease. We utilized multi-omic
systems biology approaches to identify, quantify, and immuno-
logically characterize biological factors associated with and
anticipating different PASC.
RESULTS
Overview of patient cohorts and PASCOur primary cohort (INCOV) of 209 patients represented the
spectrum of acute infection severities (Tables 1 and S1.1) and
was paired with 457 healthy controls (Table S1.2). These pa-
tients were studied at clinical diagnosis (T1), acute disease
(acute, T2), and 2–3 months post onset of initial symptoms
(convalescent, T3) (Figures 1A and S1A). Blood draws were
analyzed for auto-antibodies (autoAbs) and SARS-CoV-2-spe-
cific antibodies, global plasma proteomic and metabolomic
profiles, and single-cell (sc) multi-omic characterizations of pe-
ripheral blood mononuclear cells (PBMCs). Each blood draw
was paired with nasal-swab and plasma measurements of
SARS-CoV-2 viral load. These datasets were integrated within
the context of electronic health records (EHRs) and self-re-
ported symptoms of the same patients to guide the interpreta-
tion of the molecular signatures of PASC within a clinical
context (Figure 1A). We performed a subset of analyses on
an independent cohort of 100 post-acute COVID-19 patients
(hospitalized or ambulatory adults with respiratory-viral infec-
tions [HAARVI] cohort) to validate the findings from our primary
882 Cell 185, 881–895, March 3, 2022
cohort (Figure 1A; Tables 1 and S1.4). The duration between
symptom onset and the draw of the HAARVI cohort was nearly
identical to that of the T3 draw of INCOV (Figure S1A).
At T3, most participants exhibited antibodies against the
SARS-CoV-2 spike protein receptor-binding domain (RBD) (Fig-
ure 1B). Antibody titers correlated with acute disease severity, as
expected (Roltgen and Boyd, 2021), and also with neutralizing
antibodies in cell-based assays (Figure S1B), suggesting that
most patients exhibited robust antibody responses against
SARS-CoV-2 by T3.
Patient-reported symptoms from interviews were validated
and confirmed to be COVID-19-related through EHR. At T3,
symptoms included fatigue (52% of participants), cough
(25%), and anosmia/dysguesia (18%) (Table S1.3). Some spe-
cific PASC may be reported by only a small fraction of our
cohort. Thus, we also classified symptoms as respiratory viral
(42%), neurological (25%), anosmia/dysgeusia (18%), and GI
(9%) (Table S1.3). Studies on PASC have used heterogeneous
inclusion criteria, symptom definitions, and observation win-
dows but show a pattern where respiratory-viral symptoms
are more common and GI symptoms are rarer (Groff et al.,
2021; Jiang et al., 2021). Both the INCOV cohort and a separate
cohort, MyCOVIDDiary (Providence, 2021), showed similar
trends (Figure 1C), suggesting that the symptoms reported by
the INCOV cohort are reasonably representative. Interestingly,
patients with mild and severe acute COVID-19 severity also ex-
hibited similar trends (Figure 1C), implying that factors beyond
acute-stage disease severity could be associated with PASC.
T3 seronegative patients (8%) were enriched for immuno-
compromised patients and exhibited similar risks of PASC
(Table S1.5).
Examination of PASC in the context of EHR data from the
INCOV participants revealed significant correlations between
type 2 diabetes and certain PASC (Figure 1D). Female patients,
patients with chronic obstructive pulmonary disease (COPD),
and those with higher T1 RBC counts were more likely to present
with many (>3) symptoms (Figure S1C).

Figure 1. Overview of longitudinal multi-omic analysis of COVID-19 patients and their association with PASC
(A) Overview of study design for INCOV and HAARVI cohorts. Assays run on plasma and isolated PBMCs, and patient clinical/symptom data are shown. Bottom-
right boxes of each icon denote if assay was performed for INCOV (blue) and/or HAARVI (pink).
(B) Boxplots showing ELISA (enzyme-linked immunoassay) measured SARS-CoV-2 RBD IgG antibody titers in healthy individuals and T3 COVID-19 patients with
and without respiratory support in their acute stage. **p value < 0.01, ****p value < 0.0001.
(C) Line plot showing frequency of different symptoms in full INCOV cohort (red), subset of INCOV cohort with acute severity WOS% 3 (no respiratory support),
and the MyCOVIDDiary cohort.
(D) Heatmap showing the ln(odds ratio) for the associations between pre-existing conditions and clinical measurements from EHR and PASC, adjusted for age,
sex, and disease severity (WOS> 3). Associations with significance of p > 0.05 weremasked as gray. Only single PASCs that showed statistical significance or the
four PASC categories were shown. SpO2, blood oxygen saturation. *p value < 0.05 and **p value < 0.01.
(E) Boxplots showing plasma protein-based ‘‘negative regulation of the circadian rhythm’’ pathway enrichment (left) and cortisol and cortisone levels (middle and
right) from T3 patients with (orange) and without (blue) a specific symptom or from unexposed healthy controls (green). *p value < 0.05, **p value < 0.01,
***p value < 0.001, and ****p value < 0.0001.
(F) Barplot showing the viral load level in plasma quantified by the percentage of samples tested positive for viral fragments (RNAemia or viremia) multiplied by the
average copy number/mL of these positive samples for SARS-CoV-2 (red), EBV (blue), and CMV (green).
(G) Forest plot showing ln(odds ratios) with 95% confidence intervals for associations of PASC with SARS-CoV-2 RNAemia at T1 (top) or EBV Viremia at T1
(bottom), both adjusted for disease severity (WOS > 3, needed respiratory support), sex, and age. The independent associations of disease severity, sex, and age
with PASC are also displayed on the same plot. *p value < 0.05, **p value < 0.01, and ***p value < 0.001. See also Figure S1 and Tables S1 and S2.
llOPEN ACCESSArticle
Plasma proteomic and metabolic biomarkers atconvalescence associated with PASCWe investigated global plasma proteomic and metabolomic
profiles to identify T3 plasma markers associated with different
PASC (Tables S2.1 and S2.2). For example, patients reporting
respiratory-viral symptoms at T3 exhibited significantly
repressed levels of cortisol and cortisone at T3 (Figure 1E).
Low cortisol, a glucocorticoid, is the hallmark of adrenal insuffi-
ciency (Puar et al., 2016), which is a treatable condition that can
cause symptoms reminiscent of many PASC. Low cortisol has
been reported in acute COVID-19 patients (Choy, 2020), but
not at convalescence. Suppression of endogenous cortisol
Cell 185, 881–895, March 3, 2022 883
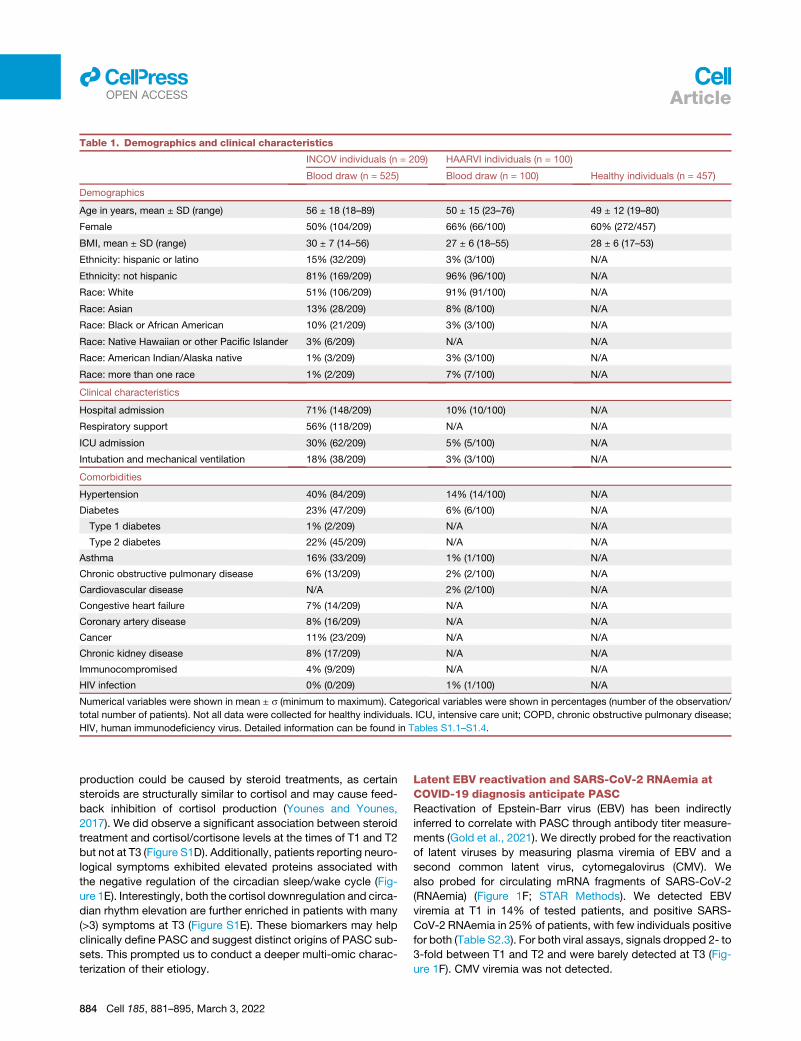
Table 1. Demographics and clinical characteristics
INCOV individuals (n = 209) HAARVI individuals (n = 100)
Healthy individuals (n = 457)Blood draw (n = 525) Blood draw (n = 100)
Demographics
Age in years, mean ± SD (range) 56 ± 18 (18–89) 50 ± 15 (23–76) 49 ± 12 (19–80)
Female 50% (104/209) 66% (66/100) 60% (272/457)
BMI, mean ± SD (range) 30 ± 7 (14–56) 27 ± 6 (18–55) 28 ± 6 (17–53)
Ethnicity: hispanic or latino 15% (32/209) 3% (3/100) N/A
Ethnicity: not hispanic 81% (169/209) 96% (96/100) N/A
Race: White 51% (106/209) 91% (91/100) N/A
Race: Asian 13% (28/209) 8% (8/100) N/A
Race: Black or African American 10% (21/209) 3% (3/100) N/A
Race: Native Hawaiian or other Pacific Islander 3% (6/209) N/A N/A
Race: American Indian/Alaska native 1% (3/209) 3% (3/100) N/A
Race: more than one race 1% (2/209) 7% (7/100) N/A
Clinical characteristics
Hospital admission 71% (148/209) 10% (10/100) N/A
Respiratory support 56% (118/209) N/A N/A
ICU admission 30% (62/209) 5% (5/100) N/A
Intubation and mechanical ventilation 18% (38/209) 3% (3/100) N/A
Comorbidities
Hypertension 40% (84/209) 14% (14/100) N/A
Diabetes 23% (47/209) 6% (6/100) N/A
Type 1 diabetes 1% (2/209) N/A N/A
Type 2 diabetes 22% (45/209) N/A N/A
Asthma 16% (33/209) 1% (1/100) N/A
Chronic obstructive pulmonary disease 6% (13/209) 2% (2/100) N/A
Cardiovascular disease N/A 2% (2/100) N/A
Congestive heart failure 7% (14/209) N/A N/A
Coronary artery disease 8% (16/209) N/A N/A
Cancer 11% (23/209) N/A N/A
Chronic kidney disease 8% (17/209) N/A N/A
Immunocompromised 4% (9/209) N/A N/A
HIV infection 0% (0/209) 1% (1/100) N/A
Numerical variables were shown in mean ± s (minimum to maximum). Categorical variables were shown in percentages (number of the observation/
total number of patients). Not all data were collected for healthy individuals. ICU, intensive care unit; COPD, chronic obstructive pulmonary disease;
HIV, human immunodeficiency virus. Detailed information can be found in Tables S1.1–S1.4.
llOPEN ACCESS Article
production could be caused by steroid treatments, as certain
steroids are structurally similar to cortisol and may cause feed-
back inhibition of cortisol production (Younes and Younes,
2017). We did observe a significant association between steroid
treatment and cortisol/cortisone levels at the times of T1 and T2
but not at T3 (Figure S1D). Additionally, patients reporting neuro-
logical symptoms exhibited elevated proteins associated with
the negative regulation of the circadian sleep/wake cycle (Fig-
ure 1E). Interestingly, both the cortisol downregulation and circa-
dian rhythm elevation are further enriched in patients with many
(>3) symptoms at T3 (Figure S1E). These biomarkers may help
clinically define PASC and suggest distinct origins of PASC sub-
sets. This prompted us to conduct a deeper multi-omic charac-
terization of their etiology.
884 Cell 185, 881–895, March 3, 2022
Latent EBV reactivation and SARS-CoV-2 RNAemia atCOVID-19 diagnosis anticipate PASCReactivation of Epstein-Barr virus (EBV) has been indirectly
inferred to correlate with PASC through antibody titer measure-
ments (Gold et al., 2021). We directly probed for the reactivation
of latent viruses by measuring plasma viremia of EBV and a
second common latent virus, cytomegalovirus (CMV). We
also probed for circulating mRNA fragments of SARS-CoV-2
(RNAemia) (Figure 1F; STAR Methods). We detected EBV
viremia at T1 in 14% of tested patients, and positive SARS-
CoV-2 RNAemia in 25% of patients, with few individuals positive
for both (Table S2.3). For both viral assays, signals dropped 2- to
3-fold between T1 and T2 and were barely detected at T3 (Fig-
ure 1F). CMV viremia was not detected.
llOPEN ACCESSArticle
Weanalyzedwhether EBV viremia (at T1), SARS-CoV-2 RNAe-
mia (at T1), or SARS-CoV-2 viral load from nasal swabs was
significantly associated with PASC at T3 (Figures 1G, S1F, and
S1G). For these analyses, we corrected for contributions from
age, sex, and acute COVID-19 severity. COVID-19 severity
was defined as whether respiratory support was needed, or by
correcting for intensive care unit (ICU) admission (Figure S1F).
Although memory PASC was significantly associated with T1
measures of both EBV viremia and SARS-CoV-2 RNAemia, the
fatigue and sputum PASC were specific to EBV viremia (Fig-
ure 1G). Very few patients exhibited positive EBV viremia at T2
or T3 or positive SARS-CoV-2 nasal-swab viral loads at T3 to
facilitate their analysis. T1 SARS-CoV-2 RNAemia also provided
a biomarker of mortality (Figure S1H) as reported in Gutmann
et al. (2021). SARS-CoV-2 nasal-swab viral load significantly
associated only with anosmia/dysgeusia (Figures S1F and
S1G) and only at T2. RNAemia associations between different
time points and with nasal swabs showed weak correlations
(Figure S1I). In summary, reactivation of latent EBV and SARS-
CoV-2 RNAemia at T1 are factors that anticipate, to varying
degrees, PASC at T3.
Auto-antibodies anticorrelate with anti-SARS-CoV-2antibodies and are associated with distinct patternsof PASCAutoAbs, especially those that neutralize type I interferons (IFNs),
have been reported to be associated with immune dysfunction
and COVID-19 mortality (Bastard et al., 2021; Wang et al.,
2021) and have been speculated to be associated with PASC
(Proal and VanElzakker, 2021). We investigated the possibility
for such a link by measuring a panel of autoAbs at T1 and T3
and comparing them against anti-SARS-CoV-2 Abs of different
isotypes. The autoAb panel included anti-IFN-a2, and five anti-
nuclear autoAbs (ANAs) (Ro/SS-A, La/SS-B, U1-snRNP, Jo-1,
and P1) commonly associated with systemic lupus erythemato-
sus (SLE) (Choi et al., 2020; Pisetsky and Lipsky, 2020). SLE is
an autoimmune disease that shares certain symptoms with
PASC (Raveendran et al., 2021) and has also been reported to
manifest following COVID-19 (Zamani et al., 2021). The SLE-
associated ANAs have already been detected in acutely infected
COVID-19 patients (Chang et al., 2021). The use of the SLE-ANA-
panel was additionally supported by the observed expansion of
atypical memory B cells (AtMs, IGHD�CD27�CD11c+FCRL5+
[defined in Figure S2A]) in both COVID-19 and SLE patients
(Oliviero et al., 2020; Su et al., 2020). In SLE, AtMs are generated
during chronic inflammation, enriched with autoreactivities, and
correlated with disease activities (Jenks et al., 2018).
We had several major findings. First, we observed that pa-
tients with autoAbs at T3 (44%) already exhibited mature
(class-switched) autoAbs as early as at diagnosis (56%) (Fig-
ure 2A), indicating that the autoAbs may predate COVID-19, as
reported elsewhere (Bastard et al., 2021). Analysis of EHR data
confirmed that only 6% of autoAb-positive patients had docu-
mented autoimmune conditions before COVID-19, suggesting
that the autoAbs may reflect subclinical conditions.
Second, we found interesting cross-correlations between au-
toAbs and anti-SARS-CoV-2 Abs at T3 (Figure 2B). Anti-SARS-
CoV-2 IgG titers positively correlated with each other, as did
the autoAbs. However, all significant correlations between
SARS-CoV-2 IgGs (class-switched) and autoAbs (anti-IFN-a2
and anti-nuclear) are anticorrelations. These findings were vali-
dated through the independent HAARVI cohort (Figure 2B, pink
rectangles). Notably, the HAARVI participants experienced mild
COVID-19 relative to the INCOV participants (10% versus 71%
hospitalization rates, Tables 1, S1.1, and S1.4) and therefore
had lower levels of anti-SARS-CoV-2 antibodies (Figure S2C),
potentially explaining why some specific correlations do not track
across the two cohorts, although the overall trends do hold.
A third major finding was that anti-SARS-CoV-2 Abs and spe-
cific autoAbs were associated with different PASC. For example,
patients with neurological PASC exhibited slightly higher levels
of anti-SARS-CoV-2 nucleocapsid protein IgG, whereas GI-
related PASC and sputum production were associated with
elevated levels of multiple autoAbs at T3 (Figure S2D; Table
S2.4) and even T1 (Figures 2C and S2E; Table S2.4). IFN-a2
autoAbs uniquely associated with respiratory-viral PASC, even
after correcting for age, sex, and disease severity (Figures 2C,
S2B, and S2F; Table S2.4). These observations suggest that
T1 autoAb levels may be anticipating biomarkers of certain
PASC (Figures 2C and S2F).
The negative correlations between anti-SARS-CoV-2 Abs and
autoAbs suggest two lines of inquiry. First, anti-IFN-a2 may
neutralize IFN-a2 signaling, dysregulating IFN-dependent B cell
responses (Braun et al., 2002), and limiting virus-specific Ab pro-
duction. IFN-a2 inhibition may also upregulate pro-inflammatory
cytokines (Guarda et al., 2011), promoting ANA generation
against self-antigens from tissue damage (Smatti et al., 2019).
Consistently, we found in T2 (acute stage) plasma that multiple
inflammation biomarkers, including IFN-g, C-reactive protein,
and IL-6, were positively associated with autoAbs at T3 (Fig-
ure 2D; Table S2.4). Similarly, in monocytes and CD8+ T cells
at T2, these autoAb-positive patients exhibited upregulated
expression of pro-inflammatory cytokine genes (Figure 2D). The
consistency across data modalities suggests a notable connec-
tion between autoAbs, T2 hyperinflammation and T3 PASC.
A second line of inquiry involved the AtM B cells, which have
been shown to be precursors of autoAb-producing plasma cells
in SLE (Jenks et al., 2018). AtMs originate from extrafollicular
pathway activation of both naive and memory B cells (Sokal
et al., 2021) and exhibit lower levels of somatic hypermutation
(SHM) than other memory B cells, consistent with our data (Fig-
ure S2G). The upregulation of AtMs in COVID-19 was most pro-
nounced in high-autoAb patients (Figure 2E, left). Furthermore, in
these patients, upregulated expression within AtMs of the B cell
receptor (BCR) signaling molecule CD79B and the IFN-inducible
gene MX1 (Figure 2E, middle and right; Table S2.5) implied
enhanced BCR and IFN signaling (Michalska et al., 2018), remi-
niscent of the hyperactive state of B cells seen in SLE (Domeier
et al., 2018), and associated with the over-production of lupus
autoAbs (Jenks et al., 2018). This analysis suggests a potential
SLE-shared mechanism for the generation of autoAbs.
Unique T cell clonal dynamics reveal distinct GI PASCassociationsT cell clonal dynamics, as inferred from T cell receptor (TCR)
gene sequences and sc transcriptomics, can provide insights
Cell 185, 881–895, March 3, 2022 885
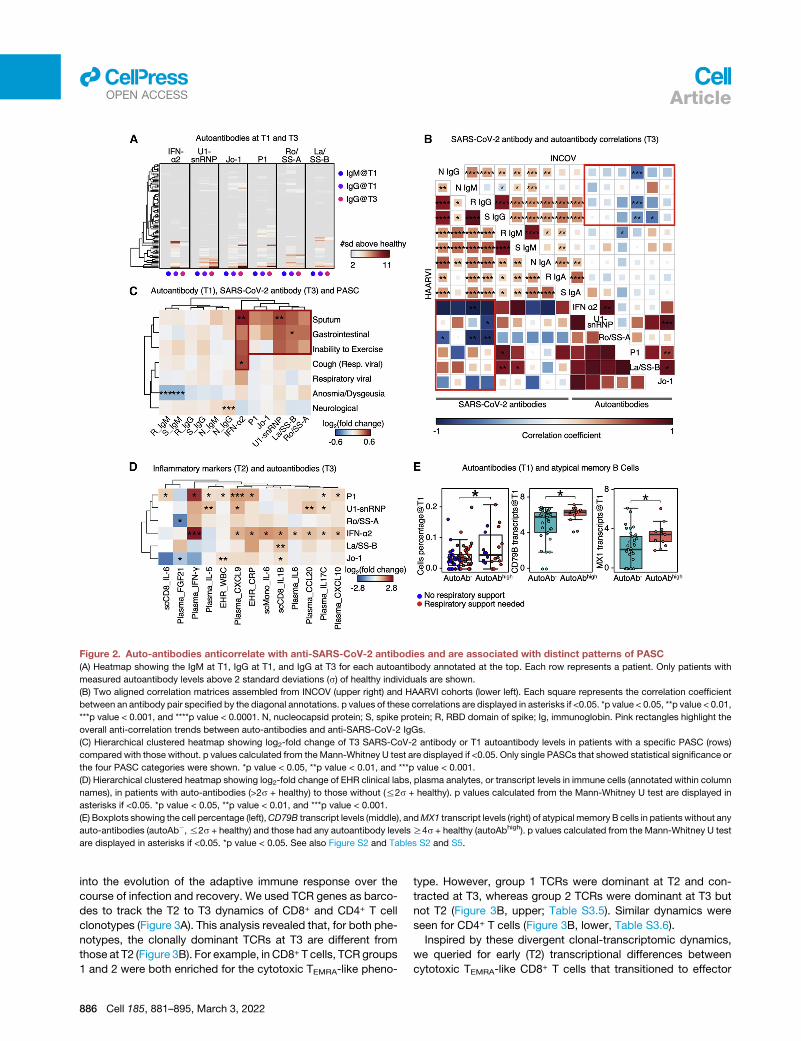
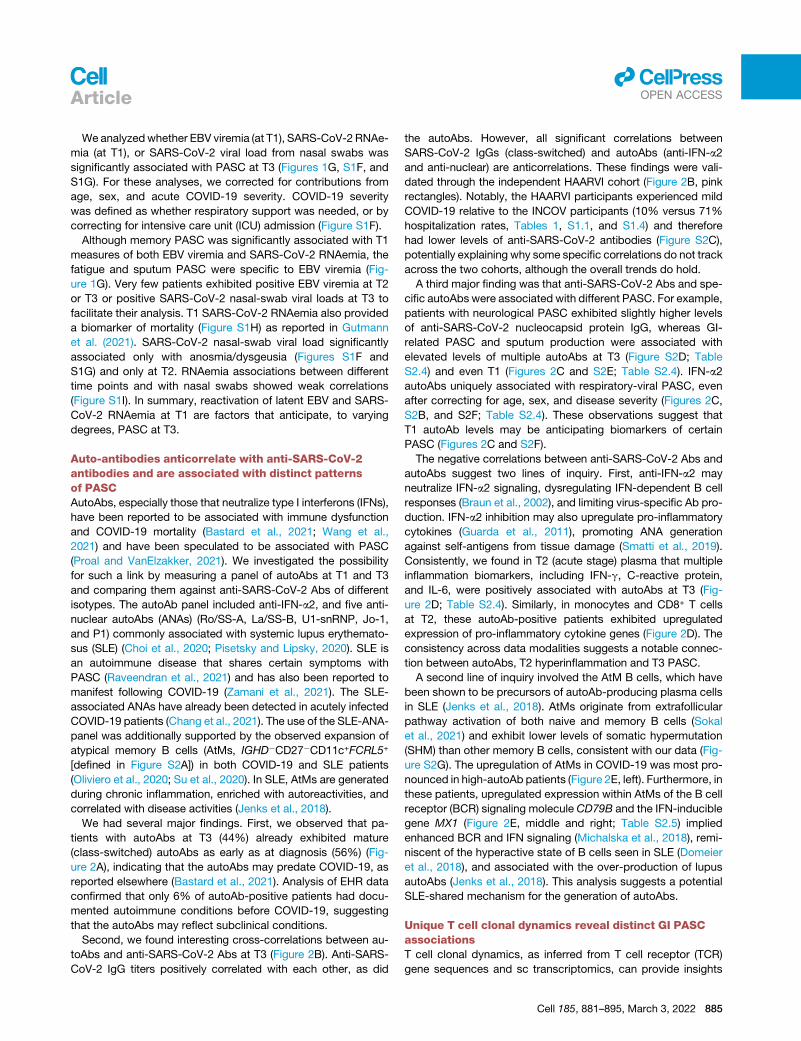
Figure 2. Auto-antibodies anticorrelate with anti-SARS-CoV-2 antibodies and are associated with distinct patterns of PASC
(A) Heatmap showing the IgM at T1, IgG at T1, and IgG at T3 for each autoantibody annotated at the top. Each row represents a patient. Only patients with
measured autoantibody levels above 2 standard deviations (s) of healthy individuals are shown.
(B) Two aligned correlation matrices assembled from INCOV (upper right) and HAARVI cohorts (lower left). Each square represents the correlation coefficient
between an antibody pair specified by the diagonal annotations. p values of these correlations are displayed in asterisks if <0.05. *p value < 0.05, **p value < 0.01,
***p value < 0.001, and ****p value < 0.0001. N, nucleocapsid protein; S, spike protein; R, RBD domain of spike; Ig, immunoglobin. Pink rectangles highlight the
overall anti-correlation trends between auto-antibodies and anti-SARS-CoV-2 IgGs.
(C) Hierarchical clustered heatmap showing log2-fold change of T3 SARS-CoV-2 antibody or T1 autoantibody levels in patients with a specific PASC (rows)
compared with those without. p values calculated from the Mann-Whitney U test are displayed if <0.05. Only single PASCs that showed statistical significance or
the four PASC categories were shown. *p value < 0.05, **p value < 0.01, and ***p value < 0.001.
(D) Hierarchical clustered heatmap showing log2-fold change of EHR clinical labs, plasma analytes, or transcript levels in immune cells (annotated within column
names), in patients with auto-antibodies (>2s + healthy) to those without (%2s + healthy). p values calculated from the Mann-Whitney U test are displayed in
asterisks if <0.05. *p value < 0.05, **p value < 0.01, and ***p value < 0.001.
(E) Boxplots showing the cell percentage (left),CD79B transcript levels (middle), andMX1 transcript levels (right) of atypicalmemory B cells in patients without any
auto-antibodies (autoAb�,%2s + healthy) and those had any autoantibody levelsR4s + healthy (autoAbhigh). p values calculated from the Mann-Whitney U test
are displayed in asterisks if <0.05. *p value < 0.05. See also Figure S2 and Tables S2 and S5.
llOPEN ACCESS Article
into the evolution of the adaptive immune response over the
course of infection and recovery. We used TCR genes as barco-
des to track the T2 to T3 dynamics of CD8+ and CD4+ T cell
clonotypes (Figure 3A). This analysis revealed that, for both phe-
notypes, the clonally dominant TCRs at T3 are different from
those at T2 (Figure 3B). For example, in CD8+ T cells, TCR groups
1 and 2 were both enriched for the cytotoxic TEMRA-like pheno-
886 Cell 185, 881–895, March 3, 2022
type. However, group 1 TCRs were dominant at T2 and con-
tracted at T3, whereas group 2 TCRs were dominant at T3 but
not T2 (Figure 3B, upper; Table S3.5). Similar dynamics were
seen for CD4+ T cells (Figure 3B, lower, Table S3.6).
Inspired by these divergent clonal-transcriptomic dynamics,
we queried for early (T2) transcriptional differences between
cytotoxic TEMRA-like CD8+ T cells that transitioned to effector

Figure 3. Lineage tracing of T cell clonotypes along the transcriptomic landscape resolved PASC association with global clonal and tran-
scriptomic dynamics
(A) Illustration of using TCRs as T cell lineage barcodes to trace how different clonotypes evolve along transcriptomic landscape from acute disease (T2) to
convalescence.
(B) Hierarchical clustering of CD8+ (upper panel) and CD4+ T cell (lower panel) TCRs (columns) based on TCR sharing patterns across select phenotypes and time
points (see color key at bottom).
(C) Illustration of mining differential transcriptomic features for CD8+ and CD4+ T cells that are of a cytotoxic TEMRA phenotype at T2 but expand into a memory
phenotype at T3, or contract at T3.
(D) Top differentially expressed genes at T2 between cytotoxic TEMRA cells that either expand into a memory phenotype, or contract by T3. CD8+ (top panel) and
CD4+ T cells (bottom panel).
(E) Frequencies of newly emerging cytotoxic clonotypes (TCR group 2 for CD8+ T cells in (B) top heatmap, TCR group 4 for CD4+ T cells in (B) bottom heatmap) for
patients at T3 with (orange) and without (blue) GI symptoms and for unexposed healthy controls (green). p values calculated from the Mann-Whitney U test are
displayed in asterisks if <0.05. *p value < 0.05, **p value < 0.01, ***p value < 0.001, and ****p value < 0.0001. See also Table S3.
llOPEN ACCESSArticle
memory (EM) T cells at T3 (group 4) versus those that clonally
contracted (group 1) (Figure 3C). The ‘‘memory-precursor’’ clo-
notypes showed biased upregulation of genes that inhibit inflam-
mation or prevent T cell over-activation (e.g., DUSP2 [Lang and
Raffi, 2019] and JUNB [Koizumi et al., 2018]) (Figure 3D, upper;
Table S3.1). By contrast, the effector clonotypes destined for
contraction had upregulated genes associated with effector
functions (e.g., GZMB and PRF1) and inflammatory responses
(Figure 3D, upper; Table S3.2). Similar signatures were also
observed for CD4+ T cells (Figure 3D, lower; Tables S3.3 and
S3.4). The implication is that for cytotoxic T cell phenotypes, dif-
ferences in early transcriptional programs may lead to divergent
cell fates. These observed behaviors of T cell clonal contraction
and memory-formation likely reflect normal recovery from
COVID-19, similar to those in other viral infection settings (Kaech
et al., 2002).
However, counterintuitively, we note that the pool of cytotoxic
T cells is also replenished with newly expanded clonotypes even
at T3 (Figure 3B; CD8 group 2 and CD4 group 4), perhaps sug-
gesting an unusual recovery for some patients. Furthermore,
this expanded cytotoxic pool was significantly enriched in
patients reporting GI PASC (Figure 3E, upper; Table S3.7). Simi-
larly, newly emerging cytotoxic CD4+ T cells (group 4) at T3 ap-
peared enriched in GI PASC-positive patients (Figure 3E, lower;
Table S3.8). These analyses suggest that GI PASC is associated
with unique T cell clonal and transcriptome dynamics, prompting
us to explore the antigen specificity of these T cell populations.
Different activation dynamics of SARS-CoV-2-specificT cell are associated with distinct PASCTo investigate the transcriptional dynamics of SARS-CoV-2-spe-
cific T cells,we first performeda functional assay for themultiplex
identification of TCR antigen specificities (MIRA) (Snyder et al.,
2020) on COVID-19 patient PBMCs to identify over 150,000
TCRs specific to nearly 600 epitopes spanning the entire
SARS-CoV-2 viral proteome (Figure 4A; Table S4.1). These func-
tional TCRswere integratedwith sc-CITE-seq (single-cell Cellular
Indexing of Transcriptomes and Epitopes by Sequencing) data
(Figure 4A) to reveal the transcriptome of SARS-CoV-2-specific
CD8+T cells (Figure 4B, upper; TableS4.3). For patients reporting
Cell 185, 881–895, March 3, 2022 887
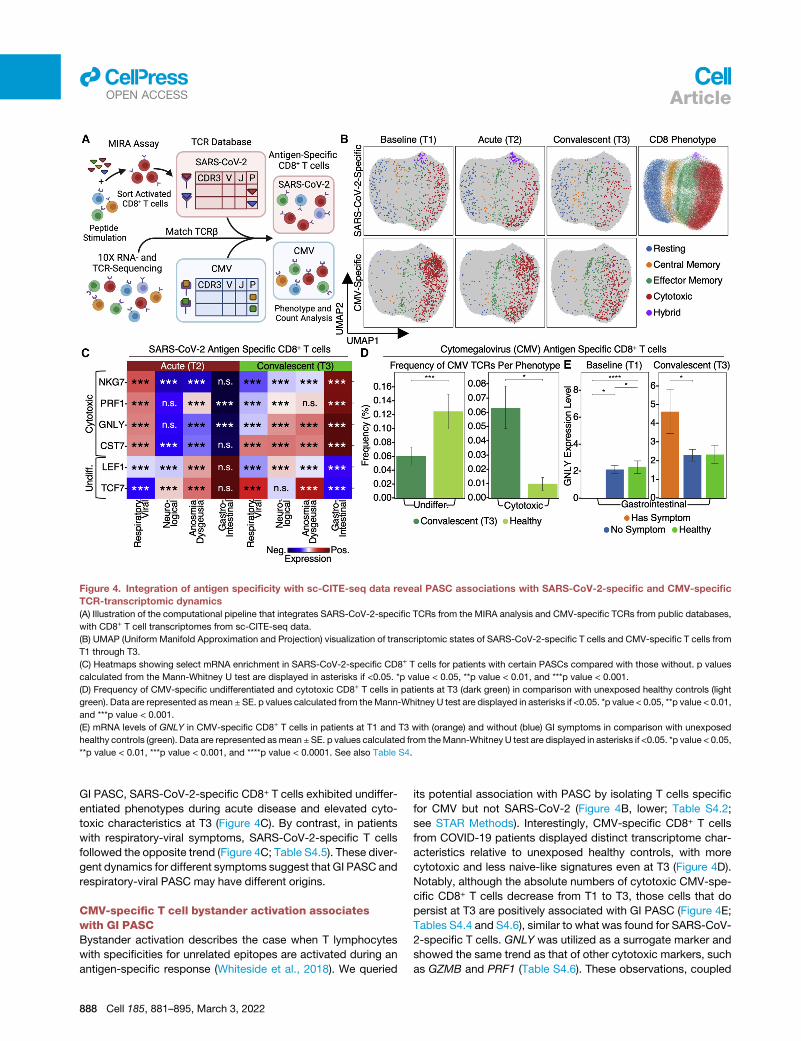
Figure 4. Integration of antigen specificity with sc-CITE-seq data reveal PASC associations with SARS-CoV-2-specific and CMV-specific
TCR-transcriptomic dynamics
(A) Illustration of the computational pipeline that integrates SARS-CoV-2-specific TCRs from the MIRA analysis and CMV-specific TCRs from public databases,
with CD8+ T cell transcriptomes from sc-CITE-seq data.
(B) UMAP (Uniform Manifold Approximation and Projection) visualization of transcriptomic states of SARS-CoV-2-specific T cells and CMV-specific T cells from
T1 through T3.
(C) Heatmaps showing select mRNA enrichment in SARS-CoV-2-specific CD8+ T cells for patients with certain PASCs compared with those without. p values
calculated from the Mann-Whitney U test are displayed in asterisks if <0.05. *p value < 0.05, **p value < 0.01, and ***p value < 0.001.
(D) Frequency of CMV-specific undifferentiated and cytotoxic CD8+ T cells in patients at T3 (dark green) in comparison with unexposed healthy controls (light
green). Data are represented asmean ± SE. p values calculated from theMann-Whitney U test are displayed in asterisks if <0.05. *p value < 0.05, **p value < 0.01,
and ***p value < 0.001.
(E) mRNA levels of GNLY in CMV-specific CD8+ T cells in patients at T1 and T3 with (orange) and without (blue) GI symptoms in comparison with unexposed
healthy controls (green). Data are represented asmean ±SE. p values calculated from theMann-Whitney U test are displayed in asterisks if <0.05. *p value < 0.05,
**p value < 0.01, ***p value < 0.001, and ****p value < 0.0001. See also Table S4.
llOPEN ACCESS Article
GI PASC, SARS-CoV-2-specific CD8+ T cells exhibited undiffer-
entiated phenotypes during acute disease and elevated cyto-
toxic characteristics at T3 (Figure 4C). By contrast, in patients
with respiratory-viral symptoms, SARS-CoV-2-specific T cells
followed the opposite trend (Figure 4C; Table S4.5). These diver-
gent dynamics for different symptoms suggest that GI PASC and
respiratory-viral PASC may have different origins.
CMV-specific T cell bystander activation associateswith GI PASCBystander activation describes the case when T lymphocytes
with specificities for unrelated epitopes are activated during an
antigen-specific response (Whiteside et al., 2018). We queried
888 Cell 185, 881–895, March 3, 2022
its potential association with PASC by isolating T cells specific
for CMV but not SARS-CoV-2 (Figure 4B, lower; Table S4.2;
see STAR Methods). Interestingly, CMV-specific CD8+ T cells
from COVID-19 patients displayed distinct transcriptome char-
acteristics relative to unexposed healthy controls, with more
cytotoxic and less naive-like signatures even at T3 (Figure 4D).
Notably, although the absolute numbers of cytotoxic CMV-spe-
cific CD8+ T cells decrease from T1 to T3, those cells that do
persist at T3 are positively associated with GI PASC (Figure 4E;
Tables S4.4 and S4.6), similar to what was found for SARS-CoV-
2-specific T cells. GNLY was utilized as a surrogate marker and
showed the same trend as that of other cytotoxic markers, such
as GZMB and PRF1 (Table S4.6). These observations, coupled
llOPEN ACCESSArticle
with the absence of detectable CMV viremia, suggest an associ-
ation of bystander activation of CMV-specific CD8+ T cells with
GI PASC.
Unresolved dysregulated immunephenotypes associatewith different PASCImmune dysregulation has been suspected to be associated with
PASC (Proal and VanElzakker, 2021), although experimental evi-
dence remainselusive.Weprobed for global immunological signa-
tures of PASC by first analyzing the sc transcriptomes of over
1,000,000PBMCs collected fromall samples in the INCOVcohort.
Cells were classified into major immune cell types and subtypes
basedonglobal transcriptomicprofiles (seeSTARMethods). Inter-
estingly, many immune cell phenotypes reported to be associated
with severe acute COVID-19 remain enriched at T3, to varying de-
grees,and toassociatedwithPASC.These includecytotoxicCD4+
T cells, proliferative-exhausted (hybrid) T cells and myeloid-
derived suppressor cells (MDSCs) (Lee et al., 2022; Mathew
et al., 2020; Schulte-Schreppinget al., 2020; Suet al., 2020; Zheng
et al., 2021) (Tables S5.1–S5.5). For example, MDSCs, which can
indicate immune paralysis and serve as a predictor for mortality in
acute COVID-19 (Su et al., 2020), remain upregulated at T3 in pa-
tientswith sputumPASC (FigureS2H). Similarly, amemory-likeNK
cell subtype at T3 positively associates with cough PASC (Fig-
ure S2H). Interestingly, activated Treg at T2 significantly positively
anticipates many different PASCs (Figure S2H). Analysis of how
sc transcriptomes change over time also revealed that the innate
immunity arm may exhibit persistent activation at T3 via NF-kB
activation mediated by TRAF6 (Table S5.6).
Systematic association of PASC and immunetranscriptomes reveals four immune endotypesTo systematically investigate the association between PASC and
these altered immune states at T3, we studied the sc-RNA-seq
data for transcripts enriched for a given PASC. The mean
expression of these genemodules comprises symptom-immune
signatures, which are visualized in a two-dimensional map to
help visualize these signatures (Figures 5A and 5B; STAR
Methods). When individual patients, based upon T3 data, were
projected onto the map, four patient groupings, or endotypes,
were resolved (Figures 5B and S3; Tables S6.1 and S6.8). This
same sc-RNA-seq analysis performed on the independent
HAARVI cohort revealed a similar immune polarization pattern
(Figures S4 and S5D), suggesting that such polarization may
be broadly shared across post-acute COVID-19 patient
populations.
Pathway analysis of the four patient groups revealed coordi-
nated expression patterns across innate and adaptive immune
cell types (Tables S6.2–S6.6), with polarization reminiscent of
the canonical type 1 and type 2 immune responses (Annunziato
et al., 2015). Specifically, the type 1 group (orange) was enriched
with Th1-like signatures in CD4+ T cells, M1-like pro-inflammatory
signatures in monocytes, cytotoxic effector signatures in CD8+
T cells and NK cells, and memory signatures in B cells (Figures
5B, 5C, and S4; Tables S6.2–S6.6). In contrast, the type 2 group
(pink) was enriched for Th2-like CD4+ T cell signatures, M2-like
(anti-inflammatory) monocyte signatures, and a plasma B cell
signature (Figures 5B, 5C, and S4; Tables S6.2–S6.6). The inter-
mediate group (green) exhibited a transitional immune status be-
tween types 1 and type 2. The naive group (blue) exhibited naive-
like T andB cell signatures, and resting NKcell signatures (Figures
5B, 5C, and S4; Tables S6.2–S6.6). Notably, there were no signif-
icant differences in the duration between the onset of initial
COVID-19 symptoms and the blood draws across the four groups
(Figure S5A). Although all non-naive-like patient groups exhibited
elevated levels of CD8+ and CD4+ T cell polyfunctionality at T3, all
patient groups exhibited high monocyte polyfunctionality relative
to healthy controls (Figure S6; Table S6.9). This suggests varying
degrees of persistent, primed immune activation across all patient
groups at convalescence. Most reported PASC (except anosmia/
dysgeusia)were less for the naive group (FigureS7B), whereas the
type 2 group experienced a higher hospitalization rate (Figure 5D),
potentially reflecting how type 2 immunity is not tailored for viral
clearance.
Immune-polarizations independently associate withviral and autoantibody PASC factorsProjections of individual patient T1 to T3 trajectories onto the
map revealed that individual participants tend toward their T3 re-
gions even at the time of COVID-19 diagnosis (Figures 5B and
S5F). This suggests that patients may be predisposed toward
their post-acute status early in the infection course. This, in
turn, suggests a possible relationship between these patient
groupings and certain PASC factors that are present at T1. In
Figure 5E, we plot the group distributions of patients expressing
high levels of IFN-a2 autoAbs, or the percent of patients who
tested positive for EBV viremia or RNAemia. While patients
that express anti-IFN-a2 levels two standard deviations above
baseline do not associate with a specific group, patients that ex-
press high anti-IFN-a2 levels (R4 standard deviations) associate
with the intermediate immune group (Figure 5E). Patients with
EBV viremia are also associated most strongly with this group,
whereas RNAemia is non-specific (Figure 5E). The plots suggest
that the intermediate immune state, which is characterized by
both pro-inflammatory and type 2 immune signatures, is worth
deeper exploration. The plots also support that these PASC fac-
tors may only minimally impact COVID-19 recovery in the naive
immune group, and that polarization away from the naive
endotype may increase the risk for most PASC (except
anosmia/dysgeusia) (Figure S7B).
The indication (Figure 5B) that a patient endotype at T3 is
anticipated by their T1 status prompted us to investigate the
T1-measured plasma proteins that could serve as biomarkers
to anticipate patient groupings at T3. To this end, we resolved
a five-protein panel (Figure S7A; Table S6.7). One of the mem-
bers of our panel, CTSL, has been reported as playing a key
role in facilitating SARS-CoV-2 infection in humans (Zhao et al.,
2021), and when measured at T1, CTSL was also predictive of
patient mortality for the INCOV cohort (Figure S7C, upper).
This was further validated in an independent cohort from St.
John’s Cancer Institute (SJCI) (Figure S7C, lower).
Cross-dataset correlations suggest certainindependence of the PASC-associated factorsWe probed for relationships between the different PASC-
anticipating factors and the multi-omic datasets collected at
Cell 185, 881–895, March 3, 2022 889
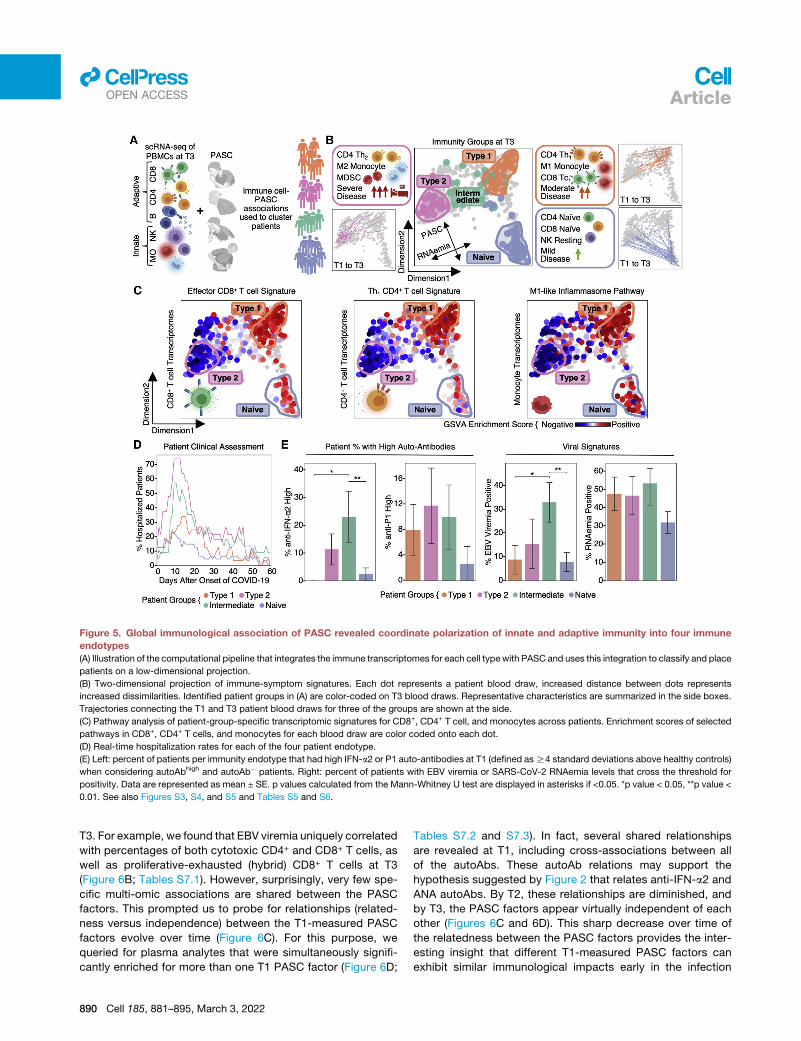
Figure 5. Global immunological association of PASC revealed coordinate polarization of innate and adaptive immunity into four immune
endotypes
(A) Illustration of the computational pipeline that integrates the immune transcriptomes for each cell typewith PASC and uses this integration to classify and place
patients on a low-dimensional projection.
(B) Two-dimensional projection of immune-symptom signatures. Each dot represents a patient blood draw, increased distance between dots represents
increased dissimilarities. Identified patient groups in (A) are color-coded on T3 blood draws. Representative characteristics are summarized in the side boxes.
Trajectories connecting the T1 and T3 patient blood draws for three of the groups are shown at the side.
(C) Pathway analysis of patient-group-specific transcriptomic signatures for CD8+, CD4+ T cell, and monocytes across patients. Enrichment scores of selected
pathways in CD8+, CD4+ T cells, and monocytes for each blood draw are color coded onto each dot.
(D) Real-time hospitalization rates for each of the four patient endotype.
(E) Left: percent of patients per immunity endotype that had high IFN-a2 or P1 auto-antibodies at T1 (defined asR4 standard deviations above healthy controls)
when considering autoAbhigh and autoAb� patients. Right: percent of patients with EBV viremia or SARS-CoV-2 RNAemia levels that cross the threshold for
positivity. Data are represented as mean ± SE. p values calculated from the Mann-Whitney U test are displayed in asterisks if <0.05. *p value < 0.05, **p value <
0.01. See also Figures S3, S4, and S5 and Tables S5 and S6.
llOPEN ACCESS Article
T3. For example, we found that EBV viremia uniquely correlated
with percentages of both cytotoxic CD4+ and CD8+ T cells, as
well as proliferative-exhausted (hybrid) CD8+ T cells at T3
(Figure 6B; Tables S7.1). However, surprisingly, very few spe-
cific multi-omic associations are shared between the PASC
factors. This prompted us to probe for relationships (related-
ness versus independence) between the T1-measured PASC
factors evolve over time (Figure 6C). For this purpose, we
queried for plasma analytes that were simultaneously signifi-
cantly enriched for more than one T1 PASC factor (Figure 6D;
890 Cell 185, 881–895, March 3, 2022
Tables S7.2 and S7.3). In fact, several shared relationships
are revealed at T1, including cross-associations between all
of the autoAbs. These autoAb relations may support the
hypothesis suggested by Figure 2 that relates anti-IFN-a2 and
ANA autoAbs. By T2, these relationships are diminished, and
by T3, the PASC factors appear virtually independent of each
other (Figures 6C and 6D). This sharp decrease over time of
the relatedness between the PASC factors provides the inter-
esting insight that different T1-measured PASC factors can
exhibit similar immunological impacts early in the infection
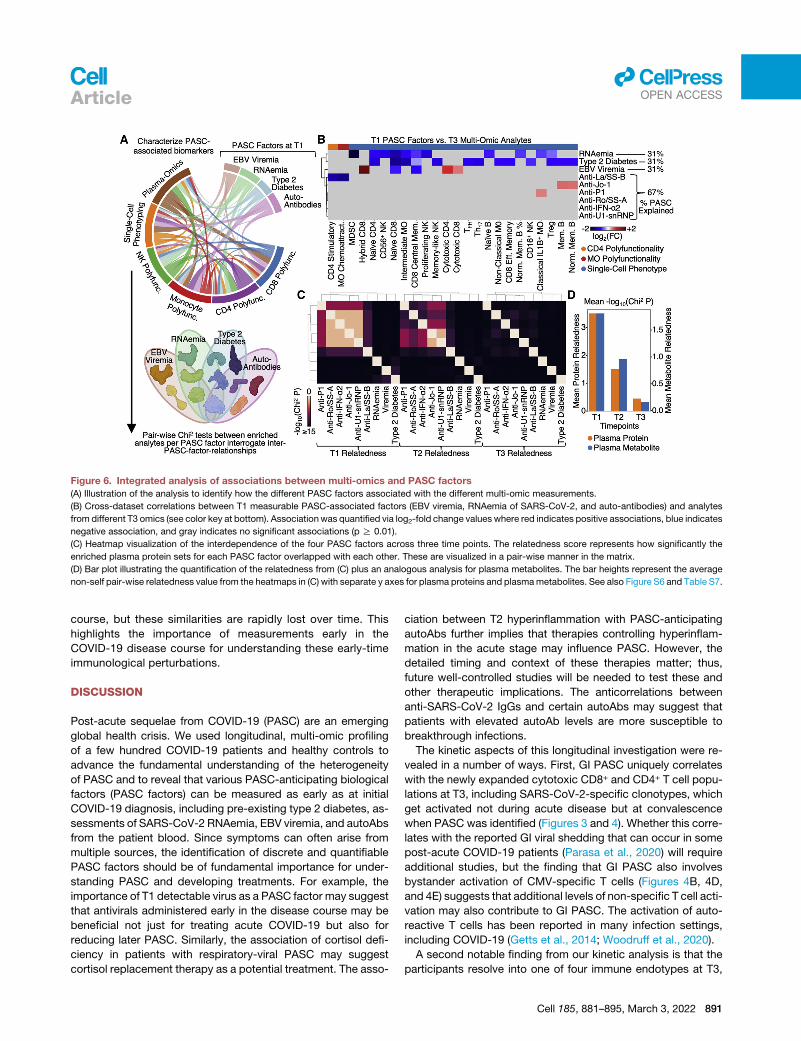
Figure 6. Integrated analysis of associations between multi-omics and PASC factors
(A) Illustration of the analysis to identify how the different PASC factors associated with the different multi-omic measurements.
(B) Cross-dataset correlations between T1 measurable PASC-associated factors (EBV viremia, RNAemia of SARS-CoV-2, and auto-antibodies) and analytes
from different T3 omics (see color key at bottom). Associationwas quantified via log2-fold change values where red indicates positive associations, blue indicates
negative association, and gray indicates no significant associations (p R 0.01).
(C) Heatmap visualization of the interdependence of the four PASC factors across three time points. The relatedness score represents how significantly the
enriched plasma protein sets for each PASC factor overlapped with each other. These are visualized in a pair-wise manner in the matrix.
(D) Bar plot illustrating the quantification of the relatedness from (C) plus an analogous analysis for plasma metabolites. The bar heights represent the average
non-self pair-wise relatedness value from the heatmaps in (C) with separate y axes for plasma proteins and plasmametabolites. See also Figure S6 and Table S7.
llOPEN ACCESSArticle
course, but these similarities are rapidly lost over time. This
highlights the importance of measurements early in the
COVID-19 disease course for understanding these early-time
immunological perturbations.
DISCUSSION
Post-acute sequelae from COVID-19 (PASC) are an emerging
global health crisis. We used longitudinal, multi-omic profiling
of a few hundred COVID-19 patients and healthy controls to
advance the fundamental understanding of the heterogeneity
of PASC and to reveal that various PASC-anticipating biological
factors (PASC factors) can be measured as early as at initial
COVID-19 diagnosis, including pre-existing type 2 diabetes, as-
sessments of SARS-CoV-2 RNAemia, EBV viremia, and autoAbs
from the patient blood. Since symptoms can often arise from
multiple sources, the identification of discrete and quantifiable
PASC factors should be of fundamental importance for under-
standing PASC and developing treatments. For example, the
importance of T1 detectable virus as a PASC factor may suggest
that antivirals administered early in the disease course may be
beneficial not just for treating acute COVID-19 but also for
reducing later PASC. Similarly, the association of cortisol defi-
ciency in patients with respiratory-viral PASC may suggest
cortisol replacement therapy as a potential treatment. The asso-
ciation between T2 hyperinflammation with PASC-anticipating
autoAbs further implies that therapies controlling hyperinflam-
mation in the acute stage may influence PASC. However, the
detailed timing and context of these therapies matter; thus,
future well-controlled studies will be needed to test these and
other therapeutic implications. The anticorrelations between
anti-SARS-CoV-2 IgGs and certain autoAbs may suggest that
patients with elevated autoAb levels are more susceptible to
breakthrough infections.
The kinetic aspects of this longitudinal investigation were re-
vealed in a number of ways. First, GI PASC uniquely correlates
with the newly expanded cytotoxic CD8+ and CD4+ T cell popu-
lations at T3, including SARS-CoV-2-specific clonotypes, which
get activated not during acute disease but at convalescence
when PASC was identified (Figures 3 and 4). Whether this corre-
lates with the reported GI viral shedding that can occur in some
post-acute COVID-19 patients (Parasa et al., 2020) will require
additional studies, but the finding that GI PASC also involves
bystander activation of CMV-specific T cells (Figures 4B, 4D,
and 4E) suggests that additional levels of non-specific T cell acti-
vation may also contribute to GI PASC. The activation of auto-
reactive T cells has been reported in many infection settings,
including COVID-19 (Getts et al., 2014; Woodruff et al., 2020).
A second notable finding from our kinetic analysis is that the
participants resolve into one of four immune endotypes at T3,
Cell 185, 881–895, March 3, 2022 891
llOPEN ACCESS Article
and a participant can be matched with this T3 endotype using
measurements at T1. Although this is consistent with the obser-
vation that most of the PASC factors can be measured at T1, as-
sociations between the PASC factors and the endotypes were
only partially resolved. The type 1 and type 2 endotype polariza-
tion represent how the immune system evolved to tailor its
effector functions to distinct challenges, with type 2 not opti-
mized for viral clearances as reflected by its highest hospitaliza-
tion rate. Of note is the intermediate ‘‘hybrid’’ group that updates
the canonical type 1/type 2 dichotomy of immune polarization.
This intermediate endotype warrants further study, as it is asso-
ciatedwith patients that exhibit both reactivation of latent EBV as
well as patients that express high levels of anti-IFN-a2 autoAbs.
Furthermore, the fact that the naive (less-activated/polarized) T3
group exhibited less enrichment for many PASC provides sup-
port for the hypothesis that unresolved/persistent immune acti-
vation and PASC are associated (Proal and VanElzakker, 2021).
A third kinetic finding that may inform future PASC studies in-
volves the time-evolving inter-relationships (‘‘relatedness’’) of
the T1-measurable PASC factors. In convalescence (T3), these
PASC factors appear largely independent of each other (Fig-
ures 6B and 6C, right), which, in the absence of additional
data, might suggest that these PASC factors constitute rela-
tively independent treatment targets. However, at diagnosis
(T1), these PASC factors exhibit a number of inter-relationships
(Figure 6C, left), perhaps suggesting a more limited number of
treatments. The implication is that the functional relationships
between the various T1 PASC factors will be easier to extract
through analysis of biospecimens collected early in the infec-
tion course. Future studies of other ‘‘long’’ medical conditions,
such as post-treatment Lyme disease (Rebman and Aucott,
2020), ‘‘chemobrain’’ (Nguyen and Ehrlich, 2020), and post-
ICU syndrome (Brown et al., 2019), may benefit from our meth-
odologies and findings. The rapid loss over time in measurable
inter-relationships between the PASC factors is also reminis-
cent of many complex dynamical systems that evolve in fash-
ions that are highly sensitive to initial conditions (Olsen and
Degn, 1985). For this study, these initial conditions are unique
to the individual participants, accentuating the need for acute
characterizations of patients to resolve their sources of post-
acute sequelae and treatments.
Our analyses provided a framework to understand the hetero-
geneity of ‘‘long COVID’’ and a rich resource for investigating the
biological factors that contribute to PASC, which can potentially
be utilized to monitor and guide interventional trials to treat and
prevent post-acute COVID-19 symptoms.
Limitations of the studyOur study focused on PASC at 2–3 months post the onset of
COVID-19 and thus cannot discern which patients will develop
long-term chronic PASC (Taquet et al., 2021). Furthermore, the
establishment of causal links between PASC factors and PASC
will likely require model studies in which perturbations can be
explored. Although we find that several PASC factors are detect-
able at initial diagnosis, the development of a predictor of PASC
will require data from multiple large, independent studies, and it
may also require titers for large panels of autoAbs. An additional
limitation is study size. Even in a study comprising a few hundred
892 Cell 185, 881–895, March 3, 2022
patients, patients that exhibit both a given PASC factor and a
specific symptom may constitute only a small subset, making
it difficult to establish specific, robust classifications or predic-
tors. Only 2–3 months post infection blood draw samples were
available in our HAARVI cohort, which prevented us from utilizing
them for T cell dynamic analyses. Furthermore, our study setup
was not suitable to identify genomic factors for PASC, although
we are contributing genomic data to support international con-
sortia focused on such studies. Another limitation is associated
with the genetic evolution of SARS-CoV-2, which may alter the
landscape of PASC experienced by patients but is not ad-
dressed here. Finally, our blood processing protocols did not
preserve granulocytes; therefore, associations between these
immune cells and PASC are unresolved.
STAR+METHODS
Detailed methods are provided in the online version of this paper
and include the following:
d KEY RESOURCES TABLE
d RESOURCE AVAILABILITY
B Lead contact
B Materials availability
B Data and code availability
d EXPERIMENTAL MODEL AND SUBJECT DETAILS
B COVID-19 and healthy individuals
d METHOD DETAILS
B Symptom survey
B Plasma and PBMC isolation
B Single-cell multi-omics assay
B SARS-CoV-2 viral load measurements
B CMV and EBV viremia measurements
B Plasma proteomics and metabolomics
B Single-cell multiplex secretome assay
B SARS-CoV-2 ELISAs
B Autoantibody ELISAs
B Neutralization assay
B MIRA assay
B Bulk TCR sequencing
d QUANTIFICATION AND STATISTICAL ANALYSIS
B Single-cell sequencing data processing
B Single-cell RNA-seq cell type identification
B Single-cell phenotype identification
B Single-cell TCR-seq data processing
B Single-cell TCR phenotype associations
B PASC and pre-existing conditions
B Plasma-omic enrichment in PASC
B PASC and viral load measurements
B Antibody and PASC correlation analysis
B Autoantibody and B cell transcriptomics
B TCR clonal trajectory analysis
B Combining CD8+ transcriptomes and TCR targets
B BLASTP analysis
B PASC and CD8+ T cell transcriptomes
B PASC and phenotype percentages over time
B Survival analysis of RNAemia
B Symptom immune-transcriptome association
llOPEN ACCESSArticle
B PASC factor relatedness and independence
B PASC factor ranking analysis
B Machine learning for patient group prediction
B Machine learning for survival prediction
B Single-cell BCR & RNA-seq integration
SUPPLEMENTAL INFORMATION
Supplemental information can be found online at https://doi.org/10.1016/j.cell.
2022.01.014.
ACKNOWLEDGMENTS
We appreciate the insightful discussion from Dr. David Baltimore, Dr. David
Koelle, Dr. Alan Aderem, and the ISB COVID-19 Study Group. We are grateful
to all participants in this study and to the medical teams at Swedish Medical
Center for their support. We thank the Northwest Genomic Center, the ISB-
Swedish COVID-19 Biobanking Unit, and the SJHC/SJCI COVID-19 clinical
and research support teams.We thank AmazonWeb Services for their support
through cloud computing credits provided by the AWS Diagnostic Develop-
ment Initiative (DDI). We acknowledge funding support from the Wilke Family
Foundation (J.R.H.), the Murdock Trust (J.R.H.), Gilead Sciences (J.R.H.),
the Swedish Medical Center Foundation (J.D.G.), the Parker Institute for Can-
cer Immunotherapy (J.R.H., M.M.D., P.D.G., L.L.L., A.R., and J.A.B.), Merck,
and the Biomedical Advanced Research and Development Authority
(HHSO10201600031C to J.R.H.). K.W. was funded by DOD (W911NF-17-2-
0086) and NIH (R01 DA040395 and UG3TR002884). R.G. was funded by the
NIH Human Immunology Project Consortium (U19AI128914) and the Vaccine
and Immunology Statistical Center (Bill and Melinda Gates Foundation
OPP1032317). Further funding by NIH (AI068129 to L.L.L. and R21 AI138258
to N.S.). D.S.B.H. was funded by SJCI/SJHC COVID-19 Research grant.
Y.S. was supported by the Mahan Fellowship at the Herbold Computational
Biology Program of Fred Hutch Cancer Research Center and the Translational
Data Science Integrated Research Center New Collaboration Award at Fred
Hutch Cancer Research Center. G.W. is supported by the European Union’s
Horizon 2020 research and innovation program under the Marie Sk1odow-
ska-Curie grant agreement no. 754432.
AUTHOR CONTRIBUTIONS
Conceptualization, Y.S., J.D.G., and J.R.H.; resources, D.S.B.H., H.R.C., H.C.,
J.D.G., and J.R.H.; methodology, Y.S., D.Y., D.G.C., and J.R.H.; investigation,
Y.S., D.Y., D.G.C., R.H.N., K.W., J.C., S.L., S.H., R.Z., J.X., S.A.K., K.S., A.J.P.-
B., S.D., C.L., I.L., S.F., C.L.D., P.B., B.S., V.R.D., K.G.A., J.L., F.Y., C.J.D.,
D.J.M., C.R., P.T., J.Z., S.M., Q.D., D.H.M., R.T., R.M.G., M.K., T.M.S., R.R.,
G.W., K.M., R.E., S.E., L.J., Y.Z., L.R., R.L., W.C., H.A.A., W.R.B., J.A.W.,
R.A.C., M.E.M., T.W., C.J.P., H.R.C., T.D.F., W.W., D.S.B.H., N.D.P., N.S.,
J.A.H., J.H., A.T.M., A.R., L.L.L., S.D.B., J.A.B., H.C., L.H., R.G., P.D.G.,
M.M.D., J.D.G., and J.R.H.; formal analysis, Y.S., D.G.C., D.Y., A.J.P.-B.,
S.A.K., R.G., and J.R.H.; writing – original draft, Y.S., D.Y., D.G.C., and
J.R.H.; writing – review & editing, Y.S., D.Y., D.G.C., R.H.N., K.W., J.C., S.L.,
S.H., R.Z., J.X., S.A.K., K.S., A.J.P.-B., S.D., C.L., I.L., S.F., C.L.D., P.B.,
B.S., V.R.D., K.G.A., J.L., F.Y., C.J.D., D.J.M., C.R., P.T., J.Z., S.M., Q.D.,
D.H.M., R.T., R.M.G., M.K., T.M.S., R.R., G.W., K.M., R.E., S.E., L.J., Y.Z.,
L.R., R.L., W.C., H.A.A., W.R.B., J.A.W., R.A.C., M.E.M., T.W., C.J.P.,
H.R.C., T.D.F., W.W., D.S.B.H., N.D.P., N.S., J.A.H., J.H., A.T.M., A.R.,
L.L.L., S.D.B., J.A.B., H.C., L.H., R.G., P.D.G., M.M.D., J.D.G., and J.R.H.
DECLARATION OF INTERESTS
J.R.H. and A.R. are founders and board members of PACT Pharma. J.R.H. is a
board member of Isoplexis, and A.R. is the scientific advisor to Isoplexis.
M.M.D. is a member of the Scientific Advisory Board of PACT Pharma.
J.A.B. is a member of the Scientific Advisory Boards of Arcus, Solid, and
VIR. J.A.B. is a member of the Board of Directors of Gilead and Provention.
J.A.B. is the CEO of Sonoma Biotherapeutics. L.L.L. is on the scientific advi-
sory boards of Alector, Atreca, Dragonfly, DrenBio, Nkarta, Obsidian Thera-
peutics, and SBI Biotech. R.G. has received consulting income from Juno
Therapeutics, Takeda, Infotech Soft, Celgene, and Merck, has received
research support from Janssen Pharmaceuticals and Juno Therapeutics,
and declares ownership in CellSpace Biosciences. P.D.G. is on the Scientific
Advisory Board of Celsius, Earli, Elpiscience, Immunoscape, Rapt, and Nex-
tech, was a scientific founder of Juno Therapeutics, and receives research
support from Lonza. J.D.G. declared contracted research with Gilead, Lilly,
and Regeneron. J.A.H. received consulting fees or honoraria from Gilead Sci-
ences, Amplyx, Allovir, Allogene therapeutics, CRISPR therapeutics, CSL
Behring, OptumHealth, Octapharma, and Takeda and research funding from
Takeda, Allovir, Karius, and Gilead Sciences. Q.D., D.H.M., R.T., R.M.G.,
M.K., and T.M.S. have employment and equity ownership with Adaptive Bio-
technologies. The remaining authors declare no competing interests.
INCLUSION AND DIVERSITY
Weworked to ensure gender balance in the recruitment of human subjects.We
worked to ensure ethnic or other types of diversity in the recruitment of human
subjects. One or more of the authors of this paper self-identifies as a member
of the LGBTQ+ community. One or more of the authors of this paper self-iden-
tifies as living with a disability.
Received: September 29, 2021
Revised: December 14, 2021
Accepted: January 19, 2022
Published: January 25, 2022
REFERENCES
Altschul, S.F., Madden, T.L., Schaffer, A.A., Zhang, J., Zhang, Z., Miller, W.,
and Lipman, D.J. (1997). Gapped BLAST and PSI-BLAST: a new generation
of protein database search programs. Nucleic Acids Res. 25, 3389–3402.
Annunziato, F., Romagnani, C., and Romagnani, S. (2015). The 3 major types
of innate and adaptive cell-mediated effector immunity. J. Allergy Clin. Immu-
nol. 135, 626–635.
Bagaev, D.V., Vroomans, R.M.A., Samir, J., Stervbo, U., Rius, C., Dolton, G.,
Greenshields-Watson, A., Attaf, M., Egorov, E.S., Zvyagin, I.V., et al. (2020).
VDJdb in 2019: database extension, new analysis infrastructure and a T-cell
receptor motif compendium. Nucleic Acids Res. 48, D1057–D1062.
Bastard, P., Gervais, A., Le Voyer, T., Rosain, J., Philippot, Q., Manry, J., Mi-
chailidis, E., Hoffmann, H.H., Eto, S., Garcia-Prat, M., et al. (2021). Autoanti-
bodies neutralizing type I IFNs are present in �4% of uninfected individuals
over 70 years old and account for �20% of COVID-19 deaths. Sci. Immunol.
6, eabl4340.
Blomberg, B., Mohn, K.G.-I., Brokstad, K.A., Zhou, F., Linchausen, D.W., Han-
sen, B.A., Lartey, S., Onyango, T.B., Kuwelker, K., Sævik, M., et al. (2021).
Long COVID in a prospective cohort of home-isolated patients. Nat. Med.
27, 1607–1613.
Braun, D., Caramalho, I., and Demengeot, J. (2002). IFN-alpha/beta enhances
BCR-dependent B cell responses. Int. Immunol. 14, 411–419.
Brown, S.M., Bose, S., Banner-Goodspeed, V., Beesley, S.J., Dinglas, V.D.,
Hopkins, R.O., Jackson, J.C., Mir-Kasimov, M., Needham, D.M., Sevin,
C.M., et al. (2019). Approaches to addressing post-intensive care syndrome
among intensive care unit survivors. A narrative review. Ann. Am. Thorac.
Soc. 16, 947–956.
Carlson, C.S., Emerson, R.O., Sherwood, A.M., Desmarais, C., Chung, M.W.,
Parsons, J.M., Steen, M.S., LaMadrid-Herrmannsfeldt, M.A., Williamson,
D.W., Livingston, R.J., et al. (2013). Using synthetic templates to design an un-
biased multiplex PCR assay. Nat. Commun. 4, 2680.
Centers for Disease Control and Prevention (2020). CDC’s diagnostic test for
COVID-19 only and supplies. https://www.cdc.gov/coronavirus/2019-ncov/
lab/virus-requests.html.
Centers for Disease Control and Prevention (2021). Post-COVID conditions.
https://www.cdc.gov/coronavirus/2019-ncov/long-term-effects/index.html.
Cell 185, 881–895, March 3, 2022 893
llOPEN ACCESS Article
Chang, S.E., Feng, A., Meng, W., Apostolidis, S.A., Mack, E., Artandi, M.,
Barman, L., Bennett, K., Chakraborty, S., Chang, I., et al. (2021). New-onset
IgG autoantibodies in hospitalized patients with COVID-19. Nat. Commun.
12, 5417.
Chapuis, A.G., Egan, D.N., Bar, M., Schmitt, T.M., McAfee, M.S., Paulson,
K.G., Voillet, V., Gottardo, R., Ragnarsson, G.B., Bleakley, M., et al. (2019).
T cell receptor gene therapy targeting WT1 prevents acute myeloid leukemia
relapse post-transplant. Nat. Med. 25, 1064–1072.
Chen, T., andGuestrin, C. (2016). XGBoost: a scalable tree boosting system. In
Proceedings of the 22nd ACM SIGKDD International Conference on Knowl-
edge Discovery and Data Mining (Association for Computing Machinery),
pp. 785–794.
Choi, M.Y., FitzPatrick, R.D., Buhler, K., Mahler, M., and Fritzler, M.J. (2020). A
review andmeta-analysis of anti-ribosomal P autoantibodies in systemic lupus
erythematosus. Autoimmun. Rev. 19, 102463.
Choy, K.W. (2020). Cortisol concentrations and mortality from COVID-19. Lan-
cet Diabetes Endocrinol. 8, 808.
Chu, H.Y., Englund, J.A., Starita, L.M., Famulare, M., Brandstetter, E., Nicker-
son, D.A., Rieder, M.J., Adler, A., Lacombe, K., Kim, A.E., et al. (2020). Early
detection of COVID-19 through a citywide pandemic surveillance platform.
N. Engl. J. Med. 383, 185–187.
Commo, F., and Bot, B.M. (2016). nplr: N-Parameter logistic regression, R
package version 0.1-7, URL https://cran.r-project.org/package=nplr.
Davidson-Pilon, C. (2021). lifelines: survival analysis in Python. J. Open Source
Softw. 4, 1317.
Domeier, P.P., Chodisetti, S.B., Schell, S.L., Kawasawa, Y.I., Fasnacht, M.J.,
Soni, C., and Rahman, Z.S.M. (2018). B-cell-intrinsic Type 1 interferon
signaling is crucial for loss of tolerance and the development of autoreactive
B cells. Cell Rep. 24, 406–418.
Emerson, R.O., DeWitt, W.S., Vignali, M., Gravley, J., Hu, J.K., Osborne, E.J.,
Desmarais, C., Klinger, M., Carlson, C.S., Hansen, J.A., et al. (2017). Immuno-
sequencing identifies signatures of cytomegalovirus exposure history and
HLA-mediated effects on the T cell repertoire. Nat. Genet. 49, 659–665.
Galeotti, C., and Bayry, J. (2020). Autoimmune and inflammatory diseases
following COVID-19. Nat. Rev. Rheumatol. 16, 413–414.
Getts, D.R., Getts, M.T., King, N.J.C., and Miller, S.D. (2014). Chapter 19. In-
fectious triggers of T cell autoimmunity. In The Autoimmune Diseases, Fifth
Edition, N.R. Rose and I.R. Mackay, eds. (Elsevier Inc.), pp. 263–274.
Gold, J.E., Okyay, R.A., Licht, W.E., and Hurley, D.J. (2021). Investigation of
long COVID prevalence and its relationship to Epstein-Barr virus reactivation.
Pathogens 10, 763.
Goldman, J.D., Wang, K., Roltgen, K., Nielsen, S.C.A., Roach, J.C., Naccache,
S.N., Yang, F., Wirz, O.F., Yost, K.E., Lee, J.Y., et al. (2020). Reinfection with
SARS-CoV-2 and failure of humoral immunity: a case report. medRxiv. medR-
xiv:. https://doi.org/10.1101/2020.09.22.20192443
Groff, D., Sun, A., Ssentongo, A.E., Ba, D.M., Parsons, N., Poudel, G.R., Le-
koubou, A., Oh, J.S., Ericson, J.E., Ssentongo, P., et al. (2021). Short-term
and long-term rates of postacute sequelae of SARS-CoV-2 infection: a sys-
tematic review. JAMA Netw. Open 4, e2128568.
Guarda, G., Braun, M., Staehli, F., Tardivel, A., Mattmann, C., Forster, I., Farlik,
M., Decker, T., Du Pasquier, R.A., Romero, P., et al. (2011). Type I interferon
inhibits interleukin-1 production and inflammasome activation. Immunity 34,
213–223.
Gutmann, C., Takov, K., Burnap, S.A., Singh, B., Ali, H., Theofilatos, K., Reed,
E., Hasman, M., Nabeebaccus, A., Fish, M., et al. (2021). SARS-CoV-2
RNAemia and proteomic trajectories inform prognostication in COVID-19 pa-
tients admitted to intensive care. Nat. Commun. 12, 3406.
Huang, C., Huang, L.,Wang, Y., Li, X., Ren, L., Gu, X., Kang, L., Guo, L., Liu, M.,
Zhou, X., et al. (2021). 6-month consequences of COVID-19 in patients dis-
charged from hospital: a cohort study. Lancet 397, 220–232.
ImmunoMind Team (2019). Immunarch: an R package for painless bioinfor-
matics analysis of T-cell and B-cell immune repertoires. Zenodo. https://doi.
org/10.5281/zenodo.3367200.
894 Cell 185, 881–895, March 3, 2022
Jenks, S.A., Cashman, K.S., Zumaquero, E., Marigorta, U.M., Patel, A.V.,
Wang, X., Tomar, D., Woodruff, M.C., Simon, Z., Bugrovsky, R., et al. (2018).
Distinct effector B cells induced by unregulated toll-like receptor 7 contribute
to pathogenic responses in systemic lupus erythematosus. Immunity 49,
725–739.e6.
Jiang, D.H., Roy, D.J., Gu, B.J., Hassett, L.C., and McCoy, R.G. (2021). Post-
acute sequelae of severe acute respiratory syndrome coronavirus 2 infection:
a state-of-the-art review. JACC Basic Transl. Sci. 6, 796–811.
Kaech, S.M., Wherry, E.J., and Ahmed, R. (2002). Effector and memory T-cell
differentiation: implications for vaccine development. Nat. Rev. Immunol. 2,
251–262.
Klinger, M., Pepin, F., Wilkins, J., Asbury, T., Wittkop, T., Zheng, J., Moorhead,
M., and Faham, M. (2015). Multiplex identification of antigen-specific T cell re-
ceptors using a combination of immune assays and immune receptor
sequencing. PLoS One 10, e0141561.
Koizumi, S.I., Sasaki, D., Hsieh, T.H., Taira, N., Arakaki, N., Yamasaki, S.,
Wang, K., Sarkar, S., Shirahata, H., Miyagi, M., et al. (2018). JunB regulates ho-
meostasis and suppressive functions of effector regulatory T cells. Nat. Com-
mun. 9, 5344.
Kuhn, M. (2008). Building predictive models in R using the caret package.
J. Stat. Softw. 28, 1–26.
Lang, R., and Raffi, F.A.M. (2019). Dual-specificity phosphatases in immunity
and infection: an update. Int. J. Mol. Sci. 20, 2710.
Lee, J.W., Su, Y., Baloni, P., Chen, D., Pavlovitch-Bedzyk, A.J., Yuan, D., Duv-
vuri, V.R., Ng, R.H., Choi, J., Xie, J., et al. (2022). Integrated analysis of plasma
and single immune cells uncovers metabolic changes in individuals with
COVID-19. Nat. Biotechnol. 40, 110–120.
Logue, J.K., Franko, N.M., McCulloch, D.J., McDonald, D., Magedson, A.,
Wolf, C.R., and Chu, H.Y. (2021). Sequelae in adults at 6 months after
COVID-19 infection. JAMA Netw. Open 4, e210830.
Maechler, M., Rousseeuw, P., Croux, C., Todorov, V., Ruckstuhl, A., Salibian-
Barrera, M., Verbeke, T., Koller, M., Conceicao, E.L.T., and Anna di Palma, M.
(2021). robustbase: Basic Robust Statistics. R package version 0, pp. 93–99.
http://robustbase.r-forge.r-project.org/.
Manor, O., Zubair, N., Conomos, M.P., Xu, X., Rohwer, J.E., Krafft, C.E., Love-
joy, J.C., and Magis, A.T. (2018). A multi-omic association study of trimethyl-
amine N-oxide. Cell Rep. 24, 935–946.
Mathew, D., Giles, J.R., Baxter, A.E., Oldridge, D.A., Greenplate, A.R., Wu,
J.E., Alanio, C., Kuri-Cervantes, L., Pampena, M.B., D’Andrea, K., et al.
(2020). Deep immune profiling of COVID-19 patients reveals distinct immuno-
types with therapeutic implications. Science 369, eabc8511.
McInnes, L., Healy, J., andMelville, J. (2020). UMAP: uniformmanifold approx-
imation and projection for dimension reduction. arXiv, arXiv:1802.03426v3.
Michalska, A., Blaszczyk, K., Wesoly, J., and Bluyssen, H.A.R. (2018). A pos-
itive feedback amplifier circuit that regulates interferon (IFN)-stimulated gene
expression and controls type I and Type II IFN responses. Front. Immunol.
9, 1135.
Nalbandian, A., Sehgal, K., Gupta, A., Madhavan, M.V., McGroder, C., Ste-
vens, J.S., Cook, J.R., Nordvig, A.S., Shalev, D., Sehrawat, T.S., et al.
(2021). Post-acute COVID-19 syndrome. Nat. Med. 27, 601–615.
Nguyen, L.D., and Ehrlich, B.E. (2020). Cellular mechanisms and treatments for
chemobrain: insight from aging and neurodegenerative diseases. EMBO Mol.
Med. 12, e12075.
Nolan, S., Vignali, M., Klinger, M., Dines, J.N., Kaplan, I.M., Svejnoha, E., Craft,
T., Boland, K., Pesesky, M., Gittelman, R.M., et al. (2020). A large-scale data-
base of T-cell receptor beta (TCRb) sequences and binding associations from
natural and synthetic exposure to SARS-CoV-2. Res. Sq. https://doi.org/10.
21203/rs.3.rs-51964/v1.
Oliviero, B., Varchetta, S., Mele, D., Mantovani, S., Cerino, A., Perotti, C.G., Lu-
dovisi, S., andMondelli, M.U. (2020). Expansion of atypical memory B cells is a
prominent feature of COVID-19. Cell. Mol. Immunol. 17, 1101–1103.
Olsen, L.F., andDegn, H. (1985). Chaos in biological systems. Q. Rev. Biophys.
18, 165–225.
llOPEN ACCESSArticle
Parasa, S., Desai, M., Thoguluva Chandrasekar, V., Patel, H.K., Kennedy, K.F.,
Roesch, T., Spadaccini, M., Colombo, M., Gabbiadini, R., Artifon, E.L.A., et al.
(2020). Prevalence of gastrointestinal symptoms and fecal viral shedding in pa-
tients with coronavirus Disease 2019: a systematic review and meta-analysis.
JAMA Netw. Open 3, e2011335.
Pedregosa, F., Varoquaux, G., Gramfort, A., Michel, V., Thirion, B., Grisel, O.,
Blondel, M., Prettenhofer, P., Weiss, R., Dubourg, V., et al. (2011). Scikit-learn:
machine learning in Python. J. Mach. Learn. Res. 12, 2825–2830.
Pisetsky, D.S. (2011). Antinuclear antibodies in healthy people: the tip of auto-
immunity’s iceberg? Arthritis Res. Ther. 13, 109.
Pisetsky, D.S., and Lipsky, P.E. (2020). New insights into the role of antinuclear
antibodies in systemic lupus erythematosus. Nat. Rev. Rheumatol. 16,
565–579.
Pola�nski, K., Young, M.D., Miao, Z., Meyer, K.B., Teichmann, S.A., and Park,
J.E. (2020). BBKNN: fast batch alignment of single cell transcriptomes. Bioin-
formatics 36, 964–965.
Proal, A.D., and VanElzakker, M.B. (2021). Long COVID or post-acute
sequelae of COVID-19 (PASC): an overview of biological factors that may
contribute to persistent symptoms. Front. Microbiol. 12, 698169.
Providence (2021). MyCovidDiary. http://mycoviddiary.org/.
Puar, T.H.K., Stikkelbroeck, N.M.M.L., Smans, L.C.C.J., Zelissen, P.M.J., and
Hermus, A.R.M.M. (2016). Adrenal crisis: still a deadly event in the 21st Cen-
tury. Am. J. Med. 129, 339.e1–339.e9.
Ramakrishnan, R.K., Kashour, T., Hamid, Q., Halwani, R., and Tleyjeh, I.M.
(2021). Unraveling the mystery surrounding post-acute sequelae of COVID-
19. Front. Immunol. 12, 686029.
Raveendran, A.V., Jayadevan, R., and Sashidharan, S. (2021). Long COVID: an
overview. Diabetes Metab. Syndr. 15, 869–875.
Rebman, A.W., and Aucott, J.N. (2020). Post-treatment Lyme disease as a
model for persistent symptoms in Lyme disease. Front. Med. (Lausanne) 7, 57.
Ren, X., Wen, W., Fan, X., Hou, W., Su, B., Cai, P., Li, J., Liu, Y., Tang, F.,
Zhang, F., et al. (2021). COVID-19 immune features revealed by a large-scale
single cell transcriptome atlas. Cell 184, 1895–1913.e19.
Robins, H.S., Campregher, P.V., Srivastava, S.K., Wacher, A., Turtle, C.J.,
Kahsai, O., Riddell, S.R., Warren, E.H., and Carlson, C.S. (2009). Comprehen-
sive assessment of T-cell receptor beta-chain diversity in alphabeta T cells.
Blood 114, 4099–4107.
Roltgen, K., and Boyd, S.D. (2021). Antibody and B cell responses to SARS-
CoV-2 infection and vaccination. Cell Host Microbe 29, 1063–1075.
Schulte-Schrepping, J., Reusch, N., Paclik, D., Baßler, K., Schlickeiser, S.,
Zhang, B., Kramer, B., Krammer, T., Brumhard, S., Bonaguro, L., et al.
(2020). Severe COVID-19 is marked by a dysregulated myeloid cell compart-
ment. Cell 182, 1419–1440.e23.
Slight-Webb, S., Lu, R., Ritterhouse, L.L., Munroe, M.E., Maecker, H.T., Fath-
man, C.G., Utz, P.J., Merrill, J.T., Guthridge, J.M., and James, J.A. (2016).
Autoantibody-positive healthy individuals display unique immune profiles
that may regulate autoimmunity. Arthritis Rheumatol. 68, 2492–2502.
Smatti, M.K., Cyprian, F.S., Nasrallah, G.K., Al Thani, A.A., Almishal, R.O., and
Yassine, H.M. (2019). Viruses and autoimmunity: a review on the potential
interaction and molecular mechanisms. Viruses 11, 762.
Snyder, T.M., Gittelman, R.M., Klinger, M., May, D.H., Osborne, E.J., Tanigu-
chi, R., Zahid, H.J., Kaplan, I.M., Dines, J.N., Noakes, M.T., et al. (2020).
Magnitude and dynamics of the T-cell response to SARS-CoV-2 infection at
both individual and population levels. medRxiv. medRxiv:. https://doi.org/10.
1101/2020.07.31.20165647
Sokal, A., Chappert, P., Barba-Spaeth, G., Roeser, A., Fourati, S., Azzaoui, I.,
Vandenberghe, A., Fernandez, I., Meola, A., Bouvier-Alias, M., et al. (2021).
Maturation and persistence of the anti-SARS-CoV-2 memory B cell response.
Cell 184, 1201–1213.e14.
Stephenson, E., Reynolds, G., Botting, R.A., Calero-Nieto, F.J., Morgan, M.D.,
Tuong, Z.K., Bach, K., Sungnak, W., Worlock, K.B., Yoshida, M., et al. (2021).
Single-cell multi-omics analysis of the immune response in COVID-19. Nat.
Med. 27, 904–916.
Sturm, G., Szabo, T., Fotakis, G., Haider, M., Rieder, D., Trajanoski, Z., and Fi-
notello, F. (2020). Scirpy: a Scanpy extension for analyzing single-cell T-cell re-
ceptor sequencing data. Bioinformatics 36, 4817–4818.
Su, Y., Chen, D., Yuan, D., Lausted, C., Choi, J., Dai, C.L., Voillet, V., Duvvuri,
V.R., Scherler, K., Troisch, P., et al. (2020). Multi-omics resolves a sharp dis-
ease-state shift between mild and moderate COVID-19. Cell 183, 1479–
1495.e20.
Tan, E.M., Feltkamp, T.E., Smolen, J.S., Butcher, B., Dawkins, R., Fritzler,
M.J., Gordon, T., Hardin, J.A., Kalden, J.R., Lahita, R.G., et al. (1997). Range
of antinuclear antibodies in ‘‘healthy’’ individuals. Arthritis Rheum 40,
1601–1611.
Taquet, M., Dercon, Q., Luciano, S., Geddes, J.R., Husain, M., and Harrison,
P.J. (2021). Incidence, co-occurrence, and evolution of long-COVID features:
a 6-month retrospective cohort study of 273,618 survivors of COVID-19. PLoS
Med. 18, e1003773.
Traag, V.A., Waltman, L., and van Eck, N.J. (2019). From Louvain to Leiden:
guaranteeing well-connected communities. Sci. Rep. 9, 5233.
Wang, E.Y., Mao, T., Klein, J., Dai, Y., Huck, J.D., Jaycox, J.R., Liu, F., Zhou,
T., Israelow, B.,Wong, P., et al. (2021). Diverse functional autoantibodies in pa-
tients with COVID-19. Nature 595, 283–288.
Whiteside, S.K., Snook, J.P., Williams, M.A., and Weis, J.J. (2018). Bystander
T cells: a balancing act of friends and foes. Trends Immunol. 39, 1021–1035.
Wolf, F.A., Angerer, P., and Theis, F.J. (2018). SCANPY: large-scale single-cell
gene expression data analysis. Genome Biol. 19, 15.
Wolock, S.L., Lopez, R., and Klein, A.M. (2019). Scrublet: computational iden-
tification of cell doublets in single-cell transcriptomic data. Cell Syst 8,
281–291.e9.
Woodruff, M.C., Ramonell, R.P., Lee, F.E.-H., and Sanz, I. (2020). Clinically
identifiable autoreactivity is common in severe SARS-CoV-2 Infection.
medRxiv. medRxiv:. https://doi.org/10.1101/2020.10.21.20216192
World Health Organization (2020). WHO R&D blueprint novel coronavirus
COVID-19 therapeutic trial synopsis. https://www.who.int/blueprint/priority-
diseases/key-action/COVID-19_Treatment_Trial_Design_Master_Protocol_
synopsis_Final_18022020.pdf.
Ye, J., Ma, N., Madden, T.L., and Ostell, J.M. (2013). IgBLAST: an immuno-
globulin variable domain sequence analysis tool. Nucleic Acids Res. 41,
W34–W40.
Younes, A.K., and Younes, N.K. (2017). Recovery of steroid induced adrenal
insufficiency. Transl. Pediatr. 6, 269–273.
Zamani, B., Moeini Taba, S.M., and Shayestehpour, M. (2021). Systemic lupus
erythematosusmanifestation following COVID-19: a case report. J. Med. Case
Rep. 15, 29.
Zhao, M.M., Yang, W.L., Yang, F.Y., Zhang, L., Huang, W.J., Hou, W., Fan,
C.F., Jin, R.H., Feng, Y.M., Wang, Y.C., et al. (2021). Cathepsin L plays a
key role in SARS-CoV-2 infection in humans and humanized mice and is a
promising target for new drug development. Signal Transduct. Target. Ther.
6, 134.
Zheng, H., Rao, A.M., Dermadi, D., Toh, J., Murphy Jones, L., Donato, M., Liu,
Y., Su, Y., Dai, C.L., Kornilov, S.A., et al. (2021). Multi-cohort analysis of host
immune response identifies conserved protective and detrimental modules
associated with severity across viruses. Immunity 54, 753–768.e5.
Cell 185, 881–895, March 3, 2022 895
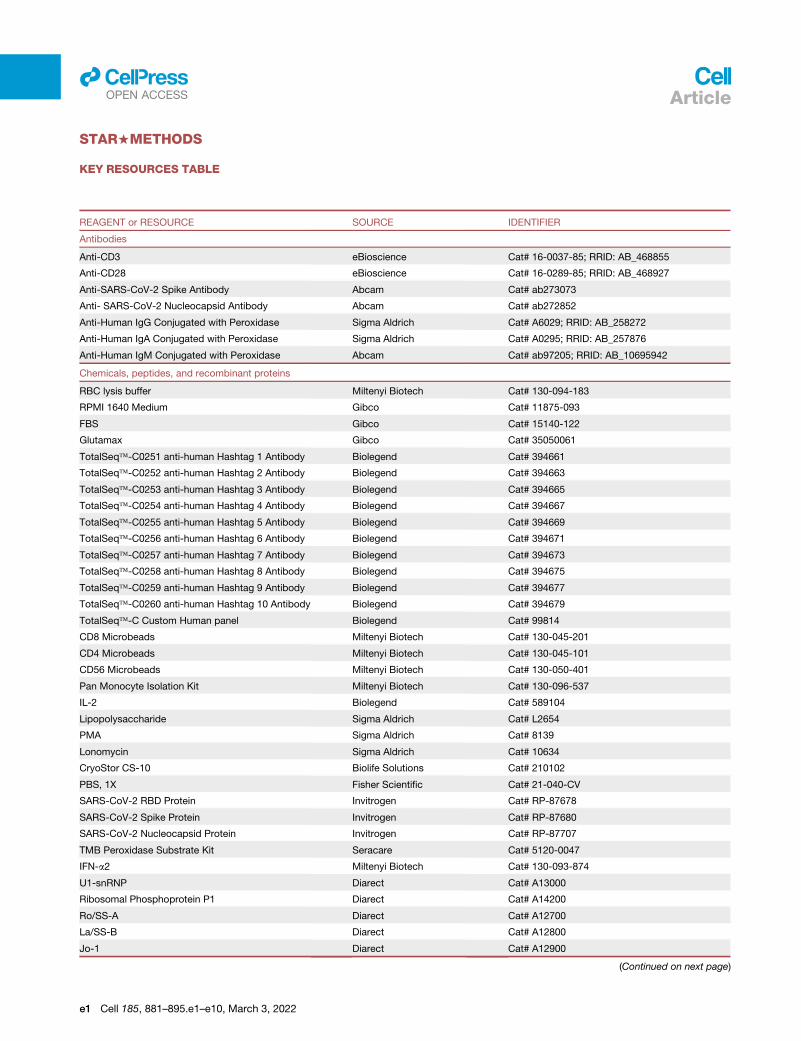
llOPEN ACCESS Article
STAR+METHODS
KEY RESOURCES TABLE
REAGENT or RESOURCE SOURCE IDENTIFIER
Antibodies
Anti-CD3 eBioscience Cat# 16-0037-85; RRID: AB_468855
Anti-CD28 eBioscience Cat# 16-0289-85; RRID: AB_468927
Anti-SARS-CoV-2 Spike Antibody Abcam Cat# ab273073
Anti- SARS-CoV-2 Nucleocapsid Antibody Abcam Cat# ab272852
Anti-Human IgG Conjugated with Peroxidase Sigma Aldrich Cat# A6029; RRID: AB_258272
Anti-Human IgA Conjugated with Peroxidase Sigma Aldrich Cat# A0295; RRID: AB_257876
Anti-Human IgM Conjugated with Peroxidase Abcam Cat# ab97205; RRID: AB_10695942
Chemicals, peptides, and recombinant proteins
RBC lysis buffer Miltenyi Biotech Cat# 130-094-183
RPMI 1640 Medium Gibco Cat# 11875-093
FBS Gibco Cat# 15140-122
Glutamax Gibco Cat# 35050061
TotalSeq�-C0251 anti-human Hashtag 1 Antibody Biolegend Cat# 394661
TotalSeq�-C0252 anti-human Hashtag 2 Antibody Biolegend Cat# 394663
TotalSeq�-C0253 anti-human Hashtag 3 Antibody Biolegend Cat# 394665
TotalSeq�-C0254 anti-human Hashtag 4 Antibody Biolegend Cat# 394667
TotalSeq�-C0255 anti-human Hashtag 5 Antibody Biolegend Cat# 394669
TotalSeq�-C0256 anti-human Hashtag 6 Antibody Biolegend Cat# 394671
TotalSeq�-C0257 anti-human Hashtag 7 Antibody Biolegend Cat# 394673
TotalSeq�-C0258 anti-human Hashtag 8 Antibody Biolegend Cat# 394675
TotalSeq�-C0259 anti-human Hashtag 9 Antibody Biolegend Cat# 394677
TotalSeq�-C0260 anti-human Hashtag 10 Antibody Biolegend Cat# 394679
TotalSeq�-C Custom Human panel Biolegend Cat# 99814
CD8 Microbeads Miltenyi Biotech Cat# 130-045-201
CD4 Microbeads Miltenyi Biotech Cat# 130-045-101
CD56 Microbeads Miltenyi Biotech Cat# 130-050-401
Pan Monocyte Isolation Kit Miltenyi Biotech Cat# 130-096-537
IL-2 Biolegend Cat# 589104
Lipopolysaccharide Sigma Aldrich Cat# L2654
PMA Sigma Aldrich Cat# 8139
Lonomycin Sigma Aldrich Cat# 10634
CryoStor CS-10 Biolife Solutions Cat# 210102
PBS, 1X Fisher Scientific Cat# 21-040-CV
SARS-CoV-2 RBD Protein Invitrogen Cat# RP-87678
SARS-CoV-2 Spike Protein Invitrogen Cat# RP-87680
SARS-CoV-2 Nucleocapsid Protein Invitrogen Cat# RP-87707
TMB Peroxidase Substrate Kit Seracare Cat# 5120-0047
IFN-a2 Miltenyi Biotech Cat# 130-093-874
U1-snRNP Diarect Cat# A13000
Ribosomal Phosphoprotein P1 Diarect Cat# A14200
Ro/SS-A Diarect Cat# A12700
La/SS-B Diarect Cat# A12800
Jo-1 Diarect Cat# A12900
(Continued on next page)
e1 Cell 185, 881–895.e1–e10, March 3, 2022
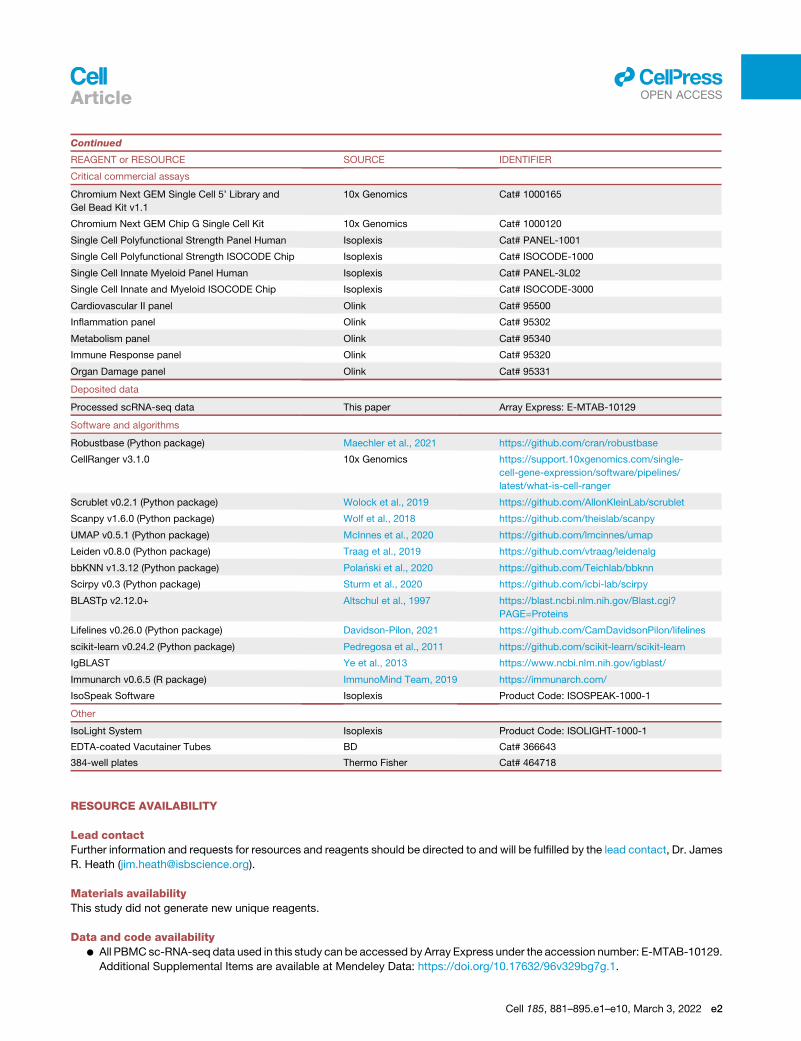
Continued
REAGENT or RESOURCE SOURCE IDENTIFIER
Critical commercial assays
Chromium Next GEM Single Cell 5’ Library and
Gel Bead Kit v1.1
10x Genomics Cat# 1000165
Chromium Next GEM Chip G Single Cell Kit 10x Genomics Cat# 1000120
Single Cell Polyfunctional Strength Panel Human Isoplexis Cat# PANEL-1001
Single Cell Polyfunctional Strength ISOCODE Chip Isoplexis Cat# ISOCODE-1000
Single Cell Innate Myeloid Panel Human Isoplexis Cat# PANEL-3L02
Single Cell Innate and Myeloid ISOCODE Chip Isoplexis Cat# ISOCODE-3000
Cardiovascular II panel Olink Cat# 95500
Inflammation panel Olink Cat# 95302
Metabolism panel Olink Cat# 95340
Immune Response panel Olink Cat# 95320
Organ Damage panel Olink Cat# 95331
Deposited data
Processed scRNA-seq data This paper Array Express: E-MTAB-10129
Software and algorithms
Robustbase (Python package) Maechler et al., 2021 https://github.com/cran/robustbase
CellRanger v3.1.0 10x Genomics https://support.10xgenomics.com/single-
cell-gene-expression/software/pipelines/
latest/what-is-cell-ranger
Scrublet v0.2.1 (Python package) Wolock et al., 2019 https://github.com/AllonKleinLab/scrublet
Scanpy v1.6.0 (Python package) Wolf et al., 2018 https://github.com/theislab/scanpy
UMAP v0.5.1 (Python package) McInnes et al., 2020 https://github.com/lmcinnes/umap
Leiden v0.8.0 (Python package) Traag et al., 2019 https://github.com/vtraag/leidenalg
bbKNN v1.3.12 (Python package) Pola�nski et al., 2020 https://github.com/Teichlab/bbknn
Scirpy v0.3 (Python package) Sturm et al., 2020 https://github.com/icbi-lab/scirpy
BLASTp v2.12.0+ Altschul et al., 1997 https://blast.ncbi.nlm.nih.gov/Blast.cgi?
PAGE=Proteins
Lifelines v0.26.0 (Python package) Davidson-Pilon, 2021 https://github.com/CamDavidsonPilon/lifelines
scikit-learn v0.24.2 (Python package) Pedregosa et al., 2011 https://github.com/scikit-learn/scikit-learn
IgBLAST Ye et al., 2013 https://www.ncbi.nlm.nih.gov/igblast/
Immunarch v0.6.5 (R package) ImmunoMind Team, 2019 https://immunarch.com/
IsoSpeak Software Isoplexis Product Code: ISOSPEAK-1000-1
Other
IsoLight System Isoplexis Product Code: ISOLIGHT-1000-1
EDTA-coated Vacutainer Tubes BD Cat# 366643
384-well plates Thermo Fisher Cat# 464718
llOPEN ACCESSArticle
RESOURCE AVAILABILITY
Lead contactFurther information and requests for resources and reagents should be directed to and will be fulfilled by the lead contact, Dr. James
R. Heath ([email protected]).
Materials availabilityThis study did not generate new unique reagents.
Data and code availabilityd All PBMC sc-RNA-seq data used in this study can be accessed by Array Express under the accession number: E-MTAB-10129.
Additional Supplemental Items are available at Mendeley Data: https://doi.org/10.17632/96v329bg7g.1.
Cell 185, 881–895.e1–e10, March 3, 2022 e2
llOPEN ACCESS
e3
Article
d This paper does not report original code.
d Any additional information required to reanalyze the data reported in this work paper is available from the lead contact upon
request.
EXPERIMENTAL MODEL AND SUBJECT DETAILS
COVID-19 and healthy individualsThe INCOV cohort included 209 SARS-CoV-2 patients (50% females, aged between 18 and 89 years with an average of 56 years), an
expansion on the cohort previously published at acute infection (Su et al., 2020). Potential participants were identified at five hospitals
of Swedish Medical Center and affiliated clinics located in the Puget Sound region near Seattle, WA. All enrolled patients provided
written in-person informed consent. De-identified proteomic and metabolomic data frommatched healthy controls processed using
the shared technical pooled control samples to enable batch-correction were previously collected from individuals enrolled in a
wellness program (Manor et al., 2018) (Arivale, Seattle, WA). Healthy control samples for single-cell analyses were obtained from
Bloodworks Northwest (Seattle, WA). Detailed information on age, sex, race, ethnicity, and disease history etc. of this patient cohort
and healthy controls are listed in Tables S1.1 and S1.2. Disease severity was quantified using the WHO Ordinal Scale for Clinical
Improvement score (WOS) (World Health Organization, 2020). Clinical data for hospitalized patients were abstracted from deidenti-
fied electronic health records (EHR). Clinical lab data were extracted from the nearest time point to each blood draw. Procedures for
the INCOV study were approved by the Institutional Review Board (IRB) at Providence St. Joseph Health with IRB study number
STUDY2020000175 and the Western Institutional Review Board (WIRB) with IRB study number 20170658.
The HAARVI (hospitalized or ambulatory adults with respiratory viral infections) cohort included 100 individuals that were either
inpatients or outpatients with laboratory-confirmed SARS-CoV-2 infection. The HAARVI participants were aged between 23 and
76 years with an average of 50 years, with 66% females. Inpatients were hospitalized at either HarborviewMedical Center, UWMed-
ical CenterMontlake, or UWMedical Center Northwest andwere enrolled during their hospital admission. Outpatients were identified
through a laboratory alert system, email and flyer advertising, and through positive SARS-CoV-2 cases reported by the Seattle Flu
Study (Chu et al., 2020). All participants subsequently were asked to return at day 60 or 90 for follow-up. Blood draws were taken
during their follow-up visits. Participants or their legally authorized representatives completed informed consent. Demographics
are listed in Table S1.4. The HAARVI study was approved by the IRB at University of Washington with IRB study numbers
STUDY00000959 and STUDY00002929.
Additionally, plasma samples were obtained from a third cohort SJCI (St. John’s Cancer Institute) where SARS-CoV-2 patients
were consented under PH&S IRB approved protocol SJCI(JWCI)-18-0401, PH&S IRB number STUDY2018000254. The JWCI/
SJCI cohort contained 33 subjects. Participants were aged between 28 and 96 years with a median of 66 years. 36% were female.
Large fractions of the cohort had hypertension (67%) and/or diabetes mellitus (36%) among other comorbidities. SARS-CoV-2
severity spanned from 3 to 7 on the WOS (median 5).
METHOD DETAILS
Symptom surveyPersistent symptoms at the T3 draw were determined by implementing interview survey, complemented by a chart review, which
were completed on 94 (75%) and 125 (100%) of convalescent patients, respectively. A standardized list of symptoms was generated
from symptoms known to be common at acute infection and persisting as PASC (Huang et al., 2021; Logue et al., 2021; Nalbandian
et al., 2021), and were asked to the interviewees specifically. These interview symptoms were further validated by a detailed chart
review for each participant using a standardized tool by clinicians (J.D.G., W.R.B., M.E.M., R.A.C.) and experienced research coor-
dinators (H.A.A., J.W.). Results from the chart review were used to determine the temporal relationship between reported symptoms
and SARS-CoV-2 infection. If symptoms were also reported before COVID-19 due to a preexisting medical condition, it will be coded
as unknown (NaN).
The study protocol (developed in March, 2020) allowed for interview questions to be asked to the participant about 8 symptoms:
fatigue, cough, dyspnea, sputum production, diarrhea, nausea or vomiting, abdominal pain, and dysgeusia. In addition, the IRB al-
lowed for an open-ended question ‘‘Could you tell me about your experience and recovery from COVID-19?’’ to capture other
resolved or persisting patient reported symptoms. Two authors (J.D.G. and H.A.) performed quality control and standardization
for all reviews which included clarifying with further review of the EHR, notes from chart review and interview and follow-up questions
to the reviewer. PASC symptoms were deemed to be present when reported symptoms from the interview and EHR are consistent.
Symptoms were also grouped as follows: respiratory viral (cough, fatigue, shortness of breath, fever or chills, muscle/body aches,
nausea), gastrointestinal (diarrhea, abdominal pain), neurologic (anxiety, blurred vision, depression, memory problems, difficulty
concentrating, difficulty sleeping, dizziness, headache), and anosmia/dysgeusia (loss of taste, loss of smell).
In our analysis, a value of 1 in respiratory viral suggests >=2 of respiratory viral PASC, and 0 suggests that no respiratory
viral PASCs were reported. For the other three categories of symptoms, a value of 1 suggests >=1 PASC reported, and 0 suggests
no PASC reported. For single PASC, we only analyzed the ones that were reported by >10 patients, including fatigue,
Cell 185, 881–895.e1–e10, March 3, 2022

llOPEN ACCESSArticle
shortness of breath, cough, inability to exercise, memory problems, difficulty concentrating, sputum, listed by frequency in a de-
scending order.
Plasma and PBMC isolationPlasma and PBMCs from the INCOV cohort were isolated from patient whole blood as previously described (Su et al., 2020). Plasma
and PBMC fractions were isolated from patient blood collected in EDTA-coated vacutainer tubes. After centrifuged at 800 x g for
15 min at room temperature, the PBMC layer (which did not include granulocytes (such as neutrophils)) was isolated, counted,
and aliquoted at 2.5 million cells/ml in CryoStor CS-10 freeze media. The aliquoted EDTA-plasma and PBMCs were frozen at
-80�C. PBMCs were later transferred into liquid nitrogen and stored until use.
Participant samples from the HAARVI cohort were collected in acid citrate dextrose and serum-separating tubes (SST, BD). Whole
blood in SST tubes was allowed to clot by incubating for at least 1 hr at room temperature then centrifuged at 700xg for 10 minutes,
aliquoted, and stored at -20�C. PBMCs were isolated by density gradient centrifugation using Histopaque (Sigma-Aldrich). After
washing, purified PBMC were resuspended in 90% heat-inactivated fetal bovine serum (FBS) (Sigma-Aldrich) with 10% dimethyl
sulfoxide (DMSO) (Sigma-Aldrich) cryopreservation media and stored in liquid nitrogen until use. All samples were frozen within
6 hrs of collection time.
Single-cell multi-omics assayChromium Single Cell Kits (10x Genomics) were utilized to analyze the transcriptome, surface protein levels, TCR, and BCR
sequences simultaneously from the same cell. Experiments were performed according to the manufacturer’s instructions. Briefly,
cryopreserved PBMCs were thawed and incubated with the 1X red blood cell lysis solution (Miltenyi Biotech) to lyse any remaining
red blood cells in the PBMC samples. Cells were stained with cell hashtag antibodies (BioLegend) and TotalSeq-C custom human
antibodies (BioLegend). Stained cells were then loaded onto a Chromium Next GEM chip G (10X Genomics). Cells were lysed for
reverse transcription and complementary DNA (cDNA) amplification in the ChromiumController (10XGenomics). The polyadenylated
transcripts were reverse-transcribed inside each gel bead-in-emulsion afterward. Full-length cDNA alongwith cell barcode identifiers
were PCR-amplified and sequencing libraries were prepared and normalized. The constructed library was sequenced on the
NovaSeq platform (Illumina).
SARS-CoV-2 viral load measurementsThe miRNeasy kit (Qiagen) was used to isolate RNA from 100 ml of plasma or nasopharyngeal swab samples according to the
manufacturer’s instructions. The RNA was eluted from the membrane with either 30 ml or 50 ml of RNAse free water for plasma or
nasopharyngeal swab samples respectively. To detect viral sequences, protocol from the CDC was followed (Centers for Disease
Control and Prevention, 2020), and primers were obtained from Integrated DNA Technologies (IDT). The qRT-PCR results were per-
formed on a CFX-96 qPCRmachine (Bio-Rad). Levels of SARS-CoV-2 RNA and human RNase P transcript were expressed as cycle
threshold (CT) value. A CT value < 36 was considered positive. The conversion of Ct value to viral copy number is based on a titration
curve generated using synthetic partial viral RNA (Twist) with known copy number as a template for qPCR.
CMV and EBV viremia measurementsReal-time quantitative PCRwas performed to detect and quantify cytomegalovirus (CMV) and Epstein-Barr virus (EBV). The DNAwas
extracted from 200 ml of plasma using QIAamp 96 DNA blood kit (Qiagen) and eluted into 100 ml AE buffer (Qiagen). 10 ml of DNA was
used for each 30 ml PCR assay. 2x QuantiTect multiplex PCRmix (Qiagen) was used for all PCR assays. The PCR cycling steps were
as follows: 1 cycle at 50�C for 2 mins, 1 cycle at 95�C for 15 mins, and 45 cycles of 94�C for 1 min and 60�C for 1 minute. Exo internal
control was spiked into each PCR reaction to monitor inhibition. A negative result was accepted only if the internal control was pos-
itive with a CT within 3 cycles of the Exo CT of no template controls. A standard curve based on titers of 10, 102, 103, 104, and 105 per
10 ml in duplex was included in each PCR run. A PCR runwas rejected if the lowest dilution of 10 did not amplify. Detection ofR1 copy
of virus DNA/reaction (50 copies/mL of plasma) was considered positive.
Plasma proteomics and metabolomicsPlasma concentrations of proteins and metabolites were measured as previously described (Su et al., 2020). Batch-corrected pro-
teomic and metabolomic data were further adjusted for age, sex and BMI, as well as their interactions, using a set of robust linear
regression models estimated for each protein and metabolite separately using the external control sample of uninfected individuals
that were selected using propensity score matching on a number of sociodemographic and comorbidity variables from a larger in-
house sample. Models were fitted using the lmrob function from the R package robustbase with the ’KS2014’ setting (Maechler et al.,
2021). Metabolite values were log2 transformed prior to further analyses, while protein abundance values (NPX) were already log2scaled. Batch-corrected plasma protein and metabolite levels were converted into Z-scores using the means and the standard
deviations estimated for the residuals in thematched control samples, which included corrections for age, sex, and bodymass index
(BMI).
Cell 185, 881–895.e1–e10, March 3, 2022 e4
llOPEN ACCESS Article
Single-cell multiplex secretome assayCryopreserved PBMCs were thawed and incubated in complete medium (RPMI 1640 (Gibco) containing 10% fetal bovine serum
(FBS, Gibco), 1x of glutamax (Gibco) and 100U/mL penicillin-streptomycin (Gibco)) overnight at 37�C, 5% CO2. After overnight re-
covery, CD4+ and CD8+ T cells were isolated using CD4+ (Miltenyi Biotec) and CD8+ (Miltenyi Biotec) microbeads sequentially.
NK cells andMonocytes were isolated using CD56MicroBeads (Miltenyi Biotec) and the PanMonocyte Isolation Kit (Miltenyi Biotec),
respectively.
The isolated CD4+ and CD8+ T cells were seeded at a density of 1x10⁵ cells/well in a 96 well-plate and stimulated for 6 hrs with
plate-bound anti-CD3 antibodies (eBioscience, pre-coated at 10 mg/ml overnight at 4�C) and 5 mg/mL of soluble anti-CD28 anti-
bodies (eBioscience) in complete medium at 37�C, 5% CO2. The isolated NK cells were cultured for 12 hrs in the presence of IL-2
(Biolegend, 10 ng/ml). The enriched monocytes at were seeded at 1x10⁵ cells/mL and stimulated with 10 ng/ml lipopolysaccharide
(Sigma-Aldrich) for 12 hrs. After stimulation, the activated cells were collected, washed, and stained withmembrane stain (included in
the IsoPlexis kit), before being loaded onto the chip consisting of 12,000 chambers pre-coated with an array of 32 cytokine capture
antibodies. The NK cells were resuspended in complete RPMI supplemented with PMA (Sigma Aldrich, 5 ng/ml) and Ionomycin
(Sigma Aldrich, 500 ng/ml) and then loaded onto the IsoCode chip for the stimulation during the incubation. The chip was inserted
into IsoLight for further incubation for 16 hours. Secreted cytokines were detected by a cocktail of detection antibodies followed by
the fluorescent labeling. Fluorescent signals were analyzed by the IsoSpeak software to calculate the numbers of cytokine-secreting
cells, the intensity level of cytokines, and polyfunctional strength index (PSI). Measured cytokines in each panel are listed as below.
Single-Cell Adaptive Immune cytokine panel including the following subsets of cytokines. Effector: Granzyme B, IFN-g, MIP-1a,
Perforin, TNF-a, and TNF-b; Stimulatory: GM-CSF, IL-2, IL-5, IL-7, IL-8, IL-9, IL-12, IL-15, and IL-21; Chemoattractive: CCL11,
IP-10, MIP-1b, and RANTES; Regulatory: IL-4, IL-10, IL-13, IL-22, TGFb1, sCD137, and sCD40L; Inflammatory: IL-1b, IL-6,
IL-17A, IL-17F, MCP-1, and MCP-4.
Single-Cell Innate Immune cytokine panel including the following subsets of cytokines. Effector: IFN-g, MIP-1a, TNF-a, and TNF-b;
Stimulatory: GM-CSF, IL-8, IL-9, IL-15, IL-18, TGF-a, and IL-5; Chemoattractive: CCL11, IP-10, MIP-1b, RANTES, and BCA-1;
Regulatory: IL-10, IL-13, IL-22, and sCD40L; Inflammatory: IL-1b, IL-6, IL-12-p40, IL-12, IL-17A, IL-17F, MCP-1, MCP-4, and MIF;
Growth Factors: EGF, PDGF-BB, and VEGF.
SARS-CoV-2 ELISAsBriefly, 384-well plates (ThermoFisher) were coated with 10 mL of 5 mg/mL SARS-CoV-2 RBD (Invitrogen), spike (S) (Invitrogen), or
nucleocapspid (N) (Invitrogen) protein in 0.1M carbonate buffer (pH9.6) overnight at 4�C. Plates were washed four times with
wash buffer (phosphate buffered saline (PBS) containing 0.05% Tween-20) and blocked with blocking buffer (wash buffer with
5% BSA) for 1 hour at room temperature (RT). Wells were incubated with 30 mL heat-inactivated plasma samples from COVID-19
patients at six serial three-fold dilutions, starting from 1:30 in blocking buffer for 1 hour at RT. The anti-S antibody (abcam) and
anti-N antibody (abcam) at nine serial three-fold dilutions, starting from 2 mg/mL were used as positive controls. A non-coating
well, a non-binding well, and a blank well as negative controls wells were also included on the plate. After washing four times with
wash buffer, wells were incubated with peroxidase-conjugated goat anti-human IgG (Sigma Aldrich, 1:1,000 dilution), IgA (Sigma Al-
drich, 1:5000 dilution), or IgM (Abcam, 1:1000 dilution) antibodies in blocking buffer for 1 hour at RT. Wells were washed four times
again before incubating with 30 mL 3,3’,5,5’-tetramethylbenzidine (TMB) substrate solution (Seracare, 5120-0047). The TMB reaction
was stopped after 5 minutes by adding 1M sulfuric acid. The OD at 450nmwas measured on a Spectramax Plate Reader. The ELISA
antibody titers were defined as the plasma dilutions that result in the middle response of the positive control and calculated by fitting
the background-subtracted data to a four-parameter logistic regression model using the R package nplr (Commo and Bot, 2016).
Autoantibody ELISAsAutoantibody measurements were adopted from the protocol described above with a few modifications as below. In brief, 384-well
plates were coated with 2 mg/mL of recombinant IFN-a2 (Miltenyi Biotech), U1-small nuclear ribonucleoprotein (U1-snRNP) (Diarect),
Ribosomal Phosphoprotein P1 (P1) (Diarect), Ro/SS-A (Diarect), La/SS-B (Diarect), or histidyl-transfer ribonucleic acid synthetase
(Jo-1) (Diarect), followed by incubating with 1:50 dilutions of plasma samples in duplicates. End-point OD at 450nm was measured
and recorded. Since it is common for healthy people to have detectable anti-nuclear antibody titers (Pisetsky, 2011; Slight-Webb
et al., 2016; Tan et al., 1997), two methods were adopted to analyze the autoantibody data. Observation in Figure 2B was made
only using datapoints that had a value greater than mean + 2 standard deviations of healthy controls. Other observations associated
with autoantibodies were made using all datapoints.
Neutralization assayThe pseudo-virus neutralization assay was conducted by Monogram Biosciences as previously described (Goldman et al., 2020).
Briefly, pseudo-typed SARS-CoV-2 virus expressing spike proteins was generated based the original Wuhan-Hu-1 strain sequences
(GenBank: NC_045512.2). Neutralizing antibody titers were measured by incubating nine serial three-fold dilutions of plasma sam-
pleswith a starting dilution of 1:40 and SARS-CoV-2 pseudo-typed virus at 37�C for 1 hr. HEK-293 cells expressing ACE2were added
e5 Cell 185, 881–895.e1–e10, March 3, 2022
llOPEN ACCESSArticle
to the 96-well plate and incubated for additional 60-80 hrs at 37�C for luminescence measurements. Neutralization titers were calcu-
lated as the plasma dilution conferring 50% inhibition (ID50) of pseudo-virus infection, adjusting for background luminescence
measured from the SARS-CoV-2 nAb positive control.
MIRA assayTheMIRA assay for identifying antigen-specific TCRswas performed as previously described (Klinger et al., 2015; Nolan et al., 2020).
Briefly, different MIRA peptides were used to stimulate T cells and antigen-specific T cells were sorted on FACSAria after overnight
incubation. Sorted cells were lysed and RNA was extracted for TCRb sequencing. Peptide-specific TCRb chain sequences were
obtained.
Bulk TCR sequencingHigh-throughput TCRb sequencing were performed as previously reported (Carlson et al., 2013; Chapuis et al., 2019; Robins et al.,
2009). Briefly, DNAwas extracted from T cells and TCR TCRbCDR3 (complementarity determining region 3) regions were sequenced
using the immunoSEQ� Assay (Adaptive Biotechnologies, Seattle, WA), a multiplex PCR-based method that amplifies and charac-
terizes CDR3 rearranged sequences, with a built-in rigorous PCR amplification bias control and quality assurance.
QUANTIFICATION AND STATISTICAL ANALYSIS
Single-cell sequencing data processingDroplet-based sequencing data were aligned and quantified via Cell Ranger Single-Cell Software Suite (v3.1.0, 10x Genomics)
using GRCh38 as a reference. Cells from each demultiplexed sample were first filtered for cells with R200 genes, then filtered
based on 1) <10000 unique molecular identifiers (UMI) counts per cell (library size); 2) <2500 detected genes per cell; and 3)
proportion of mitochondrial gene counts (mitochondrial gene UMIs/total UMIs)<10%. Doublets were simultaneously identified in
sample demultiplexing or using scrublet (Wolock et al., 2019) and removed prior to the aforementioned filtering. After QC-based
filtering, a total of 966,013 (154,745) cells for the INCOV (HAARVI) cohort were retained for downstream analysis. Scanpy (Wolf
et al., 2018) was used to normalize cells via CPM normalization (UMI count per cell was set to 106) and log1p transformation
(natural log of CPM plus one).
Single-cell RNA-seq cell type identificationNormalized, ln(CPM+1), whole transcriptomemRNA data fromQC-passing single cells were analyzed via PCA (ARPACK). All 50 PCs
were used to calculate a neighborhood graph (n_neighbors=15) which was utilized to determine UMAP (McInnes et al., 2020) coor-
dinates and Leiden (unbiased clustering) clusters (Traag et al., 2019). Clusters were assigned cell types based on canonical immune
markers and multi-cell-type clusters were separated via additional UMAP and Leiden cluster calculations. Clusters (19,034 cells for
INCOV, 477 for HAARVI) that co-expressed markers from multiple cell types were labeled as low-quality or doublets and removed
from further analysis. In total, 946,979 (154,268) cells for the INCOV (HAARVI) cohort were deemed high-quality and assigned cell
types; these cells did not show noticeable batch-to-batch variation.
Labeled T cells were used to calculate a CD4+ score (sum of min-max-scaled normalized levels of CD4 transcript and CD4 surface
protein) and a CD8+ T cell score (sum of min-max-scaled normalized levels ofCD8A andCD8B transcripts, and CD8 surface protein).
The two scores were min-max-scaled and then projected for manual gating of CD4+ and CD8+ T cells. T cells with ambiguous scores
were classified as ‘‘Other T cells’’. Other rare cell types were labeled however their frequencies may not be robust due to the cell
numbers sampled.
Single-cell phenotype identificationNormalized mRNA values for eachmajor immune cell type (B cells, CD4+ T cells, CD8+ T cells, monocytes and NK cells) were used to
construct single cell whole transcriptome matrices. These matrices were then utilized to calculate PCA values (50 PCs). PCs were
used for batch-corrected (using sequencing batch) neighborhood graph, bbkNN (Pola�nski et al., 2020) construction then UMAP
and Leiden (unbiased clustering) cluster calculations were conducted. Cells were then additionally screened for potential doublets,
clusters with high doublet scores as quantified from raw transcriptomes via Scrublet or expressing markers of other major immune
cell types were removed. If doublets were removed, PCA and subsequent kNN graph construction, and UMAP and Leiden calcula-
tions were redone.
Phenotypes were assigned based on Leiden clusters and expression of marker genes relevant for each major immune cell type.
Additional CD4+ T cell phenotypes TFH, Treg and Th17 were assigned if cells contained normalized mRNA levels above 0.0 (deter-
mined via bimodal distribution of mRNA levels from a density plot and justified as non-dropout values) for CXCR5, FOXP3, or
RORC, respectively, andwere not already assigned as a Cytotoxic or Hybrid cell. All reduced dimensions (PCA, neighborhood graph,
UMAP) and clusters (Leiden) for all of the single cell RNA-seq data were calculated via Scanpy (Wolf et al., 2018).
Cell 185, 881–895.e1–e10, March 3, 2022 e6
llOPEN ACCESS Article
Single-cell TCR-seq data processingDroplet-based sequencing data for T cell receptor sequences were aligned and quantified using the Cell Ranger Single-Cell Software
Suite (10x Genomics) against the GRCh38 human VDJ reference genome.
Single-cell TCR phenotype associationsFiltered annotated contigs for TCRs were analyzed via scirpy (Sturm et al., 2020). Aforementioned contigs were filtered for either
CD4+ or CD8+ T cells (as identified via single cell RNA-seq analysis) and then subject to clonotype definition and clonal expansion
analysis utilizing nucleotide sequences. Samples were then concatenated together andmerged with gene expression data for simul-
taneous single cell TCR and RNA data visualization.
Both the integrated CD4+ and CD8+ T cell datasets were subject to filtering for cells with complete TCR sequences, defined as a
detectable TRA and TRB. TCRs were normalized per sample (patient blood draw) by sampling with (without) replacement TCRs of
samples with n-TCRs < (R) median TCRs per sample. Pheno-tags were created by compounding cell phenotype with blood draw
timepoint (filtered for acute and convalescent). TCR x pheno-tag matrix was constructed with values as the percent of cells in the
given pheno-tag with the given TCR. Only TCRs present in R2 pheno-tags were included, and values were normalized to
ln(value+1). The matrix was then ordered and clustered in the same manner as the correlation analyses with t set to ‘‘5’’, as visually
ascertained.
PASC and pre-existing conditionsPre-existing conditions and clinical measurements were fitted to a multivariable logistic regression model of PASC, adjusted for age,
sex, and disease severity (WOS>3). Clinical labs were extracted from electronic health records (EHR). Missing labs were assumed to
be normal given missingness was generally for outpatients who were asymptomatic or had only mild symptoms with COVID-19. The
median values of the normal lab reference range for adults from American Board of Internal Medicine were used to impute missing
labs. Clinical measurements with more than 20%missingness were excluded, then imputation was done using k-nearest neighbors
(kNN). A total of 113 clinical measures and labs were available for analysis.
Before fitting logistic regression models, selection for clinical variables was done using extreme gradient boosting (XGBoost)1
using R version 3.6.3 and libraries xgboost (Chen and Guestrin, 2016) (version 1.3.2.1) and caret (Kuhn, 2008) (version 6.0-86).
XGBoost models were built to predict a binary PASC group, where a value of 1 suggests at least one PASC group reported
(respiratory viral, neurologic, and anosmia/dysgeusia) and 0 suggests no PASC group reported. Data was split into training
(80%) and test (20%) sets and upsampling was done using caret to balance the training set. Model training was done using
5-fold cross-validation, and model performances were evaluated in the test set. An XGBoost model with 16 clinical measure-
ments and labs had the highest AUC and accuracy on the test set (AUC = 0.788, 95%CI = 0.546 - 1; accuracy = 0.786, 95%CI =
0.492 - 0.953). The 16 clinical variables combined with preexisting conditions and demographics, were then used to build
logistic regression models to evaluate their associations with each of the four PASC categories and single PASCs that were
reported by > 10 patients.
Plasma-omic enrichment in PASCFor plasma proteomic analysis, top differentially expressed proteins (p-values < 5x10⁻³ in t-tests) in patients reported with a grouped
PASC compared to those without were subject to Gene Ontology (GO) analysis. The only two biological process GO terms enriched
for the top differential plasma proteins associated with neurological PASC are GO:0042321 (negative regulation of circadian sleep/
wake cycle, sleep) andGO:0045188 (regulation of circadian sleep/wake cycle, non-REM sleep). Themean of the two plasma proteins
(GHRL, ADA) that are associated with these two GO terms were used to plot Figure 1E left panel. For plasma metabolomic analysis,
cortisol and cortisone were in the top three differential metabolites in patients reporting respiratory viral PASC compared to those
without were selected to plot Figure 1E middle and right panels (Tables S2.1 and S2.2).
PASC and viral load measurementsWe performed logistic regression of PASC on binary viral load measurements, while adjusting for age, sex, and disease severity.
Separate models were fitted for each viral load measurement at each time point to predict the major symptom groups (respiratory
viral, neurological, gastrointestinal, and loss of sense) and symptoms reported in at least 10 patients. For EBV, samples with copies
per mL greater than 50 were labeled as positive. For SARS-CoV-2 RNAemia and nasal-swab viral load measurements, samples with
CT < 36 were labeled as positive. Disease severity at each timepoint was binarized by WOS>3, which characterizes hospitalized pa-
tients with respiratory support, as well as ICU admission. Estimates and their 95% Confidence Interval from multiple models were
plotted using Python. Extreme estimates with pz1 were omitted from visualization. Results from EBV viremia measurements at
T2 and T3, or nasal-swab viral at T3 were removed from visualizations in Figures S1F and S1G because <10 patients exhibit positive
signal at the time specified above, and so conclusions are hard to draw.
Antibody and PASC correlation analysisWe applied two methods for analyzing the correlations between antibodies and PASC. In the first method, the magnitude of corre-
lations (displayed in Figures 2C andS2D) was quantified via the log2 fold change (fc) of mean antibody levels in patients with a specific
e7 Cell 185, 881–895.e1–e10, March 3, 2022
llOPEN ACCESSArticle
PASC to the mean of those without. The fc values were used for plotting the heatmap. Statistical significance of the correlation be-
tween an antibody and a PASC was calculated using the Mann-Whitney U test. The second method involved logistic regression for
modeling PASC using antibody levels, sex, age, and disease severity as covariates (Figure S2F). Coefficients (ln(odds ratio)) and p
values derived from the logistic were used for plotting the heatmaps and annotating the statistical significance. Both methods used
antibody levels as continuous variables.
Autoantibody and B cell transcriptomicsEach transcript of each b cell type was tested for relationships with autoantibodies using log2 fold changes (autohigh (>=4 s +healthy)
vs. auto- (<2 s +healthy)) as quantification of magnitude and Mann Whitney U test as quantification of significance. The threshold of
significancewas determined as p < 0.05. Analytes that were representative of enriched pathways/functionswere selected. A full table
of associations between atypical memory B cell transcriptome and autoantibodies is available in Table S2.5.
TCR clonal trajectory analysisFor CD8+ T cells, TCR groups presented in Figure 3B were hyper-clustered with t set to ‘‘5’’ to ascertain finer resolution of TCR clo-
notype clusters (Table S3.5). Clonotype clusters are discussed in text and full TCR group assignment for the analyses are provided
(Table S3.5). Differential analysis was performed via scanpy.tl.rank_genes_groups (method=‘‘wilcoxon’’, n_genes=300) on single
cells comparing clonally deleted vs. expanded cells, full differential gene lists are provided (Tables S3.1 and S3.2).
For CD4+ T cells, TCR groups presented in Figure 3B were hyper-clustered with t set to ‘‘5’’ to ascertain finer resolution of TCR
clonotype clusters (Table S3.6). Clonotype clusters are discussed in text and full TCR group assignment for the analyses are provided
(Table S3.6). Differential analysis was performed via scanpy.tl.rank_genes_groups (method=‘‘wilcoxon’’, n_genes=300) on single
cells comparing clonally deleted vs. expanded cells, full differential gene lists are provided (Tables S3.3 and S3.4).
Combining CD8+ transcriptomes and TCR targetsSingle cell analysis was performed on combined CD8+ T cells from INCOV and HAARVI using Scanpy (Wolf et al., 2018). Additional
CD8+ T cells derived from healthy samples were extracted frompublished datasets based on previous cell type annotation (Ren et al.,
2021; Stephenson et al., 2021). After T cell receptor annotation using Scirpy (Sturm et al., 2020), we removed cells without TCRb
detected. Each dataset was normalized to counts per million and ln + 1 transformed before computing principal component analysis
on the combined count matrix. Batch correction was performed by constructing a batch balanced k nearest neighbors (BBKNN)
graph across datasets using the first 50 principal components (annoy neighbor approximation, method=umap, metric=angular,
k=12, trim=120) (Pola�nski et al., 2020). T cell clusters were computed via Leiden clustering (res=2.1) on the BBKNN graph and an-
notated by markers for each phenotype: Naıve (SELL, LEF1, CCR7high), Central Memory (SELL, TCF7, CCR7low), Effector Memory
(GZMK), Cytotoxic (GZMB, PRF1), and Hybrid (GZMK, GZMB, PRF1).
SARS-CoV-2-specific TCRs recognizing MHC class I peptides were obtained from ImmuneCODE MIRA dataset (release 002.1)
(Nolan et al., 2020) and seven unpublishedMIRA experiments. TCRs specific to Cytomegalovirus or Epstein-Barr virus were obtained
from VDJdb (release 2021-02-02) (Bagaev et al., 2020). Additional immunosequencing signature of CMV-associated TCRbs were
included (Emerson et al., 2017). Single cells were annotated as virus-specific based on matching TCRb bio identity, defined by
CDR3 amino acid sequences, V gene, and J gene. Sample frequency of TCRs (bio identities) per T cell phenotype were calculated
and aggregated based on virus specificity to obtain total frequencies of virus-specific T cells per phenotype.
BLASTP analysisFrom VDJdb (Bagaev et al., 2020), we obtained peptide sequences of antigens targeted by CMV-specific TCRs detected in our sc-
CITE-seq dataset. These peptides sequences were compared with non-redundant protein sequences of the SARS-CoV-2 proteome
(taxid:2697049) using blastp online web interface (Altschul et al., 1997).
PASC and CD8+ T cell transcriptomesPASC associations were quantified by isolating identified SARS-CoV-2 specific CD8+ T cells and taking themean expression of these
single cells per patient blood draw. For each symptom group (e.g. GI) six T cell phenotype marker genes were interrogated by taking
the mean expression of patients in the symptom group and subtracting the mean expression of patients not in the symptom group.
This results in a gene by symptomgroupmatrix where the value is the aforementioned difference value (positive valuesmean higher in
those in the given symptom group, negative values mean higher in those not in the given symptom group).
PASC and phenotype percentages over timeSingle-cell phenotype percentages were quantified from 10X-omic data where phenotypes were defined in the aforementioned par-
agraphs regarding sc-CITE-seq analysis. Associations between these percentages and PASC (including grouped PASCs as well as
individual PASC that were reported by more than 10 patients) were quantified via log2 fold change between those with a given PASC
variable compared to those without. Statistical significance were determined by pair-wise (meaning a single phenotype and a single
given PASC) Mann Whitney U tests, with significant associations as p < 0.05.
Cell 185, 881–895.e1–e10, March 3, 2022 e8
llOPEN ACCESS Article
Survival analysis of RNAemiaThe lifelines package (Davidson-Pilon, 2021) was used to plot Kaplan-Meier (KM) curves for patient survival probability. Date of death
was measured as days since onset of initial COVID-19 symptoms. Date of death is irrelevant for survived patients and KM curves
were plotted for up to six-months to display all dead patients. Patients were subsetted for those who RNAemia was tested for
and further split into those with and without positive RNAemia at T1. These two separate groups of patients were utilized to compute
KM curves. Statistics for survival analysis were gathered via a chi-squared test as implemented via scipy.stats.chi2_contingency. We
first generated a subset of patients for those who RNAemia at T1 was quantified, same data was used for the survival curve. We then
used this subset of patients to calculate a contingency table with rows as RNAemia positive and negative and columns as survived
and died. This contingency table was then inputted into the chi2_contingency method from scipy.stats to generate a p-value.
Symptom immune-transcriptome associationSymptoms that were universally queried for from INCOV patients (abdominal pain, cough, diarrhea, fatigue, loss of taste, nausea,
shortness of breath, and sputum) were interrogated for immune-transcriptome associations through statistical testing using the
Mann-Whitney U test with T3 cell type-specific gene expression. Each symptom was assigned a cell-type specific upregulation
and downregulation Z-like score by computing themean expression of their significantly associated (p<0.05) set of genes per patient
blood draw subtracting the mean expression of the patient blood draw across all samples (to account for technical bias) and dividing
it by the standard deviation of the patient blood draw as determined via all expressed genes (to account for technical variability).
These scores were computed for each patient blood draw for both the INCOV and HAARVI cohorts. PCA was computed on the
INCOV cohort using the patient blood draw by signature matrix and HAARVI samples were projected onto this PCA space using
the INCOV-derived PCAweights. PCs from both cohorts were utilized to calculate a kNN graph and then diffusionmap using Scanpy.
The same patient blood drawby signaturematrix was filtered for T3 INCOV blood drawswhichwere used to cluster INCOV patients
via consensus clustering. This consisted of 1000 iterations where in each iteration a random subset of the features (25%) was used to
cluster patients into four groups (via "Wards" algorithm and scipy.cluster.hierarchy’s fcluster method with criterion ‘‘maxclust’’ and
t set to ‘‘4’’). An affinity matrix was constructed for patients where each value was the percent of iterations of the 1000 iterations in
which the two patients appeared in the same cluster. This affinity matrix was then clustered using ‘‘Wards’’ algorithm and split into
four groups (same method as the clustering done per iteration).
PASC factor relatedness and independenceRelatedness was measured via the -log10 of the p-value as ascertained from chi-squared (Chi2) test as implemented via scipy.stat-
s.chi2_contingency. We first identified plasma-omic sets (one set for plasma proteins and another for metabolites) that were signif-
icantly (p < 0.01) enriched for a given PASC factor for each of the three timepoints. We then created contingency table between two
PASC factors where the two categories are non-significant and significant. For example, the double positive region would be the
number of analytes that the two PASC factors both showed significant enrichment with the same sign for, and the double negative
region would be the number of analytes that the two PASC factors both had showed non-significant enrichment. Only relatedness
values were utilized. Pair-wise Chi2 tests were utilized to display the relatedness heatmaps shown in Figure 6C. Mean relatedness
based on pair-wise tests where the two analytes were not the same (i.e. not type 2 diabetes with type 2 diabetes) were plotted as
bars in Figure 6D for each plasma-omic.
PASC factor ranking analysisThe percent PASC explained is equivalent to the number of patients that have a given PASC factor out of patients with three or more
symptoms, considering symptoms as defined in the aforementioned methods where more than 10 patients reported the given
symptom.
Machine learning for patient group predictionZ-scores of plasma protein abundance at diagnosis (T1) were used to construct binary logistic regression classifier to predict patient
group assignment at T3 using the scikit-learn package (Pedregosa et al., 2011). Analytes were initially filtered for the top n=15
markers based on the average feature weight. The use of n=15 was determined via an elbow plot based method of ranking against
weight factor. This was quantified by fitting an ExtraTreesClassifier on 75% of patients and querying for feature importance of each
plasma protein marker. Marker robustness was confirmed by repeating this analysis for 1000 iterations via sklearn’s StratifiedShuf-
fleSplit cross-validation object. The top 15 markers that performed well across all iterations and all combos (measured via the mean
feature importance) were selected to test five-marker combinations of plasma protein markers.
Each five-marker combination was cross-validated via 10 iterations (using the cross-validation object StratifiedShuffleSplit) with a
train size of 75% and test size of 25%. Models were instantiated with a random state of 0 and selected using GridSearchCV which
optimize the C parameter from 10-2 to 1013 on a log scale. GridSearchCv also used a 10 fold cross-validation StratifiedShuffleSplit
object (stratification via true patient group assignment). AUC scores were quantified via sklearn’s roc_curve and auc methods.
e9 Cell 185, 881–895.e1–e10, March 3, 2022

llOPEN ACCESSArticle
Machine learning for survival predictionThe five-markers used to predict T3 patient group assignment were split into one and two marker combinations and interrogated in
the samemanner as the five-marker combinations for patient groups in ‘‘Machine learning for patient group prediction’’ with death or
no death as the labels. An independent cohort of patients (SJCI) was used to validate survival predictions by taking the same set of
cross-validated models (the 10 logistic regression classifiers trained via the 10 subsets of INCOV data) and scoring the entire SJCI
cohort. Average ROC and standard error were plotted in the same manner as well for both the INCOV and SJCI cohort.
Single-cell BCR & RNA-seq integrationAnnotations from sc-RNA-seq were used to define B cell subtypes in the sc-BCR data. Somatic hypermutation rates (SHM) were
defined as the percentages of gaps and mismatches in the variable region of the query contig sequence compared to the top germ-
line V gene hit identified through IgBLAST (Ye et al., 2013). Filtered contig outputs from the 10x Genomics Cell Ranger pipeline were
used as input to the R package Immunarch (ImmunoMind Team, 2019) to assign clonotypes to memory B cells for each T3 blood
draw for calculation of isotype usage in Figure S5.
Cell 185, 881–895.e1–e10, March 3, 2022 e10
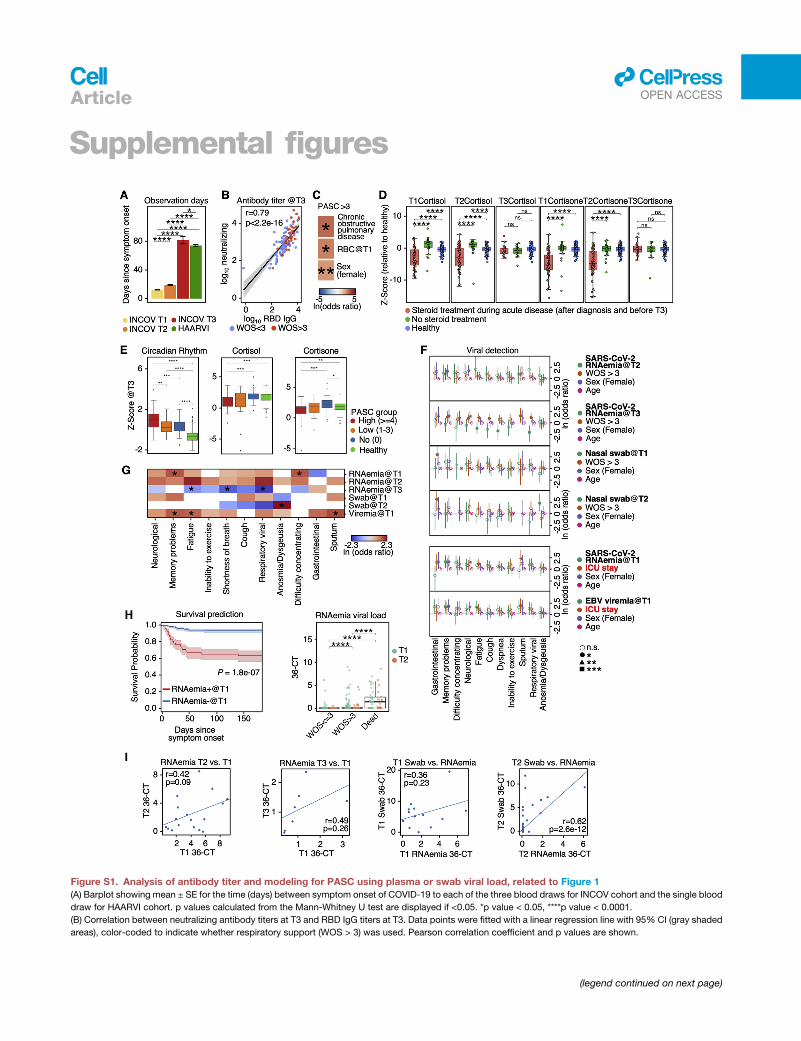
Supplemental figures
Figure S1. Analysis of antibody titer and modeling for PASC using plasma or swab viral load, related to Figure 1
(A) Barplot showing mean ± SE for the time (days) between symptom onset of COVID-19 to each of the three blood draws for INCOV cohort and the single blood
draw for HAARVI cohort. p values calculated from the Mann-Whitney U test are displayed if <0.05. *p value < 0.05, ****p value < 0.0001.
(B) Correlation between neutralizing antibody titers at T3 and RBD IgG titers at T3. Data points were fitted with a linear regression line with 95% CI (gray shaded
areas), color-coded to indicate whether respiratory support (WOS > 3) was used. Pearson correlation coefficient and p values are shown.
(legend continued on next page)
llOPEN ACCESSArticle
(C) Heatmap showing the ln(odds ratio) for only the significant associations between pre-existing conditions and clinical measurements from EHR, and
PASC R 4, adjusted for age, sex, and disease severity (WOS > 3). p values calculated from Mann-Whitney U test are displayed if <0.05. *p value < 0.05,
**p value < 0.01.
(D) Boxplots showing plasma cortisone (left) and cortisol (right) levels at T1, T2, or T3 in patient with and without steroid treatment during COVID-19 infection.
p values calculated from the Mann-Whitney U test are displayed if <0.05. *p value < 0.05, **p value < 0.01, ***p value < 0.001, and ****p value < 0.0001.
(E) Boxplots showing plasma protein-based ‘‘negative regulation of the circadian rhythm’’ pathway enrichment (left), cortisol (middle), and cortisone (right)
levels from healthy individuals (green), T3 patients presenting R4 PASC (red), 1–3 PASC (orange), and no PASC (blue). *p value < 0.05, **p value < 0.01,
***p value < 0.001, and ****p value < 0.0001.
(F) Forest plot showing ln(odds ratio) with 95% CI for associations between PASCs and variables, including SARS-CoV-2 RNAemia at T2 or T3 (top two panels)
and nasal-swab viral loads at T1 and T2 (top five panels), calculated from logistic regressionmodels, with each association/model accounting for disease severity
(WOS > 3), sex, and age. Associations between PASC and SARS-CoV-2 RNAemia at T1 or EBV viremia at T1 accounting for ICU stay instead of WOS > 3 are
shown (bottom two panels). p values are displayed in asterisks if <0.05. *p value < 0.05, **p value < 0.01, and ***p value < 0.001.
(G) A summary heatmap showing associations between various SARS-CoV-2 viral load measurements and PASC, accounted for sex, age, and disease severity
(WOS > 3). Each rectangle represents the ln(odds ratio) determined through multi-variate logistic regression. p values are displayed if <0.05. *p value < 0.05.
(H) Left: Kaplan-Meier curves for patient survival stratified by positive (cycle threshold [CT] < 36) or negative for RNAemia at T1. Right: boxplot showing the
RNAemia viral load expressed as (36-CT) of patients with different disease severities (WOS % 3, WOS > 3 [not including dead], or dead) at T1 (green) and T2
(orange). ****p value < 0.0001.
(I) Scatter plots fitted with linear regression lines showing correlations between RNAemia measurements at different time point (left two panels), as well as
correlations between RNAemia and nasal-swab viral loads (right two panels). Pearson correlation coefficients and p values are displayed.
llOPEN ACCESS Article

Figure S2. Auto-antibodies anticorrelate with anti-SARS-CoV-2 antibodies and are associated with distinct patterns of PASC, related to
Figure 2
(A) UMAP visualization of single B cells color-coded by Leiden clusters (top left) and selected gene transcript levels (other panels).
(B) Heatmap showing the odds ratio (color-coded) and p values (shown in numbers) from Fisher’s exact test to determine the dependence of column and row
variables.
(C) Boxplot showing titers of SARS-CoV-2 spike RBD antibodies in healthy, INCOV, and HAARVI at convalescence (T3 for INCOV, and 2–3 months post infection
for HAARVI). p values calculated from the Mann-Whitney U test are displayed. **p value < 0.01, and ****p value < 0.0001
(D) Hierarchical clustered heatmap showing log2-fold change of T3 autoantibody levels in patients with a specific PASC (rows) compared to those without.
p values calculated from the Mann-Whitney U test are displayed if <0.05. *p value < 0.05, **p value < 0.01.
(legend continued on next page)
llOPEN ACCESSArticle

(E) Boxplots showing all significant PASC- autoantibody (T1) relationships in Figure 2C. The percentages of patients with a given PASC that had autoantibody
levels greater than themedian antibody level of those who did not present the PASC are shown. p values calculated from theMann-Whitney U test are displayed if
<0.05. *p value < 0.05, **p value < 0.01.
(F) Heatmap showing associations between T1 autoantibody measurements and PASC, accounted for sex, age, and disease severity (left: WOS > 3, right: ICU).
Each rectangle represents the ln(odds ratio) determined throughmulti-variate logistic regression. p values are displayed if <0.05. *p value < 0.05, **p value < 0.01.
(G) Bar plots showing mean ± SE somatic hypermutation rates in CDR regions of the heavy chain in different B cell populations. p values calculated fromMann-
Whitney U test then corrected as FDR via the Benjamini-Hochberg method are displayed if FDR < 0.05. *FDR < 0.05, ****FDR < 0.0001.
(H) Associations between phenotype percentages as measured for all three time points (columns) and PASC (rows). The immune cell class is color-coded on the
top row, and themeasurement time point is color coded on the second row. Enrichment is quantified as log2-fold changes between patients with PASC compared
with those without. These are colored as red for positive, blue for negative, and statistically non-significant fold changes are shown as gray (p R 0.05).
llOPEN ACCESS Article
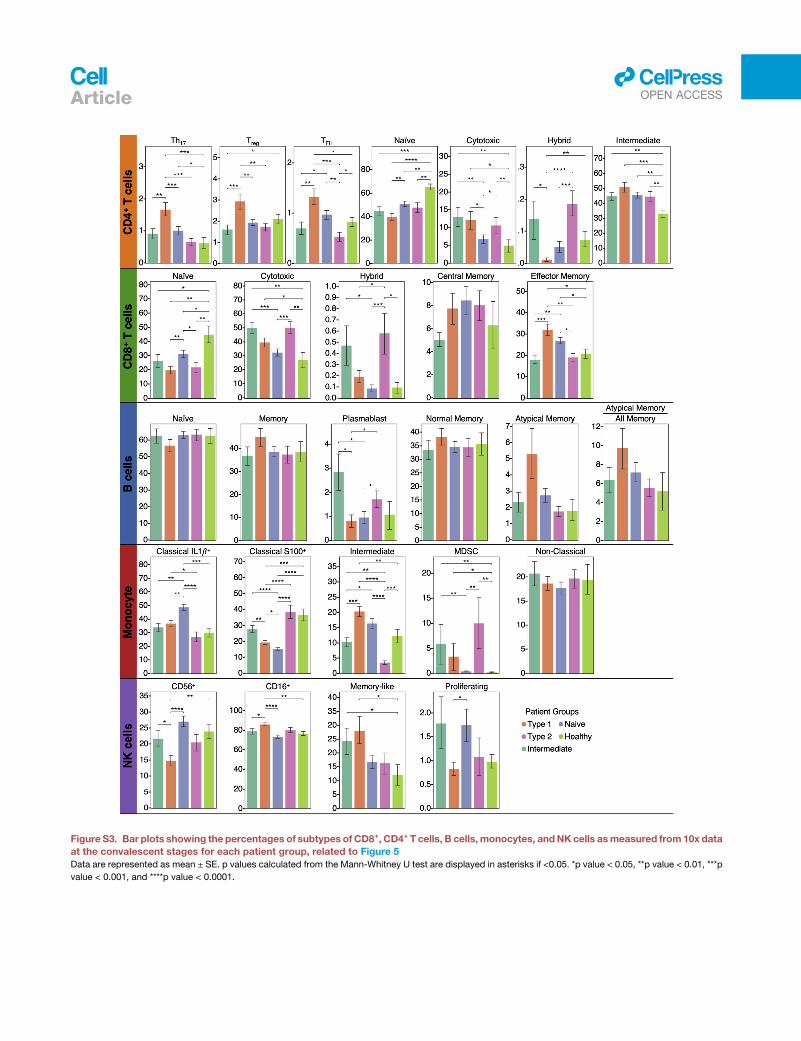
Figure S3. Bar plots showing the percentages of subtypes of CD8+, CD4+ T cells, B cells, monocytes, andNK cells asmeasured from 10x data
at the convalescent stages for each patient group, related to Figure 5
Data are represented as mean ± SE. p values calculated from the Mann-Whitney U test are displayed in asterisks if <0.05. *p value < 0.05, **p value < 0.01, ***p
value < 0.001, and ****p value < 0.0001.
llOPEN ACCESSArticle
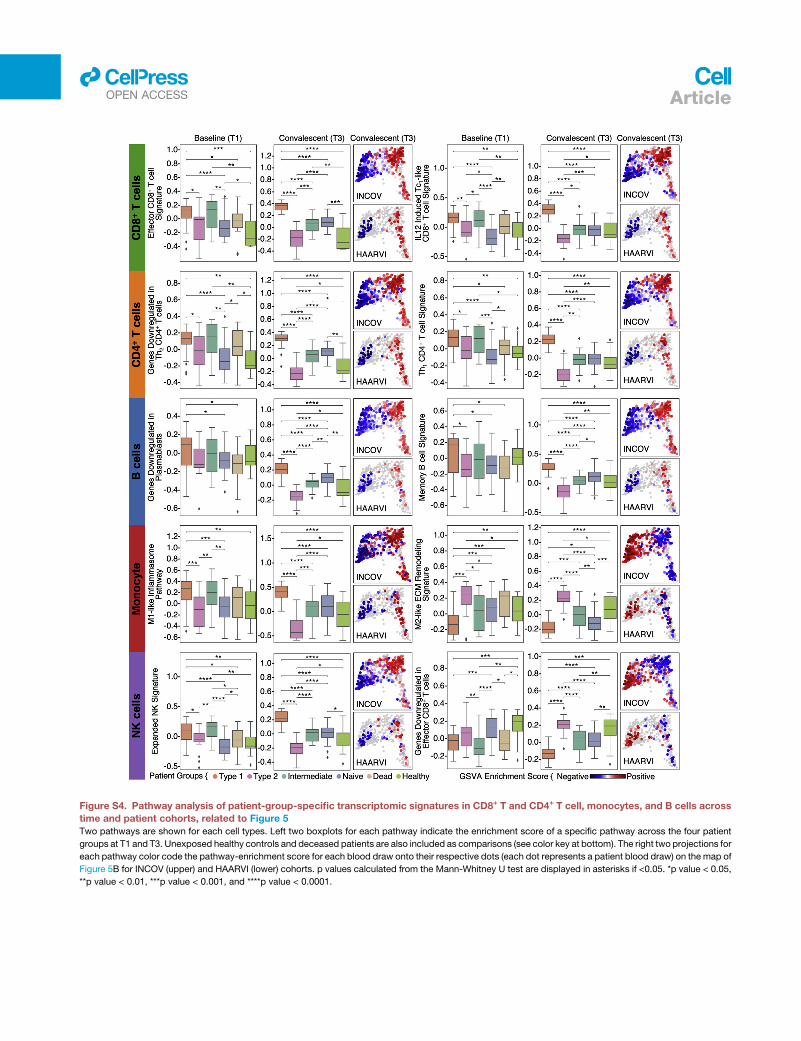
Figure S4. Pathway analysis of patient-group-specific transcriptomic signatures in CD8+ T and CD4+ T cell, monocytes, and B cells across
time and patient cohorts, related to Figure 5
Two pathways are shown for each cell types. Left two boxplots for each pathway indicate the enrichment score of a specific pathway across the four patient
groups at T1 and T3. Unexposed healthy controls and deceased patients are also included as comparisons (see color key at bottom). The right two projections for
each pathway color code the pathway-enrichment score for each blood draw onto their respective dots (each dot represents a patient blood draw) on the map of
Figure 5B for INCOV (upper) and HAARVI (lower) cohorts. p values calculated from the Mann-Whitney U test are displayed in asterisks if <0.05. *p value < 0.05,
**p value < 0.01, ***p value < 0.001, and ****p value < 0.0001.
llOPEN ACCESS Article
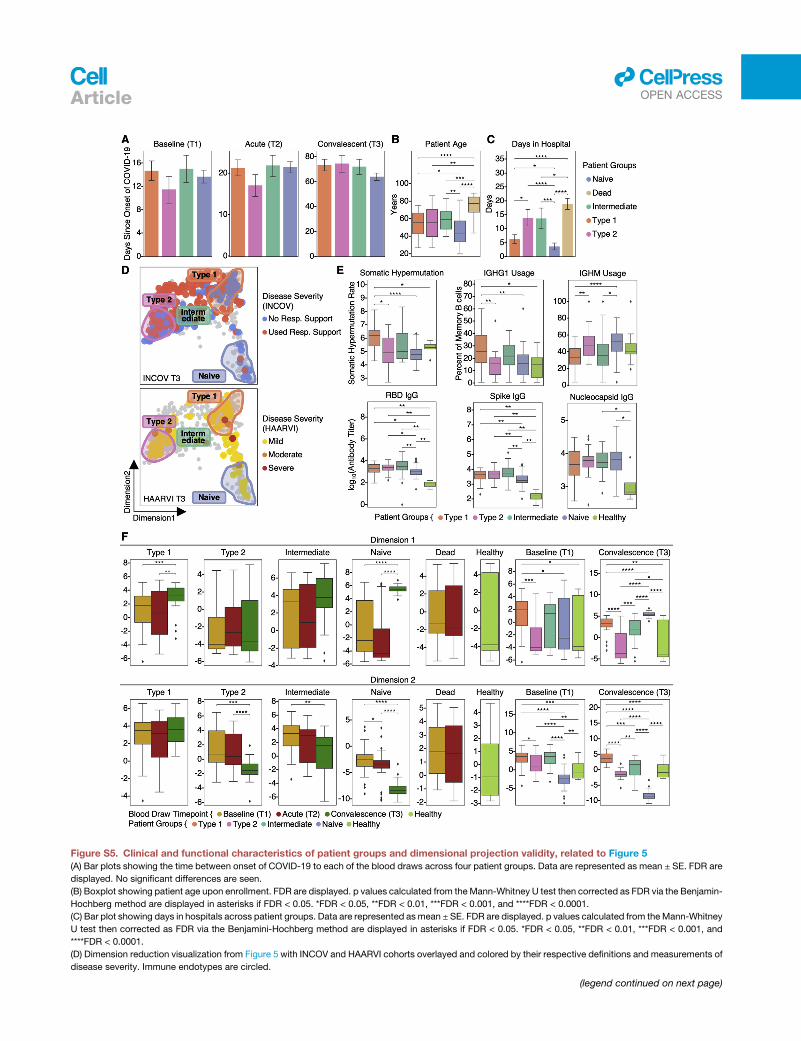
Figure S5. Clinical and functional characteristics of patient groups and dimensional projection validity, related to Figure 5
(A) Bar plots showing the time between onset of COVID-19 to each of the blood draws across four patient groups. Data are represented as mean ± SE. FDR are
displayed. No significant differences are seen.
(B) Boxplot showing patient age upon enrollment. FDR are displayed. p values calculated from theMann-Whitney U test then corrected as FDR via the Benjamin-
Hochberg method are displayed in asterisks if FDR < 0.05. *FDR < 0.05, **FDR < 0.01, ***FDR < 0.001, and ****FDR < 0.0001.
(C) Bar plot showing days in hospitals across patient groups. Data are represented asmean ± SE. FDR are displayed. p values calculated from theMann-Whitney
U test then corrected as FDR via the Benjamini-Hochberg method are displayed in asterisks if FDR < 0.05. *FDR < 0.05, **FDR < 0.01, ***FDR < 0.001, and
****FDR < 0.0001.
(D) Dimension reduction visualization from Figure 5 with INCOV and HAARVI cohorts overlayed and colored by their respective definitions and measurements of
disease severity. Immune endotypes are circled.
(legend continued on next page)
llOPEN ACCESSArticle

(E) Boxplot showing somatic hypermutation (SHM) rates in memory B cells (upper left), percentages of IGHG1 (upper middle) and IGHM (upper right) memory
B cell clones over all memory B cell clones, and RBD (lower left), spike (lower middle), and nucleocapsid (lower right) IgG log10(titers) for patients at T3.
*p value < 0.05, **p value < 0.01, ***p value < 0.001, and ****p value < 0.0001.
(F) Boxplot showing the dimension-1 (y axis of top row) and dimension-2 (y axis of bottom row) values of four patient groups controls across time points in
comparison with dead patients and unexposed healthy. p values calculated from Mann-Whitney U test are displayed in asterisks if <0.05. *p value < 0.05,
**p value < 0.01, ***p value < 0.001, and ****p value < 0.0001.
llOPEN ACCESS Article
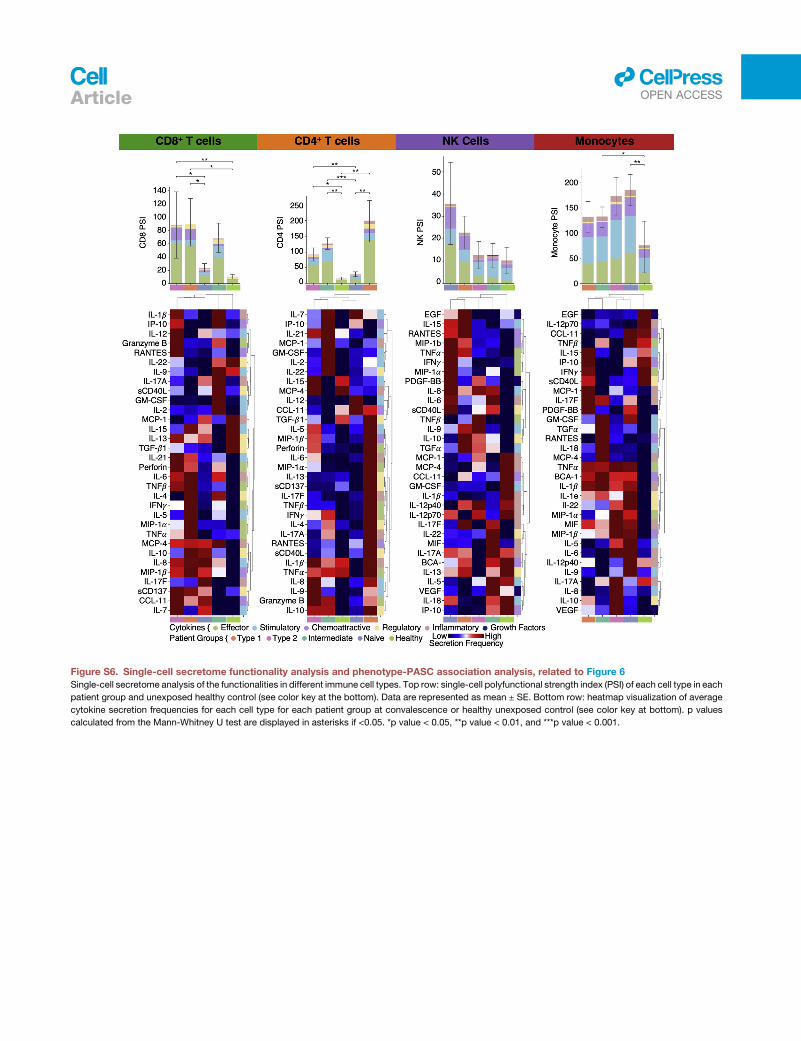
Figure S6. Single-cell secretome functionality analysis and phenotype-PASC association analysis, related to Figure 6
Single-cell secretome analysis of the functionalities in different immune cell types. Top row: single-cell polyfunctional strength index (PSI) of each cell type in each
patient group and unexposed healthy control (see color key at the bottom). Data are represented as mean ± SE. Bottom row: heatmap visualization of average
cytokine secretion frequencies for each cell type for each patient group at convalescence or healthy unexposed control (see color key at bottom). p values
calculated from the Mann-Whitney U test are displayed in asterisks if <0.05. *p value < 0.05, **p value < 0.01, and ***p value < 0.001.
llOPEN ACCESSArticle

Figure S7. Machine learning model evaluation and multi-omic PASC associations, related to Figure 5
(A) Receiver operating characteristic curves, per cross-validation (CV) iteration, for pair-wise classification (see subtitles) based upon the levels of five markers at
T1 for different validation pairs. Area under the curve (AUC) values for different CVs (in different colors) are displayed.
(B) The four axes of the radar plot indicate the enrichment score for four sets of PASC at T3 for each immune endotype.
(C) Receiver operating characteristic curve for survival prediction based on T1 plasma CTSL levels for the INCOV cohort (upper) and validation of the model
trained using the INCOV cohort with T1 plasma CTSL levels from an independent cohort (SJCI) (lower).
llOPEN ACCESS Article