Burkina Faso Labor Inspection Training on Child Labor, Facilitator's ...
Upload
khangminh22Category
view
4download
0
The Socio Economic Impacts of COVID-19 in Burkina Faso Results from a High Frequency Phone Survey of Households
Round 1
August 12, 2020

Background
• The Covid-19 – a respiratory disease caused by a novel coronavirus – which was detected in Wuhan, China in December 2019 became a pandemic in early March 2020, impacting societies and the economy at a global scale.
• Burkina Faso confirmed the first patient on March 9th, 2020.
• As of August 9th, 2020, the country has a total of 1,213 confirmed cases.
• Luckily the country experienced only 54 deaths and 995 patient recoveries, as a result, as of August 9th, 2020, there are only 164 active cases.
Source: https://burkinafaso.opendataforafrica.org/covid-19?lang=fr
COVID-19 CASES IN BURKINA FASO
0
200
400
600
800
1000
1200
30-Jan 19-Feb10-Mar30-Mar19-Apr 9-May29-May18-Jun 8-Jul 28-Jul 17-Aug
Nu
mb
er o
f p
eop
le
Total Cases
Active cases

Background (cont.)To contain the pandemic, the Government took social distancing measures…
• These measures include:
oMovement & Visa restrictions
o Schools closure
oHealth screenings in airports and
border crossings
…resulting in limited mobility
Source: Burkina Faso COVID-19 Mobility Factsheet (David Newhouse et al.; July, 2020)

Background (cont.)
• Though the human cost of Covid-19 in Burkina Faso is still limited, the immediate economic cost is likely to be significant.
• The WB is projecting a negative growth due to the COVID-19.
• Beyond the health response, the Authorities are yet to design and implement emergency measures to mitigate socio-economic impact of COVID-19.
• Other countries around the World are taking bold actions such as:• Scaling up of existing social protection
• Providing unemployment benefits
• tax relief
• Etc.
4
World Bank GDP growth projections in 2020
Source: World Bank, Economic Update (June 2020)
2.0
0.5
0.1
2.1
-0.7
-3.3
-0.3
-1.4
-0.8 -0.8
-4.0
-3.0
-2.0
-1.0
0.0
1.0
2.0
3.0
- Agriculture Industry Services Net taxes
GDP growth Contribution to GPD growth
No Shock Pessimist scenario

Objectives of the High Frequency Phone Survey of Households
• To monitor the socio-economic impacts of the COVID-19 pandemic with a focus on earnings, employment, health, education, food security, as well as copping strategy, including safety nets.
• The survey instrument was designed to be country specific, but also to allow for international comparisons given that the WB has launched similar initiatives in several countries around the World.
• The WB worked jointly with the Institut National de la Statistique et de la Démographie (INSD) for the design and implementation of the survey.
• Data collection for the 1st round (which is the subject of this presentation) took place between June 9th and July 1st, 2020.

Key Findings (I)
Knowledge and Behavior
• Majority of respondents have a good knowledge of social distancing and preventive measures that one can adopt to reduce the risk of infection with COVID-19.
• …and they frequently apply these preventive measures and recommended social behaviors.
• Respondents are not aware of all actions taken by authorities to curb the spread of the virus; only four actions are named by the majority: closure of markets, yaars, restaurants and bars; closure of places of worship; curfew/lockdown; and ban on gathering of 50 people or more.
Access to food, education and health services
• About 1 in 4 households reports that at some point during covid-19, they were unable to access basic food. Unavailability of staple foods was driving mainly by maize, particularly in the southern part of Burkina Faso. A wide range of reasons prohibited access to food: market closure, price increase, limited stock, and lack of transport means. Transport issues are mainly in Ouagadougou; price issues are more severe for poor households.
• A high proportion (9 in 10) of students remain intellectually active during the Covid-19. They are leveraging mainly on ICT (53.4%).
• Only 1 in 4 students is in touch with his/her teacher. Despite a need for social distancing, most of those in touch with their teacher are maintaining physical contact, especially those in other urban/rural and the poor. Use of ICT as communication tool is more pronounced in Ouagadougou and for non-poor.
• Since March 16th, 2 in 5 households declared that they needed health service, mainly because of malaria/fever. The vast majority of those who needed health services were able to get treatment, a sign that there was no disruption in the provision of health services. It is important to note that the questionnaire is not very clear, so treatment could include “traditional treatment”, and/or “self-treatment”.
• A combination of supply and demand factors affect ability to access health services when needed; but affordability represents the biggest constraint, especially for the poor.

Key Findings (II)
Employment and Income
• Around 10% of respondents used to work before the Covid-19 outbreak but are not working now. Fear of Covid-19 is the second most important reason for stopping work.
• The economic slowdown due to the COVID-19 has translated in an economywide reduction of income; most employees, non-farm businesses and farm activities experienced a reduction of income.
• Wage earners who were not able to work as usual were directly affected by reduction of their income as they were not paid.
• The vast majority of non-farm businesses (72.5%) experienced a reduction of income since March 16th. Non-farm businesses operating in industry and services were most affected. Closure due to Covid-19 and lack of customer are the main reasons for the lower income of non-farm businesses.
• Since mid-March, most farmers (90.1%) are having difficulties in their activities mainly due to seasonality and Covid-19 related restrictions.
• Close to half of farmers reports a reduction of prices at which they sale their products. WFP reported in April that food items prices were generally stable despite increase in transport costs. Lower farm gate prices, higher transport costs and stable market prices, point to a possible transmission of increase transport costs to farmers. It means the way COVID affects prices along the value chain will mainly harms farmers (or net producers).
• About 1 in 5 households used to receive remittances from family/friends, and for most, the amount received has reduced since the Covid-19 outbreak.

The Survey
8

Methodology
9
Approach
A phone survey using a sub-sample of the valid household phone numbers (6,877 households out of 7,010 have valid phone numbers) gathered as part of the 2018/19 Harmonized Living Conditions Household Survey (EHCVM).
Sample size
To account for non-response and attrition, 2,500 households were selected out of which 2,062 were contacted; and survey was successfully completed for 1,968 households were fully interviewed during the first round of interviews (82.5% response rate).
Coverage National, Ouagadougou, other urban, and rural areas.
Survey period June 9th to July 1st, 2020 (First of 12 Survey Rounds)
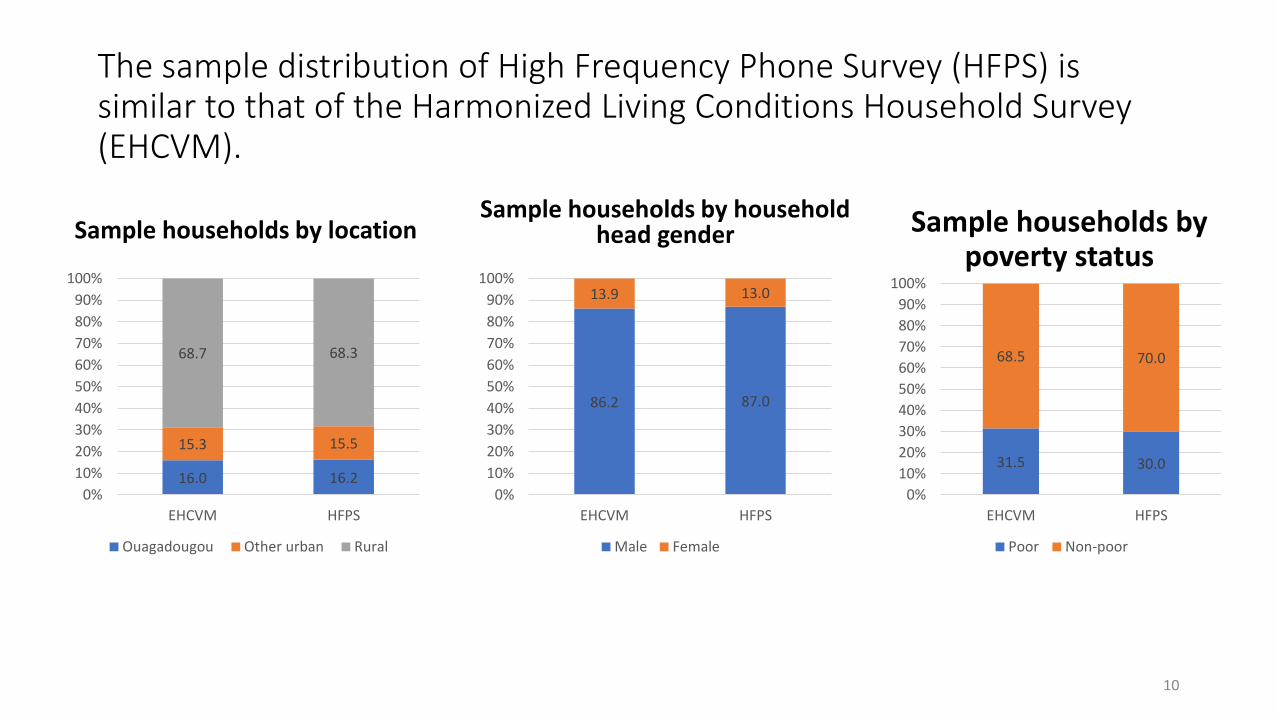
The sample distribution of High Frequency Phone Survey (HFPS) is similar to that of the Harmonized Living Conditions Household Survey (EHCVM).
Sample households by locationSample households by household
head gender
10
16.0 16.2
15.3 15.5
68.7 68.3
0%
10%
20%
30%
40%
50%
60%
70%
80%
90%
100%
EHCVM HFPS
Ouagadougou Other urban Rural
86.2 87.0
13.9 13.0
0%
10%
20%
30%
40%
50%
60%
70%
80%
90%
100%
EHCVM HFPS
Male Female
Sample households by poverty status
31.5 30.0
68.5 70.0
0%
10%
20%
30%
40%
50%
60%
70%
80%
90%
100%
EHCVM HFPS
Poor Non-poor

Implementation plan
Baseline (Round 1)
June 9th to July 1st, 2020
Follow-up (Round 2)
July-August 2020
Follow-up (Rounds 3,4,…,12)
Monthly until May 2020
11

Knowledge & Behavior
12

Majority of respondents have good knowledge of preventive measures & recommended social behaviors
97.7
97.6
96.3
95.0
94.0
92.1
91.5
86.9
0.0 10.0 20.0 30.0 40.0 50.0 60.0 70.0 80.0 90.0 100.0
Handwashing /Use of sanitizer
Use of mask/gloves
No Handshake or physical greetings
Avoid crowded places or gatherings with many people
Maintain enough distance of at least 1 meter
Avoid travel
Staying at home and avoid going out unless necessary
Avoiding touching your face
“What steps can you take to reduce the risk of infection with coronavirus?”

….with little differences by location
0.0 10.0 20.0 30.0 40.0 50.0 60.0 70.0 80.0 90.0 100.0
Handwashing /Use of sanitizer
Use of mask/gloves
No Handshake or physical greetings
Avoid crowded places or gatherings with many people
Maintain enough distance of at least 1 meter
Avoid travel
Staying at home and avoid going out unless necessary
Avoiding touching your face
Ouagadougou Other urban Rural
“What steps can you take to reduce the risk of infection with coronavirus?”

….with little differences across welfare distribution
0.0 10.0 20.0 30.0 40.0 50.0 60.0 70.0 80.0 90.0 100.0
Handwashing /Use of sanitizer
Use of mask/gloves
No Handshake or physical greetings
Avoid crowded places or gatherings with many people
Maintain enough distance of at least 1 meter
Avoid travel
Staying at home and avoid going out unless necessary
Avoiding touching your face
Non-poor Poor
“What steps can you take to reduce the risk of infection with coronavirus?”

…and they frequently apply these preventive measures & recommended social behaviors.
97.8 95.0 93.2
2.2 5.0 5.90.0 0.0 0.9
0%
10%
20%
30%
40%
50%
60%
70%
80%
90%
100%
Frequently washing hands No Handshake or physical greetings Avoid groups/gatherings of more than 10 people
Yes No Not applicable
“Since March 09, 2020, are you applying any of the following preventive measures or social behavior?”

…with very little difference across location and poverty status.
Some minor differences on handshaking and crowding between urban and rural areas (esp. Ouagadougou)
…Some minor differences on handshaking and crowding as well between poor and non-poor
98.5 97.6 97.7 92.5 97.0 95.2 88.3 93.4 94.3
1.5 2.5 2.3 7.5 3.0 4.9 9.9 5.4 5.10.0 0.0 0.0 0.0 0.0 0.0 1.8 1.2 0.6
0%10%20%30%40%50%60%70%80%90%
100%
Ou
agad
ou
gou
Oth
er u
rban
Ru
ral
Ou
agad
ou
gou
Oth
er u
rban
Ru
ral
Ou
agad
ou
gou
Oth
er u
rban
Ru
ral
Frequently washinghands
No Handshake orphysical greetings
Avoidgroups/gatherings ofmore than 10 people
Yes No Not applicable
97.8 97.8 94.3 96.6 92.7 94.5
2.2 2.2 5.7 3.4 6.4 4.80.0 0.0 0.0 0.0 1.0 0.7
0%
10%
20%
30%
40%
50%
60%
70%
80%
90%
100%
Non-poor Poor Non-poor Poor Non-poor Poor
Frequently washinghands
No Handshake orphysical greetings
Avoidgroups/gatherings ofmore than 10 people
Yes No Not applicable
“Since March 09, 2020, are you applying any of the following preventive measures or social behavior?”

Respondents are not aware of all actions taken by authorities to curb the spread of the virus; only four actions are named by the majority
61.6
55.6
53.8
52.1
41.1
31.1
26.1
22.7
16.9
14.7
13.7
7.8
0.0 10.0 20.0 30.0 40.0 50.0 60.0 70.0
Closure of markets, yaars, restaurants and bars
Closure of places of worship
Curfew/lockdown
Ban on gathering of 50 people or more
Closure of schools and universities
Restricted domestic travels
Advised citizens to stay at home
Closure of airports / transport companies
Quarantine of affected cities
Restricted international travels
Closure of non-essential businesses
Other
“What steps has the government/local authorities taken to curb the spread of the coronavirus in your area?”

…with some differences across location and poverty status
0.0 10.0 20.0 30.0 40.0 50.0 60.0 70.0
Closure of markets, yaars,…
Closure of places of worship
Curfew/lockdown
Ban on gathering of 50 people or…
Closure of schools and universities
Restricted domestic travels
Advised citizens to stay at home
Closure of airports / transport…
Quarantine of affected cities
Restricted international travels
Closure of non-essential businesses
Other
Ouagadougou Other urban Rural
0.0 10.0 20.0 30.0 40.0 50.0 60.0 70.0
Closure of markets, yaars,…
Closure of places of worship
Curfew/lockdown
Ban on gathering of 50 people or…
Closure of schools and universities
Restricted domestic travels
Advised citizens to stay at home
Closure of airports / transport…
Quarantine of affected cities
Restricted international travels
Closure of non-essential businesses
Other
Non-poor Poor
“What steps has the government/local authorities taken to curb the spread of the coronavirus in your area?”

Access to food & Social Services
20

About 1 in 4 households reports that at some point during covid-19, they were unable to access basic food
25.5
18.3
24.6
21.5
29.6
23.9
0.0
5.0
10.0
15.0
20.0
25.0
30.0
35.0
Ouagadougou Other urban Rural Non-poor Poor
Location Poverty status All
“Since march 16, 2020, was your household able to buy staple food ?” (share saying No)
Given the consumption habits, the staple foods considered for this study are:• For Ouagadougou: Imported rice/Maize in grain/Corn floor• For other urban areas: Maize in grain / Imported rice /Local rice• For rural areas: Maize in grain /Sorghum/Millet

Unavailability of staple foods was driving mainly by maize (in grain or flour), particularly in the southern part of Burkina Faso
33.143.0
31.4
52.4
31.120.7
14.3
11.9
5.3
6.6
8.2
6.0
52.645.1
63.3
41.1
60.7
73.3
0%
10%
20%
30%
40%
50%
60%
70%
80%
90%
100%
Maize flour Maize in grain Millet Imported rice Local rice Sorghum
Able Unable Not tried
“Since march 16, 2020, was your household able to buy staple food ?”

A wide range of reasons prohibited access to food: market closure, price increase, limited stock, and lack of transport means. Transport issues are mainly in Ouagadougou; price issues are more severe for poor households.
Reasons not being able to access basic food items varied across location and poverty status
35.441.4 37.4 41.4
32.637.5
25.9
31.0 37.520.5
55.535.9
8.5
27.6 24.2
32.5
10.7
22.930.1
0.0 0.0 5.2 0.0 2.9
0%
10%
20%
30%
40%
50%
60%
70%
80%
90%
100%
Ouagadougou Other urban Rural Non-poor Poor
Location Poverty status All
Local markets not operating / closed Increase in price Shops have run out of stock Limited / no transportation Restriction to go outside

A high proportion (9 in 10) of students remain intellectually active during the Covid-19. They are leveraging mainly on ICT (53%)
24.6
16.6
13.3
12.4
9.4
8.2
4.4
3.4
1.3
0.9
0.7
0.6
0.5
0.0
0.0 5.0 10.0 15.0 20.0 25.0 30.0
Listening to classroom instruction over the radio
Watching classroom instruction via television
Tutoring by another member of the household
No activities
Educational television programs watched
Other completed print jobs
Tutoring by a private tutor
Completed printed assignments provided by the teacher
They continue to frequent the Daara.
Participated in virtual classes with teacher
Completed online assignments provided by the teacher
Watch lessons pre-recorded by teacher online
Mobile learning applications used
Other completed online assignments
What types of educational activities have these children who were in school been engaged in since the educational structures were closed?

Location and poverty status do matter in the way students engage in learning activities. This can be explained by the spatial pattern of electricity coverage and asset ownership (urban/non-poor people have higher chance to own a TV, while rural/poor people own radio).
Those in Ouagadougou are more likely to rely on tutoring by another family member; and those in other urban/rural areas are more likely to do nothing or to rely on radio. The use of TV is more pronounced in urban areas.
Non-poor students are more likely to rely on TV, tutoring by another family member, and private tutor.
What types of educational activities have these children who were in school been engaged in since the educational structures were closed?
0.0 5.0 10.0 15.0 20.0 25.0 30.0 35.0
Listening to classroom instruction overthe radio
Watching classroom instruction viatelevision
Tutoring by another member of thehousehold
No activities
Educational television programswatched
Other completed print jobs
Tutoring by a private tutor
Completed printed assignmentsprovided by the teacher
Ouagadougou Other urban Rural
0.0 5.0 10.0 15.0 20.0 25.0 30.0
Listening to classroom instruction overthe radio
Watching classroom instruction viatelevision
Tutoring by another member of thehousehold
No activities
Educational television programs watched
Other completed print jobs
Tutoring by a private tutor
Completed printed assignmentsprovided by the teacher
Non-poor Poor

Only 1 in 4 students is in touch with his/her teacher
Proportion of students that remain in touch with their teacher
Despite a need for social distancing, most of those in touch with their teacher are
maintaining physical contact
16.5
20.419.1
17.8
20.8
18.4
0.0
5.0
10.0
15.0
20.0
25.0
OuagadougouOther urban Rural Non-poor Poor
Location Poverty status All
76.3
26.3
5.3
4.6
1.0
0.6
0.4
0.3
0.0 10.0 20.0 30.0 40.0 50.0 60.0 70.0 80.0 90.0
Physical contact
Telephone (audio)
SMS
Online applications

Those is other urban/rural and the poor are more likely to keep physical contact with their teacher. Use of ICT as communication tool is more pronounced in Ouagadougou and for non-poor.
Mean of communication with the teacher by location
Mean of communication with the teacher by poverty status
0.0 20.0 40.0 60.0 80.0 100.0
Physical contact
Telephone (audio)
SMS
Online applications
Ouagadougou Other urban Rural
0.0 20.0 40.0 60.0 80.0 100.0
Physical contact
Telephone (audio)
SMS
Online applications
Non-poor Poor

Despite the COVID-19, most households (49.1%) declared that they were able to buy medicine; however 1 in 4 households were unable to do so.
59.154.0
45.650.4 46.0 49.1
31.9
21.426.7
25.828.8 26.7
9.1
24.6 27.7 23.8 25.2 24.2
0%
10%
20%
30%
40%
50%
60%
70%
80%
90%
100%
Ouagadougou Other urban Rural Non-poor Poor
Location Poverty status All
Able Unable Not tried
“Since March 16th, was your household able to buy drugs? ”

Since March 16th, 2 in 5 households declared that they needed health service, mainly because of malaria/fever
Proportion of households that needed health services
36.5
45.6
42.0 42.240.3
41.6
0.0
5.0
10.0
15.0
20.0
25.0
30.0
35.0
40.0
45.0
50.0
OuagadougouOther urban Rural Non-poor Poor
Location Poverty status All
Main reasons for seeking care
65.3
17.0
11.4
8.5
4.8
4.6
3.7
1.1
0.8
0.0
0.0
0.0 10.0 20.0 30.0 40.0 50.0 60.0 70.0
Fever/Malaria
Other
Stomach problems
Sore throat, cough, cold, flu
Diarrhea
Blood pressure problem
Dental/skin/eye problem
Diabetes
Typhoid Fever
COVID19
Meningite

Reason for seeking care is quite similar across location and poverty status, but fever/malaria is slightly more predominant in rural areas
Reason for seeking care by locationReason for seeking care by poverty
status
0.0 10.0 20.0 30.0 40.0 50.0 60.0 70.0 80.0
Fever/Malaria
Other
Stomach problems
Sore throat, cough, cold, flu
Diarrhea
Blood pressure problem
Dental/skin/eye problem
Diabetes
Typhoid Fever
COVID19
Meningite
Ouagadougou Other urban Rural
0.0 10.0 20.0 30.0 40.0 50.0 60.0 70.0 80.0
Fever/Malaria
Other
Stomach problems
Sore throat, cough, cold, flu
Diarrhea
Blood pressure problem
Dental/skin/eye problem
Diabetes
Typhoid Fever
COVID19
Meningite
Non-poor Poor

The vast majority of those who needed health services were able to get treatment, a sign that there was no disruption in the provision of health services.
95.6 98.2 99.3 98.1 99.9 98.6
0.0
10.0
20.0
30.0
40.0
50.0
60.0
70.0
80.0
90.0
100.0
Ouagadougou Other urban Rural Non-poor Poor
Location Poverty status All
Note: Questionnaire not very clear, so treatment could include “traditional treatment”, and/or “self-treatment”

A combination of supply and demand factors affect ability to access health services when needed; but affordability represents the biggest constraint, especially for the poor
34.5
75.6 73.0
54.8
100.0
56.2
18.7
20.4 27.0
22.5
0.0
21.9
46.7
4.1 0.0
22.7
0.0
22.0
0%
10%
20%
30%
40%
50%
60%
70%
80%
90%
100%
Ouagadougou Other urban Rural Non-poor Poor
Location Poverty status All
Lack of money No medical staff available Refused due to lack of space
Why were you or the household member unable to access medical treatment?

Coverage of health insurance remains very low, with only 1 in 20 (6.6 percent) of households that are registered
9.4
4.3 4.4
7.0
0.9
5.2
0.0
1.0
2.0
3.0
4.0
5.0
6.0
7.0
8.0
9.0
10.0
Ouagadougou Other urban Rural Non-poor Poor
Location Poverty status All
Is your household registered with the CMU (universal health coverage) or with a mutual health insurance company?

Since March 16th, 2020, about 1 in 3 households needed a financial service; and the service was easily available to them
Proportion of households that needed to use a financial service
Proportion that was able to carry out the desired operation(s)
69.7
47.7
24.5
40.3
23.9
35.4
0.0
10.0
20.0
30.0
40.0
50.0
60.0
70.0
80.0
OuagadougouOther urban Rural Non-poor Poor
Location Poverty status All
97.4 98.6 97.1 97.4 98.0 97.5
0.0
10.0
20.0
30.0
40.0
50.0
60.0
70.0
80.0
90.0
100.0
OuagadougouOther urban Rural Non-poor Poor
Location Poverty status All

Employment & Income
35

Around 10 percent of respondents used to work before the Covid-19 outbreak but are not working now
65.9
78.083.9
79.1 82.3 80.1
13.5
12.99.5
10.511.1
10.720.6
9.1 6.6 10.4 6.6 9.2
0%
10%
20%
30%
40%
50%
60%
70%
80%
90%
100%
Ouagadougou Other urban Rural Non-poor Poor
Location Poverty status All
Currently working Stopped working (worked before March) Did not work before and after Covid-19 outbreak
Labor market situation before and after Covid-19 outbreak

Fear of Covid-19 is the second most important reason for stopping work
7.020.2
58.1
29.6
64.9
40.615.0
21.5
2.6
12.5
0.0
8.6
12.6
1.3
0.0
2.5
3.5
2.813.4 5.4
0.0
5.4
0.0
3.7
13.4 8.7 3.66.0
7.9
6.6
15.4 30.6 31.433.1
16.828.0
14.54.7 4.3 7.4 4.4 6.5
0%
10%
20%
30%
40%
50%
60%
70%
80%
90%
100%
Ouagadougou Other urban Rural Non-poor Poor
Location Poverty status All
Seasonal work Activity at standstill Staff reduction due to lack of activity
Temporarily absent Retirement Disease
In charge of sick relatives Prohibition of grouping Fear of covid19
Other
Reason for not working, for those who stopped working

3 in 5 workers are on their own account. However, in urban areas, an important proportion of workers are employees
51.857.8
63.7 62.6 58.0 61.2
1.3
8.6
31.2
18.934.8 23.837.7
29.0
2.3
14.2
4.211.1
8.52.7 0.9 2.6 1.4 2.2
0%
10%
20%
30%
40%
50%
60%
70%
80%
90%
100%
Ouagadougou Other urban Rural Non-poor Poor
Location Poverty status All
Own account In a family business On a farm Employee Apprentice/Intern
Status of occupation for those who are still working despite Covid-19

With 3 in 5 workers, agriculture is by far the most important sectorSector for those who are still working despite Covid-19
59.3
15.0
7.9
4.7
4.0
2.2
1.7
1.1
0.9
0.8
0.8
0.6
0.5
0.2
0.2
0.0 10.0 20.0 30.0 40.0 50.0 60.0 70.0
Agriculture
Commerce
Personal Services
Construction
Other
Public Administration
Education
Transport
Health
Manufacturing Branch
Mining extraction
Technical and scientific activities
Electricity/Water/Gas/Waste
Tourism
Banks, insurance, real estate
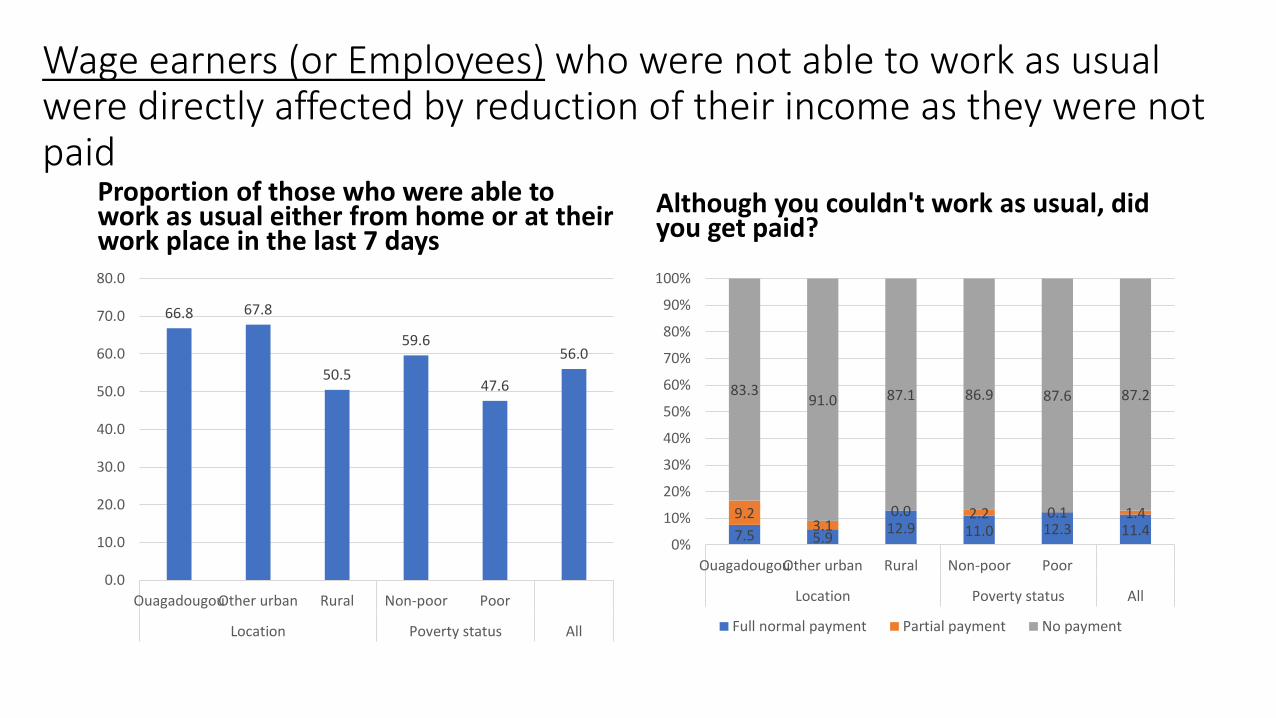
Wage earners (or Employees) who were not able to work as usual were directly affected by reduction of their income as they were not paid
Proportion of those who were able to work as usual either from home or at their work place in the last 7 days
Although you couldn't work as usual, did you get paid?
7.5 5.912.9 11.0 12.3 11.4
9.23.1
0.0 2.2 0.1 1.4
83.391.0 87.1 86.9 87.6 87.2
0%
10%
20%
30%
40%
50%
60%
70%
80%
90%
100%
OuagadougouOther urban Rural Non-poor Poor
Location Poverty status All
Full normal payment Partial payment No payment
66.8 67.8
50.5
59.6
47.6
56.0
0.0
10.0
20.0
30.0
40.0
50.0
60.0
70.0
80.0
OuagadougouOther urban Rural Non-poor Poor
Location Poverty status All

Wage earners in agriculture were less likely to work. This may have large implication for agriculture production in the near future. Payment issues, thus reduction of incomes, affected all sectors
Proportion of those who were able to work as usual either from home or at their work place in the last 7 days
Although you couldn't work as usual, did you get paid?
13.62.0
8.2 11.3
86.392.4 88.3 87.3
0%
10%
20%
30%
40%
50%
60%
70%
80%
90%
100%
Agriculture Industry Service All
Full normal payment Partial payment No payment
48.5
60.5
65.8
55.5
0.0
10.0
20.0
30.0
40.0
50.0
60.0
70.0
Agriculture Industry Service All

Entrepreneurship is very high, with half of households owning a non-farm business
40.9
56.5
46.9 46.549.4
47.4
54.2
64.6
44.5
52.9
40.8
49.1
0.0
10.0
20.0
30.0
40.0
50.0
60.0
70.0
Ouagadougou Other urban Rural Non-poor Poor
Location Poverty status All
HFPS ECVHM
Ownership of non-farm businesses by location and poverty status

Non-farm business: about 3 in 4 non-farm businesses are in services; the vast majority experienced a reduction of income since March 16th, especially those in industry and services
Distribution of non-farm businesses by sector
Evolution of non-farm businesses income since March 16th
5.4
19.4 15.5 14.5
52.9
76.475.6 72.5
37.0
4.05.2 9.5
4.8 0.2 3.7 3.5
0%
10%
20%
30%
40%
50%
60%
70%
80%
90%
100%
Agriculture Industry Service All
None Lower Identical Higher
Agriculture; 14.0
Industry; 9.2
Service; 76.9

Non-farm business: Differences across location and poverty status are minors.
Distribution of non-farm businesses by sector, location, and poverty status
Evolution of non-farm income since March 16th by sector, location, and poverty status
11.8 9.916.3 13.3 16.9 14.5
80.076.9 69.7 74.0 69.1 72.5
6.210.0 10.1 9.6 9.4 9.5
2.0 3.2 3.9 3.0 4.6 3.5
0%
10%
20%
30%
40%
50%
60%
70%
80%
90%
100%
OuagadougouOther urban Rural Non-poor Poor
Location Poverty status All
None Lower Identical Higher
4.1 8.217.6 12.7 16.7 14.0
12.2 10.0
8.38.6
10.49.2
83.7 81.874.1 78.7 72.9 76.9
0%
10%
20%
30%
40%
50%
60%
70%
80%
90%
100%
OuagadougouOther urban Rural Non-poor Poor
Location Poverty status All
Agriculture Industry Service

Closure due to Covid-19 and lack of customers are the main reasons for the lower income of non-farm businesses
Reason for having lower income by location and poverty status
Reason for having lower income by sector
57.9 61.844.5
52.544.0 50.0
30.0 19.8
30.127.3
29.928.1
2.3 6.410.6 7.5 10.8 8.5
6.0 4.7 8.3 6.7 8.5 7.3
0%
10%
20%
30%
40%
50%
60%
70%
80%
90%
100%
OuagadougouOther urban Rural Non-poor Poor
Location Poverty status All
Closure of the establishment due to Covid-19 Closure of the establishment for another reason
Seasonal closure No customers
Lack of raw materials Cannot move/transport products
Need to care for a loved one Other
44.134.4
52.6 50.0
12.9
7.6
0.3 2.3
17.540.0
28.0 28.1
13.34.4 8.4 8.5
1.412.9 7.3 7.3
0%
10%
20%
30%
40%
50%
60%
70%
80%
90%
100%
Agriculture Industry Service Total
Closure of the establishment due to Covid-19 Closure of the establishment for another reason
Seasonal closure No customers
Lack of raw materials Cannot move/transport products
Need to care for a loved one Other

Farms: about 3 in 4 households are involved in agricultural activities; agriculture is mainly concentrated among poor and rural areas
15.5
41.6
91.3
63.3
89.8
71.3
0.0
10.0
20.0
30.0
40.0
50.0
60.0
70.0
80.0
90.0
100.0
Ouagadougou Other urban Rural Non-poor Poor
Location Poverty status All

Farms: Since mid-March, most farmers are having difficulties in their activities mainly due to seasonality and Covid-19 related restrictions
Share having issues with farms activities since mid March
72.5
88.291.0 89.4 91.2 90.1
0.0
10.0
20.0
30.0
40.0
50.0
60.0
70.0
80.0
90.0
100.0
OuagadougouOther urban Rural Non-poor Poor
Location Poverty status All
Reasons for not being able to conduct farm activities as usual
41.0
29.0
19.0
11.0
8.4
1.3
0.5
0.0 10.0 20.0 30.0 40.0 50.0
Seasonal activity
Advice to stay at Home
Restriction of travel / trip
Inability to acquire or move inputs
Unable to sell or transportproduction
Need to care for a loved one
Lack of availability of manpower

Farms: Reasons for not being able to conduct farm activities vary across location and poverty status
Reasons for not being able to conduct farm activities as usual by location
Reasons for not being able to conduct farm activities as usual by poverty status
0.0 10.0 20.0 30.0 40.0 50.0
Seasonal activity
Advice to stay at Home
Restriction of travel / trip
Inability to acquire or move inputs
Unable to sell or transportproduction
Need to care for a loved one
Lack of availability of manpower
Ouagadougou Other urban Rural
0.0 10.0 20.0 30.0 40.0 50.0 60.0 70.0
Seasonal activity
Advice to stay at Home
Restriction of travel / trip
Inability to acquire or move inputs
Unable to sell or transportproduction
Need to care for a loved one
Lack of availability of manpower
Non-poor Poor
Note: Only 12 observations for Ouagadougou

Close to half of the farmers reports a reduction of prices at which they sale their products
5.515.9 15.2 15.1 12.2 14.2
58.6
54.8
33.542.4
34.539.9
35.929.2
51.342.5
53.345.9
0%
10%
20%
30%
40%
50%
60%
70%
80%
90%
100%
Ouagadougou Other urban Rural Non-poor Poor
Location Poverty status All
Higher The same Lower
Compared to this time last year, the price you received for your product was...?
Note: WFP reported in April that food items prices were generally stable despite increase in transport costs. Lower farm gate prices, higher transport costs and stable market prices, point to a possible transmission of increase transport costs to farmers. It means the way COVID affects prices along the value chain will mainly harms farmers (or net producers).

About 1 in 5 households used to receive remittances from family/friends, and for most (49.5%), the amount received has reduced since the Covid-19 outbreakProportion of households that received remittances from family/friends since March 16th
Evolution of remittances from family/friends compared to the period before March 16, 2020
11.722.0
11.8 11.718.7 13.5
35.6
44.8
35.3 40.9 26.5 37.0
52.7
33.2
52.9 47.554.8 49.5
0%
10%
20%
30%
40%
50%
60%
70%
80%
90%
100%
OuagadougouOther urban Rural Non-poor Poor
Location Poverty status All
Increased Remained the same Diminished
34.3
24.3
18.5
22.9
19.722.0
0.0
5.0
10.0
15.0
20.0
25.0
30.0
35.0
40.0
OuagadougouOther urban Rural Non-poor Poor
Location Poverty status All

Thank you
51
Copyright © 2022 FDOKUMEN


![Onchocerciasis Control Programme [OCP] - Burkina Faso](https://static.fdokumen.com/doc/165x107/63283ba86d480576770daa1c/onchocerciasis-control-programme-ocp-burkina-faso.jpg)