An Economic Analysis of Domestic Market Impacts of the U.S. ...
25
An Economic Analysis of Domestic Market Impacts of the U.S. Highbush Blueberry Council by Harry M. Kaiser Cornell University September 23, 2020
-
Upload
khangminh22 -
Category
Documents
-
view
0 -
download
0
Transcript of An Economic Analysis of Domestic Market Impacts of the U.S. ...

An Economic Analysis of Domestic Market Impacts of the U.S. Highbush Blueberry Council
by
Harry M. Kaiser Cornell University
September 23, 2020
An Economic Analysis of Domestic Market Impacts of the U.S. Highbush Blueberry Council
Harry M. Kaiser
Cornell University
Executive Summary
This research study had two central objectives:
1. To measure the domestic market impacts of the U.S. Highbush Blueberry Council’s (USHBC) promotion programs. Specifically, to determine whether the USHBC’s promotion activities increased consumption of blueberries in the United States compared to what would have occurred in the absence of these activities.
2. To measure the benefits of the USHBC promotion activities in terms of incremental profitability for the entire industry and compare these benefits with the cost of the checkoff to compute a rate of return on investment (also known as benefit-cost ratio) to its stakeholders.
To address these two objectives, an econometric model of the domestic blueberry demand was constructed, which enabled us to net out the impacts of other important factors besides USHBC promotion affecting blueberry demand such as blueberry price, price of other berries, and consumer income.
The main highlights of the study include the following results:
• Generic promotion by the USHBC is a significant demand driver on domestic blueberry
demand. Specifically, in the short-run (i.e., less than one year), a 1% increase in USHBC promotion was found to increase per capita blueberry demand by 0.1%, holding constant all other demand drivers. In the longer-run (i.e., more than 2 years), a 1% increase in USHBC promotion was found to increase per capita blueberry demand by almost 0.2%, holding constant all other demand drivers.
• The USHBC had a positive and significant impact on total blueberry consumption in the United States compared to what it would have been in its absence. Had there not been any domestic USHBC promotion activities over the latest 5-year period, 2014 through 2018, total domestic blueberry consumption would have been 13.5% (or 114.2 million pounds per year) lower than it actually was.
• USHBC promotion positively impacted the grower blueberry price. The results indicate
that a 1% increase in USHBC promotion increased grower prices by 0.59 cents per pound, on average, over the last five years.

3
• USHBC promotion efforts had a positive impact on grower net revenue over this period.
Specifically, the average increase in net revenue due to a 1% increase in promotion spending by the USHBC is $978,300 per year.
• The BCR for the USHBC is 18.74 which implies that, on average over the period 2014-2018, the benefits of the USHBC promotion programs have been over 18 times greater than the costs. In other words, if the USHBC had an extra dollar to spend on promotion, it would return $18.74 in net revenue to blueberry growers.
• The lower bound of the 90% confidence interval on the BCR is 3.56, which demonstrate
that one could be confident 90% of the time that the true BCR is not lower than 3.56.

4
An Economic Analysis of Domestic Market Impacts of the U.S. Highbush Blueberry Council
Harry M. Kaiser Cornell University
Introduction
The U.S. Highbush Blueberry Council (USHBC) is a national research and promotion organization that began operation in October of 2001. The USHBC uses a variety of promotion techniques to increase the demand (sales) for blueberries. In the domestic market these activities include health research, technical assistance and promotion to food service and food manufacturers, consumer public relations, advertising, and promotion. The USHBC is authorized under the Commodity Promotion, Research, and Information Act of 1996 and was approved in the spring of 2000 by a majority (67.8%) of producers and importers in a special referendum. Under the original program, domestic blueberry producers and importers were assessed at a rate of $12.00 per ton, and the collected revenue was used to fund promotion, research, and information projects. However, in October 2012, the USHBC unanimously agreed to increase the assessment rate to $18 per ton “to more aggressively promote highbush blueberries and take advantage of the growing scientific knowledge of the healthfulness of our product.” In 2018, $6.3 million was spent on domestic blueberry promotion.
Objective and Scope Since the 1996 Farm Bill, all federal checkoff promotion programs must be evaluated so that their return to investors can be determined. Accordingly, the primary purpose of this research is twofold: (1) to measure the domestic market impacts of the USHBC’s promotion programs, and (2) to compute a benefit-cost ratio (rate-of-return) for the promotion activities conducted by the USHBC.
In this study, the impacts of the export marketing activities conducted by the USHBC are not evaluated, since the bulk of the Council’s marketing budget is invested in the United States, e.g., in 2018, 97% of the promotion budget was allocated to domestic promotion. Specifically, this research examines whether the domestic blueberry promotion activities of the USHBC have had a positive and statistically significant impact on domestic shipments of blueberries and on grower profits. The impacts of all factors affecting domestic blueberry demand for which data are available are measured statistically. In this way, we can net out the impacts of other important factors affecting blueberry demand over time. In addition, the value of the extra sales generated by the USHBC’s marketing activities is estimated. These benefits to blueberry growers and processors are compared with the costs associated with the USHBC. To carry out this independent evaluation, the USHBC contracted with Professor Harry M. Kaiser of Cornell University to conduct the economic analysis of the domestic market impacts of
5
its promotion programs. Dr. Kaiser is the Gellert Family Professor of Applied Economics and Management at Cornell University, and director of the Cornell Commodity Promotion Research Program. Dr. Kaiser has extensive experience in conducting economic evaluation studies of domestic and international checkoff programs. Dr. Kaiser has written 135 refereed journal articles, five books, 17 book chapters, over 150 research bulletins, and received $8 million in research grants in the area of agricultural marketing with an emphasis on promotion programs. He has conducted over 120 economic evaluation studies of domestic and international checkoff programs in the United States, Canada, and Europe on such commodities as fluid milk, cheese, butter, salmon, red meat, pork, raisins, walnuts, blueberries, potatoes, beef, peanuts, wheat, watermelons, high-valued-agricultural commodities, and bulk agricultural commodities. In 2005, Kaiser was the lead author of a book on all commodity checkoff programs in California.
The rest of this report is organized as follows. The next section briefly examines consumption (and factors that affect consumption) trends in the U.S. blueberry industry. This is followed by a discussion of the economic methodology used in this study to measure the effects of the USHBC on blueberry demand. Next, the econometric (statistical) estimation results are presented and examined. Then, the econometric results are used in conjunction with a simulation model to simulate market conditions with and without the existence of the USHBC so that the impact (benefit-cost ratio) of its promotion activities can be estimated. The report concludes with a summary and a discussion of the implications of the main findings.
Trends in U.S. Blueberry Consumption
Domestic consumption of blueberries in the United States has generally been increasing since the late 1970s. Figure 1 displays domestic per capita consumption of blueberries from 1970 through 2018. Per capita consumption bottomed out at about 5.1 ounces per person in 1977. However, since then, per capita consumption has been steadily increasing. In 2018, per capita consumption was 46.5 ounces, which represents a 575% increase since 1970. What has fueled this tremendous increase in per capita consumption? One factor that has likely caused growth in consumption of blueberries over this period is that the real (inflation-adjusted) price of blueberries has generally declined. While we did not have access to retail price data for blueberries in this study, it is clear that the real price at the grower level has declined in most years since 1970. Figure 2 shows the average price for fresh and processed blueberries in New Jersey deflated (i.e., expressed in 2019 cents) by the Consumer Price Index for all items (2019 = 1.0) from 1970 through 2014. While there are some significant fluctuations in the real grower price for blueberries over this period, the trend has been downward as reflected by the trend line in Figure 2. In 1970, for example, the average of the price of fresh and frozen blueberries at the grower level was $1.57 per pound (in 2019 dollars); by 2018, this price was $1.09 per pound, which is 30.5% lower in real terms. Consequently, compared with all items in our economy, blueberries have become relatively less expensive, which should have a positive impact on blueberry consumption. Another factor that may have positively influenced consumption of blueberries is strong growth in U.S. personal income over this period. Real (inflation-adjusted in chained 2012

6
0.0
5.0
10.0
15.0
20.0
25.0
30.0
35.0
40.0
45.0
50.0
1970 1975 1980 1985 1990 1995 2000 2005 2010 2015
Oun
ces p
er p
erso
n pe
r yea
rFigure 1. Per capita blueberry consumption in the United
States, 1970-2018
0
50
100
150
200
250
300
1970 1975 1980 1985 1990 1995 2000 2005 2010 2015
Cen
ts p
er p
ound
Figure 2. Real (inflation-adjusted) blueberry grower price, 1970-2018

7
dollars) personal income from 1970 through 2018 is shown in Figure 3. In 1970, real personal income was $3.6 trillion, and by 2018 had climbed to almost $15 trillion. Growth in real personal income generally has a positive impact on the demand for most foods. As people’s budgets increase, they consume more foods, and fruits and vegetables tend to be more sensitive to change in income than other foods.
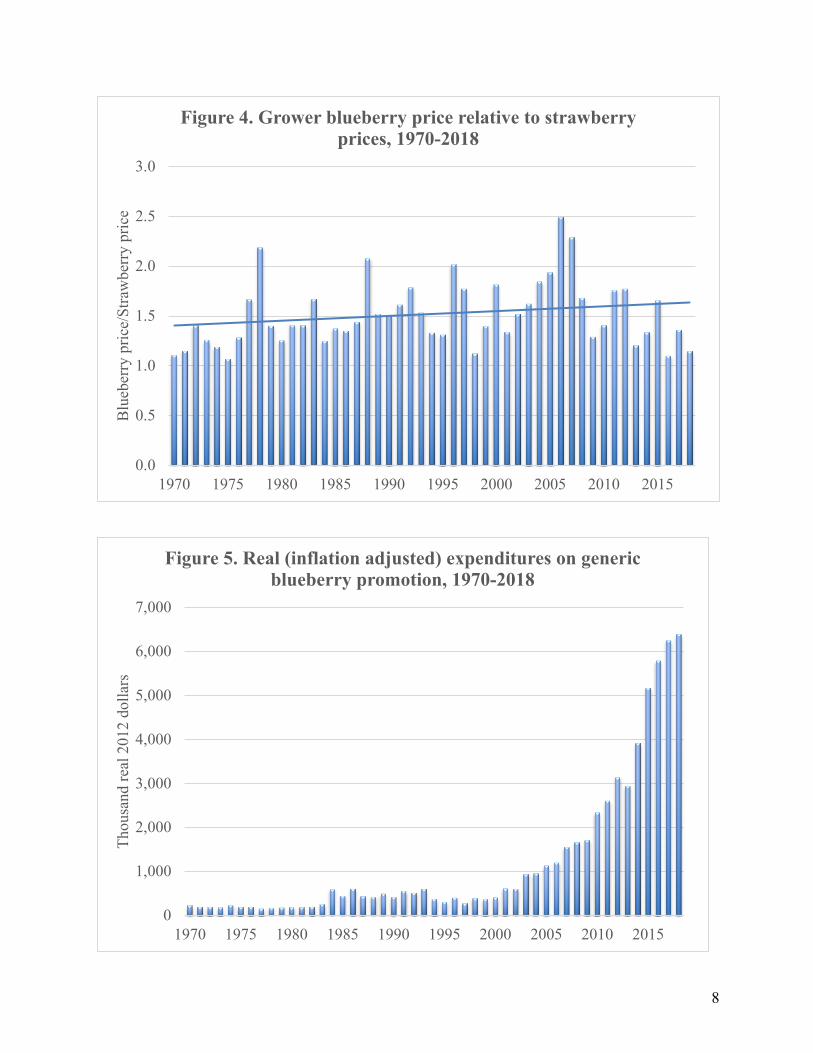
Another factor that has likely influenced consumption of blueberries is the price of blueberries relative to the price of other berries. Other berries, such as strawberries are substitutes (i.e., people consume either blueberries or other berries) to blueberries. Figure 4 shows how the average price of New Jersey blueberries (fresh and processed) has varied relative to the average grower price of strawberries since 1970. In general, there is not much of a trend here, but perhaps a slight positive trend over time with a lot of variations. Holding all other demand factors constant, the mild positive trend in blueberry price relative to strawberry price likely had a marginally negative effect on blueberry consumption since 1970.
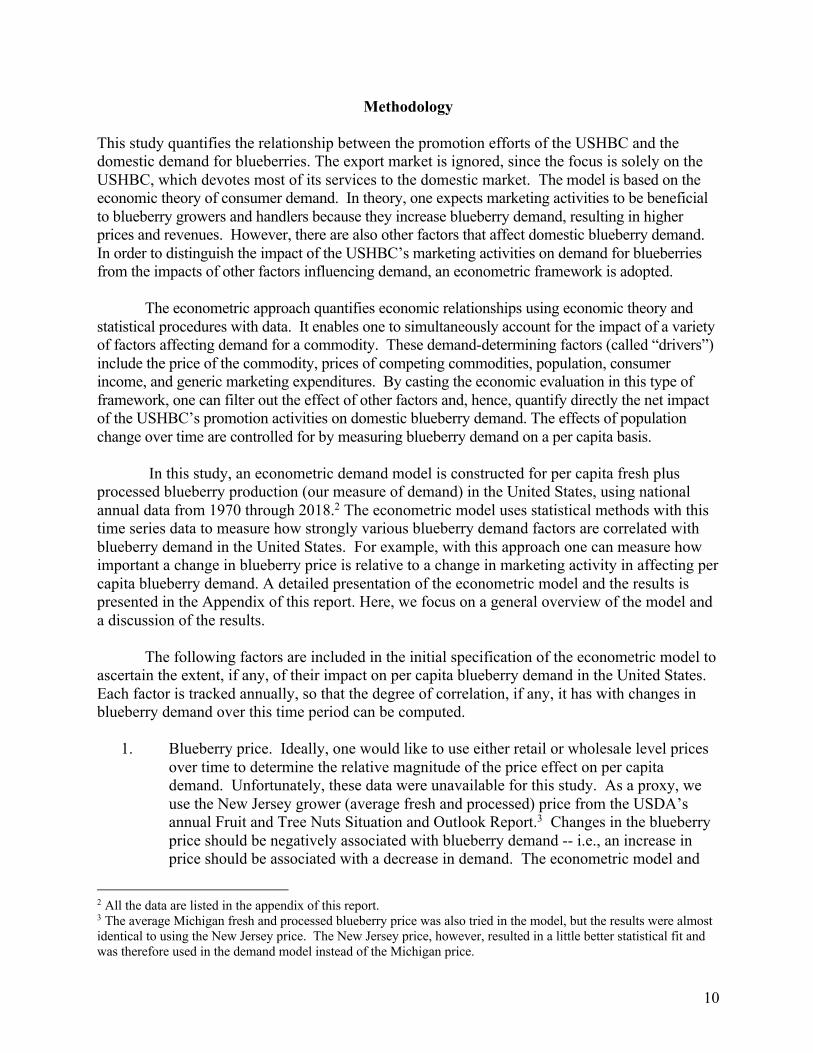
Finally, another factor that has likely contributed to growth in per capita consumption of blueberries is the promotion efforts of the USHBC. Figure 5 displays real inflation-adjusted expenditures on generic blueberry promotion since 1970.1 Since 1970, promotion expenditures
1 Prior to the creation of the USHBC in 2001, the North American Blueberry Council, a voluntary checkoff program for blueberries, conducted generic promotion activities in the United States.
0
2,000
4,000
6,000
8,000
10,000
12,000
14,000
16,000
1970 1975 1980 1985 1990 1995 2000 2005 2010 2015
Rea
l 201
2 bi
llion
dol
lars
Figure 3. Real (inflation adjusted) per capita income in United States, 1970-2018
8
0.0
0.5
1.0
1.5
2.0
2.5
3.0
1970 1975 1980 1985 1990 1995 2000 2005 2010 2015
Blu
eber
ry p
rice/
Stra
wbe
rry
pric
eFigure 4. Grower blueberry price relative to strawberry
prices, 1970-2018
0
1,000
2,000
3,000
4,000
5,000
6,000
7,000
1970 1975 1980 1985 1990 1995 2000 2005 2010 2015
Thou
sand
real
201
2 do
llars
Figure 5. Real (inflation adjusted) expenditures on generic blueberry promotion, 1970-2018

9
have increased significantly. For instance, in 1970 the industry voluntarily contributed $230,000 (measured in 2019 dollars) for generic blueberry promotion. With the implementation of the national blueberry checkoff program, generic promotion of blueberries in domestic markets rose to $614,000 in 2001, and has risen steadily since. In 2018, the annual domestic promotion budget for blueberries was $6.4 million and it is projected to be $7.4 in 2019.
The growth in per capita consumption since 1976 is crucial to the overall health and
viability of the U.S blueberry industry. This is evident in Figure 6, which displays real (inflation-adjusted) blueberry grower total revenue (in 2019 dollars) from 1970 through 2018. The increase in per capita consumption that has occurred since 1976 has been accompanied by a positive trend in grower revenue. In 1970, total grower revenue was almost $137.8 million in 2019 dollars. In 2018, total revenue grew to $871.2 million, an increase of 532.4%. Clearly, it behooves the industry to market blueberries effectively, since growth in consumption is so beneficial to grower revenues. But while this graphical analysis is useful in depicting various trends in factors affecting blueberry consumption over time, it does not tell us anything about how important these factors actually are in influencing consumption. For this, we need to turn to more sophisticated statistical models from a field of economics called “econometrics,” which is the focus of a later section in this report.
0
200
400
600
800
1,000
1,200
1,400
1970 1975 1980 1985 1990 1995 2000 2005 2010 2015
Rea
l tot
al re
venu
e in
mill
ion
dolla
rs
Figure 6. Real (inflation-adjusted) total revenue of blueberry growers in the United States, 1970-2018
10
Methodology
This study quantifies the relationship between the promotion efforts of the USHBC and the domestic demand for blueberries. The export market is ignored, since the focus is solely on the USHBC, which devotes most of its services to the domestic market. The model is based on the economic theory of consumer demand. In theory, one expects marketing activities to be beneficial to blueberry growers and handlers because they increase blueberry demand, resulting in higher prices and revenues. However, there are also other factors that affect domestic blueberry demand. In order to distinguish the impact of the USHBC’s marketing activities on demand for blueberries from the impacts of other factors influencing demand, an econometric framework is adopted. The econometric approach quantifies economic relationships using economic theory and statistical procedures with data. It enables one to simultaneously account for the impact of a variety of factors affecting demand for a commodity. These demand-determining factors (called “drivers”) include the price of the commodity, prices of competing commodities, population, consumer income, and generic marketing expenditures. By casting the economic evaluation in this type of framework, one can filter out the effect of other factors and, hence, quantify directly the net impact of the USHBC’s promotion activities on domestic blueberry demand. The effects of population change over time are controlled for by measuring blueberry demand on a per capita basis. In this study, an econometric demand model is constructed for per capita fresh plus processed blueberry production (our measure of demand) in the United States, using national annual data from 1970 through 2018.2 The econometric model uses statistical methods with this time series data to measure how strongly various blueberry demand factors are correlated with blueberry demand in the United States. For example, with this approach one can measure how important a change in blueberry price is relative to a change in marketing activity in affecting per capita blueberry demand. A detailed presentation of the econometric model and the results is presented in the Appendix of this report. Here, we focus on a general overview of the model and a discussion of the results. The following factors are included in the initial specification of the econometric model to ascertain the extent, if any, of their impact on per capita blueberry demand in the United States. Each factor is tracked annually, so that the degree of correlation, if any, it has with changes in blueberry demand over this time period can be computed.
1. Blueberry price. Ideally, one would like to use either retail or wholesale level prices over time to determine the relative magnitude of the price effect on per capita demand. Unfortunately, these data were unavailable for this study. As a proxy, we use the New Jersey grower (average fresh and processed) price from the USDA’s annual Fruit and Tree Nuts Situation and Outlook Report.3 Changes in the blueberry price should be negatively associated with blueberry demand -- i.e., an increase in price should be associated with a decrease in demand. The econometric model and
2 All the data are listed in the appendix of this report. 3 The average Michigan fresh and processed blueberry price was also tried in the model, but the results were almost identical to using the New Jersey price. The New Jersey price, however, resulted in a little better statistical fit and was therefore used in the demand model instead of the Michigan price.

11
time series data will determine how strong of correlation there is between price and per capita demand.
2. USHBC public relations and promotion expenditures in the domestic market. Of course, this is the key factor that will be statistically tested in this study to see whether it has a significant and positive impact on blueberry demand. If it has a positive and statistically significant impact on per capita blueberry demand, this means that the promotion activities of the USHBC do have a positive impact on domestic blueberry demand. (The source of data for this variable is the USHBC office). It should be noted that these expenditures do not include any free publicity that has been gained on the healthfulness of blueberries. Such free publicity was not included in the model due to a lack of availability since it is difficult for the public relations firms to quantify a value for such publicity. Assuming that the free publicity has a significant positive impact on blueberry consumption, omission of it could result in the impact of blueberry promotion being somewhat overstated.
3. Per capita demand in the previous period. This variable represents habit formation on
the part of consumers. Demand levels last year should be positively correlated with demand levels in the current year. Hence, per capita demand lagged one year is included as an explanatory variable in the model.
4. Price of competing fruits. Since these commodities are likely competitors to
blueberries, there should be a positive relationship between their price and per capita blueberry demand. For example, if the price of strawberries increases (holding all other factors constant), blueberry demand should increase. As with blueberry price, this study uses the grower-level price for strawberries as a proxy for competing fruits. (The source of these prices is the USDA’s annual Fruit and Tree Nuts Situation and Outlook Report.)
5. Population in the United States. U.S. Population should have a positive influence on
domestic demand. To control for the influence of population growth on blueberry demand, we convert total demand to a per capita basis by dividing by the U.S. population. Consequently, a per capita blueberry demand model is estimated. (The source of figures for U.S. population is the Current Population Report.)
6. Personal income. This should be positively related to blueberry demand, i.e., as
consumers' personal income increases, blueberry demand should increase. (The source of figures for this variable is the Economic Report of the President.)
To compare the relative importance of each factor on per capita blueberry demand, the results from the statistical (econometric) model are converted into demand “elasticities.” A demand elasticity measures the percentage change in domestic blueberry demand given a 1 percent change in a specific demand factor, holding all other factors constant. For example, the computed price elasticity measures the percentage change in per capita blueberry demand given a 1% change in price. The computed promotion elasticity measures the percentage change in per

12
capita blueberry demand given a 1% change in promotion, and so on. Since demand elasticities are calculated for each demand factor listed above, one can compare them to determine which factors have the largest impact on blueberry demand.
Results
Estimated blueberry demand model The estimated blueberry demand elasticities are reported in Table 1 (the full econometric
output is listed in the Appendix). The estimated coefficient on the lagged per capita blueberry demand is 0.49. This indicates that there is a positive correlation between blueberry demand in the previous year and current blueberry demand. This estimate is used to derive the long-run elasticities (LRE) by using the following formula:
1/(1 – 0.49) = 1.96.
In other words, the long run elasticities for all demand factors are almost two-times larger than the short run elasticities. The estimated demand equation suggests that the average fresh and processed price of blueberries at the grower level is an important factor in explaining annual variations in per capita blueberry demand. The short run own-price elasticity is –0.17, which implies that a 1% increase in the blueberry growers’ price would result in a 0.17% decrease in per capita quantity demanded, holding all other demand determinants constant. (All elasticities are based on mean values for the period 1970-2018.) The long run price elasticity is 0.34. This result suggests that while price is an important factor, it is still in the “inelastic” range, meaning that a 1% increase in price leads to a lower-than -1% decrease in quantity demanded. With this result, one could conclude that blueberry consumers are not sensitive to small price changes. Price insensitivity is commonly found in empirical studies of food demand in the United States. Table 1. Blueberry demand elasticities.* 90% lower 90% upper
bound conf
bound conf
Demand Factor Elasticity interval interval Lagged blueberry demand 0.49 0.30 0.68 Blueberry price -0.17 -0.31 -0.02 Strawberry price 0.22 -0.01 0.45 USHBC domestic promotion 0.10 0.02 0.14
* Elasticity measures the percentage change in domestic per capita blueberry demand given a 1% change in any demand determinant, holding constant all other determinants.

13
The estimation results indicate that strawberries are a substitute for blueberries. The short run “cross-price elasticity” of per capita blueberry demand with respect to the price of strawberries is estimated to be 0.22. That is, a 1% increase in the strawberry (growers’) price would result in a 0.22% increase in per capita blueberry demand, holding all other demand determinants constant. The long run elasticity is 0.43. This indicates that blueberries and strawberries are substitute products, since the demand for blueberries is enhanced when the price of strawberries increases. Real personal income is found to be the most important factor affecting the demand for blueberries. The income elasticity is 0.63, i.e., holding everything else constant, a 1% increase in real per capita income raised per capita blueberry demand by 0.63%. The long run income elasticity is 1.23. The elasticity associated with generic blueberry promotion is positive and statistically different from zero. Both current and one-year lagged promotion expenditures have a significant impact on demand indicating that promotion has a longer-term, carry-over effect, i.e., promotion last year impacts demand in the current year. This means that the statistical evidence supports the hypothesis that the USHBC’s promotional activities increase demand for blueberries in the United States. The estimated promotion elasticity is 0.1, which means that a 1% increase in USHBC promotion expenditures would result in a 0.1% increase in per capita domestic blueberry demand, holding all other demand determinants constant.4 The long run promotion elasticity is 0.196.
Because there is error inherent in any statistical model, a 90% confidence interval is computed for the USHBC promotion elasticity (see the last two columns of Table 1 for the confidence intervals for the other demand drivers). This interval can be interpreted as the range of possible values where one can be confident that the true population elasticity could be expected to fall 90% of the time. The 90% confidence interval for the short-run USHBC promotion elasticity is (0.02, 0.14). Because the lower bound estimate is positive, this provides statistical confidence that the USHBC activities have had a positive and statistically significant impact on per capita blueberry demand.
It should be clear from these empirical results that the promotional efforts of the USHBC have had a positive impact on domestic blueberry sales in the United States. While this is important and useful information, two further important questions remain, namely:
1. What has been the impact of the USHBC’s domestic promotion on total domestic blueberry demand?
2. How does the gain in grower net revenue from the increased demand due to USHBC domestic promotion compare to the costs of the promotion?
4 Recall that any free publicity on the healthfulness of blueberries was not included in the generic blueberry promotion expenditures. If the free publicity has a positive and significant impact on blueberry consumption, then the omission of it may result in the promotion elasticity being somewhat overstated.

14
To answer these important questions, one must use the econometric results to construct a simulation model, which is presented next.
Simulation Analysis
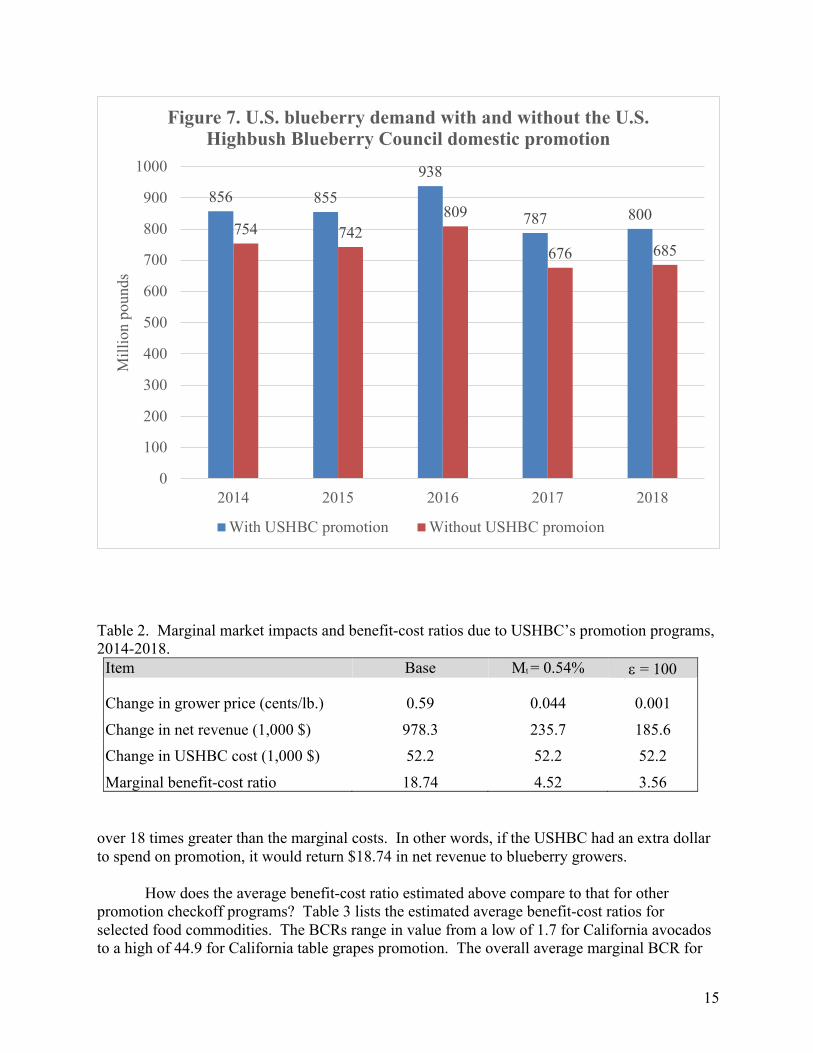
The estimation results above indicate that the USHBC’s marketing program has had a positive and statistically significant effect on domestic blueberry demand. To answer the two questions just posed, the estimated demand equation is simulated for two scenarios over the most recent 5-year period 2014-2018. The first scenario (USHBC scenario) simulates market conditions (i.e., grower price, demand, grower profits) assuming that USHBC promotion programs were in effect 2014-2018. This is a baseline or historical scenario with which to compare the second counter-factual scenario. The second scenario is a “No-USHBC” scenario, where it is assumed that there is no USHBC and generic blueberry promotion expenditures are set equal to the level they were in 2000 ($276,100 in nominal dollars), which is the year prior to the USHBC coming into existence. In this latter scenario, all demand determinants except USHBC promotion expenditures are set equal to their historic levels. The difference between these two scenarios gives the total impact of the USHBC promotion effort on domestic blueberry demand. Figure 7 displays the simulation results for annual blueberry demand (measured as fresh plus processed production) in the United States for the two scenarios. It shows clearly the positive impact on domestic blueberry demand due to the USHBC’s promotion programs. From 2014 to 2018, the USHBC’s promotion activities increased total blueberry demand by 571 million pounds in total, or 114.2 million pounds per year. This represents an annual average increase in blueberry consumption of 13.5%. Hence, the promotional spending by the USHBC has clearly had a positive effect on domestic blueberry demand.
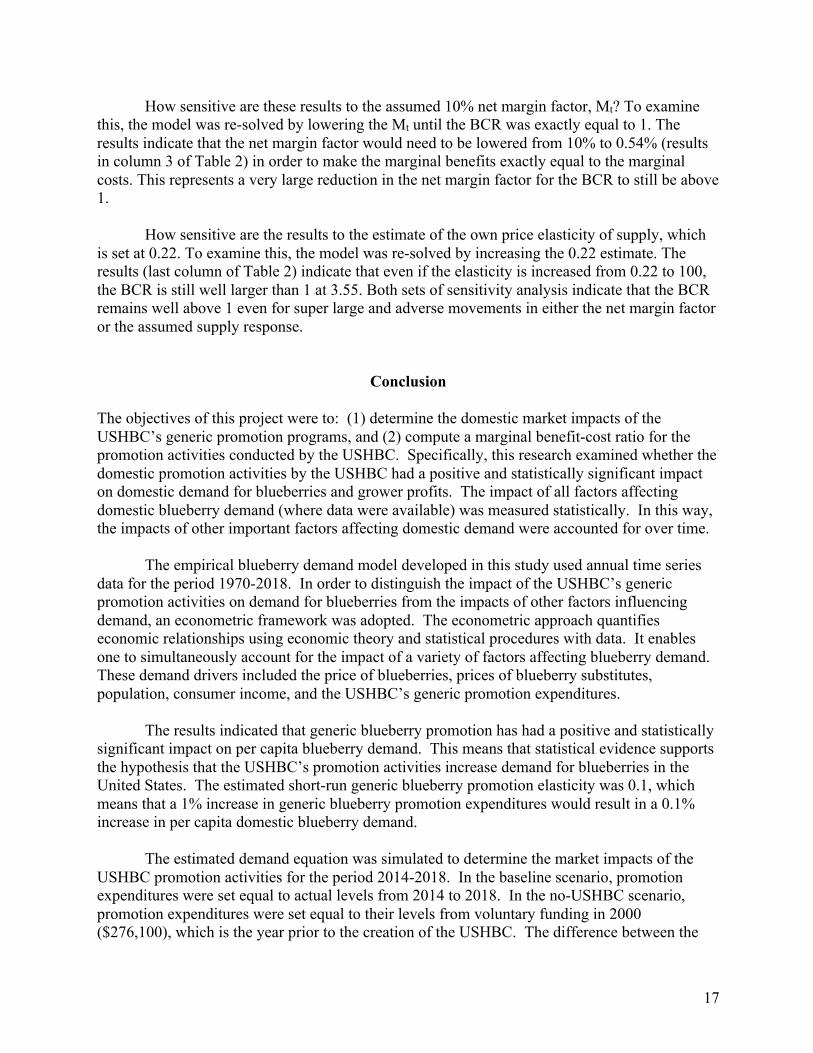
While these results indicate a positive impact of USHBC promotion programs on blueberry demand, what remains a key concern is the impact promotion has had on industry profitability compared with promotion costs. Accordingly, we next present the computed benefit-cost ratios (BCRs) in Table 2. The details of how these BCRs were computed are provided in the Appendix of the report. The second column (labeled Base) of Table 2 presents the average annual marginal impacts and BCRs (from 2014 to 2018) for USHBC promotion efforts. The term, marginal, means the impact of a 1% increase in USHBC promotion. The USHBC had a positive impact on the blueberry growers’ price over this period. The results indicate that a 1% increase in USHBC promotion causes grower prices to increase by 0.59 cents per pound. Likewise, USHBC promotion efforts had a positive impact on grower net revenue over this period as well. The average increase in net revenue due to a 1% increase in promotion spending by the USHBC is $978,300 per year. Hence, it is clear that domestic promotion efforts of the USHBC have had a significant and positive impact on growers’ profits since 2014.
How does the gain in grower net revenue compare with the costs of the USHBC? As
mentioned earlier, this is the most important question because the answer tells us whether the program is profitable. A BCR greater than 1.0 implies that the total benefits of the USHBC exceed the costs. The marginal BCR for the USHBC is 18.74 which implies that, on average over the period 2014-2018, the marginal benefits of the USHBC promotion programs have been
15
Table 2. Marginal market impacts and benefit-cost ratios due to USHBC’s promotion programs, 2014-2018.
Item Base Mt = 0.54% e = 100
Change in grower price (cents/lb.) 0.59 0.044 0.001
Change in net revenue (1,000 $) 978.3 235.7 185.6 Change in USHBC cost (1,000 $) 52.2 52.2 52.2
Marginal benefit-cost ratio 18.74 4.52 3.56 over 18 times greater than the marginal costs. In other words, if the USHBC had an extra dollar to spend on promotion, it would return $18.74 in net revenue to blueberry growers. How does the average benefit-cost ratio estimated above compare to that for other promotion checkoff programs? Table 3 lists the estimated average benefit-cost ratios for selected food commodities. The BCRs range in value from a low of 1.7 for California avocados to a high of 44.9 for California table grapes promotion. The overall average marginal BCR for
856 855938
787 800754 742
809
676 685
0
100
200
300
400
500
600
700
800
900
1000
2014 2015 2016 2017 2018
Mill
ion
poun
dsFigure 7. U.S. blueberry demand with and without the U.S.
Highbush Blueberry Council domestic promotion
With USHBC promotion Without USHBC promoion

16
Table 3. Estimated benefit-cost ratios for selected commodities. Average Marginal Benefit/ Benefit/ Cost Cost Author(s) Ratio Ratio Alston et al. (1997) California Table Grapes 44.9 38.8 Alston et al. (1998) California Dried Plums NA 2.7 Crespi and Sexton (2005) California Almonds NA 6.2 Carter et al. (2005) California Strawberries NA 44.0 Schmit et al (1997) California Eggs NA 6.9 Carman and Craft (1998) California Avocados 5.0 1.7 Williams et al. (2004) Florida Orange Juice 2.9-7.0 NA Kaiser (1997) All Dairy Products 3.4 NA Schmit and Kaiser (2004) Fluid Milk NA NA Ward (1996) Beef 5.7 5.7-9.7 Davis et al (2000) Pork NA 16.0 Kaiser and Schmit (1998) Eggs NA .54-6.33 Kaiser (2005) Blueberries 4.46-13.22 NA Murray et al. (2001) Cotton 3.2-6.0 NA Kaiser (2005) Walnuts 1.65 - 9.72 NA Kaiser et al. (2003) Raisins 5.1-15.3 .42-3.19 Ward (2008) Honey 6.02-7.91 NA Capps and Williams (2008) Lamb NA 44.5 Ward (2008) Watermelons 10.6 NA Richards and Patterson (2007) Potatoes 6.5 NA Williams (1999) Soybeans 1.7-7.9 NA Median 6.0 6.3
blueberry promotion of 18.74 is significantly higher than the overall median of all BCRs in Table 3 (6.3). To make allowances for the error inherent in any statistical estimation, a 90% confidence interval is calculated for the above marginal BCRs. The confidence interval provides a lower bound for the marginal BCR: one can be “confident” 90% of the time that the true marginal BCR lies above this limit. The lower bound of the 90% confidence interval on the BCR is 3.56, which demonstrate that one could be confident 90% of the time that the true marginal BCR s not lower than 3.56. Hence, it is reasonable to conclude that the above confidence lower bound gives credence to the previous finding that the benefits of the USHBC’s promotion programs have been considerably greater than their cost.
17
How sensitive are these results to the assumed 10% net margin factor, Mt? To examine this, the model was re-solved by lowering the Mt until the BCR was exactly equal to 1. The results indicate that the net margin factor would need to be lowered from 10% to 0.54% (results in column 3 of Table 2) in order to make the marginal benefits exactly equal to the marginal costs. This represents a very large reduction in the net margin factor for the BCR to still be above 1.
How sensitive are the results to the estimate of the own price elasticity of supply, which
is set at 0.22. To examine this, the model was re-solved by increasing the 0.22 estimate. The results (last column of Table 2) indicate that even if the elasticity is increased from 0.22 to 100, the BCR is still well larger than 1 at 3.55. Both sets of sensitivity analysis indicate that the BCR remains well above 1 even for super large and adverse movements in either the net margin factor or the assumed supply response.
Conclusion The objectives of this project were to: (1) determine the domestic market impacts of the USHBC’s generic promotion programs, and (2) compute a marginal benefit-cost ratio for the promotion activities conducted by the USHBC. Specifically, this research examined whether the domestic promotion activities by the USHBC had a positive and statistically significant impact on domestic demand for blueberries and grower profits. The impact of all factors affecting domestic blueberry demand (where data were available) was measured statistically. In this way, the impacts of other important factors affecting domestic demand were accounted for over time. The empirical blueberry demand model developed in this study used annual time series data for the period 1970-2018. In order to distinguish the impact of the USHBC’s generic promotion activities on demand for blueberries from the impacts of other factors influencing demand, an econometric framework was adopted. The econometric approach quantifies economic relationships using economic theory and statistical procedures with data. It enables one to simultaneously account for the impact of a variety of factors affecting blueberry demand. These demand drivers included the price of blueberries, prices of blueberry substitutes, population, consumer income, and the USHBC’s generic promotion expenditures. The results indicated that generic blueberry promotion has had a positive and statistically significant impact on per capita blueberry demand. This means that statistical evidence supports the hypothesis that the USHBC’s promotion activities increase demand for blueberries in the United States. The estimated short-run generic blueberry promotion elasticity was 0.1, which means that a 1% increase in generic blueberry promotion expenditures would result in a 0.1% increase in per capita domestic blueberry demand. The estimated demand equation was simulated to determine the market impacts of the USHBC promotion activities for the period 2014-2018. In the baseline scenario, promotion expenditures were set equal to actual levels from 2014 to 2018. In the no-USHBC scenario, promotion expenditures were set equal to their levels from voluntary funding in 2000 ($276,100), which is the year prior to the creation of the USHBC. The difference between the
18
two scenarios gives the total impact of USHBC promotion programs on domestic blueberry consumption. The simulation results indicate that the USHBC had a major impact on annual blueberry demand in the United States. From 2014 to 2018, the USHBC’s promotion activities increased total blueberry demand by 571 million pounds in total, or 114.2 million pounds per year. This represents an annual average increase in blueberry demand of 13.5%. Hence, the promotional spending by the USHBC has clearly had a positive effect on domestic blueberry demand.
The results indicate that a 1% increase in USHBC promotion increased grower prices by 0.59 cents per pound. Likewise, USHBC promotion efforts had a positive impact on grower net revenue over this period. Specifically, the average increase in net revenue due to a 1% increase in promotion spending by the USHBC is $978,300 per year. Hence, it is clear that domestic promotion efforts of the USHBC have had a significant and positive impact on growers’ profits since 2014.
How does the gain in grower net revenue compare with the costs of the USHBC? As mentioned earlier, this is the most important question because the answer tells us whether the program is profitable. A BCR greater than 1.0 implies that the total benefits of the USHBC exceed the costs. The marginal BCR for the USHBC is 18.74 which implies that, on average over the period 2014-2018, the marginal benefits of the USHBC promotion programs have been over 18 times greater than the marginal costs. In other words, if the USHBC had an extra dollar to spend on promotion, it would return $18.74 in net revenue to blueberry growers. To make allowances for the error inherent in any statistical estimation, a 90% confidence interval is calculated for the above marginal BCRs. The confidence interval provides a lower bound for the marginal BCR: one can be “confident” 90% of the time that the true marginal BCR lies above this limit. The lower bound of the 90% confidence interval on the BCR is 3.56, which demonstrate that one could be confident 90% of the time that the true marginal BCR s not lower than 3.56. Hence, it is reasonable to conclude that the above confidence lower bound gives credence to the previous finding that the benefits of the USHBC’s promotion programs have been considerably greater than their cost.

19
References Alston, J.M., H. Brunke, R.S. Gray, and D.A. Sumner. “Demand Enhancement through Food-
Safety Regulation: A Case Study of the Marketing Order for California Pistachios.” In The Economics of Commodity Promotion Programs: Lessons from California. By Harry M. Kaiser, Julian M. Alston, John M. Crespi, and Richard J. Sexton (editors). New York: Peter Lang Publishing, Inc, 2004.
Alston, J. M., J. A. Chalfant, J. E. Christian, E. Meng, and N. E. Piggott. “The California Table
Grape Commission’s Promotion Program: An Evaluation.” Economic Evaluation of Commodity Promotion Programs in the Current Legal and Political Environment. roceedings of the NEC-63 Fall Meeting, October 8, 1996, Monterey, California, pp. 33-62.
Capps, O., Jr., D.A. Bessler, and G.W. Williams. 2003. “Evaluating the Economic Impacts
Associated With the Advertising Effort by the Florida Department of Citrus: Final Report.” Unpublished Report. Forecasting and Business Analytics. L.L.C. May.
Crespi, John M. and Richard J. Sexton. “Have Expenditures to Advertise California Almonds
Been Effective?” NICPRE Quarterly. 6(2001):1-5. Davis, G.C., O. Capps, Jr., D.A. Bessler, J.H. Leigh, J.P. Nichols, and E. Goddard. 2001 “An
Economic Evaluation of the Pork Checkoff Program.” Departmental Technical Report No. 01-1. Department of Agricultural Economics. Texas A&M University. January.
Council of Economic Advisors. Economic Report of the President. Washington, D.C., various
years. Ferguson, C. A., S. T. Nakamoto, and N. Sawada. “An Economic Analysis of the Hawaii
Papaya Administrative Committee’s Marketing Program.” College of Tropical Agriculture and Human Resources, University of Hawaii at Manoa, 2001.
Goddard, E.W. and A.K. Amuah. “Demand for Canadian Fats and Oils: A Case Study of
Advertising Effectiveness.” American Journal of Agricultural Economics 71(1989): 741-749.
Halliburton, K. and S.R. Henneberry. “The Effectiveness of U.S. Nonprice Promotion of
Almonds in the Pacific Rim.” Journal of Agricultural and Resource Economics 20(1995): 108-121.
Julian, James W., Bernadine C. Strik, and Wei Yang “Blueberry Economics: The Costs of
Establishing and Producing Blueberries in the Willamette Valley.” Oregon State University Extension Bulletin AEB0022, 2011.
20
Kaiser, H.M. 1997. “Impact of National Dairy Advertising on Dairy Markets, 1984-95.” Journal of Agricultural and Applied Economics 29:303-14.
Kaiser, H.M. 2002. “The Domestic Impacts of the Walnut Marketing Board’s Marketing
Activities.” NICPRE Quarterly. Department of Applied Economics and Management. Cornell University. First Quarter. 1-4.
Kaiser, Harry M., Donald J. Liu, and Ted Consignado. “An Economic Analysis of California
Raisin Export Promotion.” Agribusiness: An International Journal. 19(2003):189-202. Nichols, J.P., O. Capps, Jr., G.C. Davis, and D.A. Bessler. 1997. “Evaluating Returns to the
Cotton Checkoff Program.” NICPRE Bulletin. Department of Applied Economics and Management. Cornell University. Second Quarter. 1-4.
Schmit, Todd and Harry M. Kaiser. “Egg Advertising, Dietary Cholesterol Concerns, and U.S.
Consumer Demand.” Agricultural and Resource Economics Review. 27(1998):43-52. Onunkwo, I.M. and J.E. Epperson. “Export Demand for U.S. Pecans: Impacts of U.S. Export
Promotion Programs.” Agribusiness: An International Journal 16(2000): 253-266. U.S. Department of Agriculture, Economic Research Service. Fruit and Tree Nuts Situation and
Outlook Yearbook. Washington, D.C., various years. VanSickle, J. J. and E. Evans. “The Florida Tomato Committee’s Education and Promotion
Program: An Evaluation.” Food and Resource Economics Department, University of Florida. Mimeo. December 2001.
Ward, R.W. 1998. “Evaluating the Beef Promotion Checkoff.” NICPRE Bulletin. Department of
Applied Economics and Management. Cornell University. Fourth Quarter. 1-4. Ward, R.W. and O.D. Forker. “Washington Apple Advertising: An Economic Model of Its
Impact.” Washington Apple Commission, WAC 91:1, University of Florida, Gainesville, 1991.
Weiss, K.R., R.D. Green, and A.M. Havenner. “Walnuts in Japan: A Case Study of Generic
Promotion Under the USDA’s Market Promotion Program.” In Agricultural Commodity Promotion Policies and Programs in the Global Agri-Food System, Proceedings of NEC-63 Conference, NICPRE, Cornell University, May 1996: 47-80.
Williams, G.W., C.R. Shumway, H.A. Love, and J.B. Ward. 1998. “Effectiveness of the Soybean
Checkoff Program.” Texas Agricultural Market Research Center Report. Department of Agricultural Economics. Texas A&M University. May.
Yang, Jinbin. 2008. “Economic Analysis of Blueberry Investment in British Columbia.” M.S.
Thesis. University of British Columbia, June.

21
Appendix Table. Data for blueberry demand econometric model, 1970-2018.
Consumer Real Personal Average NJ Fresh US Blueberry Per capita Strawberry Price Index Income and Processed Population Promotion Blueberry Price
Year 2019=1 Bil $ Price Cent/lb Mil 1000 $ Sales (ounces) cents/lb 1970 0.152 3,636.8 23.8 204.0 35.0 6.9 21.5 1971 0.158 3,805.2 25.9 206.8 30.0 7.1 22.5 1972 0.164 3,988.3 33.7 209.3 31.8 5.6 24.0 1973 0.174 4,235.8 34.8 211.4 33.2 7.4 27.6 1974 0.193 4,188.9 34.3 213.3 46.1 7.3 28.8 1975 0.211 4,291.9 32.7 215.5 40.5 6.8 30.6 1976 0.223 4,428.8 42.3 217.6 42.9 6.4 32.9 1977 0.237 4,568.4 55.4 219.8 37.5 5.1 33.2 1978 0.255 4,776.7 69.3 222.1 44.5 5.1 31.7 1979 0.284 4,869.9 54.3 224.6 50.0 6.8 38.7 1980 0.322 4,904.9 51.8 227.2 59.0 6.6 41.2 1981 0.356 5,024.4 59.2 229.5 64.9 6.9 42.0 1982 0.378 5,135.4 67.5 231.7 72.3 7.0 48.1 1983 0.390 5,312.4 76.0 233.8 102.0 7.9 45.6 1984 0.407 5,677.0 52.0 235.8 243.1 8.6 41.7 1985 0.421 5,847.9 61.0 237.9 189.5 9.5 44.3 1986 0.429 6,070.0 66.7 240.1 261.5 9.5 49.4 1987 0.444 6,204.1 71.0 242.3 192.1 9.3 49.4 1988 0.463 6,495.9 96.0 244.5 194.9 9.9 46.2 1989 0.485 6,686.4 71.6 246.8 239.7 10.2 47.1 1990 0.511 6,817.5 71.0 250.2 211.9 11.4 47.0 1991 0.533 6,866.9 74.5 253.5 295.5 9.3 46.2 1992 0.549 7,153.1 93.5 256.9 282.3 12.3 52.3 1993 0.565 7,271.4 71.0 260.3 337.3 13.5 46.3 1994 0.580 7,470.5 67.5 263.5 215.4 13.0 50.7 1995 0.596 7,719.0 66.5 266.6 185.4 14.9 50.7 1996 0.614 7,964.2 95.5 269.7 248.3 11.8 47.3 1997 0.628 8,255.8 98.5 273.0 169.5 13.2 55.5 1998 0.638 8,740.6 68.5 276.2 249.0 13.8 61.1 1999 0.652 9,025.9 87.5 279.3 242.3 15.4 62.5 2000 0.674 9,479.5 100.0 282.4 276.1 15.7 55.0 2001 0.692 9,740.2 86.5 285.2 425.2 16.8 64.7 2002 0.704 10,034.7 93.5 288.0 425.1 17.4 61.6 2003 0.720 10,301.5 103.5 290.6 672.8 17.5 63.8 2004 0.739 10,645.9 108.0 293.3 704.0 20.0 58.5 2005 0.764 10,811.7 116.5 296.0 866.7 20.1 60.1 2006 0.788 11,242.1 157.5 298.8 947.2 22.4 63.2 2007 0.811 11,500.5 164.0 301.7 1,262.9 22.7 71.6 2008 0.842 11,610.8 127.5 304.5 1,395.6 27.8 75.8 2009 0.839 11,592.0 98.0 307.2 1,431.4 32.1 76.0 2010 0.853 11,822.1 111.5 309.8 1,998.2 34.0 79.3 2011 0.880 12,099.9 145.0 312.0 2,295.9 35.3 82.4 2012 0.898 12,500.8 142.5 314.2 2,820.8 38.0 80.4 2013 0.911 12,339.1 103.0 316.5 2,679.3 43.3 85.6 2014 0.926 12,844.2 124.5 318.7 3,621.7 43.0 93.3 2015 0.927 13,372.8 121.0 321.0 4,788.7 42.6 73.0 2016 0.939 13,608.7 121.0 323.3 5,434.9 46.4 110.0 2017 0.959 14,002.8 145.5 325.4 5,995.3 38.7 107.0 2018 0.982 14,556.2 107.0 327.4 6,282.3 39.1 93.5

22
Methodological Details
The purpose of this section on the Appendix is to provide a more detailed discussion of the econometric model and the computational procedures for the BCR. Econometric Model.
The estimated blueberry demand equation is specified on a per capita basis using a logarithmic specification and the regression output is presented below.
Dependent Variable: LOG(Q) Sample (adjusted): 1971 2018 Included observations: 48 after adjustments ____________________________________________________________________________ Variable Coefficient Std. Error t-Statistic. Prob. CONSTANT -5.053817 1.733438 -2.915488 0.0057 LOG(NJP/CPI) -0.168087 0.086491 -1.943398 0.0587 LOG(RINC) 0.628035 0.166282 3.776932 0.0005 LOG(STRAWP/CPI) 0.220542 0.135048 1.633060 0.1099 LOG(Q(-1)) 0.486528 0.113483 4.287222 0.0001 PDL01 0.074439 0.035873 2.075098 0.0441 ______________________________________________________________________________ R-squared 0.978699 Mean dependent var 2.643556 Adjusted R-squared 0.976163 S.D. dependent var 0.666046 S.E. of regression 0.102833 Akaike info criterion -1.594950 Sum squared resid 0.444135 Schwarz criterion -1.361050 Log likelihood 44.27881 Hannan-Quinn criter. -1.506559 F-statistic 385.9397 Durbin-Watson stat 1.940415 Prob(F-statistic) 0.000000 Durbin-h stat 0.34 ______________________________________________________________________________ Lag Distribution of LOG((PROMO/CPI)) i Coefficient Std. Error t-Statistic . *| 0 0.04963 0.02392 2.07510 . *| 1 0.04963 0.02392 2.07510 Sum of Lags 0.0993 0.04783 2.07510 ______________________________________________________________________________ Where: Q is per capita fresh plus processed blueberry production, NJP is the New Jersey average grower price for fresh and processed blueberries, CPI is the Consumer Price Index for All Items (2019=1), RINC is real personal income (in chained 2012 billion dollars), STRAWP is the national average grower price for strawberries, and PDL is a second degree polynomial
23
distributed lag operator with current and one year lags and both end point restrictions imposed. LOG is the natural logarithm A convenient feature of the logarithmic specification is that each of the estimated coefficients is the demand elasticity for the variable in question.5 The estimated equation fit the data well; for instance, the adjusted R-square indicates that over 97% of the variation in per capita blueberry demand is explained by the demand factors in the demand equation. The equation has elasticity signs that are consistent with economic theory, and the estimated coefficients (except strawberry price) are all statistically significantly different from zero at the 1% significance level or better. The strawberry price is statistically significant at the 10% significance level. Hence, the estimated demand model is deemed appropriate for this analysis.
To address the potential problem of price endogeneity, an endogeneity test is performed on the blueberry price, which consisted of the following. First, the blueberry price is regressed on all other explanatory variables in the blueberry demand equation. The residuals from this regression are then included in the original blueberry demand equation, and a t-test on the estimated coefficient on this residual term is used to test the null hypothesis that the blueberry price is exogenous. In this case, the t-value on the residual term is not statistically significant and the null hypothesis therefore could not be rejected. Hence, ordinary least squares is used to estimate the blueberry demand equation. Marginal Benefit-Cost Analysis
In order to evaluate the full effect of the USHBC’s promotion programs on quantity and price, one needs to incorporate the supply response of blueberries into the model. To do this, an estimate of the supply response by blueberry growers is necessary. Previous econometric studies of fruit commodities have indicated that it is often problematic to obtain a reliable estimate of supply response to price. This is due to the long time lag between plantings and harvest. Consequently, harvest in any particular year is generally a function of yield, which is influenced by weather conditions and is largely unaffected by price. This makes it difficult to statistically determine any positive correlation between fruit production and price. Therefore, an econometric supply model is not developed in this study. Instead, an approach similar to that in previous studies by Alston et al. (1996), Crespi and Sexton, Kaiser, and Schmit and Kaiser is followed. In this approach, the supply response is incorporated using a constant elasticity form, and sensitivity analysis is conducted on a range of assumed own-price supply elasticities.6
The simulation procedure begins on the demand side, where predicted quantities of blueberry demand (QtD ) are estimated from the estimated demand equation. Then, using a procedure similar to that in Alston et al. (1996), supply is defined in constant elasticity form and
5 The Durbin-h statistic reported in the table suggests that the resulting estimated equations are free of autocorrelation problems. Several econometric diagnostic tests are conducted on the residuals in the regression and no autocorrelation or heteroscedasticity problems are detected. 6 An “own-price elasticity of supply” measures the percentage change in quantity supplied given a 1% change in the price of the commodity.
24
equated with the predicted demand quantities. Changes in demand due to USHBC promotion then affect the level of production and the resulting grower price. Specifically, the supply function is defined as:
(1) QtS = At Rt where At = QtD / Rte and (2) Rt = Pt - dt where Rt is the net grower return per pound in year t, e is the own-price elasticity of supply, and dt is the assessment rate required to finance the USHBC. The defined value, At, varies by year and ensures that, given the actual values of prices and other variables, the supply equation passes through the quantity defined by QtD. This makes possible combining of the supply response and estimated demand model to simulate past prices and quantities.
For this simulation, an estimate of the own-price elasticity of supply is necessary. The only study that has done this is an M.S. thesis in 2008, which estimated blueberry supply response to price changes in British Columbia (Yang 2008). This study found an average short-run elasticity of 0.22, which is very consistent with estimated supply responses of strawberries, raspberries, and blackcurrants for the United Kingdom of 0.30, 0.21, and 0.29, respectively, from an old study (again the only one found) for the period 1946-58 (Jones, 1961, 1962). So, in this study, we use a value of 0.22 for the supply response.
Given the simulation procedures described above, the change in net economic benefits
due to the USHBC promotion effort is computed for each year from 2014 to 2018 as the difference in net revenue (i.e., net revenue) between the following two scenarios: (1) historic or baseline scenario with USHBC promotion expenditures set to actual levels, and (2) “marginal” scenario where USHBC promotion expenditures are 1% lower than the actual expenditures. The difference between these two scenarios provides a measure of the marginal impact of the USHBC promotion spending, i.e., how the last dollar spent impacts the market. The change in net revenue is computed as follows: (3) ∆NRt = (Rt Qt – R′t Q′t) Mt, where Rt Qt represents total revenue (net return per pound times quantity sold) to blueberry growers for the baseline scenario with 100% USHBC promotion expenditures, Rt' Qt' represents total revenue to blueberry growers for the scenario with USHBC promotion expenditures reduced by 1%, and Mt represents a net margin factor for blueberry growers which translates total revenue into net revenue (net of costs). It is assumed that the net margin factor was equal to 10%, which is based on a 2011 study by Julian, Strik, and Yang (2011), who estimated economic

25
costs and returns to blueberry growers in Oregon.7 A marginal benefit-cost ratio (BCR) is computed and is equal to: BCR = ∆NRt / ∆Costt where: ∆NRt is defined in (3) and ∆Costt is equal to a 1% change in cost of the USHBC.
7 Specifically, Julian, Strik, and Yang (2011) estimated alternative net revenues based on various yields and prices received by blueberry farmers in Willamette Valley, Oregon. Based on a fresh price of $1.30 per pound, which is close to the 2014 fresh price for New Jersey, and an average yield of 16,000 pounds per acre, the estimated annual per acre returns over total economic costs is $2,186 per acre or $0.137 per pound. Based on this type of farm, the net margin factor would be 10.5%, i.e., 0.137/1.30. So in the analysis that follows, the net margin was set equal to 10%.